Table of Contents
UNITED STATES
SECURITIES AND EXCHANGE COMMISSION
Washington, D.C. 20549
FORM N-CSR
CERTIFIED SHAREHOLDER REPORT OF REGISTERED
MANAGEMENT INVESTMENT COMPANIES
Investment Company Act file number 811-09102
iShares, Inc.
(Exact name of Registrant as specified in charter)
| c/o: State Street Bank and Trust Company |
| 1 Iron Street, Boston, MA 02210 |
| (Address of principal executive offices) (Zip code) |
The Corporation Trust Incorporated
351 West Camden Street, Baltimore, MD 21201
(Name and address of agent for service)
Registrant’s telephone number, including area code: (415) 670-2000
Date of fiscal year end: October 31, 2015
Date of reporting period: October 31, 2015
Table of Contents
Item 1. Reports to Stockholders.
Copies of the annual reports transmitted to shareholders pursuant to Rule 30e-1 under the Investment Company Act of 1940 are attached.
Table of Contents
OCTOBER 31, 2015
2015 ANNUAL REPORT |  |
iShares, Inc.
| Ø | iShares Emerging Markets Corporate Bond ETF | CEMB | BATS |
| Ø | iShares Emerging Markets High Yield Bond ETF | EMHY | BATS |
| Ø | iShares Emerging Markets Local Currency Bond ETF | LEMB | NYSE Arca |
| Ø | iShares Global High Yield Corporate Bond ETF | GHYG | BATS |
Table of Contents
| 5 | ||||
| 14 | ||||
| 14 | ||||
| 15 | ||||
| 15 | ||||
| 21 | ||||
| 29 | ||||
| 33 | ||||
| 56 | ||||
| 62 | ||||
| 66 | ||||
| 77 | ||||
| 78 | ||||
| 79 | ||||
| 92 | ||||
| 97 |
Table of Contents
Management’s Discussion of Fund Performance
iSHARES®, INC.
GLOBAL BOND MARKET OVERVIEW
Global bonds generally produced negative returns in U.S. dollar terms for the 12-month period ended October 31, 2015 (the “reporting period”), after accounting for the effects of a stronger U.S. currency. Interest rates declined modestly in most markets amid uncertainty around global economic growth; however, for U.S. investors, a stronger U.S. dollar detracted from performance as overseas investments were worth less when translated back into U.S. dollars.
Global economic data were mixed. The U.S. and U.K. experienced comparatively healthy growth, with GDP expanding by 2.0% and 2.3%, respectively, through September 2015, while eurozone economic growth ran at a 1.5% annual rate through the third quarter. However, the Japanese economy contracted in two of the last four quarters, while China saw growth fall below the 7% threshold to its slowest pace since 2009.
In addition to disappointing growth, China witnessed a sharp stock market decline, currency devaluation, and a raft of monetary and policy changes meant to prop up markets. These challenges, coupled with worry about a possible Greek exit from the European common currency, led to a sell-off in risk assets and safe-haven demand for high-quality bonds.
Slower growth in China and other emerging markets also weighed on commodity markets, with prices for many key commodities falling during the fiscal year. This provided additional support for bonds in general because it meant downward pressure on inflation. In the European Union and U.K., consumer prices actually declined for the 12 months ended in September, while inflation in Japan and the U.S. was relatively flat year over year.
Despite these positives, bonds sold off and market volatility surged during the summer, when economic growth in Europe improved, corporations rushed to issue new debt, and investors began to price in the likelihood of an interest rate increase by the U.S. Federal Reserve Bank (the “Fed”).
From a sector perspective, government agency mortgage-backed securities and government bonds performed best for the reporting period. Investor concern about risk assets and surging new bond issuance generally limited returns for corporate securities. And within the corporate market, high-quality bonds generally outperformed high-yield bonds. Sharply declining commodities prices dragged down high-yield bonds. Nevertheless, many sectors of the global corporate bond market produced positive results. For example, banks were among the best-performing industries as growth improved in the eurozone and U.S., and the Fed was expected to begin raising rates.
In terms of performance by country for the reporting period, Australian bonds performed well in local currency terms, but fared poorly after taking currency effects into account. It was a similar story for bonds from across Europe, where low inflation and strong demand meant falling interest rates and higher bond prices, only to see this performance be counteracted by weakness in the euro relative to the U.S. dollar. In Japan, too, aggressive monetary policy, disappointing growth, and the absence of inflation meant falling bond yields. But an attempt to stimulate the economy by cutting interest rates and weakening the yen had the effect of limiting Japanese bond returns for U.S. investors.
Specifically, the U.S. dollar appreciated by approximately 4% relative to the British pound, 16% and 23% against the commodity-driven Canadian and Australian dollars, respectively, 14% against the euro, and 8% against the Japanese yen. The U.S. dollar’s strength during the reporting period was driven by the divergence in economic growth and central bank policies between the U.S. and other regions.
MANAGEMENT’S DISCUSSIONSOF FUND PERFORMANCE | 5 |
Table of Contents
Management’s Discussion of Fund Performance
iSHARES® EMERGING MARKETS CORPORATE BOND ETF
Performance as of October 31, 2015
| Average Annual Total Returns | Cumulative Total Returns | |||||||||||||||||||||||||
| NAV | MARKET | INDEX | NAV | MARKET | INDEX | |||||||||||||||||||||
1 Year | (1.62)% | (1.02)% | (0.89)% | (1.62)% | (1.02)% | (0.89)% | ||||||||||||||||||||
Since Inception | 2.92% | 2.93% | 3.49% | 10.74% | 10.79% | 12.91% | ||||||||||||||||||||
GROWTH OF $10,000 INVESTMENT (SINCE INCEPTION AT NET ASSET VALUE)
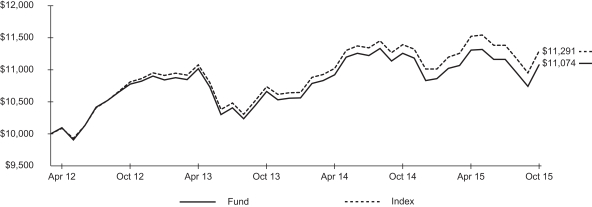
The inception date of the Fund was 4/17/12. The first day of secondary market trading was 4/19/12.
Past performance is no guarantee of future results. Performance results do not reflect the deduction of taxes that a shareholder would pay on fund distributions or on the redemption or sale of fund shares. See “About Fund Performance” on page 14 for more information.
| Shareholder Expenses | ||||||||||||||||||||||||||
| Actual | Hypothetical 5% Return | |||||||||||||||||||||||||
| Beginning Account Value (5/1/15) | Ending Account Value (10/31/15) | Expenses Paid During Period a | Beginning Account Value (5/1/15) | Ending Account Value (10/31/15) | Expenses Paid During Period a | Annualized Expense Ratio | ||||||||||||||||||||
| $ | 1,000.00 | $ | 979.50 | $ | 2.49 | $ | 1,000.00 | $ | 1,022.70 | $ | 2.55 | 0.50% | ||||||||||||||
| a | Expenses are calculated using the Fund’s annualized expense ratio (as disclosed in the table), multiplied by the average account value for the period, multiplied by the number of days in the period (184 days) and divided by the number of days in the year (365 days). See “Shareholder Expenses” on page 14 for more information. |
| 6 | 2015 iSHARES ANNUAL REPORTTO SHAREHOLDERS |
Table of Contents
Management’s Discussion of Fund Performance (Continued)
iSHARES® EMERGING MARKETS CORPORATE BOND ETF
The iShares Emerging Markets Corporate Bond ETF (the “Fund”) seeks to track the investment results of an index composed of U.S. dollar-denominated, emerging market corporate bonds, as represented by the Morningstar® Emerging Markets Corporate Bond IndexSM (the “Index”). The Fund invests in a representative sample of securities included in the Index that collectively has an investment profile similar to the Index. Due to the use of representative sampling, the Fund may or may not hold all of the securities that are included in the Index. For the 12-month reporting period ended October 31, 2015, the total return for the Fund was -1.62%, net of fees, while the total return for the Index was -0.89%.
As represented by the Index, U.S. dollar-denominated emerging markets corporate bonds declined by approximately 1% for the reporting period. The Index experienced significant volatility during the reporting period, resulting from several factors. At the beginning of the reporting period, the Fed signaled its intent to raise short-term interest rates sometime in 2015. However, uncertainty surrounding the timing of this rate hike, particularly as global economic growth remained generally sluggish throughout the reporting period, led to bouts of market volatility. Emerging markets corporate bonds were also buffeted by geopolitical turmoil in Ukraine and the Middle East, a broad decline in commodity prices, and a marked slowdown in China’s economy, which had a ripple effect on other emerging economies.
From a regional perspective, emerging markets corporate bonds in Asia had the greatest positive impact on the Index’s performance during the reporting period, led by China, South Korea, and India. European emerging markets corporate bonds also contributed positively to the Index’s return due to strong contributions from Russia and Turkey.
At the other end of the spectrum, emerging markets bonds from Latin America, the largest regional weighting in the Index, detracted from overall performance for the reporting period. Bonds issued by Brazil, the largest country weighting in the Index, Colombia, and Venezuela detracted the most as all three countries are facing considerable economic challenges.
Interest income remained an important component of the Index’s total return for the reporting period, as emerging markets bonds continued to offer high yields relative to other segments of the global bond market.
ALLOCATION BY CREDIT QUALITY
As of 10/31/15
| Moody’s Credit Rating1 | Percentage of Total Investments2 | |||
Aa | 12.50 | % | ||
A | 18.88 | |||
Baa | 33.02 | |||
Ba | 21.37 | |||
B | 3.48 | |||
Caa | 1.37 | |||
Not Rated | 9.38 | |||
|
| |||
TOTAL | 100.00 | % | ||
|
| |||
TEN LARGEST COUNTRIES
As of 10/31/15
| Country | Percentage of Total Investments2 | |||
Brazil | 14.44 | % | ||
Mexico | 11.52 | |||
China | 10.18 | |||
Russia | 9.72 | |||
South Korea | 7.45 | |||
India | 5.66 | |||
Hong Kong | 5.30 | |||
United Arab Emirates | 4.62 | |||
Chile | 3.56 | |||
Qatar | 2.70 | |||
|
| |||
TOTAL | 75.15 | % | ||
|
| |||
| 1 | Credit quality ratings shown reflect the ratings assigned by Moody’s Investors Service (“Moody’s”), a widely used independent, nationally recognized statistical rating organization. Moody’s credit ratings are opinions of the credit quality of individual obligations or of an issuer’s general creditworthiness. Investment grade ratings are credit ratings of Baa or higher. Below investment grade ratings are credit ratings of Ba or lower. Unrated investments do not necessarily indicate low credit quality. Credit quality ratings are subject to change. |
| 2 | Excludes money market funds. |
MANAGEMENT’S DISCUSSIONSOF FUND PERFORMANCE | 7 |
Table of Contents
Management’s Discussion of Fund Performance
iSHARES® EMERGING MARKETS HIGH YIELD BOND ETF
Performance as of October 31, 2015
| Average Annual Total Returns | Cumulative Total Returns | |||||||||||||||||||||||||
| NAV | MARKET | INDEX | NAV | MARKET | INDEX | |||||||||||||||||||||
1 Year | (2.13)% | (2.67)% | (1.94)% | (2.13)% | (2.67)% | (1.94)% | ||||||||||||||||||||
Since Inception | 3.92% | 3.89% | 4.39% | 14.75% | 14.65% | 16.59% | ||||||||||||||||||||
GROWTH OF $10,000 INVESTMENT (SINCE INCEPTION AT NET ASSET VALUE)
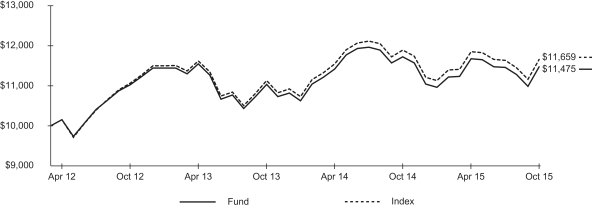
The inception date of the Fund was 4/3/12. The first day of secondary market trading was 4/3/12.
Past performance is no guarantee of future results. Performance results do not reflect the deduction of taxes that a shareholder would pay on fund distributions or on the redemption or sale of fund shares. See “About Fund Performance” on page 14 for more information.
| Shareholder Expenses | ||||||||||||||||||||||||||
| Actual | Hypothetical 5% Return | |||||||||||||||||||||||||
| Beginning Account Value (5/1/15) | Ending Account Value (10/31/15) | Expenses Paid During Period a | Beginning Account Value (5/1/15) | Ending Account Value (10/31/15) | Expenses Paid During Period a | Annualized Expense Ratio | ||||||||||||||||||||
| $ | 1,000.00 | $ | 983.30 | $ | 2.50 | $ | 1,000.00 | $ | 1,022.70 | $ | 2.55 | 0.50% | ||||||||||||||
| a | Expenses are calculated using the Fund’s annualized expense ratio (as disclosed in the table), multiplied by the average account value for the period, multiplied by the number of days in the period (184 days) and divided by the number of days in the year (365 days). See “Shareholder Expenses” on page 14 for more information. |
| 8 | 2015 iSHARES ANNUAL REPORTTO SHAREHOLDERS |
Table of Contents
Management’s Discussion of Fund Performance (Continued)
iSHARES® EMERGING MARKETS HIGH YIELD BOND ETF
The iShares Emerging Markets High Yield Bond ETF (the “Fund”) seeks to track the investment results of an index composed of U.S. dollar-denominated, emerging market high yield sovereign and corporate bonds, as represented by the Morningstar® Emerging Markets High Yield Bond IndexSM (the “Index”). The Fund invests in a representative sample of securities included in the Index that collectively has an investment profile similar to the Index. Due to the use of representative sampling, the Fund may or may not hold all of the securities that are included in the Index. For the 12-month reporting period ended October 31, 2015, the total return for the Fund was -2.13%, net of fees, while the total return for the Index was -1.94%.
As represented by the Index, U.S. dollar-denominated high-yield bonds from emerging markets declined by approximately 2% for the reporting period. The Index experienced substantial volatility during the reporting period, resulting from several factors. At the beginning of the reporting period, the Fed signaled its intent to raise short-term interest rates sometime in 2015. However, uncertainty surrounding the timing of this rate hike, particularly as global economic growth remained generally sluggish throughout the reporting period, led to bouts of market volatility. Emerging markets high-yield bonds were also buffeted by geopolitical turmoil in Ukraine and the Middle East, a broad decline in commodity prices, and a marked slowdown in China’s economy, which had a ripple effect on other emerging economies.
From a regional perspective, emerging markets high-yield bonds in Europe, the largest regional weighting in the Index, had the greatest positive impact on the Index’s performance during the reporting period, led by Russia, Hungary, and Turkey. Asian emerging markets high-yield bonds also contributed positively to the Index’s return thanks to strong contributions from China and Indonesia.
At the other end of the spectrum, emerging markets bonds from Latin America detracted from overall performance for the reporting period. Bonds issued by Brazil and Venezuela, both of which are facing considerable economic challenges, detracted the most.
Interest income remained an important component of the Index’s total return for the reporting period, as emerging markets bonds continued to offer high yields relative to other segments of the global bond market.
ALLOCATION BY CREDIT QUALITY
As of 10/31/15
| Moody’s Credit Rating1 | Percentage of Total Investments2 | |||
Baa | 31.04 | % | ||
Ba | 39.03 | |||
B | 11.79 | |||
Caa | 6.67 | |||
Ca | 1.40 | |||
Not Rated | 10.07 | |||
|
| |||
TOTAL | 100.00 | % | ||
|
| |||
TEN LARGEST COUNTRIES
As of 10/31/15
| Country | Percentage of Total Investments2 | |||
Brazil | 20.60 | % | ||
Russia | 13.93 | |||
Turkey | 10.34 | |||
Indonesia | 9.95 | |||
Venezuela | 5.51 | |||
Hungary | 3.73 | |||
Argentina | 2.92 | |||
China | 2.72 | |||
Kazakhstan | 2.43 | |||
Lebanon | 2.38 | |||
|
| |||
TOTAL | 74.51 | % | ||
|
| |||
| 1 | Credit quality ratings shown reflect the ratings assigned by Moody’s Investors Service (“Moody’s”), a widely used independent, nationally recognized statistical rating organization. Moody’s credit ratings are opinions of the credit quality of individual obligations or of an issuer’s general creditworthiness. Investment grade ratings are credit ratings of Baa or higher. Below investment grade ratings are credit ratings of Ba or lower. Unrated investments do not necessarily indicate low credit quality. Credit quality ratings are subject to change. |
| 2 | Excludes money market funds. |
MANAGEMENT’S DISCUSSIONSOF FUND PERFORMANCE | 9 |
Table of Contents
Management’s Discussion of Fund Performance
iSHARES® EMERGING MARKETS LOCAL CURRENCY BOND ETF
Performance as of October 31, 2015
| Average Annual Total Returns | Cumulative Total Returns | |||||||||||||||||||||||||
| NAV | MARKET | INDEX | NAV | MARKET | INDEX | |||||||||||||||||||||
1 Year | (13.99)% | (13.98)% | (13.71)% | (13.99)% | (13.98)% | (13.71)% | ||||||||||||||||||||
Since Inception | (1.97)% | (2.04)% | (1.65)% | (7.70)% | (7.99)% | (6.49)% | ||||||||||||||||||||
GROWTH OF $10,000 INVESTMENT (SINCE INCEPTION AT NET ASSET VALUE)
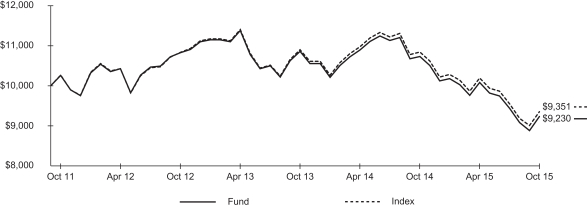
The inception date of the Fund was 10/18/11. The first day of secondary market trading was 10/20/11.
Past performance is no guarantee of future results. Performance results do not reflect the deduction of taxes that a shareholder would pay on fund distributions or on the redemption or sale of fund shares. See “About Fund Performance” on page 14 for more information.
| Shareholder Expenses | ||||||||||||||||||||||||||
| Actual | Hypothetical 5% Return | |||||||||||||||||||||||||
| Beginning Account Value (5/1/15) | Ending Account Value (10/31/15) | Expenses Paid During Period a | Beginning Account Value (5/1/15) | Ending Account Value (10/31/15) | Expenses Paid During Period a | Annualized Expense Ratio | ||||||||||||||||||||
| $ | 1,000.00 | $ | 915.90 | $ | 2.41 | $ | 1,000.00 | $ | 1,022.70 | $ | 2.55 | 0.50% | ||||||||||||||
| a | Expenses are calculated using the Fund’s annualized expense ratio (as disclosed in the table), multiplied by the average account value for the period, multiplied by the number of days in the period (184 days) and divided by the number of days in the year (365 days). See “Shareholder Expenses” on page 14 for more information. |
The iShares Emerging Markets Local Currency Bond ETF (the “Fund”) seeks to track the investment results of an index composed of local currency denominated, emerging market sovereign bonds, as represented by the Barclays Emerging Markets Broad Local Currency Bond Index (the “Index”). The Fund invests in a representative sample of securities included in the Index that collectively has an investment profile similar to the Index. Due to the use of representative sampling, the Fund may or may not hold all of the securities that are included in the Index. For the 12-month reporting period ended October 31, 2015, the total return for the Fund was -13.99%, net of fees, while the total return for the Index was -13.71%.
As represented by the Index, emerging markets sovereign bonds issued in local currencies declined by more than 13% for the reporting period. One factor behind this decline was a stronger U.S. dollar. For the reporting period, the U.S. dollar appreciated by 6% against the South Korean won, 15% against the Polish zloty, 22% against the Mexican peso, and 57% against the Brazilian real. Countries using these currencies comprised approximately half of the Index on average during the reporting period. Weaker
| 10 | 2015 iSHARES ANNUAL REPORTTO SHAREHOLDERS |
Table of Contents
Management’s Discussion of Fund Performance (Continued)
iSHARES® EMERGING MARKETS LOCAL CURRENCY BOND ETF
foreign currencies decrease the value of foreign investments measured in U.S. dollars, thereby decreasing returns for U.S. investors, while increasing values of foreign currencies relative to the U.S. dollar have the opposite effect.
The Index experienced significant volatility during the reporting period amid uncertainty surrounding the timing of a potential short-term interest rate increase by the Fed, sluggish global economic growth, a broad decline in commodity prices, and a marked slowdown in China’s economy, which had a ripple effect on other emerging economies.
From a regional perspective, emerging markets bonds from Latin America had the largest negative impact on the Index’s performance for the reporting period. Bonds issued by Brazil and Colombia detracted the most. Brazil faced considerable economic challenges and a political corruption scandal, while falling commodity prices weighed on Colombia’s bonds. The Index’s Mexican bonds also hindered performance during the reporting period, largely due to the stronger U.S. dollar relative to the Mexican peso.
Emerging markets bonds in Europe and Asia also detracted from the Index’s return for the reporting period. The most significant detractors in Europe included Russia and Turkey, while bond markets in Malaysia and South Korea (the largest country weighting in the Index) detracted the most in Asia.
The only country to contribute positively to the Index’s performance was Israel, where the central bank lowered interest rates during the reporting period to stimulate economic activity.
ALLOCATION BY CREDIT QUALITY
As of 10/31/15
| Moody’s Credit Rating1 | Percentage of Total Investments2 | |||
Aa | 20.65 | % | ||
A | 28.51 | |||
Baa | 41.18 | |||
Ba | 8.19 | |||
Not Rated | 1.47 | |||
|
| |||
TOTAL | 100.00 | % | ||
|
| |||
TEN LARGEST COUNTRIES
As of 10/31/15
| Country | Percentage of Total Investments2 | |||
South Korea | 21.51 | % | ||
Brazil | 12.49 | |||
Mexico | 9.98 | |||
Poland | 4.74 | |||
Philippines | 4.72 | |||
Turkey | 4.68 | |||
Thailand | 4.66 | |||
Indonesia | 4.61 | |||
Israel | 4.53 | |||
South Africa | 4.51 | |||
|
| |||
TOTAL | 76.43 | % | ||
|
| |||
| 1 | Credit quality ratings shown reflect the ratings assigned by Moody’s Investors Service (“Moody’s”), a widely used independent, nationally recognized statistical rating organization. Moody’s credit ratings are opinions of the credit quality of individual obligations or of an issuer’s general creditworthiness. Investment grade ratings are credit ratings of Baa or higher. Below investment grade ratings are credit ratings of Ba or lower. Unrated investments do not necessarily indicate low credit quality. Credit quality ratings are subject to change. |
| 2 | Excludes money market funds. |
MANAGEMENT’S DISCUSSIONSOF FUND PERFORMANCE | 11 |
Table of Contents
Management’s Discussion of Fund Performance
iSHARES® GLOBAL HIGH YIELD CORPORATE BOND ETF
Performance as of October 31, 2015
| Average Annual Total Returns | Cumulative Total Returns | |||||||||||||||||||||||||
| NAV | MARKET | INDEX | NAV | MARKET | INDEX | |||||||||||||||||||||
1 Year | (4.32)% | (4.36)% | (4.16)% | (4.32)% | (4.36)% | (4.16)% | ||||||||||||||||||||
Since Inception | 3.94% | 3.91% | 4.09% | 14.85% | 14.73% | 15.40% | ||||||||||||||||||||
GROWTH OF $10,000 INVESTMENT (SINCE INCEPTION AT NET ASSET VALUE)
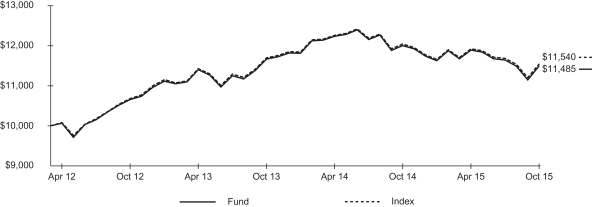
The inception date of the Fund was 4/3/12. The first day of secondary market trading was 4/5/12.
Past performance is no guarantee of future results. Performance results do not reflect the deduction of taxes that a shareholder would pay on fund distributions or on the redemption or sale of fund shares. See “About Fund Performance” on page 14 for more information.
| Shareholder Expenses | ||||||||||||||||||||||||||
| Actual | Hypothetical 5% Return | |||||||||||||||||||||||||
| Beginning Account Value (5/1/15) | Ending Account Value (10/31/15) | Expenses Paid During Period a | Beginning Account Value (5/1/15) | Ending Account Value (10/31/15) | Expenses Paid During Period a | Annualized Expense Ratio | ||||||||||||||||||||
| $ | 1,000.00 | $ | 965.80 | $ | 1.98 | $ | 1,000.00 | $ | 1,023.20 | $ | 2.04 | 0.40% | ||||||||||||||
| a | Expenses are calculated using the Fund’s annualized expense ratio (as disclosed in the table), multiplied by the average account value for the period, multiplied by the number of days in the period (184 days) and divided by the number of days in the year (365 days). See “Shareholder Expenses” on page 14 for more information. |
| 12 | 2015 iSHARES ANNUAL REPORTTO SHAREHOLDERS |
Table of Contents
Management’s Discussion of Fund Performance (Continued)
iSHARES® GLOBAL HIGH YIELD CORPORATE BOND ETF
The iShares Global High Yield Corporate Bond ETF (the “Fund”) seeks to track the investment results of an index composed of U.S. dollar, euro, British pound sterling and Canadian dollar-denominated, high yield corporate bonds, as represented by the Markit iBoxx Global Developed Markets High Yield Index (the “Index”). The Fund invests in a representative sample of securities included in the Index that collectively has an investment profile similar to the Index. Due to the use of representative sampling, the Fund may or may not hold all of the securities that are included in the Index. For the 12-month reporting period ended October 31, 2015, the total return for the Fund was -4.32%, net of fees, while the total return for the Index was -4.16%.
As represented by the Index, global high-yield corporate bonds declined by approximately 4% for the reporting period. One factor behind this decline was a stronger U.S. dollar. For the reporting period, the U.S. dollar appreciated by 14% against the euro, 4% against the British pound, and 16% against the Canadian dollar. Countries using these currencies comprised approximately 35% of the Index on average during the reporting period. Weaker foreign currencies decrease the value of foreign investments measured in U.S. dollars, thereby decreasing returns for U.S. investors, while increasing foreign currencies relative to the U.S. dollar have the opposite effect.
High-yield corporate bonds underperformed the broader global bond market during the reporting period amid heightened uncertainty that led to a flight to quality. Uncertainty surrounding the timing of a potential short-term interest rate increase by the Fed, generally sluggish global economic growth, a broad decline in commodity prices, and a marked slowdown in China’s economy (which had a ripple effect on other emerging economies) were all factors that contributed to a more risk-averse investment environment.
From a regional perspective, the Index consists almost entirely of high-yield corporate bonds from Europe and North America. European high-yield bonds detracted the most as economic growth remained lethargic on the Continent. High-yield corporate bonds from Luxembourg, Spain, and France had the most significant negative impact on the Index’s performance for the reporting period.
U.S. high-yield bonds, which comprised more than 60% of the Index on average during the reporting period, also detracted from the Index’s return. In addition to risk aversion, U.S. high-yield bonds were hurt by a stronger U.S. dollar, which reduced demand for exports and narrowed corporate profit margins for multinational companies.
ALLOCATION BY CREDIT QUALITY
As of 10/31/15
| Moody’s Credit Rating1 | Percentage of Total Investments2 | |||
Baa | 0.26 | % | ||
Ba | 47.71 | |||
B | 39.24 | |||
Caa | 8.68 | |||
Ca | 0.14 | |||
C | 0.07 | |||
Not Rated | 3.90 | |||
|
| |||
TOTAL | 100.00 | % | ||
|
| |||
TEN LARGEST COUNTRIES
As of 10/31/15
| Country | Percentage of Total Investments2 | |||
United States | 62.40 | % | ||
United Kingdom | 7.62 | |||
Italy | 5.85 | |||
Germany | 4.59 | |||
Luxembourg | 4.07 | |||
France | 3.81 | |||
Canada | 2.68 | |||
Netherlands | 2.66 | |||
Spain | 1.59 | |||
New Zealand | 0.88 | |||
|
| |||
TOTAL | 96.15 | % | ||
|
| |||
| 1 | Credit quality ratings shown reflect the ratings assigned by Moody’s Investors Service (“Moody’s”), a widely used independent, nationally recognized statistical rating organization. Moody’s credit ratings are opinions of the credit quality of individual obligations or of an issuer’s general creditworthiness. Investment grade ratings are credit ratings of Baa or higher. Below investment grade ratings are credit ratings of Ba or lower. Unrated investments do not necessarily indicate low credit quality. Credit quality ratings are subject to change. |
| 2 | Excludes money market funds. |
MANAGEMENT’S DISCUSSIONSOF FUND PERFORMANCE | 13 |
Table of Contents
Past performance is no guarantee of future results. Current performance may be lower or higher than the performance data quoted. Performance data current to the most recent month-end is available at www.ishares.com. Performance results assume reinvestment of all dividends and capital gain distributions and do not reflect the deduction of taxes that a shareholder would pay on fund distributions or on the redemption or sale of fund shares. The investment return and principal value of shares will vary with changes in market conditions. Shares may be worth more or less than their original cost when they are redeemed or sold in the market. Performance for certain funds may reflect a waiver of a portion of investment advisory fees. Without such a waiver, performance would have been lower.
Net asset value or “NAV” is the value of one share of a fund as calculated in accordance with the standard formula for valuing mutual fund shares. The price used to calculate market return (“Market Price”) is determined by using the midpoint between the highest bid and the lowest offer on the primary stock exchange on which shares of a fund are listed for trading, as of the time that such fund’s NAV is calculated. Certain funds may have a NAV which is determined prior to the opening of regular trading on its listed exchange and their market returns are calculated using the midpoint of the bid/ask spread as of the opening of regular trading on the exchange. Market and NAV returns assume that dividends and capital gain distributions have been reinvested at Market Price and NAV, respectively.
An index is a statistical composite that tracks a specified financial market or sector. Unlike a fund, an index does not actually hold a portfolio of securities and therefore does not incur the expenses incurred by a fund. These expenses negatively impact fund performance. Also, market returns do not include brokerage commissions that may be payable on secondary market transactions. If brokerage commissions were included, market returns would be lower.
As a shareholder of a Fund, you incur two types of costs: (1) transaction costs, including brokerage commissions on purchases and sales of fund shares and (2) ongoing costs, including management fees and other fund expenses. The expense example, which is based on an investment of $1,000 invested on May 1, 2015 and held through October 31, 2015, is intended to help you understand your ongoing costs (in dollars and cents) of investing in a Fund and to compare these costs with the ongoing costs of investing in other funds.
Actual Expenses — The table provides information about actual account values and actual expenses. Annualized expense ratios reflect contractual and voluntary fee waivers, if any. To estimate the expenses that you paid on your account over the period, simply divide your account value by $1,000 (for example, an $8,600 account value divided by $1,000 = 8.6), then multiply the result by the number under the heading entitled “Expenses Paid During Period.”
Hypothetical Example for Comparison Purposes — The table also provides information about hypothetical account values and hypothetical expenses based on each Fund’s actual expense ratio and an assumed rate of return of 5% per year before expenses. You may use this information to compare the ongoing costs of investing in your Fund and other funds. To do so, compare this 5% hypothetical example with the 5% hypothetical examples that appear in the shareholder reports of the other funds.
Please note that the expenses shown in the table are meant to highlight your ongoing costs only and do not reflect any transactional costs, such as brokerage commissions paid on purchases and sales of fund shares. Therefore, the hypothetical examples are useful in comparing ongoing costs only and will not help you determine the relative total costs of owning different funds. In addition, if these transactional costs were included, your costs would have been higher.
| 14 | 2015 iSHARES ANNUAL REPORTTO SHAREHOLDERS |
Table of Contents
iSHARES® EMERGING MARKETS CORPORATE BOND ETF
October 31, 2015
| Security | Principal (000s) | Value | ||||||
CORPORATE BONDS & NOTESa — 93.88% |
| |||||||
ARGENTINA — 0.59% |
| |||||||
YPF SA | ||||||||
8.50%, 07/28/25b | $ | 75 | $ | 73,725 | ||||
8.75%, 04/04/24b | 60 | 60,807 | ||||||
8.88%, 12/19/18b | 35 | 36,137 | ||||||
|
| |||||||
| 170,669 | ||||||||
BRAZIL — 13.14% |
| |||||||
Banco Bradesco SA/Cayman Islands | ||||||||
5.90%, 01/16/21b | 100 | 99,250 | ||||||
6.75%, 09/29/19b | 100 | 105,000 | ||||||
Banco BTG Pactual SA/Cayman Islands | ||||||||
4.00%, 01/16/20b | 200 | 169,000 | ||||||
Banco do Brasil SA | ||||||||
5.88%, 01/19/23b | 200 | 174,500 | ||||||
BRF SA | ||||||||
4.75%, 05/22/24b | 200 | 198,040 | ||||||
Caixa Economica Federal | ||||||||
2.38%, 11/06/17b | 150 | 140,812 | ||||||
Centrais Eletricas Brasileiras SA | ||||||||
6.88%, 07/30/19b | 100 | 89,125 | ||||||
CSN Resources SA | ||||||||
6.50%, 07/21/20b | 100 | 58,000 | ||||||
Fibria Overseas Finance Ltd. | ||||||||
5.25%, 05/12/24 | 100 | 98,375 | ||||||
Gerdau Trade Inc. | ||||||||
5.75%, 01/30/21b | 100 | 92,200 | ||||||
GTL Trade Finance Inc. | ||||||||
5.89%, 04/29/24 (Call 01/29/24)b | 150 | 125,730 | ||||||
Itau Unibanco Holding SA/Cayman Island | ||||||||
5.13%, 05/13/23b | 200 | 180,500 | ||||||
6.20%, 04/15/20b | 100 | 103,500 | ||||||
JBS Investments GmbH | ||||||||
7.25%, 04/03/24 (Call 04/03/19)b | 200 | 205,500 | ||||||
Odebrecht Drilling Norbe VIII/IX Ltd. | ||||||||
6.35%, 06/30/22 (Call 06/30/20)b | 166 | 81,164 | ||||||
Petrobras Global Finance BV | ||||||||
3.00%, 01/15/19 | 50 | 41,438 | ||||||
3.25%, 03/17/17 | 105 | 100,065 | ||||||
4.38%, 05/20/23 | 150 | 109,312 | ||||||
4.88%, 03/17/20 | 95 | 77,662 | ||||||
| Security | Principal (000s) | Value | ||||||
5.38%, 01/27/21 | $ | 200 | $ | 162,750 | ||||
5.63%, 05/20/43 | 50 | 32,790 | ||||||
5.75%, 01/20/20 | 100 | 85,345 | ||||||
6.25%, 03/17/24 | 125 | 100,119 | ||||||
6.85%, 06/05/49 | 100 | 68,620 | ||||||
6.88%, 01/20/40 | 75 | 54,000 | ||||||
7.25%, 03/17/44 | 50 | 37,200 | ||||||
7.88%, 03/15/19c | 100 | 94,750 | ||||||
Petrobras International Finance Co. SA | ||||||||
3.50%, 02/06/17 | 75 | 72,488 | ||||||
5.88%, 03/01/18 | 100 | 94,470 | ||||||
6.75%, 01/27/41 | 75 | 52,920 | ||||||
Samarco Mineracao SA | ||||||||
4.13%, 11/01/22b | 200 | 166,250 | ||||||
Telemar Norte Leste SA | ||||||||
5.50%, 10/23/20b | 100 | 68,000 | ||||||
Vale Overseas Ltd. | ||||||||
4.38%, 01/11/22c | 125 | 114,000 | ||||||
4.63%, 09/15/20c | 75 | 72,953 | ||||||
6.25%, 01/23/17 | 50 | 51,077 | ||||||
6.88%, 11/21/36 | 100 | 81,410 | ||||||
6.88%, 11/10/39 | 80 | 64,195 | ||||||
8.25%, 01/17/34 | 25 | 23,858 | ||||||
Vale SA | ||||||||
5.63%, 09/11/42c | 75 | 53,617 | ||||||
|
| |||||||
| 3,799,985 | ||||||||
CHILE — 3.49% |
| |||||||
Banco del Estado de Chile | ||||||||
4.13%, 10/07/20b | 150 | 157,618 | ||||||
Celulosa Arauco y Constitucion SA | ||||||||
4.75%, 01/11/22 (Call 10/11/21) | 37 | 38,303 | ||||||
Cencosud SA | ||||||||
5.50%, 01/20/21b | 150 | 157,307 | ||||||
Corp. Nacional del Cobre de Chile | ||||||||
3.00%, 07/17/22b | 200 | 188,846 | ||||||
4.25%, 07/17/42b | 200 | 164,235 | ||||||
Empresa Nacional de Telecomunicaciones SA | ||||||||
4.88%, 10/30/24b | 200 | 200,250 | ||||||
Empresa Nacional del Petroleo | ||||||||
4.75%, 12/06/21b | 100 | 104,049 | ||||||
|
| |||||||
| 1,010,608 | ||||||||
SCHEDULESOF INVESTMENTS | 15 |
Table of Contents
Schedule of Investments (Continued)
iSHARES® EMERGING MARKETS CORPORATE BOND ETF
October 31, 2015
| Security | Principal (000s) | Value | ||||||
CHINA — 9.98% |
| |||||||
Agile Property Holdings Ltd. | ||||||||
8.88%, 04/28/17 (Call 11/30/15)b | $ | 100 | $ | 101,500 | ||||
Alibaba Group Holding Ltd. | ||||||||
3.13%, 11/28/21 (Call 09/28/21)b | 200 | 196,915 | ||||||
3.60%, 11/28/24 (Call 08/28/24)b | 200 | 193,440 | ||||||
Baidu Inc. | ||||||||
2.25%, 11/28/17 | 200 | 200,042 | ||||||
Bank of Communications Co. Ltd. | ||||||||
4.50%, 10/03/24 (Call 10/03/19)b,d | 200 | 203,283 | ||||||
China Overseas Finance II Ltd. | ||||||||
5.50%, 11/10/20b | 100 | 108,824 | ||||||
CITIC Ltd. | ||||||||
6.63%, 04/15/21b | 100 | 114,868 | ||||||
CNOOC Finance 2012 Ltd. | ||||||||
5.00%, 05/02/42b | 200 | 207,533 | ||||||
Country Garden Holdings Co. Ltd. | ||||||||
7.50%, 03/09/20 (Call 03/09/18)b | 200 | 212,052 | ||||||
Evergrande Real Estate Group Ltd. | ||||||||
8.75%, 10/30/18 (Call 10/30/16)b | 200 | 202,260 | ||||||
Huarong Finance II Co. Ltd. | ||||||||
4.50%, 01/16/20b | 200 | 207,816 | ||||||
Sino-Ocean Land Treasure Finance I Ltd. | ||||||||
4.63%, 07/30/19b | 200 | 205,820 | ||||||
Sinochem Overseas Capital Co. Ltd. | ||||||||
4.50%, 11/12/20b | 100 | 105,245 | ||||||
Sinopec Group Overseas Development 2013 Ltd. | ||||||||
4.38%, 10/17/23b | 200 | 209,315 | ||||||
State Grid Overseas Investment 2014 Ltd. | ||||||||
4.13%, 05/07/24b | 200 | 212,629 | ||||||
Tencent Holdings Ltd. | ||||||||
3.38%, 05/02/19b | 200 | 204,276 | ||||||
|
| |||||||
| 2,885,818 | ||||||||
COLOMBIA — 2.55% |
| |||||||
Bancolombia SA | ||||||||
5.13%, 09/11/22 | 50 | 49,550 | ||||||
6.13%, 07/26/20c | 75 | 79,500 | ||||||
Ecopetrol SA | ||||||||
4.13%, 01/16/25 | 100 | 88,120 | ||||||
5.88%, 09/18/23 | 100 | 101,000 | ||||||
| Security | Principal (000s) | Value | ||||||
5.88%, 05/28/45 | $ | 50 | $ | 40,750 | ||||
7.38%, 09/18/43 | 50 | 47,625 | ||||||
7.63%, 07/23/19 | 50 | 56,325 | ||||||
Grupo Aval Ltd. | ||||||||
4.75%, 09/26/22b | 200 | 194,980 | ||||||
Pacific Exploration and Production Corp. | ||||||||
5.13%, 03/28/23 (Call 03/28/18)b | 100 | 36,500 | ||||||
5.38%, 01/26/19 (Call 01/26/17)b | 100 | 43,500 | ||||||
|
| |||||||
| 737,850 | ||||||||
HONG KONG — 5.19% |
| |||||||
Bank of China Hong Kong Ltd. | ||||||||
5.55%, 02/11/20b | 100 | 109,547 | ||||||
Bank of East Asia Ltd. (The) | ||||||||
6.38%, 05/04/22 (Call 05/04/17)b,d | 200 | 209,192 | ||||||
Hongkong Land Finance (Cayman Island) Co. Ltd. (The) | ||||||||
4.50%, 10/07/25 | 100 | 107,373 | ||||||
Hutchison Whampoa International 09 Ltd. | ||||||||
7.63%, 04/09/19b | 100 | 117,254 | ||||||
Hutchison Whampoa International 11 Ltd. | ||||||||
4.63%, 01/13/22b | 200 | 216,038 | ||||||
Hutchison Whampoa International 14 Ltd. | ||||||||
3.63%, 10/31/24b | 200 | 201,390 | ||||||
Li & Fung Ltd. | ||||||||
5.25%, 05/13/20b | 100 | 109,396 | ||||||
Shimao Property Holdings Ltd. | ||||||||
6.63%, 01/14/20 (Call 01/14/17)b | 200 | 208,554 | ||||||
Standard Chartered Bank Hong Kong Ltd. | ||||||||
5.88%, 06/24/20b | 100 | 112,200 | ||||||
Swire Pacific MTN Financing Ltd. | ||||||||
5.50%, 08/19/19b | 100 | 110,820 | ||||||
|
| |||||||
| 1,501,764 | ||||||||
INDIA — 5.55% |
| |||||||
Axis Bank Ltd./Dubai | ||||||||
4.75%, 05/02/16b | 100 | 101,424 | ||||||
Bharti Airtel International Netherlands BV | ||||||||
5.13%, 03/11/23b | 200 | 212,161 | ||||||
| 16 | 2015 iSHARES ANNUAL REPORTTO SHAREHOLDERS |
Table of Contents
Schedule of Investments (Continued)
iSHARES® EMERGING MARKETS CORPORATE BOND ETF
October 31, 2015
| Security | Principal (000s) | Value | ||||||
Export-Import Bank of India | ||||||||
4.00%, 01/14/23b | $ | 200 | $ | 203,965 | ||||
ICICI Bank Ltd. | ||||||||
6.38%, 04/30/22 (Call 04/30/17)b,d | 100 | 102,620 | ||||||
ICICI Bank Ltd./Hong Kong | ||||||||
5.75%, 11/16/20b | 100 | 111,846 | ||||||
ONGC Videsh Ltd. | ||||||||
4.63%, 07/15/24b | 200 | 206,295 | ||||||
Reliance Holdings USA Inc. | ||||||||
5.40%, 02/14/22b | 250 | 274,121 | ||||||
State Bank of India/London | ||||||||
3.62%, 04/17/19b | 200 | 205,303 | ||||||
Vedanta Resources PLC | ||||||||
9.50%, 07/18/18b | 200 | 188,000 | ||||||
|
| |||||||
| 1,605,735 | ||||||||
INDONESIA — 2.18% |
| |||||||
Majapahit Holding BV | ||||||||
7.75%, 01/20/20b | 120 | 135,420 | ||||||
7.88%, 06/29/37b | 125 | 140,156 | ||||||
Pertamina Persero PT | ||||||||
4.30%, 05/20/23b | 200 | 188,949 | ||||||
5.63%, 05/20/43b | 200 | 166,300 | ||||||
|
| |||||||
| 630,825 | ||||||||
ISRAEL — 0.80% |
| |||||||
Israel Electric Corp. Ltd. | ||||||||
6.88%, 06/21/23b | 200 | 230,240 | ||||||
|
| |||||||
| 230,240 | ||||||||
JAMAICA — 0.61% |
| |||||||
Digicel Group Ltd. | ||||||||
8.25%, 09/30/20 (Call 09/30/16)b | 200 | 177,000 | ||||||
|
| |||||||
| 177,000 | ||||||||
KAZAKHSTAN — 1.75% |
| |||||||
Development Bank of Kazakhstan JSC | ||||||||
4.13%, 12/10/22b | 200 | 174,995 | ||||||
KazMunayGas National Co. JSC | ||||||||
4.40%, 04/30/23b | 200 | 176,000 | ||||||
5.75%, 04/30/43b | 200 | 153,951 | ||||||
|
| |||||||
| 504,946 | ||||||||
MALAYSIA — 1.05% |
| |||||||
Petronas Capital Ltd. | ||||||||
3.50%, 03/18/25b | 200 | 193,542 | ||||||
5.25%, 08/12/19b | 100 | 109,082 | ||||||
|
| |||||||
| 302,624 | ||||||||
| Security | Principal (000s) | Value | ||||||
MEXICO — 11.29% |
| |||||||
Alfa SAB de CV | ||||||||
5.25%, 03/25/24 (Call 12/25/23)b | $ | 200 | $ | 210,250 | ||||
America Movil SAB de CV | ||||||||
5.00%, 03/30/20 | 100 | 110,063 | ||||||
5.63%, 11/15/17 | 100 | 107,721 | ||||||
6.13%, 03/30/40 | 100 | 113,465 | ||||||
6.38%, 03/01/35 | 100 | 115,573 | ||||||
Banco Santander Mexico SA | ||||||||
5.95%, 01/30/24 (Call 01/30/19)b,d | 200 | 208,500 | ||||||
BBVA Bancomer SA/Texas | ||||||||
6.75%, 09/30/22b | 150 | 168,300 | ||||||
Cemex Finance LLC | ||||||||
6.00%, 04/01/24 (Call 04/01/19)b | 200 | 191,000 | ||||||
9.38%, 10/12/22 (Call 10/12/17)b | 200 | 217,500 | ||||||
Coca-Cola FEMSA SAB de CV | ||||||||
3.88%, 11/26/23 | 150 | 154,972 | ||||||
Comision Federal de Electricidad | ||||||||
4.88%, 01/15/24b | 200 | 204,500 | ||||||
Empresas ICA SAB de CV | ||||||||
8.90%, 02/04/21 (Call 02/04/16)b | 50 | 13,875 | ||||||
Grupo Bimbo SAB de CV | ||||||||
4.50%, 01/25/22b | 100 | 104,153 | ||||||
Grupo Televisa SAB | ||||||||
6.63%, 01/15/40 | 56 | 61,267 | ||||||
Petroleos Mexicanos | ||||||||
3.50%, 07/18/18 | 100 | 101,700 | ||||||
3.50%, 07/23/20b | 150 | 148,773 | ||||||
3.50%, 01/30/23 | 75 | 69,638 | ||||||
4.88%, 01/24/22 | 75 | 76,485 | ||||||
4.88%, 01/18/24 | 40 | 39,968 | ||||||
5.50%, 01/21/21 | 75 | 80,062 | ||||||
5.50%, 06/27/44c | 190 | 161,918 | ||||||
5.63%, 01/23/46b | 150 | 129,345 | ||||||
5.75%, 03/01/18 | 100 | 106,215 | ||||||
6.38%, 01/23/45 | 100 | 94,750 | ||||||
6.50%, 06/02/41 | 90 | 86,382 | ||||||
6.63%, 06/15/35 | 100 | 98,375 | ||||||
6.63%, 06/15/38 | 25 | 24,094 | ||||||
8.00%, 05/03/19 | 60 | 68,625 | ||||||
|
| |||||||
| 3,267,469 | ||||||||
SCHEDULESOF INVESTMENTS | 17 |
Table of Contents
Schedule of Investments (Continued)
iSHARES® EMERGING MARKETS CORPORATE BOND ETF
October 31, 2015
| Security | Principal (000s) | Value | ||||||
MOROCCO — 0.72% |
| |||||||
OCP SA | ||||||||
5.63%, 04/25/24b | $ | 200 | $ | 208,900 | ||||
|
| |||||||
| 208,900 | ||||||||
PERU — 2.10% |
| |||||||
Banco de Credito del Peru/Panama | ||||||||
5.38%, 09/16/20b | 100 | 108,450 | ||||||
BBVA Banco Continental SA | ||||||||
5.00%, 08/26/22b | 100 | 105,250 | ||||||
Corp. Financiera de Desarrollo SA | ||||||||
4.75%, 07/15/25b | 200 | 203,250 | ||||||
Southern Copper Corp. | ||||||||
5.88%, 04/23/45 | 100 | 87,416 | ||||||
7.50%, 07/27/35 | 100 | 103,656 | ||||||
|
| |||||||
| 608,022 | ||||||||
PHILIPPINES — 0.45% |
| |||||||
Power Sector Assets & Liabilities Management Corp. | ||||||||
7.39%, 12/02/24b | 100 | 130,500 | ||||||
|
| |||||||
| 130,500 | ||||||||
QATAR — 2.65% |
| |||||||
CBQ Finance Ltd. | ||||||||
7.50%, 11/18/19b | 200 | 233,700 | ||||||
Ooredoo International Finance Ltd. | ||||||||
5.00%, 10/19/25b | 200 | 219,179 | ||||||
Qatari Diar Finance QSC | ||||||||
5.00%, 07/21/20b | 100 | 112,295 | ||||||
QNB Finance Ltd. | ||||||||
2.13%, 02/14/18b | 200 | 200,532 | ||||||
|
| |||||||
| 765,706 | ||||||||
RUSSIA — 9.53% |
| |||||||
AK Transneft OJSC Via TransCapitalInvest Ltd. | ||||||||
8.70%, 08/07/18b | 100 | 110,480 | ||||||
Alfa Bank AO Via Alfa Bond Issuance PLC | ||||||||
7.75%, 04/28/21b | 200 | 206,000 | ||||||
Evraz Group SA | ||||||||
9.50%, 04/24/18b | 100 | 106,327 | ||||||
Gazprom OAO Via Gaz Capital SA | ||||||||
4.95%, 02/06/28b | 200 | 176,548 | ||||||
6.21%, 11/22/16b | 100 | 103,470 | ||||||
7.29%, 08/16/37b | 100 | 100,270 | ||||||
9.25%, 04/23/19b | 100 | 112,375 | ||||||
| Security | Principal (000s) | Value | ||||||
LUKOIL International Finance BV | ||||||||
6.66%, 06/07/22b | $ | 120 | $ | 126,000 | ||||
7.25%, 11/05/19b | 100 | 108,020 | ||||||
Mobile Telesystems OJSC via MTS International Funding Ltd. | ||||||||
8.63%, 06/22/20b | 100 | 110,876 | ||||||
Rosneft Finance SA | ||||||||
7.25%, 02/02/20b | 100 | 105,750 | ||||||
Russian Agricultural Bank OJSC Via RSHB Capital SA | ||||||||
6.30%, 05/15/17b | 100 | 102,076 | ||||||
Russian Railways via RZD Capital PLC | ||||||||
5.74%, 04/03/17b | 100 | 102,750 | ||||||
Sberbank of Russia Via SB Capital SA | ||||||||
6.13%, 02/07/22b | 200 | 205,250 | ||||||
Severstal OAO Via Steel Capital SA | ||||||||
6.70%, 10/25/17b | 100 | 105,500 | ||||||
TMK OAO Via TMK Capital SA | ||||||||
7.75%, 01/27/18b | 200 | 203,365 | ||||||
VimpelCom Holdings BV | ||||||||
7.50%, 03/01/22b | 200 | 210,500 | ||||||
Vnesheconombank Via VEB Finance PLC | ||||||||
6.80%, 11/22/25b | 100 | 98,100 | ||||||
6.90%, 07/09/20b | 100 | 102,032 | ||||||
VTB Bank OJSC Via VTB Capital SA | ||||||||
6.55%, 10/13/20b | 100 | 103,008 | ||||||
6.88%, 05/29/18b | 150 | 157,388 | ||||||
|
| |||||||
| 2,756,085 | ||||||||
SINGAPORE — 2.13% |
| |||||||
DBS Bank Ltd. | ||||||||
3.63%, 09/21/22 (Call 09/21/17)b,d | 200 | 204,992 | ||||||
Oversea-Chinese Banking Corp. Ltd. | ||||||||
3.75%, 11/15/22 (Call 11/15/17)b,d | 100 | 102,580 | ||||||
PSA International Pte Ltd. | ||||||||
3.88%, 02/11/21b | 100 | 106,184 | ||||||
Puma International Financing SA | ||||||||
6.75%, 02/01/21 (Call 02/01/17)b | 200 | 202,312 | ||||||
|
| |||||||
| 616,068 | ||||||||
SOUTH AFRICA — 0.96% |
| |||||||
AngloGold Ashanti Holdings PLC | ||||||||
5.13%, 08/01/22c | 100 | 91,187 | ||||||
| 18 | 2015 iSHARES ANNUAL REPORTTO SHAREHOLDERS |
Table of Contents
Schedule of Investments (Continued)
iSHARES® EMERGING MARKETS CORPORATE BOND ETF
October 31, 2015
| Security | Principal (000s) | Value | ||||||
Eskom Holdings SOC Ltd. | ||||||||
5.75%, 01/26/21b | $ | 200 | $ | 185,758 | ||||
|
| |||||||
| 276,945 | ||||||||
SOUTH KOREA — 5.15% |
| |||||||
Hyundai Capital America | ||||||||
2.13%, 10/02/17b | 50 | 50,109 | ||||||
2.55%, 02/06/19b | 100 | 99,496 | ||||||
Korea Development Bank (The) | ||||||||
3.75%, 01/22/24 | 200 | 209,662 | ||||||
3.88%, 05/04/17 | 200 | 206,457 | ||||||
Korea East-West Power Co. Ltd. | ||||||||
2.63%, 11/27/18b | 200 | 203,161 | ||||||
Korea Gas Corp. | ||||||||
4.25%, 11/02/20b | 100 | 108,766 | ||||||
Korea National Oil Corp. | ||||||||
2.75%, 01/23/19b | 200 | 202,972 | ||||||
POSCO | ||||||||
4.25%, 10/28/20b | 100 | 106,326 | ||||||
Shinhan Bank | ||||||||
2.25%, 04/15/20b | 200 | 198,284 | ||||||
Woori Bank Co. Ltd. | ||||||||
6.21%, 05/02/67 (Call 05/02/17)b,d | 100 | 105,000 | ||||||
|
| |||||||
| 1,490,233 | ||||||||
SRI LANKA — 0.69% |
| |||||||
Bank of Ceylon | ||||||||
5.33%, 04/16/18b | 200 | 198,750 | ||||||
|
| |||||||
| 198,750 | ||||||||
THAILAND — 1.76% |
| |||||||
Bangkok Bank PCL/Hong Kong | ||||||||
4.80%, 10/18/20b | 100 | 108,736 | ||||||
Krung Thai Bank PCL/Cayman Islands | ||||||||
5.20%, 12/26/24 (Call 12/26/19)b,d | 200 | 203,254 | ||||||
PTT PCL | ||||||||
3.38%, 10/25/22b | 200 | 197,241 | ||||||
|
| |||||||
| 509,231 | ||||||||
TRINIDAD AND TOBAGO — 0.69% |
| |||||||
Consolidated Energy Finance SA | ||||||||
6.75%, 10/15/19 (Call 10/15/16)b | 200 | 199,000 | ||||||
|
| |||||||
| 199,000 | ||||||||
TURKEY — 2.57% |
| |||||||
Akbank TAS | ||||||||
5.00%, 10/24/22b | 150 | 148,500 | ||||||
Turkiye Garanti Bankasi AS | ||||||||
5.25%, 09/13/22b | 200 | 201,027 | ||||||
| Security | Principal (000s) | Value | ||||||
Turkiye Is Bankasi | ||||||||
3.88%, 11/07/17b | $ | 200 | $ | 201,500 | ||||
Yapi ve Kredi Bankasi AS | ||||||||
4.00%, 01/22/20b | 200 | 193,935 | ||||||
|
| |||||||
| 744,962 | ||||||||
UNITED ARAB EMIRATES — 3.56% |
| |||||||
Abu Dhabi National Energy Co. | ||||||||
6.50%, 10/27/36b | 100 | 124,376 | ||||||
Abu Dhabi National Energy Co. PJSC | ||||||||
4.13%, 03/13/17b | 200 | 205,839 | ||||||
ADCB Finance Cayman Ltd. | ||||||||
2.50%, 03/06/18b | 200 | 201,750 | ||||||
Dolphin Energy Ltd. | ||||||||
5.89%, 06/15/19b | 62 | 66,480 | ||||||
DP World Ltd. | ||||||||
6.85%, 07/02/37b | 100 | 105,625 | ||||||
Dubai Electricity & Water Authority | ||||||||
7.38%, 10/21/20b | 100 | 120,950 | ||||||
Emirates NBD PJSC | ||||||||
4.63%, 03/28/17b | 200 | 206,000 | ||||||
|
| |||||||
| 1,031,020 | ||||||||
UNITED KINGDOM — 0.37% |
| |||||||
ICBC Standard Bank PLC | ||||||||
8.13%, 12/02/19b | 100 | 108,520 | ||||||
|
| |||||||
| 108,520 | ||||||||
UNITED STATES — 0.36% |
| |||||||
Flextronics International Ltd. | ||||||||
4.63%, 02/15/20 | 100 | 103,750 | ||||||
|
| |||||||
| 103,750 | ||||||||
VENEZUELA — 2.02% |
| |||||||
Petroleos de Venezuela SA | ||||||||
5.25%, 04/12/17b | 130 | 73,125 | ||||||
5.38%, 04/12/27b | 135 | 46,913 | ||||||
5.50%, 04/12/37b | 50 | 17,100 | ||||||
6.00%, 05/16/24b | 250 | 89,687 | ||||||
6.00%, 11/15/26b | 160 | 56,544 | ||||||
8.50%, 11/02/17b | 252 | 152,862 | ||||||
9.00%, 11/17/21b | 75 | 30,960 | ||||||
9.75%, 05/17/35b | 100 | 41,500 | ||||||
12.75%, 02/17/22b | 150 | 74,625 | ||||||
|
| |||||||
| 583,316 | ||||||||
|
| |||||||
TOTAL CORPORATE BONDS & NOTES |
| |||||||
(Cost: $28,666,545) |
| 27,156,541 | ||||||
SCHEDULESOF INVESTMENTS | 19 |
Table of Contents
Schedule of Investments (Continued)
iSHARES® EMERGING MARKETS CORPORATE BOND ETF
October 31, 2015
| Security | Principal or Shares (000s) | Value | ||||||
FOREIGN GOVERNMENT OBLIGATIONSa — 4.13% |
| |||||||
BRAZIL — 1.02% |
| |||||||
Banco Nacional de Desenvolvimento Economico e Social | ||||||||
5.50%, 07/12/20b | $ | 100 | $ | 94,000 | ||||
6.37%, 06/16/18b | 100 | 100,020 | ||||||
6.50%, 06/10/19b | 100 | 100,000 | ||||||
|
| |||||||
| 294,020 | ||||||||
SOUTH KOREA — 2.15% |
| |||||||
Export-Import Bank of Korea | ||||||||
2.88%, 01/21/25 | 200 | 196,496 | ||||||
4.00%, 01/11/17 | 200 | 205,841 | ||||||
4.38%, 09/15/21 | 200 | 219,738 | ||||||
|
| |||||||
| 622,075 | ||||||||
UNITED ARAB EMIRATES — 0.96% |
| |||||||
International Petroleum Investment Co. | ||||||||
5.00%, 11/15/20b | 250 | 279,375 | ||||||
|
| |||||||
| 279,375 | ||||||||
|
| |||||||
TOTAL FOREIGN GOVERNMENT OBLIGATIONS |
| |||||||
(Cost: $1,200,661) |
| 1,195,470 | ||||||
SHORT-TERM INVESTMENTS — 3.44% |
| |||||||
MONEY MARKET FUNDS — 3.44% |
| |||||||
BlackRock Cash Funds: Institutional, | ||||||||
0.19%e,f,g | 702 | 702,274 | ||||||
BlackRock Cash Funds: Prime, | ||||||||
0.19%e,f,g | 62 | 61,521 | ||||||
BlackRock Cash Funds: Treasury, | ||||||||
0.02%e,f | 231 | 231,147 | ||||||
|
| |||||||
| 994,942 | ||||||||
|
| |||||||
TOTAL SHORT-TERM INVESTMENTS |
| |||||||
(Cost: $994,942) |
| 994,942 | ||||||
|
| |||||||
| Value | ||||||
TOTAL INVESTMENTS | ||||||
(Cost: $30,862,148) | $ | 29,346,953 | ||||
Other Assets, Less Liabilities — (1.45)% | (418,158 | ) | ||||
|
| |||||
NET ASSETS — 100.00% | $ | 28,928,795 | ||||
|
| |||||
| a | Investments are denominated in U.S. dollars. |
| b | This security may be resold to qualified foreign investors and foreign institutional buyers under Regulation S of the Securities Act of 1933. |
| c | All or a portion of this security represents a security on loan. See Note 1. |
| d | Variable rate security. Rate shown is as of report date. |
| e | Affiliated issuer. See Note 2. |
| f | The rate quoted is the annualized seven-day yield of the fund at period end. |
| g | All or a portion of this security represents an investment of securities lending collateral. See Note 1. |
See notes to financial statements.
| 20 | 2015 iSHARES ANNUAL REPORTTO SHAREHOLDERS |
Table of Contents
Schedule of Investments
iSHARES® EMERGING MARKETS HIGH YIELD BOND ETF
October 31, 2015
| Security | Principal (000s) | Value | ||||||
CORPORATE BONDS & NOTESa — 43.72% |
| |||||||
ARGENTINA — 0.72% |
| |||||||
YPF SA | ||||||||
8.50%, 07/28/25b | $ | 525 | $ | 516,075 | ||||
8.75%, 04/04/24b | 415 | 420,582 | ||||||
8.88%, 12/19/18b | 200 | 206,500 | ||||||
|
| |||||||
| 1,143,157 | ||||||||
BARBADOS — 0.26% |
| |||||||
Columbus International Inc. | ||||||||
7.38%, 03/30/21 (Call 03/30/18)b | 400 | 416,000 | ||||||
|
| |||||||
| 416,000 | ||||||||
BRAZIL — 13.64% |
| |||||||
Banco Bradesco SA/Cayman Islands | ||||||||
5.90%, 01/16/21b | 1,200 | 1,191,000 | ||||||
Banco BTG Pactual SA/Cayman Islands | ||||||||
5.75%, 09/28/22b | 300 | 249,360 | ||||||
Banco do Brasil SA | ||||||||
5.38%, 01/15/21b | 700 | 658,000 | ||||||
5.88%, 01/19/23b | 400 | 349,000 | ||||||
Banco do Brasil SA/Cayman | ||||||||
3.88%, 10/10/22 | 600 | 499,500 | ||||||
Banco Votorantim SA | ||||||||
7.38%, 01/21/20b | 159 | 156,615 | ||||||
Caixa Economica Federal | ||||||||
4.50%, 10/03/18b | 750 | 721,875 | ||||||
7.25%, 07/23/24 (Call 07/23/19)b,c | 200 | 158,000 | ||||||
Centrais Eletricas Brasileiras SA | ||||||||
5.75%, 10/27/21b | 600 | 477,600 | ||||||
6.88%, 07/30/19b | 400 | 356,500 | ||||||
CSN Resources SA | ||||||||
6.50%, 07/21/20b | 400 | 232,000 | ||||||
Fibria Overseas Finance Ltd. | ||||||||
5.25%, 05/12/24 | 250 | 245,938 | ||||||
Itau Unibanco Holding SA/Cayman Island | ||||||||
2.85%, 05/26/18b | 800 | 774,560 | ||||||
5.13%, 05/13/23b | 1,400 | 1,263,500 | ||||||
5.65%, 03/19/22b | 200 | 189,000 | ||||||
6.20%, 12/21/21b | 800 | 808,000 | ||||||
| Security | Principal (000s) | Value | ||||||
JBS Investments GmbH | ||||||||
7.25%, 04/03/24 (Call 04/03/19)b | $ | 200 | $ | 205,500 | ||||
7.75%, 10/28/20 (Call 10/28/17)b | 400 | 426,200 | ||||||
JBS USA LLC/JBS USA Finance Inc. | ||||||||
5.75%, 06/15/25 (Call 06/15/20)b | 300 | 290,250 | ||||||
5.88%, 07/15/24 (Call 07/15/19)b | 200 | 196,000 | ||||||
7.25%, 06/01/21 (Call 11/30/15)b | 450 | 470,813 | ||||||
8.25%, 02/01/20 (Call 11/30/15)b | 230 | 240,925 | ||||||
Minerva Luxembourg SA | ||||||||
7.75%, 01/31/23 (Call 01/31/18)b | 400 | 395,000 | ||||||
Odebrecht Drilling Norbe VIII/IX Ltd. | ||||||||
6.35%, 06/30/22 (Call 06/30/20)b | 369 | 180,810 | ||||||
Odebrecht Offshore Drilling Finance Ltd. | ||||||||
6.63%, 10/01/23 (Call 10/01/21)b | 187 | 61,190 | ||||||
6.75%, 10/01/23 (Call 12/01/21)b | 544 | 181,854 | ||||||
Oi SA | ||||||||
5.75%, 02/10/22b | 600 | 372,000 | ||||||
Petrobras Global Finance BV | ||||||||
3.00%, 01/15/19 | 800 | 663,000 | ||||||
3.25%, 03/17/17 | 400 | 381,200 | ||||||
4.38%, 05/20/23 | 1,000 | 728,750 | ||||||
4.88%, 03/17/20 | 600 | 490,500 | ||||||
5.38%, 01/27/21 | 1,650 | 1,342,687 | ||||||
5.63%, 05/20/43 | 550 | 360,690 | ||||||
5.75%, 01/20/20 | 780 | 665,691 | ||||||
6.25%, 03/17/24 | 500 | 400,475 | ||||||
6.85%, 06/05/49 | 850 | 583,270 | ||||||
6.88%, 01/20/40 | 575 | 414,000 | ||||||
7.25%, 03/17/44 | 300 | 223,200 | ||||||
7.88%, 03/15/19 | 850 | 805,375 | ||||||
Petrobras International Finance Co. SA | ||||||||
3.50%, 02/06/17 | 750 | 724,875 | ||||||
5.88%, 03/01/18 | 590 | 557,373 | ||||||
6.75%, 01/27/41 | 750 | 529,200 | ||||||
Rio Oil Finance Trust Series 2014-1 | ||||||||
6.25%, 07/06/24b | 675 | 551,812 | ||||||
Samarco Mineracao SA | ||||||||
5.75%, 10/24/23b | 600 | 533,820 | ||||||
Telemar Norte Leste SA | ||||||||
5.50%, 10/23/20b | 600 | 408,000 | ||||||
|
| |||||||
| 21,714,908 | ||||||||
SCHEDULESOF INVESTMENTS | 21 |
Table of Contents
Schedule of Investments (Continued)
iSHARES® EMERGING MARKETS HIGH YIELD BOND ETF
October 31, 2015
| Security | Principal (000s) | Value | ||||||
CHILE — 0.24% | ||||||||
VTR Finance BV | ||||||||
6.88%, 01/15/24 (Call 01/15/19)b | $ | 400 | $ | 387,000 | ||||
|
| |||||||
| 387,000 | ||||||||
CHINA — 2.64% | ||||||||
Agile Property Holdings Ltd. | ||||||||
8.38%, 02/18/19 (Call 02/18/17)b | 200 | 207,059 | ||||||
8.88%, 04/28/17 (Call 11/30/15)b | 270 | 274,050 | ||||||
9.88%, 03/20/17b | 400 | 417,520 | ||||||
Country Garden Holdings Co. Ltd. | ||||||||
7.25%, 04/04/21 (Call 10/04/17)b | 200 | 208,600 | ||||||
7.50%, 03/09/20 (Call 03/09/18)b | 200 | 212,052 | ||||||
7.50%, 01/10/23 (Call 01/10/18)b | 300 | 310,928 | ||||||
7.88%, 05/27/19 (Call 05/27/17)b | 200 | 213,560 | ||||||
Evergrande Real Estate Group Ltd. | ||||||||
8.75%, 10/30/18 (Call 10/30/16)b | 500 | 505,650 | ||||||
12.00%, 02/17/20 (Call 02/17/18)b | 400 | 437,074 | ||||||
Greentown China Holdings Ltd. | ||||||||
8.50%, 02/04/18 (Call 02/04/16)b | 200 | 210,304 | ||||||
KWG Property Holding Ltd. | ||||||||
8.98%, 01/14/19 (Call 01/14/17)b | 200 | 212,060 | ||||||
SOHO China Ltd. | ||||||||
5.75%, 11/07/17 (Call 11/30/15)b | 200 | 204,500 | ||||||
Sunac China Holdings Ltd. | ||||||||
9.38%, 04/05/18 (Call 04/05/16)b | 200 | 212,000 | ||||||
Trillion Chance Ltd. | ||||||||
8.50%, 01/10/19 (Call 01/10/17)b | 400 | 409,002 | ||||||
Yancoal International Resources Development Co. Ltd. | ||||||||
5.73%, 05/16/22b | 200 | 173,610 | ||||||
|
| |||||||
| 4,207,969 | ||||||||
COLOMBIA — 1.41% | ||||||||
Banco Davivienda SA | ||||||||
5.88%, 07/09/22b | 200 | 203,250 | ||||||
Banco de Bogota SA | ||||||||
5.38%, 02/19/23b | 200 | 199,800 | ||||||
Bancolombia SA | ||||||||
5.13%, 09/11/22 | 500 | 495,500 | ||||||
6.13%, 07/26/20 | 200 | 212,000 | ||||||
Colombia Telecomunicaciones SA ESP | ||||||||
5.38%, 09/27/22 (Call 09/27/17)b | 200 | 178,500 | ||||||
| Security | Principal (000s) | Value | ||||||
Grupo Aval Ltd. | ||||||||
4.75%, 09/26/22b | $ | 400 | $ | 389,960 | ||||
Pacific Exploration and Production Corp. | ||||||||
5.13%, 03/28/23 (Call 03/28/18)b | 400 | 146,000 | ||||||
5.38%, 01/26/19 (Call 01/26/17)b | 500 | 217,500 | ||||||
5.63%, 01/19/25 (Call 01/19/20)b | 300 | 112,500 | ||||||
7.25%, 12/12/21 (Call 12/12/16)b | 200 | 82,000 | ||||||
|
| |||||||
| 2,237,010 | ||||||||
HONG KONG — 1.03% | ||||||||
Bank of East Asia Ltd. (The) | ||||||||
4.25%, 11/20/24 (Call 11/20/19)b,c | 200 | 198,355 | ||||||
MCE Finance Ltd. | ||||||||
5.00%, 02/15/21 (Call 02/15/16)b | 400 | 374,520 | ||||||
Shimao Property Holdings Ltd. | ||||||||
6.63%, 01/14/20 (Call 01/14/17)b | 400 | 417,107 | ||||||
8.13%, 01/22/21 (Call 01/22/18)b | 200 | 214,773 | ||||||
8.38%, 02/10/22 (Call 02/10/19)b | 400 | 430,711 | ||||||
|
| |||||||
| 1,635,466 | ||||||||
INDIA — 1.25% | ||||||||
ABJA Investment Co. Pte Ltd. | ||||||||
4.85%, 01/31/20b | 200 | 202,444 | ||||||
5.95%, 07/31/24b | 200 | 186,184 | ||||||
ICICI Bank Ltd. | ||||||||
6.38%, 04/30/22 (Call 04/30/17)b,c | 277 | 284,257 | ||||||
IDBI Bank Ltd. | ||||||||
3.75%, 01/25/19b | 200 | 200,980 | ||||||
IDBI Bank Ltd./DIFC Dubai | ||||||||
4.38%, 03/26/18b | 200 | 205,233 | ||||||
Vedanta Resources PLC | ||||||||
6.00%, 01/31/19b | 400 | 320,146 | ||||||
7.13%, 05/31/23b | 200 | 148,500 | ||||||
8.25%, 06/07/21b | 200 | 160,000 | ||||||
9.50%, 07/18/18b | 300 | 282,000 | ||||||
|
| |||||||
| 1,989,744 | ||||||||
INDONESIA — 3.22% | ||||||||
Majapahit Holding BV | ||||||||
7.75%, 01/20/20b | 500 | 564,250 | ||||||
7.88%, 06/29/37b | 200 | 224,250 | ||||||
8.00%, 08/07/19b | 200 | 225,500 | ||||||
| 22 | 2015 iSHARES ANNUAL REPORTTO SHAREHOLDERS |
Table of Contents
Schedule of Investments (Continued)
iSHARES® EMERGING MARKETS HIGH YIELD BOND ETF
October 31, 2015
| Security | Principal (000s) | Value | ||||||
Pelabuhan Indonesia II PT | ||||||||
4.25%, 05/05/25b | $ | 600 | $ | 550,500 | ||||
Pertamina Persero PT | ||||||||
4.30%, 05/20/23b | 500 | 472,372 | ||||||
4.88%, 05/03/22b | 400 | 393,800 | ||||||
5.25%, 05/23/21b | 400 | 409,693 | ||||||
5.63%, 05/20/43b | 400 | 332,600 | ||||||
6.00%, 05/03/42b | 400 | 347,000 | ||||||
6.45%, 05/30/44b | 400 | 370,502 | ||||||
6.50%, 05/27/41b | 200 | 186,282 | ||||||
Perusahaan Gas Negara Persero Tbk PT | ||||||||
5.13%, 05/16/24b | 400 | 396,149 | ||||||
Perusahaan Listrik Negara PT | ||||||||
5.25%, 10/24/42b | 300 | 246,750 | ||||||
5.50%, 11/22/21b | 400 | 412,672 | ||||||
|
| |||||||
| 5,132,320 | ||||||||
JAMAICA — 1.05% | ||||||||
Digicel Group Ltd. | ||||||||
7.13%, 04/01/22 (Call 04/01/17)b | 400 | 330,000 | ||||||
8.25%, 09/30/20 (Call 09/30/16)b | 700 | 619,500 | ||||||
Digicel Ltd. | ||||||||
6.00%, 04/15/21 (Call 04/15/16)b | 600 | 540,000 | ||||||
6.75%, 03/01/23 (Call 03/01/18)b | 200 | 180,000 | ||||||
|
| |||||||
| 1,669,500 | ||||||||
KAZAKHSTAN — 2.37% | ||||||||
Halyk Savings Bank of Kazakhstan JSC | ||||||||
7.25%, 05/03/17b | 100 | 102,032 | ||||||
7.25%, 01/28/21b | 200 | 204,200 | ||||||
Kazakhstan Temir Zholy Finance BV | ||||||||
6.38%, 10/06/20b | 200 | 195,400 | ||||||
6.95%, 07/10/42b | 200 | 164,852 | ||||||
Kazkommertsbank JSC | ||||||||
5.50%, 12/21/22b | 300 | 214,716 | ||||||
KazMunaiGaz Finance Sub BV | ||||||||
9.13%, 07/02/18b | 600 | 661,668 | ||||||
KazMunayGas National Co. JSC | ||||||||
4.40%, 04/30/23b | 200 | 176,000 | ||||||
4.88%, 05/07/25b | 400 | 352,000 | ||||||
5.75%, 04/30/43b | 600 | 461,851 | ||||||
6.00%, 11/07/44b | 400 | 312,608 | ||||||
6.38%, 04/09/21b | 400 | 404,120 | ||||||
| Security | Principal (000s) | Value | ||||||
7.00%, 05/05/20b | $ | 500 | $ | 519,794 | ||||
|
| |||||||
| 3,769,241 | ||||||||
LUXEMBOURG — 0.32% | ||||||||
Millicom International Cellular SA | ||||||||
4.75%, 05/22/20 (Call 05/22/17)b | 200 | 176,000 | ||||||
6.00%, 03/15/25 (Call 03/15/20)b | 200 | 164,500 | ||||||
6.63%, 10/15/21 (Call 10/15/17)b | 200 | 175,000 | ||||||
|
| |||||||
| 515,500 | ||||||||
MEXICO — 2.16% | ||||||||
Axtel SAB de CV CPO | ||||||||
9.00%, 01/31/20 (Call 01/31/16)b,d | 150 | 153,375 | ||||||
Banco Santander Mexico SA | ||||||||
5.95%, 01/30/24 (Call 01/30/19)b,c | 400 | 417,000 | ||||||
BBVA Bancomer SA/Texas | ||||||||
7.25%, 04/22/20b | 300 | 333,024 | ||||||
Cemex Finance LLC | ||||||||
6.00%, 04/01/24 (Call 04/01/19)b | 400 | 382,000 | ||||||
9.38%, 10/12/22 (Call 10/12/17)b | 500 | 543,750 | ||||||
Cemex SAB de CV | ||||||||
5.70%, 01/11/25 (Call 01/11/20)b | 200 | 185,000 | ||||||
5.88%, 03/25/19 (Call 03/25/16)b | 200 | 202,200 | ||||||
6.13%, 05/05/25 (Call 05/05/20)b | 200 | 189,500 | ||||||
6.50%, 12/10/19b | 400 | 406,000 | ||||||
7.25%, 01/15/21 (Call 01/15/18)b | 300 | 307,500 | ||||||
9.50%, 06/15/18 (Call 06/15/16)b | 200 | 215,250 | ||||||
Empresas ICA SAB de CV | ||||||||
8.88%, 05/29/24 (Call 05/29/19)b | 200 | 56,000 | ||||||
8.90%, 02/04/21 (Call 02/04/16)b | 200 | 55,500 | ||||||
|
| |||||||
| 3,446,099 | ||||||||
RUSSIA — 5.51% | ||||||||
Alfa Bank AO Via Alfa Bond Issuance PLC | ||||||||
7.50%, 09/26/19b | 200 | 201,662 | ||||||
7.75%, 04/28/21b | 300 | 309,000 | ||||||
Alfa Bank OJSC Via Alfa Bond Issuance PLC | ||||||||
7.88%, 09/25/17b | 200 | 210,747 | ||||||
ALROSA Finance SA | ||||||||
7.75%, 11/03/20b | 400 | 424,000 | ||||||
SCHEDULESOF INVESTMENTS | 23 |
Table of Contents
Schedule of Investments (Continued)
iSHARES® EMERGING MARKETS HIGH YIELD BOND ETF
October 31, 2015
| Security | Principal (000s) | Value | ||||||
Bank Otkritie Financial Corp OJSC via OFCB Capital PLC | ||||||||
7.25%, 04/25/18b | $ | 200 | $ | 202,750 | ||||
Credit Bank of Moscow Via CBOM Finance PLC | ||||||||
7.70%, 02/01/18b | 200 | 201,458 | ||||||
Evraz Group SA | ||||||||
6.50%, 04/22/20b | 200 | 193,400 | ||||||
6.75%, 04/27/18b | 200 | 201,000 | ||||||
7.40%, 04/24/17b | 200 | 206,525 | ||||||
9.50%, 04/24/18b | 100 | 106,327 | ||||||
Gazprombank OAO Via GPB Eurobond Finance PLC | ||||||||
7.50%, 12/28/23 (Call 12/28/18)b,c | 200 | 180,216 | ||||||
Metalloinvest Finance Ltd. | ||||||||
5.63%, 04/17/20b | 400 | 381,000 | ||||||
MMC Norilsk Nickel OJSC via MMC Finance Ltd. | ||||||||
5.55%, 10/28/20b | 400 | 401,709 | ||||||
Mobile Telesystems OJSC via MTS International Funding Ltd. | ||||||||
5.00%, 05/30/23b | 200 | 184,750 | ||||||
8.63%, 06/22/20b | 250 | 277,190 | ||||||
OJSC Novolipetsk Steel via Steel Funding Ltd. | ||||||||
4.45%, 02/19/18b | 200 | 199,000 | ||||||
Russian Agricultural Bank OJSC Via RSHB Capital SA | ||||||||
5.10%, 07/25/18b | 600 | 597,750 | ||||||
6.30%, 05/15/17b | 300 | 306,229 | ||||||
Russian Railways via RZD Capital PLC | ||||||||
5.74%, 04/03/17b | 500 | 513,750 | ||||||
Sberbank of Russia Via SB Capital SA | ||||||||
5.13%, 10/29/22b | 800 | 748,842 | ||||||
Severstal OAO Via Steel Capital SA | ||||||||
5.90%, 10/17/22b | 200 | 194,762 | ||||||
6.70%, 10/25/17b | 200 | 211,000 | ||||||
Sibur Securities Ltd. | ||||||||
3.91%, 01/31/18b | 300 | 290,250 | ||||||
| Security | Principal (000s) | Value | ||||||
TMK OAO Via TMK Capital SA | ||||||||
6.75%, 04/03/20b | $ | 200 | $ | 186,740 | ||||
7.75%, 01/27/18b | 100 | 101,682 | ||||||
Vimpel Communications Via VIP Finance Ireland Ltd. OJSC | ||||||||
7.75%, 02/02/21b | 200 | 212,644 | ||||||
VimpelCom Holdings BV | ||||||||
5.20%, 02/13/19b | 200 | 198,000 | ||||||
5.95%, 02/13/23b | 300 | 286,875 | ||||||
7.50%, 03/01/22b | 450 | 473,625 | ||||||
VTB Bank OJSC Via VTB Capital SA | ||||||||
6.95%, 10/17/22b | 600 | 573,852 | ||||||
|
| |||||||
| 8,776,735 | ||||||||
SINGAPORE — 0.36% | ||||||||
Global A&T Electronics Ltd. | ||||||||
10.00%, 02/01/19 (Call 02/01/16)b | 200 | 170,000 | ||||||
Puma International Financing SA | ||||||||
6.75%, 02/01/21 (Call 02/01/17)b | 400 | 404,624 | ||||||
|
| |||||||
| 574,624 | ||||||||
SOUTH AFRICA — 1.93% | ||||||||
AngloGold Ashanti Holdings PLC | ||||||||
5.13%, 08/01/22 | 300 | 273,562 | ||||||
5.38%, 04/15/20 | 300 | 288,030 | ||||||
Eskom Holdings SOC Ltd. | ||||||||
5.75%, 01/26/21b | 400 | 371,516 | ||||||
6.75%, 08/06/23b | 400 | 371,400 | ||||||
7.13%, 02/11/25b | 360 | 333,900 | ||||||
Gold Fields Orogen Holding BVI Ltd. | ||||||||
4.88%, 10/07/20b | 400 | 324,000 | ||||||
Myriad International Holdings BV | ||||||||
6.00%, 07/18/20b | 800 | 852,128 | ||||||
6.38%, 07/28/17b | 250 | 262,141 | ||||||
|
| |||||||
| 3,076,677 | ||||||||
SOUTH KOREA — 0.32% | ||||||||
Woori Bank Co. Ltd. | ||||||||
5.00%, 06/10/45 (Call 06/10/20)b,c | 200 | 199,547 | ||||||
6.21%, 05/02/67 (Call 05/02/17)b,c | 300 | 315,000 | ||||||
|
| |||||||
| 514,547 | ||||||||
| 24 | 2015 iSHARES ANNUAL REPORTTO SHAREHOLDERS |
Table of Contents
Schedule of Investments (Continued)
iSHARES® EMERGING MARKETS HIGH YIELD BOND ETF
October 31, 2015
| Security | Principal (000s) | Value | ||||||
SRI LANKA — 0.39% | ||||||||
Bank of Ceylon | ||||||||
5.33%, 04/16/18b | $ | 200 | $ | 198,750 | ||||
6.88%, 05/03/17b | 200 | 205,000 | ||||||
National Savings Bank | ||||||||
8.88%, 09/18/18b | 200 | 213,750 | ||||||
|
| |||||||
| 617,500 | ||||||||
THAILAND — 0.13% | ||||||||
Krung Thai Bank PCL/Cayman Islands | ||||||||
5.20%, 12/26/24 (Call 12/26/19)b,c | 200 | 203,254 | ||||||
|
| |||||||
| 203,254 | ||||||||
TRINIDAD AND TOBAGO — 0.45% | ||||||||
Consolidated Energy Finance SA | ||||||||
6.75%, 10/15/19 (Call 10/15/16)b | 400 | 398,000 | ||||||
Petroleum Co. of Trinidad & Tobago Ltd. | ||||||||
9.75%, 08/14/19b | 300 | 321,000 | ||||||
|
| |||||||
| 719,000 | ||||||||
TURKEY — 0.86% | ||||||||
Finansbank AS/Turkey | ||||||||
6.25%, 04/30/19b | 200 | 208,824 | ||||||
Turkiye Is Bankasi AS | ||||||||
6.00%, 10/24/22b | 400 | 392,500 | ||||||
Turkiye Vakiflar Bankasi TAO | ||||||||
6.00%, 11/01/22b | 200 | 190,300 | ||||||
6.88%, 02/03/25 (Call 02/03/20)b,c | 200 | 193,930 | ||||||
Yapi ve Kredi Bankasi AS | ||||||||
5.50%, 12/06/22b | 400 | 382,460 | ||||||
|
| |||||||
| 1,368,014 | ||||||||
UKRAINE — 0.12% | ||||||||
Metinvest BV | ||||||||
8.75%, 02/14/18b | 300 | 186,048 | ||||||
|
| |||||||
| 186,048 | ||||||||
UNITED KINGDOM — 0.20% | ||||||||
ICBC Standard Bank PLC | ||||||||
8.13%, 12/02/19b | 100 | 108,520 | ||||||
Sable International Finance Ltd. | ||||||||
6.88%, 08/01/22 (Call 08/01/18)b | 200 | 203,500 | ||||||
|
| |||||||
| 312,020 | ||||||||
| Security | Principal (000s) | Value | ||||||
UNITED STATES — 0.35% | ||||||||
Flextronics International Ltd. | ||||||||
4.75%, 06/15/25 (Call 03/15/25)b | $ | 200 | $ | 195,000 | ||||
5.00%, 02/15/23 | 350 | 357,437 | ||||||
|
| |||||||
| 552,437 | ||||||||
VENEZUELA — 2.79% | ||||||||
Petroleos de Venezuela SA | ||||||||
5.25%, 04/12/17b | 910 | 511,875 | ||||||
5.38%, 04/12/27b | 1,070 | 371,825 | ||||||
5.50%, 04/12/37b | 470 | 160,740 | ||||||
6.00%, 05/16/24b | 1,564 | 561,085 | ||||||
6.00%, 11/15/26b | 1,300 | 459,420 | ||||||
8.50%, 11/02/17b | 1,971 | 1,197,185 | ||||||
9.00%, 11/17/21b | 935 | 385,968 | ||||||
9.75%, 05/17/35b | 880 | 365,200 | ||||||
12.75%, 02/17/22b | 850 | 422,875 | ||||||
|
| |||||||
| 4,436,173 | ||||||||
|
| |||||||
TOTAL CORPORATE BONDS & NOTES |
| |||||||
(Cost: $77,557,798) |
| 69,600,943 | ||||||
FOREIGN GOVERNMENT OBLIGATIONSa — 53.54% |
| |||||||
ARGENTINA — 2.12% | ||||||||
Argentine Republic Government International Bond | ||||||||
0.00%, 12/31/33e | 1,290 | 1,431,761 | ||||||
2.50%, 12/31/38e | 1,739 | 1,101,656 | ||||||
8.28%, 12/31/33e | 463 | 502,000 | ||||||
8.75%, 06/02/17e | 307 | 335,398 | ||||||
|
| |||||||
| 3,370,815 | ||||||||
BRAZIL — 6.39% | ||||||||
Banco Nacional de Desenvolvimento Economico e Social | ||||||||
4.00%, 04/14/19b | 1,000 | 937,000 | ||||||
5.75%, 09/26/23b | 800 | 708,000 | ||||||
Brazilian Government International Bond | ||||||||
4.25%, 01/07/25 | 2,000 | 1,772,500 | ||||||
4.88%, 01/22/21 | 1,600 | 1,573,600 | ||||||
5.00%, 01/27/45 | 1,100 | 825,000 | ||||||
5.88%, 01/15/19 | 1,500 | 1,599,000 | ||||||
7.13%, 01/20/37 | 1,500 | 1,458,750 | ||||||
10.13%, 05/15/27 | 1,000 | 1,306,250 | ||||||
|
| |||||||
| 10,180,100 | ||||||||
SCHEDULESOF INVESTMENTS | 25 |
Table of Contents
Schedule of Investments (Continued)
iSHARES® EMERGING MARKETS HIGH YIELD BOND ETF
October 31, 2015
| Security | Principal (000s) | Value | ||||||
COSTA RICA — 0.66% |
| |||||||
Costa Rica Government International Bond | ||||||||
4.25%, 01/26/23b | $ | 200 | $ | 180,000 | ||||
5.63%, 04/30/43b | 200 | 152,500 | ||||||
7.00%, 04/04/44b | 400 | 360,000 | ||||||
7.16%, 03/12/45b | 400 | 361,000 | ||||||
|
| |||||||
| 1,053,500 | ||||||||
CROATIA — 1.97% |
| |||||||
Croatia Government International Bond | ||||||||
5.50%, 04/04/23b | 400 | 412,000 | ||||||
6.00%, 01/26/24b | 600 | 635,250 | ||||||
6.25%, 04/27/17b | 500 | 523,280 | ||||||
6.38%, 03/24/21b | 400 | 430,500 | ||||||
6.63%, 07/14/20b | 500 | 543,425 | ||||||
6.75%, 11/05/19b | 550 | 598,298 | ||||||
|
| |||||||
| 3,142,753 | ||||||||
DOMINICAN REPUBLIC — 1.71% |
| |||||||
Dominican Republic International Bond | ||||||||
5.50%, 01/27/25b | 600 | 592,500 | ||||||
5.88%, 04/18/24b | 200 | 203,500 | ||||||
6.60%, 01/28/24b | 100 | 106,250 | ||||||
6.85%, 01/27/45b | 700 | 698,250 | ||||||
7.45%, 04/30/44b | 450 | 474,750 | ||||||
7.50%, 05/06/21b | 600 | 652,500 | ||||||
|
| |||||||
| 2,727,750 | ||||||||
ECUADOR — 0.59% |
| |||||||
Ecuador Government International Bond | ||||||||
7.95%, 06/20/24b | 800 | 608,000 | ||||||
10.50%, 03/24/20b | 400 | 332,000 | ||||||
|
| |||||||
| 940,000 | ||||||||
EGYPT — 0.54% |
| |||||||
Egypt Government International Bond | ||||||||
5.75%, 04/29/20b | 200 | 205,380 | ||||||
5.88%, 06/11/25b | 600 | 561,000 | ||||||
6.88%, 04/30/40b | 100 | 89,600 | ||||||
|
| |||||||
| 855,980 | ||||||||
| Security | Principal (000s) | Value | ||||||
EL SALVADOR — 0.87% |
| |||||||
El Salvador Government International Bond | ||||||||
5.88%, 01/30/25b | $ | 300 | $ | 266,250 | ||||
6.38%, 01/18/27b | 250 | 223,125 | ||||||
7.63%, 02/01/41b | 150 | 134,625 | ||||||
7.65%, 06/15/35b | 330 | 299,062 | ||||||
7.75%, 01/24/23b | 260 | 263,900 | ||||||
8.25%, 04/10/32b | 200 | 199,250 | ||||||
|
| |||||||
| 1,386,212 | ||||||||
GUATEMALA — 0.32% | ||||||||
Guatemala Government Bond | ||||||||
4.88%, 02/13/28b | 300 | 292,500 | ||||||
5.75%, 06/06/22b | 200 | 212,000 | ||||||
|
| |||||||
| 504,500 | ||||||||
HUNGARY — 3.63% | ||||||||
Hungary Government International Bond | ||||||||
4.00%, 03/25/19 | 200 | 209,500 | ||||||
4.13%, 02/19/18 | 410 | 429,274 | ||||||
5.38%, 02/21/23 | 760 | 836,091 | ||||||
5.38%, 03/25/24 | 600 | 663,000 | ||||||
5.75%, 11/22/23 | 700 | 788,375 | ||||||
6.25%, 01/29/20 | 720 | 812,815 | ||||||
6.38%, 03/29/21 | 900 | 1,034,910 | ||||||
7.63%, 03/29/41 | 432 | 589,093 | ||||||
Magyar Export-Import Bank Zrt | ||||||||
4.00%, 01/30/20b | 200 | 203,500 | ||||||
5.50%, 02/12/18b | 200 | 212,250 | ||||||
|
| |||||||
| 5,778,808 | ||||||||
INDONESIA — 6.45% | ||||||||
Indonesia Government International Bond | ||||||||
3.38%, 04/15/23b | 570 | 543,106 | ||||||
3.75%, 04/25/22b | 500 | 495,022 | ||||||
4.13%, 01/15/25b | 600 | 586,160 | ||||||
4.63%, 04/15/43b | 600 | 542,428 | ||||||
4.88%, 05/05/21b | 700 | 735,426 | ||||||
5.13%, 01/15/45b | 600 | 562,647 | ||||||
5.25%, 01/17/42b | 800 | 759,600 | ||||||
5.38%, 10/17/23b | 400 | 428,665 | ||||||
5.88%, 03/13/20b | 626 | 694,567 | ||||||
5.88%, 01/15/24b | 600 | 662,468 | ||||||
| 26 | 2015 iSHARES ANNUAL REPORTTO SHAREHOLDERS |
Table of Contents
Schedule of Investments (Continued)
iSHARES® EMERGING MARKETS HIGH YIELD BOND ETF
October 31, 2015
| Security | Principal (000s) | Value | ||||||
6.63%, 02/17/37b | $ | 400 | $ | 439,600 | ||||
6.75%, 01/15/44b | 600 | 679,013 | ||||||
6.88%, 03/09/17b | 400 | 428,200 | ||||||
6.88%, 01/17/18b | 500 | 549,266 | ||||||
7.75%, 01/17/38b | 600 | 740,700 | ||||||
8.50%, 10/12/35b | 500 | 655,600 | ||||||
11.63%, 03/04/19b | 600 | 768,217 | ||||||
|
| |||||||
| 10,270,685 | ||||||||
JAMAICA — 0.77% | ||||||||
Jamaica Government International Bond | ||||||||
7.63%, 07/09/25 | 400 | 436,000 | ||||||
7.88%, 07/28/45 | 200 | 202,000 | ||||||
8.00%, 06/24/19 | 150 | 163,500 | ||||||
8.00%, 03/15/39 | 400 | 432,500 | ||||||
|
| |||||||
| 1,234,000 | ||||||||
LEBANON — 2.32% | ||||||||
Lebanese Republic | ||||||||
6.65%, 02/26/30b | 450 | 445,500 | ||||||
Lebanon Government International Bond | ||||||||
5.15%, 11/12/18b | 450 | 450,405 | ||||||
5.80%, 04/14/20b | 200 | 200,040 | ||||||
6.00%, 05/20/19b | 300 | 302,547 | ||||||
6.15%, 06/19/20 | 200 | 202,290 | ||||||
6.20%, 02/26/25b | 200 | 197,000 | ||||||
6.38%, 03/09/20 | 400 | 407,500 | ||||||
8.25%, 04/12/2b | 800 | 880,192 | ||||||
9.00%, 03/20/17 | 570 | 601,139 | ||||||
|
| |||||||
| 3,686,613 | ||||||||
MOROCCO — 0.44% | ||||||||
Morocco Government International Bond | ||||||||
4.25%, 12/11/22b | 492 | 495,444 | ||||||
5.50%, 12/11/42b | 200 | 200,400 | ||||||
|
| |||||||
| 695,844 | ||||||||
NIGERIA — 0.37% | ||||||||
Nigeria Government International Bond | ||||||||
5.13%, 07/12/18b | 200 | 198,000 | ||||||
6.38%, 07/12/23b | 200 | 188,000 | ||||||
6.75%, 01/28/21b | 200 | 197,050 | ||||||
|
| |||||||
| 583,050 | ||||||||
| Security | Principal (000s) | Value | ||||||
PAKISTAN — 0.56% | ||||||||
Pakistan Government International Bond | ||||||||
6.88%, 06/01/17b | $ | 200 | $ | 207,067 | ||||
7.25%, 04/15/19b | 200 | 207,800 | ||||||
8.25%, 04/15/24b | 450 | 479,587 | ||||||
|
| |||||||
| 894,454 | ||||||||
RUSSIA — 8.03% | ||||||||
Russian Foreign Bond – Eurobond | ||||||||
3.25%, 04/04/17b | 800 | 806,120 | ||||||
3.50%, 01/16/19b | 600 | 605,250 | ||||||
4.50%, 04/04/22b | 600 | 613,500 | ||||||
4.88%, 09/16/23b | 600 | 620,220 | ||||||
5.00%, 04/29/20b | 1,100 | 1,156,375 | ||||||
5.63%, 04/04/42b | 1,000 | 996,500 | ||||||
5.88%, 09/16/43b | 600 | 615,900 | ||||||
7.50%, 03/31/30b,d | 4,136 | 4,919,000 | ||||||
11.00%, 07/24/18b | 1,100 | 1,315,050 | ||||||
12.75%, 06/24/28b | 700 | 1,141,000 | ||||||
|
| |||||||
| 12,788,915 | ||||||||
SERBIA — 1.22% | ||||||||
Republic of Serbia | ||||||||
4.88%, 02/25/20b | 600 | 618,750 | ||||||
5.25%, 11/21/17b | 200 | 208,376 | ||||||
5.88%, 12/03/18b | 400 | 424,648 | ||||||
7.25%, 09/28/21b | 600 | 685,740 | ||||||
|
| |||||||
| 1,937,514 | ||||||||
SRI LANKA — 1.05% | ||||||||
Sri Lanka Government International Bond | ||||||||
5.88%, 07/25/22b | 328 | 315,700 | ||||||
6.00%, 01/14/19b | 400 | 401,638 | ||||||
6.25%, 10/04/20b | 450 | 451,800 | ||||||
6.25%, 07/27/21b | 499 | 495,020 | ||||||
|
| |||||||
| 1,664,158 | ||||||||
TURKEY — 9.20% | ||||||||
Export Credit Bank of Turkey | ||||||||
5.00%, 09/23/21b | 200 | 199,711 | ||||||
5.38%, 11/04/16b | 200 | 205,517 | ||||||
Turkey Government International Bond | ||||||||
3.25%, 03/23/23 | 554 | 515,009 | ||||||
4.25%, 04/14/26 | 600 | 576,000 | ||||||
SCHEDULESOF INVESTMENTS | 27 |
Table of Contents
Schedule of Investments (Continued)
iSHARES® EMERGING MARKETS HIGH YIELD BOND ETF
October 31, 2015
| Security | Principal (000s) | Value | ||||||
4.88%, 04/16/43 | $ | 900 | $ | 810,270 | ||||
5.13%, 03/25/22 | 442 | 462,289 | ||||||
5.63%, 03/30/21 | 650 | 698,750 | ||||||
5.75%, 03/22/24 | 600 | 647,250 | ||||||
5.88%, 04/24/19b | 200 | 209,428 | ||||||
6.00%, 01/14/41 | 1,000 | 1,051,200 | ||||||
6.25%, 09/26/22 | 800 | 888,000 | ||||||
6.63%, 02/17/45 | 600 | 690,000 | ||||||
6.75%, 04/03/18 | 750 | 815,625 | ||||||
6.75%, 05/30/40 | 575 | 655,500 | ||||||
6.88%, 03/17/36 | 770 | 885,515 | ||||||
7.00%, 03/11/19 | 500 | 557,875 | ||||||
7.00%, 06/05/20 | 550 | 623,123 | ||||||
7.25%, 03/05/38 | 210 | 252,525 | ||||||
7.38%, 02/05/25 | 1,020 | 1,219,991 | ||||||
7.50%, 07/14/17 | 600 | 650,130 | ||||||
7.50%, 11/07/19 | 550 | 629,998 | ||||||
8.00%, 02/14/34 | 563 | 720,640 | ||||||
11.88%, 01/15/30 | 404 | 674,680 | ||||||
|
| |||||||
| 14,639,026 | ||||||||
UKRAINE — 1.36% | ||||||||
Ukraine Government International Bond | ||||||||
6.58%, 11/21/16b | 350 | 268,504 | ||||||
6.75%, 11/14/17b | 200 | 152,800 | ||||||
7.50%, 04/17/23b | 400 | 303,750 | ||||||
7.75%, 09/23/20b | 600 | 447,363 | ||||||
7.80%, 11/28/22b | 800 | 603,433 | ||||||
7.95%, 02/23/21b | 500 | 389,481 | ||||||
|
| |||||||
| 2,165,331 | ||||||||
VENEZUELA — 2.57% | ||||||||
Venezuela Government International Bond | ||||||||
6.00%, 12/09/20b | 605 | 228,388 | ||||||
7.00%, 12/01/18b | 300 | 130,500 | ||||||
7.00%, 03/31/38b | 350 | 130,375 | ||||||
7.65%, 04/21/25 | 608 | 229,520 | ||||||
7.75%, 10/13/19b | 750 | 296,250 | ||||||
8.25%, 10/13/24b | 675 | 256,500 | ||||||
9.00%, 05/07/23b | 695 | 272,787 | ||||||
9.25%, 09/15/27 | 1,445 | 632,187 | ||||||
9.25%, 05/07/28b | 620 | 243,350 | ||||||
9.38%, 01/13/34 | 385 | 154,963 | ||||||
| Security | Principal or Shares (000s) | Value | ||||||
11.75%, 10/21/26b | $ | 950 | $ | 420,375 | ||||
11.95%, 08/05/31b | 1,095 | 492,750 | ||||||
12.75%, 08/23/22b | 900 | 427,500 | ||||||
13.63%, 08/15/18 | 300 | 179,400 | ||||||
|
| |||||||
| 4,094,845 | ||||||||
VIETNAM — 0.40% | ||||||||
Vietnam Government International Bond | ||||||||
4.80%, 11/19/24b | 400 | 392,646 | ||||||
6.75%, 01/29/20b | 220 | 243,712 | ||||||
|
| |||||||
| 636,358 | ||||||||
|
| |||||||
TOTAL FOREIGN GOVERNMENT OBLIGATIONS |
| |||||||
(Cost: $89,663,613) |
| 85,231,211 | ||||||
SHORT-TERM INVESTMENTS — 1.13% |
| |||||||
MONEY MARKET FUNDS — 1.13% | ||||||||
BlackRock Cash Funds: Treasury, SL Agency Shares | ||||||||
0.02%f,g | 1,804 | 1,804,380 | ||||||
|
| |||||||
| 1,804,380 | ||||||||
|
| |||||||
TOTAL SHORT-TERM INVESTMENTS |
| |||||||
(Cost: $1,804,380) |
| 1,804,380 | ||||||
|
| |||||||
TOTAL INVESTMENTS |
| |||||||
(Cost: $169,025,791) |
| 156,636,534 | ||||||
Other Assets, Less Liabilities — 1.61% |
| 2,562,943 | ||||||
|
| |||||||
NET ASSETS — 100.00% |
| $ | 159,199,477 | |||||
|
| |||||||
CPO — Certificates of Participation (Ordinary)
| a | Investments are denominated in U.S. dollars. |
| b | This security may be resold to qualified foreign investors and foreign institutional buyers under Regulation S of the Securities Act of 1933. |
| c | Variable rate security. Rate shown is as of report date. |
| d | Step coupon security. Coupon rate will either increase (step-up bond) or decrease (step-down bond) at regular intervals until maturity. Interest rate shown reflects the rate currently in effect. |
| e | Issuer is in default of interest payments. |
| f | Affiliated issuer. See Note 2. |
| g | The rate quoted is the annualized seven-day yield of the fund at period end. |
See notes to financial statements.
| 28 | 2015 iSHARES ANNUAL REPORTTO SHAREHOLDERS |
Table of Contents
Schedule of Investments
iSHARES® EMERGING MARKETS LOCAL CURRENCY BOND ETF
October 31, 2015
| Security | (000s) | Value | ||||||||||
FOREIGN GOVERNMENT OBLIGATIONS — 94.52% |
| |||||||||||
BRAZIL — 11.81% |
| |||||||||||
Brazil Letras do Tesouro Nacional |
| |||||||||||
0.00%, 01/01/16 | BRL | 34,657 | $ | 8,818,312 | ||||||||
0.00%, 04/01/16 | BRL | 30,648 | 7,541,943 | |||||||||
0.00%, 07/01/16 | BRL | 30,279 | 7,181,913 | |||||||||
0.00%, 10/01/16 | BRL | 27,639 | 6,311,552 | |||||||||
0.00%, 01/01/17 | BRL | 18,783 | 4,136,594 | |||||||||
0.00%, 07/01/17 | BRL | 4,286 | 876,480 | |||||||||
0.00%, 01/01/18 | BRL | 19,600 | 3,718,247 | |||||||||
0.00%, 07/01/18 | BRL | 15,770 | 2,780,251 | |||||||||
0.00%, 01/01/19 | BRL | 18,783 | 3,070,180 | |||||||||
Brazil Notas do Tesouro Nacional Series F | ||||||||||||
10.00%, 01/01/18 | BRL | 3,527 | 829,259 | |||||||||
10.00%, 01/01/19 | BRL | 2,138 | 481,991 | |||||||||
10.00%, 01/01/21 | BRL | 30,845 | 6,496,675 | |||||||||
10.00%, 01/01/23 | BRL | 18,920 | 3,771,441 | |||||||||
10.00%, 01/01/25 | BRL | 23,050 | 4,402,464 | |||||||||
Brazilian Government International Bond | ||||||||||||
8.50%, 01/05/24 | BRL | 500 | 106,670 | |||||||||
10.25%, 01/10/28 | BRL | 1,420 | 302,941 | |||||||||
12.50%, 01/05/16 | BRL | 1,400 | 359,684 | |||||||||
12.50%, 01/05/22 | BRL | 1,633 | 419,015 | |||||||||
|
| |||||||||||
| 61,605,612 | ||||||||||||
CHILE — 0.32% |
| |||||||||||
Bonos del Banco Central de Chile en Pesos | ||||||||||||
4.50%, 04/01/20 | CLP | 220,000 | 322,180 | |||||||||
4.50%, 06/01/20 | CLP | 475,000 | 695,177 | |||||||||
6.00%, 02/01/21 | CLP | 35,000 | 54,813 | |||||||||
Chile Government International Bond | ||||||||||||
5.50%, 08/05/20 | CLP | 416,000 | 624,408 | |||||||||
|
| |||||||||||
| 1,696,578 | ||||||||||||
COLOMBIA — 3.43% |
| |||||||||||
Colombia Government International Bond | ||||||||||||
7.75%, 04/14/21 | COP | 496,000 | 174,548 | |||||||||
9.85%, 06/28/27 | COP | 2,998,000 | 1,207,391 | |||||||||
Colombian TES |
| |||||||||||
6.00%, 04/28/28 | COP | 4,545,000 | 1,299,454 | |||||||||
| Security | (000s) | Value | ||||||||||
7.00%, 09/11/19 | COP | 6,790,000 | $ | 2,354,546 | ||||||||
7.00%, 05/04/22 | COP | 4,322,000 | 1,461,568 | |||||||||
7.25%, 06/15/16 | COP | 1,465,000 | 511,764 | |||||||||
7.50%, 08/26/26 | COP | 6,673,800 | 2,225,580 | |||||||||
7.75%, 09/18/30 | COP | 2,050,000 | 670,401 | |||||||||
10.00%, 07/24/24 | COP | 7,616,000 | 2,992,584 | |||||||||
11.00%, 07/24/20 | COP | 8,156,000 | 3,250,976 | |||||||||
11.25%, 10/24/18 | COP | 4,568,000 | 1,767,929 | |||||||||
|
| |||||||||||
| 17,916,741 | ||||||||||||
CZECH REPUBLIC — 3.60% |
| |||||||||||
Czech Republic Government Bond | ||||||||||||
0.85%, 03/17/18a | CZK | 35,030 | 1,462,660 | |||||||||
1.50%, 10/29/19a | CZK | 13,470 | 583,225 | |||||||||
3.75%, 09/12/20a | CZK | 41,490 | 2,005,227 | |||||||||
3.85%, 09/29/21a | CZK | 38,940 | 1,950,013 | |||||||||
4.00%, 04/11/17a | CZK | 36,110 | 1,565,260 | |||||||||
4.20%, 12/04/36a | CZK | 47,880 | 2,904,699 | |||||||||
4.60%, 08/18/18a | CZK | 38,470 | 1,777,459 | |||||||||
4.70%, 09/12/22a | CZK | 22,760 | 1,215,434 | |||||||||
5.00%, 04/11/19a | CZK | 33,270 | 1,594,671 | |||||||||
5.70%, 05/25/24a | CZK | 37,010 | 2,200,397 | |||||||||
6.95%, 01/26/16a | CZK | 37,290 | 1,546,003 | |||||||||
|
| |||||||||||
| 18,805,048 | ||||||||||||
HUNGARY — 3.01% |
| |||||||||||
Hungary Government Bond |
| |||||||||||
3.50%, 06/24/20 | HUF | 642,690 | 2,387,143 | |||||||||
4.00%, 04/25/18 | HUF | 284,340 | 1,064,661 | |||||||||
5.50%, 02/12/16 | HUF | 140,490 | 505,918 | |||||||||
5.50%, 12/20/18 | HUF | 211,430 | 829,517 | |||||||||
5.50%, 06/24/25 | HUF | 299,780 | 1,246,233 | |||||||||
6.00%, 11/24/23 | HUF | 441,220 | 1,856,798 | |||||||||
6.50%, 06/24/19 | HUF | 701,550 | 2,854,761 | |||||||||
6.75%, 11/24/17 | HUF | 142,700 | 564,149 | |||||||||
7.00%, 06/24/22 | HUF | 615,300 | 2,683,041 | |||||||||
7.50%, 11/12/20 | HUF | 396,400 | 1,729,378 | |||||||||
|
| |||||||||||
| 15,721,599 | ||||||||||||
INDONESIA — 4.36% |
| |||||||||||
Indonesia Treasury Bond |
| |||||||||||
5.63%, 05/15/23 | IDR | 28,130,000 | 1,681,388 | |||||||||
6.63%, 05/15/33 | IDR | 22,700,000 | 1,281,482 | |||||||||
7.00%, 05/15/22 | IDR | 26,240,000 | 1,738,099 | |||||||||
SCHEDULESOF INVESTMENTS | 29 |
Table of Contents
Schedule of Investments (Continued)
iSHARES® EMERGING MARKETS LOCAL CURRENCY BOND ETF
October 31, 2015
| Security | (000s) | Value | ||||||||||
7.88%, 04/15/19 | IDR | 50,358,000 | $ | 3,576,696 | ||||||||
8.25%, 06/15/32 | IDR | 41,286,000 | 2,757,166 | |||||||||
8.38%, 03/15/24 | IDR | 13,138,000 | 934,974 | |||||||||
8.38%, 09/15/26 | IDR | 6,000,000 | 423,890 | |||||||||
8.38%, 03/15/34 | IDR | 12,674,000 | 863,073 | |||||||||
9.50%, 07/15/31 | IDR | 74,295,000 | 5,563,644 | |||||||||
10.00%, 07/15/17 | IDR | 4,736,000 | 353,860 | |||||||||
10.00%, 09/15/24 | IDR | 5,860,000 | 451,949 | |||||||||
10.00%, 02/15/28 | IDR | 9,815,000 | 758,267 | |||||||||
10.50%, 07/15/38 | IDR | 4,860,000 | 396,182 | |||||||||
11.00%, 11/15/20 | IDR | 15,732,000 | 1,251,698 | |||||||||
11.00%, 09/15/25 | IDR | 8,485,000 | 695,662 | |||||||||
|
| |||||||||||
| 22,728,030 | ||||||||||||
ISRAEL — 4.28% |
| |||||||||||
Israel Government Bond – Fixed | ||||||||||||
2.25%, 05/31/19 | ILS | 4,169 | 1,144,423 | |||||||||
4.00%, 01/31/18 | ILS | 11,175 | 3,135,118 | |||||||||
4.25%, 03/31/23 | ILS | 14,051 | 4,333,390 | |||||||||
5.00%, 01/31/20 | ILS | 6,909 | 2,107,869 | |||||||||
5.50%, 02/28/17 | ILS | 8,658 | 2,401,316 | |||||||||
5.50%, 01/31/22 | ILS | 3,150 | 1,026,807 | |||||||||
5.50%, 01/31/42 | ILS | 5,202 | 1,919,141 | |||||||||
6.00%, 02/28/19 | ILS | 12,185 | 3,732,454 | |||||||||
6.25%, 10/30/26 | ILS | 3,650 | 1,332,317 | |||||||||
Israel Government Bond – Shahar | ||||||||||||
6.50%, 01/31/16 | ILS | 4,545 | 1,195,933 | |||||||||
|
| |||||||||||
| 22,328,768 | ||||||||||||
MALAYSIA — 4.09% |
| |||||||||||
Malaysia Government Bond |
| |||||||||||
3.26%, 03/01/18 | MYR | 10,000 | 2,319,088 | |||||||||
3.49%, 03/31/20 | MYR | 6,899 | 1,585,999 | |||||||||
3.50%, 05/31/27 | MYR | 3,546 | 752,419 | |||||||||
3.73%, 06/15/28 | MYR | 1,800 | 392,799 | |||||||||
4.01%, 09/15/17 | MYR | 14,314 | 3,400,708 | |||||||||
4.05%, 09/30/21 | MYR | 3,374 | 784,753 | |||||||||
4.13%, 04/15/32 | MYR | 6,504 | 1,444,975 | |||||||||
4.39%, 04/15/26 | MYR | 10,565 | 2,484,865 | |||||||||
4.50%, 04/15/30 | MYR | 3,300 | 777,359 | |||||||||
4.94%, 09/30/43 | MYR | 1,975 | 474,230 | |||||||||
5.73%, 07/30/19 | MYR | 21,250 | 5,294,544 | |||||||||
| Security | (000s) | Value | ||||||||||
Malaysia Government Investment Issue | ||||||||||||
4.17%, 04/30/21 | MYR | 7,098 | $ | 1,641,396 | ||||||||
|
| |||||||||||
| 21,353,135 | ||||||||||||
MEXICO — 9.44% |
| |||||||||||
Mexican Bonos |
| |||||||||||
5.00%, 06/15/17 | MXN | 23,466 | 1,443,496 | |||||||||
6.25%, 06/16/16 | MXN | 25,955 | 1,597,147 | |||||||||
6.50%, 06/10/21 | MXN | 61,634 | 3,928,068 | |||||||||
7.25%, 12/15/16 | MXN | 57,670 | 3,629,211 | |||||||||
7.50%, 06/03/27 | MXN | 91,260 | 6,083,459 | |||||||||
7.75%, 12/14/17 | MXN | 48,350 | 3,145,998 | |||||||||
7.75%, 05/29/31 | MXN | 31,508 | 2,143,209 | |||||||||
7.75%, 11/13/42 | MXN | 45,649 | 3,099,053 | |||||||||
8.00%, 12/17/15 | MXN | 27,900 | 1,696,558 | |||||||||
8.00%, 06/11/20 | MXN | 10,320 | 697,113 | |||||||||
8.00%, 12/07/23 | MXN | 56,846 | 3,914,578 | |||||||||
8.50%, 12/13/18 | MXN | 104,493 | 7,010,777 | |||||||||
8.50%, 11/18/38 | MXN | 27,030 | 1,973,923 | |||||||||
10.00%, 12/05/24 | MXN | 76,499 | 5,924,235 | |||||||||
10.00%, 11/20/36 | MXN | 35,226 | 2,936,560 | |||||||||
|
| |||||||||||
| 49,223,385 | ||||||||||||
NIGERIA — 1.32% |
| |||||||||||
Nigeria Government Bond |
| |||||||||||
10.00%, 07/23/30 | NGN | 253,200 | 885,723 | |||||||||
13.05%, 08/16/16 | NGN | 288,600 | 1,474,825 | |||||||||
14.20%, 03/14/24 | NGN | 322,620 | 1,681,579 | |||||||||
15.10%, 04/27/17 | NGN | 220,926 | 1,148,638 | |||||||||
16.39%, 01/27/22 | NGN | 294,287 | 1,675,388 | |||||||||
|
| |||||||||||
| 6,866,153 | ||||||||||||
PERU — 1.05% |
| |||||||||||
Peru Government Bond |
| |||||||||||
5.70%, 08/12/24 | PEN | 1,895 | 534,010 | |||||||||
6.85%, 02/12/42 | PEN | 2,410 | 666,806 | |||||||||
6.90%, 08/12/37 | PEN | 781 | 222,792 | |||||||||
6.95%, 08/12/31 | PEN | 3,112 | 912,280 | |||||||||
8.20%, 08/12/26 | PEN | 9,570 | 3,140,376 | |||||||||
|
| |||||||||||
| 5,476,264 | ||||||||||||
PHILIPPINES — 4.46% |
| |||||||||||
Philippine Government Bond |
| |||||||||||
2.88%, 05/22/17 | PHP | 63,740 | 1,364,352 | |||||||||
3.88%, 11/22/19 | PHP | 83,220 | 1,803,787 | |||||||||
| 30 | 2015 iSHARES ANNUAL REPORTTO SHAREHOLDERS |
Table of Contents
Schedule of Investments (Continued)
iSHARES® EMERGING MARKETS LOCAL CURRENCY BOND ETF
October 31, 2015
| Security | (000s) | Value | ||||||||||
4.00%, 12/06/22 | PHP | 44,000 | $ | 950,877 | ||||||||
4.13%, 08/20/24 | PHP | 50,000 | 1,095,387 | |||||||||
4.63%, 09/09/40 | PHP | 53,500 | 1,133,601 | |||||||||
5.00%, 08/18/18 | PHP | 116,380 | 2,603,114 | |||||||||
6.38%, 01/19/22 | PHP | 67,798 | 1,682,859 | |||||||||
7.00%, 01/27/16 | PHP | 53,896 | 1,163,876 | |||||||||
7.00%, 03/31/17 | PHP | 23,140 | 522,953 | |||||||||
8.00%, 07/19/31 | PHP | 43,300 | 1,330,731 | |||||||||
8.13%, 12/16/35 | PHP | 130,715 | 4,003,578 | |||||||||
8.50%, 11/29/32 | PHP | 45,430 | 1,445,871 | |||||||||
Philippine Government International Bond | ||||||||||||
4.95%, 01/15/21 | PHP | 126,000 | 2,798,804 | |||||||||
6.25%, 01/14/36 | PHP | 57,000 | 1,352,563 | |||||||||
|
| |||||||||||
| 23,252,353 | ||||||||||||
POLAND — 4.48% |
| |||||||||||
Poland Government Bond |
| |||||||||||
0.00%, 01/25/16 | PLN | 11,621 | 3,006,259 | |||||||||
1.50%, 04/25/20 | PLN | 6,690 | 1,697,704 | |||||||||
3.25%, 07/25/19 | PLN | 7,334 | 1,996,495 | |||||||||
3.25%, 07/25/25 | PLN | 12,397 | 3,379,982 | |||||||||
3.75%, 04/25/18 | PLN | 3,778 | 1,028,808 | |||||||||
4.00%, 10/25/23 | PLN | 7,500 | 2,148,475 | |||||||||
4.75%, 10/25/16 | PLN | 10,657 | 2,851,273 | |||||||||
4.75%, 04/25/17 | PLN | 4,682 | 1,271,468 | |||||||||
5.00%, 04/25/16 | PLN | 5,774 | 1,523,186 | |||||||||
5.25%, 10/25/20 | PLN | 6,644 | 1,980,100 | |||||||||
5.50%, 10/25/19 | PLN | 3,477 | 1,025,549 | |||||||||
5.75%, 09/23/22 | PLN | 4,686 | 1,471,434 | |||||||||
|
| |||||||||||
| 23,380,733 | ||||||||||||
ROMANIA — 2.03% |
| |||||||||||
Romania Government Bond |
| |||||||||||
4.75%, 06/24/19 | RON | 4,700 | 1,279,469 | |||||||||
5.60%, 11/28/18 | RON | 3,680 | 1,020,110 | |||||||||
5.75%, 01/27/16 | RON | 4,040 | 1,017,377 | |||||||||
5.85%, 04/26/23 | RON | 12,170 | 3,567,229 | |||||||||
5.90%, 07/26/17 | RON | 4,960 | 1,330,577 | |||||||||
6.75%, 06/11/17 | RON | 3,180 | 859,199 | |||||||||
Romanian Government International Bond | ||||||||||||
4.75%, 08/29/16 | RON | 5,820 | 1,491,867 | |||||||||
|
| |||||||||||
| 10,565,828 | ||||||||||||
| Security | (000s) | Value | ||||||||||
RUSSIA — 3.41% |
| |||||||||||
Russian Federal Bond – OFZ |
| |||||||||||
6.00%, 05/11/16 | RUB | 34,778 | $ | 533,927 | ||||||||
6.20%, 01/31/18 | RUB | 76,303 | 1,105,358 | |||||||||
6.70%, 05/15/19 | RUB | 43,201 | 611,829 | |||||||||
6.80%, 12/11/19 | RUB | 167,888 | 2,360,547 | |||||||||
7.00%, 01/25/23 | RUB | 127,000 | 1,699,082 | |||||||||
7.05%, 01/19/28 | RUB | 60,500 | 762,650 | |||||||||
7.40%, 04/19/17 | RUB | 99,240 | 1,499,203 | |||||||||
7.40%, 06/14/17 | RUB | 102,560 | 1,542,257 | |||||||||
7.50%, 03/15/18 | RUB | 65,773 | 976,933 | |||||||||
7.50%, 02/27/19 | RUB | 84,000 | 1,226,110 | |||||||||
7.60%, 04/14/21 | RUB | 165,048 | 2,343,727 | |||||||||
8.15%, 02/03/27 | RUB | 208,849 | 2,905,065 | |||||||||
Russian Foreign Bond – Eurobond | ||||||||||||
7.85%, 03/10/18a | RUB | 15,000 | 224,176 | |||||||||
|
| |||||||||||
| 17,790,864 | ||||||||||||
SOUTH AFRICA — 4.27% |
| |||||||||||
South Africa Government Bond |
| |||||||||||
6.25%, 03/31/36 | ZAR | 56,809 | 3,080,815 | |||||||||
6.50%, 02/28/41 | ZAR | 49,808 | 2,707,117 | |||||||||
6.75%, 03/31/21 | ZAR | 39,820 | 2,744,382 | |||||||||
7.25%, 01/15/20 | ZAR | 16,428 | 1,171,062 | |||||||||
8.00%, 01/31/30 | ZAR | 25,760 | 1,753,075 | |||||||||
8.25%, 09/15/17 | ZAR | 37,474 | 2,771,455 | |||||||||
8.50%, 01/31/37 | ZAR | 14,680 | 1,009,412 | |||||||||
8.75%, 02/28/48 | ZAR | 41,066 | 2,866,097 | |||||||||
10.50%, 12/21/26 | ZAR | 47,274 | 3,952,497 | |||||||||
13.50%, 09/15/16 | ZAR | 2,667 | 203,877 | |||||||||
|
| |||||||||||
| 22,259,789 | ||||||||||||
SOUTH KOREA — 20.33% |
| |||||||||||
Korea Monetary Stabilization Bond | ||||||||||||
1.71%, 04/02/17 | KRW | 5,490,800 | 4,821,722 | |||||||||
2.90%, 12/02/15 | KRW | 9,439,100 | 8,289,816 | |||||||||
Korea Treasury Bond |
| |||||||||||
2.75%, 09/10/17 | KRW | 2,883,710 | 2,580,681 | |||||||||
2.75%, 12/10/44 | KRW | 1,053,000 | 1,016,895 | |||||||||
3.00%, 12/10/42 | KRW | 5,425,970 | 5,463,903 | |||||||||
3.13%, 03/10/19 | KRW | 7,496,670 | 6,878,616 | |||||||||
3.50%, 03/10/17 | KRW | 7,412,000 | 6,664,526 | |||||||||
SCHEDULESOF INVESTMENTS | 31 |
Table of Contents
Schedule of Investments (Continued)
iSHARES® EMERGING MARKETS LOCAL CURRENCY BOND ETF
October 31, 2015
| Security | (000s) | Value | ||||||||||
3.50%, 03/10/24 | KRW | 7,562,430 | $ | 7,364,821 | ||||||||
3.75%, 06/10/22 | KRW | 3,000,000 | 2,926,345 | |||||||||
3.75%, 12/10/33 | KRW | 3,981,410 | 4,285,486 | |||||||||
4.00%, 03/10/16 | KRW | 7,809,600 | 6,910,987 | |||||||||
4.00%, 12/10/31 | KRW | 4,070,800 | 4,432,121 | |||||||||
4.25%, 06/10/21 | KRW | 4,656,000 | 4,599,395 | |||||||||
4.75%, 12/10/30 | KRW | 3,921,000 | 4,561,092 | |||||||||
5.00%, 09/10/16 | KRW | 5,514,000 | 4,977,908 | |||||||||
5.00%, 06/10/20 | KRW | 7,228,000 | 7,234,594 | |||||||||
5.25%, 03/10/27 | KRW | 5,000,000 | 5,749,792 | |||||||||
5.50%, 09/10/17 | KRW | 4,274,600 | 4,012,286 | |||||||||
5.50%, 12/10/29 | KRW | 5,713,290 | 7,023,631 | |||||||||
5.75%, 09/10/18 | KRW | 6,400,000 | 6,247,080 | |||||||||
|
| |||||||||||
| 106,041,697 | ||||||||||||
THAILAND — 4.40% |
| |||||||||||
Thailand Government Bond |
| |||||||||||
3.58%, 12/17/27 | THB | 144,572 | 4,370,592 | |||||||||
3.65%, 12/17/21 | THB | 30,650 | 919,642 | |||||||||
3.78%, 06/25/32 | THB | 61,242 | 1,846,756 | |||||||||
3.80%, 06/14/41 | THB | 30,000 | 869,673 | |||||||||
3.85%, 12/12/25 | THB | 84,479 | 2,625,090 | |||||||||
3.88%, 06/13/19 | THB | 37,770 | 1,134,167 | |||||||||
4.13%, 11/18/16 | THB | 26,230 | 757,331 | |||||||||
4.26%, 12/12/37a | THB | 67,970 | 2,096,861 | |||||||||
4.85%, 06/17/61 | THB | 14,000 | 473,081 | |||||||||
4.88%, 06/22/29 | THB | 49,500 | 1,708,114 | |||||||||
5.13%, 03/13/18 | THB | 38,187 | 1,160,292 | |||||||||
5.67%, 03/13/28 | THB | 99,420 | 3,593,292 | |||||||||
6.15%, 07/07/26 | THB | 37,899 | 1,401,712 | |||||||||
|
| |||||||||||
| 22,956,603 | ||||||||||||
TURKEY — 4.43% |
| |||||||||||
Turkey Government Bond |
| |||||||||||
6.30%, 02/14/18 | TRY | 10,426 | 3,321,237 | |||||||||
8.00%, 03/12/25 | TRY | 2,500 | 777,064 | |||||||||
8.50%, 07/10/19 | TRY | 11,478 | 3,784,476 | |||||||||
8.50%, 09/14/22 | TRY | 9,500 | 3,050,728 | |||||||||
8.80%, 09/27/23 | TRY | 6,874 | 2,245,217 | |||||||||
9.00%, 01/27/16 | TRY | 14,588 | 4,994,554 | |||||||||
9.00%, 07/24/24 | TRY | 4,123 | 1,355,169 | |||||||||
10.50%, 01/15/20 | TRY | 10,095 | 3,564,247 | |||||||||
|
| |||||||||||
| 23,092,692 | ||||||||||||
|
| |||||||||||
TOTAL FOREIGN GOVERNMENT OBLIGATIONS |
| |||||||||||
(Cost: $581,146,058) |
| 493,061,872 | ||||||||||
| Security | (000s) | Value | ||||||||
SHORT-TERM INVESTMENTS — 0.05% |
| |||||||||
MONEY MARKET FUNDS — 0.05% |
| |||||||||
BlackRock Cash Funds: Treasury, SL Agency Shares | ||||||||||
0.02%b,c | 244 | $ | 244,291 | |||||||
|
| |||||||||
| 244,291 | ||||||||||
|
| |||||||||
TOTAL SHORT-TERM INVESTMENTS |
| |||||||||
(Cost: $244,291) | 244,291 | |||||||||
|
| |||||||||
TOTAL INVESTMENTS |
| |||||||||
(Cost: $581,390,349) | 493,306,163 | |||||||||
Other Assets, Less Liabilities — 5.43% |
| 27,225,969 | ||||||||
|
| |||||||||
NET ASSETS — 100.00% | $ | 520,532,132 | ||||||||
|
| |||||||||
BRL | — Brazilian Real | |
CLP | — Chilean Peso | |
COP | — Colombian Peso | |
CZK | — Czech Koruna | |
HUF | — Hungarian Forint | |
IDR | — Indonesian Rupiah | |
ILS | — Israeli Shekel | |
KRW | — South Korean Won | |
MXN | — Mexican Peso | |
MYR | — Malaysian Ringgit | |
NGN | — Nigerian Naira | |
PEN | — Peru Nuevo Sol | |
PHP | — Philippine Peso | |
PLN | — Polish Zloty | |
RON | — Romanian Leu | |
RUB | — New Russian Ruble | |
THB | — Thai Baht | |
TRY | — Turkish Lira | |
ZAR | — South African Rand |
| a | This security may be resold to qualified foreign investors and foreign institutional buyers under Regulation S of the Securities Act of 1933. |
| b | Affiliated issuer. See Note 2. |
| c | The rate quoted is the annualized seven-day yield of the fund at period end. |
See notes to financial statements.
| 32 | 2015 iSHARES ANNUAL REPORTTO SHAREHOLDERS |
Table of Contents
Schedule of Investments
iSHARES® GLOBAL HIGH YIELD CORPORATE BOND ETF
October 31, 2015
| Security | Principal | Value | ||||||||||
CORPORATE BONDS & NOTES — 96.92% |
| |||||||||||
AUSTRALIA — 0.43% |
| |||||||||||
FMG Resources August 2006 Pty Ltd. |
| |||||||||||
6.88%, 04/01/22 (Call 04/01/17)a,b | USD | 125 | $ | 89,376 | ||||||||
8.25%, 11/01/19 (Call 11/30/15)a,b | USD | 125 | 105,625 | |||||||||
9.75%, 03/01/22 (Call 03/01/18)a,b | USD | 225 | 224,156 | |||||||||
Origin Energy Finance Ltd. |
| |||||||||||
4.00%, 09/16/74 (Call 09/16/19)c,d | EUR | 100 | 96,933 | |||||||||
|
| |||||||||||
| 516,090 | ||||||||||||
AUSTRIA — 0.17% |
| |||||||||||
Raiffeisen Bank International AG |
| |||||||||||
4.50%, 02/21/25 (Call 02/21/20)c,d | EUR | 100 | 91,962 | |||||||||
6.63%, 05/18/21 | EUR | 100 | 114,884 | |||||||||
|
| |||||||||||
| 206,846 | ||||||||||||
BELGIUM — 0.20% |
| |||||||||||
Barry Callebaut Services NV |
| |||||||||||
5.63%, 06/15/21c | EUR | 100 | 129,796 | |||||||||
Telenet Finance VI Luxembourg SCA |
| |||||||||||
4.88%, 07/15/27 (Call 07/15/21)c | EUR | 100 | 107,427 | |||||||||
|
| |||||||||||
| 237,223 | ||||||||||||
CANADA — 2.59% |
| |||||||||||
1011778 BC ULC/New Red Finance Inc. |
| |||||||||||
4.63%, 01/15/22 (Call 10/01/17)a | USD | 100 | 101,500 | |||||||||
6.00%, 04/01/22 (Call 10/01/17)a,b | USD | 325 | 338,812 | |||||||||
Air Canada |
| |||||||||||
6.75%, 10/01/19 (Call 10/01/16)a | USD | 50 | 52,750 | |||||||||
7.63%, 10/01/19 (Call 10/01/16)a | CAD | 25 | 20,398 | |||||||||
7.75%, 04/15/21a | USD | 25 | 26,094 | |||||||||
Armtec Holdings Ltd. |
| |||||||||||
8.88%, 09/22/17 (Call 11/30/15)e | CAD | 6 | 46 | |||||||||
Athabasca Oil Corp. |
| |||||||||||
7.50%, 11/19/17 (Call 11/30/15)c | CAD | 50 | 29,809 | |||||||||
Baytex Energy Corp. |
| |||||||||||
6.63%, 07/19/22 (Call 07/19/17) | CAD | 50 | 34,012 | |||||||||
| Security | Principal | Value | ||||||||||
Bombardier Inc. |
| |||||||||||
4.75%, 04/15/19a | USD | 100 | $ | 86,500 | ||||||||
5.50%, 09/15/18a,b | USD | 150 | 140,625 | |||||||||
5.75%, 03/15/22a | USD | 50 | 38,650 | |||||||||
6.00%, 10/15/22 (Call 04/15/17)a,b | USD | 100 | 77,000 | |||||||||
6.13%, 05/15/21c | EUR | 100 | 97,762 | |||||||||
6.13%, 01/15/23a | USD | 150 | 116,250 | |||||||||
7.50%, 03/15/25 (Call 03/15/20)a,b | USD | 150 | 117,000 | |||||||||
7.75%, 03/15/20a | USD | 100 | 87,250 | |||||||||
Brookfield Residential Properties Inc. |
| |||||||||||
6.50%, 12/15/20 (Call 12/15/15)a,b | USD | 50 | 49,875 | |||||||||
Brookfield Residential Properties Inc./Brookfield Residential U.S. Corp. | ||||||||||||
6.13%, 07/01/22 (Call 07/01/17)a | USD | 25 | 24,438 | |||||||||
Canadian Energy Services & Technology Corp. | ||||||||||||
7.38%, 04/17/20 (Call 04/17/17) | CAD | 25 | 18,630 | |||||||||
Cascades Inc. |
| |||||||||||
5.50%, 07/15/21 (Call 07/15/17)a | CAD | 25 | 18,630 | |||||||||
Centric Health Corp. |
| |||||||||||
8.63%, 04/18/18 (Call 04/18/16) | CAD | 19 | 11,327 | |||||||||
CHC Helicopter SA |
| |||||||||||
9.25%, 10/15/20 (Call 11/30/15)b | USD | 90 | 51,300 | |||||||||
Corus Entertainment Inc. |
| |||||||||||
4.25%, 02/11/20c | CAD | 50 | 35,828 | |||||||||
Cott Beverages Inc. |
| |||||||||||
5.38%, 07/01/22 (Call 07/01/17) | USD | 50 | 49,750 | |||||||||
6.75%, 01/01/20 (Call 01/01/17) | USD | 100 | 105,750 | |||||||||
Gateway Casinos & Entertainment Ltd. |
| |||||||||||
8.50%, 11/26/20 (Call 11/26/16)a | CAD | 25 | 18,487 | |||||||||
Gibson Energy Inc. |
| |||||||||||
5.38%, 07/15/22 (Call 07/15/17)a | CAD | 50 | 35,636 | |||||||||
Great Canadian Gaming Corp. |
| |||||||||||
6.63%, 07/25/22 (Call 07/25/17)a | CAD | 50 | 38,885 | |||||||||
Jupiter Resources Inc. |
| |||||||||||
8.50%, 10/01/22 (Call 10/01/17)a | USD | 75 | 39,563 | |||||||||
Lundin Mining Corp. |
| |||||||||||
7.50%, 11/01/20 (Call 11/01/17)a,b | USD | 50 | 50,500 | |||||||||
7.88%, 11/01/22 (Call 11/01/18)a | USD | 50 | 50,000 | |||||||||
SCHEDULESOF INVESTMENTS | 33 |
Table of Contents
Schedule of Investments (Continued)
iSHARES® GLOBAL HIGH YIELD CORPORATE BOND ETF
October 31, 2015
| Security | Principal | Value | ||||||||||
Mattamy Group Corp. |
| |||||||||||
6.88%, 11/15/20 (Call 11/30/15)a | CAD | 50 | $ | 37,929 | ||||||||
MEG Energy Corp. |
| |||||||||||
6.38%, 01/30/23 (Call 07/30/17)a | USD | 75 | 63,188 | |||||||||
6.50%, 03/15/21 (Call 11/30/15)a | USD | 75 | 65,812 | |||||||||
7.00%, 03/31/24 (Call 09/30/18)a | USD | 125 | 107,812 | |||||||||
Newalta Corp. Series 2 |
| |||||||||||
7.75%, 11/14/19 (Call 11/30/15) | CAD | 22 | 16,731 | |||||||||
NOVA Chemicals Corp. |
| |||||||||||
5.00%, 05/01/25 (Call 01/31/25)a,b | USD | 50 | 50,000 | |||||||||
5.25%, 08/01/23 (Call 08/01/18)a | USD | 50 | 51,000 | |||||||||
NRL Energy Investments Ltd. |
| |||||||||||
8.25%, 04/13/18 (Call 11/30/15) | CAD | 25 | 9,554 | |||||||||
Paramount Resources Ltd. |
| |||||||||||
7.63%, 12/04/19 (Call 12/04/15) | CAD | 50 | 36,210 | |||||||||
Parkland Fuel Corp. |
| |||||||||||
6.00%, 11/21/22 (Call 11/21/17) | CAD | 50 | 38,121 | |||||||||
Postmedia Network Inc. |
| |||||||||||
8.25%, 08/16/17 (Call 11/30/15)a | CAD | 21 | 16,137 | |||||||||
Precision Drilling Corp. |
| |||||||||||
5.25%, 11/15/24 (Call 05/15/19) | USD | 25 | 20,625 | |||||||||
6.63%, 11/15/20 (Call 11/30/15) | USD | 100 | 89,250 | |||||||||
Quebecor Media Inc. |
| |||||||||||
5.75%, 01/15/23 | USD | 50 | 51,250 | |||||||||
6.63%, 01/15/23a | CAD | 50 | 39,076 | |||||||||
7.38%, 01/15/21 (Call 01/15/16) | CAD | 50 | 39,840 | |||||||||
Russel Metals Inc. |
| |||||||||||
6.00%, 04/19/22 (Call 04/19/17)a | CAD | 25 | 18,726 | |||||||||
Seven Generations Energy Ltd. |
| |||||||||||
6.75%, 05/01/23 (Call 05/01/18)a | USD | 50 | 45,625 | |||||||||
Superior Plus LP |
| |||||||||||
6.50%, 12/09/21 (Call 12/09/17) | CAD | 25 | 18,917 | |||||||||
Tervita Corp. |
| |||||||||||
8.00%, 11/15/18 (Call 11/30/15)a | USD | 50 | 36,750 | |||||||||
9.00%, 11/15/18 (Call 11/30/15)a | CAD | 25 | 13,137 | |||||||||
Trilogy Energy Corp. |
| |||||||||||
7.25%, 12/13/19 (Call 12/13/15) | CAD | 25 | 16,767 | |||||||||
Videotron Ltd. |
| |||||||||||
5.00%, 07/15/22 | USD | 75 | 77,812 | |||||||||
5.38%, 06/15/24 (Call 03/15/24)a | USD | 50 | 51,500 | |||||||||
5.63%, 06/15/25 (Call 03/15/25) | CAD | 25 | 19,180 | |||||||||
5.75%, 01/15/26 (Call 09/15/20)c | CAD | 25 | 18,998 | |||||||||
| Security | Principal | Value | ||||||||||
5.75%, 01/15/26 | CAD | 50 | $ | 38,216 | ||||||||
Yellow Pages Digital & Media Solutions Ltd. | ||||||||||||
9.25%, 11/30/18 (Call 11/30/15)a | CAD | 42 | 33,760 | |||||||||
|
| |||||||||||
| 3,084,980 | ||||||||||||
DENMARK — 0.09% |
| |||||||||||
TDC A/S | ||||||||||||
3.50%, 02/26/49 (Call 02/26/21)c,d | EUR | 100 | 103,285 | |||||||||
|
| |||||||||||
| 103,285 | ||||||||||||
FINLAND — 0.28% |
| |||||||||||
Nokia OYJ |
| |||||||||||
5.38%, 05/15/19 | USD | 75 | 79,875 | |||||||||
6.75%, 02/04/19c | EUR | 100 | 127,681 | |||||||||
Stora Enso OYJ |
| |||||||||||
5.00%, 03/19/18c | EUR | 100 | 119,892 | |||||||||
|
| |||||||||||
| 327,448 | ||||||||||||
FRANCE — 3.70% |
| |||||||||||
Alcatel-Lucent USA Inc. | ||||||||||||
6.75%, 11/15/20 (Call 11/15/16)a | USD | 200 | 212,000 | |||||||||
Areva SA |
| |||||||||||
3.25%, 09/04/20c | EUR | 100 | 108,909 | |||||||||
3.50%, 03/22/21 | EUR | 100 | 109,201 | |||||||||
4.38%, 11/06/19 | EUR | 100 | 114,691 | |||||||||
4.63%, 10/05/17 | EUR | 100 | 115,177 | |||||||||
4.88%, 09/23/24 | EUR | 100 | 111,749 | |||||||||
CMA CGM SA |
| |||||||||||
8.75%, 12/15/18 (Call 12/15/15)c | EUR | 100 | 114,110 | |||||||||
Credit Agricole SA |
| |||||||||||
6.64%, 05/29/49 (Call 05/31/17)a,b,d | USD | 100 | 102,500 | |||||||||
8.38%, 10/29/49 (Call 10/13/19)a,d | USD | 100 | 113,000 | |||||||||
Ephios Bondco PLC |
| |||||||||||
6.25%, 07/01/22 (Call 07/01/18)c | EUR | 150 | 172,325 | |||||||||
Faurecia |
| |||||||||||
3.13%, 06/15/22 (Call 06/15/18)c | EUR | 100 | 106,046 | |||||||||
9.38%, 12/15/16c | EUR | 100 | 119,855 | |||||||||
Groupama SA |
| |||||||||||
7.88%, 10/27/39 (Call 10/27/19)d | EUR | 100 | 119,026 | |||||||||
Holdikks SAS |
| |||||||||||
6.75%, 07/15/21 (Call 07/15/17)c | EUR | 100 | 108,676 | |||||||||
| 34 | 2015 iSHARES ANNUAL REPORTTO SHAREHOLDERS |
Table of Contents
Schedule of Investments (Continued)
iSHARES® GLOBAL HIGH YIELD CORPORATE BOND ETF
October 31, 2015
| Security | Principal | Value | ||||||||||
Holding Medi-Partenaires SAS |
| |||||||||||
7.00%, 05/15/20 (Call 05/15/16)c | EUR | 100 | $ | 117,921 | ||||||||
HomeVi SAS |
| |||||||||||
6.88%, 08/15/21 (Call 08/15/17)c | EUR | 100 | 115,436 | |||||||||
Horizon Holdings III SASU |
| |||||||||||
5.13%, 08/01/22 (Call 08/01/18)c | EUR | 100 | 114,331 | |||||||||
Loxam SAS |
| |||||||||||
4.88%, 07/23/21 (Call 07/23/17)c | EUR | 100 | 114,608 | |||||||||
Nexans SA |
| |||||||||||
5.75%, 05/02/17 | EUR | 50 | 57,442 | |||||||||
Novalis SAS |
| |||||||||||
3.00%, 04/30/22 (Call 04/30/18)c | EUR | 100 | 106,599 | |||||||||
Numericable-SFR SAS |
| |||||||||||
4.88%, 05/15/19 (Call 05/15/16)a | USD | 200 | 201,000 | |||||||||
5.38%, 05/15/22 (Call 05/15/17)c | EUR | 100 | 114,055 | |||||||||
5.63%, 05/15/24 (Call 05/15/19)c | EUR | 200 | 226,730 | |||||||||
6.00%, 05/15/22 (Call 05/15/17)a | USD | 400 | 400,000 | |||||||||
6.25%, 05/15/24 (Call 05/15/19)a | USD | 200 | 200,000 | |||||||||
Peugeot SA |
| |||||||||||
6.50%, 01/18/19c | EUR | 100 | 125,776 | |||||||||
7.38%, 03/06/18c | EUR | 100 | 124,388 | |||||||||
Rexel SA |
| |||||||||||
5.13%, 06/15/20 (Call 06/15/16)c | EUR | 100 | 115,712 | |||||||||
SGD Group SAS |
| |||||||||||
5.63%, 05/15/19 (Call 11/30/15)c | EUR | 100 | 112,674 | |||||||||
Societe Generale SA |
| |||||||||||
5.92%, 12/31/49 (Call 04/05/17)a,d | USD | 100 | 101,625 | |||||||||
SPCM SA |
| |||||||||||
2.88%, 06/15/23 (Call 06/15/18)c | EUR | 100 | 105,494 | |||||||||
THOM Europe SAS |
| |||||||||||
7.38%, 07/15/19 (Call 07/15/16)c | EUR | 100 | 117,921 | |||||||||
Vallourec SA |
| |||||||||||
3.25%, 08/02/19 | EUR | 100 | 97,134 | |||||||||
|
| |||||||||||
| 4,396,111 | ||||||||||||
GERMANY — 4.45% |
| |||||||||||
Bayerische Landbank |
| |||||||||||
5.75%, 10/23/17c | EUR | 100 | 119,376 | |||||||||
Bilfinger SE |
| |||||||||||
2.38%, 12/07/19c | EUR | 100 | 113,001 | |||||||||
Commerzbank AG |
| |||||||||||
7.75%, 03/16/21 | EUR | 200 | 267,991 | |||||||||
8.13%, 09/19/23a | USD | 200 | 233,500 | |||||||||
| Security | Principal | Value | ||||||||||
Deutsche Lufthansa AG |
| |||||||||||
5.13%, 08/12/75 (Call 02/12/21)c,d | EUR | 100 | $ | 112,564 | ||||||||
Douglas GmbH |
| |||||||||||
6.25%, 07/15/22 (Call 07/15/18)c | EUR | 100 | 116,198 | |||||||||
FMC Finance VIII SA |
| |||||||||||
5.25%, 07/31/19c | EUR | 100 | 125,323 | |||||||||
Fresenius Finance BV |
| |||||||||||
3.00%, 02/01/21c | EUR | 100 | 117,314 | |||||||||
4.00%, 02/01/24c | EUR | 100 | 123,168 | |||||||||
Fresenius Medical Care U.S. Finance II Inc. | ||||||||||||
4.13%, 10/15/20 (Call 07/17/20)a | USD | 50 | 51,250 | |||||||||
4.75%, 10/15/24 (Call 07/17/24)a | USD | 100 | 101,000 | |||||||||
5.63%, 07/31/19a | USD | 100 | 109,000 | |||||||||
Fresenius Medical Care U.S. Finance Inc. | ||||||||||||
5.75%, 02/15/21a,b | USD | 75 | 81,937 | |||||||||
Hapag-Lloyd AG | ||||||||||||
7.75%, 10/01/18 (Call 11/30/15)c | EUR | 100 | 113,503 | |||||||||
HeidelbergCement Finance Luxembourg SA | ||||||||||||
3.25%, 10/21/21c | EUR | 150 | 174,894 | |||||||||
7.50%, 04/03/20c | EUR | 100 | 136,148 | |||||||||
8.50%, 10/31/19c | EUR | 100 | 138,411 | |||||||||
9.50%, 12/15/18c | EUR | 50 | 68,522 | |||||||||
Hornbach Baumarkt AG |
| |||||||||||
3.88%, 02/15/20c | EUR | 50 | 59,364 | |||||||||
Norddeutsche Landesbank Girozentrale | ||||||||||||
6.00%, 06/29/20 | EUR | 50 | 63,241 | |||||||||
Phoenix PIB Dutch Finance BV |
| |||||||||||
3.63%, 07/30/21c | EUR | 100 | 115,298 | |||||||||
Rapid Holding GmbH |
| |||||||||||
6.63%, 11/15/20 (Call 05/15/17)c | EUR | 100 | 110,465 | |||||||||
Schaeffler Finance BV |
| |||||||||||
3.25%, 05/15/19 (Call 05/15/16)c | EUR | 100 | 112,398 | |||||||||
3.25%, 05/15/25 (Call 05/15/20)c | EUR | 100 | 109,913 | |||||||||
3.50%, 05/15/22 (Call 05/15/17)c | EUR | 100 | 112,674 | |||||||||
4.75%, 05/15/21 (Call 05/15/16)a | USD | 200 | 202,000 | |||||||||
Techem GmbH |
| |||||||||||
6.13%, 10/01/19 (Call 11/30/15)c | EUR | 100 | 115,850 | |||||||||
ThyssenKrupp AG |
| |||||||||||
1.75%, 11/25/20 (Call 08/25/20)c | EUR | 75 | 80,985 | |||||||||
SCHEDULESOF INVESTMENTS | 35 |
Table of Contents
Schedule of Investments (Continued)
iSHARES® GLOBAL HIGH YIELD CORPORATE BOND ETF
October 31, 2015
| Security | Principal | Value | ||||||||||
2.50%, 02/25/25c | EUR | 100 | $ | 104,693 | ||||||||
3.13%, 10/25/19 (Call 07/25/19)c | EUR | 100 | 114,884 | |||||||||
4.00%, 08/27/18 | EUR | 175 | 205,227 | |||||||||
4.38%, 02/28/17 | EUR | 100 | 114,895 | |||||||||
Trionista TopCo GmbH |
| |||||||||||
6.88%, 04/30/21 (Call 04/30/16)c | EUR | 100 | 117,507 | |||||||||
TUI AG |
| |||||||||||
4.50%, 10/01/19 (Call 10/01/16)c | EUR | 100 | 115,657 | |||||||||
Unitymedia GmbH |
| |||||||||||
3.75%, 01/15/27 (Call 01/15/21)c | EUR | 100 | 98,181 | |||||||||
6.13%, 01/15/25 (Call 01/15/20)a | USD | 200 | 204,750 | |||||||||
Unitymedia Hessen GmbH & Co. KG/Unitymedia NRW GmbH | ||||||||||||
4.00%, 01/15/25 (Call 01/15/20)c | EUR | 100 | 110,465 | |||||||||
5.50%, 09/15/22 (Call 09/15/17)c | EUR | 180 | 212,756 | |||||||||
ZF North America Capital Inc. |
| |||||||||||
2.75%, 04/27/23c | EUR | 200 | 212,645 | |||||||||
4.50%, 04/29/22a | USD | 150 | 150,375 | |||||||||
4.75%, 04/29/25a | USD | 150 | 147,375 | |||||||||
|
| |||||||||||
| 5,294,698 | ||||||||||||
GREECE — 0.34% |
| |||||||||||
Intralot Finance Luxembourg SA |
| |||||||||||
9.75%, 08/15/18 (Call 08/15/16)c | EUR | 100 | 116,563 | |||||||||
NBG Finance PLC |
| |||||||||||
4.38%, 04/30/19c | EUR | 100 | 87,267 | |||||||||
OTE PLC |
| |||||||||||
3.50%, 07/09/20c | EUR | 100 | 105,770 | |||||||||
PPC Finance PLC |
| |||||||||||
5.50%, 05/01/19 (Call 05/01/16)c | EUR | 100 | 95,000 | |||||||||
|
| |||||||||||
| 404,600 | ||||||||||||
INDIA — 0.09% |
| |||||||||||
Samvardhana Motherson Automotive Systems Group BV | ||||||||||||
4.13%, 07/15/21 (Call 07/15/17)c | EUR | 100 | 106,599 | |||||||||
|
| |||||||||||
| 106,599 | ||||||||||||
IRELAND — 0.56% |
| |||||||||||
Allied Irish Banks PLC |
| |||||||||||
2.75%, 04/16/19c | EUR | 100 | 115,659 | |||||||||
Ardagh Packaging Finance PLC/Ardagh Holdings USA Inc. | ||||||||||||
4.25%, 01/15/22 (Call 06/30/17)c | EUR | 100 | 111,570 | |||||||||
6.25%, 01/31/19 (Call 01/31/16)a | USD | 200 | 201,750 | |||||||||
| Security | Principal | Value | ||||||||||
Bank of Ireland |
| |||||||||||
4.25%, 06/11/24 (Call 06/11/19)c,d | EUR | 100 | $ | 113,917 | ||||||||
Smurfit Kappa Acquisitions |
| |||||||||||
4.13%, 01/30/20c | EUR | 100 | 121,246 | |||||||||
|
| |||||||||||
| 664,142 | ||||||||||||
ITALY — 5.67% |
| |||||||||||
Astaldi SpA |
| |||||||||||
7.13%, 12/01/20 (Call 12/01/16)c | EUR | 100 | 114,884 | |||||||||
Autostrada Brescia Verona Vicenza Padova SpA | ||||||||||||
2.38%, 03/20/20c | EUR | 100 | 111,349 | |||||||||
Banca Monte dei Paschi di Siena SpA | ||||||||||||
3.63%, 04/01/19c | EUR | 100 | 111,677 | |||||||||
5.00%, 04/21/20c | EUR | 100 | 112,674 | |||||||||
Banca Popolare di Milano Scarl |
| |||||||||||
7.13%, 03/01/21c | EUR | 100 | 123,674 | |||||||||
Banca Popolare di Vicenza |
| |||||||||||
2.75%, 03/20/20c | EUR | 100 | 102,000 | |||||||||
3.50%, 01/20/17c | EUR | 100 | 109,238 | |||||||||
Banco Popolare SC |
| |||||||||||
2.38%, 01/22/18c | EUR | 100 | 111,918 | |||||||||
2.63%, 09/21/18c | EUR | 100 | 112,225 | |||||||||
2.75%, 07/27/20c | EUR | 100 | 111,552 | |||||||||
3.50%, 03/14/19c | EUR | 100 | 114,420 | |||||||||
6.00%, 11/05/20c | EUR | 100 | 119,688 | |||||||||
Buzzi Unicem SpA |
| |||||||||||
5.13%, 12/09/16c | EUR | 50 | 57,546 | |||||||||
Enel SpA |
| |||||||||||
5.00%, 01/15/75 (Call 01/15/20)c,d | EUR | 100 | 116,264 | |||||||||
6.50%, 01/10/74 (Call 01/10/19)c,d | EUR | 100 | 119,578 | |||||||||
8.75%, 09/24/73 (Call 09/24/23)a,d | USD | 200 | 230,760 | |||||||||
Fiat Finance North America Inc. |
| |||||||||||
5.63%, 06/12/17 | EUR | 100 | 116,802 | |||||||||
Finmeccanica SpA |
| |||||||||||
4.50%, 01/19/21 | EUR | 100 | 121,981 | |||||||||
Iccrea Banca SpA |
| |||||||||||
1.88%, 11/25/19c | EUR | 100 | 111,462 | |||||||||
| 36 | 2015 iSHARES ANNUAL REPORTTO SHAREHOLDERS |
Table of Contents
Schedule of Investments (Continued)
iSHARES® GLOBAL HIGH YIELD CORPORATE BOND ETF
October 31, 2015
| Security | Principal | Value | ||||||||||
Intesa Sanpaolo SpA |
| |||||||||||
2.86%, 04/23/25c | EUR | 100 | $ | 107,469 | ||||||||
3.93%, 09/15/26c | EUR | 100 | 114,473 | |||||||||
5.00%, 09/23/19c | EUR | 200 | 242,764 | |||||||||
5.15%, 07/16/20 | EUR | 100 | 123,478 | |||||||||
6.63%, 05/08/18c | EUR | 100 | 121,224 | |||||||||
6.63%, 09/13/23c | EUR | 150 | 201,992 | |||||||||
Italcementi Finance SA |
| |||||||||||
6.63%, 03/19/20c,f | EUR | 100 | 130,404 | |||||||||
Mediobanca SpA |
| |||||||||||
5.75%, 04/18/23 | EUR | 100 | 127,196 | |||||||||
Salini Costruttori SpA |
| |||||||||||
6.13%, 08/01/18 | EUR | 100 | 120,472 | |||||||||
TeamSystem Holding SpA |
| |||||||||||
7.38%, 05/15/20 (Call 05/15/16)c | EUR | 100 | 114,884 | |||||||||
Telecom Italia SpA |
| |||||||||||
3.25%, 01/16/23c | EUR | 100 | 114,574 | |||||||||
4.00%, 01/21/20c | EUR | 100 | 120,787 | |||||||||
4.50%, 01/25/21c | EUR | 200 | 246,471 | |||||||||
4.75%, 05/25/18c | EUR | 100 | 120,634 | |||||||||
5.30%, 05/30/24a | USD | 200 | 202,000 | |||||||||
5.38%, 01/29/19c | EUR | 100 | 124,395 | |||||||||
6.13%, 12/14/18 | EUR | 100 | 126,217 | |||||||||
6.38%, 06/24/19 | GBP | 50 | 84,081 | |||||||||
UniCredit SpA |
| |||||||||||
5.75%, 10/28/25 (Call 10/28/20)c,d | EUR | 200 | 241,366 | |||||||||
6.70%, 06/05/18c | EUR | 100 | 123,224 | |||||||||
6.95%, 10/31/22c | EUR | 200 | 262,268 | |||||||||
Unipol Gruppo Finanziario SpA |
| |||||||||||
3.00%, 03/18/25c | EUR | 115 | 119,110 | |||||||||
Veneto Banca SCPA |
| |||||||||||
4.00%, 01/20/17c | EUR | 100 | 111,337 | |||||||||
Wind Acquisition Finance SA |
| |||||||||||
4.00%, 07/15/20 (Call 07/15/16)c | EUR | 250 | 280,995 | |||||||||
4.75%, 07/15/20 (Call 07/15/16)a | USD | 400 | 407,000 | |||||||||
7.00%, 04/23/21 (Call 04/23/17)c | EUR | 200 | 227,558 | |||||||||
7.38%, 04/23/21 (Call 04/23/17)a | USD | 200 | 201,500 | |||||||||
|
| |||||||||||
| 6,747,565 | ||||||||||||
JAPAN — 0.54% |
| |||||||||||
SoftBank Group Corp. |
| |||||||||||
4.00%, 07/30/22 (Call 04/30/22)c | EUR | 100 | 112,536 | |||||||||
4.50%, 04/15/20a,b | USD | 200 | 198,800 | |||||||||
| Security | Principal | Value | ||||||||||
4.63%, 04/15/20c | EUR | 100 | $ | 116,817 | ||||||||
4.75%, 07/30/25 (Call 04/30/25)c | EUR | 100 | 109,775 | |||||||||
5.25%, 07/30/27 (Call 04/30/27)c | EUR | 100 | 109,360 | |||||||||
|
| |||||||||||
| 647,288 | ||||||||||||
LUXEMBOURG — 3.94% |
| |||||||||||
Altice Financing SA |
| |||||||||||
5.25%, 02/15/23 (Call 02/15/18)c | EUR | 100 | 110,732 | |||||||||
6.50%, 01/15/22 (Call 12/15/16)a | USD | 200 | 202,000 | |||||||||
6.63%, 02/15/23 (Call 02/15/18)a | USD | 200 | 200,000 | |||||||||
Altice Luxembourg SA |
| |||||||||||
6.25%, 02/15/25 (Call 02/15/20)c | EUR | 100 | 97,900 | |||||||||
7.25%, 05/15/22 (Call 05/15/17)c | EUR | 200 | 214,302 | |||||||||
7.63%, 02/15/25 (Call 02/15/20)a | USD | 200 | 183,500 | |||||||||
7.75%, 05/15/22 (Call 05/15/17)a | USD | 200 | 192,000 | |||||||||
ArcelorMittal |
| |||||||||||
2.88%, 07/06/20c | EUR | 100 | 98,980 | |||||||||
3.00%, 03/25/19c | EUR | 100 | 103,681 | |||||||||
3.00%, 04/09/21c | EUR | 100 | 97,535 | |||||||||
3.13%, 01/14/22c | EUR | 100 | 95,552 | |||||||||
5.13%, 06/01/20b | USD | 50 | 47,750 | |||||||||
5.25%, 02/25/17 | USD | 100 | 100,750 | |||||||||
5.88%, 11/17/17c | EUR | 100 | 114,833 | |||||||||
6.00%, 08/05/20 | USD | 75 | 71,437 | |||||||||
6.13%, 06/01/18b | USD | 200 | 201,500 | |||||||||
6.13%, 06/01/25b | USD | 50 | 43,172 | |||||||||
6.25%, 03/01/21b | USD | 225 | 212,625 | |||||||||
7.00%, 02/25/22 | USD | 100 | 94,750 | |||||||||
10.60%, 06/01/19 | USD | 200 | 220,500 | |||||||||
Garfunkelux Holdco 3 SA |
| |||||||||||
8.50%, 11/01/22 (Call 11/01/18)c | GBP | 100 | 155,272 | |||||||||
INEOS Group Holdings SA |
| |||||||||||
6.13%, 08/15/18 (Call 11/30/15)a,b | USD | 200 | 202,000 | |||||||||
6.50%, 08/15/18 (Call 11/30/15)c | EUR | 100 | 112,398 | |||||||||
Intelsat Jackson Holdings SA |
| |||||||||||
5.50%, 08/01/23 (Call 08/01/18)b | USD | 245 | 203,044 | |||||||||
6.63%, 12/15/22 (Call 12/15/17)b | USD | 100 | 79,000 | |||||||||
7.25%, 04/01/19 (Call 11/30/15) | USD | 200 | 188,100 | |||||||||
7.25%, 10/15/20 (Call 11/30/15) | USD | 200 | 182,500 | |||||||||
7.50%, 04/01/21 (Call 04/01/16) | USD | 100 | 90,500 | |||||||||
Intelsat Luxembourg SA |
| |||||||||||
6.75%, 06/01/18 (Call 06/01/16) | USD | 50 | 44,375 | |||||||||
7.75%, 06/01/21 (Call 06/01/17) | USD | 200 | 120,500 | |||||||||
SCHEDULESOF INVESTMENTS | 37 |
Table of Contents
Schedule of Investments (Continued)
iSHARES® GLOBAL HIGH YIELD CORPORATE BOND ETF
October 31, 2015
| Security | Principal | Value | ||||||||||
8.13%, 06/01/23 (Call 06/01/18) | USD | 150 | $ | 88,875 | ||||||||
Matterhorn Telecom SA |
| |||||||||||
3.88%, 05/01/22 (Call 05/01/18)c | EUR | 100 | 101,352 | |||||||||
Millicom International Cellular SA |
| |||||||||||
6.63%, 10/15/21 (Call 10/15/17)a | USD | 200 | 180,000 | |||||||||
SIG Combibloc Holdings SCA |
| |||||||||||
7.75%, 02/15/23 (Call 02/15/18)c | EUR | 100 | 116,264 | |||||||||
Telenet Finance V Luxembourg SCA |
| |||||||||||
6.25%, 08/15/22 (Call 08/15/17)c | EUR | 100 | 119,302 | |||||||||
|
| |||||||||||
| 4,686,981 | ||||||||||||
NETHERLANDS — 2.58% |
| |||||||||||
AerCap Ireland Capital Ltd./AerCap Global Aviation Trust | ||||||||||||
2.75%, 05/15/17 | USD | 150 | 149,437 | |||||||||
3.75%, 05/15/19 | USD | 150 | 151,500 | |||||||||
4.25%, 07/01/20 | USD | 150 | 153,000 | |||||||||
4.50%, 05/15/21 | USD | 150 | 154,125 | |||||||||
4.63%, 10/30/20 | USD | 150 | 155,250 | |||||||||
5.00%, 10/01/21 | USD | 150 | 156,750 | |||||||||
LGE HoldCo VI BV |
| |||||||||||
7.13%, 05/15/24 (Call 05/15/19)c | EUR | 100 | 119,855 | |||||||||
Neptune Finco Corp. |
| |||||||||||
6.63%, 10/15/25 (Call 10/15/20)a | USD | 200 | 210,500 | |||||||||
10.13%, 01/15/23 (Call 01/15/19)a | USD | 200 | 211,500 | |||||||||
10.88%, 10/15/25 (Call 10/15/20)a | USD | 200 | 213,250 | |||||||||
NXP BV/NXP Funding LLC |
| |||||||||||
3.75%, 06/01/18a | USD | 200 | 203,000 | |||||||||
4.63%, 06/15/22a | USD | 200 | 204,000 | |||||||||
OI European Group BV |
| |||||||||||
6.75%, 09/15/20c | EUR | 100 | 128,692 | |||||||||
Sensata Technologies BV |
| |||||||||||
4.88%, 10/15/23a | USD | 25 | 24,500 | |||||||||
5.00%, 10/01/25a,b | USD | 100 | 97,750 | |||||||||
5.63%, 11/01/24a,b | USD | 50 | 50,875 | |||||||||
UPC Holding BV |
| |||||||||||
6.38%, 09/15/22 (Call 09/15/17)c | EUR | 100 | 118,474 | |||||||||
| Security | Principal | Value | ||||||||||
6.75%, 03/15/23 (Call 03/15/18)c | EUR | 100 | $ | 120,407 | ||||||||
UPCB Finance IV Ltd. |
| |||||||||||
5.38%, 01/15/25 (Call 01/15/20)a | USD | 200 | 199,500 | |||||||||
UPCB Finance V Ltd. |
| |||||||||||
7.25%, 11/15/21 (Call 11/15/16)a | USD | 135 | 144,112 | |||||||||
Ziggo Secured Finance BV |
| |||||||||||
3.75%, 01/15/25 (Call 01/15/20)c | EUR | 100 | 102,456 | |||||||||
|
| |||||||||||
| 3,068,933 | ||||||||||||
NEW ZEALAND — 0.85% |
| |||||||||||
Beverage Packaging Holdings Luxembourg II SA/Beverage Packaging Holdings II Issuer Inc. | ||||||||||||
5.63%, 12/15/16 (Call 12/15/15)a | USD | 25 | 24,969 | |||||||||
6.00%, 06/15/17 (Call 06/15/16)a | USD | 50 | 50,250 | |||||||||
Reynolds Group Issuer Inc./Reynolds Group Issuer LLC | ||||||||||||
5.75%, 10/15/20 (Call 11/30/15) | USD | 350 | 363,618 | |||||||||
6.88%, 02/15/21 (Call 02/15/16)b | USD | 100 | 104,250 | |||||||||
7.13%, 04/15/19 (Call 11/30/15) | USD | 100 | 101,625 | |||||||||
7.88%, 08/15/19 (Call 11/30/15) | USD | 100 | 103,750 | |||||||||
8.25%, 02/15/21 (Call 02/15/16) | USD | 100 | 104,000 | |||||||||
9.88%, 08/15/19 (Call 11/30/15)b | USD | 150 | 157,875 | |||||||||
|
| |||||||||||
| 1,010,337 | ||||||||||||
NORWAY — 0.10% |
| |||||||||||
Lock AS |
| |||||||||||
7.00%, 08/15/21 (Call 08/15/17)c | EUR | 100 | 115,712 | |||||||||
|
| |||||||||||
| 115,712 | ||||||||||||
PORTUGAL — 0.36% |
| |||||||||||
EDP – Energias de Portugal SA |
| |||||||||||
5.38%, 09/16/75 (Call 03/16/21)c,d | EUR | 100 | 110,056 | |||||||||
Novo Banco SA |
| |||||||||||
2.63%, 05/08/17c | EUR | 100 | 102,456 | |||||||||
4.00%, 01/21/19c | EUR | 100 | 101,484 | |||||||||
5.88%, 11/09/15c | EUR | 100 | 110,127 | |||||||||
|
| |||||||||||
| 424,123 | ||||||||||||
SINGAPORE — 0.17% |
| |||||||||||
Puma International Financing SA |
| |||||||||||
6.75%, 02/01/21 (Call 02/01/17)a | USD | 200 | 201,560 | |||||||||
|
| |||||||||||
| 201,560 | ||||||||||||
| 38 | 2015 iSHARES ANNUAL REPORTTO SHAREHOLDERS |
Table of Contents
Schedule of Investments (Continued)
iSHARES® GLOBAL HIGH YIELD CORPORATE BOND ETF
October 31, 2015
| Security | Principal | Value | ||||||||||
SOUTH KOREA — 0.03% |
| |||||||||||
Harvest Operations Corp. |
| |||||||||||
6.88%, 10/01/17 | USD | 40 | $ | 33,200 | ||||||||
|
| |||||||||||
| 33,200 | ||||||||||||
SPAIN — 1.54% | ||||||||||||
Abengoa Finance SAU |
| |||||||||||
8.88%, 11/01/17a | USD | 150 | 79,500 | |||||||||
8.88%, 02/05/18c | EUR | 100 | 55,238 | |||||||||
Abengoa Greenfield SA |
| |||||||||||
5.50%, 10/01/19c | EUR | 100 | 43,092 | |||||||||
Banco de Sabadell SA |
| |||||||||||
6.25%, 04/26/20 | EUR | 50 | 61,308 | |||||||||
Bankia SA |
| |||||||||||
3.50%, 01/17/19c | EUR | 100 | 116,684 | |||||||||
4.00%, 05/22/24 (Call 05/22/19)c,d | EUR | 100 | 110,465 | |||||||||
4.38%, 02/14/17 | EUR | 100 | 115,271 | |||||||||
Bankinter SA |
| |||||||||||
6.38%, 09/11/19c | EUR | 50 | 62,693 | |||||||||
BBVA International Preferred SAU |
| |||||||||||
5.92%, 04/29/49 (Call 04/18/17)d | USD | 50 | 50,625 | |||||||||
BPE Financiaciones SA |
| |||||||||||
2.00%, 02/03/20c | EUR | 100 | 110,093 | |||||||||
CaixaBank SA |
| |||||||||||
5.00%, 11/14/23 (Call 11/14/18)c,d | EUR | 100 | 116,353 | |||||||||
Campofrio Food Group SA |
| |||||||||||
3.38%, 03/15/22 (Call 03/15/18)c | EUR | 100 | 111,128 | |||||||||
Cellnex Telecom SAU |
| |||||||||||
3.13%, 07/27/22c | EUR | 100 | 108,250 | |||||||||
Cirsa Funding Luxembourg SA |
| |||||||||||
5.88%, 05/15/23 (Call 05/15/18)c | EUR | 100 | 104,389 | |||||||||
Gestamp Funding Luxembourg SA |
| |||||||||||
5.88%, 05/31/20 (Call 05/31/16)c | EUR | 100 | 114,884 | |||||||||
Grupo Antolin Dutch BV |
| |||||||||||
5.13%, 06/30/22 (Call 06/30/18)c | EUR | 100 | 112,951 | |||||||||
Grupo Isolux Corsan Finance BV |
| |||||||||||
6.63%, 04/15/21 (Call 04/15/17)c | EUR | 100 | 49,157 | |||||||||
Ibercaja Banco SA |
| |||||||||||
5.00%, 07/28/25 (Call 07/28/20c,d | EUR | 100 | 106,875 | |||||||||
Obrascon Huarte Lain SA |
| |||||||||||
7.63%, 03/15/20 (Call 03/15/16)c | EUR | 100 | 114,193 | |||||||||
Repsol International Finance BV |
| |||||||||||
4.50%, 03/25/75 (Call 03/25/25)c,d | EUR | 100 | 94,724 | |||||||||
|
| |||||||||||
| 1,837,873 | ||||||||||||
| Security | Principal | Value | ||||||||||
SWEDEN — 0.19% |
| |||||||||||
Verisure Holding AB |
| |||||||||||
8.75%, 09/01/18 (Call 11/02/15)c | EUR | 100 | $ | 115,104 | ||||||||
Volvo Treasury AB |
| |||||||||||
4.20%, 06/10/75 (Call 06/10/20)c,d | EUR | 100 | 109,913 | |||||||||
|
| |||||||||||
| 225,017 | ||||||||||||
SWITZERLAND — 0.19% |
| |||||||||||
Dufry Finance SCA |
| |||||||||||
4.50%, 07/15/22 (Call 07/15/17)c | EUR | 100 | 116,541 | |||||||||
Selecta Group BV |
| |||||||||||
6.50%, 06/15/20 (Call 12/15/16)c | EUR | 100 | 107,703 | |||||||||
|
| |||||||||||
| 224,244 | ||||||||||||
UNITED KINGDOM — 7.38% |
| |||||||||||
AA Bond Co. Ltd. |
| |||||||||||
5.50%, 07/31/43 (Call 07/31/18)c | GBP | 100 | 146,777 | |||||||||
Algeco Scotsman Global Finance PLC |
| |||||||||||
8.50%, 10/15/18 (Call 11/30/15)a | USD | 200 | 174,500 | |||||||||
Arqiva Broadcast Finance PLC |
| |||||||||||
9.50%, 03/31/20 (Call 03/31/16)c | GBP | 100 | 168,339 | |||||||||
Ashtead Capital Inc. |
| |||||||||||
6.50%, 07/15/22 (Call 07/15/17)a | USD | 200 | 214,000 | |||||||||
Boparan Finance PLC |
| |||||||||||
4.38%, 07/15/21 (Call 07/15/17)c | EUR | 100 | 99,695 | |||||||||
5.50%, 07/15/21 (Call 07/15/17)c | GBP | 100 | 139,768 | |||||||||
Brakes Capital |
| |||||||||||
7.13%, 12/15/18 (Call 12/15/15)c | GBP | 100 | 160,231 | |||||||||
Case New Holland Industrial Inc. |
| |||||||||||
7.88%, 12/01/17 | USD | 100 | 108,125 | |||||||||
CNH Industrial Finance Europe SA | ||||||||||||
2.75%, 03/18/19c | EUR | 100 | 108,808 | |||||||||
2.88%, 09/27/21c | EUR | 100 | 106,599 | |||||||||
6.25%, 03/09/18c | EUR | 100 | 118,606 | |||||||||
Co-Operative Bank PLC/United Kingdom | ||||||||||||
5.13%, 09/20/17 | GBP | 50 | 75,367 | |||||||||
EC Finance PLC |
| |||||||||||
5.13%, 07/15/21 (Call 01/15/17)c | EUR | 100 | 114,884 | |||||||||
Eco-Bat Finance PLC |
| |||||||||||
7.75%, 02/15/17 (Call 11/30/15)c | EUR | 100 | 107,979 | |||||||||
Fiat Chrysler Automobile NV |
| |||||||||||
4.50%, 04/15/20 | USD | 200 | 202,760 | |||||||||
5.25%, 04/15/23b | USD | 200 | 199,500 | |||||||||
SCHEDULESOF INVESTMENTS | 39 |
Table of Contents
Schedule of Investments (Continued)
iSHARES® GLOBAL HIGH YIELD CORPORATE BOND ETF
October 31, 2015
| Security | Principal | Value | ||||||||||
Fiat Chrysler Finance Europe |
| |||||||||||
4.75%, 03/22/21c | EUR | 100 | $ | 117,629 | ||||||||
4.75%, 07/15/22c | EUR | 100 | 116,900 | |||||||||
6.63%, 03/15/18c | EUR | 250 | 301,881 | |||||||||
6.75%, 10/14/19c | EUR | 200 | 251,681 | |||||||||
7.38%, 07/09/18 | EUR | 100 | 123,721 | |||||||||
Gala Group Finance PLC |
| |||||||||||
8.88%, 09/01/18 (Call 11/30/15)c | GBP | 90 | 145,946 | |||||||||
Ineos Finance PLC |
| |||||||||||
4.00%, 05/01/23 (Call 05/01/18)c | EUR | 100 | 105,770 | |||||||||
Inmarsat Finance PLC |
| |||||||||||
4.88%, 05/15/22 (Call 05/15/17)a,b | USD | 100 | 99,250 | |||||||||
International Personal Finance PLC |
| |||||||||||
5.75%, 04/07/21c | EUR | 100 | 103,135 | |||||||||
Interoute Finco PLC |
| |||||||||||
7.38%, 10/15/20 (Call 10/15/17)c | EUR | 100 | 116,541 | |||||||||
Iron Mountain Europe PLC |
| |||||||||||
6.13%, 09/15/22 (Call 09/15/17)c | GBP | 100 | 154,672 | |||||||||
Jaguar Land Rover Automotive PLC |
| |||||||||||
3.50%, 03/15/20 (Call 12/15/19)a | USD | 200 | 197,000 | |||||||||
3.88%, 03/01/23c | GBP | 100 | 145,560 | |||||||||
Moy Park Bondco PLC |
| |||||||||||
6.25%, 05/29/21 (Call 05/29/17)c | GBP | 100 | 157,529 | |||||||||
New Look Secured Issuer PLC |
| |||||||||||
6.50%, 07/01/22 (Call 06/24/18)c | GBP | 100 | 154,054 | |||||||||
Odeon & UCI Finco PLC |
| |||||||||||
9.00%, 08/01/18 (Call 11/09/15)c | GBP | 100 | 160,811 | |||||||||
Pizzaexpress Financing 2 PLC |
| |||||||||||
6.63%, 08/01/21 (Call 08/01/17)c | GBP | 100 | 160,811 | |||||||||
Rexam PLC |
| |||||||||||
6.75%, 06/29/67 (Call 06/29/17)c,d | EUR | 50 | 55,371 | |||||||||
Royal Bank of Scotland Group PLC |
| |||||||||||
3.63%, 03/25/24 (Call 03/25/19)c,d | EUR | 100 | 113,679 | |||||||||
5.13%, 05/28/24 | USD | 200 | 204,615 | |||||||||
6.00%, 12/19/23 | USD | 250 | 270,593 | |||||||||
6.10%, 06/10/23 | USD | 75 | 81,362 | |||||||||
6.13%, 12/15/22 | USD | 225 | 246,237 | |||||||||
Royal Bank of Scotland PLC (The) |
| |||||||||||
4.35%, 01/23/17 | EUR | 100 | 114,394 | |||||||||
4.63%, 09/22/21 (Call 09/22/16)d | EUR | 100 | 112,232 | |||||||||
| Security | Principal | Value | ||||||||||
6.93%, 04/09/18 | EUR | 100 | $ | 123,922 | ||||||||
Sable International Finance Ltd. |
| |||||||||||
6.88%, 08/01/22 (Call 08/01/18)a | USD | 200 | 202,500 | |||||||||
Silk Bidco AS |
| |||||||||||
7.50%, 02/01/22 (Call 02/01/18)c | EUR | 100 | 116,541 | |||||||||
Tesco Corporate Treasury Services PLC |
| |||||||||||
1.38%, 07/01/19c | EUR | 100 | 108,035 | |||||||||
2.13%, 11/12/20 (Call 08/12/20)c | EUR | 100 | 108,631 | |||||||||
2.50%, 07/01/24c | EUR | 100 | 100,578 | |||||||||
Tesco PLC |
| |||||||||||
3.38%, 11/02/18c | EUR | 100 | 115,343 | |||||||||
6.13%, 02/24/22 | GBP | 100 | 162,931 | |||||||||
Thomas Cook Finance PLC | ||||||||||||
6.75%, 06/15/21 (Call 01/15/18)c | EUR | 100 | 117,645 | |||||||||
7.75%, 06/15/20 (Call 06/15/16)c | EUR | 100 | 117,093 | |||||||||
Travis Perkins PLC |
| |||||||||||
4.38%, 09/15/21c | GBP | 100 | 155,487 | |||||||||
Tullow Oil PLC |
| |||||||||||
6.00%, 11/01/20 (Call 11/01/16)a | USD | 200 | 152,000 | |||||||||
Virgin Media Finance PLC |
| |||||||||||
4.50%, 01/15/25 (Call 01/15/20)c | EUR | 100 | 106,323 | |||||||||
Virgin Media Secured Finance PLC |
| |||||||||||
5.13%, 01/15/25 (Call 01/15/20)c | GBP | 100 | 148,648 | |||||||||
5.25%, 01/15/26 (Call 01/15/20)a | USD | 200 | 200,500 | |||||||||
5.38%, 04/15/21 (Call 04/15/17)a | USD | 270 | 282,150 | |||||||||
5.50%, 01/15/25 (Call 01/15/19)c | GBP | 90 | 138,648 | |||||||||
6.25%, 03/28/29 (Call 01/15/21)c | GBP | 100 | 156,756 | |||||||||
Viridian Group FundCo II Ltd. |
| |||||||||||
7.50%, 03/01/20 (Call 09/01/17)c | EUR | 100 | 109,360 | |||||||||
|
| |||||||||||
| 8,780,403 | ||||||||||||
UNITED STATES —��60.48% |
| |||||||||||
Activision Blizzard Inc. |
| |||||||||||
5.63%, 09/15/21 (Call 09/15/16)a | USD | 125 | 132,187 | |||||||||
6.13%, 09/15/23 (Call 09/15/18)a | USD | 200 | 217,000 | |||||||||
ADT Corp. (The) |
| |||||||||||
2.25%, 07/15/17 | USD | 50 | 49,688 | |||||||||
3.50%, 07/15/22b | USD | 75 | 69,938 | |||||||||
4.13%, 04/15/19b | USD | 25 | 25,563 | |||||||||
4.13%, 06/15/23b | USD | 100 | 96,375 | |||||||||
6.25%, 10/15/21b | USD | 125 | 135,000 | |||||||||
Advanced Micro Devices Inc. |
| |||||||||||
6.75%, 03/01/19 | USD | 75 | 58,500 | |||||||||
7.00%, 07/01/24 (Call 07/01/19) | USD | 50 | 35,000 | |||||||||
| 40 | 2015 iSHARES ANNUAL REPORTTO SHAREHOLDERS |
Table of Contents
Schedule of Investments (Continued)
iSHARES® GLOBAL HIGH YIELD CORPORATE BOND ETF
October 31, 2015
| Security | Principal | Value | ||||||||||
7.50%, 08/15/22 | USD | 50 | $ | 36,500 | ||||||||
7.75%, 08/01/20 (Call 11/30/15)b | USD | 50 | 37,000 | |||||||||
AECOM Co. |
| |||||||||||
5.75%, 10/15/22 | USD | 25 | 25,000 | |||||||||
5.88%, 10/15/24 | USD | 100 | 105,061 | |||||||||
AES Corp./VA |
| |||||||||||
4.88%, 05/15/23 (Call 05/15/18)b | USD | 100 | 92,750 | |||||||||
5.50%, 03/15/24 (Call 03/15/19) | USD | 50 | 47,375 | |||||||||
5.50%, 04/15/25 (Call 04/15/20) | USD | 100 | 93,000 | |||||||||
7.38%, 07/01/21 (Call 06/01/21)b | USD | 100 | 106,500 | |||||||||
Affinion Group Inc. |
| |||||||||||
7.88%, 12/15/18 (Call 11/30/15)b | USD | 50 | 38,250 | |||||||||
Aircastle Ltd. |
| |||||||||||
4.63%, 12/15/18 | USD | 50 | 51,750 | |||||||||
5.13%, 03/15/21 | USD | 25 | 26,250 | |||||||||
5.50%, 02/15/22b | USD | 50 | 52,875 | |||||||||
6.25%, 12/01/19b | USD | 50 | 54,625 | |||||||||
6.75%, 04/15/17 | USD | 50 | 52,750 | |||||||||
AK Steel Corp. |
| |||||||||||
7.63%, 05/15/20 (Call 11/30/15)b | USD | 40 | 20,000 | |||||||||
7.63%, 10/01/21 (Call 10/01/17) | USD | 75 | 36,188 | |||||||||
Albertson’s Holdings LLC/Safeway Inc. | ||||||||||||
7.75%, 10/15/22 (Call 10/15/17)a | USD | 50 | 54,000 | |||||||||
Alcoa Inc. |
| |||||||||||
5.13%, 10/01/24 (Call 07/01/24) | USD | 100 | 99,125 | |||||||||
5.40%, 04/15/21 (Call 01/15/21)b | USD | 150 | 155,250 | |||||||||
5.72%, 02/23/19 | USD | 100 | 106,375 | |||||||||
5.87%, 02/23/22 | USD | 100 | 104,000 | |||||||||
6.15%, 08/15/20b | USD | 100 | 105,750 | |||||||||
6.75%, 07/15/18b | USD | 150 | 165,582 | |||||||||
Alere Inc. |
| |||||||||||
6.38%, 07/01/23 (Call 07/01/18)a,b | USD | 50 | 52,000 | |||||||||
7.25%, 07/01/18 (Call 12/15/15) | USD | 50 | 52,125 | |||||||||
Aleris International Inc. |
| |||||||||||
7.63%, 02/15/18 (Call 11/30/15) | USD | 26 | 24,375 | |||||||||
7.88%, 11/01/20 (Call 11/30/15) | USD | 42 | 39,480 | |||||||||
Allegheny Technologies Inc. |
| |||||||||||
5.95%, 01/15/21 (Call 10/15/20) | USD | 50 | 42,750 | |||||||||
7.38%, 08/15/23 (Call 05/15/23) | USD | 75 | 63,750 | |||||||||
Ally Financial Inc. |
| |||||||||||
2.75%, 01/30/17 | USD | 100 | 100,500 | |||||||||
3.25%, 02/13/18 | USD | 100 | 100,500 | |||||||||
| Security | Principal | Value | ||||||||||
3.50%, 01/27/19 | USD | 50 | $ | 50,375 | ||||||||
3.60%, 05/21/18 | USD | 100 | 101,500 | |||||||||
3.75%, 11/18/19 | USD | 100 | 101,300 | |||||||||
4.13%, 03/30/20b | USD | 50 | 51,563 | |||||||||
4.13%, 02/13/22 | USD | 50 | 51,000 | |||||||||
4.63%, 05/19/22 | USD | 25 | 26,000 | |||||||||
4.63%, 03/30/25b | USD | 100 | 101,000 | |||||||||
4.75%, 09/10/18 | USD | 100 | 104,375 | |||||||||
5.13%, 09/30/24 | USD | 75 | 78,937 | |||||||||
5.50%, 02/15/17 | USD | 200 | 207,000 | |||||||||
6.25%, 12/01/17 | USD | 100 | 106,750 | |||||||||
7.50%, 09/15/20 | USD | 25 | 29,188 | |||||||||
8.00%, 03/15/20 | USD | 100 | 118,000 | |||||||||
Altice U.S. Finance I Corp. |
| |||||||||||
5.38%, 07/15/23 (Call 07/15/18)a | USD | 200 | 201,500 | |||||||||
AMC Networks Inc. |
| |||||||||||
4.75%, 12/15/22 (Call 12/15/17) | USD | 50 | 50,250 | |||||||||
7.75%, 07/15/21 (Call 07/15/16) | USD | 100 | 107,000 | |||||||||
American Airlines Group Inc. |
| |||||||||||
5.50%, 10/01/19a | USD | 100 | 101,750 | |||||||||
American Axle & Manufacturing Inc. |
| |||||||||||
6.25%, 03/15/21 (Call 03/15/16) | USD | 25 | 26,063 | |||||||||
6.63%, 10/15/22 (Call 10/15/17) | USD | 50 | 52,875 | |||||||||
American Energy-Permian Basin LLC/AEPB Finance Corp. | ||||||||||||
7.13%, 11/01/20 (Call 01/31/17)a,b | USD | 100 | 54,500 | |||||||||
7.38%, 11/01/21 (Call 07/31/17)a | USD | 50 | 27,250 | |||||||||
AmeriGas Finance LLC/AmeriGas Finance Corp. | ||||||||||||
6.75%, 05/20/20 (Call 05/20/16) | USD | 50 | 52,000 | |||||||||
7.00%, 05/20/22 (Call 05/20/17) | USD | 100 | 105,385 | |||||||||
Amsurg Corp. |
| |||||||||||
5.63%, 07/15/22 (Call 07/15/17) | USD | 175 | 171,937 | |||||||||
Anixter Inc. |
| |||||||||||
5.13%, 10/01/21 | USD | 50 | 51,250 | |||||||||
Antero Resources Corp. |
| |||||||||||
5.13%, 12/01/22 (Call 06/01/17) | USD | 100 | 90,000 | |||||||||
5.38%, 11/01/21 (Call 11/01/16)b | USD | 175 | 161,437 | |||||||||
5.63%, 06/01/23 (Call 06/01/18)a,b | USD | 100 | 92,000 | |||||||||
6.00%, 12/01/20 (Call 12/01/15) | USD | 50 | 48,000 | |||||||||
SCHEDULESOF INVESTMENTS | 41 |
Table of Contents
Schedule of Investments (Continued)
iSHARES® GLOBAL HIGH YIELD CORPORATE BOND ETF
October 31, 2015
| Security | Principal | Value | ||||||||||
APX Group Inc. |
| |||||||||||
6.38%, 12/01/19 (Call 12/01/15) | USD | 100 | $ | 97,250 | ||||||||
8.75%, 12/01/20 (Call 12/01/15)b | USD | 75 | 61,875 | |||||||||
Aramark Services Inc. |
| |||||||||||
5.75%, 03/15/20 (Call 11/30/15) | USD | 100 | 104,250 | |||||||||
ARC Properties Operating Partnership LP | ||||||||||||
2.00%, 02/06/17 | USD | 100 | 98,500 | |||||||||
Arch Coal Inc. |
| |||||||||||
7.25%, 06/15/21 (Call 06/15/16) | USD | 150 | 4,125 | |||||||||
Argos Merger Sub Inc. |
| |||||||||||
7.13%, 03/15/23 (Call 03/15/18)a | USD | 235 | 247,337 | |||||||||
Ashland Inc. |
| |||||||||||
3.88%, 04/15/18 (Call 03/15/18) | USD | 100 | 103,000 | |||||||||
4.75%, 08/15/22 (Call 05/15/22)b | USD | 100 | 100,055 | |||||||||
Audatex North America Inc. |
| |||||||||||
6.00%, 06/15/21 (Call 06/15/17)a | USD | 175 | 176,094 | |||||||||
6.13%, 11/01/23 (Call 11/01/18)a | USD | 215 | 216,344 | |||||||||
Avaya Inc. |
| |||||||||||
7.00%, 04/01/19 (Call 11/30/15)a,b | USD | 125 | 99,375 | |||||||||
10.50%, 03/01/21 (Call 03/01/17)a | USD | 100 | 38,500 | |||||||||
Avis Budget Car Rental LLC/Avis Budget Finance Inc. | ||||||||||||
5.13%, 06/01/22 (Call 06/01/17)a | USD | 25 | 25,438 | |||||||||
5.50%, 04/01/23 (Call 04/01/18)b | USD | 100 | 103,500 | |||||||||
Avon Products Inc. |
| |||||||||||
6.35%, 03/15/20 | USD | 25 | 20,250 | |||||||||
6.75%, 03/15/23 | USD | 50 | 36,375 | |||||||||
Axiall Corp. |
| |||||||||||
4.88%, 05/15/23 (Call 05/15/18) | USD | 50 | 47,625 | |||||||||
Ball Corp. |
| |||||||||||
4.00%, 11/15/23b | USD | 75 | 73,125 | |||||||||
5.00%, 03/15/22 | USD | 100 | 103,500 | |||||||||
5.25%, 07/01/25 | USD | 125 | 127,344 | |||||||||
Belden Inc. |
| |||||||||||
5.50%, 04/15/23 (Call 04/15/18)c | EUR | 100 | 111,017 | |||||||||
| Security | Principal | Value | ||||||||||
Berry Petroleum Co. LLC |
| |||||||||||
6.38%, 09/15/22 (Call 03/15/17) | USD | 50 | $ | 18,000 | ||||||||
Berry Plastics Corp. |
| |||||||||||
5.13%, 07/15/23 (Call 07/15/18) | USD | 50 | 49,625 | |||||||||
5.50%, 05/15/22 (Call 05/15/17)b | USD | 50 | 51,250 | |||||||||
6.00%, 10/15/22 (Call 10/15/18)a,b | USD | 40 | 41,900 | |||||||||
Blue Cube Spinco Inc. |
| |||||||||||
9.75%, 10/15/23 (Call 10/15/20)a | USD | 125 | 134,687 | |||||||||
BlueLine Rental Finance Corp. |
| |||||||||||
7.00%, 02/01/19 (Call 02/01/16)a,b | USD | 75 | 75,188 | |||||||||
BMC Software Finance Inc. |
| |||||||||||
8.13%, 07/15/21 (Call 07/15/16)a | USD | 175 | 135,625 | |||||||||
Boyd Gaming Corp. |
| |||||||||||
6.88%, 05/15/23 (Call 05/15/18)b | USD | 75 | 79,312 | |||||||||
BreitBurn Energy Partners LP/BreitBurn Finance Corp. | ||||||||||||
7.88%, 04/15/22 (Call 01/15/17) | USD | 75 | 28,500 | |||||||||
Builders FirstSource Inc. |
| |||||||||||
10.75%, 08/15/23 (Call 08/15/18)a,b | USD | 65 | 67,275 | |||||||||
Building Materials Corp. of America |
| |||||||||||
5.38%, 11/15/24 (Call 11/15/19)a | USD | 75 | 77,250 | |||||||||
6.00%, 10/15/25 (Call 10/15/20)a | USD | 150 | 159,750 | |||||||||
Cablevision Systems Corp. |
| |||||||||||
5.88%, 09/15/22b | USD | 50 | 41,625 | |||||||||
7.75%, 04/15/18 | USD | 50 | 52,250 | |||||||||
8.00%, 04/15/20 | USD | 125 | 121,250 | |||||||||
8.63%, 09/15/17 | USD | 250 | 266,250 | |||||||||
Caesars Entertainment Resort Properties LLC/Caesars Entertainment Resort Properties | ||||||||||||
8.00%, 10/01/20 (Call 10/01/16) | USD | 125 | 124,062 | |||||||||
11.00%, 10/01/21 (Call 10/01/16) | USD | 100 | 95,750 | |||||||||
CalAtlantic Group Inc. |
| |||||||||||
8.38%, 05/15/18 | USD | 100 | 114,500 | |||||||||
| 42 | 2015 iSHARES ANNUAL REPORTTO SHAREHOLDERS |
Table of Contents
Schedule of Investments (Continued)
iSHARES® GLOBAL HIGH YIELD CORPORATE BOND ETF
October 31, 2015
| Security | Principal | Value | ||||||||||
California Resources Corp. |
| |||||||||||
5.00%, 01/15/20 (Call 12/15/19) | USD | 100 | $ | 72,250 | ||||||||
5.50%, 09/15/21 (Call 06/15/21)b | USD | 175 | 121,187 | |||||||||
6.00%, 11/15/24 (Call 08/15/24)b | USD | 225 | 153,000 | |||||||||
Calpine Corp. |
| |||||||||||
5.38%, 01/15/23 (Call 10/15/18)b | USD | 150 | 143,437 | |||||||||
5.50%, 02/01/24 (Call 02/01/19)b | USD | 100 | 94,500 | |||||||||
5.75%, 01/15/25 (Call 10/15/19)b | USD | 200 | 189,500 | |||||||||
5.88%, 01/15/24 (Call 11/01/18)a | USD | 25 | 26,188 | |||||||||
6.00%, 01/15/22 (Call 11/01/16)a | USD | 25 | 26,250 | |||||||||
7.88%, 01/15/23 (Call 01/15/17)a,b | USD | 100 | 107,250 | |||||||||
Calumet Specialty Products Partners LP/Calumet Finance Corp. | ||||||||||||
6.50%, 04/15/21 (Call 04/15/17) | USD | 100 | 93,500 | |||||||||
Carrizo Oil & Gas Inc. |
| |||||||||||
6.25%, 04/15/23 (Call 04/15/18)b | USD | 80 | 74,800 | |||||||||
7.50%, 09/15/20 (Call 09/15/16) | USD | 175 | 174,562 | |||||||||
CCO Holdings LLC/CCO Holdings Capital Corp. | ||||||||||||
5.13%, 02/15/23 (Call 02/15/18) | USD | 50 | 50,000 | |||||||||
5.13%, 05/01/23 (Call 05/01/18)a | USD | 250 | 249,687 | |||||||||
5.25%, 03/15/21 (Call 03/15/16) | USD | 50 | 51,375 | |||||||||
5.25%, 09/30/22 (Call 09/30/17)b | USD | 150 | 151,500 | |||||||||
5.38%, 05/01/25 (Call 05/01/20)a,b | USD | 50 | 49,500 | |||||||||
5.75%, 09/01/23 (Call 03/01/18)b | USD | 50 | 51,375 | |||||||||
5.75%, 01/15/24 (Call 07/15/18) | USD | 75 | 77,062 | |||||||||
5.88%, 05/01/27 (Call 05/01/21)a | USD | 100 | 99,812 | |||||||||
6.50%, 04/30/21 (Call 11/30/15) | USD | 150 | 157,500 | |||||||||
6.63%, 01/31/22 (Call 01/31/17) | USD | 50 | 52,813 | |||||||||
7.00%, 01/15/19 (Call 11/30/15) | USD | 43 | 44,075 | |||||||||
7.38%, 06/01/20 (Call 12/01/15) | USD | 100 | 104,000 | |||||||||
CDW LLC/CDW Finance Corp. | ||||||||||||
5.00%, 09/01/23 (Call 03/01/18) | USD | 50 | 51,750 | |||||||||
5.50%, 12/01/24 (Call 06/01/24) | USD | 50 | 52,500 | |||||||||
6.00%, 08/15/22 (Call 08/15/17) | USD | 50 | 53,625 | |||||||||
CenturyLink Inc. |
| |||||||||||
Series V |
| |||||||||||
5.63%, 04/01/20 | USD | 75 | 75,188 | |||||||||
5.63%, 04/01/25 (Call 01/01/25)b | USD | 100 | 90,750 | |||||||||
5.80%, 03/15/22b | USD | 150 | 146,232 | |||||||||
6.00%, 04/01/17 | USD | 50 | 52,000 | |||||||||
6.45%, 06/15/21 | USD | 100 | 100,750 | |||||||||
Series W |
| |||||||||||
6.75%, 12/01/23b | USD | 50 | 49,500 | |||||||||
| Security | Principal | Value | ||||||||||
Cequel Communications Holdings I LLC/Cequel Capital Corp. | ||||||||||||
5.13%, 12/15/21 (Call 06/15/16)a | USD | 100 | $ | 95,625 | ||||||||
6.38%, 09/15/20 (Call 11/30/15)a | USD | 200 | 200,500 | |||||||||
Chaparral Energy Inc. |
| |||||||||||
7.63%, 11/15/22 (Call 05/15/17) | USD | 75 | 24,188 | |||||||||
Chemours Co. (The) |
| |||||||||||
6.63%, 05/15/23 (Call 05/15/18)a,b | USD | 125 | 93,594 | |||||||||
7.00%, 05/15/25 (Call 05/15/20)a | USD | 75 | 55,875 | |||||||||
Chesapeake Energy Corp. |
| |||||||||||
4.88%, 04/15/22 (Call 04/15/17) | USD | 200 | 124,000 | |||||||||
5.38%, 06/15/21 (Call 06/15/16) | USD | 50 | 32,375 | |||||||||
5.75%, 03/15/23b | USD | 100 | 63,000 | |||||||||
6.13%, 02/15/21b | USD | 100 | 65,500 | |||||||||
6.25%, 01/15/17 | EUR | 50 | 52,208 | |||||||||
6.50%, 08/15/17b | USD | 50 | 45,875 | |||||||||
6.63%, 08/15/20 | USD | 150 | 101,250 | |||||||||
6.88%, 11/15/20b | USD | 100 | 67,500 | |||||||||
7.25%, 12/15/18b | USD | 50 | 40,250 | |||||||||
CHS/Community Health Systems Inc. |
| |||||||||||
5.13%, 08/15/18 (Call 11/30/15) | USD | 100 | 101,875 | |||||||||
5.13%, 08/01/21 (Call 02/01/17)b | USD | 75 | 77,437 | |||||||||
6.88%, 02/01/22 (Call 02/01/18)b | USD | 275 | 277,062 | |||||||||
7.13%, 07/15/20 (Call 07/15/16) | USD | 250 | 256,875 | |||||||||
8.00%, 11/15/19 (Call 11/30/15) | USD | 150 | 155,625 | |||||||||
Cinemark USA Inc. |
| |||||||||||
4.88%, 06/01/23 (Call 06/01/18) | USD | 50 | 49,000 | |||||||||
5.13%, 12/15/22 (Call 12/15/17) | USD | 25 | 25,063 | |||||||||
CIT Group Inc. |
| |||||||||||
3.88%, 02/19/19 | USD | 100 | 101,250 | |||||||||
4.25%, 08/15/17 | USD | 100 | 102,125 | |||||||||
5.00%, 05/15/17 | USD | 100 | 103,125 | |||||||||
5.00%, 08/15/22 | USD | 200 | 210,500 | |||||||||
5.00%, 08/01/23b | USD | 50 | 52,438 | |||||||||
5.25%, 03/15/18 | USD | 250 | 262,187 | |||||||||
5.38%, 05/15/20 | USD | 100 | 107,625 | |||||||||
5.50%, 02/15/19a | USD | 150 | 159,375 | |||||||||
6.63%, 04/01/18a | USD | 50 | 53,875 | |||||||||
SCHEDULESOF INVESTMENTS | 43 |
Table of Contents
Schedule of Investments (Continued)
iSHARES® GLOBAL HIGH YIELD CORPORATE BOND ETF
October 31, 2015
| Security | Principal | Value | ||||||||||
Citgo Holding Inc. |
| |||||||||||
10.75%, 02/15/20a | USD | 150 | $ | 149,625 | ||||||||
Claire’s Stores Inc. |
| |||||||||||
8.88%, 03/15/19 (Call 11/30/15) | USD | 25 | 10,000 | |||||||||
9.00%, 03/15/19 (Call 11/30/15)a | USD | 150 | 122,625 | |||||||||
Clean Harbors Inc. |
| |||||||||||
5.13%, 06/01/21 (Call 12/01/16) | USD | 50 | 51,250 | |||||||||
5.25%, 08/01/20 (Call 08/01/16)b | USD | 50 | 51,750 | |||||||||
Clear Channel Worldwide Holdings Inc. |
| |||||||||||
6.50%, 11/15/22 (Call 11/15/17) | USD | 350 | 364,050 | |||||||||
Series B |
| |||||||||||
7.63%, 03/15/20 (Call 11/30/15) | USD | 250 | 258,750 | |||||||||
Cliffs Natural Resources Inc. |
| |||||||||||
7.75%, 03/31/20 (Call 03/31/17)a | USD | 57 | 22,800 | |||||||||
8.25%, 03/31/20 (Call 03/31/18)a | USD | 100 | 89,500 | |||||||||
CNH Industrial Capital LLC |
| |||||||||||
3.25%, 02/01/17 | USD | 100 | 100,250 | |||||||||
3.38%, 07/15/19b | USD | 50 | 49,188 | |||||||||
3.63%, 04/15/18b | USD | 100 | 100,250 | |||||||||
3.88%, 07/16/18a | USD | 50 | 50,125 | |||||||||
Commercial Metals Co. |
| |||||||||||
7.35%, 08/15/18 | USD | 50 | 53,625 | |||||||||
CommScope Inc. | ||||||||||||
4.38%, 06/15/20 (Call 06/15/17)a | USD | 50 | 50,750 | |||||||||
5.00%, 06/15/21 (Call 06/15/17)a | USD | 50 | 50,125 | |||||||||
5.50%, 06/15/24 (Call 06/15/19)a | USD | 100 | 99,000 | |||||||||
CommScope Technologies Finance LLC | ||||||||||||
6.00%, 06/15/25 (Call 06/15/20)a | USD | 155 | 157,712 | |||||||||
Communications Sales & Leasing Inc./CSL Capital LLC | ||||||||||||
6.00%, 04/15/23 (Call 04/15/18)a | USD | 50 | 48,250 | |||||||||
8.25%, 10/15/23 (Call 04/15/19) | USD | 100 | 92,250 | |||||||||
Comstock Resources Inc. |
| |||||||||||
10.00%, 03/15/20 (Call 03/15/16)a,b | USD | 75 | 48,938 | |||||||||
| Security | Principal | Value | ||||||||||
Concho Resources Inc. |
| |||||||||||
5.50%, 10/01/22 (Call 10/01/17) | USD | 50 | $ | 50,313 | ||||||||
5.50%, 04/01/23 (Call 10/01/17) | USD | 200 | 201,250 | |||||||||
6.50%, 01/15/22 (Call 01/15/17) | USD | 100 | 103,625 | |||||||||
CONSOL Energy Inc. |
| |||||||||||
5.88%, 04/15/22 (Call 04/15/17)b | USD | 250 | 162,500 | |||||||||
8.00%, 04/01/23 (Call 04/01/18)a | USD | 25 | 18,313 | |||||||||
Constellation Brands Inc. |
| |||||||||||
4.25%, 05/01/23 | USD | 200 | 204,500 | |||||||||
4.75%, 11/15/24b | USD | 50 | 52,375 | |||||||||
6.00%, 05/01/22 | USD | 50 | 55,875 | |||||||||
7.25%, 05/15/17 | USD | 100 | 108,250 | |||||||||
Covanta Holding Corp. |
| |||||||||||
5.88%, 03/01/24 (Call 03/01/19) | USD | 75 | 74,438 | |||||||||
Crestwood Midstream Partners LP/Crestwood Midstream Finance Corp. | ||||||||||||
6.00%, 12/15/20 (Call 12/15/16) | USD | 75 | 66,375 | |||||||||
6.13%, 03/01/22 (Call 11/01/16) | USD | 75 | 64,688 | |||||||||
6.25%, 04/01/23 (Call 04/01/18)a | USD | 50 | 42,625 | |||||||||
Crimson Merger Sub Inc. |
| |||||||||||
6.63%, 05/15/22 (Call 05/15/17)a,b | USD | 125 | 107,500 | |||||||||
Crown Americas LLC/Crown Americas Capital Corp. III | ||||||||||||
6.25%, 02/01/21 (Call 02/01/16) | USD | 50 | 52,000 | |||||||||
Crown Americas LLC/Crown Americas Capital Corp. IV | ||||||||||||
4.50%, 01/15/23b | USD | 100 | 100,000 | |||||||||
Crown Castle International Corp. |
| |||||||||||
4.88%, 04/15/22 | USD | 200 | 211,750 | |||||||||
5.25%, 01/15/23 | USD | 150 | 161,625 | |||||||||
Crown European Holdings SA |
| |||||||||||
4.00%, 07/15/22 (Call 04/15/22)c | EUR | 100 | 115,712 | |||||||||
CSC Holdings LLC |
| |||||||||||
5.25%, 06/01/24b | USD | 75 | 66,000 | |||||||||
6.75%, 11/15/21 | USD | 75 | 72,563 | |||||||||
8.63%, 02/15/19 | USD | 50 | 53,750 | |||||||||
Dana Holding Corp. |
| |||||||||||
5.38%, 09/15/21 (Call 09/15/16) | USD | 50 | 51,125 | |||||||||
5.50%, 12/15/24 (Call 12/15/19) | USD | 25 | 25,000 | |||||||||
Darling Global Finance BV |
| |||||||||||
4.75%, 05/30/22 (Call 05/30/18)c | EUR | 100 | 103,655 | |||||||||
DaVita HealthCare Partners Inc. |
| |||||||||||
5.00%, 05/01/25 (Call 05/01/20) | USD | 120 | 118,800 | |||||||||
| 44 | 2015 iSHARES ANNUAL REPORTTO SHAREHOLDERS |
Table of Contents
Schedule of Investments (Continued)
iSHARES® GLOBAL HIGH YIELD CORPORATE BOND ETF
October 31, 2015
| Security | Principal | Value | ||||||||||
5.13%, 07/15/24 (Call 07/15/19)b | USD | 200 | $ | 203,000 | ||||||||
5.75%, 08/15/22 (Call 08/15/17) | USD | 150 | 157,500 | |||||||||
DCP Midstream LLC |
| |||||||||||
5.85%, 05/21/43 (Call 05/21/23)a,d | USD | 50 | 40,000 | |||||||||
DCP Midstream Operating LP |
| |||||||||||
2.50%, 12/01/17 (Call 11/01/17) | USD | 100 | 93,000 | |||||||||
3.88%, 03/15/23 (Call 12/15/22) | USD | 50 | 42,000 | |||||||||
Dell Inc. |
| |||||||||||
4.63%, 04/01/21b | USD | 25 | 24,000 | |||||||||
5.65%, 04/15/18 | USD | 50 | 52,250 | |||||||||
5.88%, 06/15/19b | USD | 50 | 52,250 | |||||||||
Denbury Resources Inc. |
| |||||||||||
4.63%, 07/15/23 (Call 01/15/18) | USD | 100 | 67,500 | |||||||||
5.50%, 05/01/22 (Call 05/01/17)b | USD | 200 | 141,500 | |||||||||
6.38%, 08/15/21 (Call 08/15/16) | USD | 50 | 36,750 | |||||||||
DISH DBS Corp. |
| |||||||||||
4.25%, 04/01/18 | USD | 100 | 100,125 | |||||||||
4.63%, 07/15/17b | USD | 100 | 102,250 | |||||||||
5.00%, 03/15/23 | USD | 100 | 92,500 | |||||||||
5.13%, 05/01/20 | USD | 75 | 74,813 | |||||||||
5.88%, 07/15/22 | USD | 250 | 244,375 | |||||||||
5.88%, 11/15/24 | USD | 250 | 239,375 | |||||||||
6.75%, 06/01/21 | USD | 200 | 206,500 | |||||||||
7.88%, 09/01/19 | USD | 150 | 164,250 | |||||||||
DJO Finco Inc./DJO Finance LLC/DJO Finance Corp. | ||||||||||||
8.13%, 06/15/21 (Call 06/15/18)a | USD | 75 | 74,250 | |||||||||
Dollar Tree Inc. |
| |||||||||||
5.25%, 03/01/20 (Call 03/01/17)a | USD | 50 | 52,250 | |||||||||
5.75%, 03/01/23 (Call 03/01/18)a | USD | 285 | 299,250 | |||||||||
DPL Inc. |
| |||||||||||
6.50%, 10/15/16 (Call 09/15/16) | USD | 27 | 27,608 | |||||||||
7.25%, 10/15/21 (Call 07/15/21) | USD | 100 | 100,596 | |||||||||
DR Horton Inc. |
| |||||||||||
3.63%, 02/15/18 (Call 11/15/17)b | USD | 100 | 101,750 | |||||||||
3.75%, 03/01/19 (Call 12/01/18) | USD | 100 | 102,000 | |||||||||
4.00%, 02/15/20 | USD | 100 | 103,000 | |||||||||
Dynegy Inc. |
| |||||||||||
5.88%, 06/01/23 (Call 06/01/18) | USD | 50 | 46,750 | |||||||||
6.75%, 11/01/19 (Call 05/01/17) | USD | 150 | 150,000 | |||||||||
7.38%, 11/01/22 (Call 11/01/18) | USD | 200 | 200,500 | |||||||||
7.63%, 11/01/24 (Call 11/01/19) | USD | 150 | 150,375 | |||||||||
E*TRADE Financial Corp. |
| |||||||||||
5.38%, 11/15/22 (Call 11/15/17)b | USD | 30 | 32,175 | |||||||||
| Security | Principal | Value | ||||||||||
Eagle Spinco Inc. |
| |||||||||||
4.63%, 02/15/21 (Call 02/15/18) | USD | 50 | $ | 48,688 | ||||||||
Edgewell Personal Care Co. |
| |||||||||||
4.70%, 05/19/21 | USD | 100 | 103,000 | |||||||||
4.70%, 05/24/22 | USD | 91 | 93,047 | |||||||||
Endo Finance LLC |
| |||||||||||
5.75%, 01/15/22 (Call 01/15/17)a | USD | 75 | 73,781 | |||||||||
Endo Finance LLC/Endo Finco Inc. |
| |||||||||||
5.38%, 01/15/23 (Call 07/15/17)a | USD | 275 | 269,500 | |||||||||
Endo Ltd./Endo Finance LLC/Endo Finco Inc. | ||||||||||||
6.00%, 02/01/25 (Call 02/01/20)a | USD | 200 | 199,500 | |||||||||
Energizer Holdings Inc. |
| |||||||||||
5.50%, 06/15/25 (Call 06/15/20)a,b | USD | 50 | 50,900 | |||||||||
Energy Transfer Equity LP |
| |||||||||||
5.50%, 06/01/27 (Call 03/01/27) | USD | 90 | 80,100 | |||||||||
5.88%, 01/15/24 (Call 10/15/23) | USD | 175 | 169,536 | |||||||||
7.50%, 10/15/20 | USD | 100 | 107,500 | |||||||||
Energy XXI Gulf Coast Inc. |
| |||||||||||
6.88%, 03/15/24 (Call 03/15/19) | USD | 25 | 4,875 | |||||||||
7.50%, 12/15/21 (Call 12/15/16)b | USD | 55 | 10,794 | |||||||||
9.25%, 12/15/17 (Call 11/30/15) | USD | 100 | 30,000 | |||||||||
11.00%, 03/15/20 (Call 09/15/17)a | USD | 150 | 79,875 | |||||||||
EP Energy LLC/Everest Acquisition Finance Inc. | ||||||||||||
6.38%, 06/15/23 (Call 06/15/18)b | USD | 100 | 75,500 | |||||||||
9.38%, 05/01/20 (Call 05/01/16) | USD | 200 | 174,000 | |||||||||
Equinix Inc. |
| |||||||||||
4.88%, 04/01/20 (Call 04/01/17)b | USD | 25 | 26,063 | |||||||||
5.38%, 01/01/22 (Call 01/01/18) | USD | 80 | 83,600 | |||||||||
5.38%, 04/01/23 (Call 04/01/18) | USD | 100 | 104,000 | |||||||||
5.75%, 01/01/25 (Call 01/01/20) | USD | 50 | 52,250 | |||||||||
EXCO Resources Inc. |
| |||||||||||
8.50%, 04/15/22 (Call 04/15/17) | USD | 75 | 16,125 | |||||||||
FCA U.S. LLC/CG Co-Issuer Inc. |
| |||||||||||
8.25%, 06/15/21 (Call 06/15/16) | USD | 250 | 267,187 | |||||||||
Felcor Lodging LP |
| |||||||||||
5.63%, 03/01/23 (Call 03/01/18) | USD | 50 | 51,500 | |||||||||
6.00%, 06/01/25 (Call 06/01/20) | USD | 25 | 25,813 | |||||||||
Ferrellgas LP/Ferrellgas Finance Corp. | ||||||||||||
6.50%, 05/01/21 (Call 05/01/16) | USD | 50 | 46,375 | |||||||||
6.75%, 01/15/22 (Call 11/15/16) | USD | 50 | 46,250 | |||||||||
6.75%, 06/15/23 (Call 06/15/19)a | USD | 50 | 46,000 | |||||||||
SCHEDULESOF INVESTMENTS | 45 |
Table of Contents
Schedule of Investments (Continued)
iSHARES® GLOBAL HIGH YIELD CORPORATE BOND ETF
October 31, 2015
| Security | Principal | Value | ||||||||||
Fifth Third Bancorp |
| |||||||||||
5.10%, 12/29/49 (Call 06/30/23)d | USD | 50 | $ | 45,875 | ||||||||
First Data Corp. |
| |||||||||||
5.38%, 08/15/23 (Call 08/15/18)a,b | USD | 150 | 152,625 | |||||||||
6.75%, 11/01/20 (Call 11/30/15)a | USD | 97 | 102,214 | |||||||||
8.25%, 01/15/21 (Call 01/15/16)a,b | USD | 250 | 262,187 | |||||||||
8.75%, 01/15/22 (Call 01/15/16)a | USD | 100 | 105,125 | |||||||||
10.63%, 06/15/21 (Call 04/15/16) | USD | 33 | 36,836 | |||||||||
11.25%, 01/15/21 (Call 11/02/15) | USD | 33 | 36,513 | |||||||||
11.75%, 08/15/21 (Call 05/15/16) | USD | 131 | 149,504 | |||||||||
12.63%, 01/15/21 (Call 01/15/16) | USD | 250 | 286,250 | |||||||||
FirstEnergy Corp. |
| |||||||||||
Series A |
| |||||||||||
2.75%, 03/15/18 (Call 02/15/18) | USD | 100 | 100,571 | |||||||||
Series B |
| |||||||||||
4.25%, 03/15/23 (Call 12/15/22) | USD | 50 | 50,426 | |||||||||
FirstEnergy Transmission LLC |
| |||||||||||
4.35%, 01/15/25 (Call 10/15/24)a | USD | 50 | 50,934 | |||||||||
Florida East Coast Holdings Corp. |
| |||||||||||
6.75%, 05/01/19 (Call 05/01/16)a | USD | 75 | 75,469 | |||||||||
Freescale Semiconductor Inc. |
| |||||||||||
5.00%, 05/15/21 (Call 05/15/16)a | USD | 50 | 51,625 | |||||||||
6.00%, 01/15/22 (Call 11/15/16)a | USD | 100 | 106,250 | |||||||||
Frontier Communications Corp. |
| |||||||||||
6.25%, 09/15/21 (Call 06/15/21)b | USD | 50 | 44,750 | |||||||||
6.88%, 01/15/25 (Call 10/15/24) | USD | 100 | 86,000 | |||||||||
7.13%, 01/15/23b | USD | 50 | 44,750 | |||||||||
7.63%, 04/15/24 | USD | 50 | 45,000 | |||||||||
8.13%, 10/01/18 | USD | 50 | 52,750 | |||||||||
8.25%, 04/15/17b | USD | 100 | 106,750 | |||||||||
8.50%, 04/15/20 | USD | 100 | 103,250 | |||||||||
8.75%, 04/15/22 | USD | 50 | 48,125 | |||||||||
8.88%, 09/15/20 (Call 06/15/20)a | USD | 125 | 129,844 | |||||||||
9.25%, 07/01/21b | USD | 50 | 50,750 | |||||||||
| Security | Principal | Value | ||||||||||
10.50%, 09/15/22 (Call 06/15/22)a | USD | 260 | $ | 269,750 | ||||||||
11.00%, 09/15/25 (Call 06/15/25)a | USD | 420 | 440,740 | |||||||||
Gates Global LLC/Gates Global Co. |
| |||||||||||
6.00%, 07/15/22 (Call 07/15/17)a | USD | 75 | 60,000 | |||||||||
Genesis Energy LP/Genesis Energy Finance Corp. | ||||||||||||
6.00%, 05/15/23 (Call 05/15/18) | USD | 75 | 68,250 | |||||||||
6.75%, 08/01/22 (Call 08/01/18) | USD | 50 | 48,375 | |||||||||
GenOn Energy Inc. |
| |||||||||||
7.88%, 06/15/17b | USD | 100 | 92,750 | |||||||||
9.50%, 10/15/18 | USD | 75 | 66,000 | |||||||||
9.88%, 10/15/20 (Call 11/30/15) | USD | 50 | 41,500 | |||||||||
Genworth Holdings Inc. |
| |||||||||||
4.80%, 02/15/24 | USD | 100 | 75,000 | |||||||||
4.90%, 08/15/23 | USD | 75 | 56,250 | |||||||||
6.52%, 05/22/18 | USD | 50 | 50,875 | |||||||||
7.63%, 09/24/21 | USD | 100 | 93,300 | |||||||||
7.70%, 06/15/20 | USD | 50 | 50,250 | |||||||||
GLP Capital LP/GLP Financing II Inc. |
| |||||||||||
4.38%, 11/01/18 (Call 08/01/18) | USD | 50 | 51,625 | |||||||||
4.88%, 11/01/20 (Call 08/01/20)b | USD | 125 | 128,750 | |||||||||
5.38%, 11/01/23 (Call 08/01/23) | USD | 75 | 75,750 | |||||||||
Goodyear Tire & Rubber Co. (The) |
| |||||||||||
6.50%, 03/01/21 (Call 03/01/16) | USD | 100 | 105,875 | |||||||||
7.00%, 05/15/22 (Call 05/15/17)b | USD | 50 | 54,375 | |||||||||
8.25%, 08/15/20 (Call 11/30/15)b | USD | 100 | 104,500 | |||||||||
Halcon Resources Corp. |
| |||||||||||
8.63%, 02/01/20 (Call 02/01/17)a,b | USD | 50 | 43,125 | |||||||||
13.00%, 02/15/22 (Call 08/15/18)a | USD | 125 | 72,500 | |||||||||
Hanesbrands Inc. |
| |||||||||||
6.38%, 12/15/20 (Call 12/15/15) | USD | 50 | 51,875 | |||||||||
Harland Clarke Holdings Corp. |
| |||||||||||
9.25%, 03/01/21 (Call 03/01/17)a | USD | 100 | 84,875 | |||||||||
HCA Holdings Inc. |
| |||||||||||
6.25%, 02/15/21 | USD | 75 | 81,750 | |||||||||
| 46 | 2015 iSHARES ANNUAL REPORTTO SHAREHOLDERS |
Table of Contents
Schedule of Investments (Continued)
iSHARES® GLOBAL HIGH YIELD CORPORATE BOND ETF
October 31, 2015
| Security | Principal | Value | ||||||||||
HCA Inc. |
| |||||||||||
3.75%, 03/15/19 | USD | 100 | $ | 101,250 | ||||||||
4.25%, 10/15/19 | USD | 50 | 51,375 | |||||||||
4.75%, 05/01/23 | USD | 100 | 102,500 | |||||||||
5.00%, 03/15/24 | USD | 350 | 359,625 | |||||||||
5.25%, 04/15/25 | USD | 100 | 103,750 | |||||||||
5.38%, 02/01/25 | USD | 275 | 282,562 | |||||||||
5.88%, 03/15/22 | USD | 100 | 109,750 | |||||||||
5.88%, 05/01/23 | USD | 100 | 106,125 | |||||||||
6.50%, 02/15/20 | USD | 450 | 502,312 | |||||||||
7.50%, 02/15/22 | USD | 250 | 287,500 | |||||||||
HD Supply Inc. |
| |||||||||||
5.25%, 12/15/21 (Call 12/15/17)a | USD | 100 | 104,750 | |||||||||
7.50%, 07/15/20 (Call 10/15/16) | USD | 200 | 213,000 | |||||||||
11.50%, 07/15/20 (Call 10/15/16) | USD | 100 | 113,000 | |||||||||
HealthSouth Corp. |
| |||||||||||
5.75%, 11/01/24 (Call 11/01/17) | USD | 125 | 125,000 | |||||||||
Hercules Offshore Inc. |
| |||||||||||
8.75%, 07/15/21 (Call 07/15/17)a,e | USD | 50 | 10,000 | |||||||||
Hertz Corp. (The) |
| |||||||||||
5.88%, 10/15/20 (Call 11/30/15)b | USD | 50 | 51,750 | |||||||||
6.25%, 10/15/22 (Call 10/15/17)b | USD | 50 | 52,250 | |||||||||
6.75%, 04/15/19 (Call 11/30/15) | USD | 250 | 256,562 | |||||||||
Hertz Holdings Netherlands BV |
| |||||||||||
4.38%, 01/15/19c | EUR | 100 | 114,607 | |||||||||
Hexion Inc. |
| |||||||||||
6.63%, 04/15/20 (Call 11/30/15) | USD | 225 | 191,250 | |||||||||
8.88%, 02/01/18 (Call 11/30/15) | USD | 125 | 96,250 | |||||||||
Hexion Inc./Hexion Nova Scotia Finance ULC | ||||||||||||
9.00%, 11/15/20 (Call 11/30/15) | USD | 50 | 26,000 | |||||||||
Hilcorp Energy I LP/Hilcorp Finance Co. |
| |||||||||||
5.00%, 12/01/24 (Call 06/01/19)a | USD | 50 | 45,250 | |||||||||
5.75%, 10/01/25 (Call 04/01/20)a,b | USD | 75 | 69,188 | |||||||||
Hilton Worldwide Finance LLC/Hilton Worldwide Finance Corp. | ||||||||||||
5.63%, 10/15/21 (Call 10/15/16) | USD | 100 | 104,625 | |||||||||
Hologic Inc. |
| |||||||||||
5.25%, 07/15/22 (Call 07/15/18)a | USD | 111 | 115,162 | |||||||||
| Security | Principal | Value | ||||||||||
HRG Group Inc. |
| |||||||||||
7.75%, 01/15/22 (Call 01/15/17) | USD | 75 | $ | 74,438 | ||||||||
7.88%, 07/15/19 (Call 01/15/16) | USD | 50 | 53,063 | |||||||||
HUB International Ltd. | ||||||||||||
7.88%, 10/01/21 (Call 10/01/16)a | USD | 125 | 124,062 | |||||||||
Hughes Satellite Systems Corp. |
| |||||||||||
6.50%, 06/15/19 | USD | 90 | 98,550 | |||||||||
7.63%, 06/15/21 | USD | 75 | 81,937 | |||||||||
Huntington Ingalls Industries Inc. |
| |||||||||||
5.00%, 12/15/21 (Call 12/15/17)a | USD | 50 | 52,125 | |||||||||
7.13%, 03/15/21 (Call 03/15/16) | USD | 50 | 52,500 | |||||||||
Huntsman International LLC |
| |||||||||||
4.88%, 11/15/20 (Call 08/15/20)b | USD | 100 | 94,250 | |||||||||
5.13%, 04/15/21 | EUR | 100 | 107,289 | |||||||||
5.13%, 11/15/22 (Call 08/15/22)a,b | USD | 50 | 46,750 | |||||||||
IAC/InterActiveCorp |
| |||||||||||
4.75%, 12/15/22 (Call 12/15/17) | USD | 50 | 47,000 | |||||||||
4.88%, 11/30/18 (Call 11/30/15) | USD | 25 | 25,625 | |||||||||
Icahn Enterprises LP/Icahn Enterprises Finance Corp. | ||||||||||||
3.50%, 03/15/17 (Call 02/15/17)b | USD | 100 | 100,765 | |||||||||
4.88%, 03/15/19 (Call 07/15/16) | USD | 100 | 102,280 | |||||||||
5.88%, 02/01/22 (Call 08/01/17)b | USD | 200 | 206,000 | |||||||||
6.00%, 08/01/20 (Call 02/01/17) | USD | 200 | 208,243 | |||||||||
iHeartCommunications Inc. |
| |||||||||||
9.00%, 12/15/19 (Call 11/30/15) | USD | 275 | 233,062 | |||||||||
9.00%, 03/01/21 (Call 03/01/16)b | USD | 200 | 164,500 | |||||||||
9.00%, 09/15/22 (Call 09/15/17)b | USD | 100 | 81,750 | |||||||||
10.00%, 01/15/18 (Call 07/15/16)b | USD | 50 | 26,375 | |||||||||
10.63%, 03/15/23 (Call 03/15/18) | USD | 75 | 63,000 | |||||||||
11.25%, 03/01/21 (Call 03/01/16) | USD | 50 | 42,750 | |||||||||
Infor U.S. Inc. |
| |||||||||||
5.75%, 08/15/20 (Call 08/15/17)a | USD | 50 | 50,750 | |||||||||
5.75%, 05/15/22 (Call 05/15/18)c | EUR | 100 | 101,075 | |||||||||
SCHEDULESOF INVESTMENTS | 47 |
Table of Contents
Schedule of Investments (Continued)
iSHARES® GLOBAL HIGH YIELD CORPORATE BOND ETF
October 31, 2015
| Security | Principal | Value | ||||||||||
6.50%, 05/15/22 (Call 05/15/18)a | USD | 165 | $ | 155,925 | ||||||||
International Game Technology |
| |||||||||||
7.50%, 06/15/19 | USD | 25 | 26,875 | |||||||||
International Game Technology PLC | ||||||||||||
4.13%, 02/15/20 (Call 11/15/19)c | EUR | 100 | 111,337 | |||||||||
4.75%, 02/15/23 (Call 08/15/22)c | EUR | 100 | 106,737 | |||||||||
5.63%, 02/15/20 (Call 11/15/19)a,b | USD | 200 | 202,000 | |||||||||
6.25%, 02/15/22 (Call 08/15/21)a | USD | 250 | 244,375 | |||||||||
International Lease Finance Corp. |
| |||||||||||
3.88%, 04/15/18 | USD | 100 | 101,500 | |||||||||
5.88%, 04/01/19 | USD | 50 | 53,574 | |||||||||
5.88%, 08/15/22 | USD | 100 | 108,750 | |||||||||
6.25%, 05/15/19 | USD | 100 | 108,500 | |||||||||
8.25%, 12/15/20b | USD | 100 | 119,002 | |||||||||
8.75%, 03/15/17 | USD | 150 | 161,625 | |||||||||
inVentiv Health Inc. |
| |||||||||||
9.00%, 01/15/18 (Call 01/15/16)a | USD | 75 | 77,062 | |||||||||
Iron Mountain Inc. |
| |||||||||||
5.75%, 08/15/24 (Call 08/15/17) | USD | 175 | 176,312 | |||||||||
6.00%, 08/15/23 (Call 08/15/18)b | USD | 50 | 51,875 | |||||||||
iStar Inc. |
| |||||||||||
4.00%, 11/01/17 (Call 08/01/17) | USD | 100 | 97,750 | |||||||||
5.00%, 07/01/19 (Call 07/01/16) | USD | 50 | 48,938 | |||||||||
Jaguar Holding Co. II/Pharmaceutical Product Development LLC | ||||||||||||
6.38%, 08/01/23 (Call 08/01/18)a | USD | 100 | 99,500 | |||||||||
JC Penney Corp. Inc. |
| |||||||||||
5.65%, 06/01/20b | USD | 50 | 45,625 | |||||||||
8.13%, 10/01/19 | USD | 25 | 24,875 | |||||||||
Jefferies Finance LLC/JFIN Co-Issuer Corp. | ||||||||||||
6.88%, 04/15/22 (Call 04/15/17)a | USD | 200 | 187,000 | |||||||||
K. Hovnanian Enterprises Inc. |
| |||||||||||
7.25%, 10/15/20 (Call 11/30/15)a | USD | 100 | 94,250 | |||||||||
KB Home |
| |||||||||||
4.75%, 05/15/19 (Call 02/15/19) | USD | 50 | 49,125 | |||||||||
7.00%, 12/15/21 (Call 09/15/21) | USD | 50 | 50,500 | |||||||||
Kindred Healthcare Inc. |
| |||||||||||
6.38%, 04/15/22 (Call 04/15/17) | USD | 50 | 47,250 | |||||||||
8.00%, 01/15/20 | USD | 50 | 51,750 | |||||||||
8.75%, 01/15/23 | USD | 50 | 52,125 | |||||||||
| Security | Principal | Value | ||||||||||
Kinetic Concepts Inc./KCI USA Inc. |
| |||||||||||
10.50%, 11/01/18 (Call 11/30/15) | USD | 325 | $ | 341,656 | ||||||||
12.50%, 11/01/19 (Call 11/30/15) | USD | 50 | 53,000 | |||||||||
Kloeckner Pentaplast of America Inc. |
| |||||||||||
7.13%, 11/01/20 (Call 05/01/17)c | EUR | 100 | 114,607 | |||||||||
KLX Inc. |
| |||||||||||
5.88%, 12/01/22 (Call 12/01/17)a,b | USD | 100 | 102,250 | |||||||||
L Brands Inc. |
| |||||||||||
5.63%, 02/15/22 | USD | 100 | 108,250 | |||||||||
5.63%, 10/15/23 | USD | 50 | 54,625 | |||||||||
6.63%, 04/01/21 | USD | 100 | 113,500 | |||||||||
6.90%, 07/15/17 | USD | 50 | 54,000 | |||||||||
7.00%, 05/01/20 | USD | 50 | 57,250 | |||||||||
8.50%, 06/15/19 | USD | 100 | 118,000 | |||||||||
Lamar Media Corp. |
| |||||||||||
5.00%, 05/01/23 (Call 05/01/18) | USD | 50 | 51,375 | |||||||||
5.38%, 01/15/24 (Call 01/15/19) | USD | 50 | 52,000 | |||||||||
5.88%, 02/01/22 (Call 02/01/17)b | USD | 50 | 52,750 | |||||||||
Laredo Petroleum Inc. |
| |||||||||||
5.63%, 01/15/22 (Call 01/15/17) | USD | 50 | 46,875 | |||||||||
7.38%, 05/01/22 (Call 05/01/17) | USD | 50 | 49,002 | |||||||||
Laureate Education Inc. |
| |||||||||||
9.25%, 09/01/19 (Call 11/30/15)a | USD | 125 | 99,375 | |||||||||
Lear Corp. |
| |||||||||||
4.75%, 01/15/23 (Call 01/15/18) | USD | 100 | 100,750 | |||||||||
5.25%, 01/15/25 (Call 01/15/20) | USD | 50 | 51,000 | |||||||||
Leidos Holdings Inc. |
| |||||||||||
4.45%, 12/01/20 (Call 09/01/20) | USD | 50 | 49,314 | |||||||||
Lennar Corp. |
| |||||||||||
4.50%, 06/15/19 (Call 04/16/19) | USD | 25 | 25,875 | |||||||||
4.50%, 11/15/19 (Call 08/15/19) | USD | 100 | 103,500 | |||||||||
4.75%, 11/15/22 (Call 08/15/22) | USD | 50 | 50,125 | |||||||||
4.75%, 05/30/25 (Call 02/28/25) | USD | 75 | 74,250 | |||||||||
4.88%, 12/15/23 | USD | 30 | 29,888 | |||||||||
Leucadia National Corp. |
| |||||||||||
5.50%, 10/18/23 (Call 01/18/23) | USD | 50 | 49,765 | |||||||||
Level 3 Communications Inc. |
| |||||||||||
5.75%, 12/01/22 (Call 12/01/17)b | USD | 50 | 51,125 | |||||||||
| 48 | 2015 iSHARES ANNUAL REPORTTO SHAREHOLDERS |
Table of Contents
Schedule of Investments (Continued)
iSHARES® GLOBAL HIGH YIELD CORPORATE BOND ETF
October 31, 2015
| Security | Principal | Value | ||||||||||
Level 3 Financing Inc. |
| |||||||||||
5.13%, 05/01/23 (Call 05/01/18)a | USD | 100 | $ | 101,000 | ||||||||
5.38%, 08/15/22 (Call 08/15/17) | USD | 75 | 74,813 | |||||||||
5.38%, 05/01/25 (Call 05/01/20)a | USD | 100 | 99,750 | |||||||||
5.63%, 02/01/23 (Call 02/01/18) | USD | 50 | 51,500 | |||||||||
6.13%, 01/15/21 (Call 11/15/16) | USD | 50 | 52,750 | |||||||||
8.63%, 07/15/20 (Call 01/15/16) | USD | 100 | 105,625 | |||||||||
Levi Strauss & Co. |
| |||||||||||
5.00%, 05/01/25 (Call 05/01/20) | USD | 125 | 126,875 | |||||||||
6.88%, 05/01/22 (Call 05/01/17) | USD | 50 | 54,375 | |||||||||
LifePoint Health Inc. |
| |||||||||||
5.50%, 12/01/21 (Call 12/01/16) | USD | 125 | 126,094 | |||||||||
6.63%, 10/01/20 (Call 11/30/15)b | USD | 50 | 51,750 | |||||||||
Linn Energy LLC/Linn Energy Finance Corp. | ||||||||||||
6.25%, 11/01/19 (Call 11/30/15) | USD | 75 | 17,393 | |||||||||
6.50%, 05/15/19 (Call 11/30/15) | USD | 100 | 25,500 | |||||||||
6.50%, 09/15/21 (Call 09/15/17) | USD | 50 | 11,000 | |||||||||
7.75%, 02/01/21 (Call 11/30/15) | USD | 50 | 11,250 | |||||||||
8.63%, 04/15/20 (Call 11/30/15) | USD | 100 | 26,000 | |||||||||
Mallinckrodt International Finance SA |
| |||||||||||
4.75%, 04/15/23 | USD | 50 | 44,000 | |||||||||
Mallinckrodt International Finance SA/Mallinckrodt CB LLC | ||||||||||||
4.88%, 04/15/20 (Call 04/15/17)a,b | USD | 100 | 95,875 | |||||||||
5.50%, 04/15/25 (Call 04/15/20)a,b | USD | 50 | 45,375 | |||||||||
5.63%, 10/15/23 (Call 10/15/18)a,b | USD | 50 | 47,188 | |||||||||
5.75%, 08/01/22 (Call 08/01/17)a | USD | 150 | 141,750 | |||||||||
MarkWest Energy Partners LP/MarkWest Energy Finance Corp. | ||||||||||||
4.50%, 07/15/23 (Call 04/15/23) | USD | 100 | 93,750 | |||||||||
4.88%, 12/01/24 (Call 09/01/24) | USD | 200 | 188,500 | |||||||||
4.88%, 06/01/25 (Call 03/01/25) | USD | 125 | 117,187 | |||||||||
Masco Corp. |
| |||||||||||
4.45%, 04/01/25 (Call 01/01/25)b | USD | 50 | 50,125 | |||||||||
5.95%, 03/15/22 | USD | 50 | 55,125 | |||||||||
6.13%, 10/03/16b | USD | 150 | 156,000 | |||||||||
McGraw-Hill Global Education Holdings LLC/McGraw-Hill Global Education Finance | ||||||||||||
9.75%, 04/01/21 (Call 04/01/16) | USD | 50 | 54,750 | |||||||||
Memorial Production Partners LP/Memorial Production Finance��Corp. | ||||||||||||
6.88%, 08/01/22 (Call 08/01/17) | USD | 100 | 62,000 | |||||||||
| Security | Principal | Value | ||||||||||
MGM Resorts International |
| |||||||||||
5.25%, 03/31/20b | USD | 25 | $ | 25,563 | ||||||||
6.00%, 03/15/23b | USD | 150 | 152,062 | |||||||||
6.63%, 12/15/21b | USD | 125 | 133,206 | |||||||||
6.75%, 10/01/20b | USD | 100 | 106,750 | |||||||||
7.63%, 01/15/17b | USD | 100 | 106,250 | |||||||||
7.75%, 03/15/22 | USD | 100 | 110,815 | |||||||||
8.63%, 02/01/19 | USD | 100 | 113,250 | |||||||||
Michaels Stores Inc. |
| |||||||||||
5.88%, 12/15/20 (Call 12/15/16)a,b | USD | 50 | 52,875 | |||||||||
Micron Technology Inc. |
| |||||||||||
5.25%, 08/01/23 (Call 02/01/18)a | USD | 150 | 145,500 | |||||||||
5.25%, 01/15/24 (Call 05/01/18)a | USD | 50 | 48,000 | |||||||||
5.50%, 02/01/25 (Call 08/01/19) | USD | 90 | 86,400 | |||||||||
5.63%, 01/15/26 (Call 05/01/20)a | USD | 50 | 47,250 | |||||||||
5.88%, 02/15/22 (Call 02/15/17)b | USD | 50 | 50,875 | |||||||||
Midstates Petroleum Co. Inc./Midstates Petroleum Co. LLC | ||||||||||||
10.00%, 06/01/20 (Call 06/01/17)a | USD | 75 | 51,938 | |||||||||
MPH Acquisition Holdings LLC |
| |||||||||||
6.63%, 04/01/22 (Call 04/01/17)a | USD | 75 | 76,500 | |||||||||
MPT Operating Partnership LP/MPT Finance Corp. | ||||||||||||
4.00%, 08/19/22 (Call 05/19/22) | EUR | 100 | 111,768 | |||||||||
MSCI Inc. |
| |||||||||||
5.25%, 11/15/24 (Call 11/15/19)a | USD | 50 | 52,625 | |||||||||
5.75%, 08/15/25 (Call 08/15/20)a | USD | 100 | 105,000 | |||||||||
Murray Energy Corp. |
| |||||||||||
11.25%, 04/15/21 (Call 04/15/18)a | USD | 100 | 27,250 | |||||||||
Nationstar Mortgage LLC/Nationstar Capital Corp. | ||||||||||||
6.50%, 08/01/18 (Call 11/30/15) | USD | 50 | 48,750 | |||||||||
6.50%, 07/01/21 (Call 01/01/17) | USD | 100 | 92,250 | |||||||||
Navient Corp. |
| |||||||||||
4.63%, 09/25/17 | USD | 50 | 50,500 | |||||||||
4.88%, 06/17/19b | USD | 150 | 145,125 | |||||||||
5.00%, 10/26/20b | USD | 100 | 93,625 | |||||||||
SCHEDULESOF INVESTMENTS | 49 |
Table of Contents
Schedule of Investments (Continued)
iSHARES® GLOBAL HIGH YIELD CORPORATE BOND ETF
October 31, 2015
| Security | Principal | Value | ||||||||||
5.50%, 01/15/19b | USD | 250 | $ | 247,500 | ||||||||
5.50%, 01/25/23b | USD | 100 | 89,750 | |||||||||
5.88%, 03/25/21b | USD | 50 | 47,375 | |||||||||
5.88%, 10/25/24 | USD | 25 | 22,063 | |||||||||
6.00%, 01/25/17 | USD | 100 | 102,500 | |||||||||
6.13%, 03/25/24 | USD | 100 | 90,500 | |||||||||
7.25%, 01/25/22 | USD | 75 | 73,875 | |||||||||
8.00%, 03/25/20 | USD | 150 | 159,000 | |||||||||
8.45%, 06/15/18 | USD | 200 | 214,500 | |||||||||
Navios Maritime Holdings Inc./Navios Maritime Finance II U.S. Inc. | ||||||||||||
7.38%, 01/15/22 (Call 01/15/17)a | USD | �� | 50 | 39,250 | ||||||||
Navistar International Corp. |
| |||||||||||
8.25%, 11/01/21 (Call 11/30/15) | USD | 100 | 78,000 | |||||||||
NBTY Inc. |
| |||||||||||
9.00%, 10/01/18 (Call 11/30/15) | USD | 50 | 51,188 | |||||||||
NCR Corp. |
| |||||||||||
4.63%, 02/15/21 (Call 02/15/17) | USD | 50 | 49,125 | |||||||||
5.00%, 07/15/22 (Call 07/15/17) | USD | 50 | 49,125 | |||||||||
5.88%, 12/15/21 (Call 12/15/17) | USD | 50 | 49,875 | |||||||||
6.38%, 12/15/23 (Call 12/15/18) | USD | 75 | 76,687 | |||||||||
Neiman Marcus Group Ltd. LLC |
| |||||||||||
8.00%, 10/15/21 (Call 10/15/16)a | USD | 75 | 77,625 | |||||||||
Netflix Inc. |
| |||||||||||
5.50%, 02/15/22a | USD | 125 | 131,875 | |||||||||
5.88%, 02/15/25a | USD | 100 | 105,500 | |||||||||
Newfield Exploration Co. |
| |||||||||||
5.38%, 01/01/26 (Call 10/01/25) | USD | 100 | 95,000 | |||||||||
5.63%, 07/01/24b | USD | 75 | 74,625 | |||||||||
5.75%, 01/30/22 | USD | 150 | 151,875 | |||||||||
NGL Energy Partners LP/NGL Energy Finance Corp. | ||||||||||||
5.13%, 07/15/19 (Call 06/15/19) | USD | 75 | 69,750 | |||||||||
NGPL PipeCo LLC |
| |||||||||||
7.12%, 12/15/17a | USD | 125 | 115,625 | |||||||||
9.63%, 06/01/19 (Call 11/30/15)a,b | USD | 50 | 46,500 | |||||||||
Nielsen Co. Luxembourg Sarl (The) |
| |||||||||||
5.50%, 10/01/21 (Call 10/01/16)a,b | USD | 50 | 51,750 | |||||||||
Nielsen Finance LLC/Nielsen Finance Co. | ||||||||||||
4.50%, 10/01/20 (Call 10/01/16) | USD | 200 | 205,500 | |||||||||
5.00%, 04/15/22 (Call 04/15/17)a | USD | 225 | 228,656 | |||||||||
| Security | Principal | Value | ||||||||||
Novelis Inc. |
| |||||||||||
8.38%, 12/15/17 (Call 11/30/15) | USD | 200 | $ | 202,000 | ||||||||
8.75%, 12/15/20 (Call 12/15/15) | USD | 150 | 151,500 | |||||||||
NRG Energy Inc. |
| |||||||||||
6.25%, 07/15/22 (Call 07/15/18) | USD | 100 | 92,500 | |||||||||
6.25%, 05/01/24 (Call 05/01/19) | USD | 125 | 111,562 | |||||||||
6.63%, 03/15/23 (Call 09/15/17) | USD | 100 | 92,250 | |||||||||
7.63%, 01/15/18b | USD | 100 | 104,750 | |||||||||
7.88%, 05/15/21 (Call 05/15/16) | USD | 100 | 99,250 | |||||||||
8.25%, 09/01/20 (Call 11/30/15) | USD | 50 | 51,375 | |||||||||
Nuance Communications Inc. |
| |||||||||||
5.38%, 08/15/20 (Call 08/15/16)a | USD | 100 | 101,750 | |||||||||
NuStar Logistics LP |
| |||||||||||
4.80%, 09/01/20 | USD | 50 | 48,500 | |||||||||
Oasis Petroleum Inc. |
| |||||||||||
6.50%, 11/01/21 (Call 11/01/16) | USD | 50 | 42,250 | |||||||||
6.88%, 03/15/22 (Call 09/15/17) | USD | 125 | 106,875 | |||||||||
7.25%, 02/01/19 (Call 11/30/15)b | USD | 50 | 47,875 | |||||||||
Offshore Group Investment Ltd. |
| |||||||||||
7.13%, 04/01/23 (Call 04/01/18) | USD | 75 | 22,031 | |||||||||
7.50%, 11/01/19 (Call 11/30/15) | USD | 75 | 21,375 | |||||||||
OneMain Financial Holdings Inc. |
| |||||||||||
6.75%, 12/15/19 (Call 12/15/16)a | USD | 75 | 79,312 | |||||||||
7.25%, 12/15/21 (Call 12/15/17)a | USD | 50 | 52,188 | |||||||||
ONEOK Inc. |
| |||||||||||
4.25%, 02/01/22 (Call 11/02/21) | USD | 50 | 42,528 | |||||||||
7.50%, 09/01/23 (Call 06/01/23) | USD | 75 | 73,390 | |||||||||
Outfront Media Capital LLC/Outfront Media Capital Corp. | ||||||||||||
5.25%, 02/15/22 (Call 02/15/17) | USD | 75 | 76,687 | |||||||||
5.88%, 03/15/25 (Call 09/15/19) | USD | 75 | 77,107 | |||||||||
Owens-Brockway Glass Container Inc. |
| |||||||||||
5.00%, 01/15/22a | USD | 50 | 50,625 | |||||||||
5.88%, 08/15/23a | USD | 100 | 106,125 | |||||||||
Pacific Drilling SA |
| |||||||||||
5.38%, 06/01/20 (Call 06/01/16)a | USD | 100 | 52,500 | |||||||||
Peabody Energy Corp. |
| |||||||||||
6.00%, 11/15/18 | USD | 150 | 26,250 | |||||||||
6.25%, 11/15/21 | USD | 100 | 14,500 | |||||||||
6.50%, 09/15/20 | USD | 50 | 6,805 | |||||||||
10.00%, 03/15/22 (Call 03/15/18)a,b | USD | 60 | 16,200 | |||||||||
| 50 | 2015 iSHARES ANNUAL REPORTTO SHAREHOLDERS |
Table of Contents
Schedule of Investments (Continued)
iSHARES® GLOBAL HIGH YIELD CORPORATE BOND ETF
October 31, 2015
| Security | Principal | Value | ||||||||||
Penn Virginia Corp. |
| |||||||||||
8.50%, 05/01/20 (Call 05/01/17)b | USD | 50 | $ | 14,375 | ||||||||
Petco Animal Supplies Inc. |
| |||||||||||
9.25%, 12/01/18 (Call 11/30/15)a | USD | 50 | 51,375 | |||||||||
Pinnacle Entertainment Inc. |
| |||||||||||
6.38%, 08/01/21 (Call 08/01/16) | USD | 65 | 69,144 | |||||||||
7.50%, 04/15/21 (Call 11/30/15) | USD | 100 | 105,375 | |||||||||
Platform Specialty Products Corp. |
| |||||||||||
6.50%, 02/01/22 (Call 02/01/18)a,b | USD | 100 | 85,250 | |||||||||
Post Holdings Inc. |
| |||||||||||
6.00%, 12/15/22 (Call 06/15/18)a | USD | 50 | 50,125 | |||||||||
6.75%, 12/01/21 (Call 12/01/17)a | USD | 100 | 103,000 | |||||||||
7.38%, 02/15/22 (Call 02/15/17)b | USD | 125 | 131,562 | |||||||||
7.75%, 03/15/24 (Call 09/15/18)a | USD | 100 | 106,750 | |||||||||
8.00%, 07/15/25 (Call 07/15/20)a | USD | 50 | 54,125 | |||||||||
QEP Resources Inc. |
| |||||||||||
5.25%, 05/01/23 (Call 02/01/23) | USD | 50 | 44,375 | |||||||||
5.38%, 10/01/22 (Call 07/01/22) | USD | 100 | 90,000 | |||||||||
6.88%, 03/01/21 | USD | 50 | 48,500 | |||||||||
Quicken Loans Inc. |
| |||||||||||
5.75%, 05/01/25 (Call 05/01/20)a | USD | 110 | 108,762 | |||||||||
QVC Inc. |
| |||||||||||
3.13%, 04/01/19 | USD | 50 | 49,797 | |||||||||
4.38%, 03/15/23 | USD | 50 | 47,669 | |||||||||
4.45%, 02/15/25 (Call 11/15/24) | USD | 50 | 46,824 | |||||||||
4.85%, 04/01/24 | USD | 75 | 72,767 | |||||||||
5.13%, 07/02/22 | USD | 50 | 50,371 | |||||||||
Range Resources Corp. |
| |||||||||||
4.88%, 05/15/25 (Call 02/15/25)a,b | USD | 100 | 88,750 | |||||||||
5.00%, 08/15/22 (Call 02/15/17) | USD | 100 | 88,750 | |||||||||
5.00%, 03/15/23 (Call 03/15/18)b | USD | 25 | 22,125 | |||||||||
5.75%, 06/01/21 (Call 06/01/16) | USD | 50 | 46,750 | |||||||||
Realogy Group LLC/Realogy Co-Issuer Corp. | ||||||||||||
4.50%, 04/15/19a | USD | 50 | 51,500 | |||||||||
Regal Entertainment Group |
| |||||||||||
5.75%, 03/15/22 (Call 03/15/17)b | USD | 100 | 102,500 | |||||||||
Rite Aid Corp. |
| |||||||||||
6.13%, 04/01/23 (Call 04/01/18)a,b | USD | 225 | 243,281 | |||||||||
6.75%, 06/15/21 (Call 06/15/16)b | USD | 75 | 80,437 | |||||||||
9.25%, 03/15/20 (Call 03/15/16) | USD | 50 | 53,625 | |||||||||
| Security | Principal | Value | ||||||||||
Rockies Express Pipeline LLC |
| |||||||||||
5.63%, 04/15/20a | USD | 75 | $ | 75,188 | ||||||||
6.00%, 01/15/19a | USD | 50 | 50,625 | |||||||||
6.85%, 07/15/18a | USD | 50 | 51,500 | |||||||||
Royal Caribbean Cruises Ltd. |
| |||||||||||
5.25%, 11/15/22 | USD | 50 | 53,063 | |||||||||
RR Donnelley & Sons Co. |
| |||||||||||
6.00%, 04/01/24 | USD | 50 | 45,625 | |||||||||
7.00%, 02/15/22 | USD | 25 | 24,625 | |||||||||
7.88%, 03/15/21b | USD | 50 | 52,125 | |||||||||
Sabine Pass Liquefaction LLC |
| |||||||||||
5.63%, 02/01/21 (Call 11/01/20) | USD | 250 | 247,500 | |||||||||
5.63%, 04/15/23 (Call 01/15/23) | USD | 100 | 97,312 | |||||||||
5.63%, 03/01/25 (Call 12/01/24)a | USD | 225 | 215,437 | |||||||||
5.75%, 05/15/24 (Call 02/15/24) | USD | 200 | 193,000 | |||||||||
6.25%, 03/15/22 (Call 12/15/21)b | USD | 100 | 99,500 | |||||||||
Sabine Pass LNG LP |
| |||||||||||
6.50%, 11/01/20 (Call 11/01/16) | USD | 150 | 150,750 | |||||||||
7.50%, 11/30/16b | USD | 100 | 103,187 | |||||||||
Sally Holdings LLC/Sally Capital Inc. |
| |||||||||||
5.75%, 06/01/22 (Call 06/01/17)b | USD | 50 | 52,625 | |||||||||
6.88%, 11/15/19 (Call 11/30/15) | USD | 100 | 103,875 | |||||||||
Sanchez Energy Corp. |
| |||||||||||
6.13%, 01/15/23 (Call 07/15/18)b | USD | 125 | 90,625 | |||||||||
7.75%, 06/15/21 (Call 06/15/17)b | USD | 100 | 79,500 | |||||||||
SandRidge Energy Inc. |
| |||||||||||
8.75%, 06/01/20 (Call 06/01/17)a | USD | 125 | 76,562 | |||||||||
SBA Communications Corp. |
| |||||||||||
4.88%, 07/15/22 (Call 07/15/17) | USD | 75 | 76,875 | |||||||||
5.63%, 10/01/19 (Call 10/01/16) | USD | 50 | 52,188 | |||||||||
SBA Telecommunications Inc. |
| |||||||||||
5.75%, 07/15/20 (Call 07/15/16) | USD | 50 | 52,188 | |||||||||
Scientific Games International Inc. |
| |||||||||||
7.00%, 01/01/22 (Call 01/01/18)a,b | USD | 100 | 100,000 | |||||||||
10.00%, 12/01/22 (Call 12/01/18) | USD | 275 | 243,375 | |||||||||
Sealed Air Corp. |
| |||||||||||
4.50%, 09/15/23 (Call 06/15/23)c | EUR | 100 | 115,712 | |||||||||
SCHEDULESOF INVESTMENTS | 51 |
Table of Contents
Schedule of Investments (Continued)
iSHARES® GLOBAL HIGH YIELD CORPORATE BOND ETF
October 31, 2015
| Security | Principal | Value | ||||||||||
4.88%, 12/01/22 (Call 09/01/22)a | USD | 50 | $ | 51,375 | ||||||||
5.13%, 12/01/24 (Call 09/01/24)a | USD | 75 | 77,250 | |||||||||
5.25%, 04/01/23 (Call 01/01/23)a | USD | 50 | 52,250 | |||||||||
5.50%, 09/15/25 (Call 06/15/25)a | USD | 25 | 26,313 | |||||||||
Service Corp. International/U.S. |
| |||||||||||
5.38%, 01/15/22 (Call 07/15/17) | USD | 150 | 158,625 | |||||||||
5.38%, 05/15/24 (Call 05/15/19) | USD | 50 | 53,313 | |||||||||
Seventy Seven Energy Inc. |
| |||||||||||
6.50%, 07/15/22 (Call 07/15/17)b | USD | 25 | 7,563 | |||||||||
Seventy Seven Operating LLC |
| |||||||||||
6.63%, 11/15/19 (Call 11/30/15)b | USD | 75 | 44,250 | |||||||||
Sinclair Television Group Inc. |
| |||||||||||
5.38%, 04/01/21 (Call 04/01/16) | USD | 50 | 50,125 | |||||||||
5.63%, 08/01/24 (Call 08/01/19)a,b | USD | 50 | 48,875 | |||||||||
6.13%, 10/01/22 (Call 10/01/17) | USD | 50 | 51,375 | |||||||||
Sirius XM Radio Inc. |
| |||||||||||
4.25%, 05/15/20 (Call 05/15/16)a | USD | 150 | 152,625 | |||||||||
4.63%, 05/15/23 (Call 05/15/18)a,b | USD | 50 | 49,438 | |||||||||
5.38%, 04/15/25 (Call 04/15/20)a | USD | 50 | 51,125 | |||||||||
5.75%, 08/01/21 (Call 08/01/16)a,b | USD | 100 | 104,750 | |||||||||
5.88%, 10/01/20 (Call 10/01/16)a | USD | 50 | 52,813 | |||||||||
6.00%, 07/15/24 (Call 07/15/19)a | USD | 125 | 131,875 | |||||||||
SM Energy Co. |
| |||||||||||
5.00%, 01/15/24 (Call 07/15/18) | USD | 100 | 89,000 | |||||||||
5.63%, 06/01/25 (Call 06/01/20)b | USD | 75 | 68,625 | |||||||||
6.13%, 11/15/22 (Call 11/15/18) | USD | 25 | 24,375 | |||||||||
6.50%, 01/01/23 (Call 07/01/17) | USD | 50 | 48,750 | |||||||||
Smithfield Foods Inc. |
| |||||||||||
5.25%, 08/01/18 (Call 11/30/15)a | USD | 25 | 25,438 | |||||||||
6.63%, 08/15/22 (Call 08/15/17) | USD | 100 | 106,750 | |||||||||
Spectrum Brands Inc. |
| |||||||||||
5.75%, 07/15/25 (Call 07/15/20)a | USD | 125 | 133,281 | |||||||||
6.38%, 11/15/20 (Call 11/15/16) | USD | 100 | 106,750 | |||||||||
6.63%, 11/15/22 (Call 11/15/17) | USD | 50 | 54,625 | |||||||||
Springleaf Finance Corp. |
| |||||||||||
5.25%, 12/15/19b | USD | 100 | 99,250 | |||||||||
6.90%, 12/15/17 | USD | 150 | 157,875 | |||||||||
7.75%, 10/01/21 | USD | 100 | 107,750 | |||||||||
Sprint Communications Inc. |
| |||||||||||
6.00%, 12/01/16 | USD | 150 | 151,687 | |||||||||
6.00%, 11/15/22 | USD | 250 | 212,812 | |||||||||
7.00%, 03/01/20a | USD | 100 | 104,749 | |||||||||
| Security | Principal | Value | ||||||||||
7.00%, 08/15/20 | USD | 200 | $ | 184,561 | ||||||||
8.38%, 08/15/17 | USD | 100 | 102,250 | |||||||||
9.00%, 11/15/18a | USD | 325 | 357,435 | |||||||||
9.13%, 03/01/17 | USD | 100 | 103,875 | |||||||||
11.50%, 11/15/21 | USD | 100 | 105,000 | |||||||||
Sprint Corp. |
| |||||||||||
7.13%, 06/15/24 | USD | 200 | 175,625 | |||||||||
7.25%, 09/15/21 | USD | 200 | 183,750 | |||||||||
7.63%, 02/15/25 (Call 11/15/24) | USD | 200 | 177,000 | |||||||||
7.88%, 09/15/23 | USD | 500 | 458,750 | |||||||||
Steel Dynamics Inc. |
| |||||||||||
5.13%, 10/01/21 (Call 10/01/17)b | USD | 50 | 49,625 | |||||||||
5.25%, 04/15/23 (Call 04/15/18) | USD | 50 | 49,000 | |||||||||
5.50%, 10/01/24 (Call 10/01/19) | USD | 25 | 24,438 | |||||||||
6.13%, 08/15/19 (Call 08/15/16) | USD | 150 | 156,375 | |||||||||
Suburban Propane Partners LP/Suburban Energy Finance Corp. | ||||||||||||
5.50%, 06/01/24 (Call 06/01/19) | USD | 50 | 48,500 | |||||||||
SunGard Data Systems Inc. |
| |||||||||||
6.63%, 11/01/19 (Call 11/30/15) | USD | 50 | 51,750 | |||||||||
7.38%, 11/15/18 (Call 11/30/15) | USD | 100 | 102,125 | |||||||||
7.63%, 11/15/20 (Call 11/30/15) | USD | 50 | 52,063 | |||||||||
Sunoco LP/Sunoco Finance Corp. |
| |||||||||||
5.50%, 08/01/20 (Call 08/01/17)a | USD | 50 | 51,250 | |||||||||
6.38%, 04/01/23 (Call 04/01/18)a | USD | 100 | 101,000 | |||||||||
SUPERVALU Inc. |
| |||||||||||
6.75%, 06/01/21 (Call 06/01/17) | USD | 25 | 24,250 | |||||||||
T-Mobile USA Inc. |
| |||||||||||
6.00%, 03/01/23 (Call 09/01/18)b | USD | 100 | 99,750 | |||||||||
6.13%, 01/15/22 (Call 01/15/18) | USD | 100 | 101,750 | |||||||||
6.25%, 04/01/21 (Call 04/01/17) | USD | 300 | 308,250 | |||||||||
6.38%, 03/01/25 (Call 09/01/19) | USD | 150 | 150,015 | |||||||||
6.46%, 04/28/19 (Call 11/10/15) | USD | 150 | 154,312 | |||||||||
6.50%, 01/15/24 (Call 01/15/19) | USD | 150 | 151,125 | |||||||||
6.54%, 04/28/20 (Call 04/28/16) | USD | 100 | 103,000 | |||||||||
6.63%, 11/15/20 (Call 11/15/15)b | USD | 50 | 51,500 | |||||||||
6.63%, 04/28/21 (Call 04/28/17) | USD | 100 | 103,125 | |||||||||
6.63%, 04/01/23 (Call 04/01/18) | USD | 350 | 357,000 | |||||||||
6.73%, 04/28/22 (Call 04/28/17)b | USD | 100 | 103,000 | |||||||||
6.84%, 04/28/23 (Call 04/28/18) | USD | 50 | 51,000 | |||||||||
| 52 | 2015 iSHARES ANNUAL REPORTTO SHAREHOLDERS |
Table of Contents
Schedule of Investments (Continued)
iSHARES® GLOBAL HIGH YIELD CORPORATE BOND ETF
October 31, 2015
| Security | Principal | Value | ||||||||||
TA MFG. Ltd. |
| |||||||||||
3.63%, 04/15/23 (Call 04/15/18)c | EUR | 100 | $ | 104,942 | ||||||||
Talen Energy Supply LLC |
| |||||||||||
4.60%, 12/15/21 (Call 09/15/21) | USD | 100 | 86,000 | |||||||||
4.63%, 07/15/19 (Call 07/15/16)a,b | USD | 125 | 114,062 | |||||||||
6.50%, 06/01/25 (Call 06/01/20)a,b | USD | 50 | 44,250 | |||||||||
Targa Resources Partners LP/Targa Resources Partners Finance Corp. | ||||||||||||
4.13%, 11/15/19 | USD | 100 | 93,000 | |||||||||
4.25%, 11/15/23 (Call 05/15/18) | USD | 50 | 43,625 | |||||||||
5.00%, 01/15/18 (Call 10/15/17)a | USD | 100 | 98,750 | |||||||||
5.25%, 05/01/23 (Call 11/01/17) | USD | 50 | 46,625 | |||||||||
6.75%, 03/15/24 (Call 09/15/19)a | USD | 50 | 49,000 | |||||||||
6.88%, 02/01/21 (Call 02/01/16) | USD | 75 | 75,375 | |||||||||
Taylor Morrison Communities Inc./Monarch Communities Inc. | ||||||||||||
5.25%, 04/15/21 (Call 04/15/16)a | USD | 50 | 50,500 | |||||||||
TEGNA Inc. |
| |||||||||||
5.13%, 10/15/19 (Call 10/15/16) | USD | 100 | 104,250 | |||||||||
6.38%, 10/15/23 (Call 10/15/18) | USD | 75 | 80,812 | |||||||||
Tenet Healthcare Corp. |
| |||||||||||
4.38%, 10/01/21b | USD | 150 | 149,625 | |||||||||
4.50%, 04/01/21 | USD | 100 | 100,250 | |||||||||
5.00%, 03/01/19 | USD | 175 | 171,062 | |||||||||
5.50%, 03/01/19b | USD | 25 | 24,625 | |||||||||
6.00%, 10/01/20 | USD | 250 | 268,125 | |||||||||
6.25%, 11/01/18 | USD | 100 | 106,625 | |||||||||
6.75%, 06/15/23b | USD | 200 | 198,250 | |||||||||
8.00%, 08/01/20 (Call 11/30/15) | USD | 50 | 51,750 | |||||||||
8.13%, 04/01/22b | USD | 300 | 316,875 | |||||||||
Terex Corp. |
| |||||||||||
6.00%, 05/15/21 (Call 11/15/16)b | USD | 75 | 74,250 | |||||||||
TerraForm Power Operating LLC |
| |||||||||||
5.88%, 02/01/23 (Call 02/01/18)a | USD | 75 | 69,375 | |||||||||
Tesoro Corp. |
| |||||||||||
5.38%, 10/01/22 (Call 10/01/17) | USD | 50 | 51,000 | |||||||||
Tesoro Logistics LP/Tesoro Logistics Finance Corp. | ||||||||||||
5.50%, 10/15/19 (Call 09/15/19)a | USD | 100 | 102,250 | |||||||||
5.88%, 10/01/20 (Call 10/01/16) | USD | 50 | 52,000 | |||||||||
6.13%, 10/15/21 (Call 10/15/16) | USD | 50 | 52,000 | |||||||||
6.25%, 10/15/22 (Call 10/15/18)a,b | USD | 50 | 51,875 | |||||||||
| Security | Principal | Value | ||||||||||
Toll Brothers Finance Corp. |
| |||||||||||
5.88%, 02/15/22 (Call 11/15/21) | USD | 100 | $ | 107,500 | ||||||||
Toys R Us Inc. |
| |||||||||||
10.38%, 08/15/17 (Call 11/30/15) | USD | 25 | 20,000 | |||||||||
Toys R Us Property Co. II LLC |
| |||||||||||
8.50%, 12/01/17 (Call 11/30/15) | USD | 150 | 144,937 | |||||||||
TransDigm Inc. |
| |||||||||||
6.00%, 07/15/22 (Call 07/15/17) | USD | 100 | 101,750 | |||||||||
6.50%, 07/15/24 (Call 07/15/19) | USD | 125 | 127,187 | |||||||||
6.50%, 05/15/25 (Call 05/15/20)a | USD | 75 | 76,312 | |||||||||
7.50%, 07/15/21 (Call 07/15/16)b | USD | 200 | 210,500 | |||||||||
Transocean Inc. |
| |||||||||||
3.00%, 10/15/17 | USD | 50 | 46,375 | |||||||||
4.30%, 10/15/22 (Call 07/15/22) | USD | 100 | 67,250 | |||||||||
6.00%, 03/15/18b | USD | 75 | 70,594 | |||||||||
6.50%, 11/15/20 | USD | 75 | 60,750 | |||||||||
6.88%, 12/15/21 | USD | 150 | 118,500 | |||||||||
Tribune Media Co. |
| |||||||||||
5.88%, 07/15/22 (Call 07/15/18)a | USD | 100 | 102,625 | |||||||||
Trinseo Materials Operating SCA/Trinseo Materials Finance Inc. | ||||||||||||
6.38%, 05/01/22 (Call 01/05/18)c | EUR | 100 | 109,913 | |||||||||
Tronox Finance LLC |
| |||||||||||
6.38%, 08/15/20 (Call 11/30/15) | USD | 75 | 53,625 | |||||||||
7.50%, 03/15/22 (Call 03/15/18)a | USD | 50 | 35,375 | |||||||||
U.S. Airways Group Inc. |
| |||||||||||
6.13%, 06/01/18b | USD | 50 | 51,750 | |||||||||
U.S. Steel Corp. |
| |||||||||||
6.05%, 06/01/17 | USD | 50 | 46,750 | |||||||||
7.00%, 02/01/18 | USD | 50 | 43,625 | |||||||||
7.38%, 04/01/20b | USD | 50 | 37,500 | |||||||||
7.50%, 03/15/22 (Call 03/15/17)b | USD | 75 | 57,938 | |||||||||
Ultra Petroleum Corp. |
| |||||||||||
5.75%, 12/15/18 (Call 12/15/15)a | USD | 50 | 33,750 | |||||||||
6.13%, 10/01/24 (Call 10/01/19)a,b | USD | 75 | 40,688 | |||||||||
SCHEDULESOF INVESTMENTS | 53 |
Table of Contents
Schedule of Investments (Continued)
iSHARES® GLOBAL HIGH YIELD CORPORATE BOND ETF
October 31, 2015
| Security | Principal | Value | ||||||||||
United Rentals North America Inc. |
| |||||||||||
4.63%, 07/15/23 (Call 07/15/18) | USD | 125 | $ | 125,312 | ||||||||
5.50%, 07/15/25 (Call 07/15/20) | USD | 75 | 74,813 | |||||||||
5.75%, 11/15/24 (Call 05/15/19)b | USD | 75 | 76,500 | |||||||||
6.13%, 06/15/23 (Call 12/15/17)b | USD | 75 | 78,000 | |||||||||
7.38%, 05/15/20 (Call 05/15/16)b | USD | 50 | 53,125 | |||||||||
7.63%, 04/15/22 (Call 04/15/17) | USD | 150 | 162,766 | |||||||||
Univision Communications Inc. |
| |||||||||||
5.13%, 05/15/23 (Call 05/15/18)a | USD | 125 | 123,437 | |||||||||
5.13%, 02/15/25 (Call 02/15/20)a | USD | 200 | 196,000 | |||||||||
6.75%, 09/15/22 (Call 09/15/17)a | USD | 90 | 95,175 | |||||||||
8.50%, 05/15/21 (Call 11/30/15)a,b | USD | 50 | 52,250 | |||||||||
USG Corp. |
| |||||||||||
6.30%, 11/15/16b | USD | 100 | 103,250 | |||||||||
Valeant Pharmaceuticals International Inc. | ||||||||||||
4.50%, 05/15/23 (Call 05/15/18)c | EUR | 125 | 111,846 | |||||||||
5.38%, 03/15/20 (Call 03/15/17)a | USD | 350 | 304,500 | |||||||||
5.50%, 03/01/23 (Call 03/01/18)a | USD | 100 | 83,625 | |||||||||
5.63%, 12/01/21 (Call 12/01/16)a | USD | 100 | 86,750 | |||||||||
5.88%, 05/15/23 (Call 05/15/18)a | USD | 375 | 316,875 | |||||||||
6.13%, 04/15/25 (Call 04/15/20)a | USD | 295 | 249,275 | |||||||||
6.38%, 10/15/20 (Call 10/15/16)a | USD | 200 | 181,000 | |||||||||
6.75%, 08/15/21 (Call 02/15/16)a,b | USD | 100 | 89,000 | |||||||||
7.00%, 10/01/20 (Call 11/30/15)a | USD | 50 | 45,875 | |||||||||
7.25%, 07/15/22 (Call 07/15/16)a | USD | 50 | 45,000 | |||||||||
7.50%, 07/15/21 (Call 07/15/16)a | USD | 150 | 136,500 | |||||||||
| Security | Principal | Value | ||||||||||
Vereit Operating Partnership LP |
| |||||||||||
3.00%, 02/06/19 (Call 01/06/19) | USD | 100 | $ | 96,375 | ||||||||
4.60%, 02/06/24 (Call 11/06/23) | USD | 50 | 48,375 | |||||||||
VeriSign Inc. |
| |||||||||||
4.63%, 05/01/23 (Call 05/01/18)b | USD | 100 | 99,750 | |||||||||
5.25%, 04/01/25 (Call 01/01/25)b | USD | 50 | 50,750 | |||||||||
Verso Paper Holdings LLC/Verso Paper Inc. |
| |||||||||||
11.75%, 01/15/19 (Call 11/30/15)b | USD | 30 | 6,750 | |||||||||
Voya Financial Inc. |
| |||||||||||
5.65%, 05/15/53 (Call 05/15/23)b,d | USD | 50 | 50,750 | |||||||||
Vulcan Materials Co. |
| |||||||||||
4.50%, 04/01/25 (Call 01/01/25) | USD | 25 | 25,500 | |||||||||
7.50%, 06/15/21 | USD | 50 | 58,750 | |||||||||
VWR Funding Inc. |
| |||||||||||
4.63%, 04/15/22 (Call 04/15/18)c | EUR | 100 | 106,875 | |||||||||
West Corp. |
| |||||||||||
5.38%, 07/15/22 (Call 07/15/17)a,b | USD | 125 | 119,062 | |||||||||
Whiting Canadian Holding Co. ULC | ||||||||||||
8.13%, 12/01/19 (Call 12/01/15) | USD | 100 | 101,250 | |||||||||
Whiting Petroleum Corp. |
| |||||||||||
5.00%, 03/15/19 (Call 12/15/18) | USD | 100 | 95,250 | |||||||||
5.75%, 03/15/21 (Call 12/15/20)b | USD | 200 | 186,500 | |||||||||
6.25%, 04/01/23 (Call 01/01/23)b | USD | 100 | 93,250 | |||||||||
WideOpenWest Finance LLC/WideOpenWest Capital Corp. | ||||||||||||
10.25%, 07/15/19 (Call 11/30/15) | USD | 75 | 75,188 | |||||||||
Windstream Services LLC |
| |||||||||||
6.38%, 08/01/23 (Call 02/01/18) | USD | 100 | 79,000 | |||||||||
7.50%, 06/01/22 (Call 06/01/17) | USD | 50 | 41,600 | |||||||||
7.50%, 04/01/23 (Call 04/01/16)b | USD | 50 | 41,875 | |||||||||
7.75%, 10/15/20 (Call 11/30/15) | USD | 50 | 45,063 | |||||||||
7.75%, 10/01/21 (Call 10/01/16)b | USD | 100 | 86,000 | |||||||||
7.88%, 11/01/17b | USD | 100 | 105,750 | |||||||||
WMG Acquisition Corp. |
| |||||||||||
6.00%, 01/15/21 (Call 01/15/16)a | USD | 50 | 51,375 | |||||||||
| 54 | 2015 iSHARES ANNUAL REPORTTO SHAREHOLDERS |
Table of Contents
Schedule of Investments (Continued)
iSHARES® GLOBAL HIGH YIELD CORPORATE BOND ETF
October 31, 2015
| Security | Principal or Shares (000s) | Value | ||||||||||
6.75%, 04/15/22 (Call 04/15/17)a | USD | 75 | $ | 69,750 | ||||||||
WPX Energy Inc. |
| |||||||||||
5.25%, 09/15/24 (Call 06/15/24)b | USD | 50 | 41,625 | |||||||||
6.00%, 01/15/22 (Call 10/15/21) | USD | 75 | 66,000 | |||||||||
7.50%, 08/01/20 (Call 07/01/20)b | USD | 50 | 46,875 | |||||||||
8.25%, 08/01/23 (Call 06/01/23)b | USD | 100 | 93,000 | |||||||||
WR Grace & Co.-Conn |
| |||||||||||
5.13%, 10/01/21a | USD | 50 | 52,000 | |||||||||
Wynn Las Vegas LLC/Wynn Las Vegas Capital Corp. | ||||||||||||
4.25%, 05/30/23 (Call 02/28/23)a,b | USD | 50 | 44,375 | |||||||||
5.38%, 03/15/22 (Call 03/15/17)b | USD | 150 | 148,500 | |||||||||
5.50%, 03/01/25 (Call 12/01/24)a,b | USD | 225 | 210,656 | |||||||||
XPO Logistics Inc. |
| |||||||||||
5.75%, 06/15/21 (Call 12/15/17)c | EUR | 100 | 100,534 | |||||||||
6.50%, 06/15/22 (Call 06/15/18)a | USD | 150 | 133,875 | |||||||||
7.88%, 09/01/19 (Call 09/01/16)a | USD | 100 | 100,750 | |||||||||
Zayo Group LLC/Zayo Capital Inc. |
| |||||||||||
6.00%, 04/01/23 (Call 04/01/18)a | USD | 145 | 147,827 | |||||||||
Zebra Technologies Corp. |
| |||||||||||
7.25%, 10/15/22 (Call 10/15/17) | USD | 100 | 108,750 | |||||||||
|
| |||||||||||
| 71,925,969 | ||||||||||||
|
| |||||||||||
TOTAL CORPORATE BONDS & NOTES |
| |||||||||||
(Cost: $122,071,558) |
| 115,271,227 | ||||||||||
SHORT-TERM INVESTMENTS — 15.46% |
| |||||||||||
MONEY MARKET FUNDS — 15.46% |
| |||||||||||
BlackRock Cash Funds: Institutional, |
| |||||||||||
0.19%g,h,i | 15,944 | 15,944,238 | ||||||||||
| Security | (000s) | Value | ||||||||
BlackRock Cash Funds: Prime, |
| |||||||||
0.19%g,h,i | 1,397 | $ | 1,396,767 | |||||||
BlackRock Cash Funds: Treasury, |
| |||||||||
0.02%g,h | 1,040 | 1,040,084 | ||||||||
|
| |||||||||
| 18,381,089 | ||||||||||
|
| |||||||||
TOTAL SHORT-TERM INVESTMENTS |
| |||||||||
(Cost: $18,381,089) |
| 18,381,089 | ||||||||
|
| |||||||||
TOTAL INVESTMENTS | ||||||||||
(Cost: $140,452,647) |
| 133,652,316 | ||||||||
Other Assets, Less Liabilities — (12.38)% |
| (14,721,312 | ) | |||||||
|
| |||||||||
NET ASSETS — 100.00% | $ | 118,931,004 | ||||||||
|
| |||||||||
CAD | — Canadian Dollar | |
EUR | — Euro | |
GBP | — British Pound | |
USD | — United States Dollar |
| a | This security may be resold to qualified institutional buyers under Rule 144A of the Securities Act of 1933. |
| b | All or a portion of this security represents a security on loan. See Note 1. |
| c | This security may be resold to qualified foreign investors and foreign institutional buyers under Regulation S of the Securities Act of 1933. |
| d | Variable rate security. Rate shown is as of report date. |
| e | Issuer is in default of interest payments. |
| f | Step coupon security. Coupon rate will either increase (step-up bond) or decrease (step-down bond) at regular intervals until maturity. Interest rate shown reflects the rate currently in effect. |
| g | Affiliated issuer. See Note 2. |
| h | The rate quoted is the annualized seven-day yield of the fund at period end. |
| i | All or a portion of this security represents an investment of securities lending collateral. See Note 1. |
See notes to financial statements.
SCHEDULESOF INVESTMENTS | 55 |
Table of Contents
Statements of Assets and Liabilities
iSHARES® , INC.
October 31, 2015
| iShares Emerging Markets Corporate Bond ETF | iShares Emerging Markets High Yield Bond ETF | iShares Bond ETF | ||||||||||
ASSETS | ||||||||||||
Investments, at cost: | ||||||||||||
Unaffiliated | $ | 29,867,206 | $ | 167,221,411 | $ | 581,146,058 | ||||||
Affiliated (Note 2) | 994,942 | 1,804,380 | 244,291 | |||||||||
|
|
|
|
|
| |||||||
Total cost of investments | $ | 30,862,148 | $ | 169,025,791 | $ | 581,390,349 | ||||||
|
|
|
|
|
| |||||||
Investments in securities, at fair value (including securities on loana) (Note 1): | ||||||||||||
Unaffiliated | $ | 28,352,011 | $ | 154,832,154 | $ | 493,061,872 | ||||||
Affiliated (Note 2) | 994,942 | 1,804,380 | 244,291 | |||||||||
|
|
|
|
|
| |||||||
Total fair value of investments | 29,346,953 | 156,636,534 | 493,306,163 | |||||||||
Foreign currency, at valueb | — | — | 27,157,759 | |||||||||
Cash | 23,775 | 69,975 | 5,991,323 | |||||||||
Receivables: | ||||||||||||
Investment securities sold | 136,938 | — | 7,250,687 | |||||||||
Interest | 403,218 | 2,565,932 | 7,624,204 | |||||||||
Tax reclaims | — | — | 180,670 | |||||||||
|
|
|
|
|
| |||||||
Total Assets | 29,910,884 | 159,272,441 | 541,510,806 | |||||||||
|
|
|
|
|
| |||||||
LIABILITIES | ||||||||||||
Payables: | ||||||||||||
Investment securities purchased | 206,074 | — | 19,570,946 | |||||||||
Collateral for securities on loan (Note 1) | 763,795 | — | — | |||||||||
Deferred foreign capital gains taxes (Note 1) | 35 | 5,112 | 904,814 | |||||||||
Investment advisory fees (Note 2) | 12,185 | 67,852 | 222,765 | |||||||||
Capital shares redeemed | — | — | 280,149 | |||||||||
|
|
|
|
|
| |||||||
Total Liabilities | 982,089 | 72,964 | 20,978,674 | |||||||||
|
|
|
|
|
| |||||||
NET ASSETS | $ | 28,928,795 | $ | 159,199,477 | $ | 520,532,132 | ||||||
|
|
|
|
|
| |||||||
Net assets consist of: | ||||||||||||
Paid-in capital | $ | 30,725,130 | $ | 186,687,598 | $ | 622,762,768 | ||||||
Undistributed net investment income/(accumulated net investment loss) | 102,659 | 769,263 | (5,199 | ) | ||||||||
Accumulated net realized loss | (383,764 | ) | (15,866,622 | ) | (13,100,259 | ) | ||||||
Net unrealized depreciation | (1,515,230 | ) | (12,390,762 | ) | (89,125,178 | ) | ||||||
|
|
|
|
|
| |||||||
NET ASSETS | $ | 28,928,795 | $ | 159,199,477 | $ | 520,532,132 | ||||||
|
|
|
|
|
| |||||||
Shares outstandingc | 600,000 | 3,400,000 | 12,600,000 | |||||||||
|
|
|
|
|
| |||||||
Net asset value per share | $ | 48.21 | $ | 46.82 | $ | 41.31 | ||||||
|
|
|
|
|
| |||||||
| a | Securities on loan with values of $564,146, $ — and $ —, respectively. See Note 1. |
| b | Cost of foreign currency: $ —, $ — and $27,156,215, respectively. |
| c | $0.001 par value, number of shares authorized: 500 million, 500 million and 500 million, respectively. |
See notes to financial statements.
| 56 | 2015 iSHARES ANNUAL REPORTTO SHAREHOLDERS |
Table of Contents
Statements of Assets and Liabilities (Continued)
iSHARES®, INC.
October 31, 2015
iShares Global High Yield Corporate Bond ETF | ||||
ASSETS | ||||
Investments, at cost: | ||||
Unaffiliated | $ | 122,071,558 | ||
Affiliated (Note 2) | 18,381,089 | |||
|
| |||
Total cost of investments | $ | 140,452,647 | ||
|
| |||
Investments in securities, at fair value (including securities on loana) (Note 1): | ||||
Unaffiliated | $ | 115,271,227 | ||
Affiliated (Note 2) | 18,381,089 | |||
|
| |||
Total fair value of investments | 133,652,316 | |||
Foreign currency, at valueb | 1,820,686 | |||
Cash | 499 | |||
Receivables: | ||||
Investment securities sold | 253,123 | |||
Due from custodian (Note 4) | 737,908 | |||
Interest | 2,010,630 | |||
Tax reclaims | 6,468 | |||
|
| |||
Total Assets | 138,481,630 | |||
|
| |||
LIABILITIES | ||||
Payables: | ||||
Investment securities purchased | 2,174,565 | |||
Collateral for securities on loan (Note 1) | 17,341,005 | |||
Investment advisory fees (Note 2) | 35,056 | |||
|
| |||
Total Liabilities | 19,550,626 | |||
|
| |||
NET ASSETS | $ | 118,931,004 | ||
|
| |||
Net assets consist of: | ||||
Paid-in capital | $ | 126,659,471 | ||
Undistributed net investment income | 208,120 | |||
Accumulated net realized loss | (1,140,207 | ) | ||
Net unrealized depreciation | (6,796,380 | ) | ||
|
| |||
NET ASSETS | $ | 118,931,004 | ||
|
| |||
Shares outstandingc | 2,500,000 | |||
|
| |||
Net asset value per share | $ | 47.57 | ||
|
| |||
| a | Securities on loan with a value of $16,647,650. See Note 1. |
| b | Cost of foreign currency: $1,810,741. |
| c | $0.001 par value, number of shares authorized: 500 million. |
See notes to financial statements.
FINANCIAL STATEMENTS | 57 |
Table of Contents
Statements of Operations
iSHARES® , INC.
Year ended October 31, 2015
iShares Bond ETF | iShares Bond ETF | iShares Emerging Markets Bond ETF | ||||||||||
NET INVESTMENT INCOME | ||||||||||||
Interest — unaffiliateda | $ | 1,425,777 | $ | 13,404,149 | $ | 28,967,932 | ||||||
Interest — affiliated (Note 2) | 43 | 114 | 77 | |||||||||
Securities lending income — affiliated — net (Note 2) | 4,122 | — | — | |||||||||
|
|
|
|
|
| |||||||
| 1,429,942 | 13,404,263 | 28,968,009 | ||||||||||
Less: Other foreign taxes (Note 1) | — | — | (1,038 | ) | ||||||||
|
|
|
|
|
| |||||||
Total investment income | 1,429,942 | 13,404,263 | 28,966,971 | |||||||||
|
|
|
|
|
| |||||||
EXPENSES | ||||||||||||
Investment advisory fees (Note 2) | 151,278 | 1,074,126 | 3,000,002 | |||||||||
|
|
|
|
|
| |||||||
Total expenses | 151,278 | 1,074,126 | 3,000,002 | |||||||||
Less investment advisory fees waived (Note 2) | — | — | (177,866 | ) | ||||||||
|
|
|
|
|
| |||||||
Net expenses | 151,278 | 1,074,126 | 2,822,136 | |||||||||
|
|
|
|
|
| |||||||
Net investment income | 1,278,664 | 12,330,137 | 26,144,835 | |||||||||
|
|
|
|
|
| |||||||
NET REALIZED AND UNREALIZED GAIN (LOSS) | ||||||||||||
Net realized gain (loss) from: | ||||||||||||
Investments — unaffiliatedb | (121,410 | ) | (8,655,277 | ) | (59,963,817 | ) | ||||||
In-kind redemptions — unaffiliated | (372,897 | ) | (5,086,092 | ) | (1,741,977 | ) | ||||||
Foreign currency transactions | — | — | (4,502,669 | ) | ||||||||
|
|
|
|
|
| |||||||
Net realized loss | (494,307 | ) | (13,741,369 | ) | (66,208,463 | ) | ||||||
|
|
|
|
|
| |||||||
Net change in unrealized appreciation/depreciation on: | ||||||||||||
Investmentsc | (1,231,916 | ) | (6,790,259 | ) | (49,717,676 | ) | ||||||
Translation of assets and liabilities in foreign currencies | — | — | 396,913 | |||||||||
|
|
|
|
|
| |||||||
Net change in unrealized appreciation/depreciation | (1,231,916 | ) | (6,790,259 | ) | (49,320,763 | ) | ||||||
|
|
|
|
|
| |||||||
Net realized and unrealized loss | (1,726,223 | ) | (20,531,628 | ) | (115,529,226 | ) | ||||||
|
|
|
|
|
| |||||||
NET DECREASE IN NET ASSETS RESULTING FROM OPERATIONS | $ | (447,559 | ) | $ | (8,201,491 | ) | $ | (89,384,391 | ) | |||
|
|
|
|
|
| |||||||
| a | Net of foreign withholding tax of $ —, $ — and $1,155,215, respectively. |
| b | Net of foreign capital gains taxes of $ —, $3,607 and $432,669, respectively. |
| c | Net of deferred foreign capital gains taxes of $35, $1,505 and $904,814, respectively. |
See notes to financial statements.
| 58 | 2015 iSHARES ANNUAL REPORTTO SHAREHOLDERS |
Table of Contents
Statements of Operations (Continued)
iSHARES®, INC.
Year ended October 31, 2015
iShares Global High | ||||
NET INVESTMENT INCOME | ||||
Interest — unaffiliated | $ | 5,167,696 | ||
Interest — affiliated (Note 2) | 95 | |||
Securities lending income — affiliated — net (Note 2) | 58,455 | |||
|
| |||
Total investment income | 5,226,246 | |||
|
| |||
EXPENSES | ||||
Investment advisory fees (Note 2) | 514,769 | |||
|
| |||
Total expenses | 514,769 | |||
Less investment advisory fees waived (Note 2) | (140,390 | ) | ||
|
| |||
Net expenses | 374,379 | |||
|
| |||
Net investment income | 4,851,867 | |||
|
| |||
NET REALIZED AND UNREALIZED GAIN (LOSS) | ||||
Net realized gain (loss) from: | ||||
Investments — unaffiliated | (1,785,187 | ) | ||
In-kind redemptions — unaffiliated | (1,421,358 | ) | ||
Foreign currency transactions | (181,127 | ) | ||
|
| |||
Net realized loss | (3,387,672 | ) | ||
|
| |||
Net change in unrealized appreciation/depreciation on: | ||||
Investments | (6,158,114 | ) | ||
Translation of assets and liabilities in foreign currencies | 36,479 | |||
|
| |||
Net change in unrealized appreciation/depreciation | (6,121,635 | ) | ||
|
| |||
Net realized and unrealized loss | (9,509,307 | ) | ||
|
| |||
NET DECREASE IN NET ASSETS RESULTING FROM OPERATIONS | $ | (4,657,440 | ) | |
|
| |||
See notes to financial statements.
FINANCIAL STATEMENTS | 59 |
Table of Contents
Statements of Changes in Net Assets
iSHARES® , INC.
| iShares Emerging Markets Corporate Bond ETF | iShares Emerging Markets High Yield Bond ETF | |||||||||||||||
Year ended October 31, 2015 | Year ended October 31, 2014 | Year ended October 31, 2015 | Year ended October 31, 2014 | |||||||||||||
INCREASE (DECREASE) IN NET ASSETS | ||||||||||||||||
OPERATIONS: | ||||||||||||||||
Net investment income | $ | 1,278,664 | $ | 1,023,917 | $ | 12,330,137 | $ | 11,257,973 | ||||||||
Net realized loss | (494,307 | ) | (469,536 | ) | (13,741,369 | ) | (2,999,444 | ) | ||||||||
Net change in unrealized appreciation/depreciation | (1,231,916 | ) | 704,330 | (6,790,259 | ) | 2,317,391 | ||||||||||
|
|
|
|
|
|
|
| |||||||||
Net increase (decrease) in net assets resulting from operations | (447,559 | ) | 1,258,711 | (8,201,491 | ) | 10,575,920 | ||||||||||
|
|
|
|
|
|
|
| |||||||||
DISTRIBUTIONS TO SHAREHOLDERS: | ||||||||||||||||
From net investment income | (1,251,781 | ) | (1,055,015 | ) | (12,543,243 | ) | (11,283,625 | ) | ||||||||
|
|
|
|
|
|
|
| |||||||||
Total distributions to shareholders | (1,251,781 | ) | (1,055,015 | ) | (12,543,243 | ) | (11,283,625 | ) | ||||||||
|
|
|
|
|
|
|
| |||||||||
CAPITAL SHARE TRANSACTIONS: | ||||||||||||||||
Proceeds from shares sold | 14,833,589 | 10,244,305 | 93,299,391 | 20,746,273 | ||||||||||||
Cost of shares redeemed | (9,796,578 | ) | (20,194,665 | ) | (112,360,271 | ) | (24,637,402 | ) | ||||||||
|
|
|
|
|
|
|
| |||||||||
Net increase (decrease) in net assets from capital share transactions | 5,037,011 | (9,950,360 | ) | (19,060,880 | ) | (3,891,129 | ) | |||||||||
|
|
|
|
|
|
|
| |||||||||
INCREASE (DECREASE) IN NET ASSETS | 3,337,671 | (9,746,664 | ) | (39,805,614 | ) | (4,598,834 | ) | |||||||||
NET ASSETS | ||||||||||||||||
Beginning of year | 25,591,124 | 35,337,788 | 199,005,091 | 203,603,925 | ||||||||||||
|
|
|
|
|
|
|
| |||||||||
End of year | $ | 28,928,795 | $ | 25,591,124 | $ | 159,199,477 | $ | 199,005,091 | ||||||||
|
|
|
|
|
|
|
| |||||||||
Undistributed net investment income included in net assets at end of year | $ | 102,659 | $ | 75,776 | $ | 769,263 | $ | 985,976 | ||||||||
|
|
|
|
|
|
|
| |||||||||
SHARES ISSUED AND REDEEMED | ||||||||||||||||
Shares sold | 300,000 | 200,000 | 1,900,000 | 400,000 | ||||||||||||
Shares redeemed | (200,000 | ) | (400,000 | ) | (2,400,000 | ) | (500,000 | ) | ||||||||
|
|
|
|
|
|
|
| |||||||||
Net increase (decrease) in shares outstanding | 100,000 | (200,000 | ) | (500,000 | ) | (100,000 | ) | |||||||||
|
|
|
|
|
|
|
| |||||||||
See notes to financial statements.
| 60 | 2015 iSHARES ANNUAL REPORTTO SHAREHOLDERS |
Table of Contents
Statements of Changes in Net Assets (Continued)
iSHARES®, INC.
| iShares Emerging Markets Local Currency Bond ETF | iShares Global High Yield Corporate Bond ETF | |||||||||||||||
Year ended October 31, 2015 | Year ended October 31, 2014 | Year ended October 31, 2015 | Year ended October 31, 2014 | |||||||||||||
INCREASE (DECREASE) IN NET ASSETS | ||||||||||||||||
OPERATIONS: | ||||||||||||||||
Net investment income | $ | 26,144,835 | $ | 27,019,142 | $ | 4,851,867 | $ | 4,983,353 | ||||||||
Net realized gain (loss) | (66,208,463 | ) | (13,178,352 | ) | (3,387,672 | ) | 212,659 | |||||||||
Net change in unrealized appreciation/depreciation | (49,320,763 | ) | (23,280,344 | ) | (6,121,635 | ) | (3,142,613 | ) | ||||||||
|
|
|
|
|
|
|
| |||||||||
Net increase (decrease) in net assets resulting from operations | (89,384,391 | ) | (9,439,554 | ) | (4,657,440 | ) | 2,053,399 | |||||||||
|
|
|
|
|
|
|
| |||||||||
DISTRIBUTIONS TO SHAREHOLDERS: | ||||||||||||||||
From net investment income | — | (15,780,076 | ) | (4,184,901 | ) | (5,236,812 | ) | |||||||||
Return of capital | (7,292,193 | ) | (318,883 | ) | — | — | ||||||||||
|
|
|
|
|
|
|
| |||||||||
Total distributions to shareholders | (7,292,193 | ) | (16,098,959 | ) | (4,184,901 | ) | (5,236,812 | ) | ||||||||
|
|
|
|
|
|
|
| |||||||||
CAPITAL SHARE TRANSACTIONS: | ||||||||||||||||
Proceeds from shares sold | 190,126,828 | 20,287,350 | 53,329,370 | 37,550,657 | ||||||||||||
Cost of shares redeemed | (157,774,832 | ) | (48,233,688 | ) | (29,558,374 | ) | (5,258,227 | ) | ||||||||
|
|
|
|
|
|
|
| |||||||||
Net increase (decrease) in net assets from capital share transactions | 32,351,996 | (27,946,338 | ) | 23,770,996 | 32,292,430 | |||||||||||
|
|
|
|
|
|
|
| |||||||||
INCREASE (DECREASE) IN NET ASSETS | (64,324,588 | ) | (53,484,851 | ) | 14,928,655 | 29,109,017 | ||||||||||
NET ASSETS | ||||||||||||||||
Beginning of year | 584,856,720 | 638,341,571 | 104,002,349 | 74,893,332 | ||||||||||||
|
|
|
|
|
|
|
| |||||||||
End of year | $ | 520,532,132 | $ | 584,856,720 | $ | 118,931,004 | $ | 104,002,349 | ||||||||
|
|
|
|
|
|
|
| |||||||||
Undistributed net investment income/(accumulated net investment loss) included in net assets at end of year | $ | (5,199 | ) | $ | — | $ | 208,120 | $ | 378,942 | |||||||
|
|
|
|
|
|
|
| |||||||||
SHARES ISSUED AND REDEEMED | ||||||||||||||||
Shares sold | 4,200,000 | 400,000 | 1,100,000 | 700,000 | ||||||||||||
Shares redeemed | (3,600,000 | ) | (1,000,000 | ) | (600,000 | ) | (100,000 | ) | ||||||||
|
|
|
|
|
|
|
| |||||||||
Net increase (decrease) in shares outstanding | 600,000 | (600,000 | ) | 500,000 | 600,000 | |||||||||||
|
|
|
|
|
|
|
| |||||||||
See notes to financial statements.
FINANCIAL STATEMENTS | 61 |
Table of Contents
iSHARES® , INC.
(For a share outstanding throughout each period)
| iShares Emerging Markets Corporate Bond ETF | ||||||||
| Year ended Oct. 31, 2015 | Year ended Oct. 31, 2014 | Year ended Oct. 31, 2013 | Period from to | |||||||||||||
Net asset value, beginning of period | $ | 51.18 | $ | 50.48 | $ | 52.93 | $ | 50.00 | ||||||||
|
|
|
|
|
|
|
| |||||||||
Income from investment operations: | ||||||||||||||||
Net investment incomeb | 2.19 | 2.01 | 1.92 | 1.07 | ||||||||||||
Net realized and unrealized gain (loss)c | (3.02 | ) | 0.75 | (2.49 | ) | 2.76 | ||||||||||
|
|
|
|
|
|
|
| |||||||||
Total from investment operations | (0.83 | ) | 2.76 | (0.57 | ) | 3.83 | ||||||||||
|
|
|
|
|
|
|
| |||||||||
Less distributions from: | ||||||||||||||||
Net investment income | (2.14 | ) | (2.06 | ) | (1.88 | ) | (0.90 | ) | ||||||||
|
|
|
|
|
|
|
| |||||||||
Total distributions | (2.14 | ) | (2.06 | ) | (1.88 | ) | (0.90 | ) | ||||||||
|
|
|
|
|
|
|
| |||||||||
Net asset value, end of period | $ | 48.21 | $ | 51.18 | $ | 50.48 | $ | 52.93 | ||||||||
|
|
|
|
|
|
|
| |||||||||
Total return | (1.62 | )% | 5.61 | % | (1.07 | )% | 7.75 | %d | ||||||||
|
|
|
|
|
|
|
| |||||||||
Ratios/Supplemental data: | ||||||||||||||||
Net assets, end of period (000s) | $ | 28,929 | $ | 25,591 | $ | 35,338 | $ | 21,170 | ||||||||
Ratio of expenses to average net assetse | 0.53 | % | 0.60 | % | 0.60 | % | 0.60 | % | ||||||||
Ratio of net investment income to average net assetse | 4.47 | % | 3.99 | % | 3.74 | % | 3.87 | % | ||||||||
Portfolio turnover ratef | 11 | % | 20 | % | 33 | % | 29 | % | ||||||||
| a | Commencement of operations. |
| b | Based on average shares outstanding throughout each period. |
| c | The amounts reported for a share outstanding may not accord with the change in aggregate gains and losses in securities for the fiscal period due to the timing of capital share transactions in relation to the fluctuating market values of the Fund’s underlying securities. |
| d | Not annualized. |
| e | Annualized for periods of less than one year. |
| f | Portfolio turnover rates exclude portfolio securities received or delivered as a result of processing capital share transactions in Creation Units. |
See notes to financial statements.
| 62 | 2015 iSHARES ANNUAL REPORTTO SHAREHOLDERS |
Table of Contents
Financial Highlights (Continued)
iSHARES®, INC.
(For a share outstanding throughout each period)
| iShares Emerging Markets High Yield Bond ETF | ||||||||
| Year ended Oct. 31, 2015 | Year ended Oct. 31, 2014 | Year ended Oct. 31, 2013 | Period from to | |||||||||||||
Net asset value, beginning of period | $ | 51.03 | $ | 50.90 | $ | 53.62 | $ | 50.02 | ||||||||
|
|
|
|
|
|
|
| |||||||||
Income from investment operations: | ||||||||||||||||
Net investment incomeb | 2.99 | 2.93 | 2.97 | 1.60 | ||||||||||||
Net realized and unrealized gain (loss)c | (4.11 | ) | 0.15 | (2.91 | ) | 3.40 | ||||||||||
|
|
|
|
|
|
|
| |||||||||
Total from investment operations | (1.12 | ) | 3.08 | 0.06 | 5.00 | |||||||||||
|
|
|
|
|
|
|
| |||||||||
Less distributions from: | ||||||||||||||||
Net investment income | (3.09 | ) | (2.95 | ) | (2.78 | ) | (1.40 | ) | ||||||||
|
|
|
|
|
|
|
| |||||||||
Total distributions | (3.09 | ) | (2.95 | ) | (2.78 | ) | (1.40 | ) | ||||||||
|
|
|
|
|
|
|
| |||||||||
Net asset value, end of period | $ | 46.82 | $ | 51.03 | $ | 50.90 | $ | 53.62 | ||||||||
|
|
|
|
|
|
|
| |||||||||
Total return | (2.13 | )% | 6.24 | % | 0.14 | % | 10.21 | %d | ||||||||
|
|
|
|
|
|
|
| |||||||||
Ratios/Supplemental data: | ||||||||||||||||
Net assets, end of period (000s) | $ | 159,199 | $ | 199,005 | $ | 203,604 | $ | 166,231 | ||||||||
Ratio of expenses to average net assetse | 0.55 | % | 0.65 | % | 0.65 | % | 0.65 | % | ||||||||
Ratio of net investment income to average net assetse | 6.29 | % | 5.78 | % | 5.64 | % | 5.34 | % | ||||||||
Portfolio turnover ratef | 39 | % | 24 | % | 57 | % | 40 | % | ||||||||
| a | Commencement of operations. |
| b | Based on average shares outstanding throughout each period. |
| c | The amounts reported for a share outstanding may not accord with the change in aggregate gains and losses in securities for the fiscal period due to the timing of capital share transactions in relation to the fluctuating market values of the Fund’s underlying securities. |
| d | Not annualized. |
| e | Annualized for periods of less than one year. |
| f | Portfolio turnover rates exclude portfolio securities received or delivered as a result of processing capital share transactions in Creation Units. |
See notes to financial statements.
FINANCIAL HIGHLIGHTS | 63 |
Table of Contents
Financial Highlights (Continued)
iSHARES®, INC.
(For a share outstanding throughout each period)
| iShares Emerging Markets Local Currency Bond ETF | ||||||||
| Year ended Oct. 31, 2015 | Year ended Oct. 31, 2014 | Year ended Oct. 31, 2013 | Year ended Oct. 31, 2012 | Period from to | ||||||||||||||||
Net asset value, beginning of period | $ | 48.74 | $ | 50.66 | $ | 51.94 | $ | 51.13 | $ | 49.85 | ||||||||||
|
|
|
|
|
|
|
|
|
| |||||||||||
Income from investment operations: | ||||||||||||||||||||
Net investment incomeb | 2.03 | 2.26 | 2.07 | 2.31 | 0.02 | |||||||||||||||
Net realized and unrealized gain (loss)c | (8.87 | ) | (2.84 | ) | (1.92 | ) | 0.41 | 1.26 | ||||||||||||
|
|
|
|
|
|
|
|
|
| |||||||||||
Total from investment operations | (6.84 | ) | (0.58 | ) | 0.15 | 2.72 | 1.28 | |||||||||||||
|
|
|
|
|
|
|
|
|
| |||||||||||
Less distributions from: | ||||||||||||||||||||
Net investment income | — | (1.31 | ) | (1.39 | ) | (0.81 | ) | — | ||||||||||||
Return of capital | (0.59 | ) | (0.03 | ) | (0.04 | ) | (1.10 | ) | — | |||||||||||
|
|
|
|
|
|
|
|
|
| |||||||||||
Total distributions | (0.59 | ) | (1.34 | ) | (1.43 | ) | (1.91 | ) | — | |||||||||||
|
|
|
|
|
|
|
|
|
| |||||||||||
Net asset value, end of period | $ | 41.31 | $ | 48.74 | $ | 50.66 | $ | 51.94 | $ | 51.13 | ||||||||||
|
|
|
|
|
|
|
|
|
| |||||||||||
Total return | (13.99 | )%d | (1.14 | )% | 0.28 | % | 5.48 | % | 2.57 | %e | ||||||||||
|
|
|
|
|
|
|
|
|
| |||||||||||
Ratios/Supplemental data: | ||||||||||||||||||||
Net assets, end of period (000s) | $ | 520,532 | $ | 584,857 | $ | 638,342 | $ | 207,753 | $ | 30,681 | ||||||||||
Ratio of expenses to average net assetsf | 0.50 | % | 0.59 | % | 0.60 | % | 0.60 | % | 0.60 | % | ||||||||||
Ratio of expenses to average net assets prior to waived feesf | 0.53 | % | 0.60 | % | n/a | n/a | n/a | |||||||||||||
Ratio of net investment income to average net assetsf | 4.63 | % | 4.56 | % | 4.04 | % | 4.57 | % | 1.21 | % | ||||||||||
Portfolio turnover rateg | 46 | % | 43 | % | 41 | % | 61 | % | 0 | % | ||||||||||
| a | Commencement of operations. |
| b | Based on average shares outstanding throughout each period. |
| c | The amounts reported for a share outstanding may not accord with the change in aggregate gains and losses in securities for the fiscal period due to the timing of capital share transactions in relation to the fluctuating market values of the Fund’s underlying securities. |
| d | The total return disclosed is based on the net asset value (“NAV”) calculated daily for the creation and redemption of shares in the Fund, which may differ from the NAV calculated for financial reporting purposes. Based on the NAV calculated for financial reporting purposes, the total return for the Fund was -14.16%. |
| e | Not annualized. |
| f | Annualized for periods of less than one year. |
| g | Portfolio turnover rates exclude portfolio securities received or delivered in Creation Units but include portfolio transactions that are executed as a result of the Fund processing capital share transactions in Creation Units partially for cash in U.S. dollars. Excluding such cash transactions, the portfolio turnover rates for the years ended October 31, 2015, October 31, 2014, October 31, 2013 and October 30, 2012 were 32%, 36%, 39% and 61%, respectively. See Note 4. |
See notes to financial statements.
| 64 | 2015 iSHARES ANNUAL REPORTTO SHAREHOLDERS |
Table of Contents
Financial Highlights (Continued)
iSHARES®, INC.
(For a share outstanding throughout each period)
| iShares Global High Yield Corporate Bond ETF | ||||||||
| Year ended Oct. 31, 2015 | Year ended Oct. 31, 2014 | Year ended Oct. 31, 2013 | Period from to | |||||||||||||
Net asset value, beginning of period | $ | 52.00 | $ | 53.50 | $ | 51.67 | $ | 50.00 | ||||||||
|
|
|
|
|
|
|
| |||||||||
Income from investment operations: | ||||||||||||||||
Net investment incomeb | 2.56 | 2.84 | 3.05 | 1.82 | ||||||||||||
Net realized and unrealized gain (loss)c | (4.76 | ) | (1.28 | ) | 1.70 | 1.35 | ||||||||||
|
|
|
|
|
|
|
| |||||||||
Total from investment operations | (2.20 | ) | 1.56 | 4.75 | 3.17 | |||||||||||
|
|
|
|
|
|
|
| |||||||||
Less distributions from: | ||||||||||||||||
Net investment income | (2.23 | ) | (3.06 | ) | (2.92 | ) | (1.50 | ) | ||||||||
|
|
|
|
|
|
|
| |||||||||
Total distributions | (2.23 | ) | (3.06 | ) | (2.92 | ) | (1.50 | ) | ||||||||
|
|
|
|
|
|
|
| |||||||||
Net asset value, end of period | $ | 47.57 | $ | 52.00 | $ | 53.50 | $ | 51.67 | ||||||||
|
|
|
|
|
|
|
| |||||||||
Total return | (4.32 | )% | 2.91 | % | 9.50 | % | 6.53 | %d | ||||||||
|
|
|
|
|
|
|
| |||||||||
Ratios/Supplemental data: | ||||||||||||||||
Net assets, end of period (000s) | $ | 118,931 | $ | 104,002 | $ | 74,893 | $ | 36,169 | ||||||||
Ratio of expenses to average net assetse | 0.40 | % | 0.40 | % | 0.40 | % | 0.40 | % | ||||||||
Ratio of expenses to average net assets prior to waived feese | 0.55 | % | 0.55 | % | 0.55 | % | 0.55 | % | ||||||||
Ratio of net investment income to average net assetse | 5.18 | % | 5.31 | % | 5.82 | % | 6.28 | % | ||||||||
Portfolio turnover ratef | 21 | % | 21 | % | 20 | % | 10 | % | ||||||||
| a | Commencement of operations. |
| b | Based on average shares outstanding throughout each period. |
| c | The amounts reported for a share outstanding may not accord with the change in aggregate gains and losses in securities for the fiscal period due to the timing of capital share transactions in relation to the fluctuating market values of the Fund’s underlying securities. |
| d | Not annualized. |
| e | Annualized for periods of less than one year. |
| f | Portfolio turnover rates exclude portfolio securities received or delivered as a result of processing capital share transactions in Creation Units. |
See notes to financial statements.
FINANCIAL HIGHLIGHTS | 65 |
Table of Contents
iSHARES®, INC.
iShares, Inc. (the “Company”) is registered under the Investment Company Act of 1940, as amended (the “1940 Act”), as an open-end management investment company. The Company was incorporated under the laws of the State of Maryland on September 1, 1994 pursuant to Articles of Incorporation as subsequently amended and restated.
These financial statements relate only to the following funds (each, a “Fund,” and collectively, the “Funds”):
| iShares ETF | Diversification Classification | |
Emerging Markets Corporate Bond | Non-diversified | |
Emerging Markets High Yield Bond | Non-diversified | |
Emerging Markets Local Currency Bond | Non-diversified | |
Global High Yield Corporate Bond | Non-diversified |
The investment objective of each Fund is to seek investment results that correspond generally to the price and yield performance, before fees and expenses, of its underlying index. The investment adviser uses a “passive” or index approach to try to achieve each Fund’s investment objective.
Pursuant to the Company’s organizational documents, the Funds’ officers and directors are indemnified against certain liabilities that may arise out of the performance of their duties to the Funds. Additionally, in the normal course of business, the Funds enter into contracts with service providers that contain general indemnification clauses. The Funds’ maximum exposure under these arrangements is unknown as this would involve future claims that may be made against the Funds that have not yet occurred.
| 1. | SIGNIFICANT ACCOUNTING POLICIES |
The following significant accounting policies are consistently followed by the Funds in the preparation of their financial statements in conformity with accounting principles generally accepted in the United States of America (“U.S. GAAP”). The preparation of financial statements in conformity with U.S. GAAP requires management to make certain estimates and assumptions that affect the reported amounts of assets and liabilities and disclosures of contingent assets and liabilities at the date of the financial statements and the reported amounts of revenue and expenses during the reporting period. Actual results could differ from those estimates. Each Fund is considered an investment company under U.S. GAAP and follows the accounting and reporting guidance applicable to investment companies.
SECURITY VALUATION
Each Fund’s investments are valued at fair value each day that the Fund’s listing exchange is open and, for financial reporting purposes, as of the report date should the reporting period end on a day that the Fund’s listing exchange is not open. U.S. GAAP defines fair value as the price a fund would receive to sell an asset or pay to transfer a liability in an orderly transaction between market participants at the measurement date. The BlackRock Global Valuation Methodologies Committee (the “Global Valuation Committee”) provides oversight of the valuation of investments for the Funds. The investments of each Fund are valued pursuant to policies and procedures developed by the Global Valuation Committee and approved by the Board of Directors of the Company (the “Board”).
| • | Fixed income investments are valued at the last available bid price received from independent pricing services. In determining the value of a fixed income investment, pricing services may use certain information with respect to transactions in such investments, quotations from dealers, pricing matrixes, market transactions in comparable investments, various relationships observed in the market between investments, and calculated yield measures. |
| 66 | 2015 iSHARES ANNUAL REPORTTO SHAREHOLDERS |
Table of Contents
Notes to Financial Statements (Continued)
iSHARES®, INC.
| • | Open-end U.S. mutual funds are valued at that day’s published net asset value (“NAV”). |
In the event that application of these methods of valuation results in a price for an investment which is deemed not to be representative of the fair value of such investment or if a price is not available, the investment will be valued based upon other available factors deemed relevant by the Global Valuation Committee, in accordance with policies approved by the Board. These factors include but are not limited to (i) attributes specific to the investment; (ii) the principal market for the investment; (iii) the customary participants in the principal market for the investment; (iv) data assumptions by market participants for the investment, if reasonably available; (v) quoted prices for similar investments in active markets; and (vi) other factors, such as future cash flows, interest rates, yield curves, volatilities, prepayment speeds, loss severities, credit risks and/or default rates. Valuations based on such factors are reported to the Board on a quarterly basis.
The Global Valuation Committee employs various methods for calibrating valuation approaches for investments where an active market does not exist, including regular due diligence of the Company’s pricing vendors, a regular review of key inputs and assumptions, transactional back-testing or disposition analysis to compare unrealized gains and losses to realized gains and losses, reviews of missing or stale prices, reviews of large movements in market values, and reviews of market related activity.
Fair value pricing could result in a difference between the prices used to calculate a Fund’s NAV and the prices used by the Fund’s underlying index, which in turn could result in a difference between the Fund’s performance and the performance of the Fund’s underlying index.
Various inputs are used in determining the fair value of financial instruments. Inputs may be based on independent market data (“observable inputs”) or they may be internally developed (“unobservable inputs”). These inputs are categorized into a disclosure hierarchy consisting of three broad levels for financial reporting purposes. The level of a value determined for a financial instrument within the fair value hierarchy is based on the lowest level of any input that is significant to the fair value measurement in its entirety. The categorization of a value determined for a financial instrument within the hierarchy is based upon the pricing transparency of the instrument and is not necessarily an indication of the risk associated with investing in the instrument. The three levels of the fair value hierarchy are as follows:
| • | Level 1 — Unadjusted quoted prices in active markets for identical assets or liabilities; |
| • | Level 2 — Inputs other than quoted prices included within Level 1 that are observable for the asset or liability either directly or indirectly, including quoted prices for similar assets or liabilities in active markets, quoted prices for identical or similar assets or liabilities in markets that are not considered to be active, inputs other than quoted prices that are observable for the asset or liability (such as exchange rates, financing terms, interest rates, yield curves, volatilities, prepayment speeds, loss severities, credit risks and default rates) or other market-corroborated inputs; and |
| • | Level 3 — Unobservable inputs for the asset or liability, including the Global Valuation Committee’s assumptions used in determining the fair value of investments. |
Changes in valuation techniques may result in transfers in or out of an assigned level within the disclosure hierarchy. In accordance with the Company’s policy, transfers between different levels of the fair value hierarchy are deemed to have occurred as of the beginning of the reporting period.
NOTESTO FINANCIAL STATEMENTS | 67 |
Table of Contents
Notes to Financial Statements (Continued)
iSHARES®, INC.
The following table summarizes the value of each of the Funds’ investments according to the fair value hierarchy as of October 31, 2015. The breakdown of each Fund’s investments into major categories is disclosed in its respective schedule of investments.
| iShares ETF | Level 1 | Level 2 | Level 3 | Total | ||||||||||||
Emerging Markets Corporate Bond | ||||||||||||||||
Investments: | ||||||||||||||||
Assets: | ||||||||||||||||
Corporate Bonds & Notes | $ | — | $ | 27,156,541 | $ | — | $ | 27,156,541 | ||||||||
Foreign Government Obligations | — | 1,195,470 | — | 1,195,470 | ||||||||||||
Money Market Funds | 994,942 | — | — | 994,942 | ||||||||||||
|
|
|
|
|
|
|
| |||||||||
Total | $ | 994,942 | $ | 28,352,011 | $ | — | $ | 29,346,953 | ||||||||
|
|
|
|
|
|
|
| |||||||||
Emerging Markets High Yield Bond | ||||||||||||||||
Investments: | ||||||||||||||||
Assets: | ||||||||||||||||
Corporate Bonds & Notes | $ | — | $ | 69,600,943 | $ | — | $ | 69,600,943 | ||||||||
Foreign Government Obligations | — | 85,231,211 | — | 85,231,211 | ||||||||||||
Money Market Funds | 1,804,380 | — | — | 1,804,380 | ||||||||||||
|
|
|
|
|
|
|
| |||||||||
Total | $ | 1,804,380 | $ | 154,832,154 | $ | — | $ | 156,636,534 | ||||||||
|
|
|
|
|
|
|
| |||||||||
Emerging Markets Local Currency Bond | ||||||||||||||||
Investments: | ||||||||||||||||
Assets: | ||||||||||||||||
Foreign Government Obligations | $ | — | $ | 493,061,872 | $ | — | $ | 493,061,872 | ||||||||
Money Market Funds | 244,291 | — | — | 244,291 | ||||||||||||
|
|
|
|
|
|
|
| |||||||||
Total | $ | 244,291 | $ | 493,061,872 | $ | — | $ | 493,306,163 | ||||||||
|
|
|
|
|
|
|
| |||||||||
Global High Yield Corporate Bond | ||||||||||||||||
Investments: | ||||||||||||||||
Assets: | ||||||||||||||||
Corporate Bonds & Notes | $ | — | $ | 115,271,227 | $ | — | $ | 115,271,227 | ||||||||
Money Market Funds | 18,381,089 | — | — | 18,381,089 | ||||||||||||
|
|
|
|
|
|
|
| |||||||||
Total | $ | 18,381,089 | $ | 115,271,227 | $ | — | $ | 133,652,316 | ||||||||
|
|
|
|
|
|
|
| |||||||||
SECURITY TRANSACTIONS AND INCOME RECOGNITION
Security transactions are accounted for on trade date. Realized gains and losses on investment transactions are determined using the specific identification method. Interest income, including amortization and accretion of premiums and discounts on debt securities, is recognized daily on the accrual basis.
FOREIGN CURRENCY TRANSLATION
The accounting records of the Funds are maintained in U.S. dollars. Foreign currencies, as well as investment securities and other assets and liabilities denominated in foreign currencies, are translated into U.S. dollars using exchange rates deemed appropriate by the investment adviser. Purchases and sales of securities, income receipts and expense payments are translated into U.S. dollars on the respective dates of such transactions.
| 68 | 2015 iSHARES ANNUAL REPORTTO SHAREHOLDERS |
Table of Contents
Notes to Financial Statements (Continued)
iSHARES®, INC.
Each Fund does not isolate the effect of fluctuations in foreign exchange rates from the effect of fluctuations in the market prices of securities. Such fluctuations are reflected by the Funds as a component of realized and unrealized gains and losses from investments for financial reporting purposes.
FOREIGN TAXES
The Funds may be subject to foreign taxes (a portion of which may be reclaimable) on income, stock dividends, capital gains on investments, or certain foreign currency transactions. All foreign taxes are recorded in accordance with the applicable foreign tax regulations and rates that exist in the foreign jurisdictions in which the Funds invest. These foreign taxes, if any, are paid by the Funds and are reflected in their statements of operations as follows: foreign taxes withheld at source are presented as a reduction of income, foreign taxes on securities lending income are presented as a reduction of securities lending income, foreign taxes on stock dividends are presented as “other foreign taxes,” and foreign taxes on capital gains from sales of investments and foreign taxes on foreign currency transactions are included in their respective net realized gain (loss) categories. Foreign taxes payable or deferred as of October 31, 2015, if any, are disclosed in the Funds’ statements of assets and liabilities.
DISTRIBUTIONS TO SHAREHOLDERS
Dividends and distributions paid by each Fund are recorded on the ex-dividend dates. Distributions are determined on a tax basis and may differ from net investment income and net realized capital gains for financial reporting purposes. Dividends and distributions are paid in U.S. dollars and cannot be automatically reinvested in additional shares of the Funds.
LOANS OF PORTFOLIO SECURITIES
Each Fund may lend its investment securities to approved borrowers, such as brokers, dealers and other financial institutions. The borrower pledges and maintains with the Fund collateral consisting of cash, an irrevocable letter of credit issued by a bank, or securities issued or guaranteed by the U.S. government. The initial collateral received by each Fund is required to have a value of at least 102% of the current value of the loaned securities plus the interest accrued on such securities, if any, for securities traded on U.S. exchanges and a value of at least 105% for all other securities. The collateral is maintained thereafter at a value equal to at least 100% of the current value of the securities on loan plus accrued interest, if any. The market value of the loaned securities is determined at the close of each business day of the Funds. Any additional required collateral is delivered to the Funds and any excess collateral is returned by the Funds on the next business day. During the term of the loan, each Fund is entitled to all distributions made on or in respect of the loaned securities. Loans of securities are terminable at any time and the borrower, after notice, is required to return borrowed securities within the standard time period for settlement of securities transactions.
Any cash received as collateral for securities on loan may be reinvested in certain short-term instruments either directly on behalf of a fund or through one or more joint accounts or money market funds, including those managed by BlackRock Fund Advisors (“BFA”), the Funds’ investment adviser, or its affiliates. As of October 31, 2015, any securities on loan were collateralized by cash. The cash collateral received was invested in money market funds managed by BFA and is disclosed in the schedules of investments. The securities on loan for each Fund are also disclosed in its schedule of investments. The total value of any securities on loan as of October 31, 2015 and the total value of the related collateral are disclosed in the statements of assets and liabilities. Income earned by the Funds from securities lending is disclosed in the statements of operations.
The risks of securities lending include the risk that the borrower may not provide additional collateral when required or may not return the securities when due. To mitigate these risks, the Funds benefit from a borrower default indemnity provided by BlackRock, Inc. (“BlackRock”). BlackRock’s indemnity allows for full replacement of securities lent. Each Fund could suffer a loss if the value of the investments purchased with cash collateral falls below the value of the cash collateral received.
NOTESTO FINANCIAL STATEMENTS | 69 |
Table of Contents
Notes to Financial Statements (Continued)
iSHARES®, INC.
Securities lending transactions are entered into by the Funds under Master Securities Lending Agreements (“MSLA”) which provide the right, in the event of default (including bankruptcy or insolvency) for the non-defaulting party to liquidate the collateral and calculate a net exposure to the defaulting party or request additional collateral. In the event that a borrower defaults, a Fund, as lender, would offset the market value of the collateral received against the market value of the securities loaned. The value of the collateral is typically greater than that of the market value of the securities loaned, leaving the lender with a net amount payable to the defaulting party. However, bankruptcy or insolvency laws of a particular jurisdiction may impose restrictions on or prohibitions against such a right of offset in the event of an MSLA counterparty’s bankruptcy or insolvency. Under the MSLA, the borrower can resell or re-pledge the loaned securities, and a Fund can reinvest cash collateral, or, upon an event of default, resell or re-pledge the collateral.
The following table is a summary of each Fund’s securities lending agreements which are subject to offset under an MSLA as of October 31, 2015:
iShares ETF and Counterparty | Market Value of Securities on Loan | Cash Collateral Received a | Net Amount b | |||||||||
Emerging Markets Corporate Bond | ||||||||||||
Barclays Capital Inc. | $ | 181,907 | $ | 181,500 | $ | (407 | ) | |||||
Citigroup Global Markets Inc. | 17,044 | 17,044 | — | |||||||||
JPMorgan Clearing Corp. | 365,195 | 365,195 | — | |||||||||
|
|
|
|
|
| |||||||
| $ | 564,146 | $ | 563,739 | $ | (407 | ) | ||||||
|
|
|
|
|
| |||||||
Global High Yield Corporate Bond | ||||||||||||
Barclays Capital Inc. | $ | 1,848,844 | $ | 1,848,844 | $ | — | ||||||
BNP Paribas Prime Brokerage Inc. | 279,913 | 279,913 | — | |||||||||
Citigroup Global Markets Inc. | 1,538,453 | 1,538,453 | — | |||||||||
Credit Suisse Securities (USA) LLC | 1,382,513 | 1,382,513 | — | |||||||||
Deutsche Bank Securities Inc. | 1,123,810 | 1,123,810 | — | |||||||||
Goldman Sachs & Co. | 1,446,986 | 1,446,986 | — | |||||||||
Jefferies LLC | 330,875 | 330,875 | — | |||||||||
JPMorgan Clearing Corp. | 4,444,660 | 4,444,660 | — | |||||||||
JPMorgan Securities LLC | 1,055,415 | 1,055,415 | — | |||||||||
Merrill Lynch, Pierce, Fenner & Smith | 1,410,380 | 1,410,380 | — | |||||||||
Morgan Stanley & Co. LLC | 1,648,504 | 1,648,504 | — | |||||||||
National Financial Services LLC | 43,172 | 43,172 | — | |||||||||
SG Americas Securities LLC | 49,625 | 49,625 | — | |||||||||
UBS Securities LLC | 44,500 | 44,500 | — | |||||||||
|
|
|
|
|
| |||||||
| $ | 16,647,650 | $ | 16,647,650 | $ | — | |||||||
|
|
|
|
|
| |||||||
| a | Collateral received in excess of the market value of securities on loan is not presented for financial reporting purposes. The total collateral received is disclosed in each Fund’s statement of assets and liabilities. |
| b | Additional collateral is delivered to the Fund on the next business day in accordance with the MSLA. The net amount would be subject to the borrower default indemnity in the event of default by a counterparty. |
| 2. | INVESTMENT ADVISORY AGREEMENT AND OTHER TRANSACTIONS WITH AFFILIATES |
Pursuant to an Investment Advisory Agreement with the Company, BFA manages the investment of each Fund’s assets. BFA is a California corporation indirectly owned by BlackRock. Under the Investment Advisory Agreement, BFA is responsible for substantially all expenses of the Funds, except interest, taxes, brokerage commissions and other expenses connected with the execution of portfolio transactions, distribution fees, litigation expenses and any extraordinary expenses.
| 70 | 2015 iSHARES ANNUAL REPORTTO SHAREHOLDERS |
Table of Contents
Notes to Financial Statements (Continued)
iSHARES®, INC.
BFA has entered into a sub-advisory agreement with BlackRock International Limited, (the “Sub-Adviser”), an affiliate of BFA, under which BFA pays the Sub-Adviser for services it provides to the iShares Emerging Markets Local Currency Bond ETF and iShares Global High Yield Corporate Bond ETF.
Effective March 2, 2015, for its investment advisory services to each of the following Funds, BFA is entitled to an annual investment advisory fee based on the average daily net assets of each Fund as follows:
| iShares ETF | Investment Advisory Fee | |||
Emerging Markets Corporate Bond | 0.50 | % | ||
Emerging Markets High Yield Bond | 0.50 | |||
Prior to March 2, 2015, for its investment advisory services to the iShares Emerging Markets Corporate Bond ETF and iShares Emerging Markets High Yield Bond ETF, BFA was entitled to an annual investment advisory fee of 0.60% and 0.65%, respectively, based on the average daily net assets of each Fund.
Effective March 2, 2015, for its investment advisory services to the iShares Emerging Markets Local Currency Bond ETF, BFA is entitled to an annual investment advisory fee of 0.50% based on the average daily net assets of the Fund. Prior to March 2, 2015, for its investment advisory services to the Fund, BFA was entitled to an annual investment advisory fee of 0.60% based on the average daily net assets of the Fund. For the year ended October 31, 2015, BFA has voluntarily waived a portion of its investment advisory fees for the Fund in the amount of $177,866.
For its investment advisory services to the iShares Global High Yield Corporate Bond ETF, BFA is entitled to an annual investment advisory fee of 0.55% based on the average daily net assets of the Fund. The total of the investment advisory fee and any other fund expenses is a fund’s total annual operating expense. BFA has contractually agreed to waive a portion of its investment advisory fees for the Fund through February 28, 2017 in order to limit total annual operating expenses to 0.40% of average daily net assets.
The U.S. Securities and Exchange Commission has issued an exemptive order which permits BlackRock Institutional Trust Company, N.A. (“BTC”), an affiliate of BFA, to serve as securities lending agent for the Funds, subject to applicable conditions. As securities lending agent, BTC bears all operational costs directly related to securities lending. Each Fund is responsible for fees in connection with the investment of cash collateral received for securities on loan in a money market fund managed by BFA, however, BTC has agreed to reduce the amount of securities lending income it receives in order to effectively limit the collateral investment fees each Fund bears to an annual rate of 0.04% (the “collateral investment fees”). Securities lending income is equal to the total of income earned from the reinvestment of cash collateral, net of fees and other payments to and from borrowers of securities, and less the collateral investment fees. The Funds retain a portion of securities lending income and remit the remaining portion to BTC as compensation for its services as securities lending agent.
Pursuant to a securities lending agreement, each Fund retains 80% of securities lending income and the amount retained can never be less than 70% of the total of securities lending income plus the collateral investment fees. In addition, commencing the business day following the date that the aggregate securities lending income plus the collateral investment fees generated across all 1940 Act iShares exchange-traded funds (the “iShares ETF Complex”) in a given calendar year exceeds the aggregate securities lending income generated across the iShares ETF Complex in the calendar year 2013, each Fund, pursuant to a securities lending agreement, will retain for the remainder of that calendar year 85% of securities lending income and the amount retained can never be less than 70% of the total of securities lending income plus the collateral investment fees.
NOTESTO FINANCIAL STATEMENTS | 71 |
Table of Contents
Notes to Financial Statements (Continued)
iSHARES®, INC.
Prior to January 1, 2015, each Fund retained 75% of securities lending income and the amount retained was never less than 70% of the total of securities lending income plus the collateral investment fees. In addition, commencing the business day following the date that the aggregate securities lending income plus the collateral investment fees generated across the iShares ETF Complex in the calendar year 2014 exceeded the aggregate securities lending income generated across the iShares ETF Complex in the calendar year 2013 and pursuant to a securities lending agreement, each Fund retained for the remainder of the calendar year 2014, 80% of securities lending income and the amount retained was never less than 70% of the total of securities lending income plus the collateral investment fees.
For the year ended October 31, 2015, the total of securities lending agent services and collateral investment fees paid were as follows:
| iShares ETF | Fees Paid to BTC | |||
Emerging Markets Corporate Bond | $ | 1,349 | ||
Global High Yield Corporate Bond | 19,889 | |||
BlackRock Investments, LLC, an affiliate of BFA, is the distributor for each Fund. Pursuant to the distribution agreement, BFA is responsible for any fees or expenses for distribution services provided to the Funds.
Cross trades for the year ended October 31, 2015, if any, were executed by the Funds pursuant to Rule 17a-7 under the 1940 Act. Cross trading is the buying or selling of portfolio securities between funds to which BFA (or an affiliate) serves as investment adviser. At its regularly scheduled quarterly meetings, the Board reviews such transactions as of the most recent calendar quarter for compliance with the requirements and restrictions set forth by Rule 17a-7.
Each Fund may invest its positive cash balances in certain money market funds managed by BFA or an affiliate. The income earned on these temporary cash investments is included in “Interest – affiliated” in the statements of operations.
The PNC Financial Services Group, Inc. is the largest stockholder of BlackRock and is considered to be an affiliate of the Funds for 1940 Act purposes.
Certain directors and officers of the Company are also officers of BTC and/or BFA.
| 3. | INVESTMENT PORTFOLIO TRANSACTIONS |
Purchases and sales of investments (excluding in-kind transactions and short-term investments) for the year ended October 31, 2015 were as follows:
| iShares ETF | Purchases | Sales | ||||||
Emerging Markets Corporate Bond | $ | 8,276,599 | $ | 2,941,653 | ||||
Emerging Markets High Yield Bond | 72,977,027 | 73,658,318 | ||||||
Emerging Markets Local Currency Bond | 286,081,259 | 238,863,803 | ||||||
Global High Yield Corporate Bond | 43,471,343 | 19,692,464 | ||||||
| 72 | 2015 iSHARES ANNUAL REPORTTO SHAREHOLDERS |
Table of Contents
Notes to Financial Statements (Continued)
iSHARES®, INC.
In-kind transactions (see Note 4) for the year ended October 31, 2015 were as follows:
| iShares ETF | In-kind Purchases | In-kind Sales | ||||||
Emerging Markets Corporate Bond | $ | 9,391,809 | $ | 9,391,647 | ||||
Emerging Markets High Yield Bond | 90,462,666 | 108,715,449 | ||||||
Emerging Markets Local Currency Bond | 24,129,586 | 39,355,024 | ||||||
Global High Yield Corporate Bond | 27,715,434 | 27,663,188 | ||||||
| 4. | CAPITAL SHARE TRANSACTIONS |
Capital shares are issued and redeemed by each Fund only in aggregations of a specified number of shares or multiples thereof (“Creation Units”) at NAV. Except when aggregated in Creation Units, shares of each Fund are not redeemable. Transactions in capital shares for each Fund are disclosed in detail in the statements of changes in net assets.
The consideration for the purchase of Creation Units of a fund in the Company generally consists of the in-kind deposit of a designated portfolio of securities and a specified amount of cash. Certain funds in the Company may be offered in Creation Units solely or partially for cash in U.S. dollars. Investors purchasing and redeeming Creation Units may pay a purchase transaction fee and a redemption transaction fee directly to State Street Bank and Trust Company, the Company’s administrator, to offset transfer and other transaction costs associated with the issuance and redemption of Creation Units, including Creation Units for cash. Investors transacting in Creation Units for cash may also pay an additional variable charge to compensate the relevant fund for certain transaction costs (i.e., stamp taxes, taxes on currency or other financial transactions, and brokerage costs) and market impact expenses relating to investing in portfolio securities. Such variable charges, if any, are included in “Proceeds from shares sold” in the statements of changes in net assets.
From time to time, settlement of securities related to in-kind contributions or in-kind redemptions may be delayed. In such cases, securities related to in-kind contributions are reflected as “Due from custodian” and securities related to in-kind redemptions are reflected as “Securities related to in-kind transactions” in the statements of assets and liabilities.
| 5. | PRINCIPAL RISKS |
In the normal course of business, each Fund’s investment activities expose it to various types of risk associated with the financial instruments and markets in which it invests. The significant types of financial risks each Fund is exposed to include market risk and credit risk. Each Fund’s prospectus provides details of these and other types of risk.
BFA uses a “passive” or index approach to try to achieve each Fund’s investment objective following the securities included in its underlying index during upturns as well as downturns. BFA does not take steps to reduce market exposure or to lessen the effects of a declining market. Divergence from the underlying index and the composition of the portfolio is monitored by BFA.
MARKET RISK
Market risk arises mainly from uncertainty about future values of financial instruments influenced by price, currency and interest rate movements. It represents the potential loss each Fund may suffer through holding market positions in the face of market movements. Each Fund is exposed to market risk by virtue of its investment in fixed income instruments. The fair value of securities held by the Funds may decline due to general market conditions, economic trends or events that are not specifically
NOTESTO FINANCIAL STATEMENTS | 73 |
Table of Contents
Notes to Financial Statements (Continued)
iSHARES®, INC.
related to the issuers of the securities including local, regional or global political, social or economic instability or to factors that affect a particular industry or group of industries. The extent of each Fund’s exposure to market risk is the market value of the investments held as shown in the Fund’s schedule of investments.
A diversified portfolio, where this is appropriate and consistent with a fund’s objectives, minimizes the risk that a price change of a particular investment will have a material impact on the NAV of a fund. The investment concentrations within each Fund’s portfolio are disclosed in its schedule of investments.
Each Fund invests a substantial amount of its assets in securities of non-U.S. issuers that trade in non-U.S. markets. This involves certain considerations and risks not typically associated with securities of U.S. issuers. Such risks include, but are not limited to: generally less liquid and less efficient securities markets; generally greater price volatility; exchange rate fluctuations and exchange controls; imposition of restrictions on the expatriation of funds or other assets of the Fund; less publicly available information about issuers; the imposition of withholding or other taxes; higher transaction and custody costs; settlement delays and risk of loss attendant in settlement procedures; difficulties in enforcing contractual obligations; less regulation of securities markets; different accounting, disclosure and reporting requirements; more substantial governmental involvement in the economy; higher inflation rates; greater social, economic and political uncertainties; the risk of nationalization or expropriation of assets; and the risk of war. These risks are heightened for investments in issuers from countries with less developed markets.
The United States and the European Union, along with the regulatory bodies of a number of countries including Japan, Australia and Canada (collectively, “Sanctioning Bodies”), have imposed sectorial economic sanctions on certain Russian individuals and Russian corporate entities which include prohibitions on transacting in or dealing in new debt of longer than 30 or 90 days maturity or new equity of such issuers. Securities held by the iShares Emerging Markets Corporate Bond ETF, iShares Emerging Markets High Yield Bond ETF and iShares Emerging Markets Local Currency Bond ETF issued prior to the date of the sanctions being imposed are not currently subject to any restrictions under the sanctions. However, compliance with each of these sanctions may impair the ability of a Fund to buy, sell, hold, receive or deliver the affected securities or other securities of such issuers. The Sanctioning Bodies could also institute broader sanctions on Russia. These sanctions, or even the threat of further sanctions, may result in the decline of the value and liquidity of Russian securities, a weakening of the ruble or other adverse consequences to the Russian economy. Current or future sanctions may result in Russia taking counter measures or retaliatory actions, which may further impair the value and liquidity of Russian securities. These retaliatory measures may include the immediate freeze of Russian assets held by a Fund.
Each Fund invests a substantial amount of its assets in fixed-income securities. Changes in market interest rates or economic conditions may affect the value and/or liquidity of such investments. Interest rate risk is the risk that prices of bonds and other fixed-income securities will decrease as interest rates rise and increase as interest rates fall. Securities with longer durations tend to be more sensitive to interest rate changes, usually making them more volatile than securities with shorter durations. Given the environment of historically low interest rates, each Fund may be subject to a greater risk of price losses if interest rates rise.
CREDIT RISK
Credit risk is the risk that an issuer or guarantor of debt instruments or the counterparty to a financial transaction, including derivatives contracts, repurchase agreements or loans of portfolio securities, is unable or unwilling to make timely interest and/or principal payments or to otherwise honor its obligations. BFA and its affiliates manage counterparty credit risk by entering into transactions only with counterparties that they believe have the financial resources to honor their obligations and by monitoring the financial stability of those counterparties. Financial assets, which potentially expose the Funds to issuer and counterparty credit risks, consist principally of financial instruments and receivables due from counterparties. The extent of each Fund’s exposure to credit and counterparty risks with respect to those financial assets is approximated by their value recorded in its statement of assets and liabilities.
| 74 | 2015 iSHARES ANNUAL REPORTTO SHAREHOLDERS |
Table of Contents
Notes to Financial Statements (Continued)
iSHARES®, INC.
The iShares Emerging Markets Corporate Bond ETF, iShares Emerging Markets High Yield Bond ETF and iShares Global High Yield Corporate Bond ETF each invests a substantial portion of its assets in high yield securities that are rated below investment-grade (including those bonds rated lower than “BBB-” by Standard & Poor’s Ratings Services and Fitch or “Baa3” by Moody’s), or are unrated which may be more volatile than higher-rated securities of similar maturity. High yield securities may also be subject to greater levels of credit or default risk than higher-rated securities and high yield securities may be less liquid and more difficult to sell at an advantageous time or price or to value than higher-rated securities. In particular, high yield securities are often issued by smaller, less creditworthy companies or by highly leveraged (indebted) companies, which are generally less able than more financially stable companies to make scheduled payments of interest and principal.
| 6. | INCOME TAX INFORMATION |
Each Fund is treated as an entity separate from the Company’s other funds for federal income tax purposes. It is the policy of each Fund to qualify as a regulated investment company by complying with the provisions applicable to regulated investment companies, as defined under Subchapter M of the Internal Revenue Code of 1986, as amended, and to annually distribute substantially all of its ordinary income and any net capital gains (taking into account any capital loss carryforwards) sufficient to relieve it from all, or substantially all, federal income and excise taxes. Accordingly, no provision for federal income taxes is required.
U.S. GAAP requires that certain components of net assets be adjusted to reflect permanent differences between financial and tax reporting. These reclassifications have no effect on net assets or NAV per share. The following permanent differences as of October 31, 2015, attributable to net investment loss, foreign currency transactions and realized gains (losses) from in-kind redemptions, were reclassified to the following accounts:
| iShares ETF | Paid-in Capital | Undistributed Net Investment Income/Distributions in Excess of Net Investment Income | Undistributed Net Realized Gain/Accumulated Net Realized Loss | |||||||||
Emerging Markets Corporate Bond | $ | (372,898 | ) | $ | — | $ | 372,898 | |||||
Emerging Markets High Yield Bond | (6,386,123 | ) | (3,607 | ) | 6,389,730 | |||||||
Emerging Markets Local Currency Bond | (33,369,967 | ) | (26,150,034 | ) | 59,520,001 | |||||||
Global High Yield Corporate Bond | (1,421,357 | ) | (837,788 | ) | 2,259,145 | |||||||
The tax character of distributions paid during the years ended October 31, 2015 and October 31, 2014 was as follows:
| iShares ETF | 2015 | 2014 | ||||||
Emerging Markets Corporate Bond | ||||||||
Ordinary income | $ | 1,251,781 | $ | 1,055,015 | ||||
|
|
|
| |||||
Emerging Markets High Yield Bond | ||||||||
Ordinary income | $ | 12,543,243 | $ | 11,283,625 | ||||
|
|
|
| |||||
Emerging Markets Local Currency Bond | ||||||||
Ordinary income | $ | — | $ | 15,780,076 | ||||
Return of capital | 7,292,193 | 318,883 | ||||||
|
|
|
| |||||
| $ | 7,292,193 | $ | 16,098,959 | |||||
|
|
|
| |||||
Global High Yield Corporate Bond | ||||||||
Ordinary income | $ | 4,184,901 | $ | 5,236,812 | ||||
|
|
|
| |||||
NOTESTO FINANCIAL STATEMENTS | 75 |
Table of Contents
Notes to Financial Statements (Continued)
iSHARES®, INC.
As of October 31, 2015, the tax components of accumulated net earnings (losses) were as follows:
| iShares ETF | Undistributed Ordinary Income | Capital Loss Carryforwards | Net Unrealized Gains (Losses) a | Total | ||||||||||||
Emerging Markets Corporate Bond | $ | 102,659 | $ | (383,519 | ) | $ | (1,515,475 | ) | $ | (1,796,335 | ) | |||||
Emerging Markets High Yield Bond | 943,275 | (15,560,285 | ) | (12,871,111 | ) | (27,488,121 | ) | |||||||||
Emerging Markets Local Currency Bond | — | (8,453,438 | ) | (93,777,198 | ) | (102,230,636 | ) | |||||||||
Global High Yield Corporate Bond | 208,114 | (1,103,598 | ) | (6,832,983 | ) | (7,728,467 | ) | |||||||||
| a | The difference between book-basis and tax-basis unrealized gains (losses) was attributable primarily to the tax deferral of losses on wash sales and interest accruals on defaulted bonds. |
As of October 31, 2015, the following Funds had non-expiring capital loss carryforwards available to offset future realized capital gains as follows:
| iShares ETF | Non- Expiring | |||
Emerging Markets Corporate Bond | $ | 383,519 | ||
Emerging Markets High Yield Bond | 15,560,285 | |||
Emerging Markets Local Currency Bond | 8,453,438 | |||
Global High Yield Corporate Bond | 1,103,598 | |||
As of October 31, 2015, gross unrealized appreciation and gross unrealized depreciation based on cost for federal income tax purposes were as follows:
| iShares ETF | Tax Cost | Gross Unrealized Appreciation | Gross Unrealized Depreciation | Net Unrealized Appreciation (Depreciation) | ||||||||||||
Emerging Markets Corporate Bond | $ | 30,862,393 | $ | 282,328 | $ | (1,797,768 | ) | $ | (1,515,440 | ) | ||||||
Emerging Markets High Yield Bond | 169,332,128 | 2,793,988 | (15,489,582 | ) | (12,695,594 | ) | ||||||||||
Emerging Markets Local Currency Bond | 586,037,170 | 4,261,503 | (96,992,510 | ) | (92,731,007 | ) | ||||||||||
Global High Yield Corporate Bond | 140,489,256 | 902,358 | (7,739,298 | ) | (6,836,940 | ) | ||||||||||
Management has analyzed tax laws and regulations and their application to the Funds as of October 31, 2015, inclusive of the open tax return years, and does not believe there are any uncertain tax positions that require recognition of a tax liability in the Funds’ financial statements.
| 7. | SUBSEQUENT EVENTS |
Management has evaluated the impact of all subsequent events on the Funds through the date the financial statements were available to be issued and has determined that there were no subsequent events requiring adjustment or disclosure in the financial statements.
| 76 | 2015 iSHARES ANNUAL REPORTTO SHAREHOLDERS |
Table of Contents
Report of Independent Registered Public Accounting Firm
To the Shareholders and Board of Directors of
iShares, Inc.:
In our opinion, the accompanying statements of assets and liabilities, including the schedules of investments, and the related statements of operations and of changes in net assets and the financial highlights present fairly, in all material respects, the financial position of iShares Emerging Markets Corporate Bond ETF, iShares Emerging Markets High Yield Bond ETF, iShares Emerging Markets Local Currency Bond ETF and iShares Global High Yield Corporate Bond ETF (the “Funds”) at October 31, 2015, the results of each of their operations, the changes in each of their net assets and their financial highlights for each of the periods presented, in conformity with accounting principles generally accepted in the United States of America. These financial statements and financial highlights (hereafter referred to as “financial statements”) are the responsibility of the Funds’ management. Our responsibility is to express an opinion on these financial statements based on our audits. We conducted our audits of these financial statements in accordance with the standards of the Public Company Accounting Oversight Board (United States). Those standards require that we plan and perform the audit to obtain reasonable assurance about whether the financial statements are free of material misstatement. An audit includes examining, on a test basis, evidence supporting the amounts and disclosures in the financial statements, assessing the accounting principles used and significant estimates made by management, and evaluating the overall financial statement presentation. We believe that our audits, which included confirmation of securities at October 31, 2015 by correspondence with the custodian, transfer agent and brokers, provide a reasonable basis for our opinion.
PricewaterhouseCoopers LLP
San Francisco, California
December 22, 2015
REPORTOF INDEPENDENT REGISTERED PUBLIC ACCOUNTING FIRM | 77 |
Table of Contents
iSHARES®, INC.
For the fiscal year ended October 31, 2015, the following Funds earned foreign source income and paid foreign taxes which they intend to pass through to its shareholders pursuant to Section 853 of the Internal Revenue Code (the “Code”).
| iShares ETF | Foreign Source Income Earned | Foreign Taxes Paid | ||||||
Emerging Markets Corporate Bond | $ | 1,371,896 | $ | — | ||||
Emerging Markets High Yield Bond | 13,058,825 | — | ||||||
Emerging Markets Local Currency Bond | 30,123,147 | 1,587,884 | ||||||
Under Section 871(k)(1)(C) of the Code, the Funds hereby designate the following maximum amounts as interest-related dividends for the fiscal year ended October 31, 2015.
| iShares ETF | Interest- Related Dividends | |||
Emerging Markets Corporate Bond | $ | 43,877 | ||
Emerging Markets High Yield Bond | 226,700 | |||
Global High Yield Corporate Bond | 2,643,428 | |||
| 78 | 2015 iSHARES ANNUAL REPORTTO SHAREHOLDERS |
Table of Contents
Board Review and Approval of Investment Advisory
Contract
iSHARES® , INC.
I. iShares Emerging Markets Corporate Bond ETF
Under Section 15(c) of the Investment Company Act of 1940 (the “1940 Act”), the Company’s Board of Directors (the “Board”), including a majority of Directors who are not “interested persons” of the Company (as that term is defined in the 1940 Act) (the “Independent Directors”), is required annually to consider and approve the Investment Advisory Contract between the Company and BFA (the “Advisory Contract”) on behalf of the Fund. The Independent Directors requested, and BFA provided, such information as the Independent Directors, with advice from independent counsel, deemed reasonably necessary to evaluate the Advisory Contract. A committee of Independent Directors (the “15(c) Committee”), with independent counsel, met with management on May 1, 2015 and May 6, 2015, to discuss the types of information the Independent Directors required and the manner in which management would organize and present such information. At a meeting held on May 21, 2015, management presented preliminary information to the Board relating to the continuance of the Advisory Contract, and the Board, including the Independent Directors, reviewed and discussed such information at length. The Independent Directors requested from management certain additional information, which management agreed to provide. At a meeting held on June 24-25, 2015, the Board, including the Independent Directors, reviewed the additional information provided by management in response to these requests. After extensive discussions, the Board, including all of the Independent Directors, approved the continuance of the Advisory Contract for the Fund, based on a review of qualitative and quantitative information provided by BFA, including the additional information management provided at the request of the Independent Directors. The Board noted its satisfaction with the extent and quality of information provided and its frequent interactions with management, as well as the detailed responses and other information provided by BFA. The Board also noted that the Board and BFA agreed to discuss potential enhancements and adjustments to the 15(c) process for the coming year. The Independent Directors were advised by their independent counsel throughout the process, including about the legal standards applicable to their review. In approving the Advisory Contract for the Fund, the Board, including the Independent Directors, considered the following factors, no one of which was controlling, and reached the following conclusions:
Expenses and Performance of the Fund — The Board reviewed statistical information prepared by Lipper Inc. (“Lipper”), an independent provider of investment company data, regarding the expense ratio components, including actual advisory fees, waivers/reimbursements, and gross and net total expenses of the Fund in comparison with the same information for other exchange traded funds (including, where applicable, funds sponsored by an “at cost” service provider) and, in the limited instances where no comparable ETFs existed and the comparison group would not otherwise be reasonable in Lipper’s judgment, pure index institutional mutual funds, objectively selected by Lipper as comprising the Fund’s applicable peer group pursuant to Lipper’s proprietary ETF methodology (the “Lipper Group”). The Board was provided with a detailed description of Lipper’s proprietary ETF methodology used by Lipper to determine the Fund’s Lipper Group. The Board further noted that due to the limitations in providing comparable funds in the Lipper Group, the statistical information provided in Lipper’s report may or may not provide meaningful direct comparisons to the Fund in all instances.
The Board also noted that the investment advisory fee rate and overall expenses (net of waivers and reimbursements) for the Fund were higher than the median of the investment advisory fee rates and overall expenses (net of waivers and reimbursements) of the funds in its Lipper Group, and in the 5th quintile. The Board further noted that it had previously approved, effective March 2, 2015, the permanent reduction in the Fund’s investment advisory fee rate from 60 basis points to 50 basis points, which was not reflected in the Lipper data.
In addition, the Board reviewed statistical information prepared by Lipper regarding the performance of the Fund for the one-, three-, five-, ten-year, and since inception periods, as applicable, and the “last quarter” period ended December 31, 2014, and a comparison of the Fund’s performance to its performance benchmark index for the same periods. To the extent that any of the comparison funds included in the Lipper Group track the same index as the Fund, Lipper also provided, and the Board reviewed, a comparison of the Fund’s performance to that of such relevant comparison funds for the same periods. The Board noted that
BOARD REVIEW AND APPROVAL OF INVESTMENT ADVISORY CONTRACT | 79 |
Table of Contents
Board Review and Approval of Investment Advisory
Contract (Continued)
iSHARES®, INC.
the Fund generally performed in line with its performance benchmark index over the relevant periods. In considering this information, the Board noted that the Lipper Group may include funds that have a different investment objective and/or benchmark from the Fund. In addition, the Board noted that the Fund seeks to track its own benchmark index and that, during the prior year, the Board received periodic reports on the Fund’s performance in comparison with its benchmark index. Such periodic comparative performance information, including detailed information on certain specific iShares funds requested by the Boards, was also considered.
Based on this review, the other factors considered at the meeting, and their general knowledge of ETF pricing, the Board concluded that the investment advisory fee rate and expense level and the historical performance of the Fund supported the Board’s approval of the continuance of the Advisory Contract for the coming year.
Nature, Extent and Quality of Services Provided by BFA — Based on management’s representations, including information about recent and proposed enhancements to the iShares business, including with respect to shareholder servicing and support, the Board expected that there would be no diminution in the scope of services required of or provided by BFA under the Advisory Contract for the coming year as compared to the scope of services provided by BFA during prior years. In reviewing the scope of these services, the Board considered BFA’s investment philosophy and experience, noting that BFA and its affiliates have committed significant resources over time, including during the past year, to supporting the iShares funds and their shareholders. The Board acknowledged that resources to support the iShares funds and their shareholders have been added or enhanced in recent years. The Board also considered BFA’s compliance program and its compliance record with respect to the Fund. In that regard, the Board noted that BFA reports to the Board about portfolio management and compliance matters on a periodic basis in connection with regularly scheduled meetings of the Board, and on other occasions as necessary and appropriate, and has provided information and made appropriate officers available as needed to provide further assistance with these matters. The Board also reviewed the background and experience of the persons responsible for the day-to-day management of the Fund, as well as the resources available to them in managing the Fund. In addition to the above considerations, the Board reviewed and considered detailed presentations regarding BFA’s investment performance, investment and risk management processes and strategies provided at the June 24-25, 2015 meeting and throughout the previous year, and matters related to BFA’s portfolio compliance policies and procedures. The Board noted that the Fund had met its investment objective consistently since its inception date.
Based on review of this information, and the performance information discussed above, the Board concluded that the nature, extent and quality of services provided by BFA to the Fund under the Advisory Contract supported the Board’s approval of the continuance of the Advisory Contract for the coming year.
Costs of Services Provided to the Fund and Profits Realized by BFA and Affiliates — The Board reviewed information about the profitability to BlackRock of the Fund based on the fees payable to BFA and its affiliates (including fees under the Advisory Contract), and all other sources of revenue and expense to BFA and its affiliates from the Fund’s operations for the last calendar year. The Board reviewed BlackRock’s profitability methodology for the iShares funds, noting that the 15(c) Committee had focused on the methodology and proposed presentation during its meetings. The Board discussed the sources of direct and ancillary revenue with management, including the revenues to BTC from securities lending by the Fund. The Board also discussed BFA’s profit margin as reflected in the Fund’s profitability analysis and reviewed information regarding potential economies of scale (as discussed below). Based on this review, the Board concluded that the profits realized by BFA and its affiliates under the Advisory Contract and from other relationships between the Fund and BFA and/or its affiliates, if any, were within a reasonable range in light of the factors considered.
Economies of Scale — The Board reviewed information regarding potential economies of scale or other efficiencies that may result from increases in the Fund’s assets, noting that the issue of economies of scale had been focused on extensively by the
| 80 | 2015 iSHARES ANNUAL REPORTTO SHAREHOLDERS |
Table of Contents
Board Review and Approval of Investment Advisory
Contract (Continued)
iSHARES®, INC.
15(c) Committee during its meetings and addressed by management. The Board and the 15(c) Committee reviewed information provided by BFA regarding scale benefits shared with the iShares funds through relatively low fee rates established at inception, breakpoints, waivers, or other fee reductions, as well as through additional investment in the iShares business and the provision of improved or additional infrastructure and services to the iShares funds and their shareholders. The Board and the 15(c) Committee received information regarding BlackRock’s historical profitability, including BFA’s and its affiliates’ costs in providing services. The cost information distinguished between fixed and variable costs, and explained how the level of fixed and variable costs, as well as the nature of such costs, may impact the existence or size of scale benefits. The Board noted that the Advisory Contract for the Fund did not provide for any breakpoints in the Fund’s investment advisory fee rate as the assets of the Fund increase. However, the Board noted that should material economies of scale exist in the future, a breakpoint structure for the Fund may be appropriate, and that it would continue to monitor the sharing of economies of scale to determine the appropriateness of adding breakpoints in the future.
Based on this review, as well as the other factors considered at the meeting, the Board, recognizing its responsibility to consider this issue periodically, determined to approve the continuance of the Advisory Contract for the coming year.
Fees and Services Provided for Other Comparable Funds/Accounts Managed by BFA and its Affiliates — The Board received and considered information regarding the investment advisory/management fee rates for other funds/accounts in the U.S. for which BFA (or its affiliates) provides investment advisory/management services, including open-end and closed-end funds registered under the 1940 Act (including sub-advised funds), collective trust funds, separately managed accounts, and institutional separate accounts (together, the “Other Accounts”), and acknowledged BFA’s assertion that the iShares funds are fundamentally different investment vehicles from the Other Accounts. The Board noted that BFA and its affiliates do manage Other Accounts with substantially the same investment objective and strategy as the Fund or that track the same index or a similar index as the Fund. The Board further noted that BFA provided the Board with detailed information regarding how the Other Accounts (particularly institutional clients) generally differ from the Fund, including in terms of the different, generally more extensive services provided to the Fund, as well as other significant differences in the approach of BFA and its affiliates to the Fund, on one hand, and Other Accounts, on the other. In that regard, the Board considered that the pricing of services to institutional clients is typically based on a number of factors beyond the nature and extent of the specific services to be provided and often depends on the overall relationship between the client and its affiliates and the adviser and its affiliates. In addition, the Board considered the relative complexity and inherent risks and challenges of managing and providing other services to the Fund, as a publicly traded exchange traded fund, as compared to the Other Accounts that are institutional clients in light of differing regulatory requirements and client-imposed mandates. The Board also considered the “all-inclusive” nature of the Fund’s advisory fee structure, and the Fund expenses borne by BFA under this arrangement. The Board noted that the investment advisory fee rate under the Advisory Contract for the Fund was generally higher than the investment advisory/management fee rates for the Other Accounts that are institutional clients of BFA (or its affiliates) and concluded that the differences appeared to be consistent with the factors discussed.
Other Benefits to BFA and/or its Affiliates — The Board reviewed the “fallout” benefits or ancillary revenue received by BFA and/or its affiliates in connection with the services provided to the Fund by BFA, such as payment of revenue to BTC, the Fund’s securities lending agent, for loaning portfolio securities (which was included in the profit margins reviewed by the Board pursuant to BFA’s profitability methodology), and payment of advisory fees and/or administration fees to BFA and BTC (or their affiliates) in connection with any investments by the Fund in other funds for which BFA (or its affiliates) provides investment advisory services and/or administration services. The Board noted that BFA generally does not use soft dollars or consider the value of research or other services that may be provided to BFA (including its affiliates) in selecting brokers for portfolio transactions for the Fund. The Board further noted that any portfolio transactions on behalf of the Fund placed through a BFA affiliate or purchased from an underwriting syndicate in which a BFA affiliate participates, are reported to the Board pursuant to Rule 17e-1 or Rule 10f-3, as
BOARD REVIEW AND APPROVAL OF INVESTMENT ADVISORY CONTRACT | 81 |
Table of Contents
Board Review and Approval of Investment Advisory
Contract (Continued)
iSHARES®, INC.
applicable, under the 1940 Act. The Board concluded that any such ancillary benefits would not be disadvantageous to the Fund’s shareholders and thus would not alter the Board’s conclusion with respect to the appropriateness of approving the continuance of the Advisory Contract for the coming year.
Based on the considerations described above, the Board determined that the Fund’s investment advisory fee rate under the Advisory Contract does not constitute a fee that is so disproportionately large as to bear no reasonable relationship to the services rendered and that could not have been the product of arm’s-length bargaining, and concluded that it is in the best interest of the Fund and its shareholders to approve the continuance of the Advisory Contract for the coming year.
II. iShares Emerging Markets High Yield Bond ETF
Under Section 15(c) of the Investment Company Act of 1940 (the “1940 Act”), the Company’s Board of Directors (the “Board”), including a majority of Directors who are not “interested persons” of the Company (as that term is defined in the 1940 Act) (the “Independent Directors”), is required annually to consider and approve the Investment Advisory Contract between the Company and BFA (the “Advisory Contract”) on behalf of the Fund. The Independent Directors requested, and BFA provided, such information as the Independent Directors, with advice from independent counsel, deemed reasonably necessary to evaluate the Advisory Contract. A committee of Independent Directors (the “15(c) Committee”), with independent counsel, met with management on May 1, 2015 and May 6, 2015, to discuss the types of information the Independent Directors required and the manner in which management would organize and present such information. At a meeting held on May 21, 2015, management presented preliminary information to the Board relating to the continuance of the Advisory Contract, and the Board, including the Independent Directors, reviewed and discussed such information at length. The Independent Directors requested from management certain additional information, which management agreed to provide. At a meeting held on June 24-25, 2015, the Board, including the Independent Directors, reviewed the additional information provided by management in response to these requests. After extensive discussions, the Board, including all of the Independent Directors, approved the continuance of the Advisory Contract for the Fund, based on a review of qualitative and quantitative information provided by BFA, including the additional information management provided at the request of the Independent Directors. The Board noted its satisfaction with the extent and quality of information provided and its frequent interactions with management, as well as the detailed responses and other information provided by BFA. The Board also noted that the Board and BFA agreed to discuss potential enhancements and adjustments to the 15(c) process for the coming year. The Independent Directors were advised by their independent counsel throughout the process, including about the legal standards applicable to their review. In approving the Advisory Contract for the Fund, the Board, including the Independent Directors, considered the following factors, no one of which was controlling, and reached the following conclusions:
Expenses and Performance of the Fund — The Board reviewed statistical information prepared by Lipper Inc. (“Lipper”), an independent provider of investment company data, regarding the expense ratio components, including actual advisory fees, waivers/reimbursements, and gross and net total expenses of the Fund in comparison with the same information for other exchange traded funds (including, where applicable, funds sponsored by an “at cost” service provider) and, in the limited instances where no comparable ETFs existed and the comparison group would not otherwise be reasonable in Lipper’s judgment, pure index institutional mutual funds, objectively selected by Lipper as comprising the Fund’s applicable peer group pursuant to Lipper’s proprietary ETF methodology (the “Lipper Group”). The Board was provided with a detailed description of Lipper’s proprietary ETF methodology used by Lipper to determine the Fund’s Lipper Group. The Board further noted that due to the limitations in providing comparable funds in the Lipper Group, the statistical information provided in Lipper’s report may or may not provide meaningful direct comparisons to the Fund in all instances.
The Board also noted that the investment advisory fee rate and overall expenses (net of waivers and reimbursements) for the Fund were higher than the median of the investment advisory fee rates and overall expenses (net of waivers and
| 82 | 2015 iSHARES ANNUAL REPORTTO SHAREHOLDERS |
Table of Contents
Board Review and Approval of Investment Advisory
Contract (Continued)
iSHARES®, INC.
reimbursements) of the funds in its Lipper Group, and in the 5th quintile. The Board further noted that it had previously approved, effective March 2, 2015, the permanent reduction in the Fund’s investment advisory fee rate from 65 basis points to 50 basis points, which was not reflected in the Lipper data.
In addition, the Board reviewed statistical information prepared by Lipper regarding the performance of the Fund for the one-, three-, five-, ten-year, and since inception periods, as applicable, and the “last quarter” period ended December 31, 2014, and a comparison of the Fund’s performance to its performance benchmark index for the same periods. To the extent that any of the comparison funds included in the Lipper Group track the same index as the Fund, Lipper also provided, and the Board reviewed, a comparison of the Fund’s performance to that of such relevant comparison funds for the same periods. The Board noted that the Fund generally performed in line with its performance benchmark index over the relevant periods. In considering this information, the Board noted that the Lipper Group may include funds that have a different investment objective and/or benchmark from the Fund. In addition, the Board noted that the Fund seeks to track its own benchmark index and that, during the prior year, the Board received periodic reports on the Fund’s performance in comparison with its benchmark index. Such periodic comparative performance information, including detailed information on certain specific iShares funds requested by the Boards, was also considered.
Based on this review, the other factors considered at the meeting, and their general knowledge of ETF pricing, the Board concluded that the investment advisory fee rate and expense level and the historical performance of the Fund supported the Board’s approval of the continuance of the Advisory Contract for the coming year.
Nature, Extent and Quality of Services Provided by BFA — Based on management’s representations, including information about recent and proposed enhancements to the iShares business, including with respect to shareholder servicing and support, the Board expected that there would be no diminution in the scope of services required of or provided by BFA under the Advisory Contract for the coming year as compared to the scope of services provided by BFA during prior years. In reviewing the scope of these services, the Board considered BFA’s investment philosophy and experience, noting that BFA and its affiliates have committed significant resources over time, including during the past year, to supporting the iShares funds and their shareholders. The Board acknowledged that resources to support the iShares funds and their shareholders have been added or enhanced in recent years. The Board also considered BFA’s compliance program and its compliance record with respect to the Fund. In that regard, the Board noted that BFA reports to the Board about portfolio management and compliance matters on a periodic basis in connection with regularly scheduled meetings of the Board, and on other occasions as necessary and appropriate, and has provided information and made appropriate officers available as needed to provide further assistance with these matters. The Board also reviewed the background and experience of the persons responsible for the day-to-day management of the Fund, as well as the resources available to them in managing the Fund. In addition to the above considerations, the Board reviewed and considered detailed presentations regarding BFA’s investment performance, investment and risk management processes and strategies provided at the June 24-25, 2015 meeting and throughout the previous year, and matters related to BFA’s portfolio compliance policies and procedures. The Board noted that the Fund had met its investment objective consistently since its inception date.
Based on review of this information, and the performance information discussed above, the Board concluded that the nature, extent and quality of services provided by BFA to the Fund under the Advisory Contract supported the Board’s approval of the continuance of the Advisory Contract for the coming year.
Costs of Services Provided to the Fund and Profits Realized by BFA and Affiliates — The Board reviewed information about the profitability to BlackRock of the Fund based on the fees payable to BFA and its affiliates (including fees under the Advisory Contract), and all other sources of revenue and expense to BFA and its affiliates from the Fund’s operations for the last calendar year. The Board reviewed BlackRock’s profitability methodology for the iShares funds, noting that the 15(c) Committee had
BOARD REVIEW AND APPROVAL OF INVESTMENT ADVISORY CONTRACT | 83 |
Table of Contents
Board Review and Approval of Investment Advisory
Contract (Continued)
iSHARES®, INC.
focused on the methodology and proposed presentation during its meetings. The Board discussed the sources of direct and ancillary revenue with management, including the revenues to BTC from securities lending by the Fund. The Board also discussed BFA’s profit margin as reflected in the Fund’s profitability analysis and reviewed information regarding potential economies of scale (as discussed below). Based on this review, the Board concluded that the profits realized by BFA and its affiliates under the Advisory Contract and from other relationships between the Fund and BFA and/or its affiliates, if any, were within a reasonable range in light of the factors considered.
Economies of Scale — The Board reviewed information regarding potential economies of scale or other efficiencies that may result from increases in the Fund’s assets, noting that the issue of economies of scale had been focused on extensively by the 15(c) Committee during its meetings and addressed by management. The Board and the 15(c) Committee reviewed information provided by BFA regarding scale benefits shared with the iShares funds through relatively low fee rates established at inception, breakpoints, waivers, or other fee reductions, as well as through additional investment in the iShares business and the provision of improved or additional infrastructure and services to the iShares funds and their shareholders. The Board and the 15(c) Committee received information regarding BlackRock’s historical profitability, including BFA’s and its affiliates’ costs in providing services. The cost information distinguished between fixed and variable costs, and explained how the level of fixed and variable costs, as well as the nature of such costs, may impact the existence or size of scale benefits. The Board noted that the Advisory Contract for the Fund did not provide for any breakpoints in the Fund’s investment advisory fee rate as the assets of the Fund increase. However, the Board noted that should material economies of scale exist in the future, a breakpoint structure for the Fund may be appropriate, and that it would continue to monitor the sharing of economies of scale to determine the appropriateness of adding breakpoints in the future.
Based on this review, as well as the other factors considered at the meeting, the Board, recognizing its responsibility to consider this issue periodically, determined to approve the continuance of the Advisory Contract for the coming year.
Fees and Services Provided for Other Comparable Funds/Accounts Managed by BFA and its Affiliates — The Board received and considered information regarding the investment advisory/management fee rates for other funds/accounts in the U.S. for which BFA (or its affiliates) provides investment advisory/management services, including open-end and closed-end funds registered under the 1940 Act (including sub-advised funds), collective trust funds, separately managed accounts, and institutional separate accounts (together, the “Other Accounts”), and acknowledged BFA’s assertion that the iShares funds are fundamentally different investment vehicles from the Other Accounts. The Board noted that BFA and its affiliates do not manage Other Accounts with substantially the same investment objective and strategy as the Fund or that track the same index or a similar index as the Fund. The Board further noted that BFA provided the Board with detailed information regarding how the Other Accounts (particularly institutional clients) generally differ from the Fund, including in terms of the different, generally more extensive services provided to the Fund, as well as other significant differences in the approach of BFA and its affiliates to the Fund, on one hand, and Other Accounts, on the other. In that regard, the Board considered that the pricing of services to institutional clients is typically based on a number of factors beyond the nature and extent of the specific services to be provided and often depends on the overall relationship between the client and its affiliates and the adviser and its affiliates. In addition, the Board considered the relative complexity and inherent risks and challenges of managing and providing other services to the Fund, as a publicly traded exchange traded fund, as compared to the Other Accounts that are institutional clients in light of differing regulatory requirements and client-imposed mandates. The Board also considered the “all-inclusive” nature of the Fund’s advisory fee structure, and the Fund expenses borne by BFA under this arrangement. The Board noted that the investment advisory fee rate under the Advisory Contract for the Fund was generally higher than the investment advisory/management fee rates for the Other Accounts that are institutional clients of BFA (or its affiliates) and concluded that the differences appeared to be consistent with the factors discussed.
| 84 | 2015 iSHARES ANNUAL REPORTTO SHAREHOLDERS |
Table of Contents
Board Review and Approval of Investment Advisory
Contract (Continued)
iSHARES®, INC.
Other Benefits to BFA and/or its Affiliates — The Board reviewed the “fallout” benefits or ancillary revenue received by BFA and/or its affiliates in connection with the services provided to the Fund by BFA, such as payment of revenue to BTC, the Fund’s securities lending agent, for loaning portfolio securities (which was included in the profit margins reviewed by the Board pursuant to BFA’s profitability methodology), and payment of advisory fees and/or administration fees to BFA and BTC (or their affiliates) in connection with any investments by the Fund in other funds for which BFA (or its affiliates) provides investment advisory services and/or administration services. The Board noted that BFA generally does not use soft dollars or consider the value of research or other services that may be provided to BFA (including its affiliates) in selecting brokers for portfolio transactions for the Fund. The Board further noted that any portfolio transactions on behalf of the Fund placed through a BFA affiliate or purchased from an underwriting syndicate in which a BFA affiliate participates, are reported to the Board pursuant to Rule 17e-1 or Rule 10f-3, as applicable, under the 1940 Act. The Board concluded that any such ancillary benefits would not be disadvantageous to the Fund’s shareholders and thus would not alter the Board’s conclusion with respect to the appropriateness of approving the continuance of the Advisory Contract for the coming year.
Based on the considerations described above, the Board determined that the Fund’s investment advisory fee rate under the Advisory Contract does not constitute a fee that is so disproportionately large as to bear no reasonable relationship to the services rendered and that could not have been the product of arm’s-length bargaining, and concluded that it is in the best interest of the Fund and its shareholders to approve the continuance of the Advisory Contract for the coming year.
III. iShares Emerging Markets Local Currency Bond ETF
Under Section 15(c) of the Investment Company Act of 1940 (the “1940 Act”), the Company’s Board of Directors (the “Board”), including a majority of Directors who are not “interested persons” of the Company (as that term is defined in the 1940 Act) (the “Independent Directors”), is required annually to consider and approve the Investment Advisory Contract between the Company and BFA (the “Advisory Contract”), and the Sub-Advisory Agreement between BFA and BlackRock International Limited (“BIL”) (the “Sub-Advisory Agreement”), on behalf of the Fund. The Advisory Contract and the Sub-Advisory Agreement are referred to hereafter as the “Advisory Agreements”. The Independent Directors requested, and BFA provided, such information as the Independent Directors, with advice from independent counsel, deemed reasonably necessary to evaluate the Advisory Agreements. A committee of Independent Directors (the “15(c) Committee”), with independent counsel, met with management on May 1, 2015 and May 6, 2015, to discuss the types of information the Independent Directors required and the manner in which management would organize and present such information. At a meeting held on May 21, 2015, management presented preliminary information to the Board relating to the continuance of the Advisory Agreements, and the Board, including the Independent Directors, reviewed and discussed such information at length. The Independent Directors requested from management certain additional information, which management agreed to provide. At a meeting held on June 24-25, 2015, the Board, including the Independent Directors, reviewed the additional information provided by management in response to these requests. After extensive discussions, the Board, including all of the Independent Directors, approved the continuance of the Advisory Agreements for the Fund, based on a review of qualitative and quantitative information provided by BFA, including the additional information management provided at the request of the Independent Directors. The Board noted its satisfaction with the extent and quality of information provided and its frequent interactions with management, as well as the detailed responses and other information provided by BFA. The Board also noted that the Board and BFA agreed to discuss potential enhancements and adjustments to the 15(c) process for the coming year. The Independent Directors were advised by their independent counsel throughout the process, including about the legal standards applicable to their review. In approving the Advisory Agreements for the Fund, the Board, including the Independent Directors, considered the following factors, no one of which was controlling, and reached the following conclusions:
Expenses and Performance of the Fund — The Board reviewed statistical information prepared by Lipper Inc. (“Lipper”), an independent provider of investment company data, regarding the expense ratio components, including actual advisory fees,
BOARD REVIEW AND APPROVAL OF INVESTMENT ADVISORY CONTRACT | 85 |
Table of Contents
Board Review and Approval of Investment Advisory
Contract (Continued)
iSHARES®, INC.
waivers/reimbursements, and gross and net total expenses of the Fund in comparison with the same information for other exchange traded funds (including, where applicable, funds sponsored by an “at cost” service provider) and, in the limited instances where no comparable ETFs existed and the comparison group would not otherwise be reasonable in Lipper’s judgment, pure index institutional mutual funds, objectively selected by Lipper as comprising the Fund’s applicable peer group pursuant to Lipper’s proprietary ETF methodology (the “Lipper Group”). The Board was provided with a detailed description of Lipper’s proprietary ETF methodology used by Lipper to determine the Fund’s Lipper Group. The Board further noted that due to the limitations in providing comparable funds in the Lipper Group, the statistical information provided in Lipper’s report may or may not provide meaningful direct comparisons to the Fund in all instances.
The Board also noted that the investment advisory fee rate and overall expenses (net of waivers and reimbursements) for the Fund were higher than the median of the investment advisory fee rates and overall expenses (net of waivers and reimbursements) of the funds in its Lipper Group. The Board further noted that it had previously approved, effective March 2, 2015, the permanent reduction in the Fund’s investment advisory fee rate from 60 basis points to 50 basis points, which was not reflected in the Lipper data. The Board also noted that BFA pays BIL for its sub-advisory services, and that there are no additional fees imposed on the Fund in respect of the services provided under the Sub-Advisory Agreement.
In addition, the Board reviewed statistical information prepared by Lipper regarding the performance of the Fund for the one-, three-, five-, ten-year, and since inception periods, as applicable, and the “last quarter” period ended December 31, 2014, and a comparison of the Fund’s performance to its performance benchmark index for the same periods. To the extent that any of the comparison funds included in the Lipper Group track the same index as the Fund, Lipper also provided, and the Board reviewed, a comparison of the Fund’s performance to that of such relevant comparison funds for the same periods. The Board noted that the Fund generally performed in line with its performance benchmark index over the relevant periods. In considering this information, the Board noted that the Lipper Group may include funds that have a different investment objective and/or benchmark from the Fund. In addition, the Board noted that the Fund seeks to track its own benchmark index and that, during the prior year, the Board received periodic reports on the Fund’s performance in comparison with its benchmark index. Such periodic comparative performance information, including detailed information on certain specific iShares funds requested by the Boards, was also considered.
Based on this review, the other factors considered at the meeting, and their general knowledge of ETF pricing, the Board concluded that the investment advisory fee rate and expense level and the historical performance of the Fund supported the Board’s approval of the continuance of the Advisory Agreements for the coming year.
Nature, Extent and Quality of Services Provided by BFA and BIL or their Affiliates — Based on management’s representations, including information about recent and proposed enhancements to the iShares business, including with respect to shareholder servicing and support, the Board expected that there would be no diminution in the scope of services required of or provided by BFA (and any services provided by BIL on BFA’s behalf or at BFA’s direction) under the Advisory Agreements for the coming year as compared to the scope of services provided by BFA and BIL during prior years. In reviewing the scope of these services, the Board considered the investment philosophy and experience of BFA and BIL, noting that BFA and its affiliates have committed significant resources over time, including during the past year, to supporting the iShares funds and their shareholders. The Board acknowledged that resources to support the iShares funds and their shareholders have been added or enhanced in recent years. The Board also considered the compliance program of BFA and BIL and their compliance record with respect to the Fund. In that regard, the Board noted that BFA reports to the Board about portfolio management and compliance matters on a periodic basis in connection with regularly scheduled meetings of the Board, and on other occasions as necessary and appropriate, and has provided information and made appropriate officers available as needed to provide further assistance with these matters. The Board also reviewed the background and experience of the persons responsible for the day-to-day management of the Fund, as well as the resources available to them in managing the Fund. In addition to the above
| 86 | 2015 iSHARES ANNUAL REPORTTO SHAREHOLDERS |
Table of Contents
Board Review and Approval of Investment Advisory
Contract (Continued)
iSHARES®, INC.
considerations, the Board reviewed and considered detailed presentations regarding BFA’s investment performance, investment and risk management processes and strategies provided at the June 24-25, 2015 meeting and throughout the previous year, and matters related to BFA’s and BIL’s portfolio compliance policies and procedures, and BFA’s oversight of the services provided by BIL. The Board noted that the Fund had met its investment objective consistently since its inception date.
Based on review of this information, and the performance information discussed above, the Board concluded that the nature, extent and quality of services provided by BFA and BIL to the Fund under the Advisory Agreements supported the Board’s approval of the continuance of the Advisory Agreements for the coming year.
Costs of Services Provided to the Fund and Profits Realized by BFA and its Affiliates — The Board reviewed information about the profitability to BlackRock of the Fund based on the fees payable to BFA and its affiliates (including fees under the Advisory Agreements), and all other sources of revenue and expense to BFA and its affiliates from the Fund’s operations for the last calendar year. The Board reviewed BlackRock’s profitability methodology for the iShares funds, noting that the 15(c) Committee had focused on the methodology and proposed presentation during its meetings. The Board discussed the sources of direct and ancillary revenue with management, including the revenues to BTC from securities lending by the Fund. The Board also discussed BFA’s profit margin as reflected in the Fund’s profitability analysis and reviewed information regarding potential economies of scale (as discussed below). Based on this review, the Board concluded that the profits realized by BFA and its affiliates under the Advisory Agreements and from other relationships between the Fund and BFA and/or its affiliates, if any, were within a reasonable range in light of the factors considered.
Economies of Scale — The Board reviewed information regarding potential economies of scale or other efficiencies that may result from increases in the Fund’s assets, noting that the issue of economies of scale had been focused on extensively by the 15(c) Committee during its meetings and addressed by management. The Board and the 15(c) Committee reviewed information provided by BFA regarding scale benefits shared with the iShares funds through relatively low fee rates established at inception, breakpoints, waivers, or other fee reductions, as well as through additional investment in the iShares business and the provision of improved or additional infrastructure and services to the iShares funds and their shareholders. The Board and the 15(c) Committee received information regarding BlackRock’s historical profitability, including BFA’s and its affiliates’ costs in providing services. The cost information distinguished between fixed and variable costs, and explained how the level of fixed and variable costs, as well as the nature of such costs, may impact the existence or size of scale benefits. The Board noted that the Advisory Contract for the Fund did not provide for any breakpoints in the Fund’s investment advisory fee rate as the assets of the Fund increase. However, the Board noted that should material economies of scale exist in the future, a breakpoint structure for the Fund may be appropriate, and that it would continue to monitor the sharing of economies of scale to determine the appropriateness of adding breakpoints in the future.
Based on this review, as well as the other factors considered at the meeting, the Board, recognizing its responsibility to consider this issue periodically, determined to approve the continuance of the Advisory Agreements for the coming year.
Fees and Services Provided for Other Comparable Funds/Accounts Managed by BFA and its Affiliates — The Board received and considered information regarding the investment advisory/management fee rates for other funds/accounts in the U.S. for which BFA (or its affiliates) provides investment advisory/management services, including open-end and closed-end funds registered under the 1940 Act (including sub-advised funds), collective trust funds, separately managed accounts, and institutional separate accounts (together, the “Other Accounts”), and acknowledged BFA’s assertion that the iShares funds are fundamentally different investment vehicles from the Other Accounts. The Board noted that BFA and its affiliates do manage Other Accounts with substantially the same investment objective and strategy as the Fund or that track the same index or a similar index as the Fund. The Board further noted that BFA provided the Board with detailed information regarding how the Other Accounts (particularly institutional clients) generally differ from the Fund, including in terms of the different, generally more
BOARD REVIEW AND APPROVAL OF INVESTMENT ADVISORY CONTRACT | 87 |
Table of Contents
Board Review and Approval of Investment Advisory
Contract (Continued)
iSHARES®, INC.
extensive services provided to the Fund, as well as other significant differences in the approach of BFA and its affiliates to the Fund, on one hand, and Other Accounts, on the other. In that regard, the Board considered that the pricing of services to institutional clients is typically based on a number of factors beyond the nature and extent of the specific services to be provided and often depends on the overall relationship between the client and its affiliates and the adviser and its affiliates. In addition, the Board considered the relative complexity and inherent risks and challenges of managing and providing other services to the Fund, as a publicly traded exchange traded fund, as compared to the Other Accounts that are institutional clients in light of differing regulatory requirements and client-imposed mandates. The Board also considered the “all-inclusive” nature of the Fund’s advisory fee structure, and the Fund expenses borne by BFA under this arrangement. The Board noted that the investment advisory fee rate under the Advisory Contract for the Fund was generally higher than the investment advisory/management fee rates for the Other Accounts that are institutional clients of BFA (or its affiliates) and concluded that the differences appeared to be consistent with the factors discussed.
Other Benefits to BFA and/or its Affiliates — The Board reviewed the “fallout” benefits or ancillary revenue received by BFA and/or its affiliates in connection with the services provided to the Fund by BFA, such as payment of revenue to BTC, the Fund’s securities lending agent, for loaning portfolio securities (which was included in the profit margins reviewed by the Board pursuant to BFA’s profitability methodology), and payment of advisory fees and/or administration fees to BFA and BTC (or their affiliates) in connection with any investments by the Fund in other funds for which BFA (or its affiliates) provides investment advisory services and/or administration services. The Board noted that BFA and BIL generally do not use soft dollars or consider the value of research or other services that may be provided to BFA and BIL (including their affiliates) in selecting brokers for portfolio transactions for the Fund. The Board further noted that any portfolio transactions on behalf of the Fund placed through a BFA affiliate or purchased from an underwriting syndicate in which a BFA affiliate participates, are reported to the Board pursuant to Rule 17e-1 or Rule 10f-3, as applicable, under the 1940 Act. The Board concluded that any such ancillary benefits would not be disadvantageous to the Fund’s shareholders and thus would not alter the Board’s conclusion with respect to the appropriateness of approving the continuance of the Advisory Agreements for the coming year.
Based on the considerations described above, the Board determined that the Fund’s investment advisory fee rate under the Advisory Agreements does not constitute a fee that is so disproportionately large as to bear no reasonable relationship to the services rendered and that could not have been the product of arm’s-length bargaining, and concluded that it is in the best interest of the Fund and its shareholders to approve the continuance of the Advisory Agreements for the coming year.
IV. iShares Global High Yield Corporate Bond ETF
Under Section 15(c) of the Investment Company Act of 1940 (the “1940 Act”), the Company’s Board of Directors (the “Board”), including a majority of Directors who are not “interested persons” of the Company (as that term is defined in the 1940 Act) (the “Independent Directors”), is required annually to consider and approve the Investment Advisory Contract between the Company and BFA (the “Advisory Contract”), and the Sub-Advisory Agreement between BFA and BlackRock International Limited (“BIL”) (the “Sub-Advisory Agreement”), on behalf of the Fund. The Advisory Contract and the Sub-Advisory Agreement are referred to hereafter as the “Advisory Agreements”. The Independent Directors requested, and BFA provided, such information as the Independent Directors, with advice from independent counsel, deemed reasonably necessary to evaluate the Advisory Agreements. A committee of Independent Directors (the “15(c) Committee”), with independent counsel, met with management on May 1, 2015 and May 6, 2015, to discuss the types of information the Independent Directors required and the manner in which management would organize and present such information. At a meeting held on May 21, 2015, management presented preliminary information to the Board relating to the continuance of the Advisory Agreements, and the Board, including the Independent Directors, reviewed and discussed such information at length. The Independent Directors requested from management certain additional information, which management agreed to provide. At a meeting held on June 24-25, 2015, the Board, including the Independent Directors, reviewed the additional information provided by management in response to these
| 88 | 2015 iSHARES ANNUAL REPORTTO SHAREHOLDERS |
Table of Contents
Board Review and Approval of Investment Advisory
Contract (Continued)
iSHARES®, INC.
requests. After extensive discussions, the Board, including all of the Independent Directors, approved the continuance of the Advisory Agreements for the Fund, based on a review of qualitative and quantitative information provided by BFA, including the additional information management provided at the request of the Independent Directors. The Board noted its satisfaction with the extent and quality of information provided and its frequent interactions with management, as well as the detailed responses and other information provided by BFA. The Board also noted that the Board and BFA agreed to discuss potential enhancements and adjustments to the 15(c) process for the coming year. The Independent Directors were advised by their independent counsel throughout the process, including about the legal standards applicable to their review. In approving the Advisory Agreements for the Fund, the Board, including the Independent Directors, considered the following factors, no one of which was controlling, and reached the following conclusions:
Expenses and Performance of the Fund — The Board reviewed statistical information prepared by Lipper Inc. (“Lipper”), an independent provider of investment company data, regarding the expense ratio components, including actual advisory fees, waivers/reimbursements, and gross and net total expenses of the Fund in comparison with the same information for other exchange traded funds (including, where applicable, funds sponsored by an “at cost” service provider) and, in the limited instances where no comparable ETFs existed and the comparison group would not otherwise be reasonable in Lipper’s judgment, pure index institutional mutual funds, objectively selected by Lipper as comprising the Fund’s applicable peer group pursuant to Lipper’s proprietary ETF methodology (the “Lipper Group”). The Board was provided with a detailed description of Lipper’s proprietary ETF methodology used by Lipper to determine the Fund’s Lipper Group. The Board further noted that due to the limitations in providing comparable funds in the Lipper Group, the statistical information provided in Lipper’s report may or may not provide meaningful direct comparisons to the Fund in all instances.
The Board also noted that the investment advisory fee rate and overall expenses (net of waivers and reimbursements) for the Fund were lower than the median of the investment advisory fee rates and overall expenses (net of waivers and reimbursements) of the funds in its Lipper Group. The Board also noted that BFA pays BIL for its sub-advisory services, and that there are no additional fees imposed on the Fund in respect of the services provided under the Sub-Advisory Agreement.
In addition, the Board reviewed statistical information prepared by Lipper regarding the performance of the Fund for the one-, three-, five-, ten-year, and since inception periods, as applicable, and the “last quarter” period ended December 31, 2014, and a comparison of the Fund’s performance to its performance benchmark index for the same periods. To the extent that any of the comparison funds included in the Lipper Group track the same index as the Fund, Lipper also provided, and the Board reviewed, a comparison of the Fund’s performance to that of such relevant comparison funds for the same periods. The Board noted that the Fund generally performed in line with its performance benchmark index over the relevant periods. In considering this information, the Board noted that the Lipper Group may include funds that have a different investment objective and/or benchmark from the Fund. In addition, the Board noted that the Fund seeks to track its own benchmark index and that, during the prior year, the Board received periodic reports on the Fund’s performance in comparison with its benchmark index. Such periodic comparative performance information, including detailed information on certain specific iShares funds requested by the Boards, was also considered.
Based on this review, the other factors considered at the meeting, and their general knowledge of ETF pricing, the Board concluded that the investment advisory fee rate and expense level and the historical performance of the Fund supported the Board’s approval of the continuance of the Advisory Agreements for the coming year.
Nature, Extent and Quality of Services Provided by BFA and BIL or their Affiliates — Based on management’s representations, including information about recent and proposed enhancements to the iShares business, including with respect to shareholder servicing and support, the Board expected that there would be no diminution in the scope of services required of or provided by BFA (and any services provided by BIL on BFA’s behalf or at BFA’s direction) under the Advisory Agreements for the
BOARD REVIEW AND APPROVAL OF INVESTMENT ADVISORY CONTRACT | 89 |
Table of Contents
Board Review and Approval of Investment Advisory
Contract (Continued)
iSHARES®, INC.
coming year as compared to the scope of services provided by BFA and BIL during prior years. In reviewing the scope of these services, the Board considered the investment philosophy and experience of BFA and BIL, noting that BFA and its affiliates have committed significant resources over time, including during the past year, to supporting the iShares funds and their shareholders. The Board acknowledged that resources to support the iShares funds and their shareholders have been added or enhanced in recent years. The Board also considered the compliance program of BFA and BIL and their compliance record with respect to the Fund. In that regard, the Board noted that BFA reports to the Board about portfolio management and compliance matters on a periodic basis in connection with regularly scheduled meetings of the Board, and on other occasions as necessary and appropriate, and has provided information and made appropriate officers available as needed to provide further assistance with these matters. The Board also reviewed the background and experience of the persons responsible for the day-to-day management of the Fund, as well as the resources available to them in managing the Fund. In addition to the above considerations, the Board reviewed and considered detailed presentations regarding BFA’s investment performance, investment and risk management processes and strategies provided at the June 24-25, 2015 meeting and throughout the previous year, and matters related to BFA’s and BIL’s portfolio compliance policies and procedures, and BFA’s oversight of the services provided by BIL. The Board noted that the Fund had met its investment objective consistently since its inception date.
Based on review of this information, and the performance information discussed above, the Board concluded that the nature, extent and quality of services provided by BFA and BIL to the Fund under the Advisory Agreements supported the Board’s approval of the continuance of the Advisory Agreements for the coming year.
Costs of Services Provided to the Fund and Profits Realized by BFA and its Affiliates — The Board reviewed information about the profitability to BlackRock of the Fund based on the fees payable to BFA and its affiliates (including fees under the Advisory Agreements), and all other sources of revenue and expense to BFA and its affiliates from the Fund’s operations for the last calendar year. The Board reviewed BlackRock’s profitability methodology for the iShares funds, noting that the 15(c) Committee had focused on the methodology and proposed presentation during its meetings. The Board discussed the sources of direct and ancillary revenue with management, including the revenues to BTC from securities lending by the Fund. The Board also discussed BFA’s profit margin as reflected in the Fund’s profitability analysis and reviewed information regarding potential economies of scale (as discussed below). Based on this review, the Board concluded that the profits realized by BFA and its affiliates under the Advisory Agreements and from other relationships between the Fund and BFA and/or its affiliates, if any, were within a reasonable range in light of the factors considered.
Economies of Scale — The Board reviewed information regarding potential economies of scale or other efficiencies that may result from increases in the Fund’s assets, noting that the issue of economies of scale had been focused on extensively by the 15(c) Committee during its meetings and addressed by management. The Board and the 15(c) Committee reviewed information provided by BFA regarding scale benefits shared with the iShares funds through relatively low fee rates established at inception, breakpoints, waivers, or other fee reductions, as well as through additional investment in the iShares business and the provision of improved or additional infrastructure and services to the iShares funds and their shareholders. The Board and the 15(c) Committee received information regarding BlackRock’s historical profitability, including BFA’s and its affiliates’ costs in providing services. The cost information distinguished between fixed and variable costs, and explained how the level of fixed and variable costs, as well as the nature of such costs, may impact the existence or size of scale benefits. The Board noted that the Advisory Contract for the Fund did not provide for any breakpoints in the Fund’s investment advisory fee rate as the assets of the Fund increase. However, the Board noted that should material economies of scale exist in the future, a breakpoint structure for the Fund may be appropriate, and that it would continue to monitor the sharing of economies of scale to determine the appropriateness of adding breakpoints in the future. Based on this review, as well as the other factors considered at the meeting, the Board, recognizing its responsibility to consider this issue periodically, determined to approve the continuance of the Advisory Agreements for the coming year.
| 90 | 2015 iSHARES ANNUAL REPORTTO SHAREHOLDERS |
Table of Contents
Board Review and Approval of Investment Advisory
Contract (Continued)
iSHARES®, INC.
Fees and Services Provided for Other Comparable Funds/Accounts Managed by BFA and its Affiliates — The Board received and considered information regarding the investment advisory/management fee rates for other funds/accounts in the U.S. for which BFA (or its affiliates) provides investment advisory/management services, including open-end and closed-end funds registered under the 1940 Act (including sub-advised funds), collective trust funds, separately managed accounts, and institutional separate accounts (together, the “Other Accounts”), and acknowledged BFA’s assertion that the iShares funds are fundamentally different investment vehicles from the Other Accounts. The Board noted that BFA and its affiliates do not manage Other Accounts with substantially the same investment objective and strategy as the Fund or that track the same index or a similar index as the Fund. The Board further noted that BFA provided the Board with detailed information regarding how the Other Accounts (particularly institutional clients) generally differ from the Fund, including in terms of the different, generally more extensive services provided to the Fund, as well as other significant differences in the approach of BFA and its affiliates to the Fund, on one hand, and Other Accounts, on the other. In that regard, the Board considered that the pricing of services to institutional clients is typically based on a number of factors beyond the nature and extent of the specific services to be provided and often depends on the overall relationship between the client and its affiliates and the adviser and its affiliates. In addition, the Board considered the relative complexity and inherent risks and challenges of managing and providing other services to the Fund, as a publicly traded exchange traded fund, as compared to the Other Accounts that are institutional clients in light of differing regulatory requirements and client-imposed mandates. The Board also considered the “all-inclusive” nature of the Fund’s advisory fee structure, and the Fund expenses borne by BFA under this arrangement. The Board noted that the investment advisory fee rate under the Advisory Contract for the Fund was generally higher than the investment advisory/management fee rates for the Other Accounts that are institutional clients of BFA (or its affiliates) and concluded that the differences appeared to be consistent with the factors discussed.
Other Benefits to BFA and/or its Affiliates — The Board reviewed the “fallout” benefits or ancillary revenue received by BFA and/or its affiliates in connection with the services provided to the Fund by BFA, such as payment of revenue to BTC, the Fund’s securities lending agent, for loaning portfolio securities (which was included in the profit margins reviewed by the Board pursuant to BFA’s profitability methodology), and payment of advisory fees and/or administration fees to BFA and BTC (or their affiliates) in connection with any investments by the Fund in other funds for which BFA (or its affiliates) provides investment advisory services and/or administration services. The Board noted that BFA and BIL generally do not use soft dollars or consider the value of research or other services that may be provided to BFA and BIL (including their affiliates) in selecting brokers for portfolio transactions for the Fund. The Board further noted that any portfolio transactions on behalf of the Fund placed through a BFA affiliate or purchased from an underwriting syndicate in which a BFA affiliate participates, are reported to the Board pursuant to Rule 17e-1 or Rule 10f-3, as applicable, under the 1940 Act. The Board concluded that any such ancillary benefits would not be disadvantageous to the Fund’s shareholders and thus would not alter the Board’s conclusion with respect to the appropriateness of approving the continuance of the Advisory Agreements for the coming year. Based on the considerations described above, the Board determined that the Fund’s investment advisory fee rate under the Advisory Agreements does not constitute a fee that is so disproportionately large as to bear no reasonable relationship to the services rendered and that could not have been the product of arm’s-length bargaining, and concluded that it is in the best interest of the Fund and its shareholders to approve the continuance of the Advisory Agreements for the coming year.
BOARD REVIEW AND APPROVAL OF INVESTMENT ADVISORY CONTRACT | 91 |
Table of Contents
Supplemental Information (Unaudited)
iSHARES®, INC.
Section 19(a) Notices
The amounts and sources of distributions reported are estimates and are provided pursuant to regulatory requirements and are not being provided for tax reporting purposes. The actual amounts and sources for tax reporting purposes will depend upon each Fund’s investment experience during the year and may be subject to changes based on the tax regulations. Shareholders will receive a Form 1099-DIV each calendar year that will inform them how to report these distributions for federal income tax purposes.
| Total Cumulative Distributions for the Fiscal Year | % Breakdown of the Total Cumulative Distributions for the Fiscal Year | |||||||||||||||||||||||||||||||
| iShares ETF | Net Investment Income | Net Realized Capital Gains | Return of Capital | Total Per Share | Net Investment Income | Net Realized Capital Gains | Return of Capital | Total Per Share | ||||||||||||||||||||||||
Emerging Markets Corporate Bond | $ | 2.122397 | $ | — | $ | 0.014505 | $ | 2.136902 | 99 | % | — | % | 1 | % | 100 | % | ||||||||||||||||
Emerging Markets High Yield Bond | 3.087839 | — | — | 3.087839 | 100 | — | — | 100 | ||||||||||||||||||||||||
Emerging Markets Local Currency Bond | — | — | 0.593999 | 0.593999 | — | — | 100 | 100 | ||||||||||||||||||||||||
Global High Yield Corporate Bond | 2.137185 | — | 0.088119 | 2.225304 | 96 | — | 4 | 100 | ||||||||||||||||||||||||
Premium/Discount Information
The Premium/Discount Information section is intended to present information about the differences between the daily market price on secondary markets for shares of a fund and that fund’s NAV. NAV is the price at which a fund issues and redeems shares. It is calculated in accordance with the standard formula for valuing mutual fund shares. The “Market Price” of a fund generally is determined using the midpoint between the highest bid and the lowest offer on the primary stock exchange on which the shares of such fund are listed for trading, as of the time that the fund’s NAV is calculated. A fund’s Market Price may be at, above or below its NAV. The NAV of a fund will fluctuate with changes in the fair value of its portfolio holdings. The Market Price of a fund will fluctuate in accordance with changes in its NAV, as well as market supply and demand.
Premiums or discounts are the differences (expressed as a percentage) between the NAV and Market Price of a fund on a given day, generally at the time the NAV is calculated. A premium is the amount that a fund is trading above the reported NAV, expressed as a percentage of the NAV. A discount is the amount that a fund is trading below the reported NAV, expressed as a percentage of the NAV.
The following information shows the frequency of distributions of premiums and discounts for each of the Funds. The information shown for each Fund is for five calendar years (or from the inception date of the Fund if less than five years) through the date of the most recent calendar quarter-end. The specific periods covered for each Fund are disclosed in the table for the Fund.
| 92 | 2015 iSHARES ANNUAL REPORTTO SHAREHOLDERS |
Table of Contents
Supplemental Information (Unaudited) (Continued)
iSHARES® , INC.
Each line in the table shows the number of trading days in which the Fund traded within the premium/discount range indicated. The number of trading days in each premium/discount range is also shown as a percentage of the total number of trading days in the period covered by each table. All data presented here represents past performance, which cannot be used to predict future results.
iShares Emerging Markets Corporate Bond ETF
Period Covered: April 17, 2012 through September 30, 2015
Premium/Discount Range | Number of Days | Percentage of Total Days | ||||||
Greater than 3.0% and Less than 3.5% | 2 | 0.23 | % | |||||
Greater than 2.5% and Less than 3.0% | 18 | 2.07 | ||||||
Greater than 2.0% and Less than 2.5% | 34 | 3.91 | ||||||
Greater than 1.5% and Less than 2.0% | 37 | 4.25 | ||||||
Greater than 1.0% and Less than 1.5% | 150 | 17.24 | ||||||
Greater than 0.5% and Less than 1.0% | 114 | 13.10 | ||||||
Between 0.5% and –0.5% | 277 | 31.85 | ||||||
Less than –0.5% and Greater than –1.0% | 86 | 9.89 | ||||||
Less than –1.0% and Greater than –1.5% | 81 | 9.31 | ||||||
Less than –1.5% and Greater than –2.0% | 33 | 3.79 | ||||||
Less than –2.0% and Greater than –2.5% | 26 | 2.99 | ||||||
Less than –2.5% and Greater than –3.0% | 9 | 1.03 | ||||||
Less than –3.0% and Greater than –3.5% | 3 | 0.34 | ||||||
|
|
|
| |||||
| 870 | 100.00 | % | ||||||
|
|
|
| |||||
iShares Emerging Markets High Yield Bond ETF
Period Covered: April 3, 2012 through September 30, 2015
Premium/Discount Range | Number of Days | Percentage of Total Days | ||||||
Greater than 3.0% and Less than 3.5% | 1 | 0.11 | % | |||||
Greater than 2.5% and Less than 3.0% | 2 | 0.23 | ||||||
Greater than 2.0% and Less than 2.5% | 3 | 0.34 | ||||||
Greater than 1.5% and Less than 2.0% | 5 | 0.57 | ||||||
Greater than 1.0% and Less than 1.5% | 83 | 9.44 | ||||||
Greater than 0.5% and Less than 1.0% | 313 | 35.61 | ||||||
Between 0.5% and –0.5% | 429 | 48.81 | ||||||
Less than –0.5% and Greater than –1.0% | 30 | 3.41 | ||||||
Less than –1.0% and Greater than –1.5% | 10 | 1.14 | ||||||
Less than –1.5% and Greater than –2.0% | 3 | 0.34 | ||||||
|
|
|
| |||||
| 879 | 100.00 | % | ||||||
|
|
|
| |||||
SUPPLEMENTAL INFORMATION | 93 |
Table of Contents
Supplemental Information (Unaudited) (Continued)
iSHARES® , INC.
iShares Emerging Markets Local Currency Bond ETF
Period Covered: October 18, 2011 through September 30, 2015
Premium/Discount Range | Number of Days | Percentage of Total Days | ||||||
Greater than 4.5% and Less than 5.0% | 1 | 0.10 | % | |||||
Greater than 4.0% and Less than 4.5% | 3 | 0.30 | ||||||
Greater than 3.5% and Less than 4.0% | 5 | 0.50 | ||||||
Greater than 3.0% and Less than 3.5% | 1 | 0.10 | ||||||
Greater than 2.5% and Less than 3.0% | 6 | 0.60 | ||||||
Greater than 2.0% and Less than 2.5% | 29 | 2.92 | ||||||
Greater than 1.5% and Less than 2.0% | 64 | 6.44 | ||||||
Greater than 1.0% and Less than 1.5% | 228 | 22.94 | ||||||
Greater than 0.5% and Less than 1.0% | 125 | 12.58 | ||||||
Between 0.5% and –0.5% | 499 | 50.20 | ||||||
Less than –0.5% and Greater than –1.0% | 28 | 2.82 | ||||||
Less than –1.0% and Greater than –1.5% | 4 | 0.40 | ||||||
Less than –1.5% | 1 | 0.10 | ||||||
|
|
|
| |||||
| 994 | 100.00 | % | ||||||
|
|
|
| |||||
iShares Global High Yield Corporate Bond ETF
Period Covered: April 3, 2012 through September 30, 2015
Premium/Discount Range | Number of Days | Percentage of Total Days | ||||||
Greater than 4.0% | 1 | 0.11 | % | |||||
Greater than 3.5% and Less than 4.0% | 1 | 0.11 | ||||||
Greater than 3.0% and Less than 3.5% | 13 | 1.48 | ||||||
Greater than 2.5% and Less than 3.0% | 12 | 1.37 | ||||||
Greater than 2.0% and Less than 2.5% | 11 | 1.25 | ||||||
Greater than 1.5% and Less than 2.0% | 27 | 3.07 | ||||||
Greater than 1.0% and Less than 1.5% | 79 | 8.99 | ||||||
Greater than 0.5% and Less than 1.0% | 304 | 34.58 | ||||||
Between 0.5% and – 0.5% | 392 | 44.60 | ||||||
Less than –0.5% and Greater than –1.0% | 18 | 2.05 | ||||||
Less than –1.0% and Greater than –1.5% | 7 | 0.80 | ||||||
Less than –1.5% and Greater than –2.0% | 3 | 0.34 | ||||||
Less than –2.0% and Greater than –2.5% | 5 | 0.57 | ||||||
Less than –2.5% and Greater than –3.0% | 5 | 0.57 | ||||||
Less than –3.0% and Greater than –3.5% | 1 | 0.11 | ||||||
|
|
|
| |||||
| 879 | 100.00 | % | ||||||
|
|
|
| |||||
| 94 | 2015 iSHARES ANNUAL REPORTTO SHAREHOLDERS |
Table of Contents
Supplemental Information (Unaudited) (Continued)
iSHARES® , INC.
Regulation under the Alternative Investment Fund Managers Directive (“AIFMD” or, the “Directive”)
The Directive imposes detailed and prescriptive obligations on fund managers established in the European Union (the “EU”). These do not currently apply to managers established outside the EU, such as BFA. Rather, non-EU managers are only required to comply with certain disclosure, reporting and transparency obligations of the Directive if such managers market a fund to EU investors.
BFA has registered the iShares Emerging Markets High Yield Bond ETF (the “Fund”) to be marketed to EU investors in the United Kingdom, the Netherlands, Finland, Sweden and Luxembourg.
Report on Remuneration
BFA is required under the Directive to make quantitative disclosures of remuneration. These disclosures are made in line with BlackRock’s interpretation of currently available regulatory guidance on quantitative remuneration disclosures. As market or regulatory practice develops, BlackRock may consider it appropriate to make changes to the way in which quantitative remuneration disclosures are calculated. Where such changes are made, this may result in disclosures in relation to a fund not being comparable to the disclosures made in the prior year, or in relation to other BlackRock fund disclosures in that same year.
Disclosures are provided in relation to both (a) the staff of BFA; (b) staff who are senior management; and (c) staff who have the ability to materially affect the risk profile of the Fund.
All individuals included in the aggregated figures disclosed are rewarded in line with BlackRock’s remuneration policy for their responsibilities across the relevant BlackRock business area. As all individuals have a number of areas of responsibilities, only the portion of remuneration for those individuals’ services attributable to the Fund is included in the aggregate figures disclosed.
BlackRock has a clear and well defined pay-for-performance philosophy, and compensation programs which support that philosophy. For senior management, a significant percentage of variable remuneration is deferred over time. All employees are subject to a claw-back policy.
Compensation decisions for employees are made based on BlackRock’s full-year financial results and other non-financial goals and objectives. Alongside financial performance, individual compensation is also based on strategic and operating results and other considerations such as management and leadership capabilities. No set formulas are established and no fixed benchmarks are used in determining annual incentive awards.
Bonus pools are reviewed by BlackRock’s independent compensation committee, taking into account both actual and projected financial information together with information provided by the Operational Risk and Regulatory Compliance departments in relation to any activities, incidents or events that warrant consideration in making compensation decisions.
Functions such as Finance, Operational Risk, Legal & Compliance, and Human Resources each have their own organizational structures which are independent of the business units. Functional bonus pools are determined with reference to the performance of each individual function and the remuneration of the senior members of control functions is directly overseen by BlackRock’s independent compensation committee. No individual is involved in setting his or her own remuneration.
Members of staff and senior management of BFA typically provide both AIFMD and non-AIFMD related services in respect of multiple funds, clients and functions of BFA and across the broader BlackRock group. Therefore, the figures disclosed are a sum of each individual’s portion of remuneration attributable to the Fund according to an objective apportionment methodology which acknowledges the multiple-service nature of BFA. Accordingly, the figures are not representative of any individual’s actual remuneration or their remuneration structure.
SUPPLEMENTAL INFORMATION | 95 |
Table of Contents
Supplemental Information (Unaudited) (Continued)
iSHARES® , INC.
The amount of the total remuneration awarded by BFA to its staff which has been attributed to the iShares Emerging Markets High Yield Bond ETF in respect of BFA’s financial year ending December 31, 2014 was USD 32.3 thousand. This figure is comprised of fixed remuneration of USD 13.1 thousand and variable remuneration of USD 19.3 thousand. There were a total of 499 beneficiaries of the remuneration described above.
The amount of the aggregate remuneration awarded by BFA, which has been attributed to the iShares Emerging Markets High Yield Bond ETF in respect of BFA’s financial year ending December 31, 2014, to its senior management was USD 4.5 thousand, and to members of its staff whose actions have a material impact on the risk profile of the Fund was USD 0.8 thousand.
| 96 | 2015 iSHARES ANNUAL REPORTTO SHAREHOLDERS |
Table of Contents
Director and Officer Information
ISHARES® , INC.
The Board of Directors has responsibility for the overall management and operations of the Company, including general supervision of the duties performed by BFA and other service providers. Each Director serves until he or she resigns, is removed, dies, retires or becomes incapacitated. Each officer shall hold office until his or her successor is elected and qualifies or until his or her death, or his or her resignation or removal. Directors who are not “interested persons” (as defined in the 1940 Act) of the Company are referred to as independent directors (“Independent Directors”).
The registered investment companies advised by BFA or its affiliates are organized into one complex of closed-end funds, two complexes of open-end funds and one complex of exchange-traded funds (“Exchange-Traded Fund Complex”) (each, a “BlackRock Fund Complex”). Each Fund is included in the BlackRock Fund Complex referred to as the Exchange-Traded Fund Complex. Each Director also serves as a Trustee of iShares Trust and a Trustee of iShares U.S. ETF Trust and, as a result, oversees a total of 324 funds (as of October 31, 2015) within the Exchange-Traded Fund Complex. With the exception of Robert S. Kapito and Mark Wiedman, the address of each Director and officer is c/o BlackRock, Inc., 400 Howard Street, San Francisco, CA 94105. The address of Mr. Kapito and Mr. Wiedman is c/o BlackRock, Inc., Park Avenue Plaza, 55 East 52nd Street, New York, NY 10055. The Board has designated Robert H. Silver as its Independent Chairman. Additional information about the Funds’ Directors and officers may be found in the Funds’ combined Statement of Additional Information, which is available without charge, upon request, by calling toll-free 1-800-iShares (1-800-474-2737).
Interested Directors
| Name (Age) | Position(s) | Principal Occupation(s) During the Past 5 Years | Other Directorships Held by Director | |||
Robert S. Kapitoa (58) | Director (since 2009). | President and Director, BlackRock, Inc. (since 2006); Vice Chairman of BlackRock, Inc. and Head of BlackRock, Inc.’s Portfolio Management Group (since its formation in 1998) and BlackRock, Inc.’s predecessor entities (since 1988); Trustee, University of Pennsylvania (since 2009); President of Board of Directors, Hope & Heroes Children’s Cancer Fund (since 2002); President of the Board of Directors, Periwinkle Theatre for Youth (since 1983). | Trustee of iShares Trust (since 2009); Trustee of iShares U.S. ETF Trust (since 2011); Director of BlackRock, Inc. (since 2006). | |||
Mark Wiedmanb (44) | Director | Managing Director, BlackRock, Inc. (since 2007); Global Head of iShares (since 2011); Head of Corporate Strategy, BlackRock, Inc. (2009-2011). | Trustee of iShares Trust (since 2013); Trustee of iShares U.S. ETF Trust (since 2013); Director of PennyMac Financial Services, Inc. (since 2008). | |||
| a | Robert S. Kapito is deemed to be an “interested person” (as defined in the 1940 Act) of the Company due to his affiliations with BlackRock, Inc. |
| b | Mark Wiedman is deemed to be an “interested person” (as defined in the 1940 Act) of the Company due to his affiliations with BlackRock, Inc. and its affiliates. |
DIRECTORAND OFFICER INFORMATION | 97 |
Table of Contents
Director and Officer Information (Continued)
ISHARES® , INC.
Independent Directors
| Name (Age) | Position(s) | Principal Occupation(s) During the Past 5 Years | Other Directorships Held by Director | |||
Robert H. Silver (60) | Director (since 2007); Independent Chairman (since 2012). | President and Co-Founder of The Bravitas Group, Inc. (since 2006); Director and Vice Chairman of the YMCA of Greater NYC (2001-2011); Broadway Producer (2006-2011); Co-Founder and Vice President of Parentgiving Inc. (since 2008); Director and Member of the Audit and Compensation Committee of EPAM Systems, Inc. (2006-2009); President and Chief Operating Officer of UBS Financial Services Inc. (formerly Paine Webber Inc.) (2003-2005) and various executive positions with UBS and its affiliates (1988-2005); CPA and Audit Manager of KPMG, LLP (formerly Peat Marwick Mitchell) (1977-1983). | Trustee of iShares Trust (since 2007); Trustee of iShares U.S. ETF Trust (since 2011); Independent Chairman of iShares Trust and iShares U.S. ETF Trust (since 2012). | |||
Jane D. Carlin (59) | Director (since 2015). | Managing Director and Global Head of Financial Holding Company Governance & Assurance and the Global Head of Operational Risk Management of Morgan Stanley (2006-2012). | Trustee of iShares Trust (since 2015); Trustee of iShares U.S. ETF Trust (since 2015); Director of PHH Corporation (mortgage solutions) (since 2012). | |||
Cecilia H. Herbert (66) | Director (since 2005); Nominating and Governance Committee Chair and Equity Plus Committee Chair (since 2012). | Director (1998-2013) and President (2007-2011) of the Board of Directors, Catholic Charities CYO; Trustee (2002-2011) and Chair of the Finance and Investment Committee (2006-2010) of the Thacher School; Member (since 1992) and Chair (1994-2005) of the Investment Committee, Archdiocese of San Francisco; Trustee and Member of the Investment Committee, WNET, the New York public broadcasting/media company (since 2011). | Trustee of iShares Trust (since 2005); Trustee of iShares U.S. ETF Trust (since 2011); Director of Forward Funds (34 portfolios) (since 2009). | |||
Charles A. Hurty (72) | Director (since 2005); Audit Committee Chair (since 2006). | Retired; Partner, KPMG LLP (1968-2001). | Trustee of iShares Trust (since 2005); Trustee of iShares U.S. ETF Trust (since 2011); Director of GMAM Absolute Return Strategy Fund (1 portfolio) (since 2002); Director of SkyBridge Alternative Investments Multi-Adviser Hedge Fund Portfolios LLC (2 portfolios) (since 2002). | |||
| 98 | 2015 iSHARES ANNUAL REPORTTO SHAREHOLDERS |
Table of Contents
Director and Officer Information (Continued)
ISHARES® , INC.
Independent Directors (continued)
| Name (Age) | Position(s) | Principal Occupation(s) During the Past 5 Years | Other Directorships Held by Director | |||
John E. Kerrigan (60) | Director (since 2005); Fixed Income Plus Committee Chair (since 2012). | Chief Investment Officer, Santa Clara University (since 2002). | Trustee of iShares Trust (since 2005); Trustee of iShares U.S. ETF Trust (since 2011). | |||
John E. Martinez (54) | Director (since 2003); Securities Lending Committee Chair (since 2012). | Director of FirstREX Agreement Corp. (formerly EquityRock, Inc.) (since 2005). | Trustee of iShares Trust (since 2003); Trustee of iShares U.S. ETF Trust (since 2011). | |||
Madhav V. Rajan (51) | Director (since 2011); 15(c) Committee Chair (since 2012). | Robert K. Jaedicke Professor of Accounting and Senior Associate Dean for Academic Affairs and Head of MBA Program, Stanford University Graduate School of Business (since 2001); Professor of Law (by courtesy), Stanford Law School (since 2005); Visiting Professor, University of Chicago (2007-2008). | Trustee of iShares Trust (since 2011); Trustee of iShares U.S. ETF Trust (since 2011); Director, Cavium, Inc. (since 2013). | |||
DIRECTORAND OFFICER INFORMATION | 99 |
Table of Contents
Director and Officer Information (Continued)
ISHARES® , INC.
Officers
| Name (Age) | Position(s) | Principal Occupation(s) During the Past 5 Years | ||
Manish Mehta (44) | President (since 2013). | Managing Director, BlackRock, Inc. (since 2009); Chief Operating Officer for iShares (since 2009); Head of Strategy and Corporate Development, BGI (2005-2009); Chief of Staff to the CEO, BGI (2005-2009). | ||
Jack Gee (56) | Treasurer and Chief Financial Officer (since 2008). | Managing Director, BlackRock, Inc. (since 2009); Senior Director of Fund Administration of Intermediary Investor Business, BGI (2009); Director of Fund Administration of Intermediary Investor Business, BGI (2004-2009). | ||
Benjamin Archibald (40) | Secretary (since 2015). | Managing Director, BlackRock, Inc. (since 2014); Secretary of the BlackRock-advised Mutual Funds (since 2012); Director, BlackRock, Inc. (2010-2013). | ||
Charles Park (48) | Chief Compliance Officer (since 2006). | Chief Compliance Officer of BlackRock Advisors, LLC and the BlackRock-advised Funds in the Equity-Bond Complex, the Equity-Liquidity Complex and the Closed-End Complex (since 2014); Chief Compliance Officer of BFA (since 2006). | ||
Scott Radell (46) | Executive Vice President (since 2012). | Managing Director, BlackRock, Inc. (since 2009); Head of Portfolio Solutions, BlackRock, Inc. (since 2009); Head of Portfolio Solutions, BGI (2007-2009); Credit Portfolio Manager, BGI (2005-2007); Credit Research Analyst, BGI (2003-2005). | ||
Amy Schioldager (53) | Executive Vice President (since 2007). | Senior Managing Director, BlackRock, Inc. (since 2009); Global Head of Index Equity, BGI (2008-2009); Global Head of U.S. Indexing, BGI (2006-2008); Head of Domestic Equity Portfolio Management, BGI (2001-2006). | ||
| 100 | 2015 iSHARES ANNUAL REPORTTO SHAREHOLDERS |
Table of Contents
Notes:
NOTES | 101 |
Table of Contents
Notes:
| 102 | 2015 iSHARES ANNUAL REPORTTO SHAREHOLDERS |
Table of Contents
For more information visit www.iShares.com or call 1-800-474-2737
This report is intended for the Funds’ shareholders. It may not be distributed to prospective investors unless it is preceded or accompanied by the current prospectus.
Investing involves risk, including possible loss of principal.
The iShares Funds are distributed by BlackRock Investments, LLC (together with its affiliates, “BlackRock”).
The iShares Funds are not sponsored, endorsed, issued, sold or promoted by Markit Indices Limited or Morningstar, Inc., nor are they sponsored, endorsed or issued by Barclays Capital Inc. None of these companies make any representation regarding the advisability of investing in the iShares Funds. BlackRock is not affiliated with the companies listed above.
A description of the policies that the Funds use to determine how to vote proxies relating to portfolio securities and information about how the Funds voted proxies relating to portfolio securities during the most recent twelve-month period ending June 30 is available without charge, upon request, by calling toll-free 1-800-474-2737; on the Funds’ website at www.iShares.com; and on the U.S. Securities and Exchange Commission (SEC) website at www.sec.gov.
The Funds file their complete schedules of portfolio holdings with the SEC for the first and third quarters of each fiscal year on Form N-Q. The Funds’ Forms N-Q are available on the SEC’s website or may be reviewed and copied at the SEC’s Public Reference Room in Washington, D.C. Information on the operation of the Public Reference Room may be obtained by calling 1-800-SEC-0330. The Funds also disclose their complete schedules of portfolio holdings on a daily basis on the Funds’ website.
©2015 BlackRock, Inc. All rights reserved. iSHARES and BLACKROCK are registered trademarks of BlackRock, Inc. or its subsidiaries. All other marks are the property of their respective owners.
iS-AR-102-1015
 |  |
Table of Contents
OCTOBER 31, 2015
2015 ANNUAL REPORT |  |
iShares, Inc.
| Ø | iShares International High Yield Bond ETF | HYXU | BATS |
Table of Contents
| 5 | ||||
| 8 | ||||
| 8 | ||||
| 9 | ||||
| 24 | ||||
| 27 | ||||
| 28 | ||||
| 35 | ||||
| 36 | ||||
| 37 | ||||
| 41 | ||||
| 43 |
Table of Contents
Management’s Discussion of Fund Performance
iSHARES® INTERNATIONAL HIGH YIELD BOND ETF
GLOBAL BOND MARKET OVERVIEW
Global bonds generally produced negative returns in U.S. dollar terms for the 12-month period ended October 31, 2015 (the “reporting period”), after accounting for the effects of a stronger U.S. currency. Interest rates declined modestly in most markets amid uncertainty around global economic growth; however, for U.S. investors, a stronger U.S. dollar detracted from performance as overseas investments were worth less when translated back into U.S. dollars.
Global economic data were mixed. The U.S. and U.K. experienced comparatively healthy growth, with GDP expanding by 2.0% and 2.3%, respectively, through September 2015, while eurozone economic growth ran at a 1.5% annual rate through the third quarter. However, the Japanese economy contracted in two of the last four quarters, while China saw growth fall below the 7% threshold to its slowest pace since 2009.
In addition to disappointing growth, China witnessed a sharp stock market decline, currency devaluation, and a raft of monetary and policy changes meant to prop up markets. These challenges, coupled with worry about a possible Greek exit from the European common currency, led to a sell-off in risk assets and safe-haven demand for high-quality bonds.
Slower growth in China and other emerging markets also weighed on commodity markets, with prices for many key commodities falling during the fiscal year. This provided additional support for bonds in general because it meant downward pressure on inflation. In the European Union and U.K., consumer prices actually declined for the 12 months ended in September, while inflation in Japan and the U.S. was relatively flat year over year.
Despite these positives, bonds sold off and market volatility surged during the summer, when economic growth in Europe improved, corporations rushed to issue new debt, and investors began to price in the likelihood of a U.S. Federal Reserve Bank (the “Fed”) interest rate increase.
From a sector perspective, government agency mortgage-backed securities and government bonds performed best for the reporting period. Investor concern about risk assets and surging new bond issuance generally limited returns for corporate securities. And within the corporate market, high-quality bonds generally outperformed high-yield bonds. Sharply declining commodities prices dragged down high-yield bonds. Nevertheless, many sectors of the global corporate bond market produced positive results. For example, banks were among the best-performing industries as growth improved in the eurozone and U.S., and the Fed was expected to begin raising rates.
In terms of performance by country for the reporting period, Australian bonds performed well in local currency terms, but fared poorly after taking currency effects into account. It was a similar story for bonds from across Europe, where low inflation and strong demand meant falling interest rates and higher bond prices, only to see this performance be counteracted by weakness in the euro relative to the U.S. dollar. In Japan, too, aggressive monetary policy, disappointing growth, and the absence of inflation meant falling bond yields. But an attempt to stimulate the economy by cutting interest rates and weakening the yen had the effect of limiting Japanese bond returns for U.S. investors.
Specifically, the U.S. dollar appreciated by approximately 4% relative to the British pound, 16% and 23% against the commodity-driven Canadian and Australian dollars, respectively, 14% against the euro, and 8% against the Japanese yen. The U.S. dollar’s strength during the reporting period was driven by the divergence in economic growth and central bank policies between the U.S. and other regions.
MANAGEMENT’S DISCUSSIONOF FUND PERFORMANCE | 5 |
Table of Contents
Management’s Discussion of Fund Performance
iSHARES® INTERNATIONAL HIGH YIELD BOND ETF
Performance as of October 31, 2015
| Average Annual Total Returns | Cumulative Total Returns | |||||||||||||||||||||||||
| NAV | MARKET | INDEX | NAV | MARKET | INDEX | |||||||||||||||||||||
1 Year | (9.02)% | (9.80)% | (8.92)% | (9.02)% | (9.80)% | (8.92)% | ||||||||||||||||||||
Since Inception | 2.48% | 2.37% | 2.45% | 9.15% | 8.75% | 9.05% | ||||||||||||||||||||
GROWTH OF $10,000 INVESTMENT
(SINCE INCEPTION AT NET ASSET VALUE)
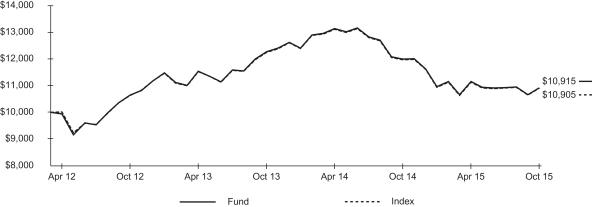
The inception date of the Fund was 4/3/12. The first day of secondary market trading was 4/3/12.
Past performance is no guarantee of future results. Performance results do not reflect the deduction of taxes that a shareholder would pay on fund distributions or on the redemption or sale of fund shares. See “About Fund Performance” on page 8 for more information.
| Shareholder Expenses | ||||||||||||||||||||||||||
| Actual | Hypothetical 5% Return | |||||||||||||||||||||||||
| Beginning Account Value (5/1/15) | Ending Account Value (10/31/15) | Expenses Paid During Period a | Beginning Account Value (5/1/15) | Ending Account Value (10/31/15) | Expenses Paid During Period a | Annualized Expense Ratio | ||||||||||||||||||||
| $ | 1,000.00 | $ | 978.30 | $ | 1.99 | $ | 1,000.00 | $ | 1,023.20 | $ | 2.04 | 0.40% | ||||||||||||||
| a | Expenses are calculated using the Fund’s annualized expense ratio (as disclosed in the table), multiplied by the average account value for the period, multiplied by the number of days in the period (184 days) and divided by the number of days in the year (365 days). See “Shareholder Expenses” on page 8 for more information. |
| 6 | 2015 iSHARES ANNUAL REPORTTO SHAREHOLDERS |
Table of Contents
Management’s Discussion of Fund Performance (Continued)
iSHARES® INTERNATIONAL HIGH YIELD BOND ETF
The iShares International High Yield Bond ETF (the “Fund”) (formerly the iShares Global ex USD High Yield Corporate Bond ETF) seeks to track the investment results of an index composed of euro, British pound sterling and Canadian dollar-denominated, high yield corporate bonds, as represented by the Markit iBoxx Global Developed Markets ex-US High Yield Index (the “Index”). The Fund invests in a representative sample of securities included in the Index that collectively has an investment profile similar to the Index. Due to the use of representative sampling, the Fund may or may not hold all of the securities that are included in the Index. For the 12-month reporting period ended October 31, 2015, the total return for the Fund was -9.02%, net of fees, while the total return for the Index was -8.92%.
As represented by the Index, high-yield corporate bonds outside of the U.S. declined by approximately 9% for the reporting period. One factor behind this decline was a stronger U.S. dollar. For the reporting period, the U.S. dollar appreciated by 4% against the British pound, 14% against the euro, and 16% against the Canadian dollar. Countries using these currencies comprised more than 90% of the Index on average during the reporting period.
High-yield corporate bonds underperformed the broader global bond market during the reporting period amid heightened uncertainty that led to a flight to quality. Uncertainty surrounding the timing of a potential short-term interest rate increase by the Fed, generally sluggish global economic growth, a broad decline in commodity prices, and a marked slowdown in China’s economy (which had a ripple effect on other emerging economies) were all factors that contributed to a more risk-averse investment environment.
The bulk of the Index consists of high-yield corporate bonds from Europe. European high-yield bonds struggled as economic growth on the Continent remained lethargic. High-yield corporate bonds from Luxembourg, France, and Italy had the most significant negative impact on the Index’s performance for the reporting period.
Outside of Europe, one of the largest country weightings in the Index during the reporting period was Canada. Canadian high-yield bonds detracted from performance as falling demand for commodities, a key component of the country’s economy, contributed to an economic contraction in the first two quarters of 2015.
ALLOCATION BY CREDIT QUALITY
As of 10/31/15
| Moody’s Credit Rating1 | Percentage of Total Investments2 |
Ba | 51.35 | % | ||
B | 30.80 | |||
Caa | 4.97 | |||
C | 0.54 | |||
Not Rated | 12.34 | |||
|
| |||
TOTAL | 100.00 | % | ||
|
|
TEN LARGEST COUNTRIES
As of 10/31/15
| Country | Percentage of Total Investments2 |
Italy | 19.74 | % | ||
United Kingdom | 18.98 | |||
Germany | 15.63 | |||
France | 10.21 | |||
Luxembourg | 6.13 | |||
Spain | 5.52 | |||
United States | 5.39 | |||
Canada | 3.09 | |||
Netherlands | 2.57 | |||
Ireland | 2.35 | |||
|
| |||
TOTAL | 89.61 | % | ||
|
|
| 1 | Credit quality ratings shown reflect the ratings assigned by Moody’s Investors Service (“Moody’s”), a widely used independent, nationally recognized statistical rating organization. Moody’s credit ratings are opinions of the credit quality of individual obligations or of an issuer’s general creditworthiness. Investment grade ratings are credit ratings of Baa or higher. Below investment grade ratings are credit ratings of Ba or lower. Unrated investments do not necessarily indicate low credit quality. Credit quality ratings are subject to change. |
| 2 | Excludes money market funds. |
MANAGEMENT’S DISCUSSIONOF FUND PERFORMANCE | 7 |
Table of Contents
Past performance is no guarantee of future results. Current performance may be lower or higher than the performance data quoted. Performance data current to the most recent month-end is available at www.ishares.com. Performance results assume reinvestment of all dividends and capital gain distributions and do not reflect the deduction of taxes that a shareholder would pay on fund distributions or on the redemption or sale of fund shares. The investment return and principal value of shares will vary with changes in market conditions. Shares may be worth more or less than their original cost when they are redeemed or sold in the market. Performance for certain funds may reflect a waiver of a portion of investment advisory fees. Without such a waiver, performance would have been lower.
Net asset value or “NAV” is the value of one share of a fund as calculated in accordance with the standard formula for valuing mutual fund shares. The price used to calculate market return (“Market Price”) is determined by using the midpoint between the highest bid and the lowest offer on the primary stock exchange on which shares of a fund are listed for trading, as of the time that such fund’s NAV is calculated. Certain funds may have a NAV which is determined prior to the opening of regular trading on its listed exchange and their market returns are calculated using the midpoint of the bid/ask spread as of the opening of regular trading on the exchange. Market and NAV returns assume that dividends and capital gain distributions have been reinvested at Market Price and NAV, respectively.
An index is a statistical composite that tracks a specified financial market or sector. Unlike a fund, an index does not actually hold a portfolio of securities and therefore does not incur the expenses incurred by a fund. These expenses negatively impact fund performance. Also, market returns do not include brokerage commissions that may be payable on secondary market transactions. If brokerage commissions were included, market returns would be lower.
As a shareholder of a Fund, you incur two types of costs: (1) transaction costs, including brokerage commissions on purchases and sales of fund shares and (2) ongoing costs, including management fees and other fund expenses. The expense example, which is based on an investment of $1,000 invested on May 1, 2015 and held through October 31, 2015, is intended to help you understand your ongoing costs (in dollars and cents) of investing in a Fund and to compare these costs with the ongoing costs of investing in other funds.
Actual Expenses — The table provides information about actual account values and actual expenses. Annualized expense ratios reflect contractual and voluntary fee waivers, if any. To estimate the expenses that you paid on your account over the period, simply divide your account value by $1,000 (for example, an $8,600 account value divided by $1,000 = 8.6), then multiply the result by the number under the heading entitled “Expenses Paid During Period.”
Hypothetical Example for Comparison Purposes — The table also provides information about hypothetical account values and hypothetical expenses based on the Fund’s actual expense ratio and an assumed rate of return of 5% per year before expenses. You may use this information to compare the ongoing costs of investing in your Fund and other funds. To do so, compare this 5% hypothetical example with the 5% hypothetical examples that appear in the shareholder reports of the other funds.
Please note that the expenses shown in the table are meant to highlight your ongoing costs only and do not reflect any transactional costs, such as brokerage commissions paid on purchases and sales of fund shares. Therefore, the hypothetical examples are useful in comparing ongoing costs only and will not help you determine the relative total costs of owning different funds. In addition, if these transactional costs were included, your costs would have been higher.
| 8 | 2015 iSHARES ANNUAL REPORTTO SHAREHOLDERS |
Table of Contents
iSHARES® INTERNATIONAL HIGH YIELD BOND ETF
October 31, 2015
| Security | Principal (000s) | Value | ||||||||||
CORPORATE BONDS & NOTES — 97.68% |
| |||||||||||
AUSTRALIA — 0.31% |
| |||||||||||
Origin Energy Finance Ltd. | ||||||||||||
4.00%, 09/16/74 (Call 09/16/19)a,b | EUR | 600 | $ | 581,598 | ||||||||
|
| |||||||||||
| 581,598 | ||||||||||||
AUSTRIA — 1.07% |
| |||||||||||
BAWAG PSK Bank fuer Arbeit und Wirtschaft und Oesterreichische Postsparkasse AG | ||||||||||||
8.13%, 10/30/23a | EUR | 200 | 274,439 | |||||||||
Raiffeisen Bank International AG | ||||||||||||
1.00%, 04/27/23b | EUR | 200 | 229,215 | |||||||||
4.50%, 02/21/25 (Call 02/21/20)a,b | EUR | 300 | 275,886 | |||||||||
6.00%, 10/16/23a | EUR | 400 | 426,395 | |||||||||
6.63%, 05/18/21 | EUR | 300 | 344,651 | |||||||||
Raiffeisenlandesbank Niederoesterreich-Wien AG | ||||||||||||
5.88%, 11/27/23a | EUR | 200 | 196,628 | |||||||||
Wienerberger AG | ||||||||||||
4.00%, 04/17/20 | EUR | 200 | 235,614 | |||||||||
|
| |||||||||||
| 1,982,828 | ||||||||||||
BELGIUM — 0.66% | ||||||||||||
Barry Callebaut Services NV | ||||||||||||
5.63%, 06/15/21a | EUR | 200 | 259,593 | |||||||||
6.00%, 07/13/17a | EUR | 200 | 239,797 | |||||||||
Ontex Group NV | ||||||||||||
4.75%, 11/15/21 (Call 11/15/17)a | EUR | 200 | 234,186 | |||||||||
Telenet Finance VI Luxembourg SCA | ||||||||||||
4.88%, 07/15/27 (Call 07/15/21)a | EUR | 300 | 322,282 | |||||||||
Univeg Holding BV | ||||||||||||
7.88%, 11/15/20 (Call 11/15/16)a | EUR | 150 | 172,756 | |||||||||
|
| |||||||||||
| 1,228,614 | ||||||||||||
CANADA — 3.02% | ||||||||||||
Air Canada | ||||||||||||
7.63%, 10/01/19 (Call 10/01/16)c | CAD | 200 | 163,183 | |||||||||
| Security | Principal (000s) | Value | ||||||||||
Armtec Holdings Ltd. | ||||||||||||
8.88%, 09/22/17 (Call 11/30/15)d | CAD | 63 | $ | 481 | ||||||||
Athabasca Oil Corp. | ||||||||||||
7.50%, 11/19/17 (Call 11/30/15)c | CAD | 250 | 149,043 | |||||||||
7.50%, 11/19/17 (Call 11/30/15)a | CAD | 100 | 59,617 | |||||||||
AutoCanada Inc. | ||||||||||||
5.63%, 05/25/21 (Call 05/25/17) | CAD | 100 | 74,712 | |||||||||
Baytex Energy Corp. | ||||||||||||
6.63%, 07/19/22 (Call 07/19/17) | CAD | 200 | 136,049 | |||||||||
Bombardier Inc. | ||||||||||||
6.13%, 05/15/21a | EUR | 500 | 488,808 | |||||||||
Canadian Energy Services & Technology Corp. | ||||||||||||
7.38%, 04/17/20 (Call 04/17/17) | CAD | 200 | 149,043 | |||||||||
Cascades Inc. | ||||||||||||
5.50%, 07/15/21 (Call 07/15/17)c | CAD | 175 | 130,412 | |||||||||
Centric Health Corp. | ||||||||||||
8.63%, 04/18/18 (Call 04/18/16) | CAD | 124 | 73,925 | |||||||||
Corus Entertainment Inc. | ||||||||||||
4.25%, 02/11/20a | CAD | 375 | 268,707 | |||||||||
Crew Energy Inc. | ||||||||||||
8.38%, 10/21/20 (Call 10/21/16)a | CAD | 100 | 73,375 | |||||||||
Gateway Casinos & Entertainment Ltd. | ||||||||||||
8.50%, 11/26/20 (Call 11/26/16)c | CAD | 150 | 110,922 | |||||||||
GFL Environmental Inc. | ||||||||||||
7.50%, 06/18/18 (Call 11/30/15)a | CAD | 199 | 151,339 | |||||||||
Gibson Energy Inc. | ||||||||||||
5.38%, 07/15/22 (Call 07/15/17)a | CAD | 125 | 90,285 | |||||||||
5.38%, 07/15/22 (Call 07/15/17)c | CAD | 125 | 89,091 | |||||||||
SCHEDULEOF INVESTMENTS | 9 |
Table of Contents
Schedule of Investments (Continued)
iSHARES® INTERNATIONAL HIGH YIELD BOND ETF
October 31, 2015
| Security | Principal (000s) | Value | ||||||||||
7.00%, 07/15/20 (Call 07/15/16)c | CAD | 100 | $ | 77,770 | ||||||||
Great Canadian Gaming Corp. | ||||||||||||
6.63%, 07/25/22 (Call 07/25/17)c | CAD | 325 | 252,752 | |||||||||
Mattamy Group Corp. | ||||||||||||
6.88%, 11/15/20 (Call 11/30/15)c | CAD | 150 | 113,788 | |||||||||
Newalta Corp. Series 2 | ||||||||||||
7.75%, 11/14/19 (Call 11/30/15) | CAD | 50 | 38,025 | |||||||||
Noralta Lodge Ltd. | ||||||||||||
7.50%, 09/24/19 (Call 09/24/16)a | CAD | 100 | 59,617 | |||||||||
NRL Energy Investments Ltd. | ||||||||||||
8.25%, 04/13/18 (Call 11/30/15) | CAD | 100 | 38,216 | |||||||||
Paramount Resources Ltd. | ||||||||||||
7.63%, 12/04/19 (Call 12/04/15) | CAD | 350 | 253,468 | |||||||||
Parkland Fuel Corp. | ||||||||||||
5.50%, 05/28/21 (Call 05/28/17) | CAD | 100 | 76,432 | |||||||||
6.00%, 11/21/22 (Call 11/21/17) | CAD | 150 | 114,362 | |||||||||
Perpetual Energy Inc. | ||||||||||||
8.75%, 03/15/18 (Call 11/30/15)a | CAD | 100 | 59,617 | |||||||||
8.75%, 07/23/19 (Call 07/23/16) | CAD | 100 | 57,324 | |||||||||
Postmedia Network Inc. | ||||||||||||
8.25%, 08/16/17 (Call 11/30/15)c | CAD | 128 | 96,823 | |||||||||
Precision Drilling Corp. | ||||||||||||
6.50%, 03/15/19 (Call 11/30/15) | CAD | 150 | 108,343 | |||||||||
Quebecor Media Inc. | ||||||||||||
6.63%, 01/15/23c | CAD | 375 | 293,069 | |||||||||
7.38%, 01/15/21 (Call 01/15/16) | CAD | 150 | 119,521 | |||||||||
River Cree Enterprises LP | ||||||||||||
11.00%, 01/20/21 (Call 01/20/18)c | CAD | 100 | 76,432 | |||||||||
| Security | Principal (000s) | Value | ||||||||||
Russel Metals Inc. | ||||||||||||
6.00%, 04/19/22 (Call 04/19/17)c | CAD | 75 | $ | 56,178 | ||||||||
6.00%, 04/19/22 (Call 04/19/17) | CAD | 150 | 112,069 | |||||||||
Sirius XM Canada Holdings Inc. | ||||||||||||
5.63%, 04/23/21 (Call 04/23/17)c | CAD | 150 | 113,502 | |||||||||
Southern Pacific Resource Corp. | ||||||||||||
8.75%, 01/25/18 (Call 11/30/15)c,d | CAD | 50 | 382 | |||||||||
Superior Plus LP | ||||||||||||
6.50%, 12/09/21 (Call 12/09/17) | CAD | 150 | 113,502 | |||||||||
Tervita Corp. | ||||||||||||
9.00%, 11/15/18 (Call 11/30/15)c | CAD | 125 | 65,684 | |||||||||
Trilogy Energy Corp. | ||||||||||||
7.25%, 12/13/19 (Call 12/13/15)c | CAD | 200 | 131,463 | |||||||||
Videotron Ltd. | ||||||||||||
5.63%, 06/15/25 (Call 03/15/25) | CAD | 275 | 210,977 | |||||||||
5.75%, 01/15/26 (Call 09/15/20)a | CAD | 300 | 227,973 | |||||||||
6.88%, 07/15/21 (Call 06/15/16) | CAD | 225 | 181,001 | |||||||||
Wajax Corp. | ||||||||||||
6.13%, 10/23/20 (Call 10/23/17)a | CAD | 100 | 76,146 | |||||||||
Yellow Pages Digital & Media Solutions Ltd. | ||||||||||||
9.25%, 11/30/18 (Call 11/30/15)c | CAD | 348 | 278,992 | |||||||||
|
| |||||||||||
| 5,612,420 | ||||||||||||
DENMARK — 0.28% | ||||||||||||
TDC A/S | ||||||||||||
3.50%, 02/26/49 (Call 02/26/21)a,b | EUR | 500 | 516,424 | |||||||||
|
| |||||||||||
| 516,424 | ||||||||||||
FINLAND — 0.69% | ||||||||||||
Nokia OYJ | ||||||||||||
6.75%, 02/04/19a | EUR | 300 | 383,041 | |||||||||
| 10 | 2015 iSHARES ANNUAL REPORTTO SHAREHOLDERS |
Table of Contents
Schedule of Investments (Continued)
iSHARES® INTERNATIONAL HIGH YIELD BOND ETF
October 31, 2015
| Security | Principal (000s) | Value | ||||||||||
Stora Enso OYJ | ||||||||||||
5.00%, 03/19/18a | EUR | 250 | $ | 299,731 | ||||||||
5.50%, 03/07/19a | EUR | 350 | 432,581 | |||||||||
UPM-Kymmene OYJ | ||||||||||||
6.63%, 01/23/17 | GBP | 100 | 162,951 | |||||||||
|
| |||||||||||
| 1,278,304 | ||||||||||||
FRANCE — 9.97% | ||||||||||||
3AB Optique Developpement SAS | ||||||||||||
5.63%, 04/15/19 (Call 11/30/15)a | EUR | 200 | 214,302 | |||||||||
Areva SA | ||||||||||||
3.13%, 03/20/23 (Call 12/20/22)a | EUR | 500 | 517,528 | |||||||||
3.25%, 09/04/20a | EUR | 300 | 326,728 | |||||||||
3.50%, 03/22/21 | EUR | 500 | 546,003 | |||||||||
4.38%, 11/06/19 | EUR | 400 | 458,766 | |||||||||
4.63%, 10/05/17 | EUR | 700 | 806,239 | |||||||||
4.88%, 09/23/24 | EUR | 600 | 670,492 | |||||||||
Autodis SA | ||||||||||||
6.50%, 02/01/19 (Call 02/01/16)a | EUR | 200 | 227,006 | |||||||||
Cegedim SA | ||||||||||||
6.75%, 04/01/20 (Call 04/01/16)a | EUR | 300 | 351,954 | |||||||||
Cerba European Lab SAS | ||||||||||||
7.00%, 02/01/20 (Call 02/01/16)a | EUR | 350 | 404,026 | |||||||||
CGG SA | ||||||||||||
5.88%, 05/15/20 (Call 05/15/17)a | EUR | 250 | 216,788 | |||||||||
Ciments Francais SA | ||||||||||||
4.75%, 04/04/17a | EUR | 350 | 404,974 | |||||||||
CMA CGM SA | ||||||||||||
7.75%, 01/15/21 (Call 01/15/18)a | EUR | 500 | 511,177 | |||||||||
8.75%, 12/15/18 (Call 12/15/15)a | EUR | 200 | 228,221 | |||||||||
Ephios Bondco PLC | ||||||||||||
6.25%, 07/01/22 (Call 07/01/18)a | EUR | 550 | 631,860 | |||||||||
Ephios Holdco II PLC | ||||||||||||
8.25%, 07/01/23 (Call 07/01/18)a | EUR | 250 | 281,686 | |||||||||
| Security | Principal (000s) | Value | ||||||||||
Europcar Groupe SA | ||||||||||||
5.75%, 06/15/22 (Call 06/15/18)a | EUR | 300 | $ | 344,717 | ||||||||
Faurecia | ||||||||||||
3.13%, 06/15/22 (Call 06/15/18)a | EUR | 450 | 477,209 | |||||||||
9.38%, 12/15/16a | EUR | 300 | 359,564 | |||||||||
Financiere Gaillon 8 SAS | ||||||||||||
7.00%, 09/30/19 (Call 03/31/16)a | EUR | 200 | 227,558 | |||||||||
Groupama SA | ||||||||||||
7.88%, 10/27/39 (Call 10/27/19)b | EUR | 500 | 595,130 | |||||||||
Holdikks SAS | ||||||||||||
6.75%, 07/15/21 (Call 07/15/17)a | EUR | 200 | 217,351 | |||||||||
Holding Medi-Partenaires SAS | ||||||||||||
7.00%, 05/15/20 (Call 05/15/16)a | EUR | 300 | 353,764 | |||||||||
HomeVi SAS | ||||||||||||
6.88%, 08/15/21 (Call 08/15/17)a | EUR | 300 | 346,308 | |||||||||
Horizon Holdings III SASU | ||||||||||||
5.13%, 08/01/22 (Call 08/01/18)a | EUR | 200 | 228,663 | |||||||||
La Financiere Atalian SAS | ||||||||||||
7.25%, 01/15/20 (Call 01/15/17)a | EUR | 200 | 236,395 | |||||||||
Labeyrie Fine Foods SAS | ||||||||||||
5.63%, 03/15/21 (Call 03/15/17)a | EUR | 250 | 291,379 | |||||||||
Loxam SAS | ||||||||||||
4.88%, 07/23/21 (Call 07/23/17)a | EUR | 300 | 343,822 | |||||||||
7.00%, 07/23/22 (Call 07/23/17)a | EUR | 150 | 171,497 | |||||||||
Nexans SA | ||||||||||||
4.25%, 03/19/18 | EUR | 200 | 229,767 | |||||||||
5.75%, 05/02/17 | EUR | 200 | 229,767 | |||||||||
Novafives SAS | ||||||||||||
4.50%, 06/30/21 (Call 06/30/17)a | EUR | 250 | 231,976 | |||||||||
Novalis SAS | ||||||||||||
3.00%, 04/30/22 (Call 04/30/18)a | EUR | 550 | 586,293 | |||||||||
SCHEDULEOF INVESTMENTS | 11 |
Table of Contents
Schedule of Investments (Continued)
iSHARES® INTERNATIONAL HIGH YIELD BOND ETF
October 31, 2015
| Security | Principal (000s) | Value | ||||||||||
Numericable-SFR SAS | ||||||||||||
5.38%, 05/15/22 (Call 05/15/17)a | EUR | 700 | $ | 798,386 | ||||||||
5.63%, 05/15/24 (Call 05/15/19)a | EUR | 800 | 906,918 | |||||||||
PagesJaunes Finance & Co. SCA | ||||||||||||
8.88%, 06/01/18 (Call 11/09/15)a | EUR | 200 | 174,535 | |||||||||
Paprec Holding | ||||||||||||
5.25%, 04/01/22 (Call 04/01/18)a | EUR | 200 | 220,930 | |||||||||
Peugeot SA | ||||||||||||
5.63%, 07/11/17 | EUR | 200 | 235,851 | |||||||||
6.50%, 01/18/19a | EUR | 400 | 503,104 | |||||||||
7.38%, 03/06/18a | EUR | 650 | 808,521 | |||||||||
Rexel SA | ||||||||||||
3.25%, 06/15/22 (Call 06/15/18)a | EUR | 300 | 318,139 | |||||||||
5.13%, 06/15/20 (Call 06/15/16)a | EUR | 450 | 520,704 | |||||||||
SGD Group SAS | ||||||||||||
5.63%, 05/15/19 (Call 11/30/15)a | EUR | 200 | 225,349 | |||||||||
SMCP SAS | ||||||||||||
8.88%, 06/15/20 (Call 06/15/16)a | EUR | 200 | 237,500 | |||||||||
SPCM SA | ||||||||||||
2.88%, 06/15/23 (Call 06/15/18)a | EUR | 350 | 369,229 | |||||||||
Tereos Finance Groupe I | ||||||||||||
4.25%, 03/04/20 (Call 03/04/19) | EUR | 300 | 294,942 | |||||||||
THOM Europe SAS | ||||||||||||
7.38%, 07/15/19 (Call 07/15/16)a | EUR | 200 | 235,843 | |||||||||
Vallourec SA | ||||||||||||
2.25%, 09/30/24a | EUR | 400 | 302,948 | |||||||||
3.25%, 08/02/19 | EUR | 100 | 97,134 | |||||||||
|
| |||||||||||
| 18,518,943 | ||||||||||||
GERMANY — 15.27% | ||||||||||||
Bayerische Landbank | ||||||||||||
5.75%, 10/23/17a | EUR | 600 | 716,258 | |||||||||
Bilfinger SE | ||||||||||||
2.38%, 12/07/19a | EUR | 300 | 339,002 | |||||||||
| Security | Principal (000s) | Value | ||||||||||
CeramTec Group GmbH | ||||||||||||
8.25%, 08/15/21 (Call 08/15/16)a | EUR | 200 | $ | 237,610 | ||||||||
Commerzbank AG | ||||||||||||
6.38%, 03/22/19 | EUR | 900 | 1,125,837 | |||||||||
7.75%, 03/16/21 | EUR | 800 | 1,071,963 | |||||||||
Deutsche Lufthansa AG | ||||||||||||
1.00%, 08/12/75 (Call 02/12/21)a,b | EUR | 400 | 450,255 | |||||||||
1.13%, 09/12/19a | EUR | 250 | 277,702 | |||||||||
Deutsche Raststaetten | ||||||||||||
6.75%, 12/30/20 (Call 12/30/16)a | EUR | 300 | 357,907 | |||||||||
Douglas GmbH | ||||||||||||
6.25%, 07/15/22 (Call 07/15/18)a | EUR | 150 | 174,297 | |||||||||
FMC Finance VII SA | ||||||||||||
5.25%, 02/15/21a | EUR | 200 | 255,536 | |||||||||
FMC Finance VIII SA | ||||||||||||
5.25%, 07/31/19a | EUR | 150 | 187,984 | |||||||||
6.50%, 09/15/18a | EUR | 250 | 316,565 | |||||||||
Franz Haniel & Cie GmbH | ||||||||||||
5.88%, 02/01/17 | EUR | 100 | 117,369 | |||||||||
Fresenius Finance BV | ||||||||||||
2.38%, 02/01/19a | EUR | 200 | 230,872 | |||||||||
2.88%, 07/15/20a | EUR | 350 | 408,859 | |||||||||
3.00%, 02/01/21a | EUR | 300 | 351,942 | |||||||||
4.00%, 02/01/24a | EUR | 350 | 431,090 | |||||||||
4.25%, 04/15/19a | EUR | 300 | 365,032 | |||||||||
FTE Verwaltungs GmbH | ||||||||||||
9.00%, 07/15/20 (Call 07/15/16)a | EUR | 200 | 233,081 | |||||||||
Galapagos Holding SA | ||||||||||||
7.00%, 06/15/22 (Call 06/15/17)a | EUR | 200 | 201,599 | |||||||||
Hapag-Lloyd AG | ||||||||||||
7.50%, 10/15/19 (Call 10/15/16)a | EUR | 200 | 228,663 | |||||||||
7.75%, 10/01/18 (Call 11/30/15)a | EUR | 200 | 227,006 | |||||||||
Heckler & Koch GmbH | ||||||||||||
9.50%, 05/15/18 (Call 11/30/15)a | EUR | 200 | 169,122 | |||||||||
| 12 | 2015 iSHARES ANNUAL REPORTTO SHAREHOLDERS |
Table of Contents
Schedule of Investments (Continued)
iSHARES® INTERNATIONAL HIGH YIELD BOND ETF
October 31, 2015
| Security | Principal (000s) | Value | ||||||||||
HeidelbergCement Finance Luxembourg SA | ||||||||||||
2.25%, 03/12/19a | EUR | 300 | $ | 339,799 | ||||||||
3.25%, 10/21/20a | EUR | 200 | 235,313 | |||||||||
3.25%, 10/21/21a | EUR | 300 | 349,787 | |||||||||
5.63%, 01/04/18 | EUR | 400 | 483,969 | |||||||||
7.50%, 04/03/20a | EUR | 400 | 544,593 | |||||||||
8.00%, 01/31/17a | EUR | 500 | 601,243 | |||||||||
8.50%, 10/31/19a | EUR | 350 | 484,439 | |||||||||
9.50%, 12/15/18a | EUR | 400 | 548,174 | |||||||||
Hornbach Baumarkt AG | ||||||||||||
3.88%, 02/15/20a | EUR | 150 | 178,091 | |||||||||
HP Pelzer Holding GmbH | ||||||||||||
7.50%, 07/15/21 (Call 07/15/17)a | EUR | 150 | 173,982 | |||||||||
KION Finance SA | ||||||||||||
6.75%, 02/15/20 (Call 02/15/16)a | EUR | 350 | 404,026 | |||||||||
Kirk Beauty One GmbH | ||||||||||||
8.75%, 07/15/23 (Call 07/15/18)a | EUR | 250 | 278,924 | |||||||||
KraussMaffei Group GmbH | ||||||||||||
8.75%, 12/15/20 (Call 12/15/15)a | EUR | 160 | 188,232 | |||||||||
Norddeutsche Landesbank Girozentrale | ||||||||||||
6.00%, 06/29/20 | EUR | 300 | 379,447 | |||||||||
Pfleiderer GmbH | ||||||||||||
7.88%, 08/01/19 (Call 08/01/16)a | EUR | 250 | 285,828 | |||||||||
Phoenix PIB Dutch Finance BV | ||||||||||||
3.13%, 05/27/20a | EUR | 200 | 229,325 | |||||||||
3.63%, 07/30/21a | EUR | 200 | 230,596 | |||||||||
ProGroup AG | ||||||||||||
5.13%, 05/01/22 (Call 05/01/18)a | EUR | 200 | 231,977 | |||||||||
Rapid Holding GmbH | ||||||||||||
6.63%, 11/15/20 (Call 05/15/17)a | EUR | 300 | 331,395 | |||||||||
Rheinmetall AG | ||||||||||||
5.25%, 09/22/17 | EUR | 300 | 356,598 | |||||||||
Schaeffler Finance BV | ||||||||||||
2.50%, 05/15/20 (Call 05/15/17)a | EUR | 300 | 332,224 | |||||||||
| Security | Principal (000s) | Value | ||||||||||
2.75%, 05/15/19 (Call 05/15/16)a | EUR | 350 | $ | 390,494 | ||||||||
3.25%, 05/15/19 (Call 05/15/16)a | EUR | 350 | 393,394 | |||||||||
3.25%, 05/15/25 (Call 05/15/20)a | EUR | 500 | 549,563 | |||||||||
3.50%, 05/15/22 (Call 05/15/17)a | EUR | 300 | 338,023 | |||||||||
4.25%, 05/15/18 (Call 11/30/15)a | EUR | 250 | 281,686 | |||||||||
SGL Carbon SE | ||||||||||||
4.88%, 01/15/21 (Call 01/15/17)a | EUR | 200 | 214,302 | |||||||||
Takko Luxembourg 2 SCA | ||||||||||||
9.88%, 04/15/19 (Call 04/15/16)a | EUR | 300 | 215,407 | |||||||||
Techem Energy Metering Service GmbH & Co. KG | ||||||||||||
7.88%, 10/01/20 (Call 10/01/16)a | EUR | 200 | 239,267 | |||||||||
Techem GmbH | ||||||||||||
6.13%, 10/01/19 (Call 11/30/15)a | EUR | 250 | 289,625 | |||||||||
ThyssenKrupp AG | ||||||||||||
1.75%, 11/25/20 (Call 08/25/20)a | EUR | 450 | 485,908 | |||||||||
2.50%, 02/25/25a | EUR | 450 | 471,119 | |||||||||
3.13%, 10/25/19 (Call 07/25/19)a | EUR | 800 | 919,073 | |||||||||
4.00%, 08/27/18 | EUR | 1,000 | 1,172,726 | |||||||||
4.38%, 02/28/17 | EUR | 900 | 1,034,053 | |||||||||
Trionista Holdco GmbH | ||||||||||||
5.00%, 04/30/20 (Call 04/30/16)a | EUR | 200 | 229,215 | |||||||||
Trionista TopCo GmbH | ||||||||||||
6.88%, 04/30/21 (Call 04/30/16)a | EUR | 400 | 470,029 | |||||||||
TUI AG | ||||||||||||
4.50%, 10/01/19 (Call 10/01/16)a | EUR | 250 | 289,142 | |||||||||
Unitymedia GmbH | ||||||||||||
3.75%, 01/15/27 (Call 01/15/21)a | EUR | 400 | 392,725 | |||||||||
SCHEDULEOF INVESTMENTS | 13 |
Table of Contents
Schedule of Investments (Continued)
iSHARES® INTERNATIONAL HIGH YIELD BOND ETF
October 31, 2015
| Security | Principal (000s) | Value | ||||||||||
Unitymedia Hessen GmbH & Co. KG/Unitymedia NRW GmbH | ||||||||||||
3.50%, 01/15/27 (Call 01/15/21)a | EUR | 300 | $ | 318,139 | ||||||||
4.00%, 01/15/25 (Call 01/15/20)a | EUR | 600 | 662,790 | |||||||||
5.13%, 01/21/23 (Call 01/21/18)a | EUR | 270 | 316,151 | |||||||||
5.50%, 09/15/22 (Call 09/15/17)a | EUR | 360 | 425,511 | |||||||||
5.63%, 04/15/23 (Call 04/15/18)a | EUR | 270 | 318,388 | |||||||||
5.75%, 01/15/23 (Call 01/15/18)a | EUR | 360 | 424,517 | |||||||||
WEPA Hygieneprodukte GmbH | ||||||||||||
6.50%, 05/15/20 (Call 05/15/16)a | EUR | 200 | 234,738 | |||||||||
ZF North America Capital Inc. | ||||||||||||
2.25%, 04/26/19a | EUR | 800 | 883,720 | |||||||||
2.75%, 04/27/23a | EUR | 700 | 744,258 | |||||||||
|
| |||||||||||
| 28,367,476 | ||||||||||||
GREECE — 1.57% | ||||||||||||
Alpha Credit Group PLC | ||||||||||||
3.38%, 06/17/17a | EUR | 250 | 243,023 | |||||||||
ERB Hellas PLC | ||||||||||||
4.25%, 06/26/18a | EUR | 350 | 304,663 | |||||||||
Frigoglass Finance BV | ||||||||||||
8.25%, 05/15/18 (Call 11/30/15)a | EUR | 200 | 217,616 | |||||||||
Intralot Finance Luxembourg SA | ||||||||||||
9.75%, 08/15/18 (Call 08/15/16)a | EUR | 150 | 174,844 | |||||||||
NBG Finance PLC | ||||||||||||
4.38%, 04/30/19a | EUR | 500 | 436,337 | |||||||||
OTE PLC | ||||||||||||
3.50%, 07/09/20a | EUR | 500 | 528,851 | |||||||||
7.88%, 02/07/18a | EUR | 400 | 475,220 | |||||||||
PPC Finance PLC | ||||||||||||
5.50%, 05/01/19 (Call 05/01/16)a | EUR | 300 | 285,000 | |||||||||
Titan Global Finance PLC | ||||||||||||
4.25%, 07/10/19a | EUR | 225 | 242,333 | |||||||||
|
| |||||||||||
| 2,907,887 | ||||||||||||
| Security | Principal (000s) | Value | ||||||||||
INDIA — 0.17% | ||||||||||||
Samvardhana Motherson Automotive Systems Group BV | ||||||||||||
4.13%, 07/15/21 (Call 07/15/17)a | EUR | 300 | $ | 319,796 | ||||||||
|
| |||||||||||
| 319,796 | ||||||||||||
IRELAND — 2.29% | ||||||||||||
Allied Irish Banks PLC | ||||||||||||
1.38%, 03/16/20a | EUR | 400 | 442,355 | |||||||||
2.75%, 04/16/19a | EUR | 300 | 346,977 | |||||||||
2.88%, 11/28/16a | EUR | 250 | 281,575 | |||||||||
Ardagh Packaging Finance PLC | ||||||||||||
9.25%, 10/15/20 (Call 11/30/15)a | EUR | 300 | 348,379 | |||||||||
Ardagh Packaging Finance PLC/Ardagh Holdings USA Inc. | ||||||||||||
4.25%, 01/15/22 (Call 06/30/17)a | EUR | 800 | 892,557 | |||||||||
Bank of Ireland | ||||||||||||
4.25%, 06/11/24 (Call 06/11/19)a,b | EUR | 550 | 626,544 | |||||||||
10.00%, 12/19/22a | EUR | 100 | 146,919 | |||||||||
eircom Finance Ltd. | ||||||||||||
9.25%, 05/15/20 (Call 05/15/16)a | EUR | 200 | 237,500 | |||||||||
Smurfit Kappa Acquisitions | ||||||||||||
2.75%, 02/01/25a | EUR | 150 | 163,212 | |||||||||
3.25%, 06/01/21 (Call 03/10/21)a | EUR | 300 | 347,965 | |||||||||
4.13%, 01/30/20a | EUR | 350 | 424,362 | |||||||||
|
| |||||||||||
| 4,258,345 | ||||||||||||
ITALY — 19.29% | ||||||||||||
Astaldi SpA | ||||||||||||
7.13%, 12/01/20 (Call 12/01/16)a | EUR | 450 | 516,976 | |||||||||
Autostrada Brescia Verona Vicenza Padova SpA | ||||||||||||
2.38%, 03/20/20a | EUR | 350 | 389,721 | |||||||||
Banca Monte dei Paschi di Siena SpA | ||||||||||||
3.63%, 04/01/19a | EUR | 800 | 893,412 | |||||||||
5.00%, 04/21/20a | EUR | 250 | 281,686 | |||||||||
5.60%, 09/09/20 | EUR | 200 | 226,729 | |||||||||
| 14 | 2015 iSHARES ANNUAL REPORTTO SHAREHOLDERS |
Table of Contents
Schedule of Investments (Continued)
iSHARES® INTERNATIONAL HIGH YIELD BOND ETF
October 31, 2015
| Security | Principal (000s) | Value | ||||||||||
Banca Popolare di Milano Scarl | ||||||||||||
4.25%, 01/30/19a | EUR | 350 | $ | 410,893 | ||||||||
7.13%, 03/01/21a | EUR | 300 | 371,023 | |||||||||
Banca Popolare di Vicenza | ||||||||||||
2.75%, 03/20/20a | EUR | 500 | 510,002 | |||||||||
3.50%, 01/20/17a | EUR | 400 | 436,953 | |||||||||
5.00%, 10/25/18a | EUR | 200 | 224,878 | |||||||||
Banco Popolare SC | ||||||||||||
2.38%, 01/22/18a | EUR | 500 | 559,589 | |||||||||
2.63%, 09/21/18a | EUR | 400 | 448,899 | |||||||||
2.75%, 07/27/20a | EUR | 600 | 669,310 | |||||||||
3.50%, 03/14/19a | EUR | 800 | 915,363 | |||||||||
6.00%, 11/05/20a | EUR | 400 | 478,751 | |||||||||
6.38%, 05/31/21a | EUR | 300 | 365,210 | |||||||||
Bormioli Rocco Holdings SA | ||||||||||||
10.00%, 08/01/18 (Call 11/30/15)a | EUR | 200 | 230,319 | |||||||||
Buzzi Unicem SpA | ||||||||||||
5.13%, 12/09/16a | EUR | 100 | 115,091 | |||||||||
6.25%, 09/28/18a | EUR | 350 | 430,832 | |||||||||
Cerved Group SpA | ||||||||||||
6.38%, 01/15/20 (Call 01/15/16)a | EUR | 200 | 228,663 | |||||||||
Cooperativa Muratori & Cementisti-CMC di Ravenna SC | ||||||||||||
7.50%, 08/01/21 (Call 08/01/17)a | EUR | 150 | 153,270 | |||||||||
Enel SpA | ||||||||||||
5.00%, 01/15/75 (Call 01/15/20)a,b | EUR | 700 | 813,851 | |||||||||
6.50%, 01/10/74 (Call 01/10/19)a,b | EUR | 800 | 956,627 | |||||||||
Fiat Finance North America Inc. | ||||||||||||
5.63%, 06/12/17 | EUR | 550 | 642,412 | |||||||||
Finmeccanica SA | ||||||||||||
8.00%, 12/16/19 | GBP | 250 | 446,138 | |||||||||
Finmeccanica SpA | ||||||||||||
4.50%, 01/19/21 | EUR | 400 | 487,925 | |||||||||
Iccrea Banca SpA | ||||||||||||
1.88%, 11/25/19a | EUR | 450 | 501,579 | |||||||||
Intesa Sanpaolo SpA | ||||||||||||
2.86%, 04/23/25a | EUR | 400 | 429,877 | |||||||||
3.93%, 09/15/26a | EUR | 600 | 686,837 | |||||||||
5.00%, 09/23/19a | EUR | 600 | 728,291 | |||||||||
| Security | Principal (000s) | Value | ||||||||||
5.15%, 07/16/20 | EUR | 600 | $ | 740,870 | ||||||||
6.63%, 05/08/18a | EUR | 550 | 666,734 | |||||||||
6.63%, 09/13/23a | EUR | 950 | 1,279,282 | |||||||||
Italcementi Finance SA | ||||||||||||
6.13%, 02/21/18a | EUR | 300 | 363,872 | |||||||||
6.63%, 03/19/20a,e | EUR | 500 | 652,020 | |||||||||
IVS F SpA | ||||||||||||
7.13%, 04/01/20 (Call 04/01/16)a | EUR | 200 | 231,446 | |||||||||
Manutencoop Facility Management SpA | ||||||||||||
8.50%, 08/01/20 (Call 08/01/16)a | EUR | 200 | 201,046 | |||||||||
Mediobanca SpA | ||||||||||||
5.00%, 11/15/20 | EUR | 500 | 611,391 | |||||||||
5.75%, 04/18/23 | EUR | 300 | 381,588 | |||||||||
Piaggio & C SpA | ||||||||||||
4.63%, 04/30/21 (Call 04/30/17)a | EUR | 200 | 227,558 | |||||||||
Rhino Bondco SpA | ||||||||||||
7.25%, 11/15/20 (Call 11/01/16)a | EUR | 200 | 236,395 | |||||||||
Salini Costruttori SpA | ||||||||||||
6.13%, 08/01/18 | EUR | 300 | 361,415 | |||||||||
Sisal Group SpA | ||||||||||||
7.25%, 09/30/17 (Call 11/09/15)a | EUR | 200 | 218,721 | |||||||||
Snai SpA | ||||||||||||
7.63%, 06/15/18 (Call 12/15/15)a | EUR | 200 | 222,874 | |||||||||
TeamSystem Holding SpA | ||||||||||||
7.38%, 05/15/20 (Call 05/15/16)a | EUR | 265 | 304,442 | |||||||||
Telecom Italia SpA | ||||||||||||
3.25%, 01/16/23a | EUR | 600 | 687,446 | |||||||||
4.00%, 01/21/20a | EUR | 500 | 603,937 | |||||||||
4.50%, 09/20/17a | EUR | 400 | 472,415 | |||||||||
4.50%, 01/25/21a | EUR | 250 | 308,089 | |||||||||
4.75%, 05/25/18a | EUR | 300 | 361,901 | |||||||||
4.88%, 09/25/20a | EUR | 300 | 374,891 | |||||||||
5.25%, 02/10/22a | EUR | 500 | 636,277 | |||||||||
5.38%, 01/29/19a | EUR | 400 | 497,578 | |||||||||
6.13%, 12/14/18 | EUR | 350 | 441,761 | |||||||||
6.38%, 06/24/19 | GBP | 400 | 672,647 | |||||||||
SCHEDULEOF INVESTMENTS | 15 |
Table of Contents
Schedule of Investments (Continued)
iSHARES® INTERNATIONAL HIGH YIELD BOND ETF
October 31, 2015
| Security | Principal (000s) | Value | ||||||||||
7.00%, 01/20/17a | EUR | 300 | $ | 357,002 | ||||||||
UniCredit SpA | ||||||||||||
5.75%, 09/26/17 | EUR | 700 | 835,113 | |||||||||
5.75%, 10/28/25 (Call 10/28/20)a,b | EUR | 800 | 965,464 | |||||||||
6.13%, 04/19/21a | EUR | 600 | 755,117 | |||||||||
6.70%, 06/05/18a | EUR | 450 | 554,507 | |||||||||
6.95%, 10/31/22a | EUR | 800 | 1,049,072 | |||||||||
Unipol Gruppo Finanziario SpA | ||||||||||||
3.00%, 03/18/25a | EUR | 750 | 776,806 | |||||||||
4.38%, 03/05/21a | EUR | 240 | 281,860 | |||||||||
Veneto Banca SCPA | ||||||||||||
4.00%, 01/20/17a | EUR | 400 | 445,348 | |||||||||
4.00%, 05/20/19a | EUR | 300 | 334,635 | |||||||||
Wind Acquisition Finance SA | ||||||||||||
4.00%, 07/15/20 (Call 07/15/16)a | EUR | 1,700 | 1,910,769 | |||||||||
7.00%, 04/23/21 (Call 04/23/17)a | EUR | 1,100 | 1,251,569 | |||||||||
|
| |||||||||||
| 35,824,965 | ||||||||||||
JAPAN — 1.14% | ||||||||||||
SoftBank Group Corp. | ||||||||||||
4.00%, 07/30/22 (Call 04/30/22)a | EUR | 400 | 450,145 | |||||||||
4.63%, 04/15/20a | EUR | 400 | 467,267 | |||||||||
4.75%, 07/30/25 (Call 04/30/25)a | EUR | 700 | 768,422 | |||||||||
5.25%, 07/30/27 (Call 04/30/27)a | EUR | 400 | 437,442 | |||||||||
|
| |||||||||||
| 2,123,276 | ||||||||||||
LUXEMBOURG — 5.98% | ||||||||||||
Altice Financing SA | ||||||||||||
5.25%, 02/15/23 (Call 02/15/18)a | EUR | 300 | 332,195 | |||||||||
6.50%, 01/15/22 (Call 12/15/16)a | EUR | 150 | 173,883 | |||||||||
Altice Finco SA | ||||||||||||
9.00%, 06/15/23 (Call 06/15/18)a | EUR | 200 | 250,203 | |||||||||
Altice Luxembourg SA | ||||||||||||
6.25%, 02/15/25 (Call 02/15/20)a | EUR | 450 | 440,548 | |||||||||
| Security | Principal (000s) | Value | ||||||||||
7.25%, 05/15/22 (Call 05/15/17)a | EUR | 1,400 | $ | 1,500,115 | ||||||||
ArcelorMittal | ||||||||||||
2.88%, 07/06/20a | EUR | 400 | 395,918 | |||||||||
3.00%, 03/25/19a | EUR | 600 | 622,083 | |||||||||
3.00%, 04/09/21a | EUR | 200 | 195,071 | |||||||||
3.13%, 01/14/22a | EUR | 500 | 477,761 | |||||||||
5.75%, 03/29/18a | EUR | 400 | 457,855 | |||||||||
5.88%, 11/17/17a | EUR | 550 | 631,581 | |||||||||
Befesa Zinc SAU Via Zinc Capital SA | ||||||||||||
8.88%, 05/15/18 (Call 11/30/15)a | EUR | 200 | 224,332 | |||||||||
ConvaTec Healthcare E SA | ||||||||||||
10.88%, 12/15/18 (Call 11/30/15)a | EUR | 150 | 171,497 | |||||||||
Garfunkelux Holdco 3 SA | ||||||||||||
7.50%, 08/01/22 (Call 08/01/18)a | EUR | 300 | 335,040 | |||||||||
8.50%, 11/01/22 (Call 11/01/18)a | GBP | 350 | 543,453 | |||||||||
GCS Holdco Finance I SA | ||||||||||||
6.50%, 11/15/18 (Call 11/30/15)a | EUR | 250 | 285,828 | |||||||||
Geo Debt Finance SCA | ||||||||||||
7.50%, 08/01/18 (Call 11/30/15)a | EUR | 200 | 209,331 | |||||||||
INEOS Group Holdings SA | ||||||||||||
5.75%, 02/15/19 (Call 02/15/16)a | EUR | 350 | 387,594 | |||||||||
6.50%, 08/15/18 (Call 11/30/15)a | EUR | 350 | 393,394 | |||||||||
LSF9 Balta Issuer SA | ||||||||||||
7.75%, 09/15/22 (Call 09/15/18)a | EUR | 150 | 173,651 | |||||||||
Magnolia BC SA | ||||||||||||
9.00%, 08/01/20 (Call 08/01/16)a | EUR | 200 | 239,157 | |||||||||
Matterhorn Telecom Holding SA | ||||||||||||
4.88%, 05/01/23 (Call 05/01/18)a | EUR | 200 | 189,448 | |||||||||
Matterhorn Telecom SA | ||||||||||||
3.88%, 05/01/22 (Call 05/01/18)a | EUR | 600 | 608,110 | |||||||||
| 16 | 2015 iSHARES ANNUAL REPORTTO SHAREHOLDERS |
Table of Contents
Schedule of Investments (Continued)
iSHARES® INTERNATIONAL HIGH YIELD BOND ETF
October 31, 2015
| Security | Principal (000s) | Value | ||||||||||
Picard Bondco SA | ||||||||||||
7.75%, 02/01/20 (Call 08/01/16)a | EUR | 250 | $ | 294,942 | ||||||||
SIG Combibloc Holdings SCA | ||||||||||||
7.75%, 02/15/23 (Call 02/15/18)a | EUR | 450 | 523,190 | |||||||||
Telenet Finance III Luxembourg SCA | ||||||||||||
6.63%, 02/15/21 (Call 02/15/16)a | EUR | 200 | 230,473 | |||||||||
Telenet Finance V Luxembourg SCA | ||||||||||||
6.25%, 08/15/22 (Call 08/15/17)a | EUR | 250 | 298,256 | |||||||||
6.75%, 08/15/24 (Call 08/15/18)a | EUR | 200 | 242,471 | |||||||||
Unilabs Subholding AB | ||||||||||||
8.50%, 07/15/18 (Call 11/09/15)a | EUR | 250 | 288,038 | |||||||||
|
| |||||||||||
| 11,115,418 | ||||||||||||
NETHERLANDS — 2.51% | ||||||||||||
Atradius Finance BV | ||||||||||||
5.25%, 09/23/44 (Call 09/23/24)a,b | EUR | 150 | 144,372 | |||||||||
Carlson Wagonlit BV | ||||||||||||
7.50%, 06/15/19 (Call 11/30/15)a | EUR | 200 | 231,844 | |||||||||
Constellium NV | ||||||||||||
4.63%, 05/15/21 (Call 05/15/17)a | EUR | 150 | 133,386 | |||||||||
Hema Bondco I BV | ||||||||||||
6.25%, 06/15/19 (Call 06/15/16)a | EUR | 200 | 159,070 | |||||||||
InterXion Holding NV | ||||||||||||
6.00%, 07/15/20 (Call 07/15/16)a | EUR | 350 | 409,825 | |||||||||
LGE HoldCo VI BV | ||||||||||||
7.13%, 05/15/24 (Call 05/15/19)a | EUR | 400 | 479,418 | |||||||||
Nyrstar Netherlands Holdings BV | ||||||||||||
8.50%, 09/15/19a | EUR | 250 | 215,407 | |||||||||
OI European Group BV | ||||||||||||
4.88%, 03/31/21a | EUR | 200 | 237,500 | |||||||||
6.75%, 09/15/20a | EUR | 300 | 386,075 | |||||||||
| Security | Principal (000s) | Value | ||||||||||
SNS BANK NV | ||||||||||||
6.25%, 10/26/20 | EUR | 50 | $ | — | ||||||||
Stork Technical Services Holdings BV | ||||||||||||
11.00%, 08/15/17 (Call 11/30/15)a | EUR | 200 | 214,302 | |||||||||
UPC Holding BV | ||||||||||||
6.38%, 09/15/22 (Call 09/15/17)a | EUR | 400 | 473,895 | |||||||||
6.75%, 03/15/23 (Call 03/15/18)a | EUR | 200 | 240,814 | |||||||||
UPCB Finance IV Ltd. | ||||||||||||
4.00%, 01/15/27 (Call 01/15/21)a | EUR | 400 | 414,244 | |||||||||
Ziggo Bond Finance BV | ||||||||||||
4.63%, 01/15/25 (Call 01/15/20)a | EUR | 300 | 311,511 | |||||||||
Ziggo Secured Finance BV | ||||||||||||
3.75%, 01/15/25 (Call 01/15/20)a | EUR | 600 | 614,738 | |||||||||
|
| |||||||||||
| 4,666,401 | ||||||||||||
NORWAY — 0.47% | ||||||||||||
Lock AS | ||||||||||||
7.00%, 08/15/21 (Call 08/15/17)a | EUR | 400 | 462,849 | |||||||||
Lock Lower Holding AS | ||||||||||||
9.50%, 08/15/22 (Call 08/15/18)a | EUR | 200 | 229,767 | |||||||||
Norske Skog AS | ||||||||||||
11.75%, 12/15/19 (Call 02/15/17)a | EUR | 200 | 185,581 | |||||||||
|
| |||||||||||
| 878,197 | ||||||||||||
PORTUGAL — 1.25% | ||||||||||||
Banco Comercial Portugues SA | ||||||||||||
3.38%, 02/27/17a | EUR | 300 | 328,512 | |||||||||
EDP — Energias de Portugal SA | ||||||||||||
1.00%, 09/16/75 (Call 03/16/21)a,b | EUR | 500 | 550,281 | |||||||||
Novo Banco SA | ||||||||||||
2.63%, 05/08/17a | EUR | 600 | 614,738 | |||||||||
4.00%, 01/21/19a | EUR | 400 | 405,937 | |||||||||
4.75%, 01/15/18a | EUR | 400 | 412,211 | |||||||||
|
| |||||||||||
| 2,311,679 | ||||||||||||
SCHEDULEOF INVESTMENTS | 17 |
Table of Contents
Schedule of Investments (Continued)
iSHARES® INTERNATIONAL HIGH YIELD BOND ETF
October 31, 2015
| Security | Principal (000s) | Value | ||||||||||
SOUTH AFRICA — 0.14% | ||||||||||||
Sappi Papier Holding GmbH | ||||||||||||
3.38%, 04/01/22 (Call 04/01/18)a | EUR | 250 | $ | 260,628 | ||||||||
|
| |||||||||||
| 260,628 | ||||||||||||
SPAIN — 5.39% | ||||||||||||
Abengoa Finance SAU | ||||||||||||
6.00%, 03/31/21a | EUR | 300 | 142,533 | |||||||||
7.00%, 04/15/20a | EUR | 200 | 100,523 | |||||||||
8.88%, 02/05/18a | EUR | 350 | 193,333 | |||||||||
Abengoa Greenfield SA | ||||||||||||
5.50%, 10/01/19a | EUR | 250 | 107,731 | |||||||||
Aldesa Financial Services SA | ||||||||||||
7.25%, 04/01/21 (Call 04/01/17)a | EUR | 150 | 142,500 | |||||||||
Almirall SA | ||||||||||||
4.63%, 04/01/21 (Call 04/01/17)a | EUR | 200 | 229,929 | |||||||||
Banco de Sabadell SA | ||||||||||||
2.50%, 12/05/16a | EUR | 300 | 338,122 | |||||||||
6.25%, 04/26/20 | EUR | 300 | 367,849 | |||||||||
Bankia SA | ||||||||||||
3.50%, 01/17/19a | EUR | 700 | 816,789 | |||||||||
4.00%, 05/22/24 (Call 05/22/19)a,b | EUR | 600 | 662,790 | |||||||||
4.38%, 02/14/17 | EUR | 300 | 345,814 | |||||||||
Bankinter SA | ||||||||||||
6.38%, 09/11/19a | EUR | 150 | 188,079 | |||||||||
BPE Financiaciones SA | ||||||||||||
2.00%, 02/03/20a | EUR | 600 | 660,555 | |||||||||
2.50%, 02/01/17 | EUR | 300 | 337,505 | |||||||||
CaixaBank SA | ||||||||||||
5.00%, 11/14/23 (Call 11/14/18)a,b | EUR | 500 | 581,764 | |||||||||
Campofrio Food Group SA | ||||||||||||
3.38%, 03/15/22 (Call 03/15/18)a | EUR | 300 | 333,383 | |||||||||
Cellnex Telecom SAU | ||||||||||||
3.13%, 07/27/22a | EUR | 400 | 433,001 | |||||||||
Cirsa Funding Luxembourg SA | ||||||||||||
5.88%, 05/15/23 (Call 05/15/18)a | EUR | 300 | 313,168 | |||||||||
8.75%, 05/15/18 (Call 11/30/15)a | EUR | 212 | 239,369 | |||||||||
| Security | Principal (000s) | Value | ||||||||||
Ence Energia y Celulosa SA | ||||||||||||
5.38%, 11/01/22a | EUR | 150 | $ | 169,840 | ||||||||
Gestamp Funding Luxembourg SA | ||||||||||||
5.88%, 05/31/20 (Call 05/31/16)a | EUR | 350 | 402,093 | |||||||||
Grupo Antolin Dutch BV | ||||||||||||
4.75%, 04/01/21 (Call 04/01/17)a | EUR | 250 | 282,376 | |||||||||
5.13%, 06/30/22 (Call 06/30/18)a | EUR | 300 | 338,851 | |||||||||
Grupo Isolux Corsan Finance BV | ||||||||||||
6.63%, 04/15/21 (Call 04/15/17)a | EUR | 500 | 245,785 | |||||||||
Ibercaja Banco SA | ||||||||||||
5.00%, 07/28/25 (Call 07/28/20)a,b | EUR | 300 | 320,625 | |||||||||
NH Hotel Group SA | ||||||||||||
6.88%, 11/15/19 (Call 11/15/17)a | EUR | 150 | 181,025 | |||||||||
Obrascon Huarte Lain SA | ||||||||||||
4.75%, 03/15/22 (Call 03/15/18)a | EUR | 250 | 248,891 | |||||||||
5.50%, 03/15/23 (Call 03/15/18)a | EUR | 200 | 203,256 | |||||||||
7.63%, 03/15/20 (Call 03/15/16)a | EUR | 250 | 285,483 | |||||||||
PortAventura Entertainment Barcelona BV | ||||||||||||
7.25%, 12/01/20 (Call 12/01/16)a | EUR | 200 | 229,767 | |||||||||
Repsol International Finance BV | ||||||||||||
4.50%, 03/25/75 (Call 03/25/25)a,b | EUR | 600 | 568,342 | |||||||||
|
| |||||||||||
| 10,011,071 | ||||||||||||
SWEDEN — 1.55% | ||||||||||||
Akelius Residential Property AB | ||||||||||||
3.38%, 09/23/20 | EUR | 200 | 223,139 | |||||||||
Auris Luxembourg II SA | ||||||||||||
8.00%, 01/15/23 (Call 01/15/18)a | EUR | 200 | 239,985 | |||||||||
Ovako AB | ||||||||||||
6.50%, 06/01/19 (Call 06/01/16)a | EUR | 250 | 245,923 | |||||||||
| 18 | 2015 iSHARES ANNUAL REPORTTO SHAREHOLDERS |
Table of Contents
Schedule of Investments (Continued)
iSHARES® INTERNATIONAL HIGH YIELD BOND ETF
October 31, 2015
| Security | Principal (000s) | Value | ||||||||||
Perstorp Holding AB | ||||||||||||
9.00%, 05/15/17 (Call 11/30/15)a | EUR | 200 | $ | 225,385 | ||||||||
SSAB AB | ||||||||||||
3.88%, 04/10/19a | EUR | 250 | 274,994 | |||||||||
Stena AB | ||||||||||||
6.13%, 02/01/17a | EUR | 200 | 228,644 | |||||||||
Verisure Holding AB | ||||||||||||
8.75%, 12/01/18 (Call 12/01/15)a | EUR | 200 | 231,999 | |||||||||
Volvo Treasury AB | ||||||||||||
4.20%, 06/10/75 (Call 06/10/20)a,b | EUR | 600 | 659,476 | |||||||||
4.85%, 03/10/78 (Call 03/10/23)a,b | EUR | 500 | 542,660 | |||||||||
|
| |||||||||||
| 2,872,205 | ||||||||||||
SWITZERLAND — 0.86% |
| |||||||||||
Clariant Finance Luxembourg SA | ||||||||||||
5.63%, 01/24/17 | EUR | 300 | 350,722 | |||||||||
Dufry Finance SCA | ||||||||||||
4.50%, 07/15/22 (Call 07/15/17)a | EUR | 300 | 349,622 | |||||||||
4.50%, 08/01/23 (Call 08/01/18)a | EUR | 450 | 519,462 | |||||||||
Gategroup Finance Luxembourg SA | ||||||||||||
6.75%, 03/01/19 (Call 11/23/15)a | EUR | 143 | 165,776 | |||||||||
Selecta Group BV | ||||||||||||
6.50%, 06/15/20 (Call 12/15/16)a | EUR | 200 | 215,407 | |||||||||
|
| |||||||||||
| 1,600,989 | ||||||||||||
UNITED KINGDOM — 18.54% |
| |||||||||||
AA Bond Co. Ltd. | ||||||||||||
5.50%, 07/31/43 (Call 07/31/18)a | GBP | 500 | 733,883 | |||||||||
Algeco Scotsman Global Finance PLC | ||||||||||||
9.00%, 10/15/18 (Call 11/30/15)a | EUR | 200 | 197,732 | |||||||||
Alliance Automotive Finance PLC | ||||||||||||
6.25%, 12/01/21 (Call 11/19/17)a | EUR | 200 | 228,110 | |||||||||
| Security | Principal (000s) | Value | ||||||||||
Arqiva Broadcast Finance PLC | ||||||||||||
9.50%, 03/31/20 (Call 03/31/16)a | GBP | 400 | $ | 673,358 | ||||||||
Aston Martin Capital Ltd. | ||||||||||||
9.25%, 07/15/18 (Call 11/30/15)a | GBP | 200 | 311,969 | |||||||||
Boparan Finance PLC | ||||||||||||
4.38%, 07/15/21 (Call 07/15/17)a | EUR | 250 | 249,237 | |||||||||
5.25%, 07/15/19 (Call 07/15/16)a | GBP | 150 | 219,498 | |||||||||
5.50%, 07/15/21 (Call 07/15/17)a | GBP | 200 | 279,536 | |||||||||
Brakes Capital | ||||||||||||
7.13%, 12/15/18 (Call 12/15/15)a | GBP | 300 | 480,694 | |||||||||
Cabot Financial Luxembourg SA | ||||||||||||
10.38%, 10/01/19 (Call 11/30/15)a | GBP | 150 | 249,903 | |||||||||
CNH Industrial Finance Europe SA | ||||||||||||
2.75%, 03/18/19a | EUR | 600 | 652,848 | |||||||||
2.88%, 09/27/21a | EUR | 450 | 479,694 | |||||||||
6.25%, 03/09/18a | EUR | 800 | 948,850 | |||||||||
Co-Operative Bank PLC/United Kingdom | ||||||||||||
5.13%, 09/20/17 | GBP | 300 | 452,200 | |||||||||
Cognita Financing PLC | ||||||||||||
7.75%, 08/15/21 (Call 08/15/17)a | GBP | 150 | 234,039 | |||||||||
Darty Financement SAS | ||||||||||||
5.88%, 03/01/21 (Call 03/01/17)a | EUR | 200 | 233,838 | |||||||||
EC Finance PLC | ||||||||||||
5.13%, 07/15/21 (Call 01/15/17)a | EUR | 200 | 229,767 | |||||||||
Eco-Bat Finance PLC | ||||||||||||
7.75%, 02/15/17 (Call 11/30/15)a | EUR | 200 | 215,959 | |||||||||
Elli Finance UK PLC | ||||||||||||
8.75%, 06/15/19 (Call 11/30/15)a | GBP | 100 | 138,224 | |||||||||
8.75%, 06/15/19 (Call 11/30/15)c | GBP | 100 | 138,224 | |||||||||
SCHEDULEOF INVESTMENTS | 19 |
Table of Contents
Schedule of Investments (Continued)
iSHARES® INTERNATIONAL HIGH YIELD BOND ETF
October 31, 2015
| Security | Principal (000s) | Value | ||||||||||
Equiniti Newco 2 PLC | ||||||||||||
7.13%, 12/15/18 (Call 11/30/15)a | GBP | 200 | $ | 316,166 | ||||||||
Fiat Chrysler Finance Europe | ||||||||||||
4.75%, 03/22/21a | EUR | 650 | 764,587 | |||||||||
4.75%, 07/15/22a | EUR | 900 | 1,052,097 | |||||||||
6.63%, 03/15/18a | EUR | 800 | 966,021 | |||||||||
6.75%, 10/14/19a | EUR | 800 | 1,006,724 | |||||||||
7.00%, 03/23/17a | EUR | 500 | 588,226 | |||||||||
7.38%, 07/09/18 | EUR | 300 | 371,162 | |||||||||
Findus Bondco SA | ||||||||||||
9.13%, 07/01/18 (Call 11/03/15)a | EUR | 200 | 230,872 | |||||||||
Gala Electric Casinos PLC | ||||||||||||
11.50%, 06/01/19 (Call 11/30/15)a | GBP | 200 | 327,413 | |||||||||
Gala Group Finance PLC | ||||||||||||
8.88%, 09/01/18 (Call 11/30/15)a | GBP | 180 | 291,891 | |||||||||
Iceland Bondco PLC | ||||||||||||
6.25%, 07/15/21 (Call 07/15/17)a | GBP | 250 | 350,386 | |||||||||
Ineos Finance PLC | ||||||||||||
4.00%, 05/01/23 (Call 05/01/18)a | EUR | 500 | 528,851 | |||||||||
Infinis PLC | ||||||||||||
7.00%, 02/15/19 (Call 02/15/16)c | GBP | 200 | 314,285 | |||||||||
International Personal Finance PLC | ||||||||||||
5.75%, 04/07/21a | EUR | 275 | 283,622 | |||||||||
Interoute Finco PLC | ||||||||||||
7.38%, 10/15/20 (Call 10/15/17)a | EUR | 250 | 291,352 | |||||||||
Iron Mountain Europe PLC | ||||||||||||
6.13%, 09/15/22 (Call 09/15/17)a | GBP | 300 | 464,015 | |||||||||
Jaguar Land Rover Automotive PLC | ||||||||||||
3.88%, 03/01/23a | GBP | 300 | 436,679 | |||||||||
5.00%, 02/15/22a | GBP | 200 | 318,918 | |||||||||
Jerrold Finco PLC | ||||||||||||
9.75%, 09/15/18 (Call 09/15/16)a | GBP | 150 | 252,509 | |||||||||
| Security | Principal (000s) | Value | ||||||||||
Kerling PLC | ||||||||||||
10.63%, 02/01/17 (Call 11/30/15)a | EUR | 450 | $ | 503,928 | ||||||||
Keystone Financing PLC | ||||||||||||
9.50%, 10/15/19 (Call 10/15/16)a | GBP | 200 | 326,640 | |||||||||
Matalan Finance PLC | ||||||||||||
6.88%, 06/01/19 (Call 05/30/16)a | GBP | 100 | 136,679 | |||||||||
6.88%, 06/01/19 (Call 05/30/16)c | GBP | 100 | 136,679 | |||||||||
Merlin Entertainments PLC | ||||||||||||
2.75%, 03/15/22 (Call 12/15/21)a | EUR | 300 | 321,453 | |||||||||
Moy Park Bondco PLC | ||||||||||||
6.25%, 05/29/21 (Call 05/29/17)a | GBP | 150 | 236,293 | |||||||||
New Look Secured Issuer PLC | ||||||||||||
6.50%, 07/01/22 (Call 06/24/18)a | GBP | 450 | 693,242 | |||||||||
Odeon & UCI Finco PLC | ||||||||||||
9.00%, 08/01/18 (Call 11/09/15)a | GBP | 200 | 321,621 | |||||||||
Old Mutual PLC | ||||||||||||
7.88%, 11/03/25 | �� | GBP | 100 | 158,826 | ||||||||
Pizzaexpress Financing 2 PLC | ||||||||||||
6.63%, 08/01/21 (Call 08/01/17)a | GBP | 350 | 562,837 | |||||||||
Premier Foods Finance PLC | ||||||||||||
6.50%, 03/15/21 (Call 03/15/17)c | GBP | 150 | 215,444 | |||||||||
6.50%, 03/15/21 (Call 03/15/17)a | GBP | 100 | 143,629 | |||||||||
Priory Group No. 3 PLC | ||||||||||||
7.00%, 02/15/18 (Call 11/30/15)c | GBP | 122 | 194,770 | |||||||||
R&R Ice Cream PLC | ||||||||||||
5.50%, 05/15/20 (Call 05/15/16)a | GBP | 250 | 395,752 | |||||||||
Rexam PLC | ||||||||||||
6.75%, 06/29/67 (Call 06/29/17)a,b | EUR | 450 | 498,335 | |||||||||
| 20 | 2015 iSHARES ANNUAL REPORTTO SHAREHOLDERS |
Table of Contents
Schedule of Investments (Continued)
iSHARES® INTERNATIONAL HIGH YIELD BOND ETF
October 31, 2015
| Security | Principal (000s) | Value | ||||||||||
Royal Bank of Scotland Group PLC | ||||||||||||
3.63%, 03/25/24 (Call 03/25/19)a,b | EUR | 650 | $ | 738,917 | ||||||||
Royal Bank of Scotland PLC (The) | ||||||||||||
4.35%, 01/23/17 | EUR | 500 | 571,969 | |||||||||
6.93%, 04/09/18 | EUR | 1,250 | 1,549,021 | |||||||||
Silk Bidco AS | ||||||||||||
7.50%, 02/01/22 (Call 02/01/18)a | EUR | 300 | 349,622 | |||||||||
Stonegate Pub Co. Financing PLC | ||||||||||||
5.75%, 04/15/19 (Call 04/15/16)a | GBP | 100 | 155,984 | |||||||||
Tesco Corporate Treasury Services PLC | ||||||||||||
1.38%, 07/01/19a | EUR | 800 | 864,278 | |||||||||
2.13%, 11/12/20 (Call 08/12/20)a | EUR | 400 | 434,525 | |||||||||
2.50%, 07/01/24a | EUR | 500 | 502,892 | |||||||||
Tesco PLC | ||||||||||||
3.38%, 11/02/18a | EUR | 700 | 807,402 | |||||||||
6.13%, 02/24/22 | GBP | 600 | 977,585 | |||||||||
Thomas Cook Finance PLC | ||||||||||||
6.75%, 06/15/21 (Call 01/15/18)a | EUR | 300 | 352,936 | |||||||||
7.75%, 06/15/20 (Call 06/15/16)a | EUR | 300 | 351,279 | |||||||||
Thomas Cook Group PLC | ||||||||||||
7.75%, 06/22/17 | GBP | 150 | 244,424 | |||||||||
Towergate Finance PLC | ||||||||||||
0.00%, 02/15/19 | GBP | 100 | 3,089 | |||||||||
Travis Perkins PLC | ||||||||||||
4.38%, 09/15/21a | GBP | 100 | 155,487 | |||||||||
Virgin Media Finance PLC | ||||||||||||
4.50%, 01/15/25 (Call 01/15/20)a | EUR | 350 | 372,129 | |||||||||
6.38%, 10/15/24 (Call 10/15/19)a | GBP | 200 | 310,715 | |||||||||
7.00%, 04/15/23 (Call 04/15/18)a | GBP | 100 | 161,776 | |||||||||
Virgin Media Secured Finance PLC | ||||||||||||
4.88%, 01/15/27 (Call 01/15/21)a | GBP | 300 | 441,312 | |||||||||
| Security | Principal (000s) | Value | ||||||||||
5.13%, 01/15/25 (Call 01/15/20)a | GBP | 200 | $ | 297,297 | ||||||||
5.50%, 01/15/21 | GBP | 400 | 657,142 | |||||||||
5.50%, 01/15/25 (Call 01/15/19)a | GBP | 315 | 485,270 | |||||||||
6.00%, 04/15/21 (Call 04/15/17)a | GBP | 585 | 955,423 | |||||||||
6.25%, 03/28/29 (Call 01/15/21)a | GBP | 300 | 470,270 | |||||||||
Viridian Group FundCo II Ltd. | ||||||||||||
7.50%, 03/01/20 (Call 09/01/17)a | EUR | 350 | 382,761 | |||||||||
Vougeot Bidco PLC | ||||||||||||
7.88%, 07/15/20 (Call 07/15/16)a | GBP | 200 | 327,799 | |||||||||
William Hill PLC | ||||||||||||
7.13%, 11/11/16 | GBP | 100 | 162,548 | |||||||||
|
| |||||||||||
| 34,433,319 | ||||||||||||
UNITED STATES — 5.26% | ||||||||||||
Avis Budget Finance PLC | ||||||||||||
6.00%, 03/01/21 (Call 03/01/16)a | EUR | 300 | 346,153 | |||||||||
Axalta Coating Systems U.S. Holdings Inc./Axalta Coating Systems Dutch Holding BV | ||||||||||||
5.75%, 02/01/21 (Call 02/01/16)a | EUR | 200 | 226,475 | |||||||||
Belden Inc. | ||||||||||||
5.50%, 04/15/23 (Call 04/15/18)a | EUR | 400 | 444,069 | |||||||||
Brookfield Office Properties Inc. | ||||||||||||
4.00%, 04/16/18 | CAD | 100 | 77,483 | |||||||||
4.30%, 01/17/17 | CAD | 100 | 77,388 | |||||||||
Celanese U.S. Holdings LLC | ||||||||||||
3.25%, 10/15/19 | EUR | 200 | 229,491 | |||||||||
Chemours Co. (The) | ||||||||||||
6.13%, 05/15/23 (Call 05/15/18)a | EUR | 200 | 166,802 | |||||||||
Chesapeake Energy Corp. | ||||||||||||
6.25%, 01/15/17 | EUR | 200 | 208,834 | |||||||||
Crown European Holdings SA | ||||||||||||
3.38%, 05/15/25 (Call 11/15/24)a | EUR | 350 | 368,263 | |||||||||
SCHEDULEOF INVESTMENTS | 21 |
Table of Contents
Schedule of Investments (Continued)
iSHARES® INTERNATIONAL HIGH YIELD BOND ETF
October 31, 2015
| Security | Principal (000s) | Value | ||||||||||
4.00%, 07/15/22 (Call 04/15/22)a | EUR | 450 | $ | 520,704 | ||||||||
Darling Global Finance BV | ||||||||||||
4.75%, 05/30/22 (Call 05/30/18)a | EUR | 300 | 310,965 | |||||||||
Goodyear Dunlop Tires Europe BV | ||||||||||||
6.75%, 04/15/19 (Call 11/30/15)a | EUR | 200 | 228,687 | |||||||||
Hertz Holdings Netherlands BV | ||||||||||||
4.38%, 01/15/19a | EUR | 250 | 286,519 | |||||||||
Huntsman International LLC | ||||||||||||
4.25%, 04/01/25 (Call 01/01/25)a | EUR | 200 | 192,209 | |||||||||
5.13%, 04/15/21 | EUR | 300 | 321,867 | |||||||||
IMS Health Inc. | ||||||||||||
4.13%, 04/01/23 (Call 04/01/18)a | EUR | 150 | 158,655 | |||||||||
Infor U.S. Inc. | ||||||||||||
5.75%, 05/15/22 (Call 05/15/18)a | EUR | 200 | 202,151 | |||||||||
International Game Technology PLC | ||||||||||||
4.13%, 02/15/20 (Call 11/15/19)a | EUR | 400 | 445,347 | |||||||||
4.75%, 03/05/20a | EUR | 300 | 334,109 | |||||||||
4.75%, 02/15/23 (Call 08/15/22)a | EUR | 550 | 587,052 | |||||||||
6.63%, 02/02/18a | EUR | 400 | 483,261 | |||||||||
Iron Mountain Canada Operations ULC | ||||||||||||
6.13%, 08/15/21 (Call 08/15/17) | CAD | 150 | 118,088 | |||||||||
Jarden Corp. | ||||||||||||
3.75%, 10/01/21a | EUR | 200 | 225,901 | |||||||||
Kloeckner Pentaplast of America Inc. | ||||||||||||
7.13%, 11/01/20 (Call 05/01/17)a | EUR | 250 | 286,519 | |||||||||
MPT Operating Partnership LP/MPT Finance Corp. | ||||||||||||
4.00%, 08/19/22 (Call 05/19/22) | EUR | 400 | 447,074 | |||||||||
| Security | Principal or Shares (000s) | Value | ||||||||||
PSPC Escrow Corp. | ||||||||||||
6.00%, 02/01/23 (Call 02/01/18)a | EUR | 200 | $ | 183,372 | ||||||||
Sealed Air Corp. | ||||||||||||
4.50%, 09/15/23 (Call 06/15/23)a | EUR | 300 | 347,136 | |||||||||
TA MFG. Ltd. | ||||||||||||
3.63%, 04/15/23 (Call 04/15/18)a | EUR | 200 | 209,884 | |||||||||
Trinseo Materials Operating SCA/Trinseo Materials Finance Inc. | ||||||||||||
6.38%, 05/01/22 (Call 01/05/18)a | EUR | 200 | 219,825 | |||||||||
Valeant Pharmaceuticals International Inc. | ||||||||||||
4.50%, 05/15/23 (Call 05/15/18)a | EUR | 1,000 | 894,767 | |||||||||
VWR Funding Inc. | ||||||||||||
4.63%, 04/15/22 (Call 04/15/18)a | EUR | 300 | 320,625 | |||||||||
XPO Logistics Inc. | ||||||||||||
5.75%, 06/15/21 (Call 12/15/17)a | EUR | 300 | 301,603 | |||||||||
|
| |||||||||||
| 9,771,278 | ||||||||||||
|
| |||||||||||
TOTAL CORPORATE BONDS & NOTES |
| |||||||||||
(Cost: $205,750,109) |
| 181,442,061 | ||||||||||
SHORT-TERM INVESTMENTS — 0.00% |
| |||||||||||
MONEY MARKET FUNDS — 0.00% |
| |||||||||||
BlackRock Cash Funds: Treasury, SL Agency Shares |
| |||||||||||
0.02%f,g | 8 | 8,272 | ||||||||||
|
| |||||||||||
| 8,272 | ||||||||||||
|
| |||||||||||
TOTAL SHORT-TERM INVESTMENTS (Cost: $8,272) |
| 8,272 | ||||||||||
|
| |||||||||||
| 22 | 2015 iSHARES ANNUAL REPORTTO SHAREHOLDERS |
Table of Contents
Schedule of Investments (Continued)
iSHARES® INTERNATIONAL HIGH YIELD BOND ETF
October 31, 2015
| Value | ||||||||
TOTAL INVESTMENTS | ||||||||
(Cost: $205,758,381) | $ | 181,450,333 | ||||||
Other Assets, Less Liabilities — 2.32% | 4,305,410 | |||||||
|
| |||||||
NET ASSETS — 100.00% | $ | 185,755,743 | ||||||
|
| |||||||
CAD | — Canadian Dollar | |
EUR | — Euro | |
GBP | — British Pound |
| a | This security may be resold to qualified foreign investors and foreign institutional buyers under Regulation S of the Securities Act of 1933. |
| b | Variable rate security. Rate shown is as of report date. |
| c | This security may be resold to qualified institutional buyers under Rule 144A of the Securities Act of 1933. |
| d | Issuer is in default of interest payments. |
| e | Step coupon security. Coupon rate will either increase (step-up bond) or decrease (step-down bond) at regular intervals until maturity. Interest rate shown reflects the rate currently in effect. |
| f | Affiliated issuer. See Note 2. |
| g | The rate quoted is the annualized seven-day yield of the fund at period end. |
See notes to financial statements.
SCHEDULEOF INVESTMENTS | 23 |
Table of Contents
Statement of Assets and Liabilities
iSHARES® INTERNATIONAL HIGH YIELD BOND ETF
October 31, 2015
ASSETS | ||||
Investments, at cost: | ||||
Unaffiliated | $ | 205,750,109 | ||
Affiliated (Note 2) | 8,272 | |||
|
| |||
Total cost of investments | $ | 205,758,381 | ||
|
| |||
Investments in securities, at fair value (Note 1): | ||||
Unaffiliated | $ | 181,442,061 | ||
Affiliated (Note 2) | 8,272 | |||
|
| |||
Total fair value of investments | 181,450,333 | |||
Foreign currency, at valuea | 2,403,322 | |||
Receivables: | ||||
Investment securities sold | 246,235 | |||
Interest | 3,509,106 | |||
Capital shares sold | 305,659 | |||
Tax reclaims | 22,740 | |||
|
| |||
Total Assets | 187,937,395 | |||
|
| |||
LIABILITIES | ||||
Payables: | ||||
Investment securities purchased | 2,111,792 | |||
Investment advisory fees (Note 2) | 69,860 | |||
|
| |||
Total Liabilities | 2,181,652 | |||
|
| |||
NET ASSETS | $ | 185,755,743 | ||
|
| |||
Net assets consist of: | ||||
Paid-in capital | $ | 211,756,266 | ||
Undistributed net investment income | 10 | |||
Accumulated net realized loss | (1,642,512 | ) | ||
Net unrealized depreciation | (24,358,021 | ) | ||
|
| |||
NET ASSETS | $ | 185,755,743 | ||
|
| |||
Shares outstandingb | 4,000,000 | |||
|
| |||
Net asset value per share | $ | 46.44 | ||
|
| |||
| a | Cost of foreign currency: $2,417,764. |
| b | $0.001 par value, number of shares authorized: 500 million. |
See notes to financial statements.
| 24 | 2015 iSHARES ANNUAL REPORTTO SHAREHOLDERS |
Table of Contents
Statement of Operations
iSHARES® INTERNATIONAL HIGH YIELD BOND ETF
Year ended October 31, 2015
NET INVESTMENT INCOME | ||||
Interest — unaffiliated | $ | 9,405,736 | ||
Interest — affiliated (Note 2) | 17 | |||
|
| |||
Total investment income | 9,405,753 | |||
|
| |||
EXPENSES | ||||
Investment advisory fees (Note 2) | 1,216,280 | |||
|
| |||
Total expenses | 1,216,280 | |||
Less investment advisory fees waived (Note 2) | (331,713 | ) | ||
|
| |||
Net expenses | 884,567 | |||
|
| |||
Net investment income | 8,521,186 | |||
|
| |||
NET REALIZED AND UNREALIZED GAIN (LOSS) | ||||
Net realized gain (loss) from: | ||||
Investments — unaffiliated | (9,375,728 | ) | ||
In-kind redemptions — unaffiliated | (3,767,914 | ) | ||
Foreign currency transactions | (832,035 | ) | ||
|
| |||
Net realized loss | (13,975,677 | ) | ||
|
| |||
Net change in unrealized appreciation/depreciation on: | ||||
Investments | (13,807,272 | ) | ||
Translation of assets and liabilities in foreign currencies | 122,218 | |||
|
| |||
Net change in unrealized appreciation/depreciation | (13,685,054 | ) | ||
|
| |||
Net realized and unrealized loss | (27,660,731 | ) | ||
|
| |||
NET DECREASE IN NET ASSETS RESULTING FROM OPERATIONS | $ | (19,139,545 | ) | |
|
| |||
See notes to financial statements.
FINANCIAL STATEMENTS | 25 |
Table of Contents
Statements of Changes in Net Assets
iSHARES® INTERNATIONAL HIGH YIELD BOND ETF
Year ended October 31, 2015 | Year ended October 31, 2014 | |||||||
INCREASE (DECREASE) IN NET ASSETS | ||||||||
OPERATIONS: | ||||||||
Net investment income | $ | 8,521,186 | $ | 5,595,737 | ||||
Net realized gain (loss) | (13,975,677 | ) | 153,527 | |||||
Net change in unrealized appreciation/depreciation | (13,685,054 | ) | (13,719,685 | ) | ||||
|
|
|
| |||||
Net decrease in net assets resulting from operations | (19,139,545 | ) | (7,970,421 | ) | ||||
|
|
|
| |||||
DISTRIBUTIONS TO SHAREHOLDERS: | ||||||||
From net investment income | (228,686 | ) | (5,709,258 | ) | ||||
From net realized gain | (91,363 | ) | — | |||||
Return of capital | (7,481,077 | ) | — | |||||
|
|
|
| |||||
Total distributions to shareholders | (7,801,126 | ) | (5,709,258 | ) | ||||
|
|
|
| |||||
CAPITAL SHARE TRANSACTIONS: | ||||||||
Proceeds from shares sold | 155,929,021 | 161,257,088 | ||||||
Cost of shares redeemed | (86,059,601 | ) | (55,903,420 | ) | ||||
|
|
|
| |||||
Net increase in net assets from capital share transactions | 69,869,420 | 105,353,668 | ||||||
|
|
|
| |||||
INCREASE IN NET ASSETS | 42,928,749 | 91,673,989 | ||||||
NET ASSETS | ||||||||
Beginning of year | 142,826,994 | 51,153,005 | ||||||
|
|
|
| |||||
End of year | $ | 185,755,743 | $ | 142,826,994 | ||||
|
|
|
| |||||
Undistributed net investment income included in net assets at end of year | $ | 10 | $ | 228,686 | ||||
|
|
|
| |||||
SHARES ISSUED AND REDEEMED | ||||||||
Shares sold | 3,100,000 | 2,800,000 | ||||||
Shares redeemed | (1,800,000 | ) | (1,000,000 | ) | ||||
|
|
|
| |||||
Net increase in shares outstanding | 1,300,000 | 1,800,000 | ||||||
|
|
|
| |||||
See notes to financial statements.
| 26 | 2015 iSHARES ANNUAL REPORTTO SHAREHOLDERS |
Table of Contents
iSHARES® INTERNATIONAL HIGH YIELD BOND ETF
(For a share outstanding throughout each period)
| Year ended Oct. 31, 2015 | Year ended Oct. 31, 2014 | Year ended Oct. 31, 2013 | Period from to Oct. 31, 2012 | |||||||||||||
Net asset value, beginning of period | $ | 52.90 | $ | 56.84 | $ | 52.01 | $ | 50.14 | ||||||||
|
|
|
|
|
|
|
| |||||||||
Income from investment operations: | ||||||||||||||||
Net investment incomeb | 1.84 | 2.43 | 3.15 | 1.94 | ||||||||||||
Net realized and unrealized gain (loss)c | (6.57 | ) | (3.55 | ) | 4.51 | 1.18 | ||||||||||
|
|
|
|
|
|
|
| |||||||||
Total from investment operations | (4.73 | ) | (1.12 | ) | 7.66 | 3.12 | ||||||||||
|
|
|
|
|
|
|
| |||||||||
Less distributions from: | ||||||||||||||||
Net investment income | (0.05 | ) | (2.82 | ) | (2.83 | ) | (1.25 | ) | ||||||||
Net realized gain | (0.02 | ) | — | — | — | |||||||||||
Return of capital | (1.66 | ) | — | — | — | |||||||||||
|
|
|
|
|
|
|
| |||||||||
Total distributions | (1.73 | ) | (2.82 | ) | (2.83 | ) | (1.25 | ) | ||||||||
|
|
|
|
|
|
|
| |||||||||
Net asset value, end of period | $ | 46.44 | $ | 52.90 | $ | 56.84 | $ | 52.01 | ||||||||
|
|
|
|
|
|
|
| |||||||||
Total return | (9.02 | )% | (2.20 | )% | 15.20 | % | 6.49 | %d | ||||||||
|
|
|
|
|
|
|
| |||||||||
Ratios/Supplemental data: | ||||||||||||||||
Net assets, end of period (000s) | $ | 185,756 | $ | 142,827 | $ | 51,153 | $ | 26,004 | ||||||||
Ratio of expenses to average net assetse | 0.40 | % | 0.40 | % | 0.40 | % | 0.40 | % | ||||||||
Ratio of expenses to average net assets prior to waived feese | 0.55 | % | 0.55 | % | 0.55 | % | 0.55 | % | ||||||||
Ratio of net investment income to average net assetse | 3.85 | % | 4.25 | % | 5.85 | % | 6.92 | % | ||||||||
Portfolio turnover ratef | 28 | % | 25 | % | 33 | % | 18 | % | ||||||||
| a | Commencement of operations. |
| b | Based on average shares outstanding throughout each period. |
| c | The amounts reported for a share outstanding may not accord with the change in aggregate gains and losses in securities for the fiscal period due to the timing of capital share transactions in relation to the fluctuating market values of the Fund’s underlying securities. |
| d | Not annualized. |
| e | Annualized for periods of less than one year. |
| f | Portfolio turnover rates exclude portfolio securities received or delivered as a result of processing capital share transactions in Creation Units. |
See notes to financial statements.
FINANCIAL HIGHLIGHTS | 27 |
Table of Contents
iSHARES® INTERNATIONAL HIGH YIELD BOND ETF
iShares, Inc. (the “Company”) is registered under the Investment Company Act of 1940, as amended (the “1940 Act”), as an open-end management investment company. The Company was incorporated under the laws of the State of Maryland on September 1, 1994 pursuant to Articles of Incorporation as subsequently amended and restated.
These financial statements relate only to the following fund (the “Fund”):
| iShares ETF | Diversification Classification | |
International High Yield Bonda | Non-diversified |
| a | Formerly the iShares Global ex USD High Yield Corporate Bond ETF. |
The investment objective of the Fund is to seek investment results that correspond generally to the price and yield performance, before fees and expenses, of its underlying index. The investment adviser uses a “passive” or index approach to try to achieve the Fund’s investment objective.
Pursuant to the Company’s organizational documents, the Fund’s officers and directors are indemnified against certain liabilities that may arise out of the performance of their duties to the Fund. Additionally, in the normal course of business, the Fund enters into contracts with service providers that contain general indemnification clauses. The Fund’s maximum exposure under these arrangements is unknown as this would involve future claims that may be made against the Fund that have not yet occurred.
| 1. | SIGNIFICANT ACCOUNTING POLICIES |
The following significant accounting policies are consistently followed by the Fund in the preparation of its financial statements in conformity with accounting principles generally accepted in the United States of America (“U.S. GAAP”). The preparation of financial statements in conformity with U.S. GAAP requires management to make certain estimates and assumptions that affect the reported amounts of assets and liabilities and disclosures of contingent assets and liabilities at the date of the financial statements and the reported amounts of revenue and expenses during the reporting period. Actual results could differ from those estimates. The Fund is considered an investment company under U.S. GAAP and follows the accounting and reporting guidance applicable to investment companies.
SECURITY VALUATION
The Fund’s investments are valued at fair value the day that the Fund’s listing exchange is open and, for financial reporting purposes, as of the report date should the reporting period end on a day that the Fund’s listing exchange is not open. U.S. GAAP defines fair value as the price a fund would receive to sell an asset or pay to transfer a liability in an orderly transaction between market participants at the measurement date. The BlackRock Global Valuation Methodologies Committee (the “Global Valuation Committee”) provides oversight of the valuation of investments for the Fund. The investments of the Fund are valued pursuant to policies and procedures developed by the Global Valuation Committee and approved by the Board of Directors of the Company (the “Board”).
| • | Fixed income investments are valued at the last available bid price received from independent pricing services. In determining the value of a fixed income investment, pricing services may use certain information with respect to transactions in such investments, quotations from dealers, pricing matrixes, market transactions in comparable investments, various relationships observed in the market between investments, and calculated yield measures. |
| • | Open-end U.S. mutual funds are valued at that day’s published net asset value (“NAV”). |
| 28 | 2015 iSHARES ANNUAL REPORTTO SHAREHOLDERS |
Table of Contents
Notes to Financial Statements (Continued)
iSHARES® INTERNATIONAL HIGH YIELD BOND ETF
In the event that application of these methods of valuation results in a price for an investment which is deemed not to be representative of the fair value of such investment or if a price is not available, the investment will be valued based upon other available factors deemed relevant by the Global Valuation Committee, in accordance with policies approved by the Board. These factors include but are not limited to (i) attributes specific to the investment; (ii) the principal market for the investment; (iii) the customary participants in the principal market for the investment; (iv) data assumptions by market participants for the investment, if reasonably available; (v) quoted prices for similar investments in active markets; and (vi) other factors, such as future cash flows, interest rates, yield curves, volatilities, prepayment speeds, loss severities, credit risks and/or default rates. Valuations based on such factors are reported to the Board on a quarterly basis.
The Global Valuation Committee employs various methods for calibrating valuation approaches for investments where an active market does not exist, including regular due diligence of the Company’s pricing vendors, a regular review of key inputs and assumptions, transactional back-testing or disposition analysis to compare unrealized gains and losses to realized gains and losses, reviews of missing or stale prices, reviews of large movements in market values, and reviews of market related activity.
Fair value pricing could result in a difference between the prices used to calculate the Fund’s NAV and the prices used by the Fund’s underlying index, which in turn could result in a difference between the Fund’s performance and the performance of the Fund’s underlying index.
Various inputs are used in determining the fair value of financial instruments. Inputs may be based on independent market data (“observable inputs”) or they may be internally developed (“unobservable inputs”). These inputs are categorized into a disclosure hierarchy consisting of three broad levels for financial reporting purposes. The level of a value determined for a financial instrument within the fair value hierarchy is based on the lowest level of any input that is significant to the fair value measurement in its entirety. The categorization of a value determined for a financial instrument within the hierarchy is based upon the pricing transparency of the instrument and is not necessarily an indication of the risk associated with investing in the instrument. The three levels of the fair value hierarchy are as follows:
| • | Level 1 — Unadjusted quoted prices in active markets for identical assets or liabilities; |
| • | Level 2 — Inputs other than quoted prices included within Level 1 that are observable for the asset or liability either directly or indirectly, including quoted prices for similar assets or liabilities in active markets, quoted prices for identical or similar assets or liabilities in markets that are not considered to be active, inputs other than quoted prices that are observable for the asset or liability (such as exchange rates, financing terms, interest rates, yield curves, volatilities, prepayment speeds, loss severities, credit risks and default rates) or other market-corroborated inputs; and |
| • | Level 3 — Unobservable inputs for the asset or liability, including the Global Valuation Committee’s assumptions used in determining the fair value of investments. |
Changes in valuation techniques may result in transfers in or out of an assigned level within the disclosure hierarchy. In accordance with the Company’s policy, transfers between different levels of the fair value hierarchy are deemed to have occurred as of the beginning of the reporting period.
NOTESTO FINANCIAL STATEMENTS | 29 |
Table of Contents
Notes to Financial Statements (Continued)
iSHARES® INTERNATIONAL HIGH YIELD BOND ETF
The following table summarizes the value of each of the Fund’s investments according to the fair value hierarchy as of October 31, 2015. The breakdown of the Fund’s investments into major categories is disclosed in its schedule of investments.
| Level 1 | Level 2 | Level 3 | Total | |||||||||||||
Investments: | ||||||||||||||||
Assets: | ||||||||||||||||
Corporate Bonds & Notes | $ | — | $ | 181,442,061 | $ | 0 | a | $ | 181,442,061 | |||||||
Money Market Funds | 8,272 | — | — | 8,272 | ||||||||||||
|
|
|
|
|
|
|
| |||||||||
Total | $ | 8,272 | $ | 181,442,061 | $ | 0 | a | $ | 181,450,333 | |||||||
|
|
|
|
|
|
|
| |||||||||
| a | Rounds to less than $1. |
SECURITY TRANSACTIONS AND INCOME RECOGNITION
Security transactions are accounted for on trade date. Realized gains and losses on investment transactions are determined using the specific identification method. Interest income, including amortization and accretion of premiums and discounts on debt securities, is recognized daily on the accrual basis.
FOREIGN CURRENCY TRANSLATION
The accounting records of the Fund are maintained in U.S. dollars. Foreign currencies, as well as investment securities and other assets and liabilities denominated in foreign currencies, are translated into U.S. dollars using exchange rates deemed appropriate by the investment adviser. Purchases and sales of securities, income receipts and expense payments are translated into U.S. dollars on the respective dates of such transactions.
The Fund does not isolate the effect of fluctuations in foreign exchange rates from the effect of fluctuations in the market prices of securities. Such fluctuations are reflected by the Fund as a component of realized and unrealized gains and losses from investments for financial reporting purposes.
FOREIGN TAXES
The Fund may be subject to foreign taxes (a portion of which may be reclaimable) on income, stock dividends, capital gains on investments, or certain foreign currency transactions. All foreign taxes are recorded in accordance with the applicable foreign tax regulations and rates that exist in the foreign jurisdictions in which the Fund invests. These foreign taxes, if any, are paid by the Fund and are reflected in its statements of operations as follows: foreign taxes withheld at source are presented as a reduction of income, foreign taxes on securities lending income are presented as a reduction of securities lending income, foreign taxes on stock dividends are presented as “other foreign taxes,” and foreign taxes on capital gains from sales of investments and foreign taxes on foreign currency transactions are included in their respective net realized gain (loss) categories. Foreign taxes payable or deferred as of October 31, 2015, if any, are disclosed in the Fund’s statements of assets and liabilities.
DISTRIBUTIONS TO SHAREHOLDERS
Dividends and distributions paid by the Fund are recorded on the ex-dividend dates. Distributions are determined on a tax basis and may differ from net investment income and net realized capital gains for financial reporting purposes. Dividends and distributions are paid in U.S. dollars and cannot be automatically reinvested in additional shares of the Fund.
| 30 | 2015 iSHARES ANNUAL REPORTTO SHAREHOLDERS |
Table of Contents
Notes to Financial Statements (Continued)
iSHARES® INTERNATIONAL HIGH YIELD BOND ETF
| 2. | INVESTMENT ADVISORY AGREEMENT AND OTHER TRANSACTIONS WITH AFFILIATES |
Pursuant to an Investment Advisory Agreement with the Company, BlackRock Fund Advisors (“BFA”) manages the investment of the Fund’s assets. BFA is a California corporation indirectly owned by BlackRock, Inc. (“BlackRock”). Under the Investment Advisory Agreement, BFA is responsible for substantially all expenses of the Fund, except interest, taxes, brokerage commissions and other expenses connected with the execution of portfolio transactions, distribution fees, litigation expenses and any extraordinary expenses.
BFA has entered into a sub-advisory agreement with BlackRock International Limited, (the “Sub-Adviser”), an affiliate of BFA, under which BFA pays the Sub-Adviser for services it provides to the Fund.
For its investment advisory services to the Fund, BFA is entitled to an annual investment advisory fee of 0.55% based on the average daily net assets of the Fund. The total of the investment advisory fee and any other fund expenses is a fund’s total annual operating expense. BFA has contractually agreed to waive a portion of its investment advisory fees for the Fund through February 28, 2017 in order to limit net total expense ratio after fee waiver to 0.40% of average daily net assets.
BlackRock Investments, LLC, an affiliate of BFA, is the distributor for the Fund. Pursuant to the distribution agreement, BFA is responsible for any fees or expenses for distribution services provided to the Fund.
Cross trades for the year ended October 31, 2015, if any, were executed by the Fund pursuant to Rule 17a-7 under the 1940 Act. Cross trading is the buying or selling of portfolio securities between funds to which BFA (or an affiliate) serves as investment adviser. At its regularly scheduled quarterly meetings, the Board reviews such transactions as of the most recent calendar quarter for compliance with the requirements and restrictions set forth by Rule 17a-7.
The Fund may invest its positive cash balances in certain money market funds managed by BFA or an affiliate. The income earned on these temporary cash investments is included in “Interest — affiliated” in the statement of operations.
The PNC Financial Services Group, Inc. is the largest stockholder of BlackRock and is considered to be an affiliate of the Fund for 1940 Act purposes.
Certain directors and officers of the Company are also officers of BlackRock Institutional Trust Company, N.A. and/or BFA.
| 3. | INVESTMENT PORTFOLIO TRANSACTIONS |
Purchases and sales of investments (excluding in-kind transactions and short-term investments) for the year ended October 31, 2015, were $185,519,653 and $59,755,225, respectively.
In-kind purchases and sales (see Note 4) for the year ended October 31, 2015, were $26,970,958 and $81,119,277, respectively.
| 4. | CAPITAL SHARE TRANSACTIONS |
Capital shares are issued and redeemed by the Fund only in aggregations of a specified number of shares or multiples thereof (“Creation Units”) at NAV. Except when aggregated in Creation Units, shares of the Fund are not redeemable. Transactions in capital shares for the Fund are disclosed in detail in the statements of changes in net assets.
The consideration for the purchase of Creation Units of a fund in the Company generally consists of the in-kind deposit of a designated portfolio of securities and a specified amount of cash. Certain funds in the Company may be offered in Creation Units solely or partially for cash in U.S. dollars. Investors purchasing and redeeming Creation Units may pay a purchase transaction fee
NOTESTO FINANCIAL STATEMENTS | 31 |
Table of Contents
Notes to Financial Statements (Continued)
iSHARES® INTERNATIONAL HIGH YIELD BOND ETF
and a redemption transaction fee directly to State Street Bank and Trust Company, the Company’s administrator, to offset transfer and other transaction costs associated with the issuance and redemption of Creation Units, including Creation Units for cash. Investors transacting in Creation Units for cash may also pay an additional variable charge to compensate the relevant fund for certain transaction costs (i.e., stamp taxes, taxes on currency or other financial transactions, and brokerage costs) and market impact expenses relating to investing in portfolio securities. Such variable charges, if any, are included in “Proceeds from shares sold” in the statements of changes in net assets.
| 5. | PRINCIPAL RISKS |
In the normal course of business, the Fund’s investment activities expose it to various types of risk associated with the financial instruments and markets in which it invests. The significant types of financial risks the Fund is exposed to include market risk and credit risk. The Fund’s prospectus provides details of these and other types of risk.
BFA uses a “passive” or index approach to try to achieve the Fund’s investment objective following the securities included in its underlying index during upturns as well as downturns. BFA does not take steps to reduce market exposure or to lessen the effects of a declining market. Divergence from the underlying index and the composition of the portfolio is monitored by BFA.
MARKET RISK
Market risk arises mainly from uncertainty about future values of financial instruments influenced by price, currency and interest rate movements. It represents the potential loss the Fund may suffer through holding market positions in the face of market movements. The Fund is exposed to market risk by virtue of its investment in fixed income instruments. The fair value of securities held by the Fund may decline due to general market conditions, economic trends or events that are not specifically related to the issuers of the securities including local, regional or global political, social or economic instability or to factors that affect a particular industry or group of industries. The extent of the Fund’s exposure to market risk is the market value of the investments held as shown in the Fund’s schedule of investments.
A diversified portfolio, where this is appropriate and consistent with a fund’s objectives, minimizes the risk that a price change of a particular investment will have a material impact on the NAV of a fund. The investment concentrations within the Fund’s portfolio are disclosed in its schedule of investments.
The Fund invests a substantial amount of its assets in securities of non-U.S. issuers that trade in non-U.S. markets. This involves certain considerations and risks not typically associated with securities of U.S. issuers. Such risks include, but are not limited to: generally less liquid and less efficient securities markets; generally greater price volatility; exchange rate fluctuations and exchange controls; imposition of restrictions on the expatriation of funds or other assets of the Fund; less publicly available information about issuers; the imposition of withholding or other taxes; higher transaction and custody costs; settlement delays and risk of loss attendant in settlement procedures; difficulties in enforcing contractual obligations; less regulation of securities markets; different accounting, disclosure and reporting requirements; more substantial governmental involvement in the economy; higher inflation rates; greater social, economic and political uncertainties; the risk of nationalization or expropriation of assets; and the risk of war. These risks are heightened for investments in issuers from countries with less developed markets.
The Fund invests a substantial amount of its assets in fixed-income securities. Changes in market interest rates or economic conditions may affect the value and/or liquidity of such investments. Interest rate risk is the risk that prices of bonds and other fixed-income securities will decrease as interest rates rise and increase as interest rates fall. Securities with longer durations tend to be more sensitive to interest rate changes, usually making them more volatile than securities with shorter durations. Given the environment of historically low interest rates, the Fund may be subject to a greater risk of price losses if interest rates rise.
| 32 | 2015 iSHARES ANNUAL REPORTTO SHAREHOLDERS |
Table of Contents
Notes to Financial Statements (Continued)
iSHARES® INTERNATIONAL HIGH YIELD BOND ETF
CREDIT RISK
Credit risk is the risk that an issuer or guarantor of debt instruments or the counterparty to a financial transaction, including derivatives contracts, repurchase agreements or loans of portfolio securities, is unable or unwilling to make timely interest and/or principal payments or to otherwise honor its obligations. BFA and its affiliates manage counterparty credit risk by entering into transactions only with counterparties that they believe have the financial resources to honor their obligations and by monitoring the financial stability of those counterparties. Financial assets, which potentially expose the Fund to issuer and counterparty credit risks, consist principally of financial instruments and receivables due from counterparties. The extent of the Fund’s exposure to credit and counterparty risks with respect to those financial assets is approximated by their value recorded in its statement of assets and liabilities.
The Fund invests a substantial portion of its assets in high yield securities that are rated below investment-grade (including those bonds rated lower than “BBB-” by Standard & Poor’s Ratings Services and Fitch or “Baa3” by Moody’s), or are unrated which may be more volatile than higher-rated securities of similar maturity. High yield securities may also be subject to greater levels of credit or default risk than higher-rated securities and high yield securities may be less liquid and more difficult to sell at an advantageous time or price or to value than higher-rated securities. In particular, high yield securities are often issued by smaller, less creditworthy companies or by highly leveraged (indebted) companies, which are generally less able than more financially stable companies to make scheduled payments of interest and principal.
| 6. | INCOME TAX INFORMATION |
The Fund is treated as an entity separate from the Company’s other funds for federal income tax purposes. It is the policy of the Fund to qualify as a regulated investment company by complying with the provisions applicable to regulated investment companies, as defined under Subchapter M of the Internal Revenue Code of 1986, as amended, and to annually distribute substantially all of its ordinary income and any net capital gains (taking into account any capital loss carryforwards) sufficient to relieve it from all, or substantially all, federal income and excise taxes. Accordingly, no provision for federal income taxes is required.
U.S. GAAP requires that certain components of net assets be adjusted to reflect permanent differences between financial and tax reporting. These reclassifications have no effect on net assets or NAV per share. The following permanent differences as of October 31, 2015, attributable to net investment loss, foreign currency transactions and realized gains (losses) from in-kind redemptions, were reclassified to the following accounts:
Paid-in Capital | Undistributed Net Investment Income/Distributions | Undistributed Net Realized Gain/Accumulated Net Realized Loss | ||||||
| $(3,938,218) | $ | (8,521,176) | $ | 12,459,394 | ||||
The tax character of distributions paid during the years ended October 31, 2015 and October 31, 2014 was as follows:
| 2015 | 2014 | |||||||
Ordinary income | $ | 228,686 | $ | 5,709,258 | ||||
Long-term capital gain | 91,363 | — | ||||||
Return of capital | 7,481,077 | — | ||||||
|
|
|
| |||||
| $ | 7,801,126 | $ | 5,709,258 | |||||
|
|
|
| |||||
NOTESTO FINANCIAL STATEMENTS | 33 |
Table of Contents
Notes to Financial Statements (Continued)
iSHARES® INTERNATIONAL HIGH YIELD BOND ETF
As of October 31, 2015, the tax components of accumulated net earnings (losses) were as follows:
| Capital Loss Carryforwards | Net Unrealized Gains (Losses)a | Total | ||||||
$(1,529,732) | $ | (24,470,791) | $ | (26,000,523) | ||||
| a | The difference between book-basis and tax-basis unrealized gains (losses) was attributable primarily to the tax deferral of losses on wash sales. |
As of October 31, 2015, the Fund had non-expiring capital loss carryforwards in the amount of $1,529,732 available to offset future realized capital gains.
As of October 31, 2015, the cost of investments for federal income tax purposes was $205,871,161. Net unrealized depreciation was $24,420,828, of which $433,352 represented gross unrealized appreciation on securities and $24,854,180 represented gross unrealized depreciation on securities.
Management has analyzed tax laws and regulations and their application to the Fund as of October 31, 2015, inclusive of the open tax return years, and does not believe there are any uncertain tax positions that require recognition of a tax liability in the Fund’s financial statements.
| 7. | SUBSEQUENT EVENTS |
Management has evaluated the impact of all subsequent events on the Fund through the date the financial statements were available to be issued and has determined that there were no subsequent events requiring adjustment or disclosure in the financial statements.
| 34 | 2015 iSHARES ANNUAL REPORTTO SHAREHOLDERS |
Table of Contents
Report of Independent Registered Public Accounting Firm
To the Shareholders and Board of Directors of
iShares, Inc.:
In our opinion, the accompanying statement of assets and liabilities, including the schedule of investments, and the related statements of operations and of changes in net assets and the financial highlights present fairly, in all material respects, the financial position of iShares International High Yield Bond ETF (the “Fund”) at October 31, 2015, the results of its operations, the changes in its net assets and its financial highlights for each of the periods presented, in conformity with accounting principles generally accepted in the United States of America. These financial statements and financial highlights (hereafter referred to as “financial statements”) are the responsibility of the Fund’s management. Our responsibility is to express an opinion on these financial statements based on our audits. We conducted our audits of these financial statements in accordance with the standards of the Public Company Accounting Oversight Board (United States). Those standards require that we plan and perform the audit to obtain reasonable assurance about whether the financial statements are free of material misstatement. An audit includes examining, on a test basis, evidence supporting the amounts and disclosures in the financial statements, assessing the accounting principles used and significant estimates made by management, and evaluating the overall financial statement presentation. We believe that our audits, which included confirmation of securities at October 31, 2015 by correspondence with the custodian, transfer agent and brokers, provide a reasonable basis for our opinion.
PricewaterhouseCoopers LLP
San Francisco, California
December 22, 2015
REPORT OF INDEPENDENT REGISTERED PUBLIC ACCOUNTING FIRM | 35 |
Table of Contents
iSHARES® INTERNATIONAL HIGH YIELD BOND ETF
Under Section 871(k)(1)(C) of the Internal Revenue Code (the “Code”), the Fund hereby designates $232,622 as the maximum amount allowable as interest-related dividends for the fiscal year ended October 31, 2015.
Under Section 852(b)(3)(C) of the Code, the Fund hereby designates $91,363 as 20% rate long-term capital gain dividends for the fiscal year ended October 31, 2015.
| 36 | 2015 iSHARES ANNUAL REPORTTO SHAREHOLDERS |
Table of Contents
Board Review and Approval of Investment Advisory
Contract
iSHARES® INTERNATIONAL HIGH YIELD BOND ETF
Under Section 15(c) of the Investment Company Act of 1940 (the “1940 Act”), the Company’s Board of Directors (the “Board”), including a majority of Directors who are not “interested persons” of the Company (as that term is defined in the 1940 Act) (the “Independent Directors”), is required annually to consider and approve the Investment Advisory Contract between the Company and BFA (the “Advisory Contract”), and the Sub-Advisory Agreement between BFA and BlackRock International Limited (“BIL”) (the “Sub-Advisory Agreement”), on behalf of the Fund. The Advisory Contract and the Sub-Advisory Agreement are referred to hereafter as the “Advisory Agreements”. The Independent Directors requested, and BFA provided, such information as the Independent Directors, with advice from independent counsel, deemed reasonably necessary to evaluate the Advisory Agreements. A committee of Independent Directors (the “15(c) Committee”), with independent counsel, met with management on May 1, 2015 and May 6, 2015, to discuss the types of information the Independent Directors required and the manner in which management would organize and present such information. At a meeting held on May 21, 2015, management presented preliminary information to the Board relating to the continuance of the Advisory Agreements, and the Board, including the Independent Directors, reviewed and discussed such information at length. The Independent Directors requested from management certain additional information, which management agreed to provide. At a meeting held on June 24-25, 2015, the Board, including the Independent Directors, reviewed the additional information provided by management in response to these requests. After extensive discussions, the Board, including all of the Independent Directors, approved the continuance of the Advisory Agreements for the Fund, based on a review of qualitative and quantitative information provided by BFA, including the additional information management provided at the request of the Independent Directors. The Board noted its satisfaction with the extent and quality of information provided and its frequent interactions with management, as well as the detailed responses and other information provided by BFA. The Board also noted that the Board and BFA agreed to discuss potential enhancements and adjustments to the 15(c) process for the coming year. The Independent Directors were advised by their independent counsel throughout the process, including about the legal standards applicable to their review. In approving the Advisory Agreements for the Fund, the Board, including the Independent Directors, considered the following factors, no one of which was controlling, and reached the following conclusions:
Expenses and Performance of the Fund — The Board reviewed statistical information prepared by Lipper Inc. (“Lipper”), an independent provider of investment company data, regarding the expense ratio components, including actual advisory fees, waivers/reimbursements, and gross and net total expenses of the Fund in comparison with the same information for other exchange traded funds (including, where applicable, funds sponsored by an “at cost” service provider) and, in the limited instances where no comparable ETFs existed and the comparison group would not otherwise be reasonable in Lipper’s judgment, pure index institutional mutual funds, objectively selected by Lipper as comprising the Fund’s applicable peer group pursuant to Lipper’s proprietary ETF methodology (the “Lipper Group”). The Board was provided with a detailed description of Lipper’s proprietary ETF methodology used by Lipper to determine the Fund’s Lipper Group. The Board further noted that due to the limitations in providing comparable funds in the Lipper Group, the statistical information provided in Lipper’s report may or may not provide meaningful direct comparisons to the Fund in all instances.
The Board also noted that the investment advisory fee rate and overall expenses (net of waivers and reimbursements) for the Fund were lower than the median of the investment advisory fee rates and overall expenses (net of waivers and reimbursements) of the funds in its Lipper Group. The Board also noted that BFA pays BIL for its sub-advisory services, and that there are no additional fees imposed on the Fund in respect of the services provided under the Sub-Advisory Agreement.
In addition, the Board reviewed statistical information prepared by Lipper regarding the performance of the Fund for the one-, three-, five-, ten-year, and since inception periods, as applicable, and the “last quarter” period ended December 31, 2014, and a comparison of the Fund’s performance to its performance benchmark index for the same periods. To the extent that any of the comparison funds included in the Lipper Group track the same index as the Fund, Lipper also provided, and the Board reviewed, a comparison of the Fund’s performance to that of such relevant comparison funds for the same periods. The Board noted that the Fund generally performed in line with its performance benchmark index over the relevant periods. In considering this
BOARD REVIEWAND APPROVALOF INVESTMENT ADVISORY CONTRACT | 37 |
Table of Contents
Board Review and Approval of Investment Advisory
Contract (Continued)
iSHARES® INTERNATIONAL HIGH YIELD BOND ETF
information, the Board noted that the Lipper Group may include funds that have a different investment objective and/or benchmark from the Fund. In addition, the Board noted that the Fund seeks to track its own benchmark index and that, during the prior year, the Board received periodic reports on the Fund’s performance in comparison with its benchmark index. Such periodic comparative performance information, including detailed information on certain specific iShares funds requested by the Boards, was also considered.
Based on this review, the other factors considered at the meeting, and their general knowledge of ETF pricing, the Board concluded that the investment advisory fee rate and expense level and the historical performance of the Fund supported the Board’s approval of the continuance of the Advisory Agreements for the coming year.
Nature, Extent and Quality of Services Provided by BFA and BIL or their Affiliates — Based on management’s representations, including information about recent and proposed enhancements to the iShares business, including with respect to shareholder servicing and support, the Board expected that there would be no diminution in the scope of services required of or provided by BFA (and any services provided by BIL on BFA’s behalf or at BFA’s direction) under the Advisory Agreements for the coming year as compared to the scope of services provided by BFA and BIL during prior years. In reviewing the scope of these services, the Board considered the investment philosophy and experience of BFA and BIL, noting that BFA and its affiliates have committed significant resources over time, including during the past year, to supporting the iShares funds and their shareholders. The Board acknowledged that resources to support the iShares funds and their shareholders have been added or enhanced in recent years. The Board also considered the compliance program of BFA and BIL and their compliance record with respect to the Fund. In that regard, the Board noted that BFA reports to the Board about portfolio management and compliance matters on a periodic basis in connection with regularly scheduled meetings of the Board, and on other occasions as necessary and appropriate, and has provided information and made appropriate officers available as needed to provide further assistance with these matters. The Board also reviewed the background and experience of the persons responsible for the day-to-day management of the Fund, as well as the resources available to them in managing the Fund. In addition to the above considerations, the Board reviewed and considered detailed presentations regarding BFA’s investment performance, investment and risk management processes and strategies provided at the June 24-25, 2015 meeting and throughout the previous year, and matters related to BFA’s and BIL’s portfolio compliance policies and procedures, and BFA’s oversight of the services provided by BIL. The Board noted that the Fund had met its investment objective consistently since its inception date.
Based on review of this information, and the performance information discussed above, the Board concluded that the nature, extent and quality of services provided by BFA and BIL to the Fund under the Advisory Agreements supported the Board’s approval of the continuance of the Advisory Agreements for the coming year.
Costs of Services Provided to the Fund and Profits Realized by BFA and its Affiliates — The Board reviewed information about the profitability to BlackRock of the Fund based on the fees payable to BFA and its affiliates (including fees under the Advisory Agreements), and all other sources of revenue and expense to BFA and its affiliates from the Fund’s operations for the last calendar year. The Board reviewed BlackRock’s profitability methodology for the iShares funds, noting that the 15(c) Committee had focused on the methodology and proposed presentation during its meetings. The Board discussed the sources of direct and ancillary revenue with management, including the revenues to BTC from securities lending by the Fund. The Board also discussed BFA’s profit margin as reflected in the Fund’s profitability analysis and reviewed information regarding potential economies of scale (as discussed below). Based on this review, the Board concluded that the profits realized by BFA and its affiliates under the Advisory Agreements and from other relationships between the Fund and BFA and/or its affiliates, if any, were within a reasonable range in light of the factors considered.
Economies of Scale — The Board reviewed information regarding potential economies of scale or other efficiencies that may result from increases in the Fund’s assets, noting that the issue of economies of scale had been focused on extensively by the
| 38 | 2015 iSHARES ANNUAL REPORTTO SHAREHOLDERS |
Table of Contents
Board Review and Approval of Investment Advisory
Contract (Continued)
iSHARES® INTERNATIONAL HIGH YIELD BOND ETF
15(c) Committee during its meetings and addressed by management. The Board and the 15(c) Committee reviewed information provided by BFA regarding scale benefits shared with the iShares funds through relatively low fee rates established at inception, breakpoints, waivers, or other fee reductions, as well as through additional investment in the iShares business and the provision of improved or additional infrastructure and services to the iShares funds and their shareholders. The Board and the 15(c) Committee received information regarding BlackRock’s historical profitability, including BFA’s and its affiliates’ costs in providing services. The cost information distinguished between fixed and variable costs, and explained how the level of fixed and variable costs, as well as the nature of such costs, may impact the existence or size of scale benefits. The Board noted that the Advisory Contract for the Fund did not provide for any breakpoints in the Fund’s investment advisory fee rate as the assets of the Fund increase. However, the Board noted that should material economies of scale exist in the future, a breakpoint structure for the Fund may be appropriate, and that it would continue to monitor the sharing of economies of scale to determine the appropriateness of adding breakpoints in the future.
Based on this review, as well as the other factors considered at the meeting, the Board, recognizing its responsibility to consider this issue periodically, determined to approve the continuance of the Advisory Agreements for the coming year.
Fees and Services Provided for Other Comparable Funds/Accounts Managed by BFA and its Affiliates — The Board received and considered information regarding the investment advisory/management fee rates for other funds/accounts in the U.S. for which BFA (or its affiliates) provides investment advisory/management services, including open-end and closed-end funds registered under the 1940 Act (including sub-advised funds), collective trust funds, separately managed accounts, and institutional separate accounts (together, the “Other Accounts”), and acknowledged BFA’s assertion that the iShares funds are fundamentally different investment vehicles from the Other Accounts. The Board noted that BFA and its affiliates do not manage Other Accounts with substantially the same investment objective and strategy as the Fund or that track the same index or a similar index as the Fund. The Board further noted that BFA provided the Board with detailed information regarding how the Other Accounts (particularly institutional clients) generally differ from the Fund, including in terms of the different, generally more extensive services provided to the Fund, as well as other significant differences in the approach of BFA and its affiliates to the Fund, on one hand, and Other Accounts, on the other. In that regard, the Board considered that the pricing of services to institutional clients is typically based on a number of factors beyond the nature and extent of the specific services to be provided and often depends on the overall relationship between the client and its affiliates and the adviser and its affiliates. In addition, the Board considered the relative complexity and inherent risks and challenges of managing and providing other services to the Fund, as a publicly traded exchange traded fund, as compared to the Other Accounts that are institutional clients in light of differing regulatory requirements and client-imposed mandates. The Board also considered the “all-inclusive” nature of the Fund’s advisory fee structure, and the Fund expenses borne by BFA under this arrangement. The Board noted that the investment advisory fee rate under the Advisory Contract for the Fund was generally higher than the investment advisory/management fee rates for the Other Accounts that are institutional clients of BFA (or its affiliates) and concluded that the differences appeared to be consistent with the factors discussed.
Other Benefits to BFA and/or its Affiliates — The Board reviewed the “fallout” benefits or ancillary revenue received by BFA and/or its affiliates in connection with the services provided to the Fund by BFA, such as payment of revenue to BTC, the Fund’s securities lending agent, for loaning portfolio securities (which was included in the profit margins reviewed by the Board pursuant to BFA’s profitability methodology), and payment of advisory fees and/or administration fees to BFA and BTC (or their affiliates) in connection with any investments by the Fund in other funds for which BFA (or its affiliates) provides investment advisory services and/or administration services. The Board noted that BFA and BIL generally do not use soft dollars or consider the value of research or other services that may be provided to BFA and BIL (including their affiliates) in selecting brokers for portfolio transactions for the Fund. The Board further noted that any portfolio transactions on behalf of the Fund placed through a BFA affiliate or purchased from an underwriting syndicate in which a BFA affiliate participates, are reported to the Board pursuant to Rule 17e-1 or Rule 10f-3, as applicable, under the 1940 Act. The Board concluded that any such ancillary benefits would not be
BOARD REVIEWAND APPROVALOF INVESTMENT ADVISORY CONTRACT | 39 |
Table of Contents
Board Review and Approval of Investment Advisory
Contract (Continued)
iSHARES® INTERNATIONAL HIGH YIELD BOND ETF
disadvantageous to the Fund’s shareholders and thus would not alter the Board’s conclusion with respect to the appropriateness of approving the continuance of the Advisory Agreements for the coming year.
Based on the considerations described above, the Board determined that the Fund’s investment advisory fee rate under the Advisory Agreements does not constitute a fee that is so disproportionately large as to bear no reasonable relationship to the services rendered and that could not have been the product of arm’s-length bargaining, and concluded that it is in the best interest of the Fund and its shareholders to approve the continuance of the Advisory Agreements for the coming year.
| 40 | 2015 iSHARES ANNUAL REPORTTO SHAREHOLDERS |
Table of Contents
Supplemental Information (Unaudited)
iSHARES® INTERNATIONAL HIGH YIELD BOND ETF
Section 19(a) Notices
The amounts and sources of distributions reported are estimates and are provided pursuant to regulatory requirements and are not being provided for tax reporting purposes. The actual amounts and sources for tax reporting purposes will depend upon the Fund’s investment experience during the year and may be subject to changes based on the tax regulations. Shareholders will receive a Form 1099-DIV each calendar year that will inform them how to report these distributions for federal income tax purposes.
| Total Cumulative Distributions for the Fiscal Year | % Breakdown of the Total Cumulative Distributions for the Fiscal Year | |||||||||||||||||||||||||||||
| Net Investment Income | Net Realized Capital Gains | Return of | Total Per | Net Investment Income | Net Realized Capital Gains | Return of Capital | Total Per Share | |||||||||||||||||||||||
| $ | 0.170601 | $ | 0.025379 | $ | 1.533600 | $ | 1.729580 | 10 | % | 1 | % | 89 | % | 100 | % | |||||||||||||||
Premium/Discount Information
The Premium/Discount Information section is intended to present information about the differences between the daily market price on secondary markets for shares of a fund and that fund’s NAV. NAV is the price at which a fund issues and redeems shares. It is calculated in accordance with the standard formula for valuing mutual fund shares. The “Market Price” of a fund generally is determined using the midpoint between the highest bid and the lowest offer on the primary stock exchange on which the shares of such fund are listed for trading, as of the time that the fund’s NAV is calculated. A fund’s Market Price may be at, above or below its NAV. The NAV of a fund will fluctuate with changes in the fair value of its portfolio holdings. The Market Price of a fund will fluctuate in accordance with changes in its NAV, as well as market supply and demand.
Premiums or discounts are the differences (expressed as a percentage) between the NAV and Market Price of a fund on a given day, generally at the time the NAV is calculated. A premium is the amount that a fund is trading above the reported NAV, expressed as a percentage of the NAV. A discount is the amount that a fund is trading below the reported NAV, expressed as a percentage of the NAV.
The following information shows the frequency of distributions of premiums and discounts for the Fund. The information shown for the Fund is for five calendar years (or from the inception date of the Fund if less than five years) through the date of the most recent calendar quarter-end. The specific periods covered for the Fund are disclosed in the table for the Fund.
SUPPLEMENTAL INFORMATION | 41 |
Table of Contents
Supplemental Information (Unaudited) (Continued)
iSHARES® INTERNATIONAL HIGH YIELD BOND ETF
Each line in the table shows the number of trading days in which the Fund traded within the premium/discount range indicated. The number of trading days in each premium/discount range is also shown as a percentage of the total number of trading days in the period covered by each table. All data presented here represents past performance, which cannot be used to predict future results.
Period Covered: April 3, 2012 through September 30, 2015
Premium/Discount Range | Number of Days | Percentage of Total Days | ||||||
Greater than 3.5% and Less than 4.0% | 2 | 0.23 | % | |||||
Greater than 3.0% and Less than 3.5% | 8 | 0.91 | ||||||
Greater than 2.5% and Less than 3.0% | 8 | 0.91 | ||||||
Greater than 2.0% and Less than 2.5% | 7 | 0.80 | ||||||
Greater than 1.5% and Less than 2.0% | 28 | 3.19 | ||||||
Greater than 1.0% and Less than 1.5% | 86 | 9.78 | ||||||
Greater than 0.5% and Less than 1.0% | 329 | 37.43 | ||||||
Between 0.5% and –0.5% | 380 | 43.22 | ||||||
Less than –0.5% and Greater than –1.0% | 17 | 1.93 | ||||||
Less than –1.0% and Greater than –1.5% | 5 | 0.57 | ||||||
Less than –1.5% and Greater than –2.0% | 5 | 0.57 | ||||||
Less than –2.0% | 4 | 0.46 | ||||||
|
|
|
| |||||
| 879 | 100.00 | % | ||||||
|
|
|
| |||||
| 42 | 2015 iSHARES ANNUAL REPORTTO SHAREHOLDERS |
Table of Contents
Director and Officer Information
iSHARES® , INC.
The Board of Directors has responsibility for the overall management and operations of the Company, including general supervision of the duties performed by BFA and other service providers. Each Director serves until he or she resigns, is removed, dies, retires or becomes incapacitated. Each officer shall hold office until his or her successor is elected and qualifies or until his or her death, or his or her resignation or removal. Directors who are not “interested persons” (as defined in the 1940 Act) of the Company are referred to as independent directors (“Independent Directors”).
The registered investment companies advised by BFA or its affiliates are organized into one complex of closed-end funds, two complexes of open-end funds and one complex of exchange-traded funds (“Exchange-Traded Fund Complex”) (each, a “BlackRock Fund Complex”). The Fund is included in the BlackRock Fund Complex referred to as the Exchange-Traded Fund Complex. Each Director also serves as a Trustee of iShares Trust and a Trustee of iShares U.S. ETF Trust and, as a result, oversees a total of 324 funds (as of October 31, 2015) within the Exchange-Traded Fund Complex. With the exception of Robert S. Kapito and Mark Wiedman, the address of each Director and officer is c/o BlackRock, Inc., 400 Howard Street, San Francisco, CA 94105. The address of Mr. Kapito and Mr. Wiedman is c/o BlackRock, Inc., Park Avenue Plaza, 55 East 52nd Street, New York, NY 10055. The Board has designated Robert H. Silver as its Independent Chairman. Additional information about the Fund’s Directors and officers may be found in the Fund’s combined Statement of Additional Information, which is available without charge, upon request, by calling toll-free 1-800-iShares (1-800-474-2737).
Interested Directors
| Name (Age) | Position(s) | Principal Occupation(s) During the Past 5 Years | Other Directorships Held by Director | |||
Robert S. Kapitoa (58) | Director (since 2009). | President and Director, BlackRock, Inc. (since 2006); Vice Chairman of BlackRock, Inc. and Head of BlackRock, Inc.’s Portfolio Management Group (since its formation in 1998) and BlackRock, Inc.’s predecessor entities (since 1988); Trustee, University of Pennsylvania (since 2009); President of Board of Directors, Hope & Heroes Children’s Cancer Fund (since 2002); President of the Board of Directors, Periwinkle Theatre for Youth (since 1983). | Trustee of iShares Trust (since 2009); Trustee of iShares U.S. ETF Trust (since 2011); Director of BlackRock, Inc. (since 2006). | |||
Mark Wiedmanb (44) | Director (since 2013). | Managing Director, BlackRock, Inc. (since 2007); Global Head of iShares (since 2011); Head of Corporate Strategy, BlackRock, Inc. (2009-2011). | Trustee of iShares Trust (since 2013); Trustee of iShares U.S. ETF Trust (since 2013); Director of PennyMac Financial Services, Inc. (since 2008). | |||
| a | Robert S. Kapito is deemed to be an “interested person” (as defined in the 1940 Act) of the Company due to his affiliations with BlackRock, Inc. |
| b | Mark Wiedman is deemed to be an “interested person” (as defined in the 1940 Act) of the Company due to his affiliations with BlackRock, Inc. and its affiliates. |
DIRECTORAND OFFICER INFORMATION | 43 |
Table of Contents
Director and Officer Information (Continued)
iSHARES®, INC.
Independent Directors
| Name (Age) | Position(s) | Principal Occupation(s) During the Past 5 Years | Other Directorships Held by Director | |||
Robert H. Silver (60) | Director (since 2007); Independent Chairman (since 2012). | President and Co-Founder of The Bravitas Group, Inc. (since 2006); Director and Vice Chairman of the YMCA of Greater NYC (2001-2011); Broadway Producer (2006-2011); Co-Founder and Vice President of Parentgiving Inc. (since 2008); Director and Member of the Audit and Compensation Committee of EPAM Systems, Inc. (2006-2009); President and Chief Operating Officer of UBS Financial Services Inc. (formerly Paine Webber Inc.) (2003-2005) and various executive positions with UBS and its affiliates (1988-2005); CPA and Audit Manager of KPMG, LLP (formerly Peat Marwick Mitchell) (1977-1983). | Trustee of iShares Trust (since 2007); Trustee of iShares U.S. ETF Trust (since 2011); Independent Chairman of iShares Trust and iShares U.S. ETF Trust (since 2012). | |||
Jane D. Carlin (59) | Director (since 2015). | Managing Director and Global Head of Financial Holding Company Governance & Assurance and the Global Head of Operational Risk Management of Morgan Stanley (2006-2012). | Trustee of iShares Trust (since 2015); Trustee of iShares U.S. ETF Trust (since 2015); Director of PHH Corporation (mortgage solutions) (since 2012). | |||
Cecilia H. Herbert (66) | Director (since 2005); Nominating and Governance Committee Chair and Equity Plus Committee Chair (since 2012). | Director (1998-2013) and President (2007-2011) of the Board of Directors, Catholic Charities CYO; Trustee (2002-2011) and Chair of the Finance and Investment Committee (2006-2010) of the Thacher School; Member (since 1992) and Chair (1994-2005) of the Investment Committee, Archdiocese of San Francisco; Trustee and Member of the Investment Committee, WNET, the New York public broadcasting/media company (since 2011). | Trustee of iShares Trust (since 2005); Trustee of iShares U.S. ETF Trust (since 2011); Director of Forward Funds (34 portfolios) (since 2009). | |||
Charles A. Hurty (72) | Director (since 2005); Audit Committee Chair (since 2006). | Retired; Partner, KPMG LLP (1968-2001). | Trustee of iShares Trust (since 2005); Trustee of iShares U.S. ETF Trust (since 2011); Director of GMAM Absolute Return Strategy Fund (1 portfolio) (since 2002); Director of SkyBridge Alternative Investments Multi-Adviser Hedge Fund Portfolios LLC (2 portfolios) (since 2002). | |||
| 44 | 2015 iSHARES ANNUAL REPORTTO SHAREHOLDERS |
Table of Contents
Director and Officer Information (Continued)
iSHARES®, INC.
Independent Directors (Continued)
| Name (Age) | Position(s) | Principal Occupation(s) During the Past 5 Years | Other Directorships Held by Director | |||
John E. Kerrigan (60) | Director (since 2005); Fixed Income Plus Committee Chair (since 2012). | Chief Investment Officer, Santa Clara University (since 2002). | Trustee of iShares Trust (since 2005); Trustee of iShares U.S. ETF Trust (since 2011). | |||
John E. Martinez (54) | Director (since 2003); Securities Lending Committee Chair (since 2012). | Director of FirstREX Agreement Corp. (formerly EquityRock, Inc.) (since 2005). | Trustee of iShares Trust (since 2003); Trustee of iShares U.S. ETF Trust (since 2011). | |||
Madhav V. Rajan (51) | Director (since 2011); 15(c) Committee Chair (since 2012). | Robert K. Jaedicke Professor of Accounting and Senior Associate Dean for Academic Affairs and Head of MBA Program, Stanford University Graduate School of Business (since 2001); Professor of Law (by courtesy), Stanford Law School (since 2005); Visiting Professor, University of Chicago (2007-2008). | Trustee of iShares Trust (since 2011); Trustee of iShares U.S. ETF Trust (since 2011); Director, Cavium, Inc. (since 2013). | |||
DIRECTORAND OFFICER INFORMATION | 45 |
Table of Contents
Director and Officer Information (Continued)
iSHARES®, INC.
Officers
| Name (Age) | Position(s) | Principal Occupation(s) During the Past 5 Years | ||
Manish Mehta (44) | President (since 2013). | Managing Director, BlackRock, Inc. (since 2009); Chief Operating Officer for iShares (since 2009); Head of Strategy and Corporate Development, BGI (2005-2009); Chief of Staff to the CEO, BGI (2005-2009). | ||
Jack Gee (56) | Treasurer and Chief Financial Officer (since 2008). | Managing Director, BlackRock, Inc. (since 2009); Senior Director of Fund Administration of Intermediary Investor Business, BGI (2009); Director of Fund Administration of Intermediary Investor Business, BGI (2004-2009). | ||
Benjamin Archibald (40) | Secretary (since 2015). | Managing Director, BlackRock, Inc. (since 2014); Secretary of the BlackRock-advised Mutual Funds (since 2012); Director, BlackRock, Inc. (2010-2013). | ||
Charles Park (48) | Chief Compliance Officer (since 2006). | Chief Compliance Officer of BlackRock Advisors, LLC and the BlackRock-advised Funds in the Equity-Bond Complex, the Equity-Liquidity Complex and the Closed-End Complex (since 2014); Chief Compliance Officer of BFA (since 2006). | ||
Scott Radell (46) | Executive Vice President (since 2012). | Managing Director, BlackRock, Inc. (since 2009); Head of Portfolio Solutions, BlackRock, Inc. (since 2009); Head of Portfolio Solutions, BGI (2007-2009); Credit Portfolio Manager, BGI (2005-2007); Credit Research Analyst, BGI (2003-2005). | ||
Amy Schioldager (53) | Executive Vice President (since 2007). | Senior Managing Director, BlackRock, Inc. (since 2009); Global Head of Index Equity, BGI (2008-2009); Global Head of U.S. Indexing, BGI (2006-2008); Head of Domestic Equity Portfolio Management, BGI (2001-2006). | ||
| 46 | 2015 iSHARES ANNUAL REPORTTO SHAREHOLDERS |
Table of Contents
For more information visit www.iShares.com or call 1-800-iShares (1-800-474-2737)
This report is intended for the Fund’s shareholders. It may not be distributed to prospective investors unless it is preceded or accompanied by the current prospectus.
Investing involves risk, including possible loss of principal.
The iShares Funds are distributed by BlackRock Investments, LLC (together with its affiliates, “BlackRock”).
The iShares Funds are not sponsored, endorsed, issued, sold or promoted by Markit Indices Limited, nor does this company make any representation regarding the advisability of investing in the iShares Funds. BlackRock is not affiliated with the company listed above.
A description of the policies that the Fund uses to determine how to vote proxies relating to portfolio securities and information about how the Fund voted proxies relating to portfolio securities during the most recent twelve-month period ending June 30 is available without charge, upon request, by calling toll-free 1-800-474-2737; on the Fund’s website at www.iShares.com; and on the U.S. Securities and Exchange Commission (SEC) website at www.sec.gov.
The Fund files its complete schedule of portfolio holdings with the SEC for the first and third quarters of each fiscal year on Form N-Q. The Fund’s Form N-Q is available on the SEC’s website or may be reviewed and copied at the SEC’s Public Reference Room in Washington, D.C. Information on the operation of the Public Reference Room may be obtained by calling 1-800-SEC-0330. The Fund also discloses its complete schedule of portfolio holdings on a daily basis on the Fund’s website.
©2015 BlackRock, Inc. All rights reserved. iSHARES and BLACKROCK are registered trademarks of BlackRock, Inc. or its subsidiaries. All other marks are the property of their respective owners.
iS-AR-1017-1015
 |  |
Table of Contents
Item 2. Code of Ethics.
iShares, Inc. (the “Registrant”) adopted a new code of ethics on July 1, 2015 that applies to persons appointed by the Registrant’s Board of Directors as the President and/or Chief Financial Officer, and any persons performing similar functions. For the fiscal year ended October 31, 2015, there were no amendments to any provision of the former and new codes of ethics, nor were there any waivers granted from any provision of the former and new codes of ethics. A copy of the new code of ethics is filed with this Form N-CSR under Item 12(a)(1).
Item 3. Audit Committee Financial Expert.
The Registrant’s Board of Directors has determined that the Registrant has more than one audit committee financial expert, as that term is defined under Item 3(b) and 3(c), serving on its audit committee. The audit committee financial experts serving on the Registrant’s audit committee are Charles A. Hurty, John E. Kerrigan, Robert H. Silver and Madhav V. Rajan, all of whom are independent, as that term is defined under Item 3(a)(2).
Item 4. Principal Accountant Fees and Services.
The principal accountant fees disclosed in items 4(a), 4(b), 4(c), 4(d) and 4(g) are for the five series of the Registrant for which the fiscal year-end is October 31, 2015 (the “Funds”), and whose annual financial statements are reported in Item 1.
| (a) | Audit Fees – The aggregate fees billed for each of the last two fiscal years for professional services rendered by the principal accountant for the audit of the Funds’ annual financial statements or services that are normally provided by the accountant in connection with statutory and regulatory filings or engagements for those fiscal years were $75,000 for the fiscal year ended October 31, 2014 and $76,000 for the fiscal year ended October 31, 2015. |
| (b) | Audit-Related Fees – There were no fees billed for the fiscal years ended October 31, 2014 and October 31, 2015 for assurance and related services by the principal accountant that were reasonably related to the performance of the audit of the Fund’s financial statements and are not reported under (a) of this Item. |
| (c) | Tax Fees – The aggregate fees billed in each of the last two fiscal years for professional services rendered by the principal accountant for the review of the Funds’ tax returns and excise tax calculations, were $18,385 for the fiscal year ended October 31, 2014 and $18,385 for the fiscal year ended October 31, 2015. |
| (d) | All Other Fees – There were no other fees billed for the fiscal years ended October 31, 2014 and October 31, 2015 for products and services provided by the principal accountant, other than the services reported in (a) through (c) of this Item. |
| (e) | (1) The Registrant’s audit committee charter, as amended, provides that the audit committee is responsible for the approval, prior to appointment, of the engagement of the principal accountant to annually audit and provide their opinion on the Registrant’s financial statements. The audit committee must also approve, prior to appointment, the engagement of the principal accountant to provide non-audit services to the Registrant or to any entity controlling, controlled by or under common control with the Registrant’s investment adviser (“Adviser Affiliate”) that provides ongoing services to the Registrant, if the engagement relates directly to the operations and financial reporting of the Registrant. |
(2) There were no services described in (b) through (d) above (including services required by the audit committee pursuant to paragraph (c)(7)(ii) of Rule 2-01 of Regulation S-X) that were approved by the audit committee pursuant to paragraph (c)(7)(i)(C) of Rule 2-01 of Regulation S-X.
| (f) | None of the hours expended on the principal accountant’s engagement to audit the Funds’ financial statements for the fiscal year ended October 31, 2015 were attributable to work performed by persons other than the principal accountant’s full-time, permanent employees. |
| (g) | The aggregate non-audit fees billed by the Registrant’s principal accountant for services rendered to the Funds, and rendered to the Registrant’s investment adviser, and any Adviser Affiliate that provides ongoing services to the Registrant for the last two fiscal years were $3,359,197 for the fiscal year ended October 31, 2014 and $3,533,666 for the fiscal year ended October 31, 2015. |
| (h) | The Registrant’s audit committee has considered whether the provision of non-audit services rendered to the Registrant’s investment adviser and any Adviser Affiliate that were not pre-approved pursuant to paragraph (c)(7)(ii) of Rule 2-01 of Regulation S-X, if any, are compatible with maintaining the principal accountant’s independence, and has determined that the provision of these services do not compromise the principal accountant’s independence. |
Item 5. Audit Committee of Listed Registrants.
The Registrant is a listed issuer as defined in Rule 10A-3 under the Exchange Act and has a separately-designated standing audit committee established in accordance with Section 3(a)(58)(A) of the Exchange Act. The Registrant’s audit committee members are Jane D. Carlin, Cecilia H. Herbert, Charles A. Hurty, John E. Kerrigan, Robert H. Silver, John E. Martinez and Madhav V. Rajan.
Table of Contents
Item 6. Investments.
| (a) | Schedules of investments are included as part of the reports to shareholders filed under Item 1 of this Form. |
| (b) | Not applicable. |
Item 7. Disclosure of Proxy Voting Policies and Procedures for Closed-End Management Investment Companies.
Not applicable to the Registrant.
Item 8. Portfolio Managers of Closed-End Management Investment Companies.
Not applicable to the Registrant.
Item 9. Purchases of Equity Securities by Closed-End Management Investment Company and Affiliated Purchasers.
Not applicable to the Registrant.
Item 10. Submission of Matters to a Vote of Security Holders.
There were no material changes to the procedures by which shareholders may recommend nominees to the Registrant’s Board of Directors.
Item 11. Controls and Procedures.
(a) The President (the Registrant’s Principal Executive Officer) and Chief Financial Officer (the Registrant’s Principal Financial Officer) have concluded that, based on their evaluation as of a date within 90 days of the filing date of this report, the disclosure controls and procedures of the Registrant (as defined in Rule 30a-3(c) under the Investment Company Act of 1940) are reasonably designed to achieve the purposes described in Section 4(a) of the attached certification.
(b) There were no changes in the Registrant’s internal control over financial reporting (as defined in Rule 30a-3(d) under the Investment Company Act of 1940) that occurred during the second fiscal quarter of the period covered by this report that have materially affected, or are reasonably likely to materially affect, the Registrant’s internal control over financial reporting.
Item 12. Exhibits.
(a) (1) Code of Ethics for Senior Officers that is the subject of Item 2 is attached.
(a) (2) Section 302 Certifications are attached.
(a) (3) Not applicable to the Registrant.
(b) Section 906 Certifications are attached.
Table of Contents
SIGNATURES
Pursuant to the requirements of the Securities Exchange Act of 1934 and the Investment Company Act of 1940, the Registrant has duly caused this report to be signed on its behalf by the undersigned, thereunto duly authorized.
| iShares, Inc. | ||
| By: | /s/ Manish Mehta | |
| Manish Mehta, President (Principal Executive Officer) | ||
| Date: December 29, 2015 | ||
Pursuant to the requirements of the Securities Exchange Act of 1934 and the Investment Company Act of 1940, this report has been signed below by the following persons on behalf of the Registrant and in the capacities and on the dates indicated.
| By: | /s/ Manish Mehta | |
| Manish Mehta, President (Principal Executive Officer) | ||
| Date: December 29, 2015 | ||
| By: | /s/ Jack Gee | |
| Jack Gee, Treasurer and Chief Financial Officer (Principal Financial Officer) | ||
| Date: December 29, 2015 | ||