UNITED STATES
SECURITIES AND EXCHANGE COMMISSION
Washington, D.C. 20549
FORM N-CSR
CERTIFIED SHAREHOLDER REPORT
OF REGISTERED MANAGEMENT INVESTMENT COMPANIES
Investment Company Act file number 811-09102
iShares, Inc.
(Exact name of registrant as specified in charter)
c/o: State Street Bank and Trust Company
100 Summer Street, 4th Floor, Boston, MA 02110
(Address of principal executive offices) (Zip code)
The Corporation Trust Incorporated
2405 York Road, Suite 201, Lutherville-Timonium, Maryland 21093
(Name and address of agent for service)
Registrant’s telephone number, including area code: (415) 670-2000
Date of fiscal year end: October 31, 2018
Date of reporting period: October 31, 2018
| Item 1. | Reports to Stockholders. |
Copies of the annual reports transmitted to shareholders pursuant to Rule 30e-1 under the Investment Company Act of 1940 are attached.
OCTOBER 31, 2018
2018 ANNUAL REPORT |  |
iShares, Inc.
 iShares Emerging Markets High Yield Bond ETF | EMHY | Cboe BZX
iShares International High Yield Bond ETF | HYXU | Cboe BZX
iShares J.P. Morgan EM Corporate Bond ETF | CEMB | Cboe BZX
iShares J.P. Morgan EM Local Currency Bond ETF | LEMB | NYSE Arca
iShares US & Intl High Yield Corp Bond ETF | GHYG | Cboe BZX
| Page | ||||
| ||||
| 5 | |||
| 6 | ||||
| 16 | ||||
| 16 | ||||
| 17 | ||||
Financial Statements | ||||
| 56 | ||||
| 58 | ||||
| 60 | ||||
| 63 | ||||
| 68 | ||||
| 77 | ||||
| 78 | ||||
| 79 | ||||
| 87 | ||||
| 91 | ||||
| 93 | ||||
| 94 | ||||
iShares, Inc.
Global Bond Market Overview
Global investment-grade bonds declined for the 12 months ended October 31, 2018 (“reporting period”). The Bloomberg Barclays Global Aggregate Index, a broad measure of global bond market performance, returned -2.05% in U.S. dollar terms for the reporting period.
The negative return for global bonds was driven primarily by rising global interest rates and mixed economic data. After a strong 2017, global economic growth eased in 2018 as areas of weakness appeared in several regions of the world. In addition, the global fixed-income markets were affected by a number of external developments, including escalating trade tensions between the U.S. and several of its trading partners (most notably China and Europe), as well as geopolitical conflicts in Turkey and the Middle East.
Regionally, the U.S. bond market declined as a strengthening U.S. economy led to higher interest rates. Driven in part by the stimulative effect of federal tax reform legislation, the U.S. economy grew by 3% for the 12 months ended September 2018, its highest year-over-year growth rate in more than three years. Faster economic growth drove the inflation rate to its highest level in more than six years in mid-2018. In this environment, the U.S. Federal Reserve Bank (“Fed”) increased short-term interest rates four times during the reporting period, increasing its short-term interest rate target to 2.25%, the highest level in more than a decade. From a sector perspective, corporate bonds declined the most amid investor concerns about high corporate debt levels, a decline in average credit quality, and relatively high valuations. In contrast, asset-backed securities (bonds backed by credit card receivables, auto loans, and other debt) advanced for the reporting period, benefiting from their higher yields and relatively short maturities.
The smaller decline in European bond markets was driven in part by a slowdown in economic activity. After improving notably in 2017, economic growth in the Eurozone slowed markedly through the first three quarters of 2018. In particular, growth in the Italian economy slowed significantly following a debt-heavy budget proposed by Italy’s new populist government, which led to a sharp increase in the country’s bond yields late in the reporting period. Other major Eurozone economies, such as Germany and France, also weakened, but to a lesser extent. Despite the economic slowdown, the European Central Bank (“ECB”) reaffirmed its plan to end its quantitative easing measures by the end of 2018, though the ECB intends to maintain its zero interest-rate policy. In the U.K., slowing economic growth and concerns about the economic impact of Brexit when it takes effect in early 2019 kept bond yields relatively stable, leading to positive returns for British bonds.
Asia-Pacific bond markets also declined modestly for the reporting period as economic growth in the region slowed. In Japan, the nation’s longest period of sustained expansion in more than 20 years came to an end when the Japanese economy contracted in the first quarter of 2018. Japanese bond yields increased slightly during the reporting period but remained near historically low levels. In South Korea, bond yields declined as the nation’s economy grew at its slowest pace in nine years. In contrast, Australian bond yields increased as the country’s economy grew at its fastest rate in six years, benefiting from strong consumer spending and increasing commodities prices.
M A R K E T O V E R V I E W | 5 |
Fund Summary as of October 31, 2018
| iShares® Emerging Markets High Yield Bond ETF |
Investment Objective
The iShares Emerging Markets High Yield Bond ETF (the “Fund”) seeks to track the investment results of an index composed of U.S. dollar-denominated, emerging market high yield sovereign and corporate bonds, as represented by the Morningstar® Emerging Markets High Yield Bond IndexSM (the “Index”). The Fund invests in a representative sample of securities included in the Index that collectively has an investment profile similar to the Index. Due to the use of representative sampling, the Fund may or may not hold all of the securities that are included in the Index.
Performance
| Average Annual Total Returns | Cumulative Total Returns | |||||||||||||||||||||||||||
| 1 Year | 5 Years | Since Inception | 1 Year | 5 Years | Since Inception | |||||||||||||||||||||||
Fund NAV | (5.96 | )% | 3.71 | % | 4.35 | % | (5.96 | )% | 19.96 | % | 32.38 | % | ||||||||||||||||
Fund Market | (6.30 | ) | 3.73 | 4.34 | (6.30 | ) | 20.07 | 32.27 | ||||||||||||||||||||
Index | (5.64 | ) | 4.00 | 4.71 | (5.64 | ) | 21.67 | 35.38 | ||||||||||||||||||||
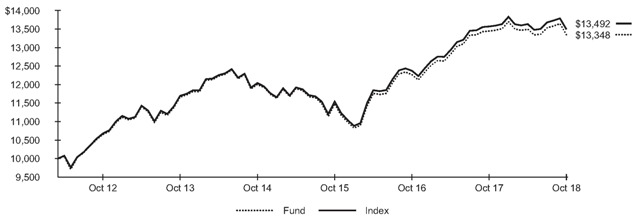
GROWTH OF $10,000 INVESTMENT
(SINCE INCEPTION AT NET ASSET VALUE)
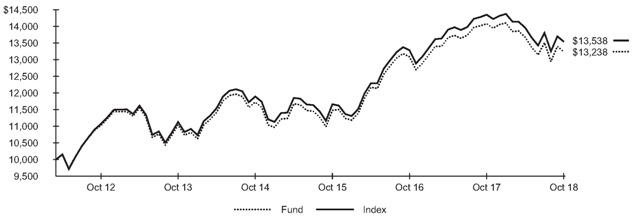
The inception date of the Fund was 4/3/12. The first day of secondary market trading was 4/3/12.
Past performance is no guarantee of future results. Performance results do not reflect the deduction of taxes that a shareholder would pay on fund distributions or on the redemption or sale of fund shares. See “About Fund Performance” on page 16 for more information.
Expense Example
| Actual | Hypothetical 5% Return | |||||||||||||||||||||||||
|
Beginning |
| | Ending Account Value (10/31/18) | | | Expenses Paid During the Period | (a) | | Beginning Account Value (05/01/18) | | | Ending Account Value (10/31/18) | | | Expenses Paid During the Period | (a) | | Annualized Expense Ratio | | ||||||
| $ 1,000.00 | $ 968.60 | $ 2.48 | $ 1,000.00 | $ 1,022.70 | $ 2.55 | 0.50 | % | |||||||||||||||||||
| (a) | Expenses are calculated using the Fund’s annualized expense ratio (as disclosed in the table), multiplied by the average account value for the period, multiplied by the number of days in the period (184 days) and divided by the number of days in the year (365 days). See “Shareholder Expenses” on page 16 for more information. |
| 6 | 2 0 1 8 I S H A R E S A N N U A L R E P O R T T O S H A R E H O L D E R S |
Fund Summary as of October 31, 2018 (continued)
| iShares® Emerging Markets High Yield Bond ETF |
Portfolio Management Commentary
As represented by the Index, emerging market high-yield bonds posted a negative return for the reporting period amid weakening global growth and a number of high-profile currency and political crises. The leading detractors from performance were sovereign bonds of countries where interest rates rose and currencies declined significantly.
Specifically, Argentine bonds were the leading detractors from the Index’s performance amid a sharp decline in the value of the Argentine peso. A corruption scandal that involved some of Argentina’s largest corporations also negatively affected bonds, as demand for Argentine debt declined due to the perceived risk of an ongoing investigation.
Turkish bonds also detracted meaningfully from the Index’s return. Rising inflation, the depreciation of the Turkish lira, and concerns about the government’s ability to manage the economy led to an economic slowdown and a sharp increase in bond yields. Although the Turkish government initially attempted to keep interest rates low, significant interest rate increases late in the reporting period alleviated some pressure on Turkish bonds.
Venezuelan bonds were also notable detractors from the Index’s performance. Venezuela entered an economic crisis, inflation rose, and its currency collapsed in value relative to the U.S. dollar. In those conditions, the country defaulted on a number of its debt obligations. Chinese corporate bonds also detracted from the Index’s performance. A debt reduction campaign by the Chinese government reduced access to credit for many companies, resulting in a series of corporate bond defaults. In addition, a leading Chinese property developer and high-yield bond issuer struggled as the housing market cooled late in the reporting period. Russian corporate bonds also struggled due to new U.S. sanctions, which weighed on the economy and drove up Russian borrowing costs.
Portfolio Information
ALLOCATION BY CREDIT QUALITY
| Moody’s Credit Rating* | Percent of Total Investments(a) | |
Baa | 5.4% | |
Ba | 48.5 | |
B | 31.7 | |
Caa | 3.4 | |
C | 1.3 | |
Not Rated | 9.7 |
TEN LARGEST COUNTRIES
| Country | Percent of Total Investments(a) | |
Brazil | 21.3% | |
Turkey | 12.8 | |
Argentina | 8.2 | |
Russia | 7.0 | |
China | 4.9 | |
South Africa | 4.8 | |
Lebanon | 3.3 | |
Ecuador | 3.0 | |
Ukraine | 2.9 | |
Dominican Republic | 2.6 |
| * | Credit quality ratings shown reflect the ratings assigned by Moody’s Investors Service (“Moody’s”), a widely used independent, nationally recognized statistical rating organization. Moody’s credit ratings are opinions of the credit quality of individual obligations or of an issuer’s general creditworthiness. Investment grade ratings are credit ratings of Baa or higher. Below investment grade ratings are credit ratings of Ba or lower. Unrated investments do not necessarily indicate low credit quality. Credit quality ratings are subject to change. |
| (a) | Excludes money market funds. |
F U N D S U M M A R Y | 7 |
Fund Summary as of October 31, 2018
| iShares® International High Yield Bond ETF |
Investment Objective
The iShares International High Yield Bond ETF (the “Fund”) seeks to track the investment results of an index composed of euro, British pound sterling and Canadian dollar-denominated, high yield corporate bonds, as represented by the Markit iBoxx® Global Developed Markets ex-US High Yield Index (the “Index”). The Fund invests in a representative sample of securities included in the Index that collectively has an investment profile similar to the Index. Due to the use of representative sampling, the Fund may or may not hold all of the securities that are included in the Index.
Performance
| Average Annual Total Returns | Cumulative Total Returns | |||||||||||||||||||||||||||
| 1 Year | 5 Years | Since Inception | 1 Year | 5 Years | Since Inception | |||||||||||||||||||||||
Fund NAV | (4.49 | )% | (0.01 | )% | 3.14 | % | (4.49 | )% | (0.07 | )% | 22.59 | % | ||||||||||||||||
Fund Market | (4.75 | ) | (0.14 | ) | 3.14 | (4.75 | ) | (0.68 | ) | 22.53 | ||||||||||||||||||
Index | (4.17 | ) | 0.19 | 3.29 | (4.17 | ) | 0.97 | 23.70 | ||||||||||||||||||||
GROWTH OF $10,000 INVESTMENT
(SINCE INCEPTION AT NET ASSET VALUE)
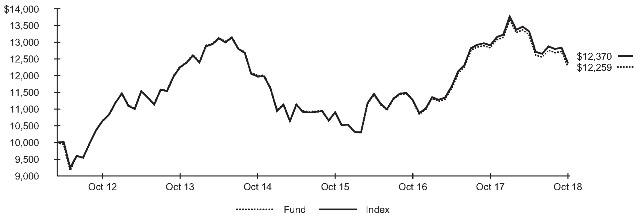
The inception date of the Fund was 4/3/12. The first day of secondary market trading was 4/3/12.
Past performance is no guarantee of future results. Performance results do not reflect the deduction of taxes that a shareholder would pay on fund distributions or on the redemption or sale of fund shares. See “About Fund Performance” on page 16 for more information.
Expense Example
| Actual | Hypothetical 5% Return | |||||||||||||||||||||||||
|
Beginning |
| | Ending Account Value (10/31/18) | | | Expenses Paid During the Period | (a) | | Beginning Account Value (05/01/18) | | | Ending Account Value (10/31/18) | | | Expenses Paid During the Period | (a) | | Annualized Expense Ratio | | ||||||
| $ 1,000.00 | $ 927.30 | $ 1.94 | $ 1,000.00 | $ 1,023.20 | $ 2.04 | 0.40 | % | |||||||||||||||||||
| (a) | Expenses are calculated using the Fund’s annualized expense ratio (as disclosed in the table), multiplied by the average account value for the period, multiplied by the number of days in the period (184 days) and divided by the number of days in the year (365 days). See “Shareholder Expenses” on page 16 for more information. |
| 8 | 2 0 1 8 I S H A R E S A N N U A L R E P O R T T O S H A R E H O L D E R S |
Fund Summary as of October 31, 2018 (continued)
| iShares® International High Yield Bond ETF |
Portfolio Management Commentary
As represented by the Index, international high-yield bonds declined during the reporting period, reflecting an increase in interest rates and slower economic growth across developed markets outside the U.S. From a country perspective, euro-denominated bonds were the leading detractors from the Index’s performance. Italian bonds detracted the most amid political uncertainty and concern about the government’s creditworthiness after the 2019 budget increased Italy’s deficit spending. Sharply higher Italian government bond yields negatively affected high-yield bonds because they increase financing costs and indicate the potential for slower growth ahead. In addition, many Italian corporations hold a significant amount of government bonds, so lower prices and potential credit downgrades adversely affect their balance sheets.
French bonds also declined amid rising interest rates and slower economic growth, which weighed on credit-sensitive corporate bonds. High levels of debt, which caused the French government to restrict bank lending to some companies, also affected French corporate bonds. Other notable detractors in the euro bloc included Germany and the Netherlands, where rates were volatile and economic growth slowed. A weaker euro further limited the performance of all these bonds in U.S. dollar terms.
High-yield bonds in the U.S. and the U.K. also detracted from the Index’s performance. Although U.S. high-yield corporate bonds benefited from tax cuts, strong economic growth, and limited bond supply, a number of issuers in the Index were affected by exposure to the automotive and manufacturing industries. In the U.K., bonds issued by automakers were the leading detractors. In addition, negotiation challenges related to the U.K.’s exit from the E.U. weighed on the British pound, which depreciated by approximately 4% against the U.S. dollar.
Portfolio Information
ALLOCATION BY CREDIT QUALITY
| Moody’s Credit Rating* | Percent of Total Investments(a) | |
Baa | 0.4% | |
Ba | 56.0 | |
B | 26.6 | |
Caa | 5.0 | |
Not Rated | 12.0 |
TEN LARGEST HOLDINGS
| Country | Percent of Total Investments(a) | |
Italy | 19.4% | |
United States | 16.9 | |
France | 13.2 | |
Germany | 8.8 | |
United Kingdom | 8.2 | |
Netherlands | 5.1 | |
Spain | 4.2 | |
Luxembourg | 4.1 | |
Ireland | 3.6 | |
Sweden | 3.4 |
| * | Credit quality ratings shown reflect the ratings assigned by Moody’s Investors Service (“Moody’s”), a widely used independent, nationally recognized statistical rating organization. Moody’s credit ratings are opinions of the credit quality of individual obligations or of an issuer’s general creditworthiness. Investment grade ratings are credit ratings of Baa or higher. Below investment grade ratings are credit ratings of Ba or lower. Unrated investments do not necessarily indicate low credit quality. Credit quality ratings are subject to change. |
| (a) | Excludes money market funds. |
F U N D S U M M A R Y | 9 |
Fund Summary as of October 31, 2018
| iShares® J.P. Morgan EM Corporate Bond ETF |
Investment Objective
The iShares J.P. Morgan EM Corporate Bond ETF (the “Fund”) seeks to track the investment results of an index composed of U.S. dollar-denominated, emerging market corporate bonds, as represented by the J.P. Morgan CEMBI Broad Diversified Core Index (the “Index”). The Fund invests in a representative sample of securities included in the Index that collectively has an investment profile similar to the Index. Due to the use of representative sampling, the Fund may or may not hold all of the securities that are included in the Index.
Performance
| Average Annual Total Returns | Cumulative Total Returns | |||||||||||||||||||||||||||
| 1 Year | 5 Years | Since Inception | 1 Year | 5 Years | Since Inception | |||||||||||||||||||||||
Fund NAV | (3.09 | )% | 3.16 | % | 3.41 | % | (3.09 | )% | 16.84 | % | 24.54 | % | ||||||||||||||||
Fund Market | (3.34 | ) | 3.58 | 3.40 | (3.34 | ) | 19.22 | 24.44 | ||||||||||||||||||||
Index(a) | (2.38 | ) | 3.79 | 4.01 | (2.38 | ) | 20.41 | 29.27 | ||||||||||||||||||||
GROWTH OF $10,000 INVESTMENT
(SINCE INCEPTION AT NET ASSET VALUE)
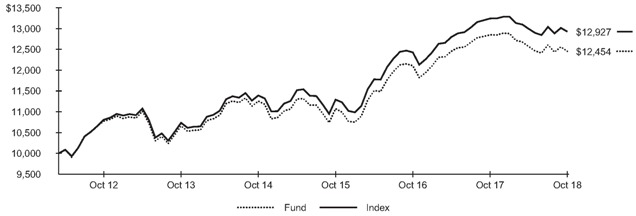
The inception date of the Fund was 4/17/12. The first day of secondary market trading was 4/19/12.
| (a) | Index performance through May 31, 2017 reflects the performance of the Morningstar® Emerging Markets Corporate Bond IndexSM. Index performance beginning on June 1, 2017 reflects the performance of the J.P. Morgan CEMBI Broad Diversified Core Index. |
Past performance is no guarantee of future results. Performance results do not reflect the deduction of taxes that a shareholder would pay on fund distributions or on the redemption or sale of fund shares. See “About Fund Performance” on page 16 for more information.
Expense Example
| Actual | Hypothetical 5% Return | |||||||||||||||||||||||||
|
Beginning |
| | Ending Account Value (10/31/18) | | | Expenses Paid During the Period | (a) | | Beginning Account Value (05/01/18) | | | Ending Account Value (10/31/18) | | | Expenses Paid During the Period | (a) | | Annualized Expense Ratio | | ||||||
| $ 1,000.00 | $ 991.00 | $ 2.51 | $ 1,000.00 | $ 1,022.70 | $ 2.55 | 0.50 | % | |||||||||||||||||||
| (a) | Expenses are calculated using the Fund’s annualized expense ratio (as disclosed in the table), multiplied by the average account value for the period, multiplied by the number of days in the period (184 days) and divided by the number of days in the year (365 days). See “Shareholder Expenses” on page 16 for more information. |
| 10 | 2 0 1 8 I S H A R E S A N N U A L R E P O R T T O S H A R E H O L D E R S |
Fund Summary as of October 31, 2018 (continued)
| iShares® J.P. Morgan EM Corporate Bond ETF |
Portfolio Management Commentary
As represented by the index, U.S. dollar-denominated emerging market corporate bonds posted a negative return for the reporting period. Rising U.S. interest rates and a strengthening U.S. dollar made servicing debt more expensive for companies and countries with U.S. dollar-denominated bonds. Though debt denominated in U.S. dollars avoids direct currency exposure, it can still be affected indirectly if a company’s ability to make payments in U.S. dollars is impaired. This is true for companies that do business and earn revenues in local currency terms, but whose debt is denominated in U.S. dollars.
Turkish bonds were the largest detractors from the Index’s return. Rising inflation, the depreciation of the Turkish lira, and concerns about the government’s ability to manage the economy led to an economic slowdown and a sharp increase in bond yields. While the Turkish government initially attempted to keep interest rates low, significant interest rate increases late in the reporting period helped to alleviate some pressure on Turkish bonds.
Chinese corporate bonds were the largest detractors from the Index’s return. A debt reduction campaign by the Chinese government reduced access to credit for many Chinese companies, resulting in a series of corporate bond defaults. This caused investors to demand higher yield to offset increased risk and drive bond prices down.
Corporate debt from Argentina also detracted from the Index’s performance amid a sharp decline in the value of the Argentine peso. A corruption scandal that involved some of Argentina’s largest corporations also negatively affected bonds, as demand for Argentine debt declined due to the perceived risk of an ongoing investigation. Russian corporate bonds also struggled due to new U.S. sanctions, which drove up Russian borrowing costs and threatened to weigh on Russian economic growth.
Portfolio Information
ALLOCATION BY CREDIT QUALITY
| Moody’s Credit Rating* | Percent of Total Investments(a) | |
Aa | 3.4% | |
A | 19.2 | |
Baa | 30.0 | |
Ba | 18.1 | |
B | 13.0 | |
Caa | 0.7 | |
Not Rated | 15.6 |
TEN LARGEST COUNTRIES
| Country | Percent of Total Investments(a) | |
China | 9.1% | |
Brazil | 7.8 | |
Russia | 5.9 | |
Mexico | 5.6 | |
Hong Kong | 5.4 | |
United Arab Emirates | 5.4 | |
India | 5.2 | |
Colombia | 4.9 | |
Israel | 4.8 | |
South Korea | 4.5 |
| * | Credit quality ratings shown reflect the ratings assigned by Moody’s Investors Service (“Moody’s”), a widely used independent, nationally recognized statistical rating organization. Moody’s credit ratings are opinions of the credit quality of individual obligations or of an issuer’s general creditworthiness. Investment grade ratings are credit ratings of Baa or higher. Below investment grade ratings are credit ratings of Ba or lower. Unrated investments do not necessarily indicate low credit quality. Credit quality ratings are subject to change. |
| (a) | Excludes money market funds. |
F U N D S U M M A R Y | 11 |
Fund Summary as of October 31, 2018
| iShares® J.P. Morgan EM Local Currency Bond ETF |
Investment Objective
The iShares J.P. Morgan EM Local Currency Bond ETF (the “Fund”) seeks to track the investment results of an index composed of local currency denominated, emerging market sovereign bonds, as represented by the J.P. Morgan GBI-EM Global Diversified 15% Cap 4.5% Floor Index (the “Index”). The Fund invests in a representative sample of securities included in the Index that collectively has an investment profile similar to the Index. Due to the use of representative sampling, the Fund may or may not hold all of the securities that are included in the Index.
Performance
| Average Annual Total Returns | Cumulative Total Returns | |||||||||||||||||||||||||||
| 1 Year | 5 Years | Since Inception | 1 Year | 5 Years | Since Inception | |||||||||||||||||||||||
Fund NAV | (7.71 | )% | (2.34 | )% | (0.52 | )% | (7.71 | )% | (11.17 | )% | (3.58 | )% | ||||||||||||||||
Fund Market | (7.64 | ) | (2.23 | ) | (0.52 | ) | (7.64 | ) | (10.68 | ) | (3.60 | ) | ||||||||||||||||
Index(a) | (6.85 | ) | (1.69 | ) | 0.00 | (6.85 | ) | (8.19 | ) | 0.04 | ||||||||||||||||||
GROWTH OF $10,000 INVESTMENT
(SINCE INCEPTION AT NET ASSET VALUE)
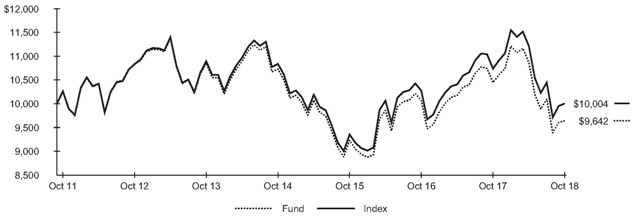
The inception date of the Fund was 10/18/11. The first day of secondary market trading was 10/20/11.
| (a) | Index performance through May 31, 2017 reflects the performance of the Bloomberg Barclays Emerging Markets Broad Local Currency Bond Index. Index performance beginning on June 1, 2017 reflects the performance of the J.P. Morgan GBI-EM Global Diversified 15% Cap 4.5% Floor Index. |
Past performance is no guarantee of future results. Performance results do not reflect the deduction of taxes that a shareholder would pay on fund distributions or on the redemption or sale of fund shares. See “About Fund Performance” on page 16 for more information.
Expense Example
| Actual | Hypothetical 5% Return | |||||||||||||||||||||||||
|
Beginning |
| | Ending Account Value (10/31/18) | | | Expenses Paid During the Period | (a) | | Beginning Account Value (05/01/18) | | | Ending Account Value (10/31/18) | | | Expenses Paid During the Period | (a) | | Annualized Expense Ratio | | ||||||
| $ 1,000.00 | $ 887.20 | $ 1.57 | $ 1,000.00 | $ 1,023.50 | $ 1.68 | 0.33 | % | |||||||||||||||||||
| (a) | Expenses are calculated using the Fund’s annualized expense ratio (as disclosed in the table), multiplied by the average account value for the period, multiplied by the number of days in the period (184 days) and divided by the number of days in the year (365 days). See “Shareholder Expenses” on page 16 for more information. |
| 12 | 2 0 1 8 I S H A R E S A N N U A L R E P O R T T O S H A R E H O L D E R S |
Fund Summary as of October 31, 2018 (continued)
| iShares® J.P. Morgan EM Local Currency Bond ETF |
Portfolio Management Commentary
As represented by the Index, emerging market bonds denominated in local currencies posted a negative return for the reporting period. Rising short-term U.S. interest rates reduced the appeal of foreign bonds relative to U.S. securities for income-oriented investors. Higher U.S. interest rates and a strong U.S. economy also meant that most emerging market currencies lost value relative to the U.S. dollar, which reduced the value of assets denominated in those currencies.
Bonds issued by Argentina, where a currency crisis affected markets during the reporting period, were the leading detractors from the Index’s performance. The combination of high fiscal deficits, a large trade deficit, and surging inflation caused the Argentine peso to lose more than half of its value relative to the U.S. dollar. This caused investors to be concerned about the ability of the government to service its debt and prompted the government to take out a loan from the International Monetary Fund. In an attempt to support the Argentine peso, interest rates were raised dramatically, endangering the country’s fragile economy.
Turkish bonds were also significant detractors, as rising inflation, the depreciation of the Turkish lira, and concerns about the government’s ability to control the economy led to an economic slowdown and a sharp increase in bond yields. While the Turkish government initially attempted to keep interest rates low, significant interest rate increases late in the reporting period alleviated some pressure on Turkish bonds.
Debt from Uruguay detracted from the Index’s return as the Uruguayan peso depreciated against the U.S. dollar. Indonesian bonds, which have a particularly high rate of foreign ownership, were negatively affected when some investors shifted capital out of Indonesia in search of higher yields.
Portfolio Information
ALLOCATION BY CREDIT QUALITY
| Moody’s Credit Rating* | Percent of Total Investments(a) | |
A | 25.5% | |
Baa | 21.7 | |
Ba | 20.7 | |
B | 5.2 | |
Not Rated | 26.9 |
TEN LARGEST COUNTRIES
| Country | Percent of Total Investments(a) | |
Brazil | 15.1% | |
Mexico | 8.0 | |
Argentina | 5.2 | |
Indonesia | 4.6 | |
Thailand | 4.6 | |
Malaysia | 4.6 | |
Poland | 4.5 | |
Czech Republic | 4.5 | |
Russia | 4.5 | |
Philippines | 4.5 |
| * | Credit quality ratings shown reflect the ratings assigned by Moody’s Investors Service (“Moody’s”), a widely used independent, nationally recognized statistical rating organization. Moody’s credit ratings are opinions of the credit quality of individual obligations or of an issuer’s general creditworthiness. Investment grade ratings are credit ratings of Baa or higher. Below investment grade ratings are credit ratings of Ba or lower. Unrated investments do not necessarily indicate low credit quality. Credit quality ratings are subject to change. |
| (a) | Excludes money market funds. |
F U N D S U M M A R Y | 13 |
Fund Summary as of October 31, 2018
| iShares® US & Intl High Yield Corp Bond ETF |
Investment Objective
The iShares US & Intl High Yield Corp Bond ETF (the “Fund”) seeks to track the investment results of an index composed of U.S. dollar, euro, British pound sterling and Canadian dollar-denominated, high yield corporate bonds, as represented by the Markit iBoxx® Global Developed Markets High Yield Index (the “Index”). The Fund invests in a representative sample of securities included in the Index that collectively has an investment profile similar to the Index. Due to the use of representative sampling, the Fund may or may not hold all of the securities that are included in the Index.
Performance
| Average Annual Total Returns | Cumulative Total Returns | |||||||||||||||||||||||||||
| 1 Year | 5 Years | Since Inception | 1 Year | 5 Years | Since Inception | |||||||||||||||||||||||
Fund NAV | (0.71 | )% | 2.73 | % | 4.49 | % | (0.71 | )% | 14.43 | % | 33.48 | % | ||||||||||||||||
Fund Market | (0.85 | ) | 2.66 | 4.50 | (0.85 | ) | 14.04 | 33.63 | ||||||||||||||||||||
Index | (0.57 | ) | 2.90 | 4.66 | (0.57 | ) | 15.34 | 34.92 | ||||||||||||||||||||
GROWTH OF $10,000 INVESTMENT
(SINCE INCEPTION AT NET ASSET VALUE)
The inception date of the Fund was 4/3/12. The first day of secondary market trading was 4/5/12.
Past performance is no guarantee of future results. Performance results do not reflect the deduction of taxes that a shareholder would pay on fund distributions or on the redemption or sale of fund shares. See “About Fund Performance” on page 16 for more information.
Expense Example
| Actual | Hypothetical 5% Return | |||||||||||||||||||||||||
|
Beginning |
| | Ending Account Value (10/31/18) | | | Expenses Paid During the Period | (a) | | Beginning Account Value (05/01/18) | | | Ending Account Value (10/31/18) | | | Expenses Paid During the Period | (a) | | Annualized Expense Ratio | | ||||||
| $ 1,000.00 | $ 989.10 | $ 2.01 | $ 1,000.00 | $ 1,023.20 | $ 2.04 | 0.40 | % | |||||||||||||||||||
| (a) | Expenses are calculated using the Fund’s annualized expense ratio (as disclosed in the table), multiplied by the average account value for the period, multiplied by the number of days in the period (184 days) and divided by the number of days in the year (365 days). See “Shareholder Expenses” on page 16 for more information. |
| 14 | 2 0 1 8 I S H A R E S A N N U A L R E P O R T T O S H A R E H O L D E R S |
Fund Summary as of October 31, 2018 (continued)
| iShares® US & Intl High Yield Corp Bond ETF |
Portfolio Management Commentary
The Index declined modestly during the reporting period, reflecting an increase in interest rates across developed markets. From a country perspective, euro-denominated bonds detracted the most from the Index’s performance. Interest rates rose in Italy, France, and Germany even as economic growth slowed. In addition, a weaker euro weighed on their performance in U.S. dollar terms. Bonds issued by U.S. companies, which made up approximately 65% of the Index on average, managed small gains and were the leading contributors. U.S. high-yield corporate bonds benefited from tax cuts, strong economic growth, and limited bond supply.
From a sector perspective, industrial bonds detracted the most from the Index’s return, led by consumer cyclicals companies. The leading detractors in the industry were automotive bonds. Concerns about a global slowdown in auto sales as a result of trade tensions between the U.S. and China weighed on auto manufacturers and parts providers. Bonds in the financial sector were another source of weakness. Banking industry bond prices declined despite relatively stable credit quality and solid earnings, as banks contended with competition over deposits, trade disputes, and rising tariffs.
At the other end of the spectrum, consumer non cyclicals bonds contributed the most to the Index’s performance. Pharmaceutical and healthcare bonds were helped by a wave of new drug approvals in the U.S., as well as rising procedure and patient treatment volumes.
Looking at performance by credit rating, the higher-rated portion of the Index declined slightly, while the lowest-rated segments of the Index rose. This reflects the favorable credit environment and investor demand for the highest-yielding securities. Consequently in the U.S., the spread, or difference in yield, between Treasury bonds and the lowest-rated segment of the market declined by 75 basis points during the reporting period. When yield spreads narrow, lower-rated bonds outperform.
Portfolio Information
ALLOCATION BY CREDIT QUALITY
| Moody’s Credit Rating* | Percent of Total Investments(a) | |
Baa | 0.8% | |
Ba | 45.5 | |
B | 37.1 | |
Caa | 11.5 | |
Ca | 0.6 | |
C | 0.1 | |
Not Rated | 4.4 |
TEN LARGEST COUNTRIES
| Country | Percent of Total Investments(a) | |
United States | 66.8% | |
Italy | 5.0 | |
United Kingdom | 3.9 | |
France | 3.8 | |
Canada | 3.3 | |
Germany | 3.3 | |
Luxembourg | 3.0 | |
Netherlands | 2.4 | |
Ireland | 1.8 | |
Spain | 1.2 |
| * | Credit quality ratings shown reflect the ratings assigned by Moody’s Investors Service (“Moody’s”), a widely used independent, nationally recognized statistical rating organization. Moody’s credit ratings are opinions of the credit quality of individual obligations or of an issuer’s general creditworthiness. Investment grade ratings are credit ratings of Baa or higher. Below investment grade ratings are credit ratings of Ba or lower. Unrated investments do not necessarily indicate low credit quality. Credit quality ratings are subject to change. |
| (a) | Excludes money market funds. |
F U N D S U M M A R Y | 15 |
Past performance is no guarantee of future results. Current performance may be lower or higher than the performance data quoted. Performance data current to the most recent month-end is available at www.ishares.com. Performance results assume reinvestment of all dividends and capital gain distributions and do not reflect the deduction of taxes that a shareholder would pay on fund distributions or on the redemption or sale of fund shares. The investment return and principal value of shares will vary with changes in market conditions. Shares may be worth more or less than their original cost when they are redeemed or sold in the market. Performance for certain funds may reflect a waiver of a portion of investment advisory fees. Without such a waiver, performance would have been lower.
Net asset value or “NAV” is the value of one share of a fund as calculated in accordance with the standard formula for valuing mutual fund shares. The price used to calculate market return (“Market Price”) is determined by using the midpoint between the highest bid and the lowest ask on the primary stock exchange on which shares of a fund are listed for trading, as of the time that such fund’s NAV is calculated. Since shares of a fund may not trade in the secondary market until after the fund’s inception, for the period from inception to the first day of secondary market trading in shares of the fund, the NAV of the fund is used as a proxy for the Market Price to calculate market returns. Market and NAV returns assume that dividends and capital gain distributions have been reinvested at Market Price and NAV, respectively.
An index is a statistical composite that tracks a specified financial market or sector. Unlike a fund, an index does not actually hold a portfolio of securities and therefore does not incur the expenses incurred by a fund. These expenses negatively impact fund performance. Also, market returns do not include brokerage commissions that may be payable on secondary market transactions. If brokerage commissions were included, market returns would be lower.
As a shareholder of your Fund, you incur two types of costs: (1) transaction costs, including brokerage commissions on purchases and sales of fund shares and (2) ongoing costs, including management fees and other fund expenses. The expense example, which is based on an investment of $1,000 invested at the beginning of the period (or from the commencement of operations if less than 6 months) and held through the end of the period, is intended to help you understand your ongoing costs (in dollars and cents) of investing in your Fund and to compare these costs with the ongoing costs of investing in other funds.
Actual Expenses – The table provides information about actual account values and actual expenses. Annualized expense ratios reflect contractual and voluntary fee waivers, if any. To estimate the expenses that you paid on your account over the period, simply divide your account value by $1,000 (for example, an $8,600 account value divided by $1,000 = 8.6), then multiply the result by the number under the heading entitled “Expenses Paid During the Period.”
Hypothetical Example for Comparison Purposes – The table also provides information about hypothetical account values and hypothetical expenses based on your Fund’s actual expense ratio and an assumed rate of return of 5% per year before expenses. You may use this information to compare the ongoing costs of investing in your Fund and other funds. To do so, compare this 5% hypothetical example with the 5% hypothetical examples that appear in the shareholder reports of the other funds.
Please note that the expenses shown in the table are meant to highlight your ongoing costs only and do not reflect any transactional costs, such as brokerage commissions paid on purchases and sales of fund shares. Therefore, the hypothetical examples are useful in comparing ongoing costs only and will not help you determine the relative total costs of owning different funds. In addition, if these transactional costs were included, your costs would have been higher.
| 16 | 2 0 1 8 I S H A R E S A N N U A L R E P O R T T O S H A R E H O L D E R S |
October 31, 2018 | iShares® Emerging Markets High Yield Bond ETF
(Percentages shown are based on Net Assets) |
| Security | Par (000) | Value | ||||||
Corporate Bonds & Notes(a) | ||||||||
Argentina — 1.2% | ||||||||
Pampa Energia SA | ||||||||
7.38%, 07/21/23 (Call 07/21/20)(b) | $ | 300 | $ | 276,375 | ||||
7.50%, 01/24/27 (Call 01/24/22)(b) | 650 | 562,250 | ||||||
YPF SA | ||||||||
6.95%, 07/21/27(b) | 800 | 678,000 | ||||||
7.00%, 12/15/47 (Call 06/15/47)(b) | 700 | 529,410 | ||||||
8.50%, 03/23/21(b) | 900 | 905,625 | ||||||
8.50%, 07/28/25(b) | 1,185 | 1,125,246 | ||||||
8.75%, 04/04/24(b) | 616 | 605,990 | ||||||
|
| |||||||
| 4,682,896 | ||||||||
Azerbaijan — 0.4% | ||||||||
Southern Gas Corridor CJSC, 6.88%, 03/24/26(b) | 1,386 | 1,480,595 | ||||||
|
| |||||||
Bahrain — 0.2% | ||||||||
Oil and Gas Holding Co. BSCC (The), 7.50%, 10/25/27(b) | 800 | 776,000 | ||||||
|
| |||||||
Brazil — 15.1% | ||||||||
Banco Bradesco SA/Cayman Islands | ||||||||
5.75%, 03/01/22(b) | 600 | 614,100 | ||||||
5.90%, 01/16/21(b) | 1,190 | 1,206,898 | ||||||
Banco BTG Pactual SA/Cayman Islands | ||||||||
4.00%, 01/16/20(b) | 608 | 598,880 | ||||||
5.50%, 01/31/23(b) | 400 | 385,500 | ||||||
Banco do Brasil SA/Cayman, 4.88%, 04/19/23(b) | 400 | 390,000 | ||||||
Banco do Brasil SA/Cayman Islands | ||||||||
3.88%, 10/10/22 | 1,400 | 1,329,370 | ||||||
4.63%, 01/15/25(b) | 800 | 752,960 | ||||||
5.38%, 01/15/21(b) | 568 | 573,680 | ||||||
5.88%, 01/26/22(b) | 900 | 910,845 | ||||||
5.88%, 01/19/23(b) | 600 | 609,360 | ||||||
6.00%, 01/22/20(b) | 400 | 408,500 | ||||||
Banco Votorantim SA, 7.38%, 01/21/20(b) | 492 | 505,235 | ||||||
Braskem Finance Ltd. | ||||||||
5.38%, 05/02/22(b) | 200 | 202,750 | ||||||
5.75%, 04/15/21(b) | 800 | 819,000 | ||||||
6.45%, 02/03/24 | 600 | 628,800 | ||||||
BRF SA | ||||||||
3.95%, 05/22/23(b) | 400 | 361,000 | ||||||
4.75%, 05/22/24(b) | 600 | 547,500 | ||||||
Caixa Economica Federal | ||||||||
3.50%, 11/07/22(b) | 450 | 429,750 | ||||||
7.25%, 07/23/24 (Call 07/23/19)(b)(c)(d) | 400 | 402,000 | ||||||
Cemig Geracao e Transmissao SA, 9.25%, 12/05/24 (Call 12/05/23)(b) | 800 | 851,800 | ||||||
Centrais Eletricas Brasileiras SA, 5.75%, 10/27/21(b) | 1,200 | 1,204,800 | ||||||
CSN Resources SA, 6.50%, 07/21/20(b) | 892 | 866,453 | ||||||
Embraer Netherlands Finance BV, 5.05%, 06/15/25 | 400 | 411,000 | ||||||
Embraer Overseas Ltd., 5.70%, 09/16/23(b) | 550 | 576,125 | ||||||
Fibria Overseas Finance Ltd., 5.25%, 05/12/24 | 500 | 507,500 | ||||||
Gerdau Trade Inc., 4.75%, 04/15/23(b) | 600 | 599,250 | ||||||
Gol Finance Inc., 7.00%, 01/31/25 (Call 01/31/22)(b) | 500 | 433,163 | ||||||
GTL Trade Finance Inc./Gerdau Holdings Inc., 5.89%, 04/29/24 (Call 01/29/24)(b) | 1,000 | 1,018,750 | ||||||
Itau Unibanco Holding SA/Cayman Islands | ||||||||
5.13%, 05/13/23(b) | 820 | 820,205 | ||||||
5.50%, 08/06/22(b) | 960 | 973,920 | ||||||
5.65%, 03/19/22(b) | 1,200 | 1,221,000 | ||||||
5.75%, 01/22/21(b) | 1,133 | 1,157,076 | ||||||
6.20%, 04/15/20(b) | 700 | 718,550 | ||||||
| Security | Par (000) | Value | ||||||
Brazil (continued) | ||||||||
6.20%, 12/21/21(b) | $ | 800 | $ | 826,000 | ||||
JBS Investments GmbH, 7.25%, 04/03/24 (Call 04/03/19)(b) | 600 | 605,325 | ||||||
JBS USA LUX SA/JBS USA Finance Inc. | ||||||||
5.75%, 06/15/25 (Call 06/15/20)(b) | 650 | 622,547 | ||||||
5.88%, 07/15/24 (Call 07/15/19)(b) | 525 | 515,287 | ||||||
6.75%, 02/15/28 (Call 02/15/23)(b) | 700 | 674,625 | ||||||
7.25%, 06/01/21 (Call 06/01/19)(b) | 1,000 | 1,012,335 | ||||||
Klabin Finance SA | ||||||||
4.88%, 09/19/27(b) | 200 | 180,190 | ||||||
5.25%, 07/16/24(b) | 700 | 683,515 | ||||||
MARB BondCo PLC | ||||||||
6.88%, 01/19/25 (Call 01/19/21)(b) | 600 | 563,070 | ||||||
7.00%, 03/15/24 (Call 03/15/20)(b) | 600 | 572,160 | ||||||
Marfrig Holdings Europe BV, 8.00%, 06/08/23 (Call 06/08/19)(b) | 800 | 809,400 | ||||||
Minerva Luxembourg SA, 6.50%, 09/20/26 (Call 09/20/21)(b) | 1,173 | 1,077,870 | ||||||
Odebrecht Finance Ltd. | ||||||||
4.38%, 04/25/25(b) | 500 | 77,500 | ||||||
5.25%, 06/27/29(b) | 400 | 66,000 | ||||||
7.13%, 06/26/42 (Call 12/26/41)(b) | 620 | 97,650 | ||||||
Petrobras Global Finance BV | ||||||||
4.38%, 05/20/23 | 2,806 | 2,719,014 | ||||||
5.30%, 01/27/25 | 2,700 | 2,567,700 | ||||||
5.38%, 01/27/21 | 694 | 707,880 | ||||||
5.63%, 05/20/43 | 600 | 496,500 | ||||||
5.75%, 02/01/29 | 1,742 | 1,611,350 | ||||||
6.00%, 01/27/28 | 4,368 | 4,135,404 | ||||||
6.13%, 01/17/22 | 909 | 941,769 | ||||||
6.25%, 03/17/24 | 1,961 | 1,981,100 | ||||||
6.75%, 01/27/41 | 500 | 469,950 | ||||||
6.85%, 06/05/15 | 1,783 | 1,577,955 | ||||||
6.88%, 01/20/40 | 1,103 | 1,042,170 | ||||||
7.25%, 03/17/44 | 1,286 | 1,240,990 | ||||||
7.38%, 01/17/27 | 2,801 | 2,885,310 | ||||||
8.38%, 05/23/21 | 999 | 1,089,160 | ||||||
8.75%, 05/23/26 | 2,279 | 2,529,348 | ||||||
Rio Oil Finance Trust, Series 2014-1, 9.25%, 07/06/24(b) | 1,138 | 1,214,926 | ||||||
Rumo Luxembourg Sarl | ||||||||
5.88%, 01/18/25 (Call 01/18/22)(b) | 800 | 759,000 | ||||||
7.38%, 02/09/24 (Call 02/09/21)(b) | 200 | 206,750 | ||||||
Votorantim Cimentos SA, 7.25%, | 650 | 666,900 | ||||||
|
| |||||||
| 60,262,370 | ||||||||
Chile — 0.3% | ||||||||
VTR Finance BV, 6.88%, 01/15/24 (Call 01/15/19)(b) | 1,000 | 1,010,000 | ||||||
|
| |||||||
China — 4.8% | ||||||||
Agile Group Holdings Ltd. | ||||||||
8.50%, 07/18/21 (Call 07/18/20)(b) | 600 | 584,919 | ||||||
9.00%, 05/21/20 (Call 05/21/19)(b) | 400 | 411,170 | ||||||
CFLD Cayman Investment Ltd., 6.50%, 12/21/20(b) | 600 | 540,000 | ||||||
China Evergrande Group | ||||||||
6.25%, 06/28/21(b) | 814 | 724,220 | ||||||
7.50%, 06/28/23 (Call 06/28/20)(b) | 800 | 642,684 | ||||||
8.25%, 03/23/22 (Call 03/23/20)(b) | 600 | 529,500 | ||||||
8.75%, 06/28/25 (Call 06/28/21)(b) | 3,666 | 2,873,227 | ||||||
9.50%, 03/29/24 (Call 03/29/21)(b) | 700 | 574,000 | ||||||
China SCE Group Holdings Ltd. | ||||||||
5.88%, 03/10/22 (Call 03/10/20)(b) | 600 | 513,732 | ||||||
7.45%, 04/17/21 (Call 04/17/20)(b) | 400 | 372,586 | ||||||
S C H E D U L E O F I N V E S T M E N T S | 17 |
Schedule of Investments (continued)
October 31, 2018 | iShares® Emerging Markets High Yield Bond ETF
(Percentages shown are based on Net Assets) |
| Security | Par (000) | Value | ||||||
China (continued) | ||||||||
CIFI Holdings Group Co. Ltd. | ||||||||
5.50%, 01/23/22 (Call 01/23/20)(b) | $ | 600 | $ | 520,656 | ||||
6.88%, 04/23/21 (Call 04/23/20)(b) | 200 | 186,000 | ||||||
Country Garden Holdings Co. Ltd. | ||||||||
4.75%, 07/25/22 (Call 07/25/20)(b) | 400 | 343,500 | ||||||
4.75%, 09/28/23 (Call 09/28/20)(b) | 500 | 408,238 | ||||||
7.25%, 04/04/21 (Call 10/04/19)(b) | 700 | 682,850 | ||||||
7.50%, 03/09/20 (Call 03/09/19)(b) | 600 | 596,250 | ||||||
Easy Tactic Ltd. | ||||||||
5.75%, 01/13/22 (Call 01/13/20)(b) | 600 | 522,750 | ||||||
5.88%, 02/13/23 (Call 11/17/20)(b) | 200 | 167,425 | ||||||
7.00%, 04/25/21 (Call 04/25/20)(b) | 800 | 748,000 | ||||||
Fantasia Holdings Group Co. Ltd. | ||||||||
7.38%, 10/04/21 (Call 10/04/19)(b) | 400 | 275,866 | ||||||
8.38%, 03/08/21(b) | 400 | 296,000 | ||||||
Fortune Star BVI Ltd. | ||||||||
5.25%, 03/23/22 (Call 03/23/20)(b) | 1,200 | 1,079,166 | ||||||
5.38%, 12/05/20(b) | 200 | 194,234 | ||||||
Greenland Global Investment Ltd., 5.88%, 07/03/24(b) | 400 | 325,164 | ||||||
KWG Group Holdings Ltd., 6.00%, 09/15/22 (Call 03/15/20)(b) | 486 | 414,315 | ||||||
New Metro Global Ltd., 6.50%, 04/23/21 (Call 04/23/20)(b) | 400 | 376,058 | ||||||
Powerlong Real Estate Holdings Ltd., 5.95%, 07/19/20(b) | 400 | 368,000 | ||||||
Ronshine China Holdings Ltd., 8.25%, 02/01/21(b) | 600 | 552,738 | ||||||
Shimao Property Holdings Ltd. | ||||||||
4.75%, 07/03/22 (Call 07/03/20)(b) | 800 | 705,000 | ||||||
8.38%, 02/10/22 (Call 02/10/19)(b) | 956 | 967,950 | ||||||
Sunac China Holdings Ltd. | ||||||||
7.35%, 07/19/21 (Call 07/19/20)(b) | 600 | 544,500 | ||||||
7.95%, 08/08/22 (Call 08/08/20)(b) | 200 | 177,994 | ||||||
Times China Holdings Ltd., 6.25%, 01/17/21 (Call 01/31/20)(b) | 600 | 548,841 | ||||||
Yuzhou Properties Co. Ltd., 7.90%, 05/11/21 (Call 05/11/20)(b) | 600 | 570,723 | ||||||
|
| |||||||
| 19,338,256 | ||||||||
Colombia — 1.3% | ||||||||
Banco de Bogota SA | ||||||||
4.38%, 08/03/27(b) | 600 | 559,500 | ||||||
5.38%, 02/19/23(b) | 400 | 400,000 | ||||||
6.25%, 05/12/26(b) | 600 | 613,125 | ||||||
Bancolombia SA | ||||||||
4.88%, 10/18/27 (Call 10/18/22)(c)(d) | 400 | 383,660 | ||||||
5.13%, 09/11/22 | 963 | 969,018 | ||||||
Colombia Telecomunicaciones SA ESP, 5.38%, 09/27/22 (Call 09/27/19)(b) | 545 | 542,684 | ||||||
Grupo Aval Ltd., 4.75%, 09/26/22(b) | 800 | 787,000 | ||||||
Millicom International Cellular SA, 6.00%, 03/15/25 (Call 03/15/20)(b) | 900 | 884,250 | ||||||
|
| |||||||
| 5,139,237 | ||||||||
Costa Rica — 0.1% | ||||||||
Banco Nacional de Costa Rica, 5.88%, 04/25/21(b) | 435 | 416,513 | ||||||
|
| |||||||
Ghana — 0.1% | ||||||||
Tullow Oil PLC, 7.00%, 03/01/25 (Call 03/01/21)(b) | 600 | 585,750 | ||||||
|
| |||||||
India — 1.2% | ||||||||
ABJA Investment Co. Pte Ltd. | ||||||||
4.85%, 01/31/20(b) | 200 | 198,887 | ||||||
5.45%, 01/24/28(b) | 1,000 | 858,750 | ||||||
5.95%, 07/31/24(b) | 625 | 617,725 | ||||||
Greenko Dutch BV, 5.25%, 07/24/24 (Call 07/24/20)(b) | 400 | 360,534 | ||||||
JSW Steel Ltd., 5.25%, 04/13/22(b) | 600 | 581,250 | ||||||
| Security | Par (000) | Value | ||||||
India (continued) | ||||||||
Vedanta Resources PLC | ||||||||
6.13%, 08/09/24 (Call 08/09/21)(b) | $ | 400 | $ | 352,960 | ||||
6.38%, 07/30/22(b) | 600 | 560,488 | ||||||
7.13%, 05/31/23(b) | 500 | 468,955 | ||||||
8.25%, 06/07/21(b) | 700 | 709,202 | ||||||
|
| |||||||
| 4,708,751 | ||||||||
Indonesia — 0.1% | ||||||||
Pelabuhan Indonesia III Persero PT, 4.88%, 10/01/24(b) | 400 | 390,480 | ||||||
|
| |||||||
Israel — 2.4% | ||||||||
Teva Pharmaceutical Finance Co. BV, 2.95%, 12/18/22 | 350 | 317,007 | ||||||
Teva Pharmaceutical Finance Netherlands III BV | ||||||||
2.20%, 07/21/21 | 2,351 | 2,192,307 | ||||||
2.80%, 07/21/23 | 2,275 | 1,997,143 | ||||||
3.15%, 10/01/26 | 2,600 | 2,109,250 | ||||||
4.10%, 10/01/46 | 1,300 | 885,775 | ||||||
6.00%, 04/15/24 (Call 01/15/24) | 1,200 | 1,189,830 | ||||||
6.75%, 03/01/28 (Call 12/01/27) | 1,000 | 1,016,485 | ||||||
|
| |||||||
| 9,707,797 | ||||||||
Jamaica — 0.7% | ||||||||
Digicel Group Ltd. | ||||||||
7.13%, 04/01/22 (Call 04/01/19)(b) | 650 | 404,625 | ||||||
8.25%, 09/30/20 (Call 12/13/18)(b) | 1,500 | 1,068,750 | ||||||
Digicel Ltd. | ||||||||
6.00%, 04/15/21 (Call 04/15/19)(b) | 850 | 771,375 | ||||||
6.75%, 03/01/23 (Call 03/01/19)(b) | 800 | 642,000 | ||||||
|
| |||||||
| 2,886,750 | ||||||||
Kazakhstan — 1.2% | ||||||||
Development Bank of Kazakhstan JSC, 4.13%, 12/10/22(b) | 1,050 | 1,030,575 | ||||||
Halyk Savings Bank of Kazakhstan JSC, 7.25%, 01/28/21(b) | 600 | 631,950 | ||||||
Kazakhstan Temir Zholy Finance BV, 6.95%, 07/10/42(b) | 800 | 866,000 | ||||||
KazMunayGas National Co. JSC | ||||||||
3.88%, 04/19/22(b) | 400 | 396,000 | ||||||
4.75%, 04/19/27(b) | 600 | 586,500 | ||||||
5.75%, 04/19/47(b) | 977 | 930,593 | ||||||
Nostrum Oil & Gas Finance BV, 8.00%, 07/25/22 (Call 07/25/19)(b) | 600 | 510,750 | ||||||
|
| |||||||
| 4,952,368 | ||||||||
Mexico — 1.4% | ||||||||
Axtel SAB de CV, 6.38%, 11/14/24 (Call 11/14/20)(b) | 200 | 191,000 | ||||||
Banco Mercantil del Norte SA/Grand Cayman, 5.75%, 10/04/31 | 400 | 364,000 | ||||||
Banco Nacional de Comercio Exterior SNC, 3.80%, 08/11/26 (Call 08/11/21)(b)(c)(d) | 700 | 670,250 | ||||||
BBVA Bancomer SA/Texas | ||||||||
5.13%, 01/18/33 (Call 01/18/28)(b)(c)(d) | 800 | 704,000 | ||||||
7.25%, 04/22/20(b) | 800 | 821,800 | ||||||
Cemex Finance LLC, 6.00%, 04/01/24 (Call 04/01/19)(b) | 850 | 846,281 | ||||||
Cemex SAB de CV | ||||||||
5.70%, 01/11/25 (Call 01/11/20)(b) | 700 | 681,853 | ||||||
6.13%, 05/05/25 (Call 05/05/20)(b) | 400 | 397,380 | ||||||
7.75%, 04/16/26 (Call 04/16/21)(b) | 800 | 840,000 | ||||||
|
| |||||||
| 5,516,564 | ||||||||
Oman — 0.3% | ||||||||
Bank Muscat SAOG, 3.75%, 05/03/21(b) | 400 | 387,000 | ||||||
Lamar Funding Ltd., 3.96%, 05/07/25(b) | 800 | 700,000 | ||||||
|
| |||||||
| 1,087,000 | ||||||||
| 18 | 2 0 1 8 I S H A R E S A N N U A L R E P O R T T O S H A R E H O L D E R S |
Schedule of Investments (continued)
October 31, 2018 | iShares® Emerging Markets High Yield Bond ETF
(Percentages shown are based on Net Assets) |
| Security | Par (000) | Value | ||||||
Panama — 0.2% | ||||||||
Sable International Finance Ltd., 6.88%, 08/01/22 (Call 08/01/19)(b) | $ | 650 | $ | 677,625 | ||||
|
| |||||||
Russia — 2.9% | ||||||||
Alfa Bank AO Via Alfa Bond Issuance PLC, 7.75%, 04/28/21(b) | 750 | 788,437 | ||||||
Credit Bank of Moscow Via CBOM Finance PLC | ||||||||
5.55%, 02/14/23(b) | 600 | 553,500 | ||||||
7.50%, 10/05/27 (Call 10/05/22)(b)(c)(d) | 400 | 301,500 | ||||||
Evraz Group SA | ||||||||
5.38%, 03/20/23(b) | 600 | 588,000 | ||||||
6.50%, 04/22/20(b) | 336 | 340,620 | ||||||
6.75%, 01/31/22(b) | 400 | 410,000 | ||||||
8.25%, 01/28/21(b) | 750 | 791,250 | ||||||
Gazprombank OAO Via GPB Eurobond Finance PLC, 7.50%, 12/28/23 (Call 12/28/18)(b)(c)(d) | 600 | 587,250 | ||||||
GTLK Europe DAC, 5.13%, 05/31/24(b) | 600 | 543,750 | ||||||
Metalloinvest Finance DAC, 4.85%, 05/02/24(b) | 600 | 565,500 | ||||||
Polyus Finance PLC, 5.25%, 02/07/23(b) | 600 | 576,750 | ||||||
Polyus Gold International Ltd., 5.63%, 04/29/20(b) | 600 | 602,400 | ||||||
Sberbank of Russia Via SB Capital SA, 5.13%, 10/29/22(b) | 1,600 | 1,572,000 | ||||||
VEON Holdings BV | ||||||||
3.95%, 06/16/21 (Call 03/16/21)(b) | 400 | 387,000 | ||||||
4.95%, 06/16/24 (Call 03/16/24)(b) | 600 | 566,250 | ||||||
5.95%, 02/13/23(b) | 600 | 601,500 | ||||||
7.50%, 03/01/22(b) | 600 | 637,500 | ||||||
VTB Bank OJSC Via VTB Capital SA, 6.95%, 10/17/22(b) | 1,200 | 1,170,000 | ||||||
|
| |||||||
| 11,583,207 | ||||||||
South Africa — 1.9% | ||||||||
AngloGold Ashanti Holdings PLC | ||||||||
5.13%, 08/01/22 | 645 | 647,419 | ||||||
5.38%, 04/15/20 | 309 | 313,017 | ||||||
Eskom Holdings SOC Ltd. | ||||||||
5.75%, 01/26/21(b) | 1,200 | 1,150,800 | ||||||
6.35%, 08/10/28(b) | 1,000 | 963,750 | ||||||
6.75%, 08/06/23(b) | 617 | 577,697 | ||||||
7.13%, 02/11/25(b) | 860 | 804,100 | ||||||
8.45%, 08/10/28(b) | 400 | 386,400 | ||||||
FirstRand Bank Ltd., 6.25%, 04/23/28 (Call 04/23/23)(b)(c)(d) | 600 | 581,250 | ||||||
Gold Fields Orogen Holding BVI Ltd., 4.88%, 10/07/20(b) | 800 | 799,000 | ||||||
MTN Mauritius Investment Ltd., 4.76%, 11/11/24(b) | 600 | 538,500 | ||||||
Transnet SOC Ltd., 4.00%, 07/26/22(b) | 671 | 627,720 | ||||||
|
| |||||||
| 7,389,653 | ||||||||
South Korea — 0.1% | ||||||||
Woori Bank, 5.00%, 06/10/45 (Call 06/10/20)(b)(c)(d) | 400 | 397,420 | ||||||
|
| |||||||
Trinidad And Tobago — 0.1% | ||||||||
Consolidated Energy Finance SA, 6.88%, 06/15/25 (Call 06/15/20)(b) | 450 | 458,452 | ||||||
|
| |||||||
Turkey — 4.0% | ||||||||
Akbank T.A.S., 4.00%, 01/24/20(b) | 200 | 193,000 | ||||||
Akbank Turk AS | ||||||||
5.00%, 10/24/22(b) | 450 | 411,188 | ||||||
5.13%, 03/31/25(b) | 200 | 171,250 | ||||||
7.20%, 03/16/27 (Call 03/16/22)(b)(c)(d) | 500 | 419,375 | ||||||
KOC Holding AS, 5.25%, 03/15/23 (Call 12/15/22)(b) | 1,000 | 941,250 | ||||||
QNB Finansbank AS, 4.88%, 05/19/22(b) | 688 | 635,712 | ||||||
TC Ziraat Bankasi AS | ||||||||
4.75%, 04/29/21(b) | 200 | 182,750 | ||||||
5.13%, 05/03/22(b) | 1,170 | 1,039,837 | ||||||
| Security | Par (000) | Value | ||||||
Turkey (continued) | ||||||||
Turk Telekomunikasyon AS, 4.88%, 06/19/24(b) | $ | 600 | $ | 517,500 | ||||
Turkcell Iletisim Hizmetleri AS | ||||||||
5.75%, 10/15/25(b) | 200 | 181,000 | ||||||
5.80%, 04/11/28 (Call 01/11/28)(b) | 400 | 343,500 | ||||||
Turkiye Garanti Bankasi AS | ||||||||
5.25%, 09/13/22(b) | 800 | 737,000 | ||||||
5.88%, 03/16/23(b) | 400 | 370,000 | ||||||
6.13%, 05/24/27 (Call 05/24/22)(b)(c)(d) | 600 | 498,000 | ||||||
6.25%, 04/20/21(b) | 200 | 196,500 | ||||||
Turkiye Halk Bankasi AS | ||||||||
3.88%, 02/05/20(b) | 800 | 719,000 | ||||||
4.75%, 02/11/21(b) | 500 | 421,875 | ||||||
5.00%, 07/13/21(b) | 300 | 253,125 | ||||||
Turkiye Is Bankasi AS | ||||||||
5.00%, 04/30/20(b) | 600 | 567,750 | ||||||
5.00%, 06/25/21(b) | 724 | 638,930 | ||||||
5.38%, 10/06/21(b) | 700 | 616,875 | ||||||
6.00%, 10/24/22(b) | 850 | 701,250 | ||||||
6.13%, 04/25/24(b) | 1,100 | 910,250 | ||||||
7.00%, 06/29/28 (Call 06/29/23)(b)(c)(d) | 200 | 146,000 | ||||||
Turkiye Vakiflar Bankasi TAO | ||||||||
5.50%, 10/27/21(b) | 800 | 718,000 | ||||||
5.75%, 01/30/23(b) | 800 | 694,000 | ||||||
6.00%, 11/01/22(b) | 200 | 164,500 | ||||||
6.88%, 02/03/25 (Call 02/03/20)(b)(c)(d) | 200 | 164,000 | ||||||
Yapi ve Kredi Bankasi AS | ||||||||
4.00%, 01/22/20(b) | 297 | 281,779 | ||||||
5.50%, 12/06/22(b) | 600 | 486,000 | ||||||
5.75%, 02/24/22(b) | 550 | 496,375 | ||||||
5.85%, 06/21/24(b) | 600 | 509,250 | ||||||
6.10%, 03/16/23(b) | 200 | 175,000 | ||||||
8.50%, 03/09/26 (Call 03/09/21)(b)(c)(d) | 400 | 348,000 | ||||||
|
| |||||||
| 15,849,821 | ||||||||
Ukraine — 0.4% | ||||||||
Metinvest BV | ||||||||
7.75%, 04/23/23 (Call 01/23/23)(b) | 800 | 768,000 | ||||||
8.50%, 04/23/26 (Call 01/23/26)(b) | 400 | 379,500 | ||||||
MHP SE, 7.75%, 05/10/24(b) | 400 | 393,500 | ||||||
|
| |||||||
| 1,541,000 | ||||||||
United Arab Emirates — 0.3% | ||||||||
DAE Funding LLC | ||||||||
4.50%, 08/01/22 (Call 08/01/19)(b) | 600 | 588,750 | ||||||
5.00%, 08/01/24 (Call 08/01/20)(b) | 700 | 678,125 | ||||||
|
| |||||||
| 1,266,875 | ||||||||
|
| |||||||
Total Corporate Bonds & Notes — 40.7% |
| 162,105,380 | ||||||
|
| |||||||
| Foreign Government Obligations(a) |
| |||||||
Argentina — 6.9% | ||||||||
Argentine Republic Government International Bond | ||||||||
2.50%, 12/31/38(e) | 4,460 | 2,497,767 | ||||||
4.63%, 01/11/23 | 1,300 | 1,096,550 | ||||||
5.63%, 01/26/22 | 2,128 | 1,915,200 | ||||||
5.88%, 01/11/28 | 2,800 | 2,174,200 | ||||||
6.63%, 07/06/28 | 930 | 741,675 | ||||||
6.88%, 04/22/21 | 3,475 | 3,327,312 | ||||||
6.88%, 01/26/27 | 3,124 | 2,608,540 | ||||||
6.88%, 01/11/48 | 1,750 | 1,290,625 | ||||||
S C H E D U L E O F I N V E S T M E N T S | 19 |
Schedule of Investments (continued)
October 31, 2018 | iShares® Emerging Markets High Yield Bond ETF
(Percentages shown are based on Net Assets) |
| Security | Par (000) | Value | ||||||
Argentina (continued) | ||||||||
7.13%, 07/06/36 | $ | 1,370 | $ | 1,051,475 | ||||
7.13%, 06/28/17 | 1,731 | 1,289,595 | ||||||
7.50%, 04/22/26 | 5,005 | 4,373,119 | ||||||
7.63%, 04/22/46 | 2,281 | 1,796,288 | ||||||
8.28%, 12/31/33 | 3,803 | 3,266,714 | ||||||
|
| |||||||
| 27,429,060 | ||||||||
Azerbaijan — 0.3% | ||||||||
State Oil Co. of the Azerbaijan Republic | ||||||||
4.75%, 03/13/23(b) | 550 | 543,125 | ||||||
6.95%, 03/18/30(b) | 600 | 635,250 | ||||||
|
| |||||||
| 1,178,375 | ||||||||
Bahrain — 2.0% | ||||||||
Bahrain Government International Bond | ||||||||
5.50%, 03/31/20(b) | 883 | 878,585 | ||||||
5.88%, 01/26/21(b) | 950 | 945,250 | ||||||
6.00%, 09/19/44(b) | 1,000 | 807,500 | ||||||
6.13%, 07/05/22(b) | 800 | 806,000 | ||||||
6.13%, 08/01/23(b) | 1,400 | 1,414,000 | ||||||
6.75%, 09/20/29(b) | 1,000 | 955,000 | ||||||
7.00%, 01/26/26(b) | 200 | 200,500 | ||||||
7.00%, 10/12/28(b) | 1,416 | 1,380,600 | ||||||
7.50%, 09/20/47(b) | 600 | 552,000 | ||||||
|
| |||||||
| 7,939,435 | ||||||||
Brazil — 5.8% | ||||||||
Banco Nacional de Desenvolvimento Economico e Social | ||||||||
5.50%, 07/12/20(b) | 400 | 411,614 | ||||||
5.75%, 09/26/23(b) | 900 | 928,373 | ||||||
Brazilian Government International Bond | ||||||||
2.63%, 01/05/23 | 1,000 | 925,000 | ||||||
4.25%, 01/07/25 | 3,548 | 3,423,820 | ||||||
4.63%, 01/13/28 (Call 10/13/27) | 2,100 | 1,974,000 | ||||||
4.88%, 01/22/21 | 2,111 | 2,144,776 | ||||||
5.00%, 01/27/45 | 3,026 | 2,522,927 | ||||||
5.63%, 01/07/41 | 1,467 | 1,355,141 | ||||||
5.63%, 02/21/47 | 2,300 | 2,078,625 | ||||||
6.00%, 04/07/26 | 1,614 | 1,690,665 | ||||||
7.13%, 01/20/37 | 1,310 | 1,439,363 | ||||||
8.25%, 01/20/34 | 1,150 | 1,371,375 | ||||||
8.75%, 02/04/25 | 500 | 608,000 | ||||||
8.88%, 04/15/24 | 1,020 | 1,228,845 | ||||||
10.13%, 05/15/27 | 700 | 922,250 | ||||||
|
| |||||||
| 23,024,774 | ||||||||
Costa Rica — 0.6% | ||||||||
Costa Rica Government International Bond | ||||||||
4.25%, 01/26/23(b) | 771 | 671,734 | ||||||
4.38%, 04/30/25(b) | 400 | 329,000 | ||||||
5.63%, 04/30/43(b) | 400 | 290,000 | ||||||
7.00%, 04/04/44(b) | 662 | 543,667 | ||||||
7.16%, 03/12/45(b) | 800 | 667,000 | ||||||
|
| |||||||
| 2,501,401 | ||||||||
Croatia — 1.3% | ||||||||
Croatia Government International Bond | ||||||||
5.50%, 04/04/23(b) | 1,500 | 1,575,000 | ||||||
6.00%, 01/26/24(b) | 700 | 752,500 | ||||||
6.38%, 03/24/21(b) | 1,206 | 1,266,300 | ||||||
6.63%, 07/14/20(b) | 1,350 | 1,410,750 | ||||||
|
| |||||||
| 5,004,550 | ||||||||
| Security | Par (000) | Value | ||||||
Dominican Republic — 2.5% | ||||||||
Dominican Republic International Bond | ||||||||
5.50%, 01/27/25(b) | $ | 1,000 | $ | 986,000 | ||||
5.88%, 04/18/24(b) | 1,040 | 1,054,300 | ||||||
5.95%, 01/25/27(b) | 1,075 | 1,068,281 | ||||||
6.00%, 07/19/28(b) | 450 | 444,938 | ||||||
6.50%, 02/15/48(b) | 750 | 705,000 | ||||||
6.60%, 01/28/24(b) | 313 | 327,398 | ||||||
6.85%, 01/27/45(b) | 1,490 | 1,456,475 | ||||||
6.88%, 01/29/26(b) | 1,203 | 1,263,150 | ||||||
7.45%, 04/30/44(b) | 1,350 | 1,405,350 | ||||||
7.50%, 05/06/21(b) | 1,300 | 1,342,575 | ||||||
|
| |||||||
| 10,053,467 | ||||||||
Ecuador — 2.9% | ||||||||
Ecuador Government International Bond | ||||||||
7.88%, 01/23/28(b) | 2,300 | 1,932,000 | ||||||
7.95%, 06/20/24(b) | 1,745 | 1,570,500 | ||||||
8.75%, 06/02/23(b) | 1,100 | 1,043,350 | ||||||
8.88%, 10/23/27(b) | 2,000 | 1,775,000 | ||||||
9.63%, 06/02/27(b) | 800 | 740,000 | ||||||
9.65%, 12/13/26(b) | 779 | 728,365 | ||||||
10.50%, 03/24/20(b) | 1,500 | 1,533,750 | ||||||
10.75%, 03/28/22(b) | 2,262 | 2,335,515 | ||||||
|
| |||||||
| 11,658,480 | ||||||||
Egypt — 2.5% | ||||||||
Egypt Government International Bond | ||||||||
5.58%, 02/21/23(b) | 1,000 | 958,750 | ||||||
5.75%, 04/29/20(b) | 760 | 763,800 | ||||||
5.88%, 06/11/25(b) | 1,159 | 1,083,665 | ||||||
6.13%, 01/31/22(b) | 2,000 | 1,975,000 | ||||||
6.59%, 02/21/28(b) | 1,014 | 930,345 | ||||||
6.88%, 04/30/40(b) | 406 | 340,025 | ||||||
7.50%, 01/31/27(b) | 1,000 | 977,500 | ||||||
7.90%, 02/21/48(b) | 1,400 | 1,254,750 | ||||||
8.50%, 01/31/47(b) | 1,700 | 1,604,375 | ||||||
|
| |||||||
| 9,888,210 | ||||||||
El Salvador — 1.0% | ||||||||
El Salvador Government International Bond | ||||||||
5.88%, 01/30/25(b) | 750 | 670,312 | ||||||
6.38%, 01/18/27(b) | 500 | 446,875 | ||||||
7.63%, 02/01/41(b) | 500 | 453,750 | ||||||
7.65%, 06/15/35(b) | 700 | 640,500 | ||||||
7.75%, 01/24/23(b) | 908 | 913,902 | ||||||
8.25%, 04/10/32(b) | 300 | 292,875 | ||||||
8.63%, 02/28/29(b) | 500 | 507,903 | ||||||
|
| |||||||
| 3,926,117 | ||||||||
Ghana — 0.9% | ||||||||
Ghana Government International Bond | ||||||||
7.63%, 05/16/29(b) | 800 | 762,000 | ||||||
7.88%, 08/07/23(b) | 800 | 815,600 | ||||||
8.13%, 01/18/26(b) | 370 | 371,388 | ||||||
8.63%, 06/16/49(b) | 800 | 750,000 | ||||||
10.75%, 10/14/30(b) | 900 | 1,075,500 | ||||||
|
| |||||||
| 3,774,488 | ||||||||
| 20 | 2 0 1 8 I S H A R E S A N N U A L R E P O R T T O S H A R E H O L D E R S |
Schedule of Investments (continued)
October 31, 2018 | iShares® Emerging Markets High Yield Bond ETF
(Percentages shown are based on Net Assets) |
| Security | Par (000) | Value | ||||||
Guatemala — 0.5% | ||||||||
Guatemala Government Bond | ||||||||
4.50%, 05/03/26(b) | $ | 400 | $ | 367,200 | ||||
4.88%, 02/13/28(b) | 923 | 849,160 | ||||||
5.75%, 06/06/22(b) | 600 | 612,000 | ||||||
|
| |||||||
| 1,828,360 | ||||||||
Ivory Coast — 0.5% | ||||||||
Ivory Coast Government International Bond | ||||||||
5.38%, 07/23/24(b) | 400 | 373,600 | ||||||
6.13%, 06/15/33(b) | 1,000 | 865,000 | ||||||
6.38%, 03/03/28(b) | 700 | 646,625 | ||||||
|
| |||||||
| 1,885,225 | ||||||||
Jamaica — 1.1% | ||||||||
Jamaica Government International Bond | ||||||||
6.75%, 04/28/28 | 1,338 | 1,446,712 | ||||||
7.63%, 07/09/25 | 700 | 794,500 | ||||||
7.88%, 07/28/45 | 700 | 811,125 | ||||||
8.00%, 03/15/39 | 1,043 | 1,209,880 | ||||||
|
| |||||||
| 4,262,217 | ||||||||
Jordan — 0.5% | ||||||||
Jordan Government International Bond | ||||||||
5.75%, 01/31/27(b) | 550 | 505,313 | ||||||
6.13%, 01/29/26(b) | 800 | 764,000 | ||||||
7.38%, 10/10/47(b) | 800 | 721,000 | ||||||
|
| |||||||
| 1,990,313 | ||||||||
Lebanon — 3.2% | ||||||||
Lebanon Government International Bond | ||||||||
5.80%, 04/14/20(b) | 695 | 658,512 | ||||||
6.00%, 01/27/23(b) | 950 | 814,625 | ||||||
6.10%, 10/04/22(b) | 1,400 | 1,216,250 | ||||||
6.15%, 06/19/20 | 350 | 329,875 | ||||||
6.20%, 02/26/25(b) | 700 | 568,750 | ||||||
6.25%, 05/27/22 | 700 | 616,000 | ||||||
6.25%, 11/04/24(b) | 535 | 440,706 | ||||||
6.38%, 03/09/20 | 800 | 767,000 | ||||||
6.40%, 05/26/23 | 650 | 559,813 | ||||||
6.60%, 11/27/26(b) | 1,350 | 1,086,750 | ||||||
6.65%, 04/22/24(b) | 620 | 527,775 | ||||||
6.65%, 11/03/28(b) | 400 | 315,500 | ||||||
6.65%, 02/26/30(b) | 790 | 612,250 | ||||||
6.75%, 11/29/27(b) | 600 | 479,250 | ||||||
6.85%, 03/23/27(b) | 900 | 725,625 | ||||||
6.85%, 05/25/29 | 700 | 549,500 | ||||||
7.00%, 03/23/32(b) | 905 | 702,506 | ||||||
7.05%, 11/02/35(b) | 300 | 232,125 | ||||||
7.25%, 03/23/37(b) | 400 | 311,500 | ||||||
8.25%, 04/12/21(b) | 1,356 | 1,293,285 | ||||||
|
| |||||||
| 12,807,597 | ||||||||
Morocco — 0.4% | ||||||||
Morocco Government International Bond | ||||||||
4.25%, 12/11/22(b) | 990 | 982,575 | ||||||
5.50%, 12/11/42(b) | 600 | 607,500 | ||||||
|
| |||||||
| 1,590,075 | ||||||||
Nigeria — 1.4% | ||||||||
Nigeria Government International Bond | ||||||||
6.38%, 07/12/23(b) | 500 | 496,875 | ||||||
6.50%, 11/28/27(b) | 1,300 | 1,192,750 | ||||||
6.75%, 01/28/21(b) | 400 | 411,500 | ||||||
7.14%, 02/23/30(b) | 514 | 472,237 | ||||||
| Security | Par (000) | Value | ||||||
Nigeria (continued) | ||||||||
7.63%, 11/28/47(b) | $ | 1,300 | $ | 1,147,250 | ||||
7.70%, 02/23/38(b) | 800 | 721,000 | ||||||
7.88%, 02/16/32(b) | 1,290 | 1,241,625 | ||||||
|
| |||||||
| 5,683,237 | ||||||||
Pakistan — 0.5% | ||||||||
Pakistan Government International Bond | ||||||||
6.88%, 12/05/27(b) | 1,000 | 920,865 | ||||||
8.25%, 04/15/24(b) | 727 | 741,540 | ||||||
8.25%, 09/30/25(b) | 400 | 407,000 | ||||||
|
| |||||||
| 2,069,405 | ||||||||
Russia — 4.0% | ||||||||
Russian Foreign Bond-Eurobond | ||||||||
4.50%, 04/04/22(b) | 1,400 | 1,411,900 | ||||||
4.88%, 09/16/23(b) | 2,000 | 2,042,500 | ||||||
5.00%, 04/29/20(b) | 2,200 | 2,235,200 | ||||||
5.63%, 04/04/42(b) | 2,000 | 2,035,000 | ||||||
5.88%, 09/16/43(b) | 1,200 | 1,258,500 | ||||||
7.50%, 03/31/30(b)(e) | 3,389 | 3,702,993 | ||||||
12.75%, 06/24/28(b) | 2,028 | 3,209,310 | ||||||
|
| |||||||
| 15,895,403 | ||||||||
Senegal — 0.4% | ||||||||
Senegal Government International Bond | ||||||||
6.25%, 07/30/24(b) | 400 | 389,500 | ||||||
6.25%, 05/23/33(b) | 700 | 602,000 | ||||||
6.75%, 03/13/48(b) | 771 | 635,111 | ||||||
|
| |||||||
| 1,626,611 | ||||||||
Serbia — 0.7% | ||||||||
Serbia International Bond | ||||||||
4.88%, 02/25/20(b) | 890 | 896,675 | ||||||
7.25%, 09/28/21(b) | 1,586 | 1,706,933 | ||||||
|
| |||||||
| 2,603,608 | ||||||||
South Africa — 2.8% | ||||||||
Republic of South Africa Government International Bond | ||||||||
4.30%, 10/12/28 | 1,700 | 1,449,250 | ||||||
4.67%, 01/17/24 | 1,200 | 1,149,000 | ||||||
4.85%, 09/27/27 | 800 | 725,000 | ||||||
4.88%, 04/14/26 | 1,200 | 1,110,000 | ||||||
5.00%, 10/12/46 | 500 | 398,750 | ||||||
5.38%, 07/24/44 | 700 | 581,000 | ||||||
5.50%, 03/09/20 | 1,168 | 1,178,220 | ||||||
5.65%, 09/27/47 | 1,100 | 926,750 | ||||||
5.88%, 05/30/22 | 850 | 868,063 | ||||||
5.88%, 09/16/25 | 1,286 | 1,268,317 | ||||||
5.88%, 06/22/30 | 600 | 564,750 | ||||||
6.25%, 03/08/41 | 601 | 558,930 | ||||||
6.30%, 06/22/48 | 600 | 538,500 | ||||||
|
| |||||||
| 11,316,530 | ||||||||
Sri Lanka — 1.7% | ||||||||
Sri Lanka Government International Bond | ||||||||
5.75%, 01/18/22(b) | 600 | 556,839 | ||||||
5.75%, 04/18/23(b) | 1,000 | 900,050 | ||||||
5.88%, 07/25/22(b) | 362 | 333,681 | ||||||
6.13%, 06/03/25(b) | 700 | 609,875 | ||||||
6.20%, 05/11/27(b) | 1,180 | 1,010,375 | ||||||
6.25%, 10/04/20(b) | 300 | 287,625 | ||||||
6.25%, 07/27/21(b) | 978 | 928,268 | ||||||
6.75%, 04/18/28(b) | 1,000 | 874,895 | ||||||
S C H E D U L E O F I N V E S T M E N T S | 21 |
Schedule of Investments (continued)
October 31, 2018 | iShares® Emerging Markets High Yield Bond ETF
(Percentages shown are based on Net Assets) |
| Security | Par (000) | Value | ||||||
Sri Lanka (continued) | ||||||||
6.83%, 07/18/26(b) | $ | 800 | $ | 716,000 | ||||
6.85%, 11/03/25(b) | 800 | 723,000 | ||||||
|
| |||||||
| 6,940,608 | ||||||||
Trinidad And Tobago — 0.3% | ||||||||
Trinidad & Tobago Government International Bond | ||||||||
4.38%, 01/16/24(b) | 400 | 384,000 | ||||||
4.50%, 08/04/26(b) | 700 | 644,844 | ||||||
|
| |||||||
| 1,028,844 | ||||||||
Turkey — 8.5% | ||||||||
Export Credit Bank of Turkey | ||||||||
5.00%, 09/23/21(b) | 450 | 415,125 | ||||||
5.38%, 02/08/21(b) | 400 | 379,600 | ||||||
5.38%, 10/24/23(b) | 200 | 176,500 | ||||||
Turkey Government International Bond | ||||||||
3.25%, 03/23/23 | 1,400 | 1,200,500 | ||||||
4.25%, 04/14/26 | 1,400 | 1,155,000 | ||||||
4.88%, 10/09/26 | 1,860 | 1,578,675 | ||||||
4.88%, 04/16/43 | 1,779 | 1,267,538 | ||||||
5.13%, 03/25/22 | 949 | 894,433 | ||||||
5.13%, 02/17/28 | 1,000 | 843,750 | ||||||
5.63%, 03/30/21 | 986 | 961,350 | ||||||
5.75%, 03/22/24 | 2,300 | 2,147,625 | ||||||
5.75%, 05/11/47 | 2,476 | 1,887,950 | ||||||
6.00%, 03/25/27 | 2,621 | 2,372,005 | ||||||
6.00%, 01/14/41 | 2,616 | 2,079,720 | ||||||
6.13%, 10/24/28 | 1,800 | 1,613,250 | ||||||
6.25%, 09/26/22 | 2,083 | 2,020,510 | ||||||
6.63%, 02/17/45 | 1,979 | 1,677,202 | ||||||
6.75%, 05/30/40 | 1,775 | 1,539,812 | ||||||
6.88%, 03/17/36 | 1,813 | 1,611,304 | ||||||
7.00%, 06/05/20 | 1,900 | 1,914,250 | ||||||
7.25%, 03/05/38 | 800 | 737,000 | ||||||
7.38%, 02/05/25 | 2,570 | 2,553,937 | ||||||
8.00%, 02/14/34 | 1,263 | 1,259,843 | ||||||
11.88%, 01/15/30 | 1,350 | 1,749,937 | ||||||
|
| |||||||
| 34,036,816 | ||||||||
Ukraine — 2.5% | ||||||||
Ukraine Government International Bond | ||||||||
7.38%, 09/25/32(b) | 2,200 | 1,832,600 | ||||||
7.75%, 09/01/20(b) | 1,326 | 1,316,055 | ||||||
7.75%, 09/01/21(b) | 950 | 934,800 | ||||||
7.75%, 09/01/22(b) | 1,004 | 973,880 | ||||||
7.75%, 09/01/23(b) | 975 | 929,662 | ||||||
7.75%, 09/01/24(b) | 918 | 861,773 | ||||||
7.75%, 09/01/25(b) | 436 | 400,575 | ||||||
7.75%, 09/01/26(b) | 1,252 | 1,131,808 | ||||||
7.75%, 09/01/27(b) | 1,198 | 1,071,012 | ||||||
Ukreximbank Via Biz Finance PLC, 9.75%, 01/22/25(b) | 450 | 447,750 | ||||||
|
| |||||||
| 9,899,915 | ||||||||
| Security | Par/ Shares (000) | Value | ||||||
Venezuela — 1.2% | ||||||||
Venezuela Government International Bond | ||||||||
6.00%, 12/09/20(b)(f) | $ | 1,290 | $ | 312,825 | ||||
7.00%, 03/31/38(b)(f) | 600 | 144,000 | ||||||
7.65%, 04/21/25(b)(f) | 1,558 | 381,710 | ||||||
8.25%, 10/13/24(b)(f) | 1,730 | 436,825 | ||||||
9.00%, 05/07/23(b)(f) | 1,237 | 309,250 | ||||||
9.25%, 09/15/27(f) | 2,762 | 690,500 | ||||||
9.25%, 05/07/28(b)(f) | 1,692 | 423,000 | ||||||
9.38%, 01/13/34(f) | 1,330 | 379,050 | ||||||
11.75%, 10/21/26(b)(f) | 1,835 | 470,219 | ||||||
11.95%, 08/05/31(b)(f) | 3,130 | 798,150 | ||||||
12.75%, 08/23/22(b)(f) | 2,530 | 647,047 | ||||||
|
| |||||||
| 4,992,576 | ||||||||
Vietnam — 0.4% | ||||||||
Vietnam Government International Bond | ||||||||
4.80%, 11/19/24(b) | 800 | 806,904 | ||||||
6.75%, 01/29/20(b) | 640 | 658,317 | ||||||
|
| |||||||
| 1,465,221 | ||||||||
|
| |||||||
Total Foreign Government Obligations — 57.3% (Cost: $259,907,747) |
| 228,300,918 | ||||||
|
| |||||||
| Short-Term Investments | ||||||||
Money Market Funds — 0.8% | ||||||||
BlackRock Cash Funds: Treasury, SL Agency Shares, 2.11%(g)(h) | 3,376 | 3,376,183 | ||||||
|
| |||||||
Total Short-Term Investments — 0.8% |
| 3,376,183 | ||||||
|
| |||||||
Total Investments in Securities — 98.8% |
| 393,782,481 | ||||||
Other Assets, Less Liabilities — 1.2% |
| 4,758,984 | ||||||
|
| |||||||
Net Assets — 100.0% | $ | 398,541,465 | ||||||
|
| |||||||
| (a) | U.S. dollar denominated security issued by foreign domiciled entity. |
| (b) | This security may be resold to qualified foreign investors and foreign institutional buyers under Regulation S of the Securities Act of 1933. |
| (c) | Security is issued at a fixed coupon rate, which converts to a variable rate at a specified date. Reference index and spread are provided if the rate is currently floating. |
| (d) | Variable or floating rate security. Rate shown is the rate in effect as of period-end. |
| (e) | Step coupon security. Coupon rate will either increase (step-up bond) or decrease (step-down bond) at regular intervals until maturity. Interest rate shown reflects the rate currently in effect. |
| (f) | Issuer is in default of interest payments. |
| (g) | Affiliate of the Fund. |
| (h) | Annualized 7-day yield as of period-end. |
| 22 | 2 0 1 8 I S H A R E S A N N U A L R E P O R T T O S H A R E H O L D E R S |
Schedule of Investments (continued)
October 31, 2018 | iShares® Emerging Markets High Yield Bond ETF
|
Affiliates
Investments in issuers considered to be affiliates of the Fund during the year ended October 31, 2018, for purposes of Section 2(a)(3) of the 1940 Act, were as follows:
| Affiliated Issuer | | Shares Held at 10/31/17 (000) | | | Net Activity (000) | | | Shares Held at 10/31/18 (000) | | | Value at 10/31/18 | | Income | | Net Realized Gain (Loss) | (a) | | Change in Unrealized Appreciation (Depreciation) | | |||||||||
BlackRock Cash Funds: Treasury, SL Agency Shares | 10,477 | (7,101 | ) | 3,376 | $ | 3,376,183 | $ | 70,383 | $ | — | $ | — | ||||||||||||||||
|
|
|
|
|
|
|
|
| (a) | Includes realized capital gain distributions from an affiliated fund, if any. |
Fair Value Measurements
Various inputs are used in determining the fair value of financial instruments. For description of the input levels and information about the Fund’s policy regarding valuation of financial instruments, refer to the Notes to Financial Statements.
The following table summarizes the value of the Fund’s investments according to the fair value hierarchy as of October 31, 2018. The breakdown of the Fund’s investments into major categories is disclosed in the Schedule of Investments above.
| Level 1 | Level 2 | Level 3 | Total | |||||||||||||
Investments | ||||||||||||||||
Assets | ||||||||||||||||
Corporate Bonds & Notes | $ | — | $ | 162,105,380 | $ | — | $ | 162,105,380 | ||||||||
Foreign Government Obligations | — | 228,300,918 | — | 228,300,918 | ||||||||||||
Money Market Funds | 3,376,183 | — | — | 3,376,183 | ||||||||||||
|
|
|
|
|
|
|
| |||||||||
| $ | 3,376,183 | $ | 390,406,298 | $ | — | $ | 393,782,481 | |||||||||
|
|
|
|
|
|
|
| |||||||||
See notes to financial statements.
S C H E D U L E O F I N V E S T M E N T S | 23 |
Schedule of Investments
October 31, 2018 | iShares® International High Yield Bond ETF
(Percentages shown are based on Net Assets) |
| Security | Par (000) | Value | ||||||||||
| Corporate Bonds & Notes | ||||||||||||
Austria — 0.2% | ||||||||||||
Raiffeisenlandesbank Niederoesterreich-Wien AG, 5.88%, 11/27/23(a) | EUR | 100 | $ | 128,962 | ||||||||
|
| |||||||||||
Belgium — 0.7% | ||||||||||||
Barry Callebaut Services NV | ||||||||||||
2.38%, 05/24/24 | EUR | 100 | 119,300 | |||||||||
5.63%, 06/15/21(a) | EUR | 100 | 128,380 | |||||||||
Telenet Finance Luxembourg Notes Sarl, 3.50%, 03/01/28 (Call 12/01/22)(a) | EUR | 200 | 222,998 | |||||||||
|
| |||||||||||
| 470,678 | ||||||||||||
Canada — 1.7% | ||||||||||||
Baytex Energy Corp., 6.63%, 07/19/22 (Call 07/19/19) | CAD | 100 | 74,910 | |||||||||
Bombardier Inc., 6.13%, 05/15/21(a) | EUR | 200 | 243,446 | |||||||||
Brookfield Residential Properties Inc., 6.13%, 05/15/23 (Call 05/15/19)(a) | CAD | 75 | 56,896 | |||||||||
Cott Corp., 5.50%, 07/01/24 (Call 06/21/19)(a) | EUR | 100 | 119,534 | |||||||||
Iron Mountain Canada Operations ULC, 5.38%, 09/15/23 (Call 09/15/19)(a) | CAD | 100 | 76,337 | |||||||||
Mattamy Group Corp., 6.50%, 10/01/25 (Call 10/01/20)(b) | CAD | 75 | 54,855 | |||||||||
Parkland Fuel Corp. | ||||||||||||
5.63%, 05/09/25 (Call 05/09/20) | CAD | 150 | 113,265 | |||||||||
5.75%, 09/16/24 (Call 09/16/19) | CAD | 100 | 76,338 | |||||||||
Postmedia Network Inc., 8.25%, 07/15/21 (Call 12/10/18)(b) | CAD | 3 | 1,893 | |||||||||
Quebecor Media Inc., 6.63%, | CAD | 175 | 140,643 | |||||||||
Southern Pacific Resource Corp., 8.75%, 01/25/18(b)(c)(d) | CAD | 50 | 5 | |||||||||
Videotron Ltd. | ||||||||||||
5.63%, 06/15/25 (Call 03/15/25) | CAD | 100 | 77,544 | |||||||||
5.75%, 01/15/26 | CAD | 100 | 77,528 | |||||||||
|
| |||||||||||
| 1,113,194 | ||||||||||||
Cyprus — 0.2% | ||||||||||||
Bank of Cyprus PCL, 9.25%, 01/19/27 (Call 01/19/22)(a)(e)(f) | EUR | 100 | 118,451 | |||||||||
|
| |||||||||||
Denmark — 1.0% | ||||||||||||
DKT Finance ApS, 7.00%, 06/17/23 (Call 06/17/20)(a) | EUR | 200 | 243,071 | |||||||||
TDC AS | ||||||||||||
3.75%, 03/02/22 | EUR | 200 | 249,226 | |||||||||
5.63%, 02/23/23(a) | GBP | 100 | 141,170 | |||||||||
|
| |||||||||||
| 633,467 | ||||||||||||
Finland — 1.9% | ||||||||||||
Nokia OYJ | ||||||||||||
1.00%, 03/15/21 | EUR | 100 | 114,600 | |||||||||
2.00%, 03/15/24 | EUR | 200 | 229,954 | |||||||||
Stora Enso OYJ | ||||||||||||
2.13%, 06/16/23 | EUR | 100 | 118,672 | |||||||||
2.50%, 06/07/27 | EUR | 100 | 114,895 | |||||||||
2.50%, 03/21/28 | EUR | 100 | 113,846 | |||||||||
Teollisuuden Voima OYJ | ||||||||||||
2.13%, 02/04/25 | EUR | 200 | 226,726 | |||||||||
2.50%, 03/17/21(a) | EUR | 100 | 117,915 | |||||||||
2.63%, 01/13/23(a) | EUR | 200 | 237,260 | |||||||||
|
| |||||||||||
| 1,273,868 | ||||||||||||
France — 12.9% | ||||||||||||
Altice France SA/France | ||||||||||||
5.63%, 05/15/24 | EUR | 300 | 350,836 | |||||||||
5.88%, 02/01/27 | EUR | 250 | 291,760 | |||||||||
Areva SA, 4.38%, 11/06/19 | EUR | 200 | 233,555 | |||||||||
| Security | Par (000) | Value | ||||||||||
France (continued) | ||||||||||||
Casino Guichard Perrachon SA | ||||||||||||
1.87%, 06/13/22 (Call 03/13/22)(a) | EUR | 200 | $ | 204,864 | ||||||||
3.58%, 02/07/25 (Call 11/07/24)(a) | EUR | 200 | 204,570 | |||||||||
4.05%, 08/05/26 (Call 05/05/26)(a) | EUR | 100 | 102,416 | |||||||||
4.50%, 03/07/24 (Call 12/04/23)(a) | EUR | 300 | 323,728 | |||||||||
4.56%, 01/25/23(a) | EUR | 200 | 220,412 | |||||||||
5.24%, 03/09/20 | EUR | 200 | 233,194 | |||||||||
CGG Holding U.S. Inc., 7.88%, 05/01/23 (Call 05/01/20)(a) | EUR | 100 | 120,364 | |||||||||
CMA CGM SA | ||||||||||||
5.25%, 01/15/25 (Call 10/15/20)(a) | EUR | 300 | 287,685 | |||||||||
7.75%, 01/15/21 (Call 01/15/19)(a) | EUR | 300 | 337,654 | |||||||||
Elis SA | ||||||||||||
1.88%, 02/15/23 (Call 11/15/22)(a) | EUR | 300 | 342,187 | |||||||||
2.88%, 02/15/26 (Call 11/15/25)(a) | EUR | 100 | 113,610 | |||||||||
Europcar Mobility Group | ||||||||||||
4.13%, 11/15/24 (Call 11/15/20)(a) | EUR | 200 | 220,001 | |||||||||
5.75%, 06/15/22 (Call 06/15/19)(a) | EUR | 200 | 231,423 | |||||||||
Faurecia SA | ||||||||||||
2.63%, 06/15/25 (Call 06/15/21)(a) | EUR | 300 | 336,273 | |||||||||
3.63%, 06/15/23 (Call 06/15/19)(a) | EUR | 100 | 115,985 | |||||||||
La Financiere Atalian SASU | ||||||||||||
4.00%, 05/15/24 (Call 05/15/20)(a) | EUR | 200 | 201,587 | |||||||||
5.13%, 05/15/25 (Call 05/15/21)(a) | EUR | 100 | 103,717 | |||||||||
Loxam SAS | ||||||||||||
3.50%, 05/03/23 (Call 04/26/19)(a) | EUR | 100 | 115,779 | |||||||||
4.25%, 04/15/24 (Call 04/15/20)(a) | EUR | 100 | 118,191 | |||||||||
4.88%, 07/23/21 (Call 07/23/19)(a) | EUR | 58 | 66,828 | |||||||||
6.00%, 04/15/25 (Call 04/15/20)(a) | EUR | 100 | 119,772 | |||||||||
Orano SA | ||||||||||||
3.13%, 03/20/23 (Call 12/20/22)(a) | EUR | 200 | 225,100 | |||||||||
3.25%, 09/04/20(a) | EUR | 100 | 116,686 | |||||||||
3.50%, 03/22/21(a) | EUR | 300 | 350,339 | |||||||||
4.88%, 09/23/24 | EUR | 250 | 292,847 | |||||||||
Peugeot SA | ||||||||||||
2.00%, 03/23/24(a) | EUR | 100 | 115,066 | |||||||||
2.00%, 03/20/25 (Call 12/20/24)(a) | EUR | 200 | 224,727 | |||||||||
2.38%, 04/14/23(a) | EUR | 200 | 238,061 | |||||||||
Rexel SA | ||||||||||||
2.13%, 06/15/25 (Call 12/15/20)(a) | EUR | 150 | 161,843 | |||||||||
2.63%, 06/15/24 (Call 03/15/20)(a) | EUR | 125 | 141,875 | |||||||||
3.50%, 06/15/23 (Call 06/15/19)(a) | EUR | 200 | 232,947 | |||||||||
SPCM SA, 2.88%, 06/15/23 (Call 06/15/19)(a) | EUR | 200 | 227,910 | |||||||||
Synlab Bondco PLC, 6.25%, 07/01/22 (Call 07/01/19)(a) | EUR | 200 | 233,689 | |||||||||
Synlab Unsecured Bondco PLC, 8.25%, 07/01/23 (Call 07/01/19)(a) | EUR | 150 | 180,658 | |||||||||
Tereos Finance Groupe I SA | ||||||||||||
4.13%, 06/16/23 (Call 03/16/23)(a) | EUR | 200 | 216,557 | |||||||||
4.25%, 03/04/20 (Call 03/04/19) | EUR | 100 | 113,052 | |||||||||
Vallourec SA | ||||||||||||
2.25%, 09/30/24(a) | EUR | 100 | 86,608 | |||||||||
6.38%, 10/15/23 (Call 10/15/20)(a) | EUR | 100 | 106,767 | |||||||||
6.63%, 10/15/22 (Call 10/15/20)(a) | EUR | 200 | 220,309 | |||||||||
|
| |||||||||||
| 8,481,432 | ||||||||||||
Germany — 8.6% | ||||||||||||
ADLER Real Estate AG | ||||||||||||
1.50%, 12/06/21 (Call 11/06/21)(a) | EUR | 100 | 113,269 | |||||||||
1.88%, 04/27/23 (Call 03/27/23)(a) | EUR | 200 | 219,357 | |||||||||
2.13%, 02/06/24 (Call 01/06/24)(a) | EUR | 100 | 109,494 | |||||||||
3.00%, 04/27/26 (Call 02/27/26)(a) | EUR | 100 | 109,409 | |||||||||
| 24 | 2 0 1 8 I S H A R E S A N N U A L R E P O R T T O S H A R E H O L D E R S |
Schedule of Investments (continued)
October 31, 2018 | iShares® International High Yield Bond ETF
(Percentages shown are based on Net Assets) |
| Security | Par (000) | Value | ||||||||||
Germany (continued) | ||||||||||||
Deutsche Bank AG | ||||||||||||
2.75%, 02/17/25(a) | EUR | 400 | $ | 446,046 | ||||||||
4.50%, 05/19/26(a) | EUR | 200 | 238,021 | |||||||||
Deutsche Lufthansa AG, 5.13%, 08/12/75 (Call 02/12/21)(a)(e)(f) | EUR | 150 | 180,108 | |||||||||
Hapag-Lloyd AG | ||||||||||||
5.13%, 07/15/24 (Call 07/03/20)(a) | EUR | 200 | 228,109 | |||||||||
6.75%, 02/01/22 (Call 02/01/19)(a) | EUR | 100 | 116,916 | |||||||||
K+S AG | ||||||||||||
2.63%, 04/06/23 (Call 01/06/23)(a) | EUR | 200 | 230,316 | |||||||||
3.25%, 07/18/24 (Call 04/18/24)(a) | EUR | 200 | 223,564 | |||||||||
4.13%, 12/06/21(a) | EUR | 200 | 245,187 | |||||||||
LANXESS AG, 4.50%, 12/06/76 (Call 06/06/23)(a)(e)(f) | EUR | 125 | 149,772 | |||||||||
METRO AG | ||||||||||||
1.38%, 10/28/21(a) | EUR | 200 | 230,456 | |||||||||
1.50%, 03/19/25(a) | EUR | 100 | 109,040 | |||||||||
Norddeutsche Landesbank Girozentrale, 6.00%, 06/29/20 | EUR | 150 | 174,083 | |||||||||
RWE AG | ||||||||||||
2.75%, 04/21/75 | EUR | 175 | 200,829 | |||||||||
3.50%, 04/21/75 | EUR | 50 | 56,531 | |||||||||
thyssenkrupp AG | ||||||||||||
1.38%, 03/03/22 (Call 12/03/21)(a) | EUR | 450 | 505,680 | |||||||||
1.75%, 11/25/20 (Call 08/25/20)(a) | EUR | 425 | 488,708 | |||||||||
2.50%, 02/25/25(a) | EUR | 100 | 116,529 | |||||||||
3.13%, 10/25/19 (Call 07/25/19)(a) | EUR | 300 | 346,041 | |||||||||
Unitymedia GmbH, 3.75%, 01/15/27 (Call 01/15/21)(a) | EUR | 200 | 238,384 | |||||||||
Unitymedia Hessen GmbH & Co. KG/Unitymedia NRW GmbH | ||||||||||||
3.50%, 01/15/27 (Call 01/15/21)(a) | EUR | 200 | 237,942 | |||||||||
4.00%, 01/15/25 (Call 01/15/20)(a) | EUR | 200 | 237,460 | |||||||||
4.63%, 02/15/26 (Call 02/15/21)(a) | EUR | 90 | 110,157 | |||||||||
|
| |||||||||||
| 5,661,408 | ||||||||||||
Greece — 0.7% | ||||||||||||
OTE PLC | ||||||||||||
2.38%, 07/18/22(a) | EUR | 100 | 116,038 | |||||||||
3.50%, 07/09/20(a) | EUR | 175 | 205,865 | |||||||||
4.38%, 12/02/19(a) | EUR | 100 | 117,594 | |||||||||
|
| |||||||||||
| 439,497 | ||||||||||||
Ireland — 3.5% | ||||||||||||
Allied Irish Banks PLC, 4.13%, 11/26/25 (Call 11/26/20)(a)(e)(f) | EUR | 200 | 236,864 | |||||||||
Ardagh Packaging Finance PLC/Ardagh Holdings USA Inc. | ||||||||||||
4.13%, 05/15/23 (Call 05/15/19)(a) | EUR | 200 | 232,959 | |||||||||
4.75%, 07/15/27 (Call 07/15/22)(a) | GBP | 100 | 120,858 | |||||||||
6.75%, 05/15/24 (Call 05/15/19)(a) | EUR | 300 | 359,995 | |||||||||
Bank of Ireland, 10.00%, 12/19/22(a) | EUR | 100 | 150,339 | |||||||||
Bank of Ireland Group PLC, 3.13%, 09/19/27 (Call 09/19/22)(a)(e)(f) | GBP | 100 | 123,063 | |||||||||
James Hardie International Finance DAC, 3.63%, 10/01/26(a) | EUR | 100 | 112,731 | |||||||||
Smurfit Kappa Acquisitions ULC | ||||||||||||
2.38%, 02/01/24 (Call 11/01/23)(a) | EUR | 100 | 116,221 | |||||||||
2.75%, 02/01/25 (Call 11/01/24)(a) | EUR | 100 | 117,343 | |||||||||
2.88%, 01/15/26(a) | EUR | 125 | 144,617 | |||||||||
3.25%, 06/01/21 (Call 03/10/21)(a) | EUR | 200 | 239,999 | |||||||||
4.13%, 01/30/20(a) | EUR | 100 | 118,134 | |||||||||
Teva Pharmaceutical Finance Netherlands II BV, 1.13%, | ||||||||||||
10/15/24(a) | EUR | 130 | 129,178 | |||||||||
Virgin Media Receivables Financing Notes II DAC, 5.75%, | ||||||||||||
04/15/23 (Call 09/15/19)(a) | GBP | 100 | 129,943 | |||||||||
|
| |||||||||||
| 2,332,244 | ||||||||||||
| Security | Par (000) | Value | ||||||||||
Israel — 1.7% | ||||||||||||
Teva Pharmaceutical Finance Netherlands II BV | ||||||||||||
0.38%, 07/25/20(a) | EUR | 350 | $ | 389,678 | ||||||||
1.63%, 10/15/28(a) | EUR | 150 | 133,395 | |||||||||
3.25%, 04/15/22 (Call 01/15/22) | EUR | 200 | 233,457 | |||||||||
4.50%, 03/01/25 (Call 12/01/24) | EUR | 300 | 356,862 | |||||||||
|
| |||||||||||
| 1,113,392 | ||||||||||||
Italy — 19.0% | ||||||||||||
Banca IFIS SpA | ||||||||||||
2.00%, 04/24/23(a) | EUR | 100 | 101,266 | |||||||||
4.50%, 10/17/27 | EUR | 100 | 90,334 | |||||||||
Banca Monte dei Paschi di Siena SpA, 5.38%, 01/18/28 (Call 01/18/23)(a)(e)(f) | EUR | 200 | 149,183 | |||||||||
Banco BPM SpA | ||||||||||||
1.75%, 04/24/23(a) | EUR | 100 | 102,141 | |||||||||
2.75%, 07/27/20(a) | EUR | 400 | 451,903 | |||||||||
4.38%, 09/21/27 | EUR | 200 | 197,049 | |||||||||
6.00%, 11/05/20(a) | EUR | 150 | 171,833 | |||||||||
6.38%, 05/31/21(a) | EUR | 100 | 114,823 | |||||||||
BPER Banca, 5.13%, 05/31/27 (Call 05/31/22)(a)(e)(f) | EUR | 100 | 107,304 | |||||||||
Fiat Chrysler Finance Europe SA | ||||||||||||
4.75%, 03/22/21(a) | EUR | 150 | 183,774 | |||||||||
4.75%, 07/15/22(a) | EUR | 400 | 500,771 | |||||||||
6.75%, 10/14/19(a) | EUR | 400 | 478,640 | |||||||||
Iccrea Banca SpA | ||||||||||||
1.50%, 02/21/20(a) | EUR | 100 | 111,128 | |||||||||
1.50%, 10/11/22(a) | EUR | 200 | 211,271 | |||||||||
1.88%, 11/25/19(a) | EUR | 200 | 225,820 | |||||||||
International Game Technology PLC | ||||||||||||
4.13%, 02/15/20 (Call 11/15/19)(a) | EUR | 100 | 116,875 | |||||||||
4.75%, 02/15/23 (Call 08/15/22)(a) | EUR | 200 | 241,932 | |||||||||
Intesa Sanpaolo SpA | ||||||||||||
2.86%, 04/23/25(a) | EUR | 175 | 181,785 | |||||||||
3.93%, 09/15/26(a) | EUR | 300 | 325,121 | |||||||||
5.15%, 07/16/20 | EUR | 300 | 356,691 | |||||||||
6.63%, 09/13/23(a) | EUR | 300 | 378,361 | |||||||||
Leonardo SpA | ||||||||||||
1.50%, 06/07/24 (Call 03/07/24)(a) | EUR | 225 | 239,552 | |||||||||
4.50%, 01/19/21 | EUR | 300 | 362,706 | |||||||||
8.00%, 12/16/19 | GBP | 100 | 135,940 | |||||||||
Mediobanca Banca di Credito Finanziario SpA | ||||||||||||
3.75%, 06/16/26 | EUR | 150 | 168,848 | |||||||||
5.00%, 11/15/20 | EUR | 100 | 117,429 | |||||||||
5.75%, 04/18/23 | EUR | 125 | 150,710 | |||||||||
Nexi Capital SpA, 4.13%, 11/01/23 (Call 11/02/19)(a) | EUR | 250 | 283,098 | |||||||||
Rossini Sarl, 6.75%, 10/30/25 (Call 10/30/21)(a) | EUR | 200 | 230,341 | |||||||||
Saipem Finance International BV | ||||||||||||
2.75%, 04/05/22(a) | EUR | 100 | 114,635 | |||||||||
3.00%, 03/08/21(a) | EUR | 200 | 232,739 | |||||||||
3.75%, 09/08/23(a) | EUR | 100 | 117,822 | |||||||||
Salini Impregilo SpA | ||||||||||||
1.75%, 10/26/24(a) | EUR | 150 | 128,955 | |||||||||
3.75%, 06/24/21(a) | EUR | 100 | 106,972 | |||||||||
Telecom Italia SpA/Milano | ||||||||||||
2.38%, 10/12/27 (Call 07/12/27)(a) | EUR | 200 | 204,094 | |||||||||
2.50%, 07/19/23(a) | EUR | 200 | 223,555 | |||||||||
2.88%, 01/28/26 (Call 10/28/25)(a) | EUR | 100 | 108,617 | |||||||||
3.00%, 09/30/25(a) | EUR | 200 | 220,151 | |||||||||
3.25%, 01/16/23(a) | EUR | 300 | 348,926 | |||||||||
3.63%, 01/19/24(a) | EUR | 100 | 117,020 | |||||||||
3.63%, 05/25/26(a) | EUR | 100 | 113,382 | |||||||||
S C H E D U L E O F I N V E S T M E N T S | 25 |
Schedule of Investments (continued)
October 31, 2018 | iShares® International High Yield Bond ETF
(Percentages shown are based on Net Assets) |
| Security | Par (000) | Value | ||||||||||
Italy (continued) | ||||||||||||
4.88%, 09/25/20(a) | EUR | 100 | $ | 121,749 | ||||||||
5.25%, 02/10/22(a) | EUR | 400 | 499,966 | |||||||||
UniCredit SpA | ||||||||||||
4.38%, 01/03/27 | EUR | 100 | 112,192 | |||||||||
5.75%, 10/28/25 | EUR | 400 | 468,850 | |||||||||
6.13%, 04/19/21(a) | EUR | 100 | 121,169 | |||||||||
6.95%, 10/31/22(a) | EUR | 486 | 612,531 | |||||||||
Unione di Banche Italiane SpA | ||||||||||||
1.75%, 04/12/23(a) | EUR | 250 | 252,174 | |||||||||
4.25%, 05/05/26 | EUR | 200 | 209,841 | |||||||||
4.45%, 09/15/27 | EUR | 100 | 102,825 | |||||||||
Unipol Gruppo SpA | ||||||||||||
3.00%, 03/18/25(a) | EUR | 300 | 319,622 | |||||||||
3.50%, 11/29/27 (Call 08/29/27)(a) | EUR | 100 | 101,658 | |||||||||
4.38%, 03/05/21(a) | EUR | 100 | 118,400 | |||||||||
Wind Tre SpA | ||||||||||||
2.63%, 01/20/23 (Call 11/03/19)(a) | EUR | 300 | 315,339 | |||||||||
3.13%, 01/20/25 (Call 11/03/20)(a) | EUR | 600 | 618,174 | |||||||||
|
| |||||||||||
| 12,497,987 | ||||||||||||
Japan — 2.6% | ||||||||||||
SoftBank Group Corp. | ||||||||||||
3.13%, 09/19/25 (Call 06/21/25)(a) | EUR | 500 | 523,997 | |||||||||
4.00%, 07/30/22 (Call 04/30/22)(a) | EUR | 200 | 241,993 | |||||||||
4.00%, 04/20/23 (Call 01/20/23)(a) | EUR | 100 | 117,437 | |||||||||
4.00%, 09/19/29 (Call 06/21/29)(a) | EUR | 200 | 197,821 | |||||||||
4.75%, 07/30/25 (Call 04/30/25)(a) | EUR | 250 | 292,146 | |||||||||
5.00%, 04/15/28 (Call 01/16/28)(a) | EUR | 300 | 331,644 | |||||||||
|
| |||||||||||
| 1,705,038 | ||||||||||||
Luxembourg — 4.0% | ||||||||||||
Altice Financing SA, 5.25%, 02/15/23 (Call 02/15/19)(a) | EUR | 200 | 233,975 | |||||||||
Altice Finco SA, 4.75%, 01/15/28 (Call 10/15/22)(a) | EUR | 200 | 187,620 | |||||||||
Altice Luxembourg SA | ||||||||||||
6.25%, 02/15/25 (Call 02/15/20)(a) | EUR | 200 | 204,002 | |||||||||
7.25%, 05/15/22 (Call 05/15/19)(a) | EUR | 600 | 663,548 | |||||||||
Garfunkelux Holdco 3 SA, 8.50%, 11/01/22 (Call 11/01/18)(a) | GBP | 200 | 244,225 | |||||||||
INEOS Finance PLC, 2.13%, 11/15/25 (Call 11/15/20)(a) | EUR | 100 | 107,192 | |||||||||
INEOS Group Holdings SA, 5.38%, 08/01/24 (Call 08/01/19)(a) | EUR | 200 | 231,876 | |||||||||
Matterhorn Telecom Holding SA, 4.88%, 05/01/23 (Call 05/01/19)(a) | EUR | 100 | 115,408 | |||||||||
Matterhorn Telecom SA | ||||||||||||
3.88%, 05/01/22 (Call 05/01/19)(a) | EUR | 300 | 345,428 | |||||||||
4.00%, 11/15/27 (Call 11/15/22)(a) | EUR | 100 | 106,815 | |||||||||
Picard Bondco SA, 5.50%, 11/30/24 (Call 11/30/20)(a) | EUR | 100 | 105,377 | |||||||||
Telenet Finance VI Luxembourg SCA, 4.88%, 07/15/27 (Call 07/15/21)(a) | EUR | 90 | 109,996 | |||||||||
|
| |||||||||||
| 2,655,462 | ||||||||||||
Netherlands — 5.0% | ||||||||||||
Axalta Coating Systems LLC, 4.25%, 08/15/24 (Call 08/15/19)(a) | EUR | 100 | 114,910 | |||||||||
Constellium NV | ||||||||||||
4.25%, 02/15/26 (Call 11/15/20)(a) | EUR | 100 | 110,539 | |||||||||
4.63%, 05/15/21 (Call 11/30/18)(a) | EUR | 100 | 114,287 | |||||||||
InterXion Holding NV, 4.75%, 06/15/25 (Call 06/15/21)(a) | EUR | 250 | 295,264 | |||||||||
Nyrstar Netherlands Holdings BV, 6.88%, 03/15/24 (Call 03/15/20)(a) | EUR | 100 | 68,707 | |||||||||
OCI NV, 5.00%, 04/15/23 (Call 04/15/20)(a) | EUR | 100 | 118,838 | |||||||||
Saipem Finance International BV, 2.63%, 01/07/25(a) | EUR | 200 | 217,299 | |||||||||
Selecta Group BV, 5.88%, 02/01/24 (Call 02/01/20)(a) | EUR | 200 | 222,144 | |||||||||
| Security | Par (000) | Value | ||||||||||
Netherlands (continued) | ||||||||||||
Sigma Holdco BV, 5.75%, 05/15/26 (Call 05/15/21)(a) | EUR | 200 | $ | 208,255 | ||||||||
SNS Bank NV, 6.25%, 10/26/20(d) | EUR | 50 | — | |||||||||
Starfruit Finco BV/Starfruit U.S. Holdco LLC, 6.50%, 10/01/26 (Call 10/01/21)(a) | EUR | 100 | 110,570 | |||||||||
United Group BV | ||||||||||||
4.38%, 07/01/22 (Call 07/01/19)(a) | EUR | 200 | 233,304 | |||||||||
4.88%, 07/01/24 (Call 07/01/20)(a) | EUR | 100 | 116,826 | |||||||||
UPC Holding BV, 3.88%, 06/15/29 (Call 06/15/22)(a) | EUR | 200 | 217,340 | |||||||||
UPCB Finance IV Ltd., 4.00%, 01/15/27 (Call 01/15/21)(a) | EUR | 90 | 105,522 | |||||||||
UPCB Finance VII Ltd., 3.63%, 06/15/29 (Call 06/15/22)(a) | EUR | 200 | 223,571 | |||||||||
Ziggo Bond Co. BV | ||||||||||||
4.63%, 01/15/25 (Call 01/15/20)(a) | EUR | 200 | 221,948 | |||||||||
7.13%, 05/15/24 (Call 05/15/19)(a) | EUR | 200 | 240,833 | |||||||||
Ziggo BV | ||||||||||||
3.75%, 01/15/25 (Call 01/15/20)(a) | EUR | 100 | 113,129 | |||||||||
4.25%, 01/15/27 (Call 01/15/22)(a) | EUR | 200 | 224,299 | |||||||||
|
| |||||||||||
| 3,277,585 | ||||||||||||
Portugal — 0.9% | ||||||||||||
Banco Comercial Portugues SA, 4.50%, 12/07/27 | EUR | 100 | 107,573 | |||||||||
Caixa Geral de Depositos SA, 5.75%, 06/28/28 | EUR | 100 | 116,814 | |||||||||
EDP - Energias de Portugal SA, 5.38%, 09/16/75 | EUR | 200 | 242,337 | |||||||||
Novo Banco SA, 8.50%, 07/06/28 (Call 07/06/23)(a)(e)(f) | EUR | 100 | 114,487 | |||||||||
|
| |||||||||||
| 581,211 | ||||||||||||
Singapore — 0.5% | ||||||||||||
Lincoln Finance Ltd., 6.88%, 04/15/21 (Call 04/15/19)(a) | EUR | 300 | 350,745 | |||||||||
|
| |||||||||||
Spain — 4.1% | ||||||||||||
Banco de Credito Social Cooperativo SA, 7.75%, 06/07/27 (Call 06/07/22)(a)(e)(f) | EUR | 100 | 103,928 | |||||||||
Banco de Sabadell SA | ||||||||||||
5.63%, 05/06/26(a) | EUR | 100 | 122,295 | |||||||||
6.25%, 04/26/20 | EUR | 150 | 181,891 | |||||||||
Bankia SA, 3.38%, 03/15/27 (Call 03/15/22)(a)(e)(f) | EUR | 100 | 115,906 | |||||||||
Bankinter SA, 2.50%, 04/06/27 (Call 04/06/22)(a)(e)(f) | EUR | 100 | 113,748 | |||||||||
Cellnex Telecom SA | ||||||||||||
2.38%, 01/16/24 (Call 10/16/23)(a) | EUR | 200 | 228,318 | |||||||||
2.88%, 04/18/25 (Call 01/18/25)(a) | EUR | 100 | 115,735 | |||||||||
3.13%, 07/27/22(a) | EUR | 200 | 240,860 | |||||||||
Distribuidora Internacional de Alimentacion SA, 0.88%, | EUR | 100 | 77,037 | |||||||||
El Corte Ingles SA, 3.00%, | EUR | 100 | 113,595 | |||||||||
Gestamp Automocion SA, 3.25%, 04/30/26 (Call 04/30/21)(a) | EUR | 200 | 214,185 | |||||||||
Grifols SA, 3.20%, 05/01/25 (Call 05/01/20)(a) | EUR | 300 | 341,138 | |||||||||
Grupo Isolux Corsan SA, Series B, 3.00%, 12/30/21 (Call 12/12/18)(c) | EUR | 141 | 2,391 | |||||||||
Ibercaja Banco SA, 5.00%, 07/28/25 (Call 07/28/20)(a)(e)(f) | EUR | 100 | 115,738 | |||||||||
LHMC Finco Sarl, 6.25%, 12/20/23 (Call 06/20/20)(a) | EUR | 200 | 234,038 | |||||||||
Liberbank SA, 6.88%, 03/14/27 (Call 03/14/22)(a)(e)(f) | EUR | 100 | 120,691 | |||||||||
Repsol International Finance BV, 4.50%, 03/25/75 | EUR | 225 | 271,100 | |||||||||
|
| |||||||||||
| 2,712,594 | ||||||||||||
Sweden — 3.4% | ||||||||||||
Akelius Residential Property AB, 3.88%, 10/05/78 | EUR | 100 | 112,075 | |||||||||
Fastighets AB Balder, 3.00%, 03/07/78 (Call 03/07/23)(a)(e)(f) | EUR | 100 | 108,643 | |||||||||
| 26 | 2 0 1 8 I S H A R E S A N N U A L R E P O R T T O S H A R E H O L D E R S |
Schedule of Investments (continued)
October 31, 2018 | iShares® International High Yield Bond ETF
(Percentages shown are based on Net Assets) |
| Security | Par (000) | Value | ||||||||||
Sweden (continued) | ||||||||||||
Intrum AB | ||||||||||||
2.75%, 07/15/22 (Call 07/15/19)(a) | EUR | 500 | $ | 552,319 | ||||||||
3.13%, 07/15/24 (Call 07/15/20)(a) | EUR | 200 | 212,066 | |||||||||
Telefonaktiebolaget LM Ericsson | ||||||||||||
0.88%, 03/01/21(a) | EUR | 200 | 228,275 | |||||||||
Series 7Y, 1.88%, 03/01/24(a) | EUR | 100 | 112,373 | |||||||||
Verisure Holding AB, 6.00%, 11/01/22 (Call 11/01/18)(a) | EUR | 180 | 209,881 | |||||||||
Verisure Midholding AB, 5.75%, 12/01/23 (Call 12/01/19)(a) | EUR | 300 | 342,694 | |||||||||
Volvo Car AB | ||||||||||||
2.00%, 01/24/25 (Call 10/24/24)(a) | EUR | 200 | 213,344 | |||||||||
3.25%, 05/18/21(a) | EUR | 100 | 119,371 | |||||||||
|
| |||||||||||
| 2,211,041 | ||||||||||||
Switzerland — 0.7% | ||||||||||||
Dufry Finance SCA, 4.50%, 08/01/23 (Call 08/01/19)(a) | EUR | 200 | 233,949 | |||||||||
Dufry One BV, 2.50%, 10/15/24 (Call 10/15/20)(a) | EUR | 200 | 219,974 | |||||||||
|
| |||||||||||
| 453,923 | ||||||||||||
United Kingdom — 7.9% | ||||||||||||
Algeco Global Finance PLC, 6.50%, 02/15/23 (Call 02/15/20)(a) | EUR | 200 | 234,004 | |||||||||
Ardonagh Midco 3 PLC, 8.38%, 07/15/23 (Call 07/15/20)(a) | GBP | 100 | 119,059 | |||||||||
Arqiva Broadcast Finance PLC, 6.75%, 09/30/23 (Call 09/30/20)(a) | GBP | 150 | 196,513 | |||||||||
Arrow Global Finance PLC, 5.13%, 09/15/24 (Call 09/15/19)(a) | GBP | 100 | 119,619 | |||||||||
Boparan Finance PLC | ||||||||||||
4.38%, 07/15/21 (Call 01/15/19)(a) | EUR | 100 | 99,637 | |||||||||
5.50%, 07/15/21 (Call 07/15/19)(a) | GBP | 100 | 111,535 | |||||||||
Cabot Financial Luxembourg SA, 7.50%, 10/01/23 (Call 10/01/19)(a) | GBP | 100 | 126,915 | |||||||||
Fiat Chrysler Automobiles NV, 3.75%, 03/29/24(a) | EUR | 400 | 483,584 | |||||||||
Heathrow Finance PLC, 3.88%, 03/01/27(a) | GBP | 100 | 118,731 | |||||||||
INEOS Finance PLC, 4.00%, 05/01/23 (Call 05/01/19)(a) | EUR | 200 | 230,820 | |||||||||
Jaguar Land Rover Automotive PLC | ||||||||||||
2.20%, 01/15/24(a) | EUR | 150 | 154,096 | |||||||||
2.75%, 01/24/21(a) | GBP | 200 | 242,884 | |||||||||
3.88%, 03/01/23(a) | GBP | 100 | 117,554 | |||||||||
4.50%, 01/15/26(a) | EUR | 150 | 157,775 | |||||||||
Merlin Entertainments PLC, 2.75%, 03/15/22 (Call 12/15/21)(a) | EUR | 150 | 176,134 | |||||||||
New Look Secured Issuer PLC, 6.50%, 07/01/22 (Call 06/24/19)(a) | GBP | 200 | 126,033 | |||||||||
Tesco Corporate Treasury Services PLC | ||||||||||||
1.38%, 10/24/23 (Call 07/24/23)(a) | EUR | 100 | 112,497 | |||||||||
2.50%, 07/01/24(a) | EUR | 200 | 237,136 | |||||||||
Tesco PLC, 6.13%, 02/24/22 | GBP | 150 | 216,372 | |||||||||
Thomas Cook Finance 2 PLC, 3.88%, 07/15/23 (Call 01/15/20)(a) | EUR | 100 | 100,422 | |||||||||
Thomas Cook Group PLC, 6.25%, 06/15/22 (Call 06/15/19)(a) | EUR | 200 | 224,442 | |||||||||
Virgin Media Finance PLC | ||||||||||||
4.50%, 01/15/25 (Call 01/15/20)(a) | EUR | 100 | 114,599 | |||||||||
6.38%, 10/15/24 (Call 09/26/19)(a) | GBP | 100 | 131,812 | |||||||||
Virgin Media Receivables Financing Notes I DAC, 5.50%, 09/15/24 (Call 09/15/19)(a) | GBP | 200 | 253,729 | |||||||||
Virgin Media Secured Finance PLC | ||||||||||||
4.88%, 01/15/27 (Call 01/15/21)(a) | GBP | 100 | 124,457 | |||||||||
5.00%, 04/15/27 (Call 04/15/22)(a) | GBP | 200 | 251,399 | |||||||||
5.13%, 01/15/25 (Call 01/15/20)(a) | GBP | 200 | 259,657 | |||||||||
5.50%, 01/15/25 (Call 01/15/19)(a) | GBP | 90 | 117,268 | |||||||||
| Security | Par (000) | Value | ||||||||||
United Kingdom (continued) | ||||||||||||
6.00%, 01/15/25 | GBP | 100 | $ | 143,691 | ||||||||
6.25%, 03/28/29 (Call 01/15/21)(a) | GBP | 100 | 132,292 | |||||||||
|
| |||||||||||
| 5,234,666 | ||||||||||||
United States — 16.4% | ||||||||||||
Adient Global Holdings Ltd., 3.50%, 08/15/24 (Call 05/15/24)(a) | EUR | 300 | 296,176 | |||||||||
AMC Entertainment Holdings Inc., 6.38%, 11/15/24 (Call 11/15/19) | GBP | 100 | 127,824 | |||||||||
Aramark International Finance Sarl, 3.13%, 04/01/25 (Call 04/01/20)(a) | EUR | 100 | 117,077 | |||||||||
Avantor Inc., 4.75%, 10/01/24 (Call 10/01/20)(a) | EUR | 100 | 115,172 | |||||||||
Avis Budget Finance PLC | ||||||||||||
4.50%, 05/15/25 (Call 05/15/20)(a) | EUR | 100 | 113,372 | |||||||||
4.75%, 01/30/26 (Call 09/30/21)(a) | EUR | 100 | 109,761 | |||||||||
Axalta Coating Systems Dutch Holding B BV, 3.75%, 01/15/25 (Call 01/15/20)(a) | EUR | 200 | 223,019 | |||||||||
Ball Corp. | ||||||||||||
3.50%, 12/15/20 | EUR | 100 | 119,893 | |||||||||
4.38%, 12/15/23 | EUR | 200 | 252,433 | |||||||||
Banff Merger Sub Inc., 8.38%, 09/01/26 (Call 09/01/21)(a) | EUR | 100 | 112,025 | |||||||||
Bausch Health Companies Inc., 4.50%, 05/15/23 (Call 05/15/19)(a) | EUR | 400 | 438,380 | |||||||||
Belden Inc. | ||||||||||||
3.38%, 07/15/27 (Call 07/15/22)(a) | EUR | 100 | 108,424 | |||||||||
3.88%, 03/15/28 (Call 03/06/23)(a) | EUR | 150 | 163,921 | |||||||||
BWAY Holding Co., 4.75%, 04/15/24 (Call 04/15/20)(a) | EUR | 100 | 114,014 | |||||||||
Ceva Logistics Finance BV, 5.25%, 08/01/25 (Call 08/01/21)(a) | EUR | 100 | 113,810 | |||||||||
Chemours Co. (The), 4.00%, 05/15/26 (Call 05/15/21) | EUR | 150 | 162,817 | |||||||||
Coty Inc. | ||||||||||||
4.00%, 04/15/23 (Call 04/15/20)(a) | EUR | 100 | 110,244 | |||||||||
4.75%, 04/15/26 (Call 04/15/21)(a) | EUR | 100 | 106,538 | |||||||||
Crown European Holdings SA | ||||||||||||
2.25%, 02/01/23 (Call 11/01/22)(a) | EUR | 100 | 115,007 | |||||||||
2.63%, 09/30/24 (Call 03/30/24)(a) | EUR | 125 | 142,656 | |||||||||
2.88%, 02/01/26 (Call 08/01/25)(a) | EUR | 100 | 110,785 | |||||||||
3.38%, 05/15/25 (Call 11/15/24)(a) | EUR | 200 | 232,129 | |||||||||
4.00%, 07/15/22 (Call 04/15/22)(a) | EUR | 200 | 249,182 | |||||||||
Darling Global Finance BV, 3.63%, 05/15/26 (Call 05/15/21)(a) | EUR | 100 | 114,769 | |||||||||
Energizer Gamma Acquisition BV, 4.63%, 07/15/26 (Call 07/15/21)(a) | EUR | 200 | 231,850 | |||||||||
Equinix Inc. | ||||||||||||
2.88%, 03/15/24 (Call 09/15/20) | EUR | 200 | 229,201 | |||||||||
2.88%, 10/01/25 (Call 10/01/20) | EUR | 300 | 332,346 | |||||||||
2.88%, 02/01/26 (Call 02/01/21) | EUR | 300 | 331,305 | |||||||||
Goodyear Dunlop Tires Europe BV, 3.75%, 12/15/23 (Call 12/15/18)(a) | EUR | 100 | 113,930 | |||||||||
Hanesbrands Finance Luxembourg SCA, 3.50%, 06/15/24 (Call 03/15/24)(a) | EUR | 100 | 117,144 | |||||||||
Hertz Holdings Netherlands BV, 5.50%, 03/30/23 (Call 03/30/20)(a) | EUR | 100 | 113,245 | |||||||||
Huntsman International LLC | ||||||||||||
4.25%, 04/01/25 (Call 01/01/25) | EUR | 100 | 126,182 | |||||||||
5.13%, 04/15/21 (Call 01/15/21) | EUR | 100 | 122,899 | |||||||||
Infor U.S. Inc., 5.75%, 05/15/22 (Call 05/15/19) | EUR | 100 | 116,265 | |||||||||
International Game Technology PLC | ||||||||||||
3.50%, 07/15/24 (Call 01/15/24)(a) | EUR | 125 | 141,686 | |||||||||
4.75%, 03/05/20(a) | EUR | 100 | 118,954 | |||||||||
S C H E D U L E O F I N V E S T M E N T S | 27 |
Schedule of Investments (continued)
October 31, 2018 | iShares® International High Yield Bond ETF
(Percentages shown are based on Net Assets)
|
| Security | Par (000) | Value | ||||||||||
United States (continued) | ||||||||||||
IQVIA Inc. | ||||||||||||
2.88%, 09/15/25 | EUR | 100 | $ | 110,514 | ||||||||
3.25%, 03/15/25 | EUR | 350 | 400,856 | |||||||||
3.50%, 10/15/24 | EUR | 200 | 232,505 | |||||||||
Iron Mountain UK PLC, 3.88%, 11/15/25 (Call 11/15/20)(a) | GBP | 200 | 240,825 | |||||||||
Levi Strauss & Co., 3.38%, 03/15/27 (Call 03/15/22) | EUR | 100 | 114,767 | |||||||||
LKQ European Holdings BV | ||||||||||||
3.63%, 04/01/26 | EUR | 100 | 111,314 | |||||||||
4.13%, 04/01/28 | EUR | 100 | 110,249 | |||||||||
LKQ Italia Bondco SpA, 3.88%, 04/01/24 (Call 01/01/24)(a) | EUR | 200 | 234,871 | |||||||||
MPT Operating Partnership LP/MPT Finance Corp. | ||||||||||||
3.33%, 03/24/25 (Call 12/24/24) | EUR | 100 | 115,548 | |||||||||
4.00%, 08/19/22 (Call 05/19/22) | EUR | 200 | 247,184 | |||||||||
Netflix Inc. | ||||||||||||
3.63%, 05/15/27 | EUR | 350 | 392,106 | |||||||||
4.63%, 05/15/29(a) | EUR | 165 | 187,132 | |||||||||
OI European Group BV | ||||||||||||
3.13%, 11/15/24 | EUR | 200 | 229,822 | |||||||||
4.88%, 03/31/21(a) | EUR | 100 | 123,834 | |||||||||
6.75%, 09/15/20(a) | EUR | 100 | 125,793 | |||||||||
PSPC Escrow Corp., 6.00%, 02/01/23 (Call 02/01/19)(a) | EUR | 100 | 117,346 | |||||||||
PVH Corp. | ||||||||||||
3.13%, 12/15/27(a) | EUR | 150 | 165,836 | |||||||||
3.63%, 07/15/24 | EUR | 125 | 153,198 | |||||||||
Refinitiv U.S. Holdings Inc. | ||||||||||||
4.50%, 05/15/26 | EUR | 250 | 283,104 | |||||||||
6.88%, 11/15/26 | EUR | 100 | 112,457 | |||||||||
Scientific Games International Inc., 5.50%, 02/15/26 | EUR | 100 | 97,653 | |||||||||
Sealed Air Corp., 4.50%, 09/15/23 (Call 06/15/23)(a) | EUR | 100 | 125,357 | |||||||||
Silgan Holdings Inc., 3.25%, 03/15/25 (Call 03/15/20) | EUR | 200 | 231,201 | |||||||||
Spectrum Brands Inc., 4.00%, 10/01/26 (Call 10/01/21)(a) | EUR | 100 | 113,894 | |||||||||
Tenneco Inc. | ||||||||||||
4.88%, 04/15/22 | EUR | 125 | 145,680 | |||||||||
5.00%, 07/15/24 | EUR | 100 | 119,003 | |||||||||
Vantiv LLC/Vanity Issuer Corp., 3.88%, 11/15/25 | GBP | 100 | 124,389 | |||||||||
WMG Acquisition Corp., 4.13%, 11/01/24 (Call 11/01/19)(a) | EUR | 90 | 105,938 | |||||||||
|
| |||||||||||
| 10,836,811 | ||||||||||||
|
| |||||||||||
Total Corporate Bonds & Notes — 97.6% |
| 64,283,656 | ||||||||||
|
| |||||||||||
| Security | Shares (000) | Value | ||||||||||
| Common Stocks | ||||||||||||
South Africa — 0.0% | ||||||||||||
Sentry Holdings Ltd. Class A(d) | 0 | (h) | $ | — | ||||||||
|
| |||||||||||
Total Common Stocks — 0.0% | — | |||||||||||
|
| |||||||||||
| Short-Term Investments | ||||||||||||
Money Market Funds — 0.0% | ||||||||||||
BlackRock Cash Funds: Treasury, SL Agency Shares, 2.11%(i)(j) | 13 | 12,873 | ||||||||||
|
| |||||||||||
Total Short-Term Investments — 0.0% |
| 12,873 | ||||||||||
|
| |||||||||||
Total Investments in Securities — 97.6% |
| 64,296,529 | ||||||||||
Other Assets, Less Liabilities — 2.4% |
| 1,561,236 | ||||||||||
|
| |||||||||||
Net Assets — 100.0% | $ | 65,857,765 | ||||||||||
|
| |||||||||||
| (a) | This security may be resold to qualified foreign investors and foreign institutional buyers under Regulation S of the Securities Act of 1933. |
| (b) | Security exempt from registration pursuant to Rule 144A under the Securities Act of 1933, as amended. These securities may be resold in transactions exempt from registration to qualified institutional investors. |
| (c) | Issuer is in default of interest payments. |
| (d) | Security is valued using significant unobservable inputs and is classified as Level 3 in the fair value hierarchy. |
| (e) | Security is issued at a fixed coupon rate, which converts to a variable rate at a specified date. Reference index and spread are provided if the rate is currently floating. |
| (f) | Variable or floating rate security. Rate shown is the rate in effect as of period-end. |
| (g) | Step coupon security. Coupon rate will either increase (step-up bond) or decrease (step-down bond) at regular intervals until maturity. Interest rate shown reflects the rate currently in effect. |
| (h) | Rounds to less than 1,000. |
| (i) | Affiliate of the Fund. |
| (j) | Annualized 7-day yield as of period-end. |
Affiliates
Investments in issuers considered to be affiliates of the Fund during the year ended October 31, 2018, for purposes of Section 2(a)(3) of the 1940 Act, were as follows:
| Affiliated Issuer | | Shares Held at 10/31/17 (000) | | | Net Activity (000) | | | Shares Held at 10/31/18 (000) | | | Value at 10/31/18 | | Income | | Net Realized Gain (Loss) | (a) | | Change in Unrealized Appreciation (Depreciation) | | |||||||||
BlackRock Cash Funds: Treasury, SL Agency Shares | 1 | 12 | 13 | $ | 12,873 | $ | 355 | $ | — | $ | — | |||||||||||||||||
|
|
|
|
|
|
|
|
| (a) | Includes realized capital gain distributions from an affiliated fund, if any. |
Fair Value Measurements
Various inputs are used in determining the fair value of financial instruments. For description of the input levels and information about the Fund’s policy regarding valuation of financial instruments, refer to the Notes to Financial Statements.
| 28 | 2 0 1 8 I S H A R E S A N N U A L R E P O R T T O S H A R E H O L D E R S |
Schedule of Investments (continued)
October 31, 2018 | iShares® International High Yield Bond ETF
|
Fair Value Measurements (continued)
The following table summarizes the value of the Fund’s investments according to the fair value hierarchy as of October 31, 2018. The breakdown of the Fund’s investments into major categories is disclosed in the Schedule of Investments above.
| Level 1 | Level 2 | Level 3 | Total | |||||||||||||
Investments | ||||||||||||||||
Assets | ||||||||||||||||
Corporate Bonds & Notes | $ | — | $ | 64,283,651 | $ | 5 | $ | 64,283,656 | ||||||||
Common Stocks | — | — | — | — | ||||||||||||
Money Market Funds | 12,873 | — | — | 12,873 | ||||||||||||
|
|
|
|
|
|
|
| |||||||||
| $ | 12,873 | $ | 64,283,651 | $ | 5 | $ | 64,296,529 | |||||||||
|
|
|
|
|
|
|
| |||||||||
See notes to financial statements.
S C H E D U L E O F I N V E S T M E N T S | 29 |
Schedule of Investments
October 31, 2018 | iShares® J.P. Morgan EM Corporate Bond ETF
(Percentages shown are based on Net Assets) |
| Security | Par (000) | Value | ||||||
| Corporate Bonds & Notes | ||||||||
Argentina — 2.7% | ||||||||
Adecoagro SA, 6.00%, 09/21/27(a) | $ | 150 | $ | 130,500 | ||||
Cablevision SA, 6.50%, 06/15/21 (Call 06/15/19)(a)(b) | 300 | 293,250 | ||||||
Pampa Energia SA | ||||||||
7.38%, 07/21/23 (Call 07/21/20)(a) | 100 | 92,125 | ||||||
7.50%, 01/24/27 (Call 01/24/22)(a) | 150 | 129,750 | ||||||
Rio Energy SA/UGEN SA/UENSA SA, 6.88%, 02/01/25 (Call 01/02/22)(a) | 150 | 117,562 | ||||||
Stoneway Capital Corp., 10.00%, 03/01/27 (Call 03/01/22)(a)(b) | 145 | 133,883 | ||||||
Transportadora de Gas del Sur SA, 6.75%, 05/02/25 (Call 05/02/22)(a) | 150 | 140,250 | ||||||
YPF SA | ||||||||
6.95%, 07/21/27(a) | 100 | 84,750 | ||||||
7.00%, 12/15/47 (Call 06/15/47)(a)(b) | 200 | 151,260 | ||||||
8.50%, 03/23/21(a) | 200 | 201,250 | ||||||
8.50%, 07/28/25(a) | 250 | 237,394 | ||||||
8.75%, 04/04/24(a) | 230 | 226,262 | ||||||
|
| |||||||
| 1,938,236 | ||||||||
Brazil — 7.7% | ||||||||
Banco Bradesco SA/Cayman Islands, 5.75%, 03/01/22(a)(b) | 200 | 204,700 | ||||||
Banco BTG Pactual SA/Cayman Islands, 5.50%, 01/31/23(a) | 200 | 192,750 | ||||||
Banco do Brasil SA/Cayman Islands | ||||||||
4.63%, 01/15/25(a) | 200 | 188,240 | ||||||
5.88%, 01/19/23(a) | 200 | 203,120 | ||||||
9.25%, (Call 04/15/23)(a)(c)(d)(e) | 200 | 214,000 | ||||||
Braskem Netherlands Finance BV, 4.50%, 01/10/28(a) | 200 | 185,800 | ||||||
BRF SA, 3.95%, 05/22/23(a)(b) | 200 | 180,500 | ||||||
CSN Islands XII Corp., 7.00%, (Call 12/23/18)(a)(c) | 100 | 74,375 | ||||||
Embraer Netherlands Finance BV | ||||||||
5.05%, 06/15/25 | 100 | 102,750 | ||||||
5.40%, 02/01/27(b) | 150 | 154,687 | ||||||
Fibria Overseas Finance Ltd., 5.25%, 05/12/24 | 50 | 50,750 | ||||||
Gol Finance Inc., 7.00%, 01/31/25 (Call 01/31/22)(a) | 50 | 43,316 | ||||||
GTL Trade Finance Inc./Gerdau Holdings Inc., 5.89%, 04/29/24 (Call 01/29/24)(a) | 150 | 152,812 | ||||||
Itau Unibanco Holding SA/Cayman Islands | ||||||||
5.13%, 05/13/23(a)(b) | 200 | 200,050 | ||||||
5.65%, 03/19/22(a)(b) | 200 | 203,500 | ||||||
JBS USA LUX SA/JBS USA Finance Inc. | ||||||||
5.88%, 07/15/24 (Call 07/15/19)(a) | 75 | 73,613 | ||||||
7.25%, 06/01/21 (Call 06/01/19)(a) | 100 | 101,234 | ||||||
Marfrig Holdings Europe BV, 8.00%, 06/08/23 (Call 06/08/19)(a) | 200 | 202,350 | ||||||
Minerva Luxembourg SA, 6.50%, 09/20/26 (Call 09/20/21)(a) | 200 | 183,780 | ||||||
Odebrecht Finance Ltd., | 200 | 31,000 | ||||||
Oi SA, 10.00%, 07/27/25(f) | 100 | 105,000 | ||||||
Petrobras Global Finance BV | ||||||||
4.38%, 05/20/23 | 100 | 96,900 | ||||||
5.30%, 01/27/25 | 158 | 150,258 | ||||||
5.63%, 05/20/43 | 150 | 124,125 | ||||||
6.00%, 01/27/28 | 125 | 118,344 | ||||||
6.13%, 01/17/22 | 134 | 138,831 | ||||||
6.25%, 03/17/24 | 225 | 227,306 | ||||||
6.75%, 01/27/41 | 100 | 93,990 | ||||||
6.85%, 06/05/15 | 100 | 88,500 | ||||||
6.88%, 01/20/40 | 48 | 45,353 | ||||||
7.25%, 03/17/44 | 150 | 144,750 | ||||||
7.38%, 01/17/27 | 250 | 257,525 | ||||||
8.38%, 05/23/21 | 153 | 166,808 | ||||||
| Security | Par (000) | Value | ||||||
Brazil (continued) | ||||||||
St. Marys Cement Inc. Canada, 5.75%, 01/28/27 (Call 10/28/26)(a) | $ | 200 | $ | 198,000 | ||||
Vale Overseas Ltd. | ||||||||
6.25%, 08/10/26 | 200 | 213,754 | ||||||
6.88%, 11/10/39 | 200 | 224,500 | ||||||
8.25%, 01/17/34 | 125 | 153,281 | ||||||
|
| |||||||
| 5,490,552 | ||||||||
Chile — 3.9% | ||||||||
Banco de Credito e Inversiones SA, 3.50%, 10/12/27(a) | 200 | 179,000 | ||||||
Celulosa Arauco y Constitucion SA, 4.50%, 08/01/24 (Call 05/01/24) | 200 | 197,250 | ||||||
Cencosud SA | ||||||||
4.38%, 07/17/27 (Call 04/17/27)(a) | 200 | 176,250 | ||||||
5.15%, 02/12/25 (Call 11/12/24)(a) | 200 | 194,440 | ||||||
Colbun SA, 4.50%, 07/10/24 | 200 | 196,750 | ||||||
Empresa Nacional de Telecomunicaciones SA | ||||||||
4.75%, 08/01/26 (Call 05/03/26)(a) | 200 | 185,750 | ||||||
4.88%, 10/30/24(a) | 200 | 191,750 | ||||||
Enel Americas SA, 4.00%, 10/25/26 (Call 07/25/26) | 300 | 280,125 | ||||||
Enel Chile SA, 4.88%, 06/12/28(b) | 200 | 196,500 | ||||||
GNL Quintero SA, 4.63%, 07/31/29(a) | 200 | 193,250 | ||||||
Inversiones CMPC SA/Cayman Islands Branch, 4.38%, 05/15/23 | 400 | 395,000 | ||||||
Latam Finance Ltd., 6.88%, 04/11/24 (Call 04/11/21)(a) | 200 | 194,000 | ||||||
VTR Finance BV, 6.88%, 01/15/24 (Call 01/15/19)(a) | 200 | 202,000 | ||||||
|
| |||||||
| 2,782,065 | ||||||||
China — 9.0% | ||||||||
Alibaba Group Holding Ltd. | ||||||||
3.40%, 12/06/27 (Call 09/06/27) | 300 | 273,526 | ||||||
4.00%, 12/06/37 (Call 06/06/37) | 200 | 175,952 | ||||||
Azure Nova International Finance Ltd., 3.50%, 03/21/22(a) | 200 | 194,322 | ||||||
Baidu Inc., 4.13%, 06/30/25 | 200 | 195,626 | ||||||
Bank of China Ltd./Hong Kong, 3.88%, 06/30/25(a) | 200 | 194,751 | ||||||
Bank of China Ltd./Macau, 2.88%, | 200 | 193,562 | ||||||
Bank of Communications Co. Ltd., 4.50%, 10/03/24 (Call 10/03/19)(a)(d)(e) | 200 | 200,052 | ||||||
China Cinda Finance 2015 I Ltd., 4.25%, 04/23/25(a) | 400 | 383,499 | ||||||
China CITIC Bank Corp. Ltd., 3.33%, 12/14/22, (3 mo. LIBOR US + | 200 | 200,054 | ||||||
China Construction Bank Corp., 3.88%, 05/13/25 (Call 05/13/20)(a)(d)(e) | 200 | 197,916 | ||||||
China Evergrande Group, 8.75%, 06/28/25 (Call 06/28/21)(a) | 200 | 156,750 | ||||||
China Overseas Finance Cayman VI Ltd., 5.95%, 05/08/24(a) | 200 | 212,163 | ||||||
CITIC Ltd. | ||||||||
3.13%, 02/28/22(a) | 200 | 193,174 | ||||||
6.63%, 04/15/21(a) | 100 | 105,434 | ||||||
CMBLEMTN 1 Ltd., 3.25%, 11/29/21(a) | 200 | 193,186 | ||||||
CNOOC Finance 2012 Ltd., 3.88%, 05/02/22(a) | 200 | 199,515 | ||||||
CNOOC Nexen Finance 2014 ULC, 4.25%, 04/30/24 | 200 | 200,293 | ||||||
CNPC General Capital Ltd., 3.40%, 04/16/23(a) | 200 | 194,906 | ||||||
Country Garden Holdings Co. Ltd., 4.75%, 07/25/22 (Call 07/25/20)(a) | 200 | 171,750 | ||||||
Fortune Star BVI Ltd., 5.25%, 03/23/22 (Call 03/23/20)(a) | 200 | 179,861 | ||||||
Huarong Finance 2017 Co. Ltd. | ||||||||
4.50%, (Call 01/24/22)(a)(c)(d)(e) | 200 | 185,750 | ||||||
4.75%, 04/27/27(a) | 200 | 184,162 | ||||||
Huarong Finance II Co. Ltd., 5.50%, 01/16/25(a) | 200 | 198,024 | ||||||
ICBCIL Finance Co. Ltd., 2.50%, | 200 | 190,059 | ||||||
| 30 | 2 0 1 8 I S H A R E S A N N U A L R E P O R T T O S H A R E H O L D E R S |
Schedule of Investments (continued)
October 31, 2018 | iShares® J.P. Morgan EM Corporate Bond ETF
(Percentages shown are based on Net Assets) |
| Security | Par (000) | Value | ||||||
China (continued) | ||||||||
Industrial & Commercial Bank of China Ltd./Singapore, 3.44%, 04/24/22, (3 mo. LIBOR US + 0.950%)(a)(e) | $ | 400 | $ | 401,434 | ||||
JD.com Inc., 3.88%, 04/29/26 | 200 | 177,922 | ||||||
Kaisa Group Holdings Ltd., 8.50%, 06/30/22 (Call 06/30/20)(a) | 200 | 140,967 | ||||||
Nexen Energy ULC, 7.50%, 07/30/39 | 100 | 133,040 | ||||||
Proven Honour Capital Ltd., 4.13%, 05/19/25(a) | 200 | 185,172 | ||||||
Shimao Property Holdings Ltd., 4.75%, 07/03/22 (Call 07/03/20)(a) | 200 | 176,250 | ||||||
Sino-Ocean Land Treasure Finance II Ltd., 5.95%, 02/04/27(a) | 200 | 187,500 | ||||||
Tencent Holdings Ltd., 3.60%, 01/19/28 (Call 10/19/27)(a) | 300 | 275,048 | ||||||
|
| |||||||
| 6,451,620 | ||||||||
Colombia — 4.9% | ||||||||
Banco de Bogota SA | ||||||||
4.38%, 08/03/27(a) | 200 | 186,500 | ||||||
5.38%, 02/19/23(a) | 200 | 200,000 | ||||||
Bancolombia SA | ||||||||
4.88%, 10/18/27 (Call 10/18/22)(d)(e) | 200 | 191,830 | ||||||
5.13%, 09/11/22 | 87 | 87,544 | ||||||
5.95%, 06/03/21 | 300 | 310,500 | ||||||
Colombia Telecomunicaciones SA ESP | ||||||||
5.38%, 09/27/22 (Call 09/27/19)(a) | 200 | 199,150 | ||||||
8.50%, (a)(c)(d)(e) | 100 | 102,325 | ||||||
Ecopetrol SA | ||||||||
4.13%, 01/16/25 | 200 | 190,750 | ||||||
5.38%, 06/26/26 (Call 03/26/26) | 325 | 327,340 | ||||||
5.88%, 09/18/23 | 300 | 313,650 | ||||||
5.88%, 05/28/45(b) | 400 | 380,800 | ||||||
7.38%, 09/18/43 | 100 | 111,905 | ||||||
Grupo Aval Ltd., 4.75%, 09/26/22(a) | 200 | 196,750 | ||||||
Grupo de Inversiones Suramericana SA, 5.50%, 04/29/26 (Call 01/29/26)(a) | 200 | 201,750 | ||||||
Millicom International Cellular SA, 6.00%, 03/15/25 (Call 03/15/20)(a) | 200 | 196,500 | ||||||
SURA Asset Management SA, 4.88%, 04/17/24(a)(b) | 100 | 98,225 | ||||||
Transportadora de Gas Internacional SA ESP, 5.70%, 03/20/22 (Call | 200 | 203,000 | ||||||
|
| |||||||
| 3,498,519 | ||||||||
Ghana — 0.5% | ||||||||
Tullow Oil PLC | ||||||||
6.25%, 04/15/22 (Call 04/15/19)(a) | 200 | 198,500 | ||||||
7.00%, 03/01/25 (Call 03/01/21)(a) | 200 | 195,250 | ||||||
|
| |||||||
| 393,750 | ||||||||
Guatemala — 0.3% | ||||||||
Comunicaciones Celulares SA Via Comcel Trust, 6.88%, 02/06/24 (Call 02/06/19)(a) | 200 | 204,575 | ||||||
|
| |||||||
Hong Kong — 5.3% | ||||||||
AIA Group Ltd., 4.50%, 03/16/46 (Call 09/16/45)(a) | 200 | 194,977 | ||||||
Bank of East Asia Ltd. (The), 4.00%, 11/03/26 (Call 11/03/21)(a)(d)(e) | 200 | 194,558 | ||||||
CK Hutchison International 16 Ltd., 2.75%, 10/03/26(a) | 600 | 538,580 | ||||||
HKT Capital No. 4 Ltd., 3.00%, | 200 | 179,415 | ||||||
Hongkong Electric Finance Ltd., 2.88%, 05/03/26(a) | 200 | 181,863 | ||||||
Hongkong Land Finance Cayman Islands Co. Ltd. (The), 4.50%, 06/01/22(a) | 200 | 204,171 | ||||||
Hutchison Whampoa International 11 Ltd., 4.63%, 01/13/22(a) | 400 | 409,633 | ||||||
Nanyang Commercial Bank Ltd., 5.00%, (Call 06/02/22)(a)(c)(d)(e) | 200 | 183,650 | ||||||
NWD Finance BVI Ltd., 5.75%, (Call 10/05/21)(a)(c) | 200 | 174,248 | ||||||
NWD MTN Ltd., 5.25%, 02/26/21(a) | 200 | 203,839 | ||||||
| Security | Par (000) | Value | ||||||
Hong Kong (continued) | ||||||||
OVPH Ltd., 5.88%, (Call 03/01/21)(a)(c) | $ | 200 | $ | 191,920 | ||||
PCPD Capital Ltd., 4.75%, 03/09/22(a) | 200 | 192,750 | ||||||
Radiant Access Ltd., 4.60%, (Call 05/18/20)(a)(c) | 200 | 160,750 | ||||||
Sun Hung Kai Properties Capital Market Ltd., 4.50%, 02/14/22(a) | 200 | 203,964 | ||||||
Swire Pacific MTN Financing Ltd., 4.50%, 10/09/23(a) | 200 | 203,539 | ||||||
Swire Properties MTN Financing Ltd., 3.63%, 01/13/26(a) | 200 | 191,088 | ||||||
TVB Finance Ltd., 3.63%, 10/11/21(a) | 200 | 194,750 | ||||||
|
| |||||||
| 3,803,695 | ||||||||
India — 5.1% | ||||||||
ABJA Investment Co. Pte Ltd., 5.45%, 01/24/28(a) | 200 | 171,750 | ||||||
Bharat Petroleum Corp. Ltd., 4.00%, 05/08/25(a) | 200 | 185,121 | ||||||
Bharti Airtel International Netherlands BV | ||||||||
5.13%, 03/11/23(a) | 200 | 193,584 | ||||||
5.35%, 05/20/24(a) | 200 | 192,839 | ||||||
Delhi International Airport Ltd., 6.13%, 10/31/26(a) | 200 | 195,902 | ||||||
Greenko Dutch BV, 5.25%, 07/24/24 (Call 07/24/20)(a) | 200 | 180,267 | ||||||
ICICI Bank Ltd./Dubai, 4.00%, 03/18/26(a) | 250 | 231,335 | ||||||
Indian Oil Corp. Ltd., 5.75%, 08/01/23(a) | 200 | 207,879 | ||||||
JSW Steel Ltd., 5.25%, 04/13/22(a) | 200 | 193,750 | ||||||
NTPC Ltd., 4.38%, 11/26/24(a) | 200 | 194,645 | ||||||
Oil India Ltd., 5.38%, 04/17/24(a) | 200 | 202,683 | ||||||
ONGC Videsh Ltd., 4.63%, 07/15/24(a) | 200 | 196,246 | ||||||
Reliance Holdings USA Inc., 5.40%, 02/14/22(a) | 250 | 257,395 | ||||||
Reliance Industries Ltd., 4.13%, | 500 | 481,493 | ||||||
State Bank of India/London, 4.88%, 04/17/24(a) | 200 | 201,474 | ||||||
Vedanta Resources PLC | ||||||||
7.13%, 05/31/23(a) | 200 | 187,582 | ||||||
8.25%, 06/07/21(a) | 200 | 202,629 | ||||||
|
| |||||||
| 3,676,574 | ||||||||
Indonesia — 1.8% | ||||||||
Indika Energy Capital III Pte Ltd., 5.88%, 11/09/24 (Call 11/09/21)(a) | 250 | 223,625 | ||||||
Listrindo Capital BV, 4.95%, 09/14/26 (Call 03/14/21)(a) | 200 | 177,930 | ||||||
Medco Platinum Road Pte Ltd., 6.75%, 01/30/25 (Call 01/30/22)(a) | 200 | 181,250 | ||||||
Minejesa Capital BV | ||||||||
4.63%, 08/10/30(a) | 200 | 176,717 | ||||||
5.63%, 08/10/37(a) | 200 | 176,750 | ||||||
Perusahaan Gas Negara Persero Tbk, 5.13%, 05/16/24(a) | 200 | 196,250 | ||||||
Saka Energi Indonesia PT, 4.45%, 05/05/24(a) | 200 | 184,250 | ||||||
|
| |||||||
| 1,316,772 | ||||||||
Israel — 4.7% | ||||||||
Altice Financing SA | ||||||||
6.63%, 02/15/23 (Call 02/15/19)(a) | 400 | 394,000 | ||||||
7.50%, 05/15/26 (Call 05/15/21)(a) | 400 | 376,000 | ||||||
Israel Chemicals Ltd., 6.38%, 05/31/38 (Call 11/30/37)(g) | 100 | 99,000 | ||||||
Israel Electric Corp. Ltd. | ||||||||
6.88%, 06/21/23(a) | 200 | 217,980 | ||||||
Series 6, 5.00%, 11/12/24(g) | 200 | 202,000 | ||||||
Teva Pharmaceutical Finance Co. BV | ||||||||
2.95%, 12/18/22 | 200 | 181,147 | ||||||
Series 2, 3.65%, 11/10/21 | 300 | 286,125 | ||||||
Teva Pharmaceutical Finance Co. LLC, 6.15%, 02/01/36 | 300 | 280,875 | ||||||
Teva Pharmaceutical Finance Netherlands III BV | ||||||||
2.20%, 07/21/21 | 300 | 279,750 | ||||||
2.80%, 07/21/23 | 500 | 438,933 | ||||||
S C H E D U L E O F I N V E S T M E N T S | 31 |
Schedule of Investments (continued)
October 31, 2018 | iShares® J.P. Morgan EM Corporate Bond ETF
(Percentages shown are based on Net Assets) |
| Security | Par (000) | Value | ||||||
Israel (continued) | ||||||||
3.15%, 10/01/26(b) | $ | 550 | $ | 446,187 | ||||
4.10%, 10/01/46 | 250 | 170,341 | ||||||
|
| |||||||
| 3,372,338 | ||||||||
Jamaica — 0.6% | ||||||||
Digicel Group Ltd., 7.13%, 04/01/22 (Call 04/01/19)(a) | 200 | 124,500 | ||||||
Digicel Ltd. | ||||||||
6.00%, 04/15/21 (Call 04/15/19)(a) | 200 | 181,500 | ||||||
6.75%, 03/01/23 (Call 03/01/19)(a) | 200 | 160,500 | ||||||
|
| |||||||
| 466,500 | ||||||||
Kazakhstan — 0.8% | ||||||||
Halyk Savings Bank of Kazakhstan JSC, 5.50%, 12/21/22(a) | 200 | 199,000 | ||||||
Nostrum Oil & Gas Finance BV, 8.00%, 07/25/22 (Call 07/25/19)(a) | 200 | 170,250 | ||||||
Tengizchevroil Finance Co. International Ltd., 4.00%, 08/15/26(a) | 200 | 186,500 | ||||||
|
| |||||||
| 555,750 | ||||||||
Kuwait — 1.6% | ||||||||
Burgan Senior SPC Ltd., 3.13%, 09/14/21(a) | 200 | 193,250 | ||||||
Equate Petrochemical BV | ||||||||
3.00%, 03/03/22(a) | 200 | 191,250 | ||||||
4.25%, 11/03/26(a) | 200 | 193,750 | ||||||
Kuwait Projects Co. SPC Ltd., 5.00%, 03/15/23(a) | 200 | 199,250 | ||||||
NBK SPC Ltd., 2.75%, 05/30/22(a) | 400 | 382,500 | ||||||
|
| |||||||
| 1,160,000 | ||||||||
Macau — 2.0% | ||||||||
Melco Resorts Finance Ltd., 4.88%, 06/06/25 (Call 06/06/20)(a) | 200 | 182,300 | ||||||
Sands China Ltd. | ||||||||
4.60%, 08/08/23 (Call 07/08/23)(g) | 200 | 197,525 | ||||||
5.13%, 08/08/25 (Call 06/08/25)(g) | 200 | 196,165 | ||||||
5.40%, 08/08/28 (Call 05/08/28)(g) | 200 | 191,069 | ||||||
Studio City Co. Ltd., 7.25%, 11/30/21 (Call 11/30/18)(a) | 200 | 205,000 | ||||||
Studio City Finance Ltd., 8.50%, 12/01/20 (Call 12/01/18)(a) | 250 | 249,340 | ||||||
Wynn Macau Ltd., 4.88%, 10/01/24 (Call 10/01/20)(a) | 200 | 181,003 | ||||||
|
| |||||||
| 1,402,402 | ||||||||
Malaysia — 1.3% | ||||||||
Gohl Capital Ltd., 4.25%, 01/24/27(a) | 400 | 374,745 | ||||||
Malayan Banking Bhd, 3.91%, 10/29/26 (Call 10/29/21)(a)(d)(e) | 200 | 196,775 | ||||||
RHB Bank Bhd, 2.50%, 10/06/21(a) | 200 | 191,552 | ||||||
TNB Global Ventures Capital Bhd, 3.24%, 10/19/26(a) | 200 | 181,861 | ||||||
|
| |||||||
| 944,933 | ||||||||
Mexico — 5.5% | ||||||||
Alfa SAB de CV, 5.25%, 03/25/24 (Call 12/25/23)(a)(b) | 200 | 197,500 | ||||||
America Movil SAB de CV | ||||||||
3.13%, 07/16/22 | 200 | 194,996 | ||||||
6.13%, 03/30/40(b) | 200 | 226,250 | ||||||
6.38%, 03/01/35 | 200 | 229,298 | ||||||
Banco Inbursa SA Institucion De Banca Multiple Grupo Financiero Inbursa, 4.13%, 06/06/24(a) | 150 | 141,780 | ||||||
Banco Santander Mexico SA, 4.13%, 11/09/22(a)(b) | 150 | 146,738 | ||||||
BBVA Bancomer SA/Texas | ||||||||
4.38%, 04/10/24(a) | 150 | 146,250 | ||||||
5.13%, 01/18/33 (Call | 200 | 176,000 | ||||||
6.75%, 09/30/22(a) | 150 | 157,725 | ||||||
Cemex SAB de CV | ||||||||
6.13%, 05/05/25 (Call 05/05/20)(a) | 200 | 198,690 | ||||||
7.75%, 04/16/26 (Call 04/16/21)(a)(b) | 200 | 210,000 | ||||||
Coca-Cola Femsa SAB de CV, 3.88%, 11/26/23 | 150 | 149,111 | ||||||
El Puerto de Liverpool SAB de CV, 3.88%, 10/06/26(a) | 200 | 181,500 | ||||||
| Security | Par (000) | Value | ||||||
Mexico (continued) | ||||||||
Grupo Bimbo SAB de CV | ||||||||
4.50%, 01/25/22(a) | $ | 100 | $ | 101,496 | ||||
4.88%, 06/27/44(a) | 200 | 181,750 | ||||||
Grupo Televisa SAB | ||||||||
5.00%, 05/13/45 (Call 11/13/44) | 200 | 174,400 | ||||||
6.63%, 01/15/40 | 100 | 106,500 | ||||||
Mexichem SAB de CV, 5.50%, 01/15/48 (Call 07/15/47)(a)(b) | 200 | 176,000 | ||||||
Sigma Alimentos SA de CV, 4.13%, 05/02/26 (Call 02/02/26)(a)(b) | 200 | 184,500 | ||||||
Southern Copper Corp. | ||||||||
5.25%, 11/08/42(b) | 200 | 192,500 | ||||||
5.88%, 04/23/45 | 150 | 156,118 | ||||||
7.50%, 07/27/35 | 100 | 119,125 | ||||||
Trust F/1401, 5.25%, 01/30/26 (Call 10/30/25)(a) | 200 | 195,250 | ||||||
|
| |||||||
| 3,943,477 | ||||||||
Morocco — 0.6% | ||||||||
OCP SA | ||||||||
5.63%, 04/25/24(a) | 200 | 203,500 | ||||||
6.88%, 04/25/44(a) | 200 | 208,500 | ||||||
|
| |||||||
| 412,000 | ||||||||
Nigeria — 0.6% | ||||||||
IHS Netherlands Holdco BV, 9.50%, 10/27/21 (Call 10/27/19)(a) | 200 | 201,750 | ||||||
Zenith Bank PLC, 7.38%, 05/30/22(a) | 200 | 201,000 | ||||||
|
| |||||||
| 402,750 | ||||||||
Oman — 0.7% | ||||||||
Bank Muscat SAOG, 3.75%, 05/03/21(a) | 200 | 193,500 | ||||||
Oztel Holdings SPC Ltd., 6.63%, 04/24/28(g) | 300 | 293,625 | ||||||
|
| |||||||
| 487,125 | ||||||||
Panama — 0.8% | ||||||||
Banco General SA, 4.13%, 08/07/27 (Call 05/07/27)(a) | 200 | 186,000 | ||||||
C&W Senior Financing DAC, 6.88%, 09/15/27 (Call 09/15/22)(a) | 200 | 190,760 | ||||||
Global Bank Corp., 4.50%, 10/20/21(a)(b) | 200 | 197,650 | ||||||
|
| |||||||
| 574,410 | ||||||||
Peru — 2.5% | ||||||||
Banco de Credito del Peru, 4.25%, 04/01/23(a) | 450 | 446,625 | ||||||
BBVA Banco Continental SA, 5.00%, 08/26/22(a)(b) | 150 | 153,000 | ||||||
Inkia Energy Ltd., 5.88%, 11/09/27 (Call 11/09/22)(a) | 200 | 189,250 | ||||||
Lima Metro Line 2 Finance Ltd., 5.88%, 07/05/34(a) | 200 | 201,750 | ||||||
Nexa Resources SA, 5.38%, 05/04/27 (Call 02/04/27)(a) | 200 | 193,750 | ||||||
Orazul Energy Egenor S en C por A, 5.63%, 04/28/27 (Call 04/25/22)(a) | 200 | 181,650 | ||||||
Peru LNG Srl, 5.38%, 03/22/30(a)(b) | 200 | 197,750 | ||||||
Transportadora de Gas del Peru SA, 4.25%, 04/30/28(a) | 200 | 192,750 | ||||||
|
| |||||||
| 1,756,525 | ||||||||
Philippines — 0.3% | ||||||||
JGSH Philippines Ltd., 4.38%, 01/23/23(a) | 200 | 197,312 | ||||||
|
| |||||||
Poland — 0.3% | ||||||||
Powszechna Kasa Oszczednosci Bank Polski SA Via PKO Finance AB, 4.63%, 09/26/22(a) | 200 | 202,750 | ||||||
|
| |||||||
Qatar — 2.5% | ||||||||
ABQ Finance Ltd., 3.50%, 02/22/22(a) | 200 | 193,750 | ||||||
CBQ Finance Ltd., 3.25%, 06/13/21(a) | 200 | 194,000 | ||||||
Nakilat Inc., 6.07%, 12/31/33(a) | 200 | 218,500 | ||||||
Ooredoo International Finance Ltd. | ||||||||
3.25%, 02/21/23(a) | 350 | 332,938 | ||||||
3.88%, 01/31/28(a) | 200 | 187,500 | ||||||
5.00%, 10/19/25(a) | 200 | 203,750 | ||||||
| 32 | 2 0 1 8 I S H A R E S A N N U A L R E P O R T T O S H A R E H O L D E R S |
Schedule of Investments (continued)
October 31, 2018 | iShares® J.P. Morgan EM Corporate Bond ETF
(Percentages shown are based on Net Assets) |
| Security | Par (000) | Value | ||||||
Qatar (continued) | ||||||||
QNB Finance Ltd., 2.13%, 09/07/21(a) | $ | 200 | $ | 189,300 | ||||
Ras Laffan Liquefied Natural Gas Co. Ltd. III, 5.84%, 09/30/27(a) | 250 | 270,000 | ||||||
|
| |||||||
| 1,789,738 | ||||||||
Russia — 5.9% | ||||||||
Alfa Bank AO Via Alfa Bond Issuance PLC, 8.00%, (Call 02/03/22)(a)(c)(d)(e) | 200 | 185,750 | ||||||
Credit Bank of Moscow Via CBOM Finance PLC, 7.50%, 10/05/27 (Call 10/05/22)(a)(d)(e) | 200 | 150,750 | ||||||
Evraz Group SA, 8.25%, 01/28/21(a) | 200 | 211,000 | ||||||
Gazprom Neft OAO Via GPN Capital SA, 6.00%, 11/27/23(a) | 200 | 205,730 | ||||||
Gazprom OAO Via Gaz Capital SA | 200 | 199,980 | ||||||
6.51%, 03/07/22(a) | 100 | 104,265 | ||||||
7.29%, 08/16/37(a) | 100 | 109,865 | ||||||
8.63%, 04/28/34(a) | 150 | 183,360 | ||||||
Gazprombank OAO Via GPB Eurobond Finance PLC, 7.50%, 12/28/23 (Call 12/28/18)(a)(d)(e) | 200 | 195,750 | ||||||
Lukoil International Finance BV | 200 | 196,230 | ||||||
6.66%, 06/07/22(a) | 100 | 105,990 | ||||||
MMC Norilsk Nickel OJSC via MMC Finance DAC, 4.10%, 04/11/23(a) | 200 | 188,250 | ||||||
Novolipetsk Steel via Steel Funding DAC, 4.50%, 06/15/23(a) | 200 | 192,500 | ||||||
Polyus Finance PLC, 5.25%, 02/07/23(a) | 200 | 192,250 | ||||||
Rosneft Oil Co. Via Rosneft International Finance DAC, 4.20%, 03/06/22(a) | 200 | 193,980 | ||||||
Sberbank of Russia Via SB Capital SA | 200 | 196,500 | ||||||
5.50%, 02/26/24 (Call 02/26/19)(a)(d)(e) | 200 | 199,250 | ||||||
6.13%, 02/07/22(a) | 200 | 205,250 | ||||||
Severstal OAO Via Steel Capital SA, 5.90%, 10/17/22(a) | 200 | 204,000 | ||||||
VEON Holdings BV | 200 | 188,750 | ||||||
5.95%, 02/13/23(a) | 200 | 200,500 | ||||||
VTB Bank OJSC Via VTB Capital SA, 6.95%, 10/17/22(a) | 400 | 390,000 | ||||||
|
| |||||||
| 4,199,900 | ||||||||
Saudi Arabia — 2.2% | ||||||||
Acwa Power Management And Investments One Ltd., 5.95%, 12/15/39(a) | 200 | 188,500 | ||||||
Dar Al-Arkan Sukuk Co. Ltd., 6.88%, 03/21/23(a) | 200 | 186,750 | ||||||
SABIC Capital II BV, 4.00%, 10/10/23(g) | 200 | 197,250 | ||||||
Saudi Electricity Global Sukuk Co., 4.21%, 04/03/22(a) | 200 | 200,500 | ||||||
Saudi Electricity Global Sukuk Co. 3 | 600 | 587,250 | ||||||
5.50%, 04/08/44(a) | 200 | 202,500 | ||||||
|
| |||||||
| 1,562,750 | ||||||||
Singapore — 2.7% | ||||||||
DBS Group Holdings Ltd. | 200 | 200,485 | ||||||
3.60%, (Call 09/07/21)(a)(c)(d)(e) | 200 | 191,199 | ||||||
Flex Ltd., 4.75%, 06/15/25 (Call 03/15/25)(b) | 300 | 296,817 | ||||||
GLP Pte Ltd., 3.88%, 06/04/25(a) | 200 | 177,764 | ||||||
Oversea-Chinese Banking Corp. Ltd., 4.25%, 06/19/24(a) | 200 | 198,708 | ||||||
SingTel Group Treasury Pte Ltd., 3.25%, 06/30/25(a) | 500 | 478,186 | ||||||
United Overseas Bank Ltd., 3.50%, 09/16/26 (Call 09/16/21)(a)(d)(e) | 400 | 393,260 | ||||||
|
| |||||||
| 1,936,419 | ||||||||
| Security | Par (000) | Value | ||||||
South Africa — 2.3% | ||||||||
AngloGold Ashanti Holdings PLC, 5.13%, 08/01/22 | $ | 100 | $ | 100,375 | ||||
Liquid Telecommunications Financing PLC, 8.50%, 07/13/22 (Call 07/13/20)(a) | 200 | 204,250 | ||||||
MTN Mauritius Investment Ltd. | 200 | 179,500 | ||||||
5.37%, 02/13/22(a) | 200 | 192,250 | ||||||
Myriad International Holdings BV, 5.50%, 07/21/25 (Call 04/21/25)(a) | 400 | 408,500 | ||||||
Petra Diamonds U.S. Treasury PLC, 7.25%, 05/01/22 (Call 05/01/19)(a) | 200 | 190,750 | ||||||
Sasol Financing International Ltd., 4.50%, 11/14/22 | 200 | 195,000 | ||||||
SASOL Financing USA LLC, 6.50%, 09/27/28 (Call 06/27/28) | 200 | 201,000 | ||||||
|
| |||||||
| 1,671,625 | ||||||||
South Korea — 3.8% | ||||||||
Hanwha Life Insurance Co. Ltd., 4.70%, 04/23/48 (Call 04/23/23)(a)(d)(e) | 200 | 190,884 | ||||||
Hyundai Capital Services Inc., 3.00%, 03/06/22(a) | 400 | 385,019 | ||||||
Korea East-West Power Company Ltd., 2.63%, 06/19/22(a) | 200 | 191,388 | ||||||
Korea Gas Corp., 3.50%, 07/21/25(a) | 200 | 192,396 | ||||||
Korea Hydro & Nuclear Power Co. Ltd., 3.00%, 09/19/22(a) | 200 | 193,922 | ||||||
Kyobo Life Insurance Co. Ltd., 3.95%, 07/24/47 (Call 07/24/22)(a)(d)(e) | 200 | 189,579 | ||||||
NongHyup Bank, 2.88%, 07/17/22(a) | 200 | 192,604 | ||||||
POSCO, 5.25%, 04/14/21(a) | 200 | 206,450 | ||||||
Shinhan Bank Co. Ltd., 2.88%, | 400 | 387,032 | ||||||
Woori Bank | 200 | 193,366 | ||||||
4.75%, 04/30/24(a) | 400 | 399,619 | ||||||
|
| |||||||
| 2,722,259 | ||||||||
Taiwan — 0.3% | ||||||||
Formosa Group Cayman Ltd., 3.38%, 04/22/25(a) | 200 | 190,382 | ||||||
|
| |||||||
Thailand — 1.1% | ||||||||
Bangkok Bank PCL/Hong Kong, 5.00%, 10/03/23(a) | 200 | 207,670 | ||||||
PTT Global Chemical PCL, 4.25%, 09/19/22(a) | 200 | 199,851 | ||||||
PTTEP Treasury Center Co. Ltd., 4.60%, (Call 07/17/22)(a)(c)(d)(e) | 200 | 192,000 | ||||||
Siam Commercial Bank PCL/Cayman Islands, 2.75%, 05/16/23(a) | 200 | 188,079 | ||||||
|
| |||||||
| 787,600 | ||||||||
Turkey — 4.3% | ||||||||
Akbank Turk AS, 5.13%, 03/31/25(a) | 200 | 171,250 | ||||||
Coca-Cola Icecek AS, 4.22%, 09/19/24 (Call 06/19/24)(a) | 200 | 187,500 | ||||||
QNB Finansbank AS, 4.88%, 05/19/22(a) | 200 | 184,800 | ||||||
Tupras Turkiye Petrol Rafinerileri AS, 4.50%, 10/18/24 (Call 07/18/24)(a) | 200 | 176,500 | ||||||
Turk Telekomunikasyon AS, 4.88%, 06/19/24(a) | 200 | 172,500 | ||||||
Turkcell Iletisim Hizmetleri AS, 5.75%, 10/15/25(a) | 200 | 181,000 | ||||||
Turkiye Garanti Bankasi AS, 5.88%, 03/16/23(a) | 400 | 370,000 | ||||||
Turkiye Halk Bankasi AS, 4.75%, 02/11/21(a) | 200 | 168,750 | ||||||
Turkiye Is Bankasi AS | 200 | 176,500 | ||||||
5.38%, 10/06/21(a) | 200 | 176,250 | ||||||
5.50%, 04/21/22(a) | 200 | 172,000 | ||||||
7.00%, 06/29/28 (Call 06/29/23)(a)(d)(e) | 200 | 146,000 | ||||||
Turkiye Vakiflar Bankasi TAO | 200 | 173,500 | ||||||
6.00%, 11/01/22(a) | 200 | 164,500 | ||||||
S C H E D U L E O F I N V E S T M E N T S | 33 |
Schedule of Investments (continued)
October 31, 2018 | iShares® J.P. Morgan EM Corporate Bond ETF
(Percentages shown are based on Net Assets) |
| Security |
Par | Value | ||||||
Turkey (continued) | ||||||||
Yapi ve Kredi Bankasi AS | $ | 200 | $ | 169,750 | ||||
8.50%, 03/09/26 (Call | 300 | 261,000 | ||||||
|
| |||||||
| 3,051,800 | ||||||||
Ukraine — 1.2% | ||||||||
DTEK Finance PLC, 10.75%, (10.75% PIK), 12/31/24 (Call 01/01/20)(f) | 260 | 266,147 | ||||||
Metinvest BV | 200 | 192,000 | ||||||
8.50%, 04/23/26 (Call 01/23/26)(g) | 200 | 189,750 | ||||||
MHP SE, 7.75%, 05/10/24(a) | 200 | 196,750 | ||||||
|
| |||||||
| 844,647 | ||||||||
United Arab Emirates — 5.3% | ||||||||
Abu Dhabi National Energy Co. PJSC | 200 | 198,800 | ||||||
3.63%, 01/12/23(a) | 200 | 195,000 | ||||||
4.38%, 06/22/26(a) | 400 | 390,000 | ||||||
6.50%, 10/27/36(a) | 100 | 118,250 | ||||||
ADCB Finance Cayman Ltd., 4.50%, 03/06/23(a) | 200 | 199,500 | ||||||
BOS Funding Ltd., 4.23%, 03/07/22(a) | 200 | 195,000 | ||||||
DAE Funding LLC, 5.00%, 08/01/24 (Call 08/01/20)(a) | 100 | 96,875 | ||||||
DIB Sukuk Ltd., 3.66%, 02/14/22(a) | 200 | 194,250 | ||||||
Dolphin Energy Ltd. LLC, 5.50%, 12/15/21(a)(b) | 200 | 209,250 | ||||||
DP World Crescent Ltd., 3.91%, 05/31/23(a) | 200 | 196,500 | ||||||
DP World Ltd., 6.85%, 07/02/37(a) | 200 | 222,000 | ||||||
Emaar Sukuk Ltd., 3.64%, 09/15/26(a) | 200 | 180,250 | ||||||
EMG SUKUK Ltd., 4.56%, 06/18/24(a) | 200 | 196,500 | ||||||
Emirates NBD Tier 1 Ltd., 5.75%, (Call 05/30/19)(a)(c)(d)(e) | 400 | 398,500 | ||||||
First Abu Dhabi Bank PJSC, 3.00%, 03/30/22(a) | 200 | 194,000 | ||||||
MAF Global Securities Ltd., 4.75%, 05/07/24(a) | 200 | 198,500 | ||||||
Ruwais Power Co. PJSC, 6.00%, 08/31/36(a) | 200 | 218,250 | ||||||
Shelf Drilling Holdings Ltd., 8.25%, 02/15/25 (Call 02/15/21)(a) | 200 | 202,250 | ||||||
|
| |||||||
| 3,803,675 | ||||||||
United Kingdom — 0.8% | ||||||||
Petron Corp., 4.60%, (a)(c)(d)(e) | 200 | 187,970 | ||||||
SABIC Capital II BV, 4.50%, | 200 | 195,912 | ||||||
Sands China Ltd., 5.40%, 08/08/28 (Call 05/08/28)(a) | 200 | 190,932 | ||||||
|
| |||||||
| 574,814 | ||||||||
Zambia — 1.5% | ||||||||
First Quantum Minerals Ltd. | 200 | 195,000 | ||||||
7.25%, 04/01/23 (Call 10/01/19)(a) | 600 | 553,500 | ||||||
7.50%, 04/01/25 (Call 04/01/20)(a) | 400 | 357,520 | ||||||
|
| |||||||
| 1,106,020 | ||||||||
|
| |||||||
Total Corporate Bonds & Notes — 97.4% |
| |||||||
(Cost: $73,568,211) | 69,676,259 | |||||||
|
| |||||||
| Security | Par/ Shares (000) | Value | ||||||
| Foreign Government Obligations(h) |
| |||||||
Nigeria — 0.3% | ||||||||
Africa Finance Corp., 3.88%, | $ | 200 | $ | 189,250 | ||||
|
| |||||||
South Korea — 0.6% | ||||||||
Korea Gas Corp., 6.25%, 01/20/42(a)(b) | 200 | 250,750 | ||||||
Korea Hydro & Nuclear Power Co. Ltd., 3.75%, 07/25/23(a) | 200 | 198,537 | ||||||
|
| |||||||
| 449,287 | ||||||||
Supranational — 0.6% | ||||||||
African Export-Import Bank (The), 4.00%, 05/24/21(a) | 400 | 395,500 | ||||||
|
| |||||||
Total Foreign Government Obligations — 1.5% |
| |||||||
(Cost: $1,087,182) | 1,034,037 | |||||||
|
| |||||||
| Short-Term Investments |
| |||||||
Money Market Funds — 7.1% | ||||||||
BlackRock Cash Funds: Institutional, SL Agency Shares, 2.36%(i)(j)(k) | 4,764 | 4,764,926 | ||||||
BlackRock Cash Funds: Treasury, SL Agency Shares, 2.11%(i)(j) | 336 | 336,440 | ||||||
|
| |||||||
| 5,101,366 | ||||||||
|
| |||||||
Total Short-Term Investments — 7.1% |
| |||||||
(Cost: $5,100,851) | 5,101,366 | |||||||
|
| |||||||
Total Investments in Securities — 106.0% |
| |||||||
(Cost: $79,756,244) | 75,811,662 | |||||||
Other Assets, Less Liabilities — (6.0)% |
| (4,296,299 | ) | |||||
|
| |||||||
Net Assets — 100.0% | $ | 71,515,363 | ||||||
|
| |||||||
| (a) | This security may be resold to qualified foreign investors and foreign institutional buyers under Regulation S of the Securities Act of 1933. |
| (b) | All or a portion of this security is on loan. |
| (c) | Perpetual security with no stated maturity date. |
| (d) | Security is issued at a fixed coupon rate, which converts to a variable rate at a specified date. Reference index and spread are provided if the rate is currently floating. |
| (e) | Variable or floating rate security. Rate shown is the rate in effect as of period-end. |
| (f) | Payment-in-kind (“PIK”) bond which gives the issuer an option to make coupon payments in cash or in the form of additional bonds. Stated interest rate represents the cash coupon rate. |
| (g) | Security exempt from registration pursuant to Rule 144A under the Securities Act of 1933, as amended. These securities may be resold in transactions exempt from registration to qualified institutional investors. |
| (h) | Investments are denominated in U.S. dollars. |
| (i) | Affiliate of the Fund. |
| (j) | Annualized 7-day yield as of period-end. |
| (k) | All or a portion of this security was purchased with cash collateral received from loaned securities. |
| 34 | 2 0 1 8 I S H A R E S A N N U A L R E P O R T T O S H A R E H O L D E R S |
Schedule of Investments (continued)
October 31, 2018 | iShares® J.P. Morgan EM Corporate Bond ETF
|
Affiliates
Investments in issuers considered to be affiliates of the Fund during the year ended October 31, 2018, for purposes of Section 2(a)(3) of the 1940 Act, were as follows:
| ||||||||||||||||||||||||||||
Affiliated Issuer | | Shares Held at 10/31/17 (000) | | | Net Activity (000) | | | Shares Held at 10/31/18 (000) | | | Value at 10/31/18 | | Income | | Net Realized Gain (Loss) | (a) | | Change in Unrealized Appreciation (Depreciation) | | |||||||||
| ||||||||||||||||||||||||||||
BlackRock Cash Funds: Institutional, SL Agency Shares | 3,412 | 1,352 | 4,764 | $ | 4,764,926 | $32,088 | (b) | $ | 276 | $ | 332 | |||||||||||||||||
BlackRock Cash Funds: Treasury, SL Agency Shares | 2,623 | (2,287 | ) | 336 | 336,440 | 18,519 | — | — | ||||||||||||||||||||
|
|
|
|
|
|
|
| |||||||||||||||||||||
| $ | 5,101,366 | $50,607 | $ | 276 | $ | 332 | ||||||||||||||||||||||
|
|
|
|
|
|
|
| |||||||||||||||||||||
| (a) | Includes realized capital gain distributions from an affiliated fund, if any. |
| (b) | Includes securities lending income earned from the reinvestment of cash collateral from loaned securities (excluding collateral investment fees), net of fees and other payments to and from borrowers of securities, and less fees paid to BTC as securities lending agent. |
Fair Value Measurements
Various inputs are used in determining the fair value of financial instruments. For description of the input levels and information about the Fund’s policy regarding valuation of financial instruments, refer to the Notes to Financial Statements.
The following table summarizes the value of the Fund’s investments according to the fair value hierarchy as of October 31, 2018. The breakdown of the Fund’s investments into major categories is disclosed in the Schedule of Investments above.
| ||||||||||||||||
| Level 1 | Level 2 | Level 3 | Total | |||||||||||||
| ||||||||||||||||
Investments | ||||||||||||||||
Assets | ||||||||||||||||
Corporate Bonds & Notes | $ | — | $ | 69,676,259 | $ | — | $ | 69,676,259 | ||||||||
Foreign Government Obligations | — | 1,034,037 | — | 1,034,037 | ||||||||||||
Money Market Funds | 5,101,366 | — | — | 5,101,366 | ||||||||||||
|
|
|
|
|
|
|
| |||||||||
| $ | 5,101,366 | $ | 70,710,296 | $ | — | $ | 75,811,662 | |||||||||
|
|
|
|
|
|
|
| |||||||||
See notes to financial statements.
S C H E D U L E O F I N V E S T M E N T S | 35 |
Schedule of Investments
October 31, 2018 | iShares® J.P. Morgan EM Local Currency Bond ETF
(Percentages shown are based on Net Assets) |
| Security | Par (000) | Value | ||||||||
| Foreign Government Obligations |
| |||||||||
Argentina — 5.1% | ||||||||||
Argentine Bonos del Tesoro | ||||||||||
15.50%, 10/17/26 | ARS | 425,665 | $ | 9,579,427 | ||||||
16.00%, 10/17/23 | ARS | 255,000 | 6,054,633 | |||||||
18.20%, 10/03/21 | ARS | 258,390 | 5,867,164 | |||||||
|
| |||||||||
| 21,501,224 | ||||||||||
Brazil — 14.8% | ||||||||||
Brazil Letras do Tesouro Nacional | ||||||||||
0.00%, 01/01/20(a) | BRL | 48,257 | 11,981,427 | |||||||
0.00%, 04/01/20(a) | BRL | 8,440 | 2,052,083 | |||||||
0.00%, 07/01/20(a) | BRL | 36,604 | 8,717,128 | |||||||
0.00%, 07/01/21(a) | BRL | 14,437 | 3,131,935 | |||||||
0.00%, 01/01/22(a) | BRL | 15,524 | 3,202,083 | |||||||
Brazil Notas do Tesouro Nacional | ||||||||||
10.00%, 01/01/29 | BRL | 2,263 | 603,807 | |||||||
Series F, 10.00%, 01/01/21 | BRL | 22,441 | 6,249,300 | |||||||
Series F, 10.00%, 01/01/23 | BRL | 54,465 | 15,016,551 | |||||||
Series F, 10.00%, 01/01/25 | BRL | 19,899 | 5,423,561 | |||||||
Series F, 10.00%, 01/01/27 | BRL | 19,802 | 5,313,062 | |||||||
Brazilian Government International Bond | ||||||||||
8.50%, 01/05/24 | BRL | 500 | 134,061 | |||||||
10.25%, 01/10/28 | BRL | 1,420 | 420,514 | |||||||
12.50%, 01/05/22 | BRL | 1,633 | 491,697 | |||||||
|
| |||||||||
| 62,737,209 | ||||||||||
Chile — 4.4% | ||||||||||
Bonos de la Tesoreria de la Republica en pesos | ||||||||||
4.50%, 02/28/21 | CLP | 1,425,000 | 2,071,579 | |||||||
4.50%, 03/01/21 | CLP | 1,230,000 | 1,788,078 | |||||||
4.50%, 03/01/26 | CLP | 4,150,000 | 5,951,841 | |||||||
5.00%, 03/01/35 | CLP | 2,925,000 | 4,209,318 | |||||||
6.00%, 01/01/43 | CLP | 2,465,000 | 3,953,473 | |||||||
Chile Government International Bond, 5.50%, 08/05/20 | CLP | 390,000 | 576,984 | |||||||
|
| |||||||||
| 18,551,273 | ||||||||||
Colombia — 4.4% | ||||||||||
Colombia Government International Bond | ||||||||||
7.75%, 04/14/21 | COP | 8,022,000 | 2,600,688 | |||||||
9.85%, 06/28/27 | COP | 745,000 | 283,912 | |||||||
Colombian TES | ||||||||||
6.00%, 04/28/28 | COP | 11,153,000 | 3,179,311 | |||||||
6.25%, 11/26/25 | COP | 500,000 | 149,768 | |||||||
7.00%, 05/04/22 | COP | 5,674,200 | 1,818,583 | |||||||
7.00%, 06/30/32 | COP | 4,910,000 | 1,450,841 | |||||||
7.50%, 08/26/26 | COP | 10,328,000 | 3,300,733 | |||||||
7.75%, 09/18/30 | COP | 5,808,000 | 1,853,966 | |||||||
10.00%, 07/24/24 | COP | 8,440,300 | 3,044,251 | |||||||
11.00%, 07/24/20 | COP | 2,417,900 | 818,807 | |||||||
|
| |||||||||
| 18,500,860 | ||||||||||
Czech Republic — 4.4% | ||||||||||
Czech Republic Government Bond | ||||||||||
0.25%, 02/10/27 | CZK | 15,000 | 564,820 | |||||||
0.45%, 10/25/23(b) | CZK | 16,000 | 652,966 | |||||||
0.95%, 05/15/30(b) | CZK | 73,230 | 2,770,436 | |||||||
1.00%, 06/26/26(b) | CZK | 10,000 | 402,575 | |||||||
2.40%, 09/17/25(b) | CZK | 23,710 | 1,057,625 | |||||||
2.50%, 08/25/28(b) | CZK | 43,580 | 1,965,086 | |||||||
3.75%, 09/12/20(b) | CZK | 10,840 | 493,346 | |||||||
3.85%, 09/29/21(b) | CZK | 128,730 | 5,972,209 | |||||||
| Security | Par (000) | Value | ||||||||
Czech Republic (continued) | ||||||||||
4.70%, 09/12/22(b) | CZK | 59,850 | $ | 2,901,784 | ||||||
5.70%, 05/25/24(b) | CZK | 38,950 | 2,057,916 | |||||||
|
| |||||||||
| 18,838,763 | ||||||||||
Dominican Republic — 4.4% | ||||||||||
Dominican Republic International Bond, 8.90%, 02/15/23(b) | DOP | 941,800 | 18,724,395 | |||||||
|
| |||||||||
Hungary — 4.4% | ||||||||||
Hungary Government Bond | ||||||||||
2.50%, 10/27/21 | HUF | 394,000 | 1,407,534 | |||||||
2.75%, 12/22/26 | HUF | 544,650 | 1,790,464 | |||||||
3.00%, 06/26/24 | HUF | 504,000 | 1,765,858 | |||||||
3.00%, 10/27/27 | HUF | 358,840 | 1,186,934 | |||||||
3.50%, 06/24/20 | HUF | 1,009,330 | 3,673,878 | |||||||
5.50%, 06/24/25 | HUF | 1,053,010 | 4,179,234 | |||||||
6.00%, 11/24/23 | HUF | 158,850 | 645,924 | |||||||
6.75%, 10/22/28 | HUF | 135,000 | 585,283 | |||||||
7.00%, 06/24/22 | HUF | 507,660 | 2,071,604 | |||||||
7.50%, 11/12/20 | HUF | 322,320 | 1,271,554 | |||||||
|
| |||||||||
| 18,578,267 | ||||||||||
Indonesia — 4.5% | ||||||||||
Indonesia Treasury Bond | ||||||||||
5.63%, 05/15/23 | IDR | 42,282,000 | 2,496,175 | |||||||
6.13%, 05/15/28 | IDR | 35,240,000 | 1,954,108 | |||||||
6.63%, 05/15/33 | IDR | 2,000,000 | 108,206 | |||||||
7.00%, 05/15/22 | IDR | 14,121,000 | 894,957 | |||||||
7.50%, 05/15/38 | IDR | 10,516,000 | 599,210 | |||||||
8.25%, 07/15/21 | IDR | 11,750,000 | 774,831 | |||||||
8.25%, 06/15/32 | IDR | 22,819,000 | 1,422,200 | |||||||
8.38%, 03/15/24 | IDR | 28,904,000 | 1,885,105 | |||||||
8.38%, 09/15/26 | IDR | 39,283,000 | 2,551,179 | |||||||
8.38%, 03/15/34 | IDR | 45,376,000 | 2,850,458 | |||||||
8.75%, 05/15/31 | IDR | 10,639,000 | 695,445 | |||||||
9.00%, 03/15/29 | IDR | 9,696,000 | 648,951 | |||||||
9.50%, 07/15/31 | IDR | 4,008,000 | 276,164 | |||||||
11.00%, 11/15/20 | IDR | 3,648,000 | 255,078 | |||||||
11.00%, 09/15/25 | IDR | 10,435,000 | 767,395 | |||||||
Perusahaan Penerbit SBSN Indonesia, 8.88%, 11/15/31 | IDR | 13,500,000 | 895,378 | |||||||
|
| |||||||||
| 19,074,840 | ||||||||||
Malaysia — 4.5% | ||||||||||
Malaysia Government Bond | ||||||||||
3.48%, 03/15/23 | MYR | 11,141 | 2,620,967 | |||||||
3.49%, 03/31/20 | MYR | 19,437 | 4,646,119 | |||||||
3.90%, 11/30/26 | MYR | 6,640 | 1,558,095 | |||||||
3.90%, 11/16/27 | MYR | 4,000 | 933,737 | |||||||
4.06%, 09/30/24 | MYR | 1,200 | 287,071 | |||||||
4.23%, 06/30/31 | MYR | 5,162 | 1,197,055 | |||||||
4.94%, 09/30/43 | MYR | 3,695 | 880,395 | |||||||
Malaysia Government Investment Issue | ||||||||||
3.23%, 04/15/20 | MYR | 1,500 | 356,754 | |||||||
3.95%, 04/14/22 | MYR | 14,210 | 3,409,537 | |||||||
4.07%, 09/30/26 | MYR | 9,138 | 2,161,198 | |||||||
4.26%, 07/26/27 | MYR | 4,000 | 957,798 | |||||||
|
| |||||||||
| 19,008,726 | ||||||||||
Mexico — 7.9% | ||||||||||
Mexican Bonos | ||||||||||
5.00%, 12/11/19 | MXN | 59,423 | 2,824,732 | |||||||
5.75%, 03/05/26 | MXN | 36,362 | 1,500,891 | |||||||
| 36 | 2 0 1 8 I S H A R E S A N N U A L R E P O R T T O S H A R E H O L D E R S |
Schedule of Investments (continued)
October 31, 2018 | iShares® J.P. Morgan EM Local Currency Bond ETF
(Percentages shown are based on Net Assets) |
| Security | Par (000) | Value | ||||||||
Mexico (continued) | ||||||||||
6.50%, 06/10/21 | MXN | 52,648 | $ | 2,469,498 | ||||||
6.50%, 06/09/22 | MXN | 147,268 | 6,783,689 | |||||||
7.50%, 06/03/27 | MXN | 160,353 | 7,275,649 | |||||||
7.75%, 05/29/31 | MXN | 43,707 | 1,965,304 | |||||||
7.75%, 11/13/42 | MXN | 53,760 | 2,317,808 | |||||||
8.00%, 06/11/20 | MXN | 20,929 | 1,023,841 | |||||||
8.00%, 12/07/23 | MXN | 16,715 | 800,831 | |||||||
8.00%, 11/07/47 | MXN | 14,350 | 632,958 | |||||||
8.50%, 05/31/29 | MXN | 4,400 | 211,336 | |||||||
8.50%, 11/18/38 | MXN | 8,526 | 400,793 | |||||||
10.00%, 12/05/24 | MXN | 67,223 | 3,512,301 | |||||||
10.00%, 11/20/36 | MXN | 28,923 | 1,557,163 | |||||||
|
| |||||||||
| 33,276,794 | ||||||||||
Peru — 4.4% | ||||||||||
Peru Government Bond | ||||||||||
5.70%, 08/12/24 | PEN | 5,345 | 1,625,885 | |||||||
6.15%, 08/12/32(b)(c) | PEN | 700 | 205,330 | |||||||
6.35%, 08/12/28 | PEN | 24,296 | 7,429,863 | |||||||
6.90%, 08/12/37 | PEN | 5,171 | 1,597,298 | |||||||
6.95%, 08/12/31 | PEN | 12,511 | 3,955,323 | |||||||
8.20%, 08/12/26 | PEN | 11,337 | 3,899,904 | |||||||
|
| |||||||||
| 18,713,603 | ||||||||||
Philippines — 4.4% | ||||||||||
Philippine Government International Bond | ||||||||||
3.90%, 11/26/22 | PHP | 244,000 | 4,181,495 | |||||||
4.95%, 01/15/21 | PHP | 372,000 | 6,772,340 | |||||||
6.25%, 01/14/36 | PHP | 451,000 | 7,858,046 | |||||||
|
| |||||||||
| 18,811,881 | ||||||||||
Poland — 4.4% | ||||||||||
Republic of Poland Government Bond | ||||||||||
1.50%, 04/25/20 | PLN | 2,636 | 688,124 | |||||||
1.75%, 07/25/21 | PLN | 18,747 | 4,888,741 | |||||||
2.50%, 07/25/26 | PLN | 4,791 | 1,204,845 | |||||||
2.50%, 07/25/27 | PLN | 10,228 | 2,542,241 | |||||||
2.75%, 04/25/28 | PLN | 2,700 | 677,264 | |||||||
3.25%, 07/25/25 | PLN | 3,868 | �� | 1,032,204 | ||||||
4.00%, 10/25/23 | PLN | 6,621 | 1,850,001 | |||||||
5.25%, 10/25/20 | PLN | 3,950 | 1,104,408 | |||||||
5.75%, 10/25/21 | PLN | 7,803 | 2,264,806 | |||||||
5.75%, 09/23/22 | PLN | 8,789 | 2,593,324 | |||||||
|
| |||||||||
| 18,845,958 | ||||||||||
Romania — 4.4% | ||||||||||
Romania Government Bond | ||||||||||
3.25%, 03/22/21 | RON | 15,080 | 3,586,556 | |||||||
3.25%, 04/29/24 | RON | 8,000 | 1,802,643 | |||||||
3.50%, 12/19/22 | RON | 17,125 | 3,993,129 | |||||||
5.75%, 04/29/20 | RON | 2,700 | 674,829 | |||||||
5.80%, 07/26/27 | RON | 8,910 | 2,293,589 | |||||||
5.85%, 04/26/23 | RON | 11,580 | 2,951,972 | |||||||
5.95%, 06/11/21 | RON | 13,050 | 3,295,220 | |||||||
|
| |||||||||
| 18,597,938 | ||||||||||
Russia — 4.4% | ||||||||||
Russian Federal Bond - OFZ | ||||||||||
6.90%, 05/23/29 | RUB | 20,500 | 277,308 | |||||||
7.00%, 01/25/23 | RUB | 651,938 | 9,517,759 | |||||||
7.05%, 01/19/28 | RUB | 90,908 | 1,262,396 | |||||||
7.10%, 10/16/24 | RUB | 84,900 | 1,216,495 | |||||||
7.25%, 05/10/34 | RUB | 22,872 | 310,947 | |||||||
7.50%, 08/18/21 | RUB | 65,550 | 982,751 | |||||||
| Security | Par (000) | Value | ||||||||
Russia (continued) | ||||||||||
7.60%, 04/14/21 | RUB | 46,910 | $ | 708,217 | ||||||
7.70%, 03/23/33 | RUB | 94,914 | 1,352,099 | |||||||
8.15%, 02/03/27 | RUB | 140,846 | 2,105,813 | |||||||
8.50%, 09/17/31 | RUB | 71,080 | 1,081,305 | |||||||
|
| |||||||||
| 18,815,090 | ||||||||||
South Africa — 4.3% | ||||||||||
Republic of South Africa Government Bond | ||||||||||
6.25%, 03/31/36 | ZAR | 17,469 | 815,115 | |||||||
6.50%, 02/28/41 | ZAR | 18,685 | 851,757 | |||||||
6.75%, 03/31/21 | ZAR | 17,000 | 1,121,996 | |||||||
7.00%, 02/28/31 | ZAR | 26,800 | 1,441,674 | |||||||
7.75%, 02/28/23 | ZAR | 2,200 | 144,132 | |||||||
8.00%, 01/31/30 | ZAR | 64,425 | 3,827,115 | |||||||
8.50%, 01/31/37 | ZAR | 26,632 | 1,551,947 | |||||||
8.75%, 01/31/44 | ZAR | 27,000 | 1,576,612 | |||||||
8.75%, 02/28/48 | ZAR | 32,764 | 1,908,679 | |||||||
8.88%, 02/28/35 | ZAR | 32,000 | 1,952,846 | |||||||
10.50%, 12/21/26 | ZAR | 41,450 | 2,983,316 | |||||||
|
| |||||||||
| 18,175,189 | ||||||||||
Thailand — 4.5% | ||||||||||
Thailand Government Bond | ||||||||||
1.88%, 06/17/22 | THB | 34,000 | 1,009,603 | |||||||
2.00%, 12/17/22 | THB | 9,100 | 270,523 | |||||||
2.13%, 12/17/26 | THB | 30,382 | 873,777 | |||||||
2.55%, 06/26/20 | THB | 24,775 | 753,466 | |||||||
2.88%, 06/17/46 | THB | 21,000 | 570,504 | |||||||
3.40%, 06/17/36 | THB | 72,770 | 2,233,017 | |||||||
3.63%, 06/16/23 | THB | 78,428 | 2,491,728 | |||||||
3.65%, 12/17/21 | THB | 86,752 | 2,733,412 | |||||||
3.65%, 06/20/31 | THB | 12,300 | 389,604 | |||||||
3.78%, 06/25/32 | THB | 13,638 | 435,353 | |||||||
3.85%, 12/12/25 | THB | 52,949 | 1,719,429 | |||||||
4.26%, 12/12/37(b) | THB | 470 | 15,738 | |||||||
4.88%, 06/22/29 | THB | 156,280 | 5,515,409 | |||||||
|
| |||||||||
| 19,011,563 | ||||||||||
Turkey — 4.2% | ||||||||||
Turkey Government Bond | ||||||||||
7.40%, 02/05/20 | TRY | 10,000 | 1,483,055 | |||||||
8.00%, 03/12/25 | TRY | 2,652 | 291,553 | |||||||
8.50%, 09/14/22 | TRY | 8,799 | 1,111,790 | |||||||
8.80%, 09/27/23 | TRY | 16,464 | 1,975,989 | |||||||
9.00%, 07/24/24 | TRY | 38,929 | 4,786,837 | |||||||
9.20%, 09/22/21 | TRY | 6,950 | 932,736 | |||||||
9.40%, 07/08/20 | TRY | 7,700 | 1,120,652 | |||||||
9.50%, 01/12/22 | TRY | 10,414 | 1,361,338 | |||||||
10.50%, 01/15/20 | TRY | 4,003 | 628,672 | |||||||
10.50%, 08/11/27 | TRY | 6,546 | 778,632 | |||||||
10.60%, 02/11/26 | TRY | 10,526 | 1,307,461 | |||||||
10.70%, 02/17/21 | TRY | 6,900 | 971,588 | |||||||
11.00%, 02/24/27 | TRY | 2,500 | 306,516 | |||||||
12.40%, 03/08/28 | TRY | 5,000 | 675,049 | |||||||
|
| |||||||||
| 17,731,868 | ||||||||||
S C H E D U L E O F I N V E S T M E N T S | 37 |
Schedule of Investments (continued)
October 31, 2018 | iShares® J.P. Morgan EM Local Currency Bond ETF
(Percentages shown are based on Net Assets) |
| Security | Par/ Shares (000) | Value | ||||||||||
Uruguay — 4.4% | ||||||||||||
Uruguay Government International Bond | ||||||||||||
8.50%, 03/15/28(b) | UYU | 331,243 | $ | 8,504,411 | ||||||||
9.88%, 06/20/22(b) | UYU | 338,110 | 10,128,511 | |||||||||
|
| |||||||||||
| 18,632,922 | ||||||||||||
|
| |||||||||||
Total Foreign Government Obligations — 98.2% |
| 416,128,363 | ||||||||||
|
| |||||||||||
| Short-Term Investments | ||||||||||||
Money Market Funds — 0.0% | ||||||||||||
BlackRock Cash Funds: Treasury, SL Agency Shares, 2.11%(d)(e) | 35 | 34,679 | ||||||||||
|
| |||||||||||
Total Short-Term Investments — 0.0% |
| 34,679 | ||||||||||
|
| |||||||||||
Total Investments in Securities — 98.2% |
| 416,163,042 | ||||||||||
Other Assets, Less Liabilities — 1.8% |
| 7,569,020 | ||||||||||
|
| |||||||||||
Net Assets — 100.0% |
| $ | 423,732,062 | |||||||||
|
| |||||||||||
| (a) | Zero-coupon bond. |
| (b) | This security may be resold to qualified foreign investors and foreign institutional buyers under Regulation S of the Securities Act of 1933. |
| (c) | Security exempt from registration pursuant to Rule 144A under the Securities Act of 1933, as amended. These securities may be resold in transactions exempt from registration to qualified institutional investors. |
| (d) | Affiliate of the Fund. |
| (e) | Annualized 7-day yield as of period-end. |
Affiliates
Investments in issuers considered to be affiliates of the Fund during the year ended October 31, 2018, for purposes of Section 2(a)(3) of the 1940 Act, were as follows:
| Affiliated Issuer | | Shares Held at 10/31/17 (000) | | | Net Activity (000) | | | Shares Held at 10/31/18 (000) | | | Value at 10/31/18 | | Income | | Net Realized Gain (Loss) | (a) | | Change in Unrealized Appreciation (Depreciation) | | |||||||||
BlackRock Cash Funds: Treasury, SL Agency Shares | 490 | (455 | ) | 35 | $ | 34,679 | $ | 15,910 | $ | — | $ | — | ||||||||||||||||
|
|
|
|
|
|
|
|
| (a) | Includes realized capital gain distributions from an affiliated fund, if any. |
Fair Value Measurements
Various inputs are used in determining the fair value of financial instruments. For description of the input levels and information about the Fund’s policy regarding valuation of financial instruments, refer to the Notes to Financial Statements.
The following table summarizes the value of the Fund’s investments according to the fair value hierarchy as of October 31, 2018. The breakdown of the Fund’s investments into major categories is disclosed in the Schedule of Investments above.
| Level 1 | Level 2 | Level 3 | Total | |||||||||||||
Investments | ||||||||||||||||
Assets | ||||||||||||||||
Foreign Government Obligations | $ | — | $ | 416,128,363 | $ | — | $ | 416,128,363 | ||||||||
Money Market Funds | 34,679 | — | — | 34,679 | ||||||||||||
|
|
|
|
|
|
|
| |||||||||
| $ | 34,679 | $ | 416,128,363 | $ | — | $ | 416,163,042 | |||||||||
|
|
|
|
|
|
|
| |||||||||
See notes to financial statements.
| 38 | 2 0 1 8 I S H A R E S A N N U A L R E P O R T T O S H A R E H O L D E R S |
Schedule of Investments
October 31, 2018 | iShares® US & Intl High Yield Corp Bond ETF
(Percentages shown are based on Net Assets) |
| Security | Par (000) | Value | ||||||
| Corporate Bonds & Notes |
| |||||||
Australia — 0.2% | ||||||||
FMG Resources August 2006 Pty Ltd. | ||||||||
4.75%, 05/15/22 (Call 02/15/22)(a)(b) | USD | 130 | $ | 125,622 | ||||
5.13%, 03/15/23 (Call 12/15/22)(a) | USD | 100 | 96,250 | |||||
5.13%, 05/15/24 (Call 02/15/24)(a)(b) | USD | 135 | 127,767 | |||||
|
| |||||||
| 349,639 | ||||||||
Austria — 0.1% | ||||||||
Raiffeisenlandesbank Niederoesterreich-Wien AG, 5.88%, 11/27/23(c) | EUR | 100 | 128,962 | |||||
Wienerberger AG, 2.00%, 05/02/24(c) | EUR | 50 | 58,003 | |||||
|
| |||||||
| 186,965 | ||||||||
Belgium — 0.3% | ||||||||
Barry Callebaut Services NV, 5.63%, 06/15/21(c) | EUR | 100 | 128,380 | |||||
Ethias SA, 5.00%, 01/14/26(c) | EUR | 100 | 125,265 | |||||
Telenet Finance Luxembourg Note, 5.50%, 03/01/28 (Call 12/01/22)(a) | USD | 200 | 185,000 | |||||
Telenet Finance Luxembourg Notes Sarl, 3.50%, 03/01/28 (Call 12/01/22)(c) | EUR | 100 | 111,499 | |||||
|
| |||||||
| 550,144 | ||||||||
Bermuda — 0.0% | ||||||||
Weatherford International Ltd., 9.88%, 02/15/24 (Call 11/15/23)(b) | USD | 150 | 117,000 | |||||
|
| |||||||
Brazil — 0.3% | ||||||||
ESAL GmbH, 6.25%, 02/05/23 (Call 12/03/18)(a)(b) | USD | 200 | 196,250 | |||||
JBS USA LUX SA/JBS USA Finance Inc. | ||||||||
5.75%, 06/15/25 (Call 06/15/20)(a) | USD | 150 | 144,000 | |||||
5.88%, 07/15/24 (Call 07/15/19)(a) | USD | 125 | 122,688 | |||||
6.75%, 02/15/28 (Call 02/15/23)(a) | USD | 175 | 168,656 | |||||
|
| |||||||
| 631,594 | ||||||||
Canada — 3.3% | ||||||||
1011778 BC ULC/New Red Finance Inc. | ||||||||
4.25%, 05/15/24 (Call 05/15/20)(a)(b) | USD | 275 | 258,500 | |||||
4.63%, 01/15/22 (Call 12/03/18)(a) | USD | 250 | 247,531 | |||||
5.00%, 10/15/25 (Call 10/15/20)(a) | USD | 525 | 490,875 | |||||
Air Canada | ||||||||
4.75%, 10/06/23 (Call 10/06/19)(a) | CAD | 25 | 19,406 | |||||
7.75%, 04/15/21(a) | USD | 75 | 80,362 | |||||
Bausch Health Companies Inc. | ||||||||
5.63%, 12/01/21 (Call 12/03/18)(a) | USD | 175 | 172,079 | |||||
7.50%, 07/15/21 (Call 12/03/18)(a) | USD | 277 | 281,155 | |||||
Baytex Energy Corp., 6.63%, 07/19/22 (Call 11/30/18) | CAD | 50 | 37,455 | |||||
Bombardier Inc. | ||||||||
5.75%, 03/15/22(a) | USD | 100 | 98,875 | |||||
6.00%, 10/15/22 (Call 12/03/18)(a)(b) | USD | 225 | 221,344 | |||||
6.13%, 05/15/21(c) | EUR | 100 | 121,723 | |||||
6.13%, 01/15/23(a) | USD | 225 | 222,422 | |||||
7.50%, 12/01/24 (Call 12/01/20)(a) | USD | 175 | 177,844 | |||||
7.50%, 03/15/25 (Call 03/15/20)(a)(b) | USD | 275 | 275,000 | |||||
7.75%, 03/15/20(a) | USD | 150 | 155,088 | |||||
8.75%, 12/01/21(a) | USD | 250 | 269,344 | |||||
Brookfield Residential Properties Inc. | ||||||||
6.13%, 05/15/23 (Call 11/30/18)(a) | CAD | 50 | 37,931 | |||||
6.50%, 12/15/20 (Call 12/03/18)(a) | USD | 50 | 50,000 | |||||
Brookfield Residential Properties Inc./Brookfield Residential U.S. Corp., 6.13%, 07/01/22 (Call 12/03/18)(a) | USD | 75 | 73,046 | |||||
Cascades Inc., 5.50%, 07/15/21 (Call 11/30/18)(a) | CAD | 25 | 19,310 | |||||
| Security | Par (000) | Value | ||||||
Canada (continued) | ||||||||
CES Energy Solutions Corp., 6.38%, 10/21/24 (Call 10/21/20) | CAD | 50 | $ | 36,729 | ||||
Cott Corp., 5.50%, 07/01/24 (Call 07/01/19)(c) | EUR | 100 | 119,534 | |||||
Crew Energy Inc., 6.50%, 03/14/24 (Call 03/14/20)(a) | CAD | 50 | 33,724 | |||||
GFL Environmental Inc., 5.38%, 03/01/23 (Call 03/01/20)(a) | USD | 75 | 67,990 | |||||
Gibson Energy Inc. | ||||||||
5.25%, 07/15/24 (Call 07/15/20)(c) | CAD | 100 | 75,081 | |||||
5.38%, 07/15/22 (Call 11/30/18)(a) | CAD | 50 | 37,990 | |||||
Great Canadian Gaming Corp., 6.63%, 07/25/22 (Call 11/30/18)(a) | CAD | 50 | 38,906 | |||||
Hulk Finance Corp., 7.00%, 06/01/26 (Call 06/01/21)(a) | USD | 75 | 69,247 | |||||
Iron Mountain Canada Operations ULC, 5.38%, 09/15/23 (Call 09/15/19)(a) | CAD | 25 | 19,084 | |||||
MEG Energy Corp. | ||||||||
6.38%, 01/30/23 (Call 12/03/18)(a) | USD | 150 | 144,926 | |||||
6.50%, 01/15/25 (Call 01/15/20)(a) | USD | 150 | 155,250 | |||||
7.00%, 03/31/24 (Call 12/03/18)(a) | USD | 175 | 171,937 | |||||
NOVA Chemicals Corp. | ||||||||
4.88%, 06/01/24 (Call 03/03/24)(a) | USD | 190 | 174,800 | |||||
5.00%, 05/01/25 (Call 01/31/25)(a) | USD | 100 | 91,025 | |||||
5.25%, 08/01/23 (Call 12/03/18)(a) | USD | 100 | 96,740 | |||||
5.25%, 06/01/27 (Call 03/03/27)(a) | USD | 200 | 179,317 | |||||
NuVista Energy Ltd., 6.50%, 03/02/23 (Call 03/02/20) | CAD | 50 | 37,383 | |||||
Open Text Corp. | ||||||||
5.63%, 01/15/23 (Call 12/03/18)(a) | USD | 150 | 150,501 | |||||
5.88%, 06/01/26 (Call 06/01/21)(a) | USD | 130 | 130,207 | |||||
Parkland Fuel Corp. | ||||||||
5.63%, 05/09/25 (Call 05/09/20) | CAD | 100 | 75,509 | |||||
5.75%, 09/16/24 (Call 09/16/19)(a) | CAD | 25 | 19,084 | |||||
5.75%, 09/16/24 (Call 09/16/19) | CAD | 50 | 38,169 | |||||
6.00%, 11/21/22 (Call 11/30/18) | CAD | 50 | 38,859 | |||||
Postmedia Network Inc., 8.25%, 07/15/21 (Call 11/30/18)(a) | CAD | 1 | 438 | |||||
Precision Drilling Corp., 7.13%, 01/15/26 (Call 11/15/20)(a) | USD | 80 | 79,192 | |||||
Quebecor Media Inc. | ||||||||
5.75%, 01/15/23 | USD | 225 | 225,256 | |||||
6.63%, 01/15/23(a) | CAD | 160 | 128,587 | |||||
Russel Metals Inc., 6.00%, 04/19/22 (Call 11/30/18)(a) | CAD | 25 | 19,113 | |||||
Seven Generations Energy Ltd. | ||||||||
5.38%, 09/30/25 (Call 09/30/20)(a) | USD | 110 | 102,575 | |||||
6.75%, 05/01/23 (Call 12/03/18)(a) | USD | 75 | 77,119 | |||||
6.88%, 06/30/23 (Call 12/03/18)(a) | USD | 125 | 127,931 | |||||
Stars Group Holdings BV/Stars Group US Co-Borrower LLC, 7.00%, 07/15/26 (Call 07/15/21)(a)(b) | USD | 200 | 202,650 | |||||
Superior Plus LP | ||||||||
5.13%, 08/27/25 (Call 02/27/21) | CAD | 50 | 35,523 | |||||
5.25%, 02/27/24 (Call 02/27/20) | CAD | 50 | 36,610 | |||||
Teck Resources Ltd., 8.50%, 06/01/24 (Call 06/01/19)(a) | USD | 100 | 108,292 | |||||
Videotron Ltd. | ||||||||
5.00%, 07/15/22 | USD | 125 | 125,156 | |||||
5.13%, 04/15/27 (Call 04/15/22)(a) | USD | 135 | 127,392 | |||||
5.38%, 06/15/24 (Call 03/15/24)(a) | USD | 100 | 99,875 | |||||
5.63%, 06/15/25 (Call 03/15/25) | CAD | 50 | 38,771 | |||||
5.75%, 01/15/26 (Call 09/15/20)(c) | CAD | 75 | 58,145 | |||||
|
| |||||||
| 6,903,907 | ||||||||
Denmark — 0.2% | ||||||||
DKT Finance ApS, 7.00%, 06/17/23 (Call 06/17/20)(c) | EUR | 200 | 243,071 | |||||
S C H E D U L E O F I N V E S T M E N T S | 39 |
Schedule of Investments (continued)
October 31, 2018 | iShares® US & Intl High Yield Corp Bond ETF
(Percentages shown are based on Net Assets) |
| Security | Par (000) | Value | ||||||
Denmark (continued) | ||||||||
Norican A/S, 4.50%, 05/15/23 | EUR | 100 | $ | 106,400 | ||||
TDC AS, 5.63%, 02/23/23(c) | GBP | 100 | 141,171 | |||||
|
| |||||||
| 490,642 | ||||||||
Finland — 0.5% | ||||||||
Nokia OYJ | EUR | 100 | 114,600 | |||||
2.00%, 03/15/24 (Call 12/15/23)(c) | EUR | 125 | 143,721 | |||||
3.38%, 06/12/22 | USD | 125 | 119,219 | |||||
4.38%, 06/12/27 | USD | 80 | 75,240 | |||||
Outokumpu OYJ, 4.13%, 06/18/24 | EUR | 100 | 109,388 | |||||
Stora Enso OYJ | EUR | 100 | 118,672 | |||||
2.50%, 03/21/28 (Call 12/21/27)(c) | EUR | 100 | 113,846 | |||||
Teollisuuden Voima Oyj, | EUR | 100 | 113,919 | |||||
Teollisuuden Voima OYJ | EUR | 100 | 113,363 | |||||
2.50%, 03/17/21(c) | EUR | 100 | 117,915 | |||||
|
| |||||||
| 1,139,883 | ||||||||
France — 3.7% | ||||||||
Altice France SA/France | EUR | 200 | 233,890 | |||||
5.88%, 02/01/27 (Call 02/01/22)(c) | EUR | 200 | 233,408 | |||||
6.25%, 05/15/24 (Call 05/15/19)(a) | USD | 200 | 192,000 | |||||
7.38%, 05/01/26 (Call 05/01/21)(a) | USD | 1,000 | 958,280 | |||||
8.13%, 02/01/27 (Call 02/01/22)(a) | USD | 400 | 395,000 | |||||
Autodis SA, 4.38%, 05/01/22 | EUR | 100 | 114,311 | |||||
Banijay Group SAS, 4.00%, 07/01/22 | EUR | 100 | 115,465 | |||||
Burger King France SAS, | EUR | 100 | 119,502 | |||||
Casino Guichard Perrachon SA | EUR | 200 | 204,863 | |||||
4.05%, 08/05/26 (Call 05/05/26)(c) | EUR | 100 | 102,416 | |||||
4.50%, 03/07/24 (Call 12/07/23)(c) | EUR | 200 | 215,818 | |||||
4.56%, 01/25/23(c) | EUR | 100 | 110,206 | |||||
5.24%, 03/09/20 | EUR | 100 | 116,597 | |||||
5.98%, 05/26/21(c) | EUR | 200 | 236,516 | |||||
CMA CGM SA | EUR | 100 | 95,895 | |||||
6.50%, 07/15/22 (Call 07/15/19)(c) | EUR | 200 | 213,917 | |||||
Elis SA | EUR | 100 | 114,062 | |||||
2.88%, 02/15/26 (Call 11/15/25)(c) | EUR | 100 | 113,610 | |||||
3.00%, 04/30/22 (Call 11/30/18)(c) | EUR | 100 | 114,897 | |||||
Europcar Mobility Group | EUR | 100 | 110,001 | |||||
5.75%, 06/15/22 (Call 11/12/18)(c) | EUR | 100 | 115,712 | |||||
Faurecia SA | EUR | 100 | 112,091 | |||||
3.63%, 06/15/23 (Call 06/15/19)(c) | EUR | 100 | 115,985 | |||||
Fnac Darty SA, 3.25%, 09/30/23 | EUR | 100 | 114,912 | |||||
La Financiere Atalian SASU | EUR | 100 | 100,794 | |||||
5.13%, 05/15/25 (Call 05/15/21)(c) | EUR | 100 | 103,717 | |||||
Louvre Bidco SAS, 4.25%, 09/30/24 | EUR | 100 | 109,608 | |||||
Loxam SAS | EUR | 58 | 66,828 | |||||
6.00%, 04/15/25 (Call 04/15/20)(c) | EUR | 100 | 119,771 | |||||
Mobilux Finance SAS, | EUR | 100 | 102,979 | |||||
| Security | Par (000) | Value | ||||||
France (continued) | ||||||||
Nexans SA, 3.25%, 05/26/21 | EUR | 100 | $ | 118,693 | ||||
Novafives SAS, 5.00%, 06/15/25 | EUR | 100 | 103,110 | |||||
Orano SA | EUR | 200 | 225,100 | |||||
3.25%, 09/04/20(c) | EUR | 200 | 233,372 | |||||
3.50%, 03/22/21(c) | EUR | 200 | 233,560 | |||||
4.88%, 09/23/24 | EUR | 150 | 175,708 | |||||
Paprec Holding SA, 4.00%, 03/31/25 | EUR | 100 | 113,026 | |||||
Peugeot SA | EUR | 100 | 115,066 | |||||
2.00%, 03/20/25 (Call 12/20/24)(c) | EUR | 100 | 112,363 | |||||
2.38%, 04/14/23(c) | EUR | 100 | 119,031 | |||||
Rexel SA | EUR | 100 | 113,500 | |||||
3.50%, 06/15/23 (Call 06/15/19)(c) | EUR | 100 | 116,473 | |||||
SPCM SA, 2.88%, 06/15/23 | EUR | 100 | 113,955 | |||||
SPIE SA, 3.13%, 03/22/24 | EUR | 100 | 114,246 | |||||
Synlab Bondco PLC, 6.25%, 07/01/22 | EUR | 150 | 175,267 | |||||
Tereos Finance Groupe I SA, | EUR | 200 | 216,557 | |||||
Vallourec SA | EUR | 100 | 86,608 | |||||
6.63%, 10/15/22 (Call 10/15/20)(c) | EUR | 200 | 220,309 | |||||
|
| |||||||
| 7,878,995 | ||||||||
Germany —3.2% | ||||||||
Adler Pelzer Holding GmbH, | EUR | 100 | 108,697 | |||||
ADLER Real Estate AG | EUR | 100 | 113,269 | |||||
1.88%, 04/27/23 (Call 03/27/23)(c) | EUR | 100 | 109,678 | |||||
3.00%, 04/27/26 (Call 02/27/26)(c) | EUR | 100 | 109,409 | |||||
Bilfinger SE, 2.38%, 12/07/19(c) | EUR | 100 | 114,659 | |||||
Blitz F18-674 GmbH, 6.00%, 07/30/26 | EUR | 100 | 114,275 | |||||
BMBG Bond Finance SCA, | EUR | 100 | 114,338 | |||||
CBR Fashion Finance BV, | EUR | 100 | 92,425 | |||||
CTC BondCo GmbH, 5.25%, 12/15/25 | EUR | 100 | 112,076 | |||||
Deutsche Bank AG | EUR | 200 | 223,023 | |||||
4.30%, 05/24/28 (Call 05/24/23)(d)(e) | USD | 300 | 270,494 | |||||
4.50%, 05/19/26(c) | EUR | 100 | 119,011 | |||||
Deutsche Bank AG/New York NY, | USD | 200 | 169,458 | |||||
Deutsche Lufthansa AG, | EUR | 100 | 120,072 | |||||
Douglas GmbH, 6.25%, 07/15/22 | EUR | 100 | 94,840 | |||||
Hapag-Lloyd AG | EUR | 100 | 114,055 | |||||
6.75%, 02/01/22 (Call 02/01/19)(c) | EUR | 100 | 116,915 | |||||
K+S AG | EUR | 100 | 115,158 | |||||
3.00%, 06/20/22(c) | EUR | 100 | 117,293 | |||||
3.25%, 07/18/24 (Call 04/18/24)(c) | EUR | 100 | 111,782 | |||||
4.13%, 12/06/21(c) | EUR | 100 | 122,594 | |||||
Kaefer Isoliertechnik GmbH & Co. KG, | EUR | 100 | 115,240 | |||||
KME AG, 6.75%, 02/01/23 | EUR | 100 | 105,827 | |||||
Kronos International Inc., | EUR | 100 | 104,234 | |||||
| 40 | 2 0 1 8 I S H A R E S A N N U A L R E P O R T T O S H A R E H O L D E R S |
Schedule of Investments (continued)
October 31, 2018 | iShares® US & Intl High Yield Corp Bond ETF
(Percentages shown are based on Net Assets) |
| Security | Par (000) | Value | ||||||||||
Germany (continued) | ||||||||||||
LANXESS AG, 4.50%, 12/06/76 (Call 06/06/23)(c)(d)(e) | EUR | 100 | $ | 119,817 | ||||||||
METRO AG, 1.50%, 03/19/25(c) | EUR | 200 | 218,079 | |||||||||
Nidda BondCo GmbH, 5.00%, 09/30/25 (Call 09/30/20)(c) | EUR | 100 | 109,228 | |||||||||
Nidda Healthcare Holding GmbH, 3.50%, 09/30/24 (Call 09/30/20)(c) | EUR | 100 | 111,543 | |||||||||
Norddeutsche Landesbank Girozentrale, 6.00%, 06/29/20 | EUR | 50 | 58,028 | |||||||||
Nordex SE, 6.50%, 02/01/23 (Call 02/01/20)(c) | EUR | 125 | 137,938 | |||||||||
Phoenix PIB Dutch Finance BV, 3.13%, 05/27/20(c) | EUR | 100 | 117,160 | |||||||||
Platin 1426 GmbH, 5.38%, 06/15/23 (Call 12/15/19)(c) | EUR | 100 | 109,724 | |||||||||
PrestigeBidCo GmbH, 6.25%, 12/15/23 (Call 12/15/19)(c) | EUR | 100 | 120,090 | |||||||||
Raffinerie Heide GmbH, 6.38%, 12/01/22 (Call 12/01/19)(c) | EUR | 100 | 104,082 | |||||||||
RWE AG | ||||||||||||
2.75%, 04/21/75 (Call | EUR | 100 | 114,759 | |||||||||
3.50%, 04/21/75 (Call | EUR | 100 | 113,062 | |||||||||
Safari Verwaltungs GmbH, 5.38%, 11/30/22 (Call 12/15/19)(c) | EUR | 100 | 114,754 | |||||||||
Senvion Holding GmbH, 3.88%, 10/25/22 (Call 05/01/19)(c) | EUR | 100 | 96,710 | |||||||||
Summit Germany Ltd., 2.00%, 01/31/25 (Call 01/31/21)(c) | EUR | 100 | 107,686 | |||||||||
Tele Columbus AG, 3.88%, 05/02/25 (Call 05/02/21)(c) | EUR | 100 | 104,550 | |||||||||
thyssenkrupp AG | EUR | 350 | 393,307 | |||||||||
1.75%, 11/25/20 (Call 08/25/20)(c) | EUR | 100 | 114,990 | |||||||||
2.50%, 02/25/25(c) | EUR | 100 | 116,529 | |||||||||
2.75%, 03/08/21 (Call 12/08/20)(c) | EUR | 200 | 234,107 | |||||||||
TUI AG, 2.13%, 10/26/21 (Call 07/26/21)(c) | EUR | 100 | 116,538 | |||||||||
Unitymedia GmbH | EUR | 100 | 119,192 | |||||||||
6.13%, 01/15/25 (Call 01/15/20)(a) | USD | 200 | 205,550 | |||||||||
Unitymedia Hessen GmbH & Co. KG/Unitymedia NRW GmbH | EUR | 100 | 118,971 | |||||||||
4.00%, 01/15/25 (Call 01/15/20)(c) | EUR | 200 | 237,460 | |||||||||
4.63%, 02/15/26 (Call 02/15/21)(c) | EUR | 90 | 110,157 | |||||||||
WEPA Hygieneprodukte GmbH, 3.75%, 05/15/24 (Call 05/15/19)(c) | EUR | 100 | 110,849 | |||||||||
|
| |||||||||||
| 6,743,682 | ||||||||||||
Greece — 0.3% | ||||||||||||
Intralot Capital Luxembourg SA, 5.25%, 09/15/24 (Call 09/15/20)(c) | EUR | 100 | 87,481 | |||||||||
OTE PLC | EUR | 100 | 116,038 | |||||||||
3.50%, 07/09/20(c) | EUR | 200 | 235,274 | |||||||||
Titan Global Finance PLC, 3.50%, 06/17/21(c) | EUR | 100 | 117,081 | |||||||||
|
| |||||||||||
| 555,874 | ||||||||||||
Ireland — 1.8% | ||||||||||||
Allied Irish Banks PLC, 4.13%, 11/26/25 (Call 11/26/20)(c)(d)(e) | EUR | 100 | 118,432 | |||||||||
Ardagh Packaging Finance PLC/Ardagh Holdings USA Inc. | EUR | 150 | 168,731 | |||||||||
4.13%, 05/15/23 (Call 05/15/19)(c) | EUR | 100 | 116,479 | |||||||||
4.25%, 09/15/22 (Call 03/15/19)(a) | USD | 200 | 193,433 | |||||||||
4.63%, 05/15/23 (Call 05/15/19)(a) | USD | 200 | 195,000 | |||||||||
| Security | Par (000) | Value | ||||||||||
Ireland (continued) | ||||||||||||
4.75%, 07/15/27 (Call 07/15/22)(c) | GBP | 100 | $ | 120,858 | ||||||||
6.00%, 02/15/25 (Call 02/15/20)(a) | USD | 400 | 375,000 | |||||||||
6.75%, 05/15/24 (Call 05/15/19)(c) | EUR | 100 | 119,998 | |||||||||
7.25%, 05/15/24 (Call 05/15/19)(a) | USD | 200 | 201,094 | |||||||||
Avolon Holdings Funding Ltd. | USD | 175 | 171,719 | |||||||||
5.50%, 01/15/23 (Call 12/15/22)(a) | USD | 100 | 99,333 | |||||||||
Bank of Ireland Group PLC, 3.13%, 09/19/27 (Call 09/19/22)(c)(d)(e) | GBP | 100 | 123,063 | |||||||||
C&W Senior Financing DAC, 6.88%, 09/15/27 (Call 09/15/22)(a) | USD | 200 | 190,500 | |||||||||
eircom Finance DAC, 4.50%, 05/31/22 (Call 11/12/18)(c) | EUR | 100 | 115,725 | |||||||||
Park Aerospace Holdings Ltd. | USD | 155 | 147,444 | |||||||||
5.25%, 08/15/22(a)(b) | USD | 325 | 322,563 | |||||||||
5.50%, 02/15/24(a) | USD | 250 | 246,673 | |||||||||
Smurfit Kappa Acquisitions ULC | EUR | 100 | 116,221 | |||||||||
2.88%, 01/15/26(c) | EUR | 100 | 115,694 | |||||||||
3.25%, 06/01/21 (Call 03/10/21)(c) | EUR | 100 | 119,999 | |||||||||
4.13%, 01/30/20(c) | EUR | 100 | 118,134 | |||||||||
Teva Pharmaceutical Finance Netherlands II BV, 1.13%, 10/15/24(c) | EUR | 120 | 119,241 | |||||||||
Virgin Media Receivables Financing Notes II DAC, 5.75%, 04/15/23 (Call 09/15/19)(c) | GBP | 100 | 129,943 | |||||||||
|
| |||||||||||
| 3,745,277 | ||||||||||||
Israel — 1.0% | ||||||||||||
Teva Pharmaceutical Finance Netherlands II BV | EUR | 150 | 167,005 | |||||||||
1.63%, 10/15/28(c) | EUR | 150 | 133,395 | |||||||||
3.25%, 04/15/22 (Call 01/15/22) | EUR | 200 | 233,458 | |||||||||
4.50%, 03/01/25 (Call 12/01/24) | EUR | 200 | 237,908 | |||||||||
Teva Pharmaceutical Finance Netherlands III BV | USD | 500 | 466,061 | |||||||||
2.80%, 07/21/23 | USD | 500 | 441,875 | |||||||||
3.15%, 10/01/26 | USD | 148 | 120,620 | |||||||||
6.00%, 04/15/24 (Call 01/15/24) | USD | 200 | 198,750 | |||||||||
6.75%, 03/01/28 (Call 12/01/27) | USD | 225 | 229,922 | |||||||||
|
| |||||||||||
| 2,228,994 | ||||||||||||
Italy — 4.8% | ||||||||||||
Autostrada Brescia Verona Vicenza Padova SpA, 2.38%, 03/20/20(c) | EUR | 100 | 115,414 | |||||||||
Banca IFIS SpA, 4.50%, 10/17/27 (Call 10/17/22)(c)(d)(e) | EUR | 100 | 90,334 | |||||||||
Banca Monte dei Paschi di Siena SpA, 5.38%, 01/18/28 (Call 01/18/23)(c)(d)(e) | EUR | 100 | 74,591 | |||||||||
Banco BPM SpA | EUR | 200 | 225,952 | |||||||||
4.38%, 09/21/27 (Call 09/21/22)(c)(d)(e) | EUR | 175 | 172,418 | |||||||||
6.00%, 11/05/20(c) | EUR | 100 | 114,555 | |||||||||
7.13%, 03/01/21(c) | EUR | 100 | 115,983 | |||||||||
BPER Banca, 5.13%, 05/31/27 (Call 05/31/22)(c)(d)(e) | EUR | 100 | 107,304 | |||||||||
Cooperativa Muratori & Cementisti-CMC di Ravenna SC, 6.00%, 02/15/23 (Call 11/15/19)(c) | EUR | 100 | 33,992 | |||||||||
EVOCA SpA, 7.00%, 10/15/23 (Call 10/15/19)(c) | EUR | 100 | 119,176 | |||||||||
Fiat Chrysler Finance Europe SA | EUR | 200 | 245,032 | |||||||||
4.75%, 07/15/22(c) | EUR | 300 | 375,578 | |||||||||
6.75%, 10/14/19(c) | EUR | 200 | 239,320 | |||||||||
S C H E D U L E O F I N V E S T M E N T S | 41 |
Schedule of Investments (continued)
October 31, 2018 | iShares® US & Intl High Yield Corp Bond ETF
(Percentages shown are based on Net Assets) |
| Security | Par (000) | Value | ||||||||||
Italy (continued) | ||||||||||||
Iccrea Banca SpA | EUR | 100 | $ | 111,128 | ||||||||
1.50%, 10/11/22(c) | EUR | 150 | 158,453 | |||||||||
1.88%, 11/25/19(c) | EUR | 100 | 112,910 | |||||||||
International Game Technology PLC | EUR | 100 | 116,875 | |||||||||
4.75%, 02/15/23 (Call 08/15/22)(c) | EUR | 100 | 120,966 | |||||||||
Intesa Sanpaolo SpA | EUR | 100 | 103,877 | |||||||||
3.93%, 09/15/26 (c) | EUR | 200 | 216,748 | |||||||||
5.15%, 07/16/20 | EUR | 200 | 237,794 | |||||||||
6.63%, 09/13/23(c) | EUR | 200 | 252,241 | |||||||||
Leonardo SpA | EUR | 100 | 106,468 | |||||||||
4.50%, 01/19/21 | EUR | 100 | 120,902 | |||||||||
5.25%, 01/21/22 | EUR | 100 | 126,248 | |||||||||
Mediobanca Banca di Credito Finanziario SpA | EUR | 200 | 234,859 | |||||||||
5.75%, 04/18/23 | EUR | 100 | 120,568 | |||||||||
Nexi Capital SpA, 4.13%, 11/01/23 (Call 11/30/19)(c) | EUR | 100 | 113,239 | |||||||||
Pro-Gest SpA, 3.25%, 12/15/24 (Call 12/15/20)(c) | EUR | 100 | 105,919 | |||||||||
Rekeep SpA, 9.00%, 06/15/22 (Call 06/15/20)(c) | EUR | 100 | 100,931 | |||||||||
Rossini Sarl, 6.75%, 10/30/25 (Call 10/30/21)(c) | EUR | 100 | 115,171 | |||||||||
Saipem Finance International BV | EUR | 100 | 114,635 | |||||||||
3.00%, 03/08/21(c) | EUR | 100 | 116,369 | |||||||||
3.75%, 09/08/23(c) | EUR | 100 | 117,822 | |||||||||
Salini Impregilo SpA | EUR | 100 | 85,970 | |||||||||
3.75%, 06/24/21(c) | EUR | 100 | 106,973 | |||||||||
Sisal Group SpA, 7.00%, 07/31/23 (Call 07/31/19)(c) | EUR | 100 | 115,712 | |||||||||
Snaitech SpA, 6.38%, 11/07/21 (Call 11/12/18)(c) | EUR | 100 | 116,717 | |||||||||
Societa Cattolica di Assicurazioni SC, 4.25%, 12/14/47 (Call | EUR | 100 | 100,176 | |||||||||
Telecom Italia SpA, 4.00%, 01/21/20(c) | EUR | 100 | 117,820 | |||||||||
Telecom Italia SpA/Milano | EUR | 200 | 204,094 | |||||||||
2.50%, 07/19/23(c) | EUR | 300 | 335,332 | |||||||||
2.88%, 01/28/26 (Call 10/28/25)(c) | EUR | 100 | 108,617 | |||||||||
3.00%, 09/30/25(c) | EUR | 200 | 220,151 | |||||||||
3.25%, 01/16/23(c) | EUR | 100 | 116,309 | |||||||||
3.63%, 01/19/24(c) | EUR | 100 | 117,020 | |||||||||
3.63%, 05/25/26(c) | EUR | 200 | 226,764 | |||||||||
4.50%, 01/25/21(c) | EUR | 100 | 121,234 | |||||||||
4.88%, 09/25/20(c) | EUR | 100 | 121,749 | |||||||||
5.25%, 02/10/22(c) | EUR | 150 | 187,487 | |||||||||
5.30%, 05/30/24(a)(b) | USD | 200 | 188,550 | |||||||||
UniCredit SpA | ||||||||||||
4.38%, 01/03/27 (Call | EUR | 100 | 112,192 | |||||||||
5.75%, 10/28/25 (Call | EUR | 300 | 351,637 | |||||||||
5.86%, 06/19/32 (Call | USD | 200 | 171,407 | |||||||||
6.95%, 10/31/22(c) | EUR | 300 | 378,106 | |||||||||
Unione di Banche Italiane SpA | ||||||||||||
4.25%, 05/05/26 (Call | EUR | 100 | 104,920 | |||||||||
4.45%, 09/15/27 (Call | EUR | 200 | 205,649 | |||||||||
Unipol Gruppo SpA | EUR | 115 | 122,522 | |||||||||
3.50%, 11/29/27 (Call 08/29/27)(c) | EUR | 100 | 101,658 | |||||||||
4.38%, 03/05/21(c) | EUR | 100 | 118,400 | |||||||||
UnipolSai Assicurazioni SpA, 3.88%, 03/01/28(c) | EUR | 100 | 93,686 | |||||||||
| Security | Par (000) | Value | ||||||||||
Italy (continued) | ||||||||||||
Wind Tre SpA | EUR | 300 | $ | 315,339 | ||||||||
3.13%, 01/20/25 (Call 11/03/20)(c) | EUR | 300 | 309,087 | |||||||||
5.00%, 01/20/26 (Call 11/03/20)(a) | USD | 350 | 297,063 | |||||||||
|
| |||||||||||
| 10,226,113 | ||||||||||||
Japan — 0.6% | ||||||||||||
SoftBank Group Corp. | EUR | 350 | 366,798 | |||||||||
4.00%, 07/30/22 (Call 04/30/22)(c) | EUR | 100 | 120,997 | |||||||||
4.00%, 04/20/23 (Call 01/20/23)(c) | EUR | 100 | 117,437 | |||||||||
4.00%, 09/19/29 (Call 06/21/29)(c) | EUR | 125 | 123,638 | |||||||||
4.50%, 04/20/25 (Call 01/20/25)(c) | EUR | 150 | 173,299 | |||||||||
4.75%, 07/30/25 (Call 04/30/25)(c) | EUR | 100 | 116,858 | |||||||||
5.00%, 04/15/28 (Call 01/16/28)(c) | EUR | 100 | 110,548 | |||||||||
5.25%, 07/30/27 (Call 04/30/27)(c) | EUR | 100 | 115,749 | |||||||||
|
| |||||||||||
| 1,245,324 | ||||||||||||
Luxembourg — 3.0% | ||||||||||||
Altice Financing SA | EUR | 100 | 116,987 | |||||||||
6.63%, 02/15/23 (Call | USD | 400 | 395,250 | |||||||||
7.50%, 05/15/26 (Call | USD | 400 | 377,118 | |||||||||
Altice Finco SA, 4.75%, 01/15/28 (Call 10/15/22)(c) | EUR | 100 | 93,810 | |||||||||
Altice Luxembourg SA | EUR | 100 | 102,001 | |||||||||
7.25%, 05/15/22 (Call 11/30/18)(c) | EUR | 450 | 497,661 | |||||||||
7.63%, 02/15/25 (Call | USD | 200 | 169,033 | |||||||||
7.75%, 05/15/22 (Call | USD | 600 | 558,750 | |||||||||
Arena Luxembourg Finance Sarl, 2.88%, 11/01/24 (Call 11/01/20)(c) | EUR | 100 | 112,774 | |||||||||
ContourGlobal Power Holdings SA, 3.38%, 08/01/23 (Call 08/01/20)(c) | EUR | 200 | 222,062 | |||||||||
Crystal Almond SARL, 10.00%, 11/01/21 (Call 11/30/18)(c) | EUR | 100 | 121,326 | |||||||||
DEA Finance SA, 7.50%, 10/15/22 (Call 04/15/19)(c) | EUR | 100 | 120,047 | |||||||||
Garfunkelux Holdco 3 SA | EUR | 100 | 109,930 | |||||||||
8.50%, 11/01/22 (Call 11/13/18)(c) | GBP | 100 | 122,112 | |||||||||
INEOS Finance PLC, 2.13%, 11/15/25 (Call 11/15/20)(c) | EUR | 100 | 107,192 | |||||||||
INEOS Group Holdings SA, 5.38%, 08/01/24 (Call 08/01/19)(c) | EUR | 100 | 115,938 | |||||||||
Intelsat Connect Finance SA, 9.50%, 02/15/23 (Call 08/15/20)(a) | USD | 250 | 240,000 | |||||||||
Intelsat Jackson Holdings SA | USD | 350 | 313,639 | |||||||||
7.50%, 04/01/21 (Call 11/01/18)(b) | USD | 225 | 227,681 | |||||||||
8.00%, 02/15/24 (Call 02/15/19)(a) | USD | 250 | 261,250 | |||||||||
8.50%, 10/15/24 (Call 10/15/20)(a) | USD | 440 | 433,532 | |||||||||
9.50%, 09/30/22(a) | USD | 100 | 115,865 | |||||||||
9.75%, 07/15/25 (Call 07/15/21)(a) | USD | 275 | 286,928 | |||||||||
Intelsat Luxembourg SA, 8.13%, 06/01/23 (Call 12/17/18) | USD | 175 | 146,535 | |||||||||
Matterhorn Telecom Holding SA, 4.88%, 05/01/23 (Call 11/13/18)(c) | EUR | 100 | 115,408 | |||||||||
Matterhorn Telecom SA | EUR | 100 | 115,143 | |||||||||
4.00%, 11/15/27 (Call 11/15/22)(c) | EUR | 100 | 106,815 | |||||||||
Picard Bondco SA, 5.50%, 11/30/24 (Call 11/30/20)(c) | EUR | 100 | 105,377 | |||||||||
Samsonite Finco Sarl, 3.50%, 05/15/26 (Call 05/15/21)(c) | EUR | 100 | 107,855 | |||||||||
| 42 | 2 0 1 8 I S H A R E S A N N U A L R E P O R T T O S H A R E H O L D E R S |
Schedule of Investments (continued)
October 31, 2018 | iShares® US & Intl High Yield Corp Bond ETF
(Percentages shown are based on Net Assets) |
| Security | Par (000) | Value | ||||||||||
Luxembourg (continued) | ||||||||||||
Swissport Financing Sarl, 6.75%, 12/15/21 (Call 11/12/18)(c) | EUR | 100 | $ | 117,485 | ||||||||
Swissport Investments SA, 6.75%, 12/15/21 (Call 11/13/18)(c) | EUR | 100 | 117,497 | |||||||||
Telenet Finance VI Luxembourg SCA, 4.88%, 07/15/27 (Call 07/15/21)(c) | EUR | 90 | 109,997 | |||||||||
|
| |||||||||||
| 6,262,998 | ||||||||||||
Netherlands — 2.3% | ||||||||||||
Constellium NV | EUR | 100 | 114,287 | |||||||||
6.63%, 03/01/25 (Call | USD | 250 | 245,104 | |||||||||
InterXion Holding NV, 4.75%, 06/15/25 (Call 06/15/21)(c) | EUR | 200 | 236,211 | |||||||||
IPD 3 BV, 4.50%, 07/15/22 (Call 07/15/19)(c) | EUR | 100 | 115,758 | |||||||||
JBS Investments GmbH, 7.25%, 04/03/24 (Call 04/03/19)(a)(b) | USD | 200 | 202,275 | |||||||||
Maxeda DIY Holding BV, 6.13%, 07/15/22 (Call 07/15/19)(c) | EUR | 100 | 106,417 | |||||||||
Nielsen Co. Luxembourg Sarl (The), 5.50%, 10/01/21 (Call | USD | 100 | 100,500 | |||||||||
NXP BV/NXP Funding LLC | USD | 200 | 193,000 | |||||||||
4.13%, 06/15/20(a) | USD | 200 | 199,228 | |||||||||
4.13%, 06/01/21(a)(b) | USD | 200 | 198,250 | |||||||||
4.63%, 06/01/23(a) | USD | 200 | 198,250 | |||||||||
Nyrstar Netherlands Holdings BV, 6.88%, 03/15/24 (Call 03/15/20)(c) | EUR | 100 | 68,707 | |||||||||
Promontoria Holding 264 BV, 6.75%, 08/15/23 (Call 08/15/20)(c) | EUR | 100 | 114,679 | |||||||||
Saipem Finance International BV, 2.63%, 01/07/25(c) | EUR | 100 | 108,649 | |||||||||
Samvardhana Motherson Automotive System Group BV, 1.80%, 07/06/24(c) | EUR | 100 | 99,383 | |||||||||
Selecta Group BV, 5.88%, 02/01/24 (Call 02/01/20)(c) | EUR | 100 | 111,072 | |||||||||
Sensata Technologies BV | USD | 100 | 97,500 | |||||||||
5.00%, 10/01/25(a) | USD | 200 | 192,375 | |||||||||
5.63%, 11/01/24(a) | USD | 100 | 99,750 | |||||||||
Sigma Holdco BV, 5.75%, 05/15/26 (Call 05/15/21)(c) | EUR | 100 | 104,128 | |||||||||
Starfruit Finco BV/Starfruit U.S. Holdco LLC, 6.50%, 10/01/26 (Call 10/01/21)(c) | EUR | 100 | 110,570 | |||||||||
Sunshine Mid BV, 6.50%, 05/15/26 (Call 05/15/21)(c) | EUR | 100 | 109,141 | |||||||||
United Group BV | EUR | 100 | 116,652 | |||||||||
4.88%, 07/01/24 (Call 07/01/20)(c) | EUR | 100 | 116,826 | |||||||||
UPC Holding BV, 3.88%, 06/15/29 (Call 06/15/22)(c) | EUR | 100 | 108,670 | |||||||||
UPCB Finance IV Ltd. | EUR | 90 | 105,522 | |||||||||
5.38%, 01/15/25 (Call 01/15/20)(a) | USD | 200 | 194,440 | |||||||||
UPCB Finance VII Ltd., 3.63%, 06/15/29 (Call 06/15/22)(c) | EUR | 150 | 167,679 | |||||||||
Ziggo Bond Co. BV | EUR | 100 | 110,974 | |||||||||
7.13%, 05/15/24 (Call 05/15/19)(c) | EUR | 100 | 120,417 | |||||||||
Ziggo Bond Finance BV, 6.00%, 01/15/27 (Call 01/15/22)(a)(b) | USD | 150 | 133,312 | |||||||||
Ziggo BV | EUR | 200 | 226,258 | |||||||||
4.25%, 01/15/27 (Call 01/15/22)(c) | EUR | 100 | 112,149 | |||||||||
5.50%, 01/15/27 (Call | USD | 350 | 320,590 | |||||||||
|
| |||||||||||
| 4,958,723 | ||||||||||||
| Security | Par (000) | Value | ||||||||||
Portugal — 0.2% | ||||||||||||
Banco Comercial Portugues SA, 4.50%, 12/07/27 (Call | EUR | 100 | $ | 107,573 | ||||||||
Caixa Geral de Depositos SA, 5.75%, 06/28/28 (Call | EUR | 100 | 116,814 | |||||||||
EDP - Energias de Portugal SA, 5.38%, 09/16/75 (Call | EUR | 100 | 121,169 | |||||||||
Novo Banco SA, 8.50%, 07/06/28 (Call 07/06/23)(c)(d)(e) | EUR | 100 | 114,487 | |||||||||
|
| |||||||||||
| 460,043 | ||||||||||||
Singapore — 0.2% | ||||||||||||
Lincoln Finance Ltd., 6.88%, 04/15/21 (Call 11/13/18)(c) | EUR | 200 | 233,830 | |||||||||
Puma International Financing SA, 5.13%, 10/06/24 (Call 10/06/20)(a) | USD | 200 | 168,125 | |||||||||
|
| |||||||||||
| 401,955 | ||||||||||||
Spain — 1.2% | ||||||||||||
Banco de Credito Social Cooperativo SA, 7.75%, 06/07/27 (Call 06/07/22)(c)(d)(e) | EUR | 100 | 103,928 | |||||||||
Banco de Sabadell SA, 5.63%, 05/06/26(c) | EUR | 100 | 122,295 | |||||||||
Bankia SA, 3.38%, 03/15/27 (Call 03/15/22)(c)(d)(e) | EUR | 100 | 115,906 | |||||||||
Bankinter SA, 2.50%, 04/06/27 (Call 04/06/22)(c)(d)(e) | EUR | 100 | 113,748 | |||||||||
Cellnex Telecom SA | EUR | 100 | 114,159 | |||||||||
2.88%, 04/18/25 (Call 01/18/25)(c) | EUR | 100 | 115,735 | |||||||||
3.13%, 07/27/22(c) | EUR | 100 | 120,430 | |||||||||
Codere Finance 2 Luxembourg SA, 6.75%, 11/01/21 (Call 11/30/18)(c) | EUR | 100 | 106,427 | |||||||||
Distribuidora Internacional de Alimentacion SA, 0.88%, 04/06/23 (Call 01/06/23)(c) | EUR | 100 | 77,036 | |||||||||
Gestamp Automocion SA, 3.25%, 04/30/26 (Call 04/30/21)(c) | EUR | 100 | 107,092 | |||||||||
Gestamp Funding Luxembourg SA, 3.50%, 05/15/23 (Call 05/15/19)(c) | EUR | 100 | 115,183 | |||||||||
Grifols SA, 3.20%, 05/01/25 (Call 05/01/20)(c) | EUR | 200 | 227,425 | |||||||||
Grupo Isolux Corsan SA, Series B, 3.00%, 12/30/21 (Call 11/30/18)(f) | EUR | 28 | 479 | |||||||||
Grupo-Antolin Irausa SA, 3.25%, 04/30/24 (Call 04/30/20)(c) | EUR | 100 | 108,118 | |||||||||
Haya Finance 2017 SA, 5.25%, 11/15/22 (Call 11/15/19)(c) | EUR | 100 | 105,522 | |||||||||
Ibercaja Banco SA, 5.00%, 07/28/25 (Call 07/28/20)(c)(d)(e) | EUR | 100 | 115,738 | |||||||||
LHMC Finco Sarl, 6.25%, 12/20/23 (Call 06/20/20)(c) | EUR | 100 | 117,019 | |||||||||
Liberbank SA, 6.88%, 03/14/27 (Call 03/14/22)(c)(d)(e) | EUR | 100 | 120,691 | |||||||||
NH Hotel Group SA, 3.75%, 10/01/23 (Call 10/01/19)(c) | EUR | 100 | 116,879 | |||||||||
Obrascon Huarte Lain SA, 4.75%, 03/15/22 (Call 11/30/18)(c) | EUR | 100 | 92,199 | |||||||||
Repsol International Finance BV, 4.50%, 03/25/75 (Call | EUR | 200 | 240,978 | |||||||||
|
| |||||||||||
| 2,456,987 | ||||||||||||
Sweden — 0.9% | ||||||||||||
Akelius Residential Property AB, 3.88%, 10/05/78 (Call | EUR | 100 | 112,075 | |||||||||
Dometic Group AB, 3.00%, 09/13/23 (Call 08/13/23)(c) | EUR | 100 | 111,397 | |||||||||
Fastighets AB Balder, 3.00%, 03/07/78 (Call 03/07/23)(c)(d)(e) | EUR | 100 | 108,643 | |||||||||
Intrum AB | EUR | 225 | 248,544 | |||||||||
3.13%, 07/15/24 (Call 07/15/20)(c) | EUR | 200 | 212,066 | |||||||||
Radisson Hotel Holdings AB, 6.88%, 07/15/23 (Call 07/15/20)(c) | EUR | 100 | 122,281 | |||||||||
S C H E D U L E O F I N V E S T M E N T S | 43 |
Schedule of Investments (continued)
October 31, 2018 | iShares® US & Intl High Yield Corp Bond ETF
(Percentages shown are based on Net Assets) |
| Security | Par (000) | Value | ||||||||||
Sweden (continued) | ||||||||||||
Telefonaktiebolaget LM Ericsson | USD | 200 | $ | 196,180 | ||||||||
Series 7Y, 1.88%, 03/01/24(c) | EUR | 200 | 224,746 | |||||||||
Unilabs Subholding AB, 5.75%, 05/15/25 (Call 05/15/20)(c) | EUR | 100 | 110,335 | |||||||||
Verisure Holding AB, 6.00%, 11/01/22 (Call 11/14/18)(c) | EUR | 90 | 104,940 | |||||||||
Verisure Midholding AB, 5.75%, 12/01/23 (Call 12/01/19)(c) | EUR | 200 | 228,463 | |||||||||
Volvo Car AB, 3.25%, 05/18/21(c) | EUR | 100 | 119,371 | |||||||||
|
| |||||||||||
| 1,899,041 | ||||||||||||
Switzerland — 0.3% | ||||||||||||
Dufry Finance SCA, 4.50%, 08/01/23 (Call 11/30/18)(c) | EUR | 100 | 116,975 | |||||||||
Dufry One BV, 2.50%, 10/15/24 (Call 10/15/20)(c) | EUR | 100 | 109,987 | |||||||||
Garrett LX I Sarl/Garrett Borrowing LLC, 5.13%, 10/15/26 (Call 10/15/21)(c) | EUR | 100 | 104,885 | |||||||||
Kongsberg Actuation Systems BV, 5.00%, 07/15/25 (Call 07/15/21)(c) | EUR | 100 | 109,691 | |||||||||
Transocean Inc., 7.50%, 01/15/26 (Call 01/15/21)(a)(b) | USD | 150 | 146,547 | |||||||||
|
| |||||||||||
| 588,085 | ||||||||||||
United Kingdom — 3.8% | ||||||||||||
Algeco Global Finance PLC, 6.50%, 02/15/23 (Call 02/15/20)(c) | EUR | 100 | 117,002 | |||||||||
Amigo Luxembourg SA, 7.63%, 01/15/24 (Call 01/15/20)(c) | GBP | 100 | 129,167 | |||||||||
Ardonagh Midco 3 PLC, 8.38%, 07/15/23 (Call 07/15/20)(c) | GBP | 100 | 119,059 | |||||||||
Arqiva Broadcast Finance PLC, 6.75%, 09/30/23 (Call 09/30/20)(c) | GBP | 100 | 131,009 | |||||||||
Aston Martin Capital Holdings Ltd., 5.75%, 04/15/22 (Call 04/15/19)(c) | GBP | 100 | 126,910 | |||||||||
Boparan Finance PLC, 5.50%, 07/15/21 (Call 11/13/18)(c) | GBP | 100 | 111,535 | |||||||||
Cabot Financial Luxembourg SA, 7.50%, 10/01/23 (Call 10/01/19)(c) | GBP | 100 | 126,915 | |||||||||
Fiat Chrysler Automobiles NV | EUR | 200 | 241,792 | |||||||||
4.50%, 04/15/20 | USD | 400 | 400,586 | |||||||||
5.25%, 04/15/23 | USD | 200 | 199,250 | |||||||||
Heathrow Finance PLC, 3.88%, 03/01/27(c) | GBP | 100 | 118,731 | |||||||||
Iceland Bondco PLC, 4.63%, 03/15/25 (Call 09/15/20)(c) | GBP | 100 | 114,350 | |||||||||
IDH Finance PLC, 6.25%, 08/15/22 (Call 11/30/18)(c) | GBP | 100 | 114,024 | |||||||||
INEOS Finance PLC, 4.00%, 05/01/23 (Call 11/12/18)(c) | EUR | 200 | 230,820 | |||||||||
Inmarsat Finance PLC, 4.88%, 05/15/22 (Call 12/03/18)(a) | USD | 200 | 195,333 | |||||||||
International Game Technology PLC, 6.25%, 01/15/27 (Call 07/15/26)(a) | USD | 200 | 197,374 | |||||||||
International Personal Finance PLC, 5.75%, 04/07/21(c) | EUR | 100 | 106,154 | |||||||||
Jaguar Land Rover Automotive PLC | EUR | 100 | 102,731 | |||||||||
3.88%, 03/01/23(c) | GBP | 100 | 117,554 | |||||||||
4.50%, 01/15/26 (Call 07/01/27)(c) | EUR | 100 | 105,183 | |||||||||
4.50%, 10/01/27 (Call 07/01/27)(a)(b) | USD | 200 | 158,750 | |||||||||
Jerrold Finco PLC, 6.25%, 09/15/21 (Call 09/15/19)(c) | GBP | 100 | 130,369 | |||||||||
KCA Deutag UK Finance PLC, 9.63%, 04/01/23 (Call 04/01/20)(a) | USD | 200 | 187,945 | |||||||||
Lecta SA, 6.50%, 08/01/23 (Call 08/01/19)(c) | EUR | 100 | 116,534 | |||||||||
Mclaren Finance PLC, 5.00%, 08/01/22 (Call 08/01/19)(c) | GBP | 100 | 120,667 | |||||||||
| Security | Par (000) | Value | ||||||||||
United Kingdom (continued) | ||||||||||||
Merlin Entertainments PLC, 2.75%, 03/15/22 (Call 12/15/21)(c) | EUR | 100 | $ | 117,422 | ||||||||
Nemean Bondco PLC, 7.38%, 02/01/24 (Call 02/01/20)(c) | GBP | 100 | 119,726 | |||||||||
New Look Secured Issuer PLC, 6.50%, 07/01/22 (Call 11/13/18)(c) | GBP | 100 | 63,016 | |||||||||
Noble Holding International Ltd., 7.75%, 01/15/24 (Call 10/15/23) | USD | 150 | 139,688 | |||||||||
Nomad Foods Bondco PLC, 3.25%, 05/15/24 (Call 05/15/20)(c) | EUR | 100 | 113,962 | |||||||||
Ocado Group PLC, 4.00%, 06/15/24 (Call 06/15/20)(c) | GBP | 100 | 125,699 | |||||||||
Pinewood Finance Co. Ltd., 3.75%, 12/01/23 (Call 12/01/19)(c) | GBP | 100 | 127,935 | |||||||||
Pinnacle Bidco PLC, 6.38%, 02/15/25 (Call 02/15/21)(c) | GBP | 100 | 130,377 | |||||||||
Pizzaexpress Financing 2 PLC, 6.63%, 08/01/21 (Call 11/12/18)(c) | GBP | 100 | 113,729 | |||||||||
Shop Direct Funding PLC, 7.75%, 11/15/22 (Call 11/15/19)(c) | GBP | 100 | 113,084 | |||||||||
Stonegate Pub Co. Financing PLC, 4.88%, 03/15/22 (Call 03/15/19)(c) | GBP | 150 | 188,028 | |||||||||
Tesco Corporate Treasury Services PLC | EUR | 100 | 112,497 | |||||||||
2.13%, 11/12/20 (Call 08/12/20)(c) | EUR | 100 | 117,091 | |||||||||
2.50%, 07/01/24(c) | EUR | 200 | 237,137 | |||||||||
Tesco PLC, 6.13%, 02/24/22 | GBP | 100 | 144,248 | |||||||||
Thomas Cook Group PLC, 6.25%, 06/15/22 (Call 06/15/19)(c) | EUR | 200 | 224,442 | |||||||||
Travelex Financing PLC, 8.00%, 05/15/22 (Call 05/15/20)(c) | EUR | 100 | 102,481 | |||||||||
Travis Perkins PLC, 4.38%, 09/15/21(c) | GBP | 100 | 128,333 | |||||||||
Virgin Media Finance PLC | EUR | 100 | 114,599 | |||||||||
5.75%, 01/15/25 (Call 01/15/20)(a)(b) | USD | 200 | 192,458 | |||||||||
Virgin Media Receivables Financing Notes I DAC, 5.50%, 09/15/24 (Call 09/15/19)(c) | GBP | 200 | 253,729 | |||||||||
Virgin Media Secured Finance PLC | GBP | 100 | 124,457 | |||||||||
5.00%, 04/15/27 (Call 04/15/22)(c) | GBP | 100 | 125,699 | |||||||||
5.25%, 01/15/26 (Call 01/15/20)(a) | USD | 200 | 186,875 | |||||||||
5.50%, 01/15/25 (Call 01/15/19)(c) | GBP | 90 | 117,268 | |||||||||
5.50%, 08/15/26 (Call 08/15/21)(a) | USD | 200 | 188,940 | |||||||||
6.25%, 03/28/29 (Call 01/15/21)(c) | GBP | 100 | 132,292 | |||||||||
Viridian Group FinanceCo PLC/Viridian Power and Energy, 4.00%, 09/15/25 (Call 09/15/20)(c) | EUR | 150 | 164,641 | |||||||||
Worldpay Finance PLC, 3.75%, 11/15/22 (Call 08/15/22)(c) | EUR | 100 | 122,286 | |||||||||
|
| |||||||||||
| 7,961,883 | ||||||||||||
United States — 65.0% | ||||||||||||
Acadia Healthcare Co. Inc., 5.63%, 02/15/23 (Call 12/03/18) | USD | 150 | 150,187 | |||||||||
Adient Global Holdings Ltd., 3.50%, 08/15/24 (Call 05/15/24)(c) | EUR | 200 | 197,450 | |||||||||
ADT Security Corp. (The) | USD | 150 | 139,379 | |||||||||
4.13%, 06/15/23 | USD | 150 | 139,125 | |||||||||
6.25%, 10/15/21 | USD | 175 | 180,687 | |||||||||
AECOM | USD | 200 | 186,250 | |||||||||
5.88%, 10/15/24 (Call 07/15/24) | USD | 150 | 152,625 | |||||||||
| 44 | 2 0 1 8 I S H A R E S A N N U A L R E P O R T T O S H A R E H O L D E R S |
Schedule of Investments (continued)
October 31, 2018 | iShares® US & Intl High Yield Corp Bond ETF
(Percentages shown are based on Net Assets) |
| Security | Par (000) | Value | ||||||||||
United States (continued) | ||||||||||||
AES Corp./VA | USD | 115 | $ | 113,806 | ||||||||
4.50%, 03/15/23 (Call 03/15/20) | USD | 115 | 113,663 | |||||||||
4.88%, 05/15/23 (Call 12/03/18)(b) | USD | 125 | 123,750 | |||||||||
5.13%, 09/01/27 (Call 09/01/22) | USD | 70 | 69,125 | |||||||||
5.50%, 04/15/25 (Call 04/15/20) | USD | 144 | 144,090 | |||||||||
6.00%, 05/15/26 (Call 05/15/21)(b) | USD | 75 | 76,627 | |||||||||
AK Steel Corp. | USD | 75 | 66,859 | |||||||||
7.63%, 10/01/21 (Call 12/03/18) | USD | 75 | 74,906 | |||||||||
Albertsons Companies LLC/Safeway Inc./New Albertson’s LP/Albertson’s LLC | USD | 225 | 198,623 | |||||||||
6.63%, 06/15/24 (Call 06/15/19) | USD | 225 | 212,871 | |||||||||
Alcoa Nederland Holding BV | USD | 200 | 208,700 | |||||||||
7.00%, 09/30/26 (Call 09/30/21)(a) | USD | 200 | 210,312 | |||||||||
Aleris International Inc., 10.75%, 07/15/23 (Call 07/15/20)(a) | USD | 75 | 78,528 | |||||||||
Allegheny Technologies Inc. | USD | 100 | 100,313 | |||||||||
7.88%, 08/15/23 (Call 05/15/23) | USD | 100 | 105,395 | |||||||||
Allison Transmission Inc. | USD | 75 | 68,813 | |||||||||
5.00%, 10/01/24 (Call 10/01/19)(a) | USD | 200 | 193,687 | |||||||||
Ally Financial Inc. | USD | 200 | 199,580 | |||||||||
4.13%, 03/30/20 | USD | 100 | 100,020 | |||||||||
4.13%, 02/13/22(b) | USD | 125 | 122,984 | |||||||||
4.25%, 04/15/21 | USD | 125 | 124,820 | |||||||||
4.63%, 05/19/22(b) | USD | 75 | 74,813 | |||||||||
4.63%, 03/30/25(b) | USD | 100 | 97,830 | |||||||||
5.13%, 09/30/24 | USD | 135 | 136,953 | |||||||||
5.75%, 11/20/25 (Call 10/21/25)(b) | USD | 200 | 205,000 | |||||||||
7.50%, 09/15/20 | USD | 25 | 26,404 | |||||||||
8.00%, 03/15/20 | USD | 100 | 104,994 | |||||||||
Altice U.S. Finance I Corp. | USD | 200 | 199,250 | |||||||||
5.50%, 05/15/26 (Call 05/15/21)(a) | USD | 400 | 389,624 | |||||||||
AMC Entertainment Holdings Inc. | USD | 125 | 115,781 | |||||||||
5.88%, 11/15/26 (Call 11/15/21) | USD | 90 | 82,392 | |||||||||
6.13%, 05/15/27 (Call 05/15/22) | USD | 100 | 91,425 | |||||||||
6.38%, 11/15/24 (Call 11/15/19) | GBP | 100 | 127,824 | |||||||||
AMC Networks Inc. | USD | 100 | 98,523 | |||||||||
4.75%, 08/01/25 (Call 08/01/21)(b) | USD | 150 | 139,248 | |||||||||
5.00%, 04/01/24 (Call 04/01/20)(b) | USD | 200 | 191,290 | |||||||||
American Airlines Group Inc., 4.63%, 03/01/20(a)(b) | USD | 100 | 100,061 | |||||||||
American Axle & Manufacturing Inc. | USD | 135 | 128,642 | |||||||||
6.25%, 03/15/26 (Call 03/15/21)(b) | USD | 70 | 66,238 | |||||||||
6.50%, 04/01/27 (Call 04/01/22)(b) | USD | 100 | 95,250 | |||||||||
6.63%, 10/15/22 (Call 12/03/18) | USD | 91 | 92,388 | |||||||||
AmeriGas Partners LP/AmeriGas Finance Corp. | USD | 125 | 117,251 | |||||||||
5.63%, 05/20/24 (Call 03/20/24) | USD | 125 | 119,598 | |||||||||
5.75%, 05/20/27 (Call 02/20/27) | USD | 100 | 93,063 | |||||||||
5.88%, 08/20/26 (Call 05/20/26) | USD | 125 | 118,137 | |||||||||
Anixter Inc., 5.13%, 10/01/21 | USD | 50 | 50,313 | |||||||||
| Security | Par (000) | Value | ||||||||||
United States (continued) | ||||||||||||
Antero Resources Corp. | USD | 125 | $ | 121,406 | ||||||||
5.13%, 12/01/22 (Call 12/03/18) | USD | 200 | 198,333 | |||||||||
5.38%, 11/01/21 (Call 12/03/18) | USD | 125 | 125,313 | |||||||||
5.63%, 06/01/23 (Call 12/03/18) | USD | 125 | 124,818 | |||||||||
APX Group Inc. | USD | 83 | 73,870 | |||||||||
7.88%, 12/01/22 (Call 12/03/18) | USD | 150 | 150,422 | |||||||||
8.75%, 12/01/20 (Call 12/03/18) | USD | 175 | 171,587 | |||||||||
Aramark International Finance Sarl, 3.13%, 04/01/25 (Call 04/01/20)(c) | EUR | 100 | 117,077 | |||||||||
Aramark Services Inc. | USD | 100 | 95,182 | |||||||||
5.00%, 04/01/25 (Call 04/01/20)(a) | USD | 75 | 74,041 | |||||||||
5.00%, 02/01/28 (Call 02/01/23)(a) | USD | 200 | 189,750 | |||||||||
5.13%, 01/15/24 (Call 01/15/19) | USD | 175 | 173,928 | |||||||||
Arconic Inc. | USD | 250 | 245,717 | |||||||||
5.40%, 04/15/21 (Call 01/15/21) | USD | 250 | 251,982 | |||||||||
5.87%, 02/23/22 | USD | 100 | 101,354 | |||||||||
6.15%, 08/15/20 | USD | 175 | 179,569 | |||||||||
Ascent Resources Utica Holdings LLC/ARU Finance Corp. | USD | 50 | 48,500 | |||||||||
10.00%, 04/01/22 (Call 04/01/20)(a)(b) | USD | 179 | 196,934 | |||||||||
Ashland LLC, 4.75%, 08/15/22 (Call 05/15/22) | USD | 200 | 198,250 | |||||||||
Avantor Inc. | EUR | 100 | 115,172 | |||||||||
6.00%, 10/01/24 (Call 10/01/20)(a) | USD | 285 | 283,887 | |||||||||
9.00%, 10/01/25 (Call 10/01/20)(a) | USD | 375 | 379,078 | |||||||||
Avis Budget Car Rental LLC/Avis Budget Finance Inc. | USD | 75 | 76,808 | |||||||||
5.50%, 04/01/23 (Call 12/03/18)(b) | USD | 100 | 97,250 | |||||||||
Avis Budget Finance PLC | EUR | 100 | 113,341 | |||||||||
4.75%, 01/30/26 (Call 09/30/21)(c) | EUR | 100 | 109,761 | |||||||||
Avon International Operations Inc., 7.88%, 08/15/22 (Call 08/15/19)(a) | USD | 100 | 101,500 | |||||||||
Avon Products Inc. | USD | 75 | 74,672 | |||||||||
7.00%, 03/15/23 | USD | 75 | 65,531 | |||||||||
Axalta Coating Systems Dutch Holding B BV, 3.75%, 01/15/25 (Call | EUR | 125 | 139,387 | |||||||||
B&G Foods Inc. | USD | 150 | 149,250 | |||||||||
5.25%, 04/01/25 (Call 04/01/20)(b) | USD | 175 | 166,281 | |||||||||
Ball Corp. | EUR | 100 | 119,893 | |||||||||
4.00%, 11/15/23(b) | USD | 175 | 169,829 | |||||||||
4.38%, 12/15/20 | USD | 150 | 150,187 | |||||||||
4.38%, 12/15/23 | EUR | 100 | 126,217 | |||||||||
4.88%, 03/15/26 (Call 12/15/25) | USD | 150 | 147,937 | |||||||||
5.00%, 03/15/22 | USD | 150 | 152,250 | |||||||||
5.25%, 07/01/25 | USD | 175 | 176,233 | |||||||||
Banff Merger Sub Inc. | EUR | 100 | 112,025 | |||||||||
9.75%, 09/01/26 (Call 09/01/21)(a) | USD | 260 | 251,008 | |||||||||
Bausch Health Companies Inc. | EUR | 225 | 246,589 | |||||||||
5.50%, 03/01/23 (Call 12/03/18)(a) | USD | 175 | 165,234 | |||||||||
S C H E D U L E O F I N V E S T M E N T S | 45 |
Schedule of Investments (continued)
October 31, 2018 | iShares® US & Intl High Yield Corp Bond ETF
(Percentages shown are based on Net Assets) |
| Security | Par (000) | Value | ||||||||||
United States (continued) | ||||||||||||
5.50%, 11/01/25 (Call 11/01/20)(a) | USD | 325 | $ | 319,076 | ||||||||
5.88%, 05/15/23 (Call 12/03/18)(a)(b) | USD | 550 | 526,854 | |||||||||
6.13%, 04/15/25 (Call 04/15/20)(a) | USD | 600 | 553,250 | |||||||||
6.50%, 03/15/22 (Call 03/15/19)(a) | USD | 250 | 259,062 | |||||||||
7.00%, 03/15/24 (Call 03/15/20)(a) | USD | 375 | 391,582 | |||||||||
9.00%, 12/15/25 (Call 12/15/21)(a) | USD | 285 | 297,214 | |||||||||
Bausch Health Companies Inc./U.S. | USD | 140 | 143,150 | |||||||||
9.25%, 04/01/26 (Call 04/01/22)(a) | USD | 275 | 288,979 | |||||||||
Beacon Roofing Supply Inc., 4.88%, 11/01/25 (Call 11/01/20)(a)(b) | USD | 260 | 233,350 | |||||||||
Beazer Homes USA Inc. | USD | 75 | 60,563 | |||||||||
8.75%, 03/15/22 (Call 03/15/19) | USD | 110 | 110,605 | |||||||||
Belden Inc., 3.88%, 03/15/28 (Call 03/15/23)(c) | EUR | 150 | 163,921 | |||||||||
Berry Global Inc. | USD | 90 | 83,960 | |||||||||
5.13%, 07/15/23 (Call 12/03/18) | USD | 125 | 124,231 | |||||||||
5.50%, 05/15/22 (Call 12/03/18) | USD | 100 | 100,125 | |||||||||
6.00%, 10/15/22 (Call 12/03/18) | USD | 90 | 91,736 | |||||||||
Blue Cube Spinco LLC | USD | 150 | 166,500 | |||||||||
10.00%, 10/15/25 (Call 10/15/20) | USD | 75 | 84,844 | |||||||||
Blue Racer Midstream LLC/Blue Racer Finance Corp., 6.13%, 11/15/22 (Call 12/03/18)(a) | USD | 150 | 152,818 | |||||||||
BlueLine Rental Finance Corp./BlueLine Rental LLC, 9.25%, 03/15/24 (Call 11/01/18)(a) | USD | 200 | 209,030 | |||||||||
Boyd Gaming Corp. | USD | 140 | 135,552 | |||||||||
6.38%, 04/01/26 (Call 04/01/21) | USD | 150 | 148,587 | |||||||||
6.88%, 05/15/23 (Call 11/16/18) | USD | 150 | 155,812 | |||||||||
Brand Industrial Services Inc., 8.50%, 07/15/25 (Call 07/15/20)(a)(b) | USD | 200 | 197,000 | |||||||||
Buckeye Partners LP, 6.38%, 01/22/78 (Call 01/22/23)(d)(e) | USD | 75 | 68,344 | |||||||||
BWAY Holding Co. | EUR | 100 | 114,014 | |||||||||
5.50%, 04/15/24 (Call 04/15/20)(a) | USD | 275 | 263,725 | |||||||||
7.25%, 04/15/25 (Call 04/15/20)(a)(b) | USD | 250 | 237,500 | |||||||||
Cablevision Systems Corp. | USD | 150 | 150,559 | |||||||||
8.00%, 04/15/20(b) | USD | 75 | 78,308 | |||||||||
Caesars Resort Collection LLC/CRC Finco Inc., 5.25%, 10/15/25 (Call 10/15/20)(a)(b) | USD | 300 | 279,187 | |||||||||
California Resources Corp., 8.00%, 12/15/22 (Call 12/15/18)(a)(b) | USD | 425 | 378,250 | |||||||||
Callon Petroleum Co. | USD | 100 | 97,500 | |||||||||
6.38%, 07/01/26 (Call 07/01/21)(b) | USD | 75 | 74,438 | |||||||||
Calpine Corp. | USD | 225 | 207,000 | |||||||||
5.38%, 01/15/23 (Call 12/03/18)(b) | USD | 250 | 236,875 | |||||||||
5.50%, 02/01/24 (Call 02/01/19)(b) | USD | 125 | 113,594 | |||||||||
5.75%, 01/15/25 (Call 10/15/19)(b) | USD | 275 | 246,070 | |||||||||
5.88%, 01/15/24 (Call 12/03/18)(a)(b) | USD | 75 | 74,813 | |||||||||
6.00%, 01/15/22 (Call 12/03/18)(a)(b) | USD | 125 | 125,566 | |||||||||
Calumet Specialty Products Partners LP/Calumet Finance Corp., 6.50%, 04/15/21 (Call 12/03/18) | USD | 175 | 168,437 | |||||||||
Carrizo Oil & Gas Inc., 7.50%, 09/15/20 (Call 11/19/18) | USD | 25 | 25,043 | |||||||||
| Security | Par (000) | Value | ||||||||||
United States (continued) | ||||||||||||
Catalent Pharma Solutions Inc., 4.75%, 12/15/24 (Call 12/15/19)(c) | EUR | 100 | $ | 118,366 | ||||||||
CBL & Associates LP | USD | 75 | 62,902 | |||||||||
5.95%, 12/15/26 (Call 09/15/26)(b) | USD | 125 | 103,844 | |||||||||
CCO Holdings LLC/CCO Holdings Capital Corp. | USD | 450 | 419,625 | |||||||||
5.13%, 02/15/23 (Call 12/03/18) | USD | 200 | 198,862 | |||||||||
5.13%, 05/01/23 (Call 12/03/18)(a) | USD | 225 | 224,156 | |||||||||
5.13%, 05/01/27 (Call 05/01/22)(a) | USD | 600 | 563,344 | |||||||||
5.25%, 03/15/21 (Call 12/03/18) | USD | 50 | 50,131 | |||||||||
5.25%, 09/30/22 (Call 12/03/18) | USD | 200 | 201,375 | |||||||||
5.38%, 05/01/25 (Call 05/01/20)(a) | USD | 150 | 146,830 | |||||||||
5.50%, 05/01/26 (Call 05/01/21)(a) | USD | 275 | 267,266 | |||||||||
5.75%, 09/01/23 (Call 12/03/18)(b) | USD | 100 | 100,609 | |||||||||
5.75%, 01/15/24 (Call 12/03/18) | USD | 225 | 227,250 | |||||||||
5.75%, 02/15/26 (Call 02/15/21)(a)(b) | USD | 500 | 494,844 | |||||||||
5.88%, 04/01/24 (Call 04/01/19)(a) | USD | 350 | 352,406 | |||||||||
5.88%, 05/01/27 (Call 05/01/21)(a)(b) | USD | 125 | 122,813 | |||||||||
CDK Global Inc. | USD | 130 | 122,200 | |||||||||
5.00%, 10/15/24 (Call 07/15/24) | USD | 100 | 98,720 | |||||||||
5.88%, 06/15/26 (Call 06/15/21) | USD | 95 | 95,713 | |||||||||
CDW LLC/CDW Finance Corp. | USD | 100 | 99,216 | |||||||||
5.00%, 09/01/25 (Call 03/01/20) | USD | 125 | 120,938 | |||||||||
5.50%, 12/01/24 (Call 06/01/24)(b) | USD | 75 | 75,094 | |||||||||
Centene Corp. | USD | 200 | 199,760 | |||||||||
4.75%, 01/15/25 (Call 01/15/20) | USD | 200 | 197,500 | |||||||||
5.38%, 06/01/26 (Call 06/01/21)(a) | USD | 355 | 360,325 | |||||||||
5.63%, 02/15/21 (Call 12/03/18) | USD | 250 | 253,453 | |||||||||
6.13%, 02/15/24 (Call 02/15/19) | USD | 200 | 208,775 | |||||||||
CenturyLink Inc. | USD | 100 | 95,675 | |||||||||
Series S, 6.45%, 06/15/21 | USD | 275 | 281,073 | |||||||||
Series T, 5.80%, 03/15/22 | USD | 300 | 300,094 | |||||||||
Series V, 5.63%, 04/01/20 | USD | 225 | 227,645 | |||||||||
Series W, 6.75%, 12/01/23(b) | USD | 150 | 152,925 | |||||||||
Series Y, 7.50%, 04/01/24 (Call 01/01/24)(b) | USD | 175 | 182,875 | |||||||||
Cequel Communications Holdings I LLC/Cequel Capital Corp. | USD | 200 | 199,456 | |||||||||
7.50%, 04/01/28 (Call 04/01/23)(a)(b) | USD | 200 | 207,940 | |||||||||
Ceva Logistics Finance BV, 5.25%, 08/01/25 (Call 08/01/21)(c) | EUR | 100 | 113,810 | |||||||||
CF Industries Inc. | USD | 100 | 94,688 | |||||||||
7.13%, 05/01/20 | USD | 174 | 180,742 | |||||||||
Change Healthcare Holdings LLC/Change Healthcare Finance Inc., 5.75%, 03/01/25 (Call 03/01/20)(a)(b) | USD | 190 | 185,725 | |||||||||
Chemours Co. (The) | USD | 100 | 93,000 | |||||||||
6.63%, 05/15/23 (Call 12/03/18) | USD | 104 | 106,340 | |||||||||
7.00%, 05/15/25 (Call 05/15/20) | USD | 150 | 154,045 | |||||||||
Cheniere Corpus Christi Holdings LLC | USD | 275 | 269,503 | |||||||||
5.88%, 03/31/25 (Call 10/02/24) | USD | 275 | 282,941 | |||||||||
7.00%, 06/30/24 (Call 01/01/24) | USD | 200 | 216,295 | |||||||||
| 46 | 2 0 1 8 I S H A R E S A N N U A L R E P O R T T O S H A R E H O L D E R S |
Schedule of Investments (continued)
October 31, 2018 | iShares® US & Intl High Yield Corp Bond ETF
(Percentages shown are based on Net Assets) |
| Security | Par (000) | Value | ||||||||||
United States (continued) | ||||||||||||
Cheniere Energy Partners LP | ||||||||||||
5.25%, 10/01/25 (Call 10/01/20)(b) | USD | 300 | $ | 294,657 | ||||||||
5.63%, 10/01/26 (Call 10/01/21)(a) | USD | 205 | 201,541 | |||||||||
Chesapeake Energy Corp. | ||||||||||||
4.88%, 04/15/22 (Call 12/03/18)(b) | USD | 75 | 71,320 | |||||||||
6.13%, 02/15/21 | USD | 75 | 75,604 | |||||||||
6.63%, 08/15/20 | USD | 75 | 77,213 | |||||||||
7.00%, 10/01/24 (Call 04/01/21) | USD | 135 | 131,794 | |||||||||
7.50%, 10/01/26 (Call 10/01/21) | USD | 90 | 88,200 | |||||||||
8.00%, 12/15/22 (Call 11/28/18)(a)(b) | USD | 270 | 281,954 | |||||||||
8.00%, 01/15/25 (Call 01/15/20)(b) | USD | 250 | 253,125 | |||||||||
8.00%, 06/15/27 (Call 06/15/22) | USD | 250 | 248,750 | |||||||||
CHS/Community Health Systems Inc. | USD | 175 | 165,375 | |||||||||
6.25%, 03/31/23 (Call 03/31/20) | USD | 600 | 551,820 | |||||||||
6.88%, 02/01/22 (Call 12/03/18) | USD | 450 | 226,125 | |||||||||
8.13%, 06/30/24 (Call 06/30/21)(a)(b) | USD | 225 | 176,625 | |||||||||
8.63%, 01/15/24 (Call 01/15/21)(a)(b) | USD | 200 | 201,750 | |||||||||
11.00%, 06/30/23 | USD | 350 | 292,250 | |||||||||
Cincinnati Bell Inc., 7.00%, 07/15/24 (Call 09/15/19)(a)(b) | USD | 100 | 89,750 | |||||||||
Cinemark USA Inc. | USD | 150 | 146,437 | |||||||||
5.13%, 12/15/22 (Call 12/03/18) | USD | 75 | 75,188 | |||||||||
CIT Group Inc. | USD | 100 | 99,544 | |||||||||
4.75%, 02/16/24 (Call 11/16/23) | USD | 100 | 98,660 | |||||||||
5.00%, 08/15/22 | USD | 200 | 201,250 | |||||||||
5.00%, 08/01/23 | USD | 150 | 150,438 | |||||||||
5.25%, 03/07/25 (Call 12/07/24) | USD | 100 | 100,714 | |||||||||
5.38%, 05/15/20 | USD | 75 | 76,738 | |||||||||
6.13%, 03/09/28(b) | USD | 75 | 77,727 | |||||||||
Clear Channel Worldwide Holdings Inc. | ||||||||||||
Series A, 6.50%, 11/15/22 (Call 12/03/18) | USD | 100 | 101,000 | |||||||||
Series B, 6.50%, 11/15/22 (Call 12/03/18)(b) | USD | 400 | 407,000 | |||||||||
Series B, 7.63%, 03/15/20 (Call 12/03/18) | USD | 300 | 300,000 | |||||||||
Clearway Energy Operating LLC, 5.75%, 10/15/25 (Call 10/15/21)(a) | USD | 60 | 59,100 | |||||||||
Cleveland-Cliffs Inc. | USD | 50 | 48,028 | |||||||||
5.75%, 03/01/25 (Call 03/01/20) | USD | 210 | 198,450 | |||||||||
CNX Resources Corp., 5.88%, 04/15/22 (Call 12/03/18) | USD | 225 | 221,872 | |||||||||
Colfax Corp., 3.25%, 05/15/25 (Call 05/15/20)(c) | EUR | 125 | 141,802 | |||||||||
CommScope Inc. | USD | 100 | 99,575 | |||||||||
5.50%, 06/15/24 (Call 06/15/19)(a) | USD | 160 | 154,800 | |||||||||
CommScope Technologies LLC | USD | 150 | 133,807 | |||||||||
6.00%, 06/15/25 (Call 06/15/20)(a) | USD | 230 | 223,675 | |||||||||
Continental Resources Inc./OK | USD | 200 | 193,146 | |||||||||
4.38%, 01/15/28 (Call 10/15/27) | USD | 185 | 178,537 | |||||||||
4.50%, 04/15/23 (Call 01/15/23) | USD | 275 | 275,451 | |||||||||
5.00%, 09/15/22 (Call 12/03/18) | USD | 280 | 282,736 | |||||||||
Coty Inc., 4.75%, 04/15/26 (Call 04/15/21)(c) | EUR | 100 | 106,538 | |||||||||
Covanta Holding Corp. | USD | 75 | 74,507 | |||||||||
5.88%, 07/01/25 (Call 07/01/20) | USD | 50 | 48,625 | |||||||||
6.00%, 01/01/27 (Call 01/01/22) | USD | 125 | 120,625 | |||||||||
6.38%, 10/01/22 (Call 11/03/18) | USD | 75 | 76,464 | |||||||||
| Security | Par (000) | Value | ||||||||||
United States (continued) | ||||||||||||
Crestwood Midstream Partners LP/Crestwood Midstream Finance Corp. | USD | 100 | $ | 99,615 | ||||||||
6.25%, 04/01/23 (Call 11/16/18) | USD | 125 | 126,741 | |||||||||
Crown Americas LLC/Crown Americas Capital Corp. IV, 4.50%, 01/15/23 | USD | 175 | 171,345 | |||||||||
Crown Americas LLC/Crown Americas Capital Corp. V, 4.25%, 09/30/26 (Call 03/31/26)(b) | USD | 75 | 67,994 | |||||||||
Crown Americas LLC/Crown Americas Capital Corp. VI, 4.75%, 02/01/26 (Call 02/01/21)(a) | USD | 175 | 165,156 | |||||||||
Crown European Holdings SA | EUR | 100 | 115,007 | |||||||||
2.63%, 09/30/24 (Call 03/31/24)(c) | EUR | 100 | 114,125 | |||||||||
2.88%, 02/01/26 (Call 08/01/25)(c) | EUR | 100 | 110,785 | |||||||||
3.38%, 05/15/25 (Call 11/15/24)(c) | EUR | 100 | 116,064 | |||||||||
4.00%, 07/15/22 (Call 04/15/22)(c) | EUR | 100 | 124,591 | |||||||||
CrownRock LP/CrownRock Finance Inc., 5.63%, 10/15/25 | USD | 225 | 214,031 | |||||||||
CSC Holdings LLC | USD | 125 | 120,469 | |||||||||
5.38%, 02/01/28 (Call 02/01/23)(a) | USD | 200 | 188,045 | |||||||||
5.50%, 04/15/27 (Call 04/15/22)(a)(b) | USD | 200 | 191,765 | |||||||||
6.63%, 10/15/25 (Call 10/15/20)(a)(b) | USD | 200 | 209,500 | |||||||||
6.75%, 11/15/21 | USD | 225 | 235,222 | |||||||||
10.13%, 01/15/23 (Call 01/15/19)(a) | USD | 200 | 217,344 | |||||||||
10.88%, 10/15/25 (Call 10/15/20)(a) | USD | 336 | 387,240 | |||||||||
CyrusOne LP/CyrusOne Finance Corp., 5.38%, 03/15/27 (Call 03/15/22) | USD | 100 | 99,500 | |||||||||
Dana Financing Luxembourg Sarl, 5.75%, 04/15/25 (Call 04/15/20)(a)(b) | USD | 75 | 71,813 | |||||||||
Dana Inc., 5.50%, 12/15/24 (Call 12/15/19)(b) | USD | 75 | 72,263 | |||||||||
Darling Global Finance BV, 3.63%, 05/15/26 (Call 05/15/21)(c) | EUR | 100 | 114,769 | |||||||||
DaVita Inc. | USD | 275 | 258,553 | |||||||||
5.13%, 07/15/24 (Call 07/15/19) | USD | 325 | 309,867 | |||||||||
5.75%, 08/15/22 (Call 12/03/18) | USD | 200 | 202,500 | |||||||||
DCP Midstream Operating LP | USD | 100 | 96,146 | |||||||||
4.75%, 09/30/21 (Call 06/30/21)(a)(b) | USD | 100 | 100,139 | |||||||||
5.35%, 03/15/20(a) | USD | 100 | 101,125 | |||||||||
5.38%, 07/15/25 (Call 04/15/25) | USD | 90 | 91,265 | |||||||||
5.85%, 05/21/43 | USD | 100 | 89,311 | |||||||||
Dell Inc., 4.63%, 04/01/21 | USD | 75 | 75,469 | |||||||||
Dell International LLC/EMC Corp. | USD | 300 | 304,875 | |||||||||
7.13%, 06/15/24 (Call 06/15/19)(a) | USD | 300 | 316,918 | |||||||||
Denbury Resources Inc. | USD | 90 | 87,871 | |||||||||
9.00%, 05/15/21 (Call 12/15/18)(a) | USD | 100 | 104,375 | |||||||||
9.25%, 03/31/22 (Call 03/31/19)(a)(b) | USD | 100 | 104,042 | |||||||||
Diamond BC BV, 5.63%, 08/15/25 (Call 08/15/20)(c) | EUR | 100 | 106,515 | |||||||||
Diamond Offshore Drilling Inc., 7.88%, 08/15/25 (Call 05/15/25)(b) | USD | 105 | 103,425 | |||||||||
Diamond Resorts International Inc. | USD | 100 | 102,375 | |||||||||
10.75%, 09/01/24 | USD | 75 | 73,487 | |||||||||
Diamondback Energy Inc. | USD | 100 | 97,250 | |||||||||
5.38%, 05/31/25 (Call 05/31/20) | USD | 110 | 109,450 | |||||||||
S C H E D U L E O F I N V E S T M E N T S | 47 |
Schedule of Investments (continued)
October 31, 2018 | iShares® US & Intl High Yield Corp Bond ETF
(Percentages shown are based on Net Assets) |
| Security | Par (000) | Value | ||||||||||
United States (continued) | ||||||||||||
DISH DBS Corp. | USD | 275 | $ | 240,625 | ||||||||
5.13%, 05/01/20 | USD | 200 | 200,500 | |||||||||
5.88%, 07/15/22(b) | USD | 375 | 354,094 | |||||||||
5.88%, 11/15/24(b) | USD | 375 | 317,234 | |||||||||
6.75%, 06/01/21 | USD | 375 | 378,750 | |||||||||
7.75%, 07/01/26(b) | USD | 375 | 332,340 | |||||||||
DJO Finance LLC/DJO Finance Corp., 8.13%, 06/15/21 (Call 12/03/18)(a) | USD | 200 | 201,340 | |||||||||
Edgewell Personal Care Co. | USD | 150 | 149,530 | |||||||||
4.70%, 05/24/22(b) | USD | 50 | 48,769 | |||||||||
Elanco Animal Health Inc. | USD | 75 | 74,907 | |||||||||
4.27%, 08/28/23 (Call 07/28/23)(a) | USD | 135 | 134,311 | |||||||||
4.90%, 08/28/28 (Call 05/28/28)(a) | USD | 140 | 140,284 | |||||||||
Eldorado Resorts Inc. | USD | 160 | 158,225 | |||||||||
6.00%, 09/15/26 (Call 09/15/21)(a)(b) | USD | 115 | 112,737 | |||||||||
EMC Corp. | USD | 375 | 364,357 | |||||||||
3.38%, 06/01/23 (Call 03/01/23) | USD | 200 | 186,810 | |||||||||
Encompass Health Corp., 5.75%, 11/01/24 (Call 12/03/18) | USD | 225 | 224,616 | |||||||||
Endeavor Energy Resources LP/EER Finance Inc. | USD | 105 | 107,888 | |||||||||
5.75%, 01/30/28 (Call 01/30/23)(a) | USD | 90 | 92,742 | |||||||||
Endo Dac/Endo Finance LLC/Endo Finco Inc. | USD | 400 | 343,731 | |||||||||
6.00%, 02/01/25 (Call 02/01/20)(a) | USD | 200 | 167,500 | |||||||||
Endo Finance LLC, 5.75%, 01/15/22 (Call 12/03/18)(a) | USD | 125 | 113,438 | |||||||||
Endo Finance LLC/Endo Finco Inc., 5.38%, 01/15/23 (Call 12/03/18)(a) | USD | 50 | 42,688 | |||||||||
Energizer Gamma Acquisition BV, 4.63%, 07/15/26 (Call 07/15/21)(c) | EUR | 150 | 173,888 | |||||||||
Energizer Gamma Acquisition Inc., 6.38%, 07/15/26 (Call 07/15/21)(a)(b) | USD | 190 | 191,900 | |||||||||
Energy Transfer LP | USD | 175 | 173,384 | |||||||||
5.50%, 06/01/27 (Call 03/01/27) | USD | 175 | 178,062 | |||||||||
5.88%, 01/15/24 (Call 10/15/23) | USD | 200 | 210,000 | |||||||||
7.50%, 10/15/20 | USD | 225 | 238,500 | |||||||||
Ensco PLC | USD | 125 | 101,250 | |||||||||
5.20%, 03/15/25 (Call 12/15/24)(b) | USD | 125 | 102,670 | |||||||||
7.75%, 02/01/26 (Call 11/01/25)(b) | USD | 175 | 163,187 | |||||||||
Envision Healthcare Corp., 8.75%, 10/15/26 (Call 10/15/21)(a) | USD | 190 | 184,003 | |||||||||
EP Energy LLC/Everest Acquisition Finance Inc. | USD | 190 | 190,000 | |||||||||
8.00%, 11/29/24 (Call 11/30/19)(a)(b) | USD | 100 | 97,321 | |||||||||
8.00%, 02/15/25 (Call 02/15/20)(a) | USD | 180 | 121,500 | |||||||||
9.38%, 05/01/24 (Call 05/01/20)(a) | USD | 200 | 152,000 | |||||||||
Equinix Inc. | EUR | 100 | 114,600 | |||||||||
2.88%, 10/01/25 (Call 10/01/20) | EUR | 150 | 166,173 | |||||||||
2.88%, 02/01/26 (Call 02/01/21) | EUR | 200 | 220,870 | |||||||||
5.38%, 01/01/22 (Call 12/03/18) | USD | 150 | 152,712 | |||||||||
5.38%, 04/01/23 (Call 12/03/18) | USD | 200 | 203,250 | |||||||||
5.38%, 05/15/27 (Call 05/15/22) | USD | 230 | 227,542 | |||||||||
| Security | Par (000) | Value | ||||||||||
United States (continued) | ||||||||||||
5.75%, 01/01/25 (Call 01/01/20) | USD | 100 | $ | 101,725 | ||||||||
5.88%, 01/15/26 (Call 01/15/21) | USD | 225 | 227,850 | |||||||||
ESH Hospitality Inc., 5.25%, 05/01/25 (Call 05/01/20)(a) | USD | 255 | 241,612 | |||||||||
Exela Intermediate LLC/Exela Finance Inc., 10.00%, 07/15/23 | USD | 175 | 181,080 | |||||||||
Extraction Oil & Gas Inc. | USD | 140 | 119,875 | |||||||||
7.38%, 05/15/24 (Call 05/15/20)(a)(b) | USD | 75 | 70,313 | |||||||||
Ferrellgas LP/Ferrellgas Finance Corp. | USD | 125 | 111,652 | |||||||||
6.75%, 01/15/22 (Call 12/03/18)(b) | USD | 50 | 43,388 | |||||||||
6.75%, 06/15/23 (Call 06/15/19)(b) | USD | 100 | 86,750 | |||||||||
Fifth Third Bancorp., 5.10%, (Call 06/30/23)(d)(e)(h) | USD | 125 | 119,240 | |||||||||
First Data Corp. | USD | 350 | 346,500 | |||||||||
5.38%, 08/15/23 (Call 11/13/18)(a) | USD | 225 | 226,969 | |||||||||
5.75%, 01/15/24 (Call 01/15/19)(a) | USD | 400 | 402,099 | |||||||||
7.00%, 12/01/23 (Call 12/01/18)(a) | USD | 625 | 648,125 | |||||||||
First Quality Finance Co. Inc. | USD | 150 | 147,438 | |||||||||
5.00%, 07/01/25 (Call 07/01/20)(a) | USD | 45 | 41,400 | |||||||||
Flex Acquisition Co. Inc. | USD | 100 | 93,347 | |||||||||
7.88%, 07/15/26 (Call 07/15/21)(a) | USD | 105 | 101,357 | |||||||||
Freedom Mortgage Corp. | USD | 50 | 46,134 | |||||||||
8.25%, 04/15/25 (Call 04/15/21)(a) | USD | 150 | 138,450 | |||||||||
Freeport-McMoRan Inc. | USD | 181 | 177,957 | |||||||||
3.55%, 03/01/22 (Call 12/01/21) | USD | 350 | 331,432 | |||||||||
3.88%, 03/15/23 (Call 12/15/22) | USD | 375 | 347,737 | |||||||||
4.00%, 11/14/21 | USD | 100 | 97,313 | |||||||||
4.55%, 11/14/24 (Call 08/14/24)(b) | USD | 150 | 138,937 | |||||||||
6.88%, 02/15/23 (Call 02/15/20) | USD | 150 | 157,087 | |||||||||
Frontier Communications Corp. | USD | 150 | 84,563 | |||||||||
7.13%, 01/15/23 | USD | 125 | 83,156 | |||||||||
7.63%, 04/15/24 | USD | 150 | 90,375 | |||||||||
8.50%, 04/01/26 (Call 04/01/21)(a) | USD | 300 | 279,141 | |||||||||
8.75%, 04/15/22 | USD | 100 | 77,400 | |||||||||
10.50%, 09/15/22 (Call 06/15/22) | USD | 400 | 333,500 | |||||||||
11.00%, 09/15/25 (Call 06/15/25) | USD | 675 | 496,969 | |||||||||
Genesis Energy LP/Genesis Energy Finance Corp. | USD | 75 | 70,852 | |||||||||
6.25%, 05/15/26 (Call 02/15/21) | USD | 75 | 67,828 | |||||||||
6.50%, 10/01/25 (Call 10/01/20)(b) | USD | 110 | 101,750 | |||||||||
6.75%, 08/01/22 (Call 12/03/18) | USD | 150 | 150,388 | |||||||||
Genworth Holdings Inc., 7.63%, 09/24/21 | USD | 150 | 152,625 | |||||||||
Golden Nugget Inc. | USD | 250 | 249,375 | |||||||||
8.75%, 10/01/25 (Call 10/01/20)(a) | USD | 125 | 128,437 | |||||||||
Goodyear Dunlop Tires Europe BV, 3.75%, 12/15/23 (Call 12/15/18)(c) | EUR | 100 | 113,930 | |||||||||
Goodyear Tire & Rubber Co. (The) | USD | 125 | 111,158 | |||||||||
5.00%, 05/31/26 (Call 05/31/21)(b) | USD | 150 | 135,750 | |||||||||
5.13%, 11/15/23 (Call 12/03/18)(b) | USD | 175 | 170,469 | |||||||||
Gray Television Inc. | USD | 100 | 95,031 | |||||||||
5.88%, 07/15/26 (Call 07/15/21)(a) | USD | 130 | 124,624 | |||||||||
| 48 | 2 0 1 8 I S H A R E S A N N U A L R E P O R T T O S H A R E H O L D E R S |
Schedule of Investments (continued)
October 31, 2018 | iShares® US & Intl High Yield Corp Bond ETF
(Percentages shown are based on Net Assets) |
| Security | Par (000) | Value | ||||||||||
United States (continued) | ||||||||||||
Griffon Corp., 5.25%, 03/01/22 (Call 12/03/18) | USD | 200 | $ | 187,500 | ||||||||
Gulfport Energy Corp. | USD | 125 | 117,188 | |||||||||
6.38%, 05/15/25 (Call 05/15/20)(b) | USD | 100 | 94,321 | |||||||||
6.38%, 01/15/26 (Call 01/15/21) | USD | 75 | 69,855 | |||||||||
Hanesbrands Finance Luxembourg SCA, 3.50%, 06/15/24 (Call 03/15/24)(c) | EUR | 100 | 117,144 | |||||||||
Hanesbrands Inc. | USD | 125 | 119,870 | |||||||||
4.88%, 05/15/26 (Call 02/15/26)(a)(b) | USD | 175 | 165,812 | |||||||||
Harland Clarke Holdings Corp. | USD | 165 | 148,781 | |||||||||
9.25%, 03/01/21 (Call 12/03/18)(a)(b) | USD | 125 | 110,625 | |||||||||
HCA Healthcare Inc., 6.25%, 02/15/21 | USD | 175 | 181,562 | |||||||||
HCA Inc. 4.50%, 02/15/27 | USD | 230 | 222,857 | |||||||||
4.75%, 05/01/23 | USD | 250 | 251,501 | |||||||||
5.00%, 03/15/24 | USD | 375 | 380,156 | |||||||||
5.25%, 04/15/25 | USD | 250 | 255,047 | |||||||||
5.25%, 06/15/26 (Call 12/15/25) | USD | 275 | 279,755 | |||||||||
5.38%, 02/01/25 | USD | 525 | 527,158 | |||||||||
5.38%, 09/01/26 (Call 03/01/26) | USD | 170 | 168,381 | |||||||||
5.63%, 09/01/28 (Call 03/01/28) | USD | 180 | 178,200 | |||||||||
5.88%, 03/15/22 | USD | 200 | 208,738 | |||||||||
5.88%, 05/01/23 | USD | 225 | 233,290 | |||||||||
5.88%, 02/15/26 (Call 08/15/25) | USD | 275 | 281,297 | |||||||||
6.50%, 02/15/20 | USD | 500 | 516,250 | |||||||||
7.50%, 02/15/22 | USD | 375 | 407,531 | |||||||||
Hertz Corp. (The) | USD | 150 | 115,137 | |||||||||
5.88%, 10/15/20 (Call 12/03/18) | USD | 125 | 122,007 | |||||||||
6.25%, 10/15/22 (Call 12/03/18)(b) | USD | 100 | 87,531 | |||||||||
7.38%, 01/15/21 (Call 12/03/18) | USD | 50 | 49,375 | |||||||||
7.63%, 06/01/22 (Call 06/01/19)(a) | USD | 250 | 239,487 | |||||||||
Hertz Holdings Netherlands BV, 5.50%, 03/30/23 (Call 03/30/20)(c) | EUR | 100 | 113,245 | |||||||||
Hexion Inc. | USD | 300 | 265,500 | |||||||||
10.38%, 02/01/22 (Call 02/01/19)(a) | USD | 105 | 93,926 | |||||||||
Hexion Inc./Hexion Nova Scotia Finance ULC, 9.00%, 11/15/20 (Call 12/03/18)(b) | USD | 100 | 58,000 | |||||||||
Hilcorp Energy I LP/Hilcorp Finance Co. | USD | 100 | 94,250 | |||||||||
5.75%, 10/01/25 (Call 04/01/20)(a) | USD | 100 | 97,302 | |||||||||
6.25%, 11/01/28 (Call 11/01/23)(a) | USD | 60 | 57,751 | |||||||||
Hilton Domestic Operating Co. Inc. | USD | 175 | 167,081 | |||||||||
5.13%, 05/01/26 (Call 05/01/21)(a)(b) | USD | 275 | 268,812 | |||||||||
Hilton Worldwide Finance LLC/Hilton Worldwide Finance Corp. | USD | 150 | 145,500 | |||||||||
4.88%, 04/01/27 (Call 04/01/22) | USD | 125 | 119,277 | |||||||||
Hologic Inc., 4.63%, 02/01/28 (Call 02/01/23)(a) | USD | 175 | 159,906 | |||||||||
Howard Hughes Corp. (The), 5.38%, 03/15/25 (Call 03/15/20)(a) | USD | 200 | 192,000 | |||||||||
HUB International Ltd., 7.00%, 05/01/26 (Call 05/01/21)(a)(b) | USD | 245 | 238,844 | |||||||||
| Security | Par (000) | Value | ||||||||||
United States (continued) | ||||||||||||
Hughes Satellite Systems Corp. | USD | 135 | $ | 128,388 | ||||||||
6.63%, 08/01/26(b) | USD | 140 | 133,350 | |||||||||
7.63%, 06/15/21 | USD | 175 | 186,178 | |||||||||
Huntsman International LLC | USD | 125 | 125,823 | |||||||||
5.13%, 04/15/21 (Call 01/15/21) | EUR | 100 | 122,899 | |||||||||
5.13%, 11/15/22 (Call 08/15/22) | USD | 100 | 101,125 | |||||||||
Icahn Enterprises LP/Icahn Enterprises Finance Corp. | USD | 250 | 249,587 | |||||||||
6.00%, 08/01/20 (Call 12/03/18)(b) | USD | 325 | 327,731 | |||||||||
6.25%, 02/01/22 (Call 02/01/19)(b) | USD | 225 | 227,250 | |||||||||
6.38%, 12/15/25 (Call 12/15/20) | USD | 125 | 124,219 | |||||||||
6.75%, 02/01/24 (Call 02/01/20) | USD | 100 | 100,425 | |||||||||
Infor U.S. Inc. | USD | 100 | 100,833 | |||||||||
5.75%, 05/15/22 (Call 11/15/18) | EUR | 100 | 116,265 | |||||||||
6.50%, 05/15/22 (Call 11/16/18) | USD | 300 | 300,094 | |||||||||
International Game Technology PLC | EUR | 100 | 113,349 | |||||||||
4.75%, 03/05/20(c) | EUR | 100 | 118,954 | |||||||||
6.25%, 02/15/22 (Call 08/15/21)(a) | USD | 250 | 257,500 | |||||||||
6.50%, 02/15/25 (Call 08/15/24)(a) | USD | 200 | 202,667 | |||||||||
IQVIA Inc. | EUR | 100 | 110,514 | |||||||||
3.25%, 03/15/25 (Call 03/15/20)(c) | EUR | 200 | 229,061 | |||||||||
3.50%, 10/15/24 (Call 10/15/19)(c) | EUR | 100 | 116,253 | |||||||||
4.88%, 05/15/23 (Call 12/03/18)(a) | USD | 150 | 148,875 | |||||||||
5.00%, 10/15/26 (Call 10/15/21)(a) | USD | 200 | 191,639 | |||||||||
Iron Mountain Inc. | USD | 175 | 155,896 | |||||||||
5.25%, 03/15/28 (Call 12/27/22)(a) | USD | 175 | 157,150 | |||||||||
5.75%, 08/15/24 (Call 11/13/18)(b) | USD | 200 | 196,250 | |||||||||
6.00%, 08/15/23 (Call 11/13/18) | USD | 150 | 153,562 | |||||||||
Iron Mountain UK PLC, 3.88%, 11/15/25 (Call 11/15/20)(c) | GBP | 100 | 120,413 | |||||||||
iStar Inc. | USD | 75 | 74,318 | |||||||||
5.25%, 09/15/22 (Call 09/15/19)(b) | USD | 100 | 96,547 | |||||||||
Jack Ohio Finance LLC/Jack Ohio Finance 1 Corp., 6.75%, 11/15/21 (Call 12/03/18)(a) | USD | 150 | 153,750 | |||||||||
Jaguar Holding Co. II/Pharmaceutical Product Development LLC, 6.38%, 08/01/23 (Call 12/03/18)(a) | USD | 200 | 199,940 | |||||||||
JC Penney Corp. Inc. | USD | 75 | 64,457 | |||||||||
8.63%, 03/15/25 (Call 03/15/21)(a)(b) | USD | 75 | 48,281 | |||||||||
Jefferies Finance LLC/JFIN Co-Issuer Corp., 7.25%, 08/15/24 (Call 08/15/20)(a) | USD | 200 | 195,467 | |||||||||
Jones Energy Holdings LLC/Jones Energy Finance Corp., 9.25%, 03/15/23 (Call 03/15/20)(a) | USD | 150 | 150,000 | |||||||||
K Hovnanian Enterprises Inc. | USD | 75 | 72,375 | |||||||||
10.50%, 07/15/24 (Call 07/15/20)(a) | USD | 75 | 68,656 | |||||||||
KB Home, 7.00%, 12/15/21 (Call 09/15/21) | USD | 75 | 77,826 | |||||||||
Kennedy-Wilson Inc., 5.88%, 04/01/24 (Call 04/01/19) | USD | 175 | 167,708 | |||||||||
KFC Holding Co./Pizza Hut Holdings LLC/Taco Bell of America LLC | USD | 150 | 140,263 | |||||||||
5.00%, 06/01/24 (Call 06/01/19)(a)(b) | USD | 200 | 197,250 | |||||||||
5.25%, 06/01/26 (Call 06/01/21)(a) | USD | 200 | 196,068 | |||||||||
S C H E D U L E O F I N V E S T M E N T S | 49 |
Schedule of Investments (continued)
October 31, 2018 | iShares® US & Intl High Yield Corp Bond ETF
(Percentages shown are based on Net Assets) |
| Security | Par (000) | Value | ||||||||||
United States (continued) | ||||||||||||
Kinetic Concepts Inc./KCI USA Inc. | USD | 100 | $ | 102,069 | ||||||||
12.50%, 11/01/21 (Call 05/01/19)(a) | USD | 75 | 81,113 | |||||||||
KLX Inc., 5.88%, 12/01/22 (Call 12/01/18)(a) | USD | 225 | 231,784 | |||||||||
Kraton Polymers LLC/Kraton Polymers Capital Corp., 5.25%, 05/15/26 (Call 05/15/21)(c) | EUR | 100 | 109,114 | |||||||||
Kronos Acquisition Holdings Inc., 9.00%, 08/15/23 (Call 12/03/18)(a) | USD | 165 | 146,644 | |||||||||
L Brands Inc. | USD | 100 | 85,248 | |||||||||
5.63%, 02/15/22 | USD | 175 | 177,144 | |||||||||
5.63%, 10/15/23 | USD | 100 | 98,840 | |||||||||
6.63%, 04/01/21 | USD | 125 | 130,075 | |||||||||
Ladder Capital Finance Holdings LLLP/Ladder Capital Finance Corp. | USD | 50 | 49,823 | |||||||||
5.25%, 10/01/25 (Call 10/01/20)(a) | USD | 85 | 78,501 | |||||||||
Lamar Media Corp. | USD | 150 | 149,625 | |||||||||
5.38%, 01/15/24 (Call 01/15/19) | USD | 50 | 50,054 | |||||||||
5.75%, 02/01/26 (Call 02/01/21)(b) | USD | 75 | 75,426 | |||||||||
Lamb Weston Holdings Inc. | USD | 150 | 146,920 | |||||||||
4.88%, 11/01/26 (Call 11/01/21)(a) | USD | 150 | 144,643 | |||||||||
Leidos Holdings Inc., 4.45%, 12/01/20 (Call 09/01/20) | USD | 50 | 50,142 | |||||||||
Lennar Corp. | USD | 125 | 121,538 | |||||||||
4.50%, 11/15/19 (Call 08/15/19)(b) | USD | 150 | 150,375 | |||||||||
4.50%, 04/30/24 (Call 01/31/24)(b) | USD | 125 | 118,438 | |||||||||
4.75%, 04/01/21 (Call 02/01/21) | USD | 100 | 100,260 | |||||||||
4.75%, 11/15/22 (Call 08/15/22) | USD | 125 | 123,775 | |||||||||
4.75%, 05/30/25 (Call 02/28/25)(b) | USD | 50 | 47,625 | |||||||||
4.75%, 11/29/27 (Call 05/29/27)(b) | USD | 175 | 163,625 | |||||||||
4.88%, 12/15/23 (Call 09/15/23) | USD | 80 | 78,197 | |||||||||
5.88%, 11/15/24 (Call 05/15/24) | USD | 50 | 50,313 | |||||||||
Level 3 Financing Inc. | USD | 125 | 124,453 | |||||||||
5.25%, 03/15/26 (Call 03/15/21) | USD | 150 | 143,467 | |||||||||
5.38%, 08/15/22 (Call 12/03/18) | USD | 175 | 175,000 | |||||||||
5.38%, 01/15/24 (Call 01/15/19) | USD | 175 | 172,844 | |||||||||
5.38%, 05/01/25 (Call 05/01/20) | USD | 150 | 146,491 | |||||||||
5.63%, 02/01/23 (Call 12/03/18) | USD | 100 | 100,164 | |||||||||
6.13%, 01/15/21 (Call 12/03/18) | USD | 50 | 50,113 | |||||||||
Levi Strauss & Co., 3.38%, 03/15/27 (Call 03/15/22) | EUR | 100 | 114,767 | |||||||||
LifePoint Health Inc. | USD | 100 | 104,805 | |||||||||
5.50%, 12/01/21 (Call 12/03/18) | USD | 200 | 202,903 | |||||||||
5.88%, 12/01/23 (Call 12/03/18) | USD | 65 | 68,006 | |||||||||
LKQ European Holdings BV, 4.13%, 04/01/28 | ||||||||||||
(Call 04/01/23)(c) | EUR | 100 | 110,249 | |||||||||
LKQ Italia Bondco SpA, 3.88%, 04/01/24 | ||||||||||||
(Call 01/01/24)(c) | EUR | 100 | 117,435 | |||||||||
Mallinckrodt International Finance SA, 4.75%, 04/15/23 | USD | 100 | 81,797 | |||||||||
Mallinckrodt International Finance SA/Mallinckrodt CB LLC | USD | 150 | 147,750 | |||||||||
5.50%, 04/15/25 (Call 04/15/20)(a)(b) | USD | 125 | 100,579 | |||||||||
5.63%, 10/15/23 (Call 12/03/18)(a) | USD | 125 | 106,719 | |||||||||
5.75%, 08/01/22 (Call 12/03/18)(a)(b) | USD | 175 | 155,830 | |||||||||
| Security | Par (000) | Value | ||||||||||
United States (continued) | ||||||||||||
Matador Resources Co., 5.88%, 09/15/26 (Call 09/15/21)(a) | USD | 75 | $ | 73,665 | ||||||||
Mattel Inc., 6.75%, 12/31/25 (Call 12/31/20)(a) | USD | 275 | 262,379 | |||||||||
McDermott Technology Americas Inc./McDermott Technology U.S. Inc., 10.63%, 05/01/24 (Call 05/01/21)(a) | USD | 250 | 226,875 | |||||||||
Meredith Corp., 6.88%, 02/01/26 (Call 02/01/21)(a)(b) | USD | 275 | 275,000 | |||||||||
Meritage Homes Corp., 6.00%, 06/01/25 (Call 03/01/25) | USD | 75 | 72,893 | |||||||||
MGM Growth Properties Operating Partnership LP/MGP Finance Co-Issuer Inc. | USD | 75 | 68,250 | |||||||||
5.63%, 05/01/24 (Call 02/01/24) | USD | 200 | 200,750 | |||||||||
MGM Resorts International | USD | 100 | 90,396 | |||||||||
5.25%, 03/31/20(b) | USD | 100 | 101,250 | |||||||||
5.75%, 06/15/25 (Call 03/15/25) | USD | 175 | 170,294 | |||||||||
6.00%, 03/15/23 | USD | 225 | 228,236 | |||||||||
6.63%, 12/15/21(b) | USD | 225 | 235,211 | |||||||||
6.75%, 10/01/20(b) | USD | 200 | 207,630 | |||||||||
7.75%, 03/15/22 | USD | 175 | 187,763 | |||||||||
Molina Healthcare Inc., | USD | 125 | 124,674 | |||||||||
MPH Acquisition Holdings LLC, 7.13%, 06/01/24 | ||||||||||||
(Call 06/01/19)(a) | USD | 300 | 305,682 | |||||||||
MPT Operating Partnership LP/MPT Finance Corp. | EUR | 100 | 123,592 | |||||||||
5.00%, 10/15/27 (Call 10/15/22) | USD | 275 | 258,417 | |||||||||
5.25%, 08/01/26 (Call 08/01/21) | USD | 100 | 96,132 | |||||||||
6.38%, 03/01/24 (Call 03/01/19) | USD | 100 | 103,955 | |||||||||
MSCI Inc. | USD | 100 | 95,955 | |||||||||
5.25%, 11/15/24 | USD | 150 | 150,649 | |||||||||
5.38%, 05/15/27 (Call 05/15/22)(a) | USD | 75 | 74,250 | |||||||||
5.75%, 08/15/25 (Call 08/15/20)(a) | USD | 150 | 153,792 | |||||||||
Murphy Oil Corp. | USD | 75 | 72,228 | |||||||||
4.45%, 12/01/22 (Call 09/01/22) | USD | 125 | 121,875 | |||||||||
5.75%, 08/15/25 (Call 08/15/20) | USD | 100 | 99,475 | |||||||||
6.88%, 08/15/24 (Call 08/15/19)(b) | USD | 100 | 104,083 | |||||||||
Nabors Industries Inc. | USD | 150 | 143,937 | |||||||||
5.00%, 09/15/20 | USD | 150 | 149,346 | |||||||||
5.50%, 01/15/23 (Call 11/15/22)(b) | USD | 100 | 94,000 | |||||||||
5.75%, 02/01/25 (Call 11/01/24) | USD | 150 | 137,812 | |||||||||
Nationstar Mortgage Holdings Inc. | USD | 165 | 167,292 | |||||||||
9.13%, 07/15/26 (Call 07/15/21)(a) | USD | 140 | 142,030 | |||||||||
Nationstar Mortgage LLC/Nationstar Capital Corp., 6.50%, 07/01/21 (Call 12/03/18) | USD | 175 | 174,344 | |||||||||
Navient Corp. | USD | 100 | 100,425 | |||||||||
5.50%, 01/25/23 | USD | 175 | 171,845 | |||||||||
5.88%, 03/25/21 | USD | 125 | 126,562 | |||||||||
5.88%, 10/25/24 | USD | 100 | 94,250 | |||||||||
6.13%, 03/25/24 | USD | 150 | 145,711 | |||||||||
6.50%, 06/15/22 | USD | 175 | 178,062 | |||||||||
6.63%, 07/26/21 | USD | 150 | 154,328 | |||||||||
6.75%, 06/25/25(b) | USD | 100 | 97,389 | |||||||||
6.75%, 06/15/26 | USD | 100 | 95,483 | |||||||||
7.25%, 01/25/22(b) | USD | 150 | 156,151 | |||||||||
7.25%, 09/25/23(b) | USD | 100 | 103,734 | |||||||||
| 50 | 2 0 1 8 I S H A R E S A N N U A L R E P O R T T O S H A R E H O L D E R S |
Schedule of Investments (continued)
October 31, 2018 | iShares® US & Intl High Yield Corp Bond ETF
(Percentages shown are based on Net Assets) |
| Security | Par (000) | Value | ||||||||||
United States (continued) | ||||||||||||
8.00%, 03/25/20 | USD | 275 | $ | 287,153 | ||||||||
Navios Maritime Holdings Inc./Navios Maritime Finance II U.S. Inc., 7.38%, 01/15/22 (Call 12/03/18)(a) | USD | 100 | 75,458 | |||||||||
Navistar International Corp., 6.63%, 11/01/25 (Call 11/01/20)(a)(b) | USD | 210 | 214,025 | |||||||||
NCR Corp. | USD | 100 | 98,282 | |||||||||
5.00%, 07/15/22 (Call 12/03/18) | USD | 100 | 95,250 | |||||||||
5.88%, 12/15/21 (Call 12/03/18) | USD | 75 | 74,918 | |||||||||
6.38%, 12/15/23 (Call 12/15/18)(b) | USD | 150 | 149,062 | |||||||||
Neiman Marcus Group Ltd. LLC, 8.00%, 10/15/21 (Call 12/03/18)(a) | USD | 175 | 105,875 | |||||||||
Netflix Inc. | EUR | 200 | 224,060 | |||||||||
4.38%, 11/15/26(b) | USD | 200 | 183,190 | |||||||||
4.63%, 05/15/29(c) | EUR | 200 | 226,827 | |||||||||
4.88%, 04/15/28(a) | USD | 270 | 247,725 | |||||||||
5.38%, 02/01/21 | USD | 100 | 101,883 | |||||||||
5.50%, 02/15/22 | USD | 125 | 127,486 | |||||||||
5.75%, 03/01/24 | USD | 75 | 76,328 | |||||||||
5.88%, 02/15/25 | USD | 175 | 177,831 | |||||||||
5.88%, 11/15/28(a)(b) | USD | 350 | 343,875 | |||||||||
6.38%, 05/15/29(a) | USD | 75 | 75,383 | |||||||||
Newfield Exploration Co. | USD | 125 | 126,172 | |||||||||
5.63%, 07/01/24 | USD | 200 | 205,750 | |||||||||
5.75%, 01/30/22(b) | USD | 150 | 154,078 | |||||||||
Nexstar Broadcasting Inc. | USD | 175 | 167,562 | |||||||||
5.88%, 11/15/22 (Call 11/13/18) | USD | 75 | 76,140 | |||||||||
NextEra Energy Operating Partners LP | USD | 100 | 95,355 | |||||||||
4.50%, 09/15/27 (Call 06/15/27)(a) | USD | 100 | 92,156 | |||||||||
NGL Energy Partners LP/NGL Energy Finance Corp., 7.50%, 11/01/23 (Call 11/01/19) | USD | 125 | 122,528 | |||||||||
NGPL PipeCo LLC | USD | 90 | 88,875 | |||||||||
4.88%, 08/15/27 (Call 02/15/27)(a) | USD | 155 | 149,362 | |||||||||
Nielsen Co. Luxembourg Sarl (The), 5.00%, 02/01/25 (Call 02/01/20)(a)(b) | USD | 100 | 97,281 | |||||||||
Nielsen Finance LLC/Nielsen Finance Co. | USD | 75 | 74,813 | |||||||||
5.00%, 04/15/22 (Call 12/03/18)(a)(b) | USD | 450 | 436,792 | |||||||||
Noble Holding International Ltd. | USD | 135 | 133,312 | |||||||||
7.95%, 04/01/25 (Call 01/01/25)(b) | USD | 75 | 67,875 | |||||||||
Novelis Corp. | USD | 275 | 258,156 | |||||||||
6.25%, 08/15/24 (Call 08/15/19)(a) | USD | 225 | 221,719 | |||||||||
NRG Energy Inc. | USD | 150 | 149,625 | |||||||||
6.25%, 05/01/24 (Call 05/01/19) | USD | 125 | 127,998 | |||||||||
6.63%, 01/15/27 (Call 07/15/21) | USD | 225 | 232,312 | |||||||||
7.25%, 05/15/26 (Call 05/15/21) | USD | 210 | 223,475 | |||||||||
Nuance Communications Inc. | USD | 43 | 43,027 | |||||||||
5.63%, 12/15/26 (Call 12/15/21) | USD | 100 | 97,066 | |||||||||
NuStar Logistics LP | USD | 100 | 99,750 | |||||||||
5.63%, 04/28/27 (Call 01/28/27) | USD | 100 | 95,625 | |||||||||
| Security | Par (000) | Value | ||||||||||
United States (continued) | ||||||||||||
Oasis Petroleum Inc. | USD | 90 | $ | 87,846 | ||||||||
6.88%, 03/15/22 (Call 12/03/18) | USD | 189 | 190,181 | |||||||||
OI European Group BV | EUR | 200 | 229,822 | |||||||||
6.75%, 09/15/20(c) | EUR | 100 | 125,792 | |||||||||
Olin Corp. | USD | 100 | 89,075 | |||||||||
5.13%, 09/15/27 (Call 03/15/22)(b) | USD | 100 | 93,467 | |||||||||
Ortho-Clinical Diagnostics Inc./Ortho-Clinical Diagnostics SA, 6.63%, 05/15/22 (Call 12/03/18)(a) | USD | 250 | 240,250 | |||||||||
Outfront Media Capital LLC/Outfront Media Capital Corp. | USD | 100 | 100,285 | |||||||||
5.63%, 02/15/24 (Call 02/15/19) | USD | 50 | 49,955 | |||||||||
5.88%, 03/15/25 (Call 09/15/19)(b) | USD | 100 | 100,154 | |||||||||
Owens-Brockway Glass Container Inc. | USD | 100 | 98,988 | |||||||||
5.88%, 08/15/23(a) | USD | 125 | 124,531 | |||||||||
Pacific Drilling First Lien Escrow Issuer Ltd., 8.38%, 10/01/23 | USD | 140 | 141,575 | |||||||||
Parsley Energy LLC/Parsley Finance Corp. | USD | 75 | 72,384 | |||||||||
5.38%, 01/15/25 (Call 01/15/20)(a) | USD | 135 | 131,865 | |||||||||
5.63%, 10/15/27 (Call 10/15/22)(a) | USD | 125 | 122,614 | |||||||||
6.25%, 06/01/24 (Call 06/01/19)(a)(b) | USD | 75 | 77,063 | |||||||||
PBF Holding Co. LLC/PBF Finance Corp. | USD | 115 | 118,899 | |||||||||
7.25%, 06/15/25 (Call 06/15/20) | USD | 100 | 102,934 | |||||||||
PDC Energy Inc. | USD | 105 | 96,338 | |||||||||
6.13%, 09/15/24 (Call 09/15/19) | USD | 100 | 95,500 | |||||||||
Peabody Energy Corp. | USD | 100 | 99,672 | |||||||||
6.38%, 03/31/25 (Call 03/31/20)(a) | USD | 75 | 74,778 | |||||||||
Penske Automotive Group Inc. | USD | 110 | 104,188 | |||||||||
5.75%, 10/01/22 (Call 12/03/18)(b) | USD | 100 | 101,313 | |||||||||
PetSmart Inc. | USD | 260 | 203,450 | |||||||||
7.13%, 03/15/23 (Call 12/03/18)(a) | USD | 350 | 242,375 | |||||||||
8.88%, 06/01/25 (Call 06/01/20)(a)(b) | USD | 100 | 69,696 | |||||||||
Pilgrim’s Pride Corp. | USD | 180 | 167,850 | |||||||||
5.88%, 09/30/27 (Call 09/30/22)(a)(b) | USD | 160 | 145,050 | |||||||||
Pitney Bowes Inc. | USD | 100 | 95,125 | |||||||||
4.38%, 05/15/22 (Call 04/15/22) | USD | 75 | 68,219 | |||||||||
4.63%, 03/15/24 (Call 12/15/23)(b) | USD | 50 | 43,875 | |||||||||
4.70%, 04/01/23 (Call 03/01/23) | USD | 75 | 66,728 | |||||||||
Platform Specialty Products Corp. | USD | 165 | 156,017 | |||||||||
6.50%, 02/01/22 (Call 12/03/18)(a) | USD | 200 | 202,560 | |||||||||
Post Holdings Inc. | USD | 325 | 298,963 | |||||||||
5.50%, 03/01/25 (Call 03/01/20)(a) | USD | 185 | 179,219 | |||||||||
5.63%, 01/15/28 (Call 12/01/22)(a) | USD | 175 | 164,552 | |||||||||
5.75%, 03/01/27 (Call 03/01/22)(a) | USD | 275 | 262,178 | |||||||||
Prestige Brands Inc., 6.38%, 03/01/24 (Call 03/01/19)(a)(b) | USD | 115 | 113,563 | |||||||||
S C H E D U L E O F I N V E S T M E N T S | 51 |
Schedule of Investments (continued)
October 31, 2018 | iShares® US & Intl High Yield Corp Bond ETF
(Percentages shown are based on Net Assets) |
| Security | Par (000) | Value | ||||||||||
United States (continued) | ||||||||||||
Prime Security Services Borrower LLC/Prime Finance Inc., 9.25%, 05/15/23 (Call 05/15/19)(a) | USD | 450 | $ | 475,515 | ||||||||
PSPC Escrow Corp., 6.00%, 02/01/23 (Call 11/30/18)(c) | EUR | 100 | 117,346 | |||||||||
PulteGroup Inc. | USD | 125 | 124,700 | |||||||||
5.00%, 01/15/27 (Call 10/15/26) | USD | 125 | 115,375 | |||||||||
5.50%, 03/01/26 (Call 12/01/25) | USD | 130 | 127,400 | |||||||||
PVH Corp., 3.63%, 07/15/24 (Call 04/15/24)(c) | EUR | 100 | 122,558 | |||||||||
QEP Resources Inc. | USD | 100 | 95,554 | |||||||||
5.38%, 10/01/22 (Call 07/01/22) | USD | 100 | 97,925 | |||||||||
5.63%, 03/01/26 (Call 12/01/25) | USD | 100 | 94,125 | |||||||||
Quicken Loans Inc. | USD | 150 | 133,369 | |||||||||
5.75%, 05/01/25 (Call 05/01/20)(a) | USD | 225 | 217,208 | |||||||||
QVC Inc. | USD | 125 | 122,742 | |||||||||
4.45%, 02/15/25 (Call 11/15/24) | USD | 125 | 118,849 | |||||||||
4.85%, 04/01/24 | USD | 100 | 98,478 | |||||||||
5.13%, 07/02/22 | USD | 100 | 101,204 | |||||||||
Rackspace Hosting Inc., 8.63%, 11/15/24 (Call 11/15/19)(a)(b) | USD | 225 | 210,779 | |||||||||
Radian Group Inc., 4.50%, 10/01/24 (Call 07/01/24) | USD | 100 | 96,250 | |||||||||
Range Resources Corp. | USD | 125 | 115,602 | |||||||||
5.00%, 08/15/22 (Call 05/15/22) | USD | 125 | 122,249 | |||||||||
5.00%, 03/15/23 (Call 12/15/22)(b) | USD | 150 | 145,125 | |||||||||
5.75%, 06/01/21 (Call 03/01/21) | USD | 100 | 101,045 | |||||||||
Realogy Group LLC/Realogy Co-Issuer Corp. | USD | 100 | 90,800 | |||||||||
5.25%, 12/01/21 (Call 12/03/18)(a) | USD | 75 | 73,688 | |||||||||
Refinitiv U.S. Holdings Inc. | EUR | 100 | 113,242 | |||||||||
6.25%, 05/15/26 (Call 11/15/21)(a)(b) | USD | 175 | 173,687 | |||||||||
6.88%, 11/15/26 (Call 11/15/21)(c) | EUR | 100 | 112,457 | |||||||||
8.25%, 11/15/26 (Call 11/15/21)(a) | USD | 265 | 257,050 | |||||||||
Reynolds Group Issuer Inc./Reynolds Group Issuer LLC/Reynolds Group Issuer Lu | USD | 300 | 293,625 | |||||||||
5.75%, 10/15/20 (Call 12/03/18)(b) | USD | 581 | 581,465 | |||||||||
7.00%, 07/15/24 (Call 07/15/19)(a)(b) | USD | 150 | 150,063 | |||||||||
Rite Aid Corp., 6.13%, 04/01/23 (Call 12/03/18)(a) | USD | 325 | 276,453 | |||||||||
Rowan Companies Inc. | USD | 75 | 71,813 | |||||||||
7.38%, 06/15/25 (Call 03/15/25)(b) | USD | 100 | 94,750 | |||||||||
RR Donnelley & Sons Co., 7.88%, 03/15/21(b) | USD | 31 | 32,182 | |||||||||
Sable Permian Resources Land LLC/AEPB Finance Corp. | USD | 100 | 60,500 | |||||||||
7.38%, 11/01/21 (Call 12/03/18)(a)(b) | USD | 84 | 49,621 | |||||||||
Sabre GLBL Inc., 5.25%, 11/15/23 (Call 12/03/18)(a) | USD | 200 | 197,667 | |||||||||
Sanchez Energy Corp. | USD | 200 | 73,500 | |||||||||
7.25%, 02/15/23 (Call 02/15/20)(a)(b) | USD | 100 | 91,500 | |||||||||
7.75%, 06/15/21 (Call 12/03/18)(b) | USD | 125 | 63,047 | |||||||||
SBA Communications Corp. | USD | 150 | 144,187 | |||||||||
4.88%, 07/15/22 (Call 12/03/18) | USD | 125 | 124,219 | |||||||||
4.88%, 09/01/24 (Call 09/01/19) | USD | 220 | 210,864 | |||||||||
| Security | Par (000) | Value | ||||||||||
United States (continued) | ||||||||||||
Scientific Games International Inc. | EUR | 100 | $ | 104,988 | ||||||||
5.00%, 10/15/25 (Call 10/15/20)(a)(b) | USD | 235 | 218,550 | |||||||||
10.00%, 12/01/22 (Call 12/03/18)(b) | USD | 400 | 419,000 | |||||||||
Sealed Air Corp. | EUR | 100 | 125,357 | |||||||||
4.88%, 12/01/22 (Call 09/01/22)(a) | USD | 100 | 98,838 | |||||||||
5.13%, 12/01/24 (Call 09/01/24)(a) | USD | 75 | 73,118 | |||||||||
5.25%, 04/01/23 (Call 01/01/23)(a) | USD | 100 | 99,125 | |||||||||
5.50%, 09/15/25 (Call 06/15/25)(a) | USD | 75 | 74,062 | |||||||||
6.50%, 12/01/20 (Call 09/01/20)(a) | USD | 50 | 51,719 | |||||||||
SemGroup Corp./Rose Rock Finance Corp., 5.63%, 07/15/22 (Call 11/16/18) | USD | 75 | 72,197 | |||||||||
Service Corp. International/U.S. | USD | 100 | 93,859 | |||||||||
5.38%, 01/15/22 (Call 12/03/18) | USD | 100 | 100,784 | |||||||||
5.38%, 05/15/24 (Call 05/15/19) | USD | 150 | 151,687 | |||||||||
ServiceMaster Co. LLC (The), 5.13%, 11/15/24 (Call 11/15/19)(a) | USD | 125 | 120,409 | |||||||||
SESI LLC | USD | 125 | 123,884 | |||||||||
7.75%, 09/15/24 (Call 09/15/20)(b) | USD | 100 | 98,375 | |||||||||
Silgan Holdings Inc., 3.25%, 03/15/25 (Call 03/15/20) | EUR | 200 | 231,201 | |||||||||
Sinclair Television Group Inc. | USD | 75 | 67,563 | |||||||||
5.38%, 04/01/21 (Call 11/16/18) | USD | 50 | 49,996 | |||||||||
5.63%, 08/01/24 (Call 08/01/19)(a)(b) | USD | 100 | 95,762 | |||||||||
6.13%, 10/01/22 (Call 11/16/18)(b) | USD | 150 | 152,625 | |||||||||
Sirius XM Radio Inc. | USD | 170 | 164,262 | |||||||||
4.63%, 05/15/23 (Call 12/03/18)(a)(b) | USD | 100 | 97,021 | |||||||||
5.00%, 08/01/27 (Call 08/01/22)(a) | USD | 275 | 258,156 | |||||||||
5.38%, 04/15/25 (Call 04/15/20)(a) | USD | 200 | 197,100 | |||||||||
5.38%, 07/15/26 (Call 07/15/21)(a) | USD | 200 | 195,500 | |||||||||
6.00%, 07/15/24 (Call 07/15/19)(a) | USD | 225 | 230,017 | |||||||||
Six Flags Entertainment Corp. | USD | 200 | 188,719 | |||||||||
5.50%, 04/15/27 (Call 04/15/22)(a)(b) | USD | 90 | 85,074 | |||||||||
SM Energy Co. | USD | 100 | 94,813 | |||||||||
5.63%, 06/01/25 (Call 06/01/20)(b) | USD | 100 | 95,856 | |||||||||
6.13%, 11/15/22 (Call 12/03/18)(b) | USD | 100 | 101,250 | |||||||||
6.63%, 01/15/27 (Call 01/15/22)(b) | USD | 85 | 85,400 | |||||||||
6.75%, 09/15/26 (Call 09/15/21)(b) | USD | 100 | 99,938 | |||||||||
Solera LLC/Solera Finance Inc., 10.50%, 03/01/24 (Call 03/01/19)(a) | USD | 380 | 412,311 | |||||||||
Southwestern Energy Co. | USD | 200 | 196,322 | |||||||||
6.20%, 01/23/25 (Call 10/23/24)(b) | USD | 175 | 169,312 | |||||||||
7.50%, 04/01/26 (Call 04/01/21)(b) | USD | 100 | 101,750 | |||||||||
7.75%, 10/01/27 (Call 10/01/22)(b) | USD | 100 | 101,588 | |||||||||
Spectrum Brands Inc. | EUR | 100 | 113,894 | |||||||||
5.75%, 07/15/25 (Call 07/15/20) | USD | 200 | 194,500 | |||||||||
6.63%, 11/15/22 (Call 12/03/18) | USD | 100 | 102,265 | |||||||||
Springleaf Finance Corp. | USD | 125 | 126,141 | |||||||||
5.63%, 03/15/23 | USD | 150 | 144,963 | |||||||||
6.13%, 05/15/22 | USD | 200 | 200,819 | |||||||||
6.88%, 03/15/25 | USD | 225 | 214,875 | |||||||||
| 52 | 2 0 1 8 I S H A R E S A N N U A L R E P O R T T O S H A R E H O L D E R S |
Schedule of Investments (continued)
October 31, 2018 | iShares® US & Intl High Yield Corp Bond ETF
(Percentages shown are based on Net Assets) |
| Security | Par (000) | Value | ||||||||||
United States (continued) | ||||||||||||
7.13%, 03/15/26 | USD | 285 | $ | 270,037 | ||||||||
7.75%, 10/01/21 | USD | 125 | 132,089 | |||||||||
8.25%, 12/15/20 | USD | 175 | 187,250 | |||||||||
Sprint Communications Inc. | USD | 400 | 404,250 | |||||||||
7.00%, 03/01/20(a) | USD | 200 | 207,250 | |||||||||
7.00%, 08/15/20 | USD | 300 | 310,500 | |||||||||
11.50%, 11/15/21 | USD | 200 | 233,000 | |||||||||
Sprint Corp. | USD | 475 | 485,521 | |||||||||
7.25%, 09/15/21 | USD | 425 | 444,656 | |||||||||
7.63%, 02/15/25 (Call 11/15/24) | USD | 275 | 285,723 | |||||||||
7.63%, 03/01/26 (Call 11/01/25) | USD | 275 | 286,000 | |||||||||
7.88%, 09/15/23 | USD | 775 | 827,312 | |||||||||
Standard Industries Inc./NJ | USD | 175 | 156,406 | |||||||||
5.00%, 02/15/27 (Call 02/15/22)(a) | USD | 100 | 91,000 | |||||||||
5.38%, 11/15/24 (Call 11/15/19)(a) | USD | 200 | 191,769 | |||||||||
5.50%, 02/15/23 (Call 02/15/19)(a) | USD | 100 | 97,817 | |||||||||
6.00%, 10/15/25 (Call 10/15/20)(a) | USD | 200 | 196,750 | |||||||||
Staples Inc., 8.50%, 09/15/25 (Call 09/15/20)(a)(b) | USD | 180 | 162,900 | |||||||||
Starwood Property Trust Inc. | USD | 85 | 82,514 | |||||||||
4.75%, 03/15/25 (Call 09/15/24) | USD | 95 | 90,701 | |||||||||
5.00%, 12/15/21 (Call 09/15/21) | USD | 150 | 149,250 | |||||||||
Steel Dynamics Inc. | USD | 125 | 122,069 | |||||||||
5.13%, 10/01/21 (Call 12/03/18) | USD | 50 | 50,250 | |||||||||
5.25%, 04/15/23 (Call 12/03/18) | USD | 50 | 50,085 | |||||||||
5.50%, 10/01/24 (Call 10/01/19) | USD | 100 | 100,448 | |||||||||
Suburban Propane Partners LP/Suburban Energy Finance Corp., 5.50%, 06/01/24 (Call 06/01/19) | USD | 100 | 94,750 | |||||||||
Sunoco LP/Sunoco Finance Corp. | USD | 150 | 144,511 | |||||||||
5.50%, 02/15/26 (Call 02/15/21)(a) | USD | 150 | 142,734 | |||||||||
5.88%, 03/15/28 (Call 03/15/23)(a) | USD | 85 | 79,074 | |||||||||
Superior Industries International Inc., 6.00%, 06/15/25 (Call 06/15/20)(c) | EUR | 100 | 102,698 | |||||||||
Symantec Corp. | USD | 75 | 72,222 | |||||||||
4.20%, 09/15/20 | USD | 100 | 99,750 | |||||||||
5.00%, 04/15/25 (Call 04/15/20)(a) | USD | 225 | 212,392 | |||||||||
TAMFG. Ltd., 3.63%, 04/15/23 (Call 11/30/18)(c) | EUR | 100 | 115,061 | |||||||||
Talen Energy Supply LLC | USD | 100 | 93,750 | |||||||||
6.50%, 06/01/25 (Call 06/01/20) | USD | 100 | 74,604 | |||||||||
9.50%, 07/15/22 (Call 07/15/20)(a) | USD | 75 | 76,125 | |||||||||
10.50%, 01/15/26 (Call 01/15/22)(a) | USD | 125 | 109,000 | |||||||||
Tallgrass Energy Partners LP/Tallgrass Energy Finance Corp. | USD | 150 | 150,609 | |||||||||
5.50%, 01/15/28 (Call 01/15/23)(a) | USD | 145 | 142,825 | |||||||||
Targa Resources Partners LP/Targa Resources Partners Finance Corp. | USD | 150 | 149,910 | |||||||||
4.25%, 11/15/23 (Call 12/03/18) | USD | 100 | 96,030 | |||||||||
5.00%, 01/15/28 (Call 01/15/23) | USD | 150 | 141,896 | |||||||||
5.13%, 02/01/25 (Call 02/01/20) | USD | 95 | 92,625 | |||||||||
5.25%, 05/01/23 (Call 12/03/18) | USD | 125 | 124,489 | |||||||||
5.38%, 02/01/27 (Call 02/01/22) | USD | 100 | 97,256 | |||||||||
| Security | Par (000) | Value | ||||||||||
United States (continued) | ||||||||||||
5.88%, 04/15/26 (Call 04/15/21)(a) | USD | 200 | $ | 200,906 | ||||||||
6.75%, 03/15/24 (Call 09/15/19) | USD | 100 | 104,750 | |||||||||
Taylor Morrison Communities Inc./Taylor Morrison Holdings II Inc., 5.25%, 04/15/21 (Call 12/03/18)(a) | USD | 100 | 99,750 | |||||||||
TEGNA Inc. | USD | 125 | 125,192 | |||||||||
6.38%, 10/15/23 (Call 12/03/18) | USD | 125 | 128,125 | |||||||||
Teleflex Inc. | USD | 100 | 92,719 | |||||||||
4.88%, 06/01/26 (Call 06/01/21) | USD | 75 | 72,978 | |||||||||
Tempur Sealy International Inc. | USD | 125 | 114,392 | |||||||||
5.63%, 10/15/23 (Call 12/03/18) | USD | 50 | 48,740 | |||||||||
Tenet Healthcare Corp. | USD | 200 | 196,910 | |||||||||
4.50%, 04/01/21(b) | USD | 175 | 173,453 | |||||||||
4.63%, 07/15/24 (Call 07/15/20) | USD | 350 | 337,347 | |||||||||
5.13%, 05/01/25 (Call 05/01/20) | USD | 245 | 234,771 | |||||||||
6.00%, 10/01/20 | USD | 350 | 358,855 | |||||||||
6.75%, 06/15/23(b) | USD | 350 | 347,419 | |||||||||
7.00%, 08/01/25 (Call 08/01/20)(b) | USD | 100 | 98,095 | |||||||||
7.50%, 01/01/22 (Call 01/01/19)(a) | USD | 150 | 156,670 | |||||||||
8.13%, 04/01/22 | USD | 525 | 546,000 | |||||||||
Tenneco Inc., 4.88%, 04/15/22 (Call 04/15/19)(c) | EUR | 175 | 203,952 | |||||||||
TerraForm Power Operating LLC | USD | 100 | 94,875 | |||||||||
5.00%, 01/31/28 (Call 07/31/27)(a) | USD | 125 | 111,523 | |||||||||
Tesla Inc., 5.30%, 08/15/25 (Call 08/15/20)(a)(b) | USD | 325 | 289,115 | |||||||||
T-Mobile USA Inc. | USD | 100 | 98,688 | |||||||||
4.50%, 02/01/26 (Call 02/01/21) | USD | 175 | 163,570 | |||||||||
4.75%, 02/01/28 (Call 02/01/23) | USD | 280 | 259,000 | |||||||||
5.13%, 04/15/25 (Call 04/15/20) | USD | 100 | 98,679 | |||||||||
5.38%, 04/15/27 (Call 04/15/22) | USD | 75 | 73,163 | |||||||||
6.00%, 03/01/23 (Call 11/13/18) | USD | 225 | 230,906 | |||||||||
6.00%, 04/15/24 (Call 04/15/19) | USD | 200 | 205,544 | |||||||||
6.38%, 03/01/25 (Call 09/01/19) | USD | 300 | 309,375 | |||||||||
6.50%, 01/15/24 (Call 01/15/19) | USD | 175 | 181,242 | |||||||||
6.50%, 01/15/26 (Call 01/15/21) | USD | 375 | 395,625 | |||||||||
Toll Brothers Finance Corp. | USD | 75 | 65,963 | |||||||||
4.38%, 04/15/23 (Call 01/15/23)(b) | USD | 50 | 48,015 | |||||||||
4.88%, 03/15/27 (Call 12/15/26) | USD | 85 | 78,413 | |||||||||
5.88%, 02/15/22 (Call 11/15/21) | USD | 100 | 101,986 | |||||||||
TransDigm Inc. | USD | 75 | 74,875 | |||||||||
6.00%, 07/15/22 (Call 12/03/18)(b) | USD | 225 | 225,619 | |||||||||
6.38%, 06/15/26 (Call 06/15/21) | USD | 200 | 196,000 | |||||||||
6.50%, 07/15/24 (Call 07/15/19) | USD | 225 | 226,828 | |||||||||
6.50%, 05/15/25 (Call 05/15/20)(b) | USD | 150 | 148,875 | |||||||||
Transocean Guardian Ltd., 5.88%, 01/15/24 (Call 07/15/21)(a) | USD | 145 | 143,089 | |||||||||
Transocean Inc. | USD | 100 | 96,700 | |||||||||
7.25%, 11/01/25 (Call 11/01/21)(a) | USD | 100 | 97,250 | |||||||||
9.00%, 07/15/23 (Call 07/15/20)(a) | USD | 250 | 262,500 | |||||||||
Transocean Phoenix 2 Ltd., 7.75%, 10/15/24 (Call 10/15/20)(a) | USD | 100 | 103,500 | |||||||||
Transocean Pontus Ltd., 6.13%, 08/01/25 (Call 08/01/21)(a) | USD | 90 | 89,438 | |||||||||
S C H E D U L E O F I N V E S T M E N T S | 53 |
Schedule of Investments (continued)
October 31, 2018 | iShares® US & Intl High Yield Corp Bond ETF
(Percentages shown are based on Net Assets) |
| Security | Par (000) | Value | ||||||||
United States (continued) | ||||||||||
Transocean Proteus Ltd., 6.25%, 12/01/24 | USD | 85 | $ | 84,575 | ||||||
TreeHouse Foods Inc., 6.00%, 02/15/24 | USD | 175 | 174,562 | |||||||
TRI Pointe Group Inc./TRI Pointe Homes Inc., | USD | 75 | 69,938 | |||||||
Tribune Media Co., 5.88%, 07/15/22 | USD | 200 | 203,250 | |||||||
Triumph Group Inc., 7.75%, 08/15/25 | USD | 67 | 62,980 | |||||||
Tronox Finance PLC, 5.75%, 10/01/25 | USD | 75 | 65,719 | |||||||
Tronox Inc., 6.50%, 04/15/26 (Call | USD | 125 | 113,984 | |||||||
U.S. Steel Corp. | USD | 90 | 84,825 | |||||||
6.88%, 08/15/25 (Call 08/15/20) | USD | 150 | 147,000 | |||||||
Ultra Resources Inc. | USD | 125 | 71,875 | |||||||
7.13%, 04/15/25 (Call 04/15/20)(a)(b) | USD | 115 | 50,600 | |||||||
United Continental Holdings Inc., 4.25%, 10/01/22(b) | USD | 100 | 97,994 | |||||||
United Rentals North America Inc. | USD | 200 | 198,325 | |||||||
4.63%, 10/15/25 (Call 10/15/20)(b) | USD | 130 | 120,181 | |||||||
4.88%, 01/15/28 (Call 01/15/23) | USD | 300 | 270,285 | |||||||
5.50%, 07/15/25 (Call 07/15/20) | USD | 150 | 146,625 | |||||||
5.50%, 05/15/27 (Call 05/15/22) | USD | 180 | 170,764 | |||||||
5.75%, 11/15/24 (Call 05/15/19)(b) | USD | 125 | 125,469 | |||||||
5.88%, 09/15/26 (Call 09/15/21) | USD | 225 | 220,050 | |||||||
Uniti Group LP/Uniti Group Finance Inc./CSL Capital LLC | USD | 100 | 96,000 | |||||||
7.13%, 12/15/24 (Call 12/15/19)(a) | USD | 125 | 110,804 | |||||||
8.25%, 10/15/23 (Call 04/15/19) | USD | 200 | 188,500 | |||||||
Univision Communications Inc. | USD | 200 | 188,400 | |||||||
5.13%, 02/15/25 (Call 02/15/20)(a)(b) | USD | 275 | 253,000 | |||||||
Vantiv LLC/Vanity Issuer Corp., 3.88%, 11/15/25 (Call 11/15/20)(c) | GBP | 100 | 124,389 | |||||||
VeriSign Inc. | USD | 200 | 199,975 | |||||||
4.75%, 07/15/27 (Call 07/15/22) | USD | 100 | 94,030 | |||||||
5.25%, 04/01/25 (Call 01/01/25) | USD | 50 | 49,875 | |||||||
Veritas U.S. Inc./Veritas Bermuda Ltd., 10.50%, 02/01/24 (Call 02/01/19)(a)(b) | USD | 200 | 171,692 | |||||||
Verscend Escrow Corp., 9.75%, 08/15/26 (Call 08/15/21)(a) | USD | 190 | 190,214 | |||||||
Vertiv Group Corp., 9.25%, 10/15/24 | USD | 100 | 99,250 | |||||||
Viacom Inc. | USD | 125 | 120,114 | |||||||
6.25%, 02/28/57 (Call 02/28/27)(d)(e) | USD | 125 | 120,000 | |||||||
Viking Cruises Ltd., 5.88%, 09/15/27 | USD | 140 | 132,608 | |||||||
Vistra Energy Corp. | USD | 100 | 101,484 | |||||||
7.38%, 11/01/22 (Call 12/03/18) | USD | 275 | 285,656 | |||||||
7.63%, 11/01/24 (Call 11/01/19) | USD | 244 | 258,628 | |||||||
Vistra Operations Co. LLC, 5.50%, 09/01/26 (Call 09/01/21)(a) | USD | 190 | 186,410 | |||||||
VOC Escrow Ltd., 5.00%, 02/15/28 | USD | 125 | 117,500 | |||||||
Voya Financial Inc., 5.65%, 05/15/53 | USD | 150 | 148,339 | |||||||
Weatherford International LLC, 9.88%, 03/01/25 | USD | 125 | 97,813 | |||||||
| Security | Par/ Shares (000) | Value | ||||||||||
United States (continued) | ||||||||||||
Weatherford International Ltd. | ||||||||||||
4.50%, 04/15/22 (Call 01/15/22)(b) | USD | 130 | $ | 96,552 | ||||||||
7.75%, 06/15/21 (Call 05/15/21)(b) | USD | 145 | 120,531 | |||||||||
8.25%, 06/15/23 (Call 03/15/23)(b) | USD | 125 | 95,625 | |||||||||
WellCare Health Plans Inc. | ||||||||||||
5.25%, 04/01/25 (Call 04/01/20) | USD | 210 | 209,475 | |||||||||
5.38%, 08/15/26 (Call 08/15/21)(a) | USD | 135 | 134,831 | |||||||||
West Corp., 8.50%, 10/15/25 (Call 10/15/20)(a) | USD | 225 | 203,257 | |||||||||
Western Digital Corp., 4.75%, 02/15/26 (Call 11/15/25)(b) | USD | 425 | 392,594 | |||||||||
Whiting Petroleum Corp. | ||||||||||||
5.75%, 03/15/21 (Call 12/15/20)(b) | USD | 150 | 151,312 | |||||||||
6.25%, 04/01/23 (Call 01/01/23)(b) | USD | 75 | 75,440 | |||||||||
6.63%, 01/15/26 (Call 10/15/25) | USD | 175 | 175,274 | |||||||||
William Lyon Homes Inc., 5.88%, 01/31/25 (Call 01/31/20) | USD | 100 | 88,125 | |||||||||
Windstream Services LLC/Windstream Finance Corp. | ||||||||||||
8.63%, 10/31/25 (Call 10/31/20)(a) | USD | 125 | 116,563 | |||||||||
9.00%, 06/30/25 (Call 06/30/21)(a) | USD | 211 | 151,920 | |||||||||
10.50%, 06/30/24 (Call 06/30/20)(a) | USD | 100 | 80,844 | |||||||||
WMG Acquisition Corp., 4.13%, 11/01/24 (Call 11/01/19)(c) | EUR | 90 | 105,938 | |||||||||
WPX Energy Inc. | ||||||||||||
5.25%, 09/15/24 (Call 06/15/24) | USD | 125 | 122,800 | |||||||||
5.75%, 06/01/26 (Call 06/01/21) | USD | 100 | 99,500 | |||||||||
6.00%, 01/15/22 (Call 10/15/21) | USD | 123 | 125,628 | |||||||||
8.25%, 08/01/23 (Call 06/01/23) | USD | 75 | 83,987 | |||||||||
WR Grace & Co.-Conn, 5.13%, 10/01/21(a) | USD | 150 | 151,125 | |||||||||
Wyndham Destinations Inc. | ||||||||||||
3.90%, 03/01/23 (Call 12/01/22) | USD | 38 | 35,075 | |||||||||
4.25%, 03/01/22 (Call 12/01/21) | USD | 56 | 54,051 | |||||||||
4.50%, 04/01/27 (Call 01/01/27) | USD | 75 | 69,384 | |||||||||
Wynn Las Vegas LLC/Wynn Las Vegas Capital Corp. | ||||||||||||
4.25%, 05/30/23 (Call | USD | 100 | 94,813 | |||||||||
5.25%, 05/15/27 (Call 02/15/27)(a) | USD | 175 | 157,891 | |||||||||
5.50%, 03/01/25 (Call 12/01/24)(a) | USD | 325 | 309,156 | |||||||||
XPO Logistics Inc. | ||||||||||||
6.13%, 09/01/23 (Call | USD | 75 | 76,950 | |||||||||
6.50%, 06/15/22 (Call 12/03/18)(a) | USD | 212 | 217,035 | |||||||||
Zayo Group LLC/Zayo Capital Inc. | ||||||||||||
5.75%, 01/15/27 (Call 01/15/22)(a) | USD | 325 | 318,565 | |||||||||
6.00%, 04/01/23 (Call 12/03/18) | USD | 275 | 280,457 | |||||||||
6.38%, 05/15/25 (Call 05/15/20) | USD | 175 | 179,156 | |||||||||
|
| |||||||||||
| 137,504,320 | ||||||||||||
Venezuela — 0.2% | ||||||||||||
Citgo Holding Inc., 10.75%, | USD | 375 | 391,875 | |||||||||
|
| |||||||||||
Total Corporate Bonds & Notes — 97.4% |
| 205,879,943 | ||||||||||
|
| |||||||||||
| Short-Term Investments |
| |||||||||||
Money Market Funds — 19.6% |
| |||||||||||
BlackRock Cash Funds: Institutional, SL Agency Shares, 2.36%(i)(j)(k) | 38,617 | 38,624,287 | ||||||||||
| 54 | 2 0 1 8 I S H A R E S A N N U A L R E P O R T T O S H A R E H O L D E R S |
Schedule of Investments (continued)
October 31, 2018 | iShares® US & Intl High Yield Corp Bond ETF
(Percentages shown are based on Net Assets) |
| Security | Shares (000) | Value | ||||||
| Money Market Funds (continued) |
| |||||||
BlackRock Cash Funds: Treasury, | 2,804 | $ | 2,804,001 | |||||
|
| |||||||
| 41,428,288 | ||||||||
|
| |||||||
Total Short-Term Investments — 19.6% |
| |||||||
(Cost: $41,423,199) | 41,428,288 | |||||||
|
| |||||||
Total Investments in Securities — 117.0% |
| |||||||
(Cost: $256,237,350) | 247,308,231 | |||||||
Other Assets, Less Liabilities — (17.0)% |
| (35,955,140 | ) | |||||
|
| |||||||
Net Assets — 100.0% | $ | 211,353,091 | ||||||
|
| |||||||
| (a) | Security exempt from registration pursuant to Rule 144A under the Securities Act of 1933, as amended. These securities may be resold in transactions exempt from registration to qualified institutional investors. |
| (b) | All or a portion of this security is on loan. |
| (c) | This security may be resold to qualified foreign investors and foreign institutional buyers under Regulation S of the Securities Act of 1933. |
| (d) | Security is issued at a fixed coupon rate, which converts to a variable rate at a specified date. Reference index and spread are provided if the rate is currently floating. |
| (e) | Variable or floating rate security. Rate shown is the rate in effect as of period-end. |
| (f) | Issuer is in default of interest payments. |
| (g) | Step coupon security. Coupon rate will either increase (step-up bond) or decrease (step-down bond) at regular intervals until maturity. Interest rate shown reflects the rate currently in effect. |
| (h) | Perpetual security with no stated maturity date. |
| (i) | Affiliate of the Fund. |
| (j) | Annualized 7-day yield as of period-end. |
| (k) | All or a portion of this security was purchased with cash collateral received from loaned securities. |
Affiliates
Investments in issuers considered to be affiliates of the Fund during the year ended October 31, 2018, for purposes of Section 2(a)(3) of the 1940 Act, were as follows:
| Affiliated Issuer | | Shares Held at 10/31/17 (000) | | | Net Activity (000) | | | Shares Held at 10/31/18 (000) | | | Value at 10/31/18 | | Income | | Net Realized Gain (Loss) | (a) | | Change in Unrealized Appreciation (Depreciation) | | |||||||||
BlackRock Cash Funds: Institutional, | 35,102 | 3,515 | 38,617 | $ | 38,624,287 | $ | 239,272 | (b) | $ (1,590 | ) | $ | 2,249 | ||||||||||||||||
BlackRock Cash Funds: Treasury, | 1,574 | 1,230 | 2,804 | 2,804,001 | 27,648 | — | — | |||||||||||||||||||||
|
|
|
|
|
|
|
| |||||||||||||||||||||
| $ | 41,428,288 | $ | 266,920 | $ (1,590 | ) | $ | 2,249 | |||||||||||||||||||||
|
|
|
|
|
|
|
|
| (a) | Includes realized capital gain distributions from an affiliated fund, if any. |
| (b) | Includes securities lending income earned from the reinvestment of cash collateral from loaned securities (excluding collateral investment fees), net of fees and other payments to and from borrowers of securities, and less fees paid to BTC as securities lending agent. |
Fair Value Measurements
Various inputs are used in determining the fair value of financial instruments. For description of the input levels and information about the Fund’s policy regarding valuation of financial instruments, refer to the Notes to Financial Statements.
The following table summarizes the value of the Fund’s investments according to the fair value hierarchy as of October 31, 2018. The breakdown of the Fund’s investments into major categories is disclosed in the Schedule of Investments above.
| Level 1 | Level 2 | Level 3 | Total | |||||||||||||
Investments | ||||||||||||||||
Assets | ||||||||||||||||
Corporate Bonds & Notes | $ | — | $ | 205,879,943 | $ | — | $ | 205,879,943 | ||||||||
Money Market Funds | 41,428,288 | — | — | 41,428,288 | ||||||||||||
|
|
|
|
|
|
|
| |||||||||
| $ | 41,428,288 | $ | 205,879,943 | $ | — | $ | 247,308,231 | |||||||||
|
|
|
|
|
|
|
| |||||||||
See notes to financial statements.
S C H E D U L E O F I N V E S T M E N T S | 55 |
Statements of Assets and Liabilities
October 31, 2018
| iShares Emerging Markets High Yield Bond ETF | iShares International High Yield Bond ETF | iShares Corporate | iShares J.P. Morgan EM Local Currency Bond ETF | |||||||||||||
ASSETS | ||||||||||||||||
Investments in securities, at value (including securities on loan)(a): | ||||||||||||||||
Unaffiliated(b) | $ | 390,406,298 | $ | 64,283,656 | $ | 70,710,296 | $ | 416,128,363 | ||||||||
Affiliated(c) | 3,376,183 | 12,873 | 5,101,366 | 34,679 | ||||||||||||
Cash | 34,341 | — | — | — | ||||||||||||
Foreign currency, at value(d) | — | 1,022,762 | — | 2,686,174 | ||||||||||||
Receivables: | ||||||||||||||||
Investments sold | — | 3,570,702 | 793,994 | 8,889,914 | ||||||||||||
Securities lending income — Affiliated | — | — | 2,281 | — | ||||||||||||
Dividends | 8,418 | 6 | 338 | 5,869 | ||||||||||||
Interest | 5,729,941 | 933,281 | 875,028 | 7,237,349 | ||||||||||||
|
|
|
|
|
|
|
| |||||||||
Total assets | 399,555,181 | 69,823,280 | 77,483,303 | 434,982,348 | ||||||||||||
|
|
|
|
|
|
|
| |||||||||
LIABILITIES | ||||||||||||||||
Collateral on securities loaned, at value | — | — | 4,763,910 | — | ||||||||||||
Deferred foreign capital gain tax | — | — | — | 2,665 | ||||||||||||
Payables: | ||||||||||||||||
Investments purchased | 792,226 | 2,753,677 | 1,173,542 | 11,139,325 | ||||||||||||
Capital shares redeemed | 26,291 | 742 | — | — | ||||||||||||
Securities related to in-kind transactions | — | 1,184,838 | — | — | ||||||||||||
Investment advisory fees | 195,199 | 26,258 | 30,488 | 108,296 | ||||||||||||
|
|
|
|
|
|
|
| |||||||||
Total liabilities | 1,013,716 | 3,965,515 | 5,967,940 | 11,250,286 | ||||||||||||
|
|
|
|
|
|
|
| |||||||||
NET ASSETS | $ | 398,541,465 | $ | 65,857,765 | $ | 71,515,363 | $ | 423,732,062 | ||||||||
|
|
|
|
|
|
|
| |||||||||
NET ASSETS CONSIST OF: | ||||||||||||||||
Paid-in capital | $ | 463,192,262 | $ | 73,593,068 | $ | 75,497,448 | $ | 482,461,808 | ||||||||
Accumulated loss | (64,650,797 | ) | (7,735,303 | ) | (3,982,085 | ) | (58,729,746 | ) | ||||||||
|
|
|
|
|
|
|
| |||||||||
NET ASSETS | $ | 398,541,465 | $ | 65,857,765 | $ | 71,515,363 | $ | 423,732,062 | ||||||||
|
|
|
|
|
|
|
| |||||||||
Shares outstanding | 8,800,000 | 1,300,000 | 1,500,000 | 9,800,000 | ||||||||||||
|
|
|
|
|
|
|
| |||||||||
Net asset value | $ | 45.29 | $ | 50.66 | $ | 47.68 | $ | 43.24 | ||||||||
|
|
|
|
|
|
|
| |||||||||
Shares authorized | 500 million | 500 million | 500 million | 500 million | ||||||||||||
|
|
|
|
|
|
|
| |||||||||
Par value | $ | 0.001 | $ | 0.001 | $ | 0.001 | $ | 0.001 | ||||||||
|
|
|
|
|
|
|
| |||||||||
(a) Securities loaned, at value | $ | — | $ | — | $ | 4,434,098 | $ | — | ||||||||
(b) Investments, at cost — Unaffiliated | $ | 432,311,097 | $ | 70,230,118 | $ | 74,655,393 | $ | 462,701,853 | ||||||||
(c) Investments, at cost — Affiliated | $ | 3,376,183 | $ | 12,873 | $ | 5,100,851 | $ | 34,679 | ||||||||
(d) Foreign currency, at cost | $ | — | $ | 1,043,285 | $ | — | $ | 2,738,137 | ||||||||
See notes to financial statements.
| 56 | 2 0 1 8 I S H A R E S A N N U A L R E P O R T T O S H A R E H O L D E R S |
Statements of Assets and Liabilities (continued)
October 31, 2018
| iShares US & Intl High Yield Corp Bond ETF | ||||
ASSETS | ||||
Investments in securities, at value (including securities on loan)(a): | ||||
Unaffiliated(b) | $ | 205,879,943 | ||
Affiliated(c) | 41,428,288 | |||
Foreign currency, at value(d) | 794,778 | |||
Receivables: | ||||
Investments sold | 2,111,549 | |||
Securities lending income — Affiliated | 18,566 | |||
Dividends | 4,830 | |||
Interest | 3,203,666 | |||
|
| |||
Total assets | 253,441,620 | |||
|
| |||
LIABILITIES | ||||
Collateral on securities loaned, at value | 38,620,481 | |||
Payables: | ||||
Investments purchased | 3,395,393 | |||
Investment advisory fees | 72,655 | |||
|
| |||
Total liabilities | 42,088,529 | |||
|
| |||
NET ASSETS | $ | 211,353,091 | ||
|
| |||
NET ASSETS CONSIST OF: | ||||
Paid-in capital | $ | 221,619,323 | ||
Accumulated loss | (10,266,232 | ) | ||
|
| |||
NET ASSETS | $ | 211,353,091 | ||
|
| |||
Shares outstanding | 4,400,000 | |||
|
| |||
Net asset value | $ | 48.03 | ||
|
| |||
Shares authorized | 500 million | |||
|
| |||
Par value | $ | 0.001 | ||
|
| |||
(a) Securities loaned, at value | $ | 36,509,253 | ||
(b) Investments, at cost — Unaffiliated | $ | 214,814,151 | ||
(c) Investments, at cost — Affiliated | $ | 41,423,199 | ||
(d) Foreign currency, at cost | $ | 809,910 | ||
See notes to financial statements.
F I N A N C I A L S T A T E M E N T S | 57 |
Year Ended October 31, 2018
| iShares Emerging Markets High Yield Bond ETF | iShares International High Yield Bond ETF | iShares J.P. Morgan EM Corporate Bond ETF | iShares J.P. Morgan EM Local Currency Bond ETF | |||||||||||||
INVESTMENT INCOME | ||||||||||||||||
Dividends —Affiliated | $ | 70,383 | $ | 355 | $ | 18,519 | $ | 15,910 | ||||||||
Interest — Unaffiliated | 31,453,628 | 3,138,147 | 4,021,376 | 25,374,641 | ||||||||||||
Securities lending income — Affiliated — net | — | — | 32,088 | — | ||||||||||||
Other income — Unaffiliated | 9,185 | 18,448 | 8,075 | — | ||||||||||||
Foreign taxes withheld | (1,487 | ) | — | — | (373,218 | ) | ||||||||||
Other foreign taxes | — | — | — | (53 | ) | |||||||||||
|
|
|
|
|
|
|
| |||||||||
Total investment income | 31,531,709 | 3,156,950 | 4,080,058 | 25,017,280 | ||||||||||||
|
|
|
|
|
|
|
| |||||||||
EXPENSES | ||||||||||||||||
Investment advisory fees | 2,809,735 | 386,226 | 419,163 | 1,603,499 | ||||||||||||
Proxy fees | 28 | 7 | 8 | 27 | ||||||||||||
|
|
|
|
|
|
|
| |||||||||
Total expenses | 2,809,763 | 386,233 | 419,171 | 1,603,526 | ||||||||||||
Less: | ||||||||||||||||
Investment advisory fees waived | — | — | — | (51,344 | ) | |||||||||||
|
|
|
|
|
|
|
| |||||||||
Total expenses after fees waived | 2,809,763 | 386,233 | 419,171 | 1,552,182 | ||||||||||||
|
|
|
|
|
|
|
| |||||||||
Net investment income | 28,721,946 | 2,770,717 | 3,660,887 | 23,465,098 | ||||||||||||
|
|
|
|
|
|
|
| |||||||||
REALIZED AND UNREALIZED GAIN (LOSS) | ||||||||||||||||
Net realized gain (loss) from: | ||||||||||||||||
Investments — Unaffiliated(a) | (8,434,273 | ) | (851,342 | ) | (339,401 | ) | (20,420,871 | ) | ||||||||
Investments — Affiliated | — | — | 276 | — | ||||||||||||
In-kind redemptions — Unaffiliated | (6,949,726 | ) | (660,020 | ) | (754,546 | ) | (223,151 | ) | ||||||||
Foreign currency transactions | — | 47,196 | (4 | ) | (1,811,276 | ) | ||||||||||
Payment by affiliate | 34,341 | — | — | — | ||||||||||||
|
|
|
|
|
|
|
| |||||||||
Net realized loss | (15,349,658 | ) | (1,464,166 | ) | (1,093,675 | ) | (22,455,298 | ) | ||||||||
|
|
|
|
|
|
|
| |||||||||
Net change in unrealized appreciation (depreciation) on: | ||||||||||||||||
Investments — Unaffiliated(b) | (47,772,345 | ) | (5,987,224 | ) | (5,355,868 | ) | (39,380,748 | ) | ||||||||
Investments — Affiliated | — | — | 332 | — | ||||||||||||
Foreign currency translations | — | (37,153 | ) | — | 100,721 | |||||||||||
|
|
|
|
|
|
|
| |||||||||
Net change in unrealized appreciation (depreciation) | (47,772,345 | ) | (6,024,377 | ) | (5,355,536 | ) | (39,280,027 | ) | ||||||||
|
|
|
|
|
|
|
| |||||||||
Net realized and unrealized loss | (63,122,003 | ) | (7,488,543 | ) | (6,449,211 | ) | (61,735,325 | ) | ||||||||
|
|
|
|
|
|
|
| |||||||||
NET DECREASE IN NET ASSETS RESULTING FROM OPERATIONS | $ | (34,400,057 | ) | $ | (4,717,826 | ) | $ | (2,788,324 | ) | $ | (38,270,227 | ) | ||||
|
|
|
|
|
|
|
| |||||||||
(a) Net of foreign capital gain tax of | $ | — | $ | — | $ | — | $ | 70,358 | ||||||||
(b) Net of deferred foreign capital gain tax of | $ | (40,799 | ) | $ | — | $ | (9,938 | ) | $ | (70,130 | ) | |||||
See notes to financial statements.
| 58 | 2 0 1 8 I S H A R E S A N N U A L R E P O R T T O S H A R E H O L D E R S |
Statements of Operations (continued)
Year Ended October 31, 2018
| iShares US & Intl High Yield Corp Bond ETF | ||||
INVESTMENT INCOME | ||||
Dividends — Affiliated | $ | 27,648 | ||
Interest — Unaffiliated | 11,463,754 | |||
Securities lending income — Affiliated — net | 239,272 | |||
Other income — Unaffiliated | 49,368 | |||
|
| |||
Total investment income | 11,780,042 | |||
|
| |||
EXPENSES | ||||
Investment advisory fees | 880,452 | |||
Proxy fees | 20 | |||
|
| |||
Total expenses | 880,472 | |||
|
| |||
Net investment income | 10,899,570 | |||
|
| |||
REALIZED AND UNREALIZED GAIN (LOSS) | ||||
Net realized gain (loss) from: | ||||
Investments — Unaffiliated | 419,427 | |||
Investments — Affiliated | (1,590 | ) | ||
In-kind redemptions — Unaffiliated | 549,606 | |||
Foreign currency transactions | 64,799 | |||
|
| |||
Net realized gain | 1,032,242 | |||
|
| |||
Net change in unrealized appreciation (depreciation) on: | ||||
Investments — Unaffiliated | (13,590,078 | ) | ||
Investments — Affiliated | 2,249 | |||
Foreign currency translations | (59,091 | ) | ||
|
| |||
Net change in unrealized appreciation (depreciation) | (13,646,920 | ) | ||
|
| |||
Net realized and unrealized loss | (12,614,678 | ) | ||
|
| |||
NET DECREASE IN NET ASSETS RESULTING FROM OPERATIONS | $ | (1,715,108 | ) | |
|
| |||
See notes to financial statements.
F I N A N C I A L S T A T E M E N T S | 59 |
Statements of Changes in Net Assets
| iShares Emerging Markets High Yield Bond ETF | iShares International High Yield Bond ETF | |||||||||||||||
Year Ended | Year Ended | Year Ended | Year Ended | |||||||||||||
| 10/31/18 | 10/31/17 | 10/31/18 | 10/31/17 | |||||||||||||
| ||||||||||||||||
INCREASE (DECREASE) IN NET ASSETS | ||||||||||||||||
OPERATIONS | ||||||||||||||||
Net investment income | $ | 28,721,946 | $ | 16,846,179 | $ | 2,770,717 | $ | 2,700,220 | ||||||||
Net realized gain (loss) | (15,349,658 | ) | 552,028 | (1,464,166 | ) | (10,896,036 | ) | |||||||||
Net change in unrealized appreciation (depreciation) | (47,772,345 | ) | 5,173,447 | (6,024,377 | ) | 14,689,684 | ||||||||||
|
|
|
|
|
|
|
| |||||||||
Net increase (decrease) in net assets resulting from operations | (34,400,057 | ) | 22,571,654 | (4,717,826 | ) | 6,493,868 | ||||||||||
|
|
|
|
|
|
|
| |||||||||
DISTRIBUTIONS TO SHAREHOLDERS(a)(b) | ||||||||||||||||
From net investment income | (27,754,319 | ) | (16,158,680 | ) | — | (622,289 | ) | |||||||||
Return of capital | — | — | — | (142,861 | ) | |||||||||||
|
|
|
|
|
|
|
| |||||||||
Decrease in net assets resulting from distributions to shareholders | (27,754,319 | ) | (16,158,680 | ) | — | (765,150 | ) | |||||||||
|
|
|
|
|
|
|
| |||||||||
CAPITAL SHARE TRANSACTIONS | ||||||||||||||||
Net increase (decrease) in net assets derived from capital share transactions | (164,171,431 | ) | 511,023,559 | (19,584,391 | ) | (70,364,903 | ) | |||||||||
|
|
|
|
|
|
|
| |||||||||
NET ASSETS(b) | ||||||||||||||||
Total increase (decrease) in net assets | (226,325,807 | ) | 517,436,533 | (24,302,217 | ) | (64,636,185 | ) | |||||||||
Beginning of year | 624,867,272 | 107,430,739 | 90,159,982 | 154,796,167 | ||||||||||||
|
|
|
|
|
|
|
| |||||||||
End of year | $ | 398,541,465 | $ | 624,867,272 | $ | 65,857,765 | $ | 90,159,982 | ||||||||
|
|
|
|
|
|
|
| |||||||||
| (a) | Distributions for annual periods determined in accordance with U.S. federal income tax regulations. |
| (b) | Prior year distribution character information and undistributed net investment income has been modified or removed to conform with current year Regulation S-X presentation changes. Refer to Note 11 for this prior year information. |
See notes to financial statements.
| 60 | 2 0 1 8 I S H A R E S A N N U A L R E P O R T T O S H A R E H O L D E R S |
Statements of Changes in Net Assets (continued)
|
| iShares J.P. Morgan EM Corporate Bond ETF | iShares J.P. Morgan EM Local Currency Bond ETF | |||||||||||||||
Year Ended | Year Ended | Year Ended | Year Ended | |||||||||||||
| 10/31/18 | 10/31/17 | 10/31/18 | 10/31/17 | |||||||||||||
| ||||||||||||||||
INCREASE (DECREASE) IN NET ASSETS | ||||||||||||||||
OPERATIONS | ||||||||||||||||
Net investment income | $ | 3,660,887 | $ | 2,870,645 | $ | 23,465,098 | $ | 15,037,672 | ||||||||
Net realized gain (loss) | (1,093,675 | ) | 724,414 | (22,455,298 | ) | (18,771,612 | ) | |||||||||
Net change in unrealized appreciation (depreciation) | (5,355,536 | ) | 1,273,020 | (39,280,027 | ) | 7,394,809 | ||||||||||
|
|
|
|
|
|
|
| |||||||||
Net increase (decrease) in net assets resulting from operations | (2,788,324 | ) | 4,868,079 | (38,270,227 | ) | 3,660,869 | ||||||||||
|
|
|
|
|
|
|
| |||||||||
DISTRIBUTIONS TO SHAREHOLDERS(a)(b) | ||||||||||||||||
Decrease in net assets resulting from distributions to shareholders | (3,577,391 | ) | (2,731,913 | ) | — | — | ||||||||||
|
|
|
|
|
|
|
| |||||||||
CAPITAL SHARE TRANSACTIONS | ||||||||||||||||
Net increase (decrease) in net assets derived from capital share transactions | (9,387,512 | ) | 52,374,235 | 152,785,390 | (145,854,394 | ) | ||||||||||
|
|
|
|
|
|
|
| |||||||||
NET ASSETS(b) | ||||||||||||||||
Total increase (decrease) in net assets | (15,753,227 | ) | 54,510,401 | 114,515,163 | (142,193,525 | ) | ||||||||||
Beginning of year | 87,268,590 | 32,758,189 | 309,216,899 | 451,410,424 | ||||||||||||
|
|
|
|
|
|
|
| |||||||||
End of year | $ | 71,515,363 | $ | 87,268,590 | $ | 423,732,062 | $ | 309,216,899 | ||||||||
|
|
|
|
|
|
|
| |||||||||
| (a) | Distributions for annual periods determined in accordance with U.S. federal income tax regulations. |
| (b) | Prior year distribution character information and undistributed net investment income (accumulated net investment loss) has been modified or removed to conform with current year Regulation S-X presentation changes. Refer to Note 11 for this prior year information. |
See notes to financial statements.
F I N A N C I A L H I G H L I G H T S | 61 |
Statements of Changes in Net Assets (continued)
| ||
| iShares US & Intl High Yield Corp Bond ETF | ||||||||
Year Ended | Year Ended | |||||||
10/31/18
| 10/31/17
| |||||||
INCREASE (DECREASE) IN NET ASSETS | ||||||||
OPERATIONS | ||||||||
Net investment income | $ | 10,899,570 | $ | 8,545,329 | ||||
Net realized gain | 1,032,242 | 1,097,777 | ||||||
Net change in unrealized appreciation (depreciation) | (13,646,920 | ) | 6,304,984 | |||||
|
|
|
| |||||
Net increase (decrease) in net assets resulting from operations | (1,715,108 | ) | 15,948,090 | |||||
|
|
|
| |||||
DISTRIBUTIONS TO SHAREHOLDERS(a)(b) | ||||||||
Decrease in net assets resulting from distributions to shareholders | (11,429,826 | ) | (7,410,092 | ) | ||||
|
|
|
| |||||
CAPITAL SHARE TRANSACTIONS | ||||||||
Net increase in net assets derived from capital share transactions | 10,395,402 | 108,017,781 | ||||||
|
|
|
| |||||
NET ASSETS(b) | ||||||||
Total increase (decrease) in net assets | (2,749,532 | ) | 116,555,779 | |||||
Beginning of year | 214,102,623 | 97,546,844 | ||||||
|
|
|
| |||||
End of year | $ | 211,353,091 | $ | 214,102,623 | ||||
|
|
|
| |||||
| (a) | Distributions for annual periods determined in accordance with U.S. federal income tax regulations. |
| (b) | Prior year distribution character information and undistributed net investment income has been modified or removed to conform with current year Regulation S-X presentation changes. Refer to Note 11 for this prior year information. |
See notes to financial statements.
| 62 | 2 0 1 8 I S H A R E S A N N U A L R E P O R T T O S H A R E H O L D E R S |
(For a share outstanding throughout each period)
| iShares Emerging Markets High Yield Bond ETF | ||||||||||||||||||||
| Year Ended 10/31/18 | Year Ended 10/31/17 | Year Ended 10/31/16 | Year Ended 10/31/15 | Year Ended 10/31/14 | ||||||||||||||||
| ||||||||||||||||||||
Net asset value, beginning of year | $ | 50.60 | $ | 49.97 | $ | 46.82 | $ | 51.03 | $ | 50.90 | ||||||||||
|
|
|
|
|
|
|
|
|
| |||||||||||
Net investment income(a) | 2.44 | 2.87 | 3.03 | 2.99 | 2.93 | |||||||||||||||
Net realized and unrealized gain (loss)(b) | (5.40 | ) | 0.77 | 3.25 | (4.11 | ) | 0.15 | |||||||||||||
|
|
|
|
|
|
|
|
|
| |||||||||||
Net increase (decrease) from investment operations | (2.96 | ) | 3.64 | 6.28 | (1.12 | ) | 3.08 | |||||||||||||
|
|
|
|
|
|
|
|
|
| |||||||||||
Distributions(c) | ||||||||||||||||||||
From net investment income | (2.35 | ) | (3.01 | ) | (3.13 | ) | (3.09 | ) | (2.95 | ) | ||||||||||
|
|
|
|
|
|
|
|
|
| |||||||||||
Total distributions | (2.35 | ) | (3.01 | ) | (3.13 | ) | (3.09 | ) | (2.95 | ) | ||||||||||
|
|
|
|
|
|
|
|
|
| |||||||||||
Net asset value, end of year | $ | 45.29 | $ | 50.60 | $ | 49.97 | $ | 46.82 | $ | 51.03 | ||||||||||
|
|
|
|
|
|
|
|
|
| |||||||||||
Total Return | ||||||||||||||||||||
Based on net asset value | (5.96 | )%(d) | 7.60 | % | 14.02 | % | (2.13 | )% | 6.24 | % | ||||||||||
|
|
|
|
|
|
|
|
|
| |||||||||||
Ratios to Average Net Assets | ||||||||||||||||||||
Total expenses | 0.50 | % | 0.50 | % | 0.50 | % | 0.55 | % | 0.65 | % | ||||||||||
|
|
|
|
|
|
|
|
|
| |||||||||||
Net investment income | 5.11 | % | 5.73 | % | 6.35 | % | 6.29 | % | 5.78 | % | ||||||||||
|
|
|
|
|
|
|
|
|
| |||||||||||
Supplemental Data | ||||||||||||||||||||
Net assets, end of year (000) | $ | 398,541 | $ | 624,867 | $ | 107,431 | $ | 159,199 | $ | 199,005 | ||||||||||
|
|
|
|
|
|
|
|
|
| |||||||||||
Portfolio turnover rate(e) | 19 | % | 25 | % | 29 | % | 39 | % | 24 | % | ||||||||||
|
|
|
|
|
|
|
|
|
| |||||||||||
| (a) | Based on average shares outstanding. |
| (b) | The amounts reported for a share outstanding may not accord with the change in aggregate gains and losses in securities for the fiscal period due to the timing of capital share transactions in relation to the fluctuating market values of the Fund’s underlying securities. |
| (c) | Distributions for annual periods determined in accordance with U.S. federal income tax regulations. |
| (d) | Includes payment received from an affiliate, which had no impact on the Fund’s total return. |
| (e) | Portfolio turnover rate excludes in-kind transactions. |
See notes to financial statements.
F I N A N C I A L H I G H L I G H T S | 63 |
Financial Highlights (continued)
(For a share outstanding throughout each period)
| iShares International High Yield Bond ETF | ||||||||||||||||||||
| Year Ended 10/31/18 | Year Ended 10/31/17 | Year Ended 10/31/16 | Year Ended 10/31/15 | Year Ended 10/31/14 | ||||||||||||||||
| ||||||||||||||||||||
Net asset value, beginning of year | $ | 53.04 | $ | 46.91 | $ | 46.44 | $ | 52.90 | $ | 56.84 | ||||||||||
|
|
|
|
|
|
|
|
|
| |||||||||||
Net investment income(a) | 1.54 | 1.77 | 1.82 | 1.84 | 2.43 | |||||||||||||||
Net realized and unrealized gain (loss)(b) | (3.92 | ) | 4.85 | (0.47 | ) | (6.57 | ) | (3.55 | ) | |||||||||||
|
|
|
|
|
|
|
|
|
| |||||||||||
Net increase (decrease) from investment operations | (2.38 | ) | 6.62 | 1.35 | (4.73 | ) | (1.12 | ) | ||||||||||||
|
|
|
|
|
|
|
|
|
| |||||||||||
Distributions(c) | ||||||||||||||||||||
From net investment income | — | (0.40 | ) | (0.26 | ) | (0.05 | ) | (2.82 | ) | |||||||||||
From net realized gain | — | — | — | (0.02 | ) | — | ||||||||||||||
Return of capital | — | (0.09 | ) | (0.62 | ) | (1.66 | ) | — | ||||||||||||
|
|
|
|
|
|
|
|
|
| |||||||||||
Total distributions | — | (0.49 | ) | (0.88 | ) | (1.73 | ) | (2.82 | ) | |||||||||||
|
|
|
|
|
|
|
|
|
| |||||||||||
Net asset value, end of year | $ | 50.66 | $ | 53.04 | $ | 46.91 | $ | 46.44 | $ | 52.90 | ||||||||||
|
|
|
|
|
|
|
|
|
| |||||||||||
Total Return | ||||||||||||||||||||
Based on net asset value | (4.49 | )% | 14.21 | % | 2.95 | % | (9.02 | )% | (2.20 | )% | ||||||||||
|
|
|
|
|
|
|
|
|
| |||||||||||
Ratios to Average Net Assets | ||||||||||||||||||||
Total expenses | 0.40 | % | 0.40 | % | 0.51 | % | 0.55 | % | 0.55 | % | ||||||||||
|
|
|
|
|
|
|
|
|
| |||||||||||
Total expenses after fees waived | 0.40 | % | 0.40 | % | 0.40 | % | 0.40 | % | 0.40 | % | ||||||||||
|
|
|
|
|
|
|
|
|
| |||||||||||
Net investment income | 2.87 | % | 3.62 | % | 3.93 | % | 3.85 | % | 4.25 | % | ||||||||||
|
|
|
|
|
|
|
|
|
| |||||||||||
Supplemental Data | ||||||||||||||||||||
Net assets, end of year (000) | $ | 65,858 | $ | 90,160 | $ | 154,796 | $ | 185,756 | $ | 142,827 | ||||||||||
|
|
|
|
|
|
|
|
|
| |||||||||||
Portfolio turnover rate(d) | 31 | % | 49 | % | 24 | % | 28 | % | 25 | % | ||||||||||
|
|
|
|
|
|
|
|
|
| |||||||||||
| (a) | Based on average shares outstanding. |
| (b) | The amounts reported for a share outstanding may not accord with the change in aggregate gains and losses in securities for the fiscal period due to the timing of capital share transactions in relation to the fluctuating market values of the Fund’s underlying securities. |
| (c) | Distributions for annual periods determined in accordance with U.S. federal income tax regulations. |
| (d) | Portfolio turnover rate excludes in-kind transactions. |
See notes to financial statements.
| 64 | 2 0 1 8 I S H A R E S A N N U A L R E P O R T T O S H A R E H O L D E R S |
Financial Highlights (continued)
(For a share outstanding throughout each period)
| iShares J.P. Morgan EM Corporate Bond ETF | ||||||||||||||||||||
| Year Ended 10/31/18 | Year Ended 10/31/17 | Year Ended 10/31/16 | Year Ended 10/31/15 | Year Ended 10/31/14 | ||||||||||||||||
| ||||||||||||||||||||
Net asset value, beginning of year | $ | 51.33 | $ | 50.40 | $ | 48.21 | $ | 51.18 | $ | 50.48 | ||||||||||
|
|
|
|
|
|
|
|
|
| |||||||||||
Net investment income(a) | 2.16 | 2.10 | 2.19 | 2.19 | 2.01 | |||||||||||||||
Net realized and unrealized gain (loss)(b) | (3.70 | ) | 0.90 | 2.18 | (3.02 | ) | 0.75 | |||||||||||||
|
|
|
|
|
|
|
|
|
| |||||||||||
Net increase (decrease) from investment operations | (1.54 | ) | 3.00 | 4.37 | (0.83 | ) | 2.76 | |||||||||||||
|
|
|
|
|
|
|
|
|
| |||||||||||
Distributions(c) | ||||||||||||||||||||
From net investment income | (2.11 | ) | (2.07 | ) | (2.18 | ) | (2.14 | ) | (2.06 | ) | ||||||||||
|
|
|
|
|
|
|
|
|
| |||||||||||
Total distributions | (2.11 | ) | (2.07 | ) | (2.18 | ) | (2.14 | ) | (2.06 | ) | ||||||||||
|
|
|
|
|
|
|
|
|
| |||||||||||
Net asset value, end of year | $ | 47.68 | $ | 51.33 | $ | 50.40 | $ | 48.21 | $ | 51.18 | ||||||||||
|
|
|
|
|
|
|
|
|
| |||||||||||
Total Return | ||||||||||||||||||||
Based on net asset value | (3.09 | )% | 6.14 | % | 9.33 | % | (1.62 | )% | 5.61 | % | ||||||||||
|
|
|
|
|
|
|
|
|
| |||||||||||
Ratios to Average Net Assets | ||||||||||||||||||||
Total expenses | 0.50 | % | 0.50 | % | 0.50 | % | 0.53 | % | 0.60 | % | ||||||||||
|
|
|
|
|
|
|
|
|
| |||||||||||
Net investment income | 4.37 | % | 4.16 | % | 4.51 | % | 4.47 | % | 3.99 | % | ||||||||||
|
|
|
|
|
|
|
|
|
| |||||||||||
Supplemental Data | ||||||||||||||||||||
Net assets, end of year (000) | $ | 71,515 | $ | 87,269 | $ | 32,758 | $ | 28,929 | $ | 25,591 | ||||||||||
|
|
|
|
|
|
|
|
|
| |||||||||||
Portfolio turnover rate(d) | 16 | % | 62 | % | 22 | % | 11 | % | 20 | % | ||||||||||
|
|
|
|
|
|
|
|
|
| |||||||||||
| (a) | Based on average shares outstanding. |
| (b) | The amounts reported for a share outstanding may not accord with the change in aggregate gains and losses in securities for the fiscal period due to the timing of capital share transactions in relation to the fluctuating market values of the Fund’s underlying securities. |
| (c) | Distributions for annual periods determined in accordance with U.S. federal income tax regulations. |
| (d) | Portfolio turnover rate excludes in-kind transactions. |
See notes to financial statements.
F I N A N C I A L H I G H L I G H T S | 65 |
Financial Highlights (continued)
(For a share outstanding throughout each period)
| iShares J.P. Morgan EM Local Currency Bond ETF | ||||||||||||||||||||
| Year Ended 10/31/18 | Year Ended 10/31/17 | Year Ended 10/31/16 | Year Ended 10/31/15 | Year Ended 10/31/14 | ||||||||||||||||
| ||||||||||||||||||||
Net asset value, beginning of year | $ | 46.85 | $ | 45.14 | $ | 41.31 | $ | 48.74 | $ | 50.66 | ||||||||||
|
|
|
|
|
|
|
|
|
| |||||||||||
Net investment income(a) | 2.87 | 2.29 | 1.94 | 2.03 | 2.26 | |||||||||||||||
Net realized and unrealized gain (loss)(b) | (6.48 | ) | (0.58 | ) | 1.89 | (8.87 | ) | (2.84 | ) | |||||||||||
|
|
|
|
|
|
|
|
|
| |||||||||||
Net increase (decrease) from investment operations | (3.61 | ) | 1.71 | 3.83 | (6.84 | ) | (0.58 | ) | ||||||||||||
|
|
|
|
|
|
|
|
|
| |||||||||||
Distributions(c) | ||||||||||||||||||||
From net investment income | — | — | — | — | (1.31 | ) | ||||||||||||||
Return of capital | — | — | — | (0.59 | ) | (0.03 | ) | |||||||||||||
|
|
|
|
|
|
|
|
|
| |||||||||||
Total distributions | — | — | — | (0.59 | ) | (1.34 | ) | |||||||||||||
|
|
|
|
|
|
|
|
|
| |||||||||||
Net asset value, end of year | $ | 43.24 | $ | 46.85 | $ | 45.14 | $ | 41.31 | $ | 48.74 | ||||||||||
|
|
|
|
|
|
|
|
|
| |||||||||||
Total Return | ||||||||||||||||||||
Based on net asset value | (7.71 | )% | 3.79 | % | 9.06 | %(d) | (13.99 | )%(d) | (1.14 | )% | ||||||||||
|
|
|
|
|
|
|
|
|
| |||||||||||
Ratios to Average Net Assets | ||||||||||||||||||||
Total expenses | 0.42 | % | 0.50 | % | 0.50 | % | 0.53 | % | 0.60 | % | ||||||||||
|
|
|
|
|
|
|
|
|
| |||||||||||
Total expenses after fees waived | 0.41 | % | 0.50 | % | 0.50 | % | 0.50 | % | 0.59 | % | ||||||||||
|
|
|
|
|
|
|
|
|
| |||||||||||
Net investment income | 6.19 | % | 5.04 | % | 4.56 | % | 4.63 | % | 4.56 | % | ||||||||||
|
|
|
|
|
|
|
|
|
| |||||||||||
Supplemental Data | ||||||||||||||||||||
Net assets, end of year (000) | $ | 423,732 | $ | 309,217 | $ | 451,410 | $ | 520,532 | $ | 584,857 | ||||||||||
|
|
|
|
|
|
|
|
|
| |||||||||||
Portfolio turnover rate(e) | 51 | % | 97 | % | 59 | % | 46 | % | 43 | % | ||||||||||
|
|
|
|
|
|
|
|
|
| |||||||||||
| (a) | Based on average shares outstanding. |
| (b) | The amounts reported for a share outstanding may not accord with the change in aggregate gains and losses in securities for the fiscal period due to the timing of capital share transactions in relation to the fluctuating market values of the Fund’s underlying securities. |
| (c) | Distributions for annual periods determined in accordance with U.S. federal income tax regulations. |
| (d) | The total return disclosed is based on the net asset value (“NAV”) calculated daily for the creation and redemption of shares in the Fund, which may differ from the NAV calculated for financial reporting purposes. Based on the NAV calculated for financial reporting purposes, the total return for the years ended October 31, 2016 and October 31, 2015 were 9.27% and (14.16)%, respectively. |
| (e) | Portfolio turnover rate excludes in-kind transactions. |
See notes to financial statements.
| 66 | 2 0 1 8 I S H A R E S A N N U A L R E P O R T T O S H A R E H O L D E R S |
Financial Highlights (continued)
(For a share outstanding throughout each period)
| iShares US & Intl High Yield Corp Bond ETF | ||||||||||||||||||||
| Year Ended 10/31/18 | Year Ended 10/31/17 | Year Ended 10/31/16 | Year Ended 10/31/15 | Year Ended 10/31/14 | ||||||||||||||||
| ||||||||||||||||||||
Net asset value, beginning of year | $ | 50.98 | $ | 48.77 | $ | 47.57 | $ | 52.00 | $ | 53.50 | ||||||||||
|
|
|
|
|
|
|
|
|
| |||||||||||
Net investment income(a) | 2.46 | 2.45 | 2.55 | 2.56 | 2.84 | |||||||||||||||
Net realized and unrealized gain (loss)(b) | (2.80 | ) | 2.08 | 0.57 | (4.76 | ) | (1.28 | ) | ||||||||||||
|
|
|
|
|
|
|
|
|
| |||||||||||
Net increase (decrease) from investment operations | (0.34 | ) | 4.53 | 3.12 | (2.20 | ) | 1.56 | |||||||||||||
|
|
|
|
|
|
|
|
|
| |||||||||||
Distributions(c) | ||||||||||||||||||||
From net investment income | (2.61 | ) | (2.32 | ) | (1.92 | ) | (2.23 | ) | (3.06 | ) | ||||||||||
|
|
|
|
|
|
|
|
|
| |||||||||||
Total distributions | (2.61 | ) | (2.32 | ) | (1.92 | ) | (2.23 | ) | (3.06 | ) | ||||||||||
|
|
|
|
|
|
|
|
|
| |||||||||||
Net asset value, end of year | $ | 48.03 | $ | 50.98 | $ | 48.77 | $ | 47.57 | $ | 52.00 | ||||||||||
|
|
|
|
|
|
|
|
|
| |||||||||||
Total Return | ||||||||||||||||||||
Based on net asset value | (0.71 | )% | 9.58 | % | 6.82 | % | (4.32 | )% | 2.91 | % | ||||||||||
|
|
|
|
|
|
|
|
|
| |||||||||||
Ratios to Average Net Assets | ||||||||||||||||||||
Total expenses | 0.40 | % | 0.40 | % | 0.51 | % | 0.55 | % | 0.55 | % | ||||||||||
|
|
|
|
|
|
|
|
|
| |||||||||||
Total expenses after fees waived | 0.40 | % | 0.40 | % | 0.40 | % | 0.40 | % | 0.40 | % | ||||||||||
|
|
|
|
|
|
|
|
|
| |||||||||||
Net investment income | 4.95 | % | 4.93 | % | 5.44 | % | 5.18 | % | 5.31 | % | ||||||||||
|
|
|
|
|
|
|
|
|
| |||||||||||
Supplemental Data | ||||||||||||||||||||
Net assets, end of year (000) | $ | 211,353 | $ | 214,103 | $ | 97,547 | $ | 118,931 | $ | 104,002 | ||||||||||
|
|
|
|
|
|
|
|
|
| |||||||||||
Portfolio turnover rate(d) | 20 | % | 22 | % | 24 | % | 21 | % | 21 | % | ||||||||||
|
|
|
|
|
|
|
|
|
| |||||||||||
| (a) | Based on average shares outstanding. |
| (b) | The amounts reported for a share outstanding may not accord with the change in aggregate gains and losses in securities for the fiscal period due to the timing of capital share transactions in relation to the fluctuating market values of the Fund’s underlying securities. |
| (c) | Distributions for annual periods determined in accordance with U.S. federal income tax regulations. |
| (d) | Portfolio turnover rate excludes in-kind transactions. |
See notes to financial statements.
F I N A N C I A L H I G H L I G H T S | 67 |
| 1. | ORGANIZATION |
iShares, Inc. (the “Company”) is registered under the Investment Company Act of 1940, as amended (the “1940 Act”), as an open-end management investment company. The Company is organized as a Maryland corporation and is authorized to have multiple series or portfolios.
These financial statements relate only to the following funds (each, a “Fund,” and collectively, the “Funds”):
| iShares ETF | Diversification Classification | |
Emerging Markets High Yield Bond | Non-diversified | |
International High Yield Bond | Diversified | |
J.P. Morgan EM Corporate Bond | Diversified | |
J.P. Morgan EM Local Currency Bond | Non-diversified | |
US & Intl High Yield Corp Bond | Diversified |
| 2. | SIGNIFICANT ACCOUNTING POLICIES |
The following significant accounting policies are consistently followed by each Fund in the preparation of its financial statements in conformity with accounting principles generally accepted in the United States of America (“U.S. GAAP”). The preparation of financial statements in conformity with U.S. GAAP requires management to make certain estimates and assumptions that affect the reported amounts of assets and liabilities and disclosures of contingent assets and liabilities at the date of the financial statements and the reported amounts of increases and decreases in net assets from operations during the reporting period. Actual results could differ from those estimates. Each Fund is considered an investment company under U.S. GAAP and follows the accounting and reporting guidance applicable to investment companies.
Investment Transactions and Income Recognition: Investment transactions are accounted for on trade date. Realized gains and losses on investment transactions are determined using the specific identification method. Interest income, including amortization and accretion of premiums and discounts on debt securities, and payment-in-kind interest income, if any, are recognized daily on the accrual basis. Dividend income and capital gain distributions, if any, are recognized on the ex-dividend date, net of any foreign taxes withheld at source.
Foreign Currency Translation: The accounting records of the Funds are maintained in U.S. dollars. Foreign currencies, as well as investment securities and other assets and liabilities denominated in non-U.S. currencies are translated to U.S. dollars using prevailing market rates as quoted by one or more data service providers. Purchases and sales of investments, income receipts and expense payments are translated into U.S. dollars on the respective dates of such transactions.
Each Fund does not isolate the effect of fluctuations in foreign exchange rates from the effect of fluctuations in the market prices of investments. Such fluctuations are reflected by the Funds as a component of net realized and unrealized gain (loss) from investments for financial reporting purposes. Each Fund reports realized currency gain (loss) on foreign currency related transactions as components of net realized gain (loss) for financial reporting purposes, whereas such components are generally treated as ordinary income for U.S. federal income tax purposes.
Foreign Taxes: The Funds may be subject to foreign taxes (a portion of which may be reclaimable) on income, stock dividends, capital gains on investments, or certain foreign currency transactions. All foreign taxes are recorded in accordance with the applicable foreign tax regulations and rates that exist in the foreign jurisdictions in which each Fund invests. These foreign taxes, if any, are paid by each Fund and are reflected in its statement of operations as follows: foreign taxes withheld at source are presented as a reduction of income, foreign taxes on securities lending income are presented as a reduction of securities lending income, foreign taxes on stock dividends are presented as “other foreign taxes”, and foreign taxes on capital gains from sales of investments and foreign taxes on foreign currency transactions are included in their respective net realized gain (loss) categories. Foreign taxes payable or deferred as of October 31, 2018, if any, are disclosed in the statement of assets and liabilities.
In-kind Redemptions: For financial reporting purposes, in-kind redemptions are treated as sales of securities resulting in realized capital gains or losses to the Funds. Because such gains or losses are not taxable to the Funds and are not distributed to existing Fund shareholders, the gains or losses are reclassified from accumulated net realized gain (loss) to paid-in capital at the end of the Funds’ tax year. These reclassifications have no effect on net assets or net asset value per share.
Distributions: Dividends and distributions paid by each Fund are recorded on the ex-dividend dates. Distributions are determined on a tax basis and may differ from net investment income and net realized capital gains for financial reporting purposes. Dividends and distributions are paid in U.S. dollars and cannot be automatically reinvested in additional shares of the Funds.
Recent Accounting Standards: In March 2017, the Financial Accounting Standards Board issued Accounting Standards Update “Premium Amortization on Purchase Callable Debt Securities” which amends the amortization period for certain purchased callable debt securities. Under the new guidance, premium amortization of purchased callable debt securities that have explicit, non-contingent call features and are callable at fixed prices will be amortized to the earliest call date. The guidance will be applied on a modified retrospective basis and is effective for fiscal years, and their interim periods, beginning after December 15, 2018. Management is currently evaluating the impact of this guidance to the Funds.
In August 2018, the Financial Accounting Standards Board issued Accounting Standards Update 2018-13 “Changes to the Disclosure Requirements for Fair Value Measurement” which modifies disclosure requirements for fair value measurements. The guidance is effective for fiscal years beginning after December 15, 2019 and for interim periods within those fiscal years. Management is currently evaluating the impact of this guidance to the Funds.
| 68 | 2 0 1 8 I S H A R E S A N N U A L R E P O R T T O S H A R E H O L D E R S |
Notes to Financial Statements (continued)
Indemnifications: In the normal course of business, each Fund enters into contracts that contain a variety of representations that provide general indemnification. The Funds’ maximum exposure under these arrangements is unknown because it involves future potential claims against the Funds, which cannot be predicted with any certainty.
| 3. | INVESTMENT VALUATION AND FAIR VALUE MEASUREMENTS |
Investment Valuation Policies: Each Fund’s investments are valued at fair value (also referred to as “market value” within the financial statements) each day that the Fund’s listing exchange is open and, for financial reporting purposes, as of the report date should the reporting period end on a day that the Fund’s listing exchange is not open. U.S. GAAP defines fair value as the price a fund would receive to sell an asset or pay to transfer a liability in an orderly transaction between market participants at the measurement date. A fund determines the fair value of its financial instruments using various independent dealers or pricing services under policies approved by the Board of Directors of the Company (the “Board”). The BlackRock Global Valuation Methodologies Committee (the “Global Valuation Committee”) is the committee formed by management to develop global pricing policies and procedures and to oversee the pricing function for all financial instruments.
Fair Value Inputs and Methodologies: The following methods and inputs are used to establish the fair value of each Fund’s assets and liabilities:
| • | Fixed-income investments are valued using the last available bid price or current market quotations provided by independent dealers or prices (including evaluated prices) supplied by approved independent third-party pricing services. Pricing services generally value fixed income securities assuming orderly transactions of an institutional round lot size, but a fund may hold or transact in such securities in smaller, odd lot sizes. Odd lots may trade at lower prices than institutional round lots. The pricing services may use matrix pricing or valuation models that utilize certain inputs and assumptions to derive values, including transaction data, credit quality information, perceived market movements, news, and other relevant information and by other methods, which may include consideration of: yields or prices of securities of comparable quality, coupon, maturity and type; indications as to values from dealers; general market conditions; and/or other factors and assumptions. |
| • | Investments in open-end U.S. mutual funds (including money market funds) are valued at that day’s published net asset value (“NAV”). |
If events (e.g., a company announcement, market volatility or a natural disaster) occur that are expected to materially affect the value of an investment, or in the event that application of these methods of valuation results in a price for an investment that is deemed not to be representative of the market value of such investment, or if a price is not available, the investment will be valued by the Global Valuation Committee, in accordance with policies approved by the Board as reflecting fair value (“Fair Valued Investments”). The fair valuation approaches that may be used by the Global Valuation Committee include market approach, income approach and the cost approach. Valuation techniques used under these approaches take into consideration inputs that include but are not limited to (i) attributes specific to the investment; (ii) the principal market for the investment; (iii) the customary participants in the principal market for the investment; (iv) data assumptions by market participants for the investment, if reasonably available; (v) quoted prices for similar investments in active markets; and (vi) other inputs, such as future cash flows, interest rates, yield curves, volatilities, prepayment speeds, loss severities, credit risks and/or default rates.
The Global Valuation Committee employs various methods for calibrating valuation approaches for investments where an active market does not exist, including regular due diligence of the Company’s pricing vendors, regular reviews of key inputs and assumptions, transactional back-testing or disposition analysis to compare unrealized gains and losses to realized gains and losses, reviews of missing or stale prices and large movements in market values, and reviews of any market related activity. The pricing of all Fair Valued Investments is subsequently reported to the Board on a quarterly basis.
Fair value pricing could result in a difference between the prices used to calculate a fund’s NAV and the prices used by the fund’s underlying index, which in turn could result in a difference between the fund’s performance and the performance of the fund’s underlying index.
Fair Value Hierarchy: Various inputs are used in determining the fair value of financial instruments. These inputs to valuation techniques are categorized into a fair value hierarchy consisting of three broad levels for financial reporting purposes as follows:
| • | Level 1 – Unadjusted price quotations in active markets for identical assets or liabilities; |
| • | Level 2 – Inputs other than quoted prices included within Level 1 that are observable for the asset or liability either directly or indirectly, including, but not limited to, quoted prices for similar assets or liabilities in markets that are active, quoted prices for identical or similar assets or liabilities in markets that are not considered to be active, inputs other than quoted prices that are observable for the asset or liability (such as interest rates, yield curves, volatilities, prepayment speeds, loss severities, credit risks and default rates) or other market-corroborated inputs; and |
| • | Level 3 – Unobservable inputs based on the best information available in the circumstances, to the extent observable inputs are not available, (including the Global Valuation Committee’s assumptions used in determining the fair value of financial instruments). |
The hierarchy gives the highest priority to unadjusted quoted prices in active markets for identical assets or liabilities (Level 1 measurements) and the lowest priority to unobservable inputs (Level 3 measurements). Accordingly, the degree of judgement exercised in determining fair value is greatest for instruments categorized in Level 3. The inputs used to measure fair value may fall into different levels of the fair value hierarchy. In such cases, for disclosure purposes, the fair value hierarchy classification is determined based on the lowest level input that is significant to the fair value measurement in its entirety. The fair value hierarchy for each Fund’s investments is included in its schedule of investments.
Changes in valuation techniques may result in transfers into or out of an assigned level within the hierarchy. In accordance with the Company’s policy, transfers between different levels of the fair value hierarchy are deemed to have occurred as of the beginning of the reporting period. The categorization of a value determined for financial instruments is based on the pricing transparency of the financial instruments and is not necessarily an indication of the risks associated with investing in those securities.
N O T E S T O F I N A N C I A L S T A T E M E N T S | 69 |
Notes to Financial Statements (continued)
| 4. | SECURITIES AND OTHER INVESTMENTS |
Securities Lending: Each Fund may lend its securities to approved borrowers, such as brokers, dealers and other financial institutions. The borrower pledges and maintains with the Fund collateral consisting of cash, an irrevocable letter of credit issued by an approved bank, or securities issued or guaranteed by the U.S. government. The initial collateral received by each Fund is required to have a value of at least 102% of the current market value of the loaned securities for securities traded on U.S. exchanges and a value of at least 105% for all other securities. The collateral is maintained thereafter at a value equal to at least 100% of the current value of the securities on loan. The market value of the loaned securities is determined at the close of each business day of the Fund and any additional required collateral is delivered to the Fund or excess collateral is returned by the Fund, on the next business day. During the term of the loan, each Fund is entitled to all distributions made on or in respect of the loaned securities but does not receive interest income on securities received as collateral. Loans of securities are terminable at any time and the borrower, after notice, is required to return borrowed securities within the standard time period for settlement of securities transactions.
As of October 31, 2018, any securities on loan were collateralized by cash and/or U.S. government obligations. Cash collateral received was invested in money market funds managed by BlackRock Fund Advisors (“BFA”), the Funds’ investment adviser, or its affiliates and is disclosed in the schedules of investments. Any non-cash collateral received cannot be sold, re-invested or pledged by the Fund, except in the event of borrower default. The securities on loan for each Fund, if any, are also disclosed in its schedule of investments. The market value of any securities on loan as of October 31, 2018 and the value of the related cash collateral are disclosed in the statements of assets and liabilities.
Securities lending transactions are entered into by a fund under Master Securities Lending Agreements (each, an “MSLA”) which provide the right, in the event of default (including bankruptcy or insolvency) for the non-defaulting party to liquidate the collateral and calculate a net exposure to the defaulting party or request additional collateral. In the event that a borrower defaults, the fund, as lender, would offset the market value of the collateral received against the market value of the securities loaned. The value of the collateral is typically greater than the market value of the securities loaned, leaving the lender with a net amount payable to the defaulting party. However, bankruptcy or insolvency laws of a particular jurisdiction may impose restrictions on or prohibitions against such a right of offset in the event of an MSLA counterparty’s bankruptcy or insolvency. Under the MSLA, absent an event of default, the borrower can resell or re-pledge the loaned securities, and the fund can reinvest cash collateral received in connection with loaned securities.
The following table is a summary of the securities lending agreements by counterparty which are subject to offset under an MSLA as of October 31, 2018:
| iShares ETF and Counterparty | | Market Value of Securities on Loan | | | Cash Collateral Received | (a) | | Non-Cash Collateral Received | | Net Amount | ||||||
J.P. Morgan EM Corporate Bond | ||||||||||||||||
Barclays Bank PLC | $ | 192,000 | $ | 192,000 | $ | — | $ | — | ||||||||
Barclays Capital Inc. | 210,000 | 210,000 | — | — | ||||||||||||
Citigroup Global Markets Inc. | 98,875 | 98,875 | — | — | ||||||||||||
HSBC Securities (USA) Inc. | 203,750 | 203,750 | — | — | ||||||||||||
Jefferies LLC | 1,957,566 | 1,957,566 | — | — | ||||||||||||
JPMorgan Securities LLC | 148,711 | 148,711 | — | — | ||||||||||||
Morgan Stanley & Co. LLC | 1,282,906 | 1,282,906 | — | — | ||||||||||||
Nomura Securities International Inc. | 204,792 | 204,792 | — | — | ||||||||||||
Wells Fargo Securities LLC | 135,498 | 135,498 | — | — | ||||||||||||
|
|
|
|
|
|
|
| |||||||||
| $ | 4,434,098 | $ | 4,434,098 | $ | — | $ | — | |||||||||
|
|
|
|
|
|
|
| |||||||||
US & Intl High Yield Corp Bond | ||||||||||||||||
Barclays Bank PLC | $ | 2,280,407 | $ | 2,280,407 | $ | — | $ | — | ||||||||
Barclays Capital Inc. | 6,147,134 | 6,147,134 | — | — | ||||||||||||
BNP Paribas New York Branch | 299,773 | 299,773 | — | — | ||||||||||||
BNP Paribas Prime Brokerage International Ltd. | 545,663 | 545,663 | — | — | ||||||||||||
Citigroup Global Markets Inc. | 3,096,972 | 3,096,972 | — | — | ||||||||||||
Credit Suisse Securities (USA) LLC | 560,792 | 560,792 | — | — | ||||||||||||
Deutsche Bank Securities Inc. | 865,307 | 865,307 | — | — | ||||||||||||
Goldman Sachs &Co. | 12,031,862 | 12,031,862 | — | — | ||||||||||||
HSBC Securities (USA) Inc. | 162,900 | 162,900 | — | — | ||||||||||||
Jefferies LLC | 214,025 | 214,025 | — | — | ||||||||||||
JPMorgan Securities LLC | 5,224,854 | 5,224,854 | — | — | ||||||||||||
Merrill Lynch, Pierce, Fenner & Smith | 485,900 | 485,900 | — | — | ||||||||||||
Morgan Stanley & Co. LLC | 3,892,954 | 3,892,954 | — | — | ||||||||||||
Nomura Securities International Inc. | 700,710 | 700,710 | — | — | ||||||||||||
|
|
|
|
|
|
|
| |||||||||
| $ | 36,509,253 | $ | 36,509,253 | $ | — | $ | — | |||||||||
|
|
|
|
|
|
|
|
| (a) | Collateral received in excess of the market value of securities on loan is not presented in this table. The total cash collateral received by each Fund is disclosed in the Fund’s statement of assets and liabilities. |
The risks of securities lending include the risk that the borrower may not provide additional collateral when required or may not return the securities when due. To mitigate these risks, each Fund benefits from a borrower default indemnity provided by BlackRock, Inc. (“BlackRock”). BlackRock’s indemnity allows for full replacement of the securities loaned if the collateral received does not cover the value of the securities loaned in the event of borrower default. Each Fund could incur a loss if the value of an
| 70 | 2 0 1 8 I S H A R E S A N N U A L R E P O R T T O S H A R E H O L D E R S |
Notes to Financial Statements (continued)
investment purchased with cash collateral falls below the market value of the loaned securities or if the value of an investment purchased with cash collateral falls below the value of the original cash collateral received. Such losses are borne entirely by each Fund.
| 5. | INVESTMENT ADVISORY AGREEMENT AND OTHER TRANSACTIONS WITH AFFILIATES |
Investment Advisory Fees: Pursuant to an Investment Advisory Agreement with the Company, BFA manages the investment of each Fund’s assets. BFA is a California corporation indirectly owned by BlackRock. Under the Investment Advisory Agreement, BFA is responsible for substantially all expenses of the Funds, except (i) interest and taxes; (ii) brokerage commissions and other expenses connected with the execution of portfolio transactions; (iii) distribution fees; (iv) the advisory fee payable to BFA; and (v) litigation expenses and any extraordinary expenses (in each case as determined by a majority of the independent directors).
For its investment advisory services to each Fund, BFA is entitled to an annual investment advisory fee, accrued daily and paid monthly by the Funds, based on the average daily net assets of each Fund as follows:
| iShares ETF | Investment Advisory Fee | |||
Emerging Markets High Yield Bond | 0.50 | % | ||
International High Yield Bond | 0.40 | |||
J.P. Morgan EM Corporate Bond | 0.50 | |||
J.P. Morgan EM Local Currency Bond | 0.30 | |||
US & Intl High Yield Corp Bond | 0.40 | |||
Prior to June 26, 2018, for its investment advisory services to the iShares J.P. Morgan EM Local Currency Bond ETF, BFA was entitled to an annual investment advisory fee of 0.50%, accrued daily and paid monthly by the Fund, based on the average daily net assets of the Fund.
Expense Waivers: The total of the investment advisory fee and any other fund expenses are a fund’s total annual operating expenses. Effective June 1, 2018, BFA contractually agreed to waive a portion of its investment advisory fee for the iShares J.P. Morgan EM Local Currency Bond ETF through May 30, 2023 such that the Fund’s total annual operating expenses after fee waiver will not exceed 0.30% of average daily net assets. The contractual waiver for the Fund was terminated effective June 26, 2018, pursuant to a written agreement between the Company and BFA and in conjunction with the permanent annual advisory fee reduction for the Fund from 0.50% to 0.30%.
Sub-Adviser: BFA has entered into a sub-advisory agreement with BlackRock International Limited (the “Sub-Adviser”), an affiliate of BFA, under which BFA pays the Sub-Adviser for services it provides to the iShares J.P. Morgan EM Local Currency Bond ETF, iShares International High Yield Bond ETF and iShares US & Intl High Yield Corp Bond ETF.
Distributor: BlackRock Investments, LLC, an affiliate of BFA, is the distributor for each Fund. Pursuant to the distribution agreement, BFA is responsible for any fees or expenses for distribution services provided to the Funds.
Securities Lending: The U.S. Securities and Exchange Commission (the “SEC”) has issued an exemptive order which permits BlackRock Institutional Trust Company, N.A. (“BTC”), an affiliate of BFA, to serve as securities lending agent for the Funds, subject to applicable conditions. As securities lending agent, BTC bears all operational costs directly related to securities lending. Each Fund is responsible for fees in connection with the investment of cash collateral received for securities on loan in a money market fund managed by BFA, or its affiliates, however, BTC has agreed to reduce the amount of securities lending income it receives in order to effectively limit the collateral investment fees each Fund bears to an annual rate of 0.04% (the “collateral investment fees”). Securities lending income is equal to the total of income earned from the reinvestment of cash collateral (excluding collateral investment fees), net of fees and other payments to and from borrowers of securities. Each Fund retains a portion of securities lending income and remits the remaining portion to BTC as compensation for its services as securities lending agent.
Pursuant to a securities lending agreement, each Fund retains 80% of securities lending income (which excludes collateral investment fees) and the amount retained can never be less than 70% of the total of securities lending income plus the collateral investment fees.
In addition, commencing the business day following the date that the aggregate securities lending income plus the collateral investment fees generated across all 1940 Act iShares exchange-traded funds (the “iShares ETF Complex”) in a given calendar year exceeds the aggregate securities lending income generated across the iShares ETF Complex in the calendar year 2013, each Fund, pursuant to a securities lending agreement, will retain for the remainder of that calendar year 85% of securities lending income and the amount retained can never be less than 70% of the total of securities lending income plus the collateral investment fees.
The share of securities lending income earned by each Fund is shown as securities lending income – affiliated – net in its statement of operations. For the year ended October 31, 2018, the Funds paid BTC the following amounts for securities lending agent services:
| iShares ETF | Fees Paid to BTC | |||
J.P. Morgan EM Corporate Bond | $ | 8,905 | ||
US & Intl High Yield Corp Bond | 68,038 | |||
Officers and Directors: Certain officers and/or directors of the Company are officers and/or directors of BlackRock or its affiliates.
Other Transactions: The PNC Financial Services Group, Inc. is the largest stockholder and an affiliate of BlackRock for 1940 Act purposes.
N O T E S T O F I N A N C I A L S T A T E M E N T S | 71 |
Notes to Financial Statements (continued)
Cross trading is the buying or selling of portfolio securities between funds to which BFA (or an affiliate) serves as investment adviser. At its regularly scheduled quarterly meetings, the Board reviews such transactions as of the most recent calendar quarter for compliance with the requirements and restrictions set forth by Rule 17a-7.
For the year ended October 31, 2018, transactions executed by the Funds pursuant to Rule 17a-7 under the 1940 Act were as follows:
| iShares ETF | Purchases | Sales | ||||||
Emerging Markets High Yield Bond | $ | 1,862,303 | $ | 1,568,556 | ||||
International High Yield Bond | 1,632,729 | 2,085,904 | ||||||
US & Intl High Yield Corp Bond | 625,262 | 2,367,345 | ||||||
During the year ended October 31, 2018, iShares Emerging Markets High Yield Bond ETF received a reimbursement of $34,341 from an affiliate, which is included in payment by affiliate in the statement of operations, relating to an operating event.
Each Fund may invest its positive cash balances in certain money market funds managed by BFA or an affiliate. The income earned on these temporary cash investments is shown as dividends – affiliated in the statement of operations.
A fund, in order to improve its portfolio liquidity and its ability to track its underlying index, may invest in shares of other iShares funds that invest in securities in the fund’s underlying index.
| 6. | PURCHASES AND SALES |
For the year ended October 31, 2018, purchases and sales of investments, including TBA rolls and excluding in-kind transactions and short-term investments, were as follows:
| iShares ETF | Purchases | Sales | ||||||
Emerging Markets High Yield Bond | $ | 158,564,187 | $ | 101,070,497 | ||||
International High Yield Bond | 33,755,205 | 28,598,396 | ||||||
J.P. Morgan EM Corporate Bond | 14,940,345 | 13,167,990 | ||||||
J.P. Morgan EM Local Currency Bond | 361,152,719 | 188,637,841 | ||||||
US & Intl High Yield Corp Bond | 49,804,047 | 43,324,450 | ||||||
For the year ended October 31, 2018, in-kind transactions were as follows:
| iShares ETF | In-kind Purchases | In-kind Sales | ||||||
Emerging Markets High Yield Bond | $ | 77,818,492 | $ | 287,128,760 | ||||
International High Yield Bond | 14,510,376 | 34,239,460 | ||||||
J.P. Morgan EM Corporate Bond | 4,925,840 | 13,901,837 | ||||||
J.P. Morgan EM Local Currency Bond | 27,991,319 | 24,465,479 | ||||||
US & Intl High Yield Corp Bond | 30,247,720 | 27,547,670 | ||||||
| 7. | INCOME TAX INFORMATION |
Each Fund is treated as an entity separate from the Company’s other funds for federal income tax purposes. It is the policy of each Fund to qualify as a regulated investment company by complying with the provisions applicable to regulated investment companies, as defined under Subchapter M of the Internal Revenue Code of 1986, as amended, and to annually distribute substantially all of its ordinary income and any net capital gains (taking into account any capital loss carryforwards) sufficient to relieve it from all, or substantially all, federal income and excise taxes. Accordingly, no provision for federal income taxes is required.
Management has analyzed tax laws and regulations and their application to the Funds as of October 31, 2018, inclusive of the open tax return years, and does not believe that there are any uncertain tax positions that require recognition of a tax liability in the Funds’ financial statements.
U.S. GAAP requires that certain components of net assets be adjusted to reflect permanent differences between financial and tax reporting. These reclassifications have no effect on net assets or NAV per share. As of October 31, 2018, the following permanent differences attributable to undistributed capital gains and realized gains (losses) from in-kind redemptions were reclassified to the following accounts:
| iShares ETF | Paid-in Capital | Accumulated Loss | ||||||
Emerging Markets High Yield Bond | $ | (7,686,403 | ) | $ | 7,686,403 | |||
International High Yield Bond | (660,020 | ) | 660,020 | |||||
J.P. Morgan EM Corporate Bond | (720,203 | ) | 720,203 | |||||
J.P. Morgan EM Local Currency Bond | (447,168 | ) | 447,168 | |||||
US & Intl High Yield Corp Bond | 521,779 | (521,779) | ||||||
| 72 | 2 0 1 8 I S H A R E S A N N U A L R E P O R T T O S H A R E H O L D E R S |
Notes to Financial Statements (continued)
The tax character of distributions paid was as follows:
| iShares ETF | Year Ended 10/31/18 | Year Ended 10/31/17 | ||||||
Emerging Markets High Yield Bond | ||||||||
Ordinary income | $ | 27,754,319 | $ | 16,158,680 | ||||
|
|
|
| |||||
International High Yield Bond | ||||||||
Ordinary income | $ | — | $ | 622,289 | ||||
Return of capital | — | 142,861 | ||||||
|
|
|
| |||||
| $ | — | $ | 765,150 | |||||
|
|
|
| |||||
J.P. Morgan EM Corporate Bond | ||||||||
Ordinary income | $ | 3,577,391 | $ | 2,731,913 | ||||
|
|
|
| |||||
J.P. Morgan EM Local Currency Bond | ||||||||
Ordinary income | $ | — | $ | — | ||||
|
|
|
| |||||
US & Intl High Yield Corp Bond | ||||||||
Ordinary income | $ | 11,429,826 | $ | 7,410,092 | ||||
|
|
|
| |||||
As of October 31, 2018, the tax components of accumulated net earnings (losses) were as follows:
| iShares ETF | | Undistributed Ordinary Income | | | Capital Loss Carryforwards | | | Net Unrealized Gains (Losses) | (a) | Total | ||||||
Emerging Markets High Yield Bond | $ | 5,073,329 | $ | (24,416,137 | ) | $ | (45,307,989 | ) | $ | (64,650,797 | ) | |||||
International High Yield Bond | 1,938,517 | (3,667,432 | ) | (6,006,388 | ) | (7,735,303 | ) | |||||||||
J.P. Morgan EM Corporate Bond | 321,651 | (327,184 | ) | (3,976,552 | ) | (3,982,085 | ) | |||||||||
J.P. Morgan EM Local Currency Bond | 12,577,739 | (11,278,388 | ) | (60,029,097 | ) | (58,729,746 | ) | |||||||||
US & Intl High Yield Corp Bond | 1,815,708 | (3,076,912 | ) | (9,005,028 | ) | (10,266,232 | ) |
| (a) | The difference between book-basis and tax-basis unrealized gains (losses) was attributable primarily to the tax deferral of losses on wash sales and the accrual of income on securities in default. |
As of October 31, 2018, the Funds had capital loss carryforwards, with no expiration dates, available to offset future realized capital gains as follows:
| iShares ETF | Non-Expiring | |||
Emerging Markets High Yield Bond | $ | 24,416,137 | ||
International High Yield Bond | 3,667,432 | |||
J.P. Morgan EM Corporate Bond | 327,184 | |||
J.P. Morgan EM Local Currency Bond | 11,278,388 | |||
US & Intl High Yield Corp Bond | 3,076,912 | |||
For the year ended October 31, 2018, the Funds utilized the following amounts of their capital loss carryforwards as follows:
| iShares ETF | Utilized | |||
International High Yield Bond | $ | 27,057 | ||
US & Intl High Yield Corp Bond | 73,135 | |||
As of October 31, 2018, gross unrealized appreciation and depreciation based on cost of investments (including short positions and derivatives, if any) for U.S. federal income tax purposes were as follows:
| iShares ETF | Tax Cost | Gross Unrealized Appreciation | Gross Unrealized Depreciation | Net Unrealized Appreciation (Depreciation) | ||||||||||||
Emerging Markets High Yield Bond | $ | 436,568,976 | $ | 417,826 | $ | (43,204,321 | ) | $ | (42,786,495 | ) | ||||||
International High Yield Bond | 70,249,259 | 269,140 | (6,221,870 | ) | (5,952,730 | ) | ||||||||||
J.P. Morgan EM Corporate Bond | 79,788,214 | 283,742 | (4,260,294 | ) | (3,976,552 | ) | ||||||||||
J.P. Morgan EM Local Currency Bond | 476,064,370 | 2,068,591 | (61,969,919 | ) | (59,901,328 | ) | ||||||||||
US & Intl High Yield Corp Bond | 256,275,060 | 1,560,714 | (10,527,543 | ) | (8,966,829 | ) | ||||||||||
N O T E S T O F I N A N C I A L S T A T E M E N T S | 73 |
Notes to Financial Statements (continued)
| 8. | PRINCIPAL RISKS |
In the normal course of business, each Fund invests in securities or other instruments and may enter into certain transactions, and such activities subject the Fund to various risks, including, among others, fluctuations in the market (market risk) or failure of an issuer to meet all of its obligations. The value of securities or other instruments may also be affected by various factors, including, without limitation: (i) the general economy; (ii) the overall market as well as local, regional or global political and/or social instability; (iii) regulation, taxation or international tax treaties between various countries; or (iv) currency, interest rate or price fluctuations. Each Fund’s prospectus provides details of the risks to which the Fund is subject.
BFA uses a “passive” or index approach to try to achieve each Fund’s investment objective following the securities included in its underlying index during upturns as well as downturns. BFA does not take steps to reduce market exposure or to lessen the effects of a declining market. Divergence from the underlying index and the composition of the portfolio is monitored by BFA.
Market Risk: Market risk arises mainly from uncertainty about future values of financial instruments influenced by price, currency and interest rate movements. It represents the potential loss a fund may suffer through holding market positions in the face of market movements. A fund is exposed to market risk by its investment in equity, fixed income and/or financial derivative instruments or by its investment in underlying funds. The fair value of securities held by a fund may decline due to general market conditions, economic trends or events that are not specifically related to the issuers of the securities including local, regional or global political, social or economic instability or to factors that affect a particular industry or group of industries. The extent of a fund’s exposure to market risk is the market value of the investments held as shown in the fund’s schedule of investments.
Investing in the securities of non-U.S. issuers involves certain considerations and risks not typically associated with securities of U.S. issuers. Such risks include, but are not limited to: differences in accounting, auditing and financial reporting standards; more substantial governmental involvement in the economy; higher inflation rates, greater social, economic and political uncertainties; possible nationalization or expropriation of assets; less availability of public information about issuers; imposition of withholding or other taxes; higher transaction and custody costs and delays in settlement procedures; and lower level of regulation of the securities markets and issuers. Non-U.S. securities may be less liquid, more difficult to value, and have greater price volatility due to exchange rate fluctuations. These and other risks are heightened for investments in issuers from countries with less developed capital markets.
Changes in market interest rates or economic conditions may affect the value and/or liquidity of fixed income investments. Interest rate risk is the risk that prices of bonds and other fixed-income securities will decrease as interest rates rise and increase as interest rates fall. Securities with longer durations tend to be more sensitive to interest rate changes, usually making their price more volatile than those of securities with shorter durations. Given the environment of historically low interest rates, a fund may be subject to a greater risk of price losses if interest rates rise.
Credit Risk: Credit risk is the risk that an issuer or guarantor of debt instruments or the counterparty to a financial transaction, including derivatives contracts, repurchase agreements or loans of portfolio securities, is unable or unwilling to make timely interest and/or principal payments or to otherwise honor its obligations. BFA and its affiliates manage counterparty credit risk by entering into transactions only with counterparties that they believe have the financial resources to honor their obligations and by monitoring the financial stability of those counterparties. Financial assets, which potentially expose a fund to issuer and counterparty credit risks, consist principally of financial instruments and receivables due from counterparties. The extent of a fund’s exposure to credit and counterparty risks with respect to those financial assets is approximated by their value recorded in its statement of assets and liabilities.
High yield securities that are rated below investment-grade (commonly referred to as “junk bonds”) or are unrated may be deemed speculative, involve greater levels of risk than higher-rated securities of similar maturity and are more likely to default. High yield securities may be issued by less creditworthy issuers, and issuers of high yield securities may be unable to meet their interest or principal payment obligations. High yield securities are subject to extreme price fluctuations, may be less liquid than higher rated fixed-income securities, even under normal economic conditions, and frequently have redemption features.
Concentration Risk: A diversified portfolio, where this is appropriate and consistent with a fund’s objectives, minimizes the risk that a price change of a particular investment will have a material impact on the NAV of a fund. The investment concentrations within each Fund’s portfolio are disclosed in its schedule of investments.
| 9. | CAPITAL SHARE TRANSACTIONS |
Capital shares are issued and redeemed by each Fund only in aggregations of a specified number of shares or multiples thereof (“Creation Units”) at NAV. Except when aggregated in Creation Units, shares of each Fund are not redeemable.
Transactions in capital shares were as follows:
Year Ended 10/31/18 | Year Ended 10/31/17 | |||||||||||||||||||
| iShares ETF | Shares | Amount | Shares | Amount | ||||||||||||||||
Emerging Markets High Yield Bond | ||||||||||||||||||||
Shares sold | 2,900,000 | $ | 140,178,128 | 10,750,000 | $ | 537,703,198 | ||||||||||||||
Shares redeemed | (6,450,000 | ) | (304,349,559 | ) | (550,000 | ) | (26,679,639 | ) | ||||||||||||
|
|
|
|
|
|
|
| |||||||||||||
Net increase (decrease) | (3,550,000 | ) | $ | (164,171,431 | ) | 10,200,000 | $ | 511,023,559 | ||||||||||||
|
|
|
|
|
|
|
| |||||||||||||
| 74 | 2 0 1 8 I S H A R E S A N N U A L R E P O R T T O S H A R E H O L D E R S |
Notes to Financial Statements (continued)
Year Ended 10/31/18 | Year Ended 10/31/17 | |||||||||||||||||||
| iShares ETF | Shares | Amount | Shares | Amount | ||||||||||||||||
International High Yield Bond | ||||||||||||||||||||
Shares sold | 300,000 | $ | 16,483,746 | 400,000 | $ | 21,160,679 | ||||||||||||||
Shares redeemed | (700,000 | ) | (36,068,137 | ) | (2,000,000 | ) | (91,525,582 | ) | ||||||||||||
|
|
|
|
|
|
|
| |||||||||||||
Net decrease | (400,000 | ) | $ | (19,584,391 | ) | (1,600,000 | ) | $ | (70,364,903 | ) | ||||||||||
|
|
|
|
|
|
|
| |||||||||||||
J.P. Morgan EM Corporate Bond | ||||||||||||||||||||
Shares sold | 100,000 | $ | 5,051,273 | 1,100,000 | $ | 54,867,601 | ||||||||||||||
Shares redeemed | (300,000 | ) | (14,438,785 | ) | (50,000 | ) | (2,493,366 | ) | ||||||||||||
|
|
|
|
|
|
|
| |||||||||||||
Net increase (decrease) | (200,000 | ) | $ | (9,387,512 | ) | 1,050,000 | $ | 52,374,235 | ||||||||||||
|
|
|
|
|
|
|
| |||||||||||||
J.P. Morgan EM Local Currency Bond | ||||||||||||||||||||
Shares sold | 4,400,000 | $ | 206,994,308 | 1,800,000 | $ | 84,085,442 | ||||||||||||||
Shares redeemed | (1,200,000 | ) | (54,208,918 | ) | (5,200,000 | ) | (229,939,836 | ) | ||||||||||||
|
|
|
|
|
|
|
| |||||||||||||
Net increase (decrease) | 3,200,000 | $ | 152,785,390 | (3,400,000 | ) | $ | (145,854,394 | ) | ||||||||||||
|
|
|
|
|
|
|
| |||||||||||||
US & Intl High Yield Corp Bond | ||||||||||||||||||||
Shares sold | 800,000 | $ | 40,180,000 | 2,600,000 | $ | 127,668,202 | ||||||||||||||
Shares redeemed | (600,000 | ) | (29,784,598 | ) | (400,000 | ) | (19,650,421 | ) | ||||||||||||
|
|
|
|
|
|
|
| |||||||||||||
Net increase | 200,000 | $ | 10,395,402 | 2,200,000 | $ | 108,017,781 | ||||||||||||||
|
|
|
|
|
|
|
| |||||||||||||
The consideration for the purchase of Creation Units of a fund in the Company generally consists of the in-kind deposit of a designated portfolio of securities and a specified amount of cash. Certain funds in the Company may be offered in Creation Units solely or partially for cash in U.S. dollars. Investors purchasing and redeeming Creation Units may pay a purchase transaction fee and a redemption transaction fee directly to State Street Bank and Trust Company, the Company’s administrator, to offset transfer and other transaction costs associated with the issuance and redemption of Creation Units, including Creation Units for cash. Investors transacting in Creation Units for cash may also pay an additional variable charge to compensate the relevant fund for certain transaction costs (i.e., stamp taxes, taxes on currency or other financial transactions, and brokerage costs) and market impact expenses relating to investing in portfolio securities. Such variable charges, if any, are included in shares sold in the table above.
From time to time, settlement of securities related to in-kind contributions or in-kind redemptions may be delayed. In such cases, securities related to in-kind transactions are reflected as a receivable or a payable in the statement of assets and liabilities.
| 10. | LEGAL PROCEEDINGS |
On June 16, 2016, investors in certain iShares funds (iShares Core S&P Small-Cap ETF, iShares Russell 1000 Growth ETF, iShares Core S&P 500 ETF, iShares Russell Mid-Cap Growth ETF, iShares Russell Mid-Cap ETF, iShares Russell Mid-Cap Value ETF, iShares Select Dividend ETF, iShares Morningstar Mid-Cap ETF, iShares Morningstar Large-Cap ETF, iShares U.S. Aerospace & Defense ETF and iShares U.S. Preferred Stock ETF) filed a class action lawsuit against iShares Trust, BlackRock, Inc. and certain of its advisory affiliates, and certain directors/trustees and officers of the Funds (collectively, “Defendants”) in California State Court. The lawsuit alleges the Defendants violated federal securities laws by failing to adequately disclose in the prospectuses issued by the funds noted above the risks of using stop-loss orders in the event of a ‘flash crash’, such as the one that occurred on May 6, 2010. On September 18, 2017, the court issued a Statement of Decision holding that the Plaintiffs lack standing to assert their claims. On October 11, 2017, the court entered final judgment dismissing all of the Plaintiffs’ claims with prejudice. Plaintiffs have appealed the court’s decision.
| 11. | REGULATION S-X AMENDMENTS |
On August 17, 2018, the SEC adopted amendments to certain disclosure requirements in Securities Act Release No. 33-10532, Disclosure Update and Simplification. The Funds have adopted the amendments pertinent to Regulation S-X in this shareholder report. The amendments impacted certain disclosure presentation on the statement of assets and liabilities, statement of changes in net assets and notes to the financial statements.
Prior year distribution information and undistributed (distributions in excess of) net investment income in the statement of changes in net assets has been modified to conform to the current year presentation in accordance with the Regulation S-X changes.
Distributions for the year ended October 31, 2017 were classified as follows:
| iShares ETF | Net Investment Income | Return of capital | ||||||
Emerging Markets High Yield Bond | $ | 16,158,680 | $ | — | ||||
International High Yield Bond | 622,289 | 142,861 | ||||||
J.P. Morgan EM Corporate Bond | 2,731,913 | — | ||||||
US & Intl High Yield Corp Bond | 7,410,092 | — | ||||||
N O T E S T O F I N A N C I A L S T A T E M E N T S | 75 |
Notes to Financial Statements (continued)
Undistributed (distributions in excess of) net investment income as of October 31, 2017 are as follows:
| iShares ETF | Undistributed (distributions in excess of) net investment income | |||
Emerging Markets High Yield Bond | $ | 1,549,867 | ||
International High Yield Bond | — | |||
J.P. Morgan EM Corporate Bond | 238,159 | |||
J.P. Morgan EM Local Currency Bond | (1,874) | |||
US & Intl High Yield Corp Bond | 1,939,840 | |||
| 12. | SUBSEQUENT EVENTS |
Management has evaluated the impact of all subsequent events on the Funds through the date the financial statements were available to be issued and has determined that there were no subsequent events requiring adjustment or additional disclosure in the financial statements.
| 76 | 2 0 1 8 I S H A R E S A N N U A L R E P O R T T O S H A R E H O L D E R S |
Report of Independent Registered Public Accounting Firm
To the Board of Directors of iShares, Inc. and
Shareholders of iShares Emerging Markets High Yield Bond ETF,
iShares International High Yield Bond ETF, iShares J.P. Morgan EM Corporate Bond ETF,
iShares J.P. Morgan EM Local Currency Bond ETF and iShares US & Intl High Yield Corp Bond ETF
Opinions on the Financial Statements
We have audited the accompanying statements of assets and liabilities, including the schedules of investments, of iShares Emerging Markets High Yield Bond ETF, iShares International High Yield Bond ETF, iShares J.P. Morgan EM Corporate Bond ETF, iShares J.P. Morgan EM Local Currency Bond ETF and iShares US & Intl High Yield Corp Bond ETF (five of the funds constituting iShares, Inc., hereafter collectively referred to as the “Funds”) as of October 31, 2018, the related statements of operations for the year ended October 31, 2018, the statements of changes in net assets for each of the two years in the period ended October 31, 2018, including the related notes, and the financial highlights for each of the five years in the period ended October 31, 2018 (collectively referred to as the “financial statements”). In our opinion, the financial statements present fairly, in all material respects, the financial position of each of the Funds as of October 31, 2018, the results of each of their operations for the year then ended, the changes in each of their net assets for each of the two years in the period ended October 31, 2018 and each of the financial highlights for each of the five years in the period ended October 31, 2018 in conformity with accounting principles generally accepted in the United States of America.
Basis for Opinions
These financial statements are the responsibility of the Funds’ management. Our responsibility is to express an opinion on the Funds’ financial statements based on our audits. We are a public accounting firm registered with the Public Company Accounting Oversight Board (United States) (“PCAOB”) and are required to be independent with respect to the Funds in accordance with the U.S. federal securities laws and the applicable rules and regulations of the Securities and Exchange Commission and the PCAOB.
We conducted our audits of these financial statements in accordance with the standards of the PCAOB. Those standards require that we plan and perform the audit to obtain reasonable assurance about whether the financial statements are free of material misstatement, whether due to error or fraud.
Our audits included performing procedures to assess the risks of material misstatement of the financial statements, whether due to error or fraud, and performing procedures that respond to those risks. Such procedures included examining, on a test basis, evidence regarding the amounts and disclosures in the financial statements. Our audits also included evaluating the accounting principles used and significant estimates made by management, as well as evaluating the overall presentation of the financial statements. Our procedures included confirmation of securities owned as of October 31, 2018 by correspondence with the custodian, transfer agent and brokers; when replies were not received from brokers, we performed other auditing procedures. We believe that our audits provide a reasonable basis for our opinions.
PricewaterhouseCoopers LLP
San Francisco, California
December 21, 2018
We have served as the auditor of one or more BlackRock investment companies since 2000.
R E P O R T O F I N D E P E N D E N T R E G I S T E R E D P U B L I C A C C O U N T I N G F I R M | 77 |
Important Tax Information (unaudited)
For the fiscal year ended October 31, 2018, the Funds earned foreign source income and paid foreign taxes which they intend to pass through to their shareholders:
| iShares ETF | Foreign Source Income Earned | Foreign Taxes Paid | ||||||
Emerging Markets High Yield Bond | $ | 31,077,235 | $ | 1,487 | ||||
International High Yield Bond | 2,840,823 | — | ||||||
J.P. Morgan EM Corporate Bond | 3,940,160 | — | ||||||
J.P. Morgan EM Local Currency Bond | 25,374,643 | 443,629 | ||||||
For the fiscal year ended October 31, 2018, the Funds hereby designate the following maximum amounts allowable as interest-related dividends eligible for exemption from U.S. withholding tax for nonresident aliens and foreign corporations:
| iShares ETF | Interest-Related Dividends | |||
US & Intl High Yield Corp Bond | $ | 5,642,296 | ||
The Funds hereby designate the following amounts of distributions from direct federal obligation interest for the fiscal year ended October 31, 2018:
| iShares ETF | Federal Obligation Interest | |||
Emerging Markets High Yield Bond | $ | 31,928 | ||
International High Yield Bond | 151 | |||
J.P. Morgan EM Corporate Bond | 8,329 | |||
J.P. Morgan EM Local Currency Bond | 7,358 | |||
US & Intl High Yield Corp Bond | 12,782 | |||
The law varies in each state as to whether and what percent of ordinary income dividends attribute to federal obligations is exempt from state income tax. Shareholders are advised to check with their tax advisers to determine if any portion of the dividends received is exempt from state income tax.
| 78 | 2 0 1 8 I S H A R E S A N N U A L R E P O R T T O S H A R E H O L D E R S |
Board Review and Approval of Investment Advisory Contract
I. iShares Emerging Markets High Yield Bond ETF and iShares J.P. Morgan EM Corporate Bond ETF
Under Section 15(c) of the Investment Company Act of 1940 (the “1940 Act”), the Company’s Board of Directors (the “Board”), including a majority of Directors who are not “interested persons” of the Company (as that term is defined in the 1940 Act) (the “Independent Directors”), is required annually to consider and approve the Investment Advisory Contract between the Company and BFA (the “Advisory Contract”) on behalf of the Funds. The Independent Directors requested, and BFA provided, such information as the Independent Directors, with advice from independent counsel, deemed reasonably necessary to evaluate the Advisory Contract. At a meeting on May 11, 2018, a committee composed of all of the Independent Directors (the “15(c) Committee”), with independent counsel, met with management and reviewed and discussed information provided in response to initial requests of the 15(c) Committee and/or their independent counsel, and requested certain additional information, which management agreed to provide. At these meetings, the 15(c) Committee reviewed and discussed information provided in response to the 15(c) Committee’s initial requests, and requested certain additional information, which management agreed to provide. At a meeting held on May 24, 2018, management presented additional information to the Board relating to the continuance of the Advisory Contract, including information requested by the 15(c) Committee during its initial meeting. The Board, including the Independent Directors, reviewed and discussed such information at length. The Independent Directors requested from management certain additional information, which management agreed to provide. At a meeting held on June 12-14, 2018, the Board, including the Independent Directors, reviewed the additional information provided by management in response to these requests. After extensive discussions, the Board, including all of the Independent Directors, approved the continuance of the Advisory Contract for the Funds, based on a review of qualitative and quantitative information provided by BFA. The Board noted its satisfaction with the extent and quality of information provided and its frequent interactions with management, as well as the detailed responses and other information provided by BFA. The Independent Directors were advised by their independent counsel throughout the process, including about the legal standards applicable to their review. In approving the Advisory Contract for the Funds, the Board, including the Independent Directors, considered various factors, including: (i) the expenses and performance of each Fund; (ii) the nature, extent and quality of the services provided by BFA; (iii) the costs of services provided to each Fund and profits realized by BFA and its affiliates; (iv) economies of scale; (v) the fees and services provided for other comparable funds/accounts managed by BFA and its affiliates; and (vi) other benefits to BFA and/or its affiliates. The material factors, no one of which was controlling, and conclusions that formed the basis for the Board, including the Independent Directors, to approve the Advisory Contract are discussed below.
Expenses and Performance of the Funds: The Board reviewed statistical information prepared by Broadridge Financial Solutions Inc. (“Broadridge”), an independent provider of investment company data, regarding the expense ratio components, including gross and net total expenses, fees and expenses of another fund in which each Fund invests (if applicable), and waivers/reimbursements (if applicable) of each Fund in comparison with the same information for other ETFs (including, where applicable, funds sponsored by an “at cost” service provider), objectively selected by Broadridge as comprising such Fund’s applicable peer group pursuant to Broadridge’s proprietary ETF methodology (the “Peer Group”). The Board was provided with a detailed description of the proprietary ETF methodology used by Broadridge to determine the applicable Peer Groups. The Board further noted that due to the limitations in providing comparable funds in the various Peer Groups, the statistical information provided in Broadridge’s report may or may not provide meaningful direct comparisons to the Funds in all instances.
The Board also noted that the investment advisory fee rates and overall expenses (net of waivers and reimbursements) for the Funds were higher than the median of the investment advisory fee rates and overall expenses (net of waivers and reimbursements) of the funds in their respective Peer Group, excluding iShares funds.
In addition, to the extent that any of the comparison funds included in the Peer Group, excluding iShares funds, track the same index as any particular Fund, Broadridge also provided, and the Board reviewed, a comparison of such Fund’s performance for the one-, three-, five-, ten-year, and since inception periods, as applicable, and for the quarter ended December 31, 2017, to that of relevant comparison fund(s) for the same periods.
The Board noted that each Fund seeks to track its specified underlying index and that, during the year, the Board received periodic reports on each Fund’s short- and longer-term performance in comparison with its underlying index. Such periodic comparative performance information, including additional detailed information as requested by the Board, was also considered. The Board noted that each Fund generally performed in line with its underlying index over the relevant periods.
Based on this review, the other factors considered at the meeting, and their general knowledge of ETF pricing, the Board concluded that the investment advisory fee rate and expense level and the historical performance of each Fund supported the Board’s approval of the continuance of the Advisory Contract for the coming year.
Nature, Extent and Quality of Services Provided by BFA: Based on management’s representations, including information about recent and proposed enhancements to the iShares business, including with respect to capital markets support and analysis, technology, portfolio management, product design and quality, compliance and risk management, global public policy and other services, the Board expected that there would be no diminution in the scope of services required of or provided by BFA under the Advisory Contract for the coming year as compared to the scope of services provided by BFA during prior years. In reviewing the scope of these services, the Board considered BFA’s investment philosophy and experience, noting that BFA and its affiliates have committed significant resources over time, including during the past year, to support the iShares funds and their shareholders. The Board also considered BFA’s compliance program and its compliance record with respect to the Funds. In that regard, the Board noted that BFA reports to the Board about portfolio management and compliance matters on a periodic basis in connection with regularly scheduled meetings of the Board, and on other occasions as necessary and appropriate, and has provided information and made relevant officers and other employees of BFA (and its affiliates) available as needed to provide further assistance with these matters. The Board also reviewed the background and experience of the persons responsible for the day-to-day management of the Funds, as well as the resources available to them in managing the Funds. In addition to the above considerations, the Board reviewed and considered detailed presentations regarding BFA’s investment performance, investment and risk management processes and strategies provided at the June 12-14, 2018 meeting and throughout the year, and matters related to BFA’s portfolio compliance policies and procedures.
Based on review of this information, and the performance information discussed above, the Board concluded that the nature, extent and quality of services provided to the Funds under the Advisory Contract supported the Board’s approval of the continuance of the Advisory Contract for the coming year.
B O A R D R E V I E W A N D A P P R O V A L O F I N V E S T M E N T A D V I S O R Y C O N T R A C T | 79 |
Board Review and Approval of Investment Advisory Contract (continued)
Costs of Services Provided to Fund and Profits Realized by BFA and its Affiliates: The Board reviewed information about the profitability to BlackRock in managing the Funds, based on the fees payable to BFA and its affiliates (including fees under the Advisory Contract), and other sources of revenue and expense to BFA and its affiliates from the Funds’ operations for the last calendar year. The Board reviewed BlackRock’s profitability methodology for the iShares funds, noting that the 15(c) Committee and the Board had focused on the methodology and profitability presentation during their meetings. The Board further noted that it considered the supplemental information the 15(c) Committee requested, which BlackRock provided, regarding the methodology. The Board discussed the sources of direct and ancillary revenue with management, including the revenues to BTC, a BlackRock affiliate, from securities lending by the Funds. The Board also discussed BFA’s profit margin as reflected in the Funds’ profitability analysis and reviewed information regarding potential economies of scale (as discussed below).
Based on this review, the Board concluded that the profits realized by BFA and its affiliates under the Advisory Contract and from other relationships between the Funds and BFA and/or its affiliates, if any, were within a reasonable range in light of the factors and other information considered.
Economies of Scale: The Board reviewed information regarding potential economies of scale or other efficiencies that may result from increases in the Funds’ assets, noting that the issue of economies of scale had been focused on by the 15(c) Committee and the Board during their meetings and addressed by management. The 15(c) Committee and the Board received information regarding BlackRock’s historical profitability, including BFA’s and its affiliates’ costs in providing services. The cost information distinguished, among other things, between fixed and variable costs, and showed how the level of fixed and variable costs, as well as the nature of such costs, may impact the existence or size of scale benefits. The 15(c) Committee and the Board reviewed information provided by BFA regarding the sharing of scale benefits with the iShares funds through various means, including, as applicable, through relatively low fee rates established at inception, breakpoints, waivers, or other fee reductions, as well as through additional investment in the iShares business and the provision of improved or additional infrastructure and services to the iShares funds and their shareholders. The Board noted that the Advisory Contract for the Funds did not provide for breakpoints in the Funds’ investment advisory fee rates as the assets of the Funds increase. However, the Board noted that a breakpoint structure for the Funds may be appropriate should material economies of scale exist in the future that are not otherwise shared, and that it would continue to monitor the sharing of economies of scale to determine the appropriateness of adding breakpoints in the future.
Based on this review of the sharing of scale benefits, as well as the other factors considered at the meeting, the Board concluded that the information concerning the sharing of scale benefits supported the Board’s approval of the continuance of the Advisory Contract for the coming year.
Fees and Services Provided for Other Comparable Funds/Accounts Managed by BFA and its Affiliates: The Board received and considered information regarding the investment advisory/management fee rates for other funds/accounts in the U.S. for which BFA (or its affiliates) provides investment advisory/management services, including open-end funds registered under the 1940 Act (including sub-advised funds), collective trust funds, and institutional separate accounts (collectively, the “Other Accounts”), and acknowledged BFA’s assertion that the iShares funds are fundamentally different investment vehicles from the Other Accounts. The Board noted that BFA and its affiliates do not manage Other Accounts with substantially the same investment objectives and strategies as the Funds and that track the same indexes as the Funds. The Board further noted that BFA provided the Board with detailed information regarding how the Other Accounts generally differ from the Funds, including in terms of the different and generally more extensive services provided to the Funds, as well as other significant differences. In that regard, the Board considered that the pricing of services to institutional clients is typically based on a number of factors beyond the nature and extent of the specific services to be provided and often depends on the overall relationship between the client and its affiliates and the adviser and its affiliates. In addition, the Board considered the relative complexity and inherent risks and challenges of managing and providing other services to the Funds, as publicly traded ETFs, as compared to the Other Accounts, particularly those that are institutional clients, in light of differing regulatory requirements and client-imposed mandates. The Board also acknowledged management’s assertion that, for certain iShares funds, and for client segmentation purposes, BlackRock has launched an iShares fund that may provide a similar investment exposure at a lower investment advisory fee rate. The Board also considered the “all-inclusive” nature of the Funds’ advisory fee structure, and the Funds’ expenses borne by BFA under this arrangement. The Board noted that the investment advisory fee rates under the Advisory Contract for the Funds was generally higher than the investment advisory/management fee rates for certain of the Other Accounts (particularly institutional clients) and concluded that the differences appeared to be consistent with the factors discussed.
Other Benefits to BFA and/or its Affiliates: The Board reviewed the “fallout” benefits or ancillary revenue received by BFA and/or its affiliates in connection with the services provided to the Funds by BFA, such as payment of revenue to BTC, the Funds’ securities lending agent, for loaning portfolio securities (which was included in the profit margins reviewed by the Board pursuant to BFA’s profitability methodology), and payment of advisory fees and/or administration fees to BFA (or its affiliates) in connection with any investments by the Funds in other funds for which BFA (or its affiliates) provides investment advisory services and/or administration services. The Board also noted the revenue received by BFA and/or its affiliates pursuant to an agreement that permits a service provider to use certain portions of BlackRock’s technology platform to service accounts managed by BFA and/or its affiliates, including the iShares funds. The Board noted that BFA generally does not use soft dollars or consider the value of research or other services that may be provided to BFA (including its affiliates) in selecting brokers for portfolio transactions for the Funds. The Board further noted that any portfolio transactions on behalf of the Funds placed through a BFA affiliate or purchased from an underwriting syndicate in which a BFA affiliate participates (including associated commissions) are reported to the Board pursuant to Rule 17e-1 or Rule 10f-3, as applicable, under the 1940 Act. The Board concluded that any such ancillary benefits would not be disadvantageous to the Funds and thus would not alter the Board’s conclusion with respect to the appropriateness of approving the continuance of the Advisory Contract for the coming year.
Conclusion: Based on a review of the factors described above, as well as such other factors as deemed appropriate by the Board, the Board, including all of the Independent Directors, determined that the Funds’ investment advisory fee rates under the Advisory Contract do not constitute fees that are so disproportionately large as to bear no reasonable relationship to the services rendered and that could not have been the product of arm’s-length bargaining, and concluded to approve the continuance of the Advisory Contract for the coming year.
II. iShares International High Yield Bond ETF
Under Section 15(c) of the Investment Company Act of 1940 (the “1940 Act”), the Company’s Board of Directors (the “Board”), including a majority of Directors who are not “interested persons” of the Company (as that term is defined in the 1940 Act) (the “Independent Directors”), is required annually to consider and approve the Investment
| 80 | 2 0 1 8 I S H A R E S A N N U A L R E P O R T T O S H A R E H O L D E R S |
Board Review and Approval of Investment Advisory Contract (continued)
Advisory Contract between the Company and BFA (the “Advisory Contract”), and the Sub-Advisory Agreement between BFA and BlackRock International Limited (“BIL”) (the “Sub-Advisory Agreement”), on behalf of the Fund. The Advisory Contract and the Sub-Advisory Agreement are referred to hereafter as the “Advisory Agreements”. The Independent Directors requested, and BFA provided, such information as the Independent Directors, with advice from independent counsel, deemed reasonably necessary to evaluate the Advisory Agreements. At a meeting on May 11, 2018, a committee composed of all of the Independent Directors (the “15(c) Committee”), with independent counsel, met with management and reviewed and discussed information provided in response to initial requests of the 15(c) Committee and/or their independent counsel, and requested certain additional information, which management agreed to provide. At these meetings, the 15(c) Committee reviewed and discussed information provided in response to the 15(c) Committee’s initial requests, and requested certain additional information, which management agreed to provide. At a meeting held on May 24, 2018, management presented additional information to the Board relating to the continuance of the Advisory Agreements, including information requested by the 15(c) Committee during its initial meeting. The Board, including the Independent Directors, reviewed and discussed such information at length. The Independent Directors requested from management certain additional information, which management agreed to provide. At a meeting held on June 12-14, 2018, the Board, including the Independent Directors, reviewed the additional information provided by management in response to these requests. After extensive discussions, the Board, including all of the Independent Directors, approved the continuance of the Advisory Agreements for the Fund, based on a review of qualitative and quantitative information provided by BFA. The Board noted its satisfaction with the extent and quality of information provided and its frequent interactions with management, as well as the detailed responses and other information provided by BFA. The Independent Directors were advised by their independent counsel throughout the process, including about the legal standards applicable to their review. In approving the Advisory Agreements for the Fund, the Board, including the Independent Directors, considered various factors, including: (i) the expenses and performance of the Fund; (ii) the nature, extent and quality of the services provided by BFA; (iii) the costs of services provided to the Fund and profits realized by BFA and its affiliates; (iv) economies of scale; (v) the fees and services provided for other comparable funds/accounts managed by BFA and its affiliates; and (vi) other benefits to BFA and/or its affiliates. The material factors, no one of which was controlling, and conclusions that formed the basis for the Board, including the Independent Directors, to approve the Advisory Agreements are discussed below.
Expenses and Performance of the Fund: The Board reviewed statistical information prepared by Broadridge Financial Solutions Inc. (“Broadridge”), an independent provider of investment company data, regarding the expense ratio components, including gross and net total expenses, fees and expenses of another fund in which the Fund invests (if applicable), and waivers/reimbursements (if applicable) of the Fund in comparison with the same information for other ETFs (including, where applicable, funds sponsored by an “at cost” service provider), objectively selected by Broadridge as comprising the Fund’s applicable peer group pursuant to Broadridge’s proprietary ETF methodology (the “Peer Group”). The Board was provided with a detailed description of the proprietary ETF methodology used by Broadridge to determine the Fund’s Peer Group. The Board further noted that due to the limitations in providing comparable funds in the Peer Group, the statistical information provided in Broadridge’s report may or may not provide meaningful direct comparisons to the Fund in all instances.
The Board also noted that the investment advisory fee rate and overall expenses (net of waivers and reimbursements) for the Fund were lower than the median of the investment advisory fee rates and overall expenses (net of waivers and reimbursements) of the funds in its Peer Group, excluding iShares funds. The Board also noted that BFA pays BIL for its sub-advisory services, and that there are no additional fees imposed on the Fund in respect of the services provided under the Sub-Advisory Agreement.
In addition, to the extent that any of the comparison funds included in the Peer Group, excluding iShares funds, track the same index as the Fund, Broadridge also provided, and the Board reviewed, a comparison of the Fund’s performance for the one-, three-, five-, ten-year, and since inception periods, as applicable, and for the quarter ended December 31, 2017, to that of relevant comparison fund(s) for the same periods.
The Board noted that the Fund seeks to track its specified underlying index and that, during the year, the Board received periodic reports on the Fund’s short- and longer-term performance in comparison with its underlying index. Such periodic comparative performance information, including additional detailed information as requested by the Board, was also considered. The Board noted that the Fund generally performed in line with its underlying index over the relevant periods.
Based on this review, the other factors considered at the meeting, and their general knowledge of ETF pricing, the Board concluded that the investment advisory fee rate and expense level and the historical performance of the Fund supported the Board’s approval of the continuance of the Advisory Agreements for the coming year.
Nature, Extent and Quality of Services Provided by BFA: Based on management’s representations, including information about recent and proposed enhancements to the iShares business, including with respect to capital markets support and analysis, technology, portfolio management, product design and quality, compliance and risk management, global public policy and other services, the Board expected that there would be no diminution in the scope of services required of or provided by BFA (and any services provided by BIL on BFA’s behalf or at BFA’s direction) under the Advisory Agreements for the coming year as compared to the scope of services provided by BFA and BIL during prior years. In reviewing the scope of these services, the Board considered the investment philosophy and experience of BFA and BIL, noting that BFA and its affiliates have committed significant resources over time, including during the past year, to support the iShares funds and their shareholders. The Board also considered the compliance program of BFA and BIL and their compliance record with respect to the Fund. In that regard, the Board noted that BFA reports to the Board about portfolio management and compliance matters on a periodic basis in connection with regularly scheduled meetings of the Board, and on other occasions as necessary and appropriate, and has provided information and made relevant officers and other employees of BFA (and its affiliates) available as needed to provide further assistance with these matters. The Board also reviewed the background and experience of the persons responsible for the day-to-day management of the Fund, as well as the resources available to them in managing the Fund. In addition to the above considerations, the Board reviewed and considered detailed presentations regarding BFA’s investment performance, investment and risk management processes and strategies provided at the June 12-14, 2018 meeting and throughout the year, and matters related to BFA’s and BIL’s portfolio compliance policies and procedures.
Based on review of this information, and the performance information discussed above, the Board concluded that the nature, extent and quality of services provided to the Fund under the Advisory Agreements supported the Board’s approval of the continuance of the Advisory Agreements for the coming year.
Costs of Services Provided to Fund and Profits Realized by BFA and its Affiliates: The Board reviewed information about the profitability to BlackRock in managing the Fund, based on the fees payable to BFA and its affiliates (including fees under the Advisory Contract), and other sources of revenue and expense to BFA and its affiliates
B O A R D R E V I E W A N D A P P R O V A L O F I N V E S T M E N T A D V I S O R Y C O N T R A C T | 81 |
Board Review and Approval of Investment Advisory Contract (continued)
from the Fund’s operations for the last calendar year. The Board reviewed BlackRock’s profitability methodology for the iShares funds, noting that the 15(c) Committee and the Board had focused on the methodology and profitability presentation during their meetings. The Board further noted that it considered the supplemental information the 15(c) Committee requested, which BlackRock provided, regarding the methodology. The Board discussed the sources of direct and ancillary revenue with management, including the revenues to BTC, a BlackRock affiliate, from securities lending by the Fund. The Board also discussed BFA’s profit margin as reflected in the Fund’s profitability analysis and reviewed information regarding potential economies of scale (as discussed below).
Based on this review, the Board concluded that the profits realized by BFA and its affiliates under the Advisory Contract and from other relationships between the Fund and BFA and/or its affiliates, if any, were within a reasonable range in light of the factors and other information considered.
Economies of Scale: The Board reviewed information regarding potential economies of scale or other efficiencies that may result from increases in the Fund’s assets, noting that the issue of economies of scale had been focused on by the 15(c) Committee and the Board during their meetings and addressed by management. The 15(c) Committee and the Board received information regarding BlackRock’s historical profitability, including BFA’s and its affiliates’ costs in providing services. The cost information distinguished, among other things, between fixed and variable costs, and showed how the level of fixed and variable costs, as well as the nature of such costs, may impact the existence or size of scale benefits. The 15(c) Committee and the Board reviewed information provided by BFA regarding the sharing of scale benefits with the iShares funds through various means, including, as applicable, through relatively low fee rates established at inception, breakpoints, waivers, or other fee reductions, as well as through additional investment in the iShares business and the provision of improved or additional infrastructure and services to the iShares funds and their shareholders. The Board noted that the Advisory Contract for the Fund did not provide for breakpoints in the Fund’s investment advisory fee rate as the assets of the Fund increase. However, the Board noted that a breakpoint structure for the Fund may be appropriate should material economies of scale exist in the future that are not otherwise shared, and that it would continue to monitor the sharing of economies of scale to determine the appropriateness of adding breakpoints in the future.
Based on this review of the sharing of scale benefits, as well as the other factors considered at the meeting, the Board concluded that the information concerning the sharing of scale benefits supported the Board’s approval of the continuance of the Advisory Agreements for the coming year.
Fees and Services Provided for Other Comparable Funds/Accounts Managed by BFA and its Affiliates: The Board received and considered information regarding the investment advisory/management fee rates for other funds/accounts in the U.S. for which BFA (or its affiliates) provides investment advisory/management services, including open-end funds registered under the 1940 Act (including sub-advised funds), collective trust funds, and institutional separate accounts (collectively, the “Other Accounts”), and acknowledged BFA’s assertion that the iShares funds are fundamentally different investment vehicles from the Other Accounts. The Board noted that BFA and its affiliates do not manage Other Accounts with substantially the same investment objective and strategy as the Fund and that track the same index as the Fund. The Board further noted that BFA provided the Board with detailed information regarding how the Other Accounts generally differ from the Fund, including in terms of the different and generally more extensive services provided to the Fund, as well as other significant differences. In that regard, the Board considered that the pricing of services to institutional clients is typically based on a number of factors beyond the nature and extent of the specific services to be provided and often depends on the overall relationship between the client and its affiliates and the adviser and its affiliates. In addition, the Board considered the relative complexity and inherent risks and challenges of managing and providing other services to the Fund, as a publicly traded ETF, as compared to the Other Accounts, particularly those that are institutional clients, in light of differing regulatory requirements and client-imposed mandates. The Board also acknowledged management’s assertion that, for certain iShares funds, and for client segmentation purposes, BlackRock has launched an iShares fund that may provide a similar investment exposure at a lower investment advisory fee rate. The Board also considered the “all-inclusive” nature of the Fund’s advisory fee structure, and the Fund’s expenses borne by BFA under this arrangement. The Board noted that the investment advisory fee rate under the Advisory Contract for the Fund was generally higher than the investment advisory/management fee rates for certain of the Other Accounts (particularly institutional clients) and concluded that the differences appeared to be consistent with the factors discussed.
Other Benefits to BFA and/or its Affiliates: The Board reviewed the “fallout” benefits or ancillary revenue received by BFA and/or its affiliates in connection with the services provided to the Fund by BFA, such as payment of revenue to BTC, the Fund’s securities lending agent, for loaning portfolio securities (which was included in the profit margins reviewed by the Board pursuant to BFA’s profitability methodology), and payment of advisory fees and/or administration fees to BFA (or its affiliates) in connection with any investments by the Fund in other funds for which BFA (or its affiliates) provides investment advisory services and/or administration services. The Board also noted the revenue received by BFA and/or its affiliates pursuant to an agreement that permits a service provider to use certain portions of BlackRock’s technology platform to service accounts managed by BFA and/or its affiliates, including the iShares funds. The Board noted that BFA generally does not use soft dollars or consider the value of research or other services that may be provided to BFA (including its affiliates) in selecting brokers for portfolio transactions for the Fund. The Board further noted that any portfolio transactions on behalf of the Fund placed through a BFA affiliate or purchased from an underwriting syndicate in which a BFA affiliate participates (including associated commissions) are reported to the Board pursuant to Rule 17e-1 or Rule 10f-3, as applicable, under the 1940 Act. The Board concluded that any such ancillary benefits would not be disadvantageous to the Fund and thus would not alter the Board’s conclusion with respect to the appropriateness of approving the continuance of the Advisory Agreements for the coming year.
Conclusion: Based on a review of the factors described above, as well as such other factors as deemed appropriate by the Board, the Board, including all of the Independent Directors, determined that the Fund’s investment advisory fee rate under the Advisory Contract does not constitute a fee that is so disproportionately large as to bear no reasonable relationship to the services rendered and that could not have been the product of arm’s-length bargaining, and concluded to approve the continuance of the Advisory Agreements for the coming year.
III. iShares J.P. Morgan EM Local Currency Bond ETF
Under Section 15(c) of the Investment Company Act of 1940 (the “1940 Act”), the Company’s Board of Directors (the “Board”), including a majority of Directors who are not “interested persons” of the Company (as that term is defined in the 1940 Act) (the “Independent Directors”), is required annually to consider and approve the Investment Advisory Contract between the Company and BFA (the “Advisory Contract”), and the Sub-Advisory Agreement between BFA and BlackRock International Limited (“BIL”) (the “Sub-Advisory Agreement”), on behalf of the Fund. The Advisory Contract and the Sub-Advisory Agreement are referred to hereafter as the “Advisory Agreements”. The
| 82 | 2 0 1 8 I S H A R E S A N N U A L R E P O R T T O S H A R E H O L D E R S |
Board Review and Approval of Investment Advisory Contract (continued)
Independent Directors requested, and BFA provided, such information as the Independent Directors, with advice from independent counsel, deemed reasonably necessary to evaluate the Advisory Agreements. At a meeting on May 11, 2018, a committee composed of all of the Independent Directors (the “15(c) Committee”), with independent counsel, met with management and reviewed and discussed information provided in response to initial requests of the 15(c) Committee and/or their independent counsel, and requested certain additional information, which management agreed to provide. At these meetings, the 15(c) Committee reviewed and discussed information provided in response to the 15(c) Committee’s initial requests, and requested certain additional information, which management agreed to provide. At a meeting held on May 24, 2018, management presented additional information to the Board relating to the continuance of the Advisory Agreements, including information requested by the 15(c) Committee during its initial meeting. The Board, including the Independent Directors, reviewed and discussed such information at length. The Independent Directors requested from management certain additional information, which management agreed to provide. At a meeting held on June 12-14, 2018, the Board, including the Independent Directors, reviewed the additional information provided by management in response to these requests. After extensive discussions, the Board, including all of the Independent Directors, approved the continuance of the Advisory Agreements for the Fund, based on a review of qualitative and quantitative information provided by BFA. The Board noted its satisfaction with the extent and quality of information provided and its frequent interactions with management, as well as the detailed responses and other information provided by BFA. The Independent Directors were advised by their independent counsel throughout the process, including about the legal standards applicable to their review. In approving the Advisory Agreements for the Fund, the Board, including the Independent Directors, considered various factors, including: (i) the expenses and performance of the Fund; (ii) the nature, extent and quality of the services provided by BFA; (iii) the costs of services provided to the Fund and profits realized by BFA and its affiliates; (iv) economies of scale; (v) the fees and services provided for other comparable funds/accounts managed by BFA and its affiliates; and (vi) other benefits to BFA and/or its affiliates. The material factors, no one of which was controlling, and conclusions that formed the basis for the Board, including the Independent Directors, to approve the Advisory Agreements are discussed below.
Expenses and Performance of the Fund: The Board reviewed statistical information prepared by Broadridge Financial Solutions Inc. (“Broadridge”), an independent provider of investment company data, regarding the expense ratio components, including gross and net total expenses, fees and expenses of another fund in which the Fund invests (if applicable), and waivers/reimbursements (if applicable) of the Fund in comparison with the same information for other ETFs (including, where applicable, funds sponsored by an “at cost” service provider), objectively selected by Broadridge as comprising the Fund’s applicable peer group pursuant to Broadridge’s proprietary ETF methodology (the “Peer Group”). The Board was provided with a detailed description of the proprietary ETF methodology used by Broadridge to determine the Fund’s Peer Group. The Board further noted that due to the limitations in providing comparable funds in the Peer Group, the statistical information provided in Broadridge’s report may or may not provide meaningful direct comparisons to the Fund in all instances.
The Board also noted that the investment advisory fee rate and overall expenses (net of waivers and reimbursements) for the Fund were higher than the median of the investment advisory fee rates and overall expenses (net of waivers and reimbursements) of the funds in its Peer Group, excluding iShares funds. The Board also noted that BFA pays BIL for its sub-advisory services, and that there are no additional fees imposed on the Fund in respect of the services provided under the Sub-Advisory Agreement.
In addition, to the extent that any of the comparison funds included in the Peer Group, excluding iShares funds, track the same index as the Fund, Broadridge also provided, and the Board reviewed, a comparison of the Fund’s performance for the one-, three-, five-, ten-year, and since inception periods, as applicable, and for the quarter ended December 31, 2017, to that of relevant comparison fund(s) for the same periods.
The Board noted that the Fund seeks to track its specified underlying index and that, during the year, the Board received periodic reports on the Fund’s short- and longer-term performance in comparison with its underlying index. Such periodic comparative performance information, including additional detailed information as requested by the Board, was also considered. The Board noted that the Fund generally performed in line with its underlying index over the relevant periods.
Based on this review, the other factors considered at the meeting, and their general knowledge of ETF pricing, the Board concluded that the investment advisory fee rate and expense level and the historical performance of the Fund supported the Board’s approval of the continuance of the Advisory Agreements for the coming year.
Nature, Extent and Quality of Services Provided by BFA: Based on management’s representations, including information about recent and proposed enhancements to the iShares business, including with respect to capital markets support and analysis, technology, portfolio management, product design and quality, compliance and risk management, global public policy and other services, the Board expected that there would be no diminution in the scope of services required of or provided by BFA (and any services provided by BIL on BFA’s behalf or at BFA’s direction) under the Advisory Agreements for the coming year as compared to the scope of services provided by BFA and BIL during prior years. In reviewing the scope of these services, the Board considered the investment philosophy and experience of BFA and BIL, noting that BFA and its affiliates have committed significant resources over time, including during the past year, to support the iShares funds and their shareholders. The Board also considered the compliance program of BFA and BIL and their compliance record with respect to the Fund. In that regard, the Board noted that BFA reports to the Board about portfolio management and compliance matters on a periodic basis in connection with regularly scheduled meetings of the Board, and on other occasions as necessary and appropriate, and has provided information and made relevant officers and other employees of BFA (and its affiliates) available as needed to provide further assistance with these matters. The Board also reviewed the background and experience of the persons responsible for the day-to-day management of the Fund, as well as the resources available to them in managing the Fund. In addition to the above considerations, the Board reviewed and considered detailed presentations regarding BFA’s investment performance, investment and risk management processes and strategies provided at the June 12-14, 2018 meeting and throughout the year, and matters related to BFA’s and BIL’s portfolio compliance policies and procedures.
Based on review of this information, and the performance information discussed above, the Board concluded that the nature, extent and quality of services provided to the Fund under the Advisory Agreements supported the Board’s approval of the continuance of the Advisory Agreements for the coming year.
Costs of Services Provided to Fund and Profits Realized by BFA and its Affiliates: The Board reviewed information about the profitability to BlackRock in managing the Fund, based on the fees payable to BFA and its affiliates (including fees under the Advisory Contract), and other sources of revenue and expense to BFA and its affiliates from the Fund’s operations for the last calendar year. The Board reviewed BlackRock’s profitability methodology for the iShares funds, noting that the15(c) Committee and the Board had focused on the methodology and profitability presentation during their meetings. The Board further noted that it considered the supplemental information the
B O A R D R E V I E W A N D A P P R O V A L O F I N V E S T M E N T A D V I S O R Y C O N T R A C T | 83 |
Board Review and Approval of Investment Advisory Contract (continued)
15(c) Committee requested, which BlackRock provided, regarding the methodology. The Board discussed the sources of direct and ancillary revenue with management, including the revenues to BTC, a BlackRock affiliate, from securities lending by the Fund. The Board also discussed BFA’s profit margin as reflected in the Fund’s profitability analysis and reviewed information regarding potential economies of scale (as discussed below).
Based on this review, the Board concluded that the profits realized by BFA and its affiliates under the Advisory Contract and from other relationships between the Fund and BFA and/or its affiliates, if any, were within a reasonable range in light of the factors and other information considered.
Economies of Scale: The Board reviewed information regarding potential economies of scale or other efficiencies that may result from increases in the Fund’s assets, noting that the issue of economies of scale had been focused on by the 15(c) Committee and the Board during their meetings and addressed by management. The 15(c) Committee and the Board received information regarding BlackRock’s historical profitability, including BFA’s and its affiliates’ costs in providing services. The cost information distinguished, among other things, between fixed and variable costs, and showed how the level of fixed and variable costs, as well as the nature of such costs, may impact the existence or size of scale benefits. The 15(c) Committee and the Board reviewed information provided by BFA regarding the sharing of scale benefits with the iShares funds through various means, including, as applicable, through relatively low fee rates established at inception, breakpoints, waivers, or other fee reductions, as well as through additional investment in the iShares business and the provision of improved or additional infrastructure and services to the iShares funds and their shareholders. The Board noted that the Advisory Contract for the Fund did not provide for any breakpoints in the Fund’s investment advisory fee rate as the assets of the Fund increase. However, the Board noted that during the June 12-14, 2018 meeting, the Board approved a permanent reduction to the advisory fee rate charged to the Fund. In addition, the Board noted that, should additional material economies of scale exist in the future that are not otherwise shared, a breakpoint structure for the Fund may be appropriate, and that it would continue to monitor the sharing of economies of scale to determine the appropriateness of adding breakpoints in the future.
Based on this review of the sharing of scale benefits, as well as the other factors considered at the meeting, the Board concluded that the information concerning the sharing of scale benefits supported the Board’s approval of the continuance of the Advisory Agreements for the coming year.
Fees and Services Provided for Other Comparable Funds/Accounts Managed by BFA and its Affiliates: The Board received and considered information regarding the investment advisory/management fee rates for other funds/accounts in the U.S. for which BFA (or its affiliates) provides investment advisory/management services, including open-end funds registered under the 1940 Act (including sub-advised funds), collective trust funds, and institutional separate accounts (collectively, the “Other Accounts”), and acknowledged BFA’s assertion that the iShares funds are fundamentally different investment vehicles from the Other Accounts. The Board noted that BFA and its affiliates do not manage Other Accounts with substantially the same investment objective and strategy as the Fund and that track the same index as the Fund. The Board further noted that BFA provided the Board with detailed information regarding how the Other Accounts generally differ from the Fund, including in terms of the different and generally more extensive services provided to the Fund, as well as other significant differences. In that regard, the Board considered that the pricing of services to institutional clients is typically based on a number of factors beyond the nature and extent of the specific services to be provided and often depends on the overall relationship between the client and its affiliates and the adviser and its affiliates. In addition, the Board considered the relative complexity and inherent risks and challenges of managing and providing other services to the Fund, as a publicly traded ETF, as compared to the Other Accounts, particularly those that are institutional clients, in light of differing regulatory requirements and client-imposed mandates. The Board also acknowledged management’s assertion that, for certain iShares funds, and for client segmentation purposes, BlackRock has launched an iShares fund that may provide a similar investment exposure at a lower investment advisory fee rate. The Board also considered the “all-inclusive” nature of the Fund’s advisory fee structure, and the Fund’s expenses borne by BFA under this arrangement. The Board noted that the investment advisory fee rate under the Advisory Contract for the Fund was generally higher than the investment advisory/management fee rates for certain of the Other Accounts (particularly institutional clients) and concluded that the differences appeared to be consistent with the factors discussed.
Other Benefits to BFA and/or its Affiliates: The Board reviewed the “fallout” benefits or ancillary revenue received by BFA and/or its affiliates in connection with the services provided to the Fund by BFA, such as payment of revenue to BTC, the Fund’s securities lending agent, for loaning portfolio securities (which was included in the profit margins reviewed by the Board pursuant to BFA’s profitability methodology), and payment of advisory fees and/or administration fees to BFA (or its affiliates) in connection with any investments by the Fund in other funds for which BFA (or its affiliates) provides investment advisory services and/or administration services. The Board also noted the revenue received by BFA and/or its affiliates pursuant to an agreement that permits a service provider to use certain portions of BlackRock’s technology platform to service accounts managed by BFA and/or its affiliates, including the iShares funds. The Board noted that BFA generally does not use soft dollars or consider the value of research or other services that may be provided to BFA (including its affiliates) in selecting brokers for portfolio transactions for the Fund. The Board further noted that any portfolio transactions on behalf of the Fund placed through a BFA affiliate or purchased from an underwriting syndicate in which a BFA affiliate participates (including associated commissions) are reported to the Board pursuant to Rule 17e-1 or Rule 10f-3, as applicable, under the 1940 Act. The Board concluded that any such ancillary benefits would not be disadvantageous to the Fund and thus would not alter the Board’s conclusion with respect to the appropriateness of approving the continuance of the Advisory Agreements for the coming year.
Conclusion: Based on a review of the factors described above, as well as such other factors as deemed appropriate by the Board, the Board, including all of the Independent Directors, determined that the Fund’s investment advisory fee rate under the Advisory Contract does not constitute a fee that is so disproportionately large as to bear no reasonable relationship to the services rendered and that could not have been the product of arm’s-length bargaining, and concluded to approve the continuance of the Advisory Agreements for the coming year.
IV. iShares US & Intl High Yield Corp Bond ETF
Under Section 15(c) of the Investment Company Act of 1940 (the “1940 Act”), the Company’s Board of Directors (the “Board”), including a majority of Directors who are not “interested persons” of the Company (as that term is defined in the 1940 Act) (the “Independent Directors”), is required annually to consider and approve the Investment Advisory Contract between the Company and BFA (the “Advisory Contract”), and the Sub-Advisory Agreement between BFA and BlackRock International Limited (“BIL”) (the “Sub-Advisory Agreement”), on behalf of the Fund. The Advisory Contract and the Sub-Advisory Agreement are referred to hereafter as the “Advisory Agreements”. The Independent Directors requested, and BFA provided, such information as the Independent Directors, with advice from independent counsel, deemed reasonably necessary
| 84 | 2 0 1 8 I S H A R E S A N N U A L R E P O R T T O S H A R E H O L D E R S |
Board Review and Approval of Investment Advisory Contract (continued)
to evaluate the Advisory Agreements. At a meeting on May 11, 2018, a committee composed of all of the Independent Directors (the “15(c) Committee”), with independent counsel, met with management and reviewed and discussed information provided in response to initial requests of the 15(c) Committee and/or their independent counsel, and requested certain additional information, which management agreed to provide. At these meetings, the 15(c) Committee reviewed and discussed information provided in response to the 15(c) Committee’s initial requests, and requested certain additional information, which management agreed to provide. At a meeting held on May 24, 2018, management presented additional information to the Board relating to the continuance of the Advisory Agreements, including information requested by the 15(c) Committee during its initial meeting. The Board, including the Independent Directors, reviewed and discussed such information at length. The Independent Directors requested from management certain additional information, which management agreed to provide. At a meeting held on June 12-14, 2018, the Board, including the Independent Directors, reviewed the additional information provided by management in response to these requests. After extensive discussions, the Board, including all of the Independent Directors, approved the continuance of the Advisory Agreements for the Fund, based on a review of qualitative and quantitative information provided by BFA. The Board noted its satisfaction with the extent and quality of information provided and its frequent interactions with management, as well as the detailed responses and other information provided by BFA. The Independent Directors were advised by their independent counsel throughout the process, including about the legal standards applicable to their review. In approving the Advisory Agreements for the Fund, the Board, including the Independent Directors, considered various factors, including: (i) the expenses and performance of the Fund; (ii) the nature, extent and quality of the services provided by BFA; (iii) the costs of services provided to the Fund and profits realized by BFA and its affiliates; (iv) economies of scale; (v) the fees and services provided for other comparable funds/accounts managed by BFA and its affiliates; and (vi) other benefits to BFA and/or its affiliates. The material factors, no one of which was controlling, and conclusions that formed the basis for the Board, including the Independent Directors, to approve the Advisory Agreements are discussed below.
Expenses and Performance of the Fund: The Board reviewed statistical information prepared by Broadridge Financial Solutions Inc. (“Broadridge”), an independent provider of investment company data, regarding the expense ratio components, including gross and net total expenses, fees and expenses of another fund in which the Fund invests (if applicable), and waivers/reimbursements (if applicable) of the Fund in comparison with the same information for other ETFs (including, where applicable, funds sponsored by an “at cost” service provider), objectively selected by Broadridge as comprising the Fund’s applicable peer group pursuant to Broadridge’s proprietary ETF methodology (the “Peer Group”). The Board was provided with a detailed description of the proprietary ETF methodology used by Broadridge to determine the Fund’s Peer Group. The Board further noted that due to the limitations in providing comparable funds in the Peer Group, the statistical information provided in Broadridge’s report may or may not provide meaningful direct comparisons to the Fund in all instances.
The Board also noted that the investment advisory fee rate and overall expenses (net of waivers and reimbursements) for the Fund were lower than the median of the investment advisory fee rates and overall expenses (net of waivers and reimbursements) of the funds in its Peer Group, excluding iShares funds. The Board also noted that BFA pays BIL for its sub-advisory services, and that there are no additional fees imposed on the Fund in respect of the services provided under the Sub-Advisory Agreement.
In addition, to the extent that any of the comparison funds included in the Peer Group, excluding iShares funds, track the same index as the Fund, Broadridge also provided, and the Board reviewed, a comparison of the Fund’s performance for the one-, three-, five-, ten-year, and since inception periods, as applicable, and for the quarter ended December 31, 2017, to that of relevant comparison fund(s) for the same periods.
The Board noted that the Fund seeks to track its specified underlying index and that, during the year, the Board received periodic reports on the Fund’s short- and longer-term performance in comparison with its underlying index. Such periodic comparative performance information, including additional detailed information as requested by the Board, was also considered. The Board noted that the Fund generally performed in line with its underlying index over the relevant periods.
Based on this review, the other factors considered at the meeting, and their general knowledge of ETF pricing, the Board concluded that the investment advisory fee rate and expense level and the historical performance of the Fund supported the Board’s approval of the continuance of the Advisory Agreements for the coming year.
Nature, Extent and Quality of Services Provided by BFA: Based on management’s representations, including information about recent and proposed enhancements to the iShares business, including with respect to capital markets support and analysis, technology, portfolio management, product design and quality, compliance and risk management, global public policy and other services, the Board expected that there would be no diminution in the scope of services required of or provided by BFA (and any services provided by BIL on BFA’s behalf or at BFA’s direction) under the Advisory Agreements for the coming year as compared to the scope of services provided by BFA and BIL during prior years. In reviewing the scope of these services, the Board considered the investment philosophy and experience of BFA and BIL, noting that BFA and its affiliates have committed significant resources over time, including during the past year, to support the iShares funds and their shareholders. The Board also considered the compliance program of BFA and BIL and their compliance record with respect to the Fund. In that regard, the Board noted that BFA reports to the Board about portfolio management and compliance matters on a periodic basis in connection with regularly scheduled meetings of the Board, and on other occasions as necessary and appropriate, and has provided information and made relevant officers and other employees of BFA (and its affiliates) available as needed to provide further assistance with these matters. The Board also reviewed the background and experience of the persons responsible for the day-to-day management of the Fund, as well as the resources available to them in managing the Fund. In addition to the above considerations, the Board reviewed and considered detailed presentations regarding BFA’s investment performance, investment and risk management processes and strategies provided at the June 12-14, 2018 meeting and throughout the year, and matters related to BFA’s and BIL’s portfolio compliance policies and procedures.
Based on review of this information, and the performance information discussed above, the Board concluded that the nature, extent and quality of services provided to the Fund under the Advisory Agreements supported the Board’s approval of the continuance of the Advisory Agreements for the coming year.
Costs of Services Provided to Fund and Profits Realized by BFA and its Affiliates: The Board reviewed information about the profitability to BlackRock in managing the Fund, based on the fees payable to BFA and its affiliates (including fees under the Advisory Contract), and other sources of revenue and expense to BFA and its affiliates from the Fund’s operations for the last calendar year. The Board reviewed BlackRock’s profitability methodology for the iShares funds, noting that the 15(c) Committee and the Board had focused on the methodology and profitability presentation during their meetings. The Board further noted that it considered the supplemental information the 15(c) Committee requested, which BlackRock provided, regarding the methodology. The Board discussed the sources of direct and ancillary revenue with management,
B O A R D R E V I E W A N D A P P R O V A L O F I N V E S T M E N T A D V I S O R Y C O N T R A C T | 85 |
Board Review and Approval of Investment Advisory Contract (continued)
including the revenues to BTC, a BlackRock affiliate, from securities lending by the Fund. The Board also discussed BFA’s profit margin as reflected in the Fund’s profitability analysis and reviewed information regarding potential economies of scale (as discussed below).
Based on this review, the Board concluded that the profits realized by BFA and its affiliates under the Advisory Contract and from other relationships between the Fund and BFA and/or its affiliates, if any, were within a reasonable range in light of the factors and other information considered.
Economies of Scale: The Board reviewed information regarding potential economies of scale or other efficiencies that may result from increases in the Fund’s assets, noting that the issue of economies of scale had been focused on by the 15(c) Committee and the Board during their meetings and addressed by management. The 15(c) Committee and the Board received information regarding BlackRock’s historical profitability, including BFA’s and its affiliates’ costs in providing services. The cost information distinguished, among other things, between fixed and variable costs, and showed how the level of fixed and variable costs, as well as the nature of such costs, may impact the existence or size of scale benefits. The 15(c) Committee and the Board reviewed information provided by BFA regarding the sharing of scale benefits with the iShares funds through various means, including, as applicable, through relatively low fee rates established at inception, breakpoints, waivers, or other fee reductions, as well as through additional investment in the iShares business and the provision of improved or additional infrastructure and services to the iShares funds and their shareholders. The Board noted that the Advisory Contract for the Fund did not provide for breakpoints in the Fund’s investment advisory fee rate as the assets of the Fund increase. However, the Board noted that a breakpoint structure for the Fund may be appropriate should material economies of scale exist in the future that are not otherwise shared, and that it would continue to monitor the sharing of economies of scale to determine the appropriateness of adding breakpoints in the future.
Based on this review of the sharing of scale benefits, as well as the other factors considered at the meeting, the Board concluded that the information concerning the sharing of scale benefits supported the Board’s approval of the continuance of the Advisory Agreements for the coming year.
Fees and Services Provided for Other Comparable Funds/Accounts Managed by BFA and its Affiliates: The Board received and considered information regarding the investment advisory/management fee rates for other funds/accounts in the U.S. for which BFA (or its affiliates) provides investment advisory/management services, including open-end funds registered under the 1940 Act (including sub-advised funds), collective trust funds, and institutional separate accounts (collectively, the “Other Accounts”), and acknowledged BFA’s assertion that the iShares funds are fundamentally different investment vehicles from the Other Accounts. The Board noted that BFA and its affiliates do not manage Other Accounts with substantially the same investment objective and strategy as the Fund and that track the same index as the Fund. The Board further noted that BFA provided the Board with detailed information regarding how the Other Accounts generally differ from the Fund, including in terms of the different and generally more extensive services provided to the Fund, as well as other significant differences. In that regard, the Board considered that the pricing of services to institutional clients is typically based on a number of factors beyond the nature and extent of the specific services to be provided and often depends on the overall relationship between the client and its affiliates and the adviser and its affiliates. In addition, the Board considered the relative complexity and inherent risks and challenges of managing and providing other services to the Fund, as a publicly traded ETF, as compared to the Other Accounts, particularly those that are institutional clients, in light of differing regulatory requirements and client-imposed mandates. The Board also acknowledged management’s assertion that, for certain iShares funds, and for client segmentation purposes, BlackRock has launched an iShares fund that may provide a similar investment exposure at a lower investment advisory fee rate. The Board also considered the “all-inclusive” nature of the Fund’s advisory fee structure, and the Fund’s expenses borne by BFA under this arrangement. The Board noted that the investment advisory fee rate under the Advisory Contract for the Fund was generally higher than the investment advisory/management fee rates for certain of the Other Accounts (particularly institutional clients) and concluded that the differences appeared to be consistent with the factors discussed.
Other Benefits to BFA and/or its Affiliates: The Board reviewed the “fallout” benefits or ancillary revenue received by BFA and/or its affiliates in connection with the services provided to the Fund by BFA, such as payment of revenue to BTC, the Fund’s securities lending agent, for loaning portfolio securities (which was included in the profit margins reviewed by the Board pursuant to BFA’s profitability methodology), and payment of advisory fees and/or administration fees to BFA (or its affiliates) in connection with any investments by the Fund in other funds for which BFA (or its affiliates) provides investment advisory services and/or administration services. The Board also noted the revenue received by BFA and/or its affiliates pursuant to an agreement that permits a service provider to use certain portions of BlackRock’s technology platform to service accounts managed by BFA and/or its affiliates, including the iShares funds. The Board noted that BFA generally does not use soft dollars or consider the value of research or other services that may be provided to BFA (including its affiliates) in selecting brokers for portfolio transactions for the Fund. The Board further noted that any portfolio transactions on behalf of the Fund placed through a BFA affiliate or purchased from an underwriting syndicate in which a BFA affiliate participates (including associated commissions) are reported to the Board pursuant to Rule 17e-1 or Rule 10f-3, as applicable, under the 1940 Act. The Board concluded that any such ancillary benefits would not be disadvantageous to the Fund and thus would not alter the Board’s conclusion with respect to the appropriateness of approving the continuance of the Advisory Agreements for the coming year.
Conclusion: Based on a review of the factors described above, as well as such other factors as deemed appropriate by the Board, the Board, including all of the Independent Directors, determined that the Fund’s investment advisory fee rate under the Advisory Contract does not constitute a fee that is so disproportionately large as to bear no reasonable relationship to the services rendered and that could not have been the product of arm’s-length bargaining, and concluded to approve the continuance of the Advisory Agreements for the coming year.
| 86 | 2 0 1 8 I S H A R E S A N N U A L R E P O R T T O S H A R E H O L D E R S |
Supplemental Information (unaudited)
Section 19(a) Notices
The amounts and sources of distributions reported in this notice are for financial reporting purposes and are not being provided for tax reporting purposes. The actual amounts and character of the distributions for tax reporting purposes will be reported to shareholders on Form 1099-DIV which is sent to shareholders shortly after calendar year-end.
Total Cumulative Distributions for the Fiscal Year | % Breakdown of the Total Cumulative Distributions for the Fiscal Year | |||||||||||||||||||||||||||||||
|
|
|
| |||||||||||||||||||||||||||||
| iShares ETF | Net Investment Income | Net Realized Capital Gains | Return of Capital | Total Per Share | Net Investment Income | Net Realized Capital Gains | Return of Capital | Total Per Share | ||||||||||||||||||||||||
Emerging Markets High Yield Bond | $ | 2.351965 | $ | — | $ | — | $ | 2.351965 | 100 | % | — | % | — | % | 100 | % | ||||||||||||||||
J.P. Morgan EM Corporate Bond | 2.106337 | — | — | 2.106337 | 100 | — | — | 100 | ||||||||||||||||||||||||
US & Intl High Yield Corp Bond | 2.605580 | — | — | 2.605580 | 100 | — | — | 100 | ||||||||||||||||||||||||
Premium/Discount Information
The Premium/Discount Information section is intended to present information about the differences between the daily market price on secondary markets for shares of a fund and that fund’s NAV. NAV is the price at which a fund issues and redeems shares. It is calculated in accordance with the standard formula for valuing mutual fund shares. The “Market Price” of a fund generally is determined using the midpoint between the highest bid and the lowest ask on the primary securities exchange on which shares of such fund are listed for trading, as of the time that the fund’s NAV is calculated. A fund’s Market Price may be at, above or below its NAV. The NAV of a fund will fluctuate with changes in the value of its portfolio holdings. The Market Price of a fund will fluctuate in accordance with changes in its NAV, as well as market supply and demand.
Premiums or discounts are the differences (expressed as a percentage) between the NAV and Market Price of a fund on a given day, generally at the time the NAV is calculated. A premium is the amount that a fund is trading above the reported NAV, expressed as a percentage of the NAV. A discount is the amount that a fund is trading below the reported NAV, expressed as a percentage of the NAV.
Premium/discount information for the Funds covering the most recently completed calendar year and the most recently completed calendar quarters since that year (or since the Fund began trading, if shorter) is publicly accessible, free of charge, at www.iShares.com.
The following information shows the frequency of distributions of premiums and discounts for the Funds for the immediately preceding five calendar years (or from the date a Fund began trading on the secondary market, if less than five years) through the date of the most recent calendar quarter-end. Each line in each table shows the number of trading days in which the Fund traded within the premium/discount range indicated. Premium/discount ranges with no trading days are omitted. The number of trading days in each premium/discount range is also shown as a percentage of the total number of trading days in the period covered by each table. All data presented here represents past performance, which cannot be used to predict future results.
iShares Emerging Markets High Yield Bond ETF
Period Covered: January 01, 2013 through September 30, 2018
| Premium/Discount Range | Number of Days | Percentage of Total Days | ||||||||
Greater than 1.0% and Less than 1.5% | 13 | 0.90 | % | |||||||
Greater than 0.5% and Less than 1.0% | 273 | 18.87 | ||||||||
Greater than 0.0% and Less than 0.5% | 884 | 61.08 | ||||||||
At NAV | 13 | 0.90 | ||||||||
Less than 0.0% and Greater than –0.5% | 235 | 16.24 | ||||||||
Less than –0.5% and Greater than –1.0% | 24 | 1.66 | ||||||||
Less than –1.0% and Greater than –1.5% | 5 | 0.35 | ||||||||
|
|
|
| |||||||
| 1,447 | 100.00 | % | ||||||||
|
|
|
| |||||||
S U P P L E M E N T A L I N F O R M A T I O N | 87 |
Supplemental Information (unaudited) (continued)
iShares International High Yield Bond ETF
Period Covered: January 01, 2013 through September 30, 2018
| Premium/Discount Range | Number of Days | Percentage of Total Days | ||||||||
Greater than 3.5% and Less than 4.0% | 1 | 0.07 | % | |||||||
Greater than 3.0% and Less than 3.5% | 2 | 0.14 | ||||||||
Greater than 2.5% and Less than 3.0% | 2 | 0.14 | ||||||||
Greater than 2.0% and Less than 2.5% | 4 | 0.28 | ||||||||
Greater than 1.5% and Less than 2.0% | 18 | 1.24 | ||||||||
Greater than 1.0% and Less than 1.5% | 68 | 4.70 | ||||||||
Greater than 0.5% and Less than 1.0% | 466 | 32.20 | ||||||||
Greater than 0.0% and Less than 0.5% | 731 | 50.52 | ||||||||
At NAV | 7 | 0.48 | ||||||||
Less than 0.0% and Greater than –0.5% | 128 | 8.85 | ||||||||
Less than –0.5% and Greater than –1.0% | 19 | 1.31 | ||||||||
Less than –1.0% and Greater than –1.5% | 1 | 0.07 | ||||||||
|
|
|
| |||||||
| 1,447 | 100.00 | % | ||||||||
|
|
|
| |||||||
iShares J.P. Morgan EM Corporate Bond ETF
Period Covered: January 01, 2013 through September 30, 2018
| Premium/Discount Range | Number of Days | Percentage of Total Days | ||||||||
Greater than 6.0% | 3 | 0.21 | % | |||||||
Greater than 4.5% and Less than 5.0% | 1 | 0.07 | ||||||||
Greater than 4.0% and Less than 4.5% | 4 | 0.28 | ||||||||
Greater than 3.5% and Less than 4.0% | 19 | 1.31 | ||||||||
Greater than 3.0% and Less than 3.5% | 10 | 0.69 | ||||||||
Greater than 2.5% and Less than 3.0% | 6 | 0.41 | ||||||||
Greater than 2.0% and Less than 2.5% | 10 | 0.69 | ||||||||
Greater than 1.5% and Less than 2.0% | 19 | 1.31 | ||||||||
Greater than 1.0% and Less than 1.5% | 127 | 8.78 | ||||||||
Greater than 0.5% and Less than 1.0% | 165 | 11.40 | ||||||||
Greater than 0.0% and Less than 0.5% | 606 | 41.88 | ||||||||
At NAV | 12 | 0.83 | ||||||||
Less than 0.0% and Greater than –0.5% | 228 | 15.76 | ||||||||
Less than –0.5% and Greater than –1.0% | 97 | 6.70 | ||||||||
Less than –1.0% and Greater than –1.5% | 78 | 5.39 | ||||||||
Less than –1.5% and Greater than –2.0% | 31 | 2.14 | ||||||||
Less than –2.0% and Greater than –2.5% | 24 | 1.66 | ||||||||
Less than –2.5% and Greater than –3.0% | 4 | 0.28 | ||||||||
Less than –3.0% and Greater than –3.5% | 3 | 0.21 | ||||||||
|
|
|
| |||||||
| 1,447 | 100.00 | % | ||||||||
|
|
|
| |||||||
| 88 | 2 0 1 8 I S H A R E S A N N U A L R E P O R T T O S H A R E H O L D E R S |
Supplemental Information (unaudited) (continued)
iShares J.P. Morgan EM Local Currency Bond ETF
Period Covered: January 01, 2013 through September 30, 2018
| Premium/Discount Range | Number of Days | Percentage of Total Days | ||||||
Greater than 2.0% and Less than 2.5% | 2 | 0.14 | % | |||||
Greater than 1.5% and Less than 2.0% | 7 | 0.48 | ||||||
Greater than 1.0% and Less than 1.5% | 94 | 6.50 | ||||||
Greater than 0.5% and Less than 1.0% | 144 | 9.95 | ||||||
Greater than 0.0% and Less than 0.5% | 724 | 50.04 | ||||||
At NAV | 14 | 0.97 | ||||||
Less than 0.0% and Greater than –0.5% | 403 | 27.85 | ||||||
Less than –0.5% and Greater than –1.0% | 51 | 3.52 | ||||||
Less than –1.0% and Greater than –1.5% | 7 | 0.48 | ||||||
Less than –3.0% and Greater than –3.5% | 1 | 0.07 | ||||||
|
|
|
| |||||
| 1,447 | 100.00 | % | ||||||
|
|
|
| |||||
iShares US & Intl High Yield Corp Bond ETF
Period Covered: January 01, 2013 through September 30, 2018
| Premium/Discount Range | Number of Days | Percentage of Total Days | ||||||
Greater than 2.0% and Less than 2.5% | 1 | 0.07 | % | |||||
Greater than 1.5% and Less than 2.0% | 6 | 0.41 | ||||||
Greater than 1.0% and Less than 1.5% | 85 | 5.87 | ||||||
Greater than 0.5% and Less than 1.0% | 400 | 27.64 | ||||||
Greater than 0.0% and Less than 0.5% | 767 | 53.02 | ||||||
At NAV | 6 | 0.41 | ||||||
Less than 0.0% and Greater than –0.5% | 118 | 8.15 | ||||||
Less than –0.5% and Greater than –1.0% | 50 | 3.46 | ||||||
Less than –1.0% and Greater than –1.5% | 13 | 0.90 | ||||||
Less than –1.5% and Greater than –2.0% | 1 | 0.07 | ||||||
|
|
|
| |||||
| 1,447 | 100.00 | % | ||||||
|
|
|
| |||||
Regulation under the Alternative Investment Fund Managers Directive
The Alternative Investment Fund Managers Directive (“AIFMD”) imposes detailed and prescriptive obligations on fund managers established in the European Union (the “EU”). These do not currently apply to managers established outside the EU, such as BFA. Rather, non-EU managers are only required to comply with certain disclosure, reporting and transparency obligations of the AIFMD if such managers market a fund to EU investors.
BFA has registered the iShares Emerging Markets High Yield Bond ETF (the “Fund”) for marketing to investors in the United Kingdom, the Netherlands, Finland, Sweden, and Luxembourg.
Report on Remuneration
BFA is required under the AIFMD to make quantitative disclosures of remuneration. These disclosures are made in line with BlackRock’s interpretation of currently available regulatory guidance on quantitative remuneration disclosures. As market or regulatory practice develops BlackRock may consider it appropriate to make changes to the way in which quantitative remuneration disclosures are calculated. Where such changes are made, this may result in disclosures in relation to a fund not being comparable to the disclosures made in the prior year, or in relation to other BlackRock fund disclosures in that same year.
Disclosures are provided in relation to (a) the staff of BFA; (b) staff who are senior management; and (c) staff who have the ability to materially affect the risk profile of the Fund.
All individuals included in the aggregated figures disclosed are rewarded in line with BlackRock’s remuneration policy for their responsibilities across the relevant BlackRock business area. As all individuals have a number of areas of responsibilities, only the portion of remuneration for those individuals’ services attributable to the Fund is included in the aggregate figures disclosed.
BlackRock has a clear and well-defined pay-for-performance philosophy, and compensation programs which support that philosophy.
BlackRock operates a total compensation model for remuneration which includes a base salary, which is contractual, and a discretionary bonus scheme. Although all employees are eligible to receive a discretionary bonus, there is no contractual obligation to make a discretionary bonus award to any employees. For senior management, a significant percentage of variable remuneration is deferred over time. All employees are subject to a claw-back policy.
S U P P L E M E N T A L I N F O R M A T I O N | 89 |
Supplemental Information (unaudited) (continued)
Remuneration decisions for employees are made once annually in January following the end of the performance year, based on BlackRock’s full-year financial results and other non-financial goals and objectives. Alongside financial performance, individual total compensation is also based on strategic and operating results and other considerations such as management and leadership capabilities. No set formulas are established and no fixed benchmarks are used in determining annual incentive awards.
Annual incentive awards are paid from a bonus pool which is reviewed throughout the year by BlackRock’s independent compensation committee, taking into account both actual and projected financial information together with information provided by the Enterprise Risk and Regulatory Compliance departments in relation to any activities, incidents or events that warrant consideration in making compensation decisions. Individuals are not involved in setting their own remuneration.
Each of the control functions (Enterprise Risk, Legal & Compliance, and Internal Audit) each have their own organizational structures which are independent of the business units. Functional bonus pools for those control functions are determined with reference to the performance of each individual function and the remuneration of the senior members of control functions is directly overseen by BlackRock’s independent compensation committee.
Members of staff and senior management of BFA typically provide both AIFMD and non-AIFMD related services in respect of multiple funds, clients and functions of BFA and across the broader BlackRock group. Therefore, the figures disclosed are a sum of each individual’s portion of remuneration attributable to the Fund according to an objective apportionment methodology which acknowledges the multiple-service nature of BFA. Accordingly the figures are not representative of any individual’s actual remuneration or their remuneration structure.
The amount of the total remuneration awarded by BFA to its staff which has been attributed to the Fund in respect of BFA’s financial year ending December 31, 2017 was USD 61.41 thousand. This figure is comprised of fixed remuneration of USD 24.48 thousand and variable remuneration of USD 36.93 thousand. There were a total of 417 beneficiaries of the remuneration described above.
The amount of the aggregate remuneration awarded by BFA, which has been attributed to the Fund in respect of BFA’s financial year ending December 31, 2017, to its senior management was USD 8.59 thousand, and to members of its staff whose actions have a material impact on the risk profile of the Fund was USD 1.6 thousand.
| 90 | 2 0 1 8 I S H A R E S A N N U A L R E P O R T T O S H A R E H O L D E R S |
Director and Officer Information
The Board of Directors has responsibility for the overall management and operations of the Funds, including general supervision of the duties performed by BFA and other service providers. Each Director serves until he or she resigns, is removed, dies, retires or becomes incapacitated. Each officer shall hold office until his or her successor is elected and qualifies or until his or her death, resignation or removal. Directors who are not “interested persons” (as defined in the 1940 Act) of the Company are referred to as independent directors (“Independent Directors”).
The registered investment companies advised by BFA or its affiliates (the “BlackRock-advised Funds”) are organized into one complex of closed-end funds, two complexes of open-end funds and one complex of exchange-traded funds (“Exchange-Traded Fund Complex”) (each, a “BlackRock Fund Complex”). Each Fund is included in the BlackRock Fund Complex referred to as the Exchange-Traded Fund Complex. Each Director also serves as a Trustee of iShares Trust and a Trustee of iShares U.S. ETF Trust and, as a result, oversees all of the funds within the Exchange-Traded Fund Complex, which consists of 343 funds as of October 31, 2018. With the exception of Robert S. Kapito, Mark K. Wiedman, Charles Park, Martin Small and Benjamin Archibald, the address of each Director and officer is c/o BlackRock, Inc., 400 Howard Street, San Francisco, CA 94105. The address of Mr. Kapito, Mr. Wiedman, Mr. Park, Mr. Small and Mr. Archibald is c/o BlackRock, Inc., Park Avenue Plaza, 55 East 52nd Street, New York, NY 10055. The Board has designated Cecilia H. Herbert as its Independent Board Chair. Additional information about the Funds’ Directors and officers may be found in the Funds’ combined Statement of Additional Information, which is available without charge, upon request, by calling toll-free 1-800-iShares (1-800-474-2737).
| Interested Directors | ||||||
| Name (Age) | Position(s) | Principal Occupation(s) During the Past 5 Years | Other Directorships Held by Director | |||
Robert S. Kapito(a) (61) | Director (since 2009). | President, BlackRock, Inc. (since 2006); Vice Chairman of BlackRock, Inc. and Head of BlackRock’s Portfolio Management Group (since its formation in 1998) and BlackRock, Inc.’s predecessor entities (since 1988); Trustee, University of Pennsylvania (since 2009); President of Board of Directors, Hope & Heroes Children’s Cancer Fund (since 2002). | Director of BlackRock, Inc. (since 2006); Trustee of iShares Trust (since 2009); Trustee of iShares U.S. ETF Trust (since 2011). | |||
Mark K. Wiedman(b) (47) | Director (since 2013). | Senior Managing Director, BlackRock, Inc. (since 2014); Managing Director, BlackRock, Inc. (2007-2014); Global Head of BlackRock’s ETF and Index Investments Business (since 2016); Global Head of iShares (2011-2016); Head of Corporate Strategy, BlackRock, Inc. (2009-2011). | Trustee of iShares Trust (since 2013); Trustee of iShares U.S. ETF Trust (since 2013); Director of PennyMac Financial Services, Inc. (since 2008). | |||
| (a) | Robert S. Kapito is deemed to be an “interested person” (as defined in the 1940 Act) of the Company due to his affiliations with BlackRock, Inc. and its affiliates. |
| (b) | Mark K. Wiedman is deemed to be an “interested person” (as defined in the 1940 Act) of the Company due to his affiliations with BlackRock, Inc. and its affiliates. |
| Independent Directors | ||||||
| Name (Age) | Position(s) | Principal Occupation(s) During the Past 5 Years | Other Directorships Held by Director | |||
Cecilia H. Herbert (69) | Director (since 2005); Independent Board Chair (since 2016). | Trustee and Member of the Finance, Technology and Quality Committee of Stanford Health Care (since 2016); Trustee and Member of the Investment Committee, WNET, a New York public media company (since 2011); Chair (1994-2005) and Member (since 1992) of the Investment Committee, Archdiocese of San Francisco; Director (1998-2013) and President (2007-2011) of the Board of Directors, Catholic Charities CYO; Trustee (2002-2011) and Chair of the Finance and Investment Committee (2006-2010) of the Thacher School. | Trustee of iShares Trust (since 2005); Trustee of iShares U.S. ETF Trust (since 2011); Independent Board Chair of iShares Trust and iShares U.S. ETF Trust (since 2016); Trustee of Forward Funds (14 portfolios) (since 2009); Trustee of Salient MF Trust (4 portfolios) (since 2015). | |||
Jane D. Carlin (62) | Director (since 2015); Risk Committee Chair (since 2016). | Consultant (since 2012); Managing Director and Global Head of Financial Holding Company Governance & Assurance and the Global Head of Operational Risk Management of Morgan Stanley (2006-2012). | Trustee of iShares Trust (since 2015); Trustee of iShares U.S. ETF Trust (since 2015); Director of PHH Corporation (mortgage solutions) (since 2012); Director of The Hanover Insurance Group, Inc. (since 2016). | |||
Richard L. Fagnani (63) | Director (since 2017); Equity Plus Committee Chair (since 2017). | Partner, KPMG LLP (2002-2016). | Trustee of iShares Trust (since 2017); Trustee of iShares U.S. ETF Trust (since 2017). | |||
D I R E C T O R A N D O F F I C E R I N F O R M A T I O N | 91 |
Director and Officer Information (continued)
| Independent Directors (continued) | ||||||
| Name (Age) | Position(s) | Principal Occupation(s) During the Past 5 Years | Other Directorships Held by Director | |||
Charles A. Hurty (75) | Director (since 2005); Audit Committee Chair (since 2006). | Retired; Partner, KPMG LLP (1968-2001). | Trustee of iShares Trust (since 2005); Trustee of iShares U.S. ETF Trust (since 2011); Director of SkyBridge Alternative Investments Multi-Adviser Hedge Fund Portfolios LLC (2 portfolios) (since 2002). | |||
John E. Kerrigan (63) | Director (since 2005); Securities Lending Committee Chair (since 2016). | Chief Investment Officer, Santa Clara University (since 2002). | Trustee of iShares Trust (since 2005); Trustee of iShares U.S. ETF Trust (since 2011). | |||
Drew E. Lawton (59) | Director (since 2017); 15(c) Committee Chair (since 2017) | Senior Managing Director of New York Life Insurance Company (2010-2015). | Trustee of iShares Trust (since 2017); Trustee of iShares U.S. ETF Trust (since 2017). | |||
John E. Martinez (57) | Director (since 2003); Fixed Income Plus Committee Chair (since 2016). | Director of Real Estate Equity Exchange, Inc. (since 2005). | Trustee of iShares Trust (since 2003); Trustee of iShares U.S. ETF Trust (since 2011). | |||
Madhav V. Rajan (54) | Director (since 2011); Nominating and Governance Committee Chair (since 2017). | Dean, and George Pratt Shultz Professor of Accounting, University of Chicago Booth School of Business (since 2017); Robert K. Jaedicke Professor of Accounting, Stanford University Graduate School of Business (2001-2017); Professor of Law (by courtesy), Stanford Law School (2005-2017); Senior Associate Dean for Academic Affairs and Head of MBA Program, Stanford University Graduate School of Business (2010-2016). | Trustee of iShares Trust (since 2011); Trustee of iShares U.S. ETF Trust (since 2011). | |||
| Officers | ||||||
| Name (Age) | Position(s) | Principal Occupation(s) During the Past 5 Years | ||||
Martin Small (43) | President (since 2016). | Managing Director, BlackRock, Inc. (since 2010); Head of U.S. iShares (since 2015); Co-Head of the U.S. Financial Markets Advisory Group, BlackRock, Inc. (2008-2014). | ||||
Jack Gee (59) | Treasurer and Chief Financial Officer (since 2008). | Managing Director, BlackRock, Inc. (since 2009); Senior Director of Fund Administration of Intermediary Investor Business, BGI (2009). | ||||
Charles Park (51) | Chief Compliance Officer (since 2006). | Chief Compliance Officer of BlackRock Advisors, LLC and the BlackRock-advised Funds in the Equity-Bond Complex, the Equity-Liquidity Complex and the Closed-End Complex (since 2014); Chief Compliance Officer of BFA (since 2006). | ||||
Benjamin Archibald (43) | Secretary (since 2015). | Managing Director, BlackRock, Inc. (since 2014); Director, BlackRock, Inc. (2010-2013); Secretary of the BlackRock-advised Mutual Funds (since 2012). | ||||
Steve Messinger (56) | Executive Vice President (since 2016). | Managing Director, BlackRock, Inc. (2007-2014 and since 2016); Managing Director, Beacon Consulting Group (2014-2016). | ||||
Scott Radell (49) | Executive Vice President (since 2012). | Managing Director, BlackRock, Inc. (since 2009); Head of Portfolio Solutions, BlackRock, Inc. (since 2009). | ||||
Alan Mason (57) | Executive Vice President (since 2016). | Managing Director, BlackRock, Inc. (since 2009). | ||||
| 92 | 2 0 1 8 I S H A R E S A N N U A L R E P O R T T O S H A R E H O L D E R S |
Electronic Delivery
Shareholders can sign up for email notifications announcing that the shareholder report or prospectus has been posted on the iShares website at www.iShares.com. Once you have enrolled, you will no longer receive prospectuses and shareholder reports in the mail.
To enroll in electronic delivery:
| • | Go to www.icsdelivery.com. |
| • | If your brokerage firm is not listed, electronic delivery may not be available. Please contact your broker-dealer or financial advisor. |
Householding
Householding is an option available to certain fund investors. Householding is a method of delivery, based on the preference of the individual investor, in which a single copy of certain shareholder documents can be delivered to investors who share the same address, even if their accounts are registered under different names. Please contact your broker-dealer if you are interested in enrolling in householding and receiving a single copy of prospectuses and other shareholder documents, or if you are currently enrolled in householding and wish to change your householding status.
Availability of Quarterly Schedule of Investments
The iShares Funds file their complete schedule of portfolio holdings with the SEC for the first and third quarters of each fiscal year on Form N-Q. The iShares Funds’ Forms N-Q are available on the SEC’s website at www.sec.gov. The iShares Funds also disclose their complete schedule of portfolio holdings on a daily basis on the iShares website at www.iShares.com.
Availability of Proxy Voting Policies and Proxy Voting Records
A description of the policies and procedures that the iShares Funds use to determine how to vote proxies relating to portfolio securities and information about how the iShares Funds voted proxies relating to portfolio securities during the most recent twelve-month period ending June 30 is available without charge, upon request (1) by calling toll-free 1-800-474-2737; (2) on the iShares website at www.iShares.com; and (3) on the SEC website at www.sec.gov.
G E N E R A L I N F O R M A T I O N | 93 |
Glossary of Terms Used in this Report
Portfolio Abbreviations - Fixed Income
LIBOR | London Interbank Offered Rate | |
PIK | Payment-in-kind | |
Currency Abbreviations | ||
ARS | Argentine peso | |
BRL | Brazilian Real | |
CAD | Canadian Dollar | |
CLP | Chilean Peso | |
COP | Colombian Peso | |
CZK | Czech Koruna | |
DOP | Dominican Peso | |
EUR | Euro | |
GBP | British Pound | |
HUF | Hungarian Forint | |
IDR | Indonesian Rupiah | |
MXN | Mexican Peso | |
MYR | Malaysian Ringgit | |
PEN | Peru Nuevo Sol | |
PHP | Philippine Peso | |
PLN | Polish Zloty | |
RON | Romanian Leu | |
RUB | New Russian Ruble | |
THB | Thai Baht | |
TRY | Turkish Lira | |
UYU | Uruguayan Peso | |
ZAR | South African Rand | |
| 94 | 2 0 1 8 I S H A R E S A N N U A L R E P O R T T O S H A R E H O L D E R S |
| ||||||||
| ||||||||
For more information visit www.iShares.com or call 1-800-iShares (1-800-474-2737)
| ||||||||
| This report is intended for the Funds’ shareholders. It may not be distributed to prospective investors unless it is preceded or accompanied by the current prospectus.
Investing involves risk, including possible loss of principal.
The iShares Funds are distributed by BlackRock Investments, LLC (together with its affiliates, “BlackRock”).
The iShares Funds are not sponsored, endorsed, issued, sold or promoted by JPMorgan Chase & Co., Markit Indices Limited or Morningstar, Inc., nor do these companies make any representation regarding the advisability of investing in the iShares Funds. BlackRock is not affiliated with the companies listed above.
©2018 BlackRock, Inc. All rights reserved. iSHARES and BLACKROCK are registered trademarks of BlackRock, Inc. or its subsidiaries. All other marks are the property of their respective owners. | |||||||
|
| |||||||


| Item 2. | Code of Ethics. |
The registrant has adopted a code of ethics, as of the end of the period covered by this report, applicable to the registrant’s principal executive officer, principal financial officer, principal accounting officer or controller, or persons performing similar functions. During the period covered by this report, the code of ethics was amended to clarify an inconsistency in to whom persons covered by the code should report suspected violations of the code. The amendment clarifies that such reporting should be made to BlackRock’s General Counsel, and retains the alternative option of anonymous reporting following “whistleblower” policies. Other non-material changes were also made in connection with this amendment. During the period covered by this report, there have been no waivers granted under the code of ethics. The registrant undertakes to provide a copy of the code of ethics to any person upon request, without charge, by calling 1-800-474-2737.
| Item 3. | Audit Committee Financial Expert. |
The registrant’s Board of Directors has determined that the registrant has more than one audit committee financial expert, as that term is defined under Item 3(b) and 3(c), serving on its audit committee. The audit committee financial experts serving on the registrant’s audit committee are Charles A. Hurty, Richard L. Fagnani (began serving on the audit committee effective as of June 20, 2017 and was designated as an audit committee financial expert serving on the audit committee effective as of September 15, 2017), John E. Kerrigan, and Madhav V. Rajan, all of whom are independent, as that term is defined under Item 3(a)(2).
| Item 4. | Principal Accountant Fees and Services. |
The principal accountant fees disclosed in items 4(a), 4(b), 4(c), 4(d) and 4(g) are for the five series of the registrant for which the fiscal year-end is October 31, 2018 (the “Funds”), and whose annual financial statements are reported in Item 1.
| (a) | Audit Fees – The aggregate fees billed for each of the last two fiscal years for professional services rendered by the principal accountant for the audit of the Funds’ annual financial statements or services that are normally provided by the accountant in connection with statutory and regulatory filings or engagements for those fiscal years were $77,500 for the fiscal year ended October 31, 2017 and $78,000 for the fiscal year ended October 31, 2018. |
| (b) | Audit-Related Fees – There were no fees billed for the fiscal years ended October 31, 2017 and October 31, 2018 for assurance and related services by the principal accountant that were reasonably related to the performance of the audit of the Fund’s financial statements and are not reported under (a) of this Item. |
| (c) | Tax Fees – The aggregate fees billed in each of the last two fiscal years for professional services rendered by the principal accountant for tax compliance, tax advice and tax planning for the Funds were $18,905 for the fiscal year ended October 31, 2017 and $18,905 for the fiscal year ended October 31, 2018. These services related to the review of the Funds’ tax returns and excise tax calculations. |
| (d) | All Other Fees – There were no other fees billed in each of the fiscal years ended October 31, 2017 and October 31, 2018 for products and services provided by the principal accountant, other than the services reported in (a) through (c) of this Item. |
| (e) | (1) The registrant’s audit committee charter, as amended, provides that the audit committee is responsible for the approval, prior to appointment, of the engagement of the principal accountant to annually audit and provide their opinion on the registrant’s financial statements. The audit committee must also approve, prior to appointment, the engagement of the principal accountant to provide non-audit services to the registrant or to any entity controlling, controlled by or under common control with the registrant’s investment adviser (“Adviser Affiliate”) that provides ongoing services to the registrant, if the engagement relates directly to the operations and financial reporting of the registrant. |
(2) There were no services described in (b) through (d) above that were approved by the audit committee pursuant to paragraph (c)(7)(i)(C) of Rule 2-01 of Regulation S-X.
| (f) | None of the hours expended on the principal accountant’s engagement to audit the Funds’ financial statements for the fiscal year ended October 31, 2018 were attributable to work performed by persons other than the principal accountant’s full-time, permanent employees. |
| (g) | The aggregate non-audit fees billed by the registrant’s principal accountant for services rendered to the Funds, and rendered to the registrant’s investment adviser, and any Adviser Affiliate that provides ongoing services to the registrant for the last two fiscal years were $18,905 for the fiscal year ended October 31, 2017 and $18,905 for the fiscal year ended October 31, 2018. |
| (h) | The registrant’s audit committee has considered whether the provision of non-audit services rendered to the registrant’s investment adviser and any Adviser Affiliate that provides ongoing services to the registrant that were not pre-approved pursuant to paragraph (c)(7)(ii) of Rule 2-01 of Regulation S-X, if any, is compatible with maintaining the principal accountant’s independence, and has determined that the provision of these services, if any, does not compromise the principal accountant’s independence. |
| Item 5. | Audit Committee of Listed Registrants |
(a) The registrant is a listed issuer as defined in Rule 10A-3 under the Exchange Act of 1934 and has a separately-designated standing audit committee established in accordance with Section 3(a)(58)(A) of the Exchange Act of 1934. The registrant’s audit committee members are Charles A. Hurty, Richard L. Fagnani (began serving on the audit committee effective as of June 20, 2017), John E. Kerrigan, and Madhav V. Rajan.
(b) Not applicable.
| Item 6. | Investments. |
| (a) | Schedules of investments are included as part of the reports to shareholders filed under Item 1 of this Form. |
| (b) | Not applicable. |
| Item 7. | Disclosure of Proxy Voting Policies and Procedures for Closed-End Management Investment Companies. |
Not applicable to the registrant.
| Item 8. | Portfolio Managers of Closed-End Management Investment Companies. |
Not applicable to the registrant.
| Item 9. | Purchases of Equity Securities by Closed-End Management Investment Company and Affiliated Purchasers. |
Not applicable to the registrant.
| Item 10. | Submission of Matters to a Vote of Security Holders. |
There were no material changes to the procedures by which shareholders may recommend nominees to the registrant’s Board of Directors.
| Item 11. | Controls and Procedures. |
(a) The President (the registrant’s Principal Executive Officer) and Treasurer and Chief Financial Officer (the registrant’s Principal Financial Officer) have concluded that the registrant’s disclosure controls and procedures (as defined in Rule 30a-3(c) under the Investment Company Act of 1940) are effective as of a date within 90 days of the filing date of this report, based on their evaluation of these controls and procedures required by Rule 30a-3(b) under the Investment Company Act of 1940 and Rules 13a-15(b) or 15d-15(b) under the Exchange Act of 1934.
(b) There were no changes in the registrant’s internal control over financial reporting (as defined in Rule 30a-3(d) under the Investment Company Act of 1940) that occurred during the period covered by this report that have materially affected, or are reasonably likely to materially affect, the registrant’s internal control over financial reporting.
| Item 12. | Disclosure of Securities Lending Activities for Closed-End Management Investment Companies. |
Not applicable to the registrant.
| Item 13. | Exhibits. |
(a) (1) Code of Ethics is not filed as an exhibit; please refer to Item 2.
(a) (2) Section 302 Certifications are attached.
(a) (3) Not applicable.
(a) (4) Not applicable.
(b) Section 906 Certifications are attached.
SIGNATURES
Pursuant to the requirements of the Securities Exchange Act of 1934 and the Investment Company Act of 1940, the registrant has duly caused this report to be signed on its behalf by the undersigned, thereunto duly authorized.
iShares, Inc. | ||
| By: | /s/ Martin Small | |
| Martin Small, President (Principal Executive Officer) | ||
Date: December 28, 2018
Pursuant to the requirements of the Securities Exchange Act of 1934 and the Investment Company Act of 1940, this report has been signed below by the following persons on behalf of the registrant and in the capacities and on the dates indicated.
| By: | /s/ Martin Small | |
| Martin Small, President (Principal Executive Officer) | ||
| Date: December 28, 2018 | ||
| By: | /s/ Jack Gee | |
| Jack Gee, Treasurer and Chief Financial Officer (Principal Financial Officer) | ||
| Date: December 28, 2018 | ||