UNITED STATES
SECURITIES AND EXCHANGE COMMISSION
Washington, D.C. 20549
FORMN-CSR
CERTIFIED SHAREHOLDER REPORT
OF REGISTERED MANAGEMENT INVESTMENT COMPANIES
Investment Company Act file number811-09102
iShares, Inc.
(Exact name of registrant as specified in charter)
c/o: State Street Bank and Trust Company
100 Summer Street, 4th Floor, Boston, MA 02110
(Address of principal executive offices) (Zip code)
The Corporation Trust Incorporated
2405 York Road, Suite 201, Lutherville-Timonium, Maryland 21093
(Name and address of agent for service)
Registrant’s telephone number, including area code: (415)670-2000
Date of fiscal year end: April 30, 2019
Date of reporting period: April 30, 2019
| Item 1. | Reports to Stockholders. |
Copies of the annual reports transmitted to shareholders pursuant to Rule30e-1 under the Investment Company
Act of 1940 are attached.
Information Classification: Confidential
APRIL 30, 2019
2019 ANNUAL REPORT |  |
iShares, Inc.
| ▶ | iShares Asia/Pacific Dividend ETF | DVYA | NYSE Arca |
| ▶ | iShares Emerging Markets Dividend ETF | DVYE | NYSE Arca |
Beginning on January 1, 2021, as permitted by regulations adopted by the Securities and Exchange Commission, paper copies of each Fund’s shareholder reports will no longer be sent by mail, unless you specifically request paper copies of the reports from your financial intermediary, such as a broker-dealer or bank. Instead, the reports will be made available on a website, and you will be notified by mail each time a report is posted and provided with a website link to access the report.
You may elect to receive all future reports in paper free of charge. If you hold accounts through a financial intermediary, you can follow the instructions included with this disclosure, if applicable, or contact your financial intermediary to request that you continue to receive paper copies of your shareholder reports. Please note that not all financial intermediaries may offer this service. Your election to receive reports in paper will apply to all funds held with your financial intermediary.
If you already elected to receive shareholder reports electronically, you will not be affected by this change and you need not take any action. You may elect to receive electronic delivery of shareholder reports and other communications by contacting your financial intermediary. Please note that not all financial intermediaries may offer this service.
| Page | ||||
| 5 | ||||
| 6 | ||||
| 10 | ||||
| 10 | ||||
| 11 | ||||
Financial Statements | ||||
| 16 | ||||
| 17 | ||||
| 18 | ||||
| 19 | ||||
| 21 | ||||
| 29 | ||||
| 30 | ||||
| 31 | ||||
| 33 | ||||
| 36 | ||||
| 37 | ||||
iShares, Inc.
Global Market Overview
Global equity markets posted a modest positive return during the 12 months ended April 30, 2019 (“reporting period”). The MSCI ACWI, a broad global equity index that includes both developed and emerging markets, returned 5.06% in United States (“U.S.”) dollar terms for the reporting period.
The reporting period was characterized by significant volatility, reflecting concerns about economic growth, corporate profits, a potential trade war between the U.S. and China, political turmoil in the U.S. and Europe, and rising interest rates. The rate of growth for many leading economies decelerated over the course of the reporting period. In the U.S., the pace of growth slowed from a 4.2% to a 2.2% annualized rate from the second to fourth quarters of 2018, before accelerating again to a 3.2% rate in the first quarter of 2019. Eurozone economic growth declined from 2.2% to 1.2% from the second quarter of 2018 to the first quarter of 2019. Similarly, economic growth in China and Japan decreased during the reporting period. Growth in the United Kingdom (“U.K.”) was also slow and remained well below a 2% annual rate.
Related to economic growth deceleration was a steady downturn in corporate earnings. In the U.S., the December 2017 tax cut led to the second strongest corporate profit growth in the developed world in calendar year 2018. However, by the first quarter of 2019, corporate earnings growth had declined year over year. In Europe and Japan, earnings expectations were repeatedly revised downward. Emerging market stocks, which are often sensitive to changes in the global economy, posted positive earnings growth but trailed the U.S. and Europe. The downturn in global growth meant continued restrained inflation, as consumer prices across the world’s leading economies increased at only a 1.5% annual rate through March 2019.
Political developments also weighed on equities, as investors faced uncertainty about the outcome of the U.K.’s planned exit (“Brexit”) from the European Union (“E.U.”). As the U.K. is one of the largest economies in the world and a key trading partner with Europe and the U.S., the potential of the U.K. leaving the E.U. without a deal in place raised concerns. In the U.S., the longest government shutdown in U.S. history further weighed on expectations for economic growth. Another significant threat to the global economy was a potential trade war between the U.S. and China. These concerns eased late in the reporting period as the U.S. government shutdown ended in January 2019, and the U.S. reduced trade tensions with China.
Leading central banks reacted to these conditions by slowing their interest rate-raising campaigns or by decreasing interest rates. For example, in December 2018 the U.S. Federal Reserve Bank (“Fed”) increased rates for the third time but in early January 2019, announced that it would slow the pace of future rate increases. The European Central Bank (“ECB”) delayed the date of its proposed first rate increase since before the Financial Crisis of 2007 – 2008 and took additional steps to stimulate the economy. China also adopted a range of monetary and fiscal policy measures intended to increase growth.
In that environment, U.S. stocks significantly outperformed other developed markets, as both European and Asian equities declined in U.S. dollar terms. Concerns about growth and trade particularly weighed on emerging market equities, most of which posted negative returns for the reporting period. In particular, Chinese markets in 2018 declined the most in a decade.
| M A R K E T O V E R V I E W | 5 |
| Fund Summary as of April 30, 2019 | iShares® Asia/Pacific Dividend ETF |
Investment Objective
TheiShares Asia/Pacific Dividend ETF(the “Fund”) seeks to track the investment results of an index composed of relatively high dividend paying equities in Asia/Pacific developed markets, as represented by the Dow Jones Asia/Pacific Select Dividend 30 IndexTM (the “Index”). The Fund invests in a representative sample of securities included in the Index that collectively has an investment profile similar to the Index. Due to the use of representative sampling, the Fund may or may not hold all of the securities that are included in the Index.
Performance
| Average Annual Total Returns | Cumulative Total Returns | |||||||||||||||||||||||||||
| 1 Year | 5 Years | Since Inception | 1 Year | 5 Years | Since Inception | |||||||||||||||||||||||
Fund NAV | (0.83 | )% | (0.24 | )% | 2.94 | % | (0.83 | )% | (1.22 | )% | 23.17 | % | ||||||||||||||||
Fund Market | 0.20 | (0.27 | ) | 2.97 | 0.20 | (1.34 | ) | 23.37 | ||||||||||||||||||||
Index | (0.58 | ) | (0.02 | ) | 3.23 | (0.58 | ) | (0.10 | ) | 25.67 | ||||||||||||||||||
GROWTH OF $10,000 INVESTMENT
(SINCE INCEPTION AT NET ASSETVALUE)
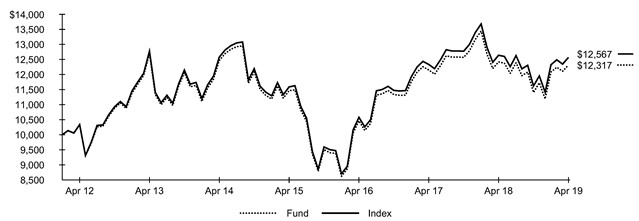
The inception date of the Fund was 2/23/12. The first day of secondary market trading was 2/24/12.
Past performance is no guarantee of future results. Performance results do not reflect the deduction of taxes that a shareholder would pay on fund distributions or on the redemption or sale of fund shares. See “About Fund Performance” on page 10 for more information.
Expense Example
| Actual | Hypothetical 5% Return | |||||||||||||||||||||||||||||
|
|
|
| |||||||||||||||||||||||||||
| | Beginning Account Value (11/01/18) | | Ending Account Value (04/30/19 | ) | | Expenses Paid During the Period | (a) | | Beginning Account Value (11/01/18 | ) | | Ending Account Value (04/30/19 | ) | | Expenses Paid During the Period | (a) | | Annualized Expense Ratio | | |||||||||||
| $ | 1,000.00 | $ | 1,079.90 | $ | 2.53 | $ | 1,000.00 | $ | 1,022.40 | $ | 2.46 | 0.49 | % | |||||||||||||||||
| (a) | Expenses are calculated using the Fund’s annualized expense ratio (as disclosed in the table), multiplied by the average account value for the period, multiplied by the number of days in the period (181 days) and divided by the number of days in the year (365 days). See “Shareholder Expenses” on page 10 for more information. |
| 6 | 2 0 1 9 I S H A R E S A N N U A L R E P O R T T O S H A R E H O L D E R S |
| Fund Summary as of April 30, 2019 (continued) | iShares® Asia/Pacific Dividend ETF |
Portfolio Management Commentary
Asia Pacific dividend stocks declined modestly during the reporting period, amid trade tensions and slowing regional economic growth. Equities in New Zealand, where annual growth reached a five-year low, meaningfully detracted from the Index’s performance. Communication services stocks weighed on the Index’s return, as cable and satellite providers struggled amid the ongoing shift toward online content, which has cost the industry subscribers and detracted from advertising revenues.
Stocks in Hong Kong weighed on the Index’s performance amid weakness in China and slow domestic growth. Retail stocks were a notable detractor, as consumers and tourists reduced spending. Technology hardware and equipment stocks were negatively affected by higher costs and slower sales outside the region. Investment banking and brokerage equities also declined as a slumping Chinese stock market and intense competition limited profits and fees.
Telecommunications stocks in Singapore also weighed on the Index’s return. Increasing competition, pricing pressures, and rising costs negatively affected revenues and profit margins in the industry. In Japan, autos and components stocks detracted from the Index’s performance. Vehicle exports weakened in the second half of 2018, especially to China, where auto sales decreased for the first time in decades.
In contrast, Australian equities were solid contributors to the Index’s return, advancing sharply in the latter half of the reporting period, bolstered by news of expected tax cuts and accommodative fiscal policy. Metals and mining stocks followed iron ore prices higher after global production was disrupted due to the closure of a large Brazilian mine following a pair of dam collapses. A cyclone in Australia also reduced production of iron ore, exacerbating the global shortage as Chinese stockpiles of the steelmaking metal declined to their lowest level since 2017.
Australian retail stocks also contributed significantly to the Index’s performance. Despite concerns about an expected economic slowdown and decreasing housing prices, consumers largely remained resilient. When sales slowed late in the reporting period, some retailers grew profits through strong sales in other markets, while others managed to beat expectations by increasing domestic sales.
Portfolio Information
ALLOCATION BY SECTOR
Sector | | Percent of Total Investments | (a) | |
Financials | 27.3 | % | ||
Consumer Discretionary | 26.6 | |||
Communication Services | 13.1 | |||
Materials | 12.2 | |||
Utilities | 8.1 | |||
Industrials | 6.3 | |||
Information Technology | 3.5 | |||
Energy | 2.9 |
| (a) | Excludes money market funds. |
ALLOCATION BY COUNTRY
Country | | Percent of Total Investments | (a) | |
Australia | 53.3 | % | ||
Hong Kong | 20.1 | |||
Japan | 10.7 | |||
Singapore | 9.0 | |||
New Zealand | 6.9 |
| F U N D S U M M A R Y | 7 |
| Fund Summary as of April 30, 2019 | iShares® Emerging Markets Dividend ETF |
Investment Objective
TheiShares Emerging Markets Dividend ETF(the “Fund”) seeks to track the investment results of an index composed of relatively high dividend paying equities in emerging markets, as represented by the Dow Jones Emerging Markets Select Dividend IndexTM (the “Index”). The Fund invests in a representative sample of securities included in the Index that collectively has an investment profile similar to the Index. Due to the use of representative sampling, the Fund may or may not hold all of the securities that are included in the Index.
Performance
| Average Annual Total Returns | Cumulative Total Returns | |||||||||||||||||||||||||||
| 1 Year | 5 Years | Since Inception | 1 Year | 5 Years | Since Inception | |||||||||||||||||||||||
Fund NAV | 2.68 | % | 1.45 | % | 0.53 | % | 2.68 | % | 7.44 | % | 3.89 | % | ||||||||||||||||
Fund Market | 3.95 | 1.35 | 0.55 | 3.95 | 6.92 | 4.02 | ||||||||||||||||||||||
Index | 2.70 | 1.55 | 0.52 | 2.70 | 7.97 | 3.78 | ||||||||||||||||||||||
GROWTH OF $10,000 INVESTMENT
(SINCE INCEPTION AT NET ASSET VALUE)
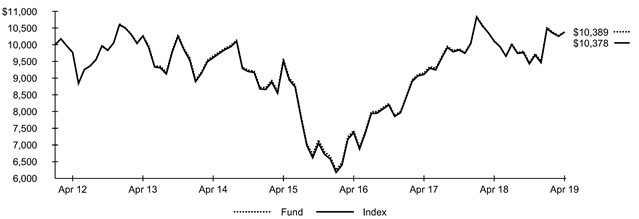
The inception date of the Fund was 2/23/12. The first day of secondary market trading was 2/24/12.
Past performance is no guarantee of future results. Performance results do not reflect the deduction of taxes that a shareholder would pay on fund distributions or on the redemption or sale of fund shares. See “About Fund Performance” on page 10 for more information.
Expense Example
| Actual | Hypothetical 5% Return | |||||||||||||||||||||||||||||
| | Beginning Account Value (11/01/18) | | | Ending Account Value (04/30/19) | | | Expenses Paid During the Period | (a) | | Beginning Account Value (11/01/18) | | | Ending Account Value (04/30/19) | | | Expenses Paid During the Period | (a) | | Annualized Expense Ratio | | ||||||||||
| $ | 1,000.00 | $ | 1,097.50 | $ | 2.55 | $ | 1,000.00 | $ | 1,022.40 | $ | 2.46 | 0.49 | % | |||||||||||||||||
| (a) | Expenses are calculated using the Fund’s annualized expense ratio (as disclosed in the table), multiplied by the average account value for the period, multiplied by the number of days in the period (181 days) and divided by the number of days in the year (365 days). See “Shareholder Expenses” on page 10 for more information. |
| 8 | 2 0 1 9 I S H A R E S A N N U A L R E P O R T T O S H A R E H O L D E R S |
| Fund Summary as of April 30, 2019 (continued) | iShares® Emerging Markets Dividend ETF |
Portfolio Management Commentary
Emerging market dividend stocks advanced modestly despite concerns about economic growth and trade. Taiwanese stocks were leading contributors to the Index’s return for the reporting period, particularly within the information technology sector, despite flat economic growth, slowing technology exports, and weakening manufacturing activity. Semiconductor stocks advanced, driven by a focus on high-margin products and efficiency. Communications equipment stocks also bolstered the Index’s performance, amid solid profit and dividend growth. Network equipment makers worked to minimize tariff issues by moving production out of mainland China and making inroads into 5G technology. Electronic equipment, instruments, and components stocks also contributed to the Index’s return, as higher-margin segments such as battery packs andhigh-end wireless earbuds improved earnings. Real estate development stocks bolstered the Index’s performance modestly amid a sharp increase in real estate investment and strong demand for office space.
Brazilian utilities stocks were meaningful contributors to the Index’s return. Although the country’s economic recovery remained slow, electric utilities run by state governments advanced sharply during the reporting period. Investor sentiment improved on expectations of federal and state leaders supporting utilities and pursuing their privatization to reduce public debt.
Russian materials stocks also contributed to the Index’s return, amid sharply increasing prices for industrial metals mined in Russia. Steel stocks advanced, as steel prices increased sharply in 2019, driven by expectations of a resolution to the trade dispute between the U.S. and China. Automotive manufacturers drove demand for metals such as palladium and nickel.
In contrast, Turkish stocks were meaningful detractors from the Index’s performance. Turkey’s economic growth slowed sharply amid a currency crisis, high inflation, and political uncertainty. Industrials and consumer discretionary stocks were notable detractors as output and new orders decreased for manufacturers and inflation pressured consumers. Real estate equities in the United Arab Emirates also detracted from the Index’s return, amid a continuing downturn in the Dubai market, where supply outstripped demand.
Portfolio Information
ALLOCATION BY SECTOR
| Sector | | Percent of Total Investments | (a) | |
Materials | 17.8 | % | ||
Financials | 14.8 | |||
Information Technology | 14.7 | |||
Real Estate | 12.6 | |||
Communication Services | 11.4 | |||
Utilities | 8.8 | |||
Energy | 8.4 | |||
Consumer Discretionary | 5.4 | |||
Industrials | 3.5 | |||
Consumer Staples | 2.6 |
| (a) | Excludes money market funds. |
TEN LARGEST COUNTRIES
| Country | | Percent of Total Investments | (a) | |
Taiwan | 21.9 | % | ||
Russia | 16.3 | |||
China | 11.6 | |||
South Africa | 8.6 | |||
Brazil | 8.5 | |||
Thailand | 7.7 | |||
India | 4.1 | |||
Turkey | 3.9 | |||
United Arab Emirates | 3.7 | |||
Malaysia | 3.1 |
| F U N D S U M M A R Y | 9 |
Past performance is no guarantee of future results. Current performance may be lower or higher than the performance data quoted. Performance data current to the most recentmonth-end is available at www.ishares.com. Performance results assume reinvestment of all dividends and capital gain distributions and do not reflect the deduction of taxes that a shareholder would pay on fund distributions or on the redemption or sale of fund shares. The investment return and principal value of shares will vary with changes in market conditions. Shares may be worth more or less than their original cost when they are redeemed or sold in the market. Performance for certain funds may reflect a waiver of a portion of investment advisory fees. Without such a waiver, performance would have been lower.
Net asset value or “NAV” is the value of one share of a fund as calculated in accordance with the standard formula for valuing mutual fund shares. The price used to calculate market return (“Market Price”) is determined by using the midpoint between the highest bid and the lowest ask on the primary stock exchange on which shares of a fund are listed for trading, as of the time that such fund’s NAV is calculated. Since shares of a fund may not trade in the secondary market until after the fund’s inception, for the period from inception to the first day of secondary market trading in shares of the fund, the NAV of the fund is used as a proxy for the Market Price to calculate market returns. Market and NAV returns assume that dividends and capital gain distributions have been reinvested at Market Price and NAV, respectively.
An index is a statistical composite that tracks a specified financial market or sector. Unlike a fund, an index does not actually hold a portfolio of securities and therefore does not incur the expenses incurred by a fund. These expenses negatively impact fund performance. Also, market returns do not include brokerage commissions that may be payable on secondary market transactions. If brokerage commissions were included, market returns would be lower.
As a shareholder of your Fund, you incur two types of costs: (1) transaction costs, including brokerage commissions on purchases and sales of fund shares and (2) ongoing costs, including management fees and other fund expenses. The expense example, which is based on an investment of $1,000 invested at the beginning of the period (or from the commencement of operations if less than 6 months) and held through the end of the period, is intended to help you understand your ongoing costs (in dollars and cents) of investing in your Fund and to compare these costs with the ongoing costs of investing in other funds.
Actual Expenses— The table provides information about actual account values and actual expenses. Annualized expense ratios reflect contractual and voluntary fee waivers, if any. To estimate the expenses that you paid on your account over the period, simply divide your account value by $1,000 (for example, an $8,600 account value divided by $1,000 = 8.6), then multiply the result by the number under the heading entitled “Expenses Paid During the Period.”
Hypothetical Example for Comparison Purposes— The table also provides information about hypothetical account values and hypothetical expenses based on your Fund’s actual expense ratio and an assumed rate of return of 5% per year before expenses. You may use this information to compare the ongoing costs of investing in your Fund and other funds. To do so, compare this 5% hypothetical example with the 5% hypothetical examples that appear in the shareholder reports of the other funds.
Please note that the expenses shown in the table are meant to highlight your ongoing costs only and do not reflect any transactional costs, such as brokerage commissions paid on purchases and sales of fund shares. Therefore, the hypothetical examples are useful in comparing ongoing costs only and will not help you determine the relative total costs of owning different funds. In addition, if these transactional costs were included, your costs would have been higher.
| 10 | 2 0 1 9 I S H A R E S A N N U A L R E P O R T T O S H A R E H O L D E R S |
April 30, 2019 | iShares® Asia/Pacific Dividend ETF (Percentages shown are based on Net Assets) |
| Security | Shares | Value | ||||||
Common Stocks |
| |||||||
Australia — 53.0% |
| |||||||
AusNet Services | 757,423 | $ | 946,274 | |||||
Australia & New Zealand Banking Group Ltd. | 50,470 | 966,234 | ||||||
Bendigo & Adelaide Bank Ltd. | 176,843 | 1,282,051 | ||||||
Boral Ltd. | 269,284 | 919,248 | ||||||
Commonwealth Bank of Australia | 19,131 | 1,003,438 | ||||||
CSR Ltd. | 557,674 | 1,397,367 | ||||||
Harvey Norman Holdings Ltd. | 538,069 | 1,579,262 | ||||||
JBHi-Fi Ltd.(a) | 67,762 | 1,229,082 | ||||||
McMillan Shakespeare Ltd. | 117,958 | 1,101,738 | ||||||
National Australia Bank Ltd. | 75,931 | 1,354,807 | ||||||
Perpetual Ltd. | 39,158 | 1,127,811 | ||||||
Super Retail Group Ltd. | 223,175 | 1,360,328 | ||||||
Sydney Airport | 178,231 | 955,913 | ||||||
Westpac Banking Corp. | 62,788 | 1,215,759 | ||||||
Woodside Petroleum Ltd. | 37,989 | 946,278 | ||||||
|
| |||||||
| 17,385,590 | ||||||||
| Hong Kong — 20.0% | ||||||||
Giordano International Ltd. | 3,234,000 | 1,537,566 | ||||||
Haitong International Securities Group Ltd. | 2,837,000 | 1,026,981 | ||||||
HK Electric Investments & HK Electric Investments Ltd. | 816,000 | 798,797 | ||||||
PCCW Ltd. | 1,914,000 | 1,153,953 | ||||||
Power Assets Holdings Ltd. | 129,000 | 899,419 | ||||||
VTech Holdings Ltd. | 125,700 | 1,146,383 | ||||||
|
| |||||||
| 6,563,099 | ||||||||
| Japan — 10.6% | ||||||||
JFE Holdings Inc. | 49,500 | 846,666 | ||||||
Mitsubishi Chemical Holdings Corp. | 113,500 | 804,156 | ||||||
Nissan Motor Co. Ltd. | 121,600 | 975,311 | ||||||
Subaru Corp. | 35,600 | 869,583 | ||||||
|
| |||||||
| 3,495,716 | ||||||||
| New Zealand — 6.9% | ||||||||
SKYCITY Entertainment Group Ltd. | 419,231 | 1,140,708 | ||||||
| Security | Shares | Value | ||||||
| New Zealand (continued) | ||||||||
Spark New Zealand Ltd. | 455,838 | $ | 1,115,674 | |||||
|
| |||||||
| 2,256,382 | ||||||||
| Singapore — 8.9% | ||||||||
DBS Group Holdings Ltd. | 44,500 | 923,542 | ||||||
Singapore Telecommunications Ltd.(a) | 455,200 | 1,060,083 | ||||||
StarHub Ltd.(a) | 828,182 | 943,052 | ||||||
|
| |||||||
| 2,926,677 | ||||||||
|
| |||||||
Total Common Stocks — 99.4% |
| 32,627,464 | ||||||
|
| |||||||
Short-Term Investments |
| |||||||
Money Market Funds — 7.7% |
| |||||||
BlackRock Cash Funds: Institutional, | 2,502,420 | 2,503,420 | ||||||
BlackRock Cash Funds: Treasury, | 11,503 | 11,503 | ||||||
|
| |||||||
| 2,514,923 | ||||||||
|
| |||||||
Total Short-Term Investments — 7.7% |
| 2,514,923 | ||||||
|
| |||||||
Total Investments in Securities — 107.1% |
| 35,142,387 | ||||||
Other Assets, Less Liabilities — (7.1)% |
| (2,319,796 | ) | |||||
|
| |||||||
Net Assets — 100.0% | $ | 32,822,591 | ||||||
|
| |||||||
| (a) | All or a portion of this security is on loan. |
| (b) | Affiliate of the Fund. |
| (c) | Annualized7-day yield as ofperiod-end. |
| (d) | All or a portion of this security was purchased with cash collateral received from loaned securities. |
Affiliates
Investments in issuers considered to be affiliates of the Fund during the year ended April 30, 2019, for purposes of Section 2(a)(3) of the 1940 Act, were as follows:
| Affiliated Issuer | | Shares Held at 04/30/18 | | Net Activity | | Shares Held at 04/30/19 | | | Value at 04/30/19 | | Income | | Net Realized Gain (Loss) | (a) | | Change in Unrealized Appreciation (Depreciation) | | |||||||||||
BlackRock Cash Funds: Institutional, SL Agency Shares | 370,188 | 2,132,232 | 2,502,420 | $ | 2,503,420 | $ | 6,363 | (b) | $ | 208 | $ | 324 | ||||||||||||||||
BlackRock Cash Funds: Treasury, SL Agency Shares | 5,356 | 6,147 | 11,503 | 11,503 | 653 | — | — | |||||||||||||||||||||
|
|
|
|
|
|
|
| |||||||||||||||||||||
| $ | 2,514,923 | $ | 7,016 | $ | 208 | $ | 324 | |||||||||||||||||||||
|
|
|
|
|
|
|
|
| (a) | Includes realized capital gain distributions from an affiliated fund, if any. |
| (b) | Includes securities lending income earned from the reinvestment of cash collateral from loaned securities (excluding collateral investment fees), net of fees and other payments to and from borrowers of securities, and less fees paid to BTC as securities lending agent. |
Fair Value Measurements
Various inputs are used in determining the fair value of financial instruments. For description of the input levels and information about the Fund’s policy regarding valuation of financial instruments, refer to the Notes to Financial Statements.
| S C H E D U L E O F I N V E S T M E N T S | 11 |
Schedule of Investments (continued) April 30, 2019 | iShares® Asia/Pacific Dividend ETF |
Fair Value Measurements (continued)
The following table summarizes the value of the Fund’s investments according to the fair value hierarchy as of April 30, 2019. The breakdown of the Fund’s investments into major categories is disclosed in the Schedule of Investments above.
| Level 1 | Level 2 | Level 3 | Total | |||||||||||||
Investments | ||||||||||||||||
Assets | ||||||||||||||||
Common Stocks | $ | 32,627,464 | $ | — | $ | — | $ | 32,627,464 | ||||||||
Money Market Funds | 2,514,923 | — | — | 2,514,923 | ||||||||||||
|
|
|
|
|
|
|
| |||||||||
| $ | 35,142,387 | $ | — | $ | — | $ | 35,142,387 | |||||||||
|
|
|
|
|
|
|
| |||||||||
See notes to financial statements.
| 12 | 2 0 1 9 I S H A R E S A N N U A L R E P O R T T O S H A R E H O L D E R S |
Schedule of Investments April 30, 2019 | iShares® Emerging Markets Dividend ETF (Percentages shown are based on Net Assets) |
| Security | Shares | Value | ||||||
Common Stocks |
| |||||||
Brazil — 5.2% |
| |||||||
AES Tiete Energia SA | 1,517,400 | $ | 4,148,525 | |||||
CCR SA | 955,400 | 2,827,286 | ||||||
EDP - Energias do Brasil SA | 786,800 | 3,487,550 | ||||||
Enauta Participacoes SA, NVS | 2,444,700 | 8,292,783 | ||||||
Engie Brasil Energia SA | 449,650 | 5,064,154 | ||||||
Transmissora Alianca de Energia Eletrica SA | 843,000 | 5,601,790 | ||||||
|
| |||||||
| 29,422,088 | ||||||||
| China — 11.5% | ||||||||
Agile Group Holdings Ltd. | 6,744,000 | 10,194,998 | ||||||
Agricultural Bank of China Ltd., Class H | 9,554,000 | 4,408,377 | ||||||
Bank of China Ltd., Class H | 9,554,000 | 4,554,511 | ||||||
China Construction Bank Corp., Class H | 4,496,000 | 3,971,407 | ||||||
China Petroleum & Chemical Corp., Class H | 8,992,000 | 6,911,281 | ||||||
China Power International Development Ltd. | 16,017,999 | 4,267,165 | ||||||
Guangzhou R&F Properties Co. Ltd., Class H | 3,821,600 | 7,589,228 | ||||||
Industrial & Commercial Bank of China Ltd., Class H | 5,058,000 | 3,797,336 | ||||||
Seaspan Corp.(a) | 531,371 | 5,388,102 | ||||||
Shenzhen Investment Ltd. | 12,926,000 | 5,140,480 | ||||||
Sinopec Shanghai Petrochemical Co. Ltd., Class H | 13,488,000 | 6,103,245 | ||||||
Zhejiang Expressway Co. Ltd., Class H | 3,372,000 | 3,614,669 | ||||||
|
| |||||||
| 65,940,799 | ||||||||
| Czech Republic — 1.4% | ||||||||
CEZ AS | 196,700 | 4,568,362 | ||||||
Komercni Banka AS | 92,449 | 3,498,428 | ||||||
|
| |||||||
| 8,066,790 | ||||||||
| Greece — 0.7% | ||||||||
OPAP SA | 354,158 | 3,810,289 | ||||||
|
| |||||||
| India — 4.0% | ||||||||
National Aluminium Co. Ltd. | 10,507,433 | 7,825,387 | ||||||
REC Ltd. | 3,641,198 | 7,724,368 | ||||||
Vedanta Ltd. | 3,144,952 | 7,544,313 | ||||||
|
| |||||||
| 23,094,068 | ||||||||
| Indonesia — 1.8% | ||||||||
Indo Tambangraya Megah Tbk PT | 7,671,300 | 10,349,526 | ||||||
|
| |||||||
| Malaysia — 3.1% | ||||||||
Berjaya Sports Toto Bhd | 9,216,813 | 5,862,914 | ||||||
British American Tobacco Malaysia Bhd | 443,400 | 3,738,523 | ||||||
Malayan Banking Bhd | 2,051,300 | 4,589,316 | ||||||
Telekom Malaysia Bhd(a) | 4,636,500 | 3,263,324 | ||||||
|
| |||||||
| 17,454,077 | ||||||||
| Mexico — 1.7% | ||||||||
Banco Santander Mexico SA Institucion de Banca Multiple Grupo Financiero Santand | 3,568,700 | 5,973,191 | ||||||
Nemak SAB de CV(b) | 6,968,800 | 3,791,592 | ||||||
|
| |||||||
| 9,764,783 | ||||||||
| Philippines — 1.6% | ||||||||
Globe Telecom Inc. | 105,375 | 3,599,280 | ||||||
PLDT Inc. | 237,445 | 5,604,363 | ||||||
|
| |||||||
| 9,203,643 | ||||||||
| Poland — 0.9% | ||||||||
Powszechny Zaklad Ubezpieczen SA | 451,848 | 4,957,450 | ||||||
|
| |||||||
| Qatar — 2.5% | ||||||||
Barwa Real Estate Co. | 468,989 | 4,452,086 | ||||||
Doha Bank QPSC | 681,425 | 4,044,121 | ||||||
| Security | Shares | Value | ||||||
| Qatar (continued) | ||||||||
United Development Co. QSC | 1,544,376 | $ | 5,702,077 | |||||
|
| |||||||
| 14,198,284 | ||||||||
| Russia — 14.9% | ||||||||
Alrosa PJSC | 3,543,410 | 5,170,462 | ||||||
Federal Grid Co. Unified Energy System PJSC | 3,033,590,000 | 7,798,009 | ||||||
Magnitogorsk Iron & Steel Works PJSC | 15,904,600 | 10,885,886 | ||||||
MMC Norilsk Nickel PJSC | 35,687 | 7,925,716 | ||||||
Mobile TeleSystems PJSC, ADR | 866,604 | 6,828,840 | ||||||
Moscow ExchangeMICEX-RTS PJSC(c) | 3,392,340 | 4,782,975 | ||||||
Novolipetsk Steel PJSC, GDR | 344,225 | 9,066,887 | ||||||
PhosAgro PJSC, GDR(d) | 293,926 | 3,700,528 | ||||||
Rostelecom PJSC | 2,455,940 | 2,814,286 | ||||||
Severstal PJSC | 798,040 | 12,916,440 | ||||||
Tatneft PJSC | 466,460 | 5,471,619 | ||||||
VTB Bank PJSC | 14,304,080,000 | 7,863,340 | ||||||
|
| |||||||
| 85,224,988 | ||||||||
| Saudi Arabia — 0.0% | ||||||||
Alinma Bank | 15 | 108 | ||||||
Saudi Electricity Co. | 20 | 91 | ||||||
|
| |||||||
| 199 | ||||||||
| South Africa — 8.5% | ||||||||
Astral Foods Ltd. | 866,323 | 10,998,049 | ||||||
Coronation Fund Managers Ltd. | 2,583,795 | 9,215,062 | ||||||
Foschini Group Ltd. (The) | 289,149 | 3,726,440 | ||||||
MTN Group Ltd. | 1,111,074 | 8,011,281 | ||||||
RMB Holdings Ltd. | 633,374 | 3,688,138 | ||||||
Telkom SA SOC Ltd. | 792,139 | 4,685,009 | ||||||
Truworths International Ltd. | 859,298 | 4,530,776 | ||||||
Woolworths Holdings Ltd./South Africa | 1,182,167 | 3,934,166 | ||||||
|
| |||||||
| 48,788,921 | ||||||||
| Taiwan — 21.7% | ||||||||
Asustek Computer Inc. | 742,000 | 5,666,872 | ||||||
AU Optronics Corp. | 27,819,000 | 9,947,896 | ||||||
Casetek Holdings Ltd. | 2,529,660 | 4,224,150 | ||||||
Chong Hong Construction Co. Ltd. | 1,967,000 | 5,537,976 | ||||||
Chunghwa Telecom Co. Ltd. | 1,124,000 | 4,037,539 | ||||||
Far EasTone Telecommunications Co. Ltd. | 1,686,000 | 4,135,750 | ||||||
Farglory Land Development Co. Ltd. | 4,496,263 | 5,551,032 | ||||||
Huaku Development Co. Ltd. | 2,529,000 | 6,400,045 | ||||||
Inventec Corp. | 7,306,475 | 5,863,907 | ||||||
Long Chen Paper Co. Ltd. | 13,769,000 | 8,065,075 | ||||||
Merry Electronics Co. Ltd. | 695,943 | 4,008,862 | ||||||
Mitac Holdings Corp. | 3,934,975 | 4,074,923 | ||||||
Nanya Technology Corp. | 4,496,000 | 9,515,498 | ||||||
Novatek Microelectronics Corp. | 562,000 | 3,664,703 | ||||||
Radiant Opto-Electronics Corp. | 1,405,000 | 4,728,650 | ||||||
Simplo Technology Co. Ltd. | 524,600 | 4,447,921 | ||||||
Sitronix Technology Corp. | 998,000 | 4,101,680 | ||||||
Supreme Electronics Co. Ltd. | 7,587,000 | 7,562,202 | ||||||
Systex Corp. | 2,810,000 | 6,174,525 | ||||||
Taiwan Cement Corp. | 2,248,200 | 3,055,707 | ||||||
Taiwan Mobile Co. Ltd. | 1,087,000 | 3,974,985 | ||||||
Wistron NeWeb Corp. | 1,405,707 | 3,639,253 | ||||||
WPG Holdings Ltd. | 4,215,280 | 5,558,806 | ||||||
|
| |||||||
| 123,937,957 | ||||||||
| Thailand — 7.6% | ||||||||
Advanced Info Service PCL, NVDR(a) | 533,900 | 3,177,478 | ||||||
Glow Energy PCL, NVDR | 1,208,300 | 3,463,099 | ||||||
Jasmine International PCL, NVDR(a) | 42,740,100 | 7,497,089 | ||||||
| S C H E D U L E O F I N V E S T M E N T S | 13 |
Schedule of Investments (continued) April 30, 2019 | iShares® Emerging Markets Dividend ETF (Percentages shown are based on Net Assets) |
| Security | Shares | Value | ||||||
| Thailand (continued) | ||||||||
Kiatnakin Bank PCL, NVDR | 2,585,200 | $ | 5,344,501 | |||||
Land & Houses PCL, NVDR | 17,112,900 | 6,003,586 | ||||||
PTT Global Chemical PCL, NVDR | 2,219,900 | 4,780,521 | ||||||
Sansiri PCL, NVDR(a) | 159,748,566 | 7,155,535 | ||||||
Siam Cement PCL (The), NVDR | 214,700 | 3,107,013 | ||||||
Thai Oil PCL, NVDR | 1,292,600 | 2,803,839 | ||||||
|
| |||||||
| 43,332,661 | ||||||||
| Turkey — 3.9% | ||||||||
Eregli Demir ve Celik Fabrikalari TAS | 7,093,283 | 10,884,408 | ||||||
Tofas Turk Otomobil Fabrikasi AS | 1,653,123 | 4,965,323 | ||||||
Tupras Turkiye Petrol Rafinerileri AS | 310,224 | 6,407,675 | ||||||
|
| |||||||
| 22,257,406 | ||||||||
| United Arab Emirates — 3.6% | ||||||||
DAMAC Properties Dubai Co. PJSC | 22,320,111 | 7,534,932 | ||||||
Dubai Investments PJSC | 21,398,993 | 7,923,072 | ||||||
Dubai Islamic Bank PJSC | 3,693,745 | 5,198,988 | ||||||
|
| |||||||
| 20,656,992 | ||||||||
|
| |||||||
Total Common Stocks — 94.6% |
| 540,460,921 | ||||||
|
| |||||||
Preferred Stocks |
| |||||||
Brazil — 3.3% |
| |||||||
Cia. de Transmissao de Energia Eletrica Paulista, Preference Shares, NVS | 1,461,200 | 7,767,815 | ||||||
Cia. Energetica de Minas Gerais, Preference Shares, NVS | 983,573 | 3,670,067 | ||||||
Telefonica Brasil SA, Preference Shares, NVS | 618,200 | 7,287,946 | ||||||
|
| |||||||
| 18,725,828 | ||||||||
| Russia — 1.2% | ||||||||
Bashneft PJSC, Preference Shares, NVS | 243,376 | 7,139,884 | ||||||
|
| |||||||
Total Preferred Stocks — 4.5% |
| 25,865,712 | ||||||
|
| |||||||
| Security | Shares | Value | ||||||
| Short-Term Investments | ||||||||
Money Market Funds — 1.7% |
| |||||||
BlackRock Cash Funds: Institutional, | 8,843,342 | $ | 8,846,879 | |||||
BlackRock Cash Funds: Treasury, | 647,271 | 647,271 | ||||||
|
| |||||||
| 9,494,150 | ||||||||
|
| |||||||
Total Short-Term Investments — 1.7% |
| 9,494,150 | ||||||
|
| |||||||
Total Investments in Securities — 100.8% |
| 575,820,783 | ||||||
Other Assets, Less Liabilities — (0.8)% |
| (4,386,209 | ) | |||||
|
| |||||||
Net Assets — 100.0% |
| $ | 571,434,574 | |||||
|
| |||||||
| (a) | All or a portion of this security is on loan. |
| (b) | Security exempt from registration pursuant to Rule 144A under the Securities Act of 1933, as amended. These securities may be resold in transactions exempt from registration to qualified institutional investors. |
| (c) | Non-income producing security. |
| (d) | This security may be resold to qualified foreign investors and foreign institutional buyers under Regulation S of the Securities Act of 1933. |
| (e) | Affiliate of the Fund. |
| (f) | Annualized7-day yield as ofperiod-end. |
| (g) | All or a portion of this security was purchased with cash collateral received from loaned securities. |
Affiliates
Investments in issuers considered to be affiliates of the Fund during the year ended April 30, 2019, for purposes of Section 2(a)(3) of the 1940 Act, were as follows:
| Affiliated Issuer | | Shares Held at 04/30/18 | | Net Activity | | Shares Held at 04/30/19 | | | Value at 04/30/19 | | Income | | Net Realized Gain (Loss) | (a) | | Change in Unrealized Appreciation (Depreciation) | | |||||||||||
BlackRock Cash Funds: Institutional, | 10,155,601 | (1,312,259 | ) | 8,843,342 | $ | 8,846,879 | $ | 308,889 | (b) | $ | 3,536 | $ | 2,071 | |||||||||||||||
BlackRock Cash Funds: Treasury, | 504,263 | 143,008 | 647,271 | 647,271 | 27,261 | — | — | |||||||||||||||||||||
|
|
|
|
|
|
|
| |||||||||||||||||||||
| $ | 9,494,150 | $ | 336,150 | $ | 3,536 | $ | 2,071 | |||||||||||||||||||||
|
|
|
|
|
|
|
|
| (a) | Includes realized capital gain distributions from an affiliated fund, if any. |
| (b) | Includes securities lending income earned from the reinvestment of cash collateral from loaned securities (excluding collateral investment fees), net of fees and other payments to and from borrowers of securities, and less fees paid to BTC as securities lending agent. |
| 14 | 2 0 1 9 I S H A R E S A N N U A L R E P O R T T O S H A R E H O L D E R S |
Schedule of Investments (continued) April 30, 2019 | iShares® Emerging Markets Dividend ETF |
Futures Contracts
| Description | Number of Contracts | Expiration Date | Notional Amount (000) | Value/ Unrealized Appreciation (Depreciation) | ||||||||||||
Long Contracts | ||||||||||||||||
MSCI Emerging MarketsE-Mini | 81 | 06/21/19 | $ | 4,375 | $ | 7,021 | ||||||||||
|
| |||||||||||||||
Derivative Financial Instruments Categorized by Risk Exposure
As of April 30, 2019, the fair values of derivative financial instruments located in the Statement of Assets and Liabilities were as follows:
| Equity Contracts | ||||
Assets — Derivative Financial Instruments | ||||
Futures contracts | ||||
Unrealized appreciation on futures contracts(a) | $ | 7,021 | ||
|
| |||
| (a) | Net cumulative appreciation (depreciation) on futures contracts are reported in the Schedule of Investments. In the Statement of Assets and Liabilities, only current day’s variation margin is reported in receivables or payables and the net cumulative unrealized appreciation (depreciation) is included in accumulated earnings (loss). |
For the year ended April 30, 2019, the effect of derivative financial instruments in the Statement of Operations was as follows:
| Equity Contracts | ||||
Net Realized Gain (Loss) from: | ||||
Futures contracts | $ | (250,807 | ) | |
|
| |||
Net Change in Unrealized Appreciation (Depreciation) on: | ||||
Futures contracts | $ | 67,403 | ||
|
| |||
Average Quarterly Balances of Outstanding Derivative Financial Instruments
Futures contracts: | ||||
Average notional value of contracts — long | $ | 3,713,663 |
For more information about the Fund’s investment risks regarding derivative financial instruments, refer to the Notes to Financial Statements.
Fair Value Measurements
Various inputs are used in determining the fair value of financial instruments. For description of the input levels and information about the Fund’s policy regarding valuation of financial instruments, refer to the Notes to Financial Statements.
The following table summarizes the value of the Fund’s investments according to the fair value hierarchy as of April 30, 2019. The breakdown of the Fund’s investments into major categories is disclosed in the Schedule of Investments above.
| Level 1 | Level 2 | Level 3 | Total | |||||||||||||
Investments | ||||||||||||||||
Assets | ||||||||||||||||
Common Stocks | $ | 540,460,921 | $ | — | $ | — | $ | 540,460,921 | ||||||||
Preferred Stocks | 25,865,712 | — | — | 25,865,712 | ||||||||||||
Money Market Funds | 9,494,150 | — | — | 9,494,150 | ||||||||||||
|
|
|
|
|
|
|
| |||||||||
| $ | 575,820,783 | $ | — | $ | — | $ | 575,820,783 | |||||||||
|
|
|
|
|
|
|
| |||||||||
Derivative financial instruments(a) | ||||||||||||||||
Assets | ||||||||||||||||
Futures Contracts | $ | 7,021 | $ | — | $ | — | $ | 7,021 | ||||||||
|
|
|
|
|
|
|
| |||||||||
| (a) | Shown at the unrealized appreciation (depreciation) on the contracts. |
See notes to financial statements.
| S C H E D U L E O F I N V E S T M E N T S | 15 |
Statements of Assets and Liabilities
April 30, 2019
iShares Asia/Pacific | iShares Emerging Markets Dividend ETF | |||||||
ASSETS | ||||||||
Investments in securities, at value (including securities on loan)(a): | ||||||||
Unaffiliated(b) | $ | 32,627,464 | $ | 566,326,633 | ||||
Affiliated(c) | 2,514,923 | 9,494,150 | ||||||
Foreign currency, at value(d) | 55,168 | 731,187 | ||||||
Cash pledged: | ||||||||
Futures contracts | — | 213,000 | ||||||
Receivables: | ||||||||
Securities lending income — Affiliated | 1,548 11,896 | |||||||
Dividends | 139,603 | 3,873,033 | ||||||
|
|
|
| |||||
Total assets | 35,338,706 | 580,649,899 | ||||||
|
|
|
| |||||
LIABILITIES | ||||||||
Collateral on securities loaned, at value | 2,502,906 | 8,838,591 | ||||||
Payables: | ||||||||
Investments purchased | — | 136,710 | ||||||
Variation margin on futures contracts | — | 6,068 | ||||||
Investment advisory fees | 13,209 | 233,956 | ||||||
|
|
|
| |||||
Total liabilities | 2,516,115 | 9,215,325 | ||||||
|
|
|
| |||||
NET ASSETS | $ | 32,822,591 | $ | 571,434,574 | ||||
|
|
|
| |||||
NET ASSETS CONSIST OF: | ||||||||
Paid-in capital | $ | 45,765,088 | $ | 655,584,458 | ||||
Accumulated loss | (12,942,497 | ) | (84,149,884 | ) | ||||
|
|
|
| |||||
NET ASSETS | $ | 32,822,591 | $ | 571,434,574 | ||||
|
|
|
| |||||
Shares outstanding | 750,000 | 14,050,000 | ||||||
|
|
|
| |||||
Net asset value | $ | 43.76 | $ | 40.67 | ||||
|
|
|
| |||||
Shares authorized | 500 million | 500 million | ||||||
|
|
|
| |||||
Par value | $ | 0.001 | $ | 0.001 | ||||
|
|
|
| |||||
(a) Securities loaned, at value | $ | 2,377,644 | $ | 8,455,186 | ||||
(b) Investments, at cost — Unaffiliated | $ | 35,989,689 | $ | 561,619,295 | ||||
(c) Investments, at cost — Affiliated | $ | 2,514,564 | $ | 9,492,024 | ||||
(d) Foreign currency, at cost | $ | 55,624 | $ | 734,405 | ||||
See notes to financial statements.
| 16 | 2 0 1 9 I S H A R E S A N N U A L R E P O R T T O S H A R E H O L D E R S |
Year Ended April 30, 2019
| iShares Asia/Pacific Dividend ETF | iShares Emerging Markets | |||||||
INVESTMENT INCOME | ||||||||
Dividends — Unaffiliated | $ | 2,158,535 | $ | 34,376,101 | ||||
Dividends — Affiliated | 653 | 27,261 | ||||||
Interest — Unaffiliated | — | 2,037 | ||||||
Securities lending income — Affiliated — net | 6,363 | 308,889 | ||||||
Foreign taxes withheld | (74,897 | ) | (3,676,233 | ) | ||||
Other foreign taxes | — | (65,505 | ) | |||||
|
|
|
| |||||
Total investment income | 2,090,654 | 30,972,550 | ||||||
|
|
|
| |||||
EXPENSES | ||||||||
Investment advisory fees | 166,912 | 2,418,231 | ||||||
Commitment fees | — | 92 | ||||||
|
|
|
| |||||
Total expenses | 166,912 | 2,418,323 | ||||||
|
|
|
| |||||
Net investment income | 1,923,742 | 28,554,227 | ||||||
|
|
|
| |||||
REALIZED AND UNREALIZED GAIN (LOSS) | ||||||||
Net realized gain (loss) from: | ||||||||
Investments — Unaffiliated | (2,458,722 | ) | (13,972,910 | ) | ||||
Investments — Affiliated | 208 | 3,536 | ||||||
In-kind redemptions — Unaffiliated | 88,040 | 8,256,191 | ||||||
Futures contracts | — | (250,807 | ) | |||||
Foreign currency transactions | (11,314 | ) | (445,561 | ) | ||||
|
|
|
| |||||
Net realized loss | (2,381,788 | ) | (6,409,551 | ) | ||||
|
|
|
| |||||
Net change in unrealized appreciation (depreciation) on: | ||||||||
Investments — Unaffiliated | 30,250 | (2,288,757 | ) | |||||
Investments — Affiliated | 324 | 2,071 | ||||||
Futures contracts | — | 67,403 | ||||||
Foreign currency translations | 533 | 100,871 | ||||||
|
|
|
| |||||
Net change in unrealized appreciation (depreciation) | 31,107 | (2,118,412 | ) | |||||
|
|
|
| |||||
Net realized and unrealized loss | (2,350,681 | ) | (8,527,963 | ) | ||||
|
|
|
| |||||
NET INCREASE (DECREASE) IN NET ASSETS RESULTING FROM OPERATIONS | $ | (426,939 | ) | $ | 20,026,264 | |||
|
|
|
| |||||
See notes to financial statements.
| F I N A N C I A L S T A T E M E N T S | 17 |
Statements of Changes in Net Assets
| iShares Asia/Pacific Dividend ETF | iShares Emerging Markets Dividend ETF | |||||||||||||||||||
| Year Ended 04/30/19 | Year Ended 04/30/18 | Year Ended 04/30/19 | Year Ended 04/30/18 | |||||||||||||||||
INCREASE (DECREASE) IN NET ASSETS | ||||||||||||||||||||
OPERATIONS | ||||||||||||||||||||
Net investment income | $ | 1,923,742 | $ | 1,993,593 | $ | 28,554,227 | $ | 16,981,682 | ||||||||||||
Net realized gain (loss) | (2,381,788 | ) | 847,097 | (6,409,551 | ) | 22,099,295 | ||||||||||||||
Net change in unrealized appreciation (depreciation) | 31,107 | (1,916,961 | ) | (2,118,412 | ) | (8,308,966 | ) | |||||||||||||
|
|
|
|
|
|
|
| |||||||||||||
Net increase (decrease) in net assets resulting from operations | (426,939 | ) | 923,729 | 20,026,264 | 30,772,011 | |||||||||||||||
|
|
|
|
|
|
|
| |||||||||||||
DISTRIBUTIONS TO SHAREHOLDERS(a)(b) | ||||||||||||||||||||
Decrease in net assets resulting from distributions to shareholders | (2,001,628 | ) | (2,084,792 | ) | (25,266,684 | ) | (17,865,271 | ) | ||||||||||||
|
|
|
|
|
|
|
| |||||||||||||
CAPITAL SHARE TRANSACTIONS | ||||||||||||||||||||
Net increase (decrease) in net assets derived from capital share transactions | (4,551,969 | ) | (4,766,094 | ) | 119,858,257 | 144,977,823 | ||||||||||||||
|
|
|
|
|
|
|
| |||||||||||||
NET ASSETS(b) | ||||||||||||||||||||
Total increase (decrease) in net assets | (6,980,536 | ) | (5,927,157 | ) | 114,617,837 | 157,884,563 | ||||||||||||||
Beginning of year | 39,803,127 | 45,730,284 | 456,816,737 | 298,932,174 | ||||||||||||||||
|
|
|
|
|
|
|
| |||||||||||||
End of year | $ | 32,822,591 | $ | 39,803,127 | $ | 571,434,574 | $ | 456,816,737 | ||||||||||||
|
|
|
|
|
|
|
| |||||||||||||
| (a) | Distributions for annual periods determined in accordance with U.S. federal income tax regulations. |
| (b) | Prior year distribution character information and distributions in excess of net investment income has been modified or removed to conform with current year RegulationS-X presentation changes. Refer to Note 13 for this prior year information. |
See notes to financial statements.
| 18 | 2 0 1 9 I S H A R E S A N N U A L R E P O R T T O S H A R E H O L D E R S |
(For a share outstanding throughout each period)
| iShares Asia/Pacific Dividend ETF | ||||||||||||||||||||
| Year Ended 04/30/19 | Year Ended 04/30/18 | Year Ended 04/30/17 | Year Ended 04/30/16 | Year Ended 04/30/15 | ||||||||||||||||
| ||||||||||||||||||||
Net asset value, beginning of year | $ | 46.83 | $ | 48.14 | $ | 43.26 | $ | 50.11 | $ | 57.27 | ||||||||||
|
|
|
|
|
|
|
|
|
| |||||||||||
Net investment income(a) | 2.49 | 2.30 | 2.46 | 2.13 | 2.38 | |||||||||||||||
Net realized and unrealized gain (loss)(b) | (2.96 | ) | (1.21 | ) | 4.38 | (6.69 | ) | (6.85 | ) | |||||||||||
|
|
|
|
|
|
|
|
|
| |||||||||||
Net increase (decrease) from investment operations | (0.47 | ) | 1.09 | 6.84 | (4.56 | ) | (4.47 | ) | ||||||||||||
|
|
|
|
|
|
|
|
|
| |||||||||||
Distributions(c) | ||||||||||||||||||||
From net investment income | (2.60 | ) | (2.40 | ) | (1.96 | ) | (2.23 | ) | (2.69 | ) | ||||||||||
Return of capital | — | — | — | (0.06 | ) | — | ||||||||||||||
|
|
|
|
|
|
|
|
|
| |||||||||||
Total distributions | (2.60 | ) | (2.40 | ) | (1.96 | ) | (2.29 | ) | (2.69 | ) | ||||||||||
|
|
|
|
|
|
|
|
|
| |||||||||||
Net asset value, end of year | $ | 43.76 | $ | 46.83 | $ | 48.14 | $ | 43.26 | $ | 50.11 | ||||||||||
|
|
|
|
|
|
|
|
|
| |||||||||||
Total Return | ||||||||||||||||||||
Based on net asset value | (0.83 | )% | 2.19 | % | 16.13 | % | (8.74 | )% | (8.04 | )% | ||||||||||
|
|
|
|
|
|
|
|
|
| |||||||||||
Ratios to Average Net Assets | ||||||||||||||||||||
Total expenses | 0.49 | % | 0.49 | % | 0.49 | % | 0.49 | % | 0.49 | % | ||||||||||
|
|
|
|
|
|
|
|
|
| |||||||||||
Net investment income | 5.65 | % | 4.72 | % | 5.38 | % | 5.03 | % | 4.47 | % | ||||||||||
|
|
|
|
|
|
|
|
|
| |||||||||||
Supplemental Data | ||||||||||||||||||||
Net assets, end of year (000) | $ | 32,823 | $ | 39,803 | $ | 45,730 | $ | 56,243 | $ | 55,120 | ||||||||||
|
|
|
|
|
|
|
|
|
| |||||||||||
Portfolio turnover rate(d) | 46 | % | 21 | % | 37 | % | 32 | % | 40 | % | ||||||||||
|
|
|
|
|
|
|
|
|
| |||||||||||
| (a) | Based on average shares outstanding. |
| (b) | The amounts reported for a share outstanding may not accord with the change in aggregate gains and losses in securities for the fiscal period due to the timing of capital share transactions in relation to the fluctuating market values of the Fund’s underlying securities. |
| (c) | Distributions for annual periods determined in accordance with U.S. federal income tax regulations. |
| (d) | Portfolio turnover rate excludesin-kind transactions. |
See notes to financial statements.
| F I N A N C I A L H I G H L I G H T S | 19 |
Financial Highlights (continued)
(For a share outstanding throughout each period)
| iShares Emerging Markets Dividend ETF | ||||||||||||||||||||
| Year Ended 04/30/19 | Year Ended 04/30/18 | Year Ended 04/30/17 | Year Ended 04/30/16 | Year Ended 04/30/15 | ||||||||||||||||
| ||||||||||||||||||||
Net asset value, beginning of year | $ | 41.91 | $ | 39.86 | $ | 33.87 | $ | 45.99 | $ | 48.33 | ||||||||||
|
|
|
|
|
|
|
|
|
| |||||||||||
Net investment income(a) | 2.31 | 1.86 | 1.52 | 1.83 | 2.00 | |||||||||||||||
Net realized and unrealized gain (loss)(b) | (1.33 | ) | 2.24 | 6.06 | (12.13 | ) | (2.45 | ) | ||||||||||||
|
|
|
|
|
|
|
|
|
| |||||||||||
Net increase (decrease) from investment operations | 0.98 | 4.10 | 7.58 | (10.30 | ) | (0.45 | ) | |||||||||||||
|
|
|
|
|
|
|
|
|
| |||||||||||
Distributions(c) | ||||||||||||||||||||
From net investment income | (2.22 | ) | (2.05 | ) | (1.59 | ) | (1.76 | ) | (1.89 | ) | ||||||||||
Return of capital | — | — | — | (0.06 | ) | — | ||||||||||||||
|
|
|
|
|
|
|
|
|
| |||||||||||
Total distributions | (2.22 | ) | (2.05 | ) | (1.59 | ) | (1.82 | ) | (1.89 | ) | ||||||||||
|
|
|
|
|
|
|
|
|
| |||||||||||
Net asset value, end of year | $ | 40.67 | $ | 41.91 | $ | 39.86 | $ | 33.87 | $ | 45.99 | ||||||||||
|
|
|
|
|
|
|
|
|
| |||||||||||
Total Return | ||||||||||||||||||||
Based on net asset value | 2.68 | % | 10.50 | % | 23.22 | % | (22.45 | )% | (0.91 | )% | ||||||||||
|
|
|
|
|
|
|
|
|
| |||||||||||
Ratios to Average Net Assets | ||||||||||||||||||||
Total expenses | 0.49 | % | 0.49 | % | 0.52 | % | 0.68 | % | 0.68 | % | ||||||||||
|
|
|
|
|
|
|
|
|
| |||||||||||
Total expenses after fees waived | 0.49 | % | 0.49 | % | 0.49 | % | 0.49 | % | 0.49 | % | ||||||||||
|
|
|
|
|
|
|
|
|
| |||||||||||
Net investment income | 5.79 | % | 4.42 | % | 4.23 | % | 5.31 | % | 4.42 | % | ||||||||||
|
|
|
|
|
|
|
|
|
| |||||||||||
Supplemental Data | ||||||||||||||||||||
Net assets, end of year (000) | $ | 571,435 | $ | 456,817 | $ | 298,932 | $ | 152,410 | $ | 211,562 | ||||||||||
|
|
|
|
|
|
|
|
|
| |||||||||||
Portfolio turnover rate(d) | 69 | % | 55 | % | 68 | % | 67 | % | 59 | % | ||||||||||
|
|
|
|
|
|
|
|
|
| |||||||||||
| (a) | Based on average shares outstanding. |
| (b) | The amounts reported for a share outstanding may not accord with the change in aggregate gains and losses in securities for the fiscal period due to the timing of capital share transactions in relation to the fluctuating market values of the Fund’s underlying securities. |
| (c) | Distributions for annual periods determined in accordance with U.S. federal income tax regulations. |
| (d) | Portfolio turnover rate excludesin-kind transactions. |
See notes to financial statements.
| 20 | 2 0 1 9 I S H A R E S A N N U A L R E P O R T T O S H A R E H O L D E R S |
| 1. | ORGANIZATION |
iShares, Inc. (the “Company”) is registered under the Investment Company Act of 1940, as amended (the “1940 Act”), as anopen-end management investment company. The Company is organized as a Maryland corporation and is authorized to have multiple series or portfolios.
These financial statements relate only to the following funds (each, a “Fund,” and collectively, the “Funds”):
| iShares ETF | Diversification Classification | |||
Asia/Pacific Dividend | Diversified | (a) | ||
Emerging Markets Dividend | Diversified | |||
| (a) | The Fund’s classification changed fromnon-diversified to diversified during the reporting period. |
| 2. | SIGNIFICANT ACCOUNTING POLICIES |
The following significant accounting policies are consistently followed by each Fund in the preparation of its financial statements in conformity with accounting principles generally accepted in the United States of America (“U.S. GAAP”). The preparation of financial statements in conformity with U.S. GAAP requires management to make certain estimates and assumptions that affect the reported amounts of assets and liabilities and disclosures of contingent assets and liabilities at the date of the financial statements and the reported amounts of increases and decreases in net assets from operations during the reporting period. Actual results could differ from those estimates. Each Fund is considered an investment company under U.S. GAAP and follows the accounting and reporting guidance applicable to investment companies.
Investment Transactions and Income Recognition:Investment transactions are accounted for on trade date. Realized gains and losses on investment transactions are determined using the specific identification method. Dividend income and capital gain distributions, if any, are recognized on theex-dividend date, net of any foreign taxes withheld at source. Any taxes withheld that are reclaimable from foreign tax authorities are reflected in tax reclaims receivable. Distributions received by the Funds may include a return of capital that is estimated by management. Such amounts are recorded as a reduction of the cost of investments or reclassified to capital gains. Upon notification from issuers, some of the dividend income received from a real estate investment trust may bere-designated as a return of capital or capital gain.Non-cash dividends, if any, are recognized on theex-dividend date and recorded asnon-cash dividend income at fair value. Interest income is accrued daily.
Foreign Currency Translation:The accounting records of the Funds are maintained in U.S. dollars. Foreign currencies, as well as investment securities and other assets and liabilities denominated innon-U.S. currencies are translated to U.S. dollars using prevailing market rates as quoted by one or more data service providers. Purchases and sales of investments, income receipts and expense payments are translated into U.S. dollars on the respective dates of such transactions.
Each Fund does not isolate the effect of fluctuations in foreign exchange rates from the effect of fluctuations in the market prices of investments. Such fluctuations are reflected by the Funds as a component of net realized and unrealized gain (loss) from investments for financial reporting purposes. Each Fund reports realized currency gain (loss) on foreign currency related transactions as components of net realized gain (loss) for financial reporting purposes, whereas such components are generally treated as ordinary income for U.S. federal income tax purposes.
Foreign Taxes:The Funds may be subject to foreign taxes (a portion of which may be reclaimable) on income, stock dividends, capital gains on investments, or certain foreign currency transactions. All foreign taxes are recorded in accordance with the applicable foreign tax regulations and rates that exist in the foreign jurisdictions in which each Fund invests. These foreign taxes, if any, are paid by each Fund and are reflected in its statement of operations as follows: foreign taxes withheld at source are presented as a reduction of income, foreign taxes on securities lending income are presented as a reduction of securities lending income, foreign taxes on stock dividends are presented as “other foreign taxes”, and foreign taxes on capital gains from sales of investments and foreign taxes on foreign currency transactions are included in their respective net realized gain (loss) categories. Foreign taxes payable or deferred as of April 30, 2019, if any, are disclosed in the statement of assets and liabilities.
In-kind Redemptions:For financial reporting purposes,in-kind redemptions are treated as sales of securities resulting in realized capital gains or losses to the Funds. Because such gains or losses are not taxable to the Funds and are not distributed to existing Fund shareholders, the gains or losses are reclassified from accumulated net realized gain (loss) topaid-in capital at the end of the Funds’ tax year. These reclassifications have no effect on net assets or net asset value per share.
Distributions:Dividends and distributions paid by each Fund are recorded on theex-dividend dates. Distributions are determined on a tax basis and may differ from net investment income and net realized capital gains for financial reporting purposes. Dividends and distributions are paid in U.S. dollars and cannot be automatically reinvested in additional shares of the Funds.
Indemnifications:In the normal course of business, each Fund enters into contracts that contain a variety of representations that provide general indemnification. The Funds’ maximum exposure under these arrangements is unknown because it involves future potential claims against the Funds, which cannot be predicted with any certainty.
| 3. | INVESTMENT VALUATION AND FAIR VALUE MEASUREMENTS |
Investment Valuation Policies:Each Fund’s investments are valued at fair value (also referred to as “market value” within the financial statements) each day that the Fund’s listing exchange is open and, for financial reporting purposes, as of the report date should the reporting period end on a day that the Fund’s listing exchange is not open. U.S. GAAP defines fair value as the price a fund would receive to sell an asset or pay to transfer a liability in an orderly transaction between market participants at
| N O T E S T O F I N A N C I A L S T A T E M E N T S | 21 |
Notes to Financial Statements (continued)
the measurement date. A fund determines the fair value of its financial instruments using various independent dealers or pricing services under policies approved by the Board of Directors of the Company (the “Board”). The BlackRock Global Valuation Methodologies Committee (the “Global Valuation Committee”) is the committee formed by management to develop global pricing policies and procedures and to oversee the pricing function for all financial instruments.
Fair Value Inputs and Methodologies:The following methods and inputs are used to establish the fair value of each Fund’s assets and liabilities:
| • | Equity investments traded on a recognized securities exchange are valued at that day’s last traded price or official closing price, as applicable, on the exchange where the stock is primarily traded. Equity investments traded on a recognized exchange for which there were no sales on that day are valued at the last traded price. |
| • | Investments inopen-end U.S. mutual funds (including money market funds) are valued at that day’s published net asset value (“NAV”). |
| • | Futures contract notional values are determined based on that day’s last reported settlement price on the exchange where the contract is traded. |
If events (e.g., a company announcement, market volatility or a natural disaster) occur that are expected to materially affect the value of an investment, or in the event that application of these methods of valuation results in a price for an investment that is deemed not to be representative of the market value of such investment, or if a price is not available, the investment will be valued by the Global Valuation Committee, in accordance with policies approved by the Board as reflecting fair value (“Fair Valued Investments”). The fair valuation approaches that may be used by the Global Valuation Committee include market approach, income approach and the cost approach. Valuation techniques used under these approaches take into consideration inputs that include but are not limited to (i) attributes specific to the investment; (ii) the principal market for the investment; (iii) the customary participants in the principal market for the investment; (iv) data assumptions by market participants for the investment, if reasonably available; (v) quoted prices for similar investments in active markets; and (vi) other inputs, such as future cash flows, interest rates, yield curves, volatilities, prepayment speeds, loss severities, credit risks and/or default rates.
Fair value pricing could result in a difference between the prices used to calculate a fund’s NAV and the prices used by the fund’s underlying index, which in turn could result in a difference between the fund’s performance and the performance of the fund’s underlying index.
Fair Value Hierarchy:Various inputs are used in determining the fair value of financial instruments. These inputs to valuation techniques are categorized into a fair value hierarchy consisting of three broad levels for financial reporting purposes as follows:
| • | Level 1 — Unadjusted price quotations in active markets for identical assets or liabilities; |
| • | Level 2 — Inputs other than quoted prices included within Level 1 that are observable for the asset or liability either directly or indirectly, including, but not limited to, quoted prices for similar assets or liabilities in markets that are active, quoted prices for identical or similar assets or liabilities in markets that are not considered to be active, inputs other than quoted prices that are observable for the asset or liability (such as interest rates, yield curves, volatilities, prepayment speeds, loss severities, credit risks and default rates) or other market-corroborated inputs; and |
| • | Level 3 — Unobservable inputs based on the best information available in the circumstances, to the extent observable inputs are not available, (including the Global Valuation Committee’s assumptions used in determining the fair value of financial instruments). |
The hierarchy gives the highest priority to unadjusted quoted prices in active markets for identical assets or liabilities (Level 1 measurements) and the lowest priority to unobservable inputs (Level 3 measurements). Accordingly, the degree of judgement exercised in determining fair value is greatest for instruments categorized in Level 3. The inputs used to measure fair value may fall into different levels of the fair value hierarchy. In such cases, for disclosure purposes, the fair value hierarchy classification is determined based on the lowest level input that is significant to the fair value measurement in its entirety. The fair value hierarchy for each Fund’s investments is included in its schedule of investments. The categorization of a value determined for financial instruments is based on the pricing transparency of the financial instruments and is not necessarily an indication of the risks associated with investing in those securities.
| 4. | SECURITIES AND OTHER INVESTMENTS |
Securities Lending:Each Fund may lend its securities to approved borrowers, such as brokers, dealers and other financial institutions. The borrower pledges and maintains with the Fund collateral consisting of cash, an irrevocable letter of credit issued by an approved bank, or securities issued or guaranteed by the U.S. government. The initial collateral received by each Fund is required to have a value of at least 102% of the current market value of the loaned securities for securities traded on U.S. exchanges and a value of at least 105% for all other securities. The collateral is maintained thereafter at a value equal to at least 100% of the current value of the securities on loan. The market value of the loaned securities is determined at the close of each business day of the Fund and any additional required collateral is delivered to the Fund or excess collateral is returned by the Fund, on the next business day. During the term of the loan, each Fund is entitled to all distributions made on or in respect of the loaned securities but does not receive interest income on securities received as collateral. Loans of securities are terminable at any time and the borrower, after notice, is required to return borrowed securities within the standard time period for settlement of securities transactions.
As of April 30, 2019, any securities on loan were collateralized by cash and/or U.S. government obligations. Cash collateral received was invested in money market funds managed by BlackRock Fund Advisors (“BFA”), the Funds’ investment adviser, or its affiliates and is disclosed in the schedules of investments. Anynon-cash collateral received cannot be sold,re-invested or pledged by the Fund, except in the event of borrower default. The securities on loan for each Fund, if any, are also disclosed in its schedule of investments. The market value of any securities on loan as of April 30, 2019 and the value of the related cash collateral are disclosed in the statements of assets and liabilities.
Securities lending transactions are entered into by a fund under Master Securities Lending Agreements (each, an “MSLA”) which provide the right, in the event of default (including bankruptcy or insolvency) for thenon-defaulting party to liquidate the collateral and calculate a net exposure to the defaulting party or request additional collateral. In the event that a borrower defaults, the fund, as lender, would offset the market value of the collateral received against the market value of the securities loaned. The value of the collateral is typically greater than the market value of the securities loaned, leaving the lender with a net amount payable to the defaulting party. However, bankruptcy or insolvency laws of a particular jurisdiction may impose restrictions on or prohibitions against such a right of offset in the event of an MSLA counterparty’s bankruptcy or
| 22 | 2 0 1 9 I S H A R E S A N N U A L R E P O R T T O S H A R E H O L D E R S |
Notes to Financial Statements (continued)
insolvency. Under the MSLA, absent an event of default, the borrower can resell orre-pledge the loaned securities, and the fund can reinvest cash collateral received in connection with loaned securities.
The following table is a summary of the securities lending agreements by counterparty which are subject to offset under an MSLA as of April 30, 2019:
iShares ETF and Counterparty | | Market Value of Securities on Loan | | | Cash Collateral Received | (a) | | Non-Cash Collateral Received | | Net Amount | ||||||
Asia/Pacific Dividend | ||||||||||||||||
Citigroup Global Markets Inc. | $ | 68,322 | $ | 68,322 | $ | — | $ | — | ||||||||
Goldman Sachs & Co. | 2,309,322 | 2,309,322 | — | — | ||||||||||||
|
|
|
|
|
|
|
| |||||||||
| $ | 2,377,644 | $ | 2,377,644 | $ | — | $ | — | |||||||||
|
|
|
|
|
|
|
| |||||||||
Emerging Markets Dividend | ||||||||||||||||
Barclays Capital Inc. | $ | 430,003 | $ | 430,003 | $ | — | $ | — | ||||||||
Credit Suisse Securities (USA) LLC | 147,279 | 147,279 | — | — | ||||||||||||
Goldman Sachs & Co. | 2,483,410 | 2,483,410 | — | — | ||||||||||||
JPMorgan Securities LLC | 3,331,365 | 3,331,365 | — | — | ||||||||||||
JPMorgan Securities PLC | 100,085 | 100,085 | — | — | ||||||||||||
Macquarie Bank Limited. | 51,309 | 51,309 | — | — | ||||||||||||
Morgan Stanley & Co. LLC (U.S. Equity Securities Lending) | 1,911,735 | 1,911,735 | — | — | ||||||||||||
|
|
|
|
|
|
|
| |||||||||
| $ | 8,455,186 | $ | 8,455,186 | $ | — | $ | — | |||||||||
|
|
|
|
|
|
|
|
| (a) | Collateral received in excess of the market value of securities on loan is not presented in this table. The total cash collateral received by each Fund is disclosed in the Fund’s statement of assets and liabilities. |
The risks of securities lending include the risk that the borrower may not provide additional collateral when required or may not return the securities when due. To mitigate these risks, each Fund benefits from a borrower default indemnity provided by BlackRock, Inc. (“BlackRock”). BlackRock’s indemnity allows for full replacement of the securities loaned if the collateral received does not cover the value of the securities loaned in the event of borrower default. Each Fund could incur a loss if the value of an investment purchased with cash collateral falls below the market value of the loaned securities or if the value of an investment purchased with cash collateral falls below the value of the original cash collateral received. Such losses are borne entirely by each Fund.
| 5. | DERIVATIVE FINANCIAL INSTRUMENTS |
Futures Contracts:Each Fund’s use of futures contracts is generally limited to cash equitization. This involves the use of available cash to invest in index futures contracts in order to gain exposure to the equity markets represented in or by the Fund’s underlying index and is intended to allow the Fund to better track its underlying index. Futures contracts are standardized, exchange-traded agreements to buy or sell a specific quantity of an underlying instrument at a set price on a future date. Depending on the terms of a contract, a futures contract is settled either through physical delivery of the underlying instrument on the settlement date or by payment of a cash amount on the settlement date.
Upon entering into a futures contract, a fund is required to pledge to the executing broker which holds segregated from its own assets, an amount of cash, U.S. government securities or other high-quality debt and equity securities equal to the minimum initial margin requirements of the exchange on which the contract is traded. Securities deposited as initial margin, if any, are designated in the schedule of investments and cash deposited, if any, is shown as cash pledged for futures contracts in the statement of assets and liabilities.
Pursuant to the contract, a fund agrees to receive from or pay to the broker an amount of cash equal to the daily fluctuation in market value of the contract (“variation margin”). Variation margin is recorded as unrealized appreciation or depreciation and, if any, shown as variation margin receivable or payable on futures contracts in the statement of assets and liabilities. When the contract is closed, a realized gain or loss is recorded in the statement of operations equal to the difference between the notional amount of the contract at the time it was opened and the notional amount at the time it was closed. Losses may arise if the notional value of a futures contract decreases due to an unfavorable change in the market rates or values of the underlying instrument during the term of the contract or if the counterparty does not perform under the contract. The use of futures contracts involves the risk of an imperfect correlation in the movements in the price of futures contracts and the assets underlying such contracts.
| 6. | INVESTMENT ADVISORY AGREEMENT AND OTHER TRANSACTIONS WITH AFFILIATES |
Investment Advisory Fees:Pursuant to an Investment Advisory Agreement with the Company, BFA manages the investment of each Fund’s assets. BFA is a California corporation indirectly owned by BlackRock. Under the Investment Advisory Agreement, BFA is responsible for substantially all expenses of the Funds, except (i) interest and taxes; (ii) brokerage commissions and other expenses connected with the execution of portfolio transactions; (iii) distribution fees; (iv) the advisory fee payable to BFA; and (v) litigation expenses and any extraordinary expenses (in each case as determined by a majority of the independent directors).
| N O T E S T O F I N A N C I A L S T A T E M E N T S | 23 |
Notes to Financial Statements (continued)
For its investment advisory services to each Fund, BFA is entitled to an annual investment advisory fee, accrued daily and paid monthly by the Funds, based on the average daily net assets of each Fund as follows:
| iShares ETF | Investment Advisory Fee | |||
Asia/Pacific Dividend | 0.49 | % | ||
Emerging Markets Dividend | 0.49 | |||
Expense Waivers:A fund may incur its pro rata share of fees and expenses attributable to its investments in other investment companies (“acquired fund fees and expenses). For the iShares Emerging Markets Dividend ETF, BFA has contractually agreed to waive a portion of its investment advisory fee for the Fund through August 31, 2022 in an amount equal to the acquired fund fees and expenses, if any, attributable to the Fund’s investments in other iShares funds.
Distributor:BlackRock Investments, LLC, an affiliate of BFA, is the distributor for each Fund. Pursuant to the distribution agreement, BFA is responsible for any fees or expenses for distribution services provided to the Funds.
Securities Lending:The U.S. Securities and Exchange Commission (the “SEC”) has issued an exemptive order which permits BlackRock Institutional Trust Company, N.A. (“BTC”), an affiliate of BFA, to serve as securities lending agent for the Funds, subject to applicable conditions. As securities lending agent, BTC bears all operational costs directly related to securities lending. Each Fund is responsible for fees in connection with the investment of cash collateral received for securities on loan in a money market fund managed by BFA, or its affiliates, however, BTC has agreed to reduce the amount of securities lending income it receives in order to effectively limit the collateral investment fees each Fund bears to an annual rate of 0.04% (the “collateral investment fees”). Securities lending income is equal to the total of income earned from the reinvestment of cash collateral (excluding collateral investment fees), net of fees and other payments to and from borrowers of securities. Each Fund retains a portion of securities lending income and remits the remaining portion to BTC as compensation for its services as securities lending agent.
Pursuant to the current securities lending agreement, each Fund retains 82% of securities lending income (which excludes collateral investment fees) and the amount retained can never be less than 70% of the total of securities lending income plus the collateral investment fees. Prior to January 1, 2019, the Fund retained 80% of securities lending income (which excludes collateral investment fees) and the amount retained was not less than 70% of the total of securities lending income plus the collateral investment fees.
In addition, commencing the business day following the date that the aggregate securities lending income plus the collateral investment fees generated across all 1940 Act iShares exchange-traded funds (the “iShares ETF Complex”) in a given calendar year exceeds a specified threshold, each Fund, pursuant to the securities lending agreement, will retain for the remainder of that calendar year 85% of securities lending income and the amount retained can never be less than 70% of the total of securities lending income plus the collateral investment fees. Prior to January 1, 2019, the Fund was subject to the same terms under the previous securities lending fee arrangement.
The share of securities lending income earned by each Fund is shown as securities lending income — affiliated — net in its statement of operations. For the year ended April 30, 2019, the Funds paid BTC the following amounts for securities lending agent services:
| iShares ETF | Fees Paid to BTC | |||
Asia/Pacific Dividend | $ | 1,735 | ||
Emerging Markets Dividend | 67,956 | |||
Officers and Directors:Certain officers and/or directors of the Company are officers and/or directors of BlackRock or its affiliates.
Cross trading is the buying or selling of portfolio securities between funds to which BFA (or an affiliate) serves as investment adviser. At its regularly scheduled quarterly meetings, the Board reviews such transactions as of the most recent calendar quarter for compliance with the requirements and restrictions set forth by Rule17a-7.
For the year ended April 30, 2019, transactions executed by the Funds pursuant to Rule17a-7 under the 1940 Act were as follows:
| iShares ETF | Purchases | Sales | ||||||
Asia/Pacific Dividend | $ | — | $ | 2,507,524 | ||||
Emerging Markets Dividend | 1,565,014 | 123,731 | ||||||
Each Fund may invest its positive cash balances in certain money market funds managed by BFA or an affiliate. The income earned on these temporary cash investments is shown as dividends — affiliated in the statement of operations.
A fund, in order to improve its portfolio liquidity and its ability to track its underlying index, may invest in shares of other iShares funds that invest in securities in the fund’s underlying index.
| 24 | 2 0 1 9 I S H A R E S A N N U A L R E P O R T T O S H A R E H O L D E R S |
Notes to Financial Statements (continued)
| 7. | PURCHASES AND SALES |
For the year ended April 30, 2019, purchases and sales of investments, excludingin-kind transactions and short-term investments, were as follows:
| iShares ETF | Purchases | Sales | ||||||
Asia/Pacific Dividend | $ | 15,825,904 | $ | 15,970,499 | ||||
Emerging Markets Dividend | 417,243,423 | 341,033,602 | ||||||
For the year ended April 30, 2019,in-kind transactions were as follows:
| iShares ETF | In-kind Purchases | In-kind Sales | ||||||
Asia/Pacific Dividend | $ | — | $ | 4,535,441 | ||||
Emerging Markets Dividend | 109,640,597 | 66,246,589 | ||||||
| 8. | INCOME TAX INFORMATION |
Each Fund is treated as an entity separate from the Company’s other funds for federal income tax purposes. It is the policy of each Fund to qualify as a regulated investment company by complying with the provisions applicable to regulated investment companies, as defined under Subchapter M of the Internal Revenue Code of 1986, as amended, and to annually distribute substantially all of its ordinary income and any net capital gains (taking into account any capital loss carryforwards) sufficient to relieve it from all, or substantially all, federal income and excise taxes. Accordingly, no provision for federal income taxes is required.
Management has analyzed tax laws and regulations and their application to the Funds as of April 30, 2019, inclusive of the open tax return years, and does not believe that there are any uncertain tax positions that require recognition of a tax liability in the Funds’ financial statements.
U.S. GAAP requires that certain components of net assets be adjusted to reflect permanent differences between financial and tax reporting. These reclassifications have no effect on net assets or NAV per share. As of April 30, 2019, the following permanent differences attributable to realized gains (losses) fromin-kind redemptions, were reclassified to the following accounts:
| iShares ETF | Paid-in Capital | Accumulated Loss | ||||||
Asia/Pacific Dividend | $ | (149,804) | $ | 149,804 | ||||
Emerging Markets Dividend | 6,560,745 | (6,560,745 | ) | |||||
The tax character of distributions paid was as follows:
| iShares ETF | Year Ended 04/30/19 | Year Ended 04/30/18 | ||||||
Asia/Pacific Dividend | ||||||||
Ordinary income | $ | 2,001,628 | $ | 2,084,792 | ||||
|
|
|
| |||||
Emerging Markets Dividend | ||||||||
Ordinary income | $ | 25,266,684 | $ | 17,865,271 | ||||
|
|
|
| |||||
As of April 30, 2019, the tax components of accumulated net earnings (losses) were as follows:
iShares ETF | | Undistributed Ordinary Income | | Non-expiring Capital Loss Carryforwards | (a) | | Net Unrealized Gains (Losses) | (b) | Total | |||||||
Asia/Pacific Dividend | $ | 68,159 | $ | (9,021,924 | ) | $ | (3,988,732 | ) | $ | (12,942,497 | ) | |||||
Emerging Markets Dividend | 6,984,622 | (79,179,629 | ) | (11,954,877 | ) | (84,149,884 | ) |
| (a) | Amounts available to offset future realized capital gains. |
| (b) | The difference between book-basis andtax-basis unrealized gains (losses) was attributable primarily to the tax deferral of losses on wash sales, the realization for tax purposes of unrealized gains (losses) on certain futures contracts and the realization for tax purposes of unrealized gains on investments in passive foreign investment companies. |
A fund may own shares in certain foreign investment entities, referred to, under U.S. tax law, as “passive foreign investment companies.” Such fund may elect tomark-to-market annually the shares of each passive foreign investment company and would be required to distribute to shareholders any suchmarked-to-market gains.
| N O T E S T O F I N A N C I A L S T A T E M E N T S | 25 |
Notes to Financial Statements (continued)
As of April 30, 2019, gross unrealized appreciation and depreciation based on cost of investments (including short positions and derivatives, if any) for U.S. federal income tax purposes were as follows:
| iShares ETF | Tax Cost | Gross Unrealized Appreciation | Gross Unrealized Depreciation | Net Unrealized Appreciation (Depreciation) | ||||||||||||
Asia/Pacific Dividend | $ | 39,129,406 | $ | 672,426 | $ | (4,659,445 | ) | $ | (3,987,019 | ) | ||||||
Emerging Markets Dividend | 587,736,286 | 38,706,707 | (50,622,210 | ) | (11,915,503 | ) | ||||||||||
| 9. | LINE OF CREDIT |
The iShares Emerging Markets Dividend ETF, along with certain other iShares funds, is a party to a $300 million credit agreement with State Street Bank and Trust Company, which expires on October 23, 2019. The line of credit may be used for temporary or emergency purposes, including redemptions, settlement of trades and rebalancing of portfolio holdings. The credit agreement has the following terms: a commitment fee of 0.20% per annum on the unused portion of the credit agreement and interest at a rate equal to the higher of (a) theone-month LIBOR (not less than zero) plus 1.00% per annum or (b) the U.S. Federal Funds rate (not less than zero) plus 1.00% per annum on amounts borrowed. The commitment fee is allocated to each fund participating in the credit agreement based on each fund’spro-rata share of the aggregate average daily value of assets invested in local securities of certain foreign markets.
The iShares Emerging Markets Dividend ETF did not borrow under the credit agreement during the year ended April 30, 2019.
| 10. | PRINCIPAL RISKS |
In the normal course of business, each Fund invests in securities or other instruments and may enter into certain transactions, and such activities subject the Fund to various risks, including, among others, fluctuations in the market (market risk) or failure of an issuer to meet all of its obligations. The value of securities or other instruments may also be affected by various factors, including, without limitation: (i) the general economy; (ii) the overall market as well as local, regional or global political and/or social instability; (iii) regulation, taxation or international tax treaties between various countries; or (iv) currency, interest rate or price fluctuations. Each Fund’s prospectus provides details of the risks to which the Fund is subject.
BFA uses a “passive” or index approach to try to achieve each Fund’s investment objective following the securities included in its underlying index during upturns as well as downturns. BFA does not take steps to reduce market exposure or to lessen the effects of a declining market. Divergence from the underlying index and the composition of the portfolio is monitored by BFA.
Market Risk:Market risk arises mainly from uncertainty about future values of financial instruments influenced by price, currency and interest rate movements. It represents the potential loss a fund may suffer through holding market positions in the face of market movements. A fund is exposed to market risk by its investment in equity, fixed income and/or financial derivative instruments or by its investment in underlying funds. The fair value of securities held by a fund may decline due to general market conditions, economic trends or events that are not specifically related to the issuers of the securities including local, regional or global political, social or economic instability or to factors that affect a particular industry or group of industries. The extent of a fund’s exposure to market risk is the market value of the investments held as shown in the fund’s schedule of investments.
Investing in the securities ofnon-U.S. issuers involves certain considerations and risks not typically associated with securities of U.S. issuers. Such risks include, but are not limited to: differences in accounting, auditing and financial reporting standards; more substantial governmental involvement in the economy; higher inflation rates, greater social, economic and political uncertainties; possible nationalization or expropriation of assets; less availability of public information about issuers; imposition of withholding or other taxes; higher transaction and custody costs and delays in settlement procedures; and lower level of regulation of the securities markets and issuers.Non-U.S. securities may be less liquid, more difficult to value, and have greater price volatility due to exchange rate fluctuations. These and other risks are heightened for investments in issuers from countries with less developed capital markets.
Credit Risk:Credit risk is the risk that an issuer or guarantor of debt instruments or the counterparty to a financial transaction, including derivatives contracts, repurchase agreements or loans of portfolio securities, is unable or unwilling to make timely interest and/or principal payments or to otherwise honor its obligations. BFA and its affiliates manage counterparty credit risk by entering into transactions only with counterparties that they believe have the financial resources to honor their obligations and by monitoring the financial stability of those counterparties. Financial assets, which potentially expose a fund to issuer and counterparty credit risks, consist principally of financial instruments and receivables due from counterparties. The extent of a fund’s exposure to credit and counterparty risks with respect to those financial assets is approximated by their value recorded in its statement of assets and liabilities.
Concentration Risk:A diversified portfolio, where this is appropriate and consistent with a fund’s objectives, minimizes the risk that a price change of a particular investment will have a material impact on the NAV of a fund. The investment concentrations within each Fund’s portfolio are disclosed in its schedule of investments.
When a fund concentrates its investments in issuers located in a single country or a limited number of countries, it assumes the risk that economic, regulatory, political and social conditions in that country or those countries may have a significant impact on the fund and could affect the income from, or the value or liquidity of, the fund’s portfolio.
When a fund concentrates its investments in securities within a single or limited number of market sectors, it assumes the risk that economic, regulatory, political and social conditions affecting such sectors may have a significant impact on the fund and could affect the income from, or the value or liquidity of, the fund’s portfolio.
| 26 | 2 0 1 9 I S H A R E S A N N U A L R E P O R T T O S H A R E H O L D E R S |
Notes to Financial Statements (continued)
| 11. | CAPITAL SHARE TRANSACTIONS |
Capital shares are issued and redeemed by each Fund only in aggregations of a specified number of shares or multiples thereof (“Creation Units”) at NAV. Except when aggregated in Creation Units, shares of each Fund are not redeemable.
Transactions in capital shares were as follows:
| ||||||||||||||||
| Year Ended 04/30/19 | Year Ended 04/30/18 | |||||||||||||||
| iShares ETF | Shares | Amount | Shares | Amount | ||||||||||||
| ||||||||||||||||
Asia/Pacific Dividend | ||||||||||||||||
Shares redeemed | (100,000 | ) | (4,551,969 | ) | (100,000 | ) | (4,766,094 | ) | ||||||||
|
|
|
|
|
|
|
| |||||||||
Emerging Markets Dividend | ||||||||||||||||
Shares sold | 6,800,000 | $ | 267,584,101 | 4,150,000 | $ | 177,446,391 | ||||||||||
Shares redeemed | (3,650,000 | ) | (147,725,844 | ) | (750,000 | ) | (32,468,568 | ) | ||||||||
|
|
|
|
|
|
|
| |||||||||
Net increase | 3,150,000 | $ | 119,858,257 | 3,400,000 | $ | 144,977,823 | ||||||||||
|
|
|
|
|
|
|
| |||||||||
The consideration for the purchase of Creation Units of a fund in the Company generally consists of thein-kind deposit of a designated portfolio of securities and a specified amount of cash. Certain funds in the Company may be offered in Creation Units solely or partially for cash in U.S. dollars. Investors purchasing and redeeming Creation Units may pay a purchase transaction fee and a redemption transaction fee directly to State Street Bank and Trust Company, the Company’s administrator, to offset transfer and other transaction costs associated with the issuance and redemption of Creation Units, including Creation Units for cash. Investors transacting in Creation Units for cash may also pay an additional variable charge to compensate the relevant fund for certain transaction costs (i.e., stamp taxes, taxes on currency or other financial transactions, and brokerage costs) and market impact expenses relating to investing in portfolio securities. Such variable charges, if any, are included in shares sold in the table above.
From time to time, settlement of securities related toin-kind contributions orin-kind redemptions may be delayed. In such cases, securities related toin-kind transactions are reflected as a receivable or a payable in the statement of assets and liabilities.
| 12. | LEGAL PROCEEDINGS |
On June 16, 2016, investors in certain iShares funds (iShares Core S&PSmall-Cap ETF, iShares Russell 1000 Growth ETF, iShares Core S&P 500 ETF, iShares RussellMid-Cap Growth ETF, iShares RussellMid-Cap ETF, iShares RussellMid-Cap Value ETF, iShares Select Dividend ETF, iShares MorningstarMid-Cap ETF, iShares MorningstarLarge-Cap ETF, iShares U.S. Aerospace & Defense ETF and iShares Preferred and Income Securities ETF) filed a class action lawsuit against iShares Trust, BlackRock, Inc. and certain of its advisory affiliates, and certain directors/trustees and officers of the Funds (collectively, “Defendants”) in California State Court. The lawsuit alleges the Defendants violated federal securities laws by failing to adequately disclose in the prospectuses issued by the funds noted above the risks of using stop-loss orders in the event of a ‘flash crash’, such as the one that occurred on May 6, 2010. On September 18, 2017, the court issued a Statement of Decision holding that the Plaintiffs lack standing to assert their claims. On October 11, 2017, the court entered final judgment dismissing all of the Plaintiffs’ claims with prejudice. Plaintiffs have appealed the court’s decision.
| 13. | REGULATIONS-X AMENDMENTS |
On August 17, 2018, the SEC adopted amendments to certain disclosure requirements in Securities Act ReleaseNo. 33-10532,Disclosure Update and Simplification. The Funds have adopted the amendments pertinent to RegulationS-X in this shareholder report. The amendments impacted certain disclosure presentation on the statement of assets and liabilities, statement of changes in net assets and notes to the financial statements.
Prior year distribution information and undistributed (distributions in excess of) net investment income in the statement of changes in net assets has been modified to conform to the current year presentation in accordance with the RegulationS-X changes.
Distributions for the year ended April 30, 2018 were classified as follows:
| iShares ETF | Net Investment Income | |||
Asia/Pacific Dividend | $ | 2,084,792 | ||
Emerging Markets Dividend | 17,865,271 | |||
Undistributed net investment income as of April 30, 2018 are as follows:
| iShares ETF | Undistributed net investment income | |||
Asia/Pacific Dividend | $ | 157,359 | ||
Emerging Markets Dividend | 929,937 | |||
| N O T E S T O F I N A N C I A L S T A T E M E N T S | 27 |
Notes to Financial Statements (continued)
| 14. | SUBSEQUENT EVENTS |
Management has evaluated the impact of all subsequent events on the Funds through the date the financial statements were available to be issued and has determined that there were no subsequent events requiring adjustment or additional disclosure in the financial statements.
| 28 | 2 0 1 9 I S H A R E S A N N U A L R E P O R T T O S H A R E H O L D E R S |
Report of Independent Registered Public Accounting Firm
To the Board of Directors of iShares, Inc. and
Shareholders of iShares Asia/Pacific Dividend ETF and iShares Emerging Markets Dividend ETF
Opinions on the Financial Statements
We have audited the accompanying statements of assets and liabilities, including the schedules of investments, of iShares Asia/Pacific Dividend ETF and iShares Emerging Markets Dividend ETF (two of the funds constituting iShares Inc., hereafter collectively referred to as the “Funds”) as of April 30, 2019, the related statements of operations for the year ended April 30, 2019, the statements of changes in net assets for each of the two years in the period ended April 30, 2019, including the related notes, and the financial highlights for each of the five years in the period ended April 30, 2019 (collectively referred to as the “financial statements”). In our opinion, the financial statements present fairly, in all material respects, the financial position of each of the Funds as of April 30, 2019, the results of each of their operations for the year then ended, the changes in each of their net assets for each of the two years in the period ended April 30, 2019 and each of the financial highlights for each of the five years in the period ended April 30, 2019 in conformity with accounting principles generally accepted in the United States of America.
Basis for Opinions
These financial statements are the responsibility of the Funds’ management. Our responsibility is to express an opinion on the Funds’ financial statements based on our audits. We are a public accounting firm registered with the Public Company Accounting Oversight Board (United States) (“PCAOB”) and are required to be independent with respect to the Funds in accordance with the U.S. federal securities laws and the applicable rules and regulations of the Securities and Exchange Commission and the PCAOB.
We conducted our audits of these financial statements in accordance with the standards of the PCAOB. Those standards require that we plan and perform the audit to obtain reasonable assurance about whether the financial statements are free of material misstatement, whether due to error or fraud.
Our audits included performing procedures to assess the risks of material misstatement of the financial statements, whether due to error or fraud, and performing procedures that respond to those risks. Such procedures included examining, on a test basis, evidence regarding the amounts and disclosures in the financial statements. Our audits also included evaluating the accounting principles used and significant estimates made by management, as well as evaluating the overall presentation of the financial statements. Our procedures included confirmation of securities owned as of April 30, 2019 by correspondence with the custodian, transfer agent and brokers. We believe that our audits provide a reasonable basis for our opinions.
/s/ PricewaterhouseCoopers LLP
San Francisco, California
June 19, 2019
We have served as the auditor of one or more BlackRock investment companies since 2000.
| R E P O R T O F I N D E P E N D E N T R E G I S T E R E D P U B L I C A C C O U N T I N G F I R M | 29 |
Important Tax Information (unaudited)
The following maximum amounts are hereby designated as qualified dividend income for individuals for the fiscal year ended April 30, 2019:
| iShares ETF | Qualified Dividend Income | |||
Asia/Pacific Dividend | $ | 1,465,600 | ||
Emerging Markets Dividend | 18,713,705 | |||
For the fiscal year ended April 30, 2019, the Funds earned foreign source income and paid foreign taxes which they intend to pass through to their shareholders:
| iShares ETF | Foreign Source Income Earned | Foreign Taxes Paid | ||||||
Asia/Pacific Dividend | $ | 2,158,535 | $ | 65,193 | ||||
Emerging Markets Dividend | 34,376,101 | 3,520,827 | ||||||
| 30 | 2 0 1 9 I S H A R E S A N N U A L R E P O R T T O S H A R E H O L D E R S |
Supplemental Information (unaudited)
Section 19(a) Notices
The amounts and sources of distributions reported in this notice are for financial reporting purposes and are not being provided for tax reporting purposes. The actual amounts and character of the distributions for tax reporting purposes will be reported to shareholders on Form1099-DIV which is sent to shareholders shortly after calendaryear-end.
| Total Cumulative Distributions for the Fiscal Year | % Breakdown of the Total Cumulative Distributions for the Fiscal Year | |||||||||||||||||||||||||||||||
| iShares ETF | Net Investment Income | Net Realized Capital Gains | Return of Capital | Total Per Share | Net Investment Income | Net Realized Capital Gains | Return of Capital | Total Per Share | ||||||||||||||||||||||||
Asia/Pacific Dividend | $ | 2.598503 | $ | — | $ | — | $ | 2.598503 | 100 | % | — | % | — | % | 100 | % | ||||||||||||||||
Emerging Markets Dividend | 2.218772 | — | — | 2.218772 | 100 | — | — | 100 | ||||||||||||||||||||||||
Premium/Discount Information
The Premium/Discount Information section is intended to present information about the differences between the daily market price on secondary markets for shares of a fund and that fund’s NAV. NAV is the price at which a fund issues and redeems shares. It is calculated in accordance with the standard formula for valuing mutual fund shares. The “Market Price” of a fund generally is determined using the midpoint between the highest bid and the lowest ask on the primary securities exchange on which shares of such fund are listed for trading, as of the time that the fund’s NAV is calculated. A fund’s Market Price may be at, above or below its NAV. The NAV of a fund will fluctuate with changes in the value of its portfolio holdings. The Market Price of a fund will fluctuate in accordance with changes in its NAV, as well as market supply and demand.
Premiums or discounts are the differences (expressed as a percentage) between the NAV and Market Price of a fund on a given day, generally at the time the NAV is calculated. A premium is the amount that a fund is trading above the reported NAV, expressed as a percentage of the NAV. A discount is the amount that a fund is trading below the reported NAV, expressed as a percentage of the NAV.
Premium/discount information for the Funds covering the most recently completed calendar year and the most recently completed calendar quarters since that year (or since the Fund began trading, if shorter) is publicly accessible, free of charge, at www.iShares.com.
The following information shows the frequency of distributions of premiums and discounts for the Funds for the immediately preceding five calendar years (or from the date a Fund began trading on the secondary market, if less than five years) through the date of the most recent calendarquarter-end. Each line in each table shows the number of trading days in which the Fund traded within the premium/discount range indicated. Premium/discount ranges with no trading days are omitted. The number of trading days in each premium/discount range is also shown as a percentage of the total number of trading days in the period covered by each table. All data presented here represents past performance, which cannot be used to predict future results.
iShares Asia/Pacific Dividend ETF
Period Covered: January 01, 2014 through March 31, 2019
| Premium/Discount Range | Number of Days | Percentage of Total Days | ||||||
Greater than 2.0% and Less than 2.5% | 1 | 0.08 | % | |||||
Greater than 1.5% and Less than 2.0% | 8 | 0.61 | ||||||
Greater than 1.0% and Less than 1.5% | 34 | 2.58 | ||||||
Greater than 0.5% and Less than 1.0% | 164 | 12.43 | ||||||
Greater than 0.0% and Less than 0.5% | 504 | 38.20 | ||||||
At NAV | 11 | 0.83 | ||||||
Less than 0.0% and Greater than –0.5% | 405 | 30.70 | ||||||
Less than –0.5% and Greater than –1.0% | 132 | 10.01 | ||||||
Less than –1.0% and Greater than –1.5% | 35 | 2.65 | ||||||
Less than –1.5% and Greater than –2.0% | 15 | 1.14 | ||||||
Less than –2.0% and Greater than –2.5% | 8 | 0.61 | ||||||
Less than –2.5% and Greater than –3.0% | 1 | 0.08 | ||||||
Less than –3.0% and Greater than –3.5% | 1 | 0.08 | ||||||
|
|
|
| |||||
| 1,319 | 100.00 | % | ||||||
|
|
|
| |||||
| S U P P L E M E N T A L I N F O R M A T I O N | 31 |
Supplemental Information (unaudited) (continued)
iShares Emerging Markets Dividend ETF
Period Covered: January 01, 2014 through March 31, 2019
| Premium/Discount Range | Number of Days | Percentage of Total Days | ||||||
Greater than 2.5% and Less than 3.0% | 1 | 0.08 | % | |||||
Greater than 2.0% and Less than 2.5% | 3 | 0.23 | ||||||
Greater than 1.5% and Less than 2.0% | 10 | 0.76 | ||||||
Greater than 1.0% and Less than 1.5% | 50 | 3.79 | ||||||
Greater than 0.5% and Less than 1.0% | 234 | 17.74 | ||||||
Greater than 0.0% and Less than 0.5% | 494 | 37.44 | ||||||
At NAV | 8 | 0.61 | ||||||
Less than 0.0% and Greater than –0.5% | 312 | 23.65 | ||||||
Less than –0.5% and Greater than –1.0% | 146 | 11.07 | ||||||
Less than –1.0% and Greater than –1.5% | 44 | 3.34 | ||||||
Less than –1.5% and Greater than –2.0% | 9 | 0.68 | ||||||
Less than –2.0% and Greater than –2.5% | 4 | 0.30 | ||||||
Less than –2.5% and Greater than –3.0% | 3 | 0.23 | ||||||
Less than –5.0% and Greater than –5.5% | 1 | 0.08 | ||||||
|
|
|
| |||||
| 1,319 | 100.00 | % | ||||||
|
|
|
| |||||
| 32 | 2 0 1 9 I S H A R E S A N N U A L R E P O R T T O S H A R E H O L D E R S |
Director and Officer Information
The Board of Directors has responsibility for the overall management and operations of the Funds, including general supervision of the duties performed by BFA and other service providers. Each Director serves until he or she resigns, is removed, dies, retires or becomes incapacitated. Each officer shall hold office until his or her successor is elected and qualifies or until his or her death, resignation or removal. Directors who are not “interested persons” (as defined in the 1940 Act) of the Company are referred to as independent directors (“Independent Directors”).
The registered investment companies advised by BFA or its affiliates (the “BlackRock-advised Funds”) are organized into one complex ofopen-end equity, multi-asset, index and money market funds (the “BlackRock Multi-Asset Complex”), one complex ofclosed-end funds andopen-endnon-index fixed-income funds (the “BlackRock Fixed-Income Complex”) and one complex of ETFs (“Exchange-Traded Fund Complex”) (each, a “BlackRock Fund Complex”). Each Fund is included in the BlackRock Fund Complex referred to as the Exchange-Traded Fund Complex. Each Director also serves as a Trustee of iShares Trust and a Trustee of iShares U.S. ETF Trust and, as a result, oversees all of the funds within the Exchange-Traded Fund Complex, which consists of 356 funds as of April 30, 2019. With the exception of Robert S. Kapito, Mark K. Wiedman, Charles Park, Martin Small, Benjamin Archibald and Neal J. Andrews, the address of each Director and officer is c/o BlackRock, Inc., 400 Howard Street, San Francisco, CA 94105. The address of Mr. Kapito, Mr. Wiedman, Mr. Park, Mr. Small, Mr. Archibald and Mr. Andrews is c/o BlackRock, Inc., Park Avenue Plaza, 55 East 52nd Street, New York, NY 10055. The Board has designated Cecilia H. Herbert as its Independent Board Chair. Additional information about the Funds’ Directors and officers may be found in the Funds’ combined Statement of Additional Information, which is available without charge, upon request, by calling toll-free1-800-iShares(1-800-474-2737).
| Interested Directors | ||||||
| Name (Age) | Position(s) | Principal Occupation(s) During the Past 5 Years | Other Directorships Held by Director | |||
| Robert S. Kapito(a)(62) | Director (since 2009). | President, BlackRock, Inc. (since 2006); Vice Chairman of BlackRock, Inc. and Head of BlackRock’s Portfolio Management Group (since its formation in 1998) and BlackRock, Inc.’s predecessor entities (since 1988); Trustee, University of Pennsylvania (since 2009); President of Board of Directors, Hope & Heroes Children’s Cancer Fund (since 2002). | Director of BlackRock, Inc. (since 2006); Trustee of iShares Trust (since 2009); Trustee of iShares U.S. ETF Trust (since 2011). | |||
| Mark K. Wiedman(b)(48) | Director (since 2013). | Senior Managing Director, BlackRock, Inc. (since 2014); Managing Director, BlackRock, Inc. (2007-2014); Head of International and of Corporate Strategy for BlackRock (since 2019); Global Head of BlackRock’s ETF and Index Investments Business (2016-2019); Global Head of iShares (2011-2016); Head of Corporate Strategy, BlackRock, Inc. (2009-2011). | Trustee of iShares Trust (since 2013); Trustee of iShares U.S. ETF Trust (since 2013); Director of PennyMac Financial Services, Inc. (since 2008). | |||
(a) Robert S. Kapito is deemed to be an “interested person” (as defined in the 1940 Act) of the Company due to his affiliations with BlackRock, Inc. and its affiliates. | ||||||
(b) Mark K. Wiedman is deemed to be an “interested person” (as defined in the 1940 Act) of the Company due to his affiliations with BlackRock, Inc. and its affiliates. | ||||||
| Independent Directors | ||||||
| Name (Age) | Position(s) | Principal Occupation(s) During the Past 5 Years | Other Directorships Held by Director | |||
| Cecilia H. Herbert (70) | Director (since 2005); Independent Board Chair (since 2016). | Chair of the Finance Committee (since 2019) and Trustee and Member of the Finance, Technology and Quality Committees of Stanford Health Care (since 2016); Member of the Audit Committee (since 2018) and Trustee and Member of the Investment Committee, WNET, a New York public media company (since 2011); Chair (1994-2005) and Member (since 1992) of the Investment Committee, Archdiocese of San Francisco; Trustee of Forward Funds (14 portfolios) (2009-2018); Trustee of Salient MF Trust (4 portfolios) (2015-2018); Director(1998-2013) and President (2007-2011) of the Board of Directors, Catholic Charities CYO; Trustee (2002-2011) and Chair of the Finance and Investment Committee (2006-2010) of the Thacher School. | Trustee of iShares Trust (since 2005); Trustee of iShares U.S. ETF Trust (since 2011); Independent Board Chair of iShares Trust and iShares U.S. ETF Trust (since 2016); Trustee of Thrivent Church Loan and Income Fund (since 2019). | |||
| D I R E C T O R A N D O F F I C E R I N F O R M A T I O N | 33 |
Director and Officer Information (continued)
| Independent Directors(continued) | ||||||
| Name (Age) | Position(s) | Principal Occupation(s) During the Past 5 Years | Other Directorships Held by Director | |||
| Jane D. Carlin (63) | Director (since 2015); Risk Committee Chair (since 2016). | Consultant (since 2012); Member of the Audit Committee (2012-2018), Chair of the Nominating and Governance Committee (2017-2018) and Director of PHH Corporation (mortgage solutions)(2012-2018); Managing Director and Global Head of Financial Holding Company Governance & Assurance and the Global Head of Operational Risk Management of Morgan Stanley(2006-2012). | Trustee of iShares Trust (since 2015); Trustee of iShares U.S. ETF Trust (since 2015); Member of the Audit Committee (since 2016) and Director of The Hanover Insurance Group, Inc. (since 2016). | |||
| Richard L. Fagnani (64) | Director (since 2017); Audit Committee Chair (since 2019). | Partner, KPMG LLP (2002-2016). | Trustee of iShares Trust (since 2017); Trustee of iShares U.S. ETF Trust (since 2017). | |||
| John E. Kerrigan (63) | Director (since 2005); Nominating and Governance and Equity Plus Committee Chairs (since 2019). | Chief Investment Officer, Santa Clara University (since 2002). | Trustee of iShares Trust (since 2005); Trustee of iShares U.S. ETF Trust (since 2011). | |||
| Drew E. Lawton (60) | Director (since 2017); 15(c) Committee Chair (since 2017). | Senior Managing Director of New York Life Insurance Company (2010-2015). | Trustee of iShares Trust (since 2017); Trustee of iShares U.S. ETF Trust (since 2017). | |||
| John E. Martinez (57) | Director (since 2003); Securities Lending Committee Chair (since 2019). | Director of Real Estate Equity Exchange, Inc. (since 2005); Director of Cloudera Foundation (since 2017); Director of Reading Partners (2012-2016). | Trustee of iShares Trust (since 2003); Trustee of iShares U.S. ETF Trust (since 2011). | |||
| Madhav V. Rajan (54) | Director (since 2011); Fixed Income Plus Committee Chair (since 2019). | Dean, and George Pratt Shultz Professor of Accounting, University of Chicago Booth School of Business (since 2017); Robert K. Jaedicke Professor of Accounting, Stanford University Graduate School of Business (2001-2017); Professor of Law (by courtesy), Stanford Law School(2005-2017); Senior Associate Dean for Academic Affairs and Head of MBA Program, Stanford University Graduate School of Business(2010-2016). | Trustee of iShares Trust (since 2011); Trustee of iShares U.S. ETF Trust (since 2011). | |||
| Officers | ||||
| Name (Age) | Position(s) | Principal Occupation(s) During the Past 5 Years | ||
| Martin Small (43) | President (since 2016). | Managing Director, BlackRock, Inc. (since 2010); Head of U.S. iShares (since 2015);Co-Head of the U.S. Financial Markets Advisory Group, BlackRock, Inc. (2008-2014). | ||
| Neal J. Andrews (53) | Treasurer and Chief Financial Officer (since 2019). | Managing Director, BlackRock, Inc. (since 2006); Chief Financial Officer of the BlackRock-advised Funds in the BlackRock Multi-Asset Complex and BlackRock Fixed-Income Complex (since 2007). | ||
| Charles Park (51) | Chief Compliance Officer (since 2006). | Chief Compliance Officer of BlackRock Advisors, LLC and the BlackRock-advised Funds in the BlackRock Multi-Asset Complex and the BlackRock Fixed-Income Complex (since 2014); Chief Compliance Officer of BFA (since 2006). | ||
| Benjamin Archibald (43) | Secretary (since 2015). | Managing Director, BlackRock, Inc. (since 2014); Director, BlackRock, Inc. (2010-2013); Secretary of the BlackRock-advised Mutual Funds (since 2012). | ||
| Steve Messinger (56) | Executive Vice President (since 2016). | Managing Director, BlackRock, Inc. (2007-2014 and since 2016); Managing Director, Beacon Consulting Group (2014-2016). | ||
| Scott Radell (50) | Executive Vice President (since 2012). | Managing Director, BlackRock, Inc. (since 2009); Head of Portfolio Solutions, BlackRock, Inc. (since 2009). | ||
| 34 | 2 0 1 9 I S H A R E S A N N U A L R E P O R T T O S H A R E H O L D E R S |
Director and Officer Information (continued)
| Officers(continued) | ||||
| Name (Age) | Position(s) | Principal Occupation(s) During the Past 5 Years | ||
| Alan Mason (58) | Executive Vice President (since 2016). | Managing Director, BlackRock, Inc. (since 2009). | ||
| D I R E C T O R A N D O F F I C E R I N F O R M A T I O N | 35 |
Electronic Delivery
Shareholders can sign up for email notifications announcing that the shareholder report or prospectus has been posted on the iShares website at www.iShares.com. Once you have enrolled, you will no longer receive prospectuses and shareholder reports in the mail.
To enroll in electronic delivery:
| • | Go to www.icsdelivery.com. |
| • | If your brokerage firm is not listed, electronic delivery may not be available. Please contact your broker-dealer or financial advisor. |
Householding
Householding is an option available to certain fund investors. Householding is a method of delivery, based on the preference of the individual investor, in which a single copy of certain shareholder documents can be delivered to investors who share the same address, even if their accounts are registered under different names. Please contact your broker-dealer if you are interested in enrolling in householding and receiving a single copy of prospectuses and other shareholder documents, or if you are currently enrolled in householding and wish to change your householding status.
Availability of Quarterly Schedule of Investments
The iShares Funds file their complete schedule of portfolio holdings with the SEC for the first and third quarters of each fiscal year on FormN-Q. The iShares Funds’ FormsN-Q are available on the SEC’s website at www.sec.gov. The iShares Funds also disclose their complete schedule of portfolio holdings on a daily basis on the iShares website at www.iShares.com.
Availability of Proxy Voting Policies and Proxy Voting Records
A description of the policies and procedures that the iShares Funds use to determine how to vote proxies relating to portfolio securities and information about how the iShares Funds voted proxies relating to portfolio securities during the most recent twelve-month period ending June 30 is available without charge, upon request (1) by calling toll-free1-800-474-2737; (2) on the iShares website at www.iShares.com; and (3) on the SEC website at www.sec.gov.
| 36 | 2 0 1 9 I S H A R E S A N N U A L R E P O R T T O S H A R E H O L D E R S |
Glossary of Terms Used in this Report
| Portfolio Abbreviations — Equity | ||
| ADR | American Depositary Receipt | |
| GDR | Global Depositary Receipt | |
| NVDR | Non-Voting Depositary Receipt | |
| NVS | Non-Voting Shares | |
| G L O S S A R Y O F T E R M S U S E D I N T H I S R E P O R T | 37 |
For more information visit www.iShares.com or call1-800-iShares(1-800-474-2737)
| This report is intended for the Funds’ shareholders. It may not be distributed to prospective investors unless it is preceded or accompanied by the current prospectus.
Investing involves risk, including possible loss of principal.
The iShares Funds are distributed by BlackRock Investments, LLC (together with its affiliates, “BlackRock”).
The iShares Funds are not sponsored, endorsed, issued, sold or promoted by S&P Dow Jones Indices LLC, nor does this company make any representation regarding the advisability of investing in the iShares Funds. BlackRock is not affiliated with the company listed above.
©2019 BlackRock, Inc. All rights reserved.iSHARESandBLACKROCKare registered trademarks of BlackRock, Inc. or its subsidiaries. All other marks are the property of their respective owners. |

 |  |
| Item 2. | Code of Ethics. |
The registrant has adopted a code of ethics, as of the end of the period covered by this report, applicable to the registrant’s principal executive officer, principal financial officer, principal accounting officer or controller, or persons performing similar functions. During the period covered by this report, the code of ethics was amended to clarify an inconsistency in to whom persons covered by the code should report suspected violations of the code. The amendment clarifies that such reporting should be made to BlackRock’s General Counsel, and retains the alternative option of anonymous reporting following “whistleblower” policies. Othernon-material changes were also made in connection with this amendment. During the period covered by this report, there have been no waivers granted under the code of ethics. The registrant undertakes to provide a copy of the code of ethics to any person upon request, without charge, by calling1-800-474-2737.
| Item 3. | Audit Committee Financial Expert. |
The registrant’s Board of Directors has determined that the registrant has more than one audit committee financial expert, as that term is defined under Item 3(b) and 3(c), serving on its audit committee. The audit committee financial experts serving on the registrant’s audit committee are Richard L. Fagnani, John E. Kerrigan, and Madhav V. Rajan, all of whom are independent, as that term is defined under Item 3(a)(2).
Information Classification: Confidential
| Item 4. | Principal Accountant Fees and Services. |
The principal accountant fees disclosed in items 4(a), 4(b), 4(c), 4(d) and 4(g) are for the two series of the registrant for which the fiscalyear-end is April 30, 2019 (the “Funds”), and whose annual financial statements are reported in Item 1.
| (a) | Audit Fees – The aggregate fees billed for each of the last two fiscal years for professional services rendered by the principal accountant for the audit of the Funds’ annual financial statements or services that are normally provided by the accountant in connection with statutory and regulatory filings or engagements for those fiscal years were $31,200 for the fiscal year ended April 30, 2018 and $31,200 for the fiscal year ended April 30, 2019. |
| (b) | Audit-Related Fees – There were no fees billed for the fiscal years ended April 30, 2018 and April 30, 2019 for assurance and related services by the principal accountant that were reasonably related to the performance of the audit of the Fund’s financial statements and are not reported under (a) of this Item. |
| (c) | Tax Fees – The aggregate fees billed in each of the last two fiscal years for professional services rendered by the principal accountant for tax compliance, tax advice and tax planning for the Funds were $7,562 for the fiscal year ended April 30, 2018 and $7,562 for the fiscal year ended April 30, 2019. These services related to the review of the Funds’ tax returns and excise tax calculations. |
| (d) | All Other Fees – There were no other fees billed in each of the fiscal years ended April 30, 2018 and April 30, 2019 for products and services provided by the principal accountant, other than the services reported in (a) through (c) of this Item. |
| (e) | (1) The registrant’s audit committee charter, as amended, provides that the audit committee is responsible for the approval, prior to appointment, of the engagement of the principal accountant to annually audit and provide their opinion on the registrant’s financial statements. The audit committee must also approve, prior to appointment, the engagement of the principal accountant to providenon-audit services to the registrant or to any entity controlling, controlled by or under common control with the registrant’s investment adviser (“Adviser Affiliate”) that provides ongoing services to the registrant, if the engagement relates directly to the operations and financial reporting of the registrant. |
(2) There were no services described in (b) through (d) above that were approved by the audit committee pursuant to paragraph (c)(7)(i)(C) of Rule2-01 of RegulationS-X.
| (f) | None of the hours expended on the principal accountant’s engagement to audit the Funds’ financial statements for the fiscal year ended April 30, 2019 were attributable to work performed by persons other than the principal accountant’s full-time, permanent employees. |
| (g) | The aggregatenon-audit fees billed by the registrant’s principal accountant for services rendered to the Funds, and rendered to the registrant’s investment adviser, and any Adviser Affiliate that provides ongoing services to the registrant for the last two fiscal years were $7,562 for the fiscal year ended April 30, 2018 and $7,562 for the fiscal year ended April 30, 2019. |
| (h) | The registrant’s audit committee has considered whether the provision ofnon-audit services rendered to the registrant’s investment adviser and any Adviser Affiliate that provides ongoing services to the registrant that were notpre-approved pursuant to paragraph (c)(7)(ii) of Rule2-01 of RegulationS-X, if any, is compatible with maintaining the principal accountant’s independence, and has determined that the provision of these services, if any, does not compromise the principal accountant’s independence. |
| Item 5. | Audit Committee of Listed Registrants |
(a) The registrant is a listed issuer as defined in Rule10A-3 under the Exchange Act of 1934 and has a separately-designated standing audit committee established in accordance with Section 3(a)(58)(A) of the Exchange Act of 1934. The registrant’s audit committee members are Richard L. Fagnani, John E. Kerrigan, and Madhav V. Rajan.
(b) Not applicable.
Information Classification: Confidential
| Item 6. | Investments. |
(a) Schedules of investments are included as part of the reports to shareholders filed under Item 1 of this Form.
(b) Not applicable.
| Item 7. | Disclosure of Proxy Voting Policies and Procedures forClosed-End Management Investment Companies. |
Not applicable to the registrant.
| Item 8. | Portfolio Managers ofClosed-End Management Investment Companies. |
Not applicable to the registrant.
| Item 9. | Purchases of Equity Securities byClosed-End Management Investment Company and Affiliated Purchasers. |
Not applicable to the registrant.
| Item 10. | Submission of Matters to a Vote of Security Holders. |
There were no material changes to the procedures by which shareholders may recommend nominees to the registrant’s Board of Directors.
| Item 11. | Controls and Procedures. |
(a) The President (the registrant’s Principal Executive Officer) and Treasurer and Chief Financial Officer (the registrant’s Principal Financial Officer) have concluded that the registrant’s disclosure controls and procedures (as defined in Rule30a-3(c) under the Investment Company Act of 1940) are effective as of a date within 90 days of the filing date of this report, based on their evaluation of these controls and procedures required by Rule30a-3(b) under the Investment Company Act of 1940 and Rules13a-15(b) or15d-15(b) under the Exchange Act of 1934.
(b) There were no changes in the registrant’s internal control over financial reporting (as defined in Rule30a-3(d) under the Investment Company Act of 1940) that occurred during the period covered by this report that have materially affected, or are reasonably likely to materially affect, the registrant’s internal control over financial reporting.
| Item 12. | Disclosure of Securities Lending Activities forClosed-End Management Investment Companies. |
Not applicable to the registrant.
| Item 13. | Exhibits. |
(a) (1) Code of Ethics is not filed as an exhibit; please refer to Item 2.
(a) (2) Section 302 Certifications are attached.
(a) (3) Not applicable.
(a) (4) Not applicable.
(b) Section 906 Certifications are attached.
Information Classification: Confidential
SIGNATURES
Pursuant to the requirements of the Securities Exchange Act of 1934 and the Investment Company Act of 1940, the registrant has duly caused this report to be signed on its behalf by the undersigned, thereunto duly authorized.
| iShares, Inc. | ||
By: /s/ Martin Small | ||
| Martin Small, President (Principal Executive Officer) | ||
Date: June 28, 2019
Pursuant to the requirements of the Securities Exchange Act of 1934 and the Investment Company Act of 1940, this report has been signed below by the following persons on behalf of the registrant and in the capacities and on the dates indicated.
By: /s/ Martin Small | ||
| Martin Small, President (Principal Executive Officer) |
Date: June 28, 2019
| By: /s/ Neal Andrews | ||
| Neal Andrews, Treasurer and Chief Financial Officer (Principal Financial Officer) |
Date: June 28, 2019
Information Classification: Confidential