UNITED STATES
SECURITIES AND EXCHANGE COMMISSION
Washington, D.C. 20549
FORM N-CSR
CERTIFIED SHAREHOLDER REPORT
OF REGISTERED MANAGEMENT INVESTMENT COMPANIES
Investment Company Act file number 811-09102
iShares, Inc.
(Exact name of registrant as specified in charter)
c/o BlackRock Fund Advisors
400 Howard Street, San Francisco, CA 94105
(Address of principal executive offices) (Zip code)
The Corporation Trust Incorporated
2405 York Road, Suite 201, Lutherville-Timonium, Maryland 21093
(Name and address of agent for service)
Registrant’s telephone number, including area code: (415) 670-2000
Date of fiscal year end: April 30, 2024
Date of reporting period: April 30, 2024
| Item 1. | Reports to Stockholders. |
(a) The Report to Shareholders is attached herewith.
|
• iShares Asia/Pacific Dividend ETF | DVYA | NYSE Arca |
• iShares Emerging Markets Dividend ETF | DVYE | NYSE Arca |
|

Rob Kapito
President, BlackRock Inc.
Dear Shareholder,
The combination of continued economic growth and cooling inflation provided a supportive backdrop for investors during the 12-month reporting period ended April 30, 2024. Higher interest rates helped to rein in inflation, and the Consumer Price Index decelerated substantially while remaining above pre-pandemic levels. A moderating labor market helped ease inflationary pressure, although wages continued to grow. Wage and job growth powered robust consumer spending, backstopping the economy. On October 7, 2023, Hamas launched a horrific attack on Israel. The ensuing war has had a significant humanitarian impact and could lead to heightened economic and market volatility. We see geopolitics as a structural market risk going forward. See our geopolitical risk dashboard at blackrock.com for more details.
Equity returns were robust during the period, as interest rates stabilized and the economy proved to be more resilient than many investors expected. The U.S. economy continued to show strength, and growth further accelerated in the second half of 2023. Large-capitalization U.S. stocks posted particularly substantial gains, supported by the performance of a few notable technology companies, while small-capitalization U.S. stocks’ advance was slower but still impressive. Meanwhile, both international developed market equities and emerging market stocks also gained, albeit at a notably slower pace than that of U.S. stocks.
The 10-year U.S. Treasury yield rose during the reporting period, driving its price down, as investors reacted to elevated inflation and attempted to anticipate future interest rate changes. However, higher yields drove solid gains in shorter-duration U.S. Treasuries. The corporate bond market benefited from improving economic sentiment, although high-yield corporate bond prices fared significantly better than investment-grade bonds as demand from yield-seeking investors remained strong.
The U.S. Federal Reserve (the “Fed”), attempting to manage persistent inflation, raised interest rates twice during the 12-month period, but paused its tightening after its July meeting. The Fed also continued to reduce its balance sheet by not replacing some of the securities that reach maturity.
Supply constraints appear to have become an embedded feature of the new macroeconomic environment, making it difficult for developed economies to increase production without sparking higher inflation. Geopolitical fragmentation and an aging population risk further exacerbating these constraints, keeping the labor market tight and wage growth high. Although the Fed has stopped tightening for now, we believe that the new economic regime means that the Fed will need to maintain high rates for an extended period, and recent statements from the Fed seem to support this view. In this new regime, we anticipate greater volatility and dispersion of returns, creating more opportunities for selective portfolio management.
Looking at developed market stocks, we have an overweight stance on U.S. stocks overall, particularly given the promise of emerging AI technologies. We are also overweight Japanese stocks as shareholder-friendly policies generate increased investor interest, although we maintain an underweight stance on European stocks. In credit, we believe there are selective opportunities in the near term despite tighter credit and financial conditions. For fixed income investing with a six- to twelve-month horizon, we see the most attractive investments in short-term U.S. Treasuries and hard-currency emerging market bonds.
Overall, our view is that investors need to think globally, position themselves to be prepared for a decarbonizing economy, and be nimble as market conditions change. We encourage you to talk with your financial advisor and visit iShares.com for further insight about investing in today’s markets.
Rob Kapito
President, BlackRock Inc.
Total Returns as of April 30, 2024 |
| | |
U.S. large cap equities
(S&P 500® Index) | | |
U.S. small cap equities
(Russell 2000® Index) | | |
International equities
(MSCI Europe, Australasia, Far East Index) | | |
Emerging market equities
(MSCI Emerging Markets Index) | | |
3-month Treasury bills
(ICE BofA 3-Month U.S. Treasury Bill Index) | | |
U.S. Treasury securities
(ICE BofA 10-Year U.S. Treasury Index) | | |
U.S. investment grade bonds
(Bloomberg U.S. Aggregate Bond Index) | | |
Tax-exempt municipal bonds
(Bloomberg Municipal Bond Index) | | |
U.S. high yield bonds
(Bloomberg U.S. Corporate High Yield 2% Issuer Capped Index) | | |
Past performance is not an indication of future results. Index performance is shown for illustrative purposes only. You cannot invest directly in an index. |
2This Page is not Part of Your Fund Report
iShares, Inc.
Global equity markets advanced during the 12 months ended April 30, 2024 (“reporting period”), supported by continued economic growth and moderating inflation in most parts of the world. The MSCI ACWI, a broad global equity index that includes both developed and emerging markets, returned 17.46% in U.S. dollar terms for the reporting period. Despite concerns about the impact of higher interest rates and rising prices, the global economy was resilient, posting moderate growth in 2023 at a similar pace to the prior year. Inflation began to subside in most regions of the world, as stabilizing energy prices and improved supply chains reduced pressure on consumers. However, geopolitical tensions were high during the reporting period, raising concerns about potential disruptions to the global economy. Fighting continued in Ukraine, and conflict erupted in Gaza following Hamas’ terrorist attack on Israel. Missile attacks on a major shipping lane in the Middle East raised concerns about a wider conflict while disrupting some supply chains.
Among developed economies, the U.S. stood out, growing at a robust pace in 2023 before slowing slightly in the first quarter of 2024. The U.S. consumer helped to power the expansion, as consumer spending continued to grow in both nominal and real (inflation-adjusted) terms. Consumers were emboldened by a strong labor market, as employers continued to add jobs, and average hourly wages increased notably. Consumer spending was also supported by higher asset values, as both home prices and strong equity performance increased household net worth and promoted spending. While improved supply chains eased goods inflation, the tight labor market kept labor costs near record highs, and growing services inflation was a significant driver of inflation’s overall persistence.
To counteract inflation, the U.S. Federal Reserve Bank (“Fed”) raised interest rates twice early in the reporting period, reaching the highest level since 2001. However, the Fed paused its interest rate increases thereafter as inflation edged down, keeping interest rates steady following its July 2023 meeting. The Fed also continued to decrease the size of its balance sheet by reducing the store of U.S. Treasuries it had accumulated to stabilize markets in the early phases of the coronavirus pandemic. While investors closely watched the Fed for signs of a shift toward lower interest rates, tenacious inflation later in the reporting period led investors to limit their expectations.
European stocks posted strong gains as energy prices stabilized, and inflation decelerated sharply. While growth in the Eurozone was nearly flat, the tepid economy meant that consumer spending grew slowly, leading to less upward pressure on prices. The European Central Bank (“ECB”) raised interest rates four times in the first half of the reporting period, but declined to increase interest rates thereafter, citing progress in lowering inflation.
Asia-Pacific region stocks also advanced, helped by the strong performance of Japanese equities. Japan returned to moderate growth in the fourth quarter of 2023 following a contraction in the third quarter. Solid exports, rising profits, and a series of corporate reforms bolstered Japanese stocks. However, Chinese equities were negatively impacted by investor concerns about government regulations and rising geopolitical tensions with the U.S. Meanwhile, emerging market stocks gained, helped by the pausing of interest rate increases from the Fed and the ECB. Stocks in India advanced significantly amid strong economic growth and robust corporate earnings, as India’s expanding middle class bolstered consumer spending.
42024 iShares Annual Report to Shareholders
Fund Summary as of April 30, 2024
iShares® Asia/Pacific Dividend ETF
Investment Objective
The iShares Asia/Pacific Dividend ETF (the “Fund”) seeks to track the investment results of an index composed of relatively high dividend paying equities in Asia/Pacific developed markets, as represented by the Dow Jones Asia/Pacific Select Dividend 50 IndexTM (the “Index”). The Fund invests in a representative sample of securities included in the Index that collectively has an investment profile similar to the Index. Due to the use of representative sampling, the Fund may or may not hold all of the securities that are included in the Index.
Performance
| Average Annual Total Returns | | |
| | | | | | | |
| | | | | | | |
| | | | | | | |
| | | | | | | |
GROWTH OF $10,000 INVESTMENT(AT NET ASSET VALUE)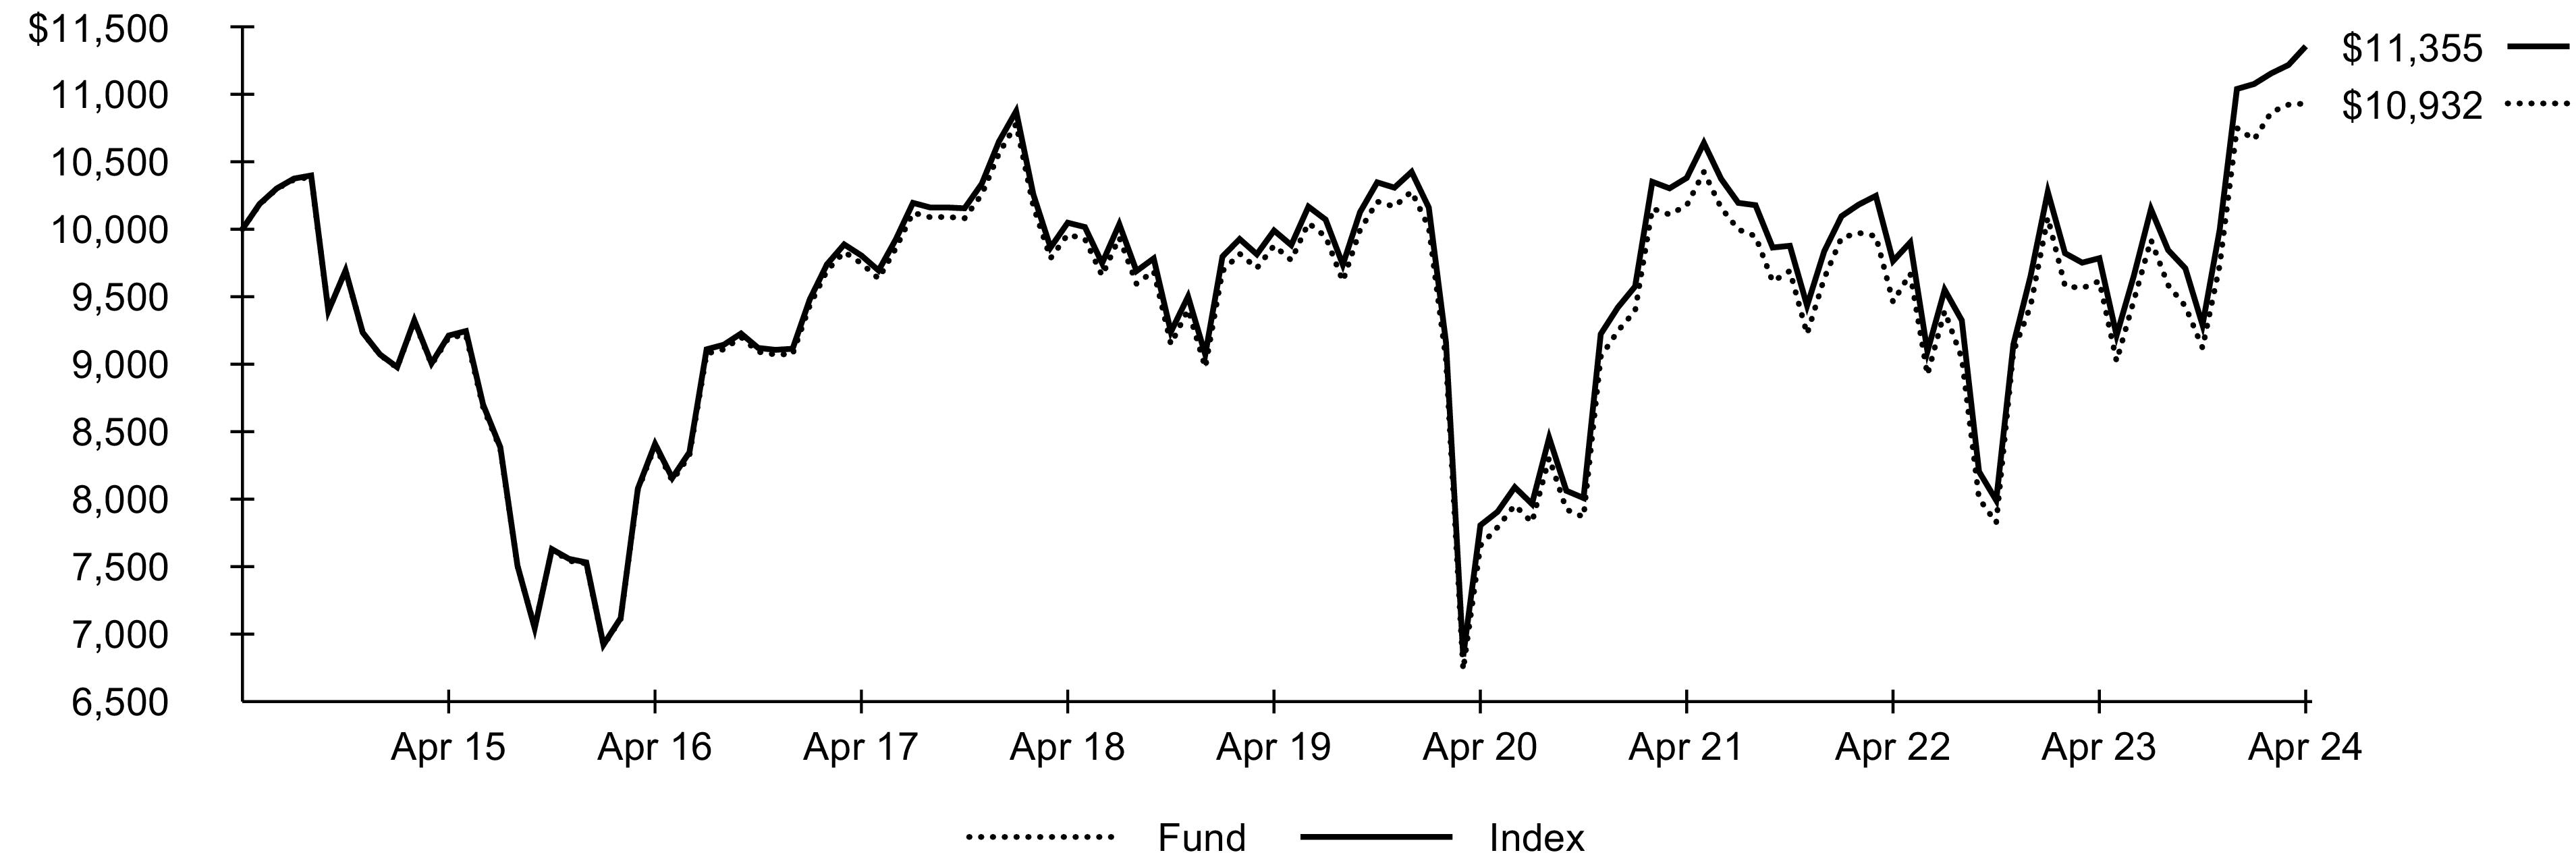
Past performance is not an indication of future results. Performance results do not reflect the deduction of taxes that a shareholder would pay on fund distributions or on the redemption or sale of fund shares. See “About Fund Performance” for more information.
Expense Example
| | |
Beginning
Account Value
(11/01/23) | Ending
Account Value
(04/30/24) | | Beginning
Account Value
(11/01/23) | Ending
Account Value
(04/30/24) | | |
| | | | | | |
| Expenses are equal to the annualized expense ratio, multiplied by the average account value over the period, multiplied by 182/366 (to reflect the one-half year period shown). Other fees, such as brokerage commissions and other fees to financial intermediaries, may be paid which are not reflected in the tables and examples above. See “Disclosure of Expenses” for more information. |
Fund Summary as of April 30, 2024 (continued)
iShares® Asia/Pacific Dividend ETF
Portfolio Management Commentary
Asia-Pacific dividend stocks advanced during the reporting period amid continued economic growth and disinflation in the region. The Australian consumer discretionary sector contributed the most to the Index’s return, led by the specialty retail industry. Homefurnishing retailers gained due to the strength of furniture orders and an easing in shipping delays that enabled faster delivery times. Also within specialty retail, investors rewarded a computer and electronics retailer for reporting profit declines that were less substantial than analysts anticipated. The Australian materials sector also contributed. In the construction materials industry, a maker of building materials advanced following a takeover offer from a French industrial giant looking to enter the Australian market. Higher iron ore prices buoyed steel companies in the Australian metals and mining industry. A weaker Australian dollar also boosted revenue for steel miners, as iron ore is typically sold in U.S. dollars.
The Japanese industrials sector further supported the Index’s performance, with notable strength in the marine transportation industry. Militant attacks on ships in the Red Sea prompted global shipping companies to reroute cargo shipments, adding days or weeks to international shipments and correspondingly raising the prices of moving goods by container ship, driving gains for Japanese marine transportation firms. Japan’s financials sector also advanced, as property and casualty insurance companies announced plans to eliminate cross-shareholdings (stock of one publicly traded company held by another publicly traded company), a move the Japanese government mandated to increase competition and improve corporate governance.
On the downside, Hong Kong’s real estate sector detracted from the Index’s return. A weakening housing market, burdened by falling demand amid rising interest rates, weighed on Hong Kong real estate management and development firms. A lowering of dividend payments in the wake of disappointing financial performance further dampened investor sentiment toward the industry.
Portfolio Information
GEOGRAPHIC ALLOCATION
Country/Geographic Region | |
| |
| |
| |
| |
| |
| Excludes money market funds. |
62024 iShares Annual Report to Shareholders
Fund Summary as of April 30, 2024
iShares® Emerging Markets Dividend ETF
Investment Objective
The iShares Emerging Markets Dividend ETF (the “Fund”) seeks to track the investment results of an index composed of relatively high dividend paying equities in emerging markets, as represented by the Dow Jones Emerging Markets Select Dividend IndexTM (the “Index”). The Fund invests in a representative sample of securities included in the Index that collectively has an investment profile similar to the Index. Due to the use of representative sampling, the Fund may or may not hold all of the securities that are included in the Index.
Performance
| Average Annual Total Returns | | |
| | | | | | | |
| | | | | | | |
| | | | | | | |
| | | | | | | |
GROWTH OF $10,000 INVESTMENT(AT NET ASSET VALUE)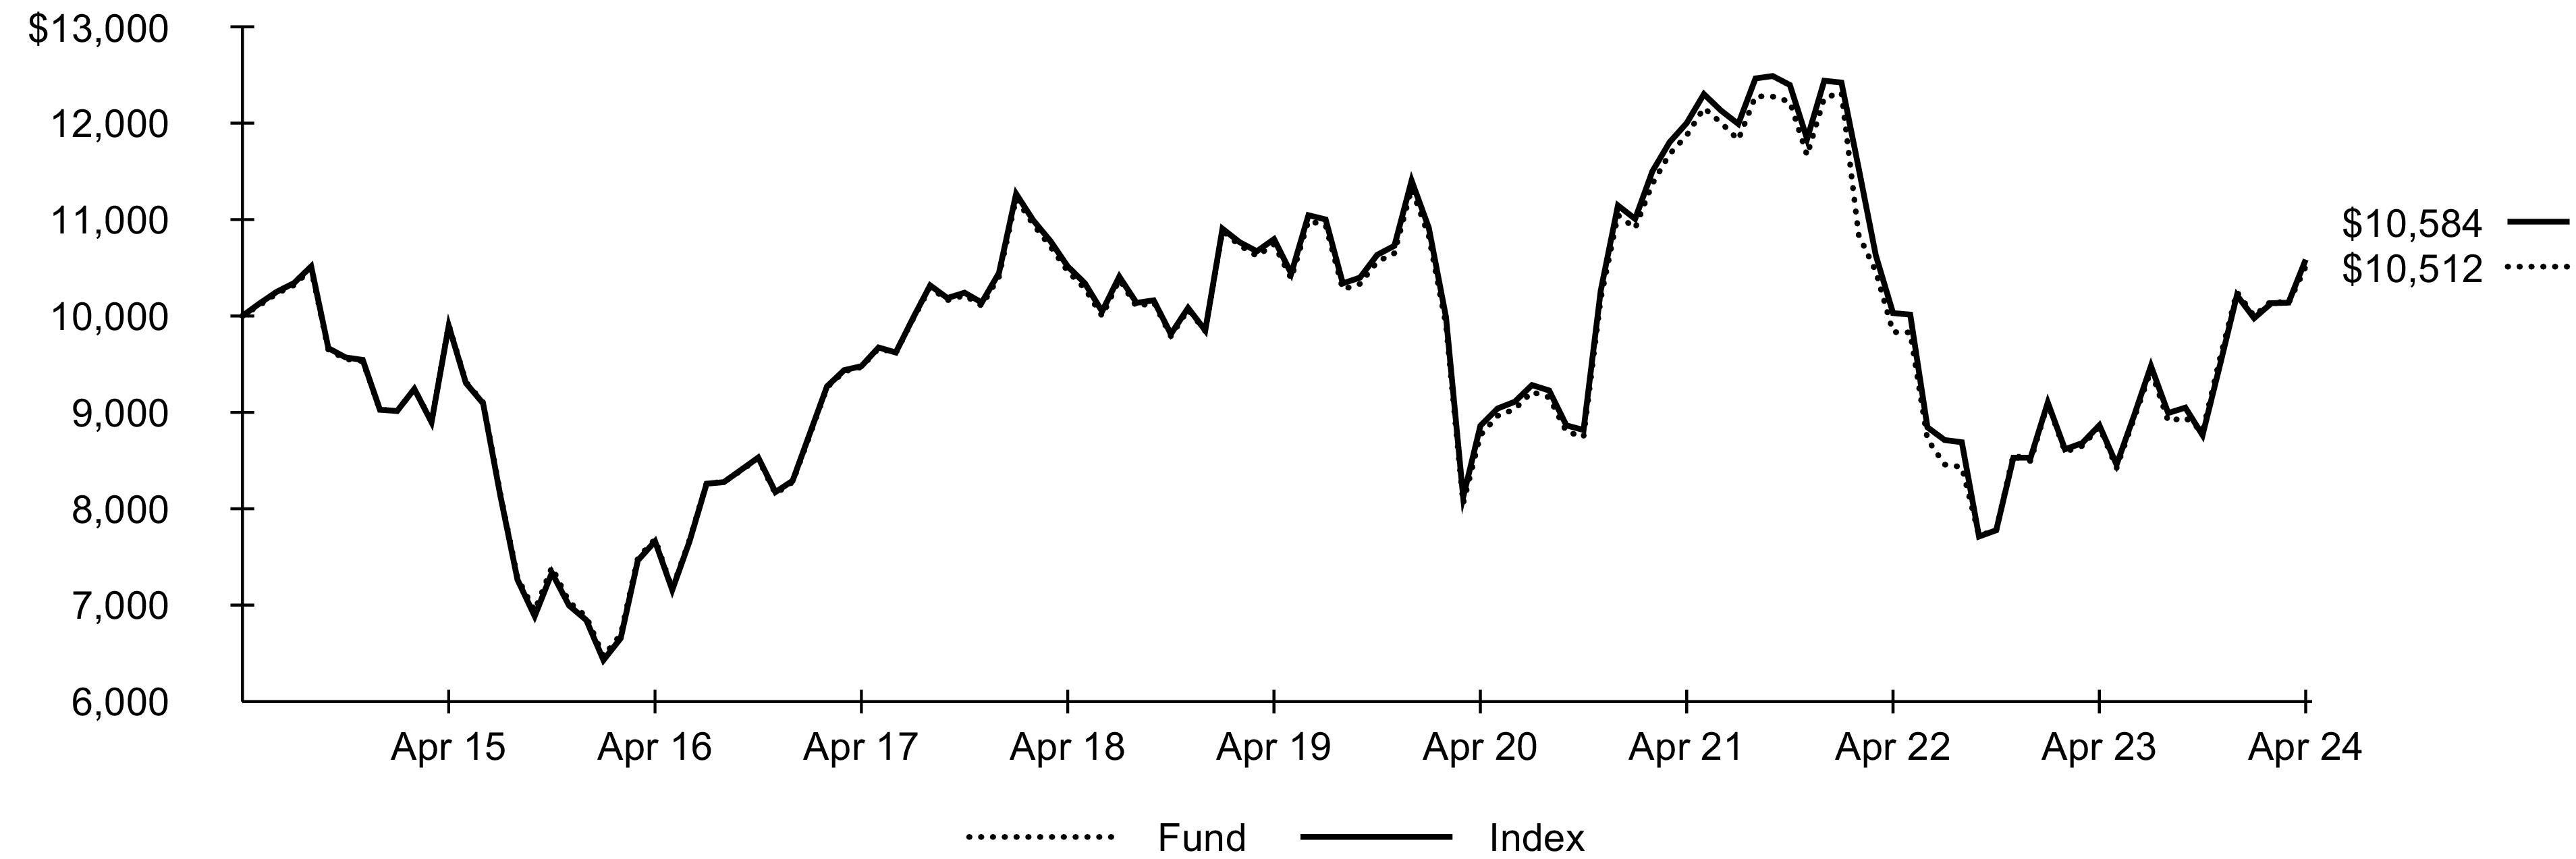
Past performance is not an indication of future results. Performance results do not reflect the deduction of taxes that a shareholder would pay on fund distributions or on the redemption or sale of fund shares. See “About Fund Performance” for more information.
Expense Example
| | |
Beginning
Account Value
(11/01/23) | Ending
Account Value
(04/30/24) | | Beginning
Account Value
(11/01/23) | Ending
Account Value
(04/30/24) | | |
| | | | | | |
| Expenses are equal to the annualized expense ratio, multiplied by the average account value over the period, multiplied by 182/366 (to reflect the one-half year period shown). Other fees, such as brokerage commissions and other fees to financial intermediaries, may be paid which are not reflected in the tables and examples above. See “Disclosure of Expenses” for more information. |
Fund Summary as of April 30, 2024 (continued)
iShares® Emerging Markets Dividend ETF
Portfolio Management Commentary
Emerging markets dividend stocks advanced strongly during the reporting period in an environment of faster economic growth for emerging market countries relative to their developed market counterparts. Equities in emerging markets found support from pauses in global central bank interest rate increases, relatively high commodities prices, and robust manufacturing and services output in response to strong global demand.
Indian stocks were the largest contributor to the Index’s performance, advancing sharply amid robust economic growth in what is now the world’s most populous nation. The Indian government’s investments in infrastructure and manufacturing incentives helped support the economy. The Indian energy sector contributed the most, as Indian oil and gas refining and marketing and transportation companies capitalized on the country’s increased imports of relatively inexpensive oil from Russia. This helped India grow its refining capabilities and its exports of products derived from refined crude. Increased production of coal to meet the nation’s rising demand for power buoyed the coal and consumable fuels industry, as did a slowdown in the rollout of renewable energy sources. The Indian financials sector also contributed, led by the specialized finance industry, as growing demand for financing of infrastructure projects benefited companies that finance these projects.
Taiwanese stocks also contributed to the Index’s return, helped by accelerating economic growth and rising exports. The Taiwanese information technology sector led the way, with particular strength in the technology hardware and equipment industry, as enthusiasm for products and services related to artificial intelligence (“AI”) propelled investor interest in Asia-based exporters of technology hardware. Taiwanese distributors of semiconductors and other electronic components benefited from robust demand for electronic components to power AI applications, along with rising prices for memory storage.
On the downside, Indonesian energy stocks detracted from the Index’s return. Lower coal prices weighed on the revenue of companies in the coal and consumable fuels industry despite record exports of Indonesian coal.
Portfolio Information
GEOGRAPHIC ALLOCATION
Country/Geographic Region | |
| |
| |
| |
| |
| |
| |
| |
| |
| |
| |
| Excludes money market funds. |
82024 iShares Annual Report to Shareholders
Past performance is not an indication of future results. Financial markets have experienced extreme volatility and trading in many instruments has been disrupted. These circumstances may continue for an extended period of time and may continue to affect adversely the value and liquidity of each Fund’s investments. As a result, current performance may be lower or higher than the performance data quoted. Performance data current to the most recent month-end is available at iShares.com. Performance results assume reinvestment of all dividends and capital gain distributions and do not reflect the deduction of taxes that a shareholder would pay on fund distributions or on the redemption or sale of fund shares. The investment return and principal value of shares will vary with changes in market conditions. Shares may be worth more or less than their original cost when they are redeemed or sold in the market. Performance for certain funds may reflect a waiver of a portion of investment advisory fees. Without such a waiver, performance would have been lower.
Net asset value or “NAV” is the value of one share of a fund as calculated in accordance with the standard formula for valuing mutual fund shares. Beginning August 10, 2020, the price used to calculate market return (“Market Price”) is the closing price. Prior to August 10, 2020, Market Price was determined using the midpoint between the highest bid and the lowest ask on the primary stock exchange on which shares of a fund are listed for trading, as of the time that such fund’s NAV is calculated. Market and NAV returns assume that dividends and capital gain distributions have been reinvested at Market Price and NAV, respectively.
An index is a statistical composite that tracks a specified financial market or sector. Unlike a fund, an index does not actually hold a portfolio of securities and therefore does not incur the expenses incurred by a fund. These expenses negatively impact fund performance. Also, index returns do not include brokerage commissions that may be payable on secondary market transactions. If brokerage commissions were included, index returns would be lower.
Disclosure of Expenses
Shareholders of each Fund may incur the following charges: (1) transactional expenses, including brokerage commissions on purchases and sales of fund shares and (2) ongoing expenses, including management fees and other fund expenses. The expense examples shown (which are based on a hypothetical investment of $1,000 invested at the beginning of the period and held through the end of the period) are intended to assist shareholders both in calculating expenses based on an investment in each Fund and in comparing these expenses with similar costs of investing in other funds.
The expense examples provide information about actual account values and actual expenses. Annualized expense ratios reflect contractual and voluntary fee waivers, if any. In order to estimate the expenses a shareholder paid during the period covered by this report, shareholders can divide their account value by $1,000 and then multiply the result by the number under the heading entitled “Expenses Paid During the Period.”
The expense examples also provide information about hypothetical account values and hypothetical expenses based on a fund’s actual expense ratio and an assumed rate of return of 5% per year before expenses. In order to assist shareholders in comparing the ongoing expenses of investing in the Funds and other funds, compare the 5% hypothetical examples with the 5% hypothetical examples that appear in the shareholder reports of the other funds.
The expenses shown in the expense examples are intended to highlight shareholders’ ongoing costs only and do not reflect any transactional expenses, such as brokerage commissions and other fees paid on purchases and sales of fund shares. Therefore, the hypothetical examples are useful in comparing ongoing expenses only and will not help shareholders determine the relative total expenses of owning different funds. If these transactional expenses were included, shareholder expenses would have been higher.
About Fund Performance/Disclosure of Expenses9
Schedule of InvestmentsApril 30, 2024
iShares® Asia/Pacific Dividend ETF(Percentages shown are based on Net Assets)
| | |
|
|
| | |
| | |
| | |
Bendigo & Adelaide Bank Ltd. | | |
| | |
| | |
| | |
| | |
| | |
Harvey Norman Holdings Ltd. | | |
| | |
| | |
Magellan Financial Group Ltd. | | |
| | |
| | |
| | |
| | |
| | |
| | |
Viva Energy Group Ltd.(a) | | |
| | |
| | |
|
BOC Hong Kong Holdings Ltd. | | |
| | |
CK Hutchison Holdings Ltd. | | |
CK Infrastructure Holdings Ltd. | | |
| | |
Henderson Land Development Co. Ltd. | | |
Hongkong Land Holdings Ltd. | | |
Hysan Development Co. Ltd. | | |
Jardine Matheson Holdings Ltd. | | |
| | |
New World Development Co. Ltd.(b) | | |
| | |
Power Assets Holdings Ltd. | | |
| | |
Sun Hung Kai Properties Ltd. | | |
Swire Pacific Ltd., Class A | | |
| | |
| | |
|
| | |
| | |
| | |
Nishimatsu Construction Co. Ltd. | | |
| | |
|
| | |
| | |
|
DBS Group Holdings Ltd.(b) | | |
Jardine Cycle & Carriage Ltd.(b) | | |
| | |
Oversea-Chinese Banking Corp. Ltd. | | |
United Overseas Bank Ltd. | | |
| | |
Wilmar International Ltd. | | |
| | |
Total Common Stocks — 99.3%
(Cost: $42,425,452) | |
|
|
Magellan Financial Group Ltd. (Issued/Exercisable 04/14/22, 1 Share for 1 Warrant, Expires 04/16/27, Strike Price AUD 35.00)(c) | | |
Total Warrants — 0.0%
(Cost: $—) | |
Total Long-Term Investments — 99.3%
(Cost: $42,425,452) | |
|
Money Market Funds — 0.8% |
BlackRock Cash Funds: Institutional, SL Agency Shares, 5.49%(d)(e)(f) | | |
BlackRock Cash Funds: Treasury, SL Agency Shares, 5.28%(d)(e) | | |
Total Short-Term Securities — 0.8%
(Cost: $342,475) | |
Total Investments — 100.1%
(Cost: $42,767,927) | |
Liabilities in Excess of Other Assets — (0.1)% | |
| |
| Security exempt from registration pursuant to Rule 144A under the Securities Act of 1933, as amended. These securities may be resold in transactions exempt from registration to qualified institutional investors. |
| All or a portion of this security is on loan. |
| Non-income producing security. |
| |
| Annualized 7-day yield as of period end. |
| All or a portion of this security was purchased with the cash collateral from loaned securities. |
102024 iShares Annual Report to Shareholders
Schedule of Investments (continued)April 30, 2024
iShares® Asia/Pacific Dividend ETF
Affiliates
Investments in issuers considered to be affiliate(s) of the Fund during the year ended April 30, 2024 for purposes of Section 2(a)(3) of the Investment Company Act of 1940, as amended, were as follows:
| | | | | Change in
Unrealized
Appreciation
(Depreciation) | | | | Capital
Gain
Distributions
from
Underlying
Funds |
BlackRock Cash Funds: Institutional, SL Agency Shares | | | | | | | | | |
BlackRock Cash Funds: Treasury, SL Agency Shares | | | | | | | | | |
| | | | | | | | | |
| Represents net amount purchased (sold). |
| All or a portion represents securities lending income earned from the reinvestment of cash collateral from loaned securities, net of fees and collateral investment expenses, and other payments to and from borrowers of securities. |
Derivative Financial Instruments Outstanding as of Period End
Futures Contracts
| | | | Value/
Unrealized
Appreciation
(Depreciation) |
| | | | |
| | | | |
| | | | |
| | | | |
Derivative Financial Instruments Categorized by Risk Exposure
As of period end, the fair values of derivative financial instruments located in the Statements of Assets and Liabilities were as follows:
| | | | Foreign
Currency
Exchange
Contracts | | | |
Liabilities—Derivative Financial Instruments | | | | | | | |
| | | | | | | |
Unrealized depreciation on futures contracts(a) | | | | | | | |
| Net cumulative unrealized appreciation (depreciation) on futures contracts are reported in the Schedule of Investments. In the Statements of Assets and Liabilities, only current day's variation margin is reported in receivables or payables and the net cumulative unrealized appreciation (depreciation) is included in accumulated earnings (loss). |
For the period ended April 30, 2024, the effect of derivative financial instruments in the Statements of Operations was as follows:
| | | | Foreign
Currency
Exchange
Contracts | | | |
Net Realized Gain (Loss) from | | | | | | | |
| | | | | | | |
Net Change in Unrealized Appreciation (Depreciation) on | | | | | | | |
| | | | | | | |
Average Quarterly Balances of Outstanding Derivative Financial Instruments
| |
Average notional value of contracts — long | |
Schedule of Investments11
Schedule of Investments (continued)April 30, 2024
iShares® Asia/Pacific Dividend ETF
For more information about the Fund’s investment risks regarding derivative financial instruments, refer to the Notes to Financial Statements.
Fair Value Hierarchy as of Period End
Various inputs are used in determining the fair value of financial instruments. For a description of the input levels and information about the Fund’s policy regarding valuation of financial instruments, refer to the Notes to Financial Statements.
The following table summarizes the Fund’s financial instruments categorized in the fair value hierarchy. The breakdown of the Fund’s financial instruments into major categories is disclosed in the Schedule of Investments above.
| | | | |
| | | | |
| | | | |
| | | | |
| | | | |
| | | | |
| | | | |
| | | | |
| | | | |
Derivative Financial Instruments(a) | | | | |
| | | | |
| | | | |
| Derivative financial instruments are futures contracts. Futures contracts are valued at the unrealized appreciation (depreciation) on the instrument. |
See notes to financial statements.
122024 iShares Annual Report to Shareholders
Schedule of InvestmentsApril 30, 2024
iShares® Emerging Markets Dividend ETF(Percentages shown are based on Net Assets)
| | |
|
|
Banco Santander Brasil SA | | |
BB Seguridade Participacoes SA | | |
Cia de Saneamento de Minas Gerais Copasa MG | | |
Cia. Siderurgica Nacional SA | | |
| | |
| | |
| | |
| | |
| | |
| | |
Transmissora Alianca de Energia Eletrica SA | | |
| | |
| | |
|
| | |
Cia. Sud Americana de Vapores SA | | |
| | |
| | |
| | |
|
Agricultural Bank of China Ltd., Class H | | |
Anhui Conch Cement Co. Ltd., Class H | | |
BAIC Motor Corp. Ltd., Class H(a) | | |
Bank of China Ltd., Class H | | |
Beijing Enterprises Water Group Ltd.(b) | | |
China Cinda Asset Management Co. Ltd., Class H | | |
China CITIC Bank Corp. Ltd., Class H | | |
China Construction Bank Corp., Class H | | |
China Hongqiao Group Ltd.(b) | | |
China Jinmao Holdings Group Ltd. | | |
China Merchants Port Holdings Co. Ltd. | | |
China Minsheng Banking Corp. Ltd., Class H | | |
China National Building Material Co. Ltd., Class H | | |
China Petroleum & Chemical Corp., Class H | | |
China Shenhua Energy Co. Ltd., Class H | | |
Chongqing Rural Commercial Bank Co. Ltd., Class H | | |
Guangdong Investment Ltd. | | |
Huadian Power International Corp. Ltd., Class H(b) | | |
Industrial & Commercial Bank of China Ltd., Class H | | |
Kingboard Laminates Holdings Ltd. | | |
Longfor Group Holdings Ltd.(a)(b) | | |
Orient Overseas International Ltd. | | |
PICC Property & Casualty Co. Ltd., Class H | | |
Yankuang Energy Group Co. Ltd., Class H | | |
Yuexiu Property Co. Ltd.(b) | | |
Zhejiang Expressway Co. Ltd., Class H | | |
| | |
|
| | |
| | |
| | |
|
Hellenic Energy Holdings SA | | |
| | |
| | |
| | |
| | |
|
SITC International Holdings Co. Ltd.(b) | | |
|
| | |
| | |
| | |
| | |
| | |
|
Adaro Energy Indonesia Tbk PT | | |
Astra International Tbk PT | | |
| | |
Indo Tambangraya Megah Tbk PT | | |
| | |
| | |
|
National Investments Co. KSCP | | |
|
| | |
|
| | |
| | |
| | |
|
| | |
|
Federal Grid Co. Rosseti PJSC(c)(d) | | |
GMK Norilskiy Nickel PAO(c)(d) | | |
| | |
Magnitogorsk Iron & Steel Works PJSC(c)(d) | | |
Mobile TeleSystems PJSC(c)(d) | | |
Moscow Exchange MICEX-RTS PJSC(c)(d) | | |
Novolipetsk Steel PJSC(c)(d) | | |
| | |
| | |
| | |
Sberbank of Russia PJSC(c)(d) | | |
| | |
| | |
| | |
| | |
|
African Rainbow Minerals Ltd. | | |
| | |
| | |
Truworths International Ltd. | | |
| | |
|
Evergreen Marine Corp. Taiwan Ltd. | | |
Himax Technologies Inc., ADR | | |
Merry Electronics Co. Ltd. | | |
Novatek Microelectronics Corp. | | |
Radiant Opto-Electronics Corp. | | |
Simplo Technology Co. Ltd. | | |
Sitronix Technology Corp. | | |
Supreme Electronics Co. Ltd. | | |
| | |
T3EX Global Holdings Corp. | | |
United Integrated Services Co. Ltd. | | |
Schedule of Investments13
Schedule of Investments (continued)April 30, 2024
iShares® Emerging Markets Dividend ETF(Percentages shown are based on Net Assets)
| | |
|
Wisdom Marine Lines Co. Ltd. | | |
| | |
| | |
|
| | |
Kiatnakin Phatra Bank PCL, NVDR | | |
| | |
| | |
Sri Trang Agro-Industry PCL, NVDR | | |
Thanachart Capital PCL, NVDR | | |
Tisco Financial Group PCL, NVDR | | |
| | |
|
Dogus Otomotiv Servis ve Ticaret AS | | |
United Arab Emirates — 1.0% |
| | |
Total Common Stocks — 84.6%
(Cost: $661,232,075) | |
|
|
Bradespar SA, Preference Shares, NVS | | |
Cia. Energetica de Minas Gerais, Preference Shares, NVS | | |
CTEEP-Cia. de Transmissao de Energia Eletrica Paulista, Preference Shares, NVS | | |
Gerdau SA, Preference Shares, NVS | | |
Metalurgica Gerdau SA, Preference Shares, NVS | | |
Petroleo Brasileiro SA, Preference Shares, NVS | | |
Unipar Carbocloro SA, Class B, Preference Shares, NVS | | |
| | |
|
Sociedad Quimica y Minera de Chile SA, Class B, Preference Shares | | |
| | |
|
Bancolombia SA, Preference Shares, NVS | | |
|
Transneft PJSC, Preference Shares, NVS(c)(d) | | |
Total Preferred Stocks — 14.9%
(Cost: $108,404,197) | |
Total Long-Term Investments — 99.5%
(Cost: $769,636,272) | |
|
Money Market Funds — 3.6% |
BlackRock Cash Funds: Institutional, SL Agency Shares, 5.49%(e)(f)(g) | | |
Total Short-Term Securities — 3.6%
(Cost: $24,901,114) | |
Total Investments — 103.1%
(Cost: $794,537,386) | |
Liabilities in Excess of Other Assets — (3.1)% | |
| |
| Security exempt from registration pursuant to Rule 144A under the Securities Act of 1933, as amended. These securities may be resold in transactions exempt from registration to qualified institutional investors. |
| All or a portion of this security is on loan. |
| Security is valued using significant unobservable inputs and is classified as Level 3 in the fair value hierarchy. |
| Non-income producing security. |
| |
| Annualized 7-day yield as of period end. |
| All or a portion of this security was purchased with the cash collateral from loaned securities. |
Affiliates
Investments in issuers considered to be affiliate(s) of the Fund during the year ended April 30, 2024 for purposes of Section 2(a)(3) of the Investment Company Act of 1940, as amended, were as follows:
| | | | | Change in
Unrealized
Appreciation
(Depreciation) | | | | Capital
Gain
Distributions
from
Underlying
Funds |
BlackRock Cash Funds: Institutional, SL Agency Shares | | | | | | | | | |
BlackRock Cash Funds: Treasury, SL Agency Shares | | | | | | | | | |
| | | | | | | | | |
| Represents net amount purchased (sold). |
| All or a portion represents securities lending income earned from the reinvestment of cash collateral from loaned securities, net of fees and collateral investment expenses, and other payments to and from borrowers of securities. |
142024 iShares Annual Report to Shareholders
Schedule of Investments (continued)April 30, 2024
iShares® Emerging Markets Dividend ETF
Derivative Financial Instruments Outstanding as of Period End
Futures Contracts
| | | | Value/
Unrealized
Appreciation
(Depreciation) |
| | | | |
MSCI Emerging Markets Index | | | | |
Derivative Financial Instruments Categorized by Risk Exposure
As of period end, the fair values of derivative financial instruments located in the Statements of Assets and Liabilities were as follows:
| | | | Foreign
Currency
Exchange
Contracts | | | |
Assets—Derivative Financial Instruments | | | | | | | |
| | | | | | | |
Unrealized appreciation on futures contracts(a) | | | | | | | |
| Net cumulative unrealized appreciation (depreciation) on futures contracts are reported in the Schedule of Investments. In the Statements of Assets and Liabilities, only current day's variation margin is reported in receivables or payables and the net cumulative unrealized appreciation (depreciation) is included in accumulated earnings (loss). |
For the period ended April 30, 2024, the effect of derivative financial instruments in the Statements of Operations was as follows:
| | | | Foreign
Currency
Exchange
Contracts | | | |
Net Realized Gain (Loss) from | | | | | | | |
| | | | | | | |
Net Change in Unrealized Appreciation (Depreciation) on | | | | | | | |
| | | | | | | |
Average Quarterly Balances of Outstanding Derivative Financial Instruments
| |
Average notional value of contracts — long | |
For more information about the Fund’s investment risks regarding derivative financial instruments, refer to the Notes to Financial Statements.
Fair Value Hierarchy as of Period End
Various inputs are used in determining the fair value of financial instruments. For a description of the input levels and information about the Fund’s policy regarding valuation of financial instruments, refer to the Notes to Financial Statements.
The following table summarizes the Fund’s financial instruments categorized in the fair value hierarchy. The breakdown of the Fund’s financial instruments into major categories is disclosed in the Schedule of Investments above.
Schedule of Investments15
Schedule of Investments (continued)April 30, 2024
iShares® Emerging Markets Dividend ETF
Fair Value Hierarchy as of Period End (continued)
| | | | |
Derivative Financial Instruments(a) | | | | |
| | | | |
| | | | |
| Derivative financial instruments are futures contracts. Futures contracts are valued at the unrealized appreciation (depreciation) on the instrument. |
See notes to financial statements.
162024 iShares Annual Report to Shareholders
Statements of Assets and LiabilitiesApril 30, 2024
| iShares
Asia/Pacific Dividend ETF | iShares
Emerging Markets Dividend ETF |
| | |
Investments, at value—unaffiliated(a)(b) | | |
Investments, at value—affiliated(c) | | |
| | |
Cash pledged for futures contracts | | |
Foreign currency collateral pledged for futures contracts(d) | | |
Foreign currency, at value(e) | | |
| | |
| | |
Securities lending income—affiliated | | |
| | |
| | |
| | |
Variation margin on futures contracts | | |
| | |
| | |
| | |
Collateral on securities loaned, at value | | |
| | |
| | |
Deferred foreign capital gain tax | | |
| | |
| | |
Variation margin on futures contracts | | |
| | |
Commitments and contingent liabilities | | |
| | |
| | |
| | |
| | |
| | |
| | |
| | |
| | |
| | |
| | |
(a) Investments, at cost—unaffiliated | | |
(b) Securities loaned, at value | | |
(c) Investments, at cost—affiliated | | |
(d) Foreign currency collateral pledged, at cost | | |
(e) Foreign currency, at cost | | |
See notes to financial statements.
Statements of OperationsYear Ended April 30, 2024
| iShares
Asia/Pacific Dividend ETF | iShares
Emerging Markets Dividend ETF |
| | |
| | |
| | |
| | |
Securities lending income—affiliated—net | | |
Other income—unaffiliated | | |
| | |
| | |
| | |
| | |
| | |
| | |
| | |
| | |
| | |
Investment advisory fees waived | | |
Total expenses after fees waived | | |
| | |
REALIZED AND UNREALIZED GAIN (LOSS) | | |
Net realized gain (loss) from: | | |
Investments—unaffiliated(a) | | |
| | |
Foreign currency transactions | | |
| | |
In-kind redemptions—unaffiliated(b) | | |
| | |
Net change in unrealized appreciation (depreciation) on: | | |
Investments—unaffiliated(c) | | |
| | |
Foreign currency translations | | |
| | |
| | |
Net realized and unrealized gain | | |
NET INCREASE IN NET ASSETS RESULTING FROM OPERATIONS | | |
(a) Net of foreign capital gain tax and capital gain tax refund, if applicable of | | |
(b) See Note 2 of the Notes to Financial Statements. |
(c) Net of increase in deferred foreign capital gain tax of | | |
See notes to financial statements.
182024 iShares Annual Report to Shareholders
Statements of Changes in Net Assets
| iShares
Asia/Pacific Dividend ETF | iShares
Emerging Markets Dividend ETF |
| | | | |
INCREASE (DECREASE) IN NET ASSETS | | | | |
| | | | |
| | | | |
| | | | |
Net change in unrealized appreciation (depreciation) | | | | |
Net increase (decrease) in net assets resulting from operations | | | | |
DISTRIBUTIONS TO SHAREHOLDERS(a) | | | | |
Decrease in net assets resulting from distributions to shareholders | | | | |
CAPITAL SHARE TRANSACTIONS | | | | |
Net increase (decrease) in net assets derived from capital share transactions | | | | |
| | | | |
Total increase (decrease) in net assets | | | | |
| | | | |
| | | | |
| Distributions for annual periods determined in accordance with U.S. federal income tax regulations. |
See notes to financial statements.
Financial Highlights(For a share outstanding throughout each period)
| iShares Asia/Pacific Dividend ETF |
| | | | | |
Net asset value, beginning of year | | | | | |
| | | | | |
Net realized and unrealized gain (loss)(b) | | | | | |
Net increase (decrease) from investment operations | | | | | |
Distributions from net investment income(c) | | | | | |
Net asset value, end of year | | | | | |
| | | | | |
| | | | | |
Ratios to Average Net Assets(e) | | | | | |
| | | | | |
Total expenses after fees waived | | | | | |
| | | | | |
| | | | | |
Net assets, end of year (000) | | | | | |
Portfolio turnover rate(f) | | | | | |
(a) Based on average shares outstanding. |
(b) The amounts reported for a share outstanding may not accord with the change in aggregate gains and losses in securities for the fiscal period due to the timing of capital share transactions in relation to the fluctuating market values of the Fund’s underlying securities. |
(c) Distributions for annual periods determined in accordance with U.S. federal income tax regulations. |
(d) Where applicable, assumes the reinvestment of distributions. |
(e) Excludes fees and expenses incurred indirectly as a result of investments in underlying funds. |
(f) Portfolio turnover rate excludes in-kind transactions, if any. |
See notes to financial statements.
202024 iShares Annual Report to Shareholders
Financial Highlights(continued)(For a share outstanding throughout each period)
| iShares Emerging Markets Dividend ETF |
| | | | | |
Net asset value, beginning of year | | | | | |
| | | | | |
Net realized and unrealized gain (loss)(b) | | | | | |
Net increase (decrease) from investment operations | | | | | |
Distributions from net investment income(c) | | | | | |
Net asset value, end of year | | | | | |
| | | | | |
| | | | | |
Ratios to Average Net Assets(f) | | | | | |
| | | | | |
| | | | | |
| | | | | |
Net assets, end of year (000) | | | | | |
Portfolio turnover rate(h) | | | | | |
(a) Based on average shares outstanding. |
(b) The amounts reported for a share outstanding may not accord with the change in aggregate gains and losses in securities for the fiscal period due to the timing of capital share transactions in relation to the fluctuating market values of the Fund’s underlying securities. |
(c) Distributions for annual periods determined in accordance with U.S. federal income tax regulations. |
(d) Where applicable, assumes the reinvestment of distributions. |
(e) Includes payment received from an affiliate, which impacted the Fund’s total return. Excluding the payment from an affiliate, the Fund’s total return would have been (17.17)%. |
(f) Excludes fees and expenses incurred indirectly as a result of investments in underlying funds. |
(g) Reflects positive effect of foreign withholding tax claims, net of the associated professional fees, which resulted in the following increases for the years ended April 30, 2022 and April 30, 2021, respectively : • Ratio of net investment income to average net assets by 0.01% and 0.02%, respectively. |
(h) Portfolio turnover rate excludes in-kind transactions, if any. |
See notes to financial statements.
Notes to Financial Statements
1. ORGANIZATION
iShares, Inc. (the “Company”) is registered under the Investment Company Act of 1940, as amended (the “1940 Act”), as an open-end management investment company. The Company is organized as a Maryland corporation and is authorized to have multiple series or portfolios.
These financial statements relate only to the following funds (each, a “Fund” and collectively, the “Funds”):
| Diversification
Classification |
| |
Emerging Markets Dividend(a) | |
| The Fund intends to be diversified in approximately the same proportion as its underlying index is diversified. The Fund may become non-diversified, as defined in the 1940 Act, solely as a result of a change in relative market capitalization or index weighting of one or more constituents of its underlying index. Shareholder approval will not be sought if the Fund crosses from diversified to non-diversified status due solely to a change in its relative market capitalization or index weighting of one or more constituents of its underlying index. |
2. SIGNIFICANT ACCOUNTING POLICIES
The financial statements are prepared in conformity with accounting principles generally accepted in the United States of America (“U.S. GAAP”), which may require management to make estimates and assumptions that affect the reported amounts of assets and liabilities in the financial statements, disclosure of contingent assets and liabilities at the date of the financial statements and the reported amounts of increases and decreases in net assets from operations during the reporting period. Actual results could differ from those estimates. Each Fund is considered an investment company under U.S. GAAP and follows the accounting and reporting guidance applicable to investment companies. Below is a summary of significant accounting policies:
Investment Transactions and Income Recognition: For financial reporting purposes, investment transactions are recorded on the dates the transactions are executed. Realized gains and losses on investment transactions are determined using the specific identification method. Dividend income and capital gain distributions, if any, are recorded on the ex-dividend date. Non-cash dividends, if any, are recorded on the ex-dividend date at fair value. Dividends from foreign securities where the ex-dividend date may have passed are subsequently recorded when the Funds are informed of the ex-dividend date. Under the applicable foreign tax laws, a withholding tax at various rates may be imposed on capital gains, dividends and interest.
Foreign Currency Translation: Each Fund's books and records are maintained in U.S. dollars. Securities and other assets and liabilities denominated in foreign currencies are translated into U.S. dollars using prevailing market rates as quoted by one or more data service providers. Purchases and sales of investments are recorded at the rates of exchange prevailing on the respective dates of such transactions. Generally, when the U.S. dollar rises in value against a foreign currency, the investments denominated in that currency will lose value; the opposite effect occurs if the U.S. dollar falls in relative value.
Each Fund does not isolate the effect of fluctuations in foreign exchange rates from the effect of fluctuations in the market prices of investments for financial reporting purposes. Accordingly, the effects of changes in exchange rates on investments are not segregated in the Statements of Operations from the effects of changes in market prices of those investments, but are included as a component of net realized and unrealized gain (loss) from investments. Each Fund reports realized currency gains (losses) on foreign currency related transactions as components of net realized gain (loss) for financial reporting purposes, whereas such components are generally treated as ordinary income for U.S. federal income tax purposes.
Foreign Taxes: The Funds may be subject to foreign taxes (a portion of which may be reclaimable) on income, stock dividends, capital gains on investments, or certain foreign currency transactions. All foreign taxes are recorded in accordance with the applicable foreign tax regulations and rates that exist in the foreign jurisdictions in which each Fund invests. These foreign taxes, if any, are paid by each Fund and are reflected in its Statements of Operations as follows: foreign taxes withheld at source are presented as a reduction of income, foreign taxes on securities lending income are presented as a reduction of securities lending income, foreign taxes on stock dividends are presented as “Other foreign taxes”, and foreign taxes on capital gains from sales of investments and foreign taxes on foreign currency transactions are included in their respective net realized gain (loss) categories. Foreign taxes payable or deferred as of April 30, 2024, if any, are disclosed in the Statements of Assets and Liabilities.
The Funds file withholding tax reclaims in certain jurisdictions to recover a portion of amounts previously withheld. The Funds may record a reclaim receivable based on collectability, which includes factors such as the jurisdiction’s applicable laws, payment history and market convention. The Statements of Operations includes tax reclaims recorded as well as professional and other fees, if any, associated with recovery of foreign withholding taxes.
Bank Overdraft: Certain Funds had outstanding cash disbursements exceeding deposited cash amounts at the custodian during the reporting period. The Funds are obligated to repay the custodian for any overdraft, including any related costs or expenses, where applicable. For financial reporting purposes, overdraft fees, if any, are included in interest expense in the Statements of Operations.
Collateralization: If required by an exchange or counterparty agreement, the Funds may be required to deliver/deposit cash and/or securities to/with an exchange, or broker-dealer or custodian as collateral for certain investments.
In-kind Redemptions: For financial reporting purposes, in-kind redemptions are treated as sales of securities resulting in realized capital gains or losses to the Funds. Because such gains or losses are not taxable to the Funds and are not distributed to existing Fund shareholders, the gains or losses are reclassified from accumulated net realized gain (loss) to paid-in capital at the end of the Funds’ tax year. These reclassifications have no effect on net assets or net asset value (“NAV”) per share.
222024 iShares Annual Report to Shareholders
Notes to Financial Statements (continued)
Distributions: Dividends and distributions paid by each Fund are recorded on the ex-dividend dates. Distributions are determined on a tax basis and may differ from net investment income and net realized capital gains for financial reporting purposes. Dividends and distributions are paid in U.S. dollars and cannot be automatically reinvested in additional shares of the Funds.
Indemnifications: In the normal course of business, each Fund enters into contracts that contain a variety of representations that provide general indemnification. The Funds’ maximum exposure under these arrangements is unknown because it involves future potential claims against the Funds, which cannot be predicted with any certainty.
3. INVESTMENT VALUATION AND FAIR VALUE MEASUREMENTS
Investment Valuation Policies: Each Fund’s investments are valued at fair value (also referred to as “market value” within the financial statements) each day that the Fund’s listing exchange is open and, for financial reporting purposes, as of the report date. U.S. GAAP defines fair value as the price a fund would receive to sell an asset or pay to transfer a liability in an orderly transaction between market participants at the measurement date. The Board of Directors of the Company (the “Board”) of each Fund has approved the designation of BlackRock Fund Advisors (“BFA”), the Funds’ investment adviser, as the valuation designee for each Fund. Each Fund determines the fair values of its financial instruments using various independent dealers or pricing services under BFA’s policies. If a security’s market price is not readily available or does not otherwise accurately represent the fair value of the security, the security will be valued in accordance with BFA’s policies and procedures as reflecting fair value. BFA has formed a committee (the “Valuation Committee”) to develop pricing policies and procedures and to oversee the pricing function for all financial instruments, with assistance from other BlackRock pricing committees.
Fair Value Inputs and Methodologies: The following methods and inputs are used to establish the fair value of each Fund’s assets and liabilities:
• Equity investments traded on a recognized securities exchange are valued at that day’s official closing price, as applicable, on the exchange where the stock is primarily traded. Equity investments traded on a recognized exchange for which there were no sales on that day are valued at the last traded price.
• Investments in open-end U.S. mutual funds (including money market funds) are valued at that day’s published NAV.
• Futures contracts are valued based on that day’s last reported settlement or trade price on the exchange where the contract is traded.
Generally, trading in foreign instruments is substantially completed each day at various times prior to the close of trading on the New York Stock Exchange (“NYSE”). Each business day, the Funds use current market factors supplied by independent pricing services to value certain foreign instruments (“Systematic Fair Value Price”). The Systematic Fair Value Price is designed to value such foreign securities at fair value as of the close of trading on the NYSE, which follows the close of the local markets.
If events (e.g., market volatility, company announcement or a natural disaster) occur that are expected to materially affect the value of such investment, or in the event that application of these methods of valuation results in a price for an investment that is deemed not to be representative of the market value of such investment, or if a price is not available, the investment will be valued by the Valuation Committee, in accordance with BFA’s policies and procedures as reflecting fair value (“Fair Valued Investments”). The fair valuation approaches that may be used by the Valuation Committee include market approach, income approach and cost approach. Valuation techniques such as discounted cash flow, use of market comparables and matrix pricing are types of valuation approaches and are typically used in determining fair value. When determining the price for Fair Valued Investments, the Valuation Committee seeks to determine the price that each Fund might reasonably expect to receive or pay from the current sale or purchase of that asset or liability in an arm’s-length transaction. Fair value determinations shall be based upon all available factors that the Valuation Committee deems relevant and consistent with the principles of fair value measurement.
Fair value pricing could result in a difference between the prices used to calculate a fund’s NAV and the prices used by the fund’s underlying index, which in turn could result in a difference between the fund’s performance and the performance of the fund’s underlying index.
Fair Value Hierarchy: Various inputs are used in determining the fair value of financial instruments. These inputs to valuation techniques are categorized into a fair value hierarchy consisting of three broad levels for financial reporting purposes as follows:
• Level 1 – Unadjusted price quotations in active markets/exchanges for identical assets or liabilities that each Fund has the ability to access;
• Level 2 – Other observable inputs (including, but not limited to, quoted prices for similar assets or liabilities in markets that are active, quoted prices for identical or similar assets or liabilities in markets that are not active, inputs other than quoted prices that are observable for the assets or liabilities (such as interest rates, yield curves, volatilities, prepayment speeds, loss severities, credit risks and default rates) or other market-corroborated inputs); and
• Level 3 – Unobservable inputs based on the best information available in the circumstances, to the extent observable inputs are not available, (including the Valuation Committee’s assumptions used in determining the fair value of financial instruments).
The hierarchy gives the highest priority to unadjusted quoted prices in active markets for identical assets or liabilities (Level 1 measurements) and the lowest priority to unobservable inputs (Level 3 measurements). Accordingly, the degree of judgment exercised in determining fair value is greatest for instruments categorized in Level 3. The inputs used to measure fair value may fall into different levels of the fair value hierarchy. In such cases, for disclosure purposes, the fair value hierarchy classification is determined based on the lowest level input that is significant to the fair value measurement in its entirety. Investments classified within Level 3 have significant unobservable inputs used by the Valuation Committee in determining the price for Fair Valued Investments. Level 3 investments include equity or debt issued by privately held companies or funds that may not have a secondary market and/or may have a limited number of investors. The categorization of a value determined for financial instruments is based on the pricing transparency of the financial instruments and is not necessarily an indication of the risks associated with investing in those securities.
Notes to Financial Statements23
Notes to Financial Statements (continued)
4. SECURITIES AND OTHER INVESTMENTS
Warrants: Warrants entitle a fund to purchase a specified number of shares of common stock and are non-income producing. The purchase price and number of shares are subject to adjustment under certain conditions until the expiration date of the warrants, if any. If the price of the underlying stock does not rise above the strike price before the warrant expires, the warrant generally expires without any value and a fund will lose any amount it paid for the warrant. Thus, investments in warrants may involve more risk than investments in common stock. Warrants may trade in the same markets as their underlying stock; however, the price of the warrant does not necessarily move with the price of the underlying stock.
Securities Lending: Each Fund may lend its securities to approved borrowers, such as brokers, dealers and other financial institutions. The borrower pledges and maintains with the Fund collateral consisting of cash, an irrevocable letter of credit issued by an approved bank, or securities issued or guaranteed by the U.S. government. The initial collateral received by each Fund is required to have a value of at least 102% of the current market value of the loaned securities for securities traded on U.S. exchanges and a value of at least 105% for all other securities. The collateral is maintained thereafter at a value equal to at least 100% of the current value of the securities on loan. The market value of the loaned securities is determined at the close of each business day of the Fund and any additional required collateral is delivered to the Fund or excess collateral is returned by the Fund, on the next business day. During the term of the loan, each Fund is entitled to all distributions made on or in respect of the loaned securities but does not receive interest income on securities received as collateral. Loans of securities are terminable at any time and the borrower, after notice, is required to return borrowed securities within the standard time period for settlement of securities transactions.
As of period end, any securities on loan were collateralized by cash and/or U.S. Government obligations. Cash collateral invested in money market funds managed by BFA, or its affiliates is disclosed in the Schedule of Investments. Any non-cash collateral received cannot be sold, re-invested or pledged by the Fund, except in the event of borrower default. The securities on loan, if any, are also disclosed in each Fund’s Schedule of Investments. The market value of any securities on loan and the value of any related cash collateral are disclosed in the Statements of Assets and Liabilities.
Securities lending transactions are entered into by the Funds under Master Securities Lending Agreements (each, an “MSLA”) which provide the right, in the event of default (including bankruptcy or insolvency) for the non-defaulting party to liquidate the collateral and calculate a net exposure to the defaulting party or request additional collateral. In the event that a borrower defaults, the Funds, as lender, would offset the market value of the collateral received against the market value of the securities loaned. When the value of the collateral is greater than that of the market value of the securities loaned, the lender is left with a net amount payable to the defaulting party. However, bankruptcy or insolvency laws of a particular jurisdiction may impose restrictions on or prohibitions against such a right of offset in the event of an MSLA counterparty’s bankruptcy or insolvency. Under the MSLA, absent an event of default, the borrower can resell or re-pledge the loaned securities, and the Funds can reinvest cash collateral received in connection with loaned securities. Upon an event of default, the parties’ obligations to return the securities or collateral to the other party are extinguished, and the parties can resell or re-pledge the loaned securities or the collateral received in connection with the loaned securities in order to satisfy the defaulting party’s net payment obligation for all transactions under the MSLA. The defaulting party remains liable for any deficiency.
As of period end, the following table is a summary of the securities on loan by counterparty which are subject to offset under an MSLA:
iShares ETF and Counterparty | Securities Loaned
at Value | | Non-Cash Collateral
Received, at Fair Value(a) | |
| | | | |
| | | | |
| | | | |
| | | | |
Emerging Markets Dividend | | | | |
| | | | |
| | | | |
Citigroup Global Markets, Inc. | | | | |
| | | | |
| | | | |
| | | | |
| | | | |
| Collateral received, if any, in excess of the market value of securities on loan is not presented in this table. The total cash collateral received by each Fund is disclosed in the Fund’s Statements of Assets and Liabilities. |
The risks of securities lending include the risk that the borrower may not provide additional collateral when required or may not return the securities when due. To mitigate these risks, each Fund benefits from a borrower default indemnity provided by BlackRock, Inc. (“BlackRock”). BlackRock’s indemnity allows for full replacement of the securities loaned to the extent the collateral received does not cover the value of the securities loaned in the event of borrower default. Each Fund could incur a loss if the value of an investment purchased with cash collateral falls below the market value of the loaned securities or if the value of an investment purchased with cash collateral falls below the value of the original cash collateral received. Such losses are borne entirely by each Fund.
242024 iShares Annual Report to Shareholders
Notes to Financial Statements (continued)
5. DERIVATIVE FINANCIAL INSTRUMENTS
Futures Contracts: Futures contracts are purchased or sold to gain exposure to, or manage exposure to, changes in interest rates (interest rate risk) and changes in the value of equity securities (equity risk) or foreign currencies (foreign currency exchange rate risk).
Futures contracts are exchange-traded agreements between the Funds and a counterparty to buy or sell a specific quantity of an underlying instrument at a specified price and on a specified date. Depending on the terms of a contract, it is settled either through physical delivery of the underlying instrument on the settlement date or by payment of a cash amount on the settlement date. Upon entering into a futures contract, the Funds are required to deposit initial margin with the broker in the form of cash or securities in an amount that varies depending on a contract’s size and risk profile. The initial margin deposit must then be maintained at an established level over the life of the contract. Amounts pledged, which are considered restricted, are included in cash pledged for futures contracts in the Statements of Assets and Liabilities.
Securities deposited as initial margin are designated in the Schedule of Investments and cash deposited, if any, are shown as cash pledged for futures contracts in the Statements of Assets and Liabilities. Pursuant to the contract, the Funds agree to receive from or pay to the broker an amount of cash equal to the daily fluctuation in market value of the contract (“variation margin”). Variation margin is recorded as unrealized appreciation (depreciation) and, if any, shown as variation margin receivable (or payable) on futures contracts in the Statements of Assets and Liabilities. When the contract is closed, a realized gain or loss is recorded in the Statements of Operations equal to the difference between the notional amount of the contract at the time it was opened and the notional amount at the time it was closed. The use of futures contracts involves the risk of an imperfect correlation in the movements in the price of futures contracts and interest rates, foreign currency exchange rates or underlying assets.
6. INVESTMENT ADVISORY AGREEMENT AND OTHER TRANSACTIONS WITH AFFILIATES
Investment Advisory Fees: Pursuant to an Investment Advisory Agreement with the Company, BFA manages the investment of each Fund’s assets. BFA is a California corporation indirectly owned by BlackRock. Under the Investment Advisory Agreement, BFA is responsible for substantially all expenses of the Funds, except (i) interest and taxes; (ii) brokerage commissions and other expenses connected with the execution of portfolio transactions; (iii) distribution fees; (iv) the advisory fee payable to BFA; and (v) litigation expenses and any extraordinary expenses (in each case as determined by a majority of the independent directors).
For its investment advisory services to each of the following Funds, BFA is entitled to an annual investment advisory fee, accrued daily and paid monthly by the Funds, based on the average daily net assets of each Fund as follows:
| |
| |
Emerging Markets Dividend | |
Expense Waivers: A fund may incur its pro rata share of fees and expenses attributable to its investments in other investment companies (“acquired fund fees and expenses"). The total of the investment advisory fee and acquired fund fees and expenses, if any, is a fund’s total annual operating expenses. Total expenses as shown in the Statements of Operations does not include acquired fund fees and expenses.
For the iShares Asia/Pacific Dividend ETF, BFA has contractually agreed to waive a portion of its investment advisory fee for the Fund through August 31, 2025 in an amount equal to the acquired fund fees and expenses, if any, attributable to investments by the Fund in other funds advised by BFA or its affiliates.
For the iShares Emerging Markets Dividend ETF, BFA has contractually agreed to waive a portion of its investment advisory fee for the Fund through August 31, 2027 in an amount equal to the acquired fund fees and expenses, if any, attributable to the Fund's investments in other iShares funds.
These amounts are included in investment advisory fees waived in the Statements of Operations. For the year ended April 30, 2024, the amounts waived in investment advisory fees pursuant to these arrangements were as follows:
Distributor: BlackRock Investments, LLC, an affiliate of BFA, is the distributor for each Fund. Pursuant to the distribution agreement, BFA is responsible for any fees or expenses for distribution services provided to the Funds.
Securities Lending: The U.S. Securities and Exchange Commission (the “SEC”) has issued an exemptive order which permits BlackRock Institutional Trust Company, N.A. (“BTC”), an affiliate of BFA, to serve as securities lending agent for the Funds, subject to applicable conditions. As securities lending agent, BTC bears all operational costs directly related to securities lending, including any custodial costs. Each Fund is responsible for fees in connection with the investment of cash collateral received for securities on loan (the “collateral investment fees”). The cash collateral is invested in a money market fund, BlackRock Cash Funds: Institutional or BlackRock Cash Funds: Treasury, managed by BFA, or its affiliates. However, BTC has agreed to reduce the amount of securities lending income it receives in order to effectively limit the collateral investment fees each Fund bears to an annual rate of 0.04%. The SL Agency Shares of such money market fund will not be subject to a sales load, redemption fee, distribution fee or service fee. The money market fund in which the cash collateral has been invested may, under certain circumstances, impose a liquidity fee of up to
Notes to Financial Statements25
Notes to Financial Statements (continued)
2% of the value redeemed or temporarily restrict redemptions for up to 10 business days during a 90 day period, in the event that the money market fund’s weekly liquid assets fall below certain thresholds.
Securities lending income is generally equal to the total of income earned from the reinvestment of cash collateral (and excludes collateral investment fees), and any fees or other payments to and from borrowers of securities. Each Fund retains a portion of the securities lending income and remits the remaining portion to BTC as compensation for its services as securities lending agent.
Pursuant to the current securities lending agreement, each Fund retains 82% of securities lending income (which excludes collateral investment fees), and the amount retained can never be less than 70% of the total of securities lending income plus the collateral investment fees.
In addition, commencing the business day following the date that the aggregate securities lending income plus the collateral investment fees generated across all 1940 Act iShares exchange-traded funds (the “iShares ETF Complex”) in that calendar year exceeds a specified threshold, each Fund, pursuant to the securities lending agreement, will retain for the remainder of that calendar year 85% of securities lending income (which excludes collateral investment fees), and the amount retained can never be less than 70% of the total of securities lending income plus the collateral investment fees.
The share of securities lending income earned by each Fund is shown as securities lending income – affiliated – net in its Statements of Operations. For the year ended April 30, 2024, the Funds paid BTC the following amounts for securities lending agent services:
| |
| |
Emerging Markets Dividend | |
Officers and Directors: Certain officers and/or directors of the Company are officers and/or directors of BlackRock or its affiliates.
Other Transactions: Cross trading is the buying or selling of portfolio securities between funds to which BFA (or an affiliate) serves as investment adviser. At its regularly scheduled quarterly meetings, the Board reviews such transactions as of the most recent calendar quarter for compliance with the requirements and restrictions set forth by Rule 17a-7.
For the year ended April 30, 2024, transactions executed by the Funds pursuant to Rule 17a-7 under the 1940 Act were as follows:
| | | |
| | | |
Emerging Markets Dividend | | | |
Each Fund may invest its positive cash balances in certain money market funds managed by BFA or an affiliate. The income earned on these temporary cash investments is shown as dividends – affiliated in the Statements of Operations.
A fund, in order to improve its portfolio liquidity and its ability to track its underlying index, may invest in shares of other iShares funds that invest in securities in the fund’s underlying index.
7. PURCHASES AND SALES
For the year ended April 30, 2024, purchases and sales of investments, excluding short-term securities and in-kind transactions, were as follows:
| | |
| | |
Emerging Markets Dividend | | |
For the year ended April 30, 2024, in-kind transactions were as follows:
| | |
| | |
Emerging Markets Dividend | | |
8. INCOME TAX INFORMATION
Each Fund is treated as an entity separate from the Company’s other funds for federal income tax purposes. It is each Fund’s policy to comply with the requirements of the Internal Revenue Code of 1986, as amended, applicable to regulated investment companies, and to distribute substantially all of its taxable income to its shareholders. Therefore, no U.S. federal income tax provision is required.
262024 iShares Annual Report to Shareholders
Notes to Financial Statements (continued)
Management has analyzed tax laws and regulations and their application to the Funds as of April 30, 2024, inclusive of the open tax return years, and does not believe that there are any uncertain tax positions that require recognition of a tax liability in the Funds’ financial statements.
U.S. GAAP requires that certain components of net assets be adjusted to reflect permanent differences between financial and tax reporting. These reclassifications have no effect on net assets or NAV per share. As of April 30, 2024, permanent differences attributable to realized gains (losses) from in-kind redemptions were reclassified to the following accounts:
| | Accumulated
Earnings (Loss) |
| | |
Emerging Markets Dividend | | |
The tax character of distributions paid was as follows:
| | |
| | |
| | |
Emerging Markets Dividend | | |
| | |
As of April 30, 2024, the tax components of accumulated net earnings (losses) were as follows:
| Undistributed
Ordinary Income | | | |
| | | | |
Emerging Markets Dividend | | | | |
| Amounts available to offset future realized capital gains. |
| The difference between book-basis and tax-basis net unrealized gains (losses) was attributable primarily to the tax deferral of losses on wash sales, the realization for tax purposes of unrealized gains (losses) on certain foreign currency contracts and futures contracts and the realization for tax purposes of unrealized gains on investments in passive foreign investment companies. |
A fund may own shares in certain foreign investment entities, referred to, under U.S. tax law, as “passive foreign investment companies.” Such fund may elect to mark-to-market annually the shares of each passive foreign investment company and would be required to distribute to shareholders any such marked-to-market gains.
As of April 30, 2024, gross unrealized appreciation and depreciation based on cost of investments (including short positions and derivatives, if any) for U.S. federal income tax purposes were as follows:
| | Gross Unrealized
Appreciation | Gross Unrealized
Depreciation | Net Unrealized
Appreciation
(Depreciation) |
| | | | |
Emerging Markets Dividend | | | | |
9. LINE OF CREDIT
The iShares Emerging Markets Dividend ETF, along with certain other iShares funds (“Participating Funds”), is a party to a $800 million credit agreement (“Syndicated Credit Agreement”) with a group of lenders, which expires on October 16, 2024. The line of credit may be used for temporary or emergency purposes, including redemptions, settlement of trades and rebalancing of portfolio holdings in certain target markets. The Funds may borrow up to the aggregate commitment amount subject to asset coverage and other limitations as specified in the Syndicated Credit Agreement. The Syndicated Credit Agreement has the following terms: a commitment fee of 0.15% per annum on the unused portion of the credit agreement and interest at a rate equal to the higher of (a) Daily Simple Secured Overnight Financing Rate (“SOFR”) plus 0.10% and 1.00% per annum or (b) the U.S. Federal Funds rate plus 1.00% per annum on amounts borrowed. The commitment fee is generally allocated to each Participating Fund based on the lesser of a Participating Fund’s relative exposure to certain target markets or a Participating Fund’s maximum borrowing amount as set forth by the terms of the Syndicated Credit Agreement.
Notes to Financial Statements27
Notes to Financial Statements (continued)
For the year ended April 30, 2024, the maximum amount borrowed, the average daily borrowing and the weighted average interest rate, if any, under the Syndicated Credit Agreement were as follows:
| | | Weighted
Average
Interest Rates |
Emerging Markets Dividend | | | |
10. PRINCIPAL RISKS
In the normal course of business, each Fund invests in securities or other instruments and may enter into certain transactions, and such activities subject the Fund to various risks, including, among others, fluctuations in the market (market risk) or failure of an issuer to meet all of its obligations. The value of securities or other instruments may also be affected by various factors, including, without limitation: (i) the general economy; (ii) the overall market as well as local, regional or global political and/or social instability; (iii) regulation, taxation or international tax treaties between various countries; or (iv) currency, interest rate or price fluctuations. Local, regional or global events such as war, acts of terrorism, the spread of infectious illness or other public health issues, recessions, or other events could have a significant impact on the Funds and their investments. Each Fund’s prospectus provides details of the risks to which the Fund is subject.
BFA uses an indexing approach to try to achieve each Fund’s investment objective. The Fund is not actively managed, and BFA generally does not attempt to take defensive positions under any market conditions, including declining markets.
The Funds may be exposed to additional risks when reinvesting cash collateral in money market funds that do not seek to maintain a stable NAV per share of $1.00, which may be subject to discretionary liquidity fees under certain circumstances.
Market Risk: Investments in the securities of issuers domiciled in countries with emerging capital markets involve certain additional risks that do not generally apply to investments in securities of issuers in more developed capital markets, such as (i) low or nonexistent trading volume, resulting in a lack of liquidity and increased volatility in prices for such securities; (ii) lack of reliable settlement procedures and significant delays in registering the transfer of securities; (iii) uncertain national policies and social, political and economic instability, increasing the potential for expropriation of assets, confiscatory taxation, high rates of inflation or unfavorable diplomatic developments; (iv) lack of publicly available or reliable information about issuers as a result of not being subject to the same degree of regulatory requirements and accounting, auditing and financial reporting standards; and (v) possible fluctuations in exchange rates, differing legal systems and the existence or possible imposition of exchange controls, custodial restrictions or other foreign or U.S. governmental laws or restrictions applicable to such investments.
Valuation Risk: The market values of equities, such as common stocks and preferred securities or equity related investments, such as futures and options, may decline due to general market conditions which are not specifically related to a particular company. They may also decline due to factors which affect a particular industry or industries. A fund may invest in illiquid investments. An illiquid investment is any investment that a fund reasonably expects cannot be sold or disposed of in current market conditions in seven calendar days or less without the sale or disposition significantly changing the market value of the investment. A fund may experience difficulty in selling illiquid investments in a timely manner at the price that it believes the investments are worth. Prices may fluctuate widely over short or extended periods in response to company, market or economic news. Markets also tend to move in cycles, with periods of rising and falling prices. This volatility may cause a fund’s NAV to experience significant increases or decreases over short periods of time. If there is a general decline in the securities and other markets, the NAV of a fund may lose value, regardless of the individual results of the securities and other instruments in which a fund invests.
The price each Fund could receive upon the sale of any particular portfolio investment may differ from each Fund’s valuation of the investment, particularly for securities that trade in thin or volatile markets or that are valued using a fair valuation technique or a price provided by an independent pricing service. Changes to significant unobservable inputs and assumptions (i.e., publicly traded company multiples, growth rate, time to exit) due to the lack of observable inputs may significantly impact the resulting fair value and therefore each Fund’s results of operations. As a result, the price received upon the sale of an investment may be less than the value ascribed by each Fund, and each Fund could realize a greater than expected loss or lesser than expected gain upon the sale of the investment. Each Fund’s ability to value its investments may also be impacted by technological issues and/or errors by pricing services or other third-party service providers.
Counterparty Credit Risk: The Funds may be exposed to counterparty credit risk, or the risk that an entity may fail to or be unable to perform on its commitments related to unsettled or open transactions, including making timely interest and/or principal payments or otherwise honoring its obligations. The Funds manage counterparty credit risk by entering into transactions only with counterparties that BFA believes have the financial resources to honor their obligations and by monitoring the financial stability of those counterparties. Financial assets, which potentially expose the Funds to market, issuer and counterparty credit risks, consist principally of financial instruments and receivables due from counterparties. The extent of the Funds’ exposure to market, issuer and counterparty credit risks with respect to these financial assets is approximately their value recorded in the Statements of Assets and Liabilities, less any collateral held by the Funds.
A derivative contract may suffer a mark-to-market loss if the value of the contract decreases due to an unfavorable change in the market rates or values of the underlying instrument. Losses can also occur if the counterparty does not perform under the contract.
With exchange-traded futures, there is less counterparty credit risk to the Funds since the exchange or clearinghouse, as counterparty to such instruments, guarantees against a possible default. The clearinghouse stands between the buyer and the seller of the contract; therefore, credit risk is limited to failure of the clearinghouse. While offset rights may exist under applicable law, a fund does not have a contractual right of offset against a clearing broker or clearinghouse in the event of a default (including the bankruptcy or insolvency). Additionally, credit risk exists in exchange-traded futures with respect to initial and variation margin that is held in a clearing broker’s customer accounts. While clearing brokers are required to segregate customer margin from their own assets, in the event that a clearing broker becomes insolvent or goes into
282024 iShares Annual Report to Shareholders
Notes to Financial Statements (continued)
bankruptcy and at that time there is a shortfall in the aggregate amount of margin held by the clearing broker for all its clients, typically the shortfall would be allocated on a pro rata basis across all the clearing broker’s customers, potentially resulting in losses to the Funds.
Geographic/Asset Class Risk: A diversified portfolio, where this is appropriate and consistent with a fund’s objectives, minimizes the risk that a price change of a particular investment will have a material impact on the NAV of a fund. The investment concentrations within each Fund’s portfolio are disclosed in its Schedule of Investments.
Certain Funds invest a significant portion of their assets in issuers located in a single country or a limited number of countries. When a fund concentrates its investments in this manner, it assumes the risk that economic, regulatory, political and social conditions in that country or those countries may have a significant impact on the fund and could affect the income from, or the value or liquidity of, the Fund’s portfolio. Unanticipated or sudden political or social developments may cause uncertainty in the markets and as a result adversely affect the Fund’s investments. Foreign issuers may not be subject to the same uniform accounting, auditing and financial reporting standards and practices as used in the United States. Foreign securities markets may also be more volatile and less liquid than U.S. securities and may be less subject to governmental supervision not typically associated with investing in U.S. securities. Investment percentages in specific countries are presented in the Schedule of Investments.
Certain Funds invest a significant portion of their assets in securities of issuers located in Asia or with significant exposure to Asian issuers or countries. The Asian financial markets have recently experienced volatility and adverse trends due to concerns in several Asian countries regarding monetary policy, government intervention in the markets, rising government debt levels or economic downturns. These events may spread to other countries in Asia and may affect the value and liquidity of certain of the Funds’ investments.
Certain Funds invest a significant portion of their assets in securities within a single or limited number of market sectors. When a fund concentrates its investments in this manner, it assumes the risk that economic, regulatory, political and social conditions affecting such sectors may have a significant impact on the fund and could affect the income from, or the value or liquidity of, the fund’s portfolio. Investment percentages in specific sectors are presented in the Schedule of Investments.
Significant Shareholder Redemption Risk: Certain shareholders may own or manage a substantial amount of fund shares and/or hold their fund investments for a limited period of time. Large redemptions of fund shares by these shareholders may force a fund to sell portfolio securities, which may negatively impact the fund’s NAV, increase the fund’s brokerage costs, and/or accelerate the realization of taxable income/gains and cause the fund to make additional taxable distributions to shareholders.
11. CAPITAL SHARE TRANSACTIONS
Capital shares are issued and redeemed by each Fund only in aggregations of a specified number of shares or multiples thereof (“Creation Units”) at NAV. Except when aggregated in Creation Units, shares of each Fund are not redeemable.
Transactions in capital shares were as follows:
| | |
| | | | |
| | | | |
| | | | |
| | | | |
| | | | |
Emerging Markets Dividend | | | | |
| | | | |
| | | | |
| | | | |
The consideration for the purchase of Creation Units of a fund in the Company generally consists of the in-kind deposit of a designated portfolio of securities and a specified amount of cash. Certain funds in the Company may be offered in Creation Units solely or partially for cash in U.S. dollars. Authorized Participants purchasing and redeeming Creation Units may pay a purchase transaction fee and a redemption transaction fee directly to State Street Bank and Trust Company, the Company’s administrator, to offset transfer and other transaction costs associated with the issuance and redemption of Creation Units, including Creation Units for cash. Authorized Participants transacting in Creation Units for cash may also pay an additional variable charge to compensate the relevant fund for certain transaction costs (i.e., stamp taxes, taxes on currency or other financial transactions, and brokerage costs) and market impact expenses relating to investing in portfolio securities. Such variable charges, if any, are included in shares sold in the table above.
From time to time, settlement of securities related to in-kind contributions or in-kind redemptions may be delayed. In such cases, securities related to in-kind transactions are reflected as a receivable or a payable in the Statements of Assets and Liabilities.
Notes to Financial Statements29
Notes to Financial Statements (continued)
12. FOREIGN WITHHOLDING TAX CLAIMS
The Internal Revenue Service ("IRS") has issued guidance to address U.S. income tax liabilities attributable to fund shareholders resulting from the recovery of foreign taxes withheld in prior calendar years. These withheld foreign taxes were passed through to shareholders in the form of foreign tax credits in the year the taxes were withheld. Assuming there are sufficient foreign taxes paid which the iShares Emerging Markets Dividend ETF is able to pass through to shareholders as a foreign tax credit in the current year, the Fund will be able to offset the prior years' withholding taxes recovered against the foreign taxes paid in the current year. Accordingly, no federal income tax liability is recorded by the Fund.
13. SUBSEQUENT EVENTS
Management has evaluated the impact of all subsequent events on the Funds through the date the financial statements were available to be issued and has determined that there were no subsequent events requiring adjustment or additional disclosure in the financial statements.
302024 iShares Annual Report to Shareholders
Report of Independent Registered Public Accounting Firm
To the Board of Directors of
iShares, Inc. and Shareholders of each of the two funds listed in the table below
Opinions on the Financial Statements
We have audited the accompanying statements of assets and liabilities, including the schedules of investments, of each of the funds listed in the table below (two of the funds constituting iShares, Inc., hereafter collectively referred to as the "Funds") as of April 30, 2024, the related statements of operations for the year ended April 30, 2024, the statements of changes in net assets for each of the two years in the period ended April 30, 2024, including the related notes, and the financial highlights for each of the five years in the period ended April 30, 2024 (collectively referred to as the “financial statements”). In our opinion, the financial statements present fairly, in all material respects, the financial position of each of the Funds listed in the table below as of April 30, 2024, the results of each of their operations for the year then ended, the changes in each of their net assets for each of the two years in the period ended April 30, 2024 and each of the financial highlights for each of the five years in the period ended April 30, 2024 in conformity with accounting principles generally accepted in the United States of America.
iShares Asia/Pacific Dividend ETF |
iShares Emerging Markets Dividend ETF |
Basis for Opinions
These financial statements are the responsibility of the Funds’ management. Our responsibility is to express an opinion on the Funds’ financial statements based on our audits. We are a public accounting firm registered with the Public Company Accounting Oversight Board (United States) (PCAOB) and are required to be independent with respect to the Funds in accordance with the U.S. federal securities laws and the applicable rules and regulations of the Securities and Exchange Commission and the PCAOB.
We conducted our audits of these financial statements in accordance with the standards of the PCAOB. Those standards require that we plan and perform the audit to obtain reasonable assurance about whether the financial statements are free of material misstatement, whether due to error or fraud.
Our audits included performing procedures to assess the risks of material misstatement of the financial statements, whether due to error or fraud, and performing procedures that respond to those risks. Such procedures included examining, on a test basis, evidence regarding the amounts and disclosures in the financial statements. Our audits also included evaluating the accounting principles used and significant estimates made by management, as well as evaluating the overall presentation of the financial statements. Our procedures included confirmation of securities owned as of April 30, 2024 by correspondence with the custodian, transfer agent and brokers; when replies were not received from brokers, we performed other auditing procedures. We believe that our audits provide a reasonable basis for our opinions.
/s/PricewaterhouseCoopers LLP
Philadelphia, Pennsylvania
June 24, 2024
We have served as the auditor of one or more BlackRock investment companies since 2000.
Report of Independent Registered Public Accounting Firm31
Important Tax Information (unaudited)
The following amounts, or maximum amounts allowable by law, are hereby designated as qualified dividend income for individuals for the fiscal year ended April 30, 2024:
| |
| |
Emerging Markets Dividend | |
The Funds intend to pass through to their shareholders the following amounts, or maximum amounts allowable by law, of foreign source income earned and foreign taxes paid for the fiscal year ended April 30, 2024:
| Foreign Source
Income Earned | |
| | |
Emerging Markets Dividend | | |
322024 iShares Annual Report to Shareholders
Statement Regarding Liquidity Risk Management Program (unaudited)
In compliance with Rule 22e-4 under the Investment Company Act of 1940, as amended (the “Liquidity Rule”), iShares, Inc. (the “Company”) has adopted and implemented a liquidity risk management program (the “Program”) for iShares Asia/Pacific Dividend ETF and iShares Emerging Markets Dividend ETF (the “Funds” or “ETFs”), each a series of the Company, which is reasonably designed to assess and manage each Fund’s liquidity risk.
The Board of Directors (the “Board”) of the Company, on behalf of the Funds, met on December 8, 2023 (the “Meeting”) to review the Program. The Board previously appointed BlackRock Fund Advisors (“BlackRock”), the investment adviser to the Funds, as the program administrator for each Fund’s Program. BlackRock also previously delegated oversight of the Program to the 40 Act Liquidity Risk Management Committee (the “Committee”). At the Meeting, the Committee, on behalf of BlackRock, provided the Board with a report that addressed the operation of the Program and assessed its adequacy and effectiveness of implementation, including the management of each Fund’s Highly Liquid Investment Minimum (“HLIM”) where applicable, and any material changes to the Program (the “Report”). The Report covered the period from October 1, 2022 through September 30, 2023 (the “Program Reporting Period”).
The Report described the Program’s liquidity classification methodology for categorizing each Fund’s investments (including derivative transactions) into one of four liquidity buckets. It also referenced the methodology used by BlackRock to establish each Fund’s HLIM and noted that the Committee reviews and ratifies the HLIM assigned to each Fund no less frequently than annually. The Report also discussed notable events affecting liquidity over the Program Reporting Period, including extended market holidays, delays in the repatriation of the local currency in certain non-U.S. countries, the continued illiquidity of Russian equity securities and the suspension of select sanctions in Venezuela.
The Report noted that the Program complied with the key factors for consideration under the Liquidity Rule for assessing, managing and periodically reviewing each Fund’s liquidity risk, as follows:
a) The Fund’s investment strategy and liquidity of portfolio investments during both normal and reasonably foreseeable stressed conditions. During the Program Reporting Period, the Committee reviewed whether each Fund’s strategy is appropriate for an open-end fund structure, with a focus on funds with more significant and consistent holdings of less liquid and illiquid assets. The Committee also factored a fund’s concentration in an issuer into the liquidity classification methodology by taking issuer position sizes into account. Derivative exposure was also considered in the calculation of a fund’s liquidity bucketing. Finally, a factor for consideration under the Liquidity Rule is a Fund’s use of borrowings for investment purposes. However, the Funds do not borrow for investment purposes.
b) Short-term and long-term cash flow projections during both normal and reasonably foreseeable stressed conditions. During the Program Reporting Period, the Committee reviewed historical redemption activity and used this information as a component to establish each ETF’s reasonably anticipated trading size utilized for liquidity classifications. The Committee may also take into consideration a fund’s shareholder ownership concentration (which, depending on product type and distribution channel, may or may not be available), a fund’s distribution channels, and the degree of certainty associated with a fund’s short-term and long-term cash flow projections.
c) Holdings of cash and cash equivalents, as well as borrowing arrangements. The Committee considered that ETFs generally do not hold more than de minimis amounts of cash. The Committee also considered that ETFs generally do not engage in borrowing.
d) The relationship between an ETF’s portfolio liquidity and the way in which, and the prices and spreads at which, ETF shares trade, including the efficiency of the arbitrage function and the level of active participation by market participants, including authorized participants. The Committee monitored the prevailing bid/ask spread and the ETF price premium (or discount) to NAV for all ETFs. However, there were no ETFs with persistent deviations of fund premium/discount or bid/ask spreads from long-term averages over the Program Reporting Period.
e) The effect of the composition of baskets on the overall liquidity of an ETF’s portfolio. In reviewing the linkage between the composition of custom baskets accepted by an ETF and any significant change in the liquidity profile of such ETF, the Committee reviewed changes in the proportion of each ETF’s portfolio comprised of less liquid and illiquid holdings to determine if applicable thresholds were met requiring enhanced review. There were no ETFs for which the custom baskets accepted by the ETF had a significant change in its liquidity profile.
There were no material changes to the Program during the Program Reporting Period other than the enhancement of certain model components in the Program’s classification methodology. The Report provided to the Board stated that the Committee concluded that based on the operation of the functions, as described in the Report, the Program is operating as intended and is effective in implementing the requirements of the Liquidity Rule.
Statement Regarding Liquidity Risk Management Program33
Supplemental Information (unaudited)
Tailored Shareholder Reports for Open-End Mutual Funds and ETFs
Effective January 24, 2023, the SEC adopted rule and form amendments to require open-end mutual funds and ETFs to transmit concise and visually engaging streamlined annual and semiannual reports to shareholders that highlight key information. Other information, including financial statements, will no longer appear in a streamlined shareholder report but must be available online, delivered free of charge upon request, and filed on a semiannual basis on Form N-CSR. The rule and form amendments have a compliance date of July 24, 2024. At this time, management is evaluating the impact of these amendments on the shareholder reports for the Funds.
Premium/Discount Information
Information on the Fund's net asset value, market price, premiums and discounts, and bid-ask spreads can be found at iShares.com.
342024 iShares Annual Report to Shareholders
Director and Officer Information (unaudited)
The Board of Directors has responsibility for the overall management and operations of the Funds, including general supervision of the duties performed by BFA and other service providers. Each Director serves until he or she resigns, is removed, dies, retires or becomes incapacitated. Each officer shall hold office until his or her successor is elected and qualifies or until his or her death, resignation or removal. Directors who are not “interested persons” (as defined in the 1940 Act) of the Company are referred to as independent directors (“Independent Directors”).
The registered investment companies advised by BFA or its affiliates (the “BlackRock-advised Funds”) are organized into the BlackRock Multi-Asset Complex, the BlackRock Fixed-Income Complex and the iShares Complex (each, a "BlackRock Fund Complex"). Each Fund is included in the iShares Complex. Each Director also serves as a Trustee of iShares Trust and a Trustee of iShares U.S. ETF Trust and, as a result, oversees all of the funds within the iShares Complex, which consists of 404 funds as of April 30, 2024. With the exception of Stephen Cohen, Robert S. Kapito and Aaron Wasserman, the address of each Trustee and officer is c/o BlackRock, Inc., 400 Howard Street, San Francisco, CA 94105. The address of Mr. Kapito and Mr. Wasserman is c/o BlackRock, Inc., 50 Hudson Yards, New York, NY 10001. The address of Mr. Cohen is c/o BlackRock, Inc., Drapers Gardens, 12 Throgmorton Avenue, London EC2N 2DL United Kingdom. The Board has designated John E. Kerrigan as its Independent Board Chair. Additional information about the Funds’ Trustees and officers may be found in the Funds’ combined Statement of Additional Information, which is available without charge, upon request, by calling toll-free 1-800-iShares (1-800-474-2737).
|
| | Principal Occupation(s)
During Past 5 Years | Other Directorships Held by Director |
| | President of BlackRock, Inc. (since 2006); Vice Chairman of BlackRock, Inc. and Head of BlackRock’s Portfolio Management Group (since its formation in 1998) and BlackRock, Inc.’s predecessor entities (since 1988); Trustee, University of Pennsylvania (since 2009); President of Board of Directors, Hope & Heroes Children’s Cancer Fund (since 2002). | Director of BlackRock, Inc. (since 2006); Trustee of iShares U.S. ETF Trust (since 2011); Trustee of iShares Trust (since 2009). |
| | Senior Managing Director, Head of Global Product Solutions of BlackRock, Inc. (since 2024); Senior Managing Director, Head of Europe, Middle East and Africa Regions of BlackRock, Inc. (2021-2024); Head of iShares Index and Wealth in EMEA of BlackRock, Inc. (2017-2021); Global Head of Fixed Income Indexing of BlackRock, Inc. (2016-2017); Chief Investment Strategist for International Fixed Income and iShares of BlackRock, Inc. (2011-2015). | Trustee of iShares U.S. ETF Trust (since 2024); Trustee of iShares Trust (since 2024). |
(a) Robert S. Kapito is deemed to be an “interested person” (as defined in the 1940 Act) of the Trust due to his affiliations with BlackRock, Inc. and its affiliates. |
(b) Stephen Cohen is deemed to be an "interested person" (as defined in the 1940 Act) of the Trust due to his affiliations with BlackRock, Inc. and its affiliates. |
|
| | Principal Occupation(s)
During Past 5 Years | Other Directorships Held by Director |
| Director (since 2005); Independent Board Chair (since 2022). | Chief Investment Officer, Santa Clara University (since 2002). | Trustee of iShares U.S. ETF Trust (since 2011); Trustee of iShares Trust (since 2005); Independent Board Chair of iShares Trust and iShares U.S. ETF Trust (since 2022). |
| Director (since 2015); Risk Committee Chair (since 2016). | Consultant (since 2012); Member of the Audit Committee (2012-2018), Chair of the Nominating and Governance Committee (2017-2018) and Director of PHH Corporation (mortgage solutions) (2012-2018); Managing Director and Global Head of Financial Holding Company Governance & Assurance and the Global Head of Operational Risk Management of Morgan Stanley (2006-2012). | Trustee of iShares U.S. ETF Trust (since 2015); Trustee of iShares Trust (since 2015); Member of the Audit Committee (since 2016), Chair of the Audit Committee (since 2020) and Director of The Hanover Insurance Group, Inc. (since 2016). |
| Director (since 2017); Audit Committee Chair (since 2019). | Partner, KPMG LLP (2002-2016); Director of One Generation Away (since 2021). | Trustee of iShares U.S. ETF Trust (since 2017); Trustee of iShares Trust (since 2017). |
| | President, Franklin Templeton Services, LLC (2017-2024); Director of the Board of Crocker Art Museum Association (since 2019); President, Crocker Art Museum Foundation (2022-2023). | Trustee of iShares U.S. ETF Trust (since 2024); Trustee of iShares Trust (since 2024). |
Director and Officer Information35
Director and Officer Information (unaudited) (continued)
Independent Directors (continued) |
| | Principal Occupation(s) During Past 5 Years | Other Directorships Held by Director |
| Director (since 2005); Nominating and Governance and Equity Plus Committee Chairs (since 2022). | Chair of the Finance Committee (since 2019) and Trustee and Member of the Finance, Audit and Quality Committees of Stanford Health Care (since 2016); Trustee of WNET, New York’s public media company (since 2011) and Member of the Audit Committee (since 2018), Investment Committee (since 2011) and Personnel Committee (since 2022); Member of the Wyoming State Investment Funds Committee (since 2022); Trustee of Forward Funds (14 portfolios) (2009-2018); Trustee of Salient MF Trust (4 portfolios) (2015-2018); Director of the Jackson Hole Center for the Arts (since 2021). | Trustee of iShares U.S. ETF Trust (since 2011); Trustee of iShares Trust (since 2005). |
| | President, James Lam & Associates, Inc. (since 2002); Director of the FAIR Institute (since 2020); adjunct professor at Carnegie Mellon University (since 2018); Member, Zicklin School of Business Dean's Council of Baruch College (since 2017); Director and Audit Committee Chair of RiskLens, Inc. (2018-2023); Director, Risk Oversight Committee Chair and Audit Committee Member of E*TRADE Financial and E*TRADE Bank (2012-2020). | Trustee of iShares U.S. ETF Trust (since 2024); Trustee of iShares Trust (since 2024). |
| Director (since 2017); 15(c) Committee Chair (since 2017). | Senior Managing Director of New York Life Insurance Company (2010-2015). | Trustee of iShares U.S. ETF Trust (since 2017); Trustee of iShares Trust (since 2017); Director of Jackson Financial Inc. (since 2021). |
| Director (since 2003); Securities Lending Committee Chair (since 2019). | Director of Real Estate Equity Exchange, Inc. (since 2005); Director of Cloudera Foundation (2017-2020); and Director of Reading Partners (2012-2016). | Trustee of iShares U.S. ETF Trust (since 2011); Trustee of iShares Trust (since 2003). |
| Director (since 2011); Fixed-Income Plus Committee Chair (since 2019). | Dean, and George Pratt Shultz Professor of Accounting, University of Chicago Booth School of Business (since 2017); Advisory Board Member (since 2016) and Director (since 2020) of C.M. Capital Corporation; Chair of the Board for the Center for Research in Security Prices, LLC (since 2020); Director of WellBe Senior Medical (since 2023); Robert K. Jaedicke Professor of Accounting, Stanford University Graduate School of Business (2001-2017); Professor of Law (by courtesy), Stanford Law School (2005-2017); Senior Associate Dean for Academic Affairs and Head of MBA Program, Stanford University Graduate School of Business (2010-2016). | Trustee of iShares U.S. ETF Trust (since 2011); Trustee of iShares Trust (since 2011). |
|
| | Principal Occupation(s)
During Past 5 Years |
| | Managing Director of BlackRock, Inc. (since 2015); Head of Global Product Solutions, Americas of BlackRock, Inc. (since 2024) and Head of Sustainable and Transition Solutions of BlackRock, Inc. (2022-2024); Global Head of Corporate Strategy of BlackRock, Inc. (2019-2022); Chief of Staff to the CEO of BlackRock, Inc. (2017-2019). |
| Treasurer and Chief Financial Officer (since 2020). | Managing Director of BlackRock, Inc. (since 2019); Chief Financial Officer of iShares Delaware Trust Sponsor LLC, BlackRock Funds, BlackRock Funds II, BlackRock Funds IV, BlackRock Funds V and BlackRock Funds VI (since 2021). |
| Chief Compliance Officer (iShares, Inc. and iShares Trust, since 2023; iShares U.S. ETF Trust, since 2023). | Managing Director of BlackRock, Inc. (since 2018); Chief Compliance Officer of the BlackRock Multi-Asset Complex, the BlackRock Fixed-Income Complex and the iShares Complex (since 2023); Deputy Chief Compliance Officer for the BlackRock Multi-Asset Complex, the BlackRock Fixed-Income Complex and the iShares Complex (2014-2023). |
| | Managing Director of BlackRock, Inc. (since 2023); Director of BlackRock, Inc. (2018-2022). |
362024 iShares Annual Report to Shareholders
Director and Officer Information (unaudited) (continued)
|
| | Principal Occupation(s) During Past 5 Years |
| Executive Vice President (since 2022). | Managing Director of BlackRock, Inc. (since 2018); Head of U.S. iShares Product (since 2022); Head of EII U.S. Product Engineering of BlackRock, Inc. (since 2021); Co-Head of EII’s Americas Portfolio Engineering of BlackRock, Inc. (2020-2021); Head of Developed Markets Portfolio Engineering of BlackRock, Inc. (2016-2019). |
| Executive Vice President (since 2022). | Managing Director of BlackRock, Inc. (since 2009); Co-Head of Index Equity of BlackRock, Inc. (since 2022). |
| Executive Vice President (since 2022). | Managing Director of BlackRock, Inc. (since 2010); Head of Fixed Income Index Investments in the Americas and Head of San Francisco Core Portfolio Management of BlackRock, Inc. (since 2020). |
Effective July 1, 2023, Aaron Wasserman replaced Charles Park as Chief Compliance Officer. |
Effective February 1, 2024, Salim Ramji resigned as Trustee of the Trust. |
Effective March 5, 2024, Stephen Cohen replaced Salim Ramji as Trustee of the Trust. |
Effective March 5, 2024, Dominik Rohé resigned as President of the Trust. |
Effective March 5, 2024, Jessica Tan replaced Dominik Rohé as President of the Trust. |
Effective April 8, 2024, Laura Fergerson was appointed as Trustee of the Trust. |
Effective April 8, 2024, James Lam was appointed as Trustee of the Trust. |
Director and Officer Information37
Electronic Delivery
Shareholders can sign up for e-mail notifications announcing that the shareholder report or prospectus has been posted on the iShares website at iShares.com. Once you have enrolled, you will no longer receive prospectuses and shareholder reports in the mail.
To enroll in electronic delivery:
• Go to icsdelivery.com.
• If your brokerage firm is not listed, electronic delivery may not be available. Please contact your broker-dealer or financial advisor.
Householding
Householding is an option available to certain fund investors. Householding is a method of delivery, based on the preference of the individual investor, in which a single copy of certain shareholder documents and Rule 30e-3 notices can be delivered to investors who share the same address, even if their accounts are registered under different names. Please contact your broker-dealer if you are interested in enrolling in householding and receiving a single copy of prospectuses and other shareholder documents, or if you are currently enrolled in householding and wish to change your householding status.
Availability of Quarterly Schedule of Investments
The Funds file their complete schedule of portfolio holdings with the SEC for the first and third quarters of each fiscal year as an exhibit to their reports on Form N-PORT. The Funds’ Forms N-PORT are available on the SEC’s website at sec.gov. Additionally, each Fund makes its portfolio holdings for the first and third quarters of each fiscal year available at iShares.com/fundreports.
Availability of Proxy Voting Policies and Proxy Voting Records
A description of the policies and procedures that the iShares Funds use to determine how to vote proxies relating to portfolio securities and information about how the iShares Funds voted proxies relating to portfolio securities during the most recent twelve-month period ending June 30 is available without charge, upon request (1) by calling toll-free 1-800-474-2737; (2) on the iShares website at iShares.com; and (3) on the SEC website at sec.gov.
A description of the Company’s policies and procedures with respect to the disclosure of the Fund’s portfolio securities is available in the Fund Prospectus. The Fund discloses its portfolio holdings daily and provides information regarding its top holdings in Fund fact sheets at iShares.com.
382024 iShares Annual Report to Shareholders
Glossary of Terms Used in this Report
|
| American Depositary Receipt |
| Non-Voting Depositary Receipt |
| |
| Public Joint Stock Company |
Glossary of Terms Used in this Report39
THIS PAGE INTENTIONALLY LEFT BLANK.
THIS PAGE INTENTIONALLY LEFT BLANK.
THIS PAGE INTENTIONALLY LEFT BLANK.
THIS PAGE INTENTIONALLY LEFT BLANK.
Want to know more?
iShares.com | 1-800-474-2737
This report is intended for the Funds’ shareholders. It may not be distributed to prospective investors unless it is preceded or accompanied by the current prospectus.
Investing involves risk, including possible loss of principal.
The iShares Funds are distributed by BlackRock Investments, LLC (together with its affiliates, “BlackRock”).
The iShares Funds are not sponsored, endorsed, issued, sold or promoted by S&P Dow Jones Indices LLC, nor does this company make any representation regarding the advisability of investing in the iShares Funds. BlackRock is not affiliated with the company listed above.
©2024 BlackRock, Inc. All rights reserved. iSHARES and BLACKROCK are registered trademarks of BlackRock, Inc. or its subsidiaries. All other marks are the property of their respective owners.
(b) Not Applicable
The registrant has adopted a code of ethics, as of the end of the period covered by this report, applicable to the registrant’s principal executive officer, principal financial officer, principal accounting officer or controller, or persons performing similar functions. During the period covered by this report, the registrant has not amended the code of ethics and there have been no waivers granted under the code of ethics. The registrant undertakes to provide a copy of the code of ethics to any person upon request, without charge, by calling 1-800-474-2737.
| Item 3. | Audit Committee Financial Expert. |
The registrant’s Board of Directors has determined that the registrant has more than one audit committee financial expert, as that term is defined under Item 3(b) and 3(c), serving on its audit committee. The audit committee financial experts serving on the registrant’s audit committee are Richard L. Fagnani and Madhav V. Rajan, all of whom are independent, as that term is defined under Item 3(a)(2).
| Item 4. | Principal Accountant Fees and Services. |
The principal accountant fees disclosed in items 4(a), 4(b), 4(c), 4(d) and 4(g) are for the two series of the registrant for which the fiscal year-end is April 30, 2024 (the “Funds”), and whose annual financial statements are reported in Item 1.
(a) Audit Fees – The aggregate fees billed for each of the last two fiscal years for professional services rendered by the principal accountant for the audit of the Funds’ annual financial statements or services that are normally provided by the accountant in connection with statutory and regulatory filings or engagements for those fiscal years were $32,800 for the fiscal year ended April 30, 2023 and $32,800 for the fiscal year ended April 30, 2024.
(b) Audit-Related Fees – There were no fees billed for the fiscal years ended April 30, 2023 and April 30, 2024 for assurance and related services by the principal accountant that were reasonably related to the performance of the audit of the Fund’s financial statements and are not reported under (a) of this Item.
(c) Tax Fees – The aggregate fees billed in each of the last two fiscal years for professional services rendered by the principal accountant for tax compliance, tax advice and tax planning for the Funds were $19,400 for the fiscal year ended April 30, 2023 and $19,400 for the fiscal year ended April 30, 2024. These services related to the review of the Funds’ tax returns and excise tax calculations.
(d) All Other Fees – There were no other fees billed in each of the fiscal years ended April 30, 2023 and April 30, 2024 for products and services provided by the principal accountant, other than the services reported in (a) through (c) of this Item.
(e) (1) The registrant’s audit committee charter, as amended, provides that the audit committee is responsible for the approval, prior to appointment, of the engagement of the principal accountant to annually audit and provide their opinion on the registrant’s financial statements. The audit committee must also approve, prior to appointment, the engagement of the principal accountant to provide non-audit services to the registrant or to any entity controlling, controlled by or under common control with the registrant’s investment adviser (“Adviser Affiliate”) that provides ongoing services to the registrant, if the engagement relates directly to the operations and financial reporting of the registrant.
(2) There were no services described in (b) through (d) above that were approved by the audit committee pursuant to paragraph (c)(7)(i)(C) of Rule 2-01 of Regulation S-X.
(f) Not Applicable
(g) The aggregate non-audit fees billed by the registrant’s principal accountant for services rendered to the Funds, and rendered to the registrant’s investment adviser, and any Adviser Affiliate that provides ongoing services to the registrant for the last two fiscal years were $19,400 for the fiscal year ended April 30, 2023 and $19,400 for the fiscal year ended April 30, 2024.
(h) The registrant’s audit committee has considered whether the provision of non-audit services rendered to the registrant’s investment adviser and any Adviser Affiliate that provides ongoing services to the registrant that were not pre-approved pursuant to paragraph (c)(7)(ii) of Rule 2-01 of Regulation S-X, if any, is compatible with maintaining the principal accountant’s independence, and has determined that the provision of these services, if any, does not compromise the principal accountant’s independence.
(i) Not Applicable
(j) Not Applicable
| Item 5. | Audit Committee of Listed Registrants. |
(a) The registrant is a listed issuer as defined in Rule 10A-3 under the Exchange Act of 1934 and has a separately-designated standing audit committee established in accordance with Section 3(a)(58)(A) of the Exchange Act of 1934. The registrant’s audit committee members are Richard L. Fagnani, Cecilia H. Herbert and Madhav V. Rajan.
(b) Not applicable.
(a) Schedules of investments are included as part of the reports to shareholders filed under Item 1 of this Form.
(b) Not applicable.
| Item 7. | Disclosure of Proxy Voting Policies and Procedures for Closed-End Management Investment Companies. |
Not applicable to the registrant.
| Item 8. | Portfolio Managers of Closed-End Management Investment Companies. |
Not applicable to the registrant.
| Item 9. | Purchases of Equity Securities by Closed-End Management Investment Company and Affiliated Purchasers. |
Not applicable to the registrant.
| Item 10. | Submission of Matters to a Vote of Security Holders. |
There were no material changes to the procedures by which shareholders may recommend nominees to the registrant’s Board of Directors.
| Item 11. | Controls and Procedures. |
(a) The President (the registrant’s Principal Executive Officer) and Treasurer and Chief Financial Officer (the registrant’s Principal Financial Officer) have concluded that the registrant’s disclosure controls and procedures (as defined in Rule 30a-3(c) under the Investment Company Act of 1940) are effective as of a date within 90 days of the filing date of this report, based on their evaluation of these controls and procedures required by Rule 30a-3(b) under the Investment Company Act of 1940 and Rules 13a-15(b) or 15d-15(b) under the Exchange Act of 1934.
(b) There were no changes in the registrant’s internal control over financial reporting (as defined in Rule 30a-3(d) under the Investment Company Act of 1940) that occurred during the period covered by this report that have materially affected, or are reasonably likely to materially affect, the registrant’s internal control over financial reporting.
| Item 12. | Disclosure of Securities Lending Activities for Closed-End Management Investment Companies. |
Not applicable to the registrant.
| Item 13. | Recovery of Erroneously Awarded Compensation. |
Not applicable
(a)(1) Code of Ethics – See Item 2
(a)(2) Any policy required by the listing standards adopted pursuant to Rule 10D-1 under the Exchange Act (17 CFR 240.10D-1) by the registered national securities exchange or registered national securities association upon which the Registrant’s securities are listed – Not Applicable
(a)(3) Section 302 Certifications are attached
(a)(4) Any written solicitation to purchase securities under Rule 23c-1 – Not Applicable
(a)(5) Change in Registrant’s independent public accountant – Not Applicable
(b) Section 906 Certifications are attached
SIGNATURES
Pursuant to the requirements of the Securities Exchange Act of 1934 and the Investment Company Act of 1940, the registrant has duly caused this report to be signed on its behalf by the undersigned, thereunto duly authorized.
iShares, Inc.
| | | | |
| | By: | | /s/ Jessica Tan |
| | | | Jessica Tan, President (Principal Executive Officer) |
Date: June 24, 2024
Pursuant to the requirements of the Securities Exchange Act of 1934 and the Investment Company Act of 1940, this report has been signed below by the following persons on behalf of the registrant and in the capacities and on the dates indicated.
| | | | |
| | By: | | /s/ Jessica Tan |
| | | | Jessica Tan, President (Principal Executive Officer) |
Date: June 24, 2024
| | | | |
| | By: | | /s/ Trent Walker |
| | | | Trent Walker, Treasurer and Chief Financial Officer (Principal Financial Officer) |
Date: June 24, 2024