UNITED STATES
SECURITIES AND EXCHANGE COMMISSION
Washington, D.C. 20549
FORM N-CSR
CERTIFIED SHAREHOLDER REPORT OF REGISTERED MANAGEMENT INVESTMENT COMPANIES
Investment Company Act file number:
Fund Address: c/o BlackRock Fund Advisors, 400 Howard Street, San Francisco, CA 94105
Name and address of agent for service: The Corporation Trust Incorporated, 2405 York Road, Suite 201, Lutherville-Timonium, Maryland 21093
Registrant's telephone number, including area code:
Date of reporting period:
Item 1 — Report to Stockholders
(a) The Report to Shareholders is attached herewith
iShares International High Yield Bond ETF
HYXU | Cboe BZX Exchange
Annual Shareholder Report — October 31, 2024
This annual shareholder report contains important information about iShares International High Yield Bond ETF (the “Fund”) for the period of November 1, 2023 to October 31, 2024. You can find additional information about the Fund at blackrock.com/fundreports. You can also request this information by contacting us at 1‑800‑iShares (1‑800‑474‑2737).
What were the Fund costs for the last year ?
(based on a hypothetical $10,000 investment)
| Fund name | Costs of a $10,000
investment | Costs paid as a percentage of a
$10,000 investment |
| iShares International High Yield Bond ETF | $43 | 0.40% |
How did the Fund perform last year?
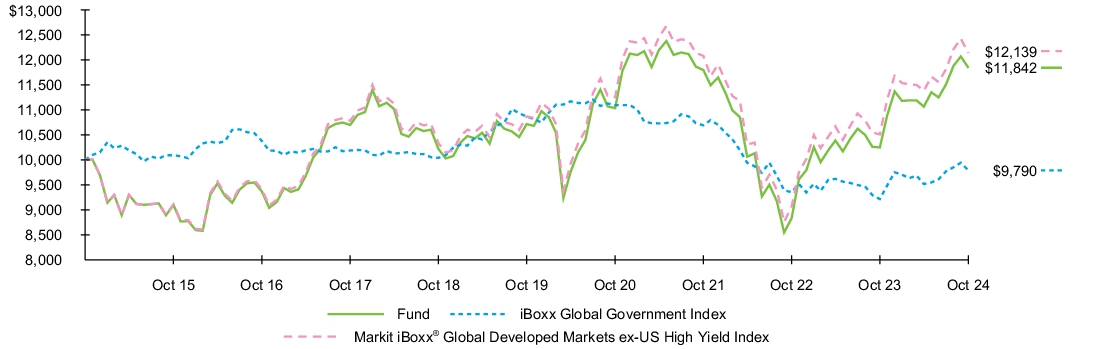
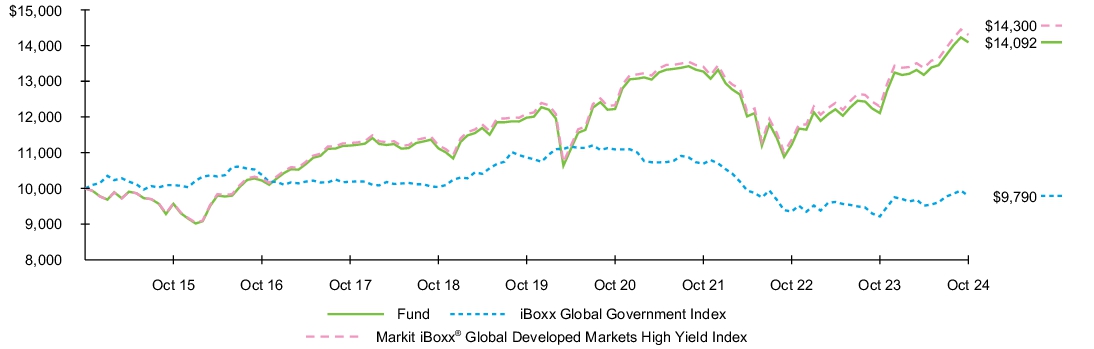
For the reporting period ended October 31, 2024, the Fund returned 15.56%.
For the same period, the iBoxx Global Government Overall USD Hedged Index returned 8.84 and the Markit iBoxx® Global Developed Markets ex-US High Yield Index returned 15.52%.
What contributed to performance?
Bond returns were supported during the reporting period by an environment of slowing pricing pressures. Amid worries about growth prospects, the European Central Bank cut rates three times, while the United States economy stayed strong, prompting the U.S. Federal Reserve Bank to wait until September before decreasing short-term interest rates for the first since 2020. In contrast, Japan ended its negative interest rate regime and raised rates. Positive returns were registered by all countries represented in the Fund. UK bonds, particularly the industrial sector, led contributors for the Fund. Italian bonds also contributed to performance, particularly in the banking industry, benefiting from the economic and fiscal strategy navigated by the new Italian government. By credit rating, bonds rated Ba and B by Moody’s were the largest contributors.
What detracted from performance?
During the reporting period there were no significant detractors from the Fund’s return.
The views expressed reflect the opinions of BlackRock as of the date of this report and are subject to change based on changes in market, economic or other conditions. These views are not intended to be a forecast of future events and are no guarantee of future results.
Fund performance
Cumulative performance: November 1, 2014 through October 31, 2024
Initial investment of $10,000
See “Average annual total returns” for additional information on fund performance.
| Average annual total returns | | | | | | |
| 1 Year | | 5 Years | | 10 Years | |
| Fund NAV | 15.56 | % | 2.02 | % | 1.70 | % |
| iBoxx Global Government Index | 6.24 | | (2.06 | ) | (0.21 | ) |
| Markit iBoxx® Global Developed Markets ex-US High Yield Index | 15.52 | | 2.24 | | 1.96 | |
| Key Fund statistics | |
| Net Assets | $51,198,963 |
| Number of Portfolio Holdings | 405 |
| Net Investment Advisory Fees | $196,972 |
| Portfolio Turnover Rate | 46% |
The Fund has added the iBoxx Global Government Index in response to new regulatory requirements.
Past performance is not an indication of future results. Performance results do not reflect the deduction of taxes that a shareholder would pay on fund distributions or on the redemption or sale of fund shares. Visit iShares.com for more recent performance information.
What did the Fund invest in?
(as of October 31, 2024)
Credit quality allocation
| Moody's Credit Rating* | Percent of Total
Investments(a) | |
| Baa | 6.6 | % |
| Ba | 45.7 | % |
| B | 27.7 | % |
| Caa | 4.7 | % |
| Ca | 1.0 | % |
| Not Rated | 14.3 | % |
| Country/Geographic Region | Percent of Total
Investments(a) | |
| France | 16.7 | % |
| Italy | 15.1 | % |
| United Kingdom | 13.1 | % |
| United States | 12.2 | % |
| Germany | 10.3 | % |
| Spain | 4.5 | % |
| Luxembourg | 4.3 | % |
| Greece | 4.2 | % |
| Sweden | 3.2 | % |
| Netherlands | 3.2 | % |
(a) | Excludes money market funds. |
* | Credit quality ratings shown reflect the ratings assigned by Moody’s Investors Service (“Moody’s”), a widely used independent, nationally recognized statistical rating organization. Moody’s credit ratings are opinions of the credit quality of individual obligations or of an issuer’s general creditworthiness. Investment grade ratings are credit ratings of Baa or higher. Below investment grade ratings are credit ratings of Ba or lower. Unrated investments do not necessarily indicate low credit quality. Credit quality ratings are subject to change. |
Additional information
If you wish to view additional information about the Fund, including but not limited to financial statements, the Fund’s prospectus, and proxy voting policies and procedures, please visit blackrock.com/fundreports. For proxy voting records, visit blackrock.com/proxyrecords.
Householding
Householding is an option available to certain fund investors. Householding is a method of delivery, based on the preference of the individual investor, in which a single copy of certain shareholder documents can be delivered to investors who share the same address, even if their accounts are registered under different names. Please contact your broker-dealer if you are interested in enrolling in householding and receiving a single copy of prospectuses and other shareholder documents, or if you are currently enrolled in householding and wish to change your householding status.
The Fund is not sponsored, endorsed, issued, sold, or promoted by Markit Indices Limited and its affiliates, nor does this company make any representation regarding the advisability of investing in the Fund. BlackRock is not affiliated with the company listed above.
©2024 BlackRock, Inc. or its affiliates. All rights reserved. iSHARES and BLACKROCK are registered trademarks of BlackRock, Inc. or its affiliates. All other trademarks are those of their respective owners.
iShares International High Yield Bond ETF
Annual Shareholder Report — October 31, 2024
HYXU-10/24-AR
iShares J.P. Morgan EM Corporate Bond ETF
CEMB | Cboe BZX Exchange
Annual Shareholder Report — October 31, 2024
This annual shareholder report contains important information about iShares J.P. Morgan EM Corporate Bond ETF (the “Fund”) for the period of November 1, 2023 to October 31, 2024. You can find additional information about the Fund at blackrock.com/fundreports. You can also request this information by contacting us at 1‑800‑iShares (1‑800‑474‑2737).
What were the Fund costs for the last year ?
(based on a hypothetical $10,000 investment)
| Fund name | Costs of a $10,000
investment | Costs paid as a percentage of a
$10,000 investment |
| iShares J.P. Morgan EM Corporate Bond ETF | $54 | 0.50% |
How did the Fund perform last year?
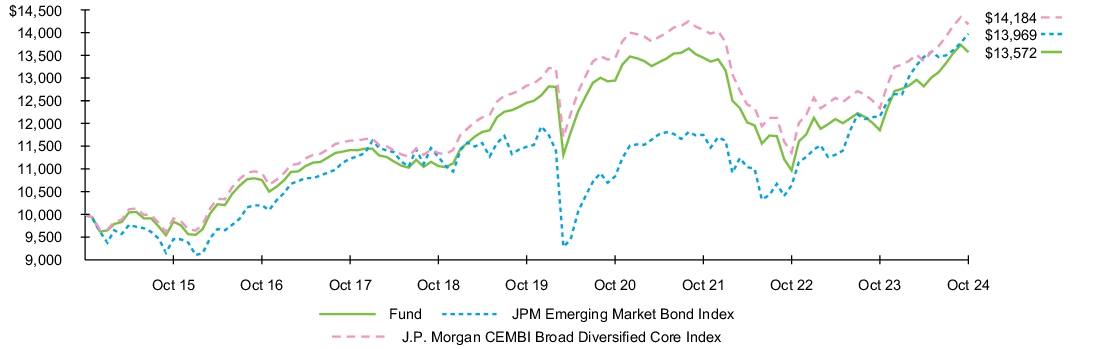
For the reporting period ended October 31, 2024, the Fund returned 14.50%.
For the same period, the JPM Emerging Market Bond Index returned 14.94% and the J.P. Morgan CEMBI Broad Diversified Core Index returned 14.99%.
What contributed to performance?
Emerging market bonds delivered strong returns during the reporting period as expectations of interest rate cuts and then a cut by the U.S. Federal Reserve in September helped these bonds move higher. In addition, emerging market economies benefited from steady growth and from already being in the advanced stages of their easing cycles. In this landscape, the Fund’s allocation to financial bonds contributed to the Fund’s return during the reporting period. Industrials, specifically the basic and communications sectors, also contributed to performance. At the issuer level, Hong Kong industrial bonds were meaningful contributors. From a quality perspective, bonds on the lower end of the investment grade spectrum (rated Baa by Moody’s) benefited performance, followed by the highest rated high yield bonds, rated Ba.
What detracted from performance?
During the reporting period there were no significant detractors from the Fund’s return.
The views expressed reflect the opinions of BlackRock as of the date of this report and are subject to change based on changes in market, economic or other conditions. These views are not intended to be a forecast of future events and are no guarantee of future results.
Fund performance
Cumulative performance: November 1, 2014 through October 31, 2024
Initial investment of $10,000
See “Average annual total returns” for additional information on fund performance.
| Average annual total returns | | | | | | |
| 1 Year | | 5 Years | | 10 Years | |
| Fund NAV | 14.50 | % | 1.74 | % | 3.10 | % |
| JPM Emerging Market Bond Index | 14.94 | | 3.99 | | 3.40 | |
| J.P. Morgan CEMBI Broad Diversified Core Index | 14.99 | | 2.02 | | 3.56 | |
| Key Fund statistics | |
| Net Assets | $444,432,505 |
| Number of Portfolio Holdings | 1,085 |
| Net Investment Advisory Fees | $2,113,528 |
| Portfolio Turnover Rate | 30% |
The Fund has added the JPM Emerging Market Bond Index in response to new regulatory requirements.
The performance of the J.P. Morgan CEMBI Broad Diversified Core Index in this report reflects the performance of the Morningstar® Emerging Markets Corporate Bond IndexSM through May 31, 2017 and, beginning on June 1, 2017, the performance of the J.P. Morgan CEMBI Broad Diversified Core Index.
Past performance is not an indication of future results. Performance results do not reflect the deduction of taxes that a shareholder would pay on fund distributions or on the redemption or sale of fund shares. Visit iShares.com for more recent performance information.
What did the Fund invest in?
(as of October 31, 2024)
Credit quality allocation
| Moody's Credit Rating* | Percent of Total
Investments(a) | |
| Aaa | 0.4 | % |
| Aa | 7.8 | % |
| A | 17.9 | % |
| Baa | 30.9 | % |
| Ba | 14.8 | % |
| B | 7.1 | % |
| Caa | 1.6 | % |
| C | 0.9 | % |
| Not Rated | 18.6 | % |
| Country/Geographic Region | Percent of Total
Investments(a) | |
| China | 9.4 | % |
| Brazil | 5.3 | % |
| United Arab Emirates | 5.2 | % |
| Saudi Arabia | 4.8 | % |
| Mexico | 4.8 | % |
| South Korea | 4.6 | % |
| India | 4.6 | % |
| Turkey | 4.3 | % |
| Chile | 4.1 | % |
| Hong Kong | 3.9 | % |
(a) | Excludes money market funds. |
* | Credit quality ratings shown reflect the ratings assigned by Moody’s Investors Service (“Moody’s”), a widely used independent, nationally recognized statistical rating organization. Moody’s credit ratings are opinions of the credit quality of individual obligations or of an issuer’s general creditworthiness. Investment grade ratings are credit ratings of Baa or higher. Below investment grade ratings are credit ratings of Ba or lower. Unrated investments do not necessarily indicate low credit quality. Credit quality ratings are subject to change. |
Additional information
If you wish to view additional information about the Fund, including but not limited to financial statements, the Fund’s prospectus, and proxy voting policies and procedures, please visit blackrock.com/fundreports. For proxy voting records, visit blackrock.com/proxyrecords.
Householding
Householding is an option available to certain fund investors. Householding is a method of delivery, based on the preference of the individual investor, in which a single copy of certain shareholder documents can be delivered to investors who share the same address, even if their accounts are registered under different names. Please contact your broker-dealer if you are interested in enrolling in householding and receiving a single copy of prospectuses and other shareholder documents, or if you are currently enrolled in householding and wish to change your householding status.
The Fund is not sponsored, endorsed, issued, sold, or promoted by JPMorgan Chase & Co., Morningstar Inc., and their respective affiliates, nor do these companies make any representation regarding the advisability of investing in the Fund. BlackRock is not affiliated with the companies listed above.
©2024 BlackRock, Inc. or its affiliates. All rights reserved. iSHARES and BLACKROCK are registered trademarks of BlackRock, Inc. or its affiliates. All other trademarks are those of their respective owners.
iShares J.P. Morgan EM Corporate Bond ETF
Annual Shareholder Report — October 31, 2024
CEMB-10/24-AR
iShares J.P. Morgan EM High Yield Bond ETF
EMHY | Cboe BZX Exchange
Annual Shareholder Report — October 31, 2024
This annual shareholder report contains important information about iShares J.P. Morgan EM High Yield Bond ETF (the “Fund”) for the period of November 1, 2023 to October 31, 2024. You can find additional information about the Fund at blackrock.com/fundreports. You can also request this information by contacting us at 1‑800‑iShares (1‑800‑474‑2737).
What were the Fund costs for the last year ?
(based on a hypothetical $10,000 investment)
| Fund name | Costs of a $10,000
investment | Costs paid as a percentage of a
$10,000 investment |
| iShares J.P. Morgan EM High Yield Bond ETF | $56 | 0.50% |
How did the Fund perform last year?
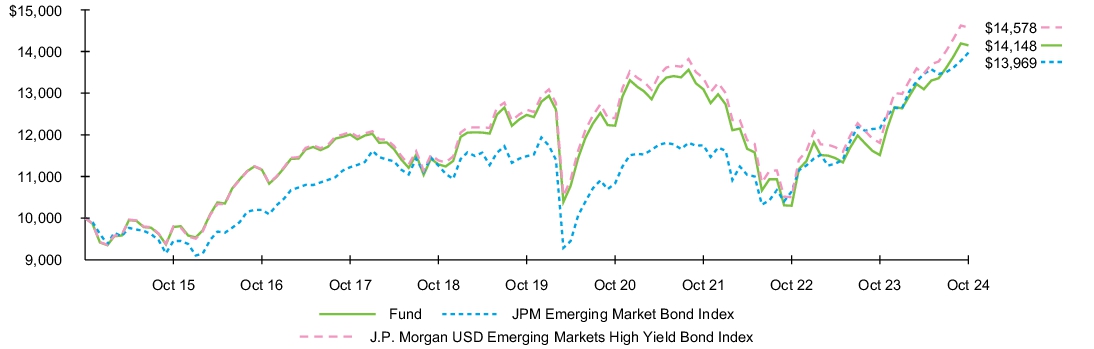
For the reporting period ended October 31, 2024, the Fund returned 22.87%.
For the same period, the JPM Emerging Market Bond Index returned 14.94% and the J.P. Morgan USD Emerging Markets High Yield Bond Index returned 23.46%.
What contributed to performance?
Emerging market bonds delivered strong returns during the reporting period, as expectations of interest rate cuts and then a cut by the U.S. Federal Reserve in September helped these bonds move higher. In addition, emerging market economies benefited from steady growth and from already being in the advanced stages of their easing cycles. Both government and corporate bonds contributed to performance, with government debt, particularly sovereign issues, providing the bulk of outperformance. Within corporate bonds, financial issues benefited performance. From a quality perspective, issues rated B and Ba by Moody’s contributed the most to the Fund’s return.
What detracted from performance?
During the reporting period there were no significant detractors from the Fund’s return.
The views expressed reflect the opinions of BlackRock as of the date of this report and are subject to change based on changes in market, economic or other conditions. These views are not intended to be a forecast of future events and are no guarantee of future results.
Fund performance
Cumulative performance: November 1, 2014 through October 31, 2024
Initial investment of $10,000
See “Average annual total returns” for additional information on fund performance.
| Average annual total returns | | | | | | |
| 1 Year | | 5 Years | | 10 Years | |
| Fund NAV | 22.87 | % | 2.54 | % | 3.53 | % |
| JPM Emerging Market Bond Index | 14.94 | | 3.99 | | 3.40 | |
| J.P. Morgan USD Emerging Markets High Yield Bond Index | 23.46 | | 2.96 | | 3.84 | |
| Key Fund statistics | |
| Net Assets | $457,667,766 |
| Number of Portfolio Holdings | 670 |
| Net Investment Advisory Fees | $1,902,829 |
| Portfolio Turnover Rate | 22% |
The Fund has added the JPM Emerging Market Bond Index in response to new regulatory requirements.
The performance of the J.P. Morgan USD Emerging Markets High Yield Bond Index in this report reflects the performance of the Morningstar® Emerging Markets High Yield Bond IndexSM through March 1, 2020 which terminated on April 1, 2020 and, beginning on March 2, 2020, the performance of the J.P. Morgan USD Emerging Markets High Yield Bond Index.
Past performance is not an indication of future results. Performance results do not reflect the deduction of taxes that a shareholder would pay on fund distributions or on the redemption or sale of fund shares. Visit iShares.com for more recent performance information.
What did the Fund invest in?
(as of October 31, 2024)
Credit quality allocation
| Moody's Credit Rating* | Percent of Total
Investments(a) | |
| Aaa | 0.7 | % |
| Aa | 0.5 | % |
| A | 0.2 | % |
| Baa | 8.0 | % |
| Ba | 35.1 | % |
| B | 25.8 | % |
| Caa | 9.1 | % |
| Ca | 0.8 | % |
| C | 0.7 | % |
| Not Rated | 19.1 | % |
| Country/Geographic Region | Percent of Total
Investments(a) | |
| Turkey | 13.5 | % |
| Brazil | 12.9 | % |
| Mexico | 8.2 | % |
| Colombia | 7.4 | % |
| Argentina | 5.7 | % |
| Dominican Republic | 3.4 | % |
| South Africa | 3.3 | % |
| Oman | 3.2 | % |
| United Arab Emirates | 2.9 | % |
| China | 2.8 | % |
(a) | Excludes money market funds. |
* | Credit quality ratings shown reflect the ratings assigned by Moody’s Investors Service (“Moody’s”), a widely used independent, nationally recognized statistical rating organization. Moody’s credit ratings are opinions of the credit quality of individual obligations or of an issuer’s general creditworthiness. Investment grade ratings are credit ratings of Baa or higher. Below investment grade ratings are credit ratings of Ba or lower. Unrated investments do not necessarily indicate low credit quality. Credit quality ratings are subject to change. |
Additional information
If you wish to view additional information about the Fund, including but not limited to financial statements, the Fund’s prospectus, and proxy voting policies and procedures, please visit blackrock.com/fundreports. For proxy voting records, visit blackrock.com/proxyrecords.
Householding
Householding is an option available to certain fund investors. Householding is a method of delivery, based on the preference of the individual investor, in which a single copy of certain shareholder documents can be delivered to investors who share the same address, even if their accounts are registered under different names. Please contact your broker-dealer if you are interested in enrolling in householding and receiving a single copy of prospectuses and other shareholder documents, or if you are currently enrolled in householding and wish to change your householding status.
The Fund is not sponsored, endorsed, issued, sold, or promoted by JPMorgan Chase & Co., Morningstar Inc., and their respective affiliates, nor do these companies make any representation regarding the advisability of investing in the Fund. BlackRock is not affiliated with the companies listed above.
©2024 BlackRock, Inc. or its affiliates. All rights reserved. iSHARES and BLACKROCK are registered trademarks of BlackRock, Inc. or its affiliates. All other trademarks are those of their respective owners.
iShares J.P. Morgan EM High Yield Bond ETF
Annual Shareholder Report — October 31, 2024
EMHY-10/24-AR
iShares J.P. Morgan EM Local Currency Bond ETF
LEMB | NYSE Arca
Annual Shareholder Report — October 31, 2024
This annual shareholder report contains important information about iShares J.P. Morgan EM Local Currency Bond ETF (the “Fund”) for the period of November 1, 2023 to October 31, 2024. You can find additional information about the Fund at blackrock.com/fundreports. You can also request this information by contacting us at 1‑800‑iShares (1‑800‑474‑2737).
What were the Fund costs for the last year ?
(based on a hypothetical $10,000 investment)
| Fund name | Costs of a $10,000
investment | Costs paid as a percentage of a
$10,000 investment |
| iShares J.P. Morgan EM Local Currency Bond ETF | $31 | 0.30% |
How did the Fund perform last year?
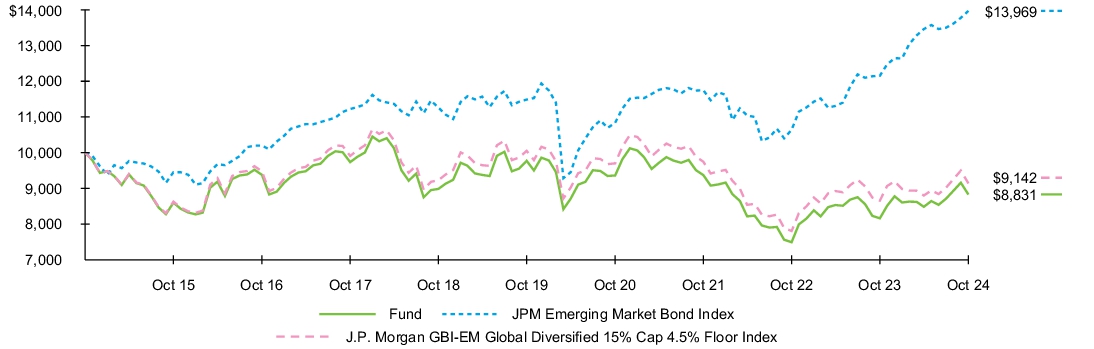
For the reporting period ended October 31, 2024, the Fund returned 8.18%.
For the same period, the JPM Emerging Market Bond Index returned 14.94% and the J.P. Morgan GBI-EM Global Diversified 15% Cap 4.5% Floor Index returned 5.61%.
What contributed to performance?
Emerging market sovereign bonds delivered solid returns during the reporting period, buoyed by expectations of a rate cut from the U.S. Federal Reserve, which was realized in September. In addition, emerging market economies benefited from steady economic growth and their progress in monetary easing cycles. At the country level, China observed gains following government efforts to stimulate the world’s second-largest economy, while South African local currency bonds benefited from the country’s improving economic outlook. In terms of credit quality, investment-grade bonds rated BBB and A contributed the most to the Fund’s return.
What detracted from performance?
During the reporting period, Turkey contributed negatively to performance as the government enacted extreme measures to address inflation and widening deficits. As inflation concerns returned, Brazil’s central bank began to raise borrowing costs, pushing bond prices lower. (Bond yields and prices move in opposite directions.)
The views expressed reflect the opinions of BlackRock as of the date of this report and are subject to change based on changes in market, economic or other conditions. These views are not intended to be a forecast of future events and are no guarantee of future results.
Fund performance
Cumulative performance: November 1, 2014 through October 31, 2024
Initial investment of $10,000
See “Average annual total returns” for additional information on fund performance.
| Average annual total returns | | | | | | |
| 1 Year | | 5 Years | | 10 Years | |
| Fund NAV | 8.18 | % | (2.01 | )% | (1.24 | )% |
| JPM Emerging Market Bond Index | 14.94 | | 3.99 | | 3.40 | |
| J.P. Morgan GBI-EM Global Diversified 15% Cap 4.5% Floor Index | 5.61 | | (1.88 | ) | (0.89 | ) |
| Key Fund statistics | |
| Net Assets | $362,469,397 |
| Number of Portfolio Holdings | 380 |
| Net Investment Advisory Fees | $1,283,298 |
| Portfolio Turnover Rate | 31% |
The Fund has added the JPM Emerging Market Bond Index in response to new regulatory requirements.
The performance of the J.P. Morgan GBI-EM Global Diversified 15% Cap 4.5% Floor Index in this report reflects the performance of the Bloomberg Emerging Markets Broad Local Currency Bond Index through May 31, 2017 and, beginning on June 1, 2017, the performance of the J.P. Morgan GBI-EM Global Diversified 15% Cap 4.5% Floor Index
Past performance is not an indication of future results. Performance results do not reflect the deduction of taxes that a shareholder would pay on fund distributions or on the redemption or sale of fund shares. Visit iShares.com for more recent performance information.
What did the Fund invest in?
(as of October 31, 2024)
Credit quality allocation
| Moody's Credit Rating* | Percent of Total
Investments(a) | |
| Aa | 3.3 | % |
| A | 20.8 | % |
| Baa | 30.9 | % |
| Ba | 9.6 | % |
| Not Rated | 35.4 | % |
| Country/Geographic Region | Percent of Total
Investments(a) | |
| China | 15.3 | % |
| Indonesia | 6.2 | % |
| Malaysia | 5.7 | % |
| Mexico | 5.2 | % |
| India | 4.9 | % |
| Thailand | 4.8 | % |
| Serbia | 4.5 | % |
| Dominican Republic | 4.5 | % |
| Uruguay | 4.5 | % |
| South Africa | 4.5 | % |
(a) | Excludes money market funds. |
* | Credit quality ratings shown reflect the ratings assigned by Moody’s Investors Service (“Moody’s”), a widely used independent, nationally recognized statistical rating organization. Moody’s credit ratings are opinions of the credit quality of individual obligations or of an issuer’s general creditworthiness. Investment grade ratings are credit ratings of Baa or higher. Below investment grade ratings are credit ratings of Ba or lower. Unrated investments do not necessarily indicate low credit quality. Credit quality ratings are subject to change. |
Additional information
If you wish to view additional information about the Fund, including but not limited to financial statements, the Fund’s prospectus, and proxy voting policies and procedures, please visit blackrock.com/fundreports. For proxy voting records, visit blackrock.com/proxyrecords.
Householding
Householding is an option available to certain fund investors. Householding is a method of delivery, based on the preference of the individual investor, in which a single copy of certain shareholder documents can be delivered to investors who share the same address, even if their accounts are registered under different names. Please contact your broker-dealer if you are interested in enrolling in householding and receiving a single copy of prospectuses and other shareholder documents, or if you are currently enrolled in householding and wish to change your householding status.
The Fund is not sponsored, endorsed, issued, sold, or promoted by JPMorgan Chase & Co., Bloomberg Index Services Limited and their respective affiliates, nor do these companies make any representation regarding the advisability of investing in the Fund. BlackRock is not affiliated with the companies listed above.
©2024 BlackRock, Inc. or its affiliates. All rights reserved. iSHARES and BLACKROCK are registered trademarks of BlackRock, Inc. or its affiliates. All other trademarks are those of their respective owners.
iShares J.P. Morgan EM Local Currency Bond ETF
Annual Shareholder Report — October 31, 2024
LEMB-10/24-AR
iShares US & Intl High Yield Corp Bond ETF
GHYG | Cboe BZX Exchange
Annual Shareholder Report — October 31, 2024
This annual shareholder report contains important information about iShares US & Intl High Yield Corp Bond ETF (the “Fund”) for the period of November 1, 2023 to October 31, 2024. You can find additional information about the Fund at blackrock.com/fundreports. You can also request this information by contacting us at 1‑800‑iShares (1‑800‑474‑2737).
What were the Fund costs for the last year ?
(based on a hypothetical $10,000 investment)
| Fund name | Costs of a $10,000
investment | Costs paid as a percentage of a
$10,000 investment |
| iShares US & Intl High Yield Corp Bond ETF | $43 | 0.40% |
How did the Fund perform last year?
For the reporting period ended October 31, 2024, the Fund returned 16.38%.
For the same period, the iBoxx Global Government Overall USD Hedged Index returned 8.84% and the Markit iBoxx® Global Developed Markets High Yield Index returned 16.32%.
What contributed to performance?
Bond returns were supported during the reporting period by an environment of slowing pricing pressures. Amid worries about growth prospects, the European Central Bank cut rates three times, while the United States economy stayed strong, prompting the U.S. Federal Reserve Bank to wait until September before decreasing short-term interest rates for the first since 2020. In contrast, Japan ended its negative interest rate regime and raised rates. Positive returns were registered by all countries, but contributions to the Fund’s return were dominated by U.S. corporate bonds, which have benefited from solid demand amid favorable bond conditions. By credit rating, bonds rated Ba and B by Moody’s were the largest contributors.
What detracted from performance?
During the reporting period there were no significant detractors from the Fund’s return.
The views expressed reflect the opinions of BlackRock as of the date of this report and are subject to change based on changes in market, economic or other conditions. These views are not intended to be a forecast of future events and are no guarantee of future results.
Fund performance
Cumulative performance: November 1, 2014 through October 31, 2024
Initial investment of $10,000
See “Average annual total returns” for additional information on fund performance.
| Average annual total returns | | | | | | |
| 1 Year | | 5 Years | | 10 Years | |
| Fund NAV | 16.38 | % | 3.30 | % | 3.49 | % |
| iBoxx Global Government Index | 6.24 | | (2.06 | ) | (0.21 | ) |
| Markit iBoxx® Global Developed Markets High Yield Index | 16.32 | | 3.42 | | 3.64 | |
| Key Fund statistics | |
| Net Assets | $148,041,255 |
| Number of Portfolio Holdings | 1,567 |
| Net Investment Advisory Fees | $538,239 |
| Portfolio Turnover Rate | 27% |
The Fund has added the iBoxx Global Government Index in response to new regulatory requirements.
Past performance is not an indication of future results. Performance results do not reflect the deduction of taxes that a shareholder would pay on fund distributions or on the redemption or sale of fund shares. Visit iShares.com for more recent performance information.
What did the Fund invest in?
(as of October 31, 2024)
Credit quality allocation
| Moody's Credit Rating* | Percent of Total
Investments(a) | |
| Baa | 2.4 | % |
| Ba | 41.2 | % |
| B | 39.7 | % |
| Caa | 10.4 | % |
| Ca | 1.0 | % |
| Not Rated | 5.3 | % |
| Country/Geographic Region | Percent of Total
Investments(a) | |
| United States | 65.0 | % |
| United Kingdom | 5.9 | % |
| France | 5.2 | % |
| Italy | 4.1 | % |
| Canada | 3.5 | % |
| Germany | 3.4 | % |
| Luxembourg | 1.7 | % |
| Netherlands | 1.7 | % |
| Israel | 1.2 | % |
| Spain | 1.2 | % |
(a) | Excludes money market funds. |
* | Credit quality ratings shown reflect the ratings assigned by Moody’s Investors Service (“Moody’s”), a widely used independent, nationally recognized statistical rating organization. Moody’s credit ratings are opinions of the credit quality of individual obligations or of an issuer’s general creditworthiness. Investment grade ratings are credit ratings of Baa or higher. Below investment grade ratings are credit ratings of Ba or lower. Unrated investments do not necessarily indicate low credit quality. Credit quality ratings are subject to change. |
Additional information
If you wish to view additional information about the Fund, including but not limited to financial statements, the Fund’s prospectus, and proxy voting policies and procedures, please visit blackrock.com/fundreports. For proxy voting records, visit blackrock.com/proxyrecords.
Householding
Householding is an option available to certain fund investors. Householding is a method of delivery, based on the preference of the individual investor, in which a single copy of certain shareholder documents can be delivered to investors who share the same address, even if their accounts are registered under different names. Please contact your broker-dealer if you are interested in enrolling in householding and receiving a single copy of prospectuses and other shareholder documents, or if you are currently enrolled in householding and wish to change your householding status.
The Fund is not sponsored, endorsed, issued, sold, or promoted by Markit Indices Limited and its affiliates, nor does this company make any representation regarding the advisability of investing in the Fund. BlackRock is not affiliated with the company listed above.
©2024 BlackRock, Inc. or its affiliates. All rights reserved. iSHARES and BLACKROCK are registered trademarks of BlackRock, Inc. or its affiliates. All other trademarks are those of their respective owners.
iShares US & Intl High Yield Corp Bond ETF
Annual Shareholder Report — October 31, 2024
GHYG-10/24-AR
(b) Not applicable
| Item 2 – | Code of Ethics – The registrant has adopted a code of ethics, as of the end of the period covered by this report, applicable to the registrant’s principal executive officer, principal financial officer, principal accounting officer or controller, or persons performing similar functions. During the period covered by this report, the registrant has not amended the code of ethics and there have been no waivers granted under the code of ethics. The registrant undertakes to provide a copy of the code of ethics to any person upon request, without charge, by calling 1-800-474-2737. |
| Item 3 – | Audit Committee Financial Expert – The registrant’s board of directors (the “board of directors”), has determined that (i) the registrant has the following audit committee financial experts serving on its audit committee and (ii) each audit committee financial expert is independent: |
Richard L. Fagnani
Madhav V. Rajan
Under applicable securities laws, a person determined to be an audit committee financial expert will not be deemed an “expert” for any purpose, including without limitation for the purposes of Section 11 of the Securities Act of 1933, as a result of being designated or identified as an audit committee financial expert. The designation or identification of a person as an audit committee financial expert does not impose on such person any duties, obligations, or liabilities greater than the duties, obligations, and liabilities imposed on such person as a member of the audit committee and board of directors in the absence of such designation or identification. The designation or identification of a person as an audit committee financial expert does not affect the duties, obligations, or liability of any other member of the audit committee or board of directors.
| Item 4 – | Principal Accountant Fees and Services. |
The principal accountant fees disclosed in items 4(a), 4(b), 4(c), 4(d) and 4(g) are for the five series of the registrant for which the fiscal year-end is October 31, 2024 (the “Funds”), and whose annual financial statements are reported in Item 7.
(a) Audit Fees – The aggregate fees billed for each of the last two fiscal years for professional services rendered by the principal accountant for the audit of the Funds’ annual financial statements or services that are normally provided by the accountant in connection with statutory and regulatory filings or engagements for those fiscal years were $82,000 for the fiscal year ended October 31, 2023 and $82,000 for the fiscal year ended October 31, 2024.
(b) Audit-Related Fees – There were no fees billed for the fiscal years ended October 31, 2023 and October 31, 2024 for assurance and related services by the principal accountant that were reasonably related to the performance of the audit of the Funds’ financial statements and are not reported under (a) of this Item.
(c) Tax Fees – The aggregate fees billed in each of the last two fiscal years for professional services rendered by the principal accountant for tax compliance, tax advice and tax planning for the Funds were $48,500 for the fiscal year ended October 31, 2023 and $48,500 for the fiscal year ended October 31, 2024. These services related to the review of the Funds’ tax returns and excise tax calculations.
(d) All Other Fees – There were no other fees billed in each of the fiscal years ended October 31, 2023 and October 31, 2024 for products and services provided by the principal accountant, other than the services reported in (a) through (c) of this Item.
(e)(1) Audit Committee Pre-Approval Policies and Procedures – The registrant’s audit committee charter, as amended, provides that the audit committee is responsible for the approval, prior to appointment, of the engagement of the principal accountant to annually audit and provide their opinion on the registrant’s financial statements. The audit committee must also approve, prior to appointment, the engagement of the principal accountant to provide non-audit services to the registrant or to any entity controlling, controlled by or under common control with the registrant’s investment adviser (“Adviser Affiliate”) that provides ongoing services to the registrant, if the engagement relates directly to the operations and financial reporting of the registrant.
(e)(2) None of the services described in each of Items 4(b) through (d) were approved by the audit committee pursuant to paragraph (c)(7)(i)(C) of Rule 2-01 of Regulation S-X.
(f) Not applicable
(g) The aggregate non-audit fees billed by the registrant’s principal accountant for services rendered to the Funds, and rendered to the registrant’s investment adviser, and any Adviser Affiliate that provides ongoing services to the registrant for the last two fiscal years were $48,500 for the fiscal year ended October 31, 2023 and $48,500 for the fiscal year ended October 31, 2024.
(h) The registrant’s audit committee has considered whether the provision of non-audit services rendered to the registrant’s investment adviser and any Adviser Affiliate that provides ongoing services to the registrant that were not pre-approved pursuant to paragraph (c)(7)(ii) of Rule 2-01 of Regulation S-X, if any, is compatible with maintaining the principal accountant’s independence, and has determined that the provision of these services, if any, does not compromise the principal accountant’s independence.
(i) Not applicable
(j) Not applicable
| Item 5 – | Audit Committee of Listed Registrant |
(a) The following individuals are members of the registrant’s separately designated standing Committee established in accordance with Section 3(a)(58)(A) of the Securities Exchange Act of 1934 (15 U.S.C. 78c(a)(58)(A)):
Richard L. Fagnani
Laura F. Fergerson
Cecilia H. Herbert
Madhav V. Rajan
(b) Not applicable
(a) The registrant’s Schedule of Investments is included as part of the Financial Statements and Financial Highlights for Open-End Management Investment Companies filed under Item 7 of this Form.
(b) Not applicable due to no such divestments during the semi-annual period covered since the previous Form N-CSR filing.
| Item 7 – | Financial Statements and Financial Highlights for Open-End Management Investment Companies |
(a) The registrant’s Financial Statements are attached herewith.
(b) The registrant’s Financial Highlights are attached herewith.
2024 Annual Financial Statements and Additional Information |
|
• iShares International High Yield Bond ETF | HYXU | Cboe BZX Exchange |
• iShares J.P. Morgan EM Corporate Bond ETF | CEMB | Cboe BZX Exchange |
• iShares J.P. Morgan EM High Yield Bond ETF | EMHY | Cboe BZX Exchange |
• iShares J.P. Morgan EM Local Currency Bond ETF | LEMB | NYSE Arca |
• iShares US & Intl High Yield Corp Bond ETF | GHYG | Cboe BZX Exchange |
|
Schedule of InvestmentsOctober 31, 2024
iShares® International High Yield Bond ETF(Percentages shown are based on Net Assets)
| | |
|
|
APA Infrastructure Ltd., 7.13%, 11/09/83, (5-year EURIBOR ICE Swap + 4.098%)(a)(b) | | |
|
ams-OSRAM AG, 10.50%, 03/30/29(a) | | |
Benteler International AG, 9.38%, 05/15/28(a) | | |
| | |
|
| | |
| | |
| | |
Telenet Finance Luxembourg Notes SARL, 3.50%, 03/01/28(a) | | |
| | |
|
Air Canada, 4.63%, 08/15/29(c) | | |
Cineplex Inc., 7.63%, 03/31/29(c) | | |
Mattamy Group Corp., 4.63%, 03/01/28(a) | | |
Mattr Corp., 7.25%, 04/02/31(c) | | |
| | |
| | |
| | |
Primo Water Holdings Inc., 3.88%, 10/31/28(a) | | |
Southern Pacific Resource Corp., 8.75%, 01/25/18(c)(d)(e)(f) | | |
Tamarack Valley Energy Ltd., 7.25%, 05/10/27(c) | | |
| | |
|
Bank of Cyprus PCL, 2.50%, 06/24/27, (1-year EUR Swap + 2.785%)(a)(b) | | |
|
Allwyn Entertainment Financing U.K. PLC, 7.25%, 04/30/30(a) | | |
|
| | |
1.50%, (5-year EUR Swap + 1.860%)(a)(b) | | |
1.75%, (5-year EURIBOR ICE Swap + 1.952%)(a)(b) | | |
2.50%, (5-year GUK + 2.136%)(a)(b) | | |
5.13%, (5-year EURIBOR ICE Swap + 2.590%)(a)(b) | | |
| | |
|
Citycon Treasury BV, 1.25%, 09/08/26(a) | | |
|
| | |
| | |
| | |
| | |
| | |
| | |
| | |
| | |
| | |
| | |
Banijay Entertainment SASU, 7.00%, 05/01/29(a) | | |
Banijay Group SAS, 6.50%, 03/01/26(a) | | |
CAB SELAS, 3.38%, 02/01/28(a) | | |
Cerba Healthcare SACA, 3.50%, 05/31/28(a) | | |
| | |
|
Chrome Holdco SASU, 5.00%, 05/31/29(a) | | |
| | |
| | |
| | |
| | |
| | |
| | |
| | |
| | |
| | |
Emeria SASU, 7.75%, 03/31/28(a) | | |
Eramet SA, 6.50%, 11/30/29(a) | | |
| | |
| | |
| | |
| | |
| | |
| | |
| | |
| | |
| | |
| | |
| | |
| | |
Holding d'Infrastructures des Metiers de l'Environnement | | |
| | |
Series ., 0.63%, Series ., 09/16/28(a) | | |
| | |
| | |
| | |
| | |
| | |
| | |
| | |
| | |
| | |
| | |
| | |
Series ., 5.38%, Series ., 05/02/31(a) | | |
IPD 3 BV, 8.00%, 06/15/28(a) | | |
Kapla Holding SAS, 3.38%, 12/15/26(a) | | |
| | |
| | |
| | |
| | |
| | |
| | |
| | |
| | |
| | |
| | |
| | |
| | |
| | |
RCI Banque SA, 5.50%, 10/09/34, (5-year EURIBOR ICE Swap + 2.750%)(a)(b) | | |
| | |
| | |
| | |
| | |
| | |
32024 iShares Annual Financial Statements and Additional Information
Schedule of Investments (continued)October 31, 2024
iShares® International High Yield Bond ETF(Percentages shown are based on Net Assets)
| | |
|
| | |
| | |
| | |
| | |
SNF Group SACA, 2.00%, 02/01/26(a) | | |
Tereos Finance Groupe I SA, 7.25%, 04/15/28(a) | | |
| | |
| | |
| | |
| | |
| | |
| | |
Viridien, 7.75%, 04/01/27(a) | | |
| | |
|
Aareal Bank AG, 5.63%, 12/12/34, (5-year EURIBOR ICE Swap + 3.250%)(a)(b) | | |
alstria office REIT-AG, 1.50%, 06/23/26(a) | | |
APCOA Group GmbH, 6.00%, 04/15/31(a) | | |
| | |
3.13%, 11/12/79, (5-year EUR Swap + 3.108%)(a)(b) | | |
3.90%, 09/25/83, (5-year EUR Swap + 3.896%)(a)(b) | | |
5.38%, 03/25/82, (5-year EUR Swap + 4.458%)(a)(b) | | |
5.50%, 09/13/54, (5-year EURIBOR ICE Swap + 3.269%)(a)(b) | | |
6.63%, 09/25/83, (5-year EUR Swap + 3.432%)(a)(b) | | |
Series N5.5, 4.50%, Series N5.5, 03/25/82, (5-year EUR Swap + 3.751%)(a)(b) | | |
Bertelsmann SE & Co. KGaA, 3.50%, 04/23/75, (5-year EUR Swap + 3.206%)(a)(b) | | |
Cheplapharm Arzneimittel GmbH | | |
| | |
| | |
| | |
Evonik Industries AG, 1.38%, 09/02/81, (5-year EUR Swap + 1.836%)(a)(b) | | |
| | |
| | |
| | |
| | |
6.75%, 11/15/29, (6.75% cash and 7.50% PIK)(a)(g) | | |
7.00%, 11/15/31, (7.00% cash and 7.75% PIK)(a)(g) | | |
8.75%, 05/15/28, (8.75% Cash and 9.50% PIK)(a)(g) | | |
| | |
| | |
| | |
Nidda Healthcare Holding GmbH | | |
| | |
| | |
| | |
| | |
| | |
| | |
| | |
| | |
Tele Columbus AG, 10.00%, 01/01/29, (10.00% PIK)(a)(g) | | |
TK Elevator Holdco GmbH, 6.63%, 07/15/28(a) | | |
TK Elevator Midco GmbH, 4.38%, 07/15/27(a) | | |
TUI Cruises GmbH, 6.25%, 04/15/29(a) | | |
| | |
|
| | |
| | |
| | |
| | |
| | |
| | |
| | |
| | |
| | |
| | |
| | |
| | |
| | |
|
| | |
2.50%, 03/23/28, (1-year EUR Swap + 2.849%)(a)(b) | | |
5.00%, 05/12/30, (1-year EUR Swap + 2.432%)(a)(b) | | |
7.50%, 06/16/27, (1-year EUR Swap + 5.084%)(a)(b) | | |
Alpha Services and Holdings SA | | |
5.50%, 06/11/31, (5-year EUR Swap + 5.823%)(a)(b) | | |
6.00%, 09/13/34, (5-year EURIBOR ICE Swap + 3.270%)(a)(b) | | |
Eurobank Ergasias Services and Holdings SA, 10.00%, 12/06/32, (5-year EUR Swap + 7.588%)(a)(b) | | |
Metlen Energy & Metals SA, 4.00%, 10/17/29(a) | | |
Mytilineos SA, 2.25%, 10/30/26(a) | | |
National Bank of Greece SA | | |
5.88%, 06/28/35, (5-year EURIBOR ICE Swap + 3.154%)(a)(b) | | |
8.00%, 01/03/34, (5-year EURIBOR ICE Swap + 4.646%)(a)(b) | | |
| | |
5.00%, 04/16/30, (1-year EURIBOR ICE Swap + 2.245%)(a)(b) | | |
6.75%, 12/05/29, (1-year EUR Swap + 3.837%)(a)(b) | | |
7.25%, 07/13/28, (1-year EUR Swap + 3.692%)(a)(b) | | |
Piraeus Financial Holdings SA | | |
5.38%, 09/18/35, (5-year EURIBOR ICE Swap + 3.150%)(a)(b) | | |
7.25%, 04/17/34, (5-year EUR Swap + 4.773%)(a)(b) | | |
| | |
| | |
| | |
| | |
|
| | |
| | |
| | |
| | |
|
Teva Pharmaceutical Finance Netherlands II BV | | |
| | |
| | |
| | |
| | |
| | |
| | |
| | |
Schedule of Investments (continued)October 31, 2024
iShares® International High Yield Bond ETF(Percentages shown are based on Net Assets)
| | |
|
Almaviva-The Italian Innovation Co. SpA, 5.00%, 10/30/30(a) | | |
| | |
| | |
| | |
Banca Monte dei Paschi di Siena SpA | | |
| | |
4.75%, 03/15/29, (3-mo. EURIBOR + 2.047%)(a)(b) | | |
6.75%, 09/05/27, (3-mo. EURIBOR + 3.283%)(a)(b) | | |
| | |
Banca Popolare di Sondrio SpA, 5.51%, 03/13/34, (5-year EUR Swap + 2.800%)(a)(b) | | |
| | |
3.25%, 01/14/31, (5-year EUR Swap + 3.800%)(a)(b) | | |
5.00%, 06/18/34, (5-year EUR Swap + 2.450%)(a)(b) | | |
| | |
3.88%, 07/25/32, (5-year EUR Swap + 3.728%)(a)(b) | | |
5.75%, 09/11/29, (3-mo. EURIBOR + 2.600%)(a)(b) | | |
6.13%, 02/01/28, (3-mo. EURIBOR + 3.600%)(a)(b) | | |
Cerved Group SpA, 6.00%, 02/15/29(a) | | |
Engineering - Ingegneria Informatica - SpA | | |
| | |
| | |
Fiber Bidco SpA, 6.13%, 06/15/31(a) | | |
Guala Closures SpA, 3.25%, 06/15/28(a) | | |
IMA Industria Macchine Automatiche SpA, 3.75%, 01/15/28(a) | | |
Infrastrutture Wireless Italiane SpA | | |
| | |
| | |
| | |
| | |
| | |
| | |
| | |
6.18%, 02/20/34, (5-year EURIBOR ICE Swap + 3.250%)(a)(b) | | |
Lottomatica SpA, 7.13%, 06/01/28(a) | | |
Lottomatica SpA/Roma, 5.38%, 06/01/30(a) | | |
Mediobanca Banca di Credito Finanziario SpA, 3.75%, 06/16/26 | | |
| | |
| | |
| | |
| | |
| | |
| | |
| | |
| | |
| | |
| | |
| | |
| | |
| | |
Pachelbel Bidco SpA, 7.13%, 05/17/31(a) | | |
Rossini SARL, 6.75%, 12/31/29(a) | | |
Saipem Finance International BV | | |
| | |
| | |
| | |
|
| | |
| | |
| | |
Telecom Italia SpA/Milano | | |
| | |
| | |
| | |
| | |
| | |
| | |
2.73%, 01/15/32, (5-year EUR Swap + 2.800%)(a)(b) | | |
5.38%, 04/16/34, (5-year EURIBOR ICE Swap + 2.800%)(a)(b) | | |
UnipolSai Assicurazioni SpA, 4.90%, 05/23/34(a) | | |
| | |
| | |
| | |
| | |
|
| | |
| | |
| | |
| | |
| | |
| | |
| | |
|
Aston Martin Capital Holdings Ltd., 10.38%, 03/31/29(a) | | |
|
Albion Financing 1 SARL/Aggreko Holdings Inc., 5.25%, 10/15/26(a) | | |
| | |
| | |
| | |
Altice Finco SA, 4.75%, 01/15/28(a) | | |
| | |
| | |
| | |
ARD Finance SA, 5.00%, 06/30/27, (5.00% Cash and 5.75% PIK)(a)(g) | | |
| | |
| | |
| | |
Garfunkelux Holdco 3 SA, 6.75%, 11/01/25(a) | | |
| | |
| | |
| | |
Matterhorn Telecom SA, 3.13%, 09/15/26(a) | | |
| | |
5.50%, 09/12/54, (5-year EURIBOR ICE Swap + 3.232%)(a)(b) | | |
6.00%, 09/12/54, (5-year EURIBOR ICE Swap + 3.586%)(a)(b) | | |
Summer BC Holdco A SARL, 9.25%, 10/31/27(a) | | |
Summer BC Holdco B SARL, 5.75%, 10/31/26(a) | | |
| | |
8.00%, 08/31/28, (6.50% Cash and 1.40% PIK)(a)(g) | | |
| | |
| | |
52024 iShares Annual Financial Statements and Additional Information
Schedule of Investments (continued)October 31, 2024
iShares® International High Yield Bond ETF(Percentages shown are based on Net Assets)
| | |
|
Boels Topholding BV, 5.75%, 05/15/30(a) | | |
Boost Newco Borrower LLC/GTCR W Dutch Finance Sub BV, 8.50%, 01/15/31(a) | | |
Odido Group Holding BV, 5.50%, 01/15/30(a) | | |
Odido Holding BV, 3.75%, 01/15/29(a) | | |
| | |
| | |
| | |
| | |
Sunrise HoldCo IV BV, 3.88%, 06/15/29(a) | | |
Trivium Packaging Finance BV, 3.75%, 08/15/26(a) | | |
VZ Vendor Financing II BV, 2.88%, 01/15/29(a) | | |
| | |
| | |
| | |
Ziggo BV, 2.88%, 01/15/30(a) | | |
| | |
|
Var Energi ASA, 7.86%, 11/15/83, (5-year EURIBOR ICE Swap + 4.765%)(a)(b) | | |
|
Banco Comercial Portugues SA, 4.00%, 05/17/32, (5-year EUR Swap + 4.065%)(a)(b) | | |
Caixa Economica Montepio Geral Caixa Economica Bancaria SA, 8.50%, 06/12/34, (5-year EURIBOR ICE Swap + 5.815%)(a)(b) | | |
| | |
1.50%, 03/14/82, (5-year EUR Swap + 1.888%)(a)(b) | | |
1.88%, 08/02/81, (5-year EUR Swap + 2.380%)(a)(b) | | |
1.88%, 03/14/82, (5-year EUR Swap + 2.080%)(a)(b) | | |
4.63%, 09/16/54, (5-year EURIBOR ICE Swap + 2.395%)(a)(b) | | |
4.75%, 05/29/54, (5-year EURIBOR ICE Swap + 2.052%)(a)(b) | | |
5.94%, 04/23/83, (5-year EUR Swap + 3.184%)(a)(b) | | |
Novo Banco SA, 9.88%, 12/01/33, (5-year EUR Swap + 6.714%)(a)(b) | | |
| | |
|
Summer BidCo BV, 10.00%, 02/15/29, (10.00% Cash and 10.75% PIK)(a)(g) | | |
| | |
| | |
| | |
| | |
| | |
| | |
| | |
|
Abanca Corp. Bancaria SA, 8.38%, 09/23/33, (5-year EURIBOR ICE Swap + 5.245%)(a)(b) | | |
Banco de Credito Social Cooperativo SA | | |
1.75%, 03/09/28, (1-year EUR Swap + 2.150%)(a)(b) | | |
5.25%, 11/27/31, (5-year EUR Swap + 5.419%)(a)(b) | | |
7.50%, 09/14/29, (1-year EURIBOR ICE Swap + 4.269%)(a)(b) | | |
| | |
2.50%, 04/15/31, (5-year EUR Swap + 2.950%)(a)(b) | | |
| | |
|
5.13%, 06/27/34, (5-year EURIBOR ICE Swap + 2.400%)(a)(b) | | |
6.00%, (5-year EUR Swap + 3.150%)(a)(b) | | |
Cirsa Finance International SARL | | |
| | |
| | |
| | |
| | |
| | |
| | |
Kaixo Bondco Telecom SA, 5.13%, 09/30/29(a) | | |
Lorca Telecom Bondco SA, 4.00%, 09/18/27(a) | | |
| | |
5.50%, 06/22/34, (5-year EUR Swap + 2.800%)(a)(b) | | |
7.25%, 11/15/27, (1-year EUR Swap + 4.250%)(a)(b) | | |
| | |
|
Assemblin Caverion Group AB, 6.25%, 07/01/30(a) | | |
| | |
| | |
| | |
| | |
| | |
| | |
| | |
| | |
| | |
| | |
Verisure Midholding AB, 5.25%, 02/15/29(a) | | |
| | |
| | |
| | |
| | |
| | |
|
| | |
| | |
| | |
| | |
| | |
|
888 Acquisitions Ltd., 7.56%, 07/15/27(a) | | |
Amber Finco PLC, 6.63%, 07/15/29(a) | | |
Ardonagh Finco Ltd., 6.88%, 02/15/31(a) | | |
BCP V Modular Services Finance II PLC, 4.75%, 11/30/28(a) | | |
Bellis Acquisition Co. PLC, 8.13%, 05/14/30(a) | | |
Bellis Finco PLC, 4.00%, 02/16/27(a) | | |
Belron U.K. Finance PLC, 4.63%, 10/15/29(a) | | |
British Telecommunications PLC | | |
5.13%, 10/03/54, (5-year EURIBOR ICE Swap + 2.542%)(a)(b) | | |
8.38%, 12/20/83, (5-year GUK + 3.820%)(a)(b) | | |
Canary Wharf Group Investment Holdings PLC, 3.38%, 04/23/28(a) | | |
Centrica PLC, 6.50%, 05/21/55, (5-year GUK + 2.512%)(a)(b) | | |
Deuce Finco PLC, 5.50%, 06/15/27(a) | | |
eG Global Finance PLC, 11.00%, 11/30/28(a) | | |
Schedule of Investments (continued)October 31, 2024
iShares® International High Yield Bond ETF(Percentages shown are based on Net Assets)
| | |
United Kingdom (continued) |
| | |
| | |
| | |
INEOS Quattro Finance 2 PLC | | |
| | |
| | |
INEOS Styrolution Ludwigshafen GmbH, 2.25%, 01/16/27(a) | | |
Jaguar Land Rover Automotive PLC | | |
| | |
| | |
Jerrold Finco PLC, 7.88%, 04/15/30(a) | | |
Market Bidco Finco PLC, 5.50%, 11/04/27(a) | | |
Miller Homes Group Finco PLC, 7.00%, 05/15/29(a) | | |
Motion Finco SARL, 7.38%, 06/15/30(a) | | |
NGG Finance PLC, 2.13%, 09/05/82, (5-year EUR Swap + 2.532%)(a)(b) | | |
| | |
| | |
| | |
| | |
| | |
| | |
Thames Water Utilities Finance PLC | | |
| | |
| | |
| | |
| | |
| | |
| | |
Virgin Media Finance PLC, 3.75%, 07/15/30(a) | | |
Virgin Media Secured Finance PLC | | |
| | |
| | |
Virgin Media Vendor Financing Notes III DAC, 4.88%, 07/15/28(a) | | |
Vmed O2 U.K. Financing I PLC | | |
| | |
| | |
| | |
| | |
| | |
2.63%, 08/27/80, (5-year EUR Swap + 3.002%)(a)(b) | | |
3.00%, 08/27/80, (5-year EUR Swap + 3.477%)(a)(b) | | |
4.20%, 10/03/78, (5-year EUR Swap + 3.427%)(a)(b) | | |
6.50%, 08/30/84, (5-year EUR Swap + 3.489%)(a)(b) | | |
8.00%, 08/30/86, (5-year GUK + 3.837%)(a)(b) | | |
Zegona Finance PLC, 6.75%, 07/15/29(a) | | |
| | |
|
Allied Universal Holdco LLC/Allied Universal Finance Corp./Atlas Luxco 4 SARL, 3.63%, 06/01/28(a) | | |
Ardagh Metal Packaging Finance USA LLC/Ardagh Metal Packaging Finance PLC | | |
| | |
| | |
Ardagh Packaging Finance PLC/Ardagh Holdings USA Inc. | | |
| | |
| | |
Ashland Services BV, 2.00%, 01/30/28(a) | | |
| | |
United States (continued) |
Avantor Funding Inc., 2.63%, 11/01/25(a) | | |
| | |
| | |
| | |
Ball Corp., 1.50%, 03/15/27 | | |
Belden Inc., 3.88%, 03/15/28(a) | | |
Brookfield Property Finance ULC | | |
| | |
| | |
Carnival PLC, 1.00%, 10/28/29 | | |
Catalent Pharma Solutions Inc., 2.38%, 03/01/28(a) | | |
Chemours Co. (The), 4.00%, 05/15/26 | | |
Clarios Global LP/Clarios U.S. Finance Co., 4.38%, 05/15/26(a) | | |
Constellium SE, 5.38%, 08/15/32(a) | | |
| | |
| | |
| | |
Crown European Holdings SACA | | |
| | |
| | |
| | |
Dana Financing Luxembourg SARL, 8.50%, 07/15/31(a) | | |
Darling Global Finance BV, 3.63%, 05/15/26(a) | | |
EMRLD Borrower LP/Emerald Co-Issuer Inc., 6.38%, 12/15/30(a) | | |
Encore Capital Group Inc., 5.38%, 02/15/26(a) | | |
Energizer Gamma Acquisition BV, 3.50%, 06/30/29(a) | | |
Goodyear Europe BV, 2.75%, 08/15/28(a) | | |
IGT Lottery Holdings BV, 4.25%, 03/15/30(a) | | |
International Game Technology PLC, 3.50%, 06/15/26(a) | | |
| | |
| | |
| | |
| | |
Iron Mountain U.K. PLC, 3.88%, 11/15/25(a) | | |
Levi Strauss & Co., 3.38%, 03/15/27 | | |
MPT Operating Partnership LP/MPT Finance Corp. | | |
| | |
| | |
| | |
Novelis Sheet Ingot GmbH, 3.38%, 04/15/29(a) | | |
| | |
| | |
| | |
Olympus Water U.S. Holding Corp. | | |
| | |
| | |
Organon & Co./Organon Foreign Debt Co-Issuer BV, 2.88%, 04/30/28(a) | | |
Perrigo Finance Unlimited Co., 5.38%, 09/30/32 | | |
SCIL IV LLC/SCIL USA Holdings LLC, 9.50%, 07/15/28(a) | | |
Silgan Holdings Inc., 2.25%, 06/01/28 | | |
Standard Industries Inc./New York, 2.25%, 11/21/26(a) | | |
| | |
| | |
| | |
72024 iShares Annual Financial Statements and Additional Information
Schedule of Investments (continued)October 31, 2024
iShares® International High Yield Bond ETF(Percentages shown are based on Net Assets)
| | |
United States (continued) |
Walgreens Boots Alliance Inc., 2.13%, 11/20/26 | | |
| | |
Total Corporate Bonds & Notes — 97.8%
(Cost: $50,626,648) | |
| | |
|
|
| | |
Total Common Stocks — 0.0%
(Cost: $159,437) | |
Total Long-Term Investments — 97.8%
(Cost: $50,786,085) | |
|
Money Market Funds — 0.0% |
BlackRock Cash Funds: Treasury, SL Agency Shares, 4.83%(i)(j) | | |
Total Short-Term Securities — 0.0%
(Cost: $20,000) | |
Total Investments — 97.8%
(Cost: $50,806,085) | |
Other Assets Less Liabilities — 2.2% | |
| |
| This security may be resold to qualified foreign investors and foreign institutional buyers under Regulation S of the Securities Act of 1933. |
| Variable rate security. Interest rate resets periodically. The rate shown is the effective interest rate as of period end. Security description also includes the reference rate and spread if published and available. |
| Security exempt from registration pursuant to Rule 144A under the Securities Act of 1933, as amended. These securities may be resold in transactions exempt from registration to qualified institutional investors. |
| Issuer filed for bankruptcy and/or is in default. |
| Security is valued using significant unobservable inputs and is classified as Level 3 in the fair value hierarchy. |
| Non-income producing security. |
| Payment-in-kind security which may pay interest/dividends in additional par/shares and/or in cash. Rates shown are the current rate and possible payment rates. |
| Step coupon security. Coupon rate will either increase (step-up bond) or decrease (step-down bond) at regular intervals until maturity. Interest rate shown reflects the rate currently in effect. |
| |
| Annualized 7-day yield as of period end. |
Affiliates
Investments in issuers considered to be affiliate(s) of the Fund during the year ended October 31, 2024 for purposes of Section 2(a)(3) of the Investment Company Act of 1940, as amended, were as follows:
| | | | | Change in
Unrealized
Appreciation
(Depreciation) | | | | Capital
Gain
Distributions
from
Underlying
Funds |
BlackRock Cash Funds: Treasury, SL Agency Shares | | | | | | | | | |
| Represents net amount purchased (sold). |
Schedule of Investments (continued)October 31, 2024
iShares® International High Yield Bond ETF
Fair Value Hierarchy as of Period End
Various inputs are used in determining the fair value of financial instruments at the measurement date. For a description of the input levels and information about the Fund’s policy regarding valuation of financial instruments, refer to the Notes to Financial Statements.
The following table summarizes the Fund’s financial instruments categorized in the fair value hierarchy. The breakdown of the Fund’s financial instruments into major categories is disclosed in the Schedule of Investments above.
See notes to financial statements.
92024 iShares Annual Financial Statements and Additional Information
Schedule of InvestmentsOctober 31, 2024
iShares® J.P. Morgan EM Corporate Bond ETF(Percentages shown are based on Net Assets)
| | |
|
|
| | |
| | |
| | |
| | |
| | |
| | |
| | |
| | |
| | |
| | |
| | |
|
AngloGold Ashanti Holdings PLC | | |
| | |
| | |
China Ping An Insurance Overseas Holdings Ltd., 2.85%, 08/12/31(b) | | |
Franshion Brilliant Ltd., 3.20%, 04/09/26(b) | | |
| | |
|
AUB Sukuk Ltd., 2.62%, 09/09/26(b) | | |
BBK BSC, 6.88%, 06/06/29(b) | | |
| | |
|
Ooredoo International Finance Ltd., 4.63%, 10/10/34(a) | | |
|
Acu Petroleo Luxembourg SARL, 7.50%, 01/13/32(b) | | |
| | |
| | |
| | |
Amaggi Luxembourg International SARL, 5.25%, 01/28/28(b) | | |
Ambipar Lux SARL, 9.88%, 02/06/31(b) | | |
| | |
| | |
| | |
B3 SA - Brasil Bolsa Balcao, 4.13%, 09/20/31(b) | | |
Banco Bradesco SA/Cayman Islands, 4.38%, 03/18/27(b) | | |
Banco BTG Pactual SA/Cayman Islands | | |
| | |
| | |
| | |
| | |
| | |
| | |
| | |
8.75%, (10-year CMT + 4.398%)(b)(d)(e)(f) | | |
Braskem America Finance Co., 7.13%, 07/22/41(b) | | |
Braskem Netherlands Finance BV | | |
| | |
| | |
| | |
| | |
| | |
| | |
|
| | |
| | |
| | |
Centrais Eletricas Brasileiras SA | | |
| | |
| | |
| | |
| | |
| | |
| | |
Cosan Overseas Ltd., 8.25%(b)(d) | | |
CSN Inova Ventures, 6.75%, 01/28/28(b) | | |
| | |
| | |
| | |
| | |
Embraer Netherlands Finance BV | | |
| | |
| | |
Guara Norte SARL, 5.20%, 06/15/34(b) | | |
GUSAP III LP, 4.25%, 01/21/30(b) | | |
Itau Unibanco Holding SA/Cayman Island | | |
3.88%, 04/15/31, (5-year CMT + 3.446%)(b)(f) | | |
4.50%, 11/21/29, (5-year CMT + 2.822%)(b)(f) | | |
4.63%, (5-year CMT + 3.222%)(b)(d)(f) | | |
7.72%, (5-year CMT + 3.981%)(b)(d)(f) | | |
7.86%, (5-year CMT + 3.863%)(b)(d)(f) | | |
| | |
| | |
| | |
| | |
MARB BondCo PLC, 3.95%, 01/29/31(b) | | |
MC Brazil Downstream Trading SARL, 7.25%, 06/30/31(b) | | |
MercadoLibre Inc., 3.13%, 01/14/31 | | |
| | |
| | |
| | |
Movida Europe SA, 7.85%, 04/11/29(b) | | |
NBM U.S. Holdings Inc., 7.00%, 05/14/26(b) | | |
Nexa Resources SA, 6.75%, 04/09/34(b) | | |
Petrobras Global Finance BV | | |
| | |
| | |
| | |
| | |
| | |
| | |
| | |
| | |
| | |
| | |
Petrorio Luxembourg Holding SARL, 6.13%, 06/09/26(b) | | |
| | |
| | |
| | |
| | |
| | |
| | |
| | |
Schedule of Investments10
Schedule of Investments (continued)October 31, 2024
iShares® J.P. Morgan EM Corporate Bond ETF(Percentages shown are based on Net Assets)
| | |
|
Rumo Luxembourg SARL, 5.25%, 01/10/28(b) | | |
Samarco Mineracao SA, 9.00%, 06/30/31, (9.00% PIK)(a)(e)(g) | | |
Simpar Europe SA, 5.20%, 01/26/31(b) | | |
Sitios Latinoamerica SAB de CV, 5.38%, 04/04/32(b) | | |
St Marys Cement Inc. Canada, 5.75%, 04/02/34(b) | | |
| | |
| | |
| | |
| | |
| | |
| | |
| | |
| | |
Suzano International Finance BV, 5.50%, 01/17/27(e) | | |
Trident Energy Finance PLC, 12.50%, 11/30/29(b) | | |
| | |
| | |
| | |
| | |
| | |
| | |
| | |
XP Inc., 6.75%, 07/02/29(b) | | |
Yinson Boronia Production BV, 8.95%, 07/31/42(b) | | |
| | |
British Virgin Islands — 0.0% |
Joy Treasure Assets Holdings Inc., 5.50%, 02/01/27(b) | | |
|
Endeavour Mining PLC, 5.00%, 10/14/26(b) | | |
|
CCCI Treasure Ltd., 3.65%, (5-year CMT + 5.117%)(b)(d)(f) | | |
|
Al Rajhi Sukuk Ltd., 5.05%, 03/12/29(b) | | |
Alinma Tier 1 Sukuk Ltd., 6.50%, (5-year CMT + 2.201%)(b)(d)(f) | | |
Arabian Centres Sukuk III Ltd., 9.50%, 03/06/29(b) | | |
Doha Finance Ltd., 5.25%, 03/12/29(b) | | |
QNB Finance Ltd., 6.06%, 04/02/29, (1-day SOFR + 1.200%)(f) | | |
SNB Sukuk Ltd., 5.13%, 02/27/29(b) | | |
| | |
|
AES Andes SA, 8.15%, 06/10/55, (5-year CMT + 3.835%)(b)(f) | | |
Agrosuper SA, 4.60%, 01/20/32(b) | | |
Alfa Desarrollo SpA, 4.55%, 09/27/51(b) | | |
| | |
| | |
| | |
| | |
Banco de Chile, 2.99%, 12/09/31(b) | | |
Banco de Credito e Inversiones SA | | |
| | |
| | |
7.50%, (5-year CMT + 3.767%)(a)(d)(f) | | |
8.75%, (5-year CMT + 4.944%)(b)(d)(f) | | |
| | |
|
Banco Santander Chile, 3.18%, 10/26/31(b)(e) | | |
Celulosa Arauco y Constitucion SA | | |
| | |
| | |
| | |
| | |
| | |
| | |
| | |
Chile Electricity Lux MPC II SARL, 5.58%, 10/20/35(a) | | |
Chile Electricity Lux MPC SARL, 6.01%, 01/20/33(b) | | |
Cia. Cervecerias Unidas SA, 3.35%, 01/19/32(b) | | |
| | |
| | |
| | |
| | |
Empresa Nacional de Telecomunicaciones SA | | |
| | |
| | |
Enel Americas SA, 4.00%, 10/25/26 | | |
Enel Chile SA, 4.88%, 06/12/28 | | |
| | |
| | |
| | |
Falabella SA, 3.38%, 01/15/32(b) | | |
GNL Quintero SA, 4.63%, 07/31/29(b) | | |
Interchile SA, 4.50%, 06/30/56(b) | | |
| | |
| | |
| | |
| | |
| | |
| | |
| | |
| | |
| | |
Sable International Finance Ltd., 7.13%, 10/15/32(a) | | |
Sociedad Quimica y Minera de Chile SA | | |
| | |
| | |
| | |
Telefonica Moviles Chile SA, 3.54%, 11/18/31(b) | | |
| | |
|
Agricultural Bank of China Ltd./New York, 5.47%, 01/24/27, (1-day SOFR Index + 0.630%)(b)(f) | | |
Alibaba Group Holding Ltd. | | |
| | |
| | |
| | |
| | |
| | |
| | |
| | |
| | |
| | |
| | |
| | |
| | |
| | |
| | |
112024 iShares Annual Financial Statements and Additional Information
Schedule of Investments (continued)October 31, 2024
iShares® J.P. Morgan EM Corporate Bond ETF(Percentages shown are based on Net Assets)
| | |
|
| | |
| | |
Bank of China Ltd./Luxembourg, 1.40%, 04/28/26(b) | | |
Bank of China Ltd./New York, 4.63%, 06/26/26(b) | | |
Bank of China Ltd./Sydney, 5.47%, 06/14/27, (1-day SOFR Index + 0.500%)(b)(f) | | |
Bank of Communications Co. Ltd., 3.80%, (5-year CMT + 3.345%)(b)(d)(f) | | |
Bank of Communications Co. Ltd./Hong Kong | | |
| | |
5.73%, 08/01/27, (1-day SOFR Index + 0.550%)(b)(f) | | |
| | |
| | |
| | |
| | |
| | |
| | |
| | |
| | |
| | |
| | |
| | |
| | |
| | |
BOCOM International Blossom Ltd., 1.75%, 06/28/26(b) | | |
Bocom Leasing Management Hong Kong Co. Ltd., 5.54%, 06/26/27, (1-day SOFR Index + 0.680%)(b)(f) | | |
CCBL Cayman 1 Corp. Ltd., 1.80%, 07/22/26(b) | | |
CCCI Treasure Ltd., 3.43%, (5-year CMT + 4.998%)(b)(d)(f) | | |
CDBL Funding 2, 2.00%, 03/04/26(b) | | |
Central Plaza Development Ltd., 4.65%, 01/19/26(b) | | |
Chalco Hong Kong Investment Co. Ltd., 2.10%, 07/28/26(b) | | |
Charming Light Investments Ltd., 4.38%, 12/21/27(b) | | |
China Cinda 2020 I Management Ltd. | | |
| | |
| | |
| | |
| | |
| | |
China Cinda Finance 2017 I Ltd. | | |
| | |
| | |
China Construction Bank Corp. | | |
2.45%, 06/24/30, (5-year CMT + 2.150%)(b)(f) | | |
2.85%, 01/21/32, (5-year CMT + 1.400%)(b)(f) | | |
China Construction Bank Corp./Hong Kong, 1.46%, 04/22/26(b) | | |
China Construction Bank Corp/Hong Kong, 5.39%, 07/16/27, (1-day SOFR Index + 0.550%)(b)(f) | | |
China Development Bank Financial Leasing Co. Ltd., 2.88%, 09/28/30, (5-year CMT + 2.750%)(b)(f) | | |
China Everbright Bank Co. Ltd./Sydney, 5.56%, 09/20/26, (1-day SOFR Index + 0.630%)(b)(f) | | |
China Everbright Bank Co. Ltd/Hong Kong, 5.66%, 05/14/27, (1-day SOFR + 0.520%)(b)(f) | | |
| | |
|
China Great Wall International Holdings III Ltd., 3.88%, 08/31/27(b) | | |
China Modern Dairy Holdings Ltd., 2.13%, 07/14/26(b) | | |
China Overseas Finance Cayman VI Ltd., 6.45%, 06/11/34(b) | | |
China Overseas Finance Cayman VIII Ltd., 2.75%, 03/02/30(b) | | |
China Railway Xunjie Co. Ltd., 4.00%, 07/06/27(b) | | |
China Resources Land Ltd., 3.75%, (5-year CMT + 5.139%)(b)(d)(f) | | |
China State Construction Finance Cayman I Ltd., 3.40%, (5-year CMT + 5.581%)(b)(d)(f) | | |
China Taiping Insurance Holdings Co. Ltd., 6.40%, (5-year CMT + 2.072%)(b)(d)(f) | | |
CICC Hong Kong Finance 2016 MTN Ltd. | | |
| | |
| | |
5.78%, 01/18/27, (1-day SOFR Index + 0.950%)(b)(f) | | |
| | |
| | |
| | |
| | |
CMB International Leasing Management Ltd., 5.82%, 06/04/27, (1-day SOFR + 0.760%)(b)(f) | | |
CMHI Finance BVI Co. Ltd. | | |
| | |
| | |
CNOOC Finance 2011 Ltd., 5.75%, 01/26/41(b) | | |
| | |
| | |
| | |
CNOOC Finance 2015 USA LLC, 4.38%, 05/02/28 | | |
CNOOC Petroleum North America ULC, 6.40%, 05/15/37 | | |
CNPC HK Overseas Capital Ltd., 5.95%, 04/28/41(b) | | |
Coastal Emerald Ltd., 6.50%, (3-year CMT + 4.781%)(b)(d)(f) | | |
Contemporary Ruiding Development Ltd., 1.50%, 09/09/26(b) | | |
CSCEC Finance Cayman II Ltd., 3.50%, 07/05/27(b) | | |
CSCIF Hong Kong Ltd., 5.75%, 05/31/27, (1-day SOFR Index + 0.670%)(b)(f) | | |
ENN Clean Energy International Investment Ltd., 3.38%, 05/12/26(b) | | |
ENN Energy Holdings Ltd., 4.63%, 05/17/27(b) | | |
Far East Horizon Ltd., 6.63%, 04/16/27(b) | | |
Fortune Star BVI Ltd., 5.95%, 10/19/25(b) | | |
Franshion Brilliant Ltd., 4.25%, 07/23/29(b) | | |
GLP China Holdings Ltd., 2.95%, 03/29/26(b) | | |
Huarong Finance 2017 Co. Ltd. | | |
| | |
| | |
Huarong Finance 2019 Co. Ltd., 4.50%, 05/29/29(b) | | |
| | |
| | |
| | |
Industrial & Commercial Bank of China Ltd. | | |
3.20%, (5-year CMT + 2.368%)(b)(d)(f) | | |
| | |
Schedule of Investments12
Schedule of Investments (continued)October 31, 2024
iShares® J.P. Morgan EM Corporate Bond ETF(Percentages shown are based on Net Assets)
| | |
|
Industrial & Commercial Bank of China Ltd./Dubai DIFC, 5.76%, 01/19/26, (1-day SOFR Index + 0.930%)(b)(f) | | |
Industrial & Commercial Bank of China Ltd./Hong Kong, 1.63%, 10/28/26(b) | | |
Industrial & Commercial Bank of China Ltd./New York, 3.54%, 11/08/27 | | |
Industrial & Commercial Bank of China Ltd./Singapore, 5.43%, 10/25/26, (1-day SOFR Index + 0.600%)(b)(f) | | |
JD.com Inc., 3.38%, 01/14/30 | | |
| | |
| | |
| | |
Longfor Group Holdings Ltd. | | |
| | |
| | |
| | |
| | |
| | |
| | |
| | |
| | |
| | |
| | |
| | |
| | |
| | |
| | |
| | |
| | |
| | |
SF Holding Investment 2021 Ltd., 3.13%, 11/17/31(b) | | |
SF Holding Investment Ltd., 2.38%, 11/17/26(b) | | |
Shanghai Port Group BVI Development 2 Co. Ltd., 2.38%, 07/13/30(b) | | |
Sinopec Capital 2013 Ltd., 4.25%, 04/24/43(b) | | |
Soar Wise Ltd., 5.15%, 03/18/27(b) | | |
Sunac China Holdings Ltd. | | |
6.75%, 09/30/28, (5.75% cash and 6.75% PIK)(b)(g) | | |
7.00%, 09/30/29, (12.00% PIK)(b)(g) | | |
| | |
| | |
| | |
| | |
| | |
| | |
| | |
| | |
| | |
| | |
| | |
| | |
| | |
Tencent Music Entertainment Group, 2.00%, 09/03/30 | | |
Vanke Real Estate Hong Kong Co. Ltd., 3.98%, 11/09/27(b) | | |
Weibo Corp., 3.38%, 07/08/30 | | |
West China Cement Ltd., 4.95%, 07/08/26(b) | | |
Westwood Group Holdings Ltd., 2.80%, 01/20/26(b) | | |
| | |
|
Xiaomi Best Time International Ltd. | | |
| | |
| | |
Yanlord Land HK Co. Ltd., 5.13%, 05/20/26(b) | | |
Zhongsheng Group Holdings Ltd., 5.98%, 01/30/28(b) | | |
| | |
|
ABRA Global Finance, 14.00%, 10/22/29, (6.00% cash and 8.00% PIK)(a)(g) | | |
AI Candelaria Spain SA, 5.75%, 06/15/33(b) | | |
| | |
| | |
| | |
Banco Davivienda SA, 6.65%, (10-year CMT + 5.097%)(b)(d)(f) | | |
Banco de Bogota SA, 6.25%, 05/12/26(b) | | |
| | |
4.63%, 12/18/29, (5-year CMT + 2.944%)(f) | | |
8.63%, 12/24/34, (5-year CMT + 4.320%)(f) | | |
Canacol Energy Ltd., 5.75%, 11/24/28(b) | | |
Colombia Telecomunicaciones SA ESP, 4.95%, 07/17/30(b) | | |
| | |
| | |
| | |
| | |
| | |
| | |
| | |
| | |
| | |
| | |
EnfraGen Energia Sur SA/EnfraGen Spain SA/Prime Energia SpA, 5.38%, 12/30/30(b) | | |
Geopark Ltd., 5.50%, 01/17/27(b) | | |
Gran Tierra Energy Inc., 9.50%, 10/15/29(b) | | |
Grupo Aval Ltd., 4.38%, 02/04/30(b) | | |
Grupo de Inversiones Suramericana SA, 5.50%, 04/29/26(b) | | |
Promigas SA ESP/Gases del Pacifico SAC, 3.75%, 10/16/29(b) | | |
SierraCol Energy Andina LLC, 6.00%, 06/15/28(b) | | |
Transportadora de Gas Internacional SA ESP, 5.55%, 11/01/28(b) | | |
| | |
|
Allwyn Entertainment Financing U.K. PLC, 7.88%, 04/30/29(b) | | |
Dominican Republic — 0.1% |
Aeropuertos Dominicanos Siglo XXI SA, 7.00%, 06/30/34(b) | | |
|
Kosmos Energy Ltd., 8.75%, 10/01/31(a) | | |
Tullow Oil PLC, 10.25%, 05/15/26(b) | | |
| | |
|
Central American Bottling Corp./CBC Bottling Holdco SL/Beliv Holdco SL, 5.25%, 04/27/29(b) | | |
CT Trust, 5.13%, 02/03/32(b) | | |
132024 iShares Annual Financial Statements and Additional Information
Schedule of Investments (continued)October 31, 2024
iShares® J.P. Morgan EM Corporate Bond ETF(Percentages shown are based on Net Assets)
| | |
|
Investment Energy Resources Ltd., 6.25%, 04/26/29(b) | | |
Millicom International Cellular SA | | |
| | |
| | |
| | |
|
| | |
2.70%, (5-year CMT + 1.758%)(b)(d)(f) | | |
| | |
| | |
| | |
| | |
| | |
| | |
| | |
| | |
| | |
| | |
Bank of Communications Hong Kong Ltd. | | |
2.30%, 07/08/31, (5-year CMT + 1.400%)(b)(f) | | |
3.73%, (5-year CMT + 2.525%)(b)(d)(f) | | |
Bank of East Asia Ltd. (The) | | |
4.00%, 05/29/30, (5-year CMT + 3.750%)(b)(f) | | |
4.88%, 04/22/32, (5-year CMT + 2.300%)(b)(f) | | |
5.83%, (5-year CMT + 5.527%)(b)(d)(f) | | |
6.75%, 06/27/34, (5-year CMT + 2.550%)(b)(f) | | |
CAS Capital No. 1 Ltd., 4.00%, (5-year CMT + 3.642%)(b)(d)(f) | | |
Castle Peak Power Finance Co. Ltd., 3.25%, 07/25/27(b) | | |
Cathay Pacific MTN Financing HK Ltd., 4.88%, 08/17/26(b) | | |
China CITIC Bank International Ltd. | | |
4.80%, (5-year CMT + 2.104%)(b)(d)(f) | | |
6.00%, 12/05/33, (5-year CMT + 1.650%)(b)(f) | | |
CLP Power HK Finance Ltd., 3.55%, (5-year CMT + 2.041%)(b)(d)(f) | | |
| | |
| | |
8.05%, (5-year CMT + 4.865%)(b)(d)(f) | | |
| | |
HKT Capital No. 4 Ltd., 3.00%, 07/14/26(b) | | |
HKT Capital No. 5 Ltd., 3.25%, 09/30/29(b) | | |
HKT Capital No. 6 Ltd., 3.00%, 01/18/32(b) | | |
Hongkong Electric Finance Ltd. | | |
| | |
| | |
Hongkong Land Finance Cayman Islands Co. Ltd. (The) | | |
| | |
| | |
HPHT Finance 21 II Ltd., 1.50%, 09/17/26(b) | | |
Hysan MTN Ltd., 2.82%, 09/04/29(b) | | |
IFC Development Corporate Treasury Ltd., 3.63%, 04/17/29(b) | | |
JMH Co. Ltd., 2.50%, 04/09/31(b) | | |
Joy Treasure Assets Holdings Inc. | | |
| | |
| | |
Li & Fung Ltd., 5.25%(b)(d) | | |
| | |
|
Link Finance Cayman 2009 Ltd. (The) | | |
| | |
| | |
Melco Resorts Finance Ltd. | | |
| | |
| | |
| | |
| | |
| | |
MTR Corp. Ltd., 1.63%, 08/19/30(b) | | |
Nan Fung Treasury III Ltd., 5.00%(b)(d) | | |
Nanyang Commercial Bank Ltd. | | |
3.80%, 11/20/29, (5-year CMT + 2.180%)(b)(f) | | |
6.00%, 08/06/34, (5-year CMT + 2.100%)(b)(f) | | |
| | |
4.13%, (5-year CMT + 5.858%)(b)(d)(f) | | |
| | |
5.25%, (5-year CMT + 7.889%)(b)(d)(f) | | |
| | |
NWD MTN Ltd., 4.13%, 07/18/29(b) | | |
Panther Ventures Ltd., 3.50%(b)(d) | | |
PCPD Capital Ltd., 5.13%, 06/18/26(b) | | |
Phoenix Lead Ltd., 4.85%(b)(d) | | |
Prudential Funding Asia PLC | | |
2.95%, 11/03/33, (5-year CMT + 1.517%)(b)(f) | | |
| | |
| | |
Seaspan Corp., 5.50%, 08/01/29(b) | | |
Sun Hung Kai Properties Capital Market Ltd. | | |
| | |
| | |
Swire Pacific MTN Financing HK Ltd., 2.88%, 01/30/30(b) | | |
Swire Properties MTN Financing Ltd., 3.63%, 01/13/26(b) | | |
Wharf REIC Finance BVI Ltd., 3.50%, 01/17/28(b) | | |
Wheelock MTN BVI Ltd., 2.38%, 01/25/26(b) | | |
| | |
|
| | |
7.50%, 05/25/27, (1-year CMT + 3.711%)(b)(f) | | |
8.75%, 05/15/33, (5-year CMT + 5.060%)(b)(f) | | |
| | |
|
ABJA Investment Co. Pte Ltd., 5.45%, 01/24/28(b) | | |
Adani Electricity Mumbai Ltd., 3.95%, 02/12/30(b) | | |
Adani Ports & Special Economic Zone Ltd. | | |
| | |
| | |
| | |
| | |
Adani Transmission Step-One Ltd., 4.00%, 08/03/26(b) | | |
Axis Bank Ltd./Gandhinagar, 4.10%, (5-year CMT + 3.315%)(b)(d)(f) | | |
Bharti Airtel Ltd., 3.25%, 06/03/31(b) | | |
CA Magnum Holdings, 5.38%, 10/31/26(b) | | |
Continuum Green Energy India Pvt / Co-Issuers, 7.50%, 06/26/33(b) | | |
Schedule of Investments14
Schedule of Investments (continued)October 31, 2024
iShares® J.P. Morgan EM Corporate Bond ETF(Percentages shown are based on Net Assets)
| | |
|
Delhi International Airport Ltd. | | |
| | |
| | |
Diamond II Ltd., 7.95%, 07/28/26(b) | | |
Greenko Dutch BV, 3.85%, 03/29/26(b) | | |
Greenko Power II Ltd., 4.30%, 12/13/28(b) | | |
Greenko Solar Mauritius Ltd., 5.95%, 07/29/26(b) | | |
HDFC Bank Ltd., 3.70%, (5-year CMT + 2.925%)(b)(d)(f) | | |
HDFC Bank Ltd./Gandhinagar, 5.69%, 03/02/26(b) | | |
Hindustan Petroleum Corp. Ltd., 4.00%, 07/12/27(b) | | |
| | |
| | |
| | |
Indian Railway Finance Corp. Ltd. | | |
| | |
| | |
| | |
| | |
IRB Infrastructure Developers Ltd., 7.11%, 03/11/32(b) | | |
JSW Hydro Energy Ltd., 4.13%, 05/18/31(b) | | |
| | |
| | |
| | |
Muthoot Finance Ltd., 7.13%, 02/14/28(b)(e) | | |
| | |
3.98%, (5-year CMT + 3.390%)(b)(d)(f) | | |
5.65%, (5-year CMT + 4.274%)(b)(d)(f) | | |
NTPC Ltd., 4.25%, 02/26/26(b) | | |
Oil India International Pte Ltd., 4.00%, 04/21/27(b) | | |
Oil India Ltd., 5.13%, 02/04/29(b) | | |
ONGC Videsh Vankorneft Pte Ltd., 3.75%, 07/27/26(b) | | |
Periama Holdings LLC/DE, 5.95%, 04/19/26(b) | | |
| | |
| | |
| | |
| | |
| | |
| | |
| | |
| | |
| | |
| | |
| | |
| | |
| | |
| | |
| | |
| | |
ReNew Wind Energy AP2/ReNew Power Pvt Ltd. other 9 Subsidiaries, 4.50%, 07/14/28(b) | | |
Shriram Finance Ltd., 6.63%, 04/22/27(b) | | |
State Bank of India, 4.88%, 05/05/28(b) | | |
State Bank of India/London | | |
| | |
| | |
UPL Corp. Ltd., 4.63%, 06/16/30(b) | | |
Vedanta Resources Finance II PLC | | |
| | |
| | |
| | |
| | |
|
Vedanta Resources Ltd., 13.88%, 12/09/28(b) | | |
Wipro IT Services LLC, 1.50%, 06/23/26(b) | | |
| | |
|
Bank Negara Indonesia Persero Tbk PT | | |
| | |
4.30%, (5-year CMT + 3.466%)(b)(d)(f) | | |
| | |
Cikarang Listrindo Tbk PT, 4.95%, 09/14/26(b) | | |
| | |
| | |
| | |
| | |
Indofood CBP Sukses Makmur Tbk PT | | |
| | |
| | |
| | |
LLPL Capital Pte Ltd., 6.88%, 02/04/39(b) | | |
Medco Maple Tree Pte Ltd., 8.96%, 04/27/29(b) | | |
| | |
| | |
| | |
Star Energy Geothermal Darajat II/Star Energy Geothermal Salak, 4.85%, 10/14/38(b) | | |
| | |
|
Bank Hapoalim BM, 3.26%, 01/21/32, (5-year CMT + 2.155%)(a)(b)(f) | | |
| | |
3.28%, 01/29/31, (5-year CMT + 1.631%)(a)(f) | | |
| | |
7.13%, 07/18/33, (5-year CMT + 3.466%)(a)(b)(f) | | |
Energian Israel Finance Ltd. | | |
| | |
| | |
| | |
| | |
ICL Group Ltd., 6.38%, 05/31/38(a)(b) | | |
Israel Discount Bank Ltd., 5.38%, 01/26/28(a) | | |
Israel Electric Corp. Ltd. | | |
| | |
| | |
| | |
| | |
| | |
Mizrahi Tefahot Bank Ltd., 3.08%, 04/07/31, (5-year CMT + 2.250%)(a)(b)(f) | | |
Teva Pharmaceutical Finance Co. LLC, 6.15%, 02/01/36(e) | | |
Teva Pharmaceutical Finance Netherlands III BV | | |
| | |
| | |
| | |
| | |
| | |
| | |
| | |
| | |
|
QIB Sukuk Ltd., 4.49%, 09/17/29(b) | | |
152024 iShares Annual Financial Statements and Additional Information
Schedule of Investments (continued)October 31, 2024
iShares® J.P. Morgan EM Corporate Bond ETF(Percentages shown are based on Net Assets)
| | |
|
Digicel Intermediate Holdings Ltd./Digicel International Finance Ltd./Difl U.S., 9.00%, 05/25/27, (2.25% PIK)(g) | | |
|
KazMunayGas National Co. JSC | | |
| | |
| | |
| | |
| | |
Tengizchevroil Finance Co. International Ltd. | | |
| | |
| | |
| | |
|
Boubyan Sukuk Ltd., 3.39%, 03/29/27(b) | | |
Burgan Bank SAK, 2.75%, 12/15/31, (5-year CMT + 2.229%)(b)(f) | | |
Equate Sukuk Spc Ltd., 5.00%, 09/05/31(b) | | |
KFH Sukuk Co., 5.01%, 01/17/29(b) | | |
Kuwait Projects Co. SPC Ltd. | | |
| | |
| | |
| | |
| | |
| | |
MEGlobal Canada ULC, 5.88%, 05/18/30(b) | | |
| | |
1.63%, 09/15/27, (1-day SOFR + 1.050%)(b)(f) | | |
5.50%, 06/06/30, (1-day SOFR + 1.160%)(b)(f) | | |
NBK Tier 1 Financing 2 Ltd., 4.50%, (6-year CMT + 2.832%)(b)(d)(f) | | |
NBK Tier 1 Ltd., 3.63%, (6-year CMT + 2.875%)(b)(d)(f) | | |
Warba Sukuk Ltd., 5.35%, 07/10/29(b) | | |
| | |
|
| | |
| | |
| | |
NewCo Holding USD 20 SARL, 9.38%, 11/07/29(a) | | |
| | |
|
Champion Path Holdings Ltd. | | |
| | |
| | |
| | |
| | |
| | |
| | |
| | |
| | |
| | |
| | |
| | |
| | |
| | |
| | |
| | |
| | |
| | |
|
| | |
| | |
| | |
| | |
| | |
| | |
|
| | |
| | |
| | |
Axiata SPV5 Labuan Ltd., 3.06%, 08/19/50(b) | | |
CIMB Bank Bhd, 2.13%, 07/20/27(b) | | |
Genm Capital Labuan Ltd., 3.88%, 04/19/31(b) | | |
Gohl Capital Ltd., 4.25%, 01/24/27(b) | | |
Misc Capital Two Labuan Ltd., 3.75%, 04/06/27(b) | | |
RHB Bank Bhd, 1.66%, 06/29/26(b) | | |
TNB Global Ventures Capital Bhd | | |
| | |
| | |
| | |
|
Alfa SAB de CV, 6.88%, 03/25/44(b) | | |
| | |
| | |
| | |
Alsea SAB de CV, 7.75%, 12/14/26(b) | | |
| | |
| | |
| | |
| | |
| | |
| | |
| | |
| | |
Banco Inbursa SA Institucion De Banca Multiple Grupo Financiero Inbursa, 4.38%, 04/11/27(b) | | |
Banco Mercantil del Norte SA/Grand Cayman | | |
5.88%, (5-year CMT + 4.643%)(b)(d)(f) | | |
6.63%, (10-year CMT + 5.034%)(b)(d)(f) | | |
7.50%, (10-year CMT + 5.470%)(b)(d)(f) | | |
7.63%, (10-year CMT + 5.353%)(b)(d)(f) | | |
8.38%, (10-year CMT + 7.760%)(b)(d)(f) | | |
Banco Santander Mexico SA Institucion de Banca Multiple Grupo Financiero Santand, 7.53%, 10/01/28, (5-year CMT + 2.995%)(b)(f) | | |
| | |
5.13%, 01/18/33, (5-year CMT + 2.650%)(b)(f) | | |
5.88%, 09/13/34, (5-year CMT + 4.308%)(b)(f) | | |
8.13%, 01/08/39, (5-year CMT + 4.214%)(b)(f) | | |
8.45%, 06/29/38, (5-year CMT + 4.661%)(b)(f) | | |
Becle SAB de CV, 2.50%, 10/14/31(b) | | |
| | |
| | |
| | |
Borr IHC Ltd./Borr Finance LLC | | |
| | |
| | |
| | |
| | |
| | |
Schedule of Investments16
Schedule of Investments (continued)October 31, 2024
iShares® J.P. Morgan EM Corporate Bond ETF(Percentages shown are based on Net Assets)
| | |
|
Buffalo Energy Mexico Holdings/Buffalo Energy Infrastructure/Buffalo Energy, 7.88%, 02/15/39(b) | | |
| | |
| | |
| | |
| | |
9.13%, (5-year CMT + 5.157%)(b)(d)(f) | | |
Cemex SAB De CV, 5.13%, (5-year CMT + 4.534%)(b)(d)(f) | | |
Cibanco SA Ibm/PLA Administradora Industrial S de RL de CV, 4.96%, 07/18/29(b) | | |
Coca-Cola Femsa SAB de CV | | |
| | |
| | |
Cometa Energia SA de CV, 6.38%, 04/24/35(b) | | |
FIEMEX Energia - Banco Actinver SA Institucion de Banca Multiple, 7.25%, 01/31/41(a) | | |
Fomento Economico Mexicano SAB de CV, 3.50%, 01/16/50 | | |
Fresnillo PLC, 4.25%, 10/02/50(b) | | |
Grupo Aeromexico SAB de CV | | |
| | |
| | |
| | |
| | |
| | |
| | |
| | |
| | |
| | |
| | |
| | |
Industrias Penoles SAB de CV | | |
| | |
| | |
Infraestructura Energetica Nova SAPI de CV | | |
| | |
| | |
Kimberly-Clark de Mexico SAB de CV, 2.43%, 07/01/31(b) | | |
Minera Mexico SA de CV, 4.50%, 01/26/50(b) | | |
Nemak SAB de CV, 3.63%, 06/28/31(b) | | |
Orbia Advance Corp. SAB de CV | | |
| | |
| | |
| | |
| | |
| | |
Sigma Finance Netherlands BV, 4.88%, 03/27/28(b) | | |
| | |
| | |
| | |
| | |
| | |
Tierra Mojada Luxembourg II SARL, 5.75%, 12/01/40(b) | | |
Total Play Telecomunicaciones SA de CV, 6.38%, 09/20/28(b) | | |
| | |
| | |
| | |
| | |
|
| | |
| | |
| | |
| | |
|
Aragvi Finance International DAC, 8.45%, 04/29/26(b) | | |
|
| | |
| | |
| | |
| | |
| | |
| | |
| | |
|
VEON Holdings BV, 3.38%, 11/25/27(b) | | |
|
| | |
| | |
9.13%, (5-year CMT + 8.070%)(b)(d)(f) | | |
| | |
| | |
| | |
IHS Netherlands Holdco BV, 8.00%, 09/18/27(b) | | |
SEPLAT Energy PLC, 7.75%, 04/01/26(b) | | |
| | |
|
Bank Muscat SAOG, 4.75%, 03/17/26(b) | | |
Otel Sukuk Ltd., 5.38%, 01/24/31(b) | | |
Oztel Holdings SPC Ltd., 6.63%, 04/24/28(b) | | |
| | |
|
AES Panama Generation Holdings SRL, 4.38%, 05/31/30(b) | | |
Banco General SA, 4.13%, 08/07/27(b) | | |
C&W Senior Finance Ltd., 6.88%, 09/15/27(b)(e) | | |
Telecomunicaciones Digitales SA, 4.50%, 01/30/30(b) | | |
| | |
|
Bioceanico Sovereign Certificate Ltd., 0.00%, 06/05/34(b)(e)(h) | | |
|
Banco de Credito del Peru SA | | |
3.13%, 07/01/30, (5-year CMT + 3.000%)(b)(e)(f) | | |
3.25%, 09/30/31, (5-year CMT + 2.450%)(b)(f) | | |
5.80%, 03/10/35, (5-year CMT + 2.244%)(a)(f) | | |
| | |
Cia. de Minas Buenaventura SAA, 5.50%, 07/23/26(b) | | |
Consorcio Transmantaro SA | | |
| | |
| | |
Hunt Oil Co. of Peru LLC Sucursal Del Peru, 8.55%, 09/18/33(b) | | |
InRetail Consumer, 3.25%, 03/22/28(b) | | |
Kallpa Generacion SA, 4.13%, 08/16/27(b) | | |
Minsur SA, 4.50%, 10/28/31(b) | | |
Niagara Energy SAC, 5.75%, 10/03/34(a) | | |
Peru LNG SRL, 5.38%, 03/22/30(b) | | |
172024 iShares Annual Financial Statements and Additional Information
Schedule of Investments (continued)October 31, 2024
iShares® J.P. Morgan EM Corporate Bond ETF(Percentages shown are based on Net Assets)
| | |
|
Pluspetrol Camisea SA/Pluspetrol Lote 56 SA, 6.24%, 07/03/36(b) | | |
Transportadora de Gas del Peru SA, 4.25%, 04/30/28(b) | | |
| | |
|
BDO Unibank Inc., 2.13%, 01/13/26(b) | | |
Globe Telecom Inc., 4.20%, (5-year CMT + 5.527%)(b)(d)(f) | | |
JGSH Philippines Ltd., 4.13%, 07/09/30(b) | | |
Manila Water Co. Inc., 4.38%, 07/30/30(b) | | |
Metropolitan Bank & Trust Co. | | |
| | |
| | |
| | |
Petron Corp., 5.95%, (5-year CMT + 7.574%)(b)(d)(f) | | |
San Miguel Corp., 5.50%, (5-year CMT + 10.237%)(b)(d)(f) | | |
San Miguel Global Power Holdings Corp., 8.75%, (5-year CMT + 7.732%)(b)(d)(f) | | |
SMC Global Power Holdings Corp. | | |
5.45%, (5-year CMT + 7.155%)(b)(d)(f) | | |
5.70%, (5-year CMT + 6.554%)(b)(d)(f) | | |
SMIC SG Holdings Pte Ltd., 5.38%, 07/24/29(b) | | |
| | |
|
Canpack SA/Canpack U.S. LLC, 3.88%, 11/15/29(b) | | |
|
ABQ Finance Ltd., 2.00%, 07/06/26(b) | | |
| | |
| | |
| | |
Commercial Bank PSQC (The), 4.50%, (5-year CMT + 3.874%)(b)(d)(f) | | |
Doha Finance Ltd., 2.38%, 03/31/26(b) | | |
Nakilat Inc., 6.07%, 12/31/33(b) | | |
Ooredoo International Finance Ltd. | | |
| | |
| | |
| | |
| | |
QIIB Senior Oryx Ltd., 5.25%, 01/24/29(b) | | |
| | |
| | |
| | |
| | |
| | |
|
Al Rajhi Bank, 6.38%, (5-year CMT + 1.888%)(b)(d)(f) | | |
Al Rajhi Sukuk Ltd., 4.75%, 04/05/28(b) | | |
Almarai Co. JSC, 5.23%, 07/25/33(b) | | |
ANB Sukuk Ltd., 3.33%, 10/28/30, (5-year CMT + 2.974%)(b)(f) | | |
Arabian Centres Sukuk II Ltd., 5.63%, 10/07/26(b) | | |
Banque Saudi Fransi, 4.75%, 05/31/28(b) | | |
BSF Finance, 5.50%, 11/23/27(b) | | |
Dar Al-Arkan Sukuk Co. Ltd., 8.00%, 02/25/29(b) | | |
| | |
| | |
| | |
|
| | |
Greensaif Pipelines Bidco Sarl, 5.85%, 02/23/36(b) | | |
Greensaif Pipelines Bidco SARL | | |
| | |
| | |
| | |
Riyad Sukuk Ltd., 3.17%, 02/25/30, (5-year CMT + 1.791%)(b)(f) | | |
Riyad Tier 1 Sukuk Ltd., 4.00%, (5-year CMT + 2.170%)(b)(d)(f) | | |
| | |
| | |
| | |
| | |
| | |
| | |
| | |
SABIC Capital II BV, 4.50%, 10/10/28(b) | | |
| | |
| | |
| | |
| | |
| | |
| | |
| | |
| | |
| | |
| | |
Saudi Electricity Global Sukuk Co. 2, 5.06%, 04/08/43(b) | | |
Saudi Electricity Global Sukuk Co. 3, 5.50%, 04/08/44(b) | | |
Saudi Electricity Global Sukuk Co. 4, 4.72%, 09/27/28(b) | | |
Saudi Electricity Global Sukuk Co. 5, 2.41%, 09/17/30(b) | | |
Saudi Electricity Sukuk Programme Co. | | |
| | |
| | |
| | |
| | |
Saudi Telecom Co., 3.89%, 05/13/29(b) | | |
| | |
| | |
6.04%, 07/11/29, (1-day SOFR + 1.200%)(b)(f) | | |
SNB Sukuk Ltd., 2.34%, 01/19/27(b) | | |
TMS Issuer SARL, 5.78%, 08/23/32(b) | | |
| | |
|
Telecommunications Co. Telekom Srbija AD Belgrade, 7.00%, 10/28/29(a) | | |
|
| | |
| | |
1.82%, 03/10/31, (5-year CMT + 1.100%)(b)(f) | | |
3.30%, (5-year CMT + 1.915%)(b)(d)(f) | | |
GLP Pte Ltd., 4.50%, (5-year CMT + 3.735%)(b)(d)(f) | | |
Oversea-Chinese Banking Corp. Ltd. | | |
1.83%, 09/10/30, (5-year CMT + 1.580%)(b)(e)(f) | | |
4.60%, 06/15/32, (5-year CMT + 1.575%)(b)(f) | | |
Schedule of Investments18
Schedule of Investments (continued)October 31, 2024
iShares® J.P. Morgan EM Corporate Bond ETF(Percentages shown are based on Net Assets)
| | |
|
5.52%, 05/21/34, (5-year CMT + 1.030%)(b)(f) | | |
Puma International Financing SA, 7.75%, 04/25/29(b) | | |
Sats Treasury Pte Ltd., 4.83%, 01/23/29(b) | | |
| | |
| | |
| | |
| | |
Singapore Telecommunications Ltd., 7.38%, 12/01/31(b) | | |
SingTel Group Treasury Pte Ltd. | | |
| | |
| | |
| | |
| | |
Ste Transcore Holdings Inc. | | |
| | |
| | |
United Overseas Bank Ltd. | | |
| | |
1.75%, 03/16/31, (5-year CMT + 1.520%)(b)(f) | | |
2.00%, 10/14/31, (5-year CMT + 1.230%)(b)(e)(f) | | |
3.86%, 10/07/32, (5-year CMT + 1.450%)(b)(f) | | |
Yinson Production Financial Services Pte Ltd., 9.63%, 05/03/29(a) | | |
| | |
|
Nanshan Life Pte Ltd., 5.45%, 09/11/34(b) | | |
|
Absa Group Ltd., 6.38%, (5-year CMT + 5.411%)(b)(d)(f) | | |
Anglo American Capital PLC | | |
| | |
| | |
| | |
| | |
| | |
| | |
| | |
| | |
| | |
| | |
Bidvest Group U.K. PLC, 3.63%, 09/23/26(b) | | |
Gold Fields Orogen Holdings BVI Ltd., 6.13%, 05/15/29(b) | | |
Liquid Telecommunications Financing PLC, 5.50%, 09/04/26(b) | | |
MTN Mauritius Investments Ltd., 6.50%, 10/13/26(b) | | |
| | |
| | |
| | |
| | |
| | |
| | |
| | |
| | |
| | |
|
Hanwha Life Insurance Co. Ltd., 3.38%, 02/04/32, (5-year CMT + 1.850%)(b)(f) | | |
| | |
|
Hyundai Capital Services Inc. | | |
| | |
| | |
| | |
Hyundai Card Co. Ltd., 5.75%, 04/24/29(b) | | |
| | |
| | |
| | |
| | |
| | |
| | |
| | |
| | |
| | |
| | |
| | |
Kyobo Life Insurance Co. Ltd., 5.90%, 06/15/52, (5-year CMT + 2.887%)(b)(f) | | |
| | |
| | |
| | |
| | |
LG Electronics Inc., 5.63%, 04/24/27(b) | | |
| | |
| | |
| | |
| | |
| | |
NAVER Corp., 1.50%, 03/29/26(b) | | |
NongHyup Bank, 4.88%, 07/03/28(b) | | |
| | |
| | |
| | |
| | |
| | |
| | |
| | |
| | |
| | |
5.91%, 10/26/28, (1-day SOFR + 1.080%)(b)(f) | | |
Shinhan Financial Group Co. Ltd. | | |
| | |
2.88%, (5-year CMT + 2.064%)(b)(d)(f) | | |
3.34%, 02/05/30, (5-year CMT + 1.500%)(b)(e)(f) | | |
| | |
| | |
| | |
| | |
| | |
| | |
| | |
| | |
| | |
| | |
| | |
SK On Co. Ltd., 5.38%, 05/11/26(b) | | |
| | |
| | |
| | |
| | |
192024 iShares Annual Financial Statements and Additional Information
Schedule of Investments (continued)October 31, 2024
iShares® J.P. Morgan EM Corporate Bond ETF(Percentages shown are based on Net Assets)
| | |
|
6.38%, (5-year CMT + 2.277%)(b)(d)(f) | | |
| | |
|
Africa Finance Corp., 2.88%, 04/28/28(b) | | |
African Export-Import Bank (The), 2.63%, 05/17/26(b) | | |
Eastern & Southern African Trade & Development Bank (The), 4.13%, 06/30/28(b) | | |
Odebrecht Holdco Finance Ltd., 0.00%, 09/10/58(b)(h) | | |
QIB Sukuk Ltd., 5.58%, 11/22/28(b) | | |
| | |
|
Consolidated Energy Finance SA | | |
| | |
| | |
Oriflame Investment Holding PLC, 5.13%, 05/04/26(b) | | |
| | |
|
Cathaylife Singapore Pte Ltd., 5.95%, 07/05/34(b) | | |
Foxconn Far East Ltd., 2.50%, 10/28/30(b) | | |
| | |
| | |
| | |
| | |
| | |
| | |
| | |
| | |
| | |
| | |
| | |
| | |
| | |
| | |
| | |
| | |
| | |
|
HTA Group Ltd/Mauritius, 7.50%, 06/04/29(b) | | |
|
Bangkok Bank PCL/Hong Kong | | |
3.47%, 09/23/36, (5-year CMT + 2.150%)(b)(f) | | |
3.73%, 09/25/34, (5-year CMT + 1.900%)(b)(f) | | |
| | |
| | |
5.00%, (5-year CMT + 4.729%)(b)(d)(f) | | |
| | |
| | |
| | |
GC Treasury Center Co. Ltd., 2.98%, 03/18/31(b)(e) | | |
Kasikornbank PCL, 5.46%, 03/07/28(b) | | |
Kasikornbank PCL/Hong Kong | | |
3.34%, 10/02/31, (5-year CMT + 1.700%)(b)(f) | | |
5.28%, (5-year CMT + 4.940%)(b)(d)(f) | | |
Krung Thai Bank PCL/Cayman Islands, 4.40%, (5-year CMT + 3.530%)(b)(d)(f) | | |
PTT Treasury Center Co. Ltd., 3.70%, 07/16/70(b)(e) | | |
PTTEP Treasury Center Co. Ltd. | | |
| | |
| | |
| | |
|
Siam Commercial Bank PCL/Cayman Islands, 4.40%, 02/11/29(b) | | |
Thaioil Treasury Center Co. Ltd. | | |
| | |
| | |
| | |
|
| | |
| | |
6.80%, 06/22/31, (5-year CMT + 6.015%)(b)(f) | | |
| | |
9.37%, (5-year CMT + 5.270%)(b)(d)(f) | | |
Anadolu Efes Biracilik Ve Malt Sanayii A/S, 3.38%, 06/29/28(b) | | |
Arcelik A/S, 8.50%, 09/25/28(b) | | |
Aydem Yenilenebilir Enerji A/S, 7.75%, 02/02/27(b) | | |
Coca-Cola Icecek A/S, 4.50%, 01/20/29(b) | | |
Eregli Demir ve Celik Fabrikalari TAS, 8.38%, 07/23/29(b) | | |
Ford Otomotiv Sanayi AS, 7.13%, 04/25/29(b) | | |
Limak Cimento Sanayi ve Ticaret AS, 9.75%, 07/25/29(b) | | |
Mersin Uluslararasi Liman Isletmeciligi AS, 8.25%, 11/15/28(b) | | |
Pegasus Hava Tasimaciligi AS, 8.00%, 09/11/31(a) | | |
QNB Bank AS, 7.25%, 05/21/29(b) | | |
| | |
| | |
| | |
Turk Telekomunikasyon AS, 7.38%, 05/20/29(b) | | |
Turkcell Iletisim Hizmetleri AS, 5.80%, 04/11/28(b) | | |
Turkiye Garanti Bankasi AS | | |
7.18%, 05/24/27, (5-year USD ICE Swap + 4.220%)(b)(f) | | |
8.38%, 02/28/34, (5-year CMT + 4.090%)(b)(f) | | |
| | |
| | |
7.75%, 01/22/30, (5-year CMT + 6.119%)(b)(f) | | |
9.19%, 06/29/28, (5-year USD Swap + 5.117%)(b)(f) | | |
Turkiye Vakiflar Bankasi TAO | | |
| | |
8.99%, 10/05/34, (5-year CMT + 4.669%)(b)(f) | | |
| | |
10.12%, (5-year CMT + 5.493%)(b)(d)(f) | | |
Ulker Biskuvi Sanayi AS, 7.88%, 07/08/31(b) | | |
Vestel Elektronik Sanayi ve Ticaret AS, 9.75%, 05/15/29(b) | | |
WE Soda Investments Holding PLC | | |
| | |
| | |
Yapi ve Kredi Bankasi A/S | | |
| | |
7.88%, 01/22/31, (5-year CMT + 7.415%)(b)(f) | | |
| | |
9.25%, 01/17/34, (5-year CMT + 5.278%)(b)(f) | | |
9.74%, (5-year CMT + 5.499%)(b)(d)(f) | | |
Zorlu Enerji Elektrik Uretim AS, 11.00%, 04/23/30(a)(e) | | |
| | |
|
Metinvest BV, 7.75%, 10/17/29(b) | | |
Schedule of Investments20
Schedule of Investments (continued)October 31, 2024
iShares® J.P. Morgan EM Corporate Bond ETF(Percentages shown are based on Net Assets)
| | |
|
MHP Lux SA, 6.95%, 04/03/26(b) | | |
| | |
United Arab Emirates — 5.1% |
Abu Dhabi Commercial Bank PJSC | | |
| | |
| | |
| | |
8.00%, (5-year CMT + 3.524%)(b)(d)(f) | | |
Abu Dhabi National Energy Co. PJSC | | |
| | |
| | |
| | |
| | |
| | |
| | |
| | |
| | |
| | |
| | |
Abu Dhabi Ports Co. PJSC, 2.50%, 05/06/31(b) | | |
Adib Capital Invest 3 Ltd., 7.25%, (5-year CMT + 3.059%)(b)(d)(f) | | |
Adib Sukuk Co. II Ltd., 5.70%, 11/15/28(b) | | |
Aldar Investment Properties Sukuk Ltd. | | |
| | |
| | |
Aldar Sukuk No. 2 Ltd., 3.88%, 10/22/29(b) | | |
Arada Sukuk Ltd., 8.13%, 06/08/27(b) | | |
Binghatti Sukuk SPC Ltd., 9.63%, 02/28/27(b) | | |
BOS Funding Ltd., 7.00%, 03/14/28(b) | | |
Commercial Bank of Dubai PSC | | |
| | |
6.00%, (6-year CMT + 5.597%)(b)(d)(f) | | |
| | |
| | |
| | |
| | |
| | |
| | |
DIB Tier 1 Sukuk 3 Ltd., 6.25%, (6-year CMT + 3.664%)(b)(d)(f) | | |
DIB Tier 1 Sukuk 4 Ltd., 4.63%, (6-year CMT + 4.077%)(b)(d)(f) | | |
EI Sukuk Co. Ltd., 5.43%, 05/28/29(b) | | |
| | |
| | |
| | |
| | |
| | |
| | |
4.25%, (6-year CMT + 3.155%)(b)(d)(f) | | |
| | |
| | |
6.13%, (6-year CMT + 3.656%)(b)(d)(f) | | |
6.13%, (6-year CMT + 5.702%)(b)(d)(f) | | |
Esic Sukuk Ltd., 5.83%, 02/14/29(b) | | |
| | |
| | |
| | |
| | |
| | |
| | |
United Arab Emirates (continued) |
First Abu Dhabi Bank PJSC | | |
| | |
4.50%, (5-year CMT + 4.138%)(b)(d)(f) | | |
| | |
| | |
| | |
5.80%, 01/16/35, (5-year CMT + 1.550%)(b)(f) | | |
6.03%, 01/29/29, (1-day SOFR + 1.200%)(b)(f) | | |
6.32%, 04/04/34, (5-year CMT + 1.700%)(b)(f) | | |
Galaxy Pipeline Assets Bidco Ltd. | | |
| | |
| | |
| | |
| | |
| | |
MAF Global Securities Ltd., 7.88%, (5-year CMT + 4.893%)(b)(d)(f) | | |
| | |
| | |
| | |
| | |
Masdar Abu Dhabi Future Energy Co. | | |
| | |
| | |
| | |
| | |
7.13%, (5-year CMT + 2.705%)(b)(d)(f) | | |
7.88%, 02/24/33, (5-year CMT + 3.997%)(b)(f) | | |
National Bank of Ras Al-Khaimah PSC, 5.38%, 07/25/29(b) | | |
National Central Cooling Co. PJSC, 2.50%, 10/21/27(b) | | |
Ruwais Power Co. PJSC, 6.00%, 08/31/36(b) | | |
SF Holding Investment Ltd., 2.88%, 02/20/30(b) | | |
Shelf Drilling Holdings Ltd., 9.63%, 04/15/29(b)(e) | | |
SIB Sukuk Co. III Ltd., 5.25%, 07/03/29(b) | | |
Sweihan PV Power Co. PJSC, 3.63%, 01/31/49(b) | | |
| | |
|
CK Hutchison International 16 Ltd., 2.75%, 10/03/26(b) | | |
CK Hutchison International 17 II Ltd., 3.25%, 09/29/27(b) | | |
CK Hutchison International 17 Ltd., 3.50%, 04/05/27(b) | | |
CK Hutchison International 19 II Ltd. | | |
| | |
| | |
CK Hutchison International 20 Ltd. | | |
| | |
| | |
CK Hutchison International 21 Ltd. | | |
| | |
| | |
CK Hutchison International 23 Ltd. | | |
| | |
| | |
CK Hutchison International 24 Ltd. | | |
| | |
| | |
212024 iShares Annual Financial Statements and Additional Information
Schedule of Investments (continued)October 31, 2024
iShares® J.P. Morgan EM Corporate Bond ETF(Percentages shown are based on Net Assets)
| | |
United Kingdom (continued) |
Hutchison Whampoa International Ltd., 7.45%, 11/24/33(b) | | |
| | |
2.61%, 01/12/28, (5-year CMT + 1.180%)(b)(f) | | |
2.68%, 06/29/32, (1-year CMT + 1.200%)(b)(f) | | |
3.27%, 02/18/36, (5-year CMT + 2.300%)(b)(f) | | |
3.60%, 01/12/33, (1-year CMT + 1.900%)(b)(f) | | |
| | |
4.30%, (5-year CMT + 3.135%)(b)(d)(f) | | |
4.31%, 05/21/30, (3-mo. LIBOR US + 1.910%)(b)(f) | | |
4.64%, 04/01/31, (1-year CMT + 3.850%)(b)(f) | | |
4.75%, (5-year CMT + 3.805%)(b)(d)(f) | | |
| | |
5.69%, 05/14/28, (1-year CMT + 1.050%)(b)(f) | | |
5.91%, 05/14/35, (1-year CMT + 1.450%)(b)(f) | | |
6.00%, (5-year CMT + 5.661%)(b)(d)(f) | | |
6.10%, 01/11/35, (1-year CMT + 2.100%)(b)(f) | | |
6.17%, 01/09/27, (1-year CMT + 2.050%)(b)(f) | | |
6.19%, 07/06/27, (1-year CMT + 1.850%)(b)(f) | | |
6.30%, 01/09/29, (1-year CMT + 2.450%)(b)(f) | | |
6.30%, 07/06/34, (1-year CMT + 2.580%)(b)(f) | | |
7.02%, 02/08/30, (1-year CMT + 2.200%)(b)(f) | | |
7.75%, (5-year CMT + 4.976%)(b)(d)(f) | | |
7.77%, 11/16/28, (1-year CMT + 3.450%)(b)(f) | | |
7.88%, (5-year CMT + 3.574%)(b)(d)(f) | | |
| | |
|
AES Andes SA, 6.30%, 03/15/29(b) | | |
| | |
| | |
| | |
China Cinda Finance 2017 I Ltd., 4.40%, 03/09/27(b) | | |
China Overseas Finance Cayman III Ltd., 6.38%, 10/29/43(b) | | |
CNOOC Finance 2014 ULC, 4.88%, 04/30/44 | | |
GCC SAB de CV, 3.61%, 04/20/32(b) | | |
JBS USA Holding Lux SARL/JBS USA Food Co./JBS Lux Co. SARL | | |
| | |
| | |
| | |
| | |
| | |
| | |
| | |
| | |
| | |
JBS USA LUX SA/JBS USA Food Co./JBS Luxembourg SARL | | |
| | |
| | |
| | |
| | |
| | |
| | |
| | |
Playtika Holding Corp., 4.25%, 03/15/29(b) | | |
Sagicor Financial Co. Ltd., 5.30%, 05/13/28(b) | | |
| | |
| | |
|
Mong Duong Finance Holdings BV, 5.13%, 05/07/29(b) | | |
|
First Quantum Minerals Ltd. | | |
| | |
| | |
| | |
| | |
Total Corporate Bonds & Notes — 96.6%
(Cost: $441,522,078) | |
Foreign Government Obligations(i) |
|
Africa Finance Corp., 5.55%, 10/08/29(a) | | |
|
| | |
| | |
| | |
Korea Electric Power Corp, 4.88%, 01/31/27(b) | | |
Korea Electric Power Corp. | | |
| | |
| | |
| | |
| | |
| | |
| | |
| | |
| | |
| | |
Korea Hydro & Nuclear Power Co. Ltd. | | |
| | |
| | |
| | |
|
| | |
| | |
| | |
African Export-Import Bank (The) | | |
| | |
| | |
| | |
|
Turkiye Vakiflar Bankasi TAO, 5.50%, 10/01/26(b) | | |
Total Foreign Government Obligations — 1.5%
(Cost: $6,890,015) | |
Total Long-Term Investments — 98.1%
(Cost: $448,412,093) | |
| | |
|
Money Market Funds — 10.0% |
BlackRock Cash Funds: Institutional, SL Agency Shares, 5.01%(j)(k)(l) | | |
Schedule of Investments22
Schedule of Investments (continued)October 31, 2024
iShares® J.P. Morgan EM Corporate Bond ETF(Percentages shown are based on Net Assets)
| | |
Money Market Funds (continued) |
BlackRock Cash Funds: Treasury, SL Agency Shares, 4.83%(j)(k) | | |
Total Short-Term Securities — 10.0%
(Cost: $44,263,295) | |
Total Investments — 108.1%
(Cost: $492,675,388) | |
Liabilities in Excess of Other Assets — (8.1)% | |
| |
| Security exempt from registration pursuant to Rule 144A under the Securities Act of 1933, as amended. These securities may be resold in transactions exempt from registration to qualified institutional investors. |
| This security may be resold to qualified foreign investors and foreign institutional buyers under Regulation S of the Securities Act of 1933. |
| Step coupon security. Coupon rate will either increase (step-up bond) or decrease (step-down bond) at regular intervals until maturity. Interest rate shown reflects the rate currently in effect. |
| Perpetual security with no stated maturity date. |
| All or a portion of this security is on loan. |
| Variable rate security. Interest rate resets periodically. The rate shown is the effective interest rate as of period end. Security description also includes the reference rate and spread if published and available. |
| Payment-in-kind security which may pay interest/dividends in additional par/shares and/or in cash. Rates shown are the current rate and possible payment rates. |
| |
| U.S. dollar denominated security issued by foreign domiciled entity. |
| |
| Annualized 7-day yield as of period end. |
| All or a portion of this security was purchased with the cash collateral from loaned securities. |
Affiliates
Investments in issuers considered to be affiliate(s) of the Fund during the year ended October 31, 2024 for purposes of Section 2(a)(3) of the Investment Company Act of 1940, as amended, were as follows:
| | | | | Change in
Unrealized
Appreciation
(Depreciation) | | | | Capital
Gain
Distributions
from
Underlying
Funds |
BlackRock Cash Funds: Institutional, SL Agency Shares | | | | | | | | | |
BlackRock Cash Funds: Treasury, SL Agency Shares | | | | | | | | | |
| | | | | | | | | |
| Represents net amount purchased (sold). |
| All or a portion represents securities lending income earned from the reinvestment of cash collateral from loaned securities, net of fees and collateral investment expenses, and other payments to and from borrowers of securities. |
Fair Value Hierarchy as of Period End
Various inputs are used in determining the fair value of financial instruments at the measurement date. For a description of the input levels and information about the Fund’s policy regarding valuation of financial instruments, refer to the Notes to Financial Statements.
The following table summarizes the Fund’s financial instruments categorized in the fair value hierarchy. The breakdown of the Fund’s financial instruments into major categories is disclosed in the Schedule of Investments above.
| | | | |
| | | | |
| | | | |
| | | | |
| | | | |
Foreign Government Obligations | | | | |
| | | | |
| | | | |
| | | | |
See notes to financial statements.
232024 iShares Annual Financial Statements and Additional Information
Schedule of InvestmentsOctober 31, 2024
iShares® J.P. Morgan EM High Yield Bond ETF(Percentages shown are based on Net Assets)
| | |
|
|
| | |
| | |
| | |
| | |
| | |
| | |
| | |
| | |
| | |
| | |
| | |
|
Southern Gas Corridor CJSC, 6.88%, 03/24/26(b) | | |
|
AUB Sukuk Ltd., 2.62%, 09/09/26(b) | | |
Bapco Energies BSCC, 7.50%, 10/25/27(b) | | |
BBK BSC, 6.88%, 06/06/29(b) | | |
| | |
|
3R Lux SARL, 9.75%, 02/05/31(b) | | |
Acu Petroleo Luxembourg SARL, 7.50%, 01/13/32(b) | | |
| | |
| | |
| | |
Amaggi Luxembourg International SARL, 5.25%, 01/28/28(b) | | |
Ambipar Lux SARL, 9.88%, 02/06/31(b) | | |
| | |
| | |
| | |
B3 SA - Brasil Bolsa Balcao, 4.13%, 09/20/31(b) | | |
Banco Bradesco SA/Cayman Islands, 4.38%, 03/18/27(b) | | |
Banco BTG Pactual SA/Cayman Islands | | |
| | |
| | |
| | |
| | |
| | |
| | |
| | |
| | |
8.75%, (10-year CMT + 4.398%)(b)(c)(d)(e) | | |
Braskem America Finance Co., 7.13%, 07/22/41(b)(c) | | |
Braskem Netherlands Finance BV | | |
| | |
| | |
| | |
| | |
| | |
| | |
| | |
| | |
| | |
Centrais Eletricas Brasileiras SA | | |
| | |
| | |
| | |
|
| | |
| | |
| | |
| | |
Cosan Overseas Ltd., 8.25%(b)(d) | | |
CSN Inova Ventures, 6.75%, 01/28/28(b) | | |
| | |
| | |
| | |
| | |
FS Luxembourg SARL, 8.88%, 02/12/31(b) | | |
Itau Unibanco Holding SA/Cayman Island | | |
3.88%, 04/15/31, (5-year CMT + 3.446%)(b)(c)(e) | | |
4.50%, 11/21/29, (5-year CMT + 2.822%)(b)(c)(e) | | |
4.63%, (5-year CMT + 3.222%)(b)(d)(e) | | |
7.72%, (5-year CMT + 3.981%)(b)(d)(e) | | |
7.86%, (5-year CMT + 3.863%)(b)(d) | | |
| | |
| | |
| | |
| | |
LD Celulose International GmbH, 7.95%, 01/26/32(a) | | |
MARB BondCo PLC, 3.95%, 01/29/31(b) | | |
MC Brazil Downstream Trading SARL, 7.25%, 06/30/31(b) | | |
MercadoLibre Inc., 3.13%, 01/14/31(c) | | |
| | |
| | |
| | |
Movida Europe SA, 7.85%, 04/11/29(b) | | |
NBM U.S. Holdings Inc., 7.00%, 05/14/26(b) | | |
Petrobras Global Finance BV | | |
| | |
| | |
| | |
| | |
| | |
| | |
| | |
| | |
| | |
| | |
Petrorio Luxembourg Holding SARL, 6.13%, 06/09/26(b) | | |
| | |
| | |
| | |
| | |
| | |
| | |
| | |
9.00%, 06/30/31, (9.00% PIK)(a)(c)(f) | | |
9.00%, 06/30/31, (9.00% PIK)(b)(f) | | |
Simpar Europe SA, 5.20%, 01/26/31(b) | | |
Trident Energy Finance PLC, 12.50%, 11/30/29(b) | | |
XP Inc., 6.75%, 07/02/29(b) | | |
Yinson Boronia Production BV, 8.95%, 07/31/42(b) | | |
| | |
|
Endeavour Mining PLC, 5.00%, 10/14/26(b) | | |
Schedule of Investments24
Schedule of Investments (continued)October 31, 2024
iShares® J.P. Morgan EM High Yield Bond ETF(Percentages shown are based on Net Assets)
| | |
|
Alinma Tier 1 Sukuk Ltd., 6.50%, (5-year CMT + 2.201%)(b)(d)(e) | | |
Arabian Centres Sukuk III Ltd., 9.50%, 03/06/29(b) | | |
| | |
|
AES Andes SA, 8.15%, 06/10/55, (5-year CMT + 3.835%)(b)(e) | | |
Agrosuper SA, 4.60%, 01/20/32(b) | | |
Banco de Credito e Inversiones SA | | |
7.50%, (5-year CMT + 3.767%)(a)(d)(e) | | |
8.75%, (5-year CMT + 4.944%)(b)(d)(e) | | |
Chile Electricity Lux MPC II SARL, 5.58%, 10/20/35(a) | | |
Falabella SA, 3.38%, 01/15/32(b) | | |
| | |
| | |
| | |
Sable International Finance Ltd., 7.13%, 10/15/32(a)(c) | | |
Telefonica Moviles Chile SA, 3.54%, 11/18/31 | | |
| | |
|
Bank of Communications Co. Ltd., 3.80%, (5-year CMT + 3.345%)(b)(d)(e) | | |
Central Plaza Development Ltd., 5.75%, (5-year CMT + 8.066%)(b)(d)(e) | | |
| | |
| | |
| | |
| | |
| | |
6.00%, (5-year CMT + 5.584%)(b)(d)(e) | | |
GLP China Holdings Ltd., 2.95%, 03/29/26(b) | | |
Guojing Capital BVI Ltd., 6.30%, 12/02/25(b) | | |
Huarong Finance 2017 Co. Ltd. | | |
| | |
| | |
Huarong Finance 2019 Co. Ltd., 4.50%, 05/29/29(b) | | |
Industrial & Commercial Bank of China Ltd., 3.20%, (5-year CMT + 2.368%)(b)(d)(e) | | |
Longfor Group Holdings Ltd. | | |
| | |
| | |
Sunac China Holdings Ltd. | | |
6.25%, 09/30/27, (5.25% Cash and 6.25% PIK)(b)(f)(g)(h) | | |
6.75%, 09/30/28, (5.75% cash and 6.75% PIK)(b)(f) | | |
6.75%, 09/30/28, (5.75% Cash and 6.75% PIK)(b)(f) | | |
7.00%, 09/30/29, (12.00% PIK)(b)(f) | | |
Vanke Real Estate Hong Kong Co. Ltd., 3.98%, 11/09/27(b) | | |
West China Cement Ltd., 4.95%, 07/08/26(b) | | |
Westwood Group Holdings Ltd., 2.80%, 01/20/26(b) | | |
Yanlord Land HK Co. Ltd., 5.13%, 05/20/26(b) | | |
| | |
|
ABRA Global Finance, 14.00%, 10/22/29, (6.00% cash and 8.00% PIK)(a)(f) | | |
AI Candelaria Spain SA, 5.75%, 06/15/33(b) | | |
Avianca Midco 2 PLC, 9.00%, 12/01/28(b) | | |
Banco Davivienda SA, 6.65%, (10-year CMT + 5.097%)(b)(d) | | |
| | |
|
Banco de Bogota SA, 6.25%, 05/12/26(b) | | |
| | |
4.63%, 12/18/29, (5-year CMT + 2.944%)(e) | | |
8.63%, 12/24/34, (5-year CMT + 4.320%)(e) | | |
Canacol Energy Ltd., 5.75%, 11/24/28(b) | | |
Colombia Telecomunicaciones SA ESP, 4.95%, 07/17/30(b) | | |
| | |
| | |
| | |
| | |
| | |
| | |
| | |
| | |
| | |
| | |
EnfraGen Energia Sur SA/EnfraGen Spain SA/Prime Energia SpA, 5.38%, 12/30/30(b) | | |
Geopark Ltd., 5.50%, 01/17/27(b) | | |
Gran Tierra Energy Inc., 9.50%, 10/15/29(b) | | |
Grupo Aval Ltd., 4.38%, 02/04/30(b) | | |
Grupo de Inversiones Suramericana SA, 5.50%, 04/29/26(b) | | |
SierraCol Energy Andina LLC, 6.00%, 06/15/28(b) | | |
| | |
|
Allwyn Entertainment Financing U.K. PLC, 7.88%, 04/30/29(b) | | |
Dominican Republic — 0.1% |
Aeropuertos Dominicanos Siglo XXI SA, 7.00%, 06/30/34 | | |
|
Kosmos Energy Ltd., 8.75%, 10/01/31(a) | | |
Tullow Oil PLC, 10.25%, 05/15/26(b) | | |
| | |
|
Central American Bottling Corp./CBC Bottling Holdco SL/Beliv Holdco SL, 5.25%, 04/27/29(b) | | |
CT Trust, 5.13%, 02/03/32(b) | | |
Investment Energy Resources Ltd., 6.25%, 04/26/29(b) | | |
Millicom International Cellular SA | | |
| | |
| | |
| | |
|
Bank of Communications Hong Kong Ltd., 3.73%, (5-year CMT + 2.525%)(b)(d)(e) | | |
Bank of East Asia Ltd. (The), 5.83%, (5-year CMT + 5.527%)(b)(d)(e) | | |
CAS Capital No. 1 Ltd., 4.00%, (5-year CMT + 3.642%)(b)(d)(e) | | |
Cathay Pacific MTN Financing HK Ltd., 4.88%, 08/17/26(b) | | |
China CITIC Bank International Ltd. | | |
3.25%, (5-year CMT + 2.530%)(b)(d)(e) | | |
4.80%, (5-year CMT + 2.104%)(b)(d)(e) | | |
252024 iShares Annual Financial Statements and Additional Information
Schedule of Investments (continued)October 31, 2024
iShares® J.P. Morgan EM High Yield Bond ETF(Percentages shown are based on Net Assets)
| | |
|
| | |
8.05%, (5-year CMT + 4.865%)(b)(d)(e) | | |
| | |
Lai Sun MTN Ltd., 5.00%, 07/28/26(b) | | |
Li & Fung Ltd., 5.25%(b)(d) | | |
Melco Resorts Finance Ltd. | | |
| | |
| | |
| | |
| | |
| | |
Nanyang Commercial Bank Ltd., 6.50%, (5-year CMT + 3.509%)(b)(d)(e) | | |
| | |
4.13%, (5-year CMT + 5.858%)(b)(d)(e) | | |
| | |
5.25%, (5-year CMT + 7.889%)(b)(d)(e) | | |
| | |
NWD MTN Ltd., 4.13%, 07/18/29(b) | | |
PCPD Capital Ltd., 5.13%, 06/18/26(b) | | |
Seaspan Corp., 5.50%, 08/01/29(b) | | |
Wheelock MTN BVI Ltd., 2.38%, 01/25/26(b) | | |
| | |
|
OTP Bank Nyrt, 8.75%, 05/15/33, (5-year CMT + 5.060%)(b)(e) | | |
|
Axis Bank Ltd./Gandhinagar, 4.10%, (5-year CMT + 3.315%)(b)(d)(e) | | |
Biocon Biologics Global PLC, 6.67%, 10/09/29(a) | | |
CA Magnum Holdings, 5.38%, 10/31/26(b) | | |
Continuum Green Energy India Pvt / Co-Issuers, 7.50%, 06/26/33(b) | | |
Delhi International Airport Ltd. | | |
| | |
| | |
Greenko Dutch BV, 3.85%, 03/29/26(b) | | |
Greenko Power II Ltd., 4.30%, 12/13/28(b) | | |
Greenko Solar Mauritius Ltd., 5.95%, 07/29/26(b) | | |
HDFC Bank Ltd., 3.70%, (5-year CMT + 2.925%)(b)(d)(e) | | |
IRB Infrastructure Developers Ltd., 7.11%, 03/11/32(b) | | |
JSW Hydro Energy Ltd., 4.13%, 05/18/31(b) | | |
| | |
| | |
| | |
Muthoot Finance Ltd., 7.13%, 02/14/28(b)(c) | | |
| | |
3.98%, (5-year CMT + 3.390%)(b)(d) | | |
5.65%, (5-year CMT + 4.274%)(b)(d)(e) | | |
Periama Holdings LLC/DE, 5.95%, 04/19/26(b) | | |
ReNew Wind Energy AP2/ReNew Power Pvt Ltd. other 9 Subsidiaries, 4.50%, 07/14/28(b) | | |
Shriram Finance Ltd., 6.63%, 04/22/27(b) | | |
UPL Corp. Ltd., 4.63%, 06/16/30(b) | | |
Vedanta Resources Finance II PLC | | |
| | |
| | |
| | |
| | |
|
Vedanta Resources Ltd., 13.88%, 12/09/28(b) | | |
| | |
|
Bank Negara Indonesia Persero Tbk PT | | |
| | |
4.30%, (5-year CMT + 3.466%)(b)(d)(e) | | |
Medco Maple Tree Pte Ltd., 8.96%, 04/27/29(b) | | |
| | |
|
Energian Israel Finance Ltd. | | |
| | |
| | |
| | |
| | |
| | |
| | |
| | |
Teva Pharmaceutical Finance Co. LLC, 6.15%, 02/01/36(c) | | |
Teva Pharmaceutical Finance Netherlands III BV | | |
| | |
| | |
| | |
| | |
| | |
| | |
| | |
| | |
|
Digicel Intermediate Holdings Ltd./Digicel International Finance Ltd./Difl U.S., 9.00%, 05/25/27, (2.25% PIK)(f) | | |
|
Tengizchevroil Finance Co. International Ltd. | | |
| | |
| | |
| | |
|
Kuwait Projects Co. SPC Ltd. | | |
| | |
| | |
| | |
|
| | |
| | |
| | |
NewCo Holding USD 20 SARL, 9.38%, 11/07/29(a) | | |
| | |
|
Champion Path Holdings Ltd. | | |
| | |
| | |
| | |
| | |
| | |
| | |
| | |
| | |
| | |
Schedule of Investments26
Schedule of Investments (continued)October 31, 2024
iShares® J.P. Morgan EM High Yield Bond ETF(Percentages shown are based on Net Assets)
| | |
|
| | |
| | |
| | |
| | |
| | |
| | |
|
Alsea SAB de CV, 7.75%, 12/14/26(b) | | |
Banco Mercantil del Norte SA/Grand Cayman | | |
5.88%, (5-year CMT + 4.643%)(b)(d)(e) | | |
6.63%, (10-year CMT + 5.034%)(b)(d) | | |
7.50%, (10-year CMT + 5.470%)(b)(d)(e) | | |
7.63%, (10-year CMT + 5.353%)(b) | | |
8.38%, (10-year CMT + 7.760%)(b)(d)(e) | | |
| | |
5.13%, 01/18/33, (5-year CMT + 2.650%)(b) | | |
5.88%, 09/13/34, (5-year CMT + 4.308%)(b)(e) | | |
8.13%, 01/08/39, (5-year CMT + 4.214%)(b) | | |
8.45%, 06/29/38, (5-year CMT + 4.661%)(b)(e) | | |
Borr IHC Ltd./Borr Finance LLC | | |
| | |
| | |
| | |
| | |
| | |
Cemex SAB de CV, 9.13%, (5-year CMT + 5.157%)(b)(d)(e) | | |
Cemex SAB De CV, 5.13%, (5-year CMT + 4.534%)(b)(c)(d)(e) | | |
Grupo Aeromexico SAB de CV | | |
| | |
| | |
Nemak SAB de CV, 3.63%, 06/28/31(b) | | |
| | |
| | |
| | |
| | |
| | |
| | |
| | |
| | |
| | |
| | |
| | |
| | |
| | |
| | |
| | |
| | |
| | |
| | |
| | |
Total Play Telecomunicaciones SA de CV, 6.38%, 09/20/28(b) | | |
| | |
|
Aragvi Finance International DAC, 8.45%, 04/29/26(b) | | |
|
| | |
| | |
| | |
|
| | |
| | |
| | |
| | |
| | |
|
VEON Holdings BV, 3.38%, 11/25/27(b) | | |
|
| | |
| | |
9.13%, (5-year CMT + 8.070%)(b)(d)(e) | | |
| | |
| | |
| | |
IHS Netherlands Holdco BV, 8.00%, 09/18/27(b) | | |
SEPLAT Energy PLC, 7.75%, 04/01/26(b) | | |
| | |
|
Bank Muscat SAOG, 4.75%, 03/17/26(b) | | |
EDO Sukuk Ltd., 5.88%, 09/21/33(b) | | |
Otel Sukuk Ltd., 5.38%, 01/24/31(b) | | |
Oztel Holdings SPC Ltd., 6.63%, 04/24/28(b) | | |
| | |
|
AES Panama Generation Holdings SRL, 4.38%, 05/31/30(b) | | |
C&W Senior Finance Ltd., 6.88%, 09/15/27(b) | | |
Telecomunicaciones Digitales SA, 4.50%, 01/30/30(b) | | |
| | |
|
Bioceanico Sovereign Certificate Ltd., 0.00%, 06/05/34(b)(i) | | |
|
Banco de Credito del Peru SA | | |
3.25%, 09/30/31, (5-year CMT + 2.450%)(b)(e) | | |
5.80%, 03/10/35, (5-year CMT + 2.244%)(a)(e) | | |
Cia. de Minas Buenaventura SAA, 5.50%, 07/23/26(b) | | |
Hunt Oil Co. of Peru LLC Sucursal Del Peru, 8.55%, 09/18/33(b) | | |
Minsur SA, 4.50%, 10/28/31(b) | | |
Peru LNG SRL, 5.38%, 03/22/30(b) | | |
| | |
| | |
| | |
| | |
|
Globe Telecom Inc., 4.20%, (5-year CMT + 5.527%)(b)(d)(e) | | |
JGSH Philippines Ltd., 4.13%, 07/09/30(b) | | |
Manila Water Co. Inc., 4.38%, 07/30/30(b) | | |
Petron Corp., 5.95%, (5-year CMT + 7.574%)(b)(d)(e) | | |
San Miguel Corp., 5.50%, (5-year CMT + 10.237%)(b)(d)(e) | | |
San Miguel Global Power Holdings Corp., 8.75%, (5-year CMT + 7.732%)(b)(d)(e) | | |
SMC Global Power Holdings Corp. | | |
5.45%, (5-year CMT + 7.155%)(b)(d)(e) | | |
5.70%, (5-year CMT + 6.554%)(b)(d)(e) | | |
272024 iShares Annual Financial Statements and Additional Information
Schedule of Investments (continued)October 31, 2024
iShares® J.P. Morgan EM High Yield Bond ETF(Percentages shown are based on Net Assets)
| | |
|
SMIC SG Holdings Pte Ltd., 5.38%, 07/24/29(b) | | |
| | |
|
Canpack SA/Canpack U.S. LLC, 3.88%, 11/15/29(b) | | |
|
Commercial Bank PSQC (The), 4.50%, (5-year CMT + 3.874%)(b)(d)(e) | | |
|
Arabian Centres Sukuk II Ltd., 5.63%, 10/07/26(b) | | |
Dar Al-Arkan Sukuk Co. Ltd., 8.00%, 02/25/29(b) | | |
Riyad Tier 1 Sukuk Ltd., 4.00%, (5-year CMT + 2.170%)(b)(d)(e) | | |
| | |
|
Telecommunications Co. Telekom Srbija AD Belgrade, 7.00%, 10/28/29(a) | | |
|
GLP Pte Ltd., 4.50%, (5-year CMT + 3.735%)(b)(d)(e) | | |
Puma International Financing SA, 7.75%, 04/25/29(b) | | |
| | |
| | |
| | |
| | |
Yinson Production Financial Services Pte Ltd., 9.63%, 05/03/29(a) | | |
| | |
|
Absa Group Ltd., 6.38%, (5-year CMT + 5.411%)(b)(d)(e) | | |
Bidvest Group U.K. PLC, 3.63%, 09/23/26(b) | | |
Eskom Holdings SOC Ltd., 6.35%, 08/10/28(b) | | |
Liquid Telecommunications Financing PLC, 5.50%, 09/04/26(b) | | |
MTN Mauritius Investments Ltd., 6.50%, 10/13/26(b) | | |
| | |
| | |
| | |
| | |
| | |
| | |
| | |
| | |
Transnet SOC Ltd., 8.25%, 02/06/28(b) | | |
| | |
|
Eastern & Southern African Trade & Development Bank (The), 4.13%, 06/30/28(b) | | |
Odebrecht Holdco Finance Ltd., 0.00%, 09/10/58(b)(i) | | |
| | |
|
Consolidated Energy Finance SA | | |
| | |
| | |
Oriflame Investment Holding PLC, 5.13%, 05/04/26(b) | | |
| | |
|
HTA Group Ltd/Mauritius, 7.50%, 06/04/29(b) | | |
| | |
|
Bangkok Bank PCL/Hong Kong | | |
3.73%, 09/25/34, (5-year CMT + 1.900%)(b)(e) | | |
5.00%, (5-year CMT + 4.729%) | | |
Kasikornbank PCL/Hong Kong, 3.34%, 10/02/31, (5-year CMT + 1.700%)(b)(e) | | |
Krung Thai Bank PCL/Cayman Islands, 4.40%, (5-year CMT + 3.530%)(b)(d)(e) | | |
| | |
|
| | |
| | |
6.80%, 06/22/31, (5-year CMT + 6.015%)(b)(e) | | |
| | |
9.37%, (5-year CMT + 5.270%)(b)(d)(e) | | |
Anadolu Efes Biracilik Ve Malt Sanayii A/S, 3.38%, 06/29/28(b) | | |
Arcelik A/S, 8.50%, 09/25/28(b) | | |
Aydem Yenilenebilir Enerji A/S, 7.75%, 02/02/27(b) | | |
Coca-Cola Icecek A/S, 4.50%, 01/20/29(b) | | |
Eregli Demir ve Celik Fabrikalari TAS, 8.38%, 07/23/29(b) | | |
Ford Otomotiv Sanayi AS, 7.13%, 04/25/29(b) | | |
Limak Cimento Sanayi ve Ticaret AS, 9.75%, 07/25/29(b) | | |
Mersin Uluslararasi Liman Isletmeciligi AS, 8.25%, 11/15/28(b) | | |
Pegasus Hava Tasimaciligi AS, 8.00%, 09/11/31(a) | | |
QNB Bank AS, 7.25%, 05/21/29(b) | | |
| | |
| | |
| | |
Turk Telekomunikasyon AS, 7.38%, 05/20/29(b) | | |
Turkcell Iletisim Hizmetleri AS, 5.80%, 04/11/28(b) | | |
Turkiye Garanti Bankasi AS | | |
7.18%, 05/24/27, (5-year USD ICE Swap + 4.220%)(b)(e) | | |
8.38%, 02/28/34, (5-year CMT + 4.090%)(b)(e) | | |
| | |
| | |
7.75%, 01/22/30, (5-year CMT + 6.119%)(b)(e) | | |
9.19%, 06/29/28, (5-year USD Swap + 5.117%)(b)(e) | | |
Turkiye Vakiflar Bankasi TAO | | |
| | |
| | |
8.99%, 10/05/34, (5-year CMT + 4.669%)(b)(e) | | |
| | |
10.12%, (5-year CMT + 5.493%)(b)(d)(e) | | |
Ulker Biskuvi Sanayi AS, 7.88%, 07/08/31(b) | | |
Vestel Elektronik Sanayi ve Ticaret AS, 9.75%, 05/15/29(b) | | |
WE Soda Investments Holding PLC | | |
| | |
| | |
Yapi ve Kredi Bankasi A/S | | |
| | |
7.88%, 01/22/31, (5-year CMT + 7.415%)(b)(e) | | |
| | |
9.25%, 01/17/34, (5-year CMT + 5.278%)(b)(e) | | |
9.74%, (5-year CMT + 5.499%)(b)(d)(e) | | |
Schedule of Investments28
Schedule of Investments (continued)October 31, 2024
iShares® J.P. Morgan EM High Yield Bond ETF(Percentages shown are based on Net Assets)
| | |
|
Zorlu Enerji Elektrik Uretim AS, 11.00%, 04/23/30(a) | | |
| | |
|
Metinvest BV, 7.75%, 10/17/29(b) | | |
MHP Lux SA, 6.95%, 04/03/26(b) | | |
| | |
United Arab Emirates — 1.7% |
Abu Dhabi Commercial Bank PJSC, 8.00%, (5-year CMT + 3.524%)(b)(d)(e) | | |
Adib Capital Invest 3 Ltd., 7.25%, (5-year CMT + 3.059%)(b)(d)(e) | | |
Alpha Star Holding VIII Ltd., 8.38%, 04/12/27(b) | | |
Arada Sukuk 2 Ltd., 8.00%, 06/24/29(b) | | |
Arada Sukuk Ltd., 8.13%, 06/08/27(b) | | |
Binghatti Sukuk SPC Ltd., 9.63%, 02/28/27(b) | | |
Commercial Bank of Dubai PSC, 6.00%, (6-year CMT + 5.597%)(b)(d)(e) | | |
DIB Tier 1 Sukuk 3 Ltd., 6.25%, (6-year CMT + 3.664%)(b)(d)(e) | | |
DIB Tier 1 Sukuk 4 Ltd., 4.63%, (6-year CMT + 4.077%)(b)(d)(e) | | |
DP World Salaam, 6.00%, (5-year CMT + 5.750%)(b)(d)(e) | | |
| | |
4.25%, (6-year CMT + 3.155%)(b)(d)(e) | | |
6.13%, (6-year CMT + 3.656%)(b)(d)(e) | | |
6.13%, (6-year CMT + 5.702%)(b)(d)(e) | | |
MAF Global Securities Ltd., 7.88%, (5-year CMT + 4.893%)(b)(d)(e) | | |
Mashreqbank PSC, 7.13%, (5-year CMT + 2.705%)(b)(d)(e) | | |
Shelf Drilling Holdings Ltd., 9.63%, 04/15/29(b) | | |
Sobha Sukuk Ltd., 8.75%, 07/17/28(b) | | |
| | |
|
| | |
4.30%, (5-year CMT + 3.135%)(b)(d)(e) | | |
4.75%, (5-year CMT + 3.805%)(b)(d)(e) | | |
6.00%, (5-year CMT + 5.661%)(b)(d)(e) | | |
7.75%, (5-year CMT + 4.976%)(b)(d)(e) | | |
7.88%, (5-year CMT + 3.574%)(b)(d)(e) | | |
| | |
|
Playtika Holding Corp., 4.25%, 03/15/29(b) | | |
Sagicor Financial Co. Ltd., 5.30%, 05/13/28(b) | | |
| | |
|
Mong Duong Finance Holdings BV, 5.13%, 05/07/29(b) | | |
|
First Quantum Minerals Ltd. | | |
| | |
| | |
| | |
| | |
Total Corporate Bonds & Notes — 46.4%
(Cost: $217,199,807) | |
| | |
Foreign Government Obligations(j) |
|
Angolan Government International Bond | | |
| | |
| | |
| | |
| | |
| | |
| | |
|
Argentine Republic Government International Bond | | |
| | |
| | |
| | |
| | |
| | |
| | |
| | |
|
Republic of Azerbaijan International Bond, 3.50%, 09/01/32(b) | | |
|
Bahrain Government International Bond | | |
| | |
| | |
| | |
| | |
| | |
| | |
| | |
| | |
| | |
| | |
| | |
CBB International Sukuk Programme Co. | | |
| | |
| | |
| | |
| | |
CBB International Sukuk Programme Co. WLL, 6.00%, 02/12/31(b) | | |
| | |
|
Bolivian Government International Bond, 4.50%, 03/20/28(b) | | |
|
Brazilian Government International Bond | | |
| | |
| | |
| | |
| | |
| | |
| | |
| | |
| | |
| | |
| | |
| | |
| | |
292024 iShares Annual Financial Statements and Additional Information
Schedule of Investments (continued)October 31, 2024
iShares® J.P. Morgan EM High Yield Bond ETF(Percentages shown are based on Net Assets)
| | |
|
| | |
| | |
| | |
| | |
| | |
|
Colombia Government International Bond | | |
| | |
| | |
| | |
| | |
| | |
| | |
| | |
| | |
| | |
| | |
| | |
| | |
| | |
| | |
| | |
| | |
| | |
| | |
| | |
| | |
| | |
|
Costa Rica Government International Bond | | |
| | |
| | |
| | |
| | |
| | |
| | |
Dominican Republic — 3.2% |
Dominican Republic International Bond | | |
| | |
| | |
| | |
| | |
| | |
| | |
| | |
| | |
| | |
| | |
| | |
| | |
| | |
| | |
| | |
|
Ecuador Government International Bond | | |
| | |
| | |
| | |
| | |
| | |
| | |
|
Egypt Government International Bond | | |
| | |
| | |
| | |
| | |
| | |
| | |
| | |
| | |
| | |
| | |
| | |
| | |
| | |
Egyptian Financial Co. for Sovereign Taskeek (The), 10.88%, 02/28/26(b) | | |
| | |
|
El Salvador Government International Bond, 9.25%, 04/17/30(b) | | |
|
Ghana Government International Bond | | |
| | |
| | |
| | |
| | |
| | |
|
Guatemala Government Bond | | |
| | |
| | |
| | |
|
Iraq International Bond, 5.80%, 01/15/28(b) | | |
|
Ivory Coast Government International Bond | | |
| | |
| | |
| | |
| | |
|
Jamaica Government International Bond | | |
| | |
| | |
| | |
| | |
|
Jordan Government International Bond | | |
| | |
| | |
| | |
| | |
| | |
| | |
|
Republic of Kenya Government International Bond | | |
| | |
| | |
Schedule of Investments30
Schedule of Investments (continued)October 31, 2024
iShares® J.P. Morgan EM High Yield Bond ETF(Percentages shown are based on Net Assets)
| | |
|
| | |
| | |
| | |
| | |
|
Lebanon Government International Bond | | |
| | |
| | |
| | |
| | |
| | |
| | |
| | |
| | |
|
Morocco Government International Bond | | |
| | |
| | |
| | |
| | |
| | |
|
Nigeria Government International Bond | | |
| | |
| | |
| | |
| | |
| | |
| | |
| | |
| | |
| | |
| | |
| | |
|
Oman Government International Bond | | |
| | |
| | |
| | |
| | |
| | |
| | |
| | |
| | |
| | |
| | |
Oman Sovereign Sukuk Co., 4.88%, 06/15/30(b) | | |
| | |
|
Pakistan Global Sukuk Programme Co. Ltd. (The), 7.95%, 01/31/29(b) | | |
Pakistan Government International Bond | | |
| | |
| | |
| | |
| | |
|
Paraguay Government International Bond | | |
| | |
| | |
|
| | |
| | |
| | |
|
Senegal Government International Bond | | |
| | |
| | |
| | |
|
Serbia International Bond | | |
| | |
| | |
| | |
| | |
|
Republic of South Africa Government International Bond | | |
| | |
| | |
| | |
| | |
| | |
| | |
| | |
| | |
| | |
| | |
| | |
| | |
|
Sri Lanka Government International Bond | | |
| | |
| | |
| | |
| | |
| | |
| | |
| | |
| | |
Trinidad And Tobago — 0.1% |
Trinidad & Tobago Government International Bond, 4.50%, 08/04/26(b) | | |
|
Hazine Mustesarligi Varlik Kiralama AS | | |
| | |
| | |
| | |
Turkey Government International Bond | | |
| | |
| | |
| | |
| | |
| | |
| | |
| | |
| | |
| | |
| | |
| | |
312024 iShares Annual Financial Statements and Additional Information
Schedule of Investments (continued)October 31, 2024
iShares® J.P. Morgan EM High Yield Bond ETF(Percentages shown are based on Net Assets)
| | |
|
| | |
| | |
| | |
| | |
| | |
| | |
Turkiye Government International Bond | | |
| | |
| | |
| | |
| | |
| | |
| | |
| | |
| | |
| | |
| | |
| | |
Turkiye Vakiflar Bankasi TAO, 5.50%, 10/01/26(b) | | |
| | |
|
Ukraine Government International Bond | | |
| | |
| | |
| | |
| | |
| | |
| | |
| | |
| | |
| | |
| | |
| | |
| | |
| | |
| | |
United Arab Emirates — 1.1% |
Emirate of Dubai Government International Bond | | |
| | |
| | |
Finance Department Government of Sharjah | | |
| | |
| | |
| | |
Sharjah Sukuk Program Ltd. | | |
| | |
| | |
| | |
| | |
| | |
| | |
|
Zambia Government International Bond | | |
| | |
| | |
| | |
Total Foreign Government Obligations — 51.0%
(Cost: $248,005,972) | |
Total Long-Term Investments — 97.4%
(Cost: $465,205,779) | |
| | |
|
Money Market Funds — 14.9% |
BlackRock Cash Funds: Institutional, SL Agency Shares, 5.01%(l)(m)(n) | | |
BlackRock Cash Funds: Treasury, SL Agency Shares, 4.83%(l)(m) | | |
Total Short-Term Securities — 14.9%
(Cost: $68,013,569) | |
Total Investments — 112.3%
(Cost: $533,219,348) | |
Liabilities in Excess of Other Assets — (12.3)% | |
| |
| Security exempt from registration pursuant to Rule 144A under the Securities Act of 1933, as amended. These securities may be resold in transactions exempt from registration to qualified institutional investors. |
| This security may be resold to qualified foreign investors and foreign institutional buyers under Regulation S of the Securities Act of 1933. |
| All or a portion of this security is on loan. |
| Perpetual security with no stated maturity date. |
| Variable rate security. Interest rate resets periodically. The rate shown is the effective interest rate as of period end. Security description also includes the reference rate and spread if published and available. |
| Payment-in-kind security which may pay interest/dividends in additional par/shares and/or in cash. Rates shown are the current rate and possible payment rates. |
| Issuer filed for bankruptcy and/or is in default. |
| Non-income producing security. |
| |
| U.S. dollar denominated security issued by foreign domiciled entity. |
| Step coupon security. Coupon rate will either increase (step-up bond) or decrease (step-down bond) at regular intervals until maturity. Interest rate shown reflects the rate currently in effect. |
| |
| Annualized 7-day yield as of period end. |
| All or a portion of this security was purchased with the cash collateral from loaned securities. |
Schedule of Investments32
Schedule of Investments (continued)October 31, 2024
iShares® J.P. Morgan EM High Yield Bond ETF
Affiliates
Investments in issuers considered to be affiliate(s) of the Fund during the year ended October 31, 2024 for purposes of Section 2(a)(3) of the Investment Company Act of 1940, as amended, were as follows:
| | | | | Change in
Unrealized
Appreciation
(Depreciation) | | | | Capital
Gain
Distributions
from
Underlying
Funds |
BlackRock Cash Funds: Institutional, SL Agency Shares | | | | | | | | | |
BlackRock Cash Funds: Treasury, SL Agency Shares | | | | | | | | | |
| | | | | | | | | |
| Represents net amount purchased (sold). |
| All or a portion represents securities lending income earned from the reinvestment of cash collateral from loaned securities, net of fees and collateral investment expenses, and other payments to and from borrowers of securities. |
Fair Value Hierarchy as of Period End
Various inputs are used in determining the fair value of financial instruments at the measurement date. For a description of the input levels and information about the Fund’s policy regarding valuation of financial instruments, refer to the Notes to Financial Statements.
The following table summarizes the Fund’s financial instruments categorized in the fair value hierarchy. The breakdown of the Fund’s financial instruments into major categories is disclosed in the Schedule of Investments above.
| | | | |
| | | | |
| | | | |
| | | | |
| | | | |
Foreign Government Obligations | | | | |
| | | | |
| | | | |
| | | | |
See notes to financial statements.
332024 iShares Annual Financial Statements and Additional Information
Schedule of InvestmentsOctober 31, 2024
iShares® J.P. Morgan EM Local Currency Bond ETF(Percentages shown are based on Net Assets)
| | |
Foreign Government Obligations |
|
Brazil Letras do Tesouro Nacional | | |
| | |
| | |
| | |
| | |
| | |
| | |
| | |
Brazil Notas do Tesouro Nacional | | |
| | |
| | |
Series F, 10.00%, 01/01/27 | | |
Series F, 10.00%, 01/01/29 | | |
Series F, 10.00%, 01/01/31 | | |
| | |
|
Bonos de la Tesoreria de la Republica en pesos | | |
| | |
| | |
| | |
| | |
| | |
| | |
| | |
| | |
| | |
| | |
| | |
| | |
|
| | |
| | |
| | |
| | |
| | |
| | |
| | |
| | |
| | |
| | |
| | |
| | |
| | |
| | |
| | |
| | |
| | |
| | |
| | |
| | |
| | |
| | |
| | |
| | |
| | |
| | |
| | |
| | |
| | |
| | |
|
| | |
| | |
| | |
| | |
| | |
| | |
| | |
| | |
| | |
| | |
| | |
| | |
| | |
| | |
| | |
| | |
| | |
| | |
| | |
| | |
| | |
| | |
| | |
| | |
| | |
| | |
| | |
| | |
| | |
| | |
| | |
| | |
| | |
| | |
| | |
| | |
| | |
| | |
|
Colombia TES, 13.25%, 02/09/33 | | |
| | |
| | |
| | |
Series B, 5.75%, 11/03/27 | | |
Series B, 6.00%, 04/28/28 | | |
Series B, 6.25%, 11/26/25 | | |
Series B, 6.25%, 07/09/36 | | |
Series B, 7.00%, 03/26/31 | | |
Series B, 7.00%, 06/30/32 | | |
Series B, 7.25%, 10/18/34 | | |
Series B, 7.25%, 10/26/50 | | |
Series B, 7.50%, 08/26/26 | | |
Series B, 7.75%, 09/18/30 | | |
| | |
|
Czech Republic Government Bond | | |
| | |
| | |
| | |
| | |
Schedule of Investments34
Schedule of Investments (continued)October 31, 2024
iShares® J.P. Morgan EM Local Currency Bond ETF(Percentages shown are based on Net Assets)
| | |
Czech Republic (continued) |
| | |
| | |
| | |
| | |
| | |
| | |
| | |
| | |
| | |
| | |
| | |
| | |
| | |
| | |
| | |
| | |
| | |
| | |
| | |
Dominican Republic — 4.4% |
Dominican Republic International Bond | | |
| | |
| | |
| | |
| | |
|
| | |
| | |
| | |
| | |
| | |
| | |
| | |
| | |
| | |
| | |
| | |
| | |
| | |
| | |
| | |
| | |
| | |
| | |
| | |
| | |
|
| | |
| | |
| | |
| | |
| | |
| | |
| | |
| | |
| | |
| | |
| | |
| | |
| | |
| | |
|
| | |
| | |
| | |
| | |
| | |
| | |
| | |
| | |
| | |
| | |
| | |
| | |
| | |
| | |
| | |
| | |
| | |
|
| | |
| | |
| | |
| | |
| | |
| | |
| | |
| | |
| | |
| | |
| | |
| | |
| | |
| | |
| | |
| | |
| | |
| | |
| | |
| | |
| | |
| | |
| | |
| | |
| | |
| | |
| | |
| | |
| | |
| | |
| | |
| | |
| | |
| | |
| | |
| | |
Perusahaan Penerbit SBSN Indonesia | | |
| | |
| | |
| | |
| | |
| | |
352024 iShares Annual Financial Statements and Additional Information
Schedule of Investments (continued)October 31, 2024
iShares® J.P. Morgan EM Local Currency Bond ETF(Percentages shown are based on Net Assets)
| | |
|
| | |
| | |
|
| | |
| | |
| | |
| | |
| | |
| | |
| | |
| | |
| | |
| | |
| | |
| | |
| | |
| | |
| | |
| | |
| | |
| | |
| | |
| | |
| | |
| | |
| | |
Malaysia Government Investment Issue | | |
| | |
| | |
| | |
| | |
| | |
| | |
| | |
| | |
| | |
| | |
| | |
| | |
| | |
| | |
| | |
| | |
| | |
| | |
| | |
|
| | |
| | |
| | |
| | |
| | |
Series M, 5.75%, 03/05/26 | | |
Series M, 7.75%, 05/29/31 | | |
Series M, 7.75%, 11/23/34 | | |
Series M, 7.75%, 11/13/42 | | |
Series M, 8.00%, 11/07/47 | | |
Series M 20, 7.50%, 06/03/27 | | |
Series M 20, 8.50%, 05/31/29 | | |
Series M 30, 8.50%, 11/18/38 | | |
| | |
|
Series M 30, 10.00%, 11/20/36 | | |
| | |
| | |
| | |
| | |
|
| | |
| | |
| | |
| | |
| | |
| | |
| | |
| | |
| | |
| | |
| | |
| | |
|
Republic of Poland Government Bond | | |
| | |
| | |
| | |
| | |
| | |
| | |
| | |
| | |
| | |
| | |
| | |
| | |
| | |
| | |
| | |
|
| | |
| | |
| | |
| | |
| | |
| | |
| | |
| | |
| | |
| | |
| | |
| | |
| | |
| | |
| | |
| | |
| | |
| | |
| | |
| | |
| | |
| | |
| | |
Schedule of Investments36
Schedule of Investments (continued)October 31, 2024
iShares® J.P. Morgan EM Local Currency Bond ETF(Percentages shown are based on Net Assets)
| | |
|
| | |
| | |
| | |
|
| | |
| | |
| | |
| | |
| | |
| | |
|
Republic of South Africa Government Bond | | |
| | |
| | |
| | |
| | |
| | |
| | |
| | |
| | |
| | |
| | |
| | |
| | |
| | |
|
| | |
| | |
| | |
| | |
| | |
| | |
| | |
| | |
| | |
| | |
| | |
| | |
| | |
| | |
| | |
| | |
| | |
| | |
| | |
| | |
| | |
| | |
| | |
| | |
| | |
| | |
|
| | |
| | |
| | |
|
| | |
| | |
| | |
| | |
| | |
| | |
| | |
| | |
| | |
| | |
| | |
| | |
| | |
| | |
|
Uruguay Government International Bond | | |
| | |
| | |
| | |
| | |
Total Long-Term Investments — 97.5%
(Cost: $371,551,133) | |
| | |
|
Money Market Funds — 0.4% |
BlackRock Cash Funds: Treasury, SL Agency Shares, 4.83%(d)(e) | | |
Total Short-Term Securities — 0.4%
(Cost: $1,530,000) | |
Total Investments — 97.9%
(Cost: $373,081,133) | |
Other Assets Less Liabilities — 2.1% | |
| |
| |
| Security exempt from registration pursuant to Rule 144A under the Securities Act of 1933, as amended. These securities may be resold in transactions exempt from registration to qualified institutional investors. |
| This security may be resold to qualified foreign investors and foreign institutional buyers under Regulation S of the Securities Act of 1933. |
| |
| Annualized 7-day yield as of period end. |
372024 iShares Annual Financial Statements and Additional Information
Schedule of Investments (continued)October 31, 2024
iShares® J.P. Morgan EM Local Currency Bond ETF
Affiliates
Investments in issuers considered to be affiliate(s) of the Fund during the year ended October 31, 2024 for purposes of Section 2(a)(3) of the Investment Company Act of 1940, as amended, were as follows:
| | | | | Change in
Unrealized
Appreciation
(Depreciation) | | | | Capital
Gain
Distributions
from
Underlying
Funds |
BlackRock Cash Funds: Treasury, SL Agency Shares | | | | | | | | | |
| Represents net amount purchased (sold). |
Fair Value Hierarchy as of Period End
Various inputs are used in determining the fair value of financial instruments at the measurement date. For a description of the input levels and information about the Fund’s policy regarding valuation of financial instruments, refer to the Notes to Financial Statements.
The following table summarizes the Fund’s financial instruments categorized in the fair value hierarchy. The breakdown of the Fund’s financial instruments into major categories is disclosed in the Schedule of Investments above.
| | | | |
| | | | |
| | | | |
| | | | |
Foreign Government Obligations | | | | |
| | | | |
| | | | |
| | | | |
See notes to financial statements.
Schedule of Investments38
Schedule of InvestmentsOctober 31, 2024
iShares® US & Intl High Yield Corp Bond ETF(Percentages shown are based on Net Assets)
| | |
|
|
APA Infrastructure Ltd., 7.13%, 11/09/83, (5-year EURIBOR ICE Swap + 4.098%)(a)(b) | | |
FMG Resources August 2006 Pty. Ltd. | | |
| | |
| | |
FMG Resources August Pty. Ltd. | | |
| | |
| | |
| | |
| | |
| | |
| | |
| | |
| | |
|
ams-OSRAM AG, 10.50%, 03/30/29(a) | | |
Benteler International AG, 9.38%, 05/15/28(a) | | |
| | |
|
Azelis Finance NV, 4.75%, 09/25/29(a) | | |
Ontex Group NV, 3.50%, 07/15/26(a) | | |
Telenet Finance Luxembourg Notes SARL, 5.50%, 03/01/28(c) | | |
| | |
|
1011778 BC ULC/New Red Finance Inc. | | |
| | |
| | |
| | |
| | |
| | |
| | |
| | |
| | |
| | |
Alcoa Nederland Holding BV, 5.50%, 12/15/27(c) | | |
AtkinsRealis Group Inc., 7.00%, 06/12/26 | | |
AutoCanada Inc., 5.75%, 02/07/29(c) | | |
Bausch Health Companies Inc., 5.00%, 02/15/29(c) | | |
| | |
| | |
| | |
| | |
| | |
| | |
| | |
| | |
| | |
| | |
| | |
Brookfield Residential Properties Inc./Brookfield Residential U.S. LLC | | |
| | |
| | |
Cineplex Inc., 7.63%, 03/31/29(c) | | |
Emera Inc., Series 16-A, 6.75%, 06/15/76, (3-mo. LIBOR US + 5.440%)(b) | | |
| | |
|
Garda World Security Corp. | | |
| | |
| | |
| | |
| | |
| | |
| | |
| | |
| | |
| | |
| | |
| | |
| | |
| | |
| | |
| | |
| | |
Series 144*, 6.88%, Series 144*, 05/15/30(c) | | |
Husky Injection Molding Systems Ltd./Titan Co-Borrower LLC, 9.00%, 02/15/29(c)(d) | | |
Jones Deslauriers Insurance Management Inc. | | |
| | |
| | |
Kronos Acquisition Holdings Inc. | | |
| | |
| | |
| | |
| | |
| | |
Mattr Corp., 7.25%, 04/02/31(c) | | |
| | |
| | |
| | |
| | |
| | |
| | |
| | |
| | |
NuVista Energy Ltd., 7.88%, 07/23/26(c) | | |
| | |
| | |
| | |
| | |
| | |
| | |
| | |
| | |
| | |
| | |
| | |
| | |
Ritchie Bros Holdings Inc. | | |
| | |
| | |
Rogers Communications Inc., 5.25%, 03/15/82, (5-year CMT + 3.590%)(b)(c) | | |
South Bow Canadian Infrastructure Holdings Ltd. | | |
7.50%, 03/01/55, (5-year CMT + 3.667%)(b)(c) | | |
7.63%, 03/01/55, (5-year CMT + 3.949%)(b)(c) | | |
Superior Plus LP, 4.25%, 05/18/28(c) | | |
Tamarack Valley Energy Ltd., 7.25%, 05/10/27(c) | | |
392024 iShares Annual Financial Statements and Additional Information
Schedule of Investments (continued)October 31, 2024
iShares® US & Intl High Yield Corp Bond ETF(Percentages shown are based on Net Assets)
| | |
|
Wrangler Holdco Corp., 6.63%, 04/01/32(c) | | |
| | |
|
Global Aircraft Leasing Co. Ltd., 8.75%, 09/01/27(c) | | |
|
Swissport Investments SA, 6.75%, 12/15/21(a)(e)(f) | | |
TI Automotive Finance PLC, 3.75%, 04/15/29(a) | | |
| | |
|
Bank of Cyprus PCL, 7.38%, 07/25/28, (3-mo. EURIBOR + 4.095%)(a)(b) | | |
|
Allwyn Entertainment Financing U.K. PLC, 7.25%, 04/30/30(a) | | |
|
| | |
1.50%, (5-year EUR Swap + 1.860%)(a)(b) | | |
2.50%, (5-year GUK + 2.136%)(a)(b) | | |
5.13%, (5-year EURIBOR ICE Swap + 2.590%)(a)(b) | | |
| | |
|
Citycon Treasury BV, 1.63%, 03/12/28(a) | | |
Finnair OYJ, 4.75%, 05/24/29(a) | | |
Huhtamaki OYJ, 4.25%, 06/09/27(a) | | |
| | |
|
Afflelou SAS, 6.00%, 07/25/29(a) | | |
| | |
| | |
| | |
| | |
| | |
| | |
| | |
| | |
| | |
| | |
| | |
| | |
| | |
| | |
Banijay Entertainment SASU, 7.00%, 05/01/29(a) | | |
CAB SELAS, 3.38%, 02/01/28(a) | | |
Cerba Healthcare SACA, 3.50%, 05/31/28(a) | | |
Chrome Holdco SASU, 5.00%, 05/31/29(a) | | |
CMA CGM SA, 5.50%, 07/15/29(a) | | |
Electricite de France SA, 9.13%, (5-year CMT + 5.411%)(b)(c)(g) | | |
Elior Group SA, 3.75%, 07/15/26(a) | | |
Elis SA, 1.63%, 04/03/28(a) | | |
| | |
| | |
| | |
| | |
Emeria SASU, 3.38%, 03/31/28(a) | | |
Eramet SA, 7.00%, 05/22/28(a) | | |
| | |
|
| | |
| | |
| | |
| | |
| | |
| | |
| | |
| | |
| | |
| | |
Goldstory SAS, 6.75%, 02/01/30(a) | | |
Holding d'Infrastructures des Metiers de l'Environnement | | |
| | |
Series ., 0.63%, Series ., 09/16/28(a) | | |
| | |
| | |
| | |
| | |
| | |
| | |
| | |
| | |
| | |
| | |
| | |
Series ., 5.38%, Series ., 05/02/31(a) | | |
IPD 3 BV, 8.00%, 06/15/28(a) | | |
Kapla Holding SAS, 3.38%, 12/15/26(a) | | |
| | |
| | |
| | |
Mobilux Finance SAS, 7.00%, 05/15/30(a) | | |
| | |
| | |
| | |
Opmobility, 4.88%, 03/13/29(a) | | |
Paprec Holding SA, 6.50%, 11/17/27(a) | | |
Picard Groupe SAS, 6.38%, 07/01/29(a) | | |
RCI Banque SA, 5.50%, 10/09/34, (5-year EURIBOR ICE Swap + 2.750%)(a)(b) | | |
| | |
| | |
| | |
| | |
Rexel SA, 2.13%, 12/15/28(a) | | |
SNF Group SACA, 2.63%, 02/01/29(a) | | |
SPIE SA, 2.63%, 06/18/26(a) | | |
Tereos Finance Groupe I SA, 4.75%, 04/30/27(a) | | |
| | |
| | |
| | |
| | |
| | |
|
| | |
3.90%, 09/25/83, (5-year EUR Swap + 3.896%)(a)(b) | | |
5.38%, 03/25/82, (5-year EUR Swap + 4.458%)(a)(b) | | |
Schedule of Investments40
Schedule of Investments (continued)October 31, 2024
iShares® US & Intl High Yield Corp Bond ETF(Percentages shown are based on Net Assets)
| | |
|
5.50%, 09/13/54, (5-year EURIBOR ICE Swap + 3.269%)(a)(b) | | |
6.63%, 09/25/83, (5-year EUR Swap + 3.432%)(a)(b) | | |
Series N5.5, 4.50%, Series N5.5, 03/25/82, (5-year EUR Swap + 3.751%)(a)(b) | | |
Bertelsmann SE & Co. KGaA, 3.50%, 04/23/75, (5-year EUR Swap + 3.206%)(a)(b) | | |
Ceconomy AG, 6.25%, 07/15/29(a) | | |
Cheplapharm Arzneimittel GmbH | | |
| | |
| | |
CT Investment GmbH, 6.38%, 04/15/30(a) | | |
Dynamo Newco II GmbH, 6.25%, 10/15/31(a) | | |
Evonik Industries AG, 1.38%, 09/02/81, (5-year EUR Swap + 1.836%)(a)(b) | | |
Fressnapf Holding SE, 5.25%, 10/31/31(a) | | |
Gruenenthal GmbH, 6.75%, 05/15/30(a) | | |
| | |
6.38%, 05/15/29, (6.38% cash)(c)(h) | | |
6.75%, 11/15/29, (6.75% cash and 7.50% PIK)(a)(h) | | |
7.00%, 11/15/31, (7.00% cash and 7.75% PIK)(a)(h) | | |
Mahle GmbH, 2.38%, 05/14/28(a) | | |
Mercer International Inc. | | |
| | |
| | |
Motel One GmbH/Muenchen, 7.75%, 04/02/31(a) | | |
Nidda Healthcare Holding GmbH | | |
| | |
| | |
PCF GmbH, 4.75%, 04/15/29(a) | | |
ProGroup AG, 5.38%, 04/15/31(a) | | |
| | |
| | |
| | |
| | |
| | |
Techem Verwaltungsgesellschaft 675 mbH, 5.38%, 07/15/29(a) | | |
Tele Columbus AG, 10.00%, 01/01/29, (10.00% PIK)(a)(h) | | |
| | |
| | |
| | |
TK Elevator Midco GmbH, 4.38%, 07/15/27(a) | | |
TK Elevator U.S. Newco Inc., 5.25%, 07/15/27(c) | | |
TUI AG, 5.88%, 03/15/29(a) | | |
TUI Cruises GmbH, 6.25%, 04/15/29(a) | | |
WEPA Hygieneprodukte GmbH, 5.63%, 01/15/31(a) | | |
| | |
| | |
| | |
| | |
| | |
| | |
| | |
| | |
| | |
| | |
|
ZF North America Capital Inc. | | |
| | |
| | |
| | |
| | |
|
| | |
2.50%, 03/23/28, (1-year EUR Swap + 2.849%)(a)(b) | | |
7.50%, 06/16/27, (1-year EUR Swap + 5.084%)(a)(b) | | |
Alpha Services and Holdings SA, 5.50%, 06/11/31, (5-year EUR Swap + 5.823%)(a)(b) | | |
Eurobank Ergasias Services and Holdings SA, 10.00%, 12/06/32, (5-year EUR Swap + 7.588%)(a)(b) | | |
Metlen Energy & Metals SA, 4.00%, 10/17/29(a) | | |
National Bank of Greece SA, 5.88%, 06/28/35, (5-year EURIBOR ICE Swap + 3.154%)(a)(b) | | |
| | |
5.00%, 04/16/30, (1-year EURIBOR ICE Swap + 2.245%)(a)(b) | | |
6.75%, 12/05/29, (1-year EUR Swap + 3.837%)(a)(b) | | |
8.25%, 01/28/27, (1-year EUR Swap + 5.715%)(a)(b) | | |
| | |
| | |
| | |
| | |
|
FWD Group Holdings Ltd., 8.40%, 04/05/29(c) | | |
Melco Resorts Finance Ltd. | | |
| | |
| | |
| | |
| | |
| | |
| | |
|
Ardagh Packaging Finance PLC/Ardagh Holdings USA Inc., 5.25%, 08/15/27(c) | | |
C&W Senior Finance Ltd., 6.88%, 09/15/27(c) | | |
eircom Finance DAC, 3.50%, 05/15/26(a) | | |
Energia Group Roi Financeco DAC, 6.88%, 07/31/28(a) | | |
| | |
| | |
| | |
| | |
| | |
| | |
| | |
|
Energian Israel Finance Ltd. | | |
| | |
| | |
| | |
| | |
412024 iShares Annual Financial Statements and Additional Information
Schedule of Investments (continued)October 31, 2024
iShares® US & Intl High Yield Corp Bond ETF(Percentages shown are based on Net Assets)
| | |
|
| | |
| | |
| | |
Teva Pharmaceutical Finance Netherlands II BV | | |
| | |
| | |
| | |
| | |
Teva Pharmaceutical Finance Netherlands III BV | | |
| | |
| | |
| | |
| | |
| | |
| | |
| | |
|
Almaviva-The Italian Innovation Co. SpA, 5.00%, 10/30/30(a) | | |
Banca IFIS SpA, 6.13%, 01/19/27(a) | | |
Banca Monte dei Paschi di Siena SpA | | |
4.75%, 03/15/29, (3-mo. EURIBOR + 2.047%)(a)(b) | | |
| | |
Banca Popolare di Sondrio SpA, 3.88%, 02/25/32, (5-year EUR Swap + 3.958%)(a)(b) | | |
| | |
2.88%, 06/29/31, (5-year EUR Swap + 3.170%)(a)(b) | | |
3.25%, 01/14/31, (5-year EUR Swap + 3.800%)(a)(b) | | |
BFF Bank SpA, 4.88%, 03/30/28, (1-year EURIBOR ICE Swap + 2.622%)(a)(b) | | |
| | |
5.75%, 09/11/29, (3-mo. EURIBOR + 2.600%)(a)(b) | | |
6.13%, 02/01/28, (3-mo. EURIBOR + 3.600%)(a)(b) | | |
Cerved Group SpA, 6.00%, 02/15/29(a) | | |
doValue SpA, 3.38%, 07/31/26(a) | | |
Engineering - Ingegneria Informatica - SpA, 5.88%, 09/30/26(a) | | |
Fiber Bidco SpA, 6.13%, 06/15/31(a) | | |
Flos B&b Italia SpA, 10.00%, 11/15/28(a) | | |
Guala Closures SpA, 3.25%, 06/15/28(a) | | |
Iccrea Banca SpA, 4.75%, 01/18/32, (5-year EURIBOR ICE Swap + 4.829%)(a)(b) | | |
Illimity Bank SpA, 5.75%, 05/31/27(a) | | |
IMA Industria Macchine Automatiche SpA, 3.75%, 01/15/28(a) | | |
Infrastrutture Wireless Italiane SpA | | |
| | |
| | |
| | |
| | |
| | |
| | |
4.20%, 06/01/32, (1-year CMT + 2.600%)(b)(c) | | |
| | |
| | |
Lottomatica SpA/Roma, 5.38%, 06/01/30(a) | | |
| | |
|
| | |
| | |
| | |
| | |
| | |
| | |
| | |
| | |
| | |
| | |
| | |
Series 2036, 7.20%, Series 2036, 07/18/36(c) | | |
Rossini SARL, 6.75%, 12/31/29(a) | | |
Saipem Finance International BV, 3.13%, 03/31/28(a) | | |
Telecom Italia SpA, 7.88%, 07/31/28(a) | | |
Telecom Italia SpA/Milano | | |
| | |
| | |
| | |
| | |
2.73%, 01/15/32, (5-year EUR Swap + 2.800%)(a)(b) | | |
5.46%, 06/30/35, (5-year CMT + 4.750%)(b)(c) | | |
5.86%, 06/19/32, (5-year USD ICE Swap + 3.703%)(b)(c) | | |
7.30%, 04/02/34, (5-year USD ICE Swap + 4.914%)(b)(c) | | |
UnipolSai Assicurazioni SpA, 4.90%, 05/23/34(a) | | |
| | |
| | |
| | |
| | |
|
| | |
5.13%, (5-year CMT + 4.578%)(b)(c)(g) | | |
6.25%, (5-year CMT + 4.956%)(b)(c)(g) | | |
| | |
| | |
| | |
| | |
| | |
| | |
| | |
| | |
|
Aston Martin Capital Holdings Ltd. | | |
| | |
| | |
| | |
|
AccorInvest Group SA, 0.00%, 11/15/31(a) | | |
Albion Financing 1 SARL/Aggreko Holdings Inc., 6.13%, 10/15/26(c) | | |
Albion Financing 2 SARL, 8.75%, 04/15/27(c) | | |
| | |
| | |
| | |
| | |
Altice Finco SA, 4.75%, 01/15/28(a) | | |
Schedule of Investments42
Schedule of Investments (continued)October 31, 2024
iShares® US & Intl High Yield Corp Bond ETF(Percentages shown are based on Net Assets)
| | |
|
| | |
| | |
| | |
| | |
| | |
ARD Finance SA, 5.00%, 06/30/27, (5.00% Cash and 5.75% PIK)(a)(h) | | |
Cidron Aida Finco SARL, 5.00%, 04/01/28(a) | | |
Garfunkelux Holdco 3 SA, 6.75%, 11/01/25(a) | | |
Herens Midco SARL, 5.25%, 05/15/29(a) | | |
| | |
| | |
| | |
| | |
| | |
Intelsat Jackson Holdings SA, 6.50%, 03/15/30(c)(d) | | |
ION Trading Technologies SARL | | |
| | |
| | |
Kleopatra Holdings 2 SCA, 6.50%, 09/01/26(a) | | |
Loarre Investments SARL, 6.50%, 05/15/29(a) | | |
Matterhorn Telecom SA, 4.00%, 11/15/27(a) | | |
SES SA, 5.50%, 09/12/54, (5-year EURIBOR ICE Swap + 3.232%)(a)(b) | | |
Summer BC Holdco B SARL, 5.75%, 10/31/26(a) | | |
Vivion Investments SARL, 8.00%, 08/31/28, (6.50% Cash and 1.40% PIK)(a)(h) | | |
| | |
|
| | |
| | |
| | |
| | |
| | |
| | |
| | |
| | |
| | |
| | |
| | |
| | |
| | |
|
Boels Topholding BV, 5.75%, 05/15/30(a) | | |
Boost Newco Borrower LLC/GTCR W Dutch Finance Sub BV, 8.50%, 01/15/31(a) | | |
Flora Food Management BV, 6.88%, 07/02/29(a) | | |
Maxeda DIY Holding BV, 5.88%, 10/01/26(a) | | |
Nobian Finance BV, 3.63%, 07/15/26(a) | | |
Odido Holding BV, 3.75%, 01/15/29(a) | | |
| | |
| | |
| | |
Sigma Holdco BV, 5.75%, 05/15/26(a) | | |
Sunrise FinCo I BV, 4.88%, 07/15/31(c) | | |
Trivium Packaging Finance BV | | |
| | |
| | |
| | |
| | |
|
UPCB Finance VII Ltd., 3.63%, 06/15/29(a) | | |
Versuni Group BV, 3.13%, 06/15/28(a) | | |
VZ Secured Financing BV, 5.00%, 01/15/32(c) | | |
VZ Vendor Financing II BV, 2.88%, 01/15/29(a) | | |
| | |
| | |
| | |
| | |
| | |
| | |
| | |
| | |
| | |
|
Var Energi ASA, 7.86%, 11/15/83, (5-year EURIBOR ICE Swap + 4.765%)(a)(b) | | |
|
Transportes Aereos Portugueses SA, 5.13%, 11/15/29(a) | | |
|
Caixa Central de Credito Agricola Mutuo CRL, 2.50%, 11/05/26, (3-mo. EURIBOR + 2.600%)(a)(b) | | |
Caixa Economica Montepio Geral Caixa Economica Bancaria SA, 5.63%, 05/29/28, (3-mo. EURIBOR + 2.600%)(a)(b) | | |
| | |
1.50%, 03/14/82, (5-year EUR Swap + 1.888%)(a)(b) | | |
1.88%, 08/02/81, (5-year EUR Swap + 2.380%)(a)(b) | | |
4.63%, 09/16/54, (5-year EURIBOR ICE Swap + 2.395%)(a)(b) | | |
4.75%, 05/29/54, (5-year EURIBOR ICE Swap + 2.052%)(a)(b) | | |
5.94%, 04/23/83, (5-year EUR Swap + 3.184%)(a)(b) | | |
Novo Banco SA, 9.88%, 12/01/33, (5-year EUR Swap + 6.714%)(a)(b) | | |
| | |
|
| | |
| | |
| | |
| | |
| | |
|
Banco de Credito Social Cooperativo SA | | |
7.50%, 09/14/29, (1-year EURIBOR ICE Swap + 4.269%)(a)(b) | | |
8.00%, 09/22/26, (1-year EUR Swap + 5.619%)(a)(b) | | |
| | |
5.13%, 06/27/34, (5-year EURIBOR ICE Swap + 2.400%)(a)(b) | | |
6.00%, (5-year EUR Swap + 3.150%)(a)(b) | | |
Cirsa Finance International SARL | | |
| | |
| | |
432024 iShares Annual Financial Statements and Additional Information
Schedule of Investments (continued)October 31, 2024
iShares® US & Intl High Yield Corp Bond ETF(Percentages shown are based on Net Assets)
| | |
|
ContourGlobal Power Holdings SA, 2.75%, 01/01/26(a) | | |
eDreams ODIGEO SA, 5.50%, 07/15/27(a) | | |
Eroski S Coop, 10.63%, 04/30/29(a) | | |
| | |
| | |
| | |
Kaixo Bondco Telecom SA, 5.13%, 09/30/29(a) | | |
Lorca Telecom Bondco SA, 4.00%, 09/18/27(a) | | |
| | |
6.50%, 09/11/28, (1-year EUR Swap + 3.250%)(a)(b) | | |
7.25%, 11/15/27, (1-year EUR Swap + 4.250%)(a)(b) | | |
| | |
|
Assemblin Caverion Group AB, 6.25%, 07/01/30(a) | | |
Dometic Group AB, 2.00%, 09/29/28(a) | | |
Heimstaden AB, 4.25%, 03/09/26(a) | | |
| | |
| | |
| | |
| | |
| | |
| | |
| | |
| | |
| | |
| | |
| | |
| | |
Verisure Midholding AB, 5.25%, 02/15/29(a) | | |
| | |
| | |
| | |
| | |
|
| | |
| | |
| | |
VistaJet Malta Finance PLC/Vista Management Holding Inc. | | |
| | |
| | |
| | |
| | |
|
| | |
| | |
| | |
Alexandrite Monnet U.K. Holdco PLC, 10.50%, 05/15/29(a) | | |
Amber Finco PLC, 6.63%, 07/15/29(a) | | |
| | |
| | |
| | |
Ardonagh Group Finance Ltd., 8.88%, 02/15/32(c) | | |
B&M European Value Retail SA, 8.13%, 11/15/30(a) | | |
| | |
United Kingdom (continued) |
BCP V Modular Services Finance II PLC, 4.75%, 11/30/28(a) | | |
Bellis Acquisition Co. PLC, 8.13%, 05/14/30(a) | | |
Bellis Finco PLC, 4.00%, 02/16/27(a) | | |
Belron U.K. Finance PLC, 4.63%, 10/15/29(a) | | |
British Telecommunications PLC | | |
4.25%, 11/23/81, (5-year CMT + 2.985%)(b)(c) | | |
4.88%, 11/23/81, (5-year CMT + 3.493%)(b)(c) | | |
5.13%, 10/03/54, (5-year EURIBOR ICE Swap + 2.542%)(a)(b) | | |
8.38%, 12/20/83, (5-year GUK + 3.820%)(a)(b) | | |
Canary Wharf Group Investment Holdings PLC, 2.63%, 04/23/25(a) | | |
Centrica PLC, 6.50%, 05/21/55, (5-year GUK + 2.512%)(a)(b) | | |
Connect Finco SARL/Connect U.S. Finco LLC, 9.00%, 09/15/29(c) | | |
Constellation Automotive Financing PLC, 4.88%, 07/15/27(a) | | |
Deuce Finco PLC, 5.50%, 06/15/27(a) | | |
Edge Finco PLC, 8.13%, 08/15/31(a) | | |
eG Global Finance PLC, 12.00%, 11/30/28(c) | | |
Global Auto Holdings Ltd./AAG FH U.K. Ltd., 8.38%, 01/15/29(c) | | |
Heathrow Finance PLC, 3.88%, 03/01/27(a)(i) | | |
Howden U.K. Refinance PLC/Howden U.K. Refinance 2 PLC/Howden U.S. Refinance LLC | | |
| | |
| | |
Iceland Bondco PLC, 10.88%, 12/15/27(a) | | |
INEOS Quattro Finance 2 PLC | | |
| | |
| | |
Jaguar Land Rover Automotive PLC | | |
| | |
| | |
| | |
| | |
Jerrold Finco PLC, 5.25%, 01/15/27(a) | | |
Kier Group PLC, 9.00%, 02/15/29(a) | | |
Market Bidco Finco PLC, 5.50%, 11/04/27(a) | | |
Merlin Entertainments Group U.S. Holdings Inc., 7.38%, 02/15/31(c) | | |
Merlin Entertainments Ltd., 5.75%, 06/15/26(c) | | |
Motion Bondco DAC, 6.63%, 11/15/27(c) | | |
Motion Finco SARL, 7.38%, 06/15/30(a) | | |
NGG Finance PLC, 2.13%, 09/05/82, (5-year EUR Swap + 2.532%)(a)(b) | | |
Nomad Foods Bondco PLC, 2.50%, 06/24/28(a) | | |
Ocado Group PLC, 3.88%, 10/08/26(a) | | |
Odeon Finco PLC, 12.75%, 11/01/27(c) | | |
PeopleCert Wisdom Issuer PLC, 5.75%, 09/15/26(a) | | |
Playtech PLC, 5.88%, 06/28/28(a) | | |
Punch Finance PLC, 6.13%, 06/30/26(a) | | |
Sherwood Financing PLC, 4.50%, 11/15/26(a) | | |
Thames Water Utilities Finance PLC | | |
| | |
| | |
| | |
| | |
Schedule of Investments44
Schedule of Investments (continued)October 31, 2024
iShares® US & Intl High Yield Corp Bond ETF(Percentages shown are based on Net Assets)
| | |
United Kingdom (continued) |
| | |
TVL Finance PLC, 10.25%, 04/28/28(a) | | |
Very Group Funding PLC (The), 6.50%, 08/01/26(a) | | |
Victoria PLC, 3.63%, 08/24/26(a) | | |
Virgin Media Finance PLC, 5.00%, 07/15/30(c) | | |
Virgin Media Secured Finance PLC | | |
| | |
| | |
| | |
| | |
Virgin Media Vendor Financing Notes III DAC, 4.88%, 07/15/28(a) | | |
Virgin Media Vendor Financing Notes IV DAC, 5.00%, 07/15/28(c) | | |
Vmed O2 U.K. Financing I PLC | | |
| | |
| | |
| | |
| | |
| | |
| | |
2.63%, 08/27/80, (5-year EUR Swap + 3.002%)(a)(b) | | |
3.00%, 08/27/80, (5-year EUR Swap + 3.477%)(a)(b) | | |
3.25%, 06/04/81, (5-year CMT + 2.447%)(b) | | |
4.13%, 06/04/81, (5-year CMT + 2.767%)(b)(d) | | |
6.50%, 08/30/84, (5-year EUR Swap + 3.489%)(a)(b) | | |
7.00%, 04/04/79, (5-year USD Swap + 4.873%)(b) | | |
8.00%, 08/30/86, (5-year GUK + 3.837%)(a)(b) | | |
Zegona Finance PLC, 6.75%, 07/15/29(a) | | |
| | |
|
Acrisure LLC/Acrisure Finance Inc. | | |
| | |
| | |
| | |
| | |
| | |
| | |
| | |
| | |
Adient Global Holdings Ltd. | | |
| | |
| | |
| | |
ADT Security Corp. (The), 4.13%, 08/01/29(c) | | |
Advance Auto Parts Inc., 3.90%, 04/15/30 | | |
AES Corp. (The), 7.60%, 01/15/55, (5-year CMT + 3.201%)(b) | | |
Aethon United BR LP/Aethon United Finance Corp., 7.50%, 10/01/29(c) | | |
AG Issuer LLC, 6.25%, 03/01/28(c) | | |
AG TTMT Escrow Issuer LLC, 8.63%, 09/30/27(c)(d) | | |
Albertsons Companies Inc./Safeway Inc./New Albertsons LP/Albertsons LLC | | |
| | |
| | |
United States (continued) |
| | |
| | |
| | |
| | |
| | |
| | |
Alcoa Nederland Holding BV | | |
| | |
| | |
| | |
Alliant Holdings Intermediate LLC/Alliant Holdings Co-Issuer | | |
| | |
| | |
| | |
| | |
| | |
| | |
| | |
Allied Universal Holdco LLC, 7.88%, 02/15/31(c) | | |
Allied Universal Holdco LLC/Allied Universal Finance Corp. | | |
| | |
| | |
Allied Universal Holdco LLC/Allied Universal Finance Corp./Atlas Luxco 4 SARL | | |
| | |
| | |
Allison Transmission Inc. | | |
| | |
| | |
| | |
Ally Financial Inc., 6.70%, 02/14/33(d) | | |
Alpha Generation LLC, 6.75%, 10/15/32(c) | | |
AMC Entertainment Holdings Inc. | | |
| | |
10.00%, 06/15/26, (10.00% Cash or 12.00% PIK)(c)(h) | | |
| | |
| | |
| | |
Amentum Holdings Inc., 7.25%, 08/01/32(c) | | |
| | |
| | |
| | |
American Airlines Inc./AAdvantage Loyalty IP Ltd. | | |
| | |
| | |
American Axle & Manufacturing Inc. | | |
| | |
| | |
| | |
American Builders & Contractors Supply Co. Inc. | | |
| | |
| | |
AmeriGas Partners LP/AmeriGas Finance Corp. | | |
| | |
| | |
| | |
452024 iShares Annual Financial Statements and Additional Information
Schedule of Investments (continued)October 31, 2024
iShares® US & Intl High Yield Corp Bond ETF(Percentages shown are based on Net Assets)
| | |
United States (continued) |
| | |
| | |
| | |
Antero Midstream Partners LP/Antero Midstream Finance Corp. | | |
| | |
| | |
| | |
| | |
| | |
| | |
| | |
Anywhere Real Estate Group LLC/Anywhere Co-Issuer Corp., 7.00%, 04/15/30(c)(d) | | |
Anywhere Real Estate Group LLC/Realogy Co-Issuer Corp. | | |
| | |
| | |
Aramark Services Inc., 5.00%, 02/01/28(c) | | |
| | |
| | |
| | |
Archrock Partners LP/Archrock Partners Finance Corp. | | |
| | |
| | |
| | |
Arcosa Inc., 6.88%, 08/15/32(c) | | |
Ardagh Metal Packaging Finance USA LLC/Ardagh Metal Packaging Finance PLC | | |
| | |
| | |
| | |
| | |
Ardagh Packaging Finance PLC/Ardagh Holdings USA Inc. | | |
| | |
| | |
| | |
| | |
| | |
| | |
| | |
| | |
| | |
| | |
Asbury Automotive Group Inc. | | |
| | |
| | |
| | |
| | |
Ascent Resources Utica Holdings LLC/ARU Finance Corp. | | |
| | |
| | |
| | |
Ashland Services BV, 2.00%, 01/30/28(a) | | |
Ashton Woods USA LLC/Ashton Woods Finance Co., 4.63%, 04/01/30(c) | | |
| | |
United States (continued) |
ASP Unifrax Holdings Inc. | | |
7.10%, 09/30/29, (5.85% cash and 1.25% PIK)(c)(h) | | |
11.18%, 09/30/29, (10.43% cash and 11.18% PIK)(c)(h) | | |
| | |
| | |
| | |
AthenaHealth Group Inc., 6.50%, 02/15/30(c) | | |
ATI Inc., 7.25%, 08/15/30(d) | | |
| | |
| | |
| | |
| | |
Avient Corp., 6.25%, 11/01/31(c) | | |
Avis Budget Car Rental LLC/Avis Budget Finance Inc. | | |
| | |
| | |
| | |
| | |
| | |
Avis Budget Finance PLC, 7.00%, 02/28/29(a) | | |
Axalta Coating Systems Dutch Holding B BV, 7.25%, 02/15/31(c) | | |
Axalta Coating Systems LLC, 3.38%, 02/15/29(c) | | |
Axalta Coating Systems LLC/Axalta Coating Systems Dutch Holding B BV, 4.75%, 06/15/27(c) | | |
| | |
| | |
| | |
| | |
| | |
| | |
| | |
| | |
| | |
| | |
| | |
| | |
Bausch & Lomb Corp., 8.38%, 10/01/28(c) | | |
Bausch Health Companies Inc. | | |
| | |
| | |
| | |
| | |
| | |
| | |
| | |
| | |
| | |
BCPE Ulysses Intermediate Inc., 7.75%, 04/01/27, (7.75% PIK)(c)(d)(h) | | |
Beacon Roofing Supply Inc., 6.50%, 08/01/30(c) | | |
Belden Inc., 3.38%, 07/15/31(a) | | |
Berry Global Inc., 5.63%, 07/15/27(c)(d) | | |
| | |
| | |
| | |
| | |
Schedule of Investments46
Schedule of Investments (continued)October 31, 2024
iShares® US & Intl High Yield Corp Bond ETF(Percentages shown are based on Net Assets)
| | |
United States (continued) |
Blue Racer Midstream LLC/Blue Racer Finance Corp. | | |
| | |
| | |
Boost Newco Borrower LLC, 7.50%, 01/15/31(c) | | |
| | |
| | |
| | |
Brand Industrial Services Inc., 10.38%, 08/01/30(c) | | |
Brandywine Operating Partnership LP | | |
| | |
| | |
Brightline East LLC, 11.00%, 01/31/30(c) | | |
| | |
| | |
| | |
| | |
Brookfield Property Finance ULC | | |
| | |
| | |
Brookfield Property REIT Inc./BPR Cumulus LLC/BPR Nimbus LLC/GGSI Sellco LLC | | |
| | |
| | |
| | |
| | |
| | |
| | |
| | |
Builders FirstSource Inc. | | |
| | |
| | |
| | |
| | |
Burford Capital Global Finance LLC | | |
| | |
| | |
Caesars Entertainment Inc. | | |
| | |
| | |
| | |
| | |
California Resources Corp., 8.25%, 06/15/29(c) | | |
| | |
| | |
| | |
| | |
| | |
| | |
| | |
Camelot Return Merger Sub Inc., 8.75%, 08/01/28(c)(d) | | |
Carnival Holdings Bermuda Ltd., 10.38%, 05/01/28(c) | | |
Carnival PLC, 1.00%, 10/28/29 | | |
| | |
12.00%, 12/01/28, (12.00% PIK)(c)(h) | | |
13.00%, 06/01/30, (13.00% PIK)(c)(h) | | |
14.00%, 06/01/31, (14.00% PIK)(c)(h) | | |
| | |
United States (continued) |
Catalent Pharma Solutions Inc. | | |
| | |
| | |
| | |
| | |
CCO Holdings LLC/CCO Holdings Capital Corp. | | |
| | |
| | |
| | |
| | |
| | |
| | |
| | |
| | |
| | |
| | |
| | |
| | |
| | |
Cedar Fair LP/Canada's Wonderland Co./Magnum Management Corp./Millennium Op | | |
| | |
| | |
| | |
| | |
| | |
Central Parent Inc./CDK Global Inc., 7.25%, 06/15/29(c) | | |
Central Parent LLC/CDK Global II LLC/CDK Financing Co. Inc., 8.00%, 06/15/29(c) | | |
| | |
| | |
| | |
Charles River Laboratories International Inc. | | |
| | |
| | |
| | |
| | |
| | |
| | |
| | |
| | |
| | |
| | |
CHS/Community Health Systems Inc. | | |
| | |
| | |
| | |
| | |
| | |
| | |
| | |
| | |
| | |
| | |
| | |
| | |
| | |
| | |
472024 iShares Annual Financial Statements and Additional Information
Schedule of Investments (continued)October 31, 2024
iShares® US & Intl High Yield Corp Bond ETF(Percentages shown are based on Net Assets)
| | |
United States (continued) |
| | |
| | |
| | |
| | |
| | |
| | |
| | |
| | |
| | |
| | |
| | |
| | |
Clarios Global LP/Clarios U.S. Finance Co. | | |
| | |
| | |
| | |
| | |
Clarivate Science Holdings Corp. | | |
| | |
| | |
| | |
| | |
| | |
Clear Channel Outdoor Holdings Inc. | | |
| | |
| | |
| | |
| | |
| | |
Clearway Energy Operating LLC | | |
| | |
| | |
| | |
| | |
| | |
| | |
| | |
| | |
Cloud Software Group Inc. | | |
| | |
| | |
| | |
Clydesdale Acquisition Holdings Inc. | | |
| | |
| | |
| | |
CMG Media Corp., 8.88%, 12/15/27(c) | | |
| | |
| | |
| | |
| | |
Cogent Communications Group LLC | | |
| | |
| | |
| | |
| | |
| | |
| | |
| | |
| | |
| | |
| | |
United States (continued) |
| | |
CommScope Technologies LLC, 5.00%, 03/15/27(c) | | |
Compass Group Diversified Holdings LLC, 5.25%, 04/15/29(c) | | |
| | |
| | |
| | |
| | |
Consolidated Communications Inc. | | |
| | |
| | |
| | |
| | |
| | |
Cornerstone Building Brands Inc., 9.50%, 08/15/29(c) | | |
| | |
| | |
| | |
| | |
Coty Inc./HFC Prestige Products Inc./HFC Prestige International U.S. LLC | | |
| | |
| | |
CQP Holdco LP/BIP-V Chinook Holdco LLC | | |
| | |
| | |
| | |
| | |
| | |
Crescent Energy Finance LLC | | |
| | |
| | |
| | |
Crown Americas LLC, 5.25%, 04/01/30 | | |
Crown Americas LLC/Crown Americas Capital Corp. V, 4.25%, 09/30/26 | | |
Crown Americas LLC/Crown Americas Capital Corp. VI, 4.75%, 02/01/26 | | |
Crown European Holdings SACA | | |
| | |
| | |
| | |
| | |
| | |
| | |
| | |
| | |
| | |
| | |
| | |
| | |
| | |
| | |
| | |
| | |
Cushman & Wakefield U.S. Borrower LLC | | |
| | |
| | |
Schedule of Investments48
Schedule of Investments (continued)October 31, 2024
iShares® US & Intl High Yield Corp Bond ETF(Percentages shown are based on Net Assets)
| | |
United States (continued) |
| | |
| | |
| | |
Dana Financing Luxembourg SARL, 8.50%, 07/15/31(a) | | |
| | |
| | |
| | |
| | |
Darling Global Finance BV, 3.63%, 05/15/26(a) | | |
| | |
| | |
| | |
| | |
| | |
| | |
| | |
Delek Logistics Partners LP/Delek Logistics Finance Corp. | | |
| | |
| | |
Directv Financing LLC, 8.88%, 02/01/30(c)(d) | | |
Directv Financing LLC/Directv Financing Co-Obligor Inc., 5.88%, 08/15/27(c) | | |
| | |
| | |
| | |
| | |
| | |
| | |
DISH Network Corp., 11.75%, 11/15/27(c) | | |
Diversified Healthcare Trust | | |
| | |
| | |
DPL Inc., 4.35%, 04/15/29 | | |
| | |
| | |
| | |
Edgewell Personal Care Co. | | |
| | |
| | |
| | |
7.88%, 06/15/54, (5-year CMT + 3.658%)(b) | | |
8.13%, 06/15/53, (5-year CMT + 3.864%)(b) | | |
EMRLD Borrower LP/Emerald Co-Issuer Inc. | | |
| | |
| | |
| | |
Encino Acquisition Partners Holdings LLC | | |
| | |
| | |
| | |
| | |
| | |
| | |
Encore Capital Group Inc. | | |
| | |
| | |
| | |
Endo Finance Holdings Inc., 8.50%, 04/15/31(c)(d) | | |
| | |
United States (continued) |
Energizer Gamma Acquisition BV, 3.50%, 06/30/29(a) | | |
| | |
| | |
| | |
| | |
7.13%, 10/01/54, (5-year CMT + 2.829%)(b) | | |
8.00%, 05/15/54, (5-year CMT + 4.020%)(b) | | |
| | |
| | |
| | |
| | |
| | |
EQM Midstream Partners LP | | |
| | |
| | |
| | |
| | |
| | |
| | |
| | |
| | |
| | |
| | |
| | |
| | |
EUSHI Finance Inc., 7.63%, 12/15/54, (5-year CMT + 3.136%)(b)(c) | | |
| | |
| | |
| | |
| | |
| | |
| | |
Ferrellgas LP/Ferrellgas Finance Corp. | | |
| | |
| | |
Fertitta Entertainment LLC/Fertitta Entertainment Finance Co. Inc. | | |
| | |
| | |
| | |
| | |
| | |
| | |
Focus Financial Partners LLC, 6.75%, 09/15/31(c) | | |
Fortress Transportation and Infrastructure Investors LLC | | |
| | |
| | |
| | |
| | |
| | |
| | |
| | |
| | |
| | |
| | |
Freedom Mortgage Holdings LLC | | |
| | |
| | |
492024 iShares Annual Financial Statements and Additional Information
Schedule of Investments (continued)October 31, 2024
iShares® US & Intl High Yield Corp Bond ETF(Percentages shown are based on Net Assets)
| | |
United States (continued) |
Frontier Communications Holdings LLC | | |
| | |
| | |
| | |
| | |
| | |
| | |
| | |
| | |
| | |
| | |
| | |
| | |
| | |
| | |
| | |
| | |
Genesis Energy LP/Genesis Energy Finance Corp. | | |
| | |
| | |
| | |
| | |
| | |
| | |
| | |
| | |
Glatfelter Corp., 7.25%, 11/15/31(c) | | |
| | |
4.70%, 10/15/51, (5-year CMT + 3.796%)(b)(c) | | |
7.95%, 10/15/54, (5-year CMT + 3.608%)(b)(c) | | |
Global Partners LP/GLP Finance Corp. | | |
| | |
| | |
Go Daddy Operating Co. LLC/GD Finance Co. Inc. | | |
| | |
| | |
Goodyear Europe BV, 2.75%, 08/15/28(a) | | |
Goodyear Tire & Rubber Co. (The) | | |
| | |
| | |
| | |
| | |
| | |
| | |
Graphic Packaging International LLC | | |
| | |
| | |
| | |
| | |
| | |
| | |
| | |
| | |
| | |
| | |
| | |
H&E Equipment Services Inc., 3.88%, 12/15/28(c) | | |
| | |
| | |
| | |
| | |
United States (continued) |
| | |
| | |
| | |
| | |
| | |
| | |
| | |
| | |
| | |
| | |
Hess Midstream Operations LP | | |
| | |
| | |
| | |
| | |
| | |
Hilcorp Energy I LP/Hilcorp Finance Co. | | |
| | |
| | |
| | |
| | |
| | |
| | |
| | |
| | |
Hillenbrand Inc., 6.25%, 02/15/29 | | |
Hilton Domestic Operating Co. Inc. | | |
| | |
| | |
| | |
| | |
| | |
| | |
| | |
| | |
Hilton Grand Vacations Borrower Escrow LLC/Hilton Grand Vacations Borrower Esc | | |
| | |
| | |
| | |
Hilton Worldwide Finance LLC/Hilton Worldwide Finance Corp., 4.88%, 04/01/27(d) | | |
HLF Financing SARL LLC/Herbalife International Inc. | | |
| | |
| | |
| | |
| | |
| | |
Howard Hughes Corp. (The) | | |
| | |
| | |
| | |
Howard Midstream Energy Partners LLC | | |
| | |
| | |
| | |
| | |
| | |
| | |
Schedule of Investments50
Schedule of Investments (continued)October 31, 2024
iShares® US & Intl High Yield Corp Bond ETF(Percentages shown are based on Net Assets)
| | |
United States (continued) |
Hudson Pacific Properties LP | | |
| | |
| | |
| | |
Hughes Satellite Systems Corp. | | |
| | |
| | |
Icahn Enterprises LP/Icahn Enterprises Finance Corp. | | |
| | |
| | |
| | |
| | |
| | |
IGT Lottery Holdings BV, 4.25%, 03/15/30(a) | | |
iHeartCommunications Inc. | | |
| | |
| | |
| | |
| | |
Imola Merger Corp., 4.75%, 05/15/29(c) | | |
International Game Technology PLC | | |
| | |
| | |
| | |
| | |
| | |
| | |
| | |
| | |
| | |
| | |
| | |
| | |
| | |
| | |
| | |
| | |
| | |
| | |
| | |
Iron Mountain Information Management Services Inc., 5.00%, 07/15/32(c) | | |
ITT Holdings LLC, 6.50%, 08/01/29(c) | | |
Jane Street Group/JSG Finance Inc. | | |
| | |
| | |
Jazz Securities DAC, 4.38%, 01/15/29(c) | | |
Jefferies Finance LLC/JFIN Co-Issuer Corp., 5.00%, 08/15/28(c) | | |
JetBlue Airways Corp./JetBlue Loyalty LP, 9.88%, 09/20/31(c) | | |
| | |
| | |
| | |
KeHE Distributors LLC/KeHE Finance Corp./NextWave Distribution Inc., 9.00%, 02/15/29(c) | | |
| | |
| | |
| | |
| | |
United States (continued) |
| | |
KFC Holding Co./Pizza Hut Holdings LLC/Taco Bell of America LLC, 4.75%, 06/01/27(c) | | |
| | |
| | |
| | |
| | |
| | |
| | |
| | |
| | |
Ladder Capital Finance Holdings LLLP/Ladder Capital Finance Corp. | | |
| | |
| | |
| | |
| | |
| | |
| | |
| | |
| | |
Lamb Weston Holdings Inc. | | |
| | |
| | |
| | |
LBM Acquisition LLC, 6.25%, 01/15/29(c)(d) | | |
LCM Investments Holdings II LLC | | |
| | |
| | |
LCPR Senior Secured Financing DAC | | |
| | |
| | |
| | |
| | |
| | |
| | |
| | |
| | |
| | |
| | |
| | |
Levi Strauss & Co., 3.38%, 03/15/27 | | |
Liberty Mutual Group Inc. | | |
4.13%, 12/15/51, (5-year CMT + 3.315%)(b)(c) | | |
| | |
| | |
| | |
| | |
| | |
| | |
| | |
| | |
| | |
| | |
Light & Wonder International Inc. | | |
| | |
| | |
| | |
Lightning Power LLC, 7.25%, 08/15/32(c) | | |
| | |
| | |
512024 iShares Annual Financial Statements and Additional Information
Schedule of Investments (continued)October 31, 2024
iShares® US & Intl High Yield Corp Bond ETF(Percentages shown are based on Net Assets)
| | |
United States (continued) |
| | |
| | |
Live Nation Entertainment Inc. | | |
| | |
| | |
| | |
Lumen Technologies Inc., 10.00%, 10/15/32(c)(d) | | |
Macy's Retail Holdings LLC | | |
| | |
| | |
| | |
| | |
| | |
| | |
| | |
| | |
| | |
| | |
Match Group Holdings II LLC | | |
| | |
| | |
| | |
| | |
Mauser Packaging Solutions Holding Co. | | |
| | |
| | |
McAfee Corp., 7.38%, 02/15/30(c)(d) | | |
McGraw-Hill Education Inc. | | |
| | |
| | |
| | |
| | |
| | |
| | |
Medline Borrower LP/Medline Co-Issuer Inc., 6.25%, 04/01/29(c) | | |
MGM Resorts International | | |
| | |
| | |
| | |
| | |
| | |
Michaels Companies Inc. (The) | | |
| | |
| | |
Midcap Financial Issuer Trust | | |
| | |
| | |
Miter Brands Acquisition Holdco Inc./MIWD Borrower LLC, 6.75%, 04/01/32(c) | | |
MIWD Holdco II LLC/MIWD Finance Corp., 5.50%, 02/01/30(c)(d) | | |
Mohegan Tribal Gaming Authority, 8.00%, 02/01/26(c) | | |
| | |
| | |
| | |
| | |
MPH Acquisition Holdings LLC | | |
| | |
| | |
| | |
United States (continued) |
MPT Operating Partnership LP/MPT Finance Corp. | | |
| | |
| | |
| | |
| | |
| | |
Murphy Oil Corp., 6.00%, 10/01/32 | | |
| | |
| | |
| | |
| | |
| | |
| | |
| | |
Nationstar Mortgage Holdings Inc. | | |
| | |
| | |
| | |
| | |
| | |
| | |
| | |
| | |
| | |
| | |
| | |
| | |
| | |
| | |
| | |
| | |
| | |
| | |
| | |
| | |
NCL Finance Ltd., 6.13%, 03/15/28(c)(d) | | |
NCR Atleos Corp., 9.50%, 04/01/29(c) | | |
| | |
| | |
| | |
Neptune Bidco U.S. Inc., 9.29%, 04/15/29(c) | | |
| | |
| | |
| | |
| | |
| | |
| | |
| | |
| | |
Newfold Digital Holdings Group Inc. | | |
| | |
| | |
| | |
| | |
| | |
| | |
| | |
| | |
NextEra Energy Operating Partners LP | | |
| | |
| | |
Schedule of Investments52
Schedule of Investments (continued)October 31, 2024
iShares® US & Intl High Yield Corp Bond ETF(Percentages shown are based on Net Assets)
| | |
United States (continued) |
| | |
NGL Energy Operating LLC/NGL Energy Finance Corp. | | |
| | |
| | |
NMG Holding Co. Inc./Neiman Marcus Group LLC, 8.50%, 04/01/26(c) | | |
Noble Finance II LLC, 8.00%, 04/15/30(c) | | |
| | |
| | |
| | |
| | |
| | |
| | |
| | |
| | |
| | |
| | |
Novelis Sheet Ingot GmbH, 3.38%, 04/15/29(a) | | |
| | |
| | |
| | |
| | |
| | |
| | |
| | |
| | |
| | |
| | |
| | |
| | |
| | |
| | |
| | |
| | |
| | |
| | |
| | |
| | |
Olympus Water U.S. Holding Corp. | | |
| | |
| | |
| | |
| | |
| | |
| | |
| | |
| | |
| | |
| | |
| | |
| | |
| | |
| | |
| | |
| | |
Organon & Co./Organon Foreign Debt Co-Issuer BV | | |
| | |
| | |
| | |
| | |
United States (continued) |
| | |
| | |
Outfront Media Capital LLC/Outfront Media Capital Corp. | | |
| | |
| | |
| | |
| | |
| | |
| | |
| | |
Owens-Brockway Glass Container Inc. | | |
| | |
| | |
Pactiv Evergreen Group Issuer Inc./Pactiv Evergreen Group Issuer LLC, 4.00%, 10/15/27(c)(d) | | |
Pactiv Evergreen Group Issuer LLC/Pactiv Evergreen Group Issuer Inc., 4.38%, 10/15/28(c) | | |
Panther Escrow Issuer LLC, 7.13%, 06/01/31(c) | | |
| | |
6.25%, 02/28/57, (3-mo. LIBOR US + 3.899%)(b) | | |
6.38%, 03/30/62, (5-year CMT + 3.999%)(b)(d) | | |
Park Intermediate Holdings LLC/PK Domestic Property LLC/PK Finance Co-Issuer | | |
| | |
| | |
| | |
PBF Holding Co. LLC/PBF Finance Corp. | | |
| | |
| | |
PennyMac Financial Services Inc. | | |
| | |
| | |
| | |
| | |
Performance Food Group Inc. | | |
| | |
| | |
| | |
Permian Resources Operating LLC | | |
| | |
| | |
| | |
| | |
| | |
Perrigo Finance Unlimited Co. | | |
| | |
| | |
| | |
PetSmart Inc./PetSmart Finance Corp. | | |
| | |
| | |
| | |
| | |
| | |
7.38%, 03/15/55, (5-year CMT + 3.883%)(b) | | |
532024 iShares Annual Financial Statements and Additional Information
Schedule of Investments (continued)October 31, 2024
iShares® US & Intl High Yield Corp Bond ETF(Percentages shown are based on Net Assets)
| | |
United States (continued) |
| | |
| | |
| | |
| | |
| | |
| | |
| | |
| | |
| | |
| | |
| | |
| | |
| | |
| | |
| | |
| | |
| | |
| | |
| | |
Premier Entertainment Sub LLC/Premier Entertainment Finance Corp. | | |
| | |
| | |
| | |
| | |
| | |
Prime Healthcare Services Inc., 9.38%, 09/01/29(c) | | |
Prime Security Services Borrower LLC/Prime Finance Inc. | | |
| | |
| | |
| | |
PTC Inc., 4.00%, 02/15/28(c) | | |
QVC Inc., 6.88%, 04/15/29(c)(d) | | |
Radiate Holdco LLC/Radiate Finance Inc. | | |
| | |
| | |
| | |
7.78%, 01/31/29, (4.28% Cash and 3.50% PIK)(c)(d)(h) | | |
9.78%, 02/15/30, (9.78% PIK)(c)(h) | | |
| | |
| | |
| | |
Raven Acquisition Holdings LLC, 6.88%, 11/15/31(c) | | |
Resorts World Las Vegas LLC/RWLV Capital Inc. | | |
| | |
| | |
| | |
| | |
| | |
RHP Hotel Properties LP/RHP Finance Corp. | | |
| | |
| | |
| | |
| | |
Rithm Capital Corp., 8.00%, 04/01/29(c) | | |
| | |
| | |
| | |
United States (continued) |
| | |
ROBLOX Corp., 3.88%, 05/01/30(c) | | |
Rocket Mortgage LLC/Rocket Mortgage Co-Issuer Inc. | | |
| | |
| | |
| | |
| | |
| | |
| | |
| | |
Rockies Express Pipeline LLC, 4.95%, 07/15/29(c) | | |
| | |
| | |
| | |
Ryan Specialty LLC, 5.88%, 08/01/32(c) | | |
| | |
| | |
| | |
| | |
| | |
| | |
| | |
| | |
| | |
SCIL IV LLC/SCIL USA Holdings LLC, 9.50%, 07/15/28(a) | | |
Scotts Miracle-Gro Co. (The) | | |
| | |
| | |
| | |
Scripps Escrow II Inc., 3.88%, 01/15/29(c)(d) | | |
Scripps Escrow Inc., 5.88%, 07/15/27(c) | | |
| | |
| | |
| | |
| | |
| | |
| | |
| | |
| | |
| | |
| | |
Sealed Air Corp./Sealed Air Corp. U.S. | | |
| | |
| | |
Select Medical Corp., 6.25%, 08/15/26(c) | | |
| | |
| | |
| | |
Sensata Technologies Inc. | | |
| | |
| | |
| | |
Service Corp. International/U.S. | | |
| | |
| | |
| | |
| | |
| | |
Schedule of Investments54
Schedule of Investments (continued)October 31, 2024
iShares® US & Intl High Yield Corp Bond ETF(Percentages shown are based on Net Assets)
| | |
United States (continued) |
| | |
| | |
| | |
| | |
| | |
| | |
| | |
| | |
| | |
| | |
Shift4 Payments LLC/Shift4 Payments Finance Sub Inc., 6.75%, 08/15/32(c) | | |
Silgan Holdings Inc., 4.13%, 02/01/28(d) | | |
Sinclair Television Group Inc. | | |
| | |
| | |
| | |
| | |
| | |
| | |
| | |
| | |
| | |
Six Flags Entertainment Corp./DE | | |
| | |
| | |
Six Flags Entertainment Corp./Six Flags Theme Parks Inc., 6.63%, 05/01/32(c) | | |
| | |
| | |
| | |
| | |
| | |
Smyrna Ready Mix Concrete LLC | | |
| | |
| | |
| | |
| | |
| | |
Sotheby's, 7.38%, 10/15/27(c) | | |
| | |
| | |
| | |
| | |
| | |
| | |
| | |
Stagwell Global LLC, 5.63%, 08/15/29(c) | | |
Standard Industries Inc./New York | | |
| | |
| | |
| | |
| | |
| | |
| | |
| | |
| | |
| | |
Star Parent Inc., 9.00%, 10/01/30(c)(d) | | |
Starwood Property Trust Inc. | | |
| | |
| | |
United States (continued) |
| | |
| | |
| | |
| | |
| | |
| | |
Suburban Propane Partners LP/Suburban Energy Finance Corp., 5.00%, 06/01/31(c) | | |
Summit Materials LLC/Summit Materials Finance Corp. | | |
| | |
| | |
| | |
| | |
| | |
Sunoco LP/Sunoco Finance Corp. | | |
| | |
| | |
| | |
| | |
| | |
Synchrony Financial, 7.25%, 02/02/33 | | |
Talen Energy Supply LLC, 8.63%, 06/01/30(c) | | |
Tallgrass Energy Partners LP/Tallgrass Energy Finance Corp. | | |
| | |
| | |
| | |
| | |
| | |
| | |
| | |
| | |
Taylor Morrison Communities Inc. | | |
| | |
| | |
| | |
| | |
| | |
| | |
| | |
Teleflex Inc., 4.25%, 06/01/28(c) | | |
Tempur Sealy International Inc. | | |
| | |
| | |
| | |
| | |
| | |
| | |
| | |
| | |
| | |
| | |
| | |
Tenneco Inc., 8.00%, 11/17/28(c)(d) | | |
Terex Corp., 6.25%, 10/15/32(c) | | |
TerraForm Power Operating LLC | | |
| | |
| | |
552024 iShares Annual Financial Statements and Additional Information
Schedule of Investments (continued)October 31, 2024
iShares® US & Intl High Yield Corp Bond ETF(Percentages shown are based on Net Assets)
| | |
United States (continued) |
| | |
| | |
| | |
| | |
| | |
| | |
| | |
| | |
| | |
| | |
| | |
| | |
| | |
| | |
| | |
| | |
| | |
Transocean Titan Financing Ltd., 8.38%, 02/01/28(c) | | |
| | |
| | |
| | |
| | |
Tronox Inc., 4.63%, 03/15/29(c)(d) | | |
| | |
| | |
| | |
| | |
| | |
| | |
| | |
| | |
| | |
UGI International LLC, 2.50%, 12/01/29(a) | | |
UKG Inc., 6.88%, 02/01/31(c)(d) | | |
| | |
| | |
| | |
United Rentals North America Inc. | | |
| | |
| | |
| | |
| | |
| | |
| | |
| | |
| | |
United Wholesale Mortgage LLC | | |
| | |
| | |
| | |
Uniti Group LP/Uniti Fiber Holdings Inc./CSL Capital LLC, 6.00%, 01/15/30(c)(d) | | |
Uniti Group LP/Uniti Group Finance 2019 Inc./CSL Capital LLC | | |
| | |
| | |
| | |
Univision Communications Inc. | | |
| | |
| | |
| | |
United States (continued) |
| | |
| | |
| | |
USA Compression Partners LP/USA Compression Finance Corp. | | |
| | |
| | |
Valaris Ltd., 8.38%, 04/30/30(c) | | |
Vector Group Ltd., 10.50%, 11/01/26(c) | | |
Venture Global Calcasieu Pass LLC | | |
| | |
| | |
| | |
| | |
| | |
| | |
| | |
| | |
| | |
| | |
Veritas U.S. Inc./Veritas Bermuda Ltd., 7.50%, 09/01/25(c) | | |
| | |
| | |
| | |
| | |
| | |
| | |
| | |
| | |
ViaSat Inc., 5.63%, 04/15/27(c) | | |
| | |
| | |
| | |
| | |
Vistra Operations Co. LLC | | |
| | |
| | |
| | |
| | |
| | |
| | |
Vital Energy Inc., 7.88%, 04/15/32(c)(d) | | |
VOC Escrow Ltd., 5.00%, 02/15/28(c) | | |
Walgreens Boots Alliance Inc. | | |
| | |
| | |
| | |
| | |
Wand NewCo 3 Inc., 7.63%, 01/30/32(c) | | |
Weatherford International Ltd., 8.63%, 04/30/30(c) | | |
Wesco Aircraft Holdings Inc. | | |
| | |
9.00%, 11/15/26(c)(d)(e)(f) | | |
| | |
| | |
| | |
| | |
Western Digital Corp., 4.75%, 02/15/26 | | |
| | |
| | |
Schedule of Investments56
Schedule of Investments (continued)October 31, 2024
iShares® US & Intl High Yield Corp Bond ETF(Percentages shown are based on Net Assets)
| | |
United States (continued) |
| | |
| | |
Windstream Services LLC/Windstream Escrow Finance Corp. | | |
| | |
| | |
| | |
| | |
| | |
Wynn Resorts Finance LLC/Wynn Resorts Capital Corp. | | |
| | |
| | |
| | |
| | |
| | |
| | |
| | |
| | |
| | |
| | |
| | |
| | |
| | |
| | |
| | |
| | |
| | |
| | |
Total Corporate Bonds & Notes — 97.0%
(Cost: $146,706,299) | |
| | |
|
|
Office Properties Income Trust, NVS | | |
Total Common Stocks — 0.0%
(Cost: $0) | |
Total Long-Term Investments — 97.0%
(Cost: $146,706,299) | |
| | |
|
Money Market Funds — 13.5% |
BlackRock Cash Funds: Institutional, SL Agency Shares, 5.01%(j)(k)(l) | | |
BlackRock Cash Funds: Treasury, SL Agency Shares, 4.83%(j)(k) | | |
Total Short-Term Securities — 13.5%
(Cost: $19,992,041) | |
Total Investments — 110.5%
(Cost: $166,698,340) | |
Liabilities in Excess of Other Assets — (10.5)% | |
| |
| This security may be resold to qualified foreign investors and foreign institutional buyers under Regulation S of the Securities Act of 1933. |
| Variable rate security. Interest rate resets periodically. The rate shown is the effective interest rate as of period end. Security description also includes the reference rate and spread if published and available. |
| Security exempt from registration pursuant to Rule 144A under the Securities Act of 1933, as amended. These securities may be resold in transactions exempt from registration to qualified institutional investors. |
| All or a portion of this security is on loan. |
| Issuer filed for bankruptcy and/or is in default. |
| Non-income producing security. |
| Perpetual security with no stated maturity date. |
| Payment-in-kind security which may pay interest/dividends in additional par/shares and/or in cash. Rates shown are the current rate and possible payment rates. |
| Step coupon security. Coupon rate will either increase (step-up bond) or decrease (step-down bond) at regular intervals until maturity. Interest rate shown reflects the rate currently in effect. |
| |
| Annualized 7-day yield as of period end. |
| All or a portion of this security was purchased with the cash collateral from loaned securities. |
572024 iShares Annual Financial Statements and Additional Information
Schedule of Investments (continued)October 31, 2024
iShares® US & Intl High Yield Corp Bond ETF
Affiliates
Investments in issuers considered to be affiliate(s) of the Fund during the year ended October 31, 2024 for purposes of Section 2(a)(3) of the Investment Company Act of 1940, as amended, were as follows:
| | | | | Change in
Unrealized
Appreciation
(Depreciation) | | | | Capital
Gain
Distributions
from
Underlying
Funds |
BlackRock Cash Funds: Institutional, SL Agency Shares | | | | | | | | | |
BlackRock Cash Funds: Treasury, SL Agency Shares | | | | | | | | | |
| | | | | | | | | |
| Represents net amount purchased (sold). |
| All or a portion represents securities lending income earned from the reinvestment of cash collateral from loaned securities, net of fees and collateral investment expenses, and other payments to and from borrowers of securities. |
Fair Value Hierarchy as of Period End
Various inputs are used in determining the fair value of financial instruments at the measurement date. For a description of the input levels and information about the Fund’s policy regarding valuation of financial instruments, refer to the Notes to Financial Statements.
The following table summarizes the Fund’s financial instruments categorized in the fair value hierarchy. The breakdown of the Fund’s financial instruments into major categories is disclosed in the Schedule of Investments above.
See notes to financial statements.
Schedule of Investments58
Statements of Assets and LiabilitiesOctober 31, 2024
| iShares
International High Yield Bond ETF | iShares
J.P. Morgan EM Corporate Bond ETF | iShares
J.P. Morgan EM High Yield Bond ETF | iShares
J.P. Morgan EM Local Currency Bond ETF |
| | | | |
Investments, at value—unaffiliated(a)(b) | | | | |
Investments, at value—affiliated(c) | | | | |
| | | | |
Foreign currency, at value(d) | | | | |
| | | | |
| | | | |
Securities lending income—affiliated | | | | |
| | | | |
| | | | |
| | | | |
| | | | |
| | | | |
| | | | |
| | | | |
Collateral on securities loaned, at value | | | | |
| | | | |
| | | | |
| | | | |
Deferred foreign capital gain tax | | | | |
| | | | |
| | | | |
Commitments and contingent liabilities | | | | |
| | | | |
| | | | |
| | | | |
| | | | |
| | | | |
| | | | |
| | | | |
| | | | |
| | | | |
| | | | |
(a) Investments, at cost—unaffiliated | | | | |
(b) Securities loaned, at value | | | | |
(c) Investments, at cost—affiliated | | | | |
(d) Foreign currency, at cost | | | | |
See notes to financial statements.
592024 iShares Annual Financial Statements and Additional Information
Statements of Assets and Liabilities (continued)October 31, 2024
| iShares
US & Intl High Yield Corp Bond ETF |
| |
Investments, at value—unaffiliated(a)(b) | |
Investments, at value—affiliated(c) | |
| |
Foreign currency, at value(d) | |
| |
| |
Securities lending income—affiliated | |
| |
| |
| |
| |
Collateral on securities loaned, at value | |
| |
| |
| |
| |
| |
Commitments and contingent liabilities | |
| |
| |
| |
| |
| |
| |
| |
| |
| |
| |
(a) Investments, at cost—unaffiliated | |
(b) Securities loaned, at value | |
(c) Investments, at cost—affiliated | |
(d) Foreign currency, at cost | |
See notes to financial statements.
Statements of Assets and Liabilities60
Statements of OperationsYear Ended October 31, 2024
| iShares
International High Yield Bond ETF | iShares
J.P. Morgan EM Corporate Bond ETF | iShares
J.P. Morgan EM High Yield Bond ETF | iShares
J.P. Morgan EM Local Currency Bond ETF |
| | | | |
| | | | |
| | | | |
Securities lending income—affiliated—net | | | | |
Other income—unaffiliated | | | | |
| | | | |
| | | | |
| | | | |
| | | | |
| | | | |
| | | | |
| | | | |
| | | | |
REALIZED AND UNREALIZED GAIN (LOSS) | | | | |
Net realized gain (loss) from: | | | | |
Investments—unaffiliated(a) | | | | |
| | | | |
Forward foreign currency exchange contracts | | | | |
Foreign currency transactions | | | | |
In-kind redemptions—unaffiliated(b) | | | | |
| | | | |
Net change in unrealized appreciation (depreciation) on: | | | | |
Investments—unaffiliated(c) | | | | |
| | | | |
Foreign currency translations | | | | |
| | | | |
Net realized and unrealized gain | | | | |
NET INCREASE IN NET ASSETS RESULTING FROM OPERATIONS | | | | |
(a) Net of foreign capital gain tax and capital gain tax refund, if applicable of | | | | |
(b) See Note 2 of the Notes to Financial Statements. |
(c) Net of increase in deferred foreign capital gain tax of | | | | |
See notes to financial statements.
612024 iShares Annual Financial Statements and Additional Information
Statements of Operations (continued)Year Ended October 31, 2024
| iShares
US & Intl High Yield Corp Bond ETF |
| |
| |
| |
Securities lending income—affiliated—net | |
Other income—unaffiliated | |
| |
| |
| |
| |
| |
| |
| |
REALIZED AND UNREALIZED GAIN (LOSS) | |
Net realized gain (loss) from: | |
| |
| |
Foreign currency transactions | |
In-kind redemptions—unaffiliated(a) | |
| |
Net change in unrealized appreciation (depreciation) on: | |
| |
| |
Foreign currency translations | |
| |
Net realized and unrealized gain | |
NET INCREASE IN NET ASSETS RESULTING FROM OPERATIONS | |
(a) See Note 2 of the Notes to Financial Statements. |
See notes to financial statements.
Statements of Operations62
Statements of Changes in Net Assets
| iShares
International High Yield Bond ETF | iShares
J.P. Morgan EM Corporate Bond ETF |
| | | | |
INCREASE (DECREASE) IN NET ASSETS | | | | |
| | | | |
| | | | |
| | | | |
Net change in unrealized appreciation (depreciation) | | | | |
Net increase in net assets resulting from operations | | | | |
DISTRIBUTIONS TO SHAREHOLDERS(a) | | | | |
Decrease in net assets resulting from distributions to shareholders | | | | |
CAPITAL SHARE TRANSACTIONS | | | | |
Net increase (decrease) in net assets derived from capital share transactions | | | | |
| | | | |
Total increase in net assets | | | | |
| | | | |
| | | | |
| Distributions for annual periods determined in accordance with U.S. federal income tax regulations. |
See notes to financial statements.
632024 iShares Annual Financial Statements and Additional Information
Statements of Changes in Net Assets(continued)
| iShares
J.P. Morgan EM High Yield Bond ETF | iShares
J.P. Morgan EM Local Currency Bond ETF |
| | | | |
INCREASE (DECREASE) IN NET ASSETS | | | | |
| | | | |
| | | | |
| | | | |
Net change in unrealized appreciation (depreciation) | | | | |
Net increase in net assets resulting from operations | | | | |
DISTRIBUTIONS TO SHAREHOLDERS(a) | | | | |
Decrease in net assets resulting from distributions to shareholders | | | | |
CAPITAL SHARE TRANSACTIONS | | | | |
Net increase (decrease) in net assets derived from capital share transactions | | | | |
| | | | |
Total increase (decrease) in net assets | | | | |
| | | | |
| | | | |
| Distributions for annual periods determined in accordance with U.S. federal income tax regulations. |
See notes to financial statements.
Statements of Changes in Net Assets64
Statements of Changes in Net Assets(continued)
| iShares
US & Intl High Yield Corp Bond ETF |
| | |
INCREASE (DECREASE) IN NET ASSETS | | |
| | |
| | |
| | |
Net change in unrealized appreciation (depreciation) | | |
Net increase in net assets resulting from operations | | |
DISTRIBUTIONS TO SHAREHOLDERS(a) | | |
Decrease in net assets resulting from distributions to shareholders | | |
CAPITAL SHARE TRANSACTIONS | | |
Net increase in net assets derived from capital share transactions | | |
| | |
Total increase in net assets | | |
| | |
| | |
| Distributions for annual periods determined in accordance with U.S. federal income tax regulations. |
See notes to financial statements.
652024 iShares Annual Financial Statements and Additional Information
Financial Highlights(For a share outstanding throughout each period)
| iShares International High Yield Bond ETF |
| | | | | |
Net asset value, beginning of year | | | | | |
| | | | | |
Net realized and unrealized gain (loss)(b) | | | | | |
Net increase (decrease) from investment operations | | | | | |
| | | | | |
From net investment income | | | | | |
| | | | | |
| | | | | |
Net asset value, end of year | | | | | |
| | | | | |
| | | | | |
Ratios to Average Net Assets(e) | | | | | |
| | | | | |
| | | | | |
| | | | | |
Net assets, end of year (000) | | | | | |
Portfolio turnover rate(f) | | | | | |
(a) Based on average shares outstanding. |
(b) The amounts reported for a share outstanding may not accord with the change in aggregate gains and losses in securities for the fiscal period due to the timing of capital share transactions in relation to the fluctuating market values of the Fund’s underlying securities. |
(c) Distributions for annual periods determined in accordance with U.S. federal income tax regulations. |
(d) Where applicable, assumes the reinvestment of distributions. |
(e) Excludes fees and expenses incurred indirectly as a result of investments in underlying funds. |
(f) Portfolio turnover rate excludes in-kind transactions, if any. |
See notes to financial statements.
Financial Highlights(continued)(For a share outstanding throughout each period)
| iShares J.P. Morgan EM Corporate Bond ETF |
| | | | | |
Net asset value, beginning of year | | | | | |
| | | | | |
Net realized and unrealized gain (loss)(b) | | | | | |
Net increase (decrease) from investment operations | | | | | |
Distributions from net investment income(c) | | | | | |
Net asset value, end of year | | | | | |
| | | | | |
| | | | | |
Ratios to Average Net Assets(e) | | | | | |
| | | | | |
| | | | | |
| | | | | |
Net assets, end of year (000) | | | | | |
Portfolio turnover rate(f) | | | | | |
(a) Based on average shares outstanding. |
(b) The amounts reported for a share outstanding may not accord with the change in aggregate gains and losses in securities for the fiscal period due to the timing of capital share transactions in relation to the fluctuating market values of the Fund’s underlying securities. |
(c) Distributions for annual periods determined in accordance with U.S. federal income tax regulations. |
(d) Where applicable, assumes the reinvestment of distributions. |
(e) Excludes fees and expenses incurred indirectly as a result of investments in underlying funds. |
(f) Portfolio turnover rate excludes in-kind transactions, if any. |
See notes to financial statements.
672024 iShares Annual Financial Statements and Additional Information
Financial Highlights(continued)(For a share outstanding throughout each period)
| iShares J.P. Morgan EM High Yield Bond ETF |
| | | | | |
Net asset value, beginning of year | | | | | |
| | | | | |
Net realized and unrealized gain (loss)(b) | | | | | |
Net increase (decrease) from investment operations | | | | | |
Distributions from net investment income(c) | | | | | |
Net asset value, end of year | | | | | |
| | | | | |
| | | | | |
Ratios to Average Net Assets(e) | | | | | |
| | | | | |
Total expenses after fees waived | | | | | |
| | | | | |
| | | | | |
Net assets, end of year (000) | | | | | |
Portfolio turnover rate(f) | | | | | |
(a) Based on average shares outstanding. |
(b) The amounts reported for a share outstanding may not accord with the change in aggregate gains and losses in securities for the fiscal period due to the timing of capital share transactions in relation to the fluctuating market values of the Fund’s underlying securities. |
(c) Distributions for annual periods determined in accordance with U.S. federal income tax regulations. |
(d) Where applicable, assumes the reinvestment of distributions. |
(e) Excludes fees and expenses incurred indirectly as a result of investments in underlying funds. |
(f) Portfolio turnover rate excludes in-kind transactions, if any. |
See notes to financial statements.
Financial Highlights(continued)(For a share outstanding throughout each period)
| iShares J.P. Morgan EM Local Currency Bond ETF |
| | | | | |
Net asset value, beginning of year | | | | | |
| | | | | |
Net realized and unrealized gain (loss)(b) | | | | | |
Net increase (decrease) from investment operations | | | | | |
Distributions from net investment income(c) | | | | | |
Net asset value, end of year | | | | | |
| | | | | |
| | | | | |
Ratios to Average Net Assets(e) | | | | | |
| | | | | |
| | | | | |
| | | | | |
Net assets, end of year (000) | | | | | |
Portfolio turnover rate(f) | | | | | |
(a) Based on average shares outstanding. |
(b) The amounts reported for a share outstanding may not accord with the change in aggregate gains and losses in securities for the fiscal period due to the timing of capital share transactions in relation to the fluctuating market values of the Fund’s underlying securities. |
(c) Distributions for annual periods determined in accordance with U.S. federal income tax regulations. |
(d) Where applicable, assumes the reinvestment of distributions. |
(e) Excludes fees and expenses incurred indirectly as a result of investments in underlying funds. |
(f) Portfolio turnover rate excludes in-kind transactions, if any. |
See notes to financial statements.
692024 iShares Annual Financial Statements and Additional Information
Financial Highlights(continued)(For a share outstanding throughout each period)
| iShares US & Intl High Yield Corp Bond ETF |
| | | | | |
Net asset value, beginning of year | | | | | |
| | | | | |
Net realized and unrealized gain (loss)(b) | | | | | |
Net increase (decrease) from investment operations | | | | | |
Distributions from net investment income(c) | | | | | |
Net asset value, end of year | | | | | |
| | | | | |
| | | | | |
Ratios to Average Net Assets(e) | | | | | |
| | | | | |
| | | | | |
| | | | | |
Net assets, end of year (000) | | | | | |
Portfolio turnover rate(f) | | | | | |
(a) Based on average shares outstanding. |
(b) The amounts reported for a share outstanding may not accord with the change in aggregate gains and losses in securities for the fiscal period due to the timing of capital share transactions in relation to the fluctuating market values of the Fund’s underlying securities. |
(c) Distributions for annual periods determined in accordance with U.S. federal income tax regulations. |
(d) Where applicable, assumes the reinvestment of distributions. |
(e) Excludes fees and expenses incurred indirectly as a result of investments in underlying funds. |
(f) Portfolio turnover rate excludes in-kind transactions, if any. |
See notes to financial statements.
Notes to Financial Statements
1. ORGANIZATION
iShares, Inc. (the “Company”) is registered under the Investment Company Act of 1940, as amended (the “1940 Act”), as an open-end management investment company. The Company is organized as a Maryland corporation and is authorized to have multiple series or portfolios.
These financial statements relate only to the following funds (each, a “Fund” and collectively, the “Funds”):
| Diversification
Classification |
International High Yield Bond | |
J.P. Morgan EM Corporate Bond | |
J.P. Morgan EM High Yield Bond | |
J.P. Morgan EM Local Currency Bond | |
US & Intl High Yield Corp Bond | |
2. SIGNIFICANT ACCOUNTING POLICIES
The financial statements are prepared in conformity with accounting principles generally accepted in the United States of America (“U.S. GAAP”), which may require management to make estimates and assumptions that affect the reported amounts of assets and liabilities in the financial statements, disclosure of contingent assets and liabilities at the date of the financial statements and the reported amounts of increases and decreases in net assets from operations during the reporting period. Actual results could differ from those estimates. Each Fund is considered an investment company under U.S. GAAP and follows the accounting and reporting guidance applicable to investment companies. Below is a summary of significant accounting policies:
Investment Transactions and Income Recognition: For financial reporting purposes, investment transactions are recorded on the dates the transactions are executed. Realized gains and losses on investment transactions are determined using the specific identification method. Dividend income and capital gain distributions, if any, are recorded on the ex-dividend date. Non-cash dividends, if any, are recorded on the ex-dividend date at fair value. Dividends from foreign securities where the ex-dividend date may have passed are subsequently recorded when the Funds are informed of the ex-dividend date. Under the applicable foreign tax laws, a withholding tax at various rates may be imposed on capital gains, dividends and interest. Interest income, including amortization and accretion of premiums and discounts on debt securities, and payment-in-kind interest are recognized daily on an accrual basis.
Foreign Currency Translation: Each Fund's books and records are maintained in U.S. dollars. Securities and other assets and liabilities denominated in foreign currencies are translated into U.S. dollars using prevailing market rates as quoted by one or more data service providers. Purchases and sales of investments are recorded at the rates of exchange prevailing on the respective dates of such transactions. Generally, when the U.S. dollar rises in value against a foreign currency, the investments denominated in that currency will lose value; the opposite effect occurs if the U.S. dollar falls in relative value.
Each Fund does not isolate the effect of fluctuations in foreign exchange rates from the effect of fluctuations in the market prices of investments for financial reporting purposes. Accordingly, the effects of changes in exchange rates on investments are not segregated in the Statements of Operations from the effects of changes in market prices of those investments, but are included as a component of net realized and unrealized gain (loss) from investments. Each Fund reports realized currency gains (losses) on foreign currency related transactions as components of net realized gain (loss) for financial reporting purposes, whereas such components are generally treated as ordinary income for U.S. federal income tax purposes.
Foreign Taxes: The Funds may be subject to foreign taxes (a portion of which may be reclaimable) on income, stock dividends, capital gains on investments, or certain foreign currency transactions. All foreign taxes are recorded in accordance with the applicable foreign tax regulations and rates that exist in the foreign jurisdictions in which each Fund invests. These foreign taxes, if any, are paid by each Fund and are reflected in its Statements of Operations as follows: foreign taxes withheld at source are presented as a reduction of income, foreign taxes on securities lending income are presented as a reduction of securities lending income, foreign taxes on stock dividends are presented as “Other foreign taxes”, and foreign taxes on capital gains from sales of investments and foreign taxes on foreign currency transactions are included in their respective net realized gain (loss) categories. Foreign taxes payable or deferred as of October 31, 2024, if any, are disclosed in the Statements of Assets and Liabilities.
The Funds file withholding tax reclaims in certain jurisdictions to recover a portion of amounts previously withheld. The Funds may record a reclaim receivable based on collectability, which includes factors such as the jurisdiction’s applicable laws, payment history and market convention. The Statements of Operations include tax reclaims recorded as well as professional and other fees, if any, associated with recovery of foreign withholding taxes.
In-kind Redemptions: For financial reporting purposes, in-kind redemptions are treated as sales of securities resulting in realized capital gains or losses to the Funds. Because such gains or losses are not taxable to the Funds and are not distributed to existing Fund shareholders, the gains or losses are reclassified from accumulated net realized gain (loss) to paid-in capital at the end of the Funds’ tax year. These reclassifications have no effect on net assets or net asset value (“NAV”) per share.
Distributions: Dividends and distributions paid by each Fund are recorded on the ex-dividend dates. Distributions are determined on a tax basis and may differ from net investment income, net realized capital gains and/or return of capital for financial reporting purposes. Dividends and distributions are paid in U.S. dollars and cannot be automatically reinvested in additional shares of the Funds.
The portion of distributions that exceeds each Fund's current and accumulated earnings and profits will constitute a non-taxable return of capital. Distributions in excess of each Fund's minimum distribution requirements, but not in excess of the Fund's earnings and profits, will be taxable to the Fund's shareholders and will not constitute
712024 iShares Annual Financial Statements and Additional Information
Notes to Financial Statements (continued)
non-taxable returns of capital. Return of capital distributions will reduce a shareholder's cost basis and will result in higher capital gains or lower capital losses when each Fund's shares on which distributions were received are sold. Once a shareholder's cost basis is reduced to zero, further distributions will be treated as capital gains.
Indemnifications: In the normal course of business, each Fund enters into contracts that contain a variety of representations that provide general indemnification. The Funds’ maximum exposure under these arrangements is unknown because it involves future potential claims against the Funds, which cannot be predicted with any certainty.
3. INVESTMENT VALUATION AND FAIR VALUE MEASUREMENTS
Investment Valuation Policies: Each Fund’s investments are valued at fair value (also referred to as “market value” within the financial statements) each day that the Fund’s listing exchange is open and, for financial reporting purposes, as of the report date. U.S. GAAP defines fair value as the price a fund would receive to sell an asset or pay to transfer a liability in an orderly transaction between market participants at the measurement date. The Board of Directors of the Company (the “Board”) of each Fund has approved the designation of BlackRock Fund Advisors (“BFA”), the Funds' investment adviser, as the valuation designee for each Fund. Each Fund determines the fair values of its financial instruments using various independent dealers or pricing services under BFA’s policies. If a security’s market price is not readily available or does not otherwise accurately represent the fair value of the security, the security will be valued in accordance with BFA’s policies and procedures as reflecting fair value. BFA has formed a committee (the “Valuation Committee”) to develop pricing policies and procedures and to oversee the pricing function for all financial instruments, with assistance from other BlackRock pricing committees.
Fair Value Inputs and Methodologies: The following methods and inputs are used to establish the fair value of each Fund’s assets and liabilities:
• Equity investments traded on a recognized securities exchange are valued at that day’s official closing price, as applicable, on the exchange where the stock is primarily traded. Equity investments traded on a recognized exchange for which there were no sales on that day are valued at the last traded price.
• Fixed-income investments for which market quotations are readily available are generally valued using the last available bid price or current market quotations provided by independent dealers or third-party pricing services. Pricing services generally value fixed income securities assuming orderly transactions of an institutional round lot size, but a fund may hold or transact in such securities in smaller, odd lot sizes. Odd lots may trade at lower prices than institutional round lots. The pricing services may use matrix pricing or valuation models that utilize certain inputs and assumptions to derive values, including transaction data (e.g., recent representative bids and offers), market data, credit quality information, perceived market movements, news, and other relevant information. Certain fixed-income securities, including asset-backed and mortgage related securities may be valued based on valuation models that consider the estimated cash flows of each tranche of the entity, establish a benchmark yield and develop an estimated tranche specific spread to the benchmark yield based on the unique attributes of the tranche. The amortized cost method of valuation may be used with respect to debt obligations with sixty days or less remaining to maturity unless BFA determines such method does not represent fair value.
• Investments in open-end U.S. mutual funds (including money market funds) are valued at that day’s NAV.
If events (e.g., market volatility, company announcement or a natural disaster) occur that are expected to materially affect the value of such investment, or in the event that application of these methods of valuation results in a price for an investment that is deemed not to be representative of the market value of such investment, or if a price is not available, the investment will be valued by the Valuation Committee in accordance with BFA’s policies and procedures as reflecting fair value (“Fair Valued Investments”). The fair valuation approaches that may be used by the Valuation Committee include market approach, income approach and cost approach. Valuation techniques such as discounted cash flow, use of market comparables and matrix pricing are types of valuation approaches and are typically used in determining fair value. When determining the price for Fair Valued Investments, the Valuation Committee seeks to determine the price that each Fund might reasonably expect to receive or pay from the current sale or purchase of that asset or liability in an arm’s-length transaction. Fair value determinations shall be based upon all available factors that the Valuation Committee deems relevant and consistent with the principles of fair value measurement as of the measurement date.
Fair value pricing could result in a difference between the prices used to calculate a fund’s NAV and the prices used by the fund’s underlying index, which in turn could result in a difference between the fund’s performance and the performance of the fund’s underlying index.
Fair Value Hierarchy: Various inputs are used in determining the fair value of financial instruments at the measurement date. These inputs to valuation techniques are categorized into a fair value hierarchy consisting of three broad levels for financial reporting purposes as follows:
• Level 1 – Unadjusted price quotations in active markets/exchanges that each Fund has the ability to access for identical assets or liabilities;
• Level 2 – Inputs other than quoted prices included within level 1 that are observable for the asset or liability, either directly or indirectly; and
• Level 3 – Inputs that are unobservable and significant to the entire fair value measurement for the asset or liability (including the Valuation Committee’s assumptions used in determining the fair value of financial instruments).
The hierarchy gives the highest priority to unadjusted quoted prices in active markets for identical assets or liabilities (Level 1 measurements) and the lowest priority to unobservable inputs (Level 3 measurements). Accordingly, the degree of judgment exercised in determining fair value is greatest for instruments categorized in Level 3. The inputs used to measure fair value may fall into different levels of the fair value hierarchy. In such cases, for disclosure purposes, the fair value hierarchy classification is determined based on the lowest level input that is significant to the fair value measurement in its entirety. Investments classified within Level 3 have significant unobservable inputs used by the Valuation Committee in determining the price for Fair Valued Investments. Level 3 investments include equity or debt issued by privately held companies
Notes to Financial Statements72
Notes to Financial Statements (continued)
or funds that may not have a secondary market and/or may have a limited number of investors. The categorization of a value determined for financial instruments is based on the pricing transparency of the financial instruments and is not necessarily an indication of the risks associated with investing in those securities.
4. SECURITIES AND OTHER INVESTMENTS
Zero-Coupon Bonds: Zero-coupon bonds are normally issued at a significant discount from face value and do not provide for periodic interest payments. These bonds may experience greater volatility in market value than other debt obligations of similar maturity which provide for regular interest payments.
Securities Lending: Each Fund may lend its securities to approved borrowers, such as brokers, dealers and other financial institutions. The borrower pledges and maintains with the Fund collateral consisting of cash, an irrevocable letter of credit issued by an approved bank, or securities issued or guaranteed by the U.S. government. The initial collateral received by each Fund is required to have a value of at least 102% of the current market value of the loaned securities for securities traded on U.S. exchanges and a value of at least 105% for all other securities. The collateral is maintained thereafter at a value equal to at least 100% of the current value of the securities on loan. The market value of the loaned securities is determined at the close of each business day of the Fund and any additional required collateral is delivered to the Fund or excess collateral is returned by the Fund, on the next business day. During the term of the loan, each Fund is entitled to all distributions made on or in respect of the loaned securities but does not receive interest income on securities received as collateral. Loans of securities are terminable at any time and the borrower, after notice, is required to return borrowed securities within the standard time period for settlement of securities transactions.
As of period end, any securities on loan were collateralized by cash and/or U.S. Government obligations. Cash collateral invested in money market funds managed by BFA, or its affiliates is disclosed in the Schedule of Investments. Any non-cash collateral received cannot be sold, re-invested or pledged by the Fund, except in the event of borrower default. The securities on loan, if any, are also disclosed in each Fund’s Schedule of Investments. The market value of any securities on loan and the value of any related cash collateral are disclosed in the Statements of Assets and Liabilities.
Securities lending transactions are entered into by the Funds under Master Securities Lending Agreements (each, an “MSLA”) which provide the right, in the event of default (including bankruptcy or insolvency) for the non-defaulting party to liquidate the collateral and calculate a net exposure to the defaulting party or request additional collateral. In the event that a borrower defaults, the Funds, as lender, would offset the market value of the collateral received against the market value of the securities loaned. When the value of the collateral is greater than that of the market value of the securities loaned, the lender is left with a net amount payable to the defaulting party. However, bankruptcy or insolvency laws of a particular jurisdiction may impose restrictions on or prohibitions against such a right of offset in the event of an MSLA counterparty’s bankruptcy or insolvency. Under the MSLA, absent an event of default, the borrower can resell or re-pledge the loaned securities, and the Funds can reinvest cash collateral received in connection with loaned securities. Upon an event of default, the parties’ obligations to return the securities or collateral to the other party are extinguished, and the parties can resell or re-pledge the loaned securities or the collateral received in connection with the loaned securities in order to satisfy the defaulting party’s net payment obligation for all transactions under the MSLA. The defaulting party remains liable for any deficiency.
As of period end, the following table is a summary of the securities on loan by counterparty which are subject to offset under an MSLA:
iShares ETF and Counterparty | Securities Loaned
at Value | | Non-Cash Collateral
Received, at Fair Value(a) | |
J.P. Morgan EM Corporate Bond | | | | |
| | | | |
| | | | |
| | | | |
| | | | |
Citigroup Global Markets, Inc. | | | | |
Deutsche Bank Securities, Inc. | | | | |
HSBC Securities (USA), Inc. | | | | |
J.P. Morgan Securities LLC | | | | |
| | | | |
| | | | |
Nomura Securities International, Inc. | | | | |
| | | | |
| | | | |
Wells Fargo Securities LLC | | | | |
| | | | |
732024 iShares Annual Financial Statements and Additional Information
Notes to Financial Statements (continued)
iShares ETF and Counterparty | Securities Loaned at Value | Cash Collateral Received(a) | Non-Cash Collateral Received, at Fair Value(a) | |
J.P. Morgan EM High Yield Bond | | | | |
| | | | |
| | | | |
| | | | |
| | | | |
Citigroup Global Markets, Inc. | | | | |
| | | | |
HSBC Securities (USA), Inc. | | | | |
J.P. Morgan Securities LLC | | | | |
| | | | |
| | | | |
Nomura Securities International, Inc. | | | | |
| | | | |
Scotia Capital (USA), Inc. | | | | |
| | | | |
| | | | |
Wells Fargo Securities LLC | | | | |
| | | | |
US & Intl High Yield Corp Bond | | | | |
| | | | |
| | | | |
BMO Capital Markets Corp. | | | | |
| | | | |
| | | | |
| | | | |
Citigroup Global Markets, Inc. | | | | |
Deutsche Bank Securities, Inc. | | | | |
| | | | |
HSBC Securities (USA) Inc. | | | | |
J.P. Morgan Securities LLC | | | | |
| | | | |
| | | | |
Nomura Securities International, Inc. | | | | |
| | | | |
| | | | |
Scotia Capital (USA), Inc. | | | | |
State Street Bank & Trust Co. | | | | |
| | | | |
| | | | |
| | | | |
| | | | |
Wells Fargo Securities LLC | | | | |
| | | | |
| Collateral received, if any, in excess of the market value of securities on loan is not presented in this table. The total cash collateral received by each Fund is disclosed in the Fund’s Statements of Assets and Liabilities. |
| The market value of the loaned securities is determined as of October 31, 2024. Additional collateral is delivered to the Fund on the next business day in accordance with the MSLA. The net amount would be subject to the borrower default indemnity in the event of default by a counterparty. |
The risks of securities lending include the risk that the borrower may not provide additional collateral when required or may not return the securities when due. To mitigate these risks, each Fund benefits from a borrower default indemnity provided by BlackRock Finance, Inc. BlackRock Finance, Inc.'s indemnity allows for full replacement of the securities loaned to the extent the collateral received does not cover the value of the securities loaned in the event of borrower default. Each Fund could incur a loss if the value of an investment purchased with cash collateral falls below the market value of the loaned securities or if the value of an investment purchased with cash collateral falls below the value of the original cash collateral received. Such losses are borne entirely by each Fund.
5. INVESTMENT ADVISORY AGREEMENT AND OTHER TRANSACTIONS WITH AFFILIATES
Investment Advisory Fees: Pursuant to an Investment Advisory Agreement with the Company, BFA manages the investment of each Fund’s assets. BFA is a California corporation indirectly owned by BlackRock. Under the Investment Advisory Agreement, BFA is responsible for substantially all expenses of the Funds, except (i) interest and taxes; (ii) brokerage commissions and other expenses connected with the execution of portfolio transactions; (iii) distribution fees; (iv) the advisory fee payable to BFA; and (v) litigation expenses and any extraordinary expenses (in each case as determined by a majority of the independent directors).
Notes to Financial Statements74
Notes to Financial Statements (continued)
For its investment advisory services to each of the following Funds, BFA is entitled to an annual investment advisory fee, accrued daily and paid monthly by the Funds, based on the average daily net assets of each Fund as follows:
| |
International High Yield Bond | |
J.P. Morgan EM Corporate Bond | |
J.P. Morgan EM High Yield Bond | |
J.P. Morgan EM Local Currency Bond | |
US & Intl High Yield Corp Bond | |
Sub-Adviser: BFA has entered into a sub-advisory agreement with BlackRock International Limited (“BIL”), an affiliate of BFA, under which BFA pays BIL for services it provides to the iShares International High Yield Bond ETF, iShares J.P. Morgan EM Corporate Bond ETF, iShares J.P. Morgan EM High Yield Bond ETF, iShares J.P. Morgan EM Local Currency Bond ETF and iShares US & Intl High Yield Corp Bond ETF. BFA has entered into a separate sub-advisory agreement with BlackRock (Singapore) Limited (“BRS”, together with BlackRock International Limited, the “Sub-Advisers”), both affiliates of BFA, under which BFA pays BRS for services it provides to the iShares J.P. Morgan EM Local Currency Bond ETF.
Distributor: BlackRock Investments, LLC ("BRIL"), an affiliate of BFA, is the distributor for each Fund. Pursuant to the distribution agreement, BFA is responsible for any fees or expenses for distribution services provided to the Funds.
ETF Servicing Fees: Each Fund has entered into an ETF Services Agreement with BRIL to perform certain order processing, Authorized Participant communications, and related services in connection with the issuance and redemption of Creation Units (“ETF Services”). BRIL is entitled to a transaction fee from Authorized Participants on each creation or redemption order for the ETF Services provided. The Funds do not pay BRIL for ETF Services.
Prior to January 08, 2024 (date of conversion for iShares J.P. Morgan EM Corporate Bond ETF and iShares J.P. Morgan EM High Yield Bond ETF), ETF Services were performed by State Street Bank and Trust Company.
Prior to January 26, 2024 (date of conversion for iShares International High Yield Bond ETF, iShares J.P. Morgan EM Local Currency Bond ETF and iShares US & Intl High Yield Corp Bond ETF), ETF Services were performed by State Street Bank and Trust Company.
Securities Lending: The U.S. Securities and Exchange Commission (the “SEC”) has issued an exemptive order which permits BlackRock Institutional Trust Company, N.A. (“BTC”), an affiliate of BFA, to serve as securities lending agent for the Funds, subject to applicable conditions. As securities lending agent, BTC bears all operational costs directly related to securities lending, including any custodial costs. Each Fund is responsible for fees in connection with the investment of cash collateral received for securities on loan (the “collateral investment fees”). The cash collateral is invested in a money market fund, BlackRock Cash Funds: Institutional or BlackRock Cash Funds: Treasury, managed by BFA, or its affiliates. However, BTC has agreed to reduce the amount of securities lending income it receives in order to effectively limit the collateral investment fees each Fund bears to an annual rate of 0.04%. The SL Agency Shares of such money market fund will not be subject to a sales load, distribution fee or service fee. BlackRock Cash Funds: Institutional may impose a discretionary liquidity fee of up to 2% on all redemptions. Discretionary liquidity fees may be imposed or terminated at any time at the discretion of the board of directors of the money market fund, or its delegate, if it is determined that such fee would be, or would not be, respectively, in the best interest of the money market fund. Additionally, BlackRock Cash Funds: Institutional will impose a mandatory liquidity fee if the money market fund's total net redemptions on a single day exceed 5% of the money market fund's net assets, unless the amount of the fee is less than 0.01% of the value of the shares redeemed. BlackRock Cash Funds: Institutional will determine the size of the mandatory liquidity fee by making a good faith estimate of certain costs the money market fund would incur if it were to sell a pro rata amount of each security in the portfolio to satisfy the amount of net redemptions on that day. There is no limit to the size of a mandatory liquidity fee. If BlackRock Cash Funds: Institutional cannot estimate the costs of selling a pro rata amount of each portfolio security in good faith and supported by data, it is required to apply a default liquidity fee of 1% on the value of shares redeemed on that day.
Securities lending income is generally equal to the total of income earned from the reinvestment of cash collateral (and excludes collateral investment fees), and any fees or other payments to and from borrowers of securities. Each Fund retains a portion of the securities lending income and remits the remaining portion to BTC as compensation for its services as securities lending agent.
Pursuant to the current securities lending agreement, each Fund retains 82% of securities lending income (which excludes collateral investment fees), and the amount retained can never be less than 70% of the total of securities lending income plus the collateral investment fees.
In addition, commencing the business day following the date that the aggregate securities lending income plus the collateral investment fees generated across all 1940 Act iShares exchange-traded funds (the “iShares ETF Complex”) in that calendar year exceeds a specified threshold, each Fund, pursuant to the securities lending agreement, will retain for the remainder of that calendar year 85% of securities lending income (which excludes collateral investment fees) and the amount retained can never be less than 70% of the total of securities lending income plus the collateral investment fees.
The share of securities lending income earned by each Fund is shown as securities lending income – affiliated – net in its Statements of Operations. For the year ended October 31, 2024, the Funds paid BTC the following amounts for securities lending agent services:
| |
J.P. Morgan EM Corporate Bond | |
J.P. Morgan EM High Yield Bond | |
US & Intl High Yield Corp Bond | |
752024 iShares Annual Financial Statements and Additional Information
Notes to Financial Statements (continued)
Officers and Directors: Certain officers and/or directors of the Company are officers and/or directors of BlackRock or its affiliates.
Other Transactions: Each Fund may invest its positive cash balances in certain money market funds managed by BFA or an affiliate. The income earned on these temporary cash investments is shown as dividends – affiliated in the Statements of Operations.
A fund, in order to improve its portfolio liquidity and its ability to track its underlying index, may invest in shares of other iShares funds that invest in securities in the fund’s underlying index.
For the year ended October 31, 2024, purchases and sales of investments, excluding short-term securities and in-kind transactions, were as follows:
| | |
International High Yield Bond | | |
J.P. Morgan EM Corporate Bond | | |
J.P. Morgan EM High Yield Bond | | |
J.P. Morgan EM Local Currency Bond | | |
US & Intl High Yield Corp Bond | | |
For the year ended October 31, 2024, in-kind transactions were as follows:
| | |
J.P. Morgan EM Corporate Bond | | |
J.P. Morgan EM High Yield Bond | | |
J.P. Morgan EM Local Currency Bond | | |
US & Intl High Yield Corp Bond | | |
7. INCOME TAX INFORMATION
Each Fund is treated as an entity separate from the Company’s other funds for federal income tax purposes. It is each Fund’s policy to comply with the requirements of the Internal Revenue Code of 1986, as amended, applicable to regulated investment companies, and to distribute substantially all of its taxable income to its shareholders. Therefore, no U.S. federal income tax provision is required.
Management has analyzed tax laws and regulations and their application to the Funds as of October 31, 2024, inclusive of the open tax return years, and does not believe that there are any uncertain tax positions that require recognition of a tax liability in the Funds’ financial statements. Management’s analysis is based on the tax laws and judicial and administrative interpretations thereof in effect as of the date of these financial statements, all of which are subject to change, possibly with retroactive effect, which may impact the Funds’ NAV.
U.S. GAAP requires that certain components of net assets be adjusted to reflect permanent differences between financial and tax reporting. These reclassifications have no effect on net assets or NAV per share. As of October 31, 2024, permanent differences attributable to net operating loss, distributions paid in excess of taxable income and realized gains (losses) from in-kind redemptions were reclassified to the following accounts:
| | Accumulated
Earnings (Loss) |
J.P. Morgan EM Corporate Bond | | |
J.P. Morgan EM High Yield Bond | | |
J.P. Morgan EM Local Currency Bond | | |
US & Intl High Yield Corp Bond | | |
The tax character of distributions paid was as follows:
| | |
International High Yield Bond | | |
| | |
J.P. Morgan EM Corporate Bond | | |
| | |
J.P. Morgan EM High Yield Bond | | |
| | |
Notes to Financial Statements76
Notes to Financial Statements (continued)
| | |
J.P. Morgan EM Local Currency Bond | | |
| | |
US & Intl High Yield Corp Bond | | |
| | |
As of October 31, 2024, the tax components of accumulated net earnings (losses) were as follows:
| Undistributed
Ordinary Income | | | |
International High Yield Bond | | | | |
J.P. Morgan EM Corporate Bond | | | | |
J.P. Morgan EM High Yield Bond | | | | |
J.P. Morgan EM Local Currency Bond | | | | |
US & Intl High Yield Corp Bond | | | | |
| Amounts available to offset future realized capital gains. |
| The difference between book-basis and tax-basis unrealized gains (losses) was attributable primarily to the tax deferral of losses on wash sales, amortization methods for premiums and discounts on fixed income securities, the classification of investments, the accrual of income on securities in default and the realization for tax purposes of unrealized gains(losses) on hyperinflationary currencies. |
As of October 31, 2024, gross unrealized appreciation and depreciation based on cost of investments (including short positions and derivatives, if any) for U.S. federal income tax purposes were as follows:
| | Gross Unrealized
Appreciation | Gross Unrealized
Depreciation | Net Unrealized
Appreciation
(Depreciation) |
International High Yield Bond | | | | |
J.P. Morgan EM Corporate Bond | | | | |
J.P. Morgan EM High Yield Bond | | | | |
J.P. Morgan EM Local Currency Bond | | | | |
US & Intl High Yield Corp Bond | | | | |
The iShares J.P. Morgan EM Local Currency Bond ETF, along with certain other iShares funds (“Participating Funds”), is a party to a $800 million credit agreement (“Syndicated Credit Agreement”) with a group of lenders, which expires on October 15, 2025. The line of credit may be used for temporary or emergency purposes, including redemptions, settlement of trades and rebalancing of portfolio holdings in certain target markets. The Funds may borrow up to the aggregate commitment amount subject to asset coverage and other limitations as specified in the Syndicated Credit Agreement. The Syndicated Credit Agreement has the following terms: a commitment fee of 0.15% per annum on the unused portion of the credit agreement and interest at a rate equal to the higher of (a) Daily Simple Secured Overnight Financing Rate (“SOFR”) plus 0.10% and 1.00% per annum or (b) the U.S. Federal Funds rate plus 1.00% per annum on amounts borrowed. The commitment fee is generally allocated to each Participating Fund based on the lesser of a Participating Fund’s relative exposure to certain target markets or a Participating Fund’s maximum borrowing amount as set forth by the terms of the Syndicated Credit Agreement.
During the year ended October 31, 2024, the Fund did not borrow under the Syndicated Credit Agreement.
In the normal course of business, each Fund invests in securities or other instruments and may enter into certain transactions, and such activities subject the Fund to various risks, including, among others, fluctuations in the market (market risk) or failure of an issuer to meet all of its obligations. The value of securities or other instruments may also be affected by various factors, including, without limitation: (i) the general economy; (ii) the overall market as well as local, regional or global political and/or social instability; (iii) regulation, taxation or international tax treaties between various countries; or (iv) currency, interest rate or price fluctuations. Local, regional or global events such as war, acts of terrorism, the spread of infectious illness or other public health issues, recessions, or other events could have a significant impact on the Funds and their investments. Each Fund’s prospectus provides details of the risks to which the Fund is subject.
BFA uses an indexing approach to try to achieve each Fund’s investment objective. The Fund is not actively managed, and BFA generally does not attempt to take defensive positions under any market conditions, including declining markets.
772024 iShares Annual Financial Statements and Additional Information
Notes to Financial Statements (continued)
The Funds may be exposed to additional risks when reinvesting cash collateral in money market funds that do not seek to maintain a stable NAV per share of $1.00, which may be subject to mandatory and discretionary liquidity fees under certain circumstances.
Market Risk: Investments in the securities of issuers domiciled in countries with emerging capital markets involve certain additional risks that do not generally apply to investments in securities of issuers in more developed capital markets, such as (i) low or nonexistent trading volume, resulting in a lack of liquidity and increased volatility in prices for such securities; (ii) lack of reliable settlement procedures and significant delays in registering the transfer of securities; (iii) uncertain national policies and social, political and economic instability, increasing the potential for expropriation of assets, confiscatory taxation, high rates of inflation or unfavorable diplomatic developments; (iv) lack of publicly available or reliable information about issuers as a result of not being subject to the same degree of regulatory requirements and accounting, auditing and financial reporting standards; and (v) possible fluctuations in exchange rates, differing legal systems and the existence or possible imposition of exchange controls, custodial restrictions or other foreign or U.S. governmental laws or restrictions applicable to such investments.
Each Fund may be exposed to prepayment risk, which is the risk that borrowers may exercise their option to prepay principal earlier than scheduled during periods of declining interest rates, which would force each Fund to reinvest in lower yielding securities. Each Fund may also be exposed to reinvestment risk, which is the risk that income from each Fund’s portfolio will decline if each Fund invests the proceeds from matured, traded or called fixed-income securities at market interest rates that are below each Fund portfolio’s current earnings rate.
Valuation Risk: The market values of equities, such as common stocks and preferred securities or equity related investments, such as futures and options, may decline due to general market conditions which are not specifically related to a particular company. They may also decline due to factors which affect a particular industry or industries. A fund may invest in illiquid investments. An illiquid investment is any investment that a fund reasonably expects cannot be sold or disposed of in current market conditions in seven calendar days or less without the sale or disposition significantly changing the market value of the investment. A fund may experience difficulty in selling illiquid investments in a timely manner at the price that it believes the investments are worth. Prices may fluctuate widely over short or extended periods in response to company, market or economic news. Markets also tend to move in cycles, with periods of rising and falling prices. This volatility may cause a fund’s NAV to experience significant increases or decreases over short periods of time. If there is a general decline in the securities and other markets, the NAV of a fund may lose value, regardless of the individual results of the securities and other instruments in which a fund invests. Each Fund’s ability to value its investments may also be impacted by technological issues and/or errors by pricing services or other third-party service providers.
The price each Fund could receive upon the sale of any particular portfolio investment may differ from each Fund’s valuation of the investment, particularly for securities that trade in thin or volatile markets or that are valued using a fair valuation technique or a price provided by an independent pricing service. Changes to significant unobservable inputs and assumptions (i.e., publicly traded company multiples, growth rate, time to exit) due to the lack of observable inputs may significantly impact the resulting fair value and therefore each Fund’s results of operations. As a result, the price received upon the sale of an investment may be less than the value ascribed by each Fund, and each Fund could realize a greater than expected loss or lesser than expected gain upon the sale of the investment.
Counterparty Credit Risk: The Funds may be exposed to counterparty credit risk, or the risk that an entity may fail to or be unable to perform on its commitments related to unsettled or open transactions, including making timely interest and/or principal payments or otherwise honoring its obligations. The Funds manage counterparty credit risk by entering into transactions only with counterparties that BFA believes have the financial resources to honor their obligations and by monitoring the financial stability of those counterparties. Financial assets, which potentially expose the Funds to market, issuer and counterparty credit risks, consist principally of financial instruments and receivables due from counterparties. The extent of the Funds’ exposure to market, issuer and counterparty credit risks with respect to these financial assets is approximately their value recorded in the Statements of Assets and Liabilities, less any collateral held by the Funds.
Geographic/Asset Class Risk: A diversified portfolio, where this is appropriate and consistent with a fund’s objectives, minimizes the risk that a price change of a particular investment will have a material impact on the NAV of a fund. The investment concentrations within each Fund’s portfolio are disclosed in its Schedule of Investments.
Certain Funds invest a significant portion of their assets in issuers located in a single country or a limited number of countries. When a fund concentrates its investments in this manner, it assumes the risk that economic, regulatory, political and social conditions in that country or those countries may have a significant impact on the fund and could affect the income from, or the value or liquidity of, the Fund’s portfolio. Unanticipated or sudden political or social developments may cause uncertainty in the markets and as a result adversely affect the Fund’s investments. Foreign issuers may not be subject to the same uniform accounting, auditing and financial reporting standards and practices as used in the United States. Foreign securities markets may also be more volatile and less liquid than U.S. securities and may be less subject to governmental supervision not typically associated with investing in U.S. securities. Investment percentages in specific countries are presented in the Schedule of Investments.
The Funds invest a significant portion of their assets in securities of issuers located in the United States. A decrease in imports or exports, changes in trade regulations, inflation and/or an economic recession in the United States may have a material adverse effect on the U.S. economy and the securities listed on U.S. exchanges. Proposed and adopted policy and legislative changes in the United States may also have a significant effect on U.S. markets generally, as well as on the value of certain securities. Governmental agencies project that the United States will continue to maintain elevated public debt levels for the foreseeable future which may constrain future economic growth. Circumstances could arise that could prevent the timely payment of interest or principal on U.S. government debt, such as reaching the legislative “debt ceiling.” Such non-payment would result in substantial negative consequences for the U.S. economy and the global financial system. If U.S. relations with certain countries deteriorate, it could adversely affect issuers that rely on the United States for trade. The United States has also experienced increased internal unrest and discord. If these trends were to continue, they may have an adverse impact on the U.S. economy and the issuers in which the Funds invest.
Notes to Financial Statements78
Notes to Financial Statements (continued)
Certain Funds invest a significant portion of their assets in securities of issuers located in Europe or with significant exposure to European issuers or countries. The European financial markets have recently experienced volatility and adverse trends due to concerns about economic downturns in, or rising government debt levels of, several European countries as well as acts of war in the region. These events may spread to other countries in Europe and may affect the value and liquidity of certain of the Funds’ investments.
Responses to the financial problems by European governments, central banks and others, including austerity measures and reforms, may not work, may result in social unrest and may limit future growth and economic recovery or have other unintended consequences. Further defaults or restructurings by governments and others of their debt could have additional adverse effects on economies, financial markets and asset valuations around the world. The United Kingdom has withdrawn from the European Union, and one or more other countries may withdraw from the European Union and/or abandon the Euro, the common currency of the European Union. These events and actions have adversely affected, and may in the future adversely affect, the value and exchange rate of the Euro and may continue to significantly affect the economies of every country in Europe, including countries that do not use the Euro and non-European Union member states. The impact of these actions, especially if they occur in a disorderly fashion, is not clear but could be significant and far reaching. In addition, Russia launched a large-scale invasion of Ukraine on February 24, 2022. The extent and duration of the military action, resulting sanctions and resulting future market disruptions in the region are impossible to predict, but have been, and may continue to be, significant and have a severe adverse effect on the region, including significant negative impacts on the economy and the markets for certain securities and commodities, such as oil and natural gas, as well as other sectors.
Certain Funds invest a significant portion of their assets in securities of issuers located in Asia or with significant exposure to Asian issuers or countries. The Asian financial markets have recently experienced volatility and adverse trends due to concerns in several Asian countries regarding monetary policy, government intervention in the markets, rising government debt levels or economic downturns. These events may spread to other countries in Asia and may affect the value and liquidity of certain of the Funds’ investments.
Certain Funds invest a significant portion of their assets in high yield securities. High yield securities that are rated below investment-grade (commonly referred to as “junk bonds”) or are unrated may be deemed speculative, involve greater levels of risk than higher-rated securities of similar maturity and are more likely to default. High yield securities may be issued by less creditworthy issuers, and issuers of high yield securities may be unable to meet their interest or principal payment obligations. High yield securities are subject to extreme price fluctuations, may be less liquid than higher rated fixed-income securities, even under normal economic conditions, and frequently have redemption features.
The Funds invest a significant portion of their assets in fixed-income securities and/or use derivatives tied to the fixed-income markets. Changes in market interest rates or economic conditions may affect the value and/or liquidity of such investments. Interest rate risk is the risk that prices of bonds and other fixed-income securities will decrease as interest rates rise and increase as interest rates fall. The Funds may be subject to a greater risk of rising interest rates during a period of historically low interest rates. The Federal Reserve has raised the federal funds rate as part of its efforts to address inflation. Changing interest rates may have unpredictable effects on markets, may result in heightened market volatility, and could negatively impact the Funds' performance.
Significant Shareholder Redemption Risk: Certain shareholders may own or manage a substantial amount of fund shares and/or hold their fund investments for a limited period of time. Large redemptions of fund shares by these shareholders may force a fund to sell portfolio securities, which may negatively impact the fund’s NAV, increase the fund’s brokerage costs, and/or accelerate the realization of taxable income/gains and cause the fund to make additional taxable distributions to shareholders.
10. CAPITAL SHARE TRANSACTIONS
Capital shares are issued and redeemed by each Fund only in aggregations of a specified number of shares or multiples thereof (“Creation Units”) at NAV. Except when aggregated in Creation Units, shares of each Fund are not redeemable.
Transactions in capital shares were as follows:
| | |
| | | | |
International High Yield Bond | | | | |
| | | | |
| | | | |
| | | | |
J.P. Morgan EM Corporate Bond | | | | |
| | | | |
| | | | |
| | | | |
J.P. Morgan EM High Yield Bond | | | | |
| | | | |
| | | | |
| | | | |
792024 iShares Annual Financial Statements and Additional Information
Notes to Financial Statements (continued)
| | |
| | | | |
J.P. Morgan EM Local Currency Bond | | | | |
| | | | |
| | | | |
| | | | |
US & Intl High Yield Corp Bond | | | | |
| | | | |
| | | | |
| | | | |
The consideration for the purchase of Creation Units of a fund in the Company generally consists of the in-kind deposit of a designated portfolio of securities and a specified amount of cash. Certain funds in the Company may be offered in Creation Units solely or partially for cash in U.S. dollars. Authorized Participants purchasing and redeeming Creation Units may pay a purchase transaction fee and a redemption transaction fee directly to BRIL, to offset transfer and other transaction costs associated with the issuance and redemption of Creation Units, including Creation Units for cash. Authorized Participants transacting in Creation Units for cash may also pay an additional variable charge to compensate the relevant fund for certain transaction costs (i.e., stamp taxes, taxes on currency or other financial transactions, and brokerage costs) and market impact expenses relating to investing in portfolio securities. Such variable charges, if any, are included in shares sold in the table above.
To the extent applicable, to facilitate the timely settlement of orders for the Funds using a clearing facility outside of the continuous net settlement process, the Funds, at their sole discretion, may permit an Authorized Participant to post cash as collateral in anticipation of the delivery of all or a portion of the applicable Deposit Securities or Fund Securities, as further described in the applicable Authorized Participant Agreement. The collateral process is subject to a Control Agreement among the Authorized Participant, each Funds’ custodian, and the Funds. In the event that the Authorized Participant fails to deliver all or a portion of the applicable Deposit Securities or Fund Securities, the Funds may exercise control over such collateral pursuant to the terms of the Control Agreement in order to purchase the applicable Deposit Securities or Fund Securities.
From time to time, settlement of securities related to in-kind contributions or in-kind redemptions may be delayed. In such cases, securities related to in-kind transactions are reflected as a receivable or a payable in the Statements of Assets and Liabilities.
Management has evaluated the impact of all subsequent events on the Funds through the date the financial statements were available to be issued and has determined that there were no subsequent events requiring adjustment or additional disclosure in the financial statements.
Notes to Financial Statements80
Report of Independent Registered Public Accounting Firm
To the Board of Directors of
iShares, Inc. and Shareholders of each of the five funds listed in the table below
Opinions on the Financial Statements
We have audited the accompanying statements of assets and liabilities, including the schedules of investments, of each of the funds listed in the table below (five of the funds constituting iShares, Inc., hereafter collectively referred to as the "Funds") as of October 31, 2024, the related statements of operations for the year ended October 31, 2024, the statements of changes in net assets for each of the two years in the period ended October 31, 2024, including the related notes, and the financial highlights for each of the five years in the period ended October 31, 2024 (collectively referred to as the “financial statements”). In our opinion, the financial statements present fairly, in all material respects, the financial position of each of the Funds listed in the table below as of October 31, 2024, the results of each of their operations for the year then ended, the changes in each of their net assets for each of the two years in the period ended October 31, 2024 and each of the financial highlights for each of the five years in the period ended October 31, 2024 in conformity with accounting principles generally accepted in the United States of America.
iShares International High Yield Bond ETF |
iShares J.P. Morgan EM Corporate Bond ETF |
iShares J.P. Morgan EM High Yield Bond ETF |
iShares J.P. Morgan EM Local Currency Bond ETF |
iShares US & Intl High Yield Corp Bond ETF |
These financial statements are the responsibility of the Funds’ management. Our responsibility is to express an opinion on the Funds’ financial statements based on our audits. We are a public accounting firm registered with the Public Company Accounting Oversight Board (United States) (PCAOB) and are required to be independent with respect to the Funds in accordance with the U.S. federal securities laws and the applicable rules and regulations of the Securities and Exchange Commission and the PCAOB.
We conducted our audits of these financial statements in accordance with the standards of the PCAOB. Those standards require that we plan and perform the audit to obtain reasonable assurance about whether the financial statements are free of material misstatement, whether due to error or fraud.
Our audits included performing procedures to assess the risks of material misstatement of the financial statements, whether due to error or fraud, and performing procedures that respond to those risks. Such procedures included examining, on a test basis, evidence regarding the amounts and disclosures in the financial statements. Our audits also included evaluating the accounting principles used and significant estimates made by management, as well as evaluating the overall presentation of the financial statements. Our procedures included confirmation of securities owned as of October 31, 2024 by correspondence with the custodian, transfer agent and brokers; when replies were not received from brokers, we performed other auditing procedures. We believe that our audits provide a reasonable basis for our opinions.
/s/PricewaterhouseCoopers LLP
Philadelphia, Pennsylvania
December 20, 2024
We have served as the auditor of one or more BlackRock investment companies since 2000.
812024 iShares Annual Financial Statements and Additional Information
Important Tax Information (unaudited)
The Funds intend to pass through to their shareholders the following amounts, or maximum amounts allowable by law, of foreign source income earned and foreign taxes paid for the fiscal year ended October 31, 2024:
| Foreign Source
Income Earned | |
International High Yield Bond | | |
J.P. Morgan EM Corporate Bond | | |
J.P. Morgan EM High Yield Bond | | |
J.P. Morgan EM Local Currency Bond | | |
The Funds hereby designate the following amounts, or maximum amounts allowable by law, of distributions from direct federal obligation interest for the fiscal year ended October 31, 2024:
| Federal Obligation
Interest |
International High Yield Bond | |
J.P. Morgan EM Corporate Bond | |
J.P. Morgan EM High Yield Bond | |
J.P. Morgan EM Local Currency Bond | |
US & Intl High Yield Corp Bond | |
The law varies in each state as to whether and what percent of ordinary income dividends attributable to federal obligations is exempt from state income tax. Shareholders are advised to check with their tax advisers to determine if any portion of the dividends received is exempt from state income tax.
The Funds hereby designate the following amounts, or maximum amounts allowable by law, as interest income eligible to be treated as a Section 163(j) interest dividend for the fiscal year ended October 31, 2024:
| |
International High Yield Bond | |
J.P. Morgan EM Corporate Bond | |
J.P. Morgan EM High Yield Bond | |
J.P. Morgan EM Local Currency Bond | |
US & Intl High Yield Corp Bond | |
The Funds hereby designate the following amounts, or maximum amounts allowable by law, as interest-related dividends eligible for exemption from U.S. withholding tax for nonresident aliens and foreign corporations for the fiscal year ended October 31, 2024:
| Interest-Related
Dividends |
International High Yield Bond | |
J.P. Morgan EM Corporate Bond | |
J.P. Morgan EM High Yield Bond | |
J.P. Morgan EM Local Currency Bond | |
US & Intl High Yield Corp Bond | |
Important Tax Information82
Premium/Discount Information
Information on the Fund's net asset value, market price, premiums and discounts, and bid-ask spreads can be found at iShares.com.
Regulation under the Alternative Investment Fund Managers Directive
The Alternative Investment Fund Managers Directive, and its United Kingdom (“UK”) equivalent, (the “AIFMD”) impose detailed and prescriptive obligations on fund managers established in the European Union (the “EU”) and the UK. These do not currently apply to managers established outside of the EU or UK, such as BFA (the “Company”). However, the Company is required to comply with certain disclosure, reporting and transparency obligations of the AIFMD because it has registered the iShares J.P. Morgan EM High Yield Bond ETF and iShares J.P. Morgan EM Local Currency Bond ETF (the “Funds”) to be marketed to investors in the EU and/or UK.
BlackRock has a clear and well-defined pay-for-performance philosophy, and compensation programs which support that philosophy.
BlackRock operates a total compensation model for remuneration which includes a base salary, which is contractual, and a discretionary bonus scheme. Although all employees are eligible to receive a discretionary bonus, there is no contractual obligation to make a discretionary bonus award to any employees. For senior management and staff who have the ability to materially affect the risk profile of the Funds, a significant percentage of variable remuneration is deferred over time. All employees are subject to a clawback policy.
Remuneration decisions for employees are made once annually in January following the end of the performance year, based on BlackRock’s full-year financial results and other non-financial goals and objectives. Alongside financial performance, individual total compensation is also based on strategic and operating results and other considerations such as management and leadership capabilities. No set formulas are established and no fixed benchmarks are used in determining annual incentive awards.
Annual incentive awards are paid from a bonus pool which is reviewed throughout the year by BlackRock's independent compensation committee, taking into account both actual and projected financial information together with information provided by the Enterprise Risk and Regulatory Compliance departments in relation to any activities, incidents or events that warrant consideration in making compensation decisions. Individuals are not involved in setting their own remuneration.
Each of the control functions (Enterprise Risk, Legal & Compliance, Finance, Human Resources and Internal Audit) each have their own organizational structures which are independent of the business units and therefore staff members in control functions are remunerated independently of the businesses they oversee. Functional bonus pools for those control functions are determined with reference to the performance of each individual function and the remuneration of the senior members of control functions is directly overseen by BlackRock's independent remuneration committee.
The Company is required under the AIFMD to make quantitative disclosures of remuneration. These disclosures are made in line with BlackRock’s interpretation of currently available regulatory guidance on quantitative remuneration disclosures. As market or regulatory practice develops BlackRock may consider it appropriate to make changes to the way in which quantitative remuneration disclosures are calculated. Where such changes are made, this may result in disclosures in relation to a fund not being comparable to the disclosures made in the prior year, or in relation to other BlackRock fund disclosures in that same year. BlackRock bases its proportionality approach on a combination of factors that it is entitled to take into account based on relevant guidelines.
Remuneration information at an individual Fund level is not readily available. Disclosures are provided in relation to (a) the staff of the Company; (b) staff who are senior management; (c) staff who have the ability to materially affect the risk profile of the Funds; and (d) staff of companies to which portfolio management and risk management has been formally delegated.
All individuals included in the aggregated figures disclosed are rewarded in line with BlackRock’s remuneration policy for their responsibilities across the relevant BlackRock business area. As all individuals have a number of areas of responsibilities, only the portion of remuneration for those individuals’ services attributable to the Funds is included in the aggregate figures disclosed.
Members of staff and senior management of the Company typically provide both AIFMD and non-AIFMD related services in respect of multiple funds, clients and functions of the Company and across the broader BlackRock group. Conversely, members of staff and senior management of the broader BlackRock group may provide both AIFMD and non-AIFMD related services in respect of multiple funds, clients and functions of the broader BlackRock group and of the Company. Therefore, the figures disclosed are a sum of individuals’ portion of remuneration attributable to the Company according to an objective apportionment methodology which acknowledges the multiple-service nature of the Company and the broader BlackRock group. Accordingly, the figures are not representative of any individual’s actual remuneration or their remuneration structure.
The amount of the total remuneration awarded to the Company’s staff in respect of the Company’s financial year ending December 31, 2023 was USD 5.43m. This figure is comprised of fixed remuneration of USD 0.74m and variable remuneration of USD 4.68m. There was a total of 8 beneficiaries of the remuneration described above.
The amount of the aggregate remuneration awarded by the Company in respect of the Company’s financial year ending December 31, 2023, to its senior management was USD 3.66m, and to other members of its staff whose actions potentially have a material impact on the risk profile of the Company or its funds was USD 1.77m.
832024 iShares Annual Financial Statements and Additional Information
Additional Information (continued)
Disclosures Under the EU Sustainable Finance Disclosure Regulation
The iShares J.P. Morgan EM High Yield Bond ETF and iShares J.P. Morgan EM Local Currency Bond ETF (the "Funds") are registered under the Alternative Investment Fund Managers Directive to be marketed to European Union (“EU”) investors, as noted above. As a result, certain disclosures are required under the EU Sustainable Finance Disclosure Regulation (“SFDR”).
Each Fund has not been categorized under the SFDR as an “Article 8” or “Article 9” product. In addition, Fund’s investment strategy does not take into account the criteria for environmentally sustainable economic activities under the EU sustainable investment taxonomy regulation or principal adverse impacts (“PAIs”) on sustainability factors under the SFDR. PAIs are identified under the SFDR as the material impacts of investment decisions on sustainability factors relating to environmental, social and employee matters, respect for human rights, and anti-corruption and anti-bribery matters.
Shareholders can sign up for e-mail notifications announcing that the shareholder report or prospectus has been posted on the iShares website at iShares.com. Once you have enrolled, you will no longer receive prospectuses and shareholder reports in the mail.
To enroll in electronic delivery:
• Go to icsdelivery.com.
• If your brokerage firm is not listed, electronic delivery may not be available. Please contact your broker-dealer or financial advisor.
Changes in and Disagreements with Accountants
Remuneration Paid to Trustees, Officers, and Others
Because BFA has agreed in the Investment Advisory Agreements to cover all operating expenses of the Funds, subject to certain exclusions as provided for therein, BFA pays the compensation to each Independent Trustee for services to the Funds from BFA's investment advisory fees.
Availability of Portfolio Holdings Information
A description of the Company’s policies and procedures with respect to the disclosure of the Fund’s portfolio securities is available in the Fund Prospectus. The Fund discloses its portfolio holdings daily and provides information regarding its top holdings in Fund fact sheets, when available, at iShares.com.
Board Review and Approval of Investment Advisory Contract
iShares International High Yield Bond ETF, iShares J.P. Morgan EM Corporate Bond ETF, iShares J.P. Morgan EM High Yield Bond ETF, iShares US & Intl High Yield Corp Bond ETF (each the “Fund”)
Under Section 15(c) of the Investment Company Act of 1940 (the “1940 Act”), the Company's Board of Directors (the “Board”), including a majority of Board Members who are not “interested persons” of the Company (as that term is defined in the 1940 Act) (the “Independent Board Members”), is required annually to consider the approval of the Investment Advisory Agreement between the Company and BFA (the “Advisory Agreement”), and the Sub-Advisory Agreement between BFA and BlackRock International Limited, (together the “Advisory Agreements”), on behalf of the Fund. The Board’s consideration entails a year-long process whereby the Board and its committees (composed solely of Independent Board Members) assess BlackRock’s services to the Fund, including investment management; fund accounting; administrative and shareholder services; oversight of the Fund’s service providers; risk management and oversight; and legal and compliance services; including the ability to meet applicable legal and regulatory requirements. The Independent Board Members requested, and BFA provided, such information as the Independent Board Members, with advice from independent counsel, deemed reasonably necessary to evaluate the Advisory Agreements. At meetings held on May 6, 2024 and May 17, 2024, a committee composed of all of the Independent Board Members (the “15(c) Committee”), with independent counsel, met with management and reviewed and discussed information provided in response to initial requests of the 15(c) Committee and/or its independent counsel. Prior to and in preparation for the meeting, the Board received and reviewed materials specifically relating to matters relevant to the renewal of the Advisory Agreement. Following discussion, the 15(c) Committee subsequently requested certain additional information, which management agreed to provide. At a meeting held on June 4-5, 2024, the Board, including the Independent Board Members, reviewed the additional information provided by management in response to these requests.
After extensive discussions and deliberations, the Board, including all of the Independent Board Members, approved the continuance of the Advisory Agreements for the Fund, based on a review of qualitative and quantitative information provided by BFA and their cumulative experience as Board Members. The Board noted its satisfaction with the extent and quality of information provided and its frequent interactions with management, as well as the detailed responses and other information provided by BFA. The Independent Board Members were advised by their independent counsel throughout the process, including about the legal standards applicable to their review. In approving the continuance of the Advisory Agreements for the Fund, the Board, including the Independent Board Members, considered various factors, including: (i) the expenses and performance of the Fund; (ii) the nature, extent and quality of the services provided by BFA and BlackRock International Limited; (iii) the costs of services provided to the Fund and profits realized by BFA and its affiliates; (iv) potential economies of scale and the sharing of related benefits; (v) the fees and services provided for other comparable funds/accounts managed by BFA and its affiliates; and (vi) other benefits to BFA and/or its affiliates. The Board Members did not identify any particular information or any single factor as determinative, and each Board Member may have attributed different weights to the various matters and factors considered. The material factors, considerations and conclusions that formed the basis for the Board, including the Independent Board Members, to approve the continuance of the Advisory Agreements are discussed below.
Expenses and Performance of the Fund: The Board reviewed statistical information prepared by Broadridge Financial Solutions, Inc. (“Broadridge”), an independent provider of investment company data, regarding the expense ratio components, including gross and net total expenses, fees and expenses of other fund(s) in which the Fund invests (if applicable), and waivers/reimbursements (if applicable) of the Fund in comparison with the same information for other ETFs, objectively selected by Broadridge as comprising the Fund’s applicable expense peer group pursuant to Broadridge’s proprietary ETF methodology (the “Peer Group”). The Board was provided with a detailed description of the proprietary ETF methodology used by Broadridge to determine the Fund’s Peer Group. The Board noted that, due to the limitations in providing comparable funds in the Peer Group, the statistical information provided in Broadridge’s report may or may not provide meaningful direct comparisons to the Fund in all instances. The Board also noted that the investment advisory fee rate and overall expenses (net of any waivers and reimbursements) for the Fund were higher than the median of the investment advisory fee rates and overall expenses (net of any waivers and reimbursements) of the funds in its Peer Group, excluding iShares funds. The Board further noted that BFA pays BlackRock International Limited for sub-advisory services, and that there are no additional fees imposed on the Fund in respect of the services provided under the Sub-Advisory Agreement(s).
In addition, to the extent that any of the comparison funds included in the Peer Group, excluding iShares funds, track the same index as the Fund, Broadridge also provided, and the Board reviewed, a comparison of the Fund’s performance for the one-year, three-year, five-year, ten-year, and since inception periods, as applicable, and for the quarter ended December 31, 2023, to that of such relevant comparison fund(s) for the same periods. The Board noted that the Fund seeks to track its specified underlying index and that, during the year, the Board received periodic reports on the Fund’s short- and longer-term performance in comparison with its underlying index. Such periodic comparative performance information, including additional detailed information as requested by the Board, was also considered. The Board noted that the Fund generally performed in line with its underlying index over the relevant periods.
Based on this review, the other relevant factors and information considered at the meeting, and their general knowledge of ETF pricing, the Board concluded that the investment advisory fee rate and expense level and the historical performance of the Fund supported the Board’s approval of the continuance of the Advisory Agreements for the coming year.
Nature, Extent and Quality of Services Provided: Based on management’s representations, including information about ongoing enhancements and initiatives with respect to the iShares product line and BFA’s business, including with respect to capital markets support and analysis, technology, portfolio management, product design and quality, compliance and risk management, global public policy and other services, the Board expected that there would be no diminution in the scope of services required of or provided by BFA and BlackRock International Limited under the Advisory Agreements for the coming year as compared with the scope of services provided by BFA during prior years. In reviewing the scope of these services, the Board considered BFA’s investment philosophy and experience, noting that BFA and its affiliates have committed significant resources over time, including during the past year, to support the iShares funds and their shareholders and have made significant investments into the iShares business. The Board also considered BFA’s compliance program and its compliance record with respect to the Fund, including related programs implemented pursuant to regulatory requirements. In that regard, the Board noted that BFA reports to the Board about portfolio management and compliance matters on a periodic basis in connection with regularly scheduled meetings of the Board, and on other occasions as necessary and appropriate, and has provided information and made relevant officers and other employees of BFA (and its affiliates) available as needed to provide further assistance with these matters. The Board also reviewed the
852024 iShares Annual Financial Statements and Additional Information
Board Review and Approval of Investment Advisory Contract (continued)
background and experience of the persons responsible for the day-to-day management of the Fund, including those of the Sub-Advisor(s), as well as the resources available to them in managing the Fund. In addition to the above considerations, the Board reviewed and considered detailed presentations regarding investment performance, investment and risk management processes and strategies for BFA and BlackRock International Limited, which were provided at the May 6, 2024 meeting and throughout the year and matters related to BFA’s portfolio compliance program and other compliance programs and services, as well as BlackRock’s continued investments in its ETF business.
Based on review of this information, and the performance information discussed above, the Board concluded that the nature, extent and quality of services provided to the Fund under the Advisory Agreements supported the Board’s approval of the continuance of the Advisory Agreements for the coming year.
Costs of Services Provided to the Fund and Profits Realized by BFA and its Affiliates: The Board reviewed information about the estimated profitability to BlackRock in managing the Fund, based on the fees payable to BFA and its affiliates (including fees under the Advisory Agreement), and other sources of revenue and expense to BFA and its affiliates from the Fund’s operations for the last calendar year. The Board reviewed BlackRock’s methodology for calculating estimated profitability of the iShares funds, noting that the 15(c) Committee and the Board had focused on the methodology and profitability presentation. The Board recognized that profitability may be affected by numerous factors, including, among other things, fee waivers by BFA, the types of funds managed, expense allocations and business mix. The Board thus recognized that calculating and comparing profitability at individual fund levels is challenging. The Board discussed with management the sources of direct and ancillary revenue, including the revenues to BTC, a BlackRock affiliate, from securities lending by the Fund. The Board also discussed BFA’s estimated profit margin as reflected in the Fund’s profitability analysis and reviewed information regarding potential economies of scale (as discussed below).
Based on this review, the Board concluded that the information considered with respect to the profits realized by BFA and its affiliates under the Advisory Agreements and from other relationships between the Fund and BFA and/or its affiliates, if any, and related costs of the services provided as well as the other factors considered at the meeting, supported the Board’s approval of the continuance of the Advisory Agreements for the coming year.
Economies of Scale: The Board reviewed information and considered the extent to which economies of scale might be realized as the assets of the Fund increase, noting that the issue of potential economies of scale had been focused on by the 15(c) Committee and the Board during their meetings and addressed by management. The 15(c) Committee and the Board received information regarding BlackRock’s historical estimated profitability (as discussed above), including BFA’s and its affiliates’ estimated costs in providing services. The estimated cost information distinguished, among other things, between fixed and variable costs, and showed how the level and nature of fixed and variable costs may impact the existence or size of scale benefits, with the Board recognizing that potential economies of scale are difficult to measure. The 15(c) Committee and the Board reviewed information provided by BFA regarding the sharing of scale benefits with the iShares funds through various means, including, as applicable, through breakpoints, waivers or other fee reductions, as well as through additional investment in the iShares business, including enhancements to or the provision of additional infrastructure and services to the iShares funds and their shareholders and, with respect to New Funds, set management fees at levels that anticipate scale over time. The Board noted that the Advisory Agreement for the Fund did not provide for breakpoints in the Fund’s investment advisory fee rate as the assets of the Fund increase. However, the Board noted that it would continue to assess the appropriateness of adding breakpoints in the future.
The Board concluded that this review of potential economies of scale and the sharing of related benefits, as well as the other factors considered at the meeting, supported the Board’s approval of the continuance of the Advisory Agreements for the coming year.
Fees and Services Provided for Other Comparable Funds/Accounts Managed by BFA and its Affiliates: The Board received and considered information regarding the investment advisory/management fee rates for other funds/accounts in the U.S. for which BFA (or its affiliates) provides investment advisory/management services, including open-end funds registered under the 1940 Act (including sub-advised funds), collective trust funds and institutional separate accounts (collectively, the “Other Accounts”).
The Board received detailed information regarding how the Other Accounts generally differ from the Fund, including in terms of the types of services and generally more extensive character and scope of services provided to the Fund, as well as other significant differences. In that regard, the Board considered that the pricing of services to institutional clients is typically based on a number of factors beyond the nature and extent of the specific services to be provided and often depends on the overall relationship between the client and its affiliates and the adviser and its affiliates. In addition, the Board considered the relative complexity and inherent risks and challenges of managing and providing other services to the Fund, as a publicly traded investment vehicle, as compared to the Other Accounts, particularly those that are institutional clients, in light of differing regulatory requirements and client-imposed mandates. The Board acknowledged BFA’s representation that the iShares funds are fundamentally different investment vehicles from the Other Accounts in its consideration of relevant qualitative and quantitative comparative information provided. The Board noted that BFA and its affiliates do not manage Other Accounts with substantially the same investment objective and strategy as the Fund and that track the same index as the Fund. The Board also acknowledged management’s assertion that, for certain iShares funds, and for client segmentation purposes, BlackRock has launched an iShares fund that may provide a similar investment exposure at a lower investment advisory fee rate.
The Board considered the “all-inclusive” nature of the Fund’s advisory fee structure, and the Fund’s expenses borne by BFA under this arrangement and noted that the investment advisory fee rate under the Advisory Agreement for the Fund was generally higher than the investment advisory/management fee rates for certain of the Other Accounts (particularly institutional clients) and concluded that the differences appeared to be consistent with the factors discussed.
Other Benefits to BFA and/or its Affiliates: The Board reviewed other benefits or ancillary revenue received by BFA and/or its affiliates in connection with the services provided to the Fund by BFA, both direct and indirect, including, but not limited to, payment of revenue to BTC, the Fund’s securities lending agent, for loaning portfolio securities, as applicable (which was included in the profit margins reviewed by the Board pursuant to BFA’s estimated profitability methodology), payment of advisory fees or other fees to BFA (or its affiliates) in connection with any investments by the Fund in other funds (including cash sweep vehicles) for which BFA (or its affiliates) provides investment advisory services or other services, and BlackRock’s profile in the investment community. The Board further considered other direct benefits that might accrue to BFA, including the actual and potential reductions in the Fund’s expenses that are borne by BFA under the “all-inclusive” management fee arrangement, due in part to
Board Review and Approval of Investment Advisory Contract86
Board Review and Approval of Investment Advisory Contract (continued)
the size and scope of BFA’s investment operations servicing the Fund (and other funds in the iShares complex) as well as in response to a changing market environment. The Board also reviewed and considered information provided by BFA concerning authorized participant primary market order processing services that are provided by BlackRock Investments, LLC (“BRIL”), an affiliate of BFA, and paid for by authorized participants under the ETF Servicing Platform. The Board also noted the revenue received by BFA and/or its affiliates pursuant to an agreement that permits a service provider to use certain portions of BlackRock’s technology platform to service accounts managed by BFA and/or its affiliates, including the iShares funds. The Board noted that BFA generally does not use soft dollars or consider the value of research or other services that may be provided to BFA (including its affiliates) in selecting brokers for portfolio transactions for the Fund. The Board concluded that any such ancillary benefits would not be disadvantageous to the Fund and thus would not alter the Board’s conclusion with respect to the appropriateness of approving the continuance of the Advisory Agreements for the coming year.
Conclusion: Based on a review of the factors described above, as well as such other factors as deemed appropriate by the Board, the Board, including all of the Independent Board Members, determined that the Fund’s investment advisory fee rate under the Advisory Agreement does not constitute a fee that is so disproportionately large as to bear no reasonable relationship to the services rendered and that could not have been the product of arm’s-length bargaining, and concluded to approve the continuance of the Advisory Agreements for the coming year.
iShares J.P. Morgan EM Local Currency Bond ETF (the “Fund”)
Under Section 15(c) of the Investment Company Act of 1940 (the “1940 Act”), the Company's Board of Directors (the “Board”), including a majority of Board Members who are not “interested persons” of the Company (as that term is defined in the 1940 Act) (the “Independent Board Members”), is required annually to consider the approval of the Investment Advisory Agreement between the Company and BFA (the “Advisory Agreement”), and the Sub-Advisory Agreement between BFA and BlackRock International Limited & BlackRock (Singapore) Limited, (together the “Advisory Agreements”), on behalf of the Fund. The Board’s consideration entails a year-long process whereby the Board and its committees (composed solely of Independent Board Members) assess BlackRock’s services to the Fund, including investment management; fund accounting; administrative and shareholder services; oversight of the Fund’s service providers; risk management and oversight; and legal and compliance services; including the ability to meet applicable legal and regulatory requirements. The Independent Board Members requested, and BFA provided, such information as the Independent Board Members, with advice from independent counsel, deemed reasonably necessary to evaluate the Advisory Agreements. At meetings held on May 6, 2024 and May 17, 2024, a committee composed of all of the Independent Board Members (the “15(c) Committee”), with independent counsel, met with management and reviewed and discussed information provided in response to initial requests of the 15(c) Committee and/or its independent counsel. Prior to and in preparation for the meeting, the Board received and reviewed materials specifically relating to matters relevant to the renewal of the Advisory Agreement. Following discussion, the 15(c) Committee subsequently requested certain additional information, which management agreed to provide. At a meeting held on June 4-5, 2024, the Board, including the Independent Board Members, reviewed the additional information provided by management in response to these requests.
After extensive discussions and deliberations, the Board, including all of the Independent Board Members, approved the continuance of the Advisory Agreements for the Fund, based on a review of qualitative and quantitative information provided by BFA and their cumulative experience as Board Members. The Board noted its satisfaction with the extent and quality of information provided and its frequent interactions with management, as well as the detailed responses and other information provided by BFA. The Independent Board Members were advised by their independent counsel throughout the process, including about the legal standards applicable to their review. In approving the continuance of the Advisory Agreements for the Fund, the Board, including the Independent Board Members, considered various factors, including: (i) the expenses and performance of the Fund; (ii) the nature, extent and quality of the services provided by BFA and BlackRock International Limited & BlackRock (Singapore) Limited; (iii) the costs of services provided to the Fund and profits realized by BFA and its affiliates; (iv) potential economies of scale and the sharing of related benefits; (v) the fees and services provided for other comparable funds/accounts managed by BFA and its affiliates; and (vi) other benefits to BFA and/or its affiliates. The Board Members did not identify any particular information or any single factor as determinative, and each Board Member may have attributed different weights to the various matters and factors considered. The material factors, considerations and conclusions that formed the basis for the Board, including the Independent Board Members, to approve the continuance of the Advisory Agreements are discussed below.
Expenses and Performance of the Fund: The Board reviewed statistical information prepared by Broadridge Financial Solutions, Inc. (“Broadridge”), an independent provider of investment company data, regarding the expense ratio components, including gross and net total expenses, fees and expenses of other fund(s) in which the Fund invests (if applicable), and waivers/reimbursements (if applicable) of the Fund in comparison with the same information for other ETFs, objectively selected by Broadridge as comprising the Fund’s applicable expense peer group pursuant to Broadridge’s proprietary ETF methodology (the “Peer Group”). The Board was provided with a detailed description of the proprietary ETF methodology used by Broadridge to determine the Fund’s Peer Group. The Board noted that, due to the limitations in providing comparable funds in the Peer Group, the statistical information provided in Broadridge’s report may or may not provide meaningful direct comparisons to the Fund in all instances. The Board also noted that the investment advisory fee rate and overall expenses (net of any waivers and reimbursements) for the Fund were lower than the median of the investment advisory fee rates and overall expenses (net of any waivers and reimbursements) of the funds in its Peer Group, excluding iShares funds. The Board further noted that BFA pays BlackRock International Limited & BlackRock (Singapore) Limited for sub-advisory services, and that there are no additional fees imposed on the Fund in respect of the services provided under the Sub-Advisory Agreement(s).
In addition, to the extent that any of the comparison funds included in the Peer Group, excluding iShares funds, track the same index as the Fund, Broadridge also provided, and the Board reviewed, a comparison of the Fund’s performance for the one-year, three-year, five-year, ten-year, and since inception periods, as applicable, and for the quarter ended December 31, 2023, to that of such relevant comparison fund(s) for the same periods. The Board noted that the Fund seeks to track its specified underlying index and that, during the year, the Board received periodic reports on the Fund’s short- and longer-term performance in comparison with its underlying index. Such periodic comparative performance information, including additional detailed information as requested by the Board, was also considered. The Board noted that the Fund generally performed in line with its underlying index over the relevant periods.
872024 iShares Annual Financial Statements and Additional Information
Board Review and Approval of Investment Advisory Contract (continued)
Based on this review, the other relevant factors and information considered at the meeting, and their general knowledge of ETF pricing, the Board concluded that the investment advisory fee rate and expense level and the historical performance of the Fund supported the Board’s approval of the continuance of the Advisory Agreements for the coming year.
Nature, Extent and Quality of Services Provided: Based on management’s representations, including information about ongoing enhancements and initiatives with respect to the iShares product line and BFA’s business, including with respect to capital markets support and analysis, technology, portfolio management, product design and quality, compliance and risk management, global public policy and other services, the Board expected that there would be no diminution in the scope of services required of or provided by BFA and BlackRock International Limited & BlackRock (Singapore) Limited under the Advisory Agreements for the coming year as compared with the scope of services provided by BFA during prior years. In reviewing the scope of these services, the Board considered BFA’s investment philosophy and experience, noting that BFA and its affiliates have committed significant resources over time, including during the past year, to support the iShares funds and their shareholders and have made significant investments into the iShares business. The Board also considered BFA’s compliance program and its compliance record with respect to the Fund, including related programs implemented pursuant to regulatory requirements. In that regard, the Board noted that BFA reports to the Board about portfolio management and compliance matters on a periodic basis in connection with regularly scheduled meetings of the Board, and on other occasions as necessary and appropriate, and has provided information and made relevant officers and other employees of BFA (and its affiliates) available as needed to provide further assistance with these matters. The Board also reviewed the background and experience of the persons responsible for the day-to-day management of the Fund, including those of the Sub-Advisor(s), as well as the resources available to them in managing the Fund. In addition to the above considerations, the Board reviewed and considered detailed presentations regarding investment performance, investment and risk management processes and strategies for BFA and BlackRock International Limited & BlackRock (Singapore) Limited, which were provided at the May 6, 2024 meeting and throughout the year and matters related to BFA’s portfolio compliance program and other compliance programs and services, as well as BlackRock’s continued investments in its ETF business.
Based on review of this information, and the performance information discussed above, the Board concluded that the nature, extent and quality of services provided to the Fund under the Advisory Agreements supported the Board’s approval of the continuance of the Advisory Agreements for the coming year.
Costs of Services Provided to the Fund and Profits Realized by BFA and its Affiliates: The Board reviewed information about the estimated profitability to BlackRock in managing the Fund, based on the fees payable to BFA and its affiliates (including fees under the Advisory Agreement), and other sources of revenue and expense to BFA and its affiliates from the Fund’s operations for the last calendar year. The Board reviewed BlackRock’s methodology for calculating estimated profitability of the iShares funds, noting that the 15(c) Committee and the Board had focused on the methodology and profitability presentation. The Board recognized that profitability may be affected by numerous factors, including, among other things, fee waivers by BFA, the types of funds managed, expense allocations and business mix. The Board thus recognized that calculating and comparing profitability at individual fund levels is challenging. The Board discussed with management the sources of direct and ancillary revenue, including the revenues to BTC, a BlackRock affiliate, from securities lending by the Fund. The Board also discussed BFA’s estimated profit margin as reflected in the Fund’s profitability analysis and reviewed information regarding potential economies of scale (as discussed below).
Based on this review, the Board concluded that the information considered with respect to the profits realized by BFA and its affiliates under the Advisory Agreements and from other relationships between the Fund and BFA and/or its affiliates, if any, and related costs of the services provided as well as the other factors considered at the meeting, supported the Board’s approval of the continuance of the Advisory Agreements for the coming year.
Economies of Scale: The Board reviewed information and considered the extent to which economies of scale might be realized as the assets of the Fund increase, noting that the issue of potential economies of scale had been focused on by the 15(c) Committee and the Board during their meetings and addressed by management. The 15(c) Committee and the Board received information regarding BlackRock’s historical estimated profitability (as discussed above), including BFA’s and its affiliates’ estimated costs in providing services. The estimated cost information distinguished, among other things, between fixed and variable costs, and showed how the level and nature of fixed and variable costs may impact the existence or size of scale benefits, with the Board recognizing that potential economies of scale are difficult to measure. The 15(c) Committee and the Board reviewed information provided by BFA regarding the sharing of scale benefits with the iShares funds through various means, including, as applicable, through breakpoints, waivers or other fee reductions, as well as through additional investment in the iShares business, including enhancements to or the provision of additional infrastructure and services to the iShares funds and their shareholders and, with respect to New Funds, set management fees at levels that anticipate scale over time. The Board noted that the Advisory Agreement for the Fund did not provide for breakpoints in the Fund’s investment advisory fee rate as the assets of the Fund increase. However, the Board noted that it would continue to assess the appropriateness of adding breakpoints in the future.
The Board concluded that this review of potential economies of scale and the sharing of related benefits, as well as the other factors considered at the meeting, supported the Board’s approval of the continuance of the Advisory Agreements for the coming year.
Fees and Services Provided for Other Comparable Funds/Accounts Managed by BFA and its Affiliates: The Board received and considered information regarding the investment advisory/management fee rates for other funds/accounts in the U.S. for which BFA (or its affiliates) provides investment advisory/management services, including open-end funds registered under the 1940 Act (including sub-advised funds), collective trust funds and institutional separate accounts (collectively, the “Other Accounts”).
The Board received detailed information regarding how the Other Accounts generally differ from the Fund, including in terms of the types of services and generally more extensive character and scope of services provided to the Fund, as well as other significant differences. In that regard, the Board considered that the pricing of services to institutional clients is typically based on a number of factors beyond the nature and extent of the specific services to be provided and often depends on the overall relationship between the client and its affiliates and the adviser and its affiliates. In addition, the Board considered the relative complexity and inherent risks and challenges of managing and providing other services to the Fund, as a publicly traded investment vehicle, as compared to the Other Accounts, particularly those that are institutional clients, in light of differing regulatory requirements and client-imposed mandates. The Board acknowledged BFA’s representation that the iShares funds are fundamentally different investment vehicles from the Other Accounts in its consideration of relevant qualitative and quantitative comparative information provided. The Board noted that
Board Review and Approval of Investment Advisory Contract88
Board Review and Approval of Investment Advisory Contract (continued)
BFA and its affiliates do not manage Other Accounts with substantially the same investment objective and strategy as the Fund and that track the same index as the Fund. The Board also acknowledged management’s assertion that, for certain iShares funds, and for client segmentation purposes, BlackRock has launched an iShares fund that may provide a similar investment exposure at a lower investment advisory fee rate.
The Board considered the “all-inclusive” nature of the Fund’s advisory fee structure, and the Fund’s expenses borne by BFA under this arrangement and noted that the investment advisory fee rate under the Advisory Agreement for the Fund was generally higher than the investment advisory/management fee rates for certain of the Other Accounts (particularly institutional clients) and concluded that the differences appeared to be consistent with the factors discussed.
Other Benefits to BFA and/or its Affiliates: The Board reviewed other benefits or ancillary revenue received by BFA and/or its affiliates in connection with the services provided to the Fund by BFA, both direct and indirect, including, but not limited to, payment of revenue to BTC, the Fund’s securities lending agent, for loaning portfolio securities, as applicable (which was included in the profit margins reviewed by the Board pursuant to BFA’s estimated profitability methodology), payment of advisory fees or other fees to BFA (or its affiliates) in connection with any investments by the Fund in other funds (including cash sweep vehicles) for which BFA (or its affiliates) provides investment advisory services or other services, and BlackRock’s profile in the investment community. The Board further considered other direct benefits that might accrue to BFA, including the actual and potential reductions in the Fund’s expenses that are borne by BFA under the “all-inclusive” management fee arrangement, due in part to the size and scope of BFA’s investment operations servicing the Fund (and other funds in the iShares complex) as well as in response to a changing market environment. The Board also reviewed and considered information provided by BFA concerning authorized participant primary market order processing services that are provided by BlackRock Investments, LLC (“BRIL”), an affiliate of BFA, and paid for by authorized participants under the ETF Servicing Platform. The Board also noted the revenue received by BFA and/or its affiliates pursuant to an agreement that permits a service provider to use certain portions of BlackRock’s technology platform to service accounts managed by BFA and/or its affiliates, including the iShares funds. The Board noted that BFA generally does not use soft dollars or consider the value of research or other services that may be provided to BFA (including its affiliates) in selecting brokers for portfolio transactions for the Fund. The Board concluded that any such ancillary benefits would not be disadvantageous to the Fund and thus would not alter the Board’s conclusion with respect to the appropriateness of approving the continuance of the Advisory Agreements for the coming year.
Conclusion: Based on a review of the factors described above, as well as such other factors as deemed appropriate by the Board, the Board, including all of the Independent Board Members, determined that the Fund’s investment advisory fee rate under the Advisory Agreement does not constitute a fee that is so disproportionately large as to bear no reasonable relationship to the services rendered and that could not have been the product of arm’s-length bargaining, and concluded to approve the continuance of the Advisory Agreements for the coming year.
892024 iShares Annual Financial Statements and Additional Information
Glossary of Terms Used in this Report
|
| Capital Appreciation Bonds |
| Closed Joint Stock Company |
| Constant Maturity Treasury |
| Euro Interbank Offered Rate |
| |
| London Interbank Offered Rate |
| |
| |
| Public Joint Stock Company |
| Real Estate Investment Trust |
| Secured Overnight Financing Rate |
| |
Glossary of Terms Used in this Report90
912024 iShares Annual Financial Statements and Additional Information
THIS PAGE INTENTIONALLY LEFT BLANK.
THIS PAGE INTENTIONALLY LEFT BLANK.
THIS PAGE INTENTIONALLY LEFT BLANK.
THIS PAGE INTENTIONALLY LEFT BLANK.
Want to know more?
iShares.com | 1-800-474-2737
This report is intended for the Funds’ shareholders. It may not be distributed to prospective investors unless it is preceded or accompanied by the current prospectus.
Investing involves risk, including possible loss of principal.
The iShares Funds are distributed by BlackRock Investments, LLC (together with its affiliates, “BlackRock”).
The iShares Funds are not sponsored, endorsed, issued, sold or promoted by JPMorgan Chase & Co. or Markit Indices Limited, nor do these companies make any representation regarding the advisability of investing in the iShares Funds. BlackRock is not affiliated with the companies listed above.
©2024 BlackRock, Inc. All rights reserved. iSHARES and BLACKROCK are registered trademarks of BlackRock, Inc. or its subsidiaries. All other marks are the property of their respective owners.
| Item 8 – | Changes in and Disagreements with Accountants for Open-End Management Investment Companies – See Item 7 |
| Item 9 – | Proxy Disclosures for Open-End Management Investment Companies – See Item 7 |
| Item 10 – | Remuneration Paid to Directors, Officers, and Others of Open-End Management Investment Companies – See Item 7 |
| Item 11 – | Statement Regarding Basis for Approval of Investment Advisory Contract – See Item 7 |
| Item 12 – | Disclosure of Proxy Voting Policies and Procedures for Closed-End Management Investment Companies – Not Applicable |
| Item 13 – | Portfolio Managers of Closed-End Management Investment Companies – Not Applicable |
| Item 14 – | Purchases of Equity Securities by Closed-End Management Investment Company and Affiliated Purchasers – Not Applicable |
| Item 15 – | Submission of Matters to a Vote of Security Holders – There have been no material changes to these procedures. |
| Item 16 – | Controls and Procedures |
(a) The registrant’s principal executive and principal financial officers, or persons performing similar functions, have concluded that the registrant’s disclosure controls and procedures (as defined in Rule 30a-3(c) under the Investment Company Act of 1940, as amended (the “1940 Act”)) are effective as of a date within 90 days of the filing date of this report based on the evaluation of these controls and procedures required by Rule 30a-3(b) under the 1940 Act and Rule 13a-15(b) or 15d-15(b) under the Securities Exchange Act of 1934, as amended.
(b) There were no changes in the registrant’s internal control over financial reporting (as defined in Rule 30a-3(d) under the 1940 Act) that occurred during the period covered by this report that have materially affected, or are reasonably likely to materially affect, the registrant’s internal control over financial reporting.
| Item 17 – | Disclosure of Securities Lending Activities for Closed-End Management Investment Companies – Not Applicable |
| Item 18 – | Recovery of Erroneously Awarded Compensation – Not Applicable |
| Item 19 – | Exhibits attached hereto |
(a)(1) Code of Ethics – See Item 2
(a)(2) Any policy required by the listing standards adopted pursuant to Rule 10D-1 under the Exchange Act (17 CFR 240.10D-1) by the registered national securities exchange or registered national securities association upon which the registrant’s securities are listed – Not Applicable
(a)(3) Section 302 Certifications are attached
(a)(4) Any written solicitation to purchase securities under Rule 23c-1 – Not Applicable
(a)(5) Change in registrant’s independent public accountant – Not Applicable
(b) Section 906 Certifications are attached
Pursuant to the requirements of the Securities Exchange Act of 1934 and the Investment Company Act of 1940, the registrant has duly caused this report to be signed on its behalf by the undersigned, thereunto duly authorized.
iShares, Inc.
| | | | |
| | By: | | /s/ Jessica Tan |
| | | | Jessica Tan |
| | | | President (principal executive officer) of |
| | | | iShares, Inc. |
Date: December 20, 2024
Pursuant to the requirements of the Securities Exchange Act of 1934 and the Investment Company Act of 1940, this report has been signed below by the following persons on behalf of the registrant and in the capacities and on the dates indicated.
| | | | |
| | By: | | /s/ Jessica Tan |
| | | | Jessica Tan |
| | | | President (principal executive officer) of |
| | | | iShares, Inc. |
Date: December 20, 2024
| | | | |
| | By: | | /s/ Trent Walker |
| | | | Trent Walker |
| | | | Treasurer and Chief Financial Officer (principal financial officer) of |
| | | | iShares, Inc. |
Date: December 20, 2024