Item 1: Report to Shareholders| Capital Opportunity Fund | December 31, 2005 |
The views and opinions in this report were current as of December 31, 2005. They are not guarantees of performance or investment results and should not be taken as investment advice. Investment decisions reflect a variety of factors, and the managers reserve the right to change their views about individual stocks, sectors, and the markets at any time. As a result, the views expressed should not be relied upon as a forecast of the fund’s future investment intent. The report is certified under the Sarbanes-Oxley Act of 2002, which requires mutual funds and other public companies to affirm that, to the best of their knowledge, the information in their financial reports is fairly and accurately stated in all material respects.
REPORTS ON THE WEB
Sign up for our E-mail Program, and you can begin to receive updated fund reports and prospectuses online rather than through the mail. Log in to your account at troweprice.com for more information.
Fellow Shareholders
For the third consecutive year, U.S. stocks generated positive results, though returns in 2005 were lower than in the prior two years. Despite an eventful year that featured record-high oil prices, the longest series of Federal Reserve interest rate hikes in more than 25 years, and one of the most damaging hurricane seasons in U.S. history, the stock market spent much of the year in a holding pattern, buffeted by contradictory influences. However, stocks advanced in fits and starts over the last half of the year, resulting in mid-single-digit gains for the major stock indexes.
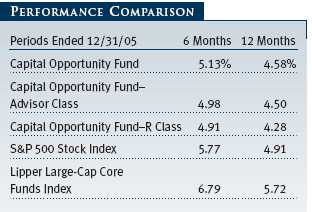
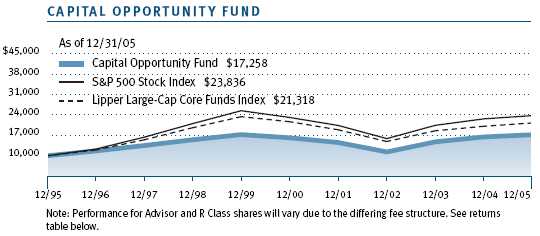
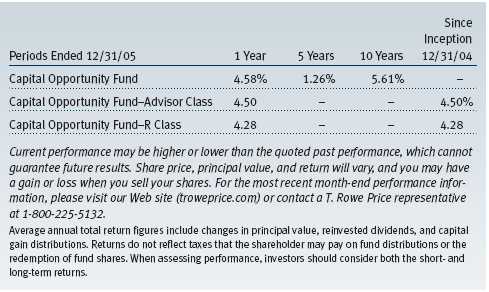
Your fund performed comparably to the broader market in 2005 but fell just short of its benchmark and Lipper peer group. As the accompanying table shows, the Capital Opportunity Fund returned 4.58% for the year, slightly trailing the returns of the S&P 500 Index and the Lipper Large-Cap Core Funds Index. (Returns for Advisor and R Class shares reflected a different fee structure.) The fund lost ground in the second half of the year as its 5.13% return for the six months ended December 31, 2005, failed to keep pace with the benchmarks. The portfolio’s modest underperformance resulted primarily from disappointing stock selection in the information technology sector.
MARKET ENVIRONMENT
Energy was the dominant theme in 2005. Oil prices rose throughout most of the year, reaching an all-time high of more than $70 per barrel in late August. Although they receded late in the year, energy prices had a significant impact on the economy and financial markets.
U.S. economic growth held up well despite the headwind of persistently high energy prices. After posting its strongest growth rate since the late 1990s in 2004, the economy grew at a slower but still solid rate in 2005 thanks to robust job growth and resilient consumer spending. The Federal Reserve continued to apply the brakes—or at least take its foot off the gas pedal—by raising short-term interest rates eight times in 2005, boosting the federal funds target rate to its highest level since May 2001. The Fed’s 13 rate hikes since mid-2004 are the most consecutive increases since 1979.
Corporate earnings growth exceeded expectations in 2005. Through the third quarter of the year, the S&P 500 had maintained its streak of double-digit quarterly earnings growth dating back to the second quarter of 2002. Nonetheless, stocks were unable to generate any momentum for most of the year, restrained by concerns about higher energy prices, rising interest rates, and the damage and disruption of the Gulf Coast hurricanes. Ultimately, though, the underlying strength in the economy and favorable corporate profit reports lifted the market into positive territory.
For the first time in seven years, large-cap stocks outperformed small-cap issues—the S&P 500 returned 4.91%, just ahead of the 4.55% return of the Russell 2000 Index. However, mid-cap stocks were the top performers in 2005: the S&P MidCap 400 Index returned 12.56%. Among large-cap stocks, value issues surpassed growth for the year, but growth trumped value in the second half.
Despite giving back a significant portion of their gains in the fourth quarter, energy and utilities stocks were far and away the top-performing market sectors in 2005, benefiting from the sharp rise in oil and gas prices. Financials and health care stocks also posted solid gains. The only two sectors of the market to decline during the year were telecommunication services and consumer discretionary.
PORTFOLIO REVIEW
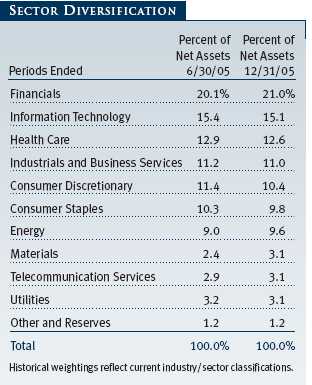
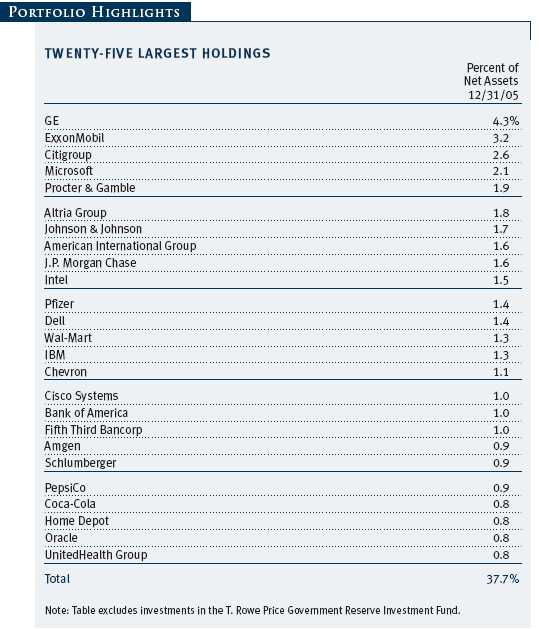
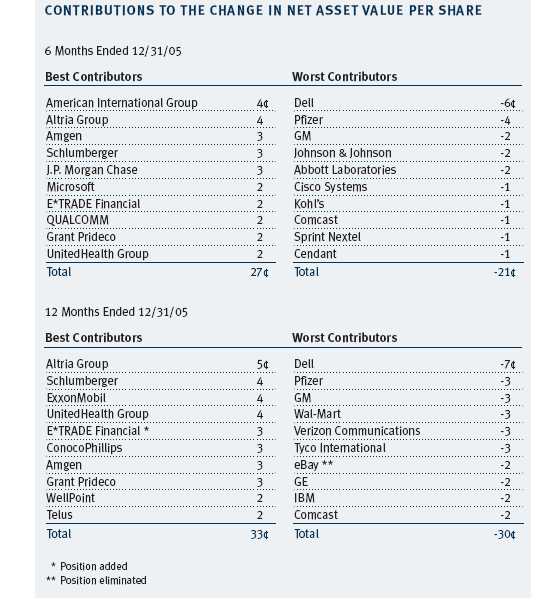
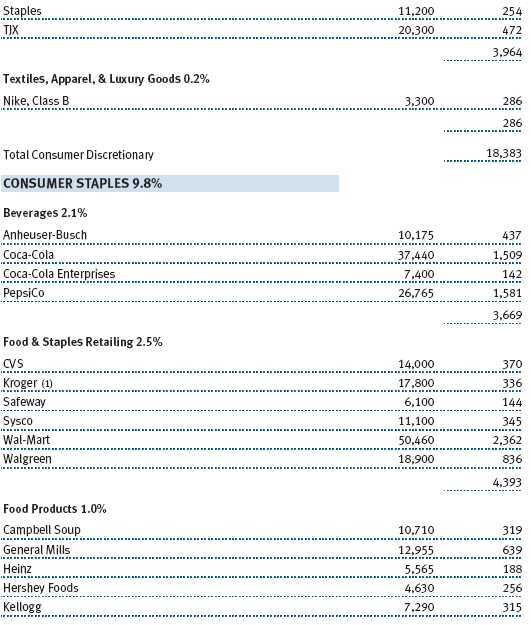
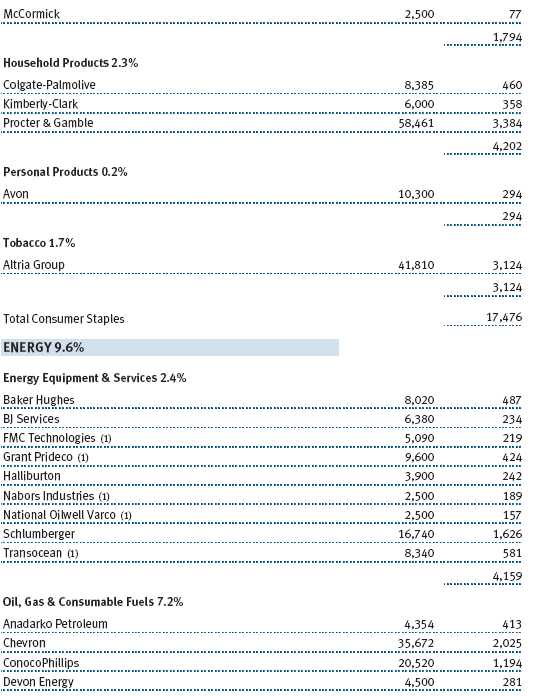
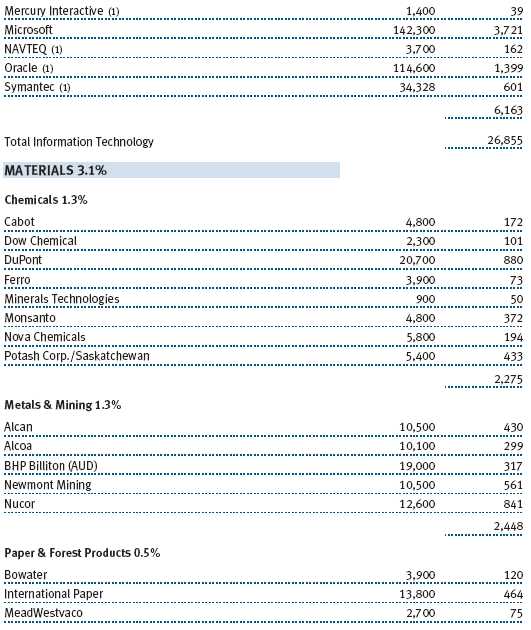
Not surprisingly, energy stocks (10% of fund assets as of December 31) produced the best returns in the portfolio in 2005. Four of the top 10 individual performance contributors for the year came from the energy sector. We maintained a modest overweight in oil equipment and services stocks, which outperformed during the year. Oil field services provider Schlumberger and Grant Prideco, a leading manufacturer of oil drilling equipment, both posted outsized gains as robust drilling and exploration activity led to a sharp increase in demand for their products and services. Other top contributors included two big oil and gas producers, ExxonMobil (the second-largest portfolio holding at year-end) and ConocoPhillips. (Please refer to the portfolio of investments for a complete listing of holdings and the amount each represents in the portfolio.)
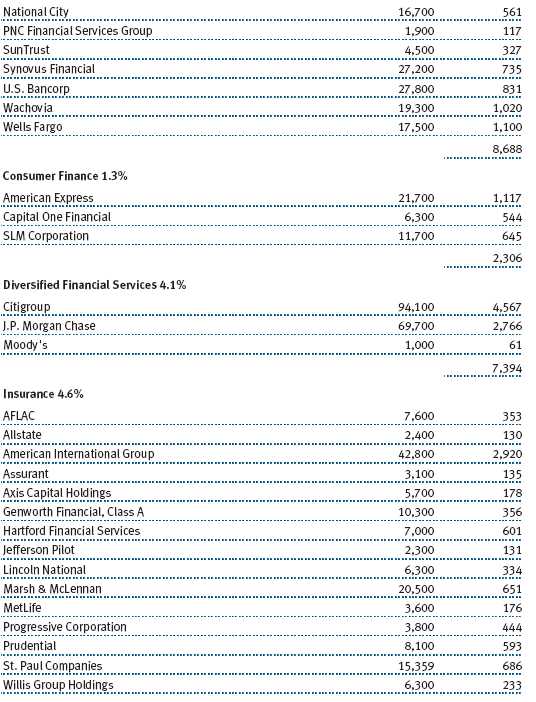
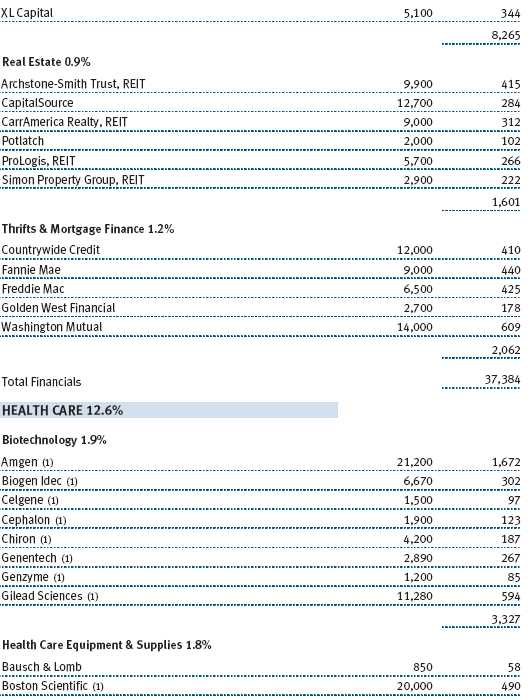
Financial stocks, which composed the portfolio’s largest sector weighting (21% of assets), contributed positively to portfolio performance. Online brokers E*TRADE Financial and Ameritrade were among the fund’s best performers in the sector. Both companies benefited from strong trading activity and advantageous acquisitions as the online brokerage industry went through a wave of consolidation. American International Group was the top performance contributor for the last six months as the insurance giant continued its recovery from an accounting scandal.
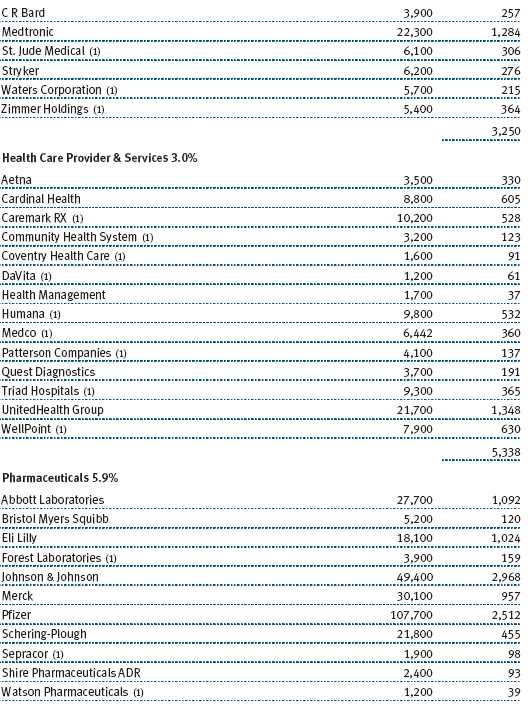
The portfolio’s health care stocks (13% of assets) also performed well, led by service providers. The nation’s largest health insurers, UnitedHealth Group and WellPoint, were among the fund’s top 10 performance contributors for the year, thanks to strong membership increases and substantial cost savings. Growing sales of its blockbuster drugs and a promising pipeline of potential new medications boosted biotechnology firm Amgen, another top 10 performer in 2005.
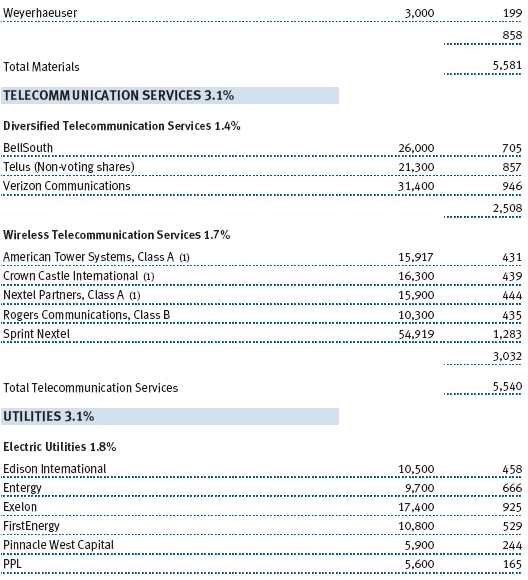
Although a small part of the portfolio, the telecommunication services sector (3% of assets) was a noteworthy contributor to fund performance. While the telecom sector of the S&P 500 declined by more than 5%, the fund’s telecom holdings gained 13%. The best performers were wireless stocks, many of which are not represented in the index. Examples include Canadian telecom company Telus and wireless services provider Nextel Partners, as well as wireless tower operators Crown Castle and American Tower Systems.
Consumer stocks (20% of assets) declined overall in 2005, but stock selection within this segment of the portfolio proved favorable relative to the S&P 500. The top individual contributor in the portfolio was tobacco maker Altria Group, which benefited from strong overseas cigarette sales and increased market share domestically. Non-benchmark holdings Panera Bread and TRW Automotive were also strong contributors. Bakery chain Panera enjoyed robust same-store sales growth and improved operational efficiencies, while auto safety parts maker TRW went through a successful restructuring.
On the downside, discount retailer Wal-Mart and automaker General Motors were among the year’s worst contributors in the portfolio. Rising fuel prices and higher health care costs crimped profit margins at Wal-Mart, while GM plunged as a challenging competitive environment led to declining sales and losses in its North American operations.
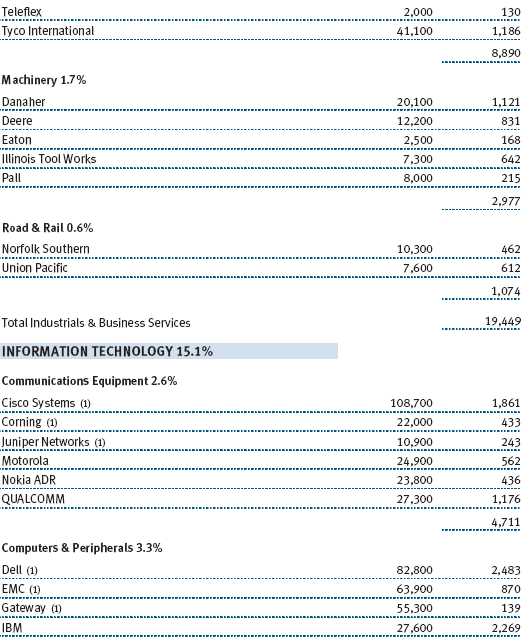
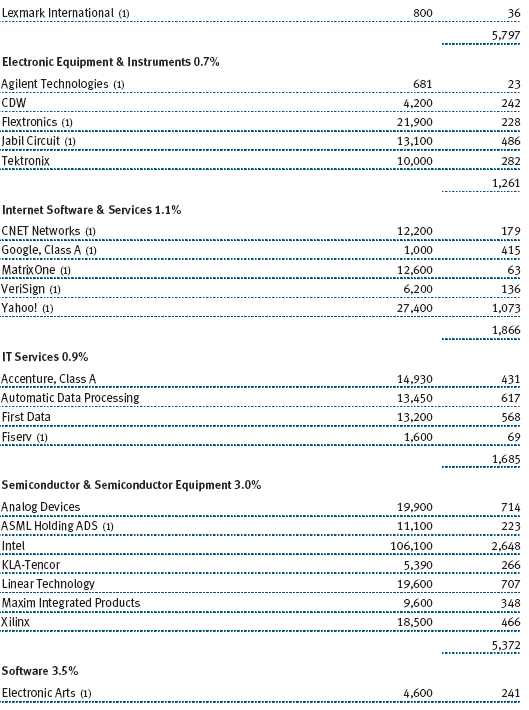
The fund’s information technology holdings (15% of assets) were primarily responsible for the portfolio’s underperformance versus the S&P 500. The largest detractor from both absolute and relative performance was electronics manufacturer Dell, which tumbled in the last half of the year. The stock came under pressure after reporting mildly disappointing revenues in August because of an overly aggressive pricing strategy, and the company eventually lowered earnings guidance for the full year. The combination of an overweight in Dell and a lack of exposure to Apple Computer, which more than doubled due to the iPod’s success, was a potent double whammy on the portfolio’s relative results.
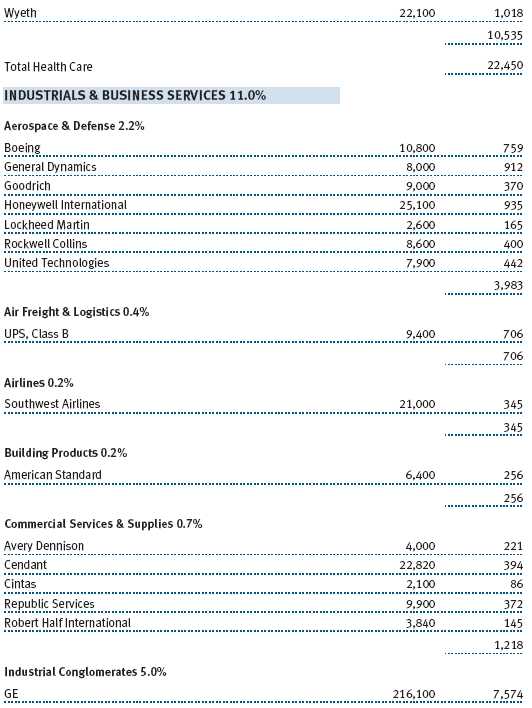
Finally, the portfolio’s largest holding, industrial conglomerate General Electric, declined modestly in 2005 as the company realigned its businesses to realize operational cost savings.
OUTLOOK
As we head into 2006, we see many reasons to be optimistic. The economy appears to be on solid footing, the Federal Reserve seems to be nearing the end of its cycle of interest rate increases, and corporations are generally in good financial shape.
In our view, the long-term prospects for the economy, corporate earnings, and the stock market remain favorable. We believe that, over the long run, investors will be well served by our investment approach: sector neutrality versus the S&P 500, with the flexibility to buy shares of any company that we believe has the potential for capital appreciation.
Respectfully submitted,

William J. Stromberg
President of the fund and chairman of its Investment Advisory Committee
January 20, 2006
The committee chairman has day-to-day responsibility for managing the portfolio and works with committee members in developing and executing the fund’s investment program.
RISKS OF INVESTING
As with all stock mutual funds, the fund’s share price can fall because of weakness in the stock market, a particular industry, or specific holdings. Stock markets can decline for many reasons, including adverse political or economic developments, changes in investor psychology, or heavy institutional selling. The prospects for an industry or company may deteriorate because of a variety of factors, including disappointing earnings or changes in the competitive environment.
GLOSSARY
Federal funds target rate: An overnight lending rate set by the Federal Reserve and used by banks to meet reserve requirements. Banks also use the fed funds rate as a benchmark for their prime lending rates.
Lipper indexes: Consist of a small number (10 to 30) of the largest mutual funds in a particular category as tracked by Lipper Inc.
Russell 2000 Index: Tracks the stocks of 2,000 small U.S. companies.
S&P 500 Stock Index: Tracks the stocks of 500 mostly large U.S. companies.
This chart shows the value of a hypothetical $10,000 investment in the fund over the past 10 fiscal year periods or since inception (for funds lacking 10-year records). The result is compared with benchmarks, which may include a broad-based market index and a peer group average or index. Market indexes do not include expenses, which are deducted from fund returns as well as mutual fund averages and indexes.
| AVERAGE ANNUAL COMPOUND TOTAL RETURN |
This table shows how the fund would have performed each year if its actual (or cumulative) returns had been earned at a constant rate.
As a mutual fund shareholder, you may incur two types of costs: (1) transaction costs, such as redemption fees or sales loads, and (2) ongoing costs, including management fees, distribution and service (12b-1) fees, and other fund expenses. The following example is intended to help you understand your ongoing costs (in dollars) of investing in the fund and to compare these costs with the ongoing costs of investing in other mutual funds. The example is based on an investment of $1,000 invested at the beginning of the most recent six-month period and held for the entire period.
Please note that the fund has three share classes: The original share class (“investor class”) charges no distribution and service (12b-1) fee; Advisor Class shares are offered only through unaffiliated brokers and other financial intermediaries and charge a 0.25% 12b-1 fee; R Class shares are available to retirement plans serviced by intermediaries and charge a 0.50% 12b-1 fee. Each share class is presented separately in the table.
Actual Expenses
The first line of the following table (“Actual”) provides information about actual account values and expenses based on the fund’s actual returns. You may use the information in this line, together with your account balance, to estimate the expenses that you paid over the period. Simply divide your account value by $1,000 (for example, an $8,600 account value divided by $1,000 = 8.6), then multiply the result by the number in the first line under the heading “Expenses Paid During Period” to estimate the expenses you paid on your account during this period.
Hypothetical Example for Comparison Purposes
The information on the second line of the table (?Hypothetical?) is based on hypothetical account values and expenses derived from the fund’s actual expense ratio and an assumed 5% per year rate of return before expenses (not the fund’s actual return). You may compare the ongoing costs of investing in the fund with other funds by contrasting this 5% hypothetical example and the 5% hypothetical examples that appear in the shareholder reports of the other funds. The hypothetical account values and expenses may not be used to estimate the actual ending account balance or expenses you paid for the period.
Note: T. Rowe Price charges an annual small-account maintenance fee of $10, generally for accounts with less than $2,000 ($500 for UGMA/UTMA). The fee is waived for any investor whose T. Rowe Price mutual fund accounts total $25,000 or more, accounts employing automatic investing, and IRAs and other retirement plan accounts that utilize a prototype plan sponsored by T. Rowe Price (although a separate custodial or administrative fee may apply to such accounts). This fee is not included in the accompanying table. If you are subject to the fee, keep it in mind when you are estimating the ongoing expenses of investing in the fund and when comparing the expenses of this fund with other funds.
You should also be aware that the expenses shown in the table highlight only your ongoing costs and do not reflect any transaction costs, such as redemption fees or sales loads. Therefore, the second line of the table is useful in comparing ongoing costs only and will not help you determine the relative total costs of owning different funds. To the extent a fund charges transaction costs, however, the total cost of owning that fund is higher.

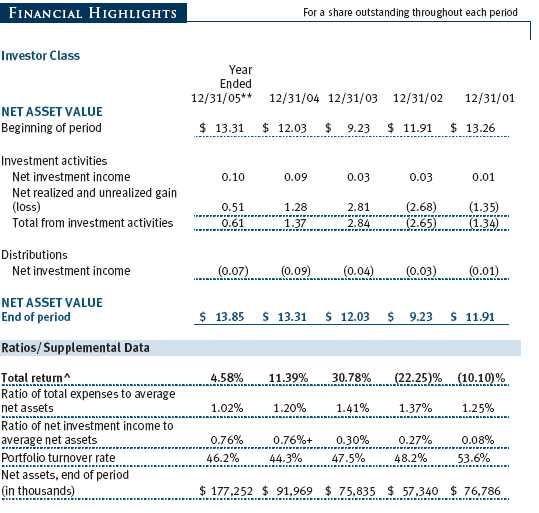
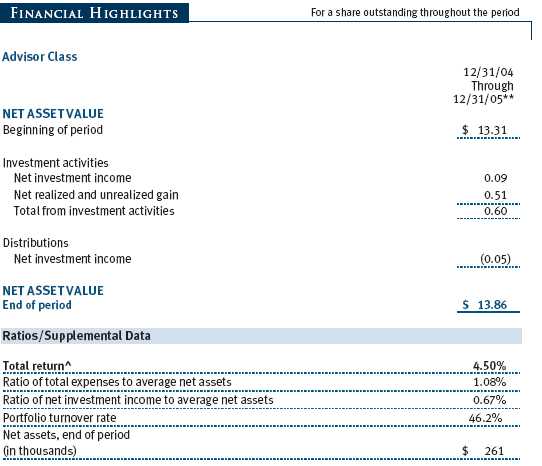
| ** | Per share amounts calculated using average shares outstanding method. |
| ^ | Total return reflects the rate that an investor would have earned on an investment in the fund |
| | during each period, assuming reinvestment of all distributions. |
| + | Includes the effect of a one-time special dividend (0.35% of average net assets) that is not |
| | expected to recur. |
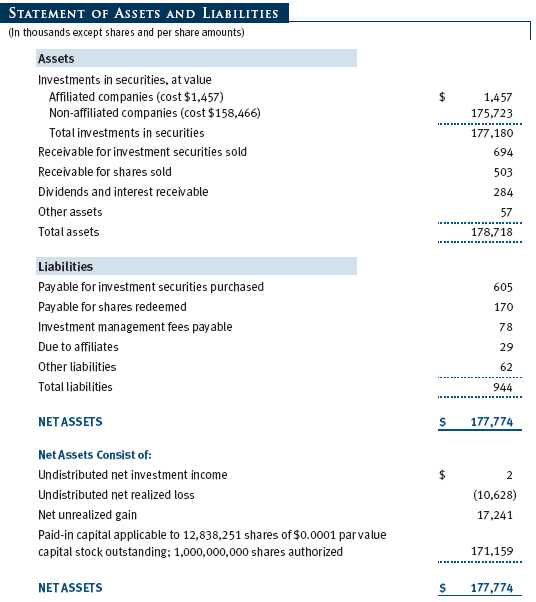
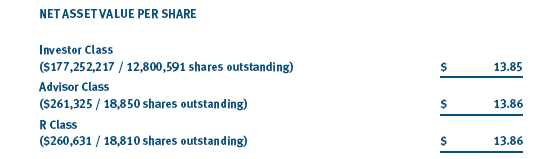
The accompanying notes are an integral part of these financial statements.
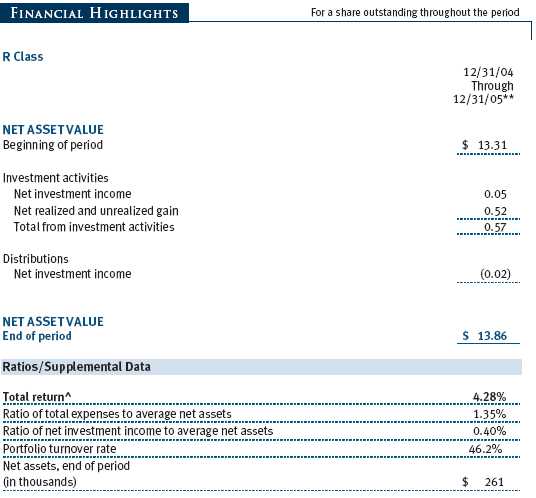
| ** | Per share amounts calculated using average shares outstanding method. |
| ^ | Total return reflects the rate that an investor would have earned on an investment in the fund |
| | during each period, assuming reinvestment of all distributions. |
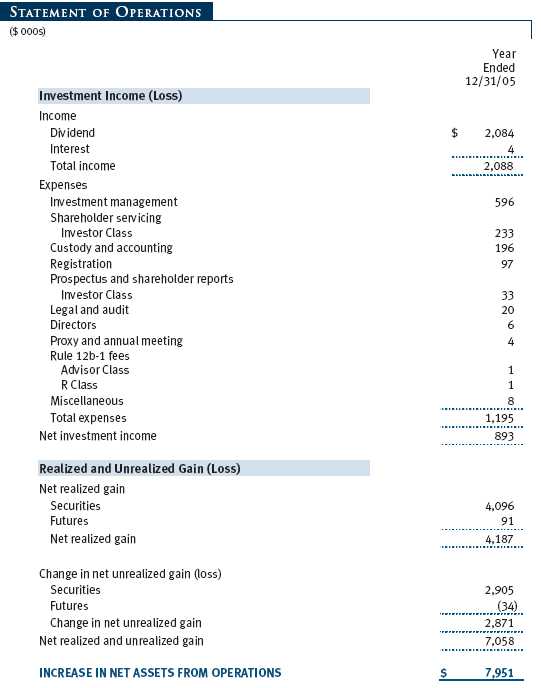
The accompanying notes are an integral part of these financial statements.
| ** | Per share amounts calculated using average shares outstanding method. |
| ^ | Total return reflects the rate that an investor would have earned on an investment in the fund |
| | during each period, assuming reinvestment of all distributions. |
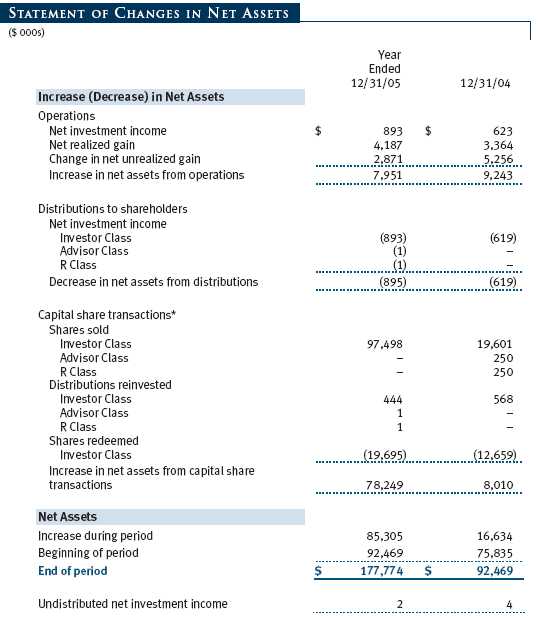
The accompanying notes are an integral part of these financial statements.
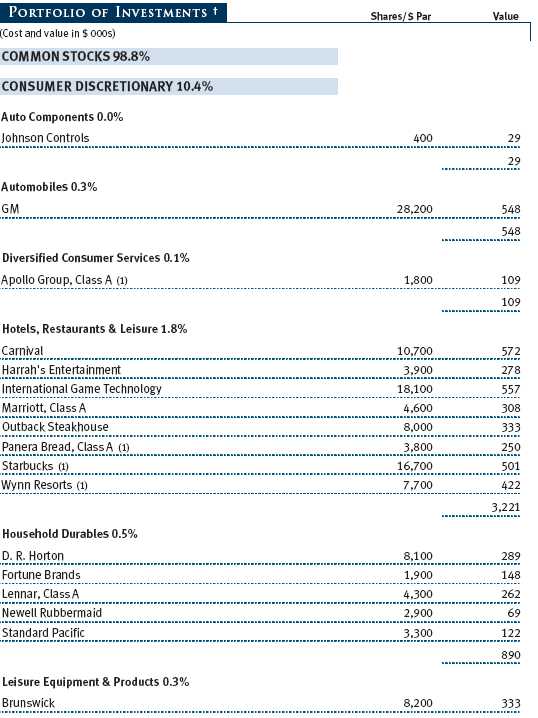
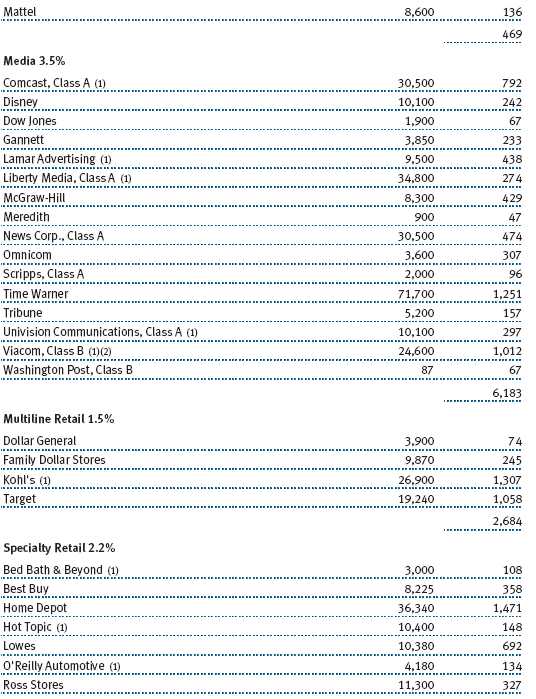

| † | Denominated in U.S. dollars unless otherwise noted |
| (1) | Non-income producing |
| (2) | When-issued security |
| (3) | Seven-day yield |
| (4) | Affiliated company – see Note 4 |
| ++ | All or a portion of this security is pledged to cover margin requirements on futures |
| | contracts at December 31, 2005 |
| ADR | American Depository Receipts |
| ADS | American Depository Shares |
| AUD | Australian Dollar |
| REIT | Real Estate Investment Trust |
 The accompanying notes are an integral part of these financial statements.
 The accompanying notes are an integral part of these financial statements.
 The accompanying notes are an integral part of these financial statements.
 The accompanying notes are an integral part of these financial statements.
| NOTES TO FINANCIAL STATEMENTS |
NOTE 1 - SIGNIFICANT ACCOUNTING POLICIES
T. Rowe Price Capital Opportunity Fund, Inc. (the fund) is registered under the Investment Company Act of 1940 (the 1940 Act) as a diversified, open-end management investment company. The fund seeks to provide long-term capital growth by investing primarily in U.S. common stocks. The fund has three classes of shares: the Capital Opportunity Fund original share class, referred to in this report as the Investor Class, offered since November 30, 1994, Capital Opportunity Fund—Advisor Class (Advisor Class), offered since December 31, 2004, and Capital Opportunity Fund—R Class (R Class), offered since December 31, 2004. Advisor Class shares are sold only through unaffiliated brokers and other unaffiliated financial intermediaries, and R Class shares are available to retirement plans serviced by intermediaries. The Advisor Class and R Class each operate under separate Board-approved Rule 12b-1 plans, pursuant to which each class compensates financial intermediaries for distrib ution, shareholder servicing, and/or certain administrative services. Each class has exclusive voting rights on matters related solely to that class, separate voting rights on matters that relate to all classes, and, in all other respects, the same rights and obligations as the other classes.
The accompanying financial statements were prepared in accordance with accounting principles generally accepted in the United States of America, which require the use of estimates made by fund management. Fund management believes that estimates and security valuations are appropriate; however actual results may differ from those estimates, and the security valuations reflected in the financial statements may differ from the value the fund ultimately realizes upon sale of the securities.
Valuation The fund values its investments and computes its net asset value per share at the close of the New York Stock Exchange (NYSE), normally 4 p.m. ET, each day that the NYSE is open for business. Equity securities listed or regularly traded on a securities exchange or in the over-the-counter market are valued at the last quoted sale price or, for certain markets, the official closing price at the time the valuations are made, except for OTC Bulletin Board securities, which are valued at the mean of the latest bid and asked prices. A security that is listed or traded on more than one exchange is valued at the quotation on the exchange determined to be the primary market for such security. Listed securities not traded on a particular day are valued at the mean of the latest bid and asked prices for domestic securities and the last quoted sale price for international securities. Debt securities with original maturities of less than one year are valued at a mortized cost in local currency, which approximates fair value when combined with accrued interest.
Investments in mutual funds are valued at the mutual fund’s closing net asset value per share on the day of valuation. Financial futures contracts are valued at closing settlement prices.
Other investments, including restricted securities, and those for which the above valuation procedures are inappropriate or are deemed not to reflect fair value are stated at fair value as determined in good faith by the T. Rowe Price Valuation Committee, established by the fund’s Board of Directors.
Most foreign markets close before the close of trading on the NYSE. If the fund determines that developments between the close of a foreign market and the close of the NYSE will, in its judgment, materially affect the value of some or all of its portfolio securities, which in turn will affect the fund’s share price, the fund will adjust the previous closing prices to reflect the fair value of the securities as of the close of the NYSE, as determined in good faith by the T. Rowe Price Valuation Committee, established by the fund’s Board of Directors. A fund may also fair value securities in other situations, such as when a particular foreign market is closed but the fund is open. In deciding whether to make fair value adjustments, the fund reviews a variety of factors, including developments in foreign markets, the performance of U.S. securities markets, and the performance of instruments trading in U.S. markets that represent foreign securities and baskets of foreign securi ties. The fund uses outside pricing services to provide it with closing market prices and information used for adjusting those prices. The fund cannot predict when and how often it will use closing prices and when it will adjust those prices to reflect fair value. As a means of evaluating its fair value process, the fund routinely compares closing market prices, the next day’s opening prices in the same markets, and adjusted prices.
Currency Translation Assets, including investments, and liabilities denominated in foreign currencies are translated into U.S. dollar values each day at the prevailing exchange rate, using the mean of the bid and asked prices of such currencies against U.S. dollars as quoted by a major bank. Purchases and sales of securities, income, and expenses are translated into U.S. dollars at the prevailing exchange rate on the date of the transaction. The effect of changes in foreign currency exchange rates on realized and unrealized security gains and losses is reflected as a component of security gains and losses.
Class Accounting The Advisor Class and R Class each pay distribution, shareholder servicing, and/or certain administrative expenses in the form of Rule 12b-1 fees, in an amount not exceeding 0.25% and 0.50%, respectively, of the class’s average daily net assets. Shareholder servicing, prospectus, and shareholder report expenses incurred by each class are charged directly to the class to which they relate. Expenses common to all classes, investment income, and realized and unrealized gains and losses are allocated to the classes based upon the relative daily net assets of each class.
Rebates and Credits Subject to best execution, the fund may direct certain security trades to brokers who have agreed to rebate a portion of the related brokerage commission to the fund in cash. Commission rebates are reflected as realized gain on securities in the accompanying financial statements and totaled $11,000 for the year ended December 31, 2005. Additionally, the fund earns credits on temporarily uninvested cash balances at the custodian that reduce the fund’s custody charges. Custody expense in the accompanying financial statements is presented before reduction for credits.
Investment Transactions, Investment Income, and Distributions Income and expenses are recorded on the accrual basis. Premiums and discounts on debt securities are amortized for financial reporting purposes. Dividends received from mutual fund investments are reflected as dividend income; capital gain distributions are reflected as realized gain/loss. Dividend income and capital gain distributions are recorded on the ex-dividend date. Investment transactions are accounted for on the trade date. Realized gains and losses are reported on the identified cost basis. Payments (?variation margin?) made or received to settle the daily fluctuations in the value of futures contracts are recorded as unrealized gains or losses until the contracts are closed. Unsettled variation margin on futures contracts is reflected as other assets or liabilities, and unrealized gains and losses on futures contracts are reflected as the change in net unrealized gain or loss in the acco mpanying financial statements. Distributions to shareholders are recorded on the ex-dividend date. Income distributions are declared and paid by each class on an annual basis. Capital gain distributions, if any, are declared and paid by the fund, typically on an annual basis.
NOTE 2 - INVESTMENT TRANSACTIONS
Consistent with its investment objective, the fund engages in the following practices to manage exposure to certain risks or enhance performance. The investment objective, policies, program, and risk factors of the fund are described more fully in the fund’s prospectus and Statement of Additional Information.Restricted Securities The fund may invest in securities that are subject to legal or contractual restrictions on resale. Although certain of these securities may be readily sold, for example, under Rule 144A, others may be illiquid, their sale may involve substantial delays and additional costs, and prompt sale at an acceptable price may be difficult.
Futures Contracts During the year ended December 31, 2005, the fund was a party to futures contracts, which provide for the future sale by one party and purchase by another of a specified amount of a specific financial instrument at an agreed upon price, date, time, and place. Risks arise from possible illiquidity of the futures market and from movements in security values.
Securities Lending The fund lends its securities to approved brokers to earn additional income. It receives as collateral cash and U.S. government securities valued at 102% to 105% of the value of the securities on loan. Cash collateral is invested in a money market pooled trust managed by the fund’s lending agent in accordance with investment guidelines approved by fund management. Collateral is maintained over the life of the loan in an amount not less than the value of loaned securities, as determined at the close of fund business each day; any additional collateral required due to changes in security values is delivered to the fund the next business day. Although risk is mitigated by the collateral, the fund could experience a delay in recovering its securities and a possible loss of income or value if the borrower fails to return the securities. Securities lending revenue recognized by the fund consists of earnings on invested collateral and borrow ing fees, net of any rebates to the borrower and compensation to the lending agent. At December 31, 2005, there were no securities on loan.
Other Purchases and sales of portfolio securities, other than short-term securities, aggregated $130,669,000 and $53,526,000, respectively, for the year ended December 31, 2005.
NOTE 3 - FEDERAL INCOME TAXES
No provision for federal income taxes is required since the fund intends to continue to qualify as a regulated investment company under Subchapter M of the Internal Revenue Code and distribute to shareholders all of its taxable income and gains. Federal income tax regulations differ from generally accepted accounting principles; therefore, distributions determined in accordance with tax regulations may differ significantly in amount or character from net investment income and realized gains for financial reporting purposes. Financial reporting records are adjusted for permanent book/tax differences to reflect tax character. Financial records are not adjusted for temporary differences.
Distributions during the year ended December 31, 2005, totaled $895,000 and were characterized as ordinary income for tax purposes. At December 31, 2005, the tax-basis components of net assets were as follows:

The fund intends to retain realized gains to the extent of available capital loss carryforwards for federal income tax purposes. During the year ended December 31, 2005, the fund utilized $4,153,000 of capital loss carryforwards. As of December 31, 2005, the fund had $919,000 of capital loss carryforwards that expire in 2009, $6,883,000 that expire in 2010, and $2,841,000 that expire in 2011.
At December 31, 2005, the cost of investments for federal income tax purposes was $159,908,000.
NOTE 4 - RELATED PARTY TRANSACTIONS
The fund is managed by T. Rowe Price Associates, Inc. (the manager or Price Associates), a wholly owned subsidiary of T. Rowe Price Group, Inc. The investment management agreement between the fund and the manager provides for an annual investment management fee, which is computed daily and paid monthly. The fee consists of an individual fund fee, equal to 0.20% of the fund’s average daily net assets, and a group fee. The group fee rate is calculated based on the combined net assets of certain mutual funds sponsored by Price Associates (the group) applied to a graduated fee schedule, with rates ranging from 0.48% for the first $1 billion of assets to 0.29% for assets in excess of $160 billion. Prior to May 1, 2005, the maximum group fee rate in the graduated fee schedule had been 0.295% for assets in excess of $120 billion. The fund’s group fee is determined by applying the group fee rate to the fund’s average daily net a ssets. At December 31, 2005, the effective annual group fee rate was 0.31%.
Each class is also subject to a contractual expense limitation through the limitation dates indicated in the table below. During the limitation period, the manager is required to waive its management fee and reimburse a class for any expenses, excluding interest, taxes, brokerage commissions, and extraordinary expenses, that would otherwise cause the class’s ratio of total expenses to average net assets (expense ratio) to exceed its expense limitation. Each class is required to repay the manager for expenses previously reimbursed and management fees waived to the extent the class’s net assets have grown or expenses have declined sufficiently to allow repayment without causing the class’s expense ratio to exceed its expense limitation. However, no repayment will be made more than three years after the date of any reimbursement or waiver or later than the repayment dates indicated in the table below.

Pursuant to this agreement, at December 31, 2005, there were no amounts subject to repayment.
In addition, the fund has entered into service agreements with Price Associates and two wholly owned subsidiaries of Price Associates (collectively, Price). Price Associates computes the daily share prices and maintains the financial records of the fund. T. Rowe Price Services, Inc., provides shareholder and administrative services in its capacity as the fund’s transfer and dividend disbursing agent. T. Rowe Price Retirement Plan Services, Inc., provides subaccounting and recordkeeping services for certain retirement accounts invested in the Investor Class and R Class. For the year ended December 31, 2005, expenses incurred pursuant to these service agreements were $102,000 for Price Associates, $154,000 for T. Rowe Price Services, Inc., and $14,000 for T. Rowe Price Retirement Plan Services, Inc. The total amount payable at period end pursuant to these service agreements is reflected as Due to Affiliates in the accompanying financial statements.
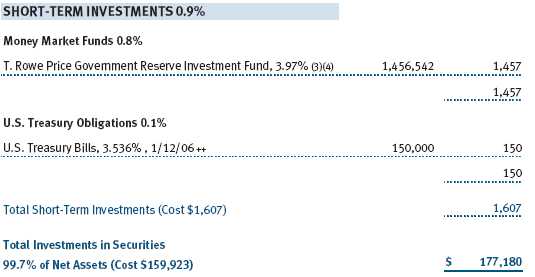
The fund may invest in the T. Rowe Price Reserve Investment Fund and the T. Rowe Price Government Reserve Investment Fund (collectively, the T. Rowe Price Reserve Funds), open-end management investment companies managed by Price Associates and affiliates of the fund. The T. Rowe Price Reserve Funds are offered as cash management options to mutual funds, trusts, and other accounts managed by Price Associates and/or its affiliates, and are not available for direct purchase by members of the public. The T. Rowe Price Reserve Funds pay no investment management fees. During the year ended December 31, 2005, dividend income from the T. Rowe Price Reserve Funds totaled $59,000, and the value of shares of the T. Rowe Price Reserve Funds held at December 31, 2005, and December 31, 2004, was $1,457,000 and $645,000, respectively.
As of December 31, 2005, T. Rowe Price Group, Inc. and/or its wholly owned subsidiaries owned 406,835 shares of the Investor class, 18,850 shares of the Advisor class, and 18,810 shares of the R class, aggregating 3% of the fund’s net assets.
| REPORT OF INDEPENDENT REGISTERED PUBLIC ACCOUNTING FIRM |
To the Board of Directors and Shareholders of T. Rowe Price Capital Opportunity Fund, Inc.
In our opinion, the accompanying statement of assets and liabilities, including the portfolio of investments, and the related statements of operations and of changes in net assets and the financial highlights present fairly, in all material respects, the financial position of T. Rowe Price Capital Opportunity Fund, Inc. (the “Fund”) at December 31, 2005, the results of its operations for the year then ended, the changes in its net assets for each of the two years in the period then ended and the financial highlights for each of the periods indicated, in conformity with accounting principles generally accepted in the United States of America. These financial statements and financial highlights (hereafter referred to as “financial statements”) are the responsibility of the Fund’s management; our responsibility is to express an opinion on these financial statements based on our audits. We conducted our audits of these financial statements in accordance with the standards of the Public Company Accounting Oversight Board (United States). Those standards require that we plan and perform the audit to obtain reasonable assurance about whether the financial statements are free of material misstatement. An audit includes examining, on a test basis, evidence supporting the amounts and disclosures in the financial statements, assessing the accounting principles used and significant estimates made by management, and evaluating the overall financial statement presentation. We believe that our audits, which included confirmation of securities at December 31, 2005, by correspondence with the custodian, brokers and by agreement to the underlying ownership records for T. Rowe Price Government Reserve Investment Fund, provide a reasonable basis for our opinion.
PricewaterhouseCoopers LLP
Baltimore, Maryland
February 13, 2006
| TAX INFORMATION (UNAUDITED) FOR THE TAX YEAR ENDED 12/31/05 |
We are providing this information as required by the Internal Revenue Code. The amounts shown may differ from those elsewhere in this report because of differences between tax and financial reporting requirements.
For taxable non-corporate shareholders, $893,000 of the fund’s income represents qualified dividend income subject to the 15% rate category.
For corporate shareholders, $893,000 of the fund’s income qualifies for the dividends-received deduction.
| INFORMATION ON PROXY VOTING POLICIES, PROCEDURES, AND RECORDS |
A description of the policies and procedures used by T. Rowe Price funds and portfolios to determine how to vote proxies relating to portfolio securities is available in each fund’s Statement of Additional Information, which you may request by calling 1-800-225-5132 or by accessing the SEC’s Web site, www.sec.gov. The description of our proxy voting policies and procedures is also available on our Web site, www.troweprice.com. To access it, click on the words “Company Info” at the top of our homepage for individual investors. Then, in the window that appears, click on the “Proxy Voting Policy” navigation button in the top left corner.
Each fund’s most recent annual proxy voting record is available on our Web site and through the SEC’s Web site. To access it through our Web site, follow the directions above, then click on the words “Proxy Voting Record” at the bottom of the Proxy Voting Policy page.
| HOW TO OBTAIN QUARTERLY PORTFOLIO HOLDINGS |
The fund files a complete schedule of portfolio holdings with the Securities and Exchange Commission for the first and third quarters of each fiscal year on Form N-Q. The fund’s Form N-Q is available electronically on the SEC’s Web site (www.sec.gov); hard copies may be reviewed and copied at the SEC’s Public Reference Room, 450 Fifth St. N.W., Washington, DC 20549. For more information on the Public Reference Room, call 1-800-SEC-0330.
| ABOUT THE FUND’S DIRECTORS AND OFFICERS |
Your fund is governed by a Board of Directors that meets regularly to review investments, performance, compliance matters, advisory fees, expenses, and other business affairs, and is responsible for protecting the interests of shareholders. The majority of the fund’s directors are independent of T. Rowe Price Associates, Inc. (T. Rowe Price); “inside” directors are officers of T. Rowe Price. The Board of Directors elects the fund’s officers, who are listed in the final table. The business address of each director and officer is 100 East Pratt Street, Baltimore, MD 21202. The Statement of Additional Information includes additional information about the fund directors and is available without charge by calling a T. Rowe Price representative at 1-800-225-5132.
| Independent Directors | |
| |
| Name | |
| (Year of Birth) | |
| Year Elected * | |
| [Number of T. Rowe Price | Principal Occupation(s) During Past 5 Years and Directorships of |
| Portfolios Overseen] | Other Public Companies |
| |
| Jeremiah E. Casey ** | Director, National Life Insurance (2001 to 8/05); Director, The Rouse |
| (1940) | Company, real estate developers (1990 to 2004) |
| 2005 | |
| [59] | |
| |
| Anthony W. Deering | Chairman, Exeter Capital, LLC, a private investment firm (2004 to pres- |
| (1945) | ent); Director, Chairman of the Board, and Chief Executive Officer, The |
| 2001 | Rouse Company, real estate developers (1997 to 2004); Director, |
| [113] | Mercantile Bank (4/03 to present) |
| |
| Donald W. Dick, Jr. | Principal, EuroCapital Advisors, LLC, an acquisition and management |
| (1943) | advisory firm; Chairman, President, and Chief Executive Officer, The |
| 1994 | Haven Group, a custom manufacturer of modular homes (1/04 |
| [113] | to present) |
| |
| David K. Fagin | Chairman and President, Nye Corporation (6/88 to present); Director, |
| (1938) | Canyon Resources Corp. and Golden Star Resources Ltd. (5/00 to |
| 1994 | present) and Pacific Rim Mining Corp. (2/02 to present) |
| [113] | |
| |
| Karen N. Horn | Managing Director and President, Global Private Client Services, Marsh |
| (1943) | Inc. (1999 to 2003); Managing Director and Head of International Private |
| 2003 | Banking, Bankers Trust (1996 to 1999); Director, Eli Lilly and Company |
| [113] | and Georgia Pacific |
| F. Pierce Linaweaver | President, F. Pierce Linaweaver & Associates, Inc., consulting |
| (1934) | environmental and civil engineers |
| 2001 | |
| [113] | |
| |
| Theo C. Rodgers *** | President, A&R Development Corporation |
| (1941) | |
| 2005 | |
| [97] | |
| |
| John G. Schreiber | Owner/President, Centaur Capital Partners, Inc., a real estate investment |
| (1946) | company; Partner, Blackstone Real Estate Advisors, L.P.; Director, AMLI |
| 2001 | Residential Properties Trust |
| [113] | |
| |
| *Each independent director serves until retirement, resignation, or election of a successor. |
| **Elected effective October 19, 2005. |
| ***Elected effective April 1, 2005. |
|
| |
| Inside Directors | |
| |
| Name | |
| (Year of Birth) | |
| Year Elected * | |
| [Number of T. Rowe Price | Principal Occupation(s) During Past 5 Years and Directorships of |
| Portfolios Overseen] | Other Public Companies |
| |
| John H. Laporte, CFA | Vice President, T. Rowe Price and T. Rowe Price Group, Inc. |
| (1945) | |
| 1994 | |
| [15] | |
| |
| James S. Riepe | Director and Vice President, T. Rowe Price; Vice Chairman of the Board, |
| (1943) | Director, and Vice President, T. Rowe Price Group, Inc.; Chairman of the |
| 1994 | Board and Director, T. Rowe Price Global Asset Management Limited, |
| [113] | T. Rowe Price Global Investment Services Limited, T. Rowe Price |
| | Investment Services, Inc., T. Rowe Price Retirement Plan Services, Inc., |
| | and T. Rowe Price Services, Inc.; Chairman of the Board, Director, |
| | President, and Trust Officer, T. Rowe Price Trust Company; Director, |
| | T. Rowe Price International, Inc.; Chairman of the Board, all funds |
| *Each inside director serves until retirement, resignation, or election of a successor. |
| Officers | |
| |
| Name (Year of Birth) | |
| Title and Fund(s) Served | Principal Occupation(s) |
| |
| Kennard W. Allen (1977) | Vice President, T. Rowe Price and T. Rowe Price |
| Vice President, Capital Opportunity Fund | Group, Inc. |
| |
| Jeffrey W. Arricale, CPA (1971) | Vice President, T. Rowe Price and T. Rowe Price |
| Vice President, Capital Opportunity Fund | Group, Inc.; formerly student, the Wharton |
| | School, University of Pennsylvania (to 2001) |
| |
| Laurie M. Bertner (1977) | Vice President, T. Rowe Price and T. Rowe Price |
| Vice President, Capital Opportunity Fund | Group, Inc. |
| |
| Joseph A. Carrier (1960) | Vice President, T. Rowe Price, T. Rowe Price |
| Treasurer, Capital Opportunity Fund | Group, Inc., T. Rowe Price Investment Services, |
| | Inc., and T. Rowe Price Trust Company |
| |
| Roger L. Fiery III, CPA (1959) | Vice President, T. Rowe Price, T. Rowe Price |
| Vice President, Capital Opportunity Fund | Group, Inc., T. Rowe Price International, Inc., |
| | and T. Rowe Price Trust Company |
| |
| John R. Gilner (1961) | Chief Compliance Officer and Vice President, |
| Chief Compliance Officer, Capital Opportunity | T. Rowe Price; Vice President, T. Rowe Price |
| Fund | Group, Inc., and T. Rowe Price Investment |
| | Services, Inc. |
| |
| David R. Giroux, CFA (1975) | Vice President, T. Rowe Price and T. Rowe Price |
| Vice President, Capital Opportunity Fund | Group, Inc. |
| |
| Gregory S. Golczewski (1966) | Vice President, T. Rowe Price and T. Rowe Price |
| Vice President, Capital Opportunity Fund | Trust Company |
| |
| Ann M. Holcomb, CFA (1972) | Vice President, T. Rowe Price and T. Rowe Price |
| Vice President, Capital Opportunity Fund | Trust Company |
| |
| Michael W. Holton (1968) | Vice President, T. Rowe Price and T. Rowe Price |
| Vice President, Capital Opportunity Fund | Group, Inc. |
| |
| Henry H. Hopkins (1942) | Director and Vice President, T. Rowe Price |
| Vice President, Capital Opportunity Fund | Investment Services, Inc., T. Rowe Price Services, |
| | Inc., and T. Rowe Price Trust Company; Vice |
| | President, T. Rowe Price, T. Rowe Price Group, |
| | Inc., T. Rowe Price International, Inc., and T. Rowe |
| | Price Retirement Plan Services, Inc. |
| |
| Patricia B. Lippert (1953) | Assistant Vice President, T. Rowe Price and |
| Secretary, Capital Opportunity Fund | T. Rowe Price Investment Services, Inc. |
| Philip A. Nestico (1976) | Vice President, T. Rowe Price |
| Vice President, Capital Opportunity Fund | |
| |
| Charles G. Pepin (1966) | Vice President, T. Rowe Price and T. Rowe Price |
| Vice President, Capital Opportunity Fund | Group, Inc. |
| |
| Joshua K. Spencer, CFA (1973) | Vice President, T. Rowe Price and T. Rowe Price |
| Vice President, Capital Opportunity Fund | Group, Inc.; formerly Research Analyst and Sector |
| | Fund Portfolio Manager, Fidelity Investments |
| | (to 2004) |
| |
| William J. Stromberg, CFA (1960) | Vice President, T. Rowe Price, T. Rowe Price |
| President, Capital Opportunity Fund | Group, Inc., and T. Rowe Price Trust Company |
| |
| Julie L. Waples (1970) | Vice President, T. Rowe Price |
| Vice President, Capital Opportunity Fund | |
| |
| Richard T. Whitney, CFA (1958) | Vice President, T. Rowe Price, T. Rowe Price |
| Vice President, Capital Opportunity Fund | Group, Inc., T. Rowe Price International, Inc., |
| | and T. Rowe Price Trust Company |
| Unless otherwise noted, officers have been employees of T. Rowe Price or T. Rowe Price International for at |
| least five years. |
Item 2. Code of Ethics.
The registrant has adopted a code of ethics, as defined in Item 2 of Form N-CSR, applicable to its principal executive officer, principal financial officer, principal accounting officer or controller, or persons performing similar functions. A copy of this code of ethics is filed as an exhibit to this Form N-CSR. No substantive amendments were approved or waivers were granted to this code of ethics during the period covered by this report.
Item 3. Audit Committee Financial Expert.
The registrant’s Board of Directors/Trustees has determined that Mr. Donald W. Dick Jr. qualifies as an audit committee financial expert, as defined in Item 3 of Form N-CSR. Mr. Dick is considered independent for purposes of Item 3 of Form N-CSR.
Item 4. Principal Accountant Fees and Services.
(a) – (d) Aggregate fees billed to the registrant for the last two fiscal years for professional services rendered by the registrant’s principal accountant were as follows:
| | 2005 | 2004 |
| Audit Fees | $10,298 | $6,898 |
| Audit-Related Fees | 508 | 968 |
| Tax Fees | 2,243 | 1,871 |
| All Other Fees | 393 | - |
Audit fees include amounts related to the audit of the registrant’s annual financial statements and services normally provided by the accountant in connection with statutory and regulatory filings. Audit-related fees include amounts reasonably related to the performance of the audit of the registrant’s financial statements and specifically include the issuance of a report on internal controls. Tax fees include amounts related to services for tax compliance, tax planning, and tax advice. The nature of these services specifically includes the review of distribution calculations and the preparation of Federal, state, and excise tax returns. All other fees include the registrant’s pro-rata share of amounts for agreed-upon procedures in conjunction with service contract approvals by the registrant’s Board of Directors/Trustees.
(e)(1) The registrant’s audit committee has adopted a policy whereby audit and non-audit services performed by the registrant’s principal accountant for the registrant, its investment adviser, and any entity controlling, controlled by, or under common control with the investment adviser that provides ongoing services to the registrant require pre-approval in advance at regularly scheduled audit committee meetings. If such a service is required between regularly scheduled audit committee meetings, pre-approval may be authorized by one audit committee member with ratification at the next scheduled audit committee meeting. Waiver of pre-approval for audit or non-audit services requiring fees of a de minimis amount is not permitted.
(2) No services included in (b) – (d) above were approved pursuant to paragraph (c)(7)(i)(C) of Rule 2-01 of Regulation S-X.
(f) Less than 50 percent of the hours expended on the principal accountant’s engagement to audit the registrant’s financial statements for the most recent fiscal year were attributed to work performed by persons other than the principal accountant’s full-time, permanent employees.
(g) The aggregate fees billed for the most recent fiscal year and the preceding fiscal year by the registrant’s principal accountant for non-audit services rendered to the registrant, its investment adviser, and any entity controlling, controlled by, or under common control with the investment adviser that provides ongoing services to the registrant were $1,008,000 and $903,000, respectively, and were less than the aggregate fees billed for those same periods by the registrant’s principal accountant for audit services rendered to the T. Rowe Price Funds.
(h) All non-audit services rendered in (g) above were pre-approved by the registrant’s audit committee. Accordingly, these services were considered by the registrant’s audit committee in maintaining the principal accountant’s independence.Item 5. Audit Committee of Listed Registrants.
Not applicable.
Item 6. Schedule of Investments.
Not applicable. The complete schedule of investments is included in Item 1 of this Form N-CSR.
Item 7. Disclosure of Proxy Voting Policies and Procedures for Closed-End Management Investment Companies.
Not applicable.
Item 8. Portfolio Managers of Closed-End Management Investment Companies.
Not applicable.
Item 9. Purchases of Equity Securities by Closed-End Management Investment Company and Affiliated Purchasers.
Not applicable.
Item 10. Submission of Matters to a Vote of Security Holders.
Not applicable.
Item 11. Controls and Procedures.
(a) The registrant’s principal executive officer and principal financial officer have evaluated the registrant’s disclosure controls and procedures within 90 days of this filing and have concluded that the registrant’s disclosure controls and procedures were effective, as of that date, in ensuring that information required to be disclosed by the registrant in this Form N-CSR was recorded, processed, summarized, and reported timely.
(b) The registrant’s principal executive officer and principal financial officer are aware of no change in the registrant’s internal control over financial reporting that occurred during the registrant’s second fiscal quarter covered by this report that has materially affected, or is reasonably likely to materially affect, the registrant’s internal control over financial reporting.
Item 12. Exhibits.
(a)(1) The registrant’s code of ethics pursuant to Item 2 of Form N-CSR is attached.
(2) Separate certifications by the registrant's principal executive officer and principal financial officer, pursuant to Section 302 of the Sarbanes-Oxley Act of 2002 and required by Rule 30a-2(a) under the Investment Company Act of 1940, are attached.
(3) Written solicitation to repurchase securities issued by closed-end companies: not applicable.
(b) A certification by the registrant's principal executive officer and principal financial officer, pursuant to Section 906 of the Sarbanes-Oxley Act of 2002 and required by Rule 30a-2(b) under the Investment Company Act of 1940, is attached.
| | |
SIGNATURES |
| |
| | Pursuant to the requirements of the Securities Exchange Act of 1934 and the Investment |
| Company Act of 1940, the registrant has duly caused this report to be signed on its behalf by the |
| undersigned, thereunto duly authorized. |
| |
| T. Rowe Price Capital Opportunity Fund, Inc. |
| |
| |
| By | /s/ James S. Riepe |
| | James S. Riepe |
| | Principal Executive Officer |
| |
| Date | February 21, 2006 |
| |
| |
| | Pursuant to the requirements of the Securities Exchange Act of 1934 and the Investment |
| Company Act of 1940, this report has been signed below by the following persons on behalf of |
| the registrant and in the capacities and on the dates indicated. |
| |
| |
| By | /s/ James S. Riepe |
| | James S. Riepe |
| | Principal Executive Officer |
| |
| Date | February 21, 2006 |
| |
| |
| |
| By | /s/ Joseph A. Carrier |
| | Joseph A. Carrier |
| | Principal Financial Officer |
| |
| Date | February 21, 2006 |