| UNITED STATES |
| SECURITIES AND EXCHANGE COMMISSION |
| Washington, D.C. 20549 |
| |
FORM N-CSR |
| |
CERTIFIED SHAREHOLDER REPORT OF REGISTERED |
MANAGEMENT INVESTMENT COMPANIES |
| |
| |
| |
| Investment Company Act File Number: 811-07225 |
|
| |
| T. Rowe Price Capital Opportunity Fund, Inc. |
|
| (Exact name of registrant as specified in charter) |
| |
| 100 East Pratt Street, Baltimore, MD 21202 |
|
| (Address of principal executive offices) |
| |
| David Oestreicher |
| 100 East Pratt Street, Baltimore, MD 21202 |
|
| (Name and address of agent for service) |
| |
| |
| Registrant’s telephone number, including area code: (410) 345-2000 |
| |
| |
| Date of fiscal year end: December 31 |
| |
| |
| Date of reporting period: December 31, 2008 |
Item 1: Report to Shareholders| Capital Opportunity Fund | December 31, 2008 |
The views and opinions in this report were current as of December 31, 2008. They are not guarantees of performance or investment results and should not be taken as investment advice. Investment decisions reflect a variety of factors, and the managers reserve the right to change their views about individual stocks, sectors, and the markets at any time. As a result, the views expressed should not be relied upon as a forecast of the fund’s future investment intent. The report is certified under the Sarbanes-Oxley Act, which requires mutual funds and other public companies to affirm that, to the best of their knowledge, the information in their financial reports is fairly and accurately stated in all material respects.
REPORTS ON THE WEB
Sign up for our E-mail Program, and you can begin to receive updated fund reports and prospectuses online rather than through the mail. Log in to your account at troweprice.com for more information.
Manager’s Letter
Fellow Shareholders
The first sentence of the Charles Dickens novel A Tale of Two Cities begins with the now-familiar words, “It was the best of times, it was the worst of times.” For the U.S. stock market in 2008, it was definitely the worst of times. You have to go back to the 1930s, in the heart of the Great Depression, to find a year in which the stock market performed as poorly as it did in 2008. The major stock indexes plummeted, losing more than one-third of their value for the year, as a deepening credit and liquidity crisis left the financials sector in shambles and a yearlong recession took its toll on the rest of the U.S. economy.

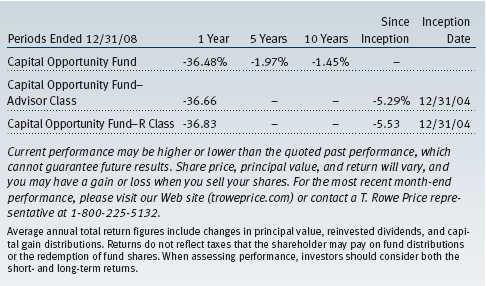
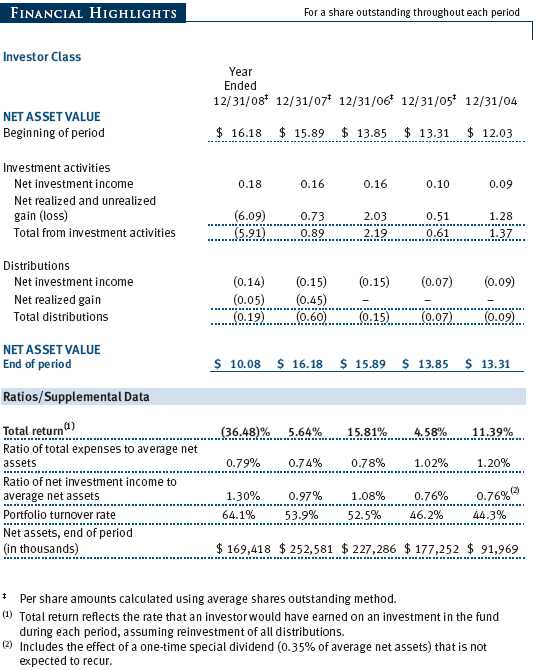
Your fund was not spared the carnage in the broader equity market. As the accompanying table shows, the Capital Opportunity Fund returned -36.48% in 2008. Much of this substantial decline occurred in the last half of the year as the fund returned -29.12% for the six months ended December 31, 2008. Although it is cold comfort when returns are so negative, the fund did outperform both the S&P 500 Index and the Lipper Large-Cap Core Funds Index for the year. (Returns for Advisor and R Class shares reflect a different fee structure.) Stock selection in two key sectors—financials and information technology—drove the fund’s outperformance of the S&P 500 in 2008.
HIGHLIGHTS
• Stocks plummeted in the worst year for the markets since the Great Depression.
• The Capital Opportunity Fund posted a substantial and disappointing loss but narrowly outperformed the S&P 500 Index for the year.
• Stock selection in financials and information technology aided the fund’s relative results, while our telecommunication services and utilities holdings hurt performance versus the S&P 500.
• Continued market volatility is likely to generate price dislocations that provide attractive investment opportunities for our experienced research team to identify.

MARKET ENVIRONMENT
A host of factors contributed to the steep market decline during the year, but one of the most significant was the liquidity crisis in the credit markets, which grew out of the subprime mortgage meltdown in mid-2007 and intensified markedly during 2008. The bursting of the housing market bubble caused a sharp increase in delinquencies and foreclosures, which led to hundreds of billions of dollars in losses and write-downs on mortgage-related securities. The magnitude of the losses forced an increasing number of financial companies to raise additional capital to strengthen their balance sheets, a task made all the more difficult by the tight credit conditions.
The credit and liquidity stress afflicting the financials sector reached critical mass in September, when brokerage firm Lehman Brothers filed for bankruptcy and several other companies—including broker Merrill Lynch and banks Washington Mutual and Wachovia—avoided bankruptcy by accepting takeover offers from competitors, in many cases at fire-sale prices. The federal government responded with an extraordinary level of intervention that included deposit guarantees, cash infusions, and purchases of distressed assets—all with the goal of restoring liquidity and preventing a systemic collapse in the financials sector.
The credit crisis and financial distress weighed on an already fragile U.S. economy that has been in recession since December 2007. The economy shed more than 2.5 million jobs in 2008, lifting the unemployment rate from 5% to a 16-year high of 7.2%. Retail sales declined for the first time in decades, weak vehicle sales left the U.S. auto industry teetering on the brink of insolvency, and industrial activity slumped to its lowest level since 2004. In an effort to jump-start the U.S. economic engine, the Federal Reserve cut its short-term interest rate target from 4.25% at the beginning of the year to an unprecedented range of 0.00%–0.25% by year-end.
In addition to the credit and economic difficulties, the stock market was buffeted by a roller-coaster ride in the commodity markets. The prices of many commodities surged in the first half of the year, with many reaching all-time highs, leading to concerns about rapidly rising inflation.
However, prices plummeted back to earth in the last six months as global demand waned, the dollar strengthened, and hedge funds liquidated resource holdings. As a result, inflation worries dissipated, giving way to concerns about deflation as the consumer price index rose by just 0.1% in 2008—the lowest increase since 1954.
Given this backdrop, stocks spent most of the year on a downward trajectory that grew steeper as the year progressed. The U.S. equity market began the year with its worst quarterly decline since 2002. Stocks rebounded in April and May as the credit crisis appeared to be abating, but a fresh round of losses in the financials sector sent the stock market down sharply in June. Volatility increased further in September as the financials sector unraveled, leading to another substantial decline in October—the worst month for the market since the 1987 crash. Stocks bottomed in late November and staged a modest recovery through the end of the year, but the major equity indexes still finished 2008 down more than 35%.
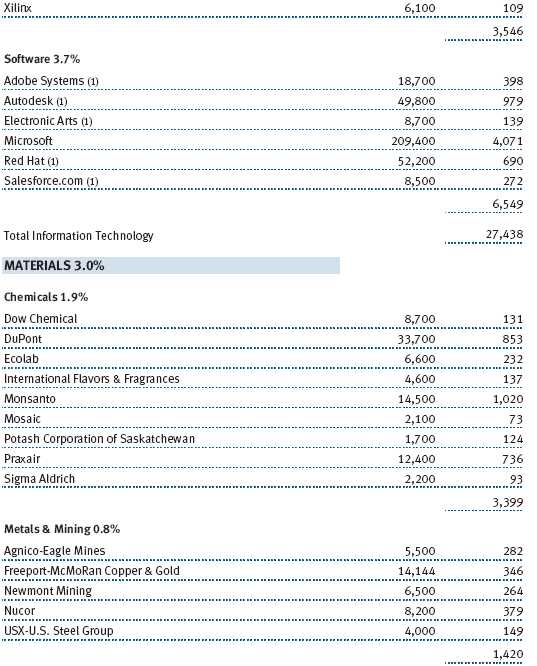
Every sector of the market declined during the year, but financials suffered the most significant losses amid the worsening credit crisis. The materials sector was hit hard by falling commodity prices, while economic weakness weighed on information technology stocks. The consumer staples and health care sectors, which are considered the most defensive sectors of the market, posted the smallest declines in 2008.
PORTFOLIO REVIEW
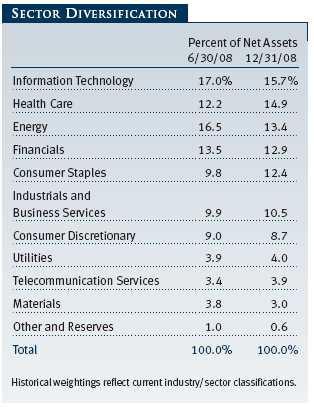
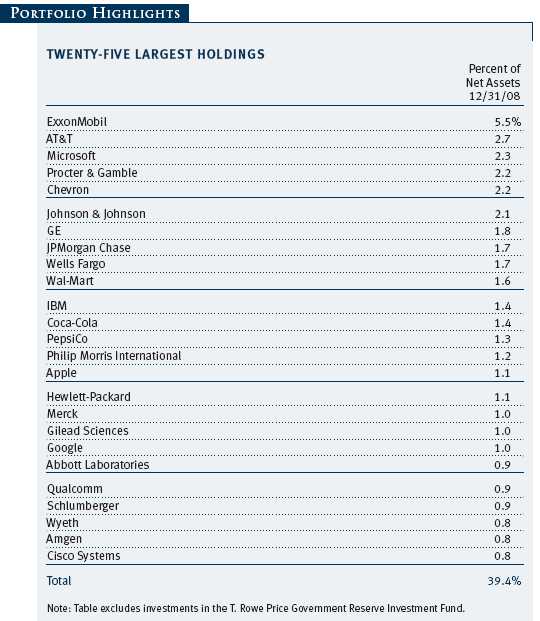
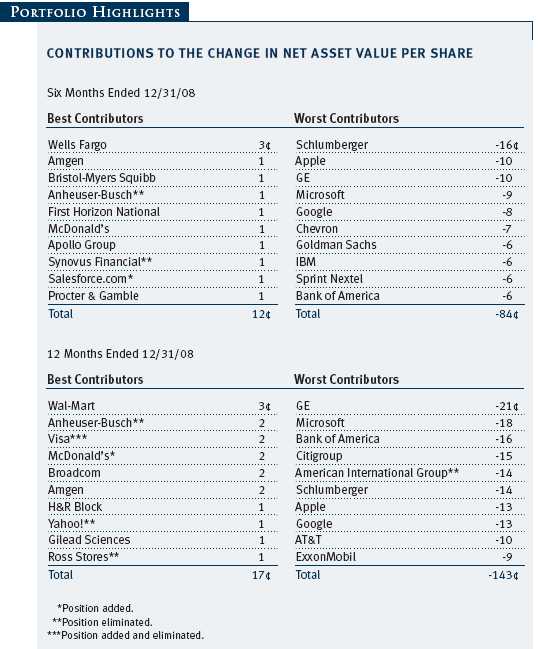
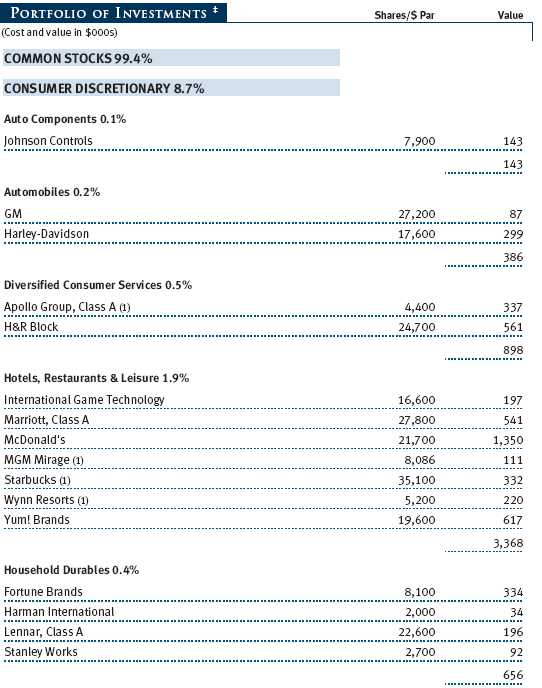
On an absolute basis, the worst-performing sector in the portfolio in 2008 was financials (13% of assets as of December 31, 2008). However, stock selection in this sector was the main contributing factor to your fund’s outperformance of the S&P 500 for the year. Much of the outperformance resulted from avoiding or limiting our exposure to some of the worst offenders in this sector. For example, we eliminated insurer American International Group and mortgage lender Fannie Mae from the portfolio around midyear, before their problems became so severe that the federal government became the largest shareholder in both companies. Your fund also benefited from some of the financial companies we did own, including tax consultant H&R Block, which was one of the few financial stocks to advance in 2008, and insurance broker AON. H&R Block jettisoned some of its less-profitable businesses to refocus on its core tax preparation services, while AON completed a successful restructuring that lowered costs across the company. (Please refer to the fund’s portfolio of investments for a complete listing of holdings and the amount each represents in the portfolio.)
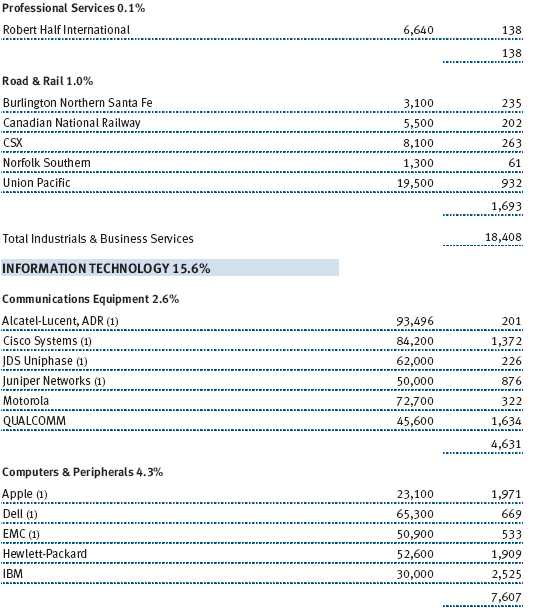
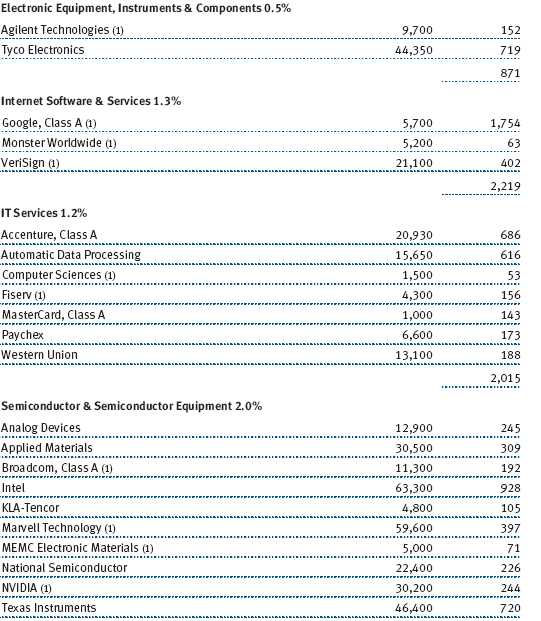
Stock selection also contributed positively to performance in the information technology sector (16% of the portfolio at the end of 2008), which was the portfolio’s largest sector weighting for much of the year. Our top contributor in this sector, on both an absolute and relative basis, was a name that may not come immediately to mind as a tech stock—credit card processor Visa, which went public early in the year. We participated in the IPO because we liked Visa’s strong transaction volumes and robust growth in its debit card business. However, we grew concerned about mounting losses in the overall credit card industry, so we took advantage of a substantial rally in the stock to eliminate it from the portfolio in the middle of the year. Other notable contributors among technology stocks included semiconductor manufacturer Broadcom, which benefited from a new product cycle, and IT consulting firm Accenture, which increased its profit margins thanks to stronger growth overseas.
Although stock selection was favorable overall among technology stocks, some of the portfolio’s biggest absolute detractors also came from this sector, particularly over the last six months as the economic environment continued to deteriorate. The culprits included some of the most well-known names in technology—consumer electronics maker Apple, online advertising and search firm Google, and software maker Microsoft, all of which were adversely affected by declines in consumer and business spending.
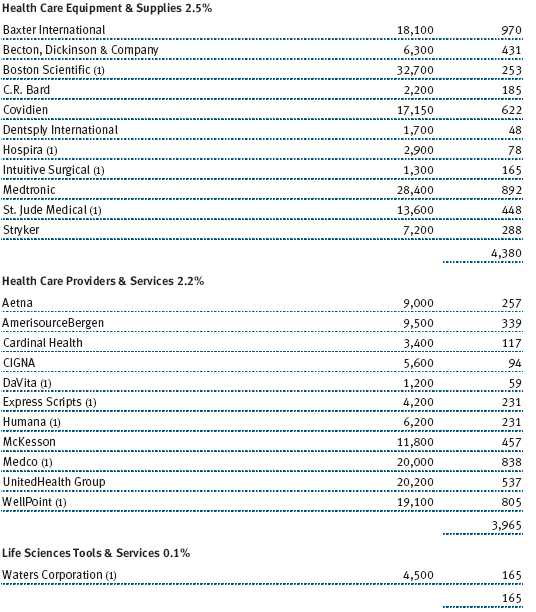
Health care was the second-biggest sector in the portfolio (15% of assets at the end of the reporting period). Our investment decisions added value in this sector as well, mostly in the biotechnology industry. Amgen was one of the best performers, advancing as its new osteoporosis medication achieved success in clinical trials. Gilead Sciences, which focuses on the treatment of HIV, was another strong contributor, benefiting from rising sales of its antiviral medications.
The top-performing sector in the portfolio on an absolute basis was consumer staples (12% of assets at year’s end), a traditionally defensive sector that typically holds up well in weak economic conditions. This sector featured the two best absolute performance contributors in the portfolio—discount retailer Wal-Mart and beverage maker Anheuser-Busch. Wal-Mart was a significant beneficiary of a shift in consumer behavior as the economic downturn caused budget-conscious consumers to seek out less expensive goods and services. Merger activity boosted Anheuser-Busch, which was acquired at a premium by InBev, a global brewing conglomerate based in Europe.
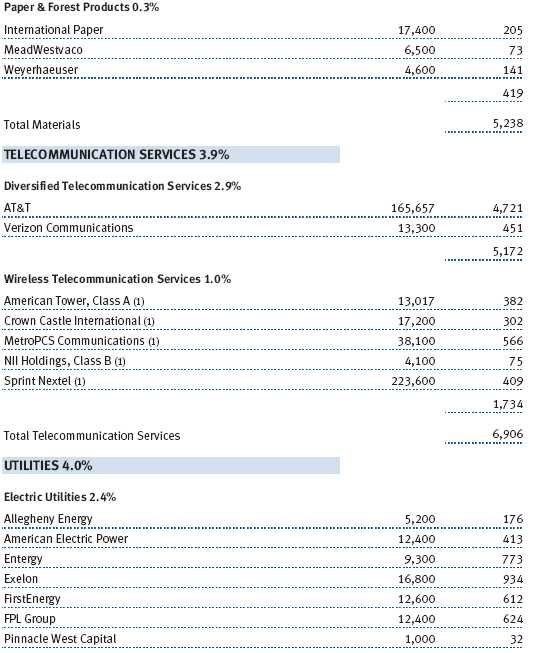
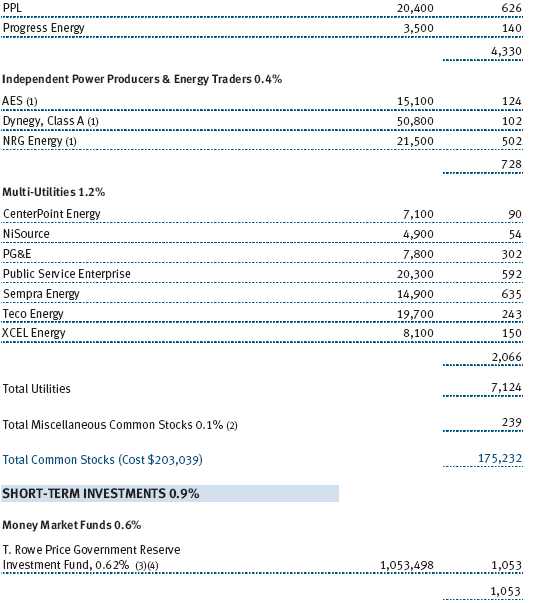
Stock selection had the biggest negative impact in the telecommunication services and utilities sectors, two of the smaller segments of the portfolio (8% of assets combined as of December 31). In the telecom sector, our stock choices among wireless companies detracted the most, led by wireless services provider Sprint Nextel. We initiated a position in the stock after a poor earnings report earlier in the year led to a lower stock price coupled with a lower—but more realistic—earnings expectation. In addition, the company hired a new CEO. Although Sprint Nextel’s cash flows and balance sheet improved as the year progressed, concerns about the company’s inability to stem the tide of subscriber and market share losses put further downward pressure on the stock. Another telecom-related detractor was wireless tower operator Crown Castle International, which declined amid concerns about its ability to refinance its short-term debt in a tight credit environment. In the utilities sector, independent power producers were the weakest performers as a sharp drop-off in natural gas prices weighed on profit margins, and our overweight position in the industry—most notably AES and NRG Energy—hurt results. In prior periods, these stocks had contributed favorably to your portfolio.
Other noteworthy decliners during the year included our positions in gaming stocks, particularly casino operator MGM Mirage and gaming machine manufacturer International Game Technology. The economic downturn hurt casino traffic and gaming revenues, while limited access to financing truncated new development. Energy services provider Schlumberger, one of the portfolio’s largest holdings for much of 2008, plunged late in the year as falling oil prices reduced demand for the company’s equipment and services.
OUTLOOK
The unstable influences that roiled the global equity markets in 2008 are likely to continue as we move through the first half of 2009. Although the U.S. government and its major trading partners have injected capital and lowered interest rates in a coordinated effort to restore confidence in the financial system, it will take some time for these measures to have an effect.
In the meantime, we expect continued market volatility to generate price dislocations that provide attractive investment opportunities for our experienced research team to identify and capitalize upon. We remain confident that our investment strategy—emphasizing rigorous research and comprehensive analysis to seek out companies we believe have the potential for capital appreciation while maintaining sector weightings in line with the S&P 500—will serve investors well over the long term.
Respectfully submitted,

Anna M. Dopkin
President of the fund and chairman of its Investment Advisory Committee
January 16, 2009
The committee chairman has day-to-day responsibility for managing the portfolio and works with committee members in developing and executing the fund’s investment program.
RISKS OF INVESTING
As with all stock mutual funds, the fund’s share price can fall because of weakness in the stock market, a particular industry, or specific holdings. Stock markets can decline for many reasons, including adverse political or economic developments, changes in investor psychology, or heavy institutional selling. The prospects for an industry or company may deteriorate because of a variety of factors, including disappointing earnings or changes in the competitive environment.
GLOSSARY
Lipper indexes: Consist of a small number (10 to 30) of the largest mutual funds in a particular category as tracked by Lipper Inc.
Russell 2000 Index: Tracks the stocks of 2,000 small U.S. companies.
S&P 500 Stock Index: Tracks the stocks of 500 mostly large U.S. companies.
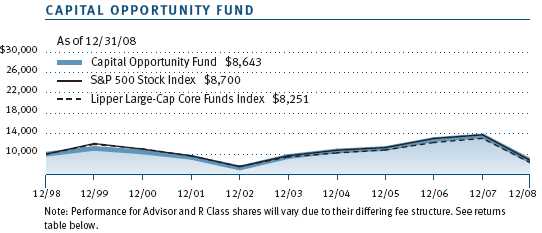
Performance and Expenses
This chart shows the value of a hypothetical $10,000 investment in the fund over the past 10 fiscal year periods or since inception (for funds lacking 10-year records). The result is compared with benchmarks, which may include a broad-based market index and a peer group average or index. Market indexes do not include expenses, which are deducted from fund returns as well as mutual fund averages and indexes.
| AVERAGE ANNUAL COMPOUND TOTAL RETURN |
This table shows how the fund would have performed each year if its actual (or cumulative) returns had been earned at a constant rate.
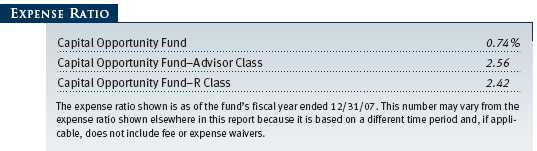
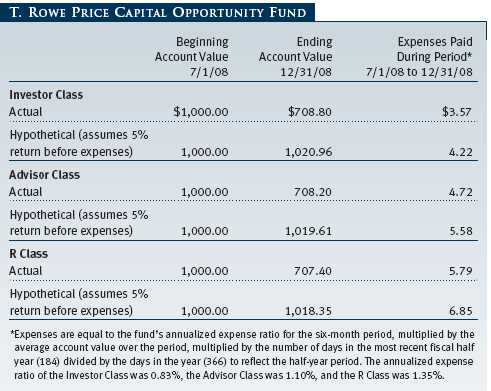
As a mutual fund shareholder, you may incur two types of costs: (1) transaction costs, such as redemption fees or sales loads, and (2) ongoing costs, including management fees, distribution and service (12b-1) fees, and other fund expenses. The following example is intended to help you understand your ongoing costs (in dollars) of investing in the fund and to compare these costs with the ongoing costs of investing in other mutual funds. The example is based on an investment of $1,000 invested at the beginning of the most recent six-month period and held for the entire period.
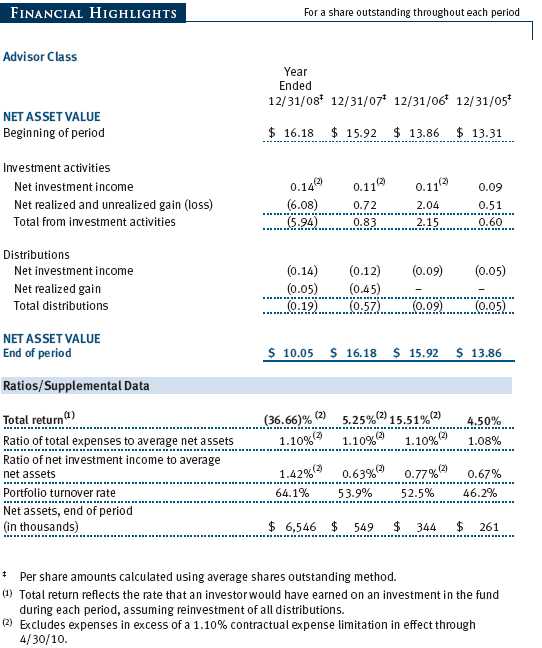
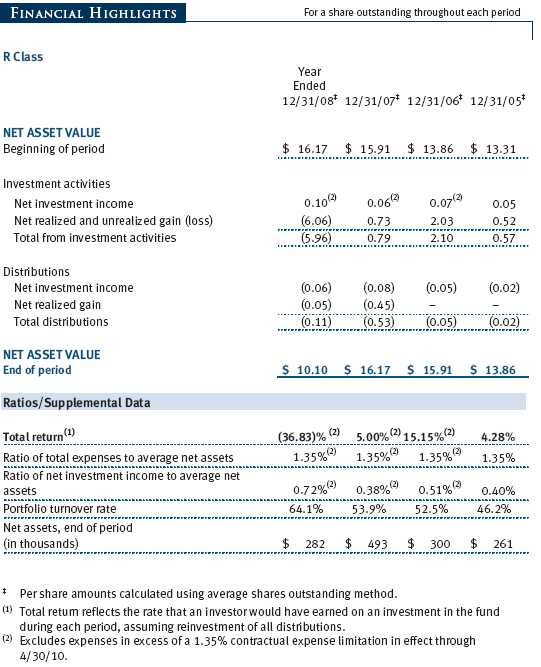
Please note that the fund has three share classes: The original share class (“investor class”) charges no distribution and service (12b-1) fee; Advisor Class shares are offered only through unaffiliated brokers and other financial intermediaries and charge a 0.25% 12b-1 fee; and R Class shares are available to retirement plans serviced by intermediaries and charge a 0.50% 12b-1 fee. Each share class is presented separately in the table.
Actual Expenses
The first line of the following table (“Actual”) provides information about actual account values and expenses based on the fund’s actual returns. You may use the information in this line, together with your account balance, to estimate the expenses that you paid over the period. Simply divide your account value by $1,000 (for example, an $8,600 account value divided by $1,000 = 8.6), then multiply the result by the number in the first line under the heading “Expenses Paid During Period” to estimate the expenses you paid on your account during this period.
Hypothetical Example for Comparison Purposes
The information on the second line of the table (“Hypothetical”) is based on hypothetical account values and expenses derived from the fund’s actual expense ratio and an assumed 5% per year rate of return before expenses (not the fund’s actual return). You may compare the ongoing costs of investing in the fund with other funds by contrasting this 5% hypothetical example and the 5% hypothetical examples that appear in the shareholder reports of the other funds. The hypothetical account values and expenses may not be used to estimate the actual ending account balance or expenses you paid for the period.
Note: T. Rowe Price charges an annual small-account maintenance fee of $10, generally for accounts with less than $2,000 ($500 for UGMA/UTMA). The fee is waived for any investor whose T. Rowe Price mutual fund accounts total $25,000 or more, accounts employing automatic investing, and IRAs and other retirement plan accounts that utilize a prototype plan sponsored by T. Rowe Price (although a separate custodial or administrative fee may apply to such accounts). This fee is not included in the accompanying table. If you are subject to the fee, keep it in mind when you are estimating the ongoing expenses of investing in the fund and when comparing the expenses of this fund with other funds.
You should also be aware that the expenses shown in the table highlight only your ongoing costs and do not reflect any transaction costs, such as redemption fees or sales loads. Therefore, the second line of the table is useful in comparing ongoing costs only and will not help you determine the relative total costs of owning different funds. To the extent a fund charges transaction costs, however, the total cost of owning that fund is higher.
The accompanying notes are an integral part of these financial statements.
The accompanying notes are an integral part of these financial statements.
The accompanying notes are an integral part of these financial statements.


The accompanying notes are an integral part of these financial statements.

The accompanying notes are an integral part of these financial statements.

The accompanying notes are an integral part of these financial statements.

The accompanying notes are an integral part of these financial statements.
| NOTES TO FINANCIAL STATEMENTS |
T. Rowe Price Capital Opportunity Fund, Inc. (the fund), is registered under the Investment Company Act of 1940 (the 1940 Act) as a diversified, open-end management investment company. The fund seeks to provide long-term capital growth by investing primarily in U.S. common stocks. The fund has three classes of shares: the Capital Opportunity Fund original share class, referred to in this report as the Investor Class, offered since November 30, 1994; the Capital Opportunity Fund—Advisor Class (Advisor Class), offered since December 31, 2004; and the Capital Opportunity Fund—R Class (R Class), offered since December 31, 2004. Advisor Class shares are sold only through unaffiliated brokers and other unaffiliated financial intermediaries, and R Class shares are available to retirement plans serviced by intermediaries. The Advisor Class and R Class each operate under separate Board-approved Rule 12b-1 plans, pursuant to which each class compensates financial intermediaries for distribution, shareholder servicing, and/or certain administrative services. Each class has exclusive voting rights on matters related solely to that class, separate voting rights on matters that relate to all classes, and, in all other respects, the same rights and obligations as the other classes.
NOTE 1 - SIGNIFICANT ACCOUNTING POLICIES
Basis of Preparation The accompanying financial statements were prepared in accordance with accounting principles generally accepted in the United States of America, which require the use of estimates made by fund management. Fund management believes that estimates and security valuations are appropriate; however, actual results may differ from those estimates, and the security valuations reflected in the financial statements may differ from the value the fund ultimately realizes upon sale of the securities.
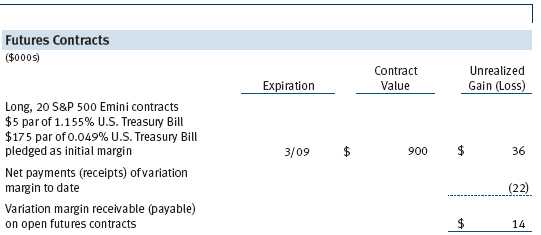
Investment Transactions, Investment Income, and Distributions Income and expenses are recorded on the accrual basis. Premiums and discounts on debt securities are amortized for financial reporting purposes. Dividends received from mutual fund investments are reflected as dividend income; capital gain distributions are reflected as realized gain/loss. Dividend income and capital gain distributions are recorded on the ex-dividend date. Income tax-related interest and penalties, if incurred, would be recorded as income tax expense. Investment transactions are accounted for on the trade date. Realized gains and losses are reported on the identified cost basis. Payments (“variation margin”) made or received to settle the daily fluctuations in the value of futures contracts are recorded as unrealized gains or losses until the contracts are closed. Unsettled variation margin on futures contracts is reflected as other assets or liabilities, and unrealized gains and losses on futures contracts are reflected as the change in net unrealized gain or loss in the accompanying financial statements. Distributions to shareholders are recorded on the ex-dividend date. Income distributions are declared and paid by each class on an annual basis. Capital gain distributions, if any, are declared and paid by the fund, typically on an annual basis.
Class Accounting The Advisor Class and R Class each pay distribution, shareholder servicing, and/or certain administrative expenses in the form of Rule 12b-1 fees, in an amount not exceeding 0.25% and 0.50%, respectively, of the class’s average daily net assets. Shareholder servicing, prospectus, and shareholder report expenses incurred by each class are charged directly to the class to which they relate. Expenses common to all classes, investment income, and realized and unrealized gains and losses are allocated to the classes based upon the relative daily net assets of each class.
Rebates Subject to best execution, the fund may direct certain security trades to brokers who have agreed to rebate a portion of the related brokerage commission to the fund in cash. Commission rebates are reflected as realized gain on securities in the accompanying financial statements and totaled $12,000 for the year ended December 31, 2008.
New Accounting Pronouncements On January 1, 2008, the fund adopted Statement of Financial Accounting Standards No. 157 (FAS 157), Fair Value Measurements. FAS 157 defines fair value, establishes the framework for measuring fair value, and expands the disclosures of fair value measurements in the financial statements. Adoption of FAS 157 did not have a material impact on the fund’s net assets or results of operations.
In March 2008, the Financial Accounting Standards Board issued Statement of Financial Accounting Standards No. 161 (FAS 161), Disclosures about Derivative Instruments and Hedging Activities, which is effective for fiscal years and interim periods beginning after November 15, 2008. FAS 161 requires enhanced disclosures about derivative and hedging activities, including how such activities are accounted for and their effect on financial position, performance and cash flows. Management is currently evaluating the impact the adoption of FAS 161 will have on the fund’s financial statements and related disclosures.
NOTE 2 - VALUATION
The fund’s investments are reported at fair value as defined under FAS 157. The fund values its investments and computes its net asset value per share at the close of the New York Stock Exchange (NYSE), normally 4 p.m. ET, each day that the NYSE is open for business.
Valuation Methods Equity securities listed or regularly traded on a securities exchange or in the over-the-counter (OTC) market are valued at the last quoted sale price or, for certain markets, the official closing price at the time the valuations are made, except for OTC Bulletin Board securities, which are valued at the mean of the latest bid and asked prices. A security that is listed or traded on more than one exchange is valued at the quotation on the exchange determined to be the primary market for such security. Listed securities not traded on a particular day are valued at the mean of the latest bid and asked prices for domestic securities and the last quoted sale price for international securities. Debt securities with remaining maturities of less than one year at the time of acquisition generally use amortized cost in local currency to approximate fair value. However, if amortized cost is deemed not to reflect fair value or the fund holds a significant amount of such securities with remaining maturities of more than 60 days, the securities are valued at prices furnished by dealers who make markets in such securities or by an independent pricing service.
Investments in mutual funds are valued at the mutual fund’s closing net asset value per share on the day of valuation. Financial futures contracts are valued at closing settlement prices.
Other investments, including restricted securities, and those for which the above valuation procedures are inappropriate or are deemed not to reflect fair value are stated at fair value as determined in good faith by the T. Rowe Price Valuation Committee, established by the fund’s Board of Directors.
Valuation Inputs Various inputs are used to determine the value of the fund’s investments. These inputs are summarized in the three broad levels listed below:
Level 1 – quoted prices in active markets for identical securities
Level 2 – observable inputs other than Level 1 quoted prices (including, but not limited to, quoted prices for similar securities, interest rates, prepayment speeds, credit risk)
Level 3 – unobservable inputs
Observable inputs are those based on market data obtained from sources independent of the fund, and unobservable inputs reflect the fund’s own assumptions based on the best information available. The input levels are not necessarily an indication of the risk or liquidity associated with investments at that level. The following table summarizes the fund’s investments, based on the inputs used to determine their values on December 31, 2008:

NOTE 3 - INVESTMENT TRANSACTIONS
Consistent with its investment objective, the fund engages in the following practices to manage exposure to certain risks or to enhance performance. The investment objective, policies, program, and risk factors of the fund are described more fully in the fund’s prospectus and Statement of Additional Information.
Futures Contracts During the year ended December 31, 2008, the fund was a party to futures contracts, which provide for the future sale by one party and purchase by another of a specified amount of a specific financial instrument at an agreed upon price, date, time, and place. Risks arise from possible illiquidity of the futures market and from movements in security values and/or interest rates.
Other Purchases and sales of portfolio securities, other than short-term securities, aggregated $165,309,000 and $142,794,000, respectively, for the year ended December 31, 2008.
NOTE 4 - FEDERAL INCOME TAXES
No provision for federal income taxes is required since the fund intends to continue to qualify as a regulated investment company under Subchapter M of the Internal Revenue Code and distribute to shareholders all of its taxable income and gains. Distributions are determined in accordance with Federal income tax regulations, which differ from generally accepted accounting principles, and, therefore, may differ significantly in amount or character from net investment income and realized gains for financial reporting purposes. Financial reporting records are adjusted for permanent book/tax differences to reflect tax character but are not adjusted for temporary differences.
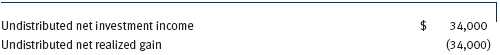
Reclassifications between income and gain relate primarily to the per share rounding of distributions. For the year ended December 31, 2008, the following reclassifications, which had no impact on results of operations or net assets, were recorded to reflect tax character:
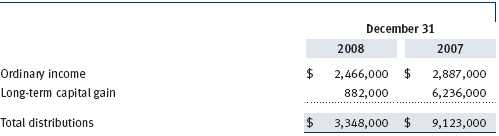
Distributions during the years ended December 31, 2008 and December 31, 2007 were characterized for tax purposes as follows:
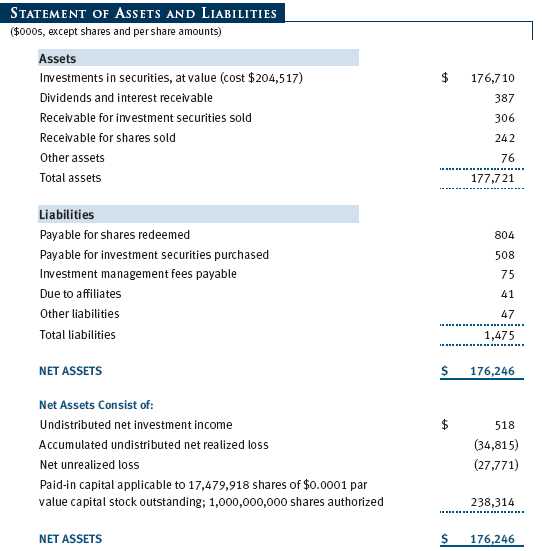
At December 31, 2008, the tax-basis cost of investments and components of net assets were as follows:

The difference between book-basis and tax-basis net unrealized appreciation (depreciation) is attributable to the deferral of losses from wash sales for tax purposes. The fund intends to retain realized gains to the extent of available capital loss carryforwards. As of December 31, 2008, all unused capital loss carryforwards expire in fiscal 2016. Pursuant to federal income tax regulations applicable to investment companies, recognition of capital losses on certain transactions is deferred until the subsequent tax year. Consequently, realized losses reflected in the accompanying financial statements include net capital losses realized between November 1 and the fund’s fiscal year-end that have not been recognized for tax purposes (Post-October loss deferrals).
NOTE 5 - RELATED PARTY TRANSACTIONS
The fund is managed by T. Rowe Price Associates, Inc. (the manager or Price Associates), a wholly owned subsidiary of T. Rowe Price Group, Inc. The investment management agreement between the fund and the manager provides for an annual investment management fee, which is computed daily and paid monthly. The fee consists of an individual fund fee, equal to 0.20% of the fund’s average daily net assets, and a group fee. The group fee rate is calculated based on the combined net assets of certain mutual funds sponsored by Price Associates (the group) applied to a graduated fee schedule, with rates ranging from 0.48% for the first $1 billion of assets to 0.285% for assets in excess of $220 billion. The fund’s group fee is determined by applying the group fee rate to the fund’s average daily net assets. At December 31, 2008, the effective annual group fee rate was 0.31%.
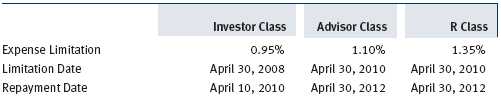
Each class is also subject to a contractual expense limitation through the limitation dates indicated in the table below. During the limitation period, the manager is required to waive its management fee and/or reimburse expenses, excluding interest, taxes, brokerage commissions, and extraordinary expenses, that would otherwise cause the class’s ratio of annualized total expenses to average net assets (expense ratio) to exceed its expense limitation. Each class is required to repay the manager for expenses previously reimbursed and management fees waived to the extent the class’s net assets have grown or expenses have declined sufficiently to allow repayment without causing the class’s expense ratio to exceed its expense limitation. However, no repayment will be made more than three years after the date of any reimbursement or waiver or later than the repayment dates indicated in the table below.
Pursuant to this agreement, expenses in the amount of $6,000 were reimbursed by the manager during the year ended December 31, 2008. Including these amounts, expenses previously reimbursed by the manager in the amount of $28,000 remain subject to repayment at December 31, 2008. For the year ended December 31, 2008, the Investor Class operated below its expense limitation.
In addition, the fund has entered into service agreements with Price Associates and two wholly owned subsidiaries of Price Associates (collectively, Price). Price Associates computes the daily share prices and provides certain other administrative services to the fund. T. Rowe Price Services, Inc., provides shareholder and administrative services in its capacity as the fund’s transfer and dividend disbursing agent. T. Rowe Price Retirement Plan Services, Inc., provides subaccounting and recordkeeping services for certain retirement accounts invested in the Investor Class and R Class. For the year ended December 31, 2008, expenses incurred pursuant to these service agreements were $167,000 for Price Associates, $164,000 for T. Rowe Price Services, Inc., and $9,000 for T. Rowe Price Retirement Plan Services, Inc. The total amount payable at period-end pursuant to these service agreements is reflected as Due to Affiliates in the accompanying financial statements.
The fund may invest in the T. Rowe Price Reserve Investment Fund and the T. Rowe Price Government Reserve Investment Fund (collectively, the T. Rowe Price Reserve Investment Funds), open-end management investment companies managed by Price Associates and considered affiliates of the fund. The T. Rowe Price Reserve Investment Funds are offered as cash management options to mutual funds, trusts, and other accounts managed by Price Associates and/or its affiliates and are not available for direct purchase by members of the public. The T. Rowe Price Reserve Investment Funds pay no investment management fees.
As of December 31, 2008, T. Rowe Price Group, Inc., and/or its wholly owned subsidiaries owned 1,227,569 shares of the Investor Class, and 19,715 shares of the R Class, aggregating 7% of the fund’s net assets.
| REPORT OF INDEPENDENT REGISTERED PUBLIC ACCOUNTING FIRM |
To the Board of Directors and Shareholders of T. Rowe Price Capital Opportunity Fund, Inc.
In our opinion, the accompanying statement of assets and liabilities, including the schedule of investments, and the related statements of operations and of changes in net assets and the financial highlights present fairly, in all material respects, the financial position of T. Rowe Price Capital Opportunity Fund, Inc. (the “Fund”) at December 31, 2008, the results of its operations for the year then ended, the changes in its net assets for each of the two years in the period then ended and the financial highlights for each of the fiscal periods presented, in conformity with accounting principles generally accepted in the United States of America. These financial statements and financial highlights (hereafter referred to as “financial statements”) are the responsibility of the Fund’s management; our responsibility is to express an opinion on these financial statements based on our audits. We conducted our audits of these financial statements in accordance with the standards of the Public Company Accounting Oversight Board (United States). Those standards require that we plan and perform the audit to obtain reasonable assurance about whether the financial statements are free of material misstatement. An audit includes examining, on a test basis, evidence supporting the amounts and disclosures in the financial statements, assessing the accounting principles used and significant estimates made by management, and evaluating the overall financial statement presentation. We believe that our audits, which included confirmation of securities at December 31, 2008 by correspondence with the custodian and brokers and confirmation of the underlying fund by correspondence with the transfer agent, provide a reasonable basis for our opinion.
PricewaterhouseCoopers LLP
Baltimore, Maryland
February 12, 2009
| TAX INFORMATION (UNAUDITED) FOR THE TAX YEAR ENDED 12/31/08 |
We are providing this information as required by the Internal Revenue Code. The amounts shown may differ from those elsewhere in this report because of differences between tax and financial reporting requirements.
The fund’s distributions to shareholders included $914,000 from long-term capital gains, subject to the 15% rate gains category.
For taxable non-corporate shareholders, $2,887,000 of the fund’s income represents qualified dividend income subject to the 15% rate category.
For corporate shareholders, $2,887,000 of the fund’s income qualifies for the dividends-received deduction.
| INFORMATION ON PROXY VOTING POLICIES, PROCEDURES, AND RECORDS |
A description of the policies and procedures used by T. Rowe Price funds and portfolios to determine how to vote proxies relating to portfolio securities is available in each fund’s Statement of Additional Information, which you may request by calling 1-800-225-5132 or by accessing the SEC’s Web site, www.sec.gov. The description of our proxy voting policies and procedures is also available on our Web site, www.troweprice.com. To access it, click on the words “Our Company” at the top of our corporate homepage. Then, when the next page appears, click on the words “Proxy Voting Policies” on the left side of the page.
Each fund’s most recent annual proxy voting record is available on our Web site and through the SEC’s Web site. To access it through our Web site, follow the directions above, then click on the words “Proxy Voting Records” on the right side of the Proxy Voting Policies page.
| HOW TO OBTAIN QUARTERLY PORTFOLIO HOLDINGS |
The fund files a complete schedule of portfolio holdings with the Securities and Exchange Commission for the first and third quarters of each fiscal year on Form N-Q. The fund’s Form N-Q is available electronically on the SEC’s Web site (www.sec.gov); hard copies may be reviewed and copied at the SEC’s Public Reference Room, 450 Fifth St. N.W., Washington, DC 20549. For more information on the Public Reference Room, call 1-800-SEC-0330.
| ABOUT THE FUND’S DIRECTORS AND OFFICERS |
Your fund is governed by a Board of Directors (Board) that meets regularly to review a wide variety of matters affecting the fund, including performance, investment programs, compliance matters, advisory fees and expenses, service providers, and other business affairs. The Board elects the fund’s officers, who are listed in the final table. At least 75% of Board members are independent of T. Rowe Price Associates, Inc. (T. Rowe Price), and T. Rowe Price International, Inc. (T. Rowe Price International); “inside” or “interested” directors are employees or officers of T. Rowe Price. The business address of each director and officer is 100 East Pratt Street, Baltimore, Maryland 21202. The Statement of Additional Information includes additional information about the directors and is available without charge by calling a T. Rowe Price representative at 1-800-225-5132.
| Independent Directors | |
| |
| Name | |
| (Year of Birth) | Principal Occupation(s) During Past Five Years and Directorships of |
| Year Elected* | Other Public Companies |
| |
| Jeremiah E. Casey | Director, National Life Insurance (2001 to 2005); Director, The Rouse |
| (1940) | Company, real estate developers (1990 to 2004) |
| 2005 | |
| |
| Anthony W. Deering | Chairman, Exeter Capital, LLC, a private investment firm (2004 to |
| (1945) | present); Director, Under Armour (8/08 to present); Director, Vornado |
| 2001 | Real Estate Investment Trust (3/04 to present); Director, Mercantile |
| | Bankshares (2002 to 2007); Member, Advisory Board, Deutsche Bank |
| | North America (2004 to present); Director, Chairman of the Board, |
| | and Chief Executive Officer, The Rouse Company, real estate devel- |
| | opers (1997 to 2004) |
| |
| Donald W. Dick, Jr. | Principal, EuroCapital Advisors, LLC, an acquisition and management |
| (1943) | advisory firm (10/95 to present); Chairman, The Haven Group, a |
| 1994 | custom manufacturer of modular homes (1/04 to present) |
| |
| David K. Fagin | Chairman and President, Nye Corporation (6/88 to present); Director, |
| (1938) | Golden Star Resources Ltd. (5/92 to present); Director, Pacific Rim |
| 1994 | Mining Corp. (2/02 to present); Director, B.C. Corporation (3/08 |
| | to present); Chairman, Canyon Resources Corp. (8/07 to 3/08); |
| | Director, Atna Resources Ltd. (3/08 to present) |
| |
| Karen N. Horn | Director, Eli Lilly and Company (1987 to present); Director, Simon |
| (1943) | Property Group (2004 to present); Director, Federal National Mortgage |
| 2003 | Association (9/06 to present); Director, Norfolk Southern (2/08 to pres- |
| | ent); Director, Georgia Pacific (5/04 to 12/05); Managing Director and |
| | President, Global Private Client Services, Marsh Inc. (1999 to 2003) |
| | |
| Theo C. Rodgers | President, A&R Development Corporation (1977 to present) |
| (1941) | |
| 2005 | |
| |
| John G. Schreiber | Owner/President, Centaur Capital Partners, Inc., a real estate invest- |
| (1946) | ment company (1991 to present); Partner, Blackstone Real Estate |
| 2001 | Advisors, L.P. (10/92 to present) |
| |
| *Each independent director oversees 126 T. Rowe Price portfolios (except Mr. Fagin, who oversees 125 T. Rowe |
| Price portfolios) and serves until retirement, resignation, or election of a successor. |
| |
| |
| Inside Directors | |
| |
| Name | |
| (Year of Birth) | |
| Year Elected* | |
| [Number of T. Rowe Price | Principal Occupation(s) During Past Five Years and Directorships of |
| Portfolios Overseen] | Other Public Companies |
| |
| Edward C. Bernard | Director and Vice President, T. Rowe Price; Vice Chairman of the Board, |
| (1956) | Director, and Vice President, T. Rowe Price Group, Inc.; Chairman of |
| 2006 | the Board, Director, and President, T. Rowe Price Investment Services, |
| [126] | Inc.; Chairman of the Board and Director, T. Rowe Price Global Asset |
| | Management Limited, T. Rowe Price Global Investment Services |
| | Limited, T. Rowe Price Retirement Plan Services, Inc., T. Rowe Price |
| | Savings Bank, and T. Rowe Price Services, Inc.; Director, T. Rowe Price |
| | International, Inc.; Chief Executive Officer, Chairman of the Board, |
| | Director, and President, T. Rowe Price Trust Company; Chairman of |
| | the Board, all funds |
| |
| John H. Laporte, CFA | Director and Vice President, T. Rowe Price and T. Rowe Price Group, |
| (1945) | Inc.; Vice President, T. Rowe Price Trust Company |
| 1994 | |
| [16] | |
| |
| *Each inside director serves until retirement, resignation, or election of a successor. |
| Officers | |
| |
| Name (Year of Birth) | |
| Title and Fund(s) Served | Principal Occupation(s) |
| |
| Kennard W. Allen (1977) | Vice President, T. Rowe Price and T. Rowe Price |
| Vice President, Capital Opportunity Fund | Group, Inc. |
| |
| Peter J. Bates, CFA (1974) | Vice President, T. Rowe Price and T. Rowe Price |
| Vice President, Capital Opportunity Fund | Group, Inc.; formerly intern, T. Rowe Price (to |
| | 2004); Vice President of Finance, Rent-A-Center, |
| | Inc. (to 2003) |
| |
| Anna M. Dopkin, CFA (1967) | Vice President, T. Rowe Price, T. Rowe Price |
| President, Capital Opportunity Fund | Group, Inc., and T. Rowe Price Trust Company |
| |
| David J. Eiswert, CFA (1972) | Vice President, T. Rowe Price and T. Rowe Price |
| Vice President, Capital Opportunity Fund | Group, Inc.; formerly Analyst, Mellon Growth |
| | Advisors and Fidelity Management and Research |
| | (to 2003) |
| |
| Roger L. Fiery III, CPA (1959) | Vice President, T. Rowe Price, T. Rowe Price |
| Vice President, Capital Opportunity Fund | Group, Inc., T. Rowe Price International, Inc., |
| | and T. Rowe Price Trust Company |
| |
| Mark S. Finn, CFA, CPA (1963) | Vice President, T. Rowe Price and T. Rowe Price |
| Vice President, Capital Opportunity Fund | Group, Inc. |
| |
| John R. Gilner (1961) | Chief Compliance Officer and Vice President, |
| Chief Compliance Officer, Capital | T. Rowe Price; Vice President, T. Rowe Price |
| Opportunity Fund | Group, Inc., and T. Rowe Price Investment |
| | Services, Inc. |
| |
| Gregory S. Golczewski (1966) | Vice President, T. Rowe Price and T. Rowe Price |
| Vice President, Capital Opportunity Fund | Trust Company |
| |
| Gregory K. Hinkle, CPA (1958) | Vice President, T. Rowe Price, T. Rowe Price |
| Treasurer, Capital Opportunity Fund | Group, Inc., T. Rowe Price Investment Services, |
| | Inc., and T. Rowe Price Trust Company; formerly |
| | Partner, PricewaterhouseCoopers LLP (to 2007) |
| |
| Ann M. Holcomb, CFA (1972) | Vice President, T. Rowe Price, T. Rowe Price |
| Vice President, Capital Opportunity Fund | Group, Inc., and T. Rowe Price Trust Company |
| |
| Patricia B. Lippert (1953) | Assistant Vice President, T. Rowe Price and |
| Secretary, Capital Opportunity Fund | T. Rowe Price Investment Services, Inc. |
| |
| Jennifer Martin (1972) | Vice President, T. Rowe Price and T. Rowe Price |
| Vice President, Capital Opportunity Fund | Group, Inc. |
| Philip A. Nestico (1976) | Vice President, T. Rowe Price and T. Rowe Price |
| Vice President, Capital Opportunity Fund | Group, Inc. |
| |
| Jason Nogueira, CFA (1974) | Vice President, T. Rowe Price and T. Rowe Price |
| Vice President, Capital Opportunity Fund | Group, Inc.; formerly Healthcare Equity Analyst, |
| | Putnam Investments (to 2004); student, Harvard |
| | Business School (to 2003) |
| |
| David Oestreicher (1967) | Director and Vice President, T. Rowe Price |
| Vice President, Capital Opportunity Fund | Investment Services, Inc., T. Rowe Price Trust |
| | Company, and T. Rowe Price Services, Inc.; Vice |
| | President, T. Rowe Price, T. Rowe Price Global |
| | Asset Management Limited, T. Rowe Price Global |
| | Investment Services Limited, T. Rowe Price |
| | Group, Inc., T. Rowe Price International, Inc., |
| | and T. Rowe Price Retirement Plan Services, Inc. |
| |
| Timothy E. Parker, CFA (1974) | Vice President, T. Rowe Price and T. Rowe Price |
| Vice President, Capital Opportunity Fund | Group, Inc. |
| |
| Charles G. Pepin (1966) | Director, T. Rowe Price Trust Company; Vice |
| Vice President, Capital Opportunity Fund | President, T. Rowe Price and T. Rowe Price |
| | Group, Inc. |
| |
| Robert T. Quinn, Jr. (1972) | Vice President, T. Rowe Price and T. Rowe Price |
| Vice President, Capital Opportunity Fund | Group, Inc.; formerly Director of Investment |
| | Banking, UBS Investment Bank (to 2004) |
| |
| Gabriel Solomon (1977) | Vice President, T. Rowe Price and T. Rowe Price |
| Vice President, Capital Opportunity Fund | Group, Inc.; formerly student, The Wharton |
| | Business School, University of Pennsylvania |
| | (to 2004); Equity Analyst Intern, Wellington |
| | Management Company, LLP (to 2003) |
| |
| Eric L. Veiel, CFA (1972) | Vice President, T. Rowe Price and T. Rowe Price |
| Vice President, Capital Opportunity Fund | Group, Inc.; formerly Senior Equity Analyst, |
| | Wachovia Securities (to 2005) |
| |
| Julie L. Waples (1970) | Vice President, T. Rowe Price |
| Vice President, Capital Opportunity Fund | |
| |
| Unless otherwise noted, officers have been employees of T. Rowe Price or T. Rowe Price International for at |
| least five years. | |
Item 2. Code of Ethics.
The registrant has adopted a code of ethics, as defined in Item 2 of Form N-CSR, applicable to its principal executive officer, principal financial officer, principal accounting officer or controller, or persons performing similar functions. A copy of this code of ethics is filed as an exhibit to this Form N-CSR. No substantive amendments were approved or waivers were granted to this code of ethics during the period covered by this report.
Item 3. Audit Committee Financial Expert.
The registrant’s Board of Directors/Trustees has determined that Ms. Karen N. Horn qualifies as an audit committee financial expert, as defined in Item 3 of Form N-CSR. Ms. Horn is considered independent for purposes of Item 3 of Form N-CSR.
Item 4. Principal Accountant Fees and Services.
(a) – (d) Aggregate fees billed to the registrant for the last two fiscal years for professional services rendered by the registrant’s principal accountant were as follows:

Audit fees include amounts related to the audit of the registrant’s annual financial statements and services normally provided by the accountant in connection with statutory and regulatory filings. Audit-related fees include amounts reasonably related to the performance of the audit of the registrant’s financial statements and specifically include the issuance of a report on internal controls and, if applicable, agreed-upon procedures related to fund acquisitions. Tax fees include amounts related to services for tax compliance, tax planning, and tax advice. The nature of these services specifically includes the review of distribution calculations and the preparation of Federal, state, and excise tax returns. All other fees include the registrant’s pro-rata share of amounts for agreed-upon procedures in conjunction with service contract approvals by the registrant’s Board of Directors/Trustees.
(e)(1) The registrant’s audit committee has adopted a policy whereby audit and non-audit services performed by the registrant’s principal accountant for the registrant, its investment adviser, and any entity controlling, controlled by, or under common control with the investment adviser that provides ongoing services to the registrant require pre-approval in advance at regularly scheduled audit committee meetings. If such a service is required between regularly scheduled audit committee meetings, pre-approval may be authorized by one audit committee member with ratification at the next scheduled audit committee meeting. Waiver of pre-approval for audit or non-audit services requiring fees of a de minimis amount is not permitted.
(2) No services included in (b) – (d) above were approved pursuant to paragraph (c)(7)(i)(C) of Rule 2-01 of Regulation S-X.
(f) Less than 50 percent of the hours expended on the principal accountant’s engagement to audit the registrant’s financial statements for the most recent fiscal year were attributed to work performed by persons other than the principal accountant’s full-time, permanent employees.
(g) The aggregate fees billed for the most recent fiscal year and the preceding fiscal year by the registrant’s principal accountant for non-audit services rendered to the registrant, its investment adviser, and any entity controlling, controlled by, or under common control with the investment adviser that provides ongoing services to the registrant were $1,922,000 and $1,486,000, respectively.
(h) All non-audit services rendered in (g) above were pre-approved by the registrant’s audit committee. Accordingly, these services were considered by the registrant’s audit committee in maintaining the principal accountant’s independence.
Item 5. Audit Committee of Listed Registrants.
Not applicable.
Item 6. Investments.
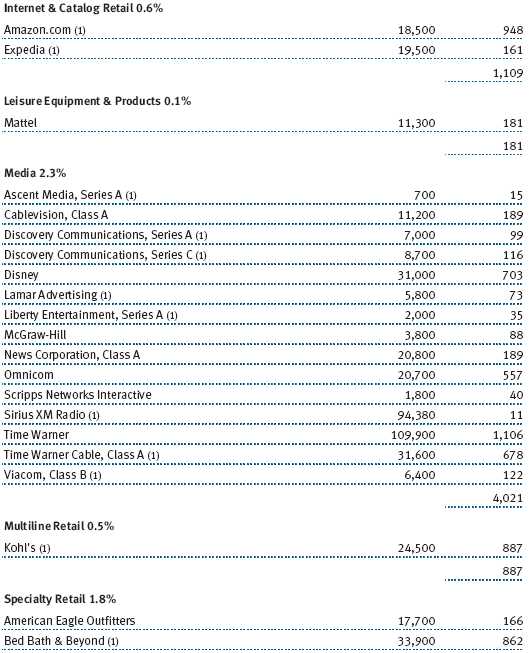
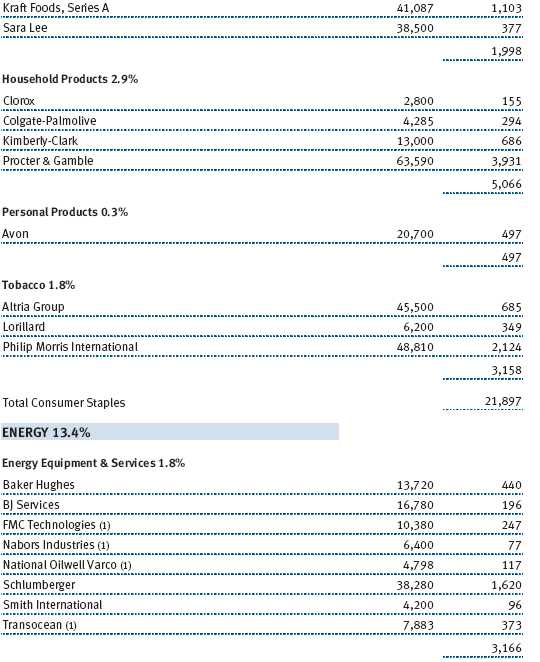
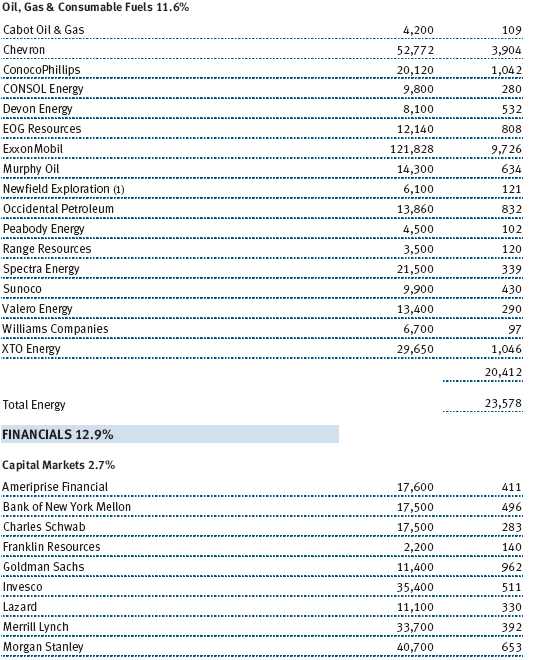
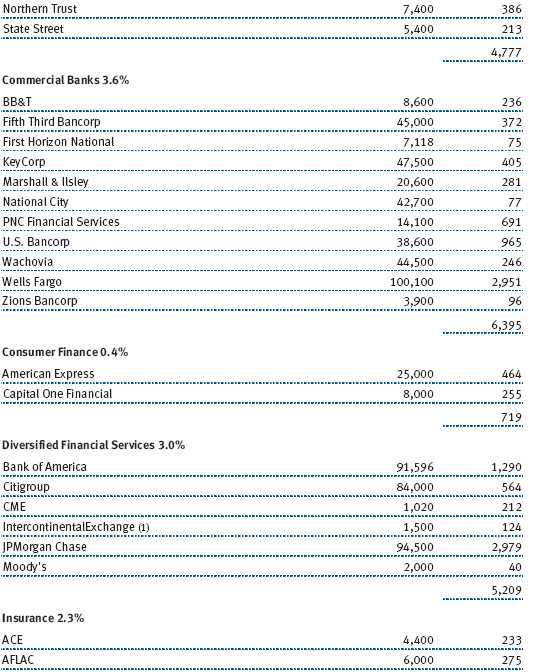
(a) Not applicable. The complete schedule of investments is included in Item 1 of this Form N-CSR.
(b) Not applicable.
Item 7. Disclosure of Proxy Voting Policies and Procedures for Closed-End Management Investment Companies.
Not applicable.
Item 8. Portfolio Managers of Closed-End Management Investment Companies.
Not applicable.
Item 9. Purchases of Equity Securities by Closed-End Management Investment Company and Affiliated Purchasers.
Not applicable.
Item 10. Submission of Matters to a Vote of Security Holders.
Not applicable.
Item 11. Controls and Procedures.
(a) The registrant’s principal executive officer and principal financial officer have evaluated the registrant’s disclosure controls and procedures within 90 days of this filing and have concluded that the registrant’s disclosure controls and procedures were effective, as of that date, in ensuring that information required to be disclosed by the registrant in this Form N-CSR was recorded, processed, summarized, and reported timely.
(b) The registrant’s principal executive officer and principal financial officer are aware of no change in the registrant’s internal control over financial reporting that occurred during the registrant’s second fiscal quarter covered by this report that has materially affected, or is reasonably likely to materially affect, the registrant’s internal control over financial reporting.
Item 12. Exhibits.
(a)(1) The registrant’s code of ethics pursuant to Item 2 of Form N-CSR is attached.
(2) Separate certifications by the registrant's principal executive officer and principal financial officer, pursuant to Section 302 of the Sarbanes-Oxley Act of 2002 and required by Rule 30a-2(a) under the Investment Company Act of 1940, are attached.
(3) Written solicitation to repurchase securities issued by closed-end companies: not applicable.
(b) A certification by the registrant's principal executive officer and principal financial officer, pursuant to Section 906 of the Sarbanes-Oxley Act of 2002 and required by Rule 30a-2(b) under the Investment Company Act of 1940, is attached.
| | |
SIGNATURES |
| |
| | Pursuant to the requirements of the Securities Exchange Act of 1934 and the Investment |
| Company Act of 1940, the registrant has duly caused this report to be signed on its behalf by the |
| undersigned, thereunto duly authorized. |
| |
| T. Rowe Price Capital Opportunity Fund, Inc. |
| |
| |
| |
| By | /s/ Edward C. Bernard |
| | Edward C. Bernard |
| | Principal Executive Officer |
| |
| Date | February 19, 2009 |
| |
| |
| |
| | Pursuant to the requirements of the Securities Exchange Act of 1934 and the Investment |
| Company Act of 1940, this report has been signed below by the following persons on behalf of |
| the registrant and in the capacities and on the dates indicated. |
| |
| |
| By | /s/ Edward C. Bernard |
| | Edward C. Bernard |
| | Principal Executive Officer |
| |
| Date | February 19, 2009 |
| |
| |
| |
| By | /s/ Gregory K. Hinkle |
| | Gregory K. Hinkle |
| | Principal Financial Officer |
| |
| Date | February 19, 2009 |