UNITED STATES
SECURITIES AND EXCHANGE COMMISSION
Washington, D.C. 20549
FORM 10-Q
ý Quarterly Report Pursuant to Section 13 or 15(d) of the Securities Exchange Act of 1934
For the quarterly period ended June 30, 2012.
OR
o Transition Report Pursuant to Section 13 or 15(d) of the Securities Exchange Act of 1934
For the transition period from to
Commission file number 1-13053
STILLWATER MINING COMPANY
(Exact name of registrant as specified in its charter)
|
| | |
| Delaware | | 81-0480654 |
(State or other jurisdiction of incorporation or organization) | | (I.R.S. Employer Identification No.) |
1321 DISCOVERY DRIVE, BILLINGS, MONTANA 59102
(Address of principal executive offices and zip code)
(406) 373-8700
(Registrant’s telephone number, including area code)
Indicate by check mark whether the registrant: (1) has filed all reports required to be filed by Section 13 or 15(d) of the Securities Exchange Act of 1934 during the preceding 12 months (or for such shorter period that the registrant was required to file such reports), and (2) has been subject to such filing requirements for the past 90 days: YES ý NO o
Indicate by check mark whether the registrant has submitted electronically and posted on its corporate Web site, if any, every Interactive Data File required to be submitted and posted pursuant to Rule 405 of Regulation S-T (§232.405 of this chapter) during the preceding 12 months (or for such shorter period that the registrant was required to submit and post such files). YES ý NO o
Indicate by check mark whether the registrant is a large accelerated filer, an accelerated filer, a non-accelerated filer, or a smaller reporting company. See definitions of “large accelerated filer,” “accelerated filer” and “smaller reporting company” in Rule 12b-2 of the Exchange Act. (Check one).
|
| | | | | | |
| Large Accelerated Filer | | ý | | Accelerated Filer | | ¨ |
| | | | |
| Non-Accelerated Filer | | ¨ | | Smaller reporting company | | ¨ |
Indicate by check mark whether the registrant is a shell company (as defined in Rule 12b-2 of the Exchange Act)
YES o NO ý
At August 6, 2012 the Company had outstanding 115,986,494 shares of common stock, par value $0.01 per share.
STILLWATER MINING COMPANY
FORM 10-Q
QUARTER ENDED JUNE 30, 2012
INDEX
|
| | |
| |
| | | |
| Item 1. | | |
| | | |
| Item 2. | | |
| | | |
| Item 3. | | |
| | | |
| Item 4. | | |
| | |
| |
| | | |
| Item 1. | | |
| | | |
| Item 1A. | | |
| | | |
| Item 4. | | |
| | | |
| Item 6. | | |
| | |
| |
| | |
| CERTIFICATIONS | |
PART I – FINANCIAL INFORMATION
ITEM 1
CONSOLIDATED FINANCIAL STATEMENTS
Stillwater Mining Company
Consolidated Statements of Operations and Comprehensive Income
(Unaudited)
(in thousands, except per share data)
|
| | | | | | | | | | | | | | | |
| | Three Months Ended
June 30, | | Six Months Ended
June 30, |
| | 2012 | | 2011 | | 2012 | | 2011 |
| Revenues | | | | | | | |
| Mine production | $ | 116,190 |
| | $ | 139,733 |
| | $ | 232,894 |
| | $ | 261,713 |
|
| PGM recycling | 96,585 |
| | 82,872 |
| | 182,932 |
| | 130,953 |
|
| Total revenues | 212,775 |
| | 222,605 |
| | 415,826 |
| | 392,666 |
|
| Costs and expenses | | | | | | | |
| Costs of metals sold | | | | | | | |
| Mine production | 74,996 |
| | 65,094 |
| | 149,025 |
| | 125,344 |
|
| PGM recycling | 93,149 |
| | 79,552 |
| | 177,264 |
| | 124,706 |
|
| Total costs of metals sold | 168,145 |
| | 144,646 |
| | 326,289 |
| | 250,050 |
|
| Depletion, depreciation and amortization | | | | | | | |
| Mine production | 14,601 |
| | 15,395 |
| | 29,005 |
| | 31,196 |
|
| PGM recycling | 261 |
| | 265 |
| | 529 |
| | 527 |
|
| Total depletion, depreciation and amortization | 14,862 |
| | 15,660 |
| | 29,534 |
| | 31,723 |
|
| Total costs of revenues | 183,007 |
| | 160,306 |
| | 355,823 |
| | 281,773 |
|
| Exploration | 2,000 |
| | 75 |
| | 12,117 |
| | 75 |
|
| Marketing | 3,650 |
| | 2,800 |
| | 5,988 |
| | 3,653 |
|
| Research and development | 77 |
| | 621 |
| | 782 |
| | 1,080 |
|
| General and administrative | 10,117 |
| | 9,893 |
| | 22,595 |
| | 16,255 |
|
| Abandonment of non-producing property | — |
| | — |
| | 2,835 |
| | — |
|
| Loss/(Gain) on disposal of property, plant and equipment | 297 |
| | (207 | ) | | 292 |
| | (226 | ) |
| Total costs and expenses | 199,148 |
| | 173,488 |
| | 400,432 |
| | 302,610 |
|
| Operating income | 13,627 |
| | 49,117 |
| | 15,394 |
| | 90,056 |
|
| Other income/(expense) | | | | | | | |
| Other | 577 |
| | 4 |
| | 585 |
| | 12 |
|
| Interest income | 790 |
| | 951 |
| | 1,435 |
| | 1,733 |
|
| Interest expense | (1,153 | ) | | (1,637 | ) | | (2,868 | ) | | (3,272 | ) |
| Foreign currency transaction gain | 3,778 |
| | — |
| | 6,709 |
| | 182 |
|
| Income before income tax provision | 17,619 |
| | 48,435 |
| | 21,255 |
| | 88,711 |
|
| Income tax benefit/(provision) | 210 |
| | (5,737 | ) | | (987 | ) | | (9,821 | ) |
| Net income | $ | 17,829 |
| | $ | 42,698 |
| | $ | 20,268 |
| | $ | 78,890 |
|
| Net loss attributable to noncontrolling interest | (371 | ) | | — |
| | (371 | ) | | — |
|
| Net income attributable to common stockholders | $ | 18,200 |
| | $ | 42,698 |
| | $ | 20,639 |
| | $ | 78,890 |
|
| Other comprehensive income/(loss), net of tax | | | | | | | |
| Net unrealized (losses)/gains on securities available for sale | (109 | ) | | 86 |
| | 199 |
| | (104 | ) |
| Comprehensive income attributable to common stockholders | $ | 18,091 |
| | $ | 42,784 |
| | $ | 20,838 |
| | $ | 78,786 |
|
| Weighted average common shares outstanding | | | | | | | |
| Basic | 115,819 |
| | 103,037 |
| | 115,686 |
| | 102,688 |
|
| Diluted | 123,855 |
| | 111,123 |
| | 116,671 |
| | 110,924 |
|
| Basic earnings per share attributable to common stockholders | $ | 0.16 |
| | $ | 0.41 |
| | $ | 0.18 |
| | $ | 0.77 |
|
| Diluted earnings per share attributable to common stockholders | $ | 0.15 |
| | $ | 0.39 |
| | $ | 0.18 |
| | $ | 0.73 |
|
Stillwater Mining Company
Consolidated Balance Sheets
(Unaudited)
(in thousands, except share and per share data)
|
| | | | | | | |
| | June 30,
2012 | | December 31,
2011 |
| ASSETS | | | |
| Cash and cash equivalents | $ | 197,157 |
| | $ | 109,097 |
|
| Investments, at fair market value | 57,953 |
| | 49,533 |
|
| Inventories | 121,578 |
| | 131,856 |
|
| Trade receivables | 8,568 |
| | 6,188 |
|
| Deferred income taxes | 109,629 |
| | 96,036 |
|
| Other current assets | 12,473 |
| | 9,433 |
|
| Total current assets | 507,358 |
| | 402,143 |
|
| Mineral properties | 597,187 |
| | 596,686 |
|
| Property, plant and equipment, net of $465,847 and $436,612 of accumulated depletion, depreciation and amortization | 394,923 |
| | 367,727 |
|
| Restricted cash | 24,995 |
| | 25,070 |
|
| Other noncurrent assets | 11,444 |
| | 11,915 |
|
| Total assets | $ | 1,535,907 |
| | $ | 1,403,541 |
|
| LIABILITIES AND STOCKHOLDERS’ EQUITY | | | |
| Accounts payable | $ | 24,582 |
| | $ | 26,880 |
|
| Accrued compensation and benefits | 28,846 |
| | 27,573 |
|
| Property, production and franchise taxes payable | 14,853 |
| | 14,071 |
|
| Current portion of long-term debt and capital lease obligations | 168,228 |
| | — |
|
| Income taxes payable | — |
| | 1,235 |
|
| Other current liabilities | 1,811 |
| | 4,576 |
|
| Total current liabilities | 238,320 |
| | 74,335 |
|
| Long-term debt | 34,849 |
| | 196,046 |
|
| Deferred income taxes | 277,085 |
| | 270,101 |
|
| Accrued workers compensation | 6,558 |
| | 6,056 |
|
| Asset retirement obligation | 7,641 |
| | 7,331 |
|
| Other noncurrent liabilities | 5,318 |
| | 5,704 |
|
| Total liabilities | 569,771 |
| | 559,573 |
|
| Equity | | | |
| Stockholders’ equity | | | |
| Preferred stock, $0.01 par value, 1,000,000 shares authorized; none issued | — |
| | — |
|
| Common stock, $0.01 par value, 200,000,000 shares authorized; 115,907,989 and 115,375,604 shares issued and outstanding | 1,159 |
| | 1,154 |
|
| Paid-in capital | 927,356 |
| | 878,050 |
|
| Accumulated deficit | (13,636 | ) | | (34,275 | ) |
| Accumulated other comprehensive loss | (762 | ) | | (961 | ) |
| Total stockholders’ equity | 914,117 |
| | 843,968 |
|
| Noncontrolling interest | 52,019 |
| | — |
|
| Total equity | 966,136 |
| | 843,968 |
|
| Total liabilities and stockholders’ equity | $ | 1,535,907 |
| | $ | 1,403,541 |
|
See accompanying notes to consolidated financial statements
Stillwater Mining Company
Consolidated Statements of Cash Flows
(Unaudited)
(in thousands)
|
| | | | | | | | | | | | | | | |
| | Three Months Ended
June 30, | | Six Months Ended
June 30, |
| | 2012 | | 2011 | | 2012 | | 2011 |
| Cash flows from operating activities | | | | | | | |
| Net income | $ | 17,829 |
| | $ | 42,698 |
| | $ | 20,268 |
| | $ | 78,890 |
|
| Adjustments to reconcile net income to net cash provided by operating activities: | | | | | | | |
| Depletion, depreciation and amortization | 14,862 |
| | 15,660 |
| | 29,534 |
| | 31,723 |
|
| Loss/(Gain) on disposal of property, plant and equipment | 297 |
| | (207 | ) | | 292 |
| | (226 | ) |
| Abandonment of non-producing property | — |
| | — |
| | 2,835 |
| | — |
|
| Accretion of asset retirement obligation | 157 |
| | 145 |
| | 310 |
| | 286 |
|
| Amortization of debt issuance costs | 315 |
| | 246 |
| | 629 |
| | 491 |
|
| Share based compensation and other benefits | 4,115 |
| | 2,689 |
| | 7,887 |
| | 5,789 |
|
| Changes in operating assets and liabilities: | | | | | | | |
| Inventories | 11,486 |
| | (15,505 | ) | | 9,920 |
| | (55,569 | ) |
| Trade receivables | 802 |
| | 81 |
| | (2,380 | ) | | (393 | ) |
| Accrued compensation and benefits | 377 |
| | 3,051 |
| | 1,234 |
| | 4,341 |
|
| Accounts payable | (7,029 | ) | | 1,450 |
| | (2,336 | ) | | 4,644 |
|
| Property, production and franchise taxes payable | (22 | ) | | 1,273 |
| | 396 |
| | 2,944 |
|
| Income taxes payable | (268 | ) | | 5,737 |
| | (3,115 | ) | | 9,821 |
|
| Workers compensation | 502 |
| | (78 | ) | | 502 |
| | (554 | ) |
| Restricted cash | — |
| | — |
| | 75 |
| | 3,000 |
|
| Other | (4,051 | ) | | 1,571 |
| | (10,683 | ) | | 7,496 |
|
| Net cash provided by operating activities | 39,372 |
| | 58,811 |
| | 55,368 |
| | 92,683 |
|
| Cash flows from investing activities | | | | | | | |
| Capital expenditures | (36,593 | ) | | (23,110 | ) | | (59,313 | ) | | (46,295 | ) |
| Purchase of long-term investment | — |
| | — |
| | — |
| | (616 | ) |
| Proceeds from disposal of property, plant and equipment | 20 |
| | 207 |
| | 28 |
| | 228 |
|
| Purchases of investments | (26,637 | ) | | (32,801 | ) | | (31,887 | ) | | (98,096 | ) |
| Proceeds from maturities of investments | 19,088 |
| | 58,575 |
| | 23,549 |
| | 137,017 |
|
| Net cash (used in) provided by investing activities | (44,122 | ) | | 2,871 |
| | (67,623 | ) | | (7,762 | ) |
| Cash flows from financing activities | | | | | | | |
| Proceeds from sale of noncontrolling interest, net of transaction costs | 94,669 |
| | — |
| | 93,821 |
| | — |
|
| Issuance of long-term debt | 7,176 |
| | — |
| | 7,176 |
| | — |
|
| Payments on long term debt and capital lease obligations | (495 | ) | | — |
| | (495 | ) | | — |
|
| Payments for debt issuance costs | — |
| | — |
| | (219 | ) | | — |
|
| Issuance of common stock | 3 |
| | 7 |
| | 32 |
| | 725 |
|
| Net cash provided by financing activities | 101,353 |
| | 7 |
| | 100,315 |
| | 725 |
|
| Cash and cash equivalents | | | | | | | |
| Net increase | 96,603 |
| | 61,689 |
| | 88,060 |
| | 85,646 |
|
| Balance at beginning of period | 100,554 |
| | 43,320 |
| | 109,097 |
| | 19,363 |
|
| Balance at end of period | $ | 197,157 |
| | $ | 105,009 |
| | $ | 197,157 |
| | $ | 105,009 |
|
See accompanying notes to consolidated financial statements
Stillwater Mining Company
Notes to Consolidated Financial Statements
(Unaudited)
NOTE 1
GENERAL
In the opinion of management, the accompanying unaudited consolidated financial statements contain all adjustments (consisting only of normal recurring adjustments) necessary to present fairly the financial position of Stillwater Mining Company (the “Company”) as of June 30, 2012, and the results of its operations and its cash flows for the three- and six- month periods ended June 30, 2012 and 2011. The results of operations for the first six months of 2012 are not necessarily indicative of the results to be expected for the full year. The accompanying consolidated financial statements in this quarterly report should be read in conjunction with the consolidated financial statements and notes thereto included in the Company's March 31, 2012 Quarterly Report on Form 10-Q and in the Company’s 2011 Annual Report on Form 10-K. All intercompany transactions and balances have been eliminated in consolidation.
The preparation of the Company’s consolidated financial statements in conformity with United States generally accepted accounting principles requires management to make estimates and assumptions that affect the amounts reported in these consolidated financial statements and accompanying notes. The more significant areas requiring the use of management’s estimates relate to mineral reserves, reclamation and environmental obligations, valuation allowance for deferred tax assets, useful lives utilized for depreciation, amortization and accretion calculations, future cash flows from long-lived assets, and fair value of derivatives and other financial instruments. Actual results could differ from these estimates.
No subsequent events were identified that required additional disclosure in the consolidated financial statements through the date of this filing.
NOTE 2
SALES
Mine Production
The Company mines and processes ores containing palladium, platinum, rhodium, gold, silver, copper and nickel into intermediate and final products for sale to customers. Palladium, platinum, rhodium, gold and silver are sent to third party refineries for final processing from where they are sold to a number of consumers and dealers with whom the Company has established trading relationships. Refined platinum group metals (PGMs) of 99.95% purity (rhodium of 99.9%) in sponge form are transferred upon sale from the Company’s account at third party refineries to the account of the purchaser. By-product precious metals are normally sold at market prices to customers, brokers or outside refiners. By-products of copper and nickel are produced by the Company at less than commercial grade, so prices for these metals typically reflect a quality discount. By-product sales are included in revenues from mine production. During the second quarter of 2012 and 2011, total by-product (copper, nickel, gold, silver and mined rhodium) sales were $7.2 million and $8.0 million, respectively. During the first six months of 2012 and 2011, total by-product (copper, nickel, gold, silver and mined rhodium) sales were $16.4 million and $15.5 million, respectively.
The Company has a three year supply agreement with General Motors Corporation (GM) that provides for fixed quantities of palladium to be delivered each month. The supply agreement with GM expires on December 31, 2013. The Company has a one year platinum supply agreement with Tiffany & Co set to expire at the end of 2012. The Company also has a new supply agreement with Johnson Matthey and recently renewed its year-to-year supply agreement with Ford Motor Company. Some of these agreements provide for pricing at a small discount to a trailing market price. The Company currently sells its remaining mine production under spot sales agreements.
Revenue is recognized when persuasive evidence of an arrangement exists, delivery has occurred either physically or through an irrevocable transfer of metals to customers’ accounts, the price is fixed or determinable, no related obligations remain and collectability is probable.
PGM Recycling
The Company purchases spent catalyst materials from third parties and processes these materials in its facilities in Columbus, Montana to recover palladium, platinum and rhodium for sale. It also accepts material supplied from third parties on a tolling basis, processing it for a fee and returning the recovered metals to the supplier. The Company has entered into sourcing arrangements for catalyst material with several suppliers. Under these sourcing arrangements as currently structured, the Company advances cash against a shipment of material shortly before actually receiving the physical shipment. These advances are included in Other current assets on the Company’s Consolidated Balance Sheet until such time as the material has been physically received and title has transferred to the Company. The Company holds a security interest in materials procured by its largest recycling supplier that have not been received by the Company. Once the material is physically received and title has transferred, the associated advance is reclassified from Other current assets into Inventories. Finance charges collected on advances and inventories prior to being earned are included in Other current liabilities on the Company’s Consolidated Balance Sheet. Finance charges are reclassified from Other current liabilities to Interest income ratably from the time the advance was made until the out-turn date of the inventory.
At the same time the Company purchases recycling material, it typically enters into a fixed forward contract for future delivery of the PGMs contained in the recycled material at a price consistent with the purchase cost of the recycled material. The contract commits the Company to deliver finished metal on a specified date that normally corresponds to the expected out-turn date for the metal from the final refiner. The purpose of this arrangement is to eliminate the Company’s exposure to fluctuations in market prices during processing, while at the same time creating an obligation for the Company to deliver metal at a future point in time that could be subject to operational risks. If the Company were unable to complete the processing of the recycled material by the contractual delivery date, it could either cover its delivery commitments with mine production or purchase finished metal in the open market. If open market purchases are used, the Company would bear the cost (or benefit) of any change in the market price relative to the price stipulated in the delivery contract.
Total Sales
Total sales to significant customers as a percentage of total revenues for the three- and six- month periods ended June 30, 2012 and 2011 were as follows:
|
| | | | | | | | | | | |
| | Three Months Ended
June 30, | | Six Months Ended
June 30, |
| | 2012 | | 2011 | | 2012 | | 2011 |
| Customer A | 25 | % | | 24 | % | | 25 | % | | 24 | % |
| Customer B | 17 | % | | 19 | % | | 17 | % | | 21 | % |
| Customer C | 16 | % | | — | % | | 17 | % | | — | % |
| Customer D | 13 | % | | — | % | | 12 | % | | — | % |
| Customer E | — | % | | 24 | % | | — | % | | 21 | % |
| Customer F | — | % | | — | % | | — | % | | 10 | % |
| | 71 | % | | 67 | % | | 71 | % | | 76 | % |
-% represents less than 10% of total revenues
NOTE 3
NONCONTROLLING INTEREST
On March 28, 2012, the Company entered into an agreement with Mitsubishi Corporation (Mitsubishi) in which a Mitsubishi subsidiary acquired a 25% interest in the Company's wholly owned subsidiary, Stillwater Canada Inc. (SCI), which owns the Marathon PGM-copper project and related properties for approximately $81.25 million and an additional $13.6 million to satisfy Mitsubishi's portion of the venture's initial cash call. Mitsubishi will be responsible for funding its 25% share of operating, capital and exploration expenditures on the Marathon properties and has agreed to cooperate and support efforts to secure project financing for Marathon. Mitsubishi will have an option to purchase up to 100% of Marathon's future PGM production under a related supply agreement at a relatively small discount to market. The transaction closed on April 10, 2012. The Company incurred transaction costs of approximately $1.1 million related to the agreement with Mitsubishi in the first six months of 2012 which was recorded within Stockholders' Equity upon closing of the transaction.
The noncontrolling interests' share of equity is reflected as Noncontrolling interest in the accompanying Consolidated Balance Sheet and was $52.0 million as of June 30, 2012.
The change in the parent company's equity as a result of the sale of the noncontrolling interest was to increase additional paid in capital by $42.5 million, offset by expenses incurred of $0.3 million in the three months ended June 30, 2012 and $1.1 million for the six months ended June 30, 2012.
NOTE 4
DERIVATIVE INSTRUMENTS
The Company uses various derivative instruments to manage its exposure to changes in PGM market commodity prices. Some of these derivatives are designated as hedges. Because the Company hedges only with instruments that have a high correlation with the value of the underlying exposures, changes in the derivatives’ fair value are expected to be offset by changes in the value of the hedged transaction.
Commodity Derivatives
The Company customarily enters into fixed forward contracts and on occasion it also enters into financially settled forward contracts to offset the price risk in its PGM recycling activity. From time to time, it also has entered into these types of contracts on portions of its mine production. Under these customary fixed forward transactions, the Company agrees to deliver a stated quantity of metal on a specific future date at a price stipulated in advance. The Company uses fixed forward transactions primarily to price in advance the metals acquired for processing in its recycling segment. Under the occasional financially settled forward transactions, at each settlement date the Company receives the net difference between the forward price and the market price if the market price is below the forward price and the Company pays the net difference between the forward price and the market price if the market price is above the forward price. These financially settled forward contracts are settled in cash at maturity and do not require physical delivery of metal at settlement. The Company typically has used financially settled forward contracts with third parties to reduce its exposure to price risk on metal it is obligated to deliver under long-term sales agreements.
Mine Production
At present the Company has no outstanding derivative contracts pertaining to its mined production.
PGM Recycling
The Company regularly enters into fixed forward sales relating to its recycling of PGM catalyst materials. The metals from PGM recycled materials are typically sold forward at the time of purchase and delivered against the fixed forward contracts when the ounces are recovered. All of these fixed forward sales contracts open at June 30, 2012, will settle at various periods through December 2012. The Company has credit agreements with its major trading partners that provide for margin deposits in the event that forward prices for metals exceed the Company’s hedged prices by a predetermined margin limit. As of June 30, 2012, no such margin deposits were outstanding or due.
Occasionally, the Company also has entered into financially settled forward contracts on its recycled materials. Such contracts are utilized when the Company wishes to establish a firm forward price for recycled metal on a specific future date. No financially settled forward contracts were entered into during the second quarter of 2012. The Company generally has not designated these contracts as cash flow hedges, so they are marked to market at the end of each accounting period. The change in the fair value of the derivatives is reflected in the consolidated statement of operations and comprehensive income.
The following is a summary of the Company’s commodity derivatives as of June 30, 2012:
|
| | | | | | | | | | | | | | | | | | | | | |
| PGM Recycling: | | | | | | | | | | | | |
| Fixed Forwards | | | | | | | | | | | | |
| | | Platinum | | Palladium | | Rhodium |
| Settlement Period | | Ounces | | Avg. Price | | Ounces | | Avg. Price | | Ounces | | Avg. Price |
| Third Quarter 2012 | | 20,981 |
| | $ | 1,498 |
| | 30,681 |
| | $ | 631 |
| | 4,803 |
| | $ | 1,359 |
|
| Fourth Quarter 2012 | | 2,051 |
| | $ | 1,447 |
| | 1,800 |
| | $ | 614 |
| | 1,905 |
| | $ | 1,232 |
|
NOTE 5
SHARE-BASED COMPENSATION
Stock Plans
The Company sponsors stock plans (the “Plans”) that enable the Company to grant stock options or other equity based compensation to employees and non-employee directors. Effective March 1, 2011, the Company ceased offering stock options as incentive compensation to employees and non-employee directors, and began to and expects to continue to issue only cash awards or restricted stock units in lieu of stock options. The Company continues to have previously issued stock options that remain outstanding under three separate plans: the 1994 Incentive Plan, the General Employee Plan and the 2004 Equity Incentive Plan. At inception of the plans, approximately 16.4 million shares of common stock were authorized for issuance under the Plans, including approximately 5.0 million, 5.2 million, 1.4 million and 4.8 million authorized shares for the 2012 Equity Incentive Plan, 2004 Equity Incentive Plan, the General Employee Plan and the 1994 Incentive Plan (as amended by the 1998 Incentive Plan), respectively. The 1998 Incentive Plan and the General Employee Plan have been terminated and no additional options, shares or units may be issued under these two terminated plans. Approximately 5.4 million shares were available and reserved for grant under the 2004 Equity Incentive Plan and the 2012 Equity Incentive Plan combined, as of June 30, 2012.
In April 2012, stockholders approved the 2012 Equity Incentive Plan. The number of shares of common stock authorized for issuance under the 2012 Equity Compensation Plan is 5.0 million.
The Compensation Committee of the Company’s Board of Directors administers the Plans and determines the type of equity awards to be issued, the exercise period, vesting period and all other terms of instruments issued under the Plans. Employees’ options and the majority of restricted stock units vest in equal annual installments over a three years period after date of grant. Some restricted stock units vest 100% one year after the date of grant. Officers’ and directors’ options expire ten years after the date of grant. All other employee options expire five to ten years years after the date of grant, depending upon the original grant date. The Company received a minimal amount of cash from the exercise of stock options in the three- and six- month periods ended June 30, 2012. The Company received $0.7 million in cash from the exercise of stock options in the six- month period ended June 30, 2011.
The Company recognizes compensation expense associated with its stock option grants based on their fair market value on the date of grant using a Black-Scholes option pricing model. The Company recognizes stock option expense ratably over the vesting period of the options. If options are canceled or forfeited prior to vesting, the Company stops recognizing the related expense effective with the date of forfeiture. The compensation expense, recorded in General and administrative in the Consolidated Statements of Operations and Comprehensive Income, related to the fair value of stock options during the three- month periods ended June 30, 2012 and 2011, was $25,900 and $61,500, respectively, and $55,300 and $131,100 during the six- month periods ended June 30, 2012 and 2011, respectively. Total compensation expense not yet recognized related to nonvested stock options is $41,500, $32,700 and $500 for the remaining six months of 2012 and for years 2013 and 2014, respectively.
Nonvested Shares
The following table summarizes the status of and changes in the Company’s nonvested shares during the first six months of 2012:
|
| | | | | | |
| | Nonvested Shares | | Weighted-Average Grant-Date Fair Value |
| Nonvested shares at January 1, 2012 | 1,502,611 |
| | $ | 10.95 |
|
| Granted | 557,910 |
| | 13.37 |
|
| Vested | (751,686 | ) | | 6.65 |
|
| Forfeited | (1,267 | ) | | 17.77 |
|
| Nonvested shares at March 31, 2012 | 1,307,568 |
| | $ | 14.45 |
|
| | | | |
| Granted | 47,834 |
| | 10.51 |
|
| Vested | (3,658 | ) | | 20.04 |
|
| Forfeited | (4,860 | ) | | 14.65 |
|
| Nonvested shares at June 30, 2012 | 1,346,884 |
| | $ | 14.29 |
|
Compensation expense related to grants of nonvested shares was $2.0 million and $1.6 million in the three- month periods ended June 30, 2012 and 2011, respectively, and is included within General and administrative in the Consolidated Statements of Operations and Comprehensive Income. Compensation expense related to grants of nonvested shares was $3.7 million and $3.1 million in the six- month periods ended June 30, 2012 and 2011, respectively.
The following table presents the compensation expense of the nonvested shares outstanding at June 30, 2012, to be recognized over the remaining vesting periods:
|
| | | |
| (In millions) | |
| Third quarter 2012 | $ | 2.0 |
|
| Fourth quarter 2012 | 1.9 |
|
| 2013 | 5.4 |
|
| 2014 | 2.8 |
|
| 2015 | 0.4 |
|
| Total | $ | 12.5 |
|
NOTE 6
INCOME TAXES
The Company determines income taxes using the asset and liability approach which results in the recognition of deferred tax assets and liabilities for the expected future tax consequences of temporary differences between the carrying amount and the tax basis of those assets and liabilities, as well as operating loss and tax credit carryforwards, using enacted tax rates in effect in the years in which the differences are expected to reverse. The effect on deferred tax assets and liabilities of a change in tax rates is recognized in income in the period that includes the enactment date. Deferred tax assets and liabilities are recorded on a jurisdictional basis.
At June 30, 2012, the Company has net operating loss carryforwards (NOLs), which expire at various times in years 2012 through 2030. The Company has reviewed its net deferred tax assets and has provided a valuation allowance to reflect the estimated amount of net deferred tax assets which management considers, more likely than not, will not be realized. Included in the provision for income taxes at June 30, 2012 is a $0.9 million adjustment for AMT. This adjustment is a result of a decrease in depreciation recorded for tax purposes in 2011. The Company recognized an income tax provision of $5.7 million in the second quarter of 2011. The Company has AMT net operating loss carry-forwards, and anticipates that all of its 2012 AMT income estimated at $48.7 million will be subject to offset by available AMT NOLs. Changes in the Company’s net deferred tax assets and liabilities have been offset by a corresponding change in the valuation allowance.
The Company’s policy is to recognize interest and penalties on unrecognized tax benefits in Income tax provision in the Consolidated Statements of Operations and Comprehensive Income. There were no interest or penalties for the three- and six- month periods ended June 30, 2012 and 2011. Tax years still open for examination by the taxing authorities are the years ending December 31, 2011, 2010, and 2009.
NOTE 7
DEBT AND CAPITAL LEASE OBLIGATION
Convertible Debentures
On March 12, 2008, the Company issued and sold $181.5 million aggregate principal amount of senior convertible debentures due March 15, 2028 (“debentures”). The debentures pay interest at 1.875% per annum, payable semi-annually on March 15 and September 15 of each year, and commenced on September 15, 2008. The debentures will mature on March 15, 2028, subject to earlier repurchase or conversion. Each $1,000 principal amount of debentures is initially convertible, at the option of the holders, into approximately 42.5351 shares of the Company’s common stock, at any time prior to the maturity date. The conversion rate is subject to certain adjustments, but will not be adjusted for accrued interest or any unpaid interest. The conversion rate initially represents a conversion price of $23.51 per share. Holders of the debentures may require the Company to repurchase all or a portion of their debentures on March 15, 2013, March 15, 2018 and March 15, 2023, or at any time before March 15, 2028 upon the occurrence of certain events including a change in control. The Company may redeem the debentures for cash beginning on or after March 22, 2013. In October 2009, the Company undertook the exchange of $15.0 million face amount of the convertible debentures for 1.84 million shares of the Company's common stock. The debentures so acquired were retired. The outstanding balance of $166.5 million is reported as short-term debt obligation as of June 30, 2012.
Amortization expense related to the issuance costs of the debentures was approximately $0.2 million in each of the three- month periods ended June 30, 2012 and 2011, respectively, and $0.5 million for each of the six- month periods ended June 30, 2012 and 2011, respectively. The interest expense on the debentures was approximately $0.8 million, respectively, for each of the three- month periods ended June 30, 2012 and 2011, and $1.6 million, respectively, for each of the six- month periods ended June 30, 2012 and 2011. The Company made cash payments of $1.6 million for interest on the debentures during each of the six- month periods ended June 30, 2012 and 2011.
Exempt Facility Revenue Bonds
The Company also has outstanding a $30.0 million offering of 8.0% Exempt Facility Revenue Bonds, Series 2000, issued through the State of Montana Board of Investments and due July 1, 2020. The balance outstanding at June 30, 2012, was $29.5 million, which is net of unamortized discount of $0.5 million. The Company made cash payments of $1.2 million for interest on the revenue bonds during the second quarter of 2012.
Asset-Backed Revolving Line of Credit
Effective December 23, 2011, the Company signed a $100.0 million asset-backed revolving credit agreement with Wells Fargo Capital Finance, incurring debt issuance costs of $1.1 million. Borrowings under this working capital facility are limited to a borrowing base comprised of 85% of eligible accounts receivable and 70% of eligible inventories. Borrowings will be secured by the Company’s accounts receivable, metals inventories and other accounts. The asset-backed revolving credit facility includes a single fixed-charge coverage covenant that only takes effect when less than 30% of the total borrowing capacity under the line remains available. The facility includes a $50.0 million letter of credit sub-facility. Outstanding borrowings under the facility accrue interest at a spread over the London Interbank Offer Rate that varies from 2.25% to 2.75%, decreasing progressively as the percentage drawn against the facility increases. The Company also pays an unused line fee on committed but unutilized commitments under the facility at a rate per annum of 0.375% or 0.5%, depending on utilization of the facility. On January 13, 2012, the Company completed the syndication of this facility to a group of four banks and simultaneously expanded the maximum line of credit to $125.0 million. The Company recognized $0.2 million in fees associated with the asset-backed revolving credit agreement in the three- and six- month periods ended June 30, 2012. Amortization expense related to the issuance costs of the credit agreement was approximately $0.1 million for the three- and six- month periods ended June 30, 2012. As of June 30, 2012, there was no drawn balance under this revolving credit facility, although approximately $5.3 million in undrawn letters of credit had been issued under this facility as collateral for sureties.
Capital Lease Obligation
On June 1, 2012, the Company entered into a lease agreement with General Electric Capital Corporation covering the acquisition of a tunnel-boring machine for use on the Blitz Project adjacent to the Stillwater Mine. The transaction is structured as a capital lease with a four-year term; lease payments are due quarterly in advance. As of June 30, 2012, the outstanding balance under the capital lease was $6.7 million.
The following is a schedule by year of the future minimum lease payments for the capital lease together with the present value of the net minimum lease payments:
|
| | | | |
| Quarter ended June 30, 2012 (in thousands) | | |
| Remaining 2012 | | $ | 991 |
|
| 2013 | | 1,982 |
|
| 2014 | | 1,982 |
|
| 2015 | | 1,982 |
|
| 2016 | | 496 |
|
| Total minimum lease payments | | 7,433 |
|
| Less amount representing interest | | 752 |
|
| Present value of net minimum lease payments | | 6,681 |
|
| Less current portion | | 1,651 |
|
| Total long-term capital lease obligation | | $ | 5,030 |
|
Capitalized Interest
The Company capitalizes interest incurred on its various debt instruments as a cost of properties under development.
For the six- month period ended June 30, 2012, the Company capitalized interest of $0.6 million.
NOTE 8
SEGMENT INFORMATION
The Company operates five reportable business segments: Mine Production, PGM Recycling, Canadian Properties, South American Properties and All Other. These segments are managed separately based on fundamental differences in their operations and geographic separation.
The Mine Production segment consists of two business components: the Stillwater Mine and the East Boulder Mine. The Mine Production segment is engaged in the development, extraction, processing and refining of PGMs. The Company sells PGMs from mine production under short-term and long-term sales agreements, through derivative financial instruments and in open PGM markets. The financial results of the Stillwater Mine and the East Boulder Mine have been aggregated, as both have similar products, processes, customers, distribution methods and economic characteristics.
The PGM Recycling segment is engaged in the recycling of spent catalyst material to recover the PGMs contained in the material. The Company allocates costs of the smelter and base metal refinery to both the Mine Production segment and to the PGM Recycling segment for internal and segment reporting purposes because the Company’s smelting and refining facilities support the PGM extraction of both business segments. The Company also accepts material supplied from third parties on a tolling basis, processing it for a fee and returning the recovered metals to the supplier.
The Canadian Properties segment consists of the Marathon PGM assets (the majority of which is mineral property) and the Bermuda exploration mineral property. The principal Marathon property acquired is a large PGM and copper deposit located near the town of Marathon, Ontario, Canada. The Marathon deposit is currently in the permitting stage and will not be in production for several years. The Bermuda exploration mineral property is located adjacent to the Marathon property. Financial information available for this segment of the Company as of June 30, 2012, consists of total asset values, general and administrative costs, exploration costs and capital expenditures as the properties are developed.
The South American Properties segment consists of the Peregrine Metals Ltd. assets. The principal Peregrine property acquired is a copper-gold discovery, located in the San Juan province of Argentina. The Peregrine deposit is currently in the exploration stage. Financial information available for this segment of the Company consists of total asset values, general and administrative costs and exploration costs.
The All Other group primarily consists of assets, revenues, and expenses of various corporate and support functions.
The Company evaluates performance and allocates resources based on income or loss before income taxes.
The following financial information relates to the Company’s business segments:
|
| | | | | | | | | | | | | | | | | | | | | | | | |
| (in thousands) | | | | | | | | South American
Properties | | | | |
| | | Mine Production | | PGM Recycling | | Canadian Properties | | | All Other | | Total |
| Three Months Ended June 30, 2012 | |
| Revenues | | $ | 116,190 |
| | $ | 96,585 |
| | $ | — |
| | $ | — |
| | $ | — |
| | $ | 212,775 |
|
| Depletion, depreciation and amortization | | $ | 14,601 |
| | $ | 261 |
| | $ | — |
| | $ | — |
| | $ | — |
| | $ | 14,862 |
|
| Interest income | | $ | — |
| | $ | 649 |
| | $ | 4 |
| | $ | 48 |
| | $ | 89 |
| | $ | 790 |
|
| Interest expense | | $ | — |
| | $ | — |
| | $ | 12 |
| | $ | — |
| | $ | 1,141 |
| | $ | 1,153 |
|
| Income (loss) before income taxes | | $ | 26,296 |
| | $ | 3,674 |
| | $ | (1,247 | ) | | $ | 1,443 |
| | $ | (12,547 | ) | | $ | 17,619 |
|
| Capital expenditures | | $ | 33,410 |
| | $ | 23 |
| | $ | 1,565 |
| | $ | — |
| | $ | 1,595 |
| | $ | 36,593 |
|
| Total assets | | $ | 441,090 |
| | $ | 61,349 |
| | $ | 246,449 |
| | $ | 427,748 |
| | $ | 359,271 |
| | $ | 1,535,907 |
|
|
| | | | | | | | | | | | | | | | | | | | | | | | |
| (in thousands) | | | | | | | | South American
Properties | | | | |
| | | | | | | | | | | | |
| Three Months Ended June 30, 2011 | | Mine Production | | PGM Recycling | | Canadian Properties | | | All Other | | Total |
| Revenues | | $ | 139,733 |
| | $ | 82,872 |
| | $ | — |
| | $ | — |
| | $ | — |
| | $ | 222,605 |
|
| Depletion, depreciation and amortization | | $ | 15,395 |
| | $ | 265 |
| | $ | — |
| | $ | — |
| | $ | — |
| | $ | 15,660 |
|
| Interest income | | $ | — |
| | $ | 544 |
| | $ | — |
| | $ | — |
| | $ | 407 |
| | $ | 951 |
|
| Interest expense | | $ | — |
| | $ | — |
| | $ | — |
| | $ | — |
| | $ | 1,637 |
| | $ | 1,637 |
|
| Income (loss) before income taxes | | $ | 59,451 |
| | $ | 3,449 |
| | $ | (766 | ) | | $ | — |
| | $ | (13,699 | ) | | $ | 48,435 |
|
| Capital expenditures | | $ | 21,492 |
| | $ | 39 |
| | $ | 1,510 |
| | $ | — |
| | $ | 69 |
| | $ | 23,110 |
|
| Total assets | | $ | 402,990 |
| | $ | 89,855 |
| | $ | 192,859 |
| | $ | — |
| | $ | 353,233 |
| | $ | 1,038,937 |
|
|
| | | | | | | | | | | | | | | | | | | | | | | | |
| (in thousands) | | | | | | | | South American
Properties | | | | |
| | | | | | | | | | | | |
| Six Months Ended June 30, 2012 | | Mine Production | | PGM Recycling | | Canadian Properties | | | All Other | | Total |
| Revenues | | $ | 232,894 |
| | $ | 182,932 |
| | $ | — |
| | $ | — |
| | $ | — |
| | $ | 415,826 |
|
| Depletion, depreciation and amortization | | $ | 29,005 |
| | $ | 529 |
| | $ | — |
| | $ | — |
| | $ | — |
| | $ | 29,534 |
|
| Interest income | | $ | — |
| | $ | 1,189 |
| | $ | 9 |
| | $ | 122 |
| | $ | 115 |
| | $ | 1,435 |
|
| Interest expense | | $ | — |
| | $ | — |
| | $ | 12 |
| | $ | — |
| | $ | 2,856 |
| | $ | 2,868 |
|
| Income (loss) before income taxes | | $ | 54,572 |
| | $ | 6,028 |
| | $ | (4,892 | ) | | $ | (7,548 | ) | | $ | (26,905 | ) | | $ | 21,255 |
|
| Capital expenditures | | $ | 53,824 |
| | $ | 54 |
| | $ | 3,323 |
| | $ | — |
| | $ | 2,112 |
| | $ | 59,313 |
|
| Total assets | | $ | 441,090 |
| | $ | 61,349 |
| | $ | 246,449 |
| | $ | 427,748 |
| | $ | 359,271 |
| | $ | 1,535,907 |
|
|
| | | | | | | | | | | | | | | | | | | | | | | | |
| (in thousands) | | | | | | | | South American
Properties | | | | |
| | | | | | | | | | | | |
| Six Months Ended June 30, 2011 | | Mine Production | | PGM Recycling | | Canadian Properties | | | All Other | | Total |
| Revenues | | $ | 261,713 |
| | $ | 130,953 |
| | $ | — |
| | $ | — |
| | $ | — |
| | $ | 392,666 |
|
| Depletion, depreciation and amortization | | $ | 31,196 |
| | $ | 527 |
| | $ | — |
| | $ | — |
| | $ | — |
| | $ | 31,723 |
|
| Interest income | | $ | — |
| | $ | 919 |
| | $ | — |
| | $ | — |
| | $ | 814 |
| | $ | 1,733 |
|
| Interest expense | | $ | — |
| | $ | — |
| | $ | — |
| | $ | — |
| | $ | 3,272 |
| | $ | 3,272 |
|
| Income (loss) before income taxes | | $ | 105,399 |
| | $ | 6,339 |
| | $ | (1,040 | ) | | $ | — |
| | $ | (21,987 | ) | | $ | 88,711 |
|
| Capital expenditures | | $ | 36,747 |
| | $ | 64 |
| | $ | 9,350 |
| | $ | — |
| | $ | 134 |
| | $ | 46,295 |
|
| Total assets | | $ | 402,990 |
| | $ | 89,855 |
| | $ | 192,859 |
| | $ | — |
| | $ | 353,233 |
| | $ | 1,038,937 |
|
NOTE 9
INVESTMENTS
The Company classifies the marketable securities in which it invests as available-for-sale securities. These securities are measured at fair market value in the financial statements with unrealized gains or losses recorded in other comprehensive income (loss). At the time the securities are sold or otherwise disposed of, gains or losses are included in net income.
The cost, gross unrealized gains, gross unrealized losses, and fair market value of available-for-sale investment securities by major security type and class of security for the periods ended June 30, 2012 and 2011, are as follows:
|
| | | | | | | | | | | | | | | | | |
| | | Investments |
| | (In thousands) | Cost | | Gross unrealized gains | | Gross unrealized losses | | Fair market value |
| 2012 |
| | | | | | | | |
| | Federal agency notes | $ | 24,523 |
| | | | $ | (154 | ) | | $ | 24,369 |
|
| | Commercial paper | 34,329 |
| | | | (745 | ) | | 33,584 |
|
| | Mutual funds | 1,374 |
| | 137 |
| | | | 1,511 |
|
| | Total | $ | 60,226 |
| | $ | 137 |
| | $ | (899 | ) | | $ | 59,464 |
|
| | | | | | | | | |
| 2011 |
| | | | | | | | |
| | Federal agency notes | $ | 117,261 |
| | | | $ | (295 | ) | | $ | 116,966 |
|
| | Commercial paper | 33,754 |
| | | | (841 | ) | | 32,913 |
|
| | Mutual funds | 1,090 |
| | 179 |
| | | | 1,269 |
|
| | Total | $ | 152,105 |
| | $ | 179 |
| | $ | (1,136 | ) | | $ | 151,148 |
|
| | | | | | | | | |
The mutual funds included in the investment table above are included in Other noncurrent assets on the Consolidated Balance Sheet.
The Company has long-term investments in several Canadian exploration companies, recorded under the cost method. At June 30, 2012, these long-term investments totaled $4.9 million and are recorded in Other noncurrent assets on the Consolidated Balance Sheet.
NOTE 10
INVENTORIES
For purposes of inventory accounting, the market value of inventory is generally deemed equal to the Company’s current cost of replacing the inventory, provided that: (1) the market value of the inventory may not exceed the estimated selling price of such inventory in the ordinary course of business less reasonably predictable costs of completion and disposal, and (2) the market value may not be less than net realizable value reduced by an allowance for a normal profit margin. No adjustments were made to the inventory value in the first six months of 2012 or at December 31, 2011.
The costs of mined PGM inventories as of any date are determined based on combined production costs per ounce and include all inventoriable production costs, including direct labor, direct materials, depreciation and amortization and other overhead costs relating to mining and processing activities incurred as of such date.
The costs of recycled PGM inventories as of any date are determined based on the acquisition cost of the recycled material and include all inventoriable processing costs, including direct labor, direct materials and third party refining costs which relate to the processing activities incurred as of such date.
Inventories reflected in the accompanying balance sheets consisted of the following:
|
| | | | | | | |
| (in thousands) | June 30,
2012 | | December 31,
2011 |
| Metals inventory | | | |
| Raw ore | $ | 1,820 |
| | $ | 1,179 |
|
| Concentrate and in-process | 46,901 |
| | 43,379 |
|
| Finished goods | 49,918 |
| | 66,194 |
|
| | 98,639 |
| | 110,752 |
|
| Materials and supplies | 22,939 |
| | 21,104 |
|
| Total inventory | $ | 121,578 |
| | $ | 131,856 |
|
The Company holds in its possession, materials it processes on a toll basis for customers until the tolled material is transported to a third party refiner.
NOTE 11
EARNINGS PER SHARE
Basic earnings per share is computed by dividing net earnings available to common stockholders by the weighted average number of common shares outstanding during the period. Diluted earnings per share reflect the potential dilution that could occur if the Company’s dilutive outstanding stock options or nonvested shares were exercised or vested and the Company’s convertible debt was converted. Reported net income was adjusted for the interest expense (including amortization expense of deferred debt fees) and the related income tax effect for the convertible debentures for the three- month period ended June 30, 2012 and for the three- and six-month periods ended June 30, 2011. The Company currently has only one class of equity shares outstanding.
A total of 48,919 and 78,418 stock option weighted shares of common stock were included in the computation of diluted earnings per share for the three- month periods ended June 30, 2012 and 2011, respectively. Outstanding options to purchase 63,643 and 96,671 of weighted shares of common stock were included in the computation of diluted earnings per share for the six- month periods ended June 30, 2012 and 2011, respectively. Outstanding options to purchase 123,559 and 54,302 of weighted shares of common stock were excluded from the computation of diluted earnings per share for the three- month periods ended June 30, 2012 and 2011, respectively, and outstanding options to purchase 125,980 and 70,745 of weighted shares of common stock were excluded from the computation of diluted earnings per share for the six- month periods ended June 30, 2012 and 2011, respectively, because the market price at the end of each period was lower than the exercise price, and therefore the effect would have been antidilutive.
The effect of including outstanding nonvested shares was to increase diluted weighted average shares outstanding by 905,205 and 925,254 shares for the three- month periods ended June 30, 2012 and 2011, respectively. A total of 922,280 and 1,057,452 outstanding nonvested shares were included in the computation of diluted earnings per share for the six- month periods ended June 30, 2012 and 2011, respectively.
All 7.1 million shares of common stock applicable to the outstanding convertible debentures were included in the computation of diluted weighted average shares in the three- month period ended June 30, 2012 and in the three- and six- month periods ended June 30, 2011. All 7.1 million shares of common stock applicable to the outstanding convertible debentures were excluded in the computation of diluted weighted average shares in the six- month period ended June 30, 2012, because the net effect of assuming all the debentures were converted would have been antidilutive.
Reconciliations showing the computation of basic and diluted shares and the related impact on income for the three- month period ended June 30, 2012 and the three- and six- month periods ended June 30, 2011 are shown in the following table:
|
| | | | | | | | | | |
| | Three Months Ended |
| (in thousands, except per share amounts) | June 30, 2012 |
| | Income (Numerator) | | Weighted Average Shares (Denominator) | | Per Share Amount |
| Basic EPS | | | | | |
| Net income attributable to common stockholders | 18,200 |
| | 115,819 |
| | $ | 0.16 |
|
| Effect of Dilutive Securities | | | | | |
| Stock options |
|
| | 49 |
| | |
| Nonvested shares | — |
| | 905 |
| | |
| 1.875% Convertible debentures | 994 |
| | 7,082 |
| | |
| Diluted EPS | | | | | |
| Net income attributable to common stockholders + assumed conversions | $ | 19,194 |
| | 123,855 |
| | $ | 0.15 |
|
|
| | | | | | | | | | | | | | | | | | | | | |
| | Three Months Ended | | Six Months Ended |
| (in thousands, except per share amounts) | June 30, 2011 | | June 30, 2011 |
| | Income (Numerator) | | Weighted Average Shares (Denominator) | | Per Share Amount | | Income (Numerator) | | Weighted Average Shares (Denominator) | | Per Share Amount |
| Basic EPS | | | | | | | | | | | |
| Net income attributable to common stockholders | 42,698 |
| | 103,037 |
| | $ | 0.41 |
| | 78,890 |
| | 102,688 |
| | $ | 0.77 |
|
| Effect of Dilutive Securities | | | | | | | | | | | |
| Stock options | — |
| | 79 |
| | | | — |
| | 97 |
| | |
| Nonvested shares | — |
| | 925 |
| | | | — |
| | 1,057 |
| | |
| 1.875% Convertible debentures | 994 |
| | 7,082 |
| | | | 1,987 |
| | 7,082 |
| | |
| Diluted EPS | | | | | | | | | | | |
| Net income attributable to common stockholders + assumed conversions | $ | 43,692 |
| | 111,123 |
| | $ | 0.39 |
| | $ | 80,877 |
| | 110,924 |
| | $ | 0.73 |
|
NOTE 12
FAIR VALUE MEASUREMENTS
Fair value is defined as the price that would be received to sell an asset or paid to transfer a liability (an exit price) in an orderly transaction between market participants and also establishes a fair value hierarchy which requires an entity to maximize the use of observable inputs and minimize the use of unobservable inputs when measuring fair value. The fair value hierarchy distinguishes three levels of inputs that may be utilized when measuring fair value: Level 1 inputs (using quoted prices in active markets for identical assets or liabilities), Level 2 inputs (using external inputs other than Level 1 prices, such as quoted prices for similar assets and liabilities in active markets or inputs that are observable for the asset or liability) and Level 3 inputs (unobservable inputs supported by little or no market activity based on internal assumptions used to measure assets and liabilities). The classification of each financial asset or liability within the above hierarchy is determined based on the lowest level input that is significant to the fair value measurement.
Financial assets and liabilities measured at fair value on a recurring basis at June 30, 2012 and December 31, 2011, consisted of the following:
|
| | | | | | | | | | | | | | | | |
| (in thousands) | | Fair Value Measurements |
| At June 30, 2012 | | Total | | Level 1 | | Level 2 | | Level 3 |
| Mutual funds | | $ | 1,511 |
| | $ | 1,511 |
| | $ | — |
| | $ | — |
|
| Investments | | | | | | | | |
| Federal agency notes | | $ | 24,369 |
| | $ | 24,369 |
| | $ | — |
| | $ | — |
|
| Commercial paper | | $ | 33,584 |
| | $ | 33,584 |
| | $ | — |
| | $ | — |
|
|
| | | | | | | | | | | | | | | | |
| (in thousands) | | Fair Value Measurements |
| At December 31, 2011 | | Total | | Level 1 | | Level 2 | | Level 3 |
| Mutual funds | | $ | 1,279 |
| | $ | 1,279 |
| | $ | — |
| | $ | — |
|
| Investments | | | | | | | | |
| Federal agency notes | | $ | 18,621 |
| | $ | 18,621 |
| | $ | — |
| | $ | — |
|
| Commercial paper | | $ | 30,912 |
| | $ | 30,912 |
| | $ | — |
| | $ | — |
|
The fair value of mutual funds and investments is based on market prices which are readily available. Unrealized gains or losses on mutual funds and investments are recorded in Accumulated other comprehensive loss on the Consolidated Balance Sheet.
Financial assets and liabilities measured at fair value on a nonrecurring basis at June 30, 2012, and December 31, 2011, consisted of the following:
|
| | | | | | | | | | | | | | | | |
| (in thousands) | | Fair Value Measurements |
| At June 30, 2012 | | Total | | Level 1 | | Level 2 | | Level 3 |
| Convertible debentures | | $ | 164,523 |
| | $ | — |
| | $ | 164,523 |
| | $ | — |
|
| Exempt facility revenue bonds | | $ | 27,900 |
| | $ | — |
| | $ | — |
| | $ | 27,900 |
|
|
| | | | | | | | | | | | | | | | |
| (in thousands) | | Fair Value Measurements |
| At December 31, 2011 | | Total | | Level 1 | | Level 2 | | Level 3 |
| Convertible debentures | | $ | 160,256 |
| | $ | — |
| | $ | 160,256 |
| | $ | — |
|
| Exempt facility revenue bonds | | $ | 27,269 |
| | $ | — |
| | $ | — |
| | $ | 27,269 |
|
The Company used implicit interest rates of comparable unsecured obligations to calculate the fair value of the Company’s $30 million 8% Series 2000 exempt facility industrial revenue bonds at June 30, 2012, and December 31, 2011. The Company used its current trading data to determine the fair value of the Company’s $166.5 million 1.875% convertible debentures at June 30, 2012, and December 31, 2011.
NOTE 13
RELATED PARTIES
The Palladium Alliance International (PAI) promotes palladium in the worldwide jewelry market. Currently, the PAI receives its funding from the Company. In the second quarter of 2012, the Company made contributions of $3.5 million compared to $2.6 million contributed in the same period in 2011. In the first six months of 2012 and 2011, the Company made contributions of $5.7 million and $3.4 million, respectively. The Company records these contributions as marketing expense.
ITEM 2
MANAGEMENT’S DISCUSSION AND ANALYSIS OF FINANCIAL CONDITION AND
RESULTS OF OPERATIONS
The commentary that follows should be read in conjunction with the consolidated financial statements included in this quarterly report and with the information provided in the Company's March 31, 2012 Quarterly Report on Form 10-Q and in the Company’s 2011 Annual Report on Form 10-K.
Overview
Stillwater Mining Company (the “Company”) is a Delaware corporation, headquartered in Billings, Montana and is listed on the New York and Toronto Stock Exchanges under the symbols SWC and SWC.U, respectively. The Company mines, processes, refines and markets palladium and platinum ores from two underground mines situated within the J-M Reef, an extensive trend of PGM mineralization located in Stillwater and Sweet Grass Counties in south central Montana. Ore produced from each of the mines is crushed and concentrated in mills located at each mine site. The resulting ore concentrates are then trucked to the Company’s smelting and refining complex in Columbus, Montana which further processes the mine concentrates and also recycles spent catalyst materials received from third parties. A portion of the recycling material is purchased for the Company’s own account and the balance is toll processed on behalf of others. The finished product from the refinery is a PGM-rich filter cake which is shipped to third parties for final refining into finished metal.
In recent years, the Company has taken steps to diversify its position as a primary PGM producer serving a single principal market from production derived solely from the J-M Reef in Montana. In November 2010, the Company completed the acquisition of Marathon PGM Corporation (Marathon). Marathon is a Canadian exploration company with an advanced-stage PGM-copper development project situated near the north shore of Lake Superior in the province of Ontario, Canada. The Marathon project team recently submitted an Environmental Impact Statement (EIS) report and supporting technical documents to the Canadian Environmental Assessment Agency and the Ontario Ministry of the Environment. The environmental assessment and technical analysis will be conducted through a joint panel review with a panel recommendation ultimately going to the Federal and Provincial Ministers of the environment for decision-making. Subsequent to this decision, the Company will continue with detailed engineering work in an effort to support the environmental assessment process and future permitting efforts at the provincial level. Recent changes to the Canadian Environmental Assessment Act are currently being reviewed by management in order to assess regulatory intent and the potential to influence the permitting process.
In a further diversification step, during October 2011, the Company completed the acquisition of Peregrine Metals Ltd., a Canadian exploration company (Peregrine) that owns the Altar copper-gold discovery, located in the San Juan province of Argentina. Altar is an exploration-stage property with initial drilling in place that indicates the presence of a large copper-gold porphyry deposit and an ancillary gold discovery. The Company is conducting further exploratory drilling seasonally on the Altar property to determine its economic potential and the limits of the deposit. Additional years of drilling will likely be needed in order to complete this evaluation.
The Company also is in the midst of developing two new mining areas adjacent to its current operations along the J-M Reef. The larger of the two, the Blitz project, eventually will extend underground access eastward from the existing Stillwater Mine infrastructure by about four-and-a-half miles on two separate levels. One of these development headings will be driven with a new tunnel-boring machine, recently leased and currently being installed in the mine. The other parallel heading will be driven above the first using conventional drill and blast methods. A new surface access intersecting this new development is also planned in order to provide adequate ventilation for the resulting work area. Total cost of the Blitz project is estimated at $180 million, to be spent over a total of about five years (commencing in 2011). The second project, Graham Creek, will extend to the west from the existing East Boulder Mine infrastructure about one-and-a-half miles on a single level. The initial cost of this extension, with associated ventilation, will be about $8 million, to be spent over a total of about four years.
The Company is dependent on cash flow from its PGM activities to sustain ongoing operations, as well as to fund the Montana mine expansion initiatives and the exploration and delineation work associated with the Marathon and Altar projects. The Marathon project, and the Altar project if it ultimately should prove to be commercial, will require substantial capital for the development of mines and corollary infrastructure. In the absence of completed engineering feasibility studies, the cost of these facilities cannot be estimated with precision today. Internally generated cash flows will fund the development of Marathon and Altar, however the Company expects that financing from the capital markets or third parties would also be required to undertake construction of these projects. The availability of such financing will depend on future market conditions and opportunities.
In this regard, the Company recently announced a sale to Mitsubishi Corporation of a 25% interest in the Company's wholly owned subsidiary, Stillwater Canada Inc., which owns the Marathon project and related properties. As a result, Mitsubishi will also assume its commensurate share of future Marathon funding commitments. The Mitsubishi transaction may also facilitate securing future financing for the Marathon development. The Marathon and Altar properties provide the Company with the opportunity and flexibility to pursue one or both of these growth initiatives in the future, as metal prices and market conditions may permit. The Company does not currently expect to commit substantial capital to the Altar project until such time as additional delineation, engineering and feasibility studies are complete. For the first six months of 2012, capital, exploration and cash overhead costs for Marathon activities (100% basis) totaled about $5.5 million. Exploration expenses and cash overhead costs for the Peregrine properties (primarily Altar) totaled $14.3 million in the first six months of 2012.
In accordance with U.S. generally accepted accounting principles, the Company is required to expense all exploration costs as incurred. Previously, the Company had not incurred significant exploration costs but with the onset of significant exploratory activity at Altar and a limited exploration program in the Marathon area, the Company is expensing these costs currently against income. Taking into account the effect of these exploration expenses in reducing net income for the foreseeable future, shareholders should recognize that the Company is seeking to add long term value through its exploration efforts. Nevertheless, in view of the inherently early-stage nature of these efforts, there is no assurance that the Company's exploration programs will lead to economically viable mining operations.
Company Priorities and Financing
The Company's various development projects will require significant commitments of capital over the next several years. Total capital spending planned for 2012 is about $135 million, up from $104.1 million (less $2.2 million in accounts payable) in 2011 and $50 million in 2010. In addition to its capital program, the Company has allocated almost $27 million for 2012 exploration activities at Altar and Marathon. Following a significant rise in commodity prices over the last few years, prices have fallen in recent months. The Company has not been immune, as PGM prices have also decreased. Many companies have announced a reduction in their capital expenditure programs. As discussed below, the Company is monitoring its spending closely. The Company may have to make adjustments such as deferring or extending certain spending commitments. While it is not yet clear whether the Company's 2012 spending in total will reach these budgeted levels, the rate of spending during the first half of the year suggests it may be fairly close. The remaining 2012 spending at Altar will include completing metallurgical analysis related to the 2011-2012 drilling season, along with fourth quarter Altar spending for mobilization and initial drilling costs related to the 2012-2013 drilling season there. Marathon spending will likely accelerate in the second half of 2012. Other capital spending overall is expected to remain fairly level.
The table below shows budgeted spending by project for 2012 and total expenditures by project during the first six months of 2012.
|
| | | | | | | |
| (in millions) | Full Year 2012 Budget | | Six Months Ended June 30, 2012 Actual Expenditures |
| Existing Operations | $ | 90.0 |
| | $ | 42.1 |
|
| Blitz and Graham Creek projects | 23.4 |
| | 14.3 |
|
| Marathon project | 21.3 |
| | 3.2 |
|
| Subtotal – Capital | $ | 134.7 |
| | $ | 59.6 |
|
| All Exploration | 26.6 |
| | 12.1 |
|
| Total | $ | 161.3 |
| | $ | 71.7 |
|
With regard to future spending requirements, the Company has indicated that the total capital cost of the Blitz and Graham Creek projects will be on the order of $188 million to be spent over about a five-year period (commencing in 2011). Preliminary estimates of the total cost to develop the Marathon project and place it into production suggest it will likely be in the range of $550 to $650 million, with major construction spending beginning in the year 2014 and first production currently targeted for mid-year 2016. Note, with the sale of the 25% interest in the Marathon properties to Mitsubishi Corporation, the Company's share of future capital spending at Marathon will be reduced from the 2010 estimated $550 to $650 million range (to first production) down to approximately $400 to $500 million. Exploration at the Altar property has been projected to be on the order of $25 million per year for three years with the first of those being 2012, although continuing at this level of spending will be evaluated following each drill season. The level of sustaining capital for the Company's existing operations is expected to remain in the range of $80 to $90 million per year.
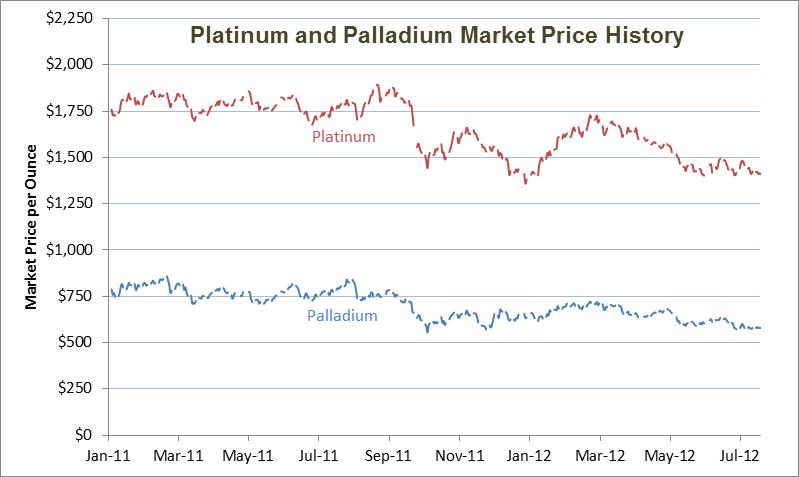
Market prices for palladium and platinum averaged $656 and $1,555 per ounce, respectively, during the first six months of 2012, resulting in EBITDA (before exploration expense) for the first six months of 2012 of about $65.6 million. Sale of a 25% interest in the Marathon property to Mitsubishi during the second quarter generated $94.9 million of additional cash, of which $51.8 million was contributed into Marathon to pre-fund future development activities there; the remaining $43.1 million remains as available cash to the Company. Late in the second quarter, the Company reached an agreement to lease the tunnel-boring machine to be utilized at the Blitz project and was reimbursed $7.2 million to cover progress payments previously paid by the Company. As of June 30, 2012, the Company's consolidated balance of cash and highly liquid short-term securities totaled $255.1 million, including $49.7 million of cash dedicated to the Marathon project and therefore unavailable for other corporate purposes.
The U.S. dollar strengthened significantly during the second quarter of 2012, and consequently market prices for palladium and platinum (along with many other commodities) have declined significantly from their first-half 2012 averages. As of June 29, 2012, palladium was quoted in London at $578 per ounce and platinum at $1,428 per ounce. If these lower prices continue, they will put pressure on the Company to restrain its project spending. With the exception of the Marathon project, which is intended to be financed at least in part externally, all of the Company's near-term capital spending is planned to come out of cash flow from operations. Continued weakness in commodity prices during the second half of 2012 and into 2013 could result in deferral of some of the Company's planned capital and exploration expenditures.
Although the Company currently has a comparatively strong cash position, a number of factors weigh against drawing down cash balances. First, the Company has $166.5 million of outstanding convertible debentures that are likely to be redeemed at par by the holders in March of 2013. While the Company is considering refinancing these debentures, current market conditions are not particularly attractive, and management prefers to preserve the option to pay off the debentures from its cash reserves in the event market conditions do not improve in the interim. Second, several of the Company's projects provide flexibility with regard to the timing of project expenditures if PGM prices decline for an extended period. While reductions in spending for sustaining capital at the existing mines would come last and hopefully be minimal, spending on the Blitz and Altar projects can be tailored to accommodate available cash. The Marathon project would be more difficult to cut back, but spending requirements for the remainder of 2012 and most of 2013 have already been pre-funded. Third, the cyclical nature of the Company's commodity business suggests it is prudent to maintain enough liquidity on hand in an effort to carry the Company through a downturn. In that vein, the Company also maintains a $125 million asset-backed revolving line of credit, some portion of which can be drawn upon to support working capital needs. Available capacity under this line at June 30, 2012, was approximately $64 million.
The sale of the 25% interest in the Marathon properties to Mitsubishi Corporation suggests that the Company's share of future capital spending at Marathon will be reduced from the 2010 estimated $550 to $650 million range (to first production) down to $400 to $500 million. Various financing avenues for Marathon are currently being explored, with the final capital structure decision probably remaining open at least until completion of the Marathon definitive engineering study and the panel review of the project's environmental assessment, both of which are now underway. Financing avenues under consideration include accessing the public debt markets. Project financing including, governmental lending sources, equipment financing, and utilizing internally generated cash flows. The availability and form of any future financing will depend on future market conditions and opportunities. There can be no assurance that the financial markets will be receptive to any offerings or that terms of other financing alternatives will be deemed acceptable. Any determination to proceed with construction and development of the Marathon project is expected to be made only when it is clear that the economics support such steps and commitments are in place with respect to the requisite financing.
Second Quarter 2012
For the second quarter of 2012, the Company reported consolidated net income attributable to common stockholders of $18.2 million, or $0.15 per fully diluted share, a decrease from the $42.7 million, or $0.39 per fully diluted share, reported in the second quarter 2011. The lower earnings reflect lower PGM prices and higher consolidated total cash costs.
Mined palladium and platinum sold in this year's second quarter decreased to 128,100 ounces from 136,600 ounces in the second quarter of 2011, mostly reflecting lower production from the Stillwater Mine in 2012. The average realized price on sales of mined palladium and platinum was $850 per ounce in the second quarter of 2012, compared to $964 per ounce realized in the second quarter of 2011 and compared to $875 per ounce realized in the first quarter of 2012. Consolidated total cash costs per ounce for the Company’s mining operations (“total cash costs per ounce” is a non-GAAP measure further defined below in Reconciliation of Non-GAAP Measure to Costs of Revenues) averaged $454 per ounce in the 2012 second quarter, up from $384 per ounce in the 2011 second quarter but well below the $514 per ounce in this year's first quarter. This increase in total cash costs per ounce between the second quarter of 2012 and the second quarter of 2011 is largely the result of higher labor costs, driven by higher contractual wage and benefit rates and a company-wide increase in total employees to 1,599 at June 30, 2012, from 1,470 at June 30, 2011. This workforce growth is attributable to hiring for the Company's new-miner training program, along with some other additions to mining and support staff. On the other hand, the reduction in second
quarter 2012 total cash costs per ounce compared to this year's first quarter is primarily the result of stronger second quarter mine production, together with a small reduction in total labor and materials costs. The Company is reaffirming its full-year 2012 total cash costs per ounce guidance of $500.
Mine production of palladium and platinum totaled 133,400 ounces in the 2012 second quarter, a 6.5% decrease from the 142,700 ounces produced in the second quarter of 2011 and a 10.4% increase over the 120,800 total ounces produced during the first quarter of 2012. Most of this variability is the normal result of changes in mining conditions and the array of stopes available for mining in any period. The Company is reaffirming its full-year 2012 mined production guidance of 500,000 ounces of palladium and platinum.
PGM recycling revenues for the second quarter 2012 were $96.6 million, an increase of 16.5% over the $82.9 million reported for the second quarter of 2011, reflecting an increased proportion of purchased ounces in the recycle business. Sold ounces of recycled PGMs (which include palladium, platinum and rhodium) increased by 51.5% to 92,900 ounces in the 2012 second quarter, from 61,300 ounces for the second quarter of 2011. Tolled recycling ounces, on the other hand, declined during the second quarter of 2012; the Company processed and returned 39,600 ounces in the second quarter of 2012 compared to 56,700 ounces in the second quarter of 2011. Total recycling ounces processed, including both purchased and tolled materials, decreased slightly to 123,100 ounces in the second quarter of 2012 from 125,200 ounces in the second quarter of 2011.
The Company’s combined average realization on recycling sales was $1,030 per ounce in the second quarter of 2012, down from $1,330 per ounce realized in the second quarter of 2011 and also below the $1,039 per ounce realized in the first quarter of 2012. Revenues from sales of purchased recycling materials totaled $95.7 million in the 2012 second quarter, up from $81.6 million in the same period last year. Tolling revenues decreased to $0.9 million in this year’s second quarter, compared to $1.3 million in the second quarter of 2011. The cost of metals sold from PGM recycling was $93.1 million in the second quarter of 2012 compared to $79.6 million in the second quarter of 2011, an increase of 17.0%. Most of the cost of recycling material is attributable to purchasing spent catalyst for the Company's own account.
Broken out by business segment, the Company’s Montana mining operations earned $26.3 million before income taxes in the second quarter of 2012, off from $59.5 million in the same quarter last year. The difference was driven by a lower combined average selling price for palladium and platinum ($850 per ounce in the second quarter of 2012 compared to $964 per ounce in the second quarter of 2011), lower PGM sales, and higher labor and material costs compared to the second quarter of 2011. Recycling activities contributed earnings of $3.7 million in this year’s second quarter, an increase from $3.4 million in the same period last year. Canadian activities cost $1.2 million in the 2012 second quarter, compared to a cost of $0.8 million reported for the second quarter of 2011. Exploration expenses and overhead costs for the Peregrine Argentina properties (primarily Altar) totaled $2.4 million in the second quarter of 2012. The Company also recorded a foreign currency gain of $3.8 million related to converting into U.S. dollars, an Argentine deferred tax liability recorded in association with the acquisition of Peregrine Metals Ltd. Corporate and other expenses (excluding the benefit for income taxes) totaled $12.5 million for the second quarter of 2012, compared to $13.7 million of expenses in the second quarter of 2011.
The Company's cash balance, excluding restricted cash, was $197.2 million at June 30, 2012, compared to $109.1 million as of December 31, 2011. During the second quarter of 2012, the Company received $94.9 million in cash from the sale of a 25% interest in the Marathon properties to Mitsubishi Corporation (approximately $81.25 million for the 25% interest and an additional $13.6 million to satisfy Mitsubishi's portion of the venture's initial capital call) and $7.2 million from a capital lease transaction. Total liquidity, expressed as cash plus short-term investments, at June 30, 2012, was $255.1 million, an increase from the $158.6 million reported at December 31, 2011. As of June 30, 2012, about $49.7 million of the Company's unrestricted cash was held in Canada and dedicated to the funding of future development at the Marathon project; this cash is not available to the Stillwater parent for its general corporate purposes. Net working capital (including cash and investments) decreased to $269.0 million at June 30, 2012, from $327.8 million at year end 2011; offsetting the cash proceeds noted above, the decrease is attributable to reclassifying the Company's $166.5 million of outstanding 1.875% convertible debentures (due 2028) as a current liability. The terms of these debentures provide that the holders will have the right to redeem these debentures at par on March 15, 2013. During the second quarter of 2012, recycling working capital decreased to $55.7 million as volumes and dollars in the recycling business declined with falling PGM prices.
Of the Company’s 1,599 Montana employees (as of June 30, 2012), approximately 791 Stillwater Mine employees and approximately 142 employees at the Columbus processing facilities are covered by a collective bargaining agreement with the USW Local 11-0001, which will expire on June 1, 2015. About 276 employees at the East Boulder Mine are covered by a separate collective bargaining agreement which will expire on December 31, 2015.
Mining Operations
The Company’s operating objectives for the full year of 2012 include targeted mine production of 500,000 combined ounces of palladium and platinum at a total consolidated cash cost of $500 per ounce. Total mine production of palladium and
platinum during the second quarter of 2012 was 133,400 ounces, bringing year-to-date production to 254,200 ounces. Consequently the Company is reaffirming its mined production guidance of 500,000 PGM ounces for the year.
Total cash costs per mined ounce (a non-GAAP measure) averaged $454 per ounce in the second quarter of 2012. Year to date in 2012, total cash costs have averaged $482 per mined ounce. The Company’s full-year 2012 guidance for total cash costs is about $500 per ounce, up from $420 per ounce averaged in 2011. This 19% anticipated year-on-year increase in total cash costs for 2012 reflects increased support and maintenance staffing, an expanded miner training program, contractual increases in wage and benefit rates, an assumed inflationary bias in the cost of materials and supplies, and slightly lower 2012 mine production. At this point the Company is maintaining its total cash cost guidance of $500 per mined ounce for the full year 2012.
At the Stillwater Mine, second quarter 2012 palladium and platinum production totaled 98,100 ounces, a decrease of 9.9% from the 108,900 ounces in the second quarter of 2011, but an increase of 11.9% over the 87,700 ounces produced in the first quarter of 2012. Average ore grades at the Stillwater Mine were approximately 0.61 ounces per ton in the quarter ending June 30, 2012 and 0.56 ounces per ton for the same period last year. Total ore tons mined at the Stillwater Mine averaged 1,951 tons per day during the second quarter of 2012, down from 2,304 tons per day in the second quarter of 2011 and slightly less than the 1,975 tons per day averaged in the first quarter of 2012. These variations in tons mined are attributable to fluctuations in overall mining conditions, the mix of mining stopes available, emphasis on mine development, and the availability of miners.
Stillwater Mine’s total cash costs of $426 per ounce for the second quarter of 2012 were higher than the $367 per ounce averaged for the second quarter of 2011. Workforce levels at the Stillwater Mine increased by about 5.5% between the second quarter of 2011 and the second quarter of 2012, in part due to hiring for the new-miner training program, plus staffing to accommodate the increasing travel distances underground as the mining front continually recedes. Total labor costs have increased proportionately, up about 10% over the past year. Cash costs per ore ton mined (also a non-GAAP measure) at the Stillwater Mine were $235 for the 2012 second quarter, 23.7% higher than the $190 per ton reported for the second quarter of 2011, reflecting the 15.3% decrease in daily tons produced, plus the increased labor costs.
Capital expenditures at the Stillwater Mine were $25.0 million for the second quarter of 2012, ahead of budget and above the $16.3 million spent during the second quarter of 2011. Primary and secondary development footages for second quarter 2012 at the Stillwater Mine were nearly on plan although in total a little behind the comparable footages for the second quarter of last year, with primary development advancing about 7,000 feet, and secondary development advancing about 4,100 feet. Diamond drilling footage for the second quarter of 2012 at the Stillwater Mine totaled about 74,200 feet, also behind the 84,200 feet drilled in the same period last year. Included in the Stillwater Mine 2012 capital spending is $9.2 million in the second quarter and $12.9 million year to date for development of the adjacent Blitz expansion project. Historically, much of the development at Stillwater has taken place to the west of the shaft, with only limited operations to the east. Conceptually, the Blitz project will use a tunnel boring machine and conventional drill-and-blast mining to develop two parallel drifts underground on separate levels that will extend out about 23,000 feet to the east beyond the existing infrastructure. These tunnels will be intercepted by a decline driven from the surface toward the far end of the development, which will provide access and ventilation to support future mining in the newly developed areas. Progress to date this year consists primarily of leasing a refurbished tunnel boring machine and installing it underground. This process is now nearly complete, and the new machine is expected to begin operating by the end of this year's third quarter. Separately, during the second quarter the Company also purchased some claim blocks previously held by third parties that will be supportive of the new Blitz development.
Mining production at the East Boulder Mine was slightly ahead of plan for the second quarter of 2012, with combined palladium and platinum production of 35,300 ounces. This compares to 33,800 ounces produced at East Boulder in the second quarter of 2011, and 33,100 ounces in the first quarter of 2012. Total cash costs of $529 per mined ounce (a non-GAAP measure) were also slightly better than plan for the second quarter of 2012, but were substantially above the $442 per ounce at the East Boulder Mine in the second quarter of 2011. Again, the increased cash costs were directionally in line with manpower, increasing from 311 at the end of the 2011 second quarter and 318 at year end 2011 to 356 at June 30, 2012. Most of the increase in manpower was associated with mine production activities. East Boulder Mine's second quarter 2012 cash costs of $529 per ounce were significantly lower than the $610 per ounce reported in this year's first quarter. The lower cash cost per ounce in the second quarter is attributable to increased production at the East Boulder Mine, slightly lower total mining costs, and higher amounts capitalized for the Graham Creek project and other mine development.
Capital expenditures at the East Boulder Mine, including Graham Creek, were $6.5 million in the second quarter of 2012, as budgeted, compared to $4.2 million in the second quarter of 2011. Actual primary development at the East Boulder Mine advanced about 3,300 feet during the 2012 second quarter with secondary development advancing 2,400 feet. Comparable development advance in the same period last year was 3,400 feet of primary development and 2,700 feet of secondary. In total,
development footage at the East Boulder Mine year-to-date is substantially ahead of plan, in part because the tunnel boring machine is operating well. The total tunnel boring machine advance year-to-date in 2012 is about 2,500 feet. Diamond drilling footage totaled about 31,200 feet for the 2012 second quarter, behind plan for the quarter but well ahead of the 21,500 feet in last year's second quarter. Total diamond drill footage is projected to catch up to plan during the remainder of the year.
PGM Recycling
For the second quarter of 2012, the Company earned $3.7 million from recycling operations on revenues of $96.6 million, reflecting a combined average realization of $1,030 per sold ounce. For the second quarter of 2011, the Company reported net income from recycling operations of $3.4 million, on revenues of $82.9 million and a combined average realization of $1,330 per sold ounce. Total tons of recycling material processed during the second quarter of 2012, including tolled material, averaged 20.9 tons per day, essentially equal to the 21.0 tons per day processed in the second quarter of 2011. Weaker PGM prices during this year’s second quarter leveled out growth in volumes of recycling material available for processing as the quarter progressed. As noted previously, total ounces recycled in the second quarter of 2012, including toll ounces processed, were 123,100 ounces, compared to 125,200 ounces in the second quarter of 2011. A higher proportion of the ounces recycled during the 2012 second quarter came from recycling material purchased for the Company’s own account than was the case in the 2011 second quarter. The Company normally purchases material from spent automotive catalysts for its own account, while spent refinery and other industrial catalysts usually are toll processed for a fee and returned to the customer.
Outstanding procurement advances for material in transit that was not backed up by inventory physically in the Company’s possession at June 30, 2012 and December 31, 2011, totaled $2.2 million and $2.6 million, respectively. The Company’s total recycling working capital, including inventory and advances, was $55.7 million at June 30, 2012, and $64.5 million at December 31, 2011. The reduction in working capital is mostly the result of lower PGM prices.
Stillwater Canada Inc. – Marathon PGM-Copper Project
In November 2010, the Company completed its acquisition of the PGM assets of Marathon PGM Corporation, a Canadian exploration company. Marathon’s principal asset is a large PGM-copper development project located just north of the town of Marathon, Ontario on the north shore of Lake Superior. Based on a completed definitive feasibility study, the Marathon deposit potentially could produce 200,000 ounces of palladium and platinum per year (at a ratio of about 4 to 1 palladium to platinum) and approximately 37.0 million pounds of copper per year. Mine life, based on the feasibility study reserves, is expected to be about 11.5 years. In 2011, the Company revised its initial capital estimate of $450 million to construct the Marathon project, adjusting the 2010 estimated capital cost upward to a range between $550 to $650 million; this estimate will be refined further once the detailed engineering study of the project now in progress is completed.
On April 10, 2012, the Company concluded a transaction with Mitsubishi Corporation through which Mitsubishi acquired a 25% interest in the Company's wholly owned subsidiary, Stillwater Canada Inc. in return for cash compensation totaling $81.25 million. Stillwater Canada Inc. owns the Marathon project and related exploration properties. An initial cash call of $54.5 million at closing provided initial funding for the venture, of which 75%, or $40.9 million, was funded by Stillwater and 25%, or $13.6 million, by Mitsubishi. This cash infusion should be sufficient to meet all Marathon PGM-copper project (and other related properties) requirements through the remainder of 2012 and most of 2013.
Mitsubishi and Stillwater will be responsible for funding their respective shares of future operating, capital and exploration expenditures on the Marathon properties. Mitsubishi also has agreed to cooperate and support efforts to secure project financing for Marathon. Under a related agreement, once Marathon is in operation Mitsubishi will have an option each year to purchase up to 100% of Marathon’s future PGM production at a relatively small discount to market. Stillwater will retain lead responsibility for managing the development and operation of Marathon.
The Company announced recently that it has now completed and submitted the Environmental Impact Statement for the Marathon project to the appropriate Canadian authorities. This environmental assessment of the Marathon project will be reviewed by a joint federal/provincial review panel in order to better coordinate consideration and public discussion of the Marathon project. In preparation for the environmental assessment, the Company and its predecessors have gathered extensive baseline information dealing with the natural environment and social and cultural background around the project area. These baseline studies have been underway since 2001 and have been supplemented and updated further since 2007. The baseline program includes research related to climate and meteorology, air quality, noise, geology, soils, wildlife, vegetation, groundwater, surface water, fish and fish habitat, socioeconomics, land use, and cultural and traditional knowledge. Computer modeling by third-party environmental, engineering and consulting firms has been included that assesses the cultural and environmental effects of all phases of the mine’s life cycle from construction through operation and closure. Additionally, the Company is consulting and working with local First Nations and aboriginal groups, nearby communities, federal and provincial government representatives and the public at large in an effort to move the project forward constructively.
Altar Project
The Altar project is a large Andean copper-gold porphyry deposit located in the San Juan province of Argentina. The Company acquired this property in conjunction with its acquisition of Peregrine Metals Ltd., a transaction that was completed during the fourth quarter of 2011. The Company initially targeted spending to approximately three years to complete exploration work at Altar and up to $25 million per year, subject to an annual review of circumstances and progress, and then determine if the results justify proceeding with engineering design work. If the project does proceed into development, the scale of the venture is likely to require bringing in one or more financing and/or operating partners. Significant infrastructure investment would be required, in addition to the substantial cost of constructing the mine itself.
The Company completed the 2011-2012 drilling season at Altar in mid-April, prior to the onset of seasonal heavy snowfall in the high Andes. Drilling activities at the Altar site currently are limited by weather to the summer period between December and April. During the season which has just concluded, the Company completed a total of 70 new or deepened drill holes, resulting in just over 27,000 meters of new drill core samples. Assay work is progressing on these samples, with associated quality assurance work and mineralogical analysis expected to be completed later this year.
Capital and Exploration Spending
Consistent with the Company's investor guidance, capital spending is planned to increase from $104.1 million in 2011 to about $135 million in 2012. Consolidated capital expenditures during the second quarter of 2012 totaled $36.6 million as compared to consolidated capital expenditures of $23.1 million at June 30, 2011. The level of consolidated capital spending to date is somewhat lower than planned. The $135 million allocated for the Company’s 2012 capital expenditures includes about $80 million for sustaining capital expenditures at the Montana mines, $23 million for the two-long term resource delineation projects along the J-M Reef, Blitz and Graham Creek, $10 million in the Columbus processing facilities and $22 million for the Marathon project. (The Mitsubishi transaction would have the effect of reducing the Company's proportional share of 2012 budgeted Marathon capital to about $16.5 million.)
In addition to capital spending, the Company also projects expending about $26.6 million for exploration programs during 2012. The Company recognized exploration expense of $2.0 million in the second quarter of 2012, bringing total exploration expenses year-to-date to about $12.1 million. Exploration costs were less than $0.1 million during the second quarter of 2011.
Supply and Demand Commentary for PGM Markets
(The following discussion reflects management’s assessment of the recent state of the PGM markets, based on discussion with industry analysts and the Company’s own observations of market dynamics. There can be no assurance that the Company’s conclusions reflect a complete or accurate picture of supply and demand trends, or outlook. However, management’s view of market conditions and the outlook for PGM supply and demand may influence its decisions on mining activities, future acquisitions, expansions or divestitures, capital investment, financing, hiring and many other factors.)
After PGM prices reached their 2012 year-to-date peak during the last week of February, palladium and platinum both traded sharply lower during the second quarter, closing the month of June in the London market at $578 and $1,428 per ounce, respectively. While underlying supply and demand remain the key economic drivers in both PGM markets, the pervasive strengthening of the U.S. dollar in the face of fiscal instability in Europe appears to have dominated changes in PGM prices through the first half of this year. It is a well-known characteristic of commodity markets that as the U.S. dollar strengthens relative to other key currencies, commodity prices expressed in U.S. dollars tend to decline, roughly offsetting the gain in currency value. While many times supply and demand factors may override this effect, they do not appear to have prevailed during this year's first half. The statistical correlation (R2 coefficient) between changes in PGM prices and movement in the dollar/euro exchange rate for the first half of 2012 is a very strong 76% for palladium and 73% for platinum, suggesting that currency fluctuations were the principal driver of PGM prices during the period.
It is interesting that, despite the ups and downs of PGM prices over the past year or so, the ratio of the palladium price to the platinum price has remained very stable. During 2009 and 2010, the price ratio between the two metals moved up from about 22% to between 40% and 45%, and the ratio has remained consistently in that range since then. The movement upward in the ratio during 2009 and 2010 appears to have corresponded to a structural shift in supply and demand for the two metals. This shift was the result of several key changes in the PGM market during that period:
| |
| • | Sales of palladium from strategic inventory stockpiles held by the Russian government began to decline, suggesting that the stockpiles were nearing depletion and bringing the supply of palladium more closely into line with industrial demand. |
| |
| • | Continuing technological progress in the design of catalytic converters brought about the ability to substitute palladium for platinum on a one-for-one basis in gasoline engine applications and in some stages of diesel catalytic converters. |
| |
| • | The shift from platinum to palladium in gasoline catalytic converters was completed when Toyota became the last of the majors to adopt palladium as the primary catalyst in its automotive emission treatment systems. |
| |
| • | Growth in auto production in emerging economies, and particularly in China, for the first time surpassed vehicle output in North America and in Europe, with catalytic converters being required on virtually all gasoline and diesel-powered vehicles being built worldwide. |
In their most recent public review of the PGM markets, Johnson Matthey estimated in May of this year that the 2011 worldwide supply of palladium from all sources totaled about 9.7 million ounces in 2011, including 6.6 million ounces from primary mine production, about 0.8 million from Russian government inventory liquidation and 2.3 million ounces from all forms of recycling. (Palladium recycling volumes include 1.7 million ounces from catalytic converters, 0.4 million ounces from jewelry, and 0.2 million from electronic scrap.) Johnson Matthey likewise estimated 2011 platinum production at 8.5 million ounces, including 6.5 million ounces from mine production and about 2.0 million ounces from all forms of recycling. (Platinum recycling includes 1.2 million ounces from automotive catalysts and 0.2 million ounces from jewelry.)
Along with the general decline in both platinum and palladium prices during this year's second quarter, the South African PGM producers are facing a number of ongoing challenges, including labor strife, sharply rising capital and operating costs, shortages of power, water and skilled labor, political uncertainty, safety stoppages, and in many cases mining operations that today are cash flow negative. Mitsui observed recently that, according to South African Government statistics, as of June 2012, mine output of PGMs has now fallen year-on-year for eleven successive months, reflecting the magnitude of the challenges producers there face. Recently, several South African producers have suspended mining operations at certain facilities that cannot operate economically at current PGM prices. Others, including some of the major producers, have stated that they are reviewing their operations but have not yet announced any production cutbacks. Virtually all producers have announced that they intend to further reduce capital spending, which some would suggest was already below the level needed to maintain current levels of PGM production over the longer term.
Production in Zimbabwe faces many similar issues, coupled with the government’s recent actions to force companies there to divest majority interests in their mining properties to indigenous groups. Palladium production in the Russian Federation is predominantly derived from Norilsk Nickel’s nickel operations, which produce palladium and platinum as by-products of nickel output and is also forecast lower. New production in North America, including the Company's growth projects, in the aggregate, is modest and is still several years from coming on-line. Any anticipated new primary PGM production in the world appears to be barely sufficient to offset the ongoing depletion of existing mines.
Aside from new mine production, other sources of PGM supply include growth in recycling volumes and drawdown of PGM inventories. There appears to be opportunity for additional recycling growth, particularly in parts of the world where recycling is not yet well established. Industry analysts have estimated that PGM recycling of automotive catalysts – the largest secondary source – is currently at about 50% of its potential. Assuming sufficiently strong PGM prices in the future, one commentator has projected that within four or five years this could increase to 70% of the total recycling opportunity. If this growth in recycling materializes, recognizing that PGM loadings are increasing in recycled catalytic converters, one analyst has suggested that automotive PGM recycling could increase from about 2.9 million ounces of palladium and platinum per year in 2011 (per Johnson Matthey) to about 4.3 million ounces per year in 2015. However, the volume of recycling material available in the market historically has fluctuated with PGM prices - volumes generally fall during periods when PGM prices are relatively weak.
Another possible source of PGM supply is existing inventories. Since 1990, a very substantial share of worldwide palladium demand has been met out of Russian government inventories accumulated from unsold Norilsk Nickel production
during the Soviet era. Although the Russian government does not comment on the status of these inventories, unattributed public remarks from Russian commentators and other sources have suggested these Russian government palladium inventories may now be approaching depletion (or conversely, others suggest, the Russian government may simply stop selling from its palladium inventory). Johnson Matthey’s estimate of 0.8 million ounces exported from these inventories during 2011 is down from about a million ounces during 2010 and 1.5 million ounces as recently as 2007. Exports of palladium from Russia into Switzerland to date in 2012 reportedly total about 67,000 ounces of raw metal and an additional 45,000 ounces of semi-fabricated material (which may not have been sourced from the State inventories). Mitsui mentions that during 2011, unnamed Russian sources suggested that between 125,000 and 150,000 ounces might be sold this year from the Russian state stocks of palladium; import figures for the first six months of 2012 fit very well with that comment. However, there can be no assurance at this time that the unattributed comment as to 2012 exports will prove to be correct.
Besides the Russian government inventories, there also are substantial inventories of PGMs held in Zurich and in London. Some of these represent physical metal backing up exchange-traded funds, or ETFs, while other inventories presumably represent holdings by individuals or institutions. Most of these inventories are considered to be in stable hands and do not trade very much. ETF holdings of platinum and palladium remained fairly flat during the second quarter after increasing earlier in the year. According to Mitsui, ETF holdings worldwide at the end of the 2012 second quarter were about 1.4 million ounces of platinum and 2.1 million ounces of palladium.
Turning to the demand side of the PGM market, the largest single use for palladium and platinum is in automotive catalytic converters. Johnson Matthey's May 2012 publication estimated that in 2011, 6.0 million ounces of palladium (67% of total palladium consumed, net of investment) and 3.1 million ounces of platinum (41% of total platinum consumed, net of investment) were used in manufacturing catalytic converters. The share of platinum allocated to the catalytic converter market was lower than normal in 2011, due in part to the still-depressed market for diesel vehicles in Europe in 2011.
In view of the pivotal role of auto production in the PGM markets, the Company follows automotive market activity closely. Mitsui commented recently that, viewed on a global basis, the automotive industry appears to be relatively healthy, suggesting that demand for palladium should be fairly strong. In North America, production figures have improved so far in 2012 - car production in the U.S., Canada and Mexico is about 20% higher in total than in June 2011, and light-duty truck production is up 16% over the same period. North American inventories of unsold vehicles have been increasing recently, however, particularly for light trucks, suggesting the automotive recovery could slow during the third quarter.
Mitsui also commented that overall Chinese automobile production grew by 4.0% year on year through June, but sales grew by only 3%, indicating that unsold inventories are growing there, as well. However, average selling prices have declined as inventories have grown, suggesting that lower prices eventually could help stimulate additional consumer demand. Growth projections in the automotive market for the full year 2012 in China remain at about 5%. One potentially negative development for Chinese auto demand was the decision recently by the city of Guangzhou to restrict new automobile registrations beginning July 1 in order to address pollution and traffic challenges. Some have suggested that other major cities may follow suit. On a positive note, however, is the Chinese government's stated determination to stimulate the economy during the second half of 2012, which should benefit the automotive market. Euro 5-equivalent Chinese emission standards, which will require higher catalyst loadings, will be implemented in Beijing ahead of the rest of the country, and Beijing intends to introduce Euro-6 equivalent restrictions by 2016.
The third leg of the world automotive market, Western Europe, is not faring so well. According to Mitsui, European passenger car sales declined by 6.8% year-on-year through June. European auto manufacturers have tried to offset some of this local market weakness by capitalizing on exports: BMW announced that its first-half 2012 global output was at record levels, and Peugeot-Citroen is expanding its Russian output. Weakness in the European auto market, with its higher percentage of diesel vehicles, tends to be disproportionately negative for platinum demand, but it also affects palladium.
In reviewing the jewelry market, Johnson Matthey estimates that demand for platinum jewelry grew by about 2.5% during 2011 to 2.48 million ounces, with the strongest demand centered in China. High-end markets in the U.S. and Europe did well, but lower-tier demand was weak. However, according to Johnson Matthey demand for palladium jewelry declined overall during 2011 to about 505,000 ounces. Johnson Matthey's assessment was essentially that palladium jewelry lacked marketing support in its key markets. After cutting back on marketing expenditures during 2009 and 2010, the Company resumed its marketing efforts, through Palladium Alliance International Inc., on behalf of palladium beginning in 2011, rolling out a significant worldwide program during the third and fourth quarters of last year. The Company has been pleased with the initial market response to these efforts, and early indications are that palladium jewelry sales may be strengthening during 2012.
Other sources of demand for palladium include chemical manufacturing, dental alloys, electronic components and investment purchases. According to Johnson Matthey, in aggregate these consumed about 1.9 million ounces of palladium in 2011, down from about 3.1 million ounces in 2010, with the decline attributable entirely to net ETF disinvestment during 2011
after strong ETF growth during 2010. Similarly, other demand sources for platinum include medical, chemical and petrochemical applications, electronic components, glass manufacturing and investment. Johnson Matthey estimates these other uses consumed about 2.5 million ounces of platinum in 2011, up slightly from 2.4 million ounces in 2010. Net investment consumption of platinum was positive both in 2010 and 2011.
In summary, both palladium and platinum are experiencing very limited if any growth in supply, with output in South Africa declining recently and Russian and North American production relatively flat. There is some future opportunity for growth in recycling volumes worldwide over time, particularly if PGM prices strengthen. The role of Russian state inventories as a significant swing source of palladium supply historically now appears to be declining, perhaps because those inventories are approaching exhaustion. Fundamental demand for palladium and platinum is primarily driven by automobile production, with some secondary support from jewelry and investment activity. This year has seen modest growth in automotive demand in North America and China, but the market is currently shrinking in Western Europe. At the margin, PGM market price activity at present appears to be dominated by currency movements (i.e. investment activity), with underlying supply and demand factors providing some underlying support.
Sales and Customers
The Company currently has in place a three-year supply agreement with General Motors Corporation effective until December 31, 2013, that provides for fixed quantities of palladium to be delivered each month. The Company also has a new one-year platinum supply agreement with Tiffany & Co., a new supply agreement with Johnson Matthey, and recently renewed its year-to-year supply agreement with Ford Motor Company. Some of these agreements provide for pricing at a small discount to a monthly trailing market price. The Company currently sells its remaining uncommitted mine production under spot sales agreements. Based on targeted 2012 mine production of about 500,000 PGM ounces, approximately 86% of the Company’s mined palladium production and 74% of its platinum production currently is committed under its supply agreements.
Strategic Areas of Emphasis
The Company’s management for many years has identified and focused on three broad strategic areas of emphasis. While specific initiatives have varied as markets have shifted and the Company has progressed, these fundamental strategic directions continue to provide a basic framework for management’s efforts to strengthen the Company. These elements are reflected in the Company’s Mission Statement – Operate Responsibly, Grow and Develop and Position the Company. Following is a brief update on the Company's progress in each of these three areas.
1. Operate Responsibly
In keeping with the Company’s focus on worker safety, Stillwater has recently announced its commitment to the new CORESafety system, a U.S. mining industry safety initiative in development for the past two years and unanimously endorsed in early April 2012 by the National Mining Association’s executive board. Under CORESafety, Stillwater and its mining industry peers will work together toward a collective target of eliminating fatal accidents and sharply reducing the frequency and severity of on-the-job injuries within the mining industry over the next five years. CORESafety provides an unprecedented opportunity to improve worker safety in the mining industry by creating an industry-wide safety forum, providing the tools to continuously improve safety and health performance and then joining with peers in sharing best practices. It is comprised of a series of 20 modules, which can be prioritized to address specific gaps in safety and health performance based on the Company's own "gap analysis." The Company has selected eight of these modules to be given initial priority, with the others to follow.
The Company generally assesses its safety performance using two broad sets of measures, incidence rates and regulatory compliance. Under federal Mine Safety and Health Administration (MSHA) standards, reportable medical safety incidence include any work-related injury requiring specific medical care as defined by MSHA , with severity ratings broadly categorized as “medical reportables” (no workdays lost), “lost time accidents” (one or more days of work lost), and “fatalities.” For the first half of 2012, the Company's incident rate, which is calculated as the number of reportable injuries per 200,000 hours worked, was 2.2, which compares favorably with the 3.3 rate experienced during the first half of 2011 and also for the full year 2011. The Company assesses its safety regulatory compliance based on the number of citations issued to the Company by MSHA inspectors, and by their severity. Data on safety compliance is included in Exhibit 95 to this filing.
In addition to safety, it is critical that the Company conduct its operations efficiently and responsibly. Ore grades at the Company’s operations are some of the best in the world, and consequently total cash costs per ounce for the Company’s mining operations also rank among the lowest of any primary PGM producer in the industry. However, because the Company’s ore contains about 3.4 times as much palladium as platinum, and South African ores typically have about twice as much platinum as palladium, the Company’s average revenues per ounce are lower and, historically, operating margins may be tighter than for South African producers. Other significant PGM producers, including Norilsk Nickel and the Canadian nickel operations,
produce PGMs as by-products, assigning them almost zero cost. Consequently, the Company often measures its performance both relative to its own historical cost performance and in comparing its cost performance against other primary PGM producers, on a platinum-equivalent basis that takes into account differences in product mix. Platinum-equivalent costs are affected not only by actual cost performance, but also by changes in currency exchange rates, so the Company's relative cost position may shift over time. However, the Company believes its current level of operating costs, relative to the other primary PGM producers, has it positioned well competitively.
As already noted, the Company has recently released a Corporate Sustainability Report that reviews in some detail its efforts to operate responsibly. This report is available on the Company's website and hard copies are available upon request. In summary, the Company takes its responsibilities seriously to comply with and hopefully exceed all applicable safety, environmental and regulatory standards. It also strives to be an active and involved corporate citizen in the communities where it operates.
Although current manpower levels remain adequate to staff current operations, the Company will need to increase staffing in order to support the additional development necessary for future operating initiatives. The Company has instituted significant new-miner training programs during 2012 at both Montana mines in an effort to offset normal attrition as existing miners retire or leave, and also to provide future staffing for the expansion projects adjacent to the existing mines. At any one time during 2012, a total of about 50 employees will be involved in these training programs. The cost of these programs – including both wages and benefits paid within the training program and the effect on production of diverting some highly experienced miners into the program as trainers – is charged against our mining operations, which has escalated the labor component of our 2012 total cash costs per ounce disproportionately. However, management views these programs as an investment in the future, as skilled miners are a scarce and vitally important asset.
2. Develop and Grow Palladium Markets
The Company’s marketing efforts for 2012 are again focused largely on the jewelry markets. During 2012, the Company is continuing a series of magazine pieces highlighting the beauty and comfort of palladium jewelry, using the theme, “I’m So Over Heavy Metal.” These pieces have already appeared in popular fashion magazines, including Elle, W, Cosmopolitan and InStyle. In addition, palladium is being featured at important fashion and celebrity events in the U.S., Europe, Japan and China. The Company also is supporting programs by several key jewelry manufacturers and retailers to feature palladium jewelry lines targeting high-end and mid-tier markets. Several of these will debut during the second half of 2012.
Beyond jewelry, the Company continues to follow efforts by the U.S. Treasury to issue an official U.S. palladium coin. In 2010, the U.S. Congress and the president authorized a process for issuing an official palladium coin, although that process has since experienced some delays. Once in place, such a coin is mandated to be produced from palladium “mined from U.S. sources.” The Company also supports continuing efforts to broaden trading of palladium on major world commodity exchanges.
Other industrial applications for palladium include refinery catalysts, electronics, hydrogen generation and dentistry. Electronic uses that take advantage of palladium’s unique characteristics include multi-layered ceramic capacitors, high-end television screens, and compact discs. Palladium in thin films has a unique ability to pass hydrogen molecules while blocking other impurities, allowing relatively inexpensive production of high-purity hydrogen for chemical processes and fuel cells. Palladium alloys used in dental fillings wear well and have an expansion coefficient that closely matches that of the teeth themselves, although other materials tend to be substituted for palladium when its price rises.
3. Grow and Diversify the Company
The Company's efforts to develop new mining areas along the J-M Reef to the east of the Stillwater Mine (the Blitz project) and to the west of the East Boulder Mine (the Graham Creek project) both are continuing to progress. The Blitz project is a $180 million, five-year development (commencing in 2011) that will extend two drifts (footwall laterals) approximately 23,000 feet to the east of the existing Stillwater Mine infrastructure. Development on one primary level will utilize a newly leased and refurbished tunnel boring machine; a second parallel level several hundred feet above the first drive will be developed using conventional drill-and-blast techniques. The Company also intends to develop a new access from the surface at the far end of the development that ultimately will intercept the footwall lateral drives to provide access for miners and equipment and ensure adequate ventilation. Definitional drilling into the reef during development will increase the Company's understanding of the J-M Reef package to the east of the Stillwater Mine and perhaps define additional attractive mining areas for the future. The tunnel boring machine has been delivered and currently is being assembled underground on site. Startup is estimated by the end of the third quarter of 2012. The Company has recently purchased some mining claims that were previously controlled by others in order to facilitate the Blitz development.
The Graham Creek project is an $8 million project to be spent over a total of about four years, that will utilize an existing
tunnel boring machine to extend the existing East Boulder Mine infrastructure about 8,200 feet to the west. About 1,200 feet of this total was completed during 2011, and an additional 2,500 feet have been added to date during this year’s first half. The tunnel boring drive is expected to be completed during the second quarter of 2013, after which a new ventilation shaft will be driven vertically to the surface. As with the Blitz project, definitional drilling along the new TBM drive will provide better geological understanding of that portion of the J-M Reef.
Although its slate of growth and development projects is currently quite full, the Company continues to monitor the activities of various mineral exploration and development efforts around the world, as well as various other related business ventures. The focus of this monitoring is to identify opportunities to establish a broader operating base, reducing the Company's sole reliance on the Stillwater and East Boulder mine properties, thereby ultimately building value for the Company's shareholders.
The Company has acquired the Marathon and Peregrine assets over the past couple of years in order to provide some additional geographic and product diversity. The Marathon resource includes PGMs with a significant copper endowment, and Peregrine’s Altar project potentially could provide copper with gold. These projects, along with Blitz and Graham Creek, offer potential for future cash flow diversification and growth – although any significant financial benefit from these projects is at least five years away.
The Company has provided a small research and development budget for 2012, primarily emphasizing more efficient technologies for processing PGMs. In particular, the Company is evaluating opportunities to develop its own precious metals refining capability. In addition, the Company has installed a small pilot plant on site at the Stillwater Mine as part of a joint research venture assessing a new technology designed to increase PGM recoveries in the mill. The Company expects to further advance its assessment of these opportunities as the year progresses.
RESULTS OF OPERATIONS
Comparison of Three- Month Periods Ended June 30, 2012 and 2011
The Company’s total revenues decreased by 4.4% to $212.8 million in the second quarter of 2012 compared to $222.6 million for the second quarter of 2011. The following analysis covers key factors contributing to the increase in revenues:
SALES AND PRICE DATA
|
| | | | | | | | | | | | | | |
| | Three Months Ended
June 30, | | Increase | | Percentage |
| (in thousands, except for average prices) | 2012 | | 2011 | | (Decrease) | | Change |
| Revenues | $ | 212,775 |
| | $ | 222,605 |
| | $ | (9,830 | ) | | (4.4 | )% |
| Ounces Sold: | | | | | | | |
| Mine Production: | | | | | | | |
| Palladium (oz.) | 97 |
| | 108 |
| | (11 | ) | | (10 | )% |
| Platinum (oz.) | 31 |
| | 29 |
| | 2 |
| | 7 | % |
| Total | 128 |
| | 137 |
| | (9 | ) | | (7 | )% |
PGM recycling: (1) | | | | | | | |
| Palladium (oz.) | 57 |
| | 31 |
| | 26 |
| | 84 | % |
| Platinum (oz.) | 30 |
| | 26 |
| | 4 |
| | 15 | % |
| Rhodium (oz.) | 6 |
| | 4 |
| | 2 |
| | 50 | % |
| Total | 93 |
| | 61 |
| | 32 |
| | 52 | % |
By-products from mining: (2) | | | | | | | |
| Rhodium (oz.) | 1 |
| | — |
| | 1 |
| | — | % |
| Gold (oz.) | 2 |
| | 2 |
| | — |
| | — | % |
| Silver (oz.) | 2 |
| | 1 |
| | 1 |
| | 100 | % |
| Copper (lb.) | 175 |
| | 219 |
| | (44 | ) | | (20 | )% |
| Nickel (lb.) | 252 |
| | 331 |
| | (79 | ) | | (24 | )% |
Average realized price per ounce (3) | | | | | | | |
| Mine Production: | | | | | | | |
| Palladium ($/oz.) | $ | 643 |
| | $ | 752 |
| | $ | (109 | ) | | (14 | )% |
| Platinum ($/oz.) | $ | 1,502 |
| | $ | 1,769 |
| | $ | (267 | ) | | (15 | )% |
Combined ($/oz.) (4) | $ | 850 |
| | $ | 964 |
| | $ | (114 | ) | | (12 | )% |
PGM recycling: (1) | | | | | | | |
| Palladium ($/oz.) | $ | 680 |
| | $ | 785 |
| | $ | (105 | ) | | (13 | )% |
| Platinum ($/oz.) | $ | 1,610 |
| | $ | 1,787 |
| | $ | (177 | ) | | (10 | )% |
| Rhodium ($/oz.) | $ | 1,413 |
| | $ | 2,381 |
| | $ | (968 | ) | | (41 | )% |
Combined ($/oz.) (4) | $ | 1,030 |
| | $ | 1,330 |
| | $ | (300 | ) | | (23 | )% |
By-products from mining: (2) | | | | | | | |
| Rhodium ($/oz.) | $ | 1,295 |
| | $ | 1,981 |
| | $ | (686 | ) | | (35 | )% |
| Gold ($/oz.) | $ | 1,594 |
| | $ | 1,508 |
| | $ | 86 |
| | 6 | % |
| Silver ($/oz.) | $ | 29 |
| | $ | 39 |
| | $ | (10 | ) | | (26 | )% |
| Copper ($/lb.) | $ | 3.35 |
| | $ | 3.97 |
| | $ | (0.62 | ) | | (16 | )% |
| Nickel ($/lb.) | $ | 6.52 |
| | $ | 10.00 |
| | $ | (3.48 | ) | | (35 | )% |
Average market price per ounce (3) | | | | | | | |
| Palladium ($/oz.) | $ | 628 |
| | $ | 759 |
| | $ | (131 | ) | | (17 | )% |
| Platinum ($/oz.) | $ | 1,499 |
| | $ | 1,781 |
| | $ | (282 | ) | | (16 | )% |
Combined ($/oz.) (4) | $ | 838 |
| | $ | 972 |
| | $ | (134 | ) | | (14 | )% |
| |
| (1) | Ounces sold and average realized price per ounce from PGM recycling relate to ounces produced from processing of catalyst materials. |
| |
| (2) | By-product metals sold reflect contained metal. Realized prices reflect net values (discounted due to product form and transportation and marketing charges) per unit received. |
| |
| (3) | The Company’s average realized price represents revenues, which include the effect of hedging gains and losses realized on commodity instruments and agreement discounts, divided by ounces sold. The average market price represents the average London Bullion Market Association afternoon postings for the actual months of the period. |
| |
| (4) | The Company reports a combined average realized and a combined average market price of palladium and platinum at the same ratio as ounces that are produced from the base metal refinery. |
Net revenues from sales of mine production (includes by-products) were $116.2 million in the second quarter of 2012, compared to $139.7 million for the same period in 2011, a 16.8% decrease. The decrease in mine production revenues reflects declining market prices accompanied by a decrease in volumes sold in the second quarter of 2012. The Company’s average combined realized price on sales of palladium and platinum from mining operations was $850 per ounce in the second quarter of 2012, compared to $964 per ounce in the same quarter of 2011. The total quantity of mined palladium and platinum sold decreased by 6.2% to 128,100 ounces in the second quarter of 2012, compared to 136,600 ounces sold during the same time period in 2011.
Revenues from PGM recycling increased to $96.6 million in the second quarter of 2012, or 16.5%, from $82.9 million in the second quarter of 2011. The increase in PGM recycling revenues is the result of higher volumes sold. The Company’s combined average realization on recycling sales (which include palladium, platinum and rhodium) was $1,030 per ounce in the second quarter of 2012, down 22.6% from $1,330 per ounce realized in the second quarter of last year. Recycled ounces sold increased to 92,900 ounces in the second quarter of this year from 61,300 ounces in the second quarter of 2011. The increase in PGM recycling revenue and recycled ounces sold during the second quarter of 2012 reflects a higher proportion of purchased ounces processed compared to the same period of 2011. Processed recycled ounces, including ounces processed on a toll basis, decreased to 123,100 ounces in the second quarter of 2012, from 125,200 ounces in the second quarter of 2011. Revenues from sales of purchased recycling materials totaled $95.7 million in the second quarter of 2012, up from $81.6 million in the same period last year. Tolling revenues declined to $0.9 million in this year’s second quarter, compared to $1.3 million in the second quarter of 2011.
The Company’s total costs of metals sold (before depletion, depreciation, amortization, and corporate overhead expenses) increased to $168.1 million in the second quarter of 2012 from $144.6 million in the second quarter of 2011, a 16.3% increase. The higher cost in 2012 was driven primarily by higher volumes of recycling material purchased (and the related value of the contained metals) and higher costs of mine production.
The costs of metals sold from mine production totaled $75.0 million for the second quarter of 2012, compared to $65.1 million for the second quarter of 2011, a 15.2% increase. The increase reflected higher labor and contracting costs between the two periods.
Total consolidated cash costs per ounce produced, a non-GAAP measure of extraction efficiency, in the second quarter of 2012 rose by 18.2% to $454 per ounce, compared to $384 per ounce in the second quarter of 2011. This increase reflected overall higher labor costs, general inflation in materials and supplies and a decrease in mine production. Higher labor costs included an increase in contractual wage and benefit rates and hiring for the Company's new miner training program.
The costs of metals sold from PGM recycling were $93.1 million in the second quarter of 2012, compared to $79.6 million in the second quarter of 2011, an increase of 17.0%. This increase was due to higher volumes sold partially offset by the related lower market value of the materials acquired for processing.
During the second quarter of 2012, the Company’s mining operations produced 133,400 ounces of PGMs, a 6.5% decrease from the 142,700 ounce production in the second quarter of 2011. Production in the second quarter of 2012 included 102,800 ounces of palladium and 30,600 ounces of platinum compared to 109,800 palladium ounces and 32,900 platinum ounces produced in the second quarter of 2011. Production at the Stillwater Mine for second quarter of 2012 was 98,100 ounces, a decrease from the 108,900 ounces produced in the second quarter of 2011, and production at the East Boulder Mine increased slightly to 35,300 ounces from 33,800 ounces in the same period last year. The production decrease at the Stillwater Mine and the relatively small production increase at the East Boulder Mine were driven by typical changes in mining conditions and the group of stopes available for mining.
General and administrative (“G&A”) costs increased to $10.1 million in the second quarter of 2012 from $9.9 million for the same period of 2011, an overall increase of $0.2 million. Exploration expenses totaled $2.0 million for the second quarter of 2012, of which almost all was attributable to the Altar copper-gold project. Exploration expenses totaled less than $0.1 million during the second quarter of 2011. Marketing expenses increased to $3.7 million in the 2012 second quarter compared to $2.8
million in the same quarter of 2011. Research and development costs decreased to less than $0.1 million from $0.6 million in the same quarter of 2011.
Total interest income for the second quarter of 2012 decreased to $0.8 million from $1.0 million in the corresponding quarter of 2011, mostly reflecting the Company’s reduced balance of cash, cash equivalents and short-term investments following the Peregrine acquisition. Interest earned on recycling volumes in the second quarter of 2012 contributed $0.6 million to net income in comparison to $0.5 million in the second quarter of 2011. Interest expense in the second quarters of 2012 and 2011 was $1.2 million (net of capitalized interest of $0.6 million) and $1.6 million, respectively.
During the second quarter of 2012, the Company recorded a foreign currency transaction gain of $3.8 million, primarily, related to the deferred tax liability recorded in association with the acquisition of Peregrine Metals Ltd. The gain was a result of the strengthening of the U.S. dollar in comparison with the Argentine peso. As the deferred tax obligation will be settled at a future date in pesos, changes in the relative currency values are recognized in the period within transaction gain/loss on the consolidated statement of operations.
Comparison of Six- Month Periods Ended June 30, 2012 and 2011
The Company’s total revenues increased by 5.9% to $415.8 million in the first six months of 2012 compared to $392.7 million for the first six months of 2011. The following analysis covers key factors contributing to the increase in revenues:
SALES AND PRICE DATA
|
| | | | | | | | | | | | | | |
| | Six Months Ended
June 30, | | Increase | | Percentage |
| (in thousands, except for average prices) | 2012 | | 2011 | | (Decrease) | | Change |
| Revenues | $ | 415,826 |
| | $ | 392,666 |
| | $ | 23,160 |
| | 5.9 | % |
| Ounces Sold: | | | | | | | |
| Mine Production: | | | | | | | |
| Palladium (oz.) | 193 |
| | 199 |
| | (6 | ) | | (3 | )% |
| Platinum (oz.) | 58 |
| | 53 |
| | 5 |
| | 9 | % |
| Total | 251 |
| | 252 |
| | (1 | ) | | — | % |
PGM recycling: (1) | | | | | | | |
| Palladium (oz.) | 103 |
| | 57 |
| | 46 |
| | 81 | % |
| Platinum (oz.) | 60 |
| | 40 |
| | 20 |
| | 50 | % |
| Rhodium (oz.) | 13 |
| | 7 |
| | 6 |
| | 86 | % |
| Total | 176 |
| | 104 |
| | 72 |
| | 69 | % |
By-products from mining: (2) | | | | | | | |
| Rhodium (oz.) | 2 |
| | — |
| | 2 |
| | — | % |
| Gold (oz.) | 5 |
| | 4 |
| | 1 |
| | 25 | % |
| Silver (oz.) | 3 |
| | 3 |
| | — |
| | — | % |
| Copper (lb.) | 349 |
| | 394 |
| | (45 | ) | | (11 | )% |
| Nickel (lb.) | 541 |
| | 671 |
| | (130 | ) | | (19 | )% |
Average realized price per ounce (3) | | | | | | | |
| Mine Production: | | | | | | | |
| Palladium ($/oz.) | $ | 657 |
| | $ | 767 |
| | $ | (110 | ) | | (14 | )% |
| Platinum ($/oz.) | $ | 1,547 |
| | $ | 1,775 |
| | $ | (228 | ) | | (13 | )% |
Combined ($/oz.) (4) | $ | 862 |
| | $ | 978 |
| | $ | (116 | ) | | (12 | )% |
PGM recycling: (1) | | | | | | | |
| Palladium ($/oz.) | $ | 664 |
| | $ | 724 |
| | $ | (60 | ) | | (8 | )% |
| Platinum ($/oz.) | $ | 1,569 |
| | $ | 1,756 |
| | $ | (187 | ) | | (11 | )% |
| Rhodium ($/oz.) | $ | 1,500 |
| | $ | 2,336 |
| | $ | (836 | ) | | (36 | )% |
Combined ($/oz.) (4) | $ | 1,034 |
| | $ | 1,234 |
| | $ | (200 | ) | | (16 | )% |
By-products from mining: (2) | | | | | | | |
| Rhodium ($/oz.) | $ | 1,378 |
| | $ | 1,981 |
| | $ | (603 | ) | | (30 | )% |
| Gold ($/oz.) | $ | 1,644 |
| | $ | 1,444 |
| | $ | 200 |
| | 14 | % |
| Silver ($/oz.) | $ | 31 |
| | $ | 35 |
| | $ | (4 | ) | | (11 | )% |
| Copper ($/lb.) | $ | 3.48 |
| | $ | 4.06 |
| | $ | (0.58 | ) | | (14 | )% |
| Nickel ($/lb.) | $ | 7.11 |
| | $ | 10.28 |
| | $ | (3.17 | ) | | (31 | )% |
Average market price per ounce (3) | | | | | | | |
| Palladium ($/oz.) | $ | 656 |
| | $ | 775 |
| | $ | (119 | ) | | (15 | )% |
| Platinum ($/oz.) | $ | 1,555 |
| | $ | 1,787 |
| | $ | (232 | ) | | (13 | )% |
Combined ($/oz.) (4) | $ | 863 |
| | $ | 987 |
| | $ | (124 | ) | | (13 | )% |
| |
| (1) | Ounces sold and average realized price per ounce from PGM recycling relate to ounces produced from processing of catalyst materials. |
| |
| (2) | By-product metals sold reflect contained metal. Realized prices reflect net values (discounted due to product form and transportation and marketing charges) per unit received. |
| |
| (3) | The Company’s average realized price represents revenues, which include the effect of hedging gains and losses realized on commodity instruments and agreement discounts, divided by ounces sold. The average market price represents the average London Bullion Market Association afternoon postings for the actual months of the period. |
| |
| (4) | The Company reports a combined average realized and a combined average market price of palladium and platinum at the same ratio as ounces that are produced from the base metal refinery. |
Net revenues from sales of mine production (includes by-products) were $232.9 million in the first six months of 2012, compared to $261.7 million for the same period in 2011, an 11.0% decrease. The decrease in mine production revenues reflects declining market prices for palladium and platinum sold in the first six months of 2012. The Company’s average combined realized price on sales of palladium and platinum from mining operations was $862 per ounce in the first six months of 2012, compared to $978 per ounce in the same period of 2011. The total quantity of mined palladium and platinum sold in the first half of 2012 totaled 251,100 ounces compared to 251,700 ounces sold during the same time period in 2011.
Revenues from PGM recycling increased to $182.9 million in the first six months of 2012, or 39.6%, from $131.0 million in the same period in 2011. The increase in PGM recycling revenues is the result of higher volumes sold despite a decrease in the average realized price for PGMs. The Company’s combined average realization on recycling sales (which include palladium, platinum and rhodium) was $1,034 per ounce in the first six months of 2012, down 16.2% from $1,234 per ounce realized in the first six months of last year. Recycled ounces sold increased 68.6% to 175,300 ounces in the first half of this year from 104,000 ounces in the same period of 2011. The increase in PGM recycling revenue and recycled ounces sold during the first half of 2012 reflect a higher proportion of purchased ounces processed compared to the same period of 2011. Processed recycled ounces, including ounces processed on a toll basis, decreased to 230,400 ounces in the first six months of 2012, from 240,800 ounces in the first six months of 2011. Revenues from sales of purchased recycling materials totaled $181.3 million in the first six months of 2012, up from $128.3 million in the same period last year. Tolling revenues declined to $1.6 million in this year’s first six months, compared to $2.7 million in the first six months of 2011.
The Company’s total costs of metals sold (before depletion, depreciation, amortization, and corporate overhead expenses) increased to $326.3 million in the first six months of 2012, from $250.1 million for the same period of 2011, a 30.5% increase. The higher cost in 2012 was driven primarily by higher volumes of recycling material purchased (and the related value of the contained metals) and higher costs of mine production.
The costs of metals sold from mine production totaled $149.0 million for the first six months of 2012, compared to $125.3 million for the same period of 2011, an 18.9% increase. The increase reflected higher labor and contracting costs between the two periods.
Total consolidated cash costs per ounce produced, a non-GAAP measure of extraction efficiency, in the first six months of 2012 rose by 17.6% to $482 per ounce, compared to $410 per ounce in the same period of 2011. This increase reflected overall higher labor costs, general inflation in materials and supplies and a decrease in mine production. Higher labor costs included an increase in contractual wage and benefit rates and hiring for the Company's new miner training program.
The costs of metals sold from PGM recycling were $177.3 million in the first six months of 2012, compared to $124.7 million in the same period of 2011, an increase of 42.2%. This increase was due to higher volumes sold partially offset by the related lower market value of the materials acquired for processing.
During the first six months of 2012, the Company’s mining operations produced 254,200 ounces of PGMs, a 7.2% decrease from the 273,800 ounce production in the same period of 2011. Production in the first six months of 2012 included 196,200 ounces of palladium and 58,000 ounces of platinum compared to 210,900 palladium ounces and 62,900 platinum ounces produced in the same period of 2011. Production at the Stillwater Mine for the first six months of 2012 was 185,800 ounces, a decrease from the 207,500 ounces produced in the same period of 2011, and production at the East Boulder Mine increased slightly to 68,400 ounces from 66,300 ounces in the same period last year. The production decrease at the Stillwater Mine and the relatively small production increase at the East Boulder Mine were driven by typical changes in mining conditions and the allocation of mining resources.
General and administrative (“G&A”) costs increased to $22.6 million in the first six months of 2012 from $16.3 million for the same period of 2011, an overall increase of $6.3 million. This increase was primarily attributable to one-time software licensing fees, higher legal and advisory services and growth in project administrative costs. Exploration expenses totaled $12.1 million for the first six months of 2012, of which almost all was attributable to the Altar copper-gold project. Exploration expenses totaled less than $0.1 million during the first six months of 2011. Marketing expenses increased to $6.0 million in the
2012 first six months compared to $3.7 million in the same period of 2011. Research and development costs decreased to $0.8 million for the first six months of 2012 from $1.1 million for the same period in 2011.
Total interest income for the first six months of 2012 decreased to $1.4 million from $1.7 million in the corresponding period of 2011, mostly reflecting the Company’s reduced balance of cash, cash equivalents and short-term investments following the Peregrine acquisition. Interest earned on recycling volumes in the first six months of 2012 contributed $1.2 million to net income in comparison to $0.9 million in the same period of 2011. Interest expense in the first six months of 2012 and 2011 was $2.9 million (net of capitalized interest of $0.6 million) and $3.3 million, respectively.
During the first six months of 2012, the Company recorded a foreign currency transaction gain of $6.7 million, primarily, related to the deferred tax liability recorded in association with the acquisition of Peregrine Metals Ltd. The gain was a result of the strengthening of the U.S. dollar in comparison with the Argentine peso. As the deferred tax obligation will be settled at a future date in pesos, changes in the relative currency values are recognized in the period within transaction gain/loss on the consolidated statement of operations.
LIQUIDITY AND CAPITAL RESOURCES
For the second quarter of 2012, net cash provided by operating activities was $39.4 million compared to $58.8 million in the second quarter of 2011. The Company’s net cash flow from operating activities is affected by several key factors, including net realized prices for its products, cash costs of production, and the level of PGM production from the mines as well as the volume of activity in its recycle business. Mining productivity rates and ore grades in turn can affect both PGM production and cash costs of production. Net cash flow from operations also includes changes in non-cash working capital, including changes to inventories and advances.
In its recycling activities, the Company customarily enters into fixed forward contracts that set the selling price for a significant portion of the recovered PGMs. Consequently, for outstanding recycling lots a change in the market price of palladium and platinum on sales of recycling materials would have little or no effect on margins earned from this activity or on cash flow from operations. However, a percentage change in market prices would affect margins on future lots by about the same percentage as the change in price. It normally takes existing lots of recycling material two to three months from the date of receipt to flow through to sales.
Changes in the cash costs of mine production generally flow through dollar-for-dollar into cash flow from operations. A reduction due to grade in total mine production of 10%, or about 50,000 palladium and platinum ounces per year, would reduce cash flow from operations by an estimated $36.0 million per year at the price and cost levels prevailing at June 30, 2012.
Net cash used in investing activities for the second quarter of 2012 was $44.1 million, comprised of capital expenditures of $36.6 million and a $7.5 million increase in investments. In the same period of 2011 net cash provided by investing activities was $2.9 million, comprised of $23.1 million of capital expenditures, offset by, $25.8 million as a net reduction in investments, and $0.2 million from sales of equipment.
Net cash provided by financing activities for the second quarter of 2012 was $101.4 million, comprised chiefly of the proceeds from the sale of the 25% Marathon interest to Mitsubishi Corporation and from a capital leasing transaction.
At June 30, 2012, the Company’s cash and cash equivalents was $197.2 million, compared to $109.1 million at December 31, 2011. If highly liquid short-term investments are included with available cash, the Company’s balance sheet liquidity is $255.1 million at June 30, 2012, an increase from $158.6 million at December 31, 2011. This includes the funds received from Mitsubishi for their 25% interest in the Marathon PGM-copper project which closed in April of 2012. These June 30, 2012 cash and liquidity balances include about $49.7 million of cash held in Canada that is dedicated as funding for the Marathon PGM-copper project (and other related properties) and so is not available to the Company for its general corporate purposes.
Outstanding debt at June 30, 2012, was $203.1 million, up from $196.0 million at December 31, 2011. The Company’s total debt includes $166.5 million outstanding (and classified as current) in the form of convertible debentures with noteholders having the right in March of 2013 to redeem their holdings at par; $29.5 million of Exempt Facility Revenue Bonds due in 2020; $0.4 million for a land purchase in 2012; and $6.7 million due under a capital lease with GE Capital. The Company expects to pay $2.8 million of interest during the remaining six months of 2012 related to its outstanding debt obligations. The Company made cash interest payments of $1.2 million during the second quarter.
The Company entered into a $100.0 million asset-backed revolving credit agreement with Wells Fargo Capital Finance in
the fourth quarter of 2011. During the first quarter of 2012 the Company completed the syndication of this facility expanding the credit line to $125.0 million. Available capacity under the line was about $63.8 million at June 30, 2012, of which $5.3 million had been utilized for undrawn irrevocable letters of credit.
CONTRACTUAL OBLIGATIONS
The Company is obligated to make future payments under various debt agreements and regulatory obligations. The following table represents significant contractual cash obligations and other commercial and regulatory commitments, including related interest payments, as of June 30, 2012:
|
| | | | | | | | | | | | | | | | | | | | | | | | | | | | |
| (in thousands) | | 2012 (1) | | 2013 | | 2014 | | 2015 | | 2016 | | Thereafter | | Total |
| Convertible debentures | | $ | — |
| | $ | 166,500 |
| | $ | — |
| | $ | — |
| | $ | — |
| | $ | — |
| | $ | 166,500 |
|
| Exempt Facility Revenue Bonds | | — |
| | — |
| | — |
| | — |
| | — |
| | 30,000 |
| | 30,000 |
|
| Land purchase | | — |
| | 93 |
| | 89 |
| | 85 |
| | 81 |
| | — |
| | 348 |
|
| Operating leases | | 195 |
| | 281 |
| | 234 |
| | 2 |
| | 1 |
| | — |
| | 713 |
|
| Capital lease obligation | | 814 |
| | 1,696 |
| | 1,791 |
| | 1,891 |
| | 489 |
| | — |
| | 6,681 |
|
| Asset retirement obligations | | — |
| | — |
| | — |
| | — |
| | — |
| | 144,271 |
| | 144,271 |
|
Payments of interest (2) | | 2,761 |
| | 3,961 |
| | 2,400 |
| | 2,400 |
| | 2,400 |
| | 8,400 |
| | 22,322 |
|
Other liabilities(3) | | 14,834 |
| | 5,306 |
| | — |
| | ��� |
| | — |
| | — |
| | 20,140 |
|
| Total | | $ | 18,604 |
| | $ | 177,837 |
| | $ | 4,514 |
| | $ | 4,378 |
| | $ | 2,971 |
| | $ | 182,671 |
| | $ | 390,975 |
|
| |
| (1) | Amounts represent cash obligations for July through December 2012. |
| |
| (2) | Interest payments on the convertible debentures noted in the above table are calculated up to March 15, 2013, the date the holders of the debentures can exercise their put option. |
| |
| (3) | Amounts included in other liabilities that are anticipated to be paid in 2012 and 2013 include property taxes and severance taxes. |
Interest payments noted in the table above assume all are based on fixed rates of interest.
FACTORS THAT MAY AFFECT FUTURE RESULTS AND FINANCIAL CONDITION
Some statements contained in this report are forward-looking statements within the meaning of Section 27A of the Securities Act of 1933, as amended, and Section 21E of the Securities Exchange Act of 1934, as amended, and, therefore, involve uncertainties or risks that could cause actual results to differ materially. These statements may contain words such as “believes,” “anticipates,” “plans,” “expects,” “intends,” “estimates” or similar expressions. Such statements also include, but are not limited to, comments regarding expansion plans, costs, grade, production and recovery rates; permitting; financing needs and the terms of future credit facilities; exchange rates; capital expenditures; increases in processing capacity; cost reduction measures; safety; timing for engineering studies; environmental permitting and compliance; litigating; labor matters; and the palladium, platinum, copper and gold market. These statements are not guarantees of the Company’s future performance and are subject to risks, uncertainties and other important factors that could cause its actual performance or achievements to differ materially from those expressed or implied by these forward-looking statements. Additional information regarding factors that could cause results to differ materially from management’s expectations is found in the Company’s 2011 Annual Report on Form 10-K, in its quarterly Form 10-Q filings, (on file with the United States Securities and Exchange Commission, available on the Company’s website) and in corresponding filings with Canadian securities regulatory authorities.
The Company intends that the forward-looking statements contained herein be subject to the above-mentioned statutory safe harbors. Investors are cautioned not to rely on forward-looking statements. The Company disclaims any obligation to update forward-looking statements.
CRITICAL ACCOUNTING POLICIES
Noncontrolling Interest - Noncontrolling interest arose from the sale of a 25% ownership interest in Stillwater Canada Inc. during the second quarter of 2012. Noncontrolling interest is classified in the Consolidated Statements of Operations and Comprehensive Income as part of consolidated net income (loss) and the accumulated amount of noncontrolling interest in the Consolidated Balance Sheets as a component of stockholders' equity.
The Company’s other significant accounting policies are discussed in detail in the Company’s 2011 Annual Report on Form 10-K.
KEY OPERATING FACTORS
Stillwater Mining Company
Key Operating Factors
(Unaudited)
|
| | | | | | | | | | | | | | | |
| | Three Months Ended
June 30, | | Six Months Ended
June 30, |
| (in thousands, except where noted) | 2012 | | 2011 | | 2012 | | 2011 |
| OPERATING AND COST DATA FOR MINE PRODUCTION | | | | | | | |
Consolidated: | | | | | | | |
| Ounces produced | | | | | | | |
| Palladium | 102 |
| | 110 |
| | 196 |
| | 211 |
|
| Platinum | 31 |
| | 33 |
| | 58 |
| | 63 |
|
| Total | 133 |
| | 143 |
| | 254 |
| | 274 |
|
| Tons milled | 269 |
| | 297 |
| | 539 |
| | 590 |
|
| Mill head grade (ounce per ton) | 0.54 |
| | 0.52 |
| | 0.51 |
| | 0.50 |
|
Sub-grade tons milled (1) | 18 |
| | 18 |
| | 30 |
| | 40 |
|
| Sub-grade tons mill head grade (ounce per ton) | 0.16 |
| | 0.18 |
| | 0.16 |
| | 0.18 |
|
Total tons milled (1) | 287 |
| | 315 |
| | 569 |
| | 630 |
|
| Combined mill head grade (ounce per ton) | 0.51 |
| | 0.50 |
| | 0.49 |
| | 0.48 |
|
| Total mill recovery (%) | 92 |
| | 92 |
| | 91 |
| | 92 |
|
Total operating costs per ounce (Non-GAAP) (2) | $ | 374 |
| | $ | 298 |
| | $ | 400 |
| | $ | 317 |
|
Total cash costs per ounce (Non-GAAP) (2) | $ | 454 |
| | $ | 384 |
| | $ | 482 |
| | $ | 410 |
|
Total production costs per ounce (Non-GAAP) (2) | $ | 562 |
| | $ | 488 |
| | $ | 596 |
| | $ | 521 |
|
Total operating costs per ton milled (Non-GAAP) (2) | $ | 174 |
| | $ | 135 |
| | $ | 179 |
| | $ | 138 |
|
Total cash costs per ton milled (Non-GAAP) (2) | $ | 211 |
| | $ | 174 |
| | $ | 216 |
| | $ | 178 |
|
Total production costs per ton milled (Non-GAAP) (2) | $ | 261 |
| | $ | 221 |
| | $ | 266 |
| | $ | 226 |
|
Stillwater Mine: | | | | | | | |
| Ounces produced | | | | | | | |
| Palladium | 75 |
| | 84 |
| | 143 |
| | 160 |
|
| Platinum | 23 |
| | 25 |
| | 43 |
| | 48 |
|
| Total | 98 |
| | 109 |
| | 186 |
| | 208 |
|
| Tons milled | 168 |
| | 195 |
| | 340 |
| | 389 |
|
| Mill head grade (ounce per ton) | 0.63 |
| | 0.59 |
| | 0.59 |
| | 0.57 |
|
Sub-grade tons milled (1) | 10 |
| | 15 |
| | 17 |
| | 32 |
|
| Sub-grade tons mill head grade (ounce per ton) | 0.20 |
| | 0.19 |
| | 0.21 |
| | 0.20 |
|
Total tons milled (1) | 178 |
| | 210 |
| | 357 |
| | 421 |
|
| Combined mill head grade (ounce per ton) | 0.61 |
| | 0.56 |
| | 0.57 |
| | 0.54 |
|
| Total mill recovery (%) | 92 |
| | 93 |
| | 92 |
| | 92 |
|
Total operating costs per ounce (Non-GAAP) (2) | $ | 352 |
| | $ | 284 |
| | $ | 375 |
| | $ | 310 |
|
Total cash costs per ounce (Non-GAAP) (2) | $ | 426 |
| | $ | 367 |
| | $ | 451 |
| | $ | 397 |
|
Total production costs per ounce (Non-GAAP) (2) | $ | 538 |
| | $ | 476 |
| | $ | 569 |
| | $ | 514 |
|
Total operating costs per ton milled (Non-GAAP) (2) | $ | 195 |
| | $ | 148 |
| | $ | 195 |
| | $ | 153 |
|
Total cash costs per ton milled (Non-GAAP) (2) | $ | 235 |
| | $ | 190 |
| | $ | 234 |
| | $ | 196 |
|
Total production costs per ton milled (Non-GAAP) (2) | $ | 297 |
| | $ | 247 |
| | $ | 296 |
| | $ | 253 |
|
Stillwater Mining Company
Key Operating Factors (continued)
(Unaudited)
|
| | | | | | | | | | | | | | | |
| | Three Months Ended
June 30, | | Six Months Ended
June 30, |
| | 2012 | | 2011 | | 2012 | | 2011 |
| OPERATING AND COST DATA FOR MINE PRODUCTION | | | | | | | |
| (Continued) | | | | | | | |
East Boulder Mine: | | | | | | | |
| Ounces produced | | | | | | | |
| Palladium | 27 |
| | 26 |
| | 53 |
| | 51 |
|
| Platinum | 8 |
| | 8 |
| | 15 |
| | 15 |
|
| Total | 35 |
| | 34 |
| | 68 |
| | 66 |
|
| Tons milled | 101 |
| | 102 |
| | 199 |
| | 201 |
|
| Mill head grade (ounce per ton) | 0.38 |
| | 0.37 |
| | 0.38 |
| | 0.37 |
|
Sub-grade tons milled (1) | 9 |
| | 3 |
| | 13 |
| | 8 |
|
| Sub-grade tons mill head grade (ounce per ton) | 0.11 |
| | 0.11 |
| | 0.11 |
| | 0.11 |
|
Total tons milled (1) | 110 |
| | 105 |
| | 212 |
| | 209 |
|
| Combined mill head grade (ounce per ton) | 0.36 |
| | 0.36 |
| | 0.36 |
| | 0.36 |
|
| Total mill recovery (%) | 91 |
| | 90 |
| | 90 |
| | 89 |
|
Total operating costs per ounce (Non-GAAP) (2) | $ | 434 |
| | $ | 340 |
| | $ | 468 |
| | $ | 339 |
|
Total cash costs per ounce (Non-GAAP) (2) | $ | 529 |
| | $ | 442 |
| | $ | 569 |
| | $ | 450 |
|
Total production costs per ounce (Non-GAAP) (2) | $ | 628 |
| | $ | 528 |
| | $ | 670 |
| | $ | 542 |
|
Total operating costs per ton milled (Non-GAAP) (2) | $ | 140 |
| | $ | 108 |
| | $ | 151 |
| | $ | 107 |
|
Total cash costs per ton milled (Non-GAAP) (2) | $ | 171 |
| | $ | 141 |
| | $ | 184 |
| | $ | 143 |
|
Total production costs per ton milled (Non-GAAP) (2) | $ | 203 |
| | $ | 168 |
| | $ | 216 |
| | $ | 172 |
|
| |
| (1) | Sub-grade tons milled includes reef waste material only. Total tons milled includes ore tons and sub-grade tons only. See “Proven and Probable Ore Reserves – Discussion” in the Company’s 2011 Annual Report on Form 10-K for further information. |
| |
| (2) | Total operating costs include costs of mining, processing and administrative expenses at the mine site (including mine site overhead and credits for metals produced other than palladium and platinum from mine production). Total cash costs include total operating costs plus royalties, insurance and taxes other than income taxes. Total production costs include total cash costs plus asset retirement costs and depreciation and amortization. Income taxes, corporate general and administrative expenses, asset impairment write-down’s, gain or loss on disposal of property, plant and equipment, restructuring costs and interest income and expense are not included in total operating costs, total cash costs or total production costs. Operating costs per ton, operating costs per ounce, cash costs per ton, cash costs per ounce, production costs per ton and production costs per ounce are non-GAAP measurements that management uses to monitor and evaluate the efficiency of its mining operations. These measures of cost are not defined under U.S. Generally Accepted Accounting Principles (GAAP). Please see “Reconciliation of Non-GAAP Measures to Costs of Revenues” and the accompanying discussion for additional detail. |
Stillwater Mining Company
Key Operating Factors (continued)
(Unaudited)
|
| | | | | | | | | | | | | | | |
| (in thousands, except for average prices) | Three Months Ended
June 30, | | Six Months Ended
June 30, |
| | 2012 | | 2011 | | 2012 | | 2011 |
| SALES AND PRICE DATA | | | | | | | |
| Ounces sold | | | | | | | |
| Mine production: | | | | | | | |
| Palladium (oz.) | 97 |
| | 108 |
| | 193 |
| | 199 |
|
| Platinum (oz.) | 31 |
| | 29 |
| | 58 |
| | 53 |
|
| Total | 128 |
| | 137 |
| | 251 |
| | 252 |
|
PGM recycling: (1) | | | | | | | |
| Palladium (oz.) | 57 |
| | 31 |
| | 103 |
| | 57 |
|
| Platinum (oz.) | 30 |
| | 26 |
| | 60 |
| | 40 |
|
| Rhodium (oz.) | 6 |
| | 4 |
| | 13 |
| | 7 |
|
| Total | 93 |
| | 61 |
| | 176 |
| | 104 |
|
By-products from mining: (2) | | | | | | | |
| Rhodium (oz.) | 1 |
| | — |
| | 2 |
| | — |
|
| Gold (oz.) | 2 |
| | 2 |
| | 5 |
| | 4 |
|
| Silver (oz.) | 2 |
| | 1 |
| | 3 |
| | 3 |
|
| Copper (lb.) | 175 |
| | 219 |
| | 349 |
| | 394 |
|
| Nickel (lb.) | 252 |
| | 331 |
| | 541 |
| | 671 |
|
Average realized price per ounce (3) | | | | | | | |
| Mine production: | | | | | | | |
| Palladium ($/oz.) | $ | 643 |
| | $ | 752 |
| | $ | 657 |
| | $ | 767 |
|
| Platinum ($/oz.) | $ | 1,502 |
| | $ | 1,769 |
| | $ | 1,547 |
| | $ | 1,775 |
|
Combined ($/oz)(4) | $ | 850 |
| | $ | 964 |
| | $ | 862 |
| | $ | 978 |
|
PGM recycling: (1) | | | | | | | |
| Palladium ($/oz.) | $ | 680 |
| | $ | 785 |
| | $ | 664 |
| | $ | 724 |
|
| Platinum ($/oz.) | $ | 1,610 |
| | $ | 1,787 |
| | $ | 1,569 |
| | $ | 1,756 |
|
| Rhodium ($/oz) | $ | 1,413 |
| | $ | 2,381 |
| | $ | 1,500 |
| | $ | 2,336 |
|
Combined ($/oz)(4) | $ | 1,030 |
| | $ | 1,330 |
| | $ | 1,034 |
| | $ | 1,234 |
|
By-products from mining: (2) | | | | | | | |
| Rhodium ($/oz.) | $ | 1,295 |
| | $ | 1,981 |
| | $ | 1,378 |
| | $ | 1,981 |
|
| Gold ($/oz.) | $ | 1,594 |
| | $ | 1,508 |
| | $ | 1,644 |
| | $ | 1,444 |
|
| Silver ($/oz.) | $ | 29 |
| | $ | 39 |
| | $ | 31 |
| | $ | 35 |
|
| Copper ($/lb.) | $ | 3.35 |
| | $ | 3.97 |
| | $ | 3.48 |
| | $ | 4.06 |
|
| Nickel ($/lb.) | $ | 6.52 |
| | $ | 10.00 |
| | $ | 7.11 |
| | $ | 10.28 |
|
Average market price per ounce (3) | | | | | | | |
| Palladium ($/oz.) | $ | 628 |
| | $ | 759 |
| | $ | 656 |
| | $ | 775 |
|
| Platinum ($/oz.) | $ | 1,499 |
| | $ | 1,781 |
| | $ | 1,555 |
| | $ | 1,787 |
|
Combined ($/oz)(4) | $ | 838 |
| | $ | 972 |
| | $ | 863 |
| | $ | 987 |
|
| |
| (1) | Ounces sold and average realized price per ounce from PGM recycling relate to ounces produced from processing of catalyst materials. |
| |
| (2) | By-product metals sold reflect contained metal. Realized prices reflect net values (discounted due to product form and transportation and marketing charges) per unit received. |
| |
| (3) | The Company’s average realized price represents revenues, which include the effect of hedging gains and losses realized on commodity instruments and agreement discounts, divided by ounces sold. The average market price represents the average London Bullion Market Association afternoon postings for the actual months of the period. |
| |
| (4) | The Company reports a combined average realized and a combined average market price of palladium and platinum at the same ratio as ounces that are produced from the base metal refinery. |
Reconciliation of Non-GAAP Measures to Costs of Revenues
The Company utilizes certain non-GAAP measures as indicators in assessing the performance of its mining and processing operations during any period. Because of the processing time required to complete the extraction of finished PGM products, there are typically lags of one to three months between ore production and sale of the finished product. Sales in any period include some portion of material mined and processed from prior periods as the revenue recognition process is completed. Consequently, while costs of revenues (a GAAP measure included in the Company’s Consolidated Statement of Operations and Comprehensive Income) appropriately reflects the expense associated with the materials sold in any period, the Company has developed certain non-GAAP measures to assess the costs associated with its producing and processing activities in a particular period and to compare those costs between periods.
While the Company believes that these non-GAAP measures may also be of value to outside readers, both as general indicators of the Company’s mining efficiency from period to period and as insight into how the Company internally measures its operating performance, these non-GAAP measures are not standardized across the mining industry and in most cases will not be directly comparable to similar measures that may be provided by other companies. These non-GAAP measures are only useful as indicators of relative operational performance in any period, and because they do not take into account the inventory timing differences that are included in costs of revenues, they cannot meaningfully be used to develop measures of earnings or profitability. A reconciliation of these measures to costs of revenues for each period shown is provided as part of the following tables, and a description of each non-GAAP measure is provided below.
Total Costs of Revenues: For the Company as a whole, this measure is equal to total costs of revenues, as reported in the Consolidated Statement of Operations and Comprehensive Income. For the Stillwater Mine, the East Boulder Mine, and other PGM activities, the Company segregates the expenses within total costs of revenues that are directly associated with each of these activities and then allocates the remaining facility costs included in total cost of revenues in proportion to the monthly volumes from each activity. The resulting total costs of revenues measures for the Stillwater Mine, the East Boulder Mine and other PGM activities are equal in total to total costs of revenues as reported in the Company’s Consolidated Statement of Operations and Comprehensive Income.
Total Production Costs (Non-GAAP): Calculated as total costs of revenues (for each mine or combined) adjusted to exclude gains or losses on asset dispositions, costs and profit from recycling activities, revenues from the sale of mined by-products and timing differences resulting from changes in product inventories. This non-GAAP measure provides a comparative measure of the total costs incurred in association with production and processing activities in a period, and may be compared to prior periods or between the Company’s mines.
When divided by the total tons milled in the respective period, Total Production Cost per Ton Milled (Non-GAAP) – measured for each mine or combined – provides an indication of the cost per ton milled in that period. Because of variability of ore grade in the Company’s mining operations, production efficiency underground is frequently measured against ore tons produced rather than contained PGM ounces. Because ore tons are first actually weighed as they are fed into the mill, mill feed is the first point at which production tons are measured precisely. Consequently, Total Production Cost per Ton Milled (Non-GAAP) is a general measure of production efficiency, and is affected both by the level of Total Production Costs (Non-GAAP) and by the volume of tons produced and fed to the mill.
When divided by the total recoverable PGM ounces from production in the respective period, Total Production Cost per Ounce (Non-GAAP) – measured for each mine or combined – provides an indication of the cost per ounce produced in that period. Recoverable PGM ounces from production are an indication of the amount of PGM product extracted through mining in any period. Because extracting PGM material is ultimately the objective of mining, the cost per ounce of extracting and processing PGM ounces in a period is a useful measure for comparing extraction efficiency between periods and between the Company’s mines. Consequently, Total Production Cost per Ounce (Non-GAAP) in any period is a general measure of extraction efficiency, and is affected by the level of Total Production Costs (Non-GAAP), by the grade of the ore produced and by the volume of ore produced in the period.
Total Cash Costs (Non-GAAP): This non-GAAP measure is calculated by excluding the depreciation and amortization and asset retirement costs from Total Production Costs (Non-GAAP) for each mine or combined. The Company uses this measure as a comparative indication of the cash costs related to production and processing in any period.
When divided by the total tons milled in the respective period, Total Cash Cost per Ton Milled (Non-GAAP) – measured for each mine or combined – provides an indication of the level of cash costs incurred per ton milled in that period. Because of variability of ore grade in the Company’s mining operations, production efficiency underground is frequently measured against ore tons produced rather than contained PGM ounces. Because ore tons are first weighed as they are fed into the mill, mill feed is the first point at which production tons are measured precisely. Consequently, Total Cash Cost per Ton
Milled (Non-GAAP) is a general measure of production efficiency, and is affected both by the level of Total Cash Costs (Non-GAAP) and by the volume of tons produced and fed to the mill.
When divided by the total recoverable PGM ounces from production in the respective period, Total Cash Cost per Ounce (Non-GAAP) – measured for each mine or combined – provides an indication of the level of cash costs incurred per PGM ounce produced in that period. Recoverable PGM ounces from production are an indication of the amount of PGM product extracted through mining in any period. Because ultimately extracting PGM material is the objective of mining, the cash cost per ounce of extracting and processing PGM ounces in a period is a useful measure for comparing extraction efficiency between periods and between the Company’s mines. Consequently, Total Cash Cost per Ounce (Non-GAAP) in any period is a general measure of extraction efficiency, and is affected by the level of Total Cash Costs (Non-GAAP), by the grade of the ore produced and by the volume of ore produced in the period.
Total Operating Costs (Non-GAAP): This non-GAAP measure is derived from Total Cash Costs (Non-GAAP) for each mine or combined by excluding royalty, tax and insurance expenses from Total Cash Costs (Non-GAAP). Royalties, taxes and insurance costs are contractual or governmental obligations outside of the control of the Company’s mining operations, and in the case of royalties and most taxes, are driven more by the level of sales realizations rather than by operating efficiency. Consequently, Total Operating Costs (Non-GAAP) is a useful indicator of the level of production and processing costs incurred in a period that are under the control of mining operations.
When divided by the total tons milled in the respective period, Total Operating Cost per Ton Milled (Non-GAAP) – measured for each mine or combined – provides an indication of the level of controllable cash costs incurred per ton milled in that period. Because of variability of ore grade in the Company’s mining operations, production efficiency underground is frequently measured against ore tons produced rather than contained PGM ounces. Because ore tons are first actually weighed as they are fed into the mill, mill feed is the first point at which production tons are measured precisely. Consequently, Total Operating Cost per Ton Milled (Non-GAAP) is a general measure of production efficiency, and is affected both by the level of Total Operating Costs (Non-GAAP) and by the volume of tons produced and fed to the mill.
When divided by the total recoverable PGM ounces from production in the respective period, Total Operating Cost per Ounce (Non-GAAP) – measured for each mine or combined – provides an indication of the level of controllable cash costs incurred per PGM ounce produced in that period. Recoverable PGM ounces from production are an indication of the amount of PGM product extracted through mining in any period. Because ultimately extracting PGM material is the objective of mining, the cost per ounce of extracting and processing PGM ounces in a period is a useful measure for comparing extraction efficiency between periods and between the Company’s mines. Consequently, Total Operating Cost per Ounce (Non-GAAP) in any period is a general measure of extraction efficiency, and is affected by the level of Total Operating Costs (Non-GAAP), by the grade of the ore produced and by the volume of ore produced in the period.
Reconciliation of Non-GAAP Measures to Costs of Revenues
|
| | | | | | | | | | | | | | | |
| | Three Months Ended
June 30, | | Six Months Ended
June 30, |
| (in thousands) | 2012 | | 2011 | | 2012 | | 2011 |
| Consolidated: | | | | | | | |
| Reconciliation to consolidated costs of revenues: | | | | | | |
Total operating costs (Non-GAAP) | $ | 49,915 |
| | $ | 42,454 |
| | $ | 101,743 |
| | $ | 86,754 |
|
| Royalties, taxes and other | 10,612 |
| | 12,380 |
| | 20,915 |
| | 25,428 |
|
Total cash costs (Non-GAAP) | $ | 60,527 |
| | $ | 54,834 |
| | $ | 122,658 |
| | $ | 112,182 |
|
| Asset retirement costs | 157 |
| | 144 |
| | 311 |
| | 285 |
|
| Depletion, depreciation and amortization | 14,601 |
| | 15,395 |
| | 29,005 |
| | 31,196 |
|
| Depletion, depreciation and amortization (in inventory) | (294 | ) | | (773 | ) | | (358 | ) | | (1,090 | ) |
Total production costs (Non-GAAP) | $ | 74,991 |
| | $ | 69,600 |
| | $ | 151,616 |
| | $ | 142,573 |
|
| Change in product inventories | 3,554 |
| | (716 | ) | | 3,737 |
| | (8,211 | ) |
| Cost of PGM recycling | 93,149 |
| | 79,552 |
| | 177,264 |
| | 124,706 |
|
| PGM recycling – depreciation | 261 |
| | 265 |
| | 529 |
| | 527 |
|
| Add: Profit from by-products | 7,229 |
| | 8,005 |
| | 16,351 |
| | 15,539 |
|
| Add: Profit from PGM recycling | 3,823 |
| | 3,600 |
| | 6,326 |
| | 6,639 |
|
| Total consolidated costs of revenues | $ | 183,007 |
| | $ | 160,306 |
| | $ | 355,823 |
| | $ | 281,773 |
|
| Stillwater Mine: | | | | | | | |
| Reconciliation to costs of revenues: | | | | | | | |
Total operating costs (Non-GAAP) | $ | 34,566 |
| | $ | 30,967 |
| | $ | 69,692 |
| | $ | 64,277 |
|
| Royalties, taxes and other | 7,230 |
| | 8,963 |
| | 14,054 |
| | 18,035 |
|
Total cash costs (Non-GAAP) | $ | 41,796 |
| | $ | 39,930 |
| | $ | 83,746 |
| | $ | 82,312 |
|
| Asset retirement costs | 145 |
| | 133 |
| | 288 |
| | 264 |
|
| Depletion, depreciation and amortization | 11,067 |
| | 12,169 |
| | 22,237 |
| | 24,156 |
|
| Depletion, depreciation and amortization (in inventory) | (228 | ) | | (443 | ) | | (484 | ) | | (124 | ) |
Total production costs (Non-GAAP) | $ | 52,780 |
| | $ | 51,789 |
| | $ | 105,787 |
| | $ | 106,608 |
|
| Change in product inventories | 2,040 |
| | (590 | ) | | 3,294 |
| | (7,210 | ) |
| Add: Profit from by-products | 4,636 |
| | 5,244 |
| | 10,602 |
| | 9,884 |
|
| Add: Profit from PGM recycling | 2,803 |
| | 2,732 |
| | 4,615 |
| | 5,020 |
|
| Total costs of revenues | $ | 62,259 |
| | $ | 59,175 |
| | $ | 124,298 |
| | $ | 114,302 |
|
| East Boulder Mine: | | | | | | | |
| Reconciliation to costs of revenues: | | | | | | | |
Total operating costs (Non-GAAP) | $ | 15,349 |
| | $ | 11,487 |
| | $ | 32,052 |
| | $ | 22,477 |
|
| Royalties, taxes and other | 3,382 |
| | 3,417 |
| | 6,860 |
| | 7,393 |
|
Total cash costs (Non-GAAP) | $ | 18,731 |
| | $ | 14,904 |
| | $ | 38,912 |
| | $ | 29,870 |
|
| Asset retirement costs | 12 |
| | 11 |
| | 23 |
| | 21 |
|
| Depletion, depreciation and amortization | 3,534 |
| | 3,226 |
| | 6,769 |
| | 7,040 |
|
| Depletion, depreciation and amortization (in inventory) | (66 | ) | | (330 | ) | | 125 |
| | (966 | ) |
Total production costs (Non-GAAP) | $ | 22,211 |
| | $ | 17,811 |
| | $ | 45,829 |
| | $ | 35,965 |
|
| Change in product inventories | 1,514 |
| | (126 | ) | | 443 |
| | (1,001 | ) |
| Add: Profit from by-products | 2,593 |
| | 2,761 |
| | 5,749 |
| | 5,655 |
|
| Add: Profit from PGM recycling | 1,020 |
| | 868 |
| | 1,711 |
| | 1,619 |
|
| Total costs of revenues | $ | 27,338 |
| | $ | 21,314 |
| | $ | 53,732 |
| | $ | 42,238 |
|
| PGM Recycling | | | | | | | |
| Reconciliation to costs of revenues: | | | | �� | | | |
| PGM recycling – depreciation | 261 |
| | 265 |
| | 529 |
| | 527 |
|
| Cost of PGM recycling | 93,149 |
| | 79,552 |
| | 177,264 |
| | 124,706 |
|
| Total costs of revenues | $ | 93,410 |
| | $ | 79,817 |
| | $ | 177,793 |
| | $ | 125,233 |
|
ITEM 3
QUANTITATIVE AND QUALITATIVE DISCLOSURE ABOUT MARKET RISK
The Company is exposed to market risk, including the effects of adverse changes in metal prices, interest rates and foreign currencies as discussed below.
Commodity Price Risk
The Company produces and sells palladium, platinum and associated by-product metals directly to its customers and also through third parties. As a result, financial performance can be materially affected when prices for these commodities fluctuate. In order to manage commodity price risk and to reduce the impact of fluctuation in prices, the Company has entered into long-term supply agreements with suppliers and customers, from time to time has employed various derivative financial instruments and attempts to maintain adequate liquidity to sustain operations during a downturn in PGM prices. Because the Company hedges only with instruments that have a high correlation with the value of the hedged transactions, changes in the fair value of the derivatives are expected to be highly effective in offsetting changes in the value of the hedged transaction.
The Company entered into a three-year supply agreement with General Motors Corporation (GM) effective January 1, 2011, that provides for fixed quantities of palladium to be delivered to GM each month. The agreement provides for pricing at a small discount to a trailing monthly average market price. The Company also is party to one-year agreements with Ford Motor Company, Johnson Matthey and Tiffany and Co. containing pricing and volume provisions structured similarly to the GM agreement.
The Company customarily enters into fixed forward sales and, rarely, financially settled forward sales transactions that may or may not be accounted for as cash-flow hedges to mitigate the price risk in its PGM recycling and mine production activities. Under these fixed forward transactions, typically metals contained in the spent catalytic materials are sold forward at the time the materials are purchased and then are delivered against the fixed forward contracts when the finished ounces are recovered. The Company believes such fixed forward sales transactions qualify for the exception to hedge accounting treatment provided for in the accounting literature and so has elected to account for these transactions as normal purchases and normal sales. (Financially settled forward contracts are settled net for cash, and therefore they do not qualify for this accounting treatment.)
Interest Rate Risk
At June 30, 2012, all of the Company’s outstanding long-term debt was subject to fixed rates of interest. Interest income on payments to the Company’s recycling suppliers is generally linked to short-term inter-bank rates. Undrawn letters of credit issued under the Company's revolving credit facility carry a fixed contractual rate of interest, although any cash drawings against the facility would be subject to a floating interest rate.
The Company’s convertible debentures and industrial revenue bonds do not contain financial covenants, other than change in control protection and, in the case of the convertible debentures, investor make-whole provisions. The Company’s asset-backed revolving credit facility includes a single fixed-charge coverage covenant that only takes effect when less than 30% of the total borrowing capacity under the line remains available. Because there were no drawings and only $5.3 million of undrawn letters of credit issued under the revolving credit facility at June 30, 2012, the Company is not constrained by conventional financial covenants at this time.
Foreign Currency Risk
With the acquisition of the Marathon assets in Canada late in 2010, the Company first gained some modest exposure to fluctuations in the exchange rate between the Canadian dollar and the U.S. dollar. Similarly, the Peregrine acquisition has created some initial minor exposure to Canadian, Argentine and other foreign currencies. While these exposures currently are limited to foreign cash deposits and expenses incurred for the services of a few foreign-based employees and contractors, along with some associated support costs, as the Company’s foreign commitments expand in the future, the exposure will become more material. The Company does not generally hedge this exposure at present, but may consider doing so in the future as the scale of its foreign operations grows. During the second quarter of 2012, the Company recorded a foreign currency transaction gain of $4.4 million related to the deferred tax liability recorded in association with the acquisition of Peregrine Metals Ltd. The gain was a result of the strengthening of the U.S. dollar in comparison with the Argentine peso. As the deferred tax obligation will be settled at a future date in pesos, changes in the relative currency values are recognized in the period within transaction gain/loss on the consolidated statement of operations.
ITEM 4
CONTROLS AND PROCEDURES
| |
| (a) | Disclosure Controls and Procedures. |
The Company’s management, with the participation of the Company’s Chief Executive Officer and Chief Financial Officer, has evaluated the effectiveness of the Company’s disclosure controls and procedures (as such term is defined in Rules 13a-15(e) and 15d-15(e) under the Securities Exchange Act of 1934, as amended (the “Exchange Act”)) as of the end of the period covered by this report. Based on such evaluation, the Company’s Chief Executive Officer and Chief Financial Officer have concluded that, as of the end of such period, the Company’s disclosure controls and procedures are effective in recording, processing, summarizing and reporting, on a timely basis, information required to be disclosed by the Company in the reports that it files or submits under the Exchange Act.
Management believes, to the best of its knowledge, that (i) this report does not contain any untrue statement of a material fact or omit to state any material fact necessary to make the statements complete, accurate and not misleading, and (ii) the financial statements, and other financial information included in this report, fairly present in all material respects the Company’s financial condition, results of operations and cash flows as of, and for, the periods represented in this report.
In designing and evaluating the Company’s disclosure controls and procedures, management recognized that disclosure controls and procedures, no matter how well conceived and well operated, can provide only reasonable, not absolute, assurance that the objectives of the disclosure controls and procedures are met. Additionally, in designing disclosure controls and procedures, the Company’s management necessarily was required to apply its judgment in evaluating the cost-benefit relationship of possible disclosure controls and procedures. The Company also designed disclosure controls and procedures based in part upon assumptions about the likelihood of future events, and there can be no assurance that any design will succeed in achieving its stated goals under all potential future conditions.
| |
| (b) | Internal Control Over Financial Reporting. |
In reviewing internal control over financial reporting as of June 30, 2012, management determined that during the second quarter of 2012 there have not been any changes in the Company’s internal control over financial reporting (as such term is defined in Rules 13a-15(f) and 15d-15(f) under the Exchange Act) that have materially affected, or are reasonably likely to materially affect, the Company’s internal control over financial reporting.
PART II – OTHER INFORMATION
ITEM 1
LEGAL PROCEEDINGS
The Company is involved in various claims and legal actions arising in the ordinary course of business, primarily employee lawsuits. In the opinion of management, the ultimate disposition of these matters is not expected to have a material adverse effect on the Company’s consolidated financial position, results of operations or liquidity.
For further information on legal guarantees and indemnities, see Note 19 “Commitments and Contingencies” in the Company’s audited consolidated financial statements as presented in the Company’s 2011 Annual Report on Form 10-K.
ITEM 1A
RISK FACTORS
The Company filed its Annual Report on Form 10-K for the year ended December 31, 2011 with the Securities and Exchange Commission on February 23, 2012, which sets forth its risk factors in Item 1A therein. As of the date of this filing, the Company has not experienced any material changes to the risk factors previously described therein.
ITEM 4
MINE SAFETY DISCLOSURES
The Company continually works to establish and maintain a multi-faceted “culture of safety,” summarized by the slogan, “Everyone goes home safe every day.” The established Company safety programs include incident tracking and analysis, near miss reporting, workplace start-of-shift inspection checklists, team safety meetings, annual refresher training, safety stand-downs and financial incentives for working safely. The Company also works closely with Mine Safety and Health Administration inspectors to act on their findings and incorporate their suggestions. Management also strives to maintain a consistent “tone at the top” that gives working safely priority over all other Company objectives.
Under the recently enacted Dodd-Frank Act, each operator of a coal or other mine is required to include certain mine safety results within its periodic reports filed with the Securities and Exchange Commission. In accordance with the reporting requirements included in Section 1503(a) of the Dodd-Frank Wall Street Reform and Consumer Protection Act and Item 104 of Regulation S-K (17 CFR 229.104), the required mine safety results regarding certain mining safety and health matters for each of the Company’s mine locations that are covered under the scope of the Dodd-Frank Act are included in Exhibit 95 of the 2011 Annual Report on Form 10-K. In the second quarter of 2012, the Company received a total of 30 violations of mandatory health or safety standards that could significantly and substantially contribute to the cause and effect of a mine safety or health hazard under section 104 of the Federal Mine Safety and Health Act. See Exhibit 95 “Mine Safety Disclosures” included in this quarterly report for more information.
ITEM 6
EXHIBITS
See attached exhibit index
SIGNATURES
Pursuant to the requirements of the Securities Exchange Act of 1934, the registrant has duly caused this report to be signed on its behalf by the undersigned thereunto duly authorized.
|
| | | | | |
| | | STILLWATER MINING COMPANY |
| | | | | | (Registrant) |
| | | | | | |
| Date: | August 8, 2012 | | | | |
| | | | By: | | /s/ Francis R. McAllister |
| | | | | | Francis R. McAllister |
| | | | | | Chairman and Chief Executive Officer |
| | | | | | (Principal Executive Officer) |
| | | | | | |
| Date: | August 8, 2012 | | | | |
| | | | By: | | /s/ Gregory A. Wing |
| | | | | | Gregory A. Wing |
| | | | | | Vice President and Chief Financial Officer |
| | | | | | (Principal Financial Officer) |
EXHIBITS
|
| | |
| Number | | Description |
| | |
| 31.1 | | Rule 13a-14(a)/15d-14(a) Certification – Chief Executive Officer, dated, August 8, 2012 |
| | |
| 31.2 | | Rule 13a-14(a)/15d-14(a) Certification – Vice President and Chief Financial Officer, dated, August 8, 2012 |
| | |
| 32.1 | | Section 1350 Certification, dated, August 8, 2012 |
| | |
| 32.2 | | Section 1350 Certification, dated, August 8, 2012 |
| | |
| 95.0 | | Mine Safety Disclosures |
| | |
| 101.INS | | XBRL Instance Document |
| | | |
| 101.SCH | | XBRL Schema Document |
| | | |
| 101.CAL | | XBRL Calculation Linkbase Document |
| | | |
| 101.DEF | | XBRL Definition Linkbase Document |
| | | |
| 101.LAB | | XBRL Labels Linkbase Document |
| | | |
| 101.PRE | | XBRL Presentation Linkbase Document |