UNITED STATES
SECURITIES AND EXCHANGE COMMISSION
Washington, D.C. 20549
FORM 10-Q
ý Quarterly Report Pursuant to Section 13 or 15(d) of the Securities Exchange Act of 1934
For the quarterly period ended September 30, 2012.
OR
o Transition Report Pursuant to Section 13 or 15(d) of the Securities Exchange Act of 1934
For the transition period from to
Commission file number 1-13053
STILLWATER MINING COMPANY
(Exact name of registrant as specified in its charter)
| Delaware | 81-0480654 | |
(State or other jurisdiction of incorporation or organization) | (I.R.S. Employer Identification No.) | |
1321 DISCOVERY DRIVE, BILLINGS, MONTANA 59102
(Address of principal executive offices and zip code)
(406) 373-8700
(Registrant’s telephone number, including area code)
Indicate by check mark whether the registrant: (1) has filed all reports required to be filed by Section 13 or 15(d) of the Securities Exchange Act of 1934 during the preceding 12 months (or for such shorter period that the registrant was required to file such reports), and (2) has been subject to such filing requirements for the past 90 days: YES ý NO o
Indicate by check mark whether the registrant has submitted electronically and posted on its corporate Web site, if any, every Interactive Data File required to be submitted and posted pursuant to Rule 405 of Regulation S-T (§232.405 of this chapter) during the preceding 12 months (or for such shorter period that the registrant was required to submit and post such files). YES ý NO o
Indicate by check mark whether the registrant is a large accelerated filer, an accelerated filer, a non-accelerated filer, or a smaller reporting company. See definitions of “large accelerated filer,” “accelerated filer” and “smaller reporting company” in Rule 12b-2 of the Exchange Act. (Check one).
| Large Accelerated Filer | ý | Accelerated Filer | ¨ | |||
| Non-Accelerated Filer | ¨ | Smaller reporting company | ¨ | |||
Indicate by check mark whether the registrant is a shell company (as defined in Rule 12b-2 of the Exchange Act)
YES o NO ý
At October 26, 2012, the Company had outstanding 116,813,300 shares of common stock, par value $0.01 per share.
STILLWATER MINING COMPANY
FORM 10-Q
QUARTER ENDED SEPTEMBER 30, 2012
INDEX
| Item 1. | ||
| Item 2. | ||
| Item 3. | ||
| Item 4. | ||
| Item 1. | ||
| Item 1A. | ||
| Item 4. | ||
| Item 6. | ||
| CERTIFICATIONS | ||
2
PART I – FINANCIAL INFORMATION
ITEM 1
CONSOLIDATED FINANCIAL STATEMENTS
Stillwater Mining Company
Consolidated Statements of Operations and Comprehensive Income
(Unaudited)
(in thousands, except per share data)
| Three Months Ended September 30, | Nine Months Ended September 30, | ||||||||||||||
| 2012 | 2011 | 2012 | 2011 | ||||||||||||
| Revenues | |||||||||||||||
| Mine production | $ | 107,057 | $ | 145,033 | $ | 339,951 | $ | 406,746 | |||||||
| PGM recycling | 73,987 | 107,477 | 256,919 | 238,430 | |||||||||||
| Other | — | 1,142 | — | 1,142 | |||||||||||
| Total revenues | 181,044 | 253,652 | 596,870 | 646,318 | |||||||||||
| Costs and expenses | |||||||||||||||
| Costs of metals sold | |||||||||||||||
| Mine production | 69,910 | 71,006 | 218,935 | 196,350 | |||||||||||
| PGM recycling | 72,096 | 103,336 | 249,360 | 228,042 | |||||||||||
| Other | — | 1,141 | — | 1,141 | |||||||||||
| Total costs of metals sold | 142,006 | 175,483 | 468,295 | 425,533 | |||||||||||
| Depletion, depreciation and amortization | |||||||||||||||
| Mine production | 13,843 | 15,359 | 42,848 | 46,555 | |||||||||||
| PGM recycling | 264 | 269 | 793 | 796 | |||||||||||
| Total depletion, depreciation and amortization | 14,107 | 15,628 | 43,641 | 47,351 | |||||||||||
| Total costs of revenues | 156,113 | 191,111 | 511,936 | 472,884 | |||||||||||
| Exploration | 1,668 | 290 | 13,785 | 365 | |||||||||||
| Marketing | 1,886 | 4,337 | 7,874 | 7,990 | |||||||||||
| Research and development | 82 | 525 | 864 | 1,605 | |||||||||||
| General and administrative | 9,882 | 13,149 | 32,477 | 29,404 | |||||||||||
| Abandonment of non-producing property | — | — | 2,835 | — | |||||||||||
| Loss on long-term investments | 1,697 | — | 1,697 | — | |||||||||||
| (Gain)/Loss on disposal of property, plant and equipment | 71 | 84 | 363 | (142 | ) | ||||||||||
| Total costs and expenses | 171,399 | 209,496 | 571,831 | 512,106 | |||||||||||
| Operating income | 9,645 | 44,156 | 25,039 | 134,212 | |||||||||||
| Other income/(expense) | |||||||||||||||
| Other | 82 | 14 | 667 | 26 | |||||||||||
| Interest income | 271 | 1,106 | 1,706 | 2,839 | |||||||||||
| Interest expense | (1,493 | ) | (1,635 | ) | (4,361 | ) | (4,907 | ) | |||||||
| Foreign currency transaction gain/(loss) | 6,605 | (142 | ) | 13,314 | 40 | ||||||||||
| Income before income tax provision | 15,110 | 43,499 | 36,365 | 132,210 | |||||||||||
| Income tax provision | (2,418 | ) | (2,758 | ) | (3,405 | ) | (12,579 | ) | |||||||
| Net income | $ | 12,692 | $ | 40,741 | $ | 32,960 | $ | 119,631 | |||||||
| Net loss attributable to noncontrolling interest | (304 | ) | — | (675 | ) | — | |||||||||
| Net income attributable to common stockholders | $ | 12,996 | $ | 40,741 | $ | 33,635 | $ | 119,631 | |||||||
| Other comprehensive income/(loss), net of tax | |||||||||||||||
| Net unrealized gains/(losses) on securities available for sale | 421 | (235 | ) | 620 | (339 | ) | |||||||||
| Comprehensive income attributable to common stockholders | $ | 13,417 | $ | 40,506 | $ | 34,255 | $ | 119,292 | |||||||
| Comprehensive income attributable to noncontrolling interest | (304 | ) | — | (675 | ) | — | |||||||||
| Total comprehensive income | $ | 13,113 | $ | 40,506 | $ | 33,580 | $ | 119,292 | |||||||
| Weighted average common shares outstanding | |||||||||||||||
| Basic | 116,377 | 103,114 | 115,918 | 102,831 | |||||||||||
| Diluted | 117,145 | 111,118 | 116,847 | 110,967 | |||||||||||
| Basic earnings per share attributable to common stockholders | $ | 0.11 | $ | 0.40 | $ | 0.29 | $ | 1.16 | |||||||
| Diluted earnings per share attributable to common stockholders | $ | 0.11 | $ | 0.37 | $ | 0.29 | $ | 1.10 | |||||||
See accompanying notes to consolidated financial statements
3
Stillwater Mining Company
Consolidated Balance Sheets
(Unaudited)
(in thousands, except share and per share data)
| September 30, 2012 | December 31, 2011 | ||||||
| ASSETS | |||||||
| Cash and cash equivalents | $ | 198,475 | $ | 109,097 | |||
| Investments, at fair market value | 76,252 | 49,533 | |||||
| Inventories | 125,495 | 131,856 | |||||
| Trade receivables | 9,915 | 6,188 | |||||
| Deferred income taxes | 20,154 | 19,819 | |||||
| Other current assets | 11,013 | 9,433 | |||||
| Total current assets | 441,304 | 325,926 | |||||
| Mineral properties | 600,751 | 596,686 | |||||
| Property, plant and equipment, net of $480,083 and $436,612 of accumulated depletion, depreciation and amortization | 403,354 | 367,727 | |||||
| Restricted cash | 9,245 | 25,070 | |||||
| Other noncurrent assets | 9,843 | 11,915 | |||||
| Total assets | $ | 1,464,497 | $ | 1,327,324 | |||
| LIABILITIES AND STOCKHOLDERS’ EQUITY | |||||||
| Accounts payable | $ | 25,894 | $ | 26,880 | |||
| Accrued compensation and benefits | 30,028 | 27,573 | |||||
| Property, production and franchise taxes payable | 12,973 | 14,071 | |||||
| Current portion of long-term debt and capital lease obligations | 168,407 | — | |||||
| Income taxes payable | — | 1,235 | |||||
| Other current liabilities | 4,344 | 4,576 | |||||
| Total current liabilities | 241,646 | 74,335 | |||||
| Long-term debt and capital lease obligations | 34,907 | 196,046 | |||||
| Deferred income taxes | 181,516 | 193,884 | |||||
| Accrued workers compensation | 6,546 | 6,056 | |||||
| Asset retirement obligation | 7,801 | 7,331 | |||||
| Other noncurrent liabilities | 7,828 | 5,704 | |||||
| Total liabilities | 480,244 | 483,356 | |||||
| Equity | |||||||
| Stockholders’ equity | |||||||
| Preferred stock, $0.01 par value, 1,000,000 shares authorized; none issued | — | — | |||||
| Common stock, $0.01 par value, 200,000,000 shares authorized; 116,756,413 and 115,375,604 shares issued and outstanding | 1,168 | 1,154 | |||||
| Paid-in capital | 932,351 | 878,050 | |||||
| Accumulated deficit | (640 | ) | (34,275 | ) | |||
| Accumulated other comprehensive loss | (341 | ) | (961 | ) | |||
| Total stockholders’ equity | 932,538 | 843,968 | |||||
| Noncontrolling interest | 51,715 | — | |||||
| Total equity | 984,253 | 843,968 | |||||
| Total liabilities and stockholders’ equity | $ | 1,464,497 | $ | 1,327,324 | |||
See accompanying notes to consolidated financial statements
4
Stillwater Mining Company
Consolidated Statements of Cash Flows
(Unaudited)
(in thousands)
| Three Months Ended September 30, | Nine Months Ended September 30, | ||||||||||||||
| 2012 | 2011 | 2012 | 2011 | ||||||||||||
| Cash flows from operating activities | |||||||||||||||
| Net income | $ | 12,692 | $ | 40,741 | $ | 32,960 | $ | 119,631 | |||||||
| Adjustments to reconcile net income to net cash provided by operating activities: | |||||||||||||||
| Depletion, depreciation and amortization | 14,107 | 15,628 | 43,641 | 47,351 | |||||||||||
| (Gain)/Loss on disposal of property, plant and equipment | 71 | 84 | 363 | (142 | ) | ||||||||||
| Loss on long-term investments | 1,697 | — | 1,697 | — | |||||||||||
| Foreign currency transaction (gain) | (6,094 | ) | — | (12,703 | ) | — | |||||||||
| Abandonment of non-producing property | — | — | 2,835 | — | |||||||||||
| Accretion of asset retirement obligation | 160 | 147 | 470 | 433 | |||||||||||
| Amortization of debt issuance costs | 315 | 246 | 944 | 737 | |||||||||||
| Share based compensation and other benefits | 5,013 | 3,284 | 12,899 | 9,073 | |||||||||||
| Changes in operating assets and liabilities: | |||||||||||||||
| Inventories | (3,700 | ) | (23,267 | ) | 6,221 | (78,836 | ) | ||||||||
| Trade receivables | (1,347 | ) | 692 | (3,727 | ) | 299 | |||||||||
| Accrued compensation and benefits | 1,162 | (350 | ) | 2,258 | 3,992 | ||||||||||
| Accounts payable | 1,064 | 3,374 | (1,270 | ) | 8,018 | ||||||||||
| Property, production and franchise taxes payable | 634 | 1,232 | 1,041 | 4,176 | |||||||||||
| Income taxes payable | 1,880 | (7,242 | ) | (1,235 | ) | 2,579 | |||||||||
| Workers compensation | (12 | ) | 304 | 490 | (250 | ) | |||||||||
| Restricted cash | 15,750 | — | 15,825 | 3,000 | |||||||||||
| Other | 1,674 | 333 | (2,275 | ) | 7,829 | ||||||||||
| Net cash provided by operating activities | 45,066 | 35,206 | 100,434 | 127,890 | |||||||||||
| Cash flows from investing activities | |||||||||||||||
| Capital expenditures | (25,375 | ) | (27,937 | ) | (84,688 | ) | (74,232 | ) | |||||||
| Purchase of long-term investment | — | — | — | (616 | ) | ||||||||||
| Proceeds from disposal of property, plant and equipment | 12 | 9 | 39 | 236 | |||||||||||
| Purchases of investments | (36,399 | ) | (7,571 | ) | (68,286 | ) | (105,667 | ) | |||||||
| Proceeds from maturities of investments | 18,454 | 67,380 | 42,003 | 204,397 | |||||||||||
| Net cash (used in) provided by investing activities | (43,308 | ) | 31,881 | (110,932 | ) | 24,118 | |||||||||
| Cash flows from financing activities | |||||||||||||||
| Proceeds from sale of noncontrolling interest, net of transaction costs | — | — | 93,821 | — | |||||||||||
| Issuance of long-term debt | — | — | 7,176 | — | |||||||||||
| Payments on long term debt and capital lease obligations | (451 | ) | — | (946 | ) | — | |||||||||
| Payments for debt issuance costs | — | — | (219 | ) | — | ||||||||||
| Issuance of common stock | 11 | 60 | 44 | 785 | |||||||||||
| Net cash (used in) provided by financing activities | (440 | ) | 60 | 99,876 | 785 | ||||||||||
| Cash and cash equivalents | |||||||||||||||
| Net increase | 1,318 | 67,147 | 89,378 | 152,793 | |||||||||||
| Balance at beginning of period | 197,157 | 105,009 | 109,097 | 19,363 | |||||||||||
| Balance at end of period | $ | 198,475 | $ | 172,156 | $ | 198,475 | $ | 172,156 | |||||||
See accompanying notes to consolidated financial statements
5
Stillwater Mining Company
Notes to Consolidated Financial Statements
(Unaudited)
NOTE 1
GENERAL
In the opinion of management, the accompanying unaudited consolidated financial statements contain all adjustments (consisting only of normal recurring adjustments) necessary to present fairly the financial position of Stillwater Mining Company (the “Company”) as of September 30, 2012, and the results of its operations and its cash flows for the three- and nine- month periods ended September 30, 2012 and 2011. The results of operations for the first nine months of 2012 are not necessarily indicative of the results to be expected for the full year. The accompanying consolidated financial statements in this quarterly report should be read in conjunction with the consolidated financial statements and notes thereto included in the Company's previously filed June 30, 2012 (as amended and filed on October 19, 2012), and March 31, 2012 Quarterly Reports on Form 10-Q and in the Company’s 2011 Annual Report on Form 10-K. All intercompany transactions and balances have been eliminated in consolidation.
The preparation of the Company’s consolidated financial statements in conformity with United States generally accepted accounting principles requires management to make estimates and assumptions that affect the amounts reported in these consolidated financial statements and accompanying notes. The more significant areas requiring the use of management’s estimates relate to mineral reserves, reclamation and environmental obligations, valuation allowance for deferred tax assets, useful lives utilized for depreciation, amortization and accretion calculations, future cash flows from long-lived assets, and fair value of derivatives and other financial instruments. Actual results could differ from these estimates.
The Company evaluates subsequent events through the date the consolidated financial statements are issued. Other than the subsequent event noted below, no subsequent events were identified that required additional disclosure in the consolidated financial statements through the date of this filing.
Subsequent to the end of the third quarter of 2012, on October 17, 2012, the Company completed the issuance and sale of $396.75 million of 1.75% senior unsecured convertible debentures, due October 15, 2032. Each $1,000 principal amount of these new debentures is initially convertible, under certain circumstances and during certain periods, into 60.4961 shares (subject to customary anti-dilution adjustments) of the Company's common stock, which represents an initial conversion price of $16.53 per share. The debentures also include an embedded conversion enhancement feature that is equivalent to including with each debenture a warrant initially exercisable for 30.2481 shares initially at $16.53 per share (both subject to customary anti-dilution adjustments). The Company, at its election, may settle conversions of the debentures in cash, shares of its common stock or any combination of cash and shares of its common stock. Debenture holders have the right to redeem their debentures at face value plus accrued and unpaid interest, to, but excluding, the relevant repurchase date on October 15 of each of 2019, 2024, 2029, and upon the occurrence of certain corporate events. The Company will have the right to call the debentures at any time on or after October 20, 2019. The debentures will be bifurcated under U.S. GAAP into separate debt and equity components, and will reflect an effective maturity (to the first optional redemption date) of seven years. The residual amount recorded within equity will be treated for accounting purposes as additional debt discount and will be accreted as an additional non-cash interest charge to earnings over the expected life. Issuance costs totaling about $12.4 million will be deducted from the gross proceeds of the offering and will be amortized ratably over 84 months. Net proceeds of the offering will be used to retire the Company's $166.5 million of outstanding 1.875% convertible debentures upon their expected redemption in March of 2013, and for general corporate purposes.
NOTE 2
SALES
Mine Production
The Company mines and processes ores containing palladium, platinum, rhodium, gold, silver, copper and nickel into intermediate and final products for sale to customers. Palladium, platinum, rhodium, gold and silver are sent to third party refineries for final processing from where they are sold to a number of consumers and dealers with whom the Company has established trading relationships. Refined platinum group metals (PGMs) of 99.95% purity (rhodium of 99.9%) in sponge form are transferred upon sale from the Company’s account at third party refineries to the account of the purchaser. By-product precious metals are normally sold at market prices to customers, brokers or outside refiners. By-products of copper and nickel are produced by the Company at less than commercial grade, so prices for these metals typically reflect a quality discount. By-product sales are included in revenues from mine production. During the third quarter of 2012 and 2011, total by-product (copper, nickel, gold, silver and mined rhodium) sales were $7.2 million and $9.0 million, respectively.
6
During the first nine months of 2012 and 2011, total by-product (copper, nickel, gold, silver and mined rhodium) sales were $23.6 million and $24.5 million, respectively.
The Company has a three year supply agreement with General Motors Corporation (GM) that provides for fixed quantities of palladium to be delivered each month. The supply agreement with GM expires on December 31, 2013. The Company has a one year platinum supply agreement with Tiffany & Co set to expire at the end of 2012. The Company also has a supply agreement with Johnson Matthey and a year-to-year supply agreement with Ford Motor Company. Some of these agreements provide for pricing at a small discount to a trailing market price. The Company currently sells its remaining mine production under spot sales agreements.
Revenue is recognized when persuasive evidence of an arrangement exists, delivery has occurred either physically or through an irrevocable transfer of metals to customers’ accounts, the price is fixed or determinable, no related obligations remain and collectability is probable.
PGM Recycling
The Company purchases spent catalyst materials from third parties and processes these materials in its facilities in Columbus, Montana to recover palladium, platinum and rhodium for sale. It also accepts material supplied from third parties on a tolling basis, processing it for a fee and returning the recovered metals to the supplier. The Company has entered into sourcing arrangements for catalyst material with several suppliers. Under these sourcing arrangements as currently structured, the Company advances cash against a shipment of material shortly before actually receiving the physical shipment. These advances are included in Other current assets on the Company’s Consolidated Balance Sheet until such time as the material has been physically received and title has transferred to the Company. The Company holds a security interest in materials procured by its largest recycling supplier that have not been received by the Company. Once the material is physically received and title has transferred, the associated advance is reclassified from Other current assets into Inventories. Finance charges collected on advances and inventories prior to being earned are included in Other current liabilities on the Company’s Consolidated Balance Sheet. Finance charges are reclassified from Other current liabilities to Interest income ratably from the time the advance was made until the out-turn date of the inventory.
At the same time the Company purchases recycling material, it typically enters into a fixed forward contract for future delivery of the PGMs contained in the recycled material at a price consistent with the purchase cost of the recycled material. The contract commits the Company to deliver finished metal on a specified date that normally corresponds to the expected out-turn date for the metal from the final refiner. The purpose of this arrangement is to eliminate the Company’s exposure to fluctuations in market prices during processing, while at the same time creating an obligation for the Company to deliver metal at a future point in time that could be subject to operational risks. If the Company were unable to complete the processing of the recycled material by the contractual delivery date, it could either cover its delivery commitments with mine production or purchase finished metal in the open market. If open market purchases are used, the Company would bear the cost (or benefit) of any change in the market price relative to the price stipulated in the delivery contract.
Total Sales
Total sales to significant customers as a percentage of total revenues for the three- and nine- month periods ended September 30, 2012 and 2011 were as follows:
| Three Months Ended September 30, | Nine Months Ended September 30, | ||||||||||
| 2012 | 2011 | 2012 | 2011 | ||||||||
| Customer A | 28 | % | 31 | % | 26 | % | 27 | % | |||
| Customer B | 18 | % | 16 | % | 18 | % | 19 | % | |||
| Customer C | 16 | % | — | % | 17 | % | — | % | |||
| Customer D | — | % | 10 | % | 10 | % | — | % | |||
| Customer E | — | % | 20 | % | — | % | 21 | % | |||
| 62 | % | 77 | % | 71 | % | 67 | % | ||||
-% represents less than 10% of total revenues
7
NOTE 3
CORRECTION OF IMMATERIAL BALANCE SHEET CLASSIFICATION ERROR
In the third quarter of 2012, the Company identified an error in the presentation of the deferred tax asset and liability on the Company's Consolidated Balance Sheet. The error in presentation impacted the balance sheet at December 31, 2011 and the subsequent quarters in 2012.
The Company assessed the materiality of this error in accordance with Staff Accounting Bulletin (SAB) No. 108 and determined the error was immaterial to previously reported amounts contained in the periodic reports. The Company intends to correct this error through subsequent periodic filings. The effect of recording this immaterial correction on the balance sheet as of December 31, 2011, and for the fiscal 2012 quarterly periods to be reported in subsequent periodic filings are as follows:
| (in thousands) | At December 31, 2011 | At March 31, 2012 | At June 30, 2012 | |||||||||||
| As Reported | As Revised | As Reported | As Revised | As Reported | As Revised | |||||||||
| Deferred tax asset | 96,036 | 19,819 | 107,150 | 20,819 | 109,629 | 19,760 | ||||||||
| Total current assets | 402,143 | 325,926 | 413,890 | 327,559 | 507,358 | 417,489 | ||||||||
| Total assets | 1,403,541 | 1,327,324 | 1,422,088 | 1,335,757 | 1,535,907 | 1,446,038 | ||||||||
| Deferred tax liability | 270,101 | 193,884 | 279,017 | 192,686 | 277,085 | 187,216 | ||||||||
| Total liabilities | 559,573 | 483,356 | 571,595 | 485,264 | 569,771 | 479,902 | ||||||||
| Total liabilities and stockholder's equity | 1,403,541 | 1,327,324 | 1,422,088 | 1,335,757 | 1,535,907 | 1,446,038 | ||||||||
NOTE 4
NONCONTROLLING INTEREST
On March 28, 2012, the Company entered into an agreement with Mitsubishi Corporation (Mitsubishi) in which a Mitsubishi subsidiary acquired a 25% interest in the Company's wholly owned subsidiary, Stillwater Canada Inc. (SCI), which owns the Marathon PGM-copper project and related properties, for approximately $81.25 million and an additional $13.6 million to satisfy Mitsubishi's portion of the venture's initial cash call. Mitsubishi will be responsible for funding its 25% share of operating, capital and exploration expenditures on the Marathon properties and has agreed to cooperate and support efforts to secure project financing for Marathon. Mitsubishi will have an option to purchase up to 100% of Marathon's future PGM production under a related supply agreement at a relatively small discount to market. The transaction closed on April 10, 2012. The Company incurred transaction costs of approximately $1.1 million related to the agreement with Mitsubishi, which was recorded within Stockholders' Equity upon closing of the transaction.
The noncontrolling interests' share of equity in SCI is reflected as Noncontrolling interest in the accompanying Consolidated Balance Sheet and was $51.7 million as of September 30, 2012.
The change in the parent company's equity as a result of the sale of the noncontrolling interest in SCI was an increase to Additional paid in capital of $42.5 million, offset in part by expenses incurred of $1.1 million.
NOTE 5
DERIVATIVE INSTRUMENTS
The Company uses various derivative instruments to manage its exposure to changes in PGM market commodity prices. Some of these derivatives are designated as hedges. Because the Company hedges only with instruments that have a high correlation with the value of the underlying exposures, changes in the derivatives’ fair value are expected to be offset by changes in the value of the hedged transaction.
Commodity Derivatives
The Company customarily enters into fixed forward contracts and on occasion it also enters into financially settled forward contracts to offset the price risk in its PGM recycling activity. From time to time, it also has entered into these types of contracts on portions of its mine production. Under these customary fixed forward transactions, the Company agrees to deliver a stated quantity of metal on a specific future date at a price stipulated in advance. The Company uses fixed forward transactions primarily to price in advance the metals acquired for processing in its recycling segment.
8
Under the occasional financially settled forward transactions, at each settlement date the Company receives the net difference between the forward price and the market price if the market price is below the forward price and the Company pays the net difference between the forward price and the market price if the market price is above the forward price. These financially settled forward contracts are settled in cash at maturity and do not require physical delivery of metal at settlement. The Company typically has used financially settled forward contracts with third parties to reduce its exposure to price risk on metal it is obligated to deliver under long-term sales agreements.
Mine Production
The Company had no outstanding derivative contracts pertaining to its mined production during the nine- month periods ending September 30, 2012 and 2011.
PGM Recycling
The Company regularly enters into fixed forward sales relating to its recycling of PGM catalyst materials. The metals from PGM recycled materials are typically sold forward at the time of purchase and delivered against the fixed forward contracts when the ounces are recovered. All of these fixed forward sales contracts open at September 30, 2012, will settle at various periods through March 2013. The Company has credit agreements with its major trading partners that provide for margin deposits in the event that forward prices for metals exceed the Company’s hedged prices by a predetermined margin limit. As of September 30, 2012, no such margin deposits were outstanding or due.
Occasionally, the Company also has entered into financially settled forward contracts on its recycled materials. Such contracts are utilized when the Company wishes to establish a firm forward price for recycled metal on a specific future date. No financially settled forward contracts were entered into during the three- and nine- month periods ending September 30, 2012 and 2011. The Company generally has not designated these contracts as cash flow hedges, so they are marked to market at the end of each accounting period. The change in the fair value of the derivatives is reflected in the Consolidated Statement of Operations and Comprehensive Income.
The following is a summary of the Company’s obligations to deliver metal under commodity derivatives in place as of September 30, 2012:
| PGM Recycling: | |||||||||||||||||||||
| Fixed Forwards | |||||||||||||||||||||
| Platinum | Palladium | Rhodium | |||||||||||||||||||
| Settlement Period | Ounces | Avg. Price | Ounces | Avg. Price | Ounces | Avg. Price | |||||||||||||||
| Fourth Quarter 2012 | 23,892 | $ | 1,502 | 33,726 | $ | 622 | 6,015 | $ | 1,168 | ||||||||||||
| First Quarter 2013 | 2,959 | $ | 1,621 | 4,347 | $ | 653 | 1,625 | $ | 1,173 | ||||||||||||
NOTE 6
SHARE-BASED COMPENSATION
Stock Plans
The Company sponsors stock plans (the “Plans”) that enable the Company to grant stock options or other equity based compensation to employees and non-employee directors. Effective March 1, 2011, the Company ceased offering stock options as incentive compensation to employees and non-employee directors, and began to and expects to continue to issue only cash awards or restricted stock units in lieu of stock options. The Company continues to have previously issued stock options that remain outstanding under three separate plans: the 1994 Incentive Plan, the General Employee Plan and the 2004 Equity Incentive Plan. In April 2012, stockholders approved the 2012 Equity Incentive Plan. At inception of the plans, approximately 16.4 million shares of common stock were authorized for issuance under the Plans, including approximately 5.0 million, 5.2 million, 1.4 million and 4.8 million authorized shares for the 2012 Equity Incentive Plan, 2004 Equity Incentive Plan, the General Employee Plan and the 1994 Incentive Plan (as amended by the 1998 Incentive Plan), respectively. The 1998 Incentive Plan and the General Employee Plan have been terminated and no additional options, shares or units may be issued under these two terminated plans. Approximately 5.4 million shares were available and reserved for grant under the 2004 Equity Incentive Plan and the 2012 Equity Incentive Plan combined, as of September 30, 2012.
The Compensation Committee of the Company’s Board of Directors administers the Plans and determines the type of equity awards to be issued, the exercise period, vesting period and all other terms of instruments issued under the Plans. Employees’ options and the majority of restricted stock units vest in equal annual installments over a three year period after date of grant. Some restricted stock units vest 100% one year after the date of grant.
9
Officers’ and directors’ options expire ten years after the date of grant. All other employee options expire five to ten years after the date of grant, depending upon the original grant date.
The Company received a minimal amount of cash from the exercise of stock options in the three- and nine- month periods ended September 30, 2012. The Company received $0.1 million and $0.8 million in cash from the exercise of stock options in the three- and nine- month periods ended September 30, 2011.
The Company recognizes compensation expense associated with its stock option grants based on their fair market value on the date of grant as determined using a Black-Scholes option pricing model. The Company recognizes stock option expense ratably over the vesting period of the options. If options are canceled or forfeited prior to vesting, the Company stops recognizing the related expense effective with the date of forfeiture. The compensation expense, recorded in General and administrative in the Consolidated Statements of Operations and Comprehensive Income, related to the fair value of stock options during the three- month periods ended September 30, 2012 and 2011, was $22,900 and $58,000, respectively, and $78,200 and $189,400 during the nine- month periods ended September 30, 2012 and 2011, respectively. Total compensation expense not yet recognized related to nonvested stock options is $18,700, $32,600 and $500 for the remaining three months of 2012 and for years 2013 and 2014, respectively.
Nonvested Shares
The following table summarizes the status of and changes in the Company’s nonvested shares during the first nine months of 2012:
| Nonvested Shares | Weighted-Average Grant-Date Fair Value | |||||
| Nonvested shares at January 1, 2012 | 1,502,611 | $ | 10.95 | |||
| Granted | 557,910 | 13.37 | ||||
| Vested | (751,686 | ) | 6.65 | |||
| Forfeited | (1,267 | ) | 17.77 | |||
| Nonvested shares at March 31, 2012 | 1,307,568 | $ | 14.45 | |||
| Granted | 48,167 | 10.51 | ||||
| Vested | (3,658 | ) | 20.04 | |||
| Forfeited | (4,860 | ) | 14.65 | |||
| Nonvested shares at June 30, 2012 | 1,347,217 | $ | 14.29 | |||
| Granted | 5,282 | 9.07 | ||||
| Vested | (130,866 | ) | 14.42 | |||
| Forfeited | (26,942 | ) | 13.68 | |||
| Nonvested shares at September 30, 2012 | 1,194,691 | $ | 14.26 | |||
Compensation expense related to grants of nonvested shares was $2.8 million and $1.7 million in the three- month periods ended September 30, 2012 and 2011, respectively, and is included within General and administrative in the Consolidated Statements of Operations and Comprehensive Income. Compensation expense related to grants of nonvested shares was $6.5 million and $4.8 million in the nine- month periods ended September 30, 2012 and 2011, respectively.
The following table presents the compensation expense of the nonvested shares outstanding at September 30, 2012, to be recognized over the remaining vesting periods:
| (In millions) | |||
| Fourth quarter 2012 | $ | 1.7 | |
| 2013 | 4.8 | ||
| 2014 | 2.4 | ||
| 2015 | 0.4 | ||
| Total | $ | 9.3 | |
10
NOTE 7
INCOME TAXES
The Company determines income taxes using the asset and liability approach which results in the recognition of deferred tax assets and liabilities for the expected future tax consequences of temporary differences between the carrying amount and the tax basis of those assets and liabilities, as well as operating loss and tax credit carryforwards, using enacted tax rates in effect in the years in which the differences are expected to reverse. The effect on deferred tax assets and liabilities of a change in tax rates is recognized in income in the period that includes the enactment date. Deferred tax assets and liabilities are recorded on a jurisdictional basis.
At September 30, 2012, the Company has U.S. net operating loss carryforwards (NOLs), which expire at various times in years 2012 through 2028. The Company has reviewed its net deferred tax assets and has provided a valuation allowance to reflect the estimated amount of net deferred tax assets which management considers, more likely than not, will not be realized. Included in the provision for income taxes for the three- and nine- month periods ended September 30, 2012 are adjustments for AMT in the amount of $2.4 million and $3.4 million, respectively. These adjustments are the result of changes in estimates and accounting method changes made for tax purposes in 2011. The Company recognized an income tax provision of $2.8 million and $12.6 million for the three- and nine- month periods ending September 30, 2011. The Company has AMT net operating loss carry-forwards, and anticipates that all of its 2012 AMT income will be subject to offset by available AMT NOLs. Changes in the Company’s net deferred tax assets and liabilities have been offset by a corresponding change in the valuation allowance.
The Company’s policy is to recognize interest and penalties on unrecognized tax benefits in Income tax provision in the Consolidated Statements of Operations and Comprehensive Income. Interest of $8,300 and penalties of $110,700 were recognized for the three- and nine- month periods ended September 30, 2012. There were no interest or penalties for the same periods in 2011. Cash paid for income taxes was $0.8 million and $4.8 million for the three- and nine- month periods ending September 30, 2012. Tax years still open for examination by the taxing authorities are the years ending December 31, 2011, 2010, and 2009. Additionally, tax years in which NOLs are generated remain open for a period of three years after such NOL's are utilized.
NOTE 8
DEBT AND CAPITAL LEASE OBLIGATIONS
Convertible Debentures
On March 12, 2008, the Company issued and sold $181.5 million aggregate principal amount of senior unsecured convertible debentures due March 15, 2028 (“debentures”). The debentures pay interest at 1.875% per annum, payable semi-annually on March 15 and September 15 of each year, and commenced on September 15, 2008. The debentures will mature on March 15, 2028, subject to earlier repurchase or conversion. Each $1,000 principal amount of debentures is initially convertible, at the option of the holders, into approximately 42.5351 shares of the Company’s common stock, at any time prior to the maturity date. The conversion rate is subject to certain adjustments, but will not be adjusted for accrued interest or any unpaid interest. The conversion rate initially represents a conversion price of $23.51 per share. Holders of the debentures may require the Company to repurchase all or a portion of their debentures on March 15, 2013, March 15, 2018 and March 15, 2023, or at any time before March 15, 2028 upon the occurrence of certain events including a change in control. The Company may redeem the debentures for cash beginning on or after March 22, 2013. In October 2009, the Company undertook the exchange of $15.0 million face amount of the convertible debentures for 1.84 million shares of the Company's common stock. The debentures so acquired were retired. The outstanding balance of $166.5 million is reported as a short-term debt obligation as of September 30, 2012.
Amortization expense related to the issuance costs of the debentures was approximately $0.2 million in each of the three- month periods ended September 30, 2012 and 2011, respectively, and $0.7 million for each of the nine- month periods ended September 30, 2012 and 2011, respectively. The interest expense on the debentures was approximately $0.8 million for each of the three- month periods ended September 30, 2012 and 2011, and $2.3 million for each of the nine- month periods ended September 30, 2012 and 2011. The Company made cash payments of $1.6 million for interest on the debentures for each of the three- month periods ended September 30, 2012 and 2011, and $3.1 million for each of the nine- month periods ended September 30, 2012 and 2011.
11
Exempt Facility Revenue Bonds
The Company also has outstanding a $30.0 million offering of 8.0% Exempt Facility Revenue Bonds, Series 2000, issued through the State of Montana Board of Investments and due July 1, 2020. The balance outstanding at September 30, 2012, was $29.6 million, which is net of unamortized discount of $0.4 million. The Company made cash payments of $1.2 million for interest on revenue bonds during the nine- month periods ending September 30, 2012 and 2011.
Asset-Backed Revolving Line of Credit
Effective December 23, 2011, the Company signed a $100.0 million asset-backed revolving credit agreement with Wells Fargo Capital Finance, incurring debt issuance costs of $1.1 million. Borrowings under this working capital facility are limited to a borrowing base comprised of 85% of eligible accounts receivable and 70% of eligible inventories. Borrowings will be secured by the Company’s accounts receivable, metals inventories and other accounts. The asset-backed revolving credit facility includes a single fixed-charge coverage covenant that only takes effect when less than 30% of the total borrowing capacity under the line remains available. The facility includes a $50.0 million letter of credit sub-facility. Outstanding borrowings under the facility accrue interest at a spread over the London Interbank Offer Rate that varies from 2.25% to 2.75%, decreasing progressively as the percentage drawn against the facility increases. The Company also pays an unused line fee on committed but unutilized commitments under the facility at a rate per annum of 0.375% or 0.5%, depending on utilization of the facility. On January 13, 2012, the Company completed the syndication of this facility to a group of four banks and simultaneously expanded the maximum line of credit to $125.0 million. The Company recognized $0.2 million in fees associated with the asset-backed revolving credit agreement in the three- month period ended September 30, 2012 and $0.7 million for the nine- month period ended September 30, 2012. Amortization expense related to the issuance costs of the credit agreement was approximately $0.1 million and $0.2 million for the three- and nine- month periods ended September 30, 2012. As of September 30, 2012, there was no drawn balance under this revolving credit facility, although approximately $8.3 million in undrawn letters of credit had been issued under this facility as collateral for sureties.
Capital Lease Obligations
On June 1, 2012, the Company entered into a lease agreement with General Electric Capital Corporation (GECC) covering the acquisition of a tunnel-boring machine for use on the Blitz project adjacent to the Stillwater Mine. The transaction is structured as a capital lease with a four-year term; lease payments are due quarterly in advance. In the third quarter of 2012, the Company increased the lease balance due under the original GECC capital lease by $0.7 million. The Company made cash payments of $0.5 million and $0.9 million on its capital lease obligations during the three- and nine month periods ended September 30, 2012, respectively. These cash payments included interest of $0.1 million. As of September 30, 2012, the outstanding balance under the capital lease was $6.9 million.
The following is a schedule by year of the future minimum lease payments for the capital lease together with the present value of the net minimum lease payments:
| Quarter ended September 30, 2012 (in thousands) | ||||
| Remaining 2012 | $ | 542 | ||
| 2013 | 2,168 | |||
| 2014 | 2,168 | |||
| 2015 | 2,168 | |||
| 2016 | 590 | |||
| Total minimum lease payments | 7,636 | |||
| Less interest at rates ranging from 5.21% to 5.46% (before tax) | 729 | |||
| Net minimum lease payments | 6,907 | |||
| Less current portion | 1,830 | |||
| Total long-term capital lease obligation | $ | 5,077 | ||
Capitalized Interest
The Company capitalizes interest incurred on its various debt instruments as a cost of properties under development. For the three- and nine- month periods ended September 30, 2012, the Company capitalized interest of $0.3 million and $0.9 million, respectively. The Company did not record capitalized interest as a cost of properties under development in the comparable periods in 2011.
12
NOTE 9
SEGMENT INFORMATION
The Company operates five reportable business segments: Mine Production, PGM Recycling, Canadian Properties, South American Properties and All Other. These segments are managed separately based on fundamental differences in their operations and geographic separation.
The Mine Production segment consists of two business components: the Stillwater Mine and the East Boulder Mine. The Mine Production segment is engaged in the development, extraction, processing and refining of PGMs.
The Company sells PGMs from mine production under short-term and long-term sales agreements, through commitments under derivative financial instruments and in open PGM markets. The financial results for the Stillwater Mine and the East Boulder Mine have been aggregated, as both have similar products, processes, customers, distribution methods and economic characteristics.
The PGM Recycling segment is engaged in the recycling of spent catalyst material to recover the PGMs contained in the material. The Company allocates costs of the smelter and base metal refinery to both the Mine Production segment and to the PGM Recycling segment for internal and segment reporting purposes because the Company’s smelting and refining facilities support the PGM extraction requirements of both business segments. The Company also accepts material supplied from third parties on a tolling basis, processing it for a fee and returning the recovered metals to the supplier.
The Canadian Properties segment consists of the Marathon PGM assets (the majority of which is mineral property) and the Bermuda exploration mineral property. The principal Marathon property is a large PGM and copper deposit located near the town of Marathon, Ontario, Canada. The Marathon deposit is currently in the environmental review and permitting stage and will not be in production for several years. The Bermuda exploration mineral property is located adjacent to the Marathon property. Financial information available for this segment consists of total asset values, general and administrative costs, exploration costs and capital expenditures as the properties are developed.
The South American Properties segment consists of the Peregrine Metals Ltd. assets. The principal Peregrine property acquired is a copper-gold discovery, located in the San Juan province of Argentina. The Peregrine deposit is currently in the exploration stage. Financial information available for this segment of the Company consists of total asset values, general and administrative costs and exploration costs.
The All Other group primarily consists of assets, revenues, and expenses of various corporate and support functions.
The Company evaluates performance and allocates resources based on income or loss before income taxes.
The following financial information relates to the Company’s business segments:
| (in thousands) | South American Properties | |||||||||||||||||||||||
Mine Production | PGM Recycling | Canadian Properties | All Other | Total | ||||||||||||||||||||
| Three Months Ended September 30, 2012 | ||||||||||||||||||||||||
| Revenues | $ | 107,057 | $ | 73,987 | $ | — | $ | — | $ | — | $ | 181,044 | ||||||||||||
| Depletion, depreciation and amortization | $ | 13,843 | $ | 264 | $ | — | $ | — | $ | — | $ | 14,107 | ||||||||||||
| General and administrative expenses | $ | — | $ | — | $ | 661 | $ | 251 | $ | 8,970 | $ | 9,882 | ||||||||||||
| Interest income | $ | — | $ | 472 | $ | 15 | $ | 44 | $ | (260 | ) | $ | 271 | |||||||||||
| Interest expense | $ | — | $ | — | $ | — | $ | — | $ | 1,493 | $ | 1,493 | ||||||||||||
| Income (loss) before income taxes | $ | 23,307 | $ | 1,884 | $ | (1,282 | ) | $ | 5,019 | $ | (13,818 | ) | $ | 15,110 | ||||||||||
| Capital expenditures | $ | 19,530 | $ | 61 | $ | 3,558 | $ | 6 | $ | 2,220 | $ | 25,375 | ||||||||||||
| Total assets | $ | 452,734 | $ | 63,105 | $ | 245,351 | $ | 425,322 | $ | 277,985 | $ | 1,464,497 | ||||||||||||
13
| (in thousands) | South American Properties | |||||||||||||||||||||||
| Three Months Ended September 30, 2011 | Mine Production | PGM Recycling | Canadian Properties | All Other | Total | |||||||||||||||||||
| Revenues | $ | 145,033 | $ | 107,477 | $ | — | $ | — | $ | 1,142 | $ | 253,652 | ||||||||||||
| Depletion, depreciation and amortization | $ | 15,359 | $ | 269 | $ | — | $ | — | $ | — | $ | 15,628 | ||||||||||||
| General and administrative expenses | $ | — | $ | — | $ | 439 | $ | — | $ | 12,710 | $ | 13,149 | ||||||||||||
| Interest income | $ | — | $ | 635 | $ | — | $ | — | $ | 471 | $ | 1,106 | ||||||||||||
| Interest expense | $ | — | $ | — | $ | — | $ | — | $ | 1,635 | $ | 1,635 | ||||||||||||
| Income (loss) before income taxes | $ | 58,584 | $ | 4,357 | $ | (871 | ) | $ | — | $ | (18,571 | ) | $ | 43,499 | ||||||||||
| Capital expenditures | $ | 25,408 | $ | 123 | $ | 2,289 | $ | — | $ | 117 | $ | 27,937 | ||||||||||||
| Total assets | $ | 409,778 | $ | 111,555 | $ | 195,392 | $ | — | $ | 362,857 | $ | 1,079,582 | ||||||||||||
| (in thousands) | South American Properties | |||||||||||||||||||||||
| Nine Months Ended September 30, 2012 | Mine Production | PGM Recycling | Canadian Properties | All Other | Total | |||||||||||||||||||
| Revenues | $ | 339,951 | $ | 256,919 | $ | — | $ | — | $ | — | $ | 596,870 | ||||||||||||
| Depletion, depreciation and amortization | $ | 42,848 | $ | 793 | $ | — | $ | — | $ | — | $ | 43,641 | ||||||||||||
| General and administrative expenses | $ | — | $ | — | $ | 2,436 | $ | 2,793 | $ | 27,248 | $ | 32,477 | ||||||||||||
| Interest income | $ | — | $ | 1,661 | $ | 24 | $ | 166 | $ | (145 | ) | $ | 1,706 | |||||||||||
| Interest expense | $ | — | $ | — | $ | 12 | $ | — | $ | 4,349 | $ | 4,361 | ||||||||||||
| Income (loss) before income taxes | $ | 77,879 | $ | 7,912 | $ | (6,174 | ) | $ | (2,528 | ) | $ | (40,724 | ) | $ | 36,365 | |||||||||
| Capital expenditures | $ | 73,354 | $ | 115 | $ | 6,881 | $ | 6 | $ | 4,332 | $ | 84,688 | ||||||||||||
| Total assets | $ | 452,734 | $ | 63,105 | $ | 245,351 | $ | 425,322 | $ | 277,985 | $ | 1,464,497 | ||||||||||||
| (in thousands) | South American Properties | |||||||||||||||||||||||
| Nine Months Ended September 30, 2011 | Mine Production | PGM Recycling | Canadian Properties | All Other | Total | |||||||||||||||||||
| Revenues | $ | 406,746 | $ | 238,430 | $ | — | $ | — | $ | 1,142 | $ | 646,318 | ||||||||||||
| Depletion, depreciation and amortization | $ | 46,555 | $ | 796 | $ | — | $ | — | $ | — | $ | 47,351 | ||||||||||||
| General and administrative expenses | $ | — | $ | — | $ | 1,587 | $ | — | $ | 27,817 | $ | 29,404 | ||||||||||||
| Interest income | $ | — | $ | 1,554 | $ | — | $ | — | $ | 1,285 | $ | 2,839 | ||||||||||||
| Interest expense | $ | — | $ | — | $ | — | $ | — | $ | 4,907 | $ | 4,907 | ||||||||||||
| Income (loss) before income taxes | $ | 163,983 | $ | 10,696 | $ | (1,911 | ) | $ | — | $ | (40,558 | ) | $ | 132,210 | ||||||||||
| Capital expenditures | $ | 62,155 | $ | 187 | $ | 11,639 | $ | — | $ | 251 | $ | 74,232 | ||||||||||||
| Total assets | $ | 409,778 | $ | 111,555 | $ | 195,392 | $ | — | $ | 362,857 | $ | 1,079,582 | ||||||||||||
14
NOTE 10
INVESTMENTS
The Company classifies the marketable securities in which it invests as available-for-sale securities. These securities are measured at fair market value in the financial statements with unrealized gains or losses recorded in other comprehensive income (loss). At the time the securities are sold or otherwise disposed of, gains or losses are included in net income.
The cost, gross unrealized gains, gross unrealized losses, and fair market value of available-for-sale investment securities by major security type and class of security for the periods ended September 30, 2012 and 2011, are as follows:
| Investments | |||||||||||||||||
| (in thousands) | Cost | Gross unrealized gains | Gross unrealized losses | Fair market value | |||||||||||||
| 2012 | |||||||||||||||||
| Federal agency notes | $ | 35,322 | $ | — | $ | (153 | ) | $ | 35,169 | ||||||||
| Commercial paper | 41,485 | — | (402 | ) | 41,083 | ||||||||||||
| Mutual funds | 1,468 | 214 | — | 1,682 | |||||||||||||
| Total | $ | 78,275 | $ | 214 | $ | (555 | ) | $ | 77,934 | ||||||||
| 2011 | |||||||||||||||||
| Federal agency notes | $ | 52,597 | $ | — | $ | (267 | ) | $ | 52,330 | ||||||||
| Commercial paper | 38,314 | — | (906 | ) | 37,408 | ||||||||||||
| Mutual funds | 1,152 | — | (18 | ) | 1,134 | ||||||||||||
| Total | $ | 92,063 | $ | — | $ | (1,191 | ) | $ | 90,872 | ||||||||
The mutual funds included in the investment table above are included in Other noncurrent assets on the Company's Consolidated Balance Sheet.
The Company has long-term investments in several Canadian exploration companies, recorded on the balance sheet at cost. The Company determined that its long-term investments, representing equity holdings in certain of these exploration companies, were other than temporarily impaired and recorded a loss of $1.7 million for the three- month period ended September 30, 2012. At September 30, 2012, these long-term investments totaled $3.8 million and are recorded in Other noncurrent assets on the Company's Consolidated Balance Sheet.
NOTE 11
INVENTORIES
For purposes of inventory accounting, the market value of inventory is generally deemed equal to the Company’s current cost of replacing the inventory, provided that: (1) the market value of the inventory may not exceed the estimated selling price of such inventory in the ordinary course of business less reasonably predictable costs of completion and disposal, and (2) the market value may not be less than net realizable value reduced by an allowance for a normal profit margin. No adjustments were made to the inventory value in the first nine months of 2012 or 2011.
The costs of mined PGM inventories as of any date are determined based on combined production costs per ounce and include all inventoriable production costs, including direct labor, direct materials, depreciation and amortization and other overhead costs relating to mining and processing activities incurred as of such date.
The costs of recycled PGM inventories as of any date are determined based on the acquisition cost of the recycled material and include all inventoriable processing costs, including direct labor, direct materials and third party refining costs which relate to the processing activities incurred as of such date.
15
Inventories reflected in the accompanying balance sheets consisted of the following:
| (in thousands) | September 30, 2012 | December 31, 2011 | |||||
| Metals inventory | |||||||
| Raw ore | $ | 2,568 | $ | 1,179 | |||
| Concentrate and in-process | 37,087 | 43,379 | |||||
| Finished goods | 62,772 | 66,194 | |||||
| 102,427 | 110,752 | ||||||
| Materials and supplies | 23,068 | 21,104 | |||||
| Total inventory | $ | 125,495 | $ | 131,856 | |||
The Company holds in its possession, but does not reflect in inventory, materials it processes on a toll basis for customers until the tolled material is transported to a third party refiner.
NOTE 12
EARNINGS PER SHARE
Basic earnings per share is computed by dividing net earnings available to common stockholders by the weighted average number of common shares outstanding during the period. Diluted earnings per share reflect the potential dilution that could occur if the Company’s dilutive outstanding stock options or nonvested shares were exercised or vested and the Company’s convertible debt was converted. For purposes of calculating earnings per share, reported net income was adjusted for the interest expense (including amortization expense of deferred debt fees) and the related income tax effect for the convertible debentures for the three- and nine- month periods ended September 30, 2011. No adjustment was made to reported net income during the comparable periods in 2012 because the effect would have been antidilutive. The Company currently has only one class of equity shares outstanding.
A total of 48,742 and 33,991 weighted shares of common stock from outstanding options were included in the computation of diluted earnings per share for the three- month periods ended September 30, 2012 and 2011, respectively. Outstanding options to purchase 58,793 and 60,987 of weighted shares of common stock were included in the computation of diluted earnings per share for the nine- month periods ended September 30, 2012 and 2011, respectively. Outstanding options to purchase 118,928 and 289,700 of weighted shares of common stock were excluded from the computation of diluted earnings per share for the three- month periods ended September 30, 2012 and 2011, respectively, and outstanding options to purchase 123,996 and 51,357 of weighted shares of common stock were excluded from the computation of diluted earnings per share for the nine- month periods ended September 30, 2012 and 2011, respectively, because the market price at the end of each period was lower than the exercise price, and therefore the effect would have been antidilutive.
The effect of including outstanding nonvested shares was to increase diluted weighted average shares outstanding by 718,977 and 888,248 shares for the three- month periods ended September 30, 2012 and 2011, respectively. A total of 870,870 and 992,966 outstanding nonvested shares were included in the computation of diluted earnings per share for the nine- month periods ended September 30, 2012 and 2011, respectively.
All 7.1 million shares of common stock applicable to the outstanding convertible debentures were excluded in the computation of diluted weighted average shares in the three- and nine- month periods ended September 30, 2012, because the net effect of assuming all the debentures were converted would have been antidilutive. All 7.1 million shares of common stock applicable to the outstanding convertible debentures were included in the computation of diluted weighted average shares in the three- and nine- month periods ended September 30, 2011.
16
Reconciliations showing the computation of basic and diluted shares and the related impact on income for the three- and nine- month periods ended September 30, 2011 are shown in the following table:
| Three Months Ended | Nine Months Ended | ||||||||||||||||||||
| (in thousands, except per share amounts) | September 30, 2011 | September 30, 2011 | |||||||||||||||||||
Income (Numerator) | Weighted Average Shares (Denominator) | Per Share Amount | Income (Numerator) | Weighted Average Shares (Denominator) | Per Share Amount | ||||||||||||||||
| Basic EPS | |||||||||||||||||||||
| Net income attributable to common stockholders | 40,741 | 103,114 | $ | 0.40 | 119,631 | 102,831 | $ | 1.16 | |||||||||||||
| Effect of Dilutive Securities | |||||||||||||||||||||
| Stock options | — | 34 | — | 61 | |||||||||||||||||
| Nonvested shares | — | 888 | — | 993 | |||||||||||||||||
| 1.875% Convertible debentures | 913 | 7,082 | 2,738 | 7,082 | |||||||||||||||||
| Diluted EPS | |||||||||||||||||||||
| Net income attributable to common stockholders + assumed conversions | $ | 41,654 | 111,118 | $ | 0.37 | $ | 122,369 | 110,967 | $ | 1.10 | |||||||||||
NOTE 13
FAIR VALUE MEASUREMENTS
Fair value is defined as the price that would be received to sell an asset or paid to transfer a liability (an exit price) in an orderly transaction between market participants. This definition also establishes a fair value hierarchy which requires an entity to maximize the use of observable inputs and minimize the use of unobservable inputs when measuring fair value. The fair value hierarchy distinguishes three levels of inputs that may be utilized when measuring fair value: Level 1 inputs (using quoted prices in active markets for identical assets or liabilities), Level 2 inputs (using external inputs other than Level 1 prices, such as quoted prices for similar assets and liabilities in active markets or inputs that are observable for the asset or liability) and Level 3 inputs (unobservable inputs supported by little or no market activity based on internal assumptions used to measure assets and liabilities). The classification of each financial asset or liability within the above hierarchy is determined based on the lowest level input that is significant to the fair value measurement.
Financial assets and liabilities measured at fair value on a recurring basis at September 30, 2012 and December 31, 2011, consisted of the following:
| (in thousands) | Fair Value Measurements | |||||||||||||||
| At September 30, 2012 | Total | Level 1 | Level 2 | Level 3 | ||||||||||||
| Mutual funds | $ | 1,682 | $ | 1,682 | $ | — | $ | — | ||||||||
| Investments | ||||||||||||||||
| Federal agency notes | $ | 35,169 | $ | 35,169 | $ | — | ||||||||||
| Commercial paper | $ | 41,083 | $ | 41,083 | $ | — | ||||||||||
| (in thousands) | Fair Value Measurements | |||||||||||||||
| At December 31, 2011 | Total | Level 1 | Level 2 | Level 3 | ||||||||||||
| Mutual funds | $ | 1,279 | $ | 1,279 | $ | — | $ | — | ||||||||
| Investments | ||||||||||||||||
| Federal agency notes | $ | 18,621 | $ | 18,621 | $ | — | ||||||||||
| Commercial paper | $ | 30,912 | $ | 30,912 | $ | — | ||||||||||
The fair value of mutual funds and investments is based on market prices which are readily available. Unrealized gains or losses on mutual funds and investments are recorded in Accumulated other comprehensive loss on the Consolidated Balance Sheet.
17
Financial assets and liabilities measured at fair value on a nonrecurring basis at September 30, 2012, and December 31, 2011, consisted of the following:
| (in thousands) | Fair Value Measurements | |||||||||||||||
| At September 30, 2012 | Total | Level 1 | Level 2 | Level 3 | ||||||||||||
| Convertible debentures | $ | 165,798 | $ | — | $ | 165,798 | $ | — | ||||||||
| Exempt facility revenue bonds | $ | 31,546 | $ | — | $ | — | $ | 31,546 | ||||||||
| Long-term investments | $ | 3,301 | $ | 3,301 | $ | — | $ | — | ||||||||
| (in thousands) | Fair Value Measurements | |||||||||||||||
| At December 31, 2011 | Total | Level 1 | Level 2 | Level 3 | ||||||||||||
| Convertible debentures | $ | 160,256 | $ | — | $ | 160,256 | $ | — | ||||||||
| Exempt facility revenue bonds | $ | 27,269 | $ | — | $ | — | $ | 27,269 | ||||||||
The Company used implicit interest rates of comparable unsecured obligations to calculate the fair value of the Company’s $30 million 8% Series 2000 exempt facility industrial revenue bonds at September 30, 2012, and December 31, 2011. The Company used its current trading data to determine the fair value of the Company’s $166.5 million 1.875% convertible debentures at September 30, 2012, and December 31, 2011. The fair value of the Company's long-term investments in certain Canadian exploration companies at September 30, 2012 is based on market prices which are readily available.
NOTE 14
RELATED PARTIES
The Palladium Alliance International (PAI) promotes the use of palladium in the worldwide jewelry market. Currently, the PAI receives its funding from the Company. In the third quarter of 2012, the Company made contributions of $1.8 million to PAI, compared to $3.9 million contributed in the same period in 2011. In the nine-month periods ending September 30, of 2012 and 2011, the Company made contributions to PAI of $7.4 million and $7.3 million, respectively. The Company records these contributions as marketing expense.
18
ITEM 2
MANAGEMENT’S DISCUSSION AND ANALYSIS OF FINANCIAL CONDITION AND
RESULTS OF OPERATIONS
The commentary that follows should be read in conjunction with the consolidated financial statements and notes thereto included in this quarterly report, as well as with the information provided in the Company's June 30, 2012 (as amended and filed on October 19, 2012), and March 31, 2012 Quarterly Reports on Form 10-Q and in the Company’s 2011 Annual Report on Form 10-K.
Overview
Stillwater Mining Company (the “Company”) is a Delaware corporation, headquartered in Billings, Montana and is listed on the New York and Toronto Stock Exchanges under the symbols SWC and SWC.U, respectively. The Company mines, processes, refines and markets palladium and platinum ores from two underground mines situated within the J-M Reef, an extensive trend of PGM mineralization located in Stillwater and Sweet Grass Counties in south central Montana. Ore produced from each of the mines is crushed and concentrated in mills located at each mine site. The resulting ore concentrates are then trucked to the Company’s smelting and refining complex in Columbus, Montana which further processes the mine concentrates and also recycles spent catalyst materials received from third parties. A portion of the recycling material is purchased for the Company’s own account and the balance is toll processed on behalf of others. The finished product from the refinery is a PGM-rich filter cake which is shipped to third parties for final refining into finished metal.
In addition to its Montana operations, the Company also controls the Marathon project, an advanced-stage PGM-copper development situated near the north shore of Lake Superior in the province of Ontario, Canada. In July of this year, the Marathon project team submitted an Environmental Impact Statement (EIS) report and supporting technical documents jointly to the Canadian Environmental Assessment Agency and the Ontario Ministry of the Environment. The environmental assessment and technical analysis will be conducted through a joint panel review with a panel recommendation ultimately going to the Federal and Provincial Ministers of the Environment for decision-making. The Company recently announced preliminary engineering findings that indicate the palladium metal content was overestimated in a portion of the original resource and reserve modeling work provided to the Company at the time of the acquisition. The Company still doesn't know the overall effect or materiality of these findings on Marathon's infrastructure, on its economics, or on its permitting timeline, but as the Company cautioned earlier, the effect is likely to be some deterioration in both project economics and ore reserves. At the same time, the Company is also seeing some potential increase in the overall resource tonnage as a result of higher metals prices, better-than-estimated metal recoveries and new drilling information, which might partially offset the effect of lower ore reserve grades. The Company expects the final engineering study to be completed during the first half of 2013.
The Company is further evaluating the matter as it continues its engineering and environmental assessment efforts at the Marathon project.
The Company also owns the Altar copper-gold property, located in the San Juan province of Argentina. Altar is an exploration-stage property with substantial drilling in place that indicates the presence of large copper-gold porphyry deposits and an ancillary gold discovery. The Company is conducting further exploratory drilling programs seasonally on the Altar property to determine its economic potential and the limits of the deposit. Additional years of drilling will likely be needed in order to complete this evaluation.
In Montana, the Company is in the midst of developing two new mining blocks adjacent to each of its current operations along the J-M Reef. The larger of the two, the Blitz project, eventually will extend underground access eastward from the existing Stillwater Mine infrastructure by about four-and-a-half miles on two separate levels. One of these development headings will be driven with a new tunnel-boring machine (TBM) that recently commenced operating underground from the east side of the Stillwater Mine. The other parallel heading is being driven about 600 feet above the first using conventional drill and blast methods. A new surface portal also will be constructed, that will intersect the two primary Blitz tunnels in order to provide adequate ventilation and emergency egress for the Blitz area. Total cost of the Blitz project is now estimated at about $197 million, to be incurred over a total of about six years. About $32.7 million has been incurred there to date. The second project, the Graham Creek development, is utilizing one of the original East Boulder TBMs to develop about 8,200 feet to the west of the existing East Boulder Mine infrastructure. TBM development at Graham Creek is scheduled to be completed late in the first quarter of 2013, after which two new vertical ventilation shafts to surface will be installed. The total cost of this extension, with associated ventilation, is now estimated to be about $13 million, to be spent over a total of about five years. To date about $2.6 million has been spent on the Graham Creek development.
19
The Company is dependent on cash flow from its PGM activities to sustain ongoing operations, as well as to fund the Montana mine expansion initiatives and the exploration and delineation work associated with the Marathon and Altar projects. Both the Marathon project and the Altar project, if they ultimately should prove to be commercial, will require substantial capital for the development of mines and corollary infrastructure. In the absence of completed engineering feasibility studies, the cost of these facilities cannot be estimated with precision today. The Company expects to utilize internally generated cash flows to fund part of the development of Marathon and Altar; however, the Company expects that financing from the capital markets, institutional lending markets or third parties will also be required to undertake construction of these projects. The availability of such financing will depend on future market conditions and opportunities.
Earlier this year, the Company announced the sale to Mitsubishi Corporation of a 25% interest in the Company's wholly owned subsidiary, Stillwater Canada Inc., which owns the Marathon project and related Canadian properties. As a result, Mitsubishi will also assume its proportionate share of future Marathon funding commitments. The Mitsubishi involvement may also facilitate securing future project financing in support of the Marathon development. The Marathon and Altar properties provide the Company with the opportunity and flexibility to pursue one or both of these growth initiatives in the future, to the extent metal prices and market conditions may permit. The Company does not currently expect to commit substantial capital to the Altar project until additional delineation drilling, engineering and feasibility studies are completed, probably several years in the future. For the first nine months of 2012, capital, exploration and cash overhead costs for Marathon activities (100% basis) totaled about $10.3 million, of which $6.9 million was capitalized as development costs of the Marathon project and $3.4 million was expensed as incurred. Exploration and cash overhead costs for the Peregrine properties (primarily Altar) totaled $15.9 million in the nine months ended September 30, 2012 and have been expensed as incurred.
In accordance with U.S. generally accepted accounting principles (GAAP), the Company is required to expense all exploration costs as incurred. Prior to 2012, the Company had not incurred significant exploration costs, but with the onset of significant exploratory activity at Altar and a limited exploration program in the Marathon area in 2012, the Company is expensing these costs currently against income. Taking into account the effect of these exploration expenses in reducing net income for the foreseeable future, shareholders should recognize that the Company is seeking to add long term value through its exploration efforts. Nevertheless, in view of the inherently early-stage nature of these efforts, there is no assurance that the Company's exploration programs will lead to economically viable mining operations.
Company Priorities, Planning and Financing
Subsequent to the end of the third quarter of 2012, on October 17, 2012, the Company completed the issuance and sale of $396.75 million of 1.75% senior unsecured convertible debentures, due October 15, 2032. Each $1,000 principal amount of these new debentures is initially convertible, under certain circumstances and during certain periods, into 60.4961 shares (subject to customary anti-dilution adjustments) of the Company's common stock, which represents an initial conversion price of $16.53 per share. The debentures also include an embedded conversion enhancement feature that is equivalent to including with each debenture a warrant initially exercisable for 30.2481 shares initially at $16.53 per share (both subject to customary anti-dilution adjustments). The Company, at its election, may settle conversions of the debentures in cash, shares of its common stock or any combination of cash and shares of its common stock. Debenture holders have the right to redeem their debentures at face value plus accrued and unpaid interest, to, but excluding, the relevant repurchase date on October 15 of each of 2019, 2024, 2029, and upon the occurrence of certain corporate events. The Company will have the right to call the debentures at any time on or after October 20, 2019. The debentures will be bifurcated under U.S. GAAP into separate debt and equity components, and will reflect an effective maturity (to the first optional redemption date) of seven years. The residual amount recorded within equity will be treated for accounting purposes as additional debt discount and will be accreted as an additional non-cash interest charge to earnings over the expected life. Issuance costs totaling about $12.4 million will be deducted from the gross proceeds of the offering and will be amortized ratably over 84 months. Net proceeds of the offering will be used to retire the Company's $166.5 million of outstanding 1.875% convertible debentures upon their expected redemption in March of 2013, and for general corporate purposes.
With the issuance of the recent convertible debentures, the Company currently has a more comfortable cash position. Even after repaying the $166.5 million of outstanding convertible debentures that are expected to be redeemed at par by the holders in March of 2013, the Company is likely to have cash and short-term investments on hand in excess of $400 million. In addition, the Company also maintains a $125 million asset-backed revolving line of credit, some portion of which can be drawn upon to support working capital needs. Available capacity under this line at September 30, 2012, was approximately $62.7 million. The Company's cash balance will be available to support initial construction spending at the Marathon project and as a liquidity cushion against any cyclical downturn in metals prices.
20
Market prices for palladium and platinum averaged $641 and $1,535 per ounce, respectively, during the first nine months of 2012, resulting in adjusted EBITDA (before exploration expense, abandonment of non-producing property, loss on long-term investments, loss on disposal of property, plant and equipment, and foreign currency transaction gain) for the first nine months of 2012 of about $88.0 million. Sale of the 25% interest in the Marathon property to Mitsubishi during the second quarter of 2012 generated $94.9 million of additional cash. Of this additional cash, $51.8 million was contributed into Marathon to pre-fund future development activities there; the remaining $43.1 million remains as available cash to the Company. Late in the second quarter of 2012, the Company reached an agreement to lease the TBM to be utilized at the Blitz project and was reimbursed $7.2 million to cover progress payments previously paid by the Company. As of September 30, 2012, the Company's consolidated balance of cash and highly liquid short-term securities totaled $274.7 million, including $45.9 million of cash dedicated to the Marathon project, and other related activities and therefore unavailable for other corporate purposes.
Management is pleased to have completed the recent convertible debenture offering. In view of the volatile capital markets experienced over the last few years, the political uncertainty concerning the upcoming U.S. elections and federal budget negotiations, the persistent financial problems within Europe, the growth and greater importance of China's role in the world economy, and the underlying volatility in metal prices, it has become far more difficult for companies generally and for the Company itself to predict and at times to plan for future financings. The completion of this offering, at a stated interest rate of 1.75%, essentially alleviates some of the short-term pressure on the Company and enables management to focus on longer-term objectives.
The Company's operations and its various projects will require significant commitments of capital over the next several years. Total capital spending guidance for 2012 was about $135 million, up from actual capital expenditures of $104.1 million in 2011 and $50.3 million in 2010. In addition to its capital programs, the Company budgeted almost $27 million to support 2012 exploration activities at Altar and Marathon. It now appears that capital and exploration spending for 2012 will end up lower than these planned levels, although a portion of the 2012 spending shortfall represents spending deferred into 2013.
The table below shows budgeted spending by project for the full year of 2012; actual expenditures by project during the nine-months ended September 30, 2012 and updated full-year 2012 spending guidance by project.
| (in millions) | Full Year 2012 Budget | Nine months ended September 30, 2012 Actual Expenditures | Full Year 2012 Updated Guidance | ||||||||
| Existing Operations | $ | 90.0 | $ | 59.8 | $ | 90.6 | |||||
| Blitz and Graham Creek projects | 23.4 | 19.6 | 23.5 | ||||||||
| Marathon project (100%) | 21.3 | 6.7 | 12.8 | ||||||||
| Subtotal – Capital | $ | 134.7 | $ | 86.1 | $ | 126.9 | |||||
| All Exploration * | 26.6 | 13.8 | 17.2 | ||||||||
| Total | $ | 161.3 | $ | 99.9 | $ | 144.1 | |||||
*The 2012 exploration budget includes $25 million of exploration and support costs at the Altar properties and $1.6 million of exploration and support costs at the Marathon properties.
With regard to longer-term spending requirements, the Company intends to finance as much of its exploration and development costs as possible out of internally generated cash flows. It is unlikely that Marathon construction can be completed without relying on external financing sources. If necessary, a portion of the funds from the Company's recent convertible debenture offering may serve as initial capital in support of Marathon until specific project financing is in place. Other than Marathon, the timing of expenditures for the Company's other projects is flexible and can be adjusted to accommodate pricing cycles in PGMs that affect the Company's available cash flows. In particular, weaker PGM prices could result in deferral of some of the Company's planned capital and exploration expenditures.
Looking more closely at the funding of specific projects, the Company has recently increased its estimate of total development costs at Blitz and Graham Creek, both of which began in 2011. The total estimated capital cost of the Blitz development is now about $197 million, up from previous guidance of about $180 million. The latest estimate for the Graham Creek project is about $13 million, up from previous guidance of about $8 million, reflecting in part the added cost of bringing in a contractor to develop the new ventilation raises for the project. These dollars are projected to be spent more or less ratably over a five- or six- year period. Preliminary estimates of the total cost to develop the Marathon project and place it into production suggest it will likely be in the range of $550 to $650 million, with a firmer estimate expected once the definitive engineering study is completed in 2013. Major construction spending at Marathon should begin in 2014, with first production likely in 2017, taking into account long lead-time items. The sale of the 25% interest in the Marathon properties to Mitsubishi Corporation should reduce the Company's share of future capital spending at Marathon from the estimated $550 to $650
21
million range (to first production) down to 75% of that estimate, or somewhere in the range of $400 to $500 million.
Future levels of spending at Altar will be evaluated year by year. The level of capital spending required to sustain the Company's existing Montana operations is expected to remain in the range of $80 to $90 million per year.
While a portion of the proceeds from the recent convertible debenture offering should be available to support initial development expenditures at Marathon, specific project financing or outside financing probably will be needed there. Various financing avenues for Marathon are currently being explored, with the final capital structure decision remaining open at least until completion of the Marathon definitive engineering study and the panel review of the project's environmental assessment, both of which are now under way. Management expects to work closely with its Marathon partner in an effort to secure appropriate financing. The availability and form of any future financing will depend on future market conditions and opportunities. There can be no assurance that the financial markets will be receptive to any offerings or that terms of other financing alternatives will be deemed acceptable. Any determination to proceed with construction and development of the Marathon project is expected to be made only when it is clear that the economics support such steps and commitments are in place with respect to the requisite financing.
Third Quarter 2012
For the third quarter of 2012, the Company reported consolidated net income attributable to common stockholders of $13.0 million, or $0.11 per fully diluted share, a decrease from the $40.7 million, or $0.37 per fully diluted share, reported in the third quarter 2011. The lower earnings primarily reflect lower PGM sales volumes and prices and higher consolidated total cash costs in this year's third quarter.
Mined palladium and platinum sold in this year's third quarter decreased to 124,300 ounces from 137,800 ounces in the third quarter of 2011, mostly reflecting lower production from the Stillwater Mine in the 2012 third quarter. The average realized price on sales of mined palladium and platinum was $803 per ounce in the third quarter of 2012, compared to $988 per ounce realized in the third quarter of 2011 and compared to $850 per ounce realized in the second quarter of 2012. Consolidated total cash costs per ounce for the Company’s mining operations (“total cash costs per ounce” is a non-GAAP measure further defined below in Reconciliation of Non-GAAP Measure to Costs of Revenues) averaged $496 per ounce in the 2012 third quarter, up from $439 per ounce in the 2011 third quarter and $454 per ounce in this year's second quarter. This increase in total cash costs per ounce between the third quarter of 2012 and the third quarter of 2011 is largely the result of lower mine production and higher labor costs, driven by higher contractual wage and benefit rates and a company-wide increase in total employees in Montana to 1,629 at September 30, 2012, from 1,493 at September 30, 2011. The increase in staffing levels was primarily attributable to hiring for the new-miner training program in support of new projects and to accommodate increasing underground travel distances and operations support requirements as the mines expand. The increase in third quarter 2012 total cash costs per ounce compared to this year's second quarter is primarily the result of lower third quarter mine production, together with the effect of a contractual wage increase effective July 1, 2012. The Company is reaffirming its full-year 2012 guidance for total cash costs of $500 per ounce.
PGM recycling revenues for the third quarter 2012 were $74.0 million, a decrease of 31.2% from the $107.5 million reported for the third quarter of 2011, mostly reflecting lower sales volumes and lower PGM prices.
The Company’s combined average realization on recycling sales was $985 per ounce in the third quarter of 2012, down from $1,230 per ounce realized in the third quarter of 2011 and also below the $1,030 per ounce realized in the second quarter of 2012. Revenues from sales of purchased recycling materials totaled $73.5 million in the 2012 third quarter, a decrease from $106.6 million in the same period last year. Tolling revenues decreased to $0.5 million in this year’s third quarter, compared to $0.8 million in the third quarter of 2011. The cost of metals sold from PGM recycling was $72.1 million in the third quarter of 2012 compared to $103.3 million in the third quarter of 2011, a decrease of 30.2%. Most of the cost of recycling material is attributable to purchasing spent catalyst for the Company's own account.
Broken out by business segment, the Company’s Montana mining operations earned $23.3 million before income taxes in the third quarter of 2012, off from $58.6 million in the same quarter last year. The difference was driven by a lower combined average selling price for palladium and platinum ($803 per ounce in the third quarter of 2012 compared to $988 per ounce in the third quarter of 2011), lower PGM sales volumes, and higher labor and material costs compared to the third quarter of 2011. Recycling activities (including finance charges) contributed earnings of $1.9 million in this year’s third quarter compared to $4.4 million in the same period last year. Lower pricing and volumes contributed to the decline. Canadian activities cost $1.3 million in the 2012 third quarter, compared to a cost of $0.9 million reported for the third quarter of 2011. Exploration expenses and overhead costs for the Peregrine Argentina properties (primarily Altar) totaled $1.5 million in the third quarter of 2012. The Company also recorded a foreign currency transaction gain of $6.5 million of which $6.1 million is related to converting into U.S. dollars an Argentine deferred income tax liability recorded in association with the acquisition of Peregrine Metals Ltd. Corporate and other expenses (excluding income taxes) totaled $13.8 million for the third quarter of 2012, compared to $18.6 million of expenses in the third quarter of 2011.
22
The Company's cash balance, excluding restricted cash, was $198.5 million at September 30, 2012, compared to $109.1 million as of December 31, 2011. Total liquidity, expressed as available cash plus short-term investments, at September 30, 2012, was $274.7 million, an increase from the $158.6 million reported at December 31, 2011. The cash collateral previously required (related to reclamation obligations) under the Company's surety bonds was reduced and the Company was able to substitute letters of credit under its current asset-backed revolving credit agreement with Wells Fargo Capital which allowed the Company to recover $15.8 million of its previously restricted cash balance during the third quarter of 2012. As of September 30, 2012, about $45.9 million of the Company's unrestricted cash was held in Canada and dedicated to the funding of future development at the Marathon project and other related activities; this cash is not available to the Stillwater parent for its general corporate purposes. Net working capital (including cash and short-term investments) decreased to $199.7 million at September 30, 2012, from $251.6 million at year end 2011. The decrease is attributable in part to reclassifying the Company's $166.5 million of outstanding 1.875% convertible debentures (due 2028) as a current liability. The terms of these debentures provide that the holders will have the right to redeem these debentures at face value on March 15, 2013. During the third quarter of 2012, recycling working capital increased to $57.8 million from the $55.7 million in the second quarter of 2012, as volumes and dollars in the recycling business increased along with increasing PGM prices late in the quarter.
Of the Company’s 1,629 Montana employees (as of September 30, 2012), approximately 805 Stillwater Mine employees and approximately 145 employees at the Columbus processing facilities are covered by a collective bargaining agreement with the USW Local 11-0001, which will expire on June 1, 2015. About 292 employees at the East Boulder Mine are covered by a separate collective bargaining agreement which will expire on December 31, 2015.
Mining Operations
The Company’s operating objectives for the full year of 2012 include targeted mine production of 500,000 combined ounces of palladium and platinum at a total consolidated cash cost of $500 per ounce. Mine production of palladium and platinum totaled 127,000 ounces in the 2012 third quarter, a 2.3% decrease from the 130,000 ounces produced in the third quarter of 2011 and a 4.8% decrease from the 133,400 total ounces produced during the second quarter of 2012. Most of this variability is the normal result of changes in mining conditions and the array of stopes available for mining in any period. Year-to-date mine production in 2012 is 381,200 ounces. Consequently, the Company is reaffirming its full-year 2012 mined production guidance of 500,000 ounces of palladium and platinum.
Combined total cash costs per mined ounce (a non-GAAP measure) averaged $496 per ounce in the third quarter of 2012. Year to date in 2012, combined total cash costs have averaged $487 per mined ounce. The Company’s full-year 2012 guidance for total cash costs is about $500 per ounce, up from $420 per ounce averaged in 2011. This 19.0% anticipated year-on-year increase in total cash costs for 2012 reflects increased support and maintenance staffing, an expanded miner training program, contractual increases in wage and benefit rates, an assumed inflationary bias in the cost of materials and supplies, and slightly lower 2012 mine production. At this point the Company is maintaining its total cash cost guidance of $500 per mined ounce for the full year 2012.
At the Stillwater Mine, third quarter 2012 palladium and platinum production totaled 94,100 ounces, a decrease of 2.8% from the 96,800 ounces in the third quarter of 2011, and a decrease of 4.1% from the 98,100 ounces produced in the second quarter of 2012. Average ore grades at the Stillwater Mine were approximately 0.62 combined ounces of palladium and platinum per ton in the quarter ending September 30, 2012 and 0.53 ounces per ton for the same period last year. Total ore tons mined at the Stillwater Mine averaged 1,806 tons per day during the third quarter of 2012, down from 2,188 tons per day in the third quarter of 2011 and less than the 1,951 tons per day averaged in the second quarter of 2012. These variations in tons mined are attributable to fluctuations in overall mining conditions, the mix of mining stopes available, emphasis on mine development, and the availability of miners.
Stillwater Mine’s total cash costs of $469 per ounce for the third quarter of 2012 were higher than the $411 per ounce averaged for the third quarter of 2011. Workforce levels at the Stillwater Mine increased by about 4.9% between the third quarter of 2011 and the third quarter of 2012, in part due to hiring for the new-miner training program, plus staffing increases to accommodate the increasing travel distances underground as the mining front continually recedes. Total labor costs have increased proportionately, up about 11.4% over the past year. Cash costs per ore ton mined (also a non-GAAP measure) at the Stillwater Mine were $266 for the 2012 third quarter, 35.0% higher than the $197 per ton reported for the third quarter of 2011, reflecting the 17.5% decrease in daily tons produced, plus the increased labor costs.
Capital expenditures at the Stillwater Mine, including Blitz, were $15.2 million for the third quarter of 2012, and $58.5 million year to date. That compares to the $21.2 million of capital spent during the third quarter of 2011 and $47.7 million spent through the first nine months of 2011. Primary and secondary development footages for third quarter 2012 at the Stillwater Mine were behind the comparable footages for the third quarter of last year, with primary and secondary development advancing about 8,800 feet in total, compared to 11,400 feet in last year's third quarter.
23
Diamond drilling footage for the third quarter of 2012 at the Stillwater Mine totaled about 69,200 feet, also behind the 82,800 feet drilled in the same period last year. Included in the Stillwater Mine 2012 capital spending is $4.1 million in the third quarter and $17.0 million year to date for development of the adjacent Blitz expansion project.
Mining production at the East Boulder Mine for the third quarter of 2012 was 32,900 combined ounces of palladium and platinum. This compares to 33,200 ounces produced at East Boulder in the third quarter of 2011, and 35,300 ounces in the second quarter of 2012. Total cash costs of $574 per mined ounce (a non-GAAP measure) for the third quarter of 2012 were substantially above the $520 per ounce at the East Boulder Mine in the third quarter of 2011. Again, the increased cash costs were directionally in line with manpower, increasing from 313 employees at the end of the 2011 third quarter to 375 employees at September 30, 2012. Most of the increase in manpower was associated with mine production and training activities. East Boulder Mine's third quarter 2012 cash costs of $574 per ounce were also higher than the $529 per ounce reported in this year's second quarter, mostly as a result of the lower ounce production.
Capital expenditures at the East Boulder Mine, including Graham Creek, totaled $5.2 million in the third quarter of 2012 and $15.9 million year to date, both about as budgeted. Capital spending in 2011 at the East Boulder Mine was $5.0 million in the third quarter and $13.7 million through the first nine months of 2011. Actual primary and secondary development at the East Boulder Mine advanced about 5,400 feet during the 2012 third quarter. The comparable development advance in the same period last year was 5,300 feet. The total TBM advance year-to-date in 2012 is about 3,700 feet. Diamond drilling footage at the East Boulder Mine totaled about 41,700 feet for the 2012 third quarter, a little short of the 43,000 feet in last year's third quarter. Graham Creek capital spending included in the totals above was $0.9 million in the 2012 third quarter and $2.6 million for the first nine months of 2012.
PGM Recycling
For the third quarter of 2012, the Company earned $1.9 million from recycling operations on revenues of $74.0 million, reflecting a combined average realization of $985 per sold ounce. Sold ounces of recycled PGMs (which include palladium, platinum and rhodium) decreased by 14.0% to 74,600 ounces in the 2012 third quarter, from 86,700 ounces for the third quarter of 2011. Tolled recycling ounces also declined during the third quarter of 2012, the Company processed and returned 22,400 ounces in the third quarter of 2012 compared to 30,400 ounces in the third quarter of 2011. Total recycling ounces processed, including both purchased and tolled materials, decreased to 96,200 ounces in the third quarter of 2012 from 133,500 ounces in the third quarter of 2011. Volumes of material available for recycling are sensitive to market prices and tend to decline during periods of lower PGM prices.
For the third quarter of 2011, the Company reported income from recycling operations of $4.4 million on revenues of $107.5 million and a combined average realization of $1,230 per sold ounce. Total tons of recycling material processed during the third quarter of 2012, including tolled material, averaged 14.8 tons per day, lower than the 22.2 tons per day processed in the third quarter of 2011. Weaker PGM prices during this year’s third quarter led to reduced volumes of recycling material available for processing as the quarter progressed. As noted previously, total ounces recycled in the third quarter of 2012, including toll ounces processed, were 96,200 ounces, compared to 133,500 ounces in the third quarter of 2011. A higher proportion of the ounces recycled during the 2012 third quarter came from recycling material purchased for the Company’s own account than was the case in the 2011 third quarter. The Company normally purchases material from spent automotive catalysts for its own account, while spent refinery and other industrial catalysts usually are toll processed for a fee and returned to the customer.
Outstanding procurement advances for material in transit that were not backed up by inventory physically in the Company’s possession at September 30, 2012 and December 31, 2011, totaled $3.3 million and $2.6 million, respectively. The Company’s total recycling working capital, including inventory and advances, was $57.8 million at September 30, 2012, and $64.5 million at December 31, 2011. The reduction in working capital is mostly the result of lower PGM prices.
As announced previously, the Company is also in the process of implementing a new slag cleaning circuit at its Columbus, Montana processing facility. The Company's previous smelting furnace was idled when a new and larger primary smelting furnace was commissioned in 2009. In 2011, the idled furnace was refurbished as planned in order to serve as a slag-cleaning furnace, supporting improved metal recoveries and additional recycling growth, as well as providing backup smelting capacity.
24
Engineering of the operating systems necessary to connect the modified furnace with the Company's primary smelting furnace, has now been completed and final construction is in progress. A mandatory furnace warming, required in starting the slag cleaning furnace operation, is currently underway. The furnace warming phase will be followed by firing up and conditioning of the reconfigured furnace. The electric arc in the reconfigured furnace has now been struck and conditioning of the furnace is currently underway. Once operational, the slag cleaning furnace will be temporarily used for smelting so that final modifications can be installed on the primary furnace. Construction is scheduled to be complete and the slag cleaning circuit fully operational at the beginning of December 2012. Company engineers have estimated that the slag cleaning operation will recover an estimated 4,000 ounces of PGMs annually from both mined and recycled materials that would otherwise remain bound up in the smelter slags.
Stillwater Canada Inc. – Marathon PGM-Copper Project
The Company's principal asset at Marathon is a large PGM-copper development project located just north of the town of Marathon, Ontario on the north shore of Lake Superior. The Marathon project is currently in the environmental review phase of permitting, and final detailed engineering studies are ongoing there. The Company's most current estimate of the capital cost to develop the Marathon project is in the range of $550 to $650 million; this estimate may be refined further once the detailed engineering study of the project now in progress is completed.
In April 2012, the Company concluded an $81.25 million cash transaction with Mitsubishi Corporation through which Mitsubishi acquired a 25% interest in the Company's wholly owned subsidiary Stillwater Canada Inc. Stillwater Canada Inc. owns the Marathon project and some related Canadian exploration properties. An initial cash call of $54.5 million at closing provided initial funding for the venture, of which 75%, or $40.9 million, was funded by Stillwater and 25%, or $13.6 million, by Mitsubishi. This cash infusion should be sufficient to meet all Marathon PGM-copper project and related requirements through the remainder of 2012 and most of 2013.
Mitsubishi and Stillwater will be responsible for funding their respective shares of future operating, capital and exploration expenditures on the Marathon properties. Mitsubishi also has agreed to cooperate and support efforts to secure project financing for Marathon. Under a related agreement, once Marathon is in operation Mitsubishi will have an option each year to purchase up to 100% of Marathon’s future PGM production at a relatively small discount to market. Stillwater will retain lead responsibility for managing the development and operation of Marathon.
The Company recently completed and submitted the Environmental Impact Statement for the Marathon project to the appropriate Canadian authorities. This environmental assessment of the Marathon project will be reviewed by a joint federal/provincial review panel in order to better coordinate consideration and public discussion of the Marathon project. In preparation for the environmental assessment, the Company and its predecessors have gathered extensive baseline information dealing with the natural environment and social and cultural background around the project area. These baseline studies have been underway since 2001 and have been supplemented and updated further since 2007. The baseline program includes research related to climate and meteorology, air quality, noise, geology, soils, wildlife, vegetation, groundwater, surface water, fish and fish habitat, socioeconomics, land use, and cultural and traditional knowledge. Computer modeling by third-party environmental, engineering and consulting firms has been included that assesses the cultural and environmental effects of all phases of the mine’s life cycle from construction through operation and closure. Additionally, the Company is consulting and working with local First Nations and aboriginal groups, nearby communities, federal and provincial government representatives and the public at large in an effort to move the project forward constructively.
In addition to this environmental review, the Company is also engaged in preparing a detailed engineering study that will produce the final engineering design as well as an updated economic assessment for the Marathon project. The Company recently announced preliminary engineering findings that indicate the palladium metal content was overestimated in a portion of the original resource and reserve modeling work provided to the Company at the time of the acquisition. The Company still doesn't know the overall effect or materiality of these findings on Marathon's infrastructure, on its economics, or on its permitting timeline, but as the Company cautioned earlier, the effect is likely to be some deterioration in both project economics and ore reserves. At the same time, the Company is also seeing some potential increase in the overall resource tonnage as a result of higher metals prices, better-than-estimated metal recoveries and new drilling information, which might partially offset the effect of lower ore reserve grades. The Company expects the final engineering study to be completed during the first half of 2013.
Altar Project
The Altar project is a large Andean copper-gold porphyry deposit located in the San Juan province of Argentina. The Company acquired this property in conjunction with its acquisition of Peregrine Metals Ltd., a transaction that was completed during the fourth quarter of 2011. The Company initially targeted approximately three years of spending at about $25 million per year to complete exploration work at Altar subject to a review each year of circumstances and continuing resource
25
potential. Once the exploration program is completed and the resource well defined, then the Company will determine if the results justify proceeding with engineering design work. If the project ultimately does proceed into development, the scale of the venture is likely to require bringing in one or more large financing and/or operating partners. Significant infrastructure investment would be required, in addition to the substantial cost of constructing the mine itself.
The Company completed the 2011-2012 drilling season at Altar in mid-April 2012, prior to the onset of seasonal heavy snowfall in the high Andes. Drilling activities at the Altar site currently are limited by weather to the southern hemisphere summer period between December and April of each year. The past season's drilling expanded the limits of the copper-gold mineralization at depth in the original Altar discovery area and confirmed the presence and significance of a second distinct mineralizing center with somewhat higher gold grades in the eastern portion of the Altar resource area. Further, reconnaissance drilling has discovered a potential third distinct mineralizing center indicating additional copper-gold potential on the Company's concessions north of the current Altar resource. Drilling activities have yet to define the perimeter of the Altar mineralization area. Added drilling at Quebrada de la Mina, a gold target to the northwest of the principal Altar mineral resource, indicated attractive gold grades but insufficient volumes to sustain a stand-alone gold operation there. Specific assay results from this season's drilling have been posted by the Company in a Form 8-K filing, accessible on the Company's website.
While Altar exploration and administrative expenditures were budgeted at about $25 million for 2012, only about $15.9 million in total has been spent to date through September, suggesting that even with spending to mobilize next year's drilling program late in the fourth quarter of 2012, total spending at Altar will probably not exceed $20 million this year. Drilling in the 2012-2013 season will focus on extending the Company's understanding of the Altar resource at depth, as well as trying to determine the eastern boundary of the mineralization.
Capital and Exploration Spending
Capital spending was budgeted to increase from $104.1 million in 2011 to about $135 million in 2012. Consolidated capital expenditures during the third quarter of 2012 totaled $25.4 million, bringing total capital spending to $84.7 million year to date through September 2012. This compares to consolidated capital expenditures of $27.9 million in the third quarter of 2011 and $74.2 million in the first nine months of 2011. The level of consolidated capital spending to date in 2012 is somewhat lower than planned, and after reviewing the capital spending outlook for the balance of the year, the Company has reduced its 2012 full-year capital spending guidance to about $127 million from $135 million. (The guidance shown is before adjusting for the Mitsubishi transaction. The Mitsubishi transaction would have the effect of reducing the Company's proportional share of 2012 Marathon capital spending by $3.2 million.) For additional detail of the 2012 capital spending, please refer to the table located in the "Company Priorities, Planning and Financing" section of the MD&A.
In addition to capital spending, the Company also budgeted about $26.6 million for exploration programs and related support expenses during 2012. The Company recognized exploration expense of $1.7 million in the third quarter of 2012, bringing total exploration expenses year-to-date to about $13.8 million. Exploration costs during the three- and nine- month periods ended September 30, 2011 were $0.3 million and $0.4 million, respectively. The Company now expects full-year 2012 exploration expenditures to total about $17.2 million, excluding administrative costs.
Supply and Demand Commentary for PGM Markets
(The following discussion reflects management’s assessment of the recent state of the PGM markets, based on discussion with industry analysts and the Company’s own observations of market dynamics. There can be no assurance that the Company’s conclusions reflect a complete or accurate picture of supply and demand trends, or outlook. However, management’s view of market conditions and the outlook for PGM supply and demand may influence its decisions on mining activities, future acquisitions, expansions or divestitures, capital investment, financing, hiring and many other factors.)
During 2012, market prices for palladium and platinum have largely been driven by extraordinary external events. A six-week strike in January and February at Impala Platinum's Rustenburg operations in South Africa drove PGM prices to a peak early in the year, but once the strike was resolved, prices soon drifted back downward. Platinum in particular has remained in oversupply during 2012 due mostly to softer demand from the European auto industry without any corresponding cutback in mine production to match. The usual summer stagnation in the PGM markets was compounded this year by Eurozone financial woes, which drove strong demand for U.S. dollars as a safe-haven currency, thereby pushing down commodity prices generally. This decline in PGM prices reached bottom in late July and early August. Subsequently, PGM prices then rallied as it appeared the European Central Bank had found a way to buoy up troubled member state economies, thereby reducing safe-haven demand for dollars and allowing commodity prices to recover. Headlines about labor violence in South Africa and the tragic shootings at Lonmin's Marikana Mine, along with the related mine shutdowns, created a brief price spike during September, particularly in platinum, but the underlying dynamic of slack demand for PGMs ultimately prevailed, and prices quickly stabilized.
26
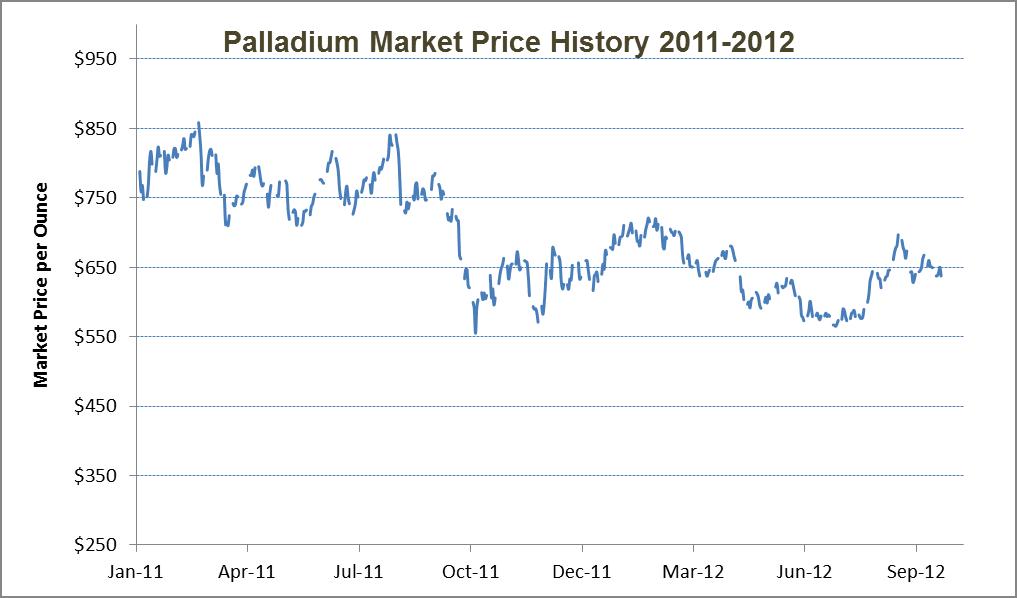
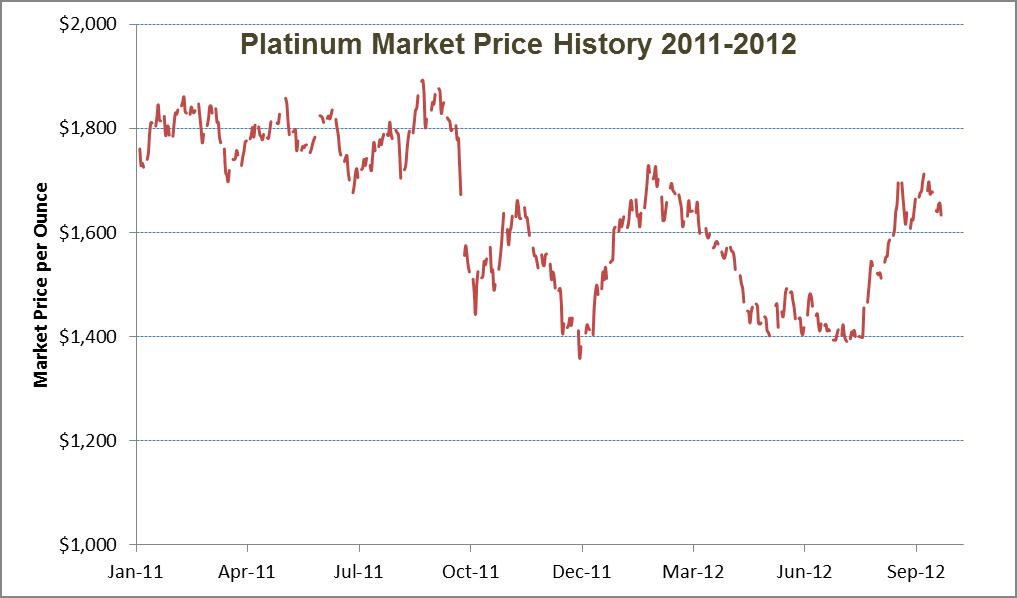
It may be instructive to compare the effect on the PGM market of recent events in South Africa with the situation there during the first quarter of 2008. Prior to the economic downturn that hit late in the second half of 2008, demand for platinum and palladium - particularly from the auto sector - was strong and metal markets were comparatively tight. When in January 2008 flooding took out a portion of South African coal production, the result was power rationing that led to cutbacks and temporary closures at some mining facilities. In response, platinum prices surged during the first quarter of 2008 from about $1,575 per ounce in mid-January to over $2,200 per ounce by early March. Palladium prices also increased, but to a lesser extent, from $379 per ounce in mid-January to a peak of $582 per ounce in early March. In contrast to 2008, the market reaction to the recent labor unrest in South Africa has been more muted. Platinum prices increased from a low of $1,390 per ounce in early August to $1,697 per ounce in mid-September, while palladium rose from its low of $565 per ounce in late July to $702 per ounce in mid-September. Prices for both metals have since receded, even though the total ounces of mine production lost this year greatly exceeds what was lost in 2008.
The difference between 2008 and today lies primarily in the supply picture. Unlike 2008, in 2012 platinum demand has been severely depressed as European automakers have scaled back production without any significant corresponding reduction in PGM output. As a result, analysts suggest that the platinum market has been oversupplied this year by perhaps 500,000 ounces. This surplus has driven down platinum prices in 2012 to a level that in many cases is below the total cash costs of production. Normally when this occurs the highest cost producers will scale back uneconomic production until prices bring supply back into balance with demand. However, in South Africa, where the most uneconomic operations are located, the government regards large-scale cutbacks, with the accompanying unemployment, as politically unacceptable. Consequently, there have been very few closures of high-cost mines and so the excess production has continued.
27
The same analysts that estimate 2012 overproduction of about 500,000 ounces of platinum also suggest that the cumulative impact of labor actions to date this year has been the loss of about 300,000 ounces of platinum production, partially absorbing the indicated market surplus. Even if all the labor unrest in South Africa were to be resolved today, it will take months to restore the affected mining operations to their previous levels of productivity, suggesting that the platinum surplus could be largely absorbed by the end of 2012. Whether the market then tightens and metal prices begin to rise depends on several factors.
The labor agreement ultimately reached between Lonmin and its employees at Marikana within the past month reportedly resulted in an effective wage increase on the order of 14%, substantially in excess of the underlying South African inflation rate. This will increase costs at an already high cost mine and has put pressure on other producers to provide similar wage increase. If economic activity picks up again worldwide and auto production in Europe recovers more quickly than expected, the surplus production from uneconomic mines could once again be absorbed and PGM prices could rise, allowing the producers to cover their higher costs. Alternatively, if cash remains tight and producers still are unable politically to cut back uneconomic production, they may instead choose to cut back on sustaining capital investment, which is less visible politically but ultimately is more damaging to production than mothballing high cost facilities. And finally, if nothing else happens, ultimately producers may run out of cash and go out of business, thereby reducing the oversupply, but painfully.
Palladium is less affected by the issues in South Africa, but it also is not especially in tight supply at this time. Experience suggests that during periods when the market for physical palladium is not especially tight, it tends to track the platinum price. From 2003 until mid-2010, the palladium price generally averaged between 20% and 25% of the platinum price. During 2010, Russian government exports of palladium declined and Toyota shifted to using palladium in place of platinum in its catalytic converters, resulting in a structural tightening of the palladium market. Since then, the palladium price has consistently averaged around 40% of the platinum price. It appears likely to remain in this range until a broad economic recovery emerges, at which time physical demand for palladium could tighten disproportionately, allowing the palladium price to rise in relation to platinum.
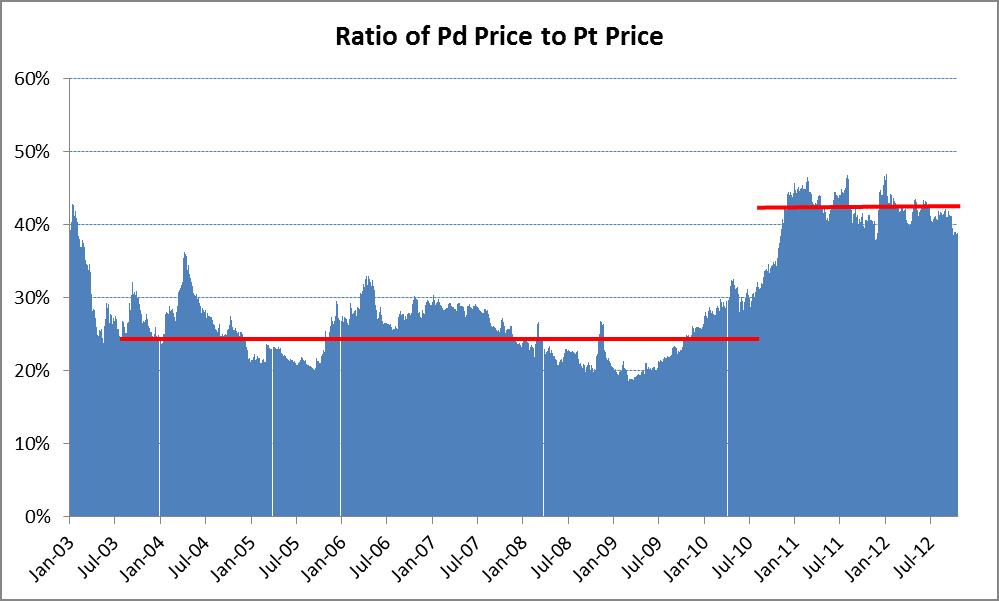
PGM mine production from other regions of the world appears to be flat to down slightly during 2012. Production from Zimbabwe remains stable, despite government efforts to extract more cash from the industry and impose indigenization requirements. All North American PGM operations appear to be in full production at this time. Nickel prices have been somewhat depressed in 2012, which constrains palladium by-product output, particularly from Norilsk Nickel. Exports from Russian government stockpiles have been extremely low during 2012, apparently less than 200,000 ounces to date. (Some ounces exported during 2011 may not have been sold until this year, however.) Recycling volumes available in the market have been lower than normal recently, reflecting the lower PGM prices seen this summer and perhaps anticipating higher prices going forward.
On the demand side, PGM requirements are largely driven by the needs of the automobile companies. Recovery from the downturn in 2008 and 2009 has been gradual, but worldwide annual light vehicle production is now well ahead of where it was before the downturn and is still increasing. Current forecasts suggest output of about 81 million light vehicles during 2012, up from about 74 million vehicles in 2010 and, as some analysts suggest, perhaps going to 100 million light vehicles by 2015 or 2016.
28
The North American auto market is generally healthy, showing strong year-on-year growth in 2012, despite isolated inventory backlog situations. Growth of the Chinese market has been weaker this year, reflecting a broader economic slowdown in the Chinese economy that some suggest may represent a “soft landing.” New stimulus measures reportedly are being introduced in China, which could result in stronger growth going forward. On the other hand, some large cities in China have imposed limits on the number of new automobile registrations they will accept each month, which could constrain future automotive sales somewhat. India remains a strong alternate market for diesel cars, as diesel fuel is heavily subsidized there, but the government reportedly is now taking steps to offset this inadvertent subsidy to private diesel vehicles. European output remains the laggard, of course, with sharply lower auto production particularly along its southern tier. Since more than half of European auto production is diesel, which requires higher platinum loadings, the depressed market in Europe is particularly hard on the platinum producers. Until now, the export market has helped offset lower local sales by European auto manufacturers, but imports into China in particular have now slowed. In response, Volvo has recently announced the temporary closure of a production facility in Europe.
Up to date reports on the jewelry market are harder to find, but it appears that platinum jewelry demand remains robust in China, its largest market, perhaps driven in part by lower prices and its alternative role as an investment vehicle. Palladium demand also appears to be growing again in response to an active marketing campaign, but off a much smaller base than platinum.
Sales and Customers
The Company currently has in place a three-year supply agreement with General Motors Corporation effective until December 31, 2013, that provides for fixed quantities of palladium to be delivered each month. The Company also has a one-year platinum supply agreement with Tiffany & Co., a supply agreement with Johnson Matthey, and a year-to-year supply agreement with Ford Motor Company. Some of these agreements provide for pricing at a small discount to a monthly trailing market price. The Company currently sells its remaining uncommitted mine production under spot sales agreements. Based on targeted 2012 mine production of about 500,000 PGM ounces, approximately 93% of the Company’s mined palladium production and 64% of its platinum production currently is committed under its supply agreements.
Strategic Areas of Emphasis
The Company’s management for many years has identified and focused on three broad strategic areas of emphasis. While specific initiatives have varied as markets have shifted and the Company has progressed, these fundamental strategic directions continue to provide a basic framework for management’s efforts to strengthen the Company. These elements are reflected in the Company’s Mission Statement – Operate Responsibly, Grow and Develop and Position the Company. Following is a brief update on the Company's progress in each of these three areas.
1. Operate Responsibly
In keeping with the Company’s focus on worker safety, Stillwater recently announced its commitment to the new CORESafety system, a U.S. mining industry safety initiative in development for the past two years and unanimously endorsed in early April 2012 by the National Mining Association’s executive board. Under CORESafety, Stillwater and its mining industry peers will work together toward a collective target of eliminating fatal accidents and sharply reducing the frequency and severity of on-the-job injuries within the mining industry over the next five years. CORESafety provides an unprecedented opportunity to improve worker safety in the mining industry by creating an industry-wide safety forum, providing the tools to continuously improve safety and health performance and then joining with peers in sharing best practices. It is comprised of a series of 20 modules, which can be prioritized to address specific gaps in safety and health performance based on the Company's own "gap analysis." The Company has selected eight of these modules to be given initial priority, with the others to follow.
The Company generally assesses its safety performance using two broad sets of measures, incidence rates and regulatory compliance. Under federal Mine Safety and Health Administration (MSHA) standards, reportable medical safety incidents include any work-related injury requiring specific medical care as defined by MSHA , with severity ratings broadly categorized as “medical reportables” (no workdays lost), “lost time accidents” (one or more days of work lost), and “fatalities.” For the first nine- months of 2012, the Company's incident rate, which is calculated as the number of reportable injuries per 200,000 hours worked, was 3.3, slightly better than the 3.4 rate experienced during the first nine months of 2011 and equal to the 3.3 rate experienced for the full year 2011. The Company assesses its safety regulatory compliance based on the number of citations issued to the Company by MSHA inspectors, and by their severity. Data on safety compliance is included in Exhibit 95 to this filing.
29
In addition to safety, it is critical that the Company conduct its operations efficiently and responsibly. Ore grades at the Company’s operations are some of the best in the world, and consequently total cash costs per ounce for the Company’s mining operations also rank among the lowest of any primary PGM producer in the industry. However, because the Company’s ore contains about 3.4 times as much palladium as platinum, and South African ores typically have about twice as much platinum as palladium, the Company’s average revenue per ounce is lower and, historically, operating margins may be tighter than for South African producers. Other significant PGM producers, including Norilsk Nickel and the Canadian nickel operations, produce PGMs as by-products, assigning them almost zero cost. Consequently, the Company often measures its performance, both relative to its own historical cost performance and in comparing its cost performance against other primary PGM producers, on a platinum-equivalent basis that takes into account differences in product mix. Platinum-equivalent costs are affected not only by actual cost performance, but also by changes in currency exchange rates, so the Company's relative cost position may shift over time. However, the Company believes its current level of operating costs, relative to the other primary PGM producers, has it positioned well competitively.
As already noted, the Company recently released a Corporate Sustainability Report that reviews in some detail its efforts to operate responsibly. This report is available on the Company's website and hard copies are available upon request. In summary, the Company takes its responsibilities to comply with, and hopefully exceed, all applicable safety, environmental and regulatory standards seriously. It also strives to be an active and involved corporate citizen in the communities in which it operates.
Although current manpower levels remain adequate to staff current operations, the Company will need to increase staffing in order to support the additional development necessary for future operating initiatives. The Company has instituted significant new-miner training programs during 2012 at both Montana mines in an effort to offset normal attrition as existing miners retire or leave, and also to provide future staffing for the expansion projects adjacent to the existing mines. At any one time during 2012, a total of about 50 employees will be involved in these training programs. The cost of these programs – including both wages and benefits paid within the training program and the effect on production of diverting some highly experienced miners into the program as trainers – is charged against our mining operations, which has escalated the labor component of our 2012 total cash costs per ounce disproportionately. However, management views these programs as an investment in the future, as skilled miners are scarce and a vitally important asset.
2. Develop and Grow Palladium Markets
The Company’s marketing efforts for 2012 are again focused largely on the jewelry markets. During 2012, the Company is continuing a series of magazine pieces highlighting the beauty and comfort of palladium jewelry, using the theme, “I’m So Over Heavy Metal.” These pieces have already appeared in popular fashion magazines, including Elle, W, Cosmopolitan and InStyle. In addition, palladium is being featured at important fashion and celebrity events in the U.S., Europe, Japan and China. The Company also is supporting programs by several key jewelry manufacturers and retailers to feature palladium jewelry lines targeting high-end and mid-tier markets. Several of these will debut during the last quarter of 2012.
Beyond jewelry, the Company continues to follow efforts by the U.S. Treasury to issue an official U.S. palladium coin. In 2010, the U.S. Congress and the president authorized a process for issuing an official palladium coin, although that process has since experienced some delays. Once in place, such a coin is mandated to be produced from palladium “mined from U.S. sources.” The Company also supports continuing efforts to broaden trading of palladium on major world commodity exchanges.
Other industrial applications for palladium include refinery catalysts, electronics, hydrogen generation and dentistry. Electronic uses that take advantage of palladium’s unique characteristics include multi-layered ceramic capacitors, high-end television screens, and compact discs. Palladium in thin films has a unique ability to pass hydrogen molecules while blocking other impurities, allowing relatively inexpensive production of high-purity hydrogen for chemical processes and fuel cells. Palladium alloys used in dental fillings wear well and have an expansion coefficient that closely matches that of the teeth themselves, although other materials tend to be substituted for palladium when its price rises.
3. Grow and Diversify the Company
The Company's efforts to develop new mining areas along the J-M Reef to the east of the Stillwater Mine (the Blitz project) and to the west of the East Boulder Mine (the Graham Creek project) both are continuing to progress. The Blitz project is about a $197 million, six-year development (commencing in 2011) that will extend two drifts (footwall laterals) approximately 23,000 feet to the east of the existing Stillwater Mine infrastructure. Development on one primary level will utilize a newly refurbished TBM; a second parallel level several hundred feet above the first drive will be developed using conventional drill-and-blast techniques. The Company also intends to develop a new access from the surface near the far
30
eastern end of the development that ultimately will intercept the footwall lateral drives to provide emergency egress for miners and ensure adequate ventilation. Definitional drilling into the reef during development will increase the Company's understanding of the geological composition of the J-M Reef to the east of the Stillwater Mine and perhaps define additional attractive mining areas for the future.
The Graham Creek project is about a $13 million project to be spent over a total of about five years, that will utilize an existing TBM to extend the existing East Boulder Mine infrastructure about 8,200 feet to the west. About 1,200 feet of this total was completed during 2011, and an additional 3,700 feet have been added to date in 2012. The TBM drive is expected to be completed during the second quarter of 2013, after which time two new ventilation shafts will be driven vertically to the surface. As with the Blitz project, definitional drilling along the new TBM drive will provide better geological understanding of that section of the J-M Reef.
Although its slate of growth and development projects is currently quite full, the Company continues to monitor the activities of various mineral exploration and development efforts around the world, as well as various other related business ventures. The focus of this monitoring is to identify opportunities to establish a broader operating base, reducing the Company's sole reliance on the Stillwater and East Boulder mine properties, thereby ultimately building value for the Company's shareholders.
The Company has acquired the Marathon and Peregrine assets over the past couple of years in order to provide some additional geographic and product diversity. The Marathon resource includes PGMs with a significant copper endowment, and Peregrine’s Altar project potentially could provide copper with gold. These projects, along with Blitz and Graham Creek, offer potential for future cash flow diversification and growth – although any significant financial benefit from these projects is still several years away.
The Company is researching more efficient technologies for processing PGMs. In particular, the Company is evaluating opportunities to develop its own precious metals refining capability. In addition, the Company has installed a small pilot plant on site at the Stillwater Mine as part of a joint research venture assessing a new technology designed to increase PGM recoveries in the mill.
31
RESULTS OF OPERATIONS
Comparison of Three- Month Periods Ended September 30, 2012 and 2011
The Company’s total revenues decreased by 28.6% to $181.0 million in the third quarter of 2012 compared to $253.7 million for the third quarter of 2011. The following analysis covers key factors contributing to the decrease in revenues:
32
SALES AND PRICE DATA
| Three Months Ended September 30, | Increase | Percentage | ||||||||||||
| (in thousands, except for average prices) | 2012 | 2011 | (Decrease) | Change | ||||||||||
| Revenues | $ | 181,044 | $ | 253,652 | $ | (72,608 | ) | (28.6 | )% | |||||
| Ounces Sold: | ||||||||||||||
| Mine Production: | ||||||||||||||
| Palladium (oz.) | 97 | 109 | (12 | ) | (11 | )% | ||||||||
| Platinum (oz.) | 27 | 29 | (2 | ) | (7 | )% | ||||||||
| Total | 124 | 138 | (14 | ) | (10 | )% | ||||||||
PGM recycling: (1) | ||||||||||||||
| Palladium (oz.) | 42 | 49 | (7 | ) | (14 | )% | ||||||||
| Platinum (oz.) | 27 | 31 | (4 | ) | (13 | )% | ||||||||
| Rhodium (oz.) | 6 | 6 | — | — | ||||||||||
| Total | 75 | 86 | (11 | ) | (13 | )% | ||||||||
Other: (5) | ||||||||||||||
| Platinum (oz.) | — | 1 | (1 | ) | (100 | )% | ||||||||
By-products from mining: (2) | ||||||||||||||
| Rhodium (oz.) | 1 | 2 | (1 | ) | (50 | )% | ||||||||
| Gold (oz.) | 2 | 2 | — | — | ||||||||||
| Silver (oz.) | 1 | 1 | — | — | ||||||||||
| Copper (lb.) | 219 | 218 | 1 | — | ||||||||||
| Nickel (lb.) | 295 | 301 | (6 | ) | (2 | )% | ||||||||
Average realized price per ounce (3) | ||||||||||||||
| Mine Production: | ||||||||||||||
| Palladium ($/oz.) | $ | 605 | $ | 772 | $ | (167 | ) | (22 | )% | |||||
| Platinum ($/oz.) | $ | 1,513 | $ | 1,784 | $ | (271 | ) | (15 | )% | |||||
Combined ($/oz.) (4) | 803 | $ | 988 | $ | (185 | ) | (19 | )% | ||||||
PGM recycling: (1) | ||||||||||||||
| Palladium ($/oz.) | $ | 620 | $ | 767 | $ | (147 | ) | (19 | )% | |||||
| Platinum ($/oz.) | $ | 1,491 | $ | 1,788 | $ | (297 | ) | (17 | )% | |||||
| Rhodium ($/oz.) | $ | 1,327 | $ | 2,192 | $ | (865 | ) | (39 | )% | |||||
Combined ($/oz.) (4) | $ | 985 | $ | 1,230 | $ | (245 | ) | (20 | )% | |||||
Other: (5) | ||||||||||||||
| Platinum ($/oz.) | $ | — | $ | 1,774 | $ | (1,774 | ) | (100 | )% | |||||
By-products from mining: (2) | ||||||||||||||
| Rhodium ($/oz.) | $ | 1,124 | $ | 1,832 | $ | (708 | ) | (39 | )% | |||||
| Gold ($/oz.) | $ | 1,692 | $ | 1,703 | $ | (11 | ) | (1 | )% | |||||
| Silver ($/oz.) | $ | 32 | $ | 41 | $ | (9 | ) | (22 | )% | |||||
| Copper ($/lb.) | $ | 3.34 | $ | 3.87 | $ | (0.53 | ) | (14 | )% | |||||
| Nickel ($/lb.) | $ | 6.16 | $ | 8.39 | $ | (2.23 | ) | (27 | )% | |||||
Average market price per ounce (3) | ||||||||||||||
| Palladium ($/oz.) | $ | 611 | $ | 753 | $ | (142 | ) | (19 | )% | |||||
| Platinum ($/oz.) | $ | 1,496 | $ | 1,771 | $ | (275 | ) | (16 | )% | |||||
Combined ($/oz.) (4) | $ | 804 | $ | 970 | $ | (166 | ) | (17 | )% | |||||
33
| (1) | Ounces sold and average realized price per ounce from PGM recycling relate to ounces produced from processing of catalyst materials. |
| (2) | By-product metals sold reflect contained metal. Realized prices reflect net values (discounted due to product form and transportation and marketing charges) per unit received. |
| (3) | The Company’s average realized price represents revenues, which include the effect of hedging gains and losses realized on commodity instruments and agreement discounts, divided by ounces sold. The average market price represents the average London Bullion Market Association afternoon postings for the actual months of the period. |
| (4) | The Company reports a combined average realized and a combined average market price of palladium and platinum at the same ratio as ounces that are produced from the base metal refinery. |
| (5) | Ounces sold and average realized price per ounce from Other relate to ounces purchased in the open market for resale. |
Net revenues from sales of mine production (including by-products) were $107.1 million in the third quarter of 2012, compared to $145.0 million for the same period in 2011, a 26.1% decrease. The decrease in mine production revenues reflects declining market prices accompanied by a decrease in volumes sold in the third quarter of 2012. The Company’s average combined realized price on sales of palladium and platinum from mining operations was $803 per ounce in the third quarter of 2012, compared to $988 per ounce in the same quarter of 2011. The total quantity of mined palladium and platinum sold decreased by 9.8% to 124,300 ounces in the third quarter of 2012, compared to 137,800 ounces sold during the same time period in 2011.
Revenues from PGM recycling decreased to $74.0 million in the third quarter of 2012, or 31.2%, from $107.5 million in the third quarter of 2011. The decrease in PGM recycling revenues is the result of lower PGM prices and lower volumes sold. The Company’s combined average realization on recycling sales (which include palladium, platinum and rhodium) was $985 per ounce in the third quarter of 2012, down 19.9% from $1,230 per ounce realized in the third quarter of last year. Recycled ounces sold decreased to 74,600 ounces in the third quarter of this year from 86,700 ounces in the third quarter of 2011. Processed recycled ounces, including ounces processed on a toll basis, decreased to 96,200 ounces in the third quarter of 2012, from 133,500 ounces in the third quarter of 2011. Revenues from sales of purchased recycling materials totaled $73.5 million in the third quarter of 2012, a decrease from $106.6 million in the same period last year. Tolling revenues declined to $0.5 million in this year’s third quarter, compared to $0.8 million in the third quarter of 2011.
The Company’s total costs of metals sold (before depletion, depreciation, amortization, and corporate overhead expenses) decreased to $142.0 million in the third quarter of 2012 from $175.5 million in the third quarter of 2011, a 19.1% decrease. The lower cost in 2012 was driven primarily by decreased volumes of recycling material purchased (and the related value of the contained metals) and lower mine production volumes offset in part by higher costs of mine production.
The costs of metals sold from mine production totaled $69.9 million for the third quarter of 2012, compared to $71.0 million for the third quarter of 2011, a 1.5% decrease. However, total consolidated cash costs per ounce produced, a non-GAAP measure of extraction efficiency, in the third quarter of 2012 rose by 13.0% to $496 per ounce, compared to $439 per ounce in the third quarter of 2011. This increase in total cash costs per ounce between the third quarter of 2012 and the third quarter of 2011 is largely the result of lower mine production and higher labor costs, driven by higher contractual wage and benefit rates and a company-wide increase in total employees in Montana.
The costs of metals sold from PGM recycling were $72.1 million in the third quarter of 2012, compared to $103.3 million in the third quarter of 2011, a decrease of 30.2%. This decrease was due to lower volumes sold and the related lower market value of the materials acquired for processing.
During the third quarter of 2012, the Company’s mining operations produced 127,000 ounces of PGMs, a 2.3% decrease from the 130,000 ounce production in the third quarter of 2011. Production in the third quarter of 2012 included 97,500 ounces of palladium and 29,500 ounces of platinum, compared to 100,100 palladium ounces and 29,900 platinum ounces produced in the third quarter of 2011. Production at the Stillwater Mine for the third quarter of 2012 was 94,100 ounces, a decrease from the 96,800 ounces produced in the third quarter of 2011, and production at the East Boulder Mine decreased slightly to 32,900 ounces from 33,200 ounces in the same period last year. The production decreases at the Stillwater Mine and the East Boulder Mine were driven by typical variability in mine production as the normal result of changes in mining conditions and the array of stopes available for mining in any period.
34
General and administrative (“G&A”) costs decreased to $9.9 million in the third quarter of 2012 from $13.1 million for the same period of 2011, an overall decrease of $3.2 million. The third quarter of 2011 included $4.7 million in expenses associated with financing activities and $1.3 million of acquisition costs related to Peregrine Metals Ltd. Exploration expenses totaled $1.7 million for the third quarter of 2012, of which almost all was attributable to the Altar copper-gold project. Exploration expenses during the third quarter of 2011 totaled $0.3 million. Marketing expenses totaled $1.9 million in the 2012 third quarter compared to $4.3 million in the same quarter of 2011. Research and development costs decreased to less than $0.1 million from $0.5 million in the same quarter of 2011. The Company recorded a loss on its long-term investments in certain Canadian exploration companies in the third quarter of 2012 of $1.7 million.
Total interest income for the third quarter of 2012 decreased to $0.3 million from $1.1 million in the corresponding quarter of 2011, mostly reflecting lower interest rates. Interest expense in the third quarters of 2012 and 2011 was $1.5 million (net of capitalized interest of $0.3 million) and $1.6 million, respectively.
During the third quarter of 2012, the Company recorded a foreign currency transaction gain of $6.6 million, primarily related to the deferred tax liability recorded in association with the acquisition of Peregrine Metals Ltd. The gain was a result of the strengthening of the U.S. dollar in comparison with the Argentine peso. As the deferred tax obligation will be settled at a future date in pesos, changes in the relative currency values are recognized in the period within transaction gain/loss on the consolidated statement of operations.
Comparison of Nine- Month Periods Ended September 30, 2012 and 2011
The Company’s total revenues decreased by 7.6% to $596.9 million in the first nine months of 2012 compared to $646.3 million for the first nine months of 2011. The following analysis covers key factors contributing to the decrease in revenues:
35
SALES AND PRICE DATA
| Nine Months Ended September 30, | Increase | Percentage | ||||||||||||
| (in thousands, except for average prices) | 2012 | 2011 | (Decrease) | Change | ||||||||||
| Revenues | $ | 596,870 | $ | 646,318 | $ | (49,448 | ) | (7.6 | )% | |||||
| Ounces Sold: | ||||||||||||||
| Mine Production: | ||||||||||||||
| Palladium (oz.) | 290 | 308 | (18 | ) | (6 | )% | ||||||||
| Platinum (oz.) | 85 | 82 | 3 | 4 | % | |||||||||
| Total | 375 | 390 | (15 | ) | (4 | )% | ||||||||
PGM recycling: (1) | ||||||||||||||
| Palladium (oz.) | 145 | 106 | 39 | 37 | % | |||||||||
| Platinum (oz.) | 86 | 71 | 15 | 21 | % | |||||||||
| Rhodium (oz.) | 19 | 13 | 6 | 46 | % | |||||||||
| Total | 250 | 190 | 60 | 32 | % | |||||||||
Other: (5) | ||||||||||||||
| Platinum (oz.) | — | 1 | (1 | ) | (100 | )% | ||||||||
By-products from mining: (2) | ||||||||||||||
| Rhodium (oz.) | 3 | 2 | 1 | 50 | % | |||||||||
| Gold (oz.) | 7 | 6 | 1 | 17 | % | |||||||||
| Silver (oz.) | 4 | 4 | — | — | ||||||||||
| Copper (lb.) | 568 | 612 | (44 | ) | (7 | )% | ||||||||
| Nickel (lb.) | 836 | 972 | (136 | ) | (14 | )% | ||||||||
Average realized price per ounce (3) | ||||||||||||||
| Mine Production: | ||||||||||||||
| Palladium ($/oz.) | $ | 640 | $ | 769 | $ | (129 | ) | (17 | )% | |||||
| Platinum ($/oz.) | $ | 1,536 | $ | 1,778 | $ | (242 | ) | (14 | )% | |||||
Combined ($/oz.) (4) | $ | 843 | $ | 981 | $ | (138 | ) | (14 | )% | |||||
PGM recycling: (1) | ||||||||||||||
| Palladium ($/oz.) | $ | 651 | $ | 744 | $ | (93 | ) | (13 | )% | |||||
| Platinum ($/oz.) | $ | 1,545 | $ | 1,770 | $ | (225 | ) | (13 | )% | |||||
| Rhodium ($/oz.) | $ | 1,449 | $ | 2,272 | $ | (823 | ) | (36 | )% | |||||
Combined ($/oz.) (4) | $ | 1,020 | $ | 1,232 | $ | (212 | ) | (17 | )% | |||||
Other: (5) | ||||||||||||||
| Platinum ($/oz.) | $ | — | $ | 1,774 | $ | (1,774 | ) | (100 | )% | |||||
By-products from mining: (2) | ||||||||||||||
| Rhodium ($/oz.) | $ | 1,310 | $ | 1,857 | $ | (547 | ) | (29 | )% | |||||
| Gold ($/oz.) | $ | 1,659 | $ | 1,519 | $ | 140 | 9 | % | ||||||
| Silver ($/oz.) | $ | 31 | $ | 37 | $ | (6 | ) | (16 | )% | |||||
| Copper ($/lb.) | $ | 3.42 | $ | 3.99 | $ | (0.57 | ) | (14 | )% | |||||
| Nickel ($/lb.) | $ | 6.77 | $ | 9.70 | $ | (2.93 | ) | (30 | )% | |||||
Average market price per ounce (3) | ||||||||||||||
| Palladium ($/oz.) | $ | 641 | $ | 768 | $ | (127 | ) | (17 | )% | |||||
| Platinum ($/oz.) | $ | 1,535 | $ | 1,782 | $ | (247 | ) | (14 | )% | |||||
Combined ($/oz.) (4) | $ | 843 | $ | 981 | $ | (138 | ) | (14 | )% | |||||
36
| (1) | Ounces sold and average realized price per ounce from PGM recycling relate to ounces produced from processing of catalyst materials. |
| (2) | By-product metals sold reflect contained metal. Realized prices reflect net values (discounted due to product form and transportation and marketing charges) per unit received. |
| (3) | The Company’s average realized price represents revenues, which include the effect of hedging gains and losses realized on commodity instruments and agreement discounts, divided by ounces sold. The average market price represents the average London Bullion Market Association afternoon postings for the actual months of the period. |
| (4) | The Company reports a combined average realized and a combined average market price of palladium and platinum at the same ratio as ounces that are produced from the base metal refinery. |
| (5) | Ounces sold and average realized price per ounce from Other relate to ounces purchased in the open market for resale. |
Net revenues from sales of mine production (includes by-products) were $340.0 million in the first nine months of 2012, compared to $406.7 million for the same period in 2011, a 16.4% decrease. The decrease in mine production revenues reflects reduced market prices for palladium and platinum sold in the first nine months of 2012. The Company’s average combined realized price on sales of palladium and platinum from mining operations decreased to $843 per ounce in the first nine months of 2012, compared to $981 per ounce in the same period of 2011. The total quantity of mined palladium and platinum sold in the first nine months of 2012 totaled 375,400 ounces compared to 389,500 ounces sold during the same time period in 2011.
Revenues from PGM recycling increased to $256.9 million in the first nine months of 2012, or 7.8%, from $238.4 million in the same period in 2011. Revenues from sales of purchased recycling materials totaled $254.8 million in the first nine months of 2012, up from $234.9 million in the same period last year. Tolling revenues declined to $2.1 million in this year’s first nine months, compared to $3.5 million in the first nine months of 2011. The increase in PGM recycling revenues is the result of higher volumes sold despite a decrease in the average realized price for PGMs. The Company’s combined average realization on recycling sales (which include palladium, platinum and rhodium) was $1,020 per ounce in the first nine months of 2012, down 17.2% from $1,232 per ounce realized in the first nine months of last year. Recycled ounces sold increased 31.0% to 249,900 ounces in the first nine months of this year from 190,700 ounces in the same period of 2011. The increase in PGM recycling revenue and recycled ounces sold during the first nine months of 2012 reflect a higher proportion of purchased ounces processed compared to the same period of 2011. Processed recycled ounces, including ounces processed on a toll basis, decreased to 326,600 ounces in the first nine months of 2012, from 374,300 ounces in the first nine months of 2011.
The Company’s total costs of metals sold (before depletion, depreciation, amortization, and corporate overhead expenses) increased to $468.3 million in the first nine months of 2012, from $425.5 million for the same period of 2011, a 10.1% increase. The higher cost in 2012 was driven primarily by higher volumes of recycling material purchased (partially offset by the related lower value of the contained metals) and higher costs of mine production.
The costs of metals sold from mine production totaled $218.9 million for the first nine months of 2012, compared to $196.4 million for the same period of 2011, an 11.5% increase. The increase reflected lower mine production and higher labor costs between the two periods.
Total consolidated cash costs per ounce produced, a non-GAAP measure of extraction efficiency, in the first nine months of 2012 rose by 16.2% to $487 per ounce, compared to $419 per ounce in the same period of 2011. This increase reflects overall higher labor costs, general inflation in materials and supplies and a decrease in mine production. Higher labor costs included an increase in contractual wage and benefit rates and hiring for the Company's new miner training program.
The costs of metals sold from PGM recycling were $249.4 million in the first nine months of 2012, compared to $228.0 million in the same period of 2011, an increase of 9.4%. This increase was due to higher volumes sold partially offset by the related lower market value of the materials acquired for processing.
During the first nine months of 2012, the Company’s mining operations produced 381,200 ounces of PGMs, a 5.6% decrease from the 403,800 ounces of production in the same period of 2011. Production in the first nine months of 2012 included 293,700 ounces of palladium and 87,500 ounces of platinum, compared to 311,000 palladium ounces and 92,800 platinum ounces produced in the same period of 2011. Production at the Stillwater Mine for the first nine months of 2012 was 279,900 ounces, a decrease from the 304,200 ounces produced in the same period of 2011, and production at the East Boulder Mine increased slightly to 101,300 ounces from 99,600 ounces in the same period last year. The production decrease at the Stillwater Mine and the relatively small production increase at the East Boulder Mine were driven by typical changes in mining conditions and the allocation of mining resources.
37
General and administrative (“G&A”) costs increased to $32.5 million in the first nine months of 2012 from $29.4 million for the same period of 2011, an overall increase of $3.1 million. This increase was primarily attributable to one-time software licensing fees, higher legal and advisory services and growth in project administrative costs. Exploration expenses totaled $13.8 million for the first nine months of 2012, of which almost all was attributable to the Altar copper-gold project. Exploration expenses during the first nine months of 2011 totaled $0.4 million. Marketing expenses remained fairly flat during the first nine months of 2012 at $7.9 million as compared to $8.0 million in the same period of 2011. Research and development costs decreased to $0.9 million for the first nine months of 2012 from $1.6 million for the same period in 2011.
Total interest income for the first nine months of 2012 decreased to $1.7 million from $2.8 million in the corresponding period of 2011, mostly reflecting lower interest rates. Interest expense in the first nine months of 2012 and 2011 was $4.4 million (net of capitalized interest of $0.9 million) and $4.9 million, respectively.
During the first nine months of 2012, the Company recorded a foreign currency transaction gain of $13.3 million, primarily related to the deferred tax liability recorded in association with the acquisition of Peregrine Metals Ltd. The gain was a result of the strengthening of the U.S. dollar in comparison with the Argentine peso. As the deferred tax obligation will be settled at a future date in pesos, changes in the relative currency values are recognized in the period within transaction gain/loss on the consolidated statement of operations.
LIQUIDITY AND CAPITAL RESOURCES
For the third quarter of 2012, net cash provided by operating activities was $45.1 million compared to $35.2 million in the third quarter of 2011. The Company’s net cash flow from operating activities is affected by several key factors, including net realized prices for its products, cash costs of production, and the level of PGM production from the mines as well as the volume of activity in its recycle business. Mining productivity rates and ore grades in turn can affect both PGM production and cash costs of production. Net cash flow from operations also includes changes in non-cash working capital, including changes to inventories and advances.
In its recycling activities, the Company customarily enters into fixed forward contracts that set the selling price for a significant portion of the recovered PGMs. Consequently, for outstanding recycling lots a change in the market price of palladium and platinum on sales of recycling materials would have little or no effect on margins earned from this activity or on cash flow from operations. However, a percentage change in market prices would affect margins on future lots by about the same percentage as the change in price. It normally takes existing lots of recycling material two to three months from the date of receipt to flow through to sales.
Changes in the cash costs of mine production generally flow through dollar-for-dollar into cash flow from operations. A reduction due to grade in total mine production of 10%, or about 50,000 palladium and platinum ounces per year, would reduce cash flow from operations by an estimated $40.0 million per year at the price and cost levels prevailing at September 30, 2012.
Net cash used in investing activities for the third quarter of 2012 was $43.3 million, comprised of cash capital expenditures of $25.4 million and a $17.9 million net increase in investments. In the same period of 2011 net cash provided by investing activities was $31.9 million, comprised of $27.9 million of cash capital expenditures, offset by a $59.8 million net reduction in investments.
Net cash consumed by financing activities for the third quarter of 2012 was $0.4 million, comprised of cash payments of principal and interest on capital lease obligations. In the same period of 2011, net cash provided by financing activities was $0.1 million as a result of cash received from the exercise of stock options.
At September 30, 2012, the Company’s cash and cash equivalents was $198.5 million, compared to $109.1 million at December 31, 2011. If highly liquid short-term investments are included with available cash, the Company’s balance sheet liquidity is $274.7 million at September 30, 2012, an increase from $158.6 million at December 31, 2011. This includes the funds received from Mitsubishi for their 25% interest in the Marathon PGM-copper project which closed in April of 2012. These September 30, 2012 cash and liquidity balances include about $45.9 million of cash held in Canada that is dedicated as funding for the Marathon PGM-copper project (and other related properties) and so is not available to the Company for its general corporate purposes.
38
Outstanding debt at September 30, 2012, was $203.3 million, up from $196.0 million at December 31, 2011. The Company’s total debt includes $166.5 million outstanding (and classified as current) in the form of convertible debentures with debenture holders having the right in March of 2013 to redeem their holdings at face value; $29.6 million of 8.0% State of Montana Exempt Facility Revenue Bonds due in 2020; $0.3 million of financing for a land purchase in 2012; and $6.9 million due under a capital lease with GE Capital. The Company expects to pay $1.3 million of interest during the remaining three months of 2012 related to its outstanding debt obligations. The Company made cash interest payments of $1.6 million during the third quarter of 2012.
The Company entered into a $100.0 million asset-backed revolving credit agreement with Wells Fargo Capital Finance in the fourth quarter of 2011. During the first quarter of 2012 the Company completed the syndication of this facility expanding the credit line to $125.0 million. Available capacity under the line was about $62.7 million at September 30, 2012, of which $8.3 million had been utilized for undrawn irrevocable letters of credit.
Subsequent to the end of the third quarter of 2012, on October 17, 2012, the Company completed the issuance and sale of $396.75 million of 1.75% senior unsecured convertible debentures, due October 15, 2032. Each $1,000 principal amount of these new debentures is initially convertible, under certain circumstances and during certain periods, into 60.4961 shares (subject to customary anti-dilution adjustments) of the Company's common stock, which represents an initial conversion price of $16.53 per share. The debentures also include an embedded conversion enhancement feature that is equivalent to including with each debenture a warrant initially exercisable for 30.2481 shares initially at $16.53 per share (both subject to customary anti-dilution adjustments). The Company, at its election, may settle conversions of the debentures in cash, shares of its common stock or any combination of cash and shares of its common stock. Debenture holders have the right to redeem their debentures at face value plus accrued and unpaid interest, to, but excluding, the relevant repurchase date on October 15 of each of 2019, 2024, 2029, and upon the occurrence of certain corporate events. The Company will have the right to call the debentures at any time on or after October 20, 2019. The debentures will be bifurcated under U.S. GAAP into separate debt and equity components, and will reflect an effective maturity (to the first optional redemption date) of seven years. The residual amount recorded within equity will be treated for accounting purposes as additional debt discount and will be accreted as an additional non-cash interest charge to earnings over the expected life. Issuance costs totaling about $12.4 million will be deducted from the gross proceeds of the offering and will be amortized ratably over 84 months. Net proceeds of the offering will be used to retire the Company's $166.5 million of outstanding 1.875% convertible debentures upon their expected redemption in March of 2013, and for general corporate purposes.
CONTRACTUAL OBLIGATIONS
The Company is obligated to make future payments under various debt agreements and regulatory obligations. The following table represents significant contractual cash obligations and other commercial and regulatory commitments, including related interest payments, as of September 30, 2012:
| (in thousands) | 2012 (1) | 2013 | 2014 | 2015 | 2016 | Thereafter | Total | |||||||||||||||||||||
| Convertible debentures | $ | — | $ | 166,500 | $ | — | $ | — | $ | — | $ | — | $ | 166,500 | ||||||||||||||
| Exempt Facility Revenue Bonds | — | — | — | — | — | 30,000 | 30,000 | |||||||||||||||||||||
| Land purchase | — | 93 | 89 | 85 | 81 | — | 348 | |||||||||||||||||||||
| Operating leases | 98 | 288 | 241 | 9 | 8 | 4 | 648 | |||||||||||||||||||||
| Capital lease obligation | 448 | 1,855 | 1,958 | 2,066 | 580 | — | 6,907 | |||||||||||||||||||||
| Asset retirement obligations | — | — | — | — | — | 144,271 | 144,271 | |||||||||||||||||||||
Payments of interest (2) | 1,294 | 4,275 | 2,611 | 2,502 | 2,408 | 8,400 | 21,490 | |||||||||||||||||||||
Other liabilities(3) | 12,946 | 7,821 | — | — | — | — | 20,767 | |||||||||||||||||||||
| Total | $ | 14,786 | $ | 180,832 | $ | 4,899 | $ | 4,662 | $ | 3,077 | $ | 182,675 | $ | 390,931 | ||||||||||||||
| (1) | Amounts represent cash obligations for October through December 2012. |
| (2) | Interest payments on the convertible debentures noted in the above table are calculated up to March 15, 2013, the first date the holders of the debentures can elect to redeem the debentures at face value. |
| (3) | Amounts included in other liabilities that are anticipated to be paid in 2012 and 2013 include property taxes and severance taxes. |
Interest payments noted in the table above all are based on fixed rates of interest.
39
FACTORS THAT MAY AFFECT FUTURE RESULTS AND FINANCIAL CONDITION
Some statements contained in this report are forward-looking statements within the meaning of Section 27A of the Securities Act of 1933, as amended, and Section 21E of the Securities Exchange Act of 1934, as amended, and, therefore, involve uncertainties or risks that could cause actual results to differ materially. These statements may contain words such as “believes,” “anticipates,” “plans,” “expects,” “intends,” “estimates” or similar expressions. Such statements also include, but are not limited to, comments regarding expansion plans, costs, grade, production and recovery rates; permitting; financing needs and the terms of future credit facilities; exchange rates; capital expenditures; increases in processing capacity; cost reduction measures; safety; timing for engineering studies; environmental permitting and compliance; litigating; labor matters; and the palladium, platinum, copper and gold market. These statements are not guarantees of the Company’s future performance and are subject to risks, uncertainties and other important factors that could cause its actual performance or achievements to differ materially from those expressed or implied by these forward-looking statements. Additional information regarding factors that could cause results to differ materially from management’s expectations is found in the Company’s 2011 Annual Report on Form 10-K, in its quarterly Form 10-Q filings, (on file with the United States Securities and Exchange Commission, available on the Company’s website) and in corresponding filings with Canadian securities regulatory authorities.
The Company intends that the forward-looking statements contained herein be subject to the above-mentioned statutory safe harbors. Investors are cautioned not to rely on forward-looking statements. The Company disclaims any obligation to update forward-looking statements.
CRITICAL ACCOUNTING POLICIES
Noncontrolling Interest - Noncontrolling interest arose from the sale of shares equaling a 25% ownership interest in Stillwater Canada Inc. during the second quarter of 2012. Noncontrolling interest is classified in the Consolidated Statements of Operations and Comprehensive Income as part of consolidated net income (loss) and the accumulated amount of noncontrolling interest in the Consolidated Balance Sheets as a component of stockholders' equity.
The Company’s other significant accounting policies are discussed in detail in the Company’s 2011 Annual Report on Form 10-K.
40
KEY OPERATING FACTORS
Stillwater Mining Company
Key Operating Factors
(Unaudited)
| Three Months Ended September 30, | Nine Months Ended September 30, | ||||||||||||||
| (in thousands, except where noted) | 2012 | 2011 | 2012 | 2011 | |||||||||||
| OPERATING AND COST DATA FOR MINE PRODUCTION | |||||||||||||||
Consolidated: | |||||||||||||||
| Ounces produced | |||||||||||||||
| Palladium | 98 | 100 | 294 | 311 | |||||||||||
| Platinum | 29 | 30 | 87 | 93 | |||||||||||
| Total | 127 | 130 | 381 | 404 | |||||||||||
| Tons milled | 262 | 283 | 801 | 873 | |||||||||||
| Mill head grade (ounce per ton) | 0.52 | 0.49 | 0.51 | 0.50 | |||||||||||
Sub-grade tons milled (1) | 19 | 24 | 49 | 64 | |||||||||||
| Sub-grade tons mill head grade (ounce per ton) | 0.18 | 0.19 | 0.17 | 0.18 | |||||||||||
Total tons milled (1) | 281 | 307 | 850 | 937 | |||||||||||
| Combined mill head grade (ounce per ton) | 0.50 | 0.47 | 0.49 | 0.47 | |||||||||||
| Total mill recovery (%) | 92 | 92 | 92 | 92 | |||||||||||
Total operating costs per ounce (Non-GAAP) (2) | $ | 417 | $ | 340 | $ | 406 | $ | 324 | |||||||
Total cash costs per ounce (Non-GAAP) (2) | $ | 496 | $ | 439 | $ | 487 | $ | 419 | |||||||
Total production costs per ounce (Non-GAAP) (2) | $ | 608 | $ | 553 | $ | 600 | $ | 531 | |||||||
Total operating costs per ton milled (Non-GAAP) (2) | $ | 189 | $ | 144 | $ | 182 | $ | 140 | |||||||
Total cash costs per ton milled (Non-GAAP) (2) | $ | 225 | $ | 186 | $ | 219 | $ | 181 | |||||||
Total production costs per ton milled (Non-GAAP) (2) | $ | 276 | $ | 235 | $ | 269 | $ | 229 | |||||||
Stillwater Mine: | |||||||||||||||
| Ounces produced | |||||||||||||||
| Palladium | 72 | 74 | 215 | 234 | |||||||||||
| Platinum | 22 | 22 | 65 | 70 | |||||||||||
| Total | 94 | 96 | 280 | 304 | |||||||||||
| Tons milled | 156 | 184 | 496 | 573 | |||||||||||
| Mill head grade (ounce per ton) | 0.64 | 0.55 | 0.61 | 0.56 | |||||||||||
Sub-grade tons milled (1) | 10 | 17 | 27 | 49 | |||||||||||
| Sub-grade tons mill head grade (ounce per ton) | 0.24 | 0.23 | 0.22 | 0.21 | |||||||||||
Total tons milled (1) | 166 | 201 | 523 | 622 | |||||||||||
| Combined mill head grade (ounce per ton) | 0.62 | 0.53 | 0.59 | 0.53 | |||||||||||
| Total mill recovery (%) | 92 | 92 | 92 | 92 | |||||||||||
Total operating costs per ounce (Non-GAAP) (2) | $ | 395 | $ | 317 | $ | 382 | $ | 312 | |||||||
Total cash costs per ounce (Non-GAAP) (2) | $ | 469 | $ | 411 | $ | 457 | $ | 401 | |||||||
Total production costs per ounce (Non-GAAP) (2) | $ | 582 | $ | 532 | $ | 574 | $ | 520 | |||||||
Total operating costs per ton milled (Non-GAAP) (2) | $ | 224 | $ | 152 | $ | 204 | $ | 153 | |||||||
Total cash costs per ton milled (Non-GAAP) (2) | $ | 266 | $ | 197 | $ | 244 | $ | 196 | |||||||
Total production costs per ton milled (Non-GAAP) (2) | $ | 330 | $ | 256 | $ | 307 | $ | 254 | |||||||
41
Stillwater Mining Company
Key Operating Factors (continued)
(Unaudited)
| Three Months Ended September 30, | Nine Months Ended September 30, | ||||||||||||||
| 2012 | 2011 | 2012 | 2011 | ||||||||||||
| OPERATING AND COST DATA FOR MINE PRODUCTION | |||||||||||||||
| (Continued) | |||||||||||||||
East Boulder Mine: | |||||||||||||||
| Ounces produced | |||||||||||||||
| Palladium | 26 | 26 | 79 | 77 | |||||||||||
| Platinum | 7 | 8 | 22 | 23 | |||||||||||
| Total | 33 | 34 | 101 | 100 | |||||||||||
| Tons milled | 106 | 99 | 305 | 300 | |||||||||||
| Mill head grade (ounce per ton) | 0.34 | 0.37 | 0.36 | 0.37 | |||||||||||
Sub-grade tons milled (1) | 9 | 7 | 22 | 15 | |||||||||||
| Sub-grade tons mill head grade (ounce per ton) | 0.10 | 0.09 | 0.11 | 0.10 | |||||||||||
Total tons milled (1) | 115 | 106 | 327 | 315 | |||||||||||
| Combined mill head grade (ounce per ton) | 0.32 | 0.35 | 0.35 | 0.36 | |||||||||||
| Total mill recovery (%) | 90 | 90 | 90 | 89 | |||||||||||
Total operating costs per ounce (Non-GAAP) (2) | $ | 480 | $ | 407 | $ | 472 | $ | 362 | |||||||
Total cash costs per ounce (Non-GAAP) (2) | $ | 574 | $ | 520 | $ | 570 | $ | 474 | |||||||
Total production costs per ounce (Non-GAAP) (2) | $ | 684 | $ | 616 | $ | 674 | $ | 567 | |||||||
Total operating costs per ton milled (Non-GAAP) (2) | $ | 138 | $ | 129 | $ | 147 | $ | 114 | |||||||
Total cash costs per ton milled (Non-GAAP) (2) | $ | 165 | $ | 165 | $ | 177 | $ | 150 | |||||||
Total production costs per ton milled (Non-GAAP) (2) | $ | 197 | $ | 195 | $ | 209 | $ | 179 | |||||||
| (1) | Sub-grade tons milled includes reef waste material only. Total tons milled includes ore tons and sub-grade tons only. See “Proven and Probable Ore Reserves – Discussion” in the Company’s 2011 Annual Report on Form 10-K for further information. |
| (2) | Total operating costs include costs of mining, processing and administrative expenses at the mine site (including mine site overhead and credits for metals produced other than palladium and platinum from mine production). Total cash costs include total operating costs plus royalties, insurance and taxes other than income taxes. Total production costs include total cash costs plus asset retirement costs and depreciation and amortization. Income taxes, corporate general and administrative expenses, asset impairment write-down’s, gain or loss on disposal of property, plant and equipment, restructuring costs and interest income and expense are not included in total operating costs, total cash costs or total production costs. Operating costs per ton, operating costs per ounce, cash costs per ton, cash costs per ounce, production costs per ton and production costs per ounce are non-GAAP measurements that management uses to monitor and evaluate the efficiency of its mining operations. These measures of cost are not defined under U.S. Generally Accepted Accounting Principles (GAAP). Please see “Reconciliation of Non-GAAP Measures to Costs of Revenues” and the accompanying discussion for additional detail. |
42
Stillwater Mining Company
Key Operating Factors (continued)
(Unaudited)
| (in thousands, except for average prices) | Three Months Ended September 30, | Nine Months Ended September 30, | |||||||||||||
| 2012 | 2011 | 2012 | 2011 | ||||||||||||
| SALES AND PRICE DATA | |||||||||||||||
| Ounces sold | |||||||||||||||
| Mine production: | |||||||||||||||
| Palladium (oz.) | 97 | 109 | 290 | 308 | |||||||||||
| Platinum (oz.) | 27 | 29 | 85 | 82 | |||||||||||
| Total | 124 | 138 | 375 | 390 | |||||||||||
PGM recycling: (1) | |||||||||||||||
| Palladium (oz.) | 42 | 49 | 145 | 106 | |||||||||||
| Platinum (oz.) | 27 | 31 | 86 | 71 | |||||||||||
| Rhodium (oz.) | 6 | 6 | 19 | 13 | |||||||||||
| Total | 75 | 86 | 250 | 190 | |||||||||||
Other: (5) | |||||||||||||||
| Platinum (oz.) | — | 1 | — | 1 | |||||||||||
By-products from mining: (2) | |||||||||||||||
| Rhodium (oz.) | 1 | 2 | 3 | 2 | |||||||||||
| Gold (oz.) | 2 | 2 | 7 | 6 | |||||||||||
| Silver (oz.) | 1 | 1 | 4 | 4 | |||||||||||
| Copper (lb.) | 219 | 218 | 568 | 612 | |||||||||||
| Nickel (lb.) | 295 | 301 | 836 | 972 | |||||||||||
Average realized price per ounce (3) | |||||||||||||||
| Mine production: | |||||||||||||||
| Palladium ($/oz.) | $ | 605 | $ | 772 | $ | 640 | $ | 769 | |||||||
| Platinum ($/oz.) | $ | 1,513 | $ | 1,784 | $ | 1,536 | $ | 1,778 | |||||||
Combined ($/oz)(4) | $ | 803 | $ | 988 | $ | 843 | $ | 981 | |||||||
PGM recycling: (1) | |||||||||||||||
| Palladium ($/oz.) | $ | 620 | $ | 767 | $ | 651 | $ | 744 | |||||||
| Platinum ($/oz.) | $ | 1,491 | $ | 1,788 | $ | 1,545 | $ | 1,770 | |||||||
| Rhodium ($/oz) | $ | 1,327 | $ | 2,192 | $ | 1,449 | $ | 2,272 | |||||||
Combined ($/oz)(4) | $ | 985 | $ | 1,230 | $ | 1,020 | $ | 1,232 | |||||||
Other: (5) | |||||||||||||||
| Platinum ($/oz.) | $ | — | $ | 1,774 | $ | — | $ | 1,774 | |||||||
By-products from mining: (2) | |||||||||||||||
| Rhodium ($/oz.) | $ | 1,124 | $ | 1,832 | $ | 1,310 | $ | 1,857 | |||||||
| Gold ($/oz.) | $ | 1,692 | $ | 1,703 | $ | 1,659 | $ | 1,519 | |||||||
| Silver ($/oz.) | $ | 32 | $ | 41 | $ | 31 | $ | 37 | |||||||
| Copper ($/lb.) | $ | 3.34 | $ | 3.87 | $ | 3.42 | $ | 3.99 | |||||||
| Nickel ($/lb.) | $ | 6.16 | $ | 8.39 | $ | 6.77 | $ | 9.70 | |||||||
Average market price per ounce (3) | |||||||||||||||
| Palladium ($/oz.) | $ | 611 | $ | 753 | $ | 641 | $ | 768 | |||||||
| Platinum ($/oz.) | $ | 1,496 | $ | 1,771 | $ | 1,535 | $ | 1,782 | |||||||
Combined ($/oz)(4) | $ | 804 | $ | 970 | $ | 843 | $ | 981 | |||||||
43
| (1) | Ounces sold and average realized price per ounce from PGM recycling relate to ounces produced from processing of catalyst materials. |
| (2) | By-product metals sold reflect contained metal. Realized prices reflect net values (discounted due to product form and transportation and marketing charges) per unit received. |
| (3) | The Company’s average realized price represents revenues, which include the effect of hedging gains and losses realized on commodity instruments and agreement discounts, divided by ounces sold. The average market price represents the average London Bullion Market Association afternoon postings for the actual months of the period. |
| (4) | The Company reports a combined average realized and a combined average market price of palladium and platinum at the same ratio as ounces that are produced from the base metal refinery. |
| (5) | Ounces sold and average realized price per ounce from Other relate to ounces purchased in the open market for resale. |
Reconciliation of Non-GAAP Measures to Costs of Revenues
The Company utilizes certain non-GAAP measures as indicators in assessing the performance of its mining and processing operations during any period. Because of the processing time required to complete the extraction of finished PGM products, there are typically lags of one to three months between ore production and sale of the finished product. Sales in any period include some portion of material mined and processed from prior periods as the revenue recognition process is completed. Consequently, while costs of revenues (a GAAP measure included in the Company’s Consolidated Statement of Operations and Comprehensive Income) appropriately reflects the expense associated with the materials sold in any period, the Company has developed certain non-GAAP measures to assess the costs associated with its producing and processing activities in a particular period and to compare those costs between periods.
While the Company believes that these non-GAAP measures may also be of value to outside readers, both as general indicators of the Company’s mining efficiency from period to period and as insight into how the Company internally measures its operating performance, these non-GAAP measures are not standardized across the mining industry and in most cases will not be directly comparable to similar measures that may be provided by other companies. These non-GAAP measures are only useful as indicators of relative operational performance in any period, and because they do not take into account the inventory timing differences that are included in costs of revenues, they cannot meaningfully be used to develop measures of earnings or profitability. A reconciliation of these measures to costs of revenues for each period shown is provided as part of the following tables, and a description of each non-GAAP measure is provided below.
Total Costs of Revenues: For the Company as a whole, this measure is equal to total costs of revenues, as reported in the Consolidated Statement of Operations and Comprehensive Income. For the Stillwater Mine, the East Boulder Mine, and other PGM activities, the Company segregates the expenses within total costs of revenues that are directly associated with each of these activities and then allocates the remaining facility costs included in total cost of revenues in proportion to the monthly volumes from each activity. The resulting total costs of revenues measures for the Stillwater Mine, the East Boulder Mine and other PGM activities are equal in total to total costs of revenues as reported in the Company’s Consolidated Statement of Operations and Comprehensive Income.
Total Production Costs (Non-GAAP): Calculated as total costs of revenues (for each mine or combined) adjusted to exclude gains or losses on asset dispositions, costs and profit from recycling activities, revenues from the sale of mined by-products and timing differences resulting from changes in product inventories. This non-GAAP measure provides a comparative measure of the total costs incurred in association with production and processing activities in a period, and may be compared to prior periods or between the Company’s mines.
When divided by the total tons milled in the respective period, Total Production Cost per Ton Milled (Non-GAAP) – measured for each mine or combined – provides an indication of the cost per ton milled in that period. Because of variability of ore grade in the Company’s mining operations, production efficiency underground is frequently measured against ore tons produced rather than contained PGM ounces. Because ore tons are first actually weighed as they are fed into the mill, mill feed is the first point at which production tons are measured precisely. Consequently, Total Production Cost per Ton Milled (Non-GAAP) is a general measure of production efficiency, and is affected both by the level of Total Production Costs (Non-GAAP) and by the volume of tons produced and fed to the mill.
When divided by the total recoverable PGM ounces from production in the respective period, Total Production Cost per Ounce (Non-GAAP) – measured for each mine or combined – provides an indication of the cost per ounce produced in that period. Recoverable PGM ounces from production are an indication of the amount of PGM product extracted through mining in any period. Because extracting PGM material is ultimately the objective of mining, the cost per ounce of extracting and processing PGM ounces in a period is a useful measure for comparing extraction efficiency between periods and between the Company’s mines. Consequently, Total Production Cost per Ounce (Non-GAAP) in any period is a general measure of
44
extraction efficiency, and is affected by the level of Total Production Costs (Non-GAAP), by the grade of the ore produced and by the volume of ore produced in the period.
Total Cash Costs (Non-GAAP): This non-GAAP measure is calculated by excluding the depreciation and amortization and asset retirement costs from Total Production Costs (Non-GAAP) for each mine or combined. The Company uses this measure as a comparative indication of the cash costs related to production and processing in any period.
When divided by the total tons milled in the respective period, Total Cash Cost per Ton Milled (Non-GAAP) – measured for each mine or combined – provides an indication of the level of cash costs incurred per ton milled in that period. Because of variability of ore grade in the Company’s mining operations, production efficiency underground is frequently measured against ore tons produced rather than contained PGM ounces. Because ore tons are first weighed as they are fed into the mill, mill feed is the first point at which production tons are measured precisely. Consequently, Total Cash Cost per Ton Milled (Non-GAAP) is a general measure of production efficiency, and is affected both by the level of Total Cash Costs (Non-GAAP) and by the volume of tons produced and fed to the mill.
When divided by the total recoverable PGM ounces from production in the respective period, Total Cash Cost per Ounce (Non-GAAP) – measured for each mine or combined – provides an indication of the level of cash costs incurred per PGM ounce produced in that period. Recoverable PGM ounces from production are an indication of the amount of PGM product extracted through mining in any period. Because ultimately extracting PGM material is the objective of mining, the cash cost per ounce of extracting and processing PGM ounces in a period is a useful measure for comparing extraction efficiency between periods and between the Company’s mines. Consequently, Total Cash Cost per Ounce (Non-GAAP) in any period is a general measure of extraction efficiency, and is affected by the level of Total Cash Costs (Non-GAAP), by the grade of the ore produced and by the volume of ore produced in the period.
Total Operating Costs (Non-GAAP): This non-GAAP measure is derived from Total Cash Costs (Non-GAAP) for each mine or combined by excluding royalty, tax and insurance expenses from Total Cash Costs (Non-GAAP). Royalties, taxes and insurance costs are contractual or governmental obligations outside of the control of the Company’s mining operations, and in the case of royalties and most taxes, are driven more by the level of sales realizations rather than by operating efficiency. Consequently, Total Operating Costs (Non-GAAP) is a useful indicator of the level of production and processing costs incurred in a period that are under the control of mining operations.
When divided by the total tons milled in the respective period, Total Operating Cost per Ton Milled (Non-GAAP) – measured for each mine or combined – provides an indication of the level of controllable cash costs incurred per ton milled in that period. Because of variability of ore grade in the Company’s mining operations, production efficiency underground is frequently measured against ore tons produced rather than contained PGM ounces. Because ore tons are first actually weighed as they are fed into the mill, mill feed is the first point at which production tons are measured precisely. Consequently, Total Operating Cost per Ton Milled (Non-GAAP) is a general measure of production efficiency, and is affected both by the level of Total Operating Costs (Non-GAAP) and by the volume of tons produced and fed to the mill.
When divided by the total recoverable PGM ounces from production in the respective period, Total Operating Cost per Ounce (Non-GAAP) – measured for each mine or combined – provides an indication of the level of controllable cash costs incurred per PGM ounce produced in that period. Recoverable PGM ounces from production are an indication of the amount of PGM product extracted through mining in any period. Because ultimately extracting PGM material is the objective of mining, the cost per ounce of extracting and processing PGM ounces in a period is a useful measure for comparing extraction efficiency between periods and between the Company’s mines. Consequently, Total Operating Cost per Ounce (Non-GAAP) in any period is a general measure of extraction efficiency, and is affected by the level of Total Operating Costs (Non-GAAP), by the grade of the ore produced and by the volume of ore produced in the period.
45
Reconciliation of Non-GAAP Measures to Costs of Revenues
| Three Months Ended September 30, | Nine Months Ended September 30, | ||||||||||||
| (in thousands) | 2012 | 2011 | 2012 | 2011 | |||||||||
| Consolidated: | |||||||||||||
| Reconciliation to consolidated costs of revenues: | |||||||||||||
| Total operating costs (Non-GAAP) | $ | 52,943 | $ | 44,212 | $ | 154,686 | $ | 130,966 | |||||
| Royalties, taxes and other | 10,108 | 12,823 | 31,023 | 38,251 | |||||||||
| Total cash costs (Non-GAAP) | $ | 63,051 | $ | 57,035 | $ | 185,709 | $ | 169,217 | |||||
| Asset retirement costs | 160 | 147 | 471 | 432 | |||||||||
| Depletion, depreciation and amortization | 13,843 | 15,359 | 42,848 | 46,555 | |||||||||
| Depletion, depreciation and amortization (in inventory) | 217 | (580 | ) | (141 | ) | (1,670 | ) | ||||||
| Total production costs (Non-GAAP) | $ | 77,271 | $ | 71,961 | $ | 228,887 | $ | 214,534 | |||||
| Change in product inventories | (2,764 | ) | 2,068 | 973 | (6,143 | ) | |||||||
| Cost of PGM recycling | 72,096 | 103,336 | 249,360 | 228,042 | |||||||||
| PGM recycling – depreciation | 264 | 269 | 793 | 796 | |||||||||
| Add: Profit from by-products | 7,212 | 8,969 | 23,563 | 24,508 | |||||||||
| Add: Profit from PGM recycling | 2,034 | 4,508 | 8,360 | 11,147 | |||||||||
| Total consolidated costs of revenues | $ | 156,113 | $ | 191,111 | $ | 511,936 | $ | 472,884 | |||||
| Stillwater Mine: | |||||||||||||
| Reconciliation to costs of revenues: | |||||||||||||
| Total operating costs (Non-GAAP) | $ | 37,147 | $ | 30,686 | $ | 106,839 | $ | 94,963 | |||||
| Royalties, taxes and other | 7,025 | 9,056 | 21,079 | 27,091 | |||||||||
| Total cash costs (Non-GAAP) | $ | 44,172 | $ | 39,742 | $ | 127,918 | $ | 122,054 | |||||
| Asset retirement costs | 148 | 137 | 436 | 401 | |||||||||
| Depletion, depreciation and amortization | 10,439 | 12,126 | 32,676 | 36,282 | |||||||||
| Depletion, depreciation and amortization (in inventory) | 31 | (513 | ) | (453 | ) | (637 | ) | ||||||
| Total production costs (Non-GAAP) | $ | 54,790 | $ | 51,492 | $ | 160,577 | $ | 158,100 | |||||
| Change in product inventories | (2,206 | ) | 1,666 | 1,088 | (5,544 | ) | |||||||
| Add: Profit from by-products | 4,692 | 5,950 | 15,294 | 15,834 | |||||||||
| Add: Profit from PGM recycling | 1,504 | 3,353 | 6,119 | 8,373 | |||||||||
| Total costs of revenues | $ | 58,780 | $ | 62,461 | $ | 183,078 | $ | 176,763 | |||||
| East Boulder Mine: | |||||||||||||
| Reconciliation to costs of revenues: | |||||||||||||
| Total operating costs (Non-GAAP) | $ | 15,796 | $ | 13,525 | $ | 47,848 | $ | 36,002 | |||||
| Royalties, taxes and other | 3,083 | 3,767 | 9,943 | 11,160 | |||||||||
| Total cash costs (Non-GAAP) | $ | 18,879 | $ | 17,292 | $ | 57,791 | $ | 47,162 | |||||
| Asset retirement costs | 12 | 11 | 35 | 32 | |||||||||
| Depletion, depreciation and amortization | 3,404 | 3,233 | 10,173 | 10,273 | |||||||||
| Depletion, depreciation and amortization (in inventory) | 186 | (66 | ) | 311 | (1,032 | ) | |||||||
| Total production costs (Non-GAAP) | $ | 22,481 | $ | 20,470 | $ | 68,310 | $ | 56,435 | |||||
| Change in product inventories | (558 | ) | (740 | ) | (115 | ) | (1,741 | ) | |||||
| Add: Profit from by-products | 2,520 | 3,019 | 8,269 | 8,674 | |||||||||
| Add: Profit from PGM recycling | 530 | 1,155 | 2,241 | 2,774 | |||||||||
| Total costs of revenues | $ | 24,973 | $ | 23,904 | $ | 78,705 | $ | 66,142 | |||||
| PGM Recycling | |||||||||||||
| Reconciliation to costs of revenues: | |||||||||||||
| Cost of open market purchases | — | 1,141 | — | 1,141 | |||||||||
| PGM recycling – depreciation | 264 | 269 | 793 | 796 | |||||||||
| Cost of PGM recycling | 72,096 | 103,336 | 249,360 | 228,042 | |||||||||
| Total costs of revenues | $ | 72,360 | $ | 104,746 | $ | 250,153 | $ | 229,979 | |||||
46
ITEM 3
QUANTITATIVE AND QUALITATIVE DISCLOSURE ABOUT MARKET RISK
The Company is exposed to market risk, including the effects of adverse changes in metal prices, interest rates and foreign currencies as discussed below.
Commodity Price Risk
The Company produces and sells palladium, platinum and associated by-product metals directly to its customers and also through third parties. As a result, financial performance can be materially affected when prices for these commodities fluctuate. In order to manage commodity price risk and to reduce the impact of fluctuation in prices, the Company has entered into long-term supply agreements with suppliers and customers, from time to time has employed various derivative financial instruments and attempts to maintain adequate liquidity to sustain operations during a downturn in PGM prices. Because the Company hedges only with instruments that have a high correlation with the value of the hedged transactions, changes in the fair value of the derivatives are expected to be highly effective in offsetting changes in the value of the hedged transaction.
The Company entered into a three-year supply agreement with General Motors Corporation (GM) effective January 1, 2011, that provides for fixed quantities of palladium to be delivered to GM each month. The agreement provides for pricing at a small discount to a trailing monthly average market price. The Company also is party to one-year agreements with Ford Motor Company, Johnson Matthey and Tiffany and Co. containing pricing and volume provisions structured similarly to the GM agreement.
The Company customarily enters into fixed forward sales and, rarely, financially settled forward sales transactions that may or may not be accounted for as cash-flow hedges to mitigate the price risk in its PGM recycling and mine production activities. Under these fixed forward transactions, typically metals contained in the spent catalytic materials are sold forward at the time the materials are purchased and then are delivered against the fixed forward contracts when the finished ounces are recovered. The Company believes such fixed forward sales transactions qualify for the exception to hedge accounting treatment provided for in the accounting literature and so has elected to account for these transactions as normal purchases and normal sales. (Financially settled forward contracts are settled net for cash, and therefore they do not qualify for this accounting treatment.) Fixed forward sales commit the Company to deliver fixed quantities of metal on a stated date in the future; if the Company is unable to meet its delivery commitments, it would be required to purchase metal at the prevailing rate in the open market at a price which could differ from the price stipulated in the fixed forward sales arrangement.
Interest Rate Risk
At September 30, 2012, all of the Company’s outstanding long-term debt was subject to fixed rates of interest. Interest income on payments to the Company’s recycling suppliers is generally linked to short-term inter-bank rates. Undrawn letters of credit issued under the Company's revolving credit facility carry a fixed contractual rate of interest, although any cash drawings against the facility would be subject to a floating interest rate.
The Company’s convertible debentures and industrial revenue bonds do not contain financial covenants, other than change in control protection and, in the case of the convertible debentures, investor make-whole provisions. The Company’s asset-backed revolving credit facility includes a single fixed-charge coverage covenant that only takes effect when less than 30% of the total borrowing capacity under the line remains available. Because there were no drawings and only $8.3 million of undrawn letters of credit issued under the revolving credit facility at September 30, 2012, the Company is not constrained by conventional financial covenants at this time. With the recent issue of the $396.75 million convertible debentures, the Company has a higher level of indebtedness which may affect its ability to pay the principal of and interest on the notes and its creditworthiness generally.
Foreign Currency Risk
With the acquisition of the Marathon assets in Canada late in 2010, the Company first gained some modest exposure to fluctuations in the exchange rate between the Canadian dollar and the U.S. dollar. Similarly, the Peregrine acquisition has created some exposure to Canadian, Argentine and other foreign currencies. While these exposures currently are limited to foreign cash deposits and expenses incurred for the services of a few foreign-based employees and contractors, along with some associated support costs, as the Company’s foreign commitments expand in the future, the exposure will become more material. The Company does not generally hedge this exposure at present, but may consider doing so in the future as the scale of its foreign operations grows. During the third quarter of 2012, the Company recorded a foreign currency transaction gain of $6.1 million related to the deferred tax liability recorded in association with the acquisition of Peregrine Metals Ltd. The gain was a result of the strengthening of the U.S. dollar in comparison with the Argentine peso. As the deferred tax obligation will be settled at a future date in pesos, changes in the relative currency values are recognized in the period within transaction gain/loss on the consolidated statement of operations.
47
ITEM 4
CONTROLS AND PROCEDURES
| (a) | Disclosure Controls and Procedures. |
The Company’s management, with the participation of the Company’s Chief Executive Officer and Chief Financial Officer, has evaluated the effectiveness of the Company’s disclosure controls and procedures (as such term is defined in Rules 13a-15(e) and 15d-15(e) under the Securities Exchange Act of 1934, as amended (the “Exchange Act”)) as of the end of the period covered by this report. Based on such evaluation, the Company’s Chief Executive Officer and Chief Financial Officer have concluded that, as of the end of such period, the Company’s disclosure controls and procedures are effective in recording, processing, summarizing and reporting, on a timely basis, information required to be disclosed by the Company in the reports that it files or submits under the Exchange Act.
Management believes, to the best of its knowledge, that (i) this report does not contain any untrue statement of a material fact or omit to state any material fact necessary to make the statements complete, accurate and not misleading, and (ii) the financial statements, and other financial information included in this report, fairly present in all material respects the Company’s financial condition, results of operations and cash flows as of, and for, the periods represented in this report.
In designing and evaluating the Company’s disclosure controls and procedures, management recognized that disclosure controls and procedures, no matter how well conceived and well operated, can provide only reasonable, not absolute, assurance that the objectives of the disclosure controls and procedures are met. Additionally, in designing disclosure controls and procedures, the Company’s management necessarily was required to apply its judgment in evaluating the cost-benefit relationship of possible disclosure controls and procedures. The Company also designed disclosure controls and procedures based in part upon assumptions about the likelihood of future events, and there can be no assurance that any design will succeed in achieving its stated goals under all potential future conditions.
| (b) | Internal Control Over Financial Reporting. |
In reviewing internal control over financial reporting as of September 30, 2012, management determined that during the third quarter of 2012 there have not been any changes in the Company’s internal control over financial reporting (as such term is defined in Rules 13a-15(f) and 15d-15(f) under the Exchange Act) that have materially affected, or are reasonably likely to materially affect, the Company’s internal control over financial reporting.
48
PART II – OTHER INFORMATION
ITEM 1
LEGAL PROCEEDINGS
The Company is involved in various claims and legal actions arising in the ordinary course of business, primarily employee lawsuits. In the opinion of management, the ultimate disposition of these matters is not expected to have a material adverse effect on the Company’s consolidated financial position, results of operations or liquidity.
For further information on legal guarantees and indemnities, see Note 19 “Commitments and Contingencies” in the Company’s audited consolidated financial statements as presented in the Company’s 2011 Annual Report on Form 10-K.
ITEM 1A
RISK FACTORS
The Company filed its Annual Report on Form 10-K for the year ended December 31, 2011, with the Securities and Exchange Commission on February 23, 2012, which sets forth its risk factors in Item 1A therein. As a result of the Company's recent financing activities, the Company has expanded its discussion of risk factors to include the following:
The Company's leverage is now higher than historical levels.
With the issuance on October 17, 2012, of $396.75 million of 1.75% senior unsecured convertible debentures, the Company's total exposure to outstanding debt has increased significantly, although the Company intends to use a portion of the proceeds to redeem existing convertible debentures in 2013. The Company will likely need access to additional financing beyond its available cash and ability to draw funds under its working capital line of credit to complete its planned capital expenditures and expansion initiatives. As a result, the Company is now more highly leveraged than it has been historically. This higher leverage will result in higher interest charges and reduce the Company's net income in future periods. The Company and its subsidiaries may be able to incur substantial additional debt in the future. Higher levels of indebtedness may affect the Company's ability to pay the principal and interest on the Company's debt and the company's creditworthiness generally.
Risks associated with operating the Company's strategic alliances may adversely affect the Company's financial condition and results of operations.
The Company has entered into a strategic alliance with Mitsubishi Corporation, whereby they have a 25% interest in Stillwater Canada Inc., which owns Marathon, and they will be entitled to purchase 100% of Marathon's PGM production. The Company may enter into additional strategic alliances or joint ventures in the future. Such strategic alliance partners may at any time have economic, business or legal interest or goals that are inconsistent with the Company's goals or with the goals of the strategic alliance. The Company's strategic alliance arrangements may require it, among other matters, to pay certain costs or to make certain capital investments or to seek our strategic alliance partner's consent to take certain actions. In addition, the Company's strategic alliance partners may be unable or unwilling to meet their economic or other obligations under the operative documents, and the Company may be required to either fulfill those obligations alone to ensure the ongoing success of a strategic alliance or to dissolve and liquidate a strategic alliance. Further, if the Company is unable to meet its financial obligations in full under such a strategic alliance, it may have its ownership interest involuntarily diluted by its strategic alliance partners.
Failure to successfully integrate acquisitions into the Company's existing operations could have an adverse impact on its business, financial condition and results of operations.
The Company has recently made several acquisitions. The Company anticipates that in the future it may, from time to time, acquire additional businesses that it believes would provide a strategic fit with its business. Potential issues associated with acquisitions could include, among other things: the Company's ability to realize the benefits or cost savings that it expects to realize as a result of the acquisition; diversion of management's attention; its ability to successfully integrate its businesses with the business of the acquired company; motivating, recruiting and retaining executives and key employees; conforming standards, controls, procedures and policies, business cultures and compensation structures among its company and the acquired company; consolidating and streamlining sales, marketing and corporate operations; potential exposure to unknown liabilities of acquired companies; environmental risks; loss of key employees and customers of the acquired business; and managing tax costs or inefficiencies associated with integrating its operations following completion of an acquisition. If an acquisition is not successfully completed or integrated into the Company's existing operations, its business, financial condition and results of operations could be adversely impacted.
49
ITEM 4
MINE SAFETY DISCLOSURES
The Company continually works to establish and maintain a multi-faceted “culture of safety,” summarized by the slogan, “Everyone goes home safe every day.” The established Company safety system includes incident tracking and analysis, near miss reporting, hazard recognition and workplace start-of-shift inspections, team safety meetings, annual refresher training, task training, standard operating procedures training, safety sweeps, audits and stand-downs and financial incentives for working safely. The Company also works closely with Mine Safety and Health Administration (MSHA), inspectors to act on their findings and incorporate their suggestions. Management also strives to maintain a consistent “tone at the top” that gives working safely priority over all other Company objectives.
Under the recently enacted Dodd-Frank Act, each operator of a coal or other mine is required to include certain mine safety results within its periodic reports filed with the Securities and Exchange Commission. In accordance with the reporting requirements included in Section 1503(a) of the Dodd-Frank Wall Street Reform and Consumer Protection Act and Item 104 of Regulation S-K (17 CFR 229.104), the required mine safety results regarding certain mining safety and health matters for each of the Company’s mine locations that are covered under the scope of the Dodd-Frank Act are included in Exhibit 95 of the 2011 Annual Report on Form 10-K. In the third quarter of 2012, the Company received a total of 21 citations for violations of mandatory health or safety standards that MSHA classified as significant and substantial. See Exhibit 95 “Mine Safety Disclosures” included in this quarterly report for more information.
ITEM 6
EXHIBITS
See attached exhibit index
50
SIGNATURES
Pursuant to the requirements of the Securities Exchange Act of 1934, the registrant has duly caused this report to be signed on its behalf by the undersigned thereunto duly authorized.
| STILLWATER MINING COMPANY | |||||
| (Registrant) | |||||
| Date: | October 30, 2012 | ||||
| By: | /s/ Francis R. McAllister | ||||
| Francis R. McAllister | |||||
| Chairman and Chief Executive Officer | |||||
| (Principal Executive Officer) | |||||
| Date: | October 30, 2012 | ||||
| By: | /s/ Gregory A. Wing | ||||
| Gregory A. Wing | |||||
| Vice President and Chief Financial Officer | |||||
| (Principal Financial Officer) | |||||
51
EXHIBITS
| Number | Description | |
| 10.1 | Platinum and Palladium Purchase and Supply Agreement, made as of January 1, 2012, between Stillwater Mining Company and Ford Motor Company (portions of the agreement have been omitted pursuant to a confidential treatment request), filed herewith | |
| 31.1 | Rule 13a-14(a)/15d-14(a) Certification – Chief Executive Officer, dated, October 30, 2012 | |
| 31.2 | Rule 13a-14(a)/15d-14(a) Certification – Vice President and Chief Financial Officer, dated, October 30, 2012 | |
| 32.1 | Section 1350 Certification, dated, October 30, 2012 | |
| 32.2 | Section 1350 Certification, dated, October 30, 2012 | |
| 95.0 | Mine Safety Disclosures | |
| 101.INS | XBRL Instance Document | |
| 101.SCH | XBRL Schema Document | |
| 101.CAL | XBRL Calculation Linkbase Document | |
| 101.DEF | XBRL Definition Linkbase Document | |
| 101.LAB | XBRL Labels Linkbase Document | |
| 101.PRE | XBRL Presentation Linkbase Document | |
52