UNITED STATES
SECURITIES AND EXCHANGE COMMISSION
Washington, D.C. 20549
FORM 10-K
ý ANNUAL REPORT PURSUANT TO SECTION 13 OR 15(d) OF THE SECURITIES EXCHANGE ACT OF 1934 FOR THE FISCAL YEAR ENDED DECEMBER 31, 2012.
or
¨ TRANSITION REPORT PURSUANT TO SECTION 13 OR 15(d) OF THE SECURITIES EXCHANGE ACT OF 1934 FOR THE TRANSITION PERIOD FROM TO
Commission File Number 1-13053
STILLWATER MINING COMPANY
(Exact name of registrant as specified in its charter)
|
| | |
| Delaware | | 81-0480654 |
(State or other jurisdiction of incorporation or organization) | | (I.R.S. Employer Identification No.) |
1321 Discovery Drive, Billings, Montana 59102
(Address of principal executive offices and zip code)
(Registrant’s telephone number, including area code) (406) 373-8700
Securities registered pursuant to Section 12(b) of the Act:
|
| | |
| Title of each class | | Name of each exchange on which registered |
| Common Stock, $0.01 par value | | The New York Stock Exchange/Toronto Stock Exchange |
Securities registered pursuant to Section 12(g) of the Act: None
Indicate by check mark if the registrant is a well-known seasoned issuer, as defined in Rule 405 of the Securities Act. ý YES ¨ NO
Indicate by check mark if the registrant is not required to file reports pursuant to Section 13 or Section 15(d) of the Act. ¨ YES ý NO
Indicate by check mark whether the registrant (1) has filed all reports required to be filed by Section 13 or 15(d) of the Securities Exchange Act of 1934 during the preceding 12 months (or for such shorter period that the registrant was required to file such reports), and (2) has been subject to such filing requirements for the past 90 days. ý YES ¨ NO
Indicate by check mark whether the registrant has submitted electronically and posted on its corporate Web site, if any, every Interactive Date File required to be submitted and posted pursuant to Rule 405 of Regulation S-T (§232.405 of this chapter) during the preceding 12 months (or for such shorter period that the registrant was required to submit and post such files). YES ý NO ¨
Indicate by check mark if disclosure of delinquent filers pursuant to Item 405 of Regulation S-K is not contained herein, and will not be contained, to the best of registrant’s knowledge, in definitive proxy or information statements incorporated by reference in Part III of this Form 10-K or any amendment to this Form 10-K. ý
Indicate by check mark whether the registrant is a large accelerated filer, an accelerated filer, a non-accelerated filer, or a smaller reporting company. See the definitions of “large accelerated filer,” “accelerated filer” and “smaller reporting company” in Rule 12b-2 of the Exchange Act. (Check one):
|
| | | | | | |
Large Accelerated Filer ý | | Accelerated File ¨ | | Non-Accelerated Filer ¨ | | Smaller reporting company ¨ |
| | | | |
Indicate by check mark whether the registrant is a shell company (as defined in Exchange Act Rule 12b-2). ¨ YES ý NO
As of June 29, 2012, assuming a price of $8.54 per share, the closing sale price on the New York Stock Exchange, the aggregate market value of shares of voting and non-voting common equity held by non-affiliates was approximately $967.2 million.
As of February 26, 2013, the Company had outstanding 117,582,157 shares of common stock, par value $0.01 per share.
DOCUMENTS INCORPORATED BY REFERENCE
Certain information required in Part III of this Annual Report on Form 10-K is incorporated herein by reference to the Registrant’s Proxy Statement for its 2013 Annual Meeting of Stockholders.
TABLE OF CONTENTS
|
| | |
| GLOSSARY OF SELECTED MINING TERMS | |
| | | |
| |
| ITEM 1A | | |
| ITEM 3 | | |
| ITEM 4 | | |
| | | |
| ITEM 5 | | |
| ITEM 6 | | |
| ITEM 7 | | |
| ITEM 7A | | |
| ITEM 8 | | |
| ITEM 9A | | |
| | | |
| ITEM 10 | | |
| ITEM 11 | | |
| ITEM 12 | | |
| ITEM 13 | | |
| ITEM 14 | | |
| | | |
| ITEM 15 | | |
| | | |
GLOSSARY OF SELECTED MINING TERMS
The following is a glossary of selected mining terms used in the United States and Canada and referenced in the Form 10-K that may be technical in nature:
|
| | |
| Adit | | A horizontal tunnel or drive, open to the surface at one end, which is used as an entrance to a mine. |
| | |
| Anorthosite | | Igneous rock composed almost wholly of the mineral plagioclase feldspar. |
| | |
| Assay | | The analysis of the proportions of metals in ore, or the testing of an ore or mineral for composition, purity, weight, or other properties of commercial interest. |
| | |
| Base metal refinery | | A processing facility designed to extract base metals such as copper and nickel from the product stream. The Company’s base metal refinery receives PGM-rich matte material from the smelter, chemically extracts copper, nickel, residual iron and small amounts of other minerals as by-products from the matte, and then ships the remaining filtercake material to third-party precious metal refiners for final processing. |
| | |
| Catalysts | | Catalysts are materials that facilitate one or more chemical reactions without being consumed in the reaction themselves. As referenced in this report, platinum group metals serve as catalysts within the catalytic converters used in automotive exhaust and pollution control systems and, where so indicated, within similar applications in petroleum refining or other chemical processes. |
| | |
| Close-spaced drilling | | The drilling of holes designed to extract representative samples (“cores”) of rock and assess the mineralization in a target area. |
| | |
| Concentrate | | A mineral processing product that generally describes the material that is produced after crushing and grinding ore, effecting significant separation of gangue (waste) minerals from the metal and/or metal minerals, and discarding the waste and minor amounts of metal and/or metal minerals. The resulting “concentrate” of metal and/or metal minerals typically has an order of magnitude higher content of metal and/or metal minerals than the beginning ore material. |
| | |
| Crystallize | | Process by which matter becomes crystalline (solid) from a gaseous, fluid or dispersed state. The separation, usually from a liquid phase on cooling, of a solid crystalline phase. |
| | |
| Cut-off grade | | The lowest grade of mineralized material that qualifies as ore in a given deposit. The grade above which minerals are considered economically mineable considering the following parameters: estimates over the relevant period of mining costs, ore treatment costs, smelting and refining costs, process and refining recovery rates, royalty expenses, by-product credits, general and administrative costs, and PGM prices. |
| | |
| Decline | | A gently sloped underground excavation constructed for purposes of moving mobile equipment, materials, supplies or personnel from surface openings to deeper mine workings or as an alternative to hoisting in a shaft for mobilization of equipment and materials between mine levels. |
| | |
| Dilution | | An estimate of the amount of waste or low-grade mineralized rock which will be mined with the ore as part of normal mining practices in extracting an ore body. |
| | |
| Diamond Drilling | | Diamond Drilling is a specialized form of boring holes typically used in defining a mineral deposit which allows for the recovery of core for support of geologic characterization, grade determination and metallurgical testing. |
| | |
| Drift | | A major horizontal access tunnel used for the transportation of ore or waste. |
| | |
| Ductility | | Property of a solid material that undergoes more or less plastic deformation before it ruptures. The ability of a material to stretch without fracturing. |
| | |
| Fault | | A geologic fracture or a zone of fractures along which there has been displacement of the sides relative to one another parallel to the fracture. |
| | |
| Filter cake | | The PGM-bearing product that is shipped from the Company’s base metal refinery to a third-party toll refinery for the final extractive stages in the refining process. |
| | | |
| Footwall | | The underlying side of a fault, ore body, or mine working; especially the wall rock beneath an inclined vein, fault, or reef. See "Hanging wall" and "Wall rock". |
| | |
Gabbro rocks (See Mafic/Ultramafic) | | A group of dark-colored igneous rocks composed primarily of the minerals plagioclase feldspar and clinopyroxene, with minor orthopyroxene. |
| | |
|
| | |
| Gangue material | | The non-metalliferous or waste metalliferous mineral in the ore. |
| | |
| Grade | | The average metal content, as determined by assay of a volume of ore. For precious metals, grade is normally expressed as troy ounces per ton of ore or as grams per metric tonne of ore. |
| | |
| Gram | | A metric unit measure of mass. Grades of precious metals for palladium, platinum, gold and silver outside the United States usually are reported in grams/tonne. A gram is equal to about 0.032 troy ounces. |
| | |
| Hanging wall | | The overlying side of a fault, ore body, or mine working; especially the wall rock above an inclined vein, fault, or reef. See "Footwall" and "Wall rock". |
| | |
| Hectare | | A metric unit measure of area. One hectare is equivalent to about 2.47 acres. |
| | |
| Hoist | | See shaft. |
| | |
| Jackleg drill | | A manually operated rock drill, generally powered by compressed air, used to drill holes for blasting rock and to install ground support hardware. |
| | |
| Kilometer | | A metric unit measure of distance. One kilometer is equivalent to about 0.62 statute miles. |
| | |
| Lenticular-shaped | | Resembling in shape the cross section of a double-convex lens. |
| | |
| Load-haul-dump | | A vehicle used underground to scoop up mined material and move it to a central collection or discharge point. Generally called an “LHD” by miners. |
| | |
| Lode claims | | Claims to the mineral rights along a lode (vein) structure of mineralized material on Federal land; typically in the U.S. lode claims are 1,500 feet in length and 600 feet wide along the trend of the mineralized material. |
| | |
| Mafic rocks | | Igneous rocks composed chiefly of dark, ferromagnesian minerals in addition to lighter-colored feldspars. |
| | |
| Matte | | See “PGM-rich matte”. |
| | |
| Matrix | | The finer-grained material between the larger particles of a rock or the material surrounding mineral particles. |
| | |
| Meter | | A metric unit measure of length. One meter is equivalent to about 3.28 feet. |
| | |
| Mill | | A processing plant that produces a concentrate of the valuable minerals or metals contained in an ore. The concentrate must then be treated in some other type of plant, such as a smelter, to effect recovery of the pure metal. Term used interchangeably with concentrator. |
| | |
| Mill site claims | | Claiming of Federal land for mill site purposes or other operations connected with mining lode claims. Used for non-mineralized land not necessarily contiguous with the vein or lode. |
| | |
| Mineral beneficiation | | A treatment process separating the valuable minerals from the host material. |
| | |
| Mineral deposit | | Geologic term measuring an aggregate of a mineral or metal in an unusually high concentration. The term deposit does not distinguish whether the mineral can be extracted economically. |
| | |
| Mineralization | | The concentration of metals and their compounds in rocks, and the processes involved therein. |
| | | |
| Mineralized material | | A mineralized body which has been delineated by appropriately spaced drilling and/or underground sampling to support a general estimate of available tonnage and average grade of metals. Such a deposit does not qualify as a reserve until a comprehensive evaluation based upon unit cost, grade, recoveries, and other material factors conclude legal and economic feasibility. |
| | |
| Mouat Agreement | | Mining and Processing Agreement dated March 16, 1984 regarding the Mouat family. The Mouat royalty stems back to the formation of Stillwater Mining Company at which time claims staked by the Mouats’ forebears in 1876 were leased to Stillwater Mining Company. |
| | |
| Net Smelter Return (NSR) | | A payment made by a producer of metals based on the value of the gross metal production from the property, less deduction of certain limited costs including smelting, refining, transportation and insurance costs. |
| | |
|
| | |
| Net smelter royalty | | A share of revenue paid by the Company to the owner of a royalty interest generally calculated based on the imputed value of the PGM concentrate delivered to the smelter. For Stillwater Mining Company’s Montana operations, royalties are calculated on the mineral production subject to each royalty as a percentage of the revenue received by the Company after deducting treatment, refining and transportation charges paid to third parties, and certain other costs incurred in connection with processing the concentrate at the Columbus smelter. |
| | |
| Norite | | Coarse-grained igneous rock composed of the minerals plagioclase feldspar and orthopyroxene. |
| | |
| Ore | | That part of a mineral deposit which could be economically and legally extracted or produced at the time of reserve determination. |
| | |
| Outcrop | | The part of a rock formation that appears at the earth’s surface often protruding above the surrounding ground. |
| | |
| PGM | | The platinum group metals collectively and in any combination of palladium, platinum, rhodium, ruthenium, osmium, and iridium. Reference to PGM grades for the Company’s mine operations include measured quantities of palladium and platinum only. References to PGM grades associated with recycle materials typically include palladium, platinum and rhodium. |
| | |
| PGM-rich matte | | Matte is an intermediate product of smelting; an impure metallic sulfide mixture made by melting sulfide ore concentrates. PGM rich matte is a matte with an elevated level of platinum group metals. |
| | |
| Porphyry | | A copper porphyry is igneous rock containing large crystals known as phenocrysts embedded in a fine-grained matrix containing copper, copper sulfides, and potential lesser amounts of other metals and minerals. Porphyry copper deposits contain disseminated mineralization meaning that a large volume of shattered rock contains a branching network of tiny quartz veins, spaced only a few centimeters apart, in which grains of the copper ore minerals chalcopyrite and bomite occur with pyrite. Commercial copper porphyry deposits typically are low grade (1% copper or less), but can be very large. The majority of all copper mined today is produced from porphyry deposits. |
| | |
Probable (indicated) reserves | | Reserves for which quantity and grade and/or quality are computed from information similar to that used for proven (measured) reserves, but the sites for inspection, sampling, and measurement are farther apart or are otherwise less adequately spaced. The degree of assurance, although lower than that for proven (measured) reserves, is high enough to assume continuity between points of observation. |
| | |
Proven (measured) reserves | | Reserves for which (a) quantity is computed from dimensions revealed in outcrops, trenches, workings or drill holes; grade and/or quality are computed from the results of detailed sampling; and (b) the sites for inspection, sampling and measurement are spaced so closely and the geologic character is so well defined that size, shape, depth and mineral content of reserves are well established. |
| | |
| Recovery | | The percentage of contained metal actually extracted from ore in the course of processing such ore. |
| | | |
| Reef | | A layer precipitated within the Stillwater Layered Igneous Complex enriched in platinum group metal-bearing minerals, chalcopyrite, pyrrhotite, pentlandite, and other sulfide materials. The J-M Reef, which the Company mines, occurs at a regular stratigraphic position within the Stillwater Complex. Note: this use of “reef” is uncommon and originated in South Africa where it is used to describe the PGM-bearing Merensky, UG2, and other similar layers in the Bushveld Complex. |
| | |
| Refining | | The final stage of metal production in which residual impurities are removed from the metal. |
| | |
| Reserves | | That part of a mineral deposit which could be economically and legally extracted or produced at the time of the reserve determination. |
| | |
| Recycling materials | | Spent PGM-bearing materials collected for reprocessing from automotive, petroleum, chemical, medical, food and other catalysts. Additionally, PGMs for recycling may be sourced from scrap electronics and thermocouples, old jewelry and materials used in manufacturing glass. |
| | |
| Scrubber | | A treatment system for industrial waste gases that extracts environmentally deleterious components prior to venting to the atmosphere. The Company’s scrubber system at the smelter and base metal refinery primarily removes sulfur dioxide – which is converted in the scrubber into environmentally benign gypsum (calcium sulfate) – and captures any particulates in the stack gas. |
| | |
| Shaft | | A vertical or steeply inclined excavation for the purposes of opening and servicing an underground mine. It is usually equipped with a hoist at the top which lowers and raises a conveyance for handling personnel and materials. |
| | |
| Slag | | Slag is a nonmetallic product resulting from the mutual dissolution of flux and nonmetallic impurities during smelting. A silica rich slag is a smelting slag that contains a relatively high level of silica. |
|
| | |
| | |
| Sill | | (1) With respect to a mine opening, the base or floor of the excavated area (stope); (2) With respect to intrusive rock, a tabular intrusive unit that is conformable with surrounding rock layers. |
| | |
| Slusher | | (1) An electric double-drum winch with two steel ropes attached to an open-bottomed scoop that transports (drags) ore from the rock face to a loading point, where the ore is discharged. (2) A very selective mining method in which small ore stopes are mined using a slusher. |
| | |
| Smelting | | Heating ore or concentrate material with suitable flux materials at high temperatures creating a fusion of these materials to produce a melt consisting of two layers, with a slag of the flux and gangue (waste) minerals on top and molten impure metals below. This generally produces an unfinished product (matte) requiring refining. |
| | |
| Sponge | | A granular (shot) form of PGM. Commonly, the form required for manufacture of many PGM-based chemicals and catalysts. |
| | |
| Stope | | A localized area of underground excavation from which ore is extracted. |
| | |
| Strike | | The course, direction or bearing of a vein or a layer of rock. |
| | |
| Tailings | | That portion of the mined material that remains after the valuable minerals have been extracted. |
| | |
| TBRC | | A “top-blown rotary converter,” a rotating furnace vessel which processes PGM-rich matte received from the smelter furnace, removing iron from the molten material by injecting a stream of oxygen. This process converts iron sulfides into an iron oxide slag which floats to the surface for separation. |
| | |
| Tonne | | A metric unit measure used in the mining industry. One tonne is equal to 1,000 kilograms, about 1.102 short tons or 2204.6 pounds. Production volumes outside the United States usually are reported in tonnes. |
| | |
| Tolling | | Processing of material owned by others for a fee without taking title to the material. |
| | | |
| Troy ounce | | A unit measure used in the precious metals industry. A troy ounce is equal to about 31.103 grams. The amounts of palladium and platinum produced and/or sold by the Company are reported in troy ounces. There are 12 troy ounces to a troy pound and 32,150.7 troy ounces in a metric tonne. |
| | |
Tunnel Boring Machine (TBM) | | A machine that is typically used to excavate tunnels with a circular cross section through a variety of rock strata over long relatively straight horizontal distances. The TBM bores through anything from hard rock to sand. |
| | |
| Ultramafic rocks | | Igneous rocks composed chiefly of dark, ferromagnesian minerals in the absence of significant lighter-colored feldspars. |
| | |
| Vein | | A mineralized zone having regular development in length, width and depth that clearly separates it from neighboring rock. |
| | |
| Wall rock | | The rock adjacent to, enclosing, or including a vein, layer, or dissemination of ore minerals. See “Hanging wall” and “Footwall” above. |
PART I
ITEMS 1 AND 2
BUSINESS AND PROPERTIES
INTRODUCTION
Stillwater Mining Company (the Company) is engaged in the development, extraction, processing, smelting, refining and marketing of palladium, platinum and associated metals (platinum group metals or PGMs) from a geological formation in south-central Montana known as the J-M Reef and from the recycling of spent catalytic converters. The Company is also engaged in expanding its mining operations on the J-M Reef, developing its Marathon PGM-copper property adjacent to Lake Superior in the province of Ontario, Canada and advancing the exploration of its Altar copper-gold property in the province of San Juan, Argentina.
The J-M Reef is the only known significant primary source of platinum group metals inside the United States and one of the significant resources outside South Africa and the Russian Federation. Associated by-product metals at the Company’s operations include significant amounts of nickel and copper and minor amounts of gold, silver and rhodium. The J-M Reef is a narrow but extensive mineralized zone containing PGMs, which has been traced over a strike length of approximately 28 miles.
PGMs are rare precious metals with unique physical properties that are used in diverse industrial applications and in jewelry. The largest use for PGMs currently is in the automotive industry for the production of catalytic converters that reduce harmful automobile emissions. Besides being used in automotive applications, palladium is used in jewelry, in the production of electronic components for personal computers, cellular telephones and facsimile machines, as well as in dental applications and in petroleum and industrial catalysts. Industrial uses for platinum, in addition to automobile and industrial catalysts, include the manufacturing of data storage disks, fiberglass, paints, nitric acid, anti-cancer drugs, fiber optic cables, fertilizers, unleaded and high-octane gasoline and fuel cells. Rhodium, produced in the Company’s recycling operations and to a limited extent as a by-product from mining, also is used in automotive catalytic converters to reduce nitrogen oxides and in jewelry as a plating agent to provide brightness.
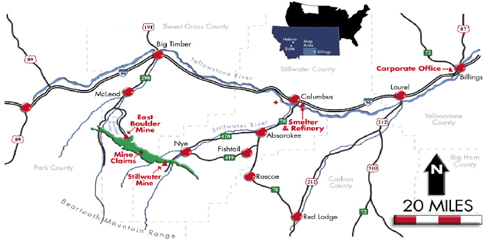
The Company conducts mining operations at the Stillwater Mine near Nye, Montana and at the East Boulder Mine south of Big Timber, Montana. Ore extraction at both mines takes place within the J-M Reef. The Company operates concentrating plants at each mining operation to upgrade the mined production into a concentrate form. The Company operates a smelter and base metal refinery in Columbus, Montana which further upgrades the mined concentrates into a PGM-rich filter cake. The filter cake is shipped to third-party custom refiners for final refining before the contained PGMs are sold to third parties.
Besides processing mine concentrates, the Company also recycles spent catalyst material acquired from third parties at the smelter and base metal refinery to recover the contained PGMs – palladium, platinum and rhodium. The Company currently has catalyst sourcing arrangements with various suppliers who ship spent catalysts to the Company for processing. The Company smelts and refines the spent catalysts within the same process stream as the mine concentrates. The Company both purchases recycling materials for its own account and processes them on behalf of others for a fee.
In the fourth quarter of 2010, the Company announced two new expansion projects along the J-M Reef. The first of these, known as the Blitz project, is developing new underground drifts on two levels from the current Stillwater Mine toward the eastern extremity of the reef. These drifts both will be intersected from a new portal to be developed about four miles to the east of the existing mineshaft. The other project, known as Graham Creek, is developing about 8,200 feet of new drift toward the west from the existing East Boulder Mine infrastructure, using a tunnel-boring machine (TBM). Two new ventilation raises to surface will be constructed once the Graham Creek TBM drive is completed.
In November 2010, the Company completed the acquisition of Marathon PGM Corporation (Marathon). Marathon was a Canadian exploration company with an advanced-stage PGM development project situated near the north shore of Lake Superior in the province of Ontario, Canada. This acquisition was intended to expand the Company's annual PGM production and, at the same time, mitigate the Company's risk profile as a primary PGM producer serving one principal market from production derived solely from the J-M Reef in Montana. The Marathon project originally anticipated annual production potential of about 160,000 ounces of PGMs (with the initial two full years of production as high as 200,000 ounces of PGMs) and 37 million pounds of copper. In March 2012, Stillwater Mining Company entered into an agreement with Mitsubishi Corporation through which the Japanese global integrated business enterprise acquired a 25% interest in the Marathon project for approximately US$81.25 million. Including Mitsubishi's share of the venture's first cash call of $13.6 million, total cash proceeds contributed into Marathon by Mitsubishi were $94.9 million. Going forward, Mitsubishi will be responsible for funding its 25% share of operating, capital and exploration expenditures on the Marathon properties and has agreed to cooperate and support efforts to secure project financing for Marathon. Under a related supply agreement, Mitsubishi also will have an option to purchase up to 100% of the project's PGM production at a small discount to the then prevailing market price.
In October 2011, the Company completed the acquisition of Peregrine Metals Ltd., a Canadian exploration company (Peregrine) that owns the Altar property, located in the San Juan province of Argentina. In completing the acquisition, the Company paid a total of $166.4 million (net of cash acquired) in cash and issued 12.03 million Company common shares. Altar is an exploration-stage property with initial drilling in place that indicates the presence of a large copper-gold porphyry deposit and an ancillary gold discovery.
The Company is dependent on cash flow from its PGM activities to sustain ongoing operations, as well as to fund its Montana mine expansion initiatives and any ongoing delineation work associated with the Marathon and Altar projects. If the Marathon project ultimately advances into construction, the Company expects to utilize available cash on hand to fund the initial construction outlay at Marathon, but management anticipates that it will seek additional project financing to support this effort in conjunction with its joint venture partner. With respect to Altar, in view of the continuing improvement in the PGM markets and taking into consideration the increased political uncertainty in Argentina, the Company has been cautious in its evaluation of the Altar project. The Company completed its 2011-2012 drilling and evaluation program for about $17 million, less than the $25.0 million originally planned. The Company has further reduced its 2013 exploration, and general and administrative budget at Altar to about $13.4 million. The Company intends to keep its outlay at modest levels for the foreseeable future in order to gain a better gauge on its prospects and ultimate value. In the view of management, Altar represents a valuable option.
At December 31, 2012, the Company had proven and probable ore reserves at its Montana operations, of approximately 46.1 million tons with an average combined palladium and platinum grade of 0.46 ounces per ton of ore (0.36 ounces of palladium and 0.10 ounces of platinum per ton of ore). This is equivalent to approximately 21.5 million in-situ proven and probable ounces of palladium and platinum (16.8 million ounces of palladium and 4.7 million ounces of platinum) at a ratio of about 3.58 parts palladium to one part platinum.
In October 2012, the Company announced preliminary engineering findings indicating that the palladium metal content for the Marathon project was overestimated in a portion of the original resource and reserve modeling work utilized at the time of the acquisition. The Company is in the process of updating its technical report, which will allow assessment of the overall materiality of these findings on Marathon's infrastructure and on its economics. Management believes the effect is likely to be some deterioration in both the project economics and in the estimate of proven and probable ore reserves. See “Business and Properties – Proven and Probable Ore Reserves.”
2012 – YEAR IN REVIEW:
| |
| • | The Company reported net income attributable to common stockholders of $55.0 million, or $0.46 per diluted share, for the year ended December 31, 2012, compared to $144.3 million, or $1.30 per diluted share, in 2011. Contributing to the decline in net income during 2012 were lower market prices for palladium and platinum and higher mine operating costs. Revenues from the sale of mined production of $455.4 million, a decrease of 13.7% from the $528.0 million in 2011, were a result of lower PGM prices. See “Management’s Discussion and Analysis of Financial Condition and Results of Operations – Year Ended December 31, 2012 Compared to Year Ended December 31, 2011.” |
| |
| • | In 2012, the Company’s mining operations produced a total of 513,700 ounces of palladium and platinum, a decrease of 0.8% from the 517,900 ounces produced in 2011. Total consolidated cash cost per ounce (a non-GAAP measure of extraction efficiency further defined in Part II, Item 6 of this report) averaged $484 in 2012, compared with $420 per ounce in 2011. Higher cash costs in 2012 were a result of higher labor costs, general inflation in materials and supplies and the small decrease in mine production. Higher labor costs included an increase in contractual wage and benefit rates and an increase in the hiring rate for the Company's new-miner training program. The Company’s revenues for 2012, 2011 and 2010 totaled $800.2 million, $906.0 million and $555.9 million, respectively. Detail of revenues and volumes sold by year is shown in the following table: |
|
| | | | | | | | | | | | | | | | | | | | | | | | | | | | | | | | | | | |
Year ended December 31, (In thousands) | | Sales Revenues | | Troy Ounces Sold |
| | Palladium | | Platinum | | Rhodium | | Other (1) | | Total | | Palladium | | Platinum | | Rhodium | | Other (3) | | Total |
| 2012 | | | | | | | | | | | | | | | | | | | | |
| Mine production | | $ | 247,847 |
| | $ | 176,937 |
| | $ | 4,877 |
| | $ | 25,765 |
| | $ | 455,426 |
| | 386 |
| | 114 |
| | 4 |
| | 15 |
| | 519 |
|
| PGM recycling | | 123,876 |
| | 183,719 |
| | 34,817 |
| | 2,406 |
| | 344,818 |
| | 192 |
| | 119 |
| | 25 |
| | — |
| | 336 |
|
| Total | | $ | 371,723 |
| | $ | 360,656 |
| | $ | 39,694 |
| | $ | 28,171 |
| | $ | 800,244 |
| | 578 |
| | 233 |
| | 29 |
| | 15 |
| | 855 |
|
| 2011 | | | | | | | | | | | | | | | | | | | | |
| Mine production | | $ | 297,251 |
| | $ | 194,794 |
| | $ | 7,213 |
| | $ | 28,749 |
| | $ | 528,007 |
| | 402 |
| | 114 |
| | 5 |
| | 15 |
| | 536 |
|
| PGM recycling | | 124,267 |
| | 201,195 |
| | 47,326 |
| | 4,032 |
| | 376,820 |
| | 169 |
| | 114 |
| | 23 |
| | — |
| | 306 |
|
Other (2) | | 7 |
| | 954 |
| | 181 |
| | — |
| | 1,142 |
| | — |
| | 1 |
| | — |
| | — |
| | 1 |
|
| Total | | $ | 421,525 |
| | $ | 396,943 |
| | $ | 54,720 |
| | $ | 32,781 |
| | $ | 905,969 |
| | 571 |
| | 229 |
| | 28 |
| | 15 |
| | 843 |
|
| 2010 | | | | | | | | | | | | | | | | | | | | |
| Mine production | | $ | 186,749 |
| | $ | 166,313 |
| | $ | 3,880 |
| | $ | 24,102 |
| | $ | 381,044 |
| | 377 |
| | 112 |
| | 2 |
| | 14 |
| | 505 |
|
| PGM recycling | | 36,893 |
| | 95,911 |
| | 30,470 |
| | 5,338 |
| | 168,612 |
| | 81 |
| | 62 |
| | 13 |
| | — |
| | 156 |
|
Other (2) | | 6,222 |
| | — |
| | — |
| | — |
| | 6,222 |
| | 13 |
| | — |
| | — |
| | — |
| | 13 |
|
| Total | | $ | 229,864 |
| | $ | 262,224 |
| | $ | 34,350 |
| | $ | 29,440 |
| | $ | 555,878 |
| | 471 |
| | 174 |
| | 15 |
| | 14 |
| | 674 |
|
| |
| (1) | “Other” column includes gold, silver, nickel and copper by-product sales from mine production and revenue from processing recycling materials on a toll basis. |
| |
| (2) | “Other” row includes sales of metal purchased in the open market. |
| |
| (3) | “Other” column includes gold and silver by-product ounces and recycled ounces sold. Not reflected in the “other” ounce column in the table above are approximately 1.1 million pounds, 1.3 million pounds and 1.2 million pounds of nickel sold in 2012, 2011 and 2010, respectively, and approximately 0.7 million pounds of copper sold in 2012 and 0.8 million pounds in each of the years 2011 and 2010. |
Revenues from PGM recycling decreased by 8.5% during 2012, to $344.8 million from $376.8 million in 2011, a direct result of lower PGM prices. Recycled ounces purchased for the Company's own account and sold in 2012 totaled 336,500 ounces, an increase of 9.9% over the 306,200 ounces sold in 2011. The Company’s combined average realization on recycling sales (which include palladium, platinum and rhodium) decreased to $1,018 per ounce in 2012 from $1,218 per ounce in 2011, reflecting lower market prices for palladium and platinum. In addition to purchased material, the Company returned 98,800 ounces of PGMs on a tolling basis in 2012, below the 171,600 returned toll ounces in 2011. Recycled volumes fed to the smelter totaled 445,200 ounces of PGMs in 2012, down 8.5% from the 486,700 ounces fed in 2011, driven by decreased availability of recycling materials in the market at the lower PGM prices that prevailed during 2012. Working capital associated with recycling activities in the form of inventories and advances was $87.8 million, $64.5 million and $41.5 million at December 31, 2012, 2011 and 2010, respectively. Included in these totals are outstanding procurement advances to recycling suppliers totaling $10.2 million, $2.6 million and $6.1 million at December 31, 2012, 2011 and 2010, respectively.
The Company has a three-year supply agreement with General Motors Corporation (“GM”), expiring at the end of 2013, that commits the Company to deliver fixed quantities of palladium to GM each month. The agreement provides for monthly pricing at a small discount to a trailing market price. The Company has a one-year market-based platinum supply agreement with Tiffany & Co., one-year PGM supply agreements with Johnson Matthey and BASF, and a month-to-month supply agreement with Ford Motor Company. These agreements all include market-based pricing terms, and some provide for a small discount to the average market price.
The Company’s 2012 capital expenditures totaled $116.6 million, (adjusted to include incurred but unpaid obligations at the end of 2012) an increase over the $104.1 million in 2011. Capital outlay in 2012 included $81.3 million in development and infrastructure work at the Montana mines (including $19.4 million for the Blitz project development), $26.7 million in facilities and equipment and $8.6 million of project outlay at Marathon. Capital expenditures in 2011 included $69.2 million for development and infrastructure work at the Montana mines (including $15.7 million for the Blitz project development) and $20.9 million in facilities and equipment, $14.1 million in net cash and shares to acquire the Bermuda property from Benton Resources Corp., and $6.9 million of capital outlay at Marathon. In addition, during 2011, the Company spent $262.8 million in net cash and shares to acquire Peregrine Metals Ltd. For a discussion of certain risks associated with the Company’s business, see "Business and Properties – Introduction", and " – Risk Factors" and "Management’s Discussion and Analysis of Financial Condition and Results of Operations."
The Company’s exploration outlay during 2012 totaled about $15.0 million, of which $14.2 million was spent on drilling at the Altar property in Argentina and $0.8 million was spent on the Marathon properties in Canada. Exploration outlay during 2011 totaled about $2.5 million, of which $2.0 million was spent on drilling at the Altar property and $0.5 million on the Marathon properties in Canada. There were no funds expended for exploration on these properties during 2010. The Company has budgeted to incur about $8.8 million and $3.6 million on exploration efforts in Argentina and Canada, respectively, during 2013. The Company expenses exploration costs as incurred.
In 2012, the Company announced the sale to Mitsubishi Corporation for cash of a 25% interest in the Company's wholly-owned subsidiary, Stillwater Canada Inc, which owns the Marathon project and related Canadian properties. As a result, Mitsubishi assumed its proportionate share of future Marathon funding commitments. The Mitsubishi involvement may also facilitate securing future project financing in support of the Marathon development.
For the year ended December 31, 2012, capital, exploration and cash overhead costs for Stillwater Canada Inc (primarily the Marathon activities on a 100% basis) totaled about $13.2 million, of which $8.6 million was capitalized as development costs of the Marathon project and $4.6 million was expensed as incurred. Exploration and cash overhead costs for the Peregrine properties (primarily Altar) totaled $17.3 million in the year ended December 31, 2012 and have been expensed as incurred.
During the fourth quarter of 2012, the Company completed the issuance of $396.75 million of 1.75% senior unsecured convertible debentures, due October 15, 2032. Each $1,000 principal amount of these new debentures is initially convertible, under certain circumstances and during certain periods, into 60.4961 shares (subject to customary anti-dilution adjustments) of the Company's common stock, which represents an initial conversion price of $16.53 per share. The debentures also include an embedded conversion enhancement feature that is equivalent to including with each debenture a warrant initially exercisable for 30.2481 shares initially at $16.53 per share (also subject to customary anti-dilution adjustments). The effect of enhancement was to increase the effective conversion price. The Company, at its election, may settle conversions of the debentures in cash, shares of its common stock or any combination of cash and shares of its common stock. Debenture holders have the right to redeem their debentures at face value (plus accrued and unpaid interest up to, but excluding, the relevant repurchase date) on October 15, of each of the years 2019, 2024, 2029, at maturity and upon the occurrence of certain corporate events. The Company will have the right to call the debentures at any time on or after October 20, 2019. For accounting purposes, these debentures have been bifurcated under U.S. GAAP into separate debt and equity components, and reflect an effective maturity (to the first optional redemption date) of seven years. The residual amount recorded within equity is treated for accounting purposes as additional debt discount and accreted as an additional non-cash interest charge to earnings over the expected life. Issuance costs totaling about $12.4 million were deducted from the gross proceeds of the offering and the debt portion is being amortized ratably over 84 months. Net proceeds of the offering will be used to retire the Company's $166.5 million of outstanding 1.875% convertible debentures upon their expected redemption in March of 2013, and for general corporate purposes.
SAFETY
Mining operations conducted at the Stillwater Mine and at the East Boulder Mine involve the use of heavy machinery, drilling and blasting in confined spaces. The Company continues the pursuit of safety excellence with the utilization, since 2001, of the Company’s “G.E.T. (Guide, Educate and Train) Safe” program and with last year's commitment to the new CORESafety system, a U.S mining industry safety initiative endorsed in April 2012 by the National Mining Association's executive Board. The Company's safety and health management systems efforts are focused on accident prevention, continually seeking safer methods of mining and increased employee awareness and training. Areas of specific focus include enhanced work place examinations, on-going education in hazard recognition, safety audits with a focus of continual improvement and sustaining of the best practices, consistent safety standards adherence, accident/incidence investigations, near miss reporting and analysis and use of focus teams who are part of the mining workforce. Salary and hourly focus teams have been successful in proactively solving many safety related challenges.
Under CORESafety, the Company and its mining industry peers will work together toward a collective target of eliminating fatal accidents and sharply reducing the frequency and severity of on-the-job injuries within the mining industry over the next five years. CORESafety provides an unprecedented opportunity to improve worker safety in the mining industry by creating an industry-wide safety forum, providing the tools to continuously improve safety and health performance and then joining with peers in sharing best practices. It is comprised of a series of 20 modules, which can be prioritized to address specific gaps in safety and health performance based on the Company's own "gap analysis." The Company has selected eight of these modules to be given initial priority, with the others to follow.
The Company continues to use focus teams to address specific safety and health related issues. One of these areas in particular has been in the area of compliance with the Mine Safety and Health Administration’s (MSHA) diesel particulate matter (DPM) standards. At year-end 2012, the Company believes all underground operations are in compliance with these
stringent standards through the use of blended biodiesel fuels, post exhaust treatments, power train advances and high secondary ventilation standards.
For the year ended December 31, 2012, none of the Company’s mines received written notice from MSHA of (i) a flagrant violation under section 110(b)(2) of the Mine Act; (ii) a pattern of violations of mandatory health or safety standards that are of such nature as could have significantly and substantially contributed to the cause and effect of other mine health or safety hazards under section 104(e) of the Mine Act; or (iii) the potential to have such a pattern.
During 2012, the overall Company reportable accident incidence rate (measured as reportable incidents per 200,000 man hours worked) improved to 3.12 versus 3.34 at the end of 2011. The 2012 results represent a 74.8% reduction in incidence rates for Company employees and contractors since the inception of the “G.E.T. Safe” safety and health management systems in 2001. The metallurgical complex in Columbus, Montana, continued to maintain a low incidence rate while being recognized by the Montana Department of Labor and Occupational Safety and Health Administration (OSHA) as a leader in workplace safety.
The smelter, base metal refinery and analytical laboratory continue to participate in and support the Montana Department of Labor’s Safety and Health Achievement Recognition Program (SHARP). These facilities have all received SHARP recognition numerous times. The smelter received a three year SHARP recognition in 2010. The base metal refinery and laboratory received SHARP recognition in 2009 and have recently applied again for the SHARP award.
The SHARP program recognizes employers who have demonstrated exemplary achievements in workplace safety and health. By meeting the SHARP inspection requirements, these facilities may be exempt from general OSHA inspections for a period of time. During 2011, employee participation and involvement was further enhanced through the external continuous improvement audits and regular internal safety inspections conducted by salary and hourly inspection teams.
2013 – LOOKING FORWARD
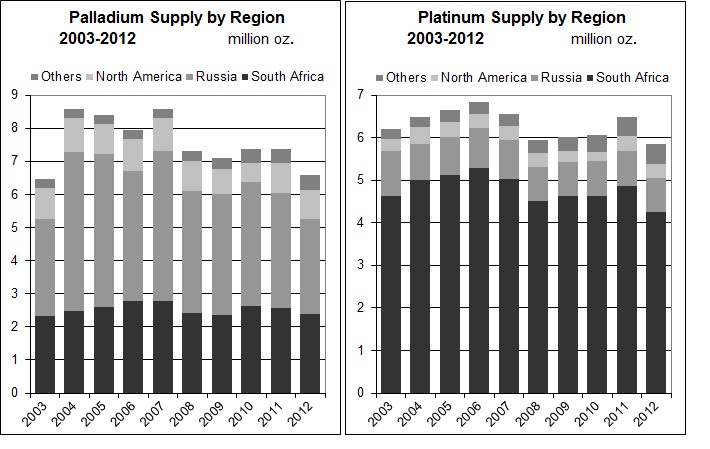
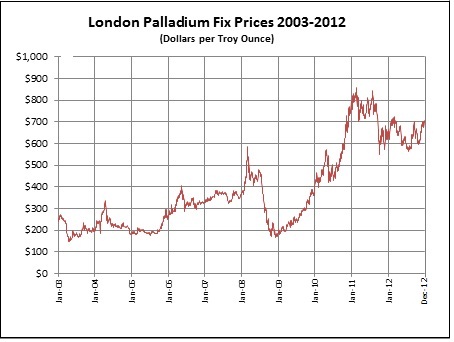
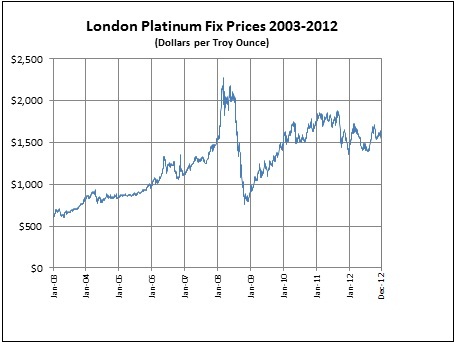
Commodity prices and demand for the Company's principal metals, palladium and platinum, declined sharply during the economic recession in late 2008 and early 2009. The price of palladium and platinum increased throughout 2009, 2010 and the first half of 2011. PGM prices then declined beginning in September of 2011, as European debt problems and restrictive credit policies in China took their toll on the markets. As shown on the chart below, the price of palladium, which had traded as low as $164 per ounce in December 2008, was quoted in London through August 2011 at prices above $800 per ounce; thereafter palladium traded lower and ended the year 2011 at $630 per ounce. Similarly, platinum consistently trended upward following its October 2008 low of $763 per ounce, was quoted in London at prices above $1,800 per ounce through August; thereafter traded lower to end 2011 at a price of $1,354 per ounce. The increase in PGM prices between 2008 and early 2011 appeared to have been the result of gradual recovery in automotive demand in the Western economies (excluding Europe, where vehicle production has continued to be depressed), coupled with continued growth in automotive production in China and certain other emerging economies. Slower growth in Chinese auto demand during 2011, coupled with the damage to Japanese infrastructure from the devastating earthquake and tsunami in March 2011, impeded auto sales growth and therefore PGM demand during much of the year. On top of this, the threat of a Greek default in the late summer of 2011 created a flight to dollars, which strengthened the U.S. currency, putting downward pressure on commodity prices that was accentuated by heavy liquidation of PGM holdings within exchange-traded funds. PGM prices generally continued lower during the first half of 2012, but then gradually strengthened late in the year as concerns over the state of the euro abated and concerns regarding production of PGMs in South Africa. This strengthening price trend continued into early 2013 until the recent sell off of most metals and other commodities.
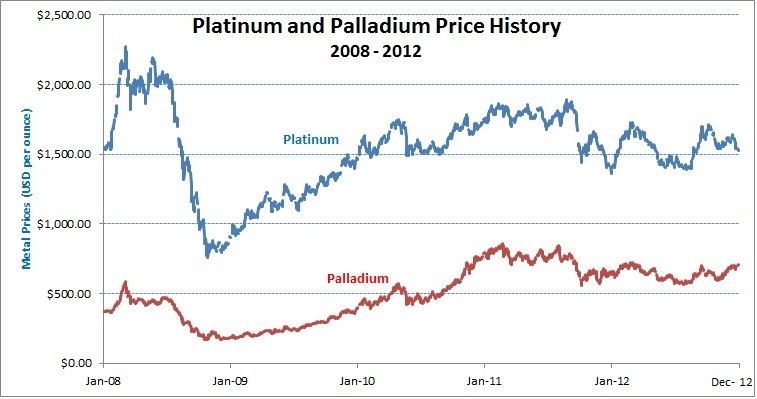
While the absolute level of PGM prices is important for the Company, an equally critical consideration is the relative level of the palladium price in comparison to the price of platinum. Because the Company’s mines produce about 3.36 times as much saleable palladium as platinum, the Company benefits as the price of palladium converges upward toward the price of platinum. The price of palladium relative to platinum averaged between 20% and 25% of the price of platinum from 2003 through the first half of 2010, but since then it has increased to average between 40% and 45% of the platinum price for the past two years or so. To illustrate the importance of this move, an analysis of the Company’s financial results for 2012 demonstrates that, had the price of palladium been lower and only averaged 22% of the price of platinum (assuming a steady platinum price) in 2012 instead of the actual average ratio of 43.5%, the Company’s EBITDA for 2012 would have been reduced by about $130.0 million.
From an operating perspective, the Company’s ability to increase its mine production in response to higher PGM prices is very limited, as is generally the case throughout the PGM industry. Production is constrained primarily by the developed state of the mines (i.e., the number and quality of working faces available for mining) and by limits on the availability of skilled manpower and equipment. The Company’s mine plans for 2013 contemplate production of about 500,000 ounces of palladium and platinum, a little lower than actual production in 2012. Total cash costs per ounce (a non-GAAP measure of mining efficiency) are projected to average $560 per ounce in 2013, higher than the $484 per ounce experienced in 2012, reflecting anticipated cost inflation in materials and supplies, increased labor costs associated with the labor agreements at the Montana operations, expanded and enhanced miner training efforts, increased growth in tax and royalty expense associated with increased PGM realizations and stable mine production in 2013. Prices for key consumables (steel, fuel and explosives) used in mine production are continuing to experience upward pressure.
Capital spending in 2013 is budgeted at about $172.8 million, which anticipates higher spending on equipment replacement and mine development, plus improvements at the smelter in Columbus, development spending for the Blitz, Far West, and Graham Creek projects along the J-M Reef in Montana, and continuing work at the Company’s Marathon PGM property in Canada. The Company has budgeted to incur about $13.4 million in Argentina and $8.1 million in Canada on exploration and general and administrative costs during 2013. Exploration costs are expensed as incurred and are reflected separately in the Company’s consolidated statement of operations, where they reduce net income. Thus, lower metals prices, higher mining costs and the need to expense exploration costs significantly affect net income.
In response to the Company’s expectation of robust longer-term market fundamentals for palladium and platinum and the constraints on increasing production from the Company’s existing mines, the Company is involved in two mine expansion projects along the J-M Reef. The first of these, known as the Blitz project, will develop new underground drifts on two levels from the current Stillwater Mine toward the eastern extremity of the reef, ultimately extending 23,400 feet of new development to the east on each level. A new portal and decline from surface would also be installed about four miles to the east of the existing Stillwater Mine surface facilities, intersecting the two new drifts and providing ventilation and emergency egress for the Blitz area. As now contemplated, the Blitz project is estimated to cost about $209.8 million (of which $35.6 million had already been incurred through 2012) and will take about six more years to complete. During 2012, the Company took delivery on a refurbished TBM for the Blitz project, installed it underground, and placed it into operation in mid-December. The other project on the J-M Reef, known as Graham Creek, is developing 8,200 feet toward the west from the existing East Boulder Mine infrastructure, using a TBM that was already in place underground. The Graham Creek development also will include
constructing two new ventilation raises to surface once the TBM drive is completed, most likely in the first half of 2013. Overall, Graham Creek is a smaller-scale project than Blitz and is expected to cost about $12.4 million, of which $3.5 million had already been incurred through 2012, with first production in early 2015.
In 2012, management identified an area within the Stillwater Mine infrastructure that has only recently become accessible and that appears to be an attractive candidate for accelerated development. This area, which is referred to as the Far West, is situated underneath the well-developed Upper West mining area, which has been in production for many years, but because Far West is below the 5000-level primary Upper West haulage level, its development has had to await the completion of the 3500-level haulage in that part of the mine. It has always been the Company's intent to mine that area in due course. The project represents an acceleration of development in the Far West area pulling forward capital that would otherwise have been spent in later years. The development at Far West will cost about $28 million over three years, and once it is fully online it should increase the mine's annual PGM production by about 45,000 ounces. Allocation of resources to Far West may delay the Blitz development to a limited extent, but Far West should allow the Company to benefit from production growth sooner than the Blitz project alone would provide.
During 2013, the Company expects to continue advancing the Marathon project in Canada. Focus will continue towards completing detailed engineering and updating associated technical reports in 2013. On the environmental front, the Company submitted its environmental assessment to the joint federal/provincial panel in July 2012 and is currently responding to additional information requests from various government agencies and the general public. Work with First Nations and other Aboriginal groups will also be ongoing. Once the environmental assessment has been deemed complete and ministerial approvals are in hand, the formal mine permitting process will proceed. The Company's current estimate is that first production from Marathon will not occur before 2017. The Company’s preliminary estimate of capital costs remains in the range of $550 million to $650 million, pending the completion of the detailed engineering study later in 2013.
The Company intends to allocate about $8.8 million for exploration at the Altar project in Argentina during the 2012-2013 drilling season (generally December through April). The Company currently has two drill rigs on the Altar property for the 2012-2013 drilling season. The focus of the drilling this season will be to better define the perimeter of the primary copper porphyry and to probe it at depth, and to assess certain other mineral targets on the property. This project is not yet sufficiently advanced to include ore in the Company's proven or probable reserves. The drilling costs will be expensed as incurred and recorded as exploration expense on the Company’s Consolidated Statements of Operations and Comprehensive Income.
SUMMARY OF THE COMPANY
Stillwater Mining Company is engaged in the development, extraction, processing, smelting, refining, and marketing of palladium, platinum and associated metals (platinum group metals or PGMs) from a geological formation in south-central Montana known as the J-M Reef and from the recycling of spent catalytic converters. The Company is also engaged in expanding its mining operations on the J-M Reef, developing its Marathon PGM-copper property adjacent to Lake Superior in the province of Ontario, Canada and advancing the exploration of its Altar copper-gold property in the province of San Juan, Argentina.
The J-M Reef is the only known significant primary source of platinum group metals inside the United States and one of the significant resources outside South Africa and the Russian Federation. Associated by-product metals at the Company's operations include significant amounts of nickel and copper and minor amounts of gold, silver and rhodium. The J-M Reef is a narrow but extensive mineralized zone containing PGMs, which has been traced over a strike length of approximately 28 miles.
THE STILLWATER COMPLEX AND J-M REEF
LOCATION
The Stillwater Complex, which hosts the J-M Reef ore deposit, is located in the Beartooth Mountains in south central Montana. It is situated along the northern edge of the Beartooth Uplift and Plateau, which rise to elevations in excess of 10,000 feet above sea level. The plateau and Stillwater Complex have been deeply incised by the major drainages and tributaries of the Stillwater and Boulder Rivers down to elevations at the valley floor of approximately 5,000 feet above sea level.
GEOLOGY OF THE J-M REEF
Geologically, the Stillwater Layered Igneous Complex is composed of a succession of ultramafic to mafic rocks derived from a large complex magma body emplaced deep in the Earth’s crust an estimated 2.7 billion years ago. The molten mass was sufficiently large and fluid at the time of emplacement to allow its chemical constituents to crystallize slowly and sequentially, with the heavier mafic minerals settling more rapidly toward the base of the cooling complex. The lighter, more siliceous suites
crystallized more slowly and also settled into layered successions of norite, gabbroic and anorthosite suites. This systematic process resulted in mineral segregations being deposited into extensive and relatively uniform layers of varied mineral concentrations.
The uniquely PGM-enriched J-M Reef and its characteristic host rock package represent one such layered sequence within the Stillwater Layered Igneous Complex. The geosciences community believes that the PGM-enriched suite and other minerals characterizing the J-M Reef accumulated at the same time and by the same mechanisms of formation as the rocks enclosing them. Over time, the orientation of a portion of the original horizontal reef and layered igneous complex was faulted an estimated 20,000 feet to the northeast and was tilted upward at angles of 50 to 90 degrees to the north by the Beartooth Uplift. Localized faulting and intrusive mafic dikes are also evident along the 28-mile strike length of exposed Stillwater Complex. The impact of these structural events is localized along the J-M Reef and affects the percent mineable tonnage in an area, creates additional dilution, or results in below cut-off grade and barren zones within the reef. The impacts on ore reserves of these events are quantified in the percent mineable discussion under “Business and Properties - Proven and Probable Ore Reserves.” The upper portion and exposed edge of the uplifted reef complex were eroded forming the lenticular-shaped surface exposure of the Stillwater Complex and J-M Reef package evident today.
The J-M Reef package has been traced at its predictable geologic position and with unusual overall uniformity over considerable distances within the uplifted portion of the Stillwater Complex. The surface outcrops of the reef have been examined, mapped and sampled for approximately 28 miles along its east-southeasterly course and over a known expression of over 8,200 feet vertically. The predictability of the J-M Reef has been further confirmed in subsurface mine workings of the Stillwater and East Boulder Mines and by over 38,000 drill hole penetrations.
The PGMs in the J-M Reef consist primarily of palladium, platinum and a minor amount of rhodium. The reef also contains significant amounts of nickel and copper and trace amounts of gold and silver. Five-year production figures from the Company’s mining operations on the J-M Reef are summarized in Part II, Item 6, “Selected Financial Data.”
The Company’s original long-term development strategy and certain elements of its current planning and mining practices on the J-M Reef ore deposit were founded upon initial feasibility and engineering studies conducted in the 1980s. Initial mine designs and practices were established in response to available technologies and the particular characteristics and challenges of the J-M Reef ore deposit. The Company’s current development plans, mining methods and ore extraction schedules are designed to provide systematic access to, and development of, the ore deposit within the framework of current and forecasted economic, regulatory and technological considerations as well as the specific characteristics of the J-M Reef ore deposit. Some of the challenges inherent in the development of the J-M Reef include:
| |
| • | Surface access limitations (property ownership and environmental sensitivity); |
| |
| • | Topographic and climatic extremes involving rugged mountainous terrain and substantial elevation differences; |
| |
| • | Specific configuration of the mineralized zone (narrow – average width 5 feet, depth – up to 1.5 miles of vertical extent, and long – approximately 28 miles in length), dipping downward at an angle varying from near vertical to 38 degrees; |
| |
| • | A deposit which extends both laterally and to depth from available mine openings, with travel distances underground from portal to working face of up to six miles; and |
| |
| • | Proven and probable ore reserves extending for a lateral distance of approximately 32,000 feet at the Stillwater Mine and approximately 12,500 feet at the East Boulder Mine – a combined extent underground of approximately 8.4 miles, with active underground travelways and ramps on multiple levels totaling more than 100 miles in extent that must be maintained and supported logistically. |
ORE RESERVE DETERMINATION METHODOLOGY
The Company utilizes statistical methodologies to calculate ore reserves based on interpolation between and projection beyond sample points. Interpolation and projection are limited by certain modifying factors including geologic boundaries, economic considerations and constraints imposed by safe mining practices. Sample points consist of variably spaced drill core intervals through the J-M Reef obtained from drill sites located on the surface and in underground development workings. Results from all sample points within the ore reserve area are evaluated and applied in determining the ore reserve.
For proven ore reserves, distances between samples range from 25 to 100 feet but are typically spaced at 50-foot intervals both horizontally and vertically. The sample data for proven ore reserves consists of survey data, lithologic data and assay results. Quality Assurance/Quality Control (QA/QC) protocols are in place at both mine sites to test the sampling and analysis procedures. To test assay accuracy and reproducibility, pulps from core samples are resubmitted and compared. To test for sample label errors or cross-contamination, blank core (waste core) samples are submitted with the mineralized sample lots and compared. The QA/QC protocols are practiced on both resource development and production samples. The resulting data is entered into a 3-dimensional modeling software package and is analyzed to produce a 3-dimensional solid block model of the
resource. The assay values are further analyzed by a geostatistical modeling technique (kriging) to establish a grade distribution within the 3-dimensional block model. Dilution is then applied to the model and a diluted tonnage and grade are calculated for each block. Ore and waste tons, contained ounces and grade are then calculated and summed for all blocks. A percent mineable factor based on historic geologic unit values is applied and the final proven reserve tons and grade are calculated.
Two types of cut-off grades are recognized for the J-M Reef, a geologic cut-off boundary and an economic cut-off grade. The geologic cut-off grade for both the Stillwater and East Boulder Mines falls in the range of 0.2 to 0.3 troy ounces of palladium plus platinum (Pd+Pt) per ton. The economic cut-off grade is lower than the geologic cut-off and can vary between the mines based on cost and efficiency factors. The determination of the economic cut-off grade is completed on a round by round basis and is driven primarily by excess mill capacity and geologic character encountered at the face. See “Business and Properties – Proven and Probable Ore Reserves – Discussion” for reserve sensitivity to metal pricing.
Probable ore reserve estimations are based on longer projections, up to a maximum radius of 1,000 feet beyond the limit of existing drill hole sample intercepts of the J-M Reef obtained from surface and underground drilling. Statistical modeling and the established continuity of the J-M Reef, as determined from results of 26 years of mining activity to date, support the Company’s technical confidence in estimates of tonnage and grade over this projection distance. Where appropriate, projections for the probable ore reserve determination are constrained by any known or anticipated restrictive geologic features.
The Company reviews its methodology for calculating ore reserves on an annual basis. Conversion, an indicator of the success in upgrading probable ore reserves to proven ore reserves, is evaluated annually as part of the reserve process. The annual review examines the effect of new geologic information, changes implemented or planned in mining practices and mine economics on factors used for the estimation of probable ore reserves. The review includes an evaluation of the Company’s rate of conversion of probable reserves to proven reserves.
The proven and probable ore reserves are then modeled as a long-term mine plan and additional factors including mining methods, process recoveries, metal prices, mine operating productivities and costs and capital estimates are applied to determine the overall economics of the ore reserves. The Company has made available on its website (www.stillwatermining.com) in the Investor Relations section a report entitled “Technical Report for the Mining Operations at Stillwater Mining Company”, dated as of March 2011 and furnished to the United States Securities and Exchange Commission (SEC) on Form 8-K on June 23, 2011, that discusses the Company’s ore reserve methodology in greater detail.
SEC ORE RESERVE GUIDELINES
The SEC has established guidelines contained in Industry Guide No. 7 to assist registered companies as they estimate ore reserves. These guidelines set forth technical, legal, and economic criteria for determining whether the Company’s ore reserves can be classified as proven and probable.
The SEC’s economic guidelines historically have not constrained the Company’s ore reserves, and did not constrain the ore reserves at December 31, 2012. Under these guidelines, ore may be classified as proven or probable if extraction and sale result in positive cumulative undiscounted cash flow. The Company utilizes the historical trailing twelve-quarter average combined PGM market price in ascertaining these cumulative undiscounted cash flows.
The Company believes that it is appropriate to use a long-term average price for measuring ore reserves, as such a price better matches the period over which the reserves will ultimately be mined. However, should metal prices decline substantially from their present level for an extended period, the twelve-quarter trailing average price might also decline and could result in a reduction of the Company’s reported ore reserves.
The Company’s Ore Reserve Committee, a committee of the Board, met three times during 2012 with management and third party independent outside experts to review ore reserve methodology, to identify best practices in the industry and to receive reports on the progress and results of the Company’s mine development efforts. The Committee has reviewed the Company’s ore reserves as reported at December 31, 2012, having met with management and with the Company’s independent consultant on ore reserves.
RESULTS
The December 31, 2012, ore reserves were reviewed by Behre Dolbear & Company, Inc. (Behre Dolbear), third party independent consultants, who are experts in mining, geology and ore reserve determination. The Company has utilized Behre Dolbear to carry out independent reviews and inventories of the Company’s ore reserves since 1990. Behre Dolbear has consented to be a named expert herein. See “Risk Factors – Ore Reserves Are Very Difficult to Estimate and Ore Reserve Estimates May Require Adjustment in the Future; Changes in Ore Grades, Mining Practices and Economic Factors Could Materially Affect the Company’s Production and Reported Results.”
PROVEN AND PROBABLE ORE RESERVES
The Company’s proven ore reserves are generally expected to be extracted utilizing existing mine infrastructure. However, additional infrastructure development will be required to extract the Company’s probable ore reserves. Based on the 2013 mining plans at each mine, the year-end 2012 proven ore reserves of 3.3 million tons at the Stillwater Mine and 2.7 million tons at the East Boulder Mine represent an adequate level of proven ore reserves to support planned mining activities.
The grade of the Company’s J-M Reef ore reserves, measured in combined palladium and platinum ounces per ton, is a composite average of samples in all reserve areas. As is common in underground mines, the grade mined and the recovery rate achieved varies depending on the area being mined. In particular, mill head grade varies significantly between the Stillwater and East Boulder Mines, as well as within different areas of each mine. During 2012, 2011 and 2010, the average mill head grade for all tons processed from the Stillwater Mine was 0.58, 0.53 and 0.50 PGM ounces per ton of ore, respectively. During 2012 and 2011, the average mill head grade for all tons processed from the East Boulder Mine was about 0.35 PGM ounces per ton of ore compared to an average mill head grade of 0.37 PGM ounces per ton of ore in 2010. Concentrator feeds at both mines typically include, along with the ore, some PGM-bearing material that is below the cut-off grade for reserves (reef waste) but that is economic to process so long as there is capacity available in the concentrator.
As of December 31, 2012, 2011 and 2010 the Company’s proven and probable ore reserves in the J-M Reef were as follows:
|
| | | | | | | | | | | | |
| STILLWATER MINE |
| | | ORE TONS (000’s) | | AVERAGE GRADE (OZ/TON) | | CONTAINED OUNCES (000’S) | | SALEABLE OUNCES (000’S) |
| As of December 31, 2012 | | | | | | | | |
| Proven Reserves | | 3,333 |
| | 0.59 |
| | 1,952 |
| | 1,639 |
|
| Palladium | | | | 0.46 |
| | 1,524 |
| | 1,272 |
|
| Platinum | | | | 0.13 |
| | 428 |
| | 367 |
|
| Probable Reserves | | 12,149 |
| | 0.59 |
| | 7,189 |
| | 6,035 |
|
| Palladium | | | | 0.46 |
| | 5,612 |
| | 4,684 |
|
| Platinum | | | | 0.13 |
| | 1,577 |
| | 1,351 |
|
| Total Proven and Probable Reserves (1) | | 15,482 |
| | 0.59 |
| | 9,141 |
| | 7,674 |
|
| Palladium | | | | 0.46 |
| | 7,136 |
| | 5,956 |
|
| Platinum | | | | 0.13 |
| | 2,005 |
| | 1,718 |
|
| As of December 31, 2011 | | | | | | | | |
| Proven Reserves | | 2,782 |
| | 0.62 |
| | 1,711 |
| | 1,401 |
|
| Palladium | | | | 0.48 |
| | 1,335 |
| | 1,087 |
|
| Platinum | | | | 0.14 |
| | 376 |
| | 314 |
|
| Probable Reserves | | 12,262 |
| | 0.60 |
| | 7,374 |
| | 6,039 |
|
| Palladium | | | | 0.47 |
| | 5,753 |
| | 4,684 |
|
| Platinum | | | | 0.13 |
| | 1,621 |
| | 1,355 |
|
| Total Proven and Probable Reserves (1) | | 15,044 |
| | 0.60 |
| | 9,085 |
| | 7,440 |
|
| Palladium | | | | 0.47 |
| | 7,087 |
| | 5,770 |
|
| Platinum | | | | 0.13 |
| | 1,997 |
| | 1,669 |
|
| As of December 31, 2010 | | | | | | | | |
| Proven Reserves | | 2,559 |
| | 0.64 |
| | 1,648 |
| | 1,354 |
|
| Palladium | | | | 0.50 |
| | 1,285 |
| | 1,050 |
|
| Platinum | | | | 0.14 |
| | 363 |
| | 304 |
|
| Probable Reserves | | 13,116 |
| | 0.62 |
| | 8,176 |
| | 6,717 |
|
| Palladium | | | | 0.49 |
| | 6,376 |
| | 5,207 |
|
| Platinum | | | | 0.14 |
| | 1,800 |
| | 1,510 |
|
| Total Proven and Probable Reserves (1) | | 15,675 |
| | 0.63 |
| | 9,824 |
| | 8,071 |
|
| Palladium | | | | 0.49 |
| | 7,661 |
| | 6,257 |
|
| Platinum | | | | 0.14 |
| | 2,163 |
| | 1,814 |
|
|
| | | | | | | | | | | | |
| EAST BOULDER MINE |
| | | ORE TONS (000’s) | | AVERAGE GRADE (OZ/TON) | | CONTAINED OUNCES (000’S) | | SALEABLE OUNCES (000’S) |
| As of December 31, 2012 | | | | | | | | |
| Proven Reserves | | 2,690 |
| | 0.42 |
| | 1,126 |
| | 951 |
|
| Palladium | | | | 0.33 |
| | 881 |
| | 739 |
|
| Platinum | | | | 0.09 |
| | 245 |
| | 212 |
|
| Probable Reserves | | 27,970 |
| | 0.40 |
| | 11,188 |
| | 9,456 |
|
| Palladium | | | | 0.31 |
| | 8,756 |
| | 7,349 |
|
| Platinum | | | | 0.09 |
| | 2,432 |
| | 2,107 |
|
| Total Proven and Probable Reserves (1) | | 30,660 |
| | 0.40 |
| | 12,314 |
| | 10,407 |
|
| Palladium | | | | 0.31 |
| | 9,638 |
| | 8,088 |
|
| Platinum | | | | 0.09 |
| | 2,676 |
| | 2,319 |
|
| As of December 31, 2011 | | | | | | | | |
| Proven Reserves | | 2,228 |
| | 0.41 |
| | 907 |
| | 767 |
|
| Palladium | | | | 0.32 |
| | 710 |
| | 595 |
|
| Platinum | | | | 0.09 |
| | 197 |
| | 172 |
|
| Probable Reserves | | 25,207 |
| | 0.40 |
| | 9,988 |
| | 8,449 |
|
| Palladium | | | | 0.31 |
| | 7,817 |
| | 6,551 |
|
| Platinum | | | | 0.09 |
| | 2,171 |
| | 1,898 |
|
| Total Proven and Probable Reserves (1) | | 27,435 |
| | 0.40 |
| | 10,895 |
| | 9,216 |
|
| Palladium | | | | 0.31 |
| | 8,527 |
| | 7,146 |
|
| Platinum | | | | 0.09 |
| | 2,368 |
| | 2,070 |
|
| As of December 31, 2010 | | | | | | | | |
| Proven Reserves | | 2,059 |
| | 0.41 |
| | 848 |
| | 713 |
|
| Palladium | | | | 0.32 |
| | 664 |
| | 553 |
|
| Platinum | | | | 0.09 |
| | 184 |
| | 160 |
|
| Probable Reserves | | 23,064 |
| | 0.40 |
| | 9,199 |
| | 7,736 |
|
| Palladium | | | | 0.31 |
| | 7,200 |
| | 5,998 |
|
| Platinum | | | | 0.09 |
| | 1,999 |
| | 1,738 |
|
| Total Proven and Probable Reserves (1) | | 25,123 |
| | 0.40 |
| | 10,047 |
| | 8,449 |
|
| Palladium | | | | 0.31 |
| | 7,864 |
| | 6,551 |
|
| Platinum | | | | 0.09 |
| | 2,183 |
| | 1,898 |
|
|
| | | | | | | | | | | | |
| TOTAL MONTANA MINES |
| | | ORE TONS (000’s) | | AVERAGE GRADE (OZ/TON) | | CONTAINED OUNCES (000’S) | | SALEABLE OUNCES (000’S) |
| As of December 31, 2012 | | | | | | | | |
| Proven Reserves | | 6,023 |
| | 0.51 |
| | 3,078 |
| | 2,590 |
|
| Probable Reserves | | 40,119 |
| | 0.46 |
| | 18,377 |
| | 15,491 |
|
| Total Proven and Probable Reserves (1) | | 46,142 |
| | 0.46 |
| | 21,455 |
| | 18,081 |
|
| As of December 31, 2011 | | | | | | | | |
| Proven Reserves | | 5,010 |
| | 0.51 |
| | 2,618 |
| | 2,168 |
|
| Probable Reserves | | 37,469 |
| | 0.46 |
| | 17,362 |
| | 14,488 |
|
| Total Proven and Probable Reserves (1) | | 42,479 |
| | 0.47 |
| | 19,980 |
| | 16,656 |
|
| As of December 31, 2010 | | | | | | | | |
| Proven Reserves | | 4,618 |
| | 0.54 |
| | 2,496 |
| | 2,067 |
|
| Probable Reserves | | 36,180 |
| | 0.49 |
| | 17,375 |
| | 14,453 |
|
| Total Proven and Probable Reserves (1) | | 40,798 |
| | 0.49 |
| | 19,871 |
| | 16,520 |
|
(1) Reserves are defined as that part of a mineral deposit that could be economically and legally extracted or produced at the time of the reserve determination. Proven ore reserves are defined as ore reserves for which (a) quantity is computed from dimensions revealed in outcrops, trenches, workings or drill holes; grade and/or quality are computed from the results of detailed sampling and (b) the sites for inspection, sampling and measurement are spaced so closely and the geologic character is so well defined that size, shape, depth and mineral content of ore reserves are well-established. Probable ore reserves are defined as ore reserves for which quantity and grade and/or quality are computed from information similar to that used for proven ore reserves, but the sites for inspection, sampling, and measurement are farther apart or are otherwise less adequately spaced. The degree of assurance, although lower than that for proven ore reserves, is high enough to assume continuity between points of observation. The proven and probable ore reserves reflect variations in the PGM content and structural impacts on the J-M Reef. These variations are the result of localized depositional and structural influences on the distributions of economic PGM mineralization. Geologic domains within the reserve boundaries of the two mines include areas where as little as 0% and up to 100% of the J-M Reef is economically mineable. The ore reserve estimate gives effect to these assumptions. See “Risk Factors” and “Management’s Discussion and Analysis of Financial Condition and Results of Operations – Factors That May Affect Future Results and Financial Condition.”
DISCUSSION
The Company’s mine development efforts over the past several years have focused on converting probable reserves to proven reserves, rather than on adding new probable reserves. As of December 31, 2012, the Company’s total proven palladium and platinum ore reserves in the J-M Reef were 6.0 million tons at an average grade of 0.51 ounces per ton, containing 3.1 million ounces of palladium and platinum. This represented a net increase of 17.6% in proven contained ounces compared to the proven ore reserves reported as of December 31, 2011. The Company’s total probable ore reserves of palladium and platinum at December 31, 2012, were 40.1 million tons at an average grade of 0.46 ounces per ton, containing 18.4 million ounces of palladium and platinum. This represented a net increase of 5.8% in probable contained ounces compared to the probable reserves reported at December 31, 2011. Combined, the Company’s total proven and probable palladium and platinum ore reserves as of December 31, 2012, were 46.1 million tons at an average grade of 0.46 ounces per ton, containing 21.5 million ounces of palladium plus platinum – a net increase of about 7.4% in total proven and probable contained ounces from the 20.0 million ounces reported as of December 31, 2011.
In 2012, proven and probable ore tons increased 8.6% and contained ounces reflected an increase of 7.4% from those reported December 31, 2011. In 2011, proven and probable ore tons increased 4.1% while contained ounces increased by 0.5% from those reported December 31, 2010. The Company’s total proven and probable ore reserve tonnage in the J-M Reef at December 31, 2012, increased by about 13.1% or 5.3 million tons over the past two years. However, total contained ounces in proven and probable reserves increased by about 8.0% from those reported December 31, 2010.
The Stillwater Mine proven and probable ore reserves at year-end 2012 increased by 2.9% in terms of ore tons from those reported at year-end 2011. The East Boulder Mine proven and probable ore reserves at year-end 2012 increased by 11.8% in ore tons from those reported at year-end 2011. Overall, the Company’s estimated proven and probable ore reserves based on ore tons increased by 8.6% in 2012. The Company’s ore reserve determination for 2012, calculated at December 31, 2012, was limited by geologic certainty and not by economic constraints.
The following table highlights 2012 and 2011 year on year proven and probable ore reserves changes for the Montana operations:
|
| | | | | | | | | | | | | | | | | |
| | | As of December 31, 2012 | | As of December 31, 2011 | | Tonnage |
| | | Tons | Grade | Oz | | Tons | Grade | Oz | | Change |
| Stillwater Mine | | | | | | | | | | |
| Proven | | 3,333 |
| 0.59 |
| 1,952 |
| | 2,782 |
| 0.62 |
| 1,711 |
| | 19.8 | % |
| Probable | | 12,149 |
| 0.59 |
| 7,189 |
| | 12,262 |
| 0.60 |
| 7,374 |
| | -0.9 | % |
| Sub-Total | | 15,482 |
| 0.59 |
| 9,141 |
| | 15,044 |
| 0.60 |
| 9,085 |
| | 2.9 | % |
| East Boulder Mine | | | | | | | | | | |
| Proven | | 2,690 |
| 0.42 |
| 1,126 |
| | 2,228 |
| 0.41 |
| 907 |
| | 20.7 | % |
| Probable | | 27,970 |
| 0.40 |
| 11,188 |
| | 25,207 |
| 0.40 |
| 9,988 |
| | 11.0 | % |
| Sub-Total | | 30,660 |
| 0.40 |
| 12,314 |
| | 27,435 |
| 0.40 |
| 10,895 |
| | 11.8 | % |
| Total | | | | | | | | | | |
| Proven | | 6,023 |
| 0.51 |
| 3,078 |
| | 5,010 |
| 0.51 |
| 2,618 |
| | 20.2 | % |
| Probable | | 40,119 |
| 0.46 |
| 18,377 |
| | 37,469 |
| 0.46 |
| 17,362 |
| | 7.1 | % |
| Total | | 46,142 |
| 0.46 |
| 21,455 |
| | 42,479 |
| 0.47 |
| 19,980 |
| | 8.6 | % |
Changes in proven and probable ore reserves are due to the net effect of the following:
| |
| • | Additions to proven ore reserves from new definition drilling, |
| |
| • | Deletions as proven reserves are mined, |
| |
| • | Deletions from probable ore reserves as areas are converted by new drilling from probable to proven ore reserves, |
| |
| • | Additions from development activity to convert mineralized inventory to probable ore reserves and |
| |
| • | Additions and deletions from adjustments to ore reserve estimation factors and mine planning criteria. The cut-off grade used in mine planning ranges from 0.2 to 0.3 ounces of palladium and platinum per ton for the Stillwater Mine and is 0.2 ounces of palladium and platinum per ton for the East Boulder Mine. The economic value of this cut-off grade varies with palladium and platinum prices and with the cost and efficiency of the different mining methods employed. |
IMPAIRMENT OF LONG-LIVED ASSETS
The Company reviews and evaluates its long-lived assets for impairment when events or changes in circumstances indicate that the related carrying amounts may not be recoverable. Impairment is considered to exist if total estimated future cash flows on an undiscounted basis are less than the carrying amount of the asset. The estimation of future cash flows takes into account estimates of recoverable ounces, PGM prices (long-term sales contract prices and historical pricing trends or third party projections of future prices, rather than prices at a point in time, as an indicator of longer-term future prices), production levels, and capital and reclamation expenditures, all based on life-of-mine plans and projections. If the assets are impaired, a calculation of fair market value is performed, and if fair market value is lower than the carrying value of the assets, the assets are reduced to their fair market value.
Assumptions underlying future cash flows are subject to certain risks and uncertainties. Any differences between projections and actual outcomes for key factors such as PGM prices, recoverable ounces, and/or the Company’s operating performance could have a material effect on the Company’s ability to recover the carrying amounts of its long-lived assets and so could potentially lead to impairment charges in the future.
The Company concluded there was no impairment of its long-lived assets at December 31, 2012, or at December 31, 2011.
CURRENT OPERATIONS
The Company’s current mining and processing operations are located in south central Montana. The Company conducts mining and milling operations at the Stillwater Mine near Nye, Montana and at the East Boulder Mine south of Big Timber, Montana. Both mines are located on mine claims that follow the apex of the J-M Reef. The Company operates a smelter and base metal refinery, and recycling facilities in Columbus, Montana.
Montana Properties and Facilities – February 2013
STILLWATER MINE
The Company conducts underground mining operations at its wholly-owned Stillwater Mine, near Nye, Montana. The Stillwater Mine facility accesses, extracts and processes PGM ores from the eastern portion of the J-M Reef using mine openings located in the Stillwater Valley. In addition, the Company owns and maintains ancillary buildings that contain the concentrator, shop and warehouse, changing facilities, headframe, hoist house, paste plant, water treatment, storage facilities and office. All surface structures and tailings management facilities are located within the 2,475 acre Stillwater Mine Operating Permit area which is administrated collectively by the Montana Department of Environmental Quality (DEQ) and the United States Forest Service (USFS). Ore reserves developed at the Stillwater Mine are controlled by patented mining claims either leased or owned outright by the Company. The mine is located approximately 85 miles southwest of Billings, Montana, and is accessed by a paved road. The mine has adequate water and power from established sources. See “Risk Factors – Uncertainty of Title to Properties – The Validity of Unpatented Mining Claims is Subject to Title Risk.”
The Stillwater Mine accesses and has developed a 5.9-mile-long underground segment of the J-M Reef, on various levels between 2,000 and 7,500 feet above sea level. Access to the ore at the Stillwater Mine is accomplished by means of a 1,950-foot vertical shaft and by a system of horizontal adits and drifts driven parallel to the strike of the J-M Reef at vertical intervals of between 150 feet and 300 feet. Seven main adits have been driven from surface portals on the west and east slopes of the Stillwater Valley at various elevations between 5,000 and 5,900 feet above sea level. Several additional principal levels have been developed below the 5,000-foot level down to the 3,200-foot elevation, accessed from the vertical shaft and the associated shaft ramp system. Ore from this region of the mine is hauled by truck and/or rail to the shaft, where it is crushed and hoisted out of the mine. Below the 3,200-foot elevation, the Company is continuing to develop a decline system and additional principal mining levels to access and develop deeper areas in the central part of the mine below those currently serviced by the existing shaft. At the end of 2012, this decline system extended down to the 2,000 foot level.
The 1,950-foot vertical shaft was constructed between 1994 and 1997 as part of the Company’s plan to double the mine’s output capacity from 1,000 to 2,000 tons of ore per day and was sunk adjacent to the concentrator (starting at the 5,000-foot surface elevation) to increase efficiency of the operation. Ore and any waste rock to be transported to the surface from the off-shaft and deeper areas of the mine are crushed prior to being hoisted up the shaft. The production shaft and underground crushing station reduce haulage times and costs, facilitate the handling of ore and waste and improve the grinding capabilities of the concentrator. Ore from above the 5,000-foot west elevation is hauled to the surface by rail. Waste material not used for backfilling in underground excavations is transported to the surface and placed in permitted waste rock disposal sites.
The Stillwater Mine currently uses its 31 footwall lateral drifts and 6 primary ramps and vertical excavations to provide personnel and equipment access, supply haulage and drainage, intake and exhaust ventilation systems, muck haulage, backfill plant access, powder storage and/or emergency egress. The footwall lateral and primary ramp systems will continue to provide support for production and ongoing development activities. In addition, certain mine levels are required as an integral component of the ventilation system and serve as required intake and/or exhaust levels, or as parallel splits to maintain electrical ventilation horsepower balance and to meet MSHA requirements. MSHA regulations require the Company to designate alternate (secondary) escapeways from mine workings. These levels, in addition to comprising critical functional components of the ventilation and escapeway system, serve as permanent mine service and utility infrastructure for road and rail transportation, dewatering and backfill pumping facilities. They have been designed and are intended to be used for the life of the mine.
During 2007, the Company began construction of a major dedicated decline ramp for electric truck haulage of material mined from below the 3500 rail level. The electric trucks haul material up to the 3500 level of the shaft, where it can then be hoisted to the surface. This new ramp currently services down to the 2900 level of the mine, but it is planned eventually to extend down to about the 1,400-foot elevation. The first-phase installation of the Kiruna electric trucks at Stillwater Mine was completed and the first two trucks were placed into operation during the first quarter of 2011. In the future, the Company expects to install a horizontal rail haulage system on the 2,000 foot level to transport ore and waste material from the deeper mining faces to the electric truck ramps. A third Kiruna electric truck is expected to be added in 2013.
Prior to 1994, almost all of the Company’s mining activities utilized captive cut-and-fill stoping methods. This is a manpower-intensive mining method that extracts the ore body in eight to ten foot high horizontal cuts within the reef, accessed from vertical raises and mined with conventional jackleg drills and slushers. The open space created by the extraction of each cut is backfilled with waste rock and coarse concentrator tailings and becomes the floor for the next level of mining as the process moves upward. Commencing in 1994, the Company introduced two mechanized mining methods: ramp-and-fill and sub-level stoping. Ramp-and-fill is a mining method in which a series of horizontal cuts are extracted from the ore body using mobile equipment. Access to the ore body is from ramps driven within or adjacent to the ore body, allowing the use of hydraulic drills and load-haul-dump equipment. Sub-level stoping is a mining method in which blocks of the reef approximately 50 feet high and up to 75 feet in length are extracted in 30-foot intervals utilizing mobile long-hole drills and
remote control rubber tired load-haul-dump equipment. The reef is mined in a retreat sequence and mined out areas are filled with development waste or sand backfill as appropriate. Traditionally, captive cut-and-fill has been viewed as being more selective in nature than either ramp-and-fill or sub-level stoping, but it also requires miners with specialized skills and is generally less productive. Other factors considered in determining the most appropriate mining method for each area include the amount of ancillary development required as well as the ore grade and ground conditions expected. The Company determines the appropriate mining method to be used on a stope-by-stope basis utilizing an engineering and economic analysis.
The Company processes ore from the Stillwater Mine through a surface concentrator facility (mill) adjacent to the Stillwater Mine shaft. The mill has a permitted design capacity of 3,000 tons per day. During 2012, an average of 1,838 tons of ore and 100 tons of sub-grade material were processed through the mill per calendar day. In addition, on average the mill processed 98 tons per calendar day of smelter slag. Crushed ore is fed into the concentrator, mixed with water and ground to slurry in the concentrator’s mill circuits to liberate the PGM-bearing sulfide minerals from the rock matrix. Various reagents are added to the slurry, which then is agitated in a froth flotation circuit to separate the valuable sulfides from the waste rock. In this circuit, the sulfide minerals are successively floated, recycled, reground and refloated to produce a concentrate suitable for further processing. The flotation concentrate, which represents approximately 1.5% of the original ore weight, is filtered, placed in large bins and then transported by truck 46 miles to the Company’s metallurgical complex in Columbus, Montana. In 2012, approximately 55% of the tailings material from the mill was returned to the mine and used as fill material to provide support for additional mining activities. The balance was placed in permitted tailings containment areas on the surface. No additional steps are necessary to treat any tailings placed back into the mine or into the impoundments, as they are environmentally inert. Tailings are disposed of into the impoundment areas pursuant to the Company’s operating permits. Mill recovery of PGMs from the ore is historically about 92%.
In 1998, the Company received an amendment to its existing operating permit providing for the construction of a lined surface tailings impoundment that would serve the Stillwater Mine for approximately the next 30 years. This facility, located about eight miles from the mine and generally referred to as the Hertzler impoundment, was placed into operation in late 2000. See “Risk Factors – Regulatory and Environmental Matters – Permitting and Reclamation.”
During 2012, the Stillwater Mine produced 377,400 ounces of palladium and platinum, a decrease of 2.5% from the 386,900 ounces produced in 2011. Daily ore and reef waste tons produced declined to 1,937 in 2012 from 2,175 in 2011. The Stillwater Mine’s total cash costs (a non-GAAP measure) averaged $456 per ounce in 2012 compared to $401 per ounce in 2011. These total cash costs are net of recycling and by-product sales credits – without the benefit of these credits, the Stillwater Mine’s total cash costs would have averaged $530 per ounce in 2012 and $498 per ounce in 2011. The 13.7% increase in average total cash costs (net of credits) was attributable to increased labor and materials costs, including hiring for the new-miner training program, to the ever-expanding distances from the portal to the mining faces, and to some level of catching up for maintenance and infrastructure under spending to conserve cash during 2009 and 2010. See Part II, Item 6, “Selected Financial Data” for further discussion of non-GAAP measures.
EAST BOULDER MINE
The East Boulder Mine is located in Sweet Grass County, Montana, approximately 32 miles south of the town of Big Timber and is accessed by a public road. The East Boulder Mine is fully permitted independently of the Stillwater Mine and comprises a second distinct mining operation accessing the western portion of the J-M Reef. The mine consists of underground mine development and surface support facilities, including a concentrator, shop and warehouse, changing facilities, storage facilities, office and tailings management facility. All mine facilities are wholly-owned and operated by the Company. Surface facilities for the East Boulder Mine are situated on unpatented mill site claims maintained on federal lands located within the
Gallatin National Forest and administered by the USFS and the Montana DEQ. All surface facilities, including the tailings management complex, are located within a 980-acre operating permit area. Proven and probable ore reserves for the mine are controlled by patented mining claims owned by the Company. Development of the East Boulder Mine began in 1998, and the mine commenced commercial production effective January 1, 2002.
From the surface facilities at the East Boulder, the J-M Reef is accessed by two 18,500-foot long, 15-foot diameter horizontal TBM adits driven into the mountain. These adits are equipped with rail haulage and intersect the ore body deep within the mountain at an elevation 6,450 feet above sea level. Within the mine, the ore body currently is accessed from seven levels of horizontal footwall lateral drifts driven parallel to the J-M Reef totaling approximately 37,500 feet in length, and from four primary ramps totaling approximately 16,815 feet of development. The ore body is accessed vertically by ramp systems tying together the footwall laterals and driven approximately every 2,500 feet along the length of the deposit. The mined ore is transported horizontally out of the East Boulder Mine by rail haulage to the mine portal, where it is processed through the East Boulder concentrator facility. The East Boulder concentrator has a permitted throughput capacity of 2,000 tons per day. Concentrates produced in the mill are transported approximately 75 miles to the Company’s metallurgical complex in Columbus, Montana.
In 2012 and 2011, approximately 46% of the East Boulder mine tailings material was returned to the mine and used for backfill in mined out voids to provide a foundation upon which additional mining activities can occur. The balance was placed in surface tailings containment areas. No additional steps are necessary to treat any tailings placed back into the mine or into the impoundments, as they are environmentally inert, and tailings placed into the impoundment areas are disposed of pursuant to the Company’s operating permits. The current impoundment area has an estimated staged life of approximately 20 years at the original planned production and processing rate of 2,000 tons per day. During 2012, ore and reef waste production at the East Boulder Mine averaged 1,234 tons per day, compared to 1,140 tons per day during 2011. Mill recovery of the PGMs contained in the ore was about 90%, 89% and 89% in 2012, 2011 and 2010, respectively.
The East Boulder Mine produced 136,300 ounces of PGMs in 2012, an increase of 4.0% compared to the 131,000 ounces of PGMs produced in 2011. The East Boulder Mine’s total cash costs (a non-GAAP measure) were $562 per ounce in 2012 compared to $475 per ounce in 2011. These total cash costs include the benefit in each period of recycling and by-product credits – if these credits are excluded, the resulting cash costs would have been $663 per ounce in 2012 and $609 per ounce in 2011. The higher average cash costs per ounce in 2012 were driven mostly by higher labor and materials costs. See Part II, Item 6, “Selected Financial Data” for further discussion of non-GAAP measures.
METALLURGICAL COMPLEX
SMELTER
The Company owns a smelter facility and associated real estate located in Columbus, Montana. The smelter facility consists of two electric furnaces, two top blown rotary converters (TBRCs), a matte granulator, and gas handling and solution regeneration systems.
During 2009, the Company completed construction of the second smelter furnace at the Columbus facility. This new primary furnace is intended to accommodate forecasted levels of future processing, mitigate any potential operational risk (virtually all of the Company’s metal production is dependent on the availability of the smelter facility), and allow the Company to continue processing during periodic scheduled maintenance shutdowns. After stripping out the old refractory material from the original furnace during 2010, the furnace structure was re-bricked during 2011 and reconfigured during 2012 as a “slag cleaning” furnace. In this configuration, slag tapped from the primary furnace is laundered into the original furnace, providing additional residence time for the matte to separate from the slag material, with the intent of increasing metal recoveries. Reconfigured as such, the slag cleaning furnace also serves as a backup production furnace if needed.
Concentrates from the mine sites are transported to the smelter, dried, and fed into the electric furnace. In the furnace, the concentrates are commingled with spent catalyst materials collected by the Company’s recycling business segment. The combined feed is melted in the furnace, where the lighter silica-rich slag separates out into a distinct layer that floats on the heavier nickel-copper PGM-rich matte. The matte is tapped from the furnace periodically and granulated. This granulated furnace matte is then re-melted and processed in a TBRC, which extracts iron from the converter matte. The converter matte is poured from the TBRC, granulated and transferred to the base metal refinery for further processing. The granulated converter matte, approximately 6% of the original smelter feed by weight, consists principally of copper and nickel sulfides containing about 1.5% to 2.0% PGMs. The residual slag from the slag cleaning furnace is tapped from the furnace, cooled and returned to the mine for reprocessing.
The gases released from the smelting operations are routed through a gas/liquid scrubbing system, which removes approximately 99.8% of the contained sulfur dioxide (SO2). Spent scrubbing solution is treated in a process that converts the sulfur dioxide into gypsum, or calcium sulfate, and regenerates clean scrubbing solution. The gypsum is sold for use as a soil amendment for farmers and as a water treatment additive in the coal bed methane industry.
BASE METAL REFINERY
The Company’s base metal refinery is located on property the Company owns adjacent to the smelter in Columbus, Montana.
The base metal refinery utilizes the patented Sherritt Process, whereby a sulfuric acid solution dissolves the nickel, copper, cobalt and any residual iron in the converter matte. These metals are separated chemically from the PGM-bearing converter matte and the copper and nickel ultimately are marketed as by-products. A nickel crystallizer circuit produces a crystalline nickel sulfate by-product containing minor amounts of cobalt, which is marketed under sales contracts with various companies. A copper electrowinning circuit removes copper from solution as cathode copper that is marketed to copper refiners for upgrading to commercial grade material. The removal of these metals upgrades the PGM fraction of the converter matte product substantially from about 2% PGMs to approximately 40% PGMs.
The base metal refinery produces a palladium, platinum and rhodium-rich filter cake, which also contains minor amounts of gold and silver. This filter cake is shipped to third-party precious metal refineries in New Jersey and California under tolling agreements that provide the Company with returns of finished metal. The palladium and platinum metals are returned to the Company’s account as 99.95% purity sponge; refined rhodium, gold and silver are also returned to the Company’s account. The refined metals are then available for delivery to the Company’s customers. The Company pays its refiners a per-ounce refining charge for the toll processing of the refined filter cake, and they also retain a small percentage of the contained metals.
PGM RECYCLING
The Company regularly sources spent catalytic converter materials containing PGM metals from third-party suppliers and processes them through its metallurgical complex. Such materials may either be purchased outright or may be processed and returned to the supplier for a tolling fee. The spent catalytic material is collected by the third party suppliers, primarily from automobile repair shops and automobile yards that disassemble old cars for the recycling of their parts. The Company also processes spent PGM catalysts from petroleum refineries and other sources, normally on a tolling basis.
Upon receipt of the PGM materials for recycling, they are weighed, crushed and sampled prior to being commingled with mine concentrates for smelting in the electric furnace. Nickel and copper sulfides which occur naturally in the mine concentrates act as a metallurgical collector to facilitate the chemical extraction of the PGMs from the recycled material.
In acquiring recycled automotive catalysts, the Company sometimes advances funds to its suppliers in order to facilitate procurement efforts. Total outstanding procurement advances to recycling suppliers totaled $10.2 million, $2.6 million and $6.1 million at December 31, 2012, 2011 and 2010, respectively. The Company only advances against a portion of the value of material from its suppliers that either is awaiting transit or is physically in transit to the Company’s processing facilities.
Recycled ounces sold in 2012 increased to 336,500 ounces compared to 306,200 ounces in 2011. In addition to purchased material, the Company processed 98,800 ounces of PGMs on a tolling basis in 2012, down from 171,600 tolled ounces in 2011. In total, recycled volumes fed to the smelter in 2012 were 445,200 ounces of PGMs, a decrease of 8.5% from 486,700 ounces in 2011. The decreased volumes in 2012 resulted from less material coming available in the market in response to lower PGM market prices. It has been the Company’s experience that in general the volume of spent catalyst available in the market is sensitive to PGM market prices, as suppliers tend to withhold material from the market when prices fall and then release it for sale when prices rise.
The Company records revenue and costs of metals sold for the processing of these recycled materials. Revenues from recycling decreased to $344.8 million in 2012, from $376.8 million in 2011 and increased over the $168.6 million in 2010. Costs of metals sold were $334.9 million, $358.6 million and $157.3 million for 2012, 2011 and 2010, respectively – most of these costs are associated with purchasing the recycled material for processing. Earnings before tax from the processing of recycled catalysts in 2012, 2011 and 2010, including financing charges to customers, were $10.5 million, $18.8 million and $11.5 million, respectively. Because of the significant quantities of recycling material typically processed through its smelter and base metal refinery and the substantial time required for processing, the Company usually carries large inventories of recycling material in process.
Working capital associated with these recycling activities, which includes inventories and advances, was $87.8 million, $64.5 million and $41.5 million at December 31, 2012, 2011 and 2010, respectively.
EMPLOYEES
The following table indicates the number of Company employees (excluding contractors) in the respective areas:
|
| | | | | | | | | |
| | | Number of Employees |
| SITE | | at December 31, |
| | | 2012 | | 2011 | | 2010 |
| Stillwater Mine | | 989 |
| | 954 |
| | 850 |
|
| East Boulder Mine | | 373 |
| | 318 |
| | 280 |
|
| Smelter and Refinery Complex | | 190 |
| | 179 |
| | 169 |
|
| Administrative Support | | 80 |
| | 71 |
| | 55 |
|
| Canadian Operations | | 14 |
| | 16 |
| | — |
|
| South American Operations | | 18 |
| | 29 |
| | — |
|
| Total | | 1,664 |
| | 1,567 |
| | 1,354 |
|
All of the Company’s hourly employees at the Stillwater Mine, the East Boulder Mine, the smelter and the base metal refinery are represented by the United Steel Workers of America (USW). The Company is party to a four-year labor agreement expiring on June 1, 2015, that covers substantially all hourly workers at the Stillwater Mine, the smelter and the base metal refinery and provided for an annual wage increase of 5% per annum in 2012 and 4% per annum in 2013 and 2014. Separately, the Company is party to a four-year labor agreement covering all hourly workers at the East Boulder Mine that was ratified by the represented workforce there in late December 2011, and is scheduled to expire on December 31, 2015. Provisions of the East Boulder agreement are similar to those agreed at the Stillwater Mine and processing facilities. See “Risk Factors – Limited Availability of Additional Mining Personnel and Uncertainty of Labor Relations May Affect the Company’s Ability to Achieve Its Production Targets."
MARATHON DEVELOPMENT PROJECT
LOCATION
The Marathon PGM-copper project (the “project”) is located 10 kilometers (km) north of the town of Marathon, Ontario. The project site is in an area characterized by typical boreal vegetation, moderate to steep hilly terrain and numerous streams, ponds and shallow lakes. The project area is bounded by the Pic River to the east and Lake Superior to the southwest. The climate of this area is typical of northern areas within the Canadian Shield, with long winters and short, warm summers.
The project area is conveniently situated in close proximity to population centers, the Trans-Canada Highway, an electrical transmission corridor, rail lines, Great Lakes port facilities and a regional airport.
PROJECT DESCRIPTION
The Marathon project is an advanced stage development project. During 2012, the Company submitted its Environment Assessment Report to the joint Federal and Provincial Panel charged with coordinating review of the project. The Environmental Assessment Report is currently progressing through a sufficiency review, comment and response process. Additionally, detailed engineering work is under way related to the design, construction and commercial operation of a conventional open pit mine and processing facility. The current plan is for the operations to be owner-operated, employing their own equipment and workforce.
In March 2012, the Company entered into an agreement with Mitsubishi Corporation through which the Japanese global integrated business enterprise acquired a 25% interest in the project for approximately US$81.25 million. Including Mitsubishi's share of the venture's first cash call of $13.6 million, total cash proceeds contributed into Marathon by Mitsubishi were $94.9 million. Going forward, Mitsubishi will be responsible for funding its 25% share of operating, capital and exploration expenditures on the Marathon properties and has agreed to cooperate and support efforts to secure project financing for Marathon. Under a related supply agreement, Mitsubishi also will have an option annually to purchase up to 100% of the project's PGM production at a small discount to the then-prevailing market price.
The present mine plan envisions development of a substantial main pit and the sequential mining of several smaller satellite pits. Ore reserves were determined in an independent study performed by a third party and documented in a January 8, 2010, report: “Technical Report on the Updated Feasibility Study for the Marathon PGM-copper project, Marathon, Ontario, Canada”. Proven and probable reserves identified in that report totaled 91 million ore tonnes grading 0.246% copper, 0.832 g/t palladium and 0.237 g/t platinum. This Feasibility Study anticipated mining and processing at a rate of 22,000 tonnes per day, implying a mining life of approximately 11.5 years.
During 2012, the Company commissioned a third-party detailed engineering study of the Marathon project, with the intent of verifying work done previously and completing detailed project design and economics. In reviewing the earlier resource determination, an error was identified in the previous modeling that resulted in palladium grades being overstated on a significant portion of the project area. The detailed project design and economics, and updated technical review are continuing with completion anticipated during the second half of 2013. Management believes the effect is likely to be some deterioration in both the project economics and in the estimate of proven and probable ore reserves. However, the updated report will take into account not only the lower palladium grades, but also additional drill data obtained since the earlier study was prepared, as well as more current metals prices. At that time, with firmer project economics in hand, the Company anticipates updating the proven and probable ore reserve estimates at Marathon.
The Company plans about $21.9 million of capital outlay at Marathon in 2013 in support of environmental assessment activities, detailed engineering and sustaining efforts related to the Marathon development project. Preliminary estimates have indicated a total capital spend to first production in the range of $550 million to $650 million.
If commercial development of the Marathon project proceeds, it will ultimately require substantial capital investment for the construction of the mine and corollary infrastructure. The total development cost cannot be estimated today with precision but will follow from the detailed engineering study. While cash on hand and internally generated cash flows would play an important part in the development of Marathon, the Company expects that project financing from the market or third parties would also be required to complete the project construction. The availability of financing will depend on future market conditions and opportunities. The Company does not currently expect to commit substantial capital at Marathon until such time as the delineation and engineering studies provide analysis that clearly supports the economics of proceeding with development. Any decision to proceed with the project also will be contingent on securing all required permits, resolving affected First Nations and other Aboriginal concerns, and having necessary financing commitments in hand.
As currently envisioned, the PGM-copper ores at Marathon will be processed (crushed, ground and concentrated) at on-site processing facilities to produce a marketable concentrate product containing copper, palladium, platinum, silver and gold. The concentrate will be transported off-site to a commercial smelter and refinery for subsequent metal extraction and separation. The residual material or “process solids” resulting from the milling process will be deposited in the Process Solids Management Facility (PSMF). Multiple sites within the project area have been evaluated as potential locations for the PSMF, and the preferred site is undergoing final consideration and environmental assessment. The non-ore bearing mine rock produced will be permanently stored in either the Mine Rock Storage Area (MRSA) located east of the main pit or used in construction of the PSMF.
Incremental reclamation activities are planned throughout the operation’s life. At final closure, and upon the completion of an end-of-life closure plan, the Company will have secured and remediated the project site to a condition facilitating sustainable and/or traditional use by First Nations communities.
Stillwater Canada Inc is continuing with baseline environmental and socio-economic studies and is engaged with federal and provincial regulatory entities and First Nations communities to secure the required permits and approvals for mine construction and operation. In December 2008, the project was accepted under the Major Projects Management Office (MPMO) initiative. A formal project description was submitted to the Canadian Environmental Assessment Agency (CEAA) in March 2010, which triggered the Federal Environmental Assessment (FEA) process. On October 7, 2010, the project was referred to an independent review panel. According to the latest project timeline, all federal and provincial approvals are anticipated in 2014, which, following 18 to 24 months of mine construction, would allow commencement of commercial production in 2017. However, due to uncertainties as to the actual timing of each phase of the approval process and depending on financing, there can be no assurance as to a specific date for commercial production.
Once development proceeds, the project is expected to create an estimated 300 construction jobs, followed by approximately 130 to 250 full-time life of mine positions and roughly three spin-off jobs (suppliers, contractors) in the region for each full-time position.
EXPLORATION AND DEVELOPMENT
Montana, USA
The J-M Reef has been explored from the surface along its entire 28-mile strike length by surface sampling and drilling which consists of an array of over 900 drill holes. Exploration activities historically also included driving and then drilling from two exploratory underground adits not currently in active use, the West Fork adit and the Frog Pond adit. Comprehensive evaluation of PGM mineralization encountered in the J-M Reef has allowed delineation of indicated resources adjacent to the Stillwater and East Boulder Mines and confirmation of the existence of mineralized material over much of the remaining strike length. Exploration to date has defined sufficient probable ore reserves, based upon historical conversion rates, to sustain mining for a number of years into the future. It is the Company’s practice to systematically convert its established probable ore reserves to the proven ore category as mine development progresses by performing definition drilling and evaluation coincident with planned advances of underground development.
A key element of the Company’s development activities in the Stillwater Complex consists of ongoing efforts to convert its established probable ore reserves into proven ore reserves by extending the lateral and vertical development of the Stillwater and East Boulder Mines. These ongoing activities involve constructing and extending mine development workings to access established ore reserves and continuously advancing definition drilling, engineering and mine plans to replace depleted ore reserves. Costs incurred in connection with capitalized mine development at the Company's existing operations (excluding Blitz and Graham Creek development projects) were $53.5 million for 2012 and $53.5 million for 2011, compared to $32.2 million in 2010. These capitalized mine development costs are included in total capital outlay. Development spending at the Montana operations in 2013 is planned to be about $71.4 million.
The following table outlines measures that are used by the Company to gauge progress on resource development activities:
|
| | | | | | | | | |
| Location and Development Activity | | 2012 | | 2011 | | 2010 |
| Stillwater Mine | | | | | | |
New Primary Development (equivalent feet)(1) | | 26,427 |
| | 28,131 |
| | 19,666 |
|
New Footwall Lateral (equivalent feet)(1) | | 9,595 |
| | 10,409 |
| | 9,983 |
|
| New Definition drilling (feet) | | 307,717 |
| | 321,434 |
| | 291,173 |
|
| East Boulder Mine | | | | | | |
New Primary Development (equivalent feet)(1) | | 13,869 |
| | 11,347 |
| | 3,539 |
|
New Footwall Lateral (equivalent feet)(1) | | 8,306 |
| | 6,593 |
| | 2,362 |
|
| New Definition drilling (feet) | | 152,093 |
| | 86,695 |
| | 81,474 |
|
| |
| (1) | Based on one linear foot of excavation, 11 feet wide by 12 feet high (cross-section of 132 ft.2). |
In addition to the development spending planned at the existing mines, about $21.2 million of total capital outlay is planned in 2013 for the Blitz project adjacent to the Stillwater Mine and the Graham Creek project to the west of the East Boulder Mine.
The Blitz project includes three principal elements: a tunnel boring machine, or TBM, drive that ultimately will extend about 23,400 feet to the east from the existing Stillwater Mine infrastructure; a second underground drift parallel to the TBM drive and about 600 feet above it; and a proposed new surface portal and decline to be located about four miles to the east of the existing Stillwater Mine facilities. The new surface portal will be conventionally driven and is intended to intercept the two primary Blitz tunnels, providing ventilation and emergency egress for the Blitz area. The TBM acquired for the Blitz project was fully commissioned during the fourth quarter of 2012 and is currently in operation. Construction of the second conventional drift is also in progress. As these drives continue to advance, definitional and probe drilling will be performed to further enhance the understanding of the geology in this area. Total cost of the Blitz project is expected to be approximately $209.0 million, of which approximately $35.6 million has been charged to the project through the end of 2012.
The Company's Far West project was first identified in this year's mining plan and is situated underneath the Upper West workings in an area of relatively high PGM grades between the 3500 and 5000 levels at the western end of the Stillwater Mine. This project represents an acceleration of development in the Far West area pulling forward capital that would have otherwise been spent in later years. The Company anticipates the Far West project will take about three years to fully develop at an estimated incremental cost of $28.0 million. It represents an acceleration of incremental production made possible by the Company's ongoing development of the Blitz project. Because the Far West project is situated within the existing envelope of the Stillwater Mine, the development efforts there will benefit from the existing major infrastructure of the mine. At least initially, some manpower may be diverted from the Blitz development into the Far West project in order to accelerate overall
production growth at the Stillwater Mine, but if workforce attrition remains stable, the effect on the Blitz timeline should be minimal.
The Graham Creek project's 8,200 foot TBM excavation remains on track and will be finished in the first half of 2013. Once complete, it will be followed by the installation of two ventilation raises to surface over the subsequent 18 months. During this time, the Company will continue to hire and train additional skilled miners required for the East Boulder Mine and Graham Creek operations. Through the end of 2012, the TBM has advanced about 6,500 feet. While not complete, significant definitional drilling has been performed at the Graham Creek project and minable ore has been identified. Ore grades in this area appear consistent with current grades in the existing portion of the East Boulder Mine. The cost of the Graham Creek project is estimated at $13.0 million, of which approximately $3.5 million has been charged to the project through the end of 2012.
Ontario, Canada
The Marathon PGM-copper project is located 10 km north of the town of Marathon, Ontario, on the eastern margin of the Coldwell Complex, a Proterozoic layered intrusion. The palladium, platinum and copper mineralization occurs principally in the Two Duck Lake gabbro. The known zones of significant mineralization have a total north-south strike length of about 3 km and dip 30° to 40° toward the west. The mineralization has a true thickness ranging from 4 meters (m) to 100 m.
The town of Marathon is situated adjacent to the Trans-Canada Highway on the northeast shore of Lake Superior, approximately 300 km east of the city of Thunder Bay. The Marathon project benefits from excellent location and access to well-developed transportation infrastructure. The project site is in an area characterized by dense vegetation, moderate to steep hilly terrain with a series of streams, ponds and small lakes. The project area is bounded by the Pic River to the east and by Lake Superior to the southwest. The climate of this area is typical of northern areas within the Canadian Shield, with long winters and short, warm summers.
Over the past five decades, the Marathon project area has been a focal point for several exploration campaigns conducted by both major and junior mineral exploration and development organizations. Numerous technical, scientific and economic studies have been conducted on the Coldwell Complex by individuals affiliated with provincial or federal government agencies as well as several academic institutions. During the 1960s, Anaconda Canada was one of the earliest organizations to systematically explore the project area’s copper mineralization. In the mid-1980s, Fleck Resources (a predecessor of Polymet Mining Corp.) acquired 100% control of the property. With various partners, they subsequently conducted extensive exploration and drilling programs that included the reexamination of Anaconda’s drill core and the recognition of palladium and its association with the area’s copper mineralization. By late 2003, Marathon PGM Corporation had acquired the entire Fleck interest in the project area. Marathon subsequently staked additional mining claims and, through additional transactions, acquired additional parcels of mining claims and mineral leases, consolidated the minerals interests that in total now comprise the Marathon project.
The Company has established an exploration team that coordinates drilling and evaluation efforts on the Marathon properties. The Company plans to spend about $3.6 million during 2013 on exploration in this area. This team of experienced geologists may also pursue other exploration opportunities in the future, with particular emphasis on Canada. The Company plans about $21.9 million of capital outlay in 2013 for detailed engineering and other activities related to the Marathon development.
ALTAR COPPER-GOLD EXPLORATION PROJECT
San Juan Province, Argentina
In October 2011, the Company completed the acquisition of Peregrine Metals Ltd., a Canadian exploration company whose principal asset is the Altar project, a large advanced stage Andean Porphyry copper-gold exploration property located in the San Juan Province of Argentina. Through this acquisition, the Company now controls 11,945 hectares of mineral interests at Altar. The property consists of eight wholly-owned mining concessions totaling 7,771 hectares, five optioned mining concessions totaling 3,705 hectares, and one staked mineral concession comprising 469 hectares. Once in production, seven of these mining concessions would be subject to production royalties, including a 1% net smelter royalty, and four other concessions subject are to a 2% net smelter royalty.
The Company has an experienced exploration team in Argentina presently focused on an ongoing program to further delineate and evaluate the technical and economic merits of the large Altar mineral deposit. The annual drilling season in the Andes Mountains typically extends from December through April. The Company's 2013 exploration drilling campaign involves two contracted core drill rigs active on the Altar property and expects to drill and analyze about 11,000 meters of additional core. The exploration objectives for the 2013 field season include the delineation of geologic boundaries to the Altar copper-gold porphyry system, further drill testing and evaluations in poorly defined portions of known Altar deposit, and
reconnaissance drilling of two distinct precious metal occurrences located adjacent to the Altar deposit and perhaps other geological targets of interest located within boundaries of the mining concessions.
LOCATION
The Altar project is located in the Andes Mountains of Argentina, about 10 km from the Argentina-Chile border, and approximately 180 km west of the city of San Juan. Elevations within the project area range between 3,100 m and 4,000 m above sea level. The Altar project is currently accessed via two routes in Argentina. The primary access route up the eastern slope of the Andes is shared with Xtrata’s El Pachón project and extends southwestward from the town of Barreal before trending northwards toward El Pachón and continuing for 25 km to the Altar Camp. The access route is a good quality gravel road approximately 170 km in length. Secondary access is provided by 170 km of gravel road leading westward from the community of Calingasta along the Rio Calingasta valley. The route crosses the Cordillera de La Totora at the headwaters of the Rio Calingasta, turns southward along the upper tributaries of the Rio Blanco and then westward along the Rio Pantanosa to the Property. Both routes involve crossing several rivers and high-mountain passes.
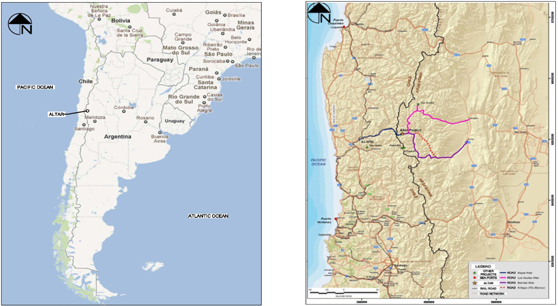
PROJECT DESCRIPTION
The Altar copper-gold project is an advanced stage exploration project. The project is primarily a copper-gold porphyry deposit with potential for discrete peripheral gold system targets. The Altar deposit currently exhibits open mineralization in most directions; hence, it will require continued drilling not only in the primary Altar copper-gold porphyry, but also in the potential peripheral gold systems to fully define total project scale and scope.
The current 2012-2013 diamond drill program has been designed to further define the size and limits of primary copper-gold mineralization with a possible update of the resource model. Additionally, further understanding of peripheral gold targets is a goal of the current drilling program. The Company has engaged two drill rigs for the 2012-2013 drilling season and expects to incur about $8.8 million in exploration spending during 2013 on Altar exploration.
If the resource ultimately justifies it, the Altar project will ultimately require substantial capital for the development of a mine and supporting infrastructure. The boundaries of the resource have not yet been defined, so the ultimate cost of any development at Altar cannot be accurately estimated yet. The Company's efforts at Altar at this time are focused on better defining the extent and quality of the resource in order to properly evaluate it. That in turn will allow the Company to develop an appropriate strategy for extracting value from the property.
GEOLOGY OF THE ALTAR DEPOSIT
The Altar porphyry copper-gold deposit is associated with Middle-Late Miocene intermediate composition subvolcanic porphyries that intrude Early Miocene rhyolitic ignimbrites and fine-grained andesite flows of the Pachón Formation. Elevated gold, silver and molybdenum values are associated with the copper mineralization.
A leached cap zone has been intersected by drilling at depths ranging from 0 m to 258 m. Beneath the leached cap are zones of supergene copper enrichment and primarily sulfide mineralization that have been variably affected by weathering, mainly in the form of oxidation developed along narrow joints and fractures.
Prior to the current 2012 exploration program, drilling at the property included 153 diamond drill holes totaling 59,602 m. Six prior seasonal diamond drilling programs had been completed at Altar; the first, by Rio Tinto, in 2003, and subsequent
programs by Peregrine during the summer field seasons between 2005 and 2011.
Altar Drill Program Summary
Through April 2012
|
| | | | | | | | | |
| Year | | Company | | Holes Drilled | | Total meter(s) | | Comments |
| 2003 | | Rio Tinto | | 7 | | 2,841 |
| | |
| 2006 | | Peregrine | | 8 | | 3,302 |
| | |
| 2007 | | Peregrine | | 25 | | 10,408 |
| | |
| 2008 | | Peregrine | | 24 | | 12,741 |
| | +1 hole extended |
| 2010 | | Peregrine | | 76 | | 26,349 |
| | + 2 holes extended |
| 2011 | | Peregrine | | 13 | | 3,961 |
| | |
| 2012 | | Peregrine (SWC) | | 64 | | 27,280 |
| | + 6 holes extended |
| Total | | | | 217 | | 86,882 |
| | |
DRILL-INDICATED COPPER-GOLD MINERALIZATION
A Canadian NI 43-101 resource disclosure was released by Peregrine Metals Ltd. effective October 4, 2010, and amended as of March 21, 2011. It reported that drilling on the Altar properties has indicated the presence of a porphyry copper deposit with associated by-product grades of gold and molybdenum. At this stage the property has no proven or probable ore reserves, as defining ore reserves requires completing a definitive feasibility study that delineates project economics.
OTHER PROPERTIES
The Company owns a warehouse facility in Columbus, Montana and leases office space in Columbus and Billings, Montana. The Company owns parcels of rural land in Stillwater and Sweet Grass Counties, Montana, near its mines and metallurgical complex totaling approximately 4,549 acres and additional commercial properties in the communities of Columbus and Big Timber, Montana. Subsidiaries of the Company own residential and commercial properties in Marathon, Ontario which are used as support facilities for operations and exploration projects. The Company’s subsidiaries lease office and warehouse space at various locations in Canada, Argentina and Chile. The Company’s corporate office is located in the office space leased in Billings, Montana. The annual expense for office leases in Montana totals approximately $0.3 million per year.
LONG-TERM FINANCING
1.875% CONVERTIBLE DEBENTURES
In March 2008, the Company issued and sold $181.5 million aggregate principal amount of senior convertible debentures due in 2028 (debentures). The debentures pay interest at 1.875% per annum, payable semi-annually on March 15 and September 15 of each year. The debentures will mature on March 15, 2028, subject to earlier repurchase or conversion. Each $1,000 principal amount of debentures is initially convertible, at the option of the holders, into approximately 42.5351 shares of the Company’s common stock at any time prior to the maturity date. The conversion rate is subject to certain adjustments but will not be adjusted for accrued interest or any unpaid interest. The conversion rate initially represents a conversion price of $23.51 per share. Holders of the debentures may require the Company to repurchase all or a portion of their debentures on March 15, 2013, March 15, 2018 and March 15, 2023, at maturity or upon the occurrence of certain events, including a change in control. The Company may redeem the debentures for cash at any time on or after March 22, 2013. The outstanding balance of $166.5 million is reported as a short-term debt obligation as of December 31, 2012.
The debentures were sold to an “accredited investor” within the meaning of Rule 501 under the Securities Act of 1933, as amended (the “Securities Act”), in reliance upon the private placement exemption afforded by Section 4(2) of the Securities Act. The initial investor offered and resold the debentures to “qualified institutional buyers” under Rule 144A of the Securities Act. An affiliate of MMC Norilsk Nickel, with the approval of the Company’s public directors, purchased and as of December 31, 2012, currently holds $80.0 million of the debentures.
In connection with the issuance of the debentures, the Company incurred $5.1 million of issuance costs, which primarily consisted of investment banking fees, legal and other professional fees. These costs are classified within Other noncurrent assets on the Company's Consolidated Balance Sheets and are being amortized as interest expense over the term from issuance through the first date that the holders can require repurchase of the debentures, which is March 15, 2013. Amortization expense related to the issuance costs of the debentures was $0.9 million for each of the years ended December 31, 2012, 2011 and 2010, and the interest expense on the debentures was $3.1 million in each of the years 2012, 2011 and 2010. The Company made cash payments of $3.1 million for interest on the debentures during the years of 2012, 2011 and 2010.
1.75% CONVERTIBLE DEBENTURES
On October 17, 2012, the Company completed an additional issuance of $396.75 million of 1.75% senior unsecured convertible debentures, due October 15, 2032. Each $1,000 principal amount of these new debentures is initially convertible, under certain circumstances and during certain periods, into 60.4961 shares (subject to customary anti-dilution adjustments) of the Company's common stock, which represents an initial conversion price of $16.53 per share. The debentures also include an embedded conversion enhancement feature that is equivalent to including with each debenture a warrant initially exercisable for 30.2481 shares initially at $16.53 per share (also subject to customary anti-dilution adjustments). The effect of enhancement was to increase the effective conversion price. The Company, at its election, may settle conversions of the debentures in cash, shares of its common stock or any combination of cash and shares of its common stock. Debenture holders have the right to redeem their debentures (at face value plus accrued and unpaid interest up to, but excluding, the relevant repurchase date) on October 15 of each of 2019, 2024, 2029, and upon the occurrence of certain corporate events. The Company will have the right to call the debentures at any time on or after October 20, 2019. The debentures were bifurcated under U.S. GAAP into separate debt and equity components, and reflect an effective maturity (to the first optional redemption date) of seven years. The residual amount recorded within equity is treated for accounting purposes as additional debt discount and accreted as an additional non-cash interest charge to earnings over the expected life. Debt and equity issuance costs totaling about $12.4 million were deducted from the gross proceeds and the debt portion is being amortized ratably over 84 months. Net proceeds of the offering will be used to retire the Company's $166.5 million of outstanding 1.875% convertible debentures upon their expected redemption in March of 2013, and for general corporate purposes.
EXEMPT FACILITY REVENUE BONDS
During 2000, the Company completed a $30.0 million offering of Exempt Facility Revenue Bonds, Series 2000, through the State of Montana Board of Investments. The bonds were issued by the State of Montana Board of Investments to finance a portion of the costs of constructing and equipping certain sewage and solid waste disposal facilities at both the Stillwater Mine and the East Boulder Mine. The bonds mature on July 1, 2020, and have a stated interest rate of 8.00% with interest paid semi-annually. The bonds have an effective interest rate of 8.57%. Net proceeds from the offering were $28.7 million. The balance outstanding for the year ended December 31, 2012 was $29.6 million, which is net of unamortized discount of $0.4 million. The outstanding balance at December 31, 2011 and 2010 was $29.5 million net of unamortized discount of $0.5 million. The Company made annual cash payments of $2.4 million for interest on the revenue bonds during 2012, 2011 and 2010.
ASSET-BACKED REVOLVING CREDIT FACILITY
In December 2011, the Company signed a $100.0 million asset-backed revolving credit agreement with Wells Fargo Capital Finance, incurring debt issuance costs of $1.1 million. Maximum permitted borrowings under this working capital facility are limited to a borrowing base comprised of 85% of eligible accounts receivable and 70% of eligible inventories. Terms of the agreement state that the borrowings will be secured by the Company’s accounts receivable, metals inventories and other accounts. The credit agreement includes a financial covenant requiring, whenever the remaining availability under the line is less than 30% of the total borrowing capacity, that the Company’s fixed charge coverage ratio be at least 1.0 to 1.0. It also includes other customary restrictions that become tighter as drawings under the facility increase. The facility includes a $50.0 million letter of credit sub-facility. Outstanding borrowings under the facility accrue interest at a spread over the London Interbank Offer Rate that varies from 2.25% to 2.75%, decreasing progressively as the percentage drawn against the facility increases. The Company also pays an unused line fee on committed but unutilized commitments under the facility at a rate per annum of 0.375% or 0.5%, depending on utilization of the facility. In January 2012, the Company completed the syndication of this facility to a group of four banks and simultaneously expanded the maximum line of credit to $125.0 million incurring additional debt issuance costs of $0.2 million. The Company recognized approximately $1.0 million in fees associated with the asset-backed revolving credit facility for the year ended December 31, 2012. Amortization expense related to the issuance costs of the credit agreement for the year ended December 31, 2012 was approximately, $0.3 million. At December 31, 2012, the Company’s available borrowing base was approximately $72.2 million. As of December 31, 2012, there was no drawn balance under this revolving credit facility, although approximately $17.5 million in undrawn letters of credit have been issued under this facility as collateral for sureties.
CAPITAL LEASE OBLIGATIONS
In June 2012, the Company entered into a lease agreement with General Electric Capital Corporation (GECC) covering the acquisition of a tunnel-boring machine for use on the Blitz project adjacent to the Stillwater Mine. The transaction is structured as a capital lease with a four-year term; lease payments are due quarterly in advance. In the third quarter of 2012, the Company increased the lease balance due under the original GECC capital lease by $0.7 million. The Company made cash payments of $1.6 million on its capital lease obligations for the year ended December 31, 2012. These cash payments included interest of $0.2 million. As of December 31, 2012, the outstanding balance under the capital lease was $6.5 million.
PGM SALES AND HEDGING
MINE PRODUCTION
Palladium, platinum, rhodium, gold and silver are sold to a number of consumers and dealers with whom the Company has established trading relationships. Refined platinum group metals of 99.95% purity (rhodium of 99.9%) in sponge-form are transferred upon sale from the Company’s account at third-party refineries to the account of the purchaser. After final refining, by-product gold, silver and rhodium are normally sold at market prices to customers, brokers or outside refiners. Copper and nickel by-products from the Company’s base metal refinery are produced at less than commercial grade, so prices for these metals typically reflect a quality discount. By-product sales are included in revenues from mine production. During 2012, 2011 and 2010, total revenues from by-product (copper, nickel, gold, silver and mined rhodium) sales were $30.6 million, $36.0 million and $28.0 million, respectively.
The Company has a supply agreement with GM that took effect in January 2011 and expires on December 31, 2013. The agreement provides for fixed quantities of palladium to be delivered each month. The Company has a one-year platinum supply agreement with Tiffany & Co., which expires at the end of 2013. The Company also has one-year supply agreements with Johnson Matthey and BASF and a month-to-month agreement with Ford Motor Company. Some of these agreements provide for pricing at a small discount to a trailing average market price. Based on the targeted 2013 mine production of about 500,000 ounces, essentially all of the Company's mined palladium production and 74% of its platinum production is committed under its supply agreements for 2013. The Company expects to sell its remaining 2013 platinum production under spot sales agreements.
Currently, none of the Company’s mine production is committed under forward sales or other hedging arrangements. The Company historically entered into derivative contracts and hedging arrangements from time to time to manage the effect on the Company’s cash flow of fluctuations in the price of palladium and platinum from mine production. Hedging activities consisted of fixed forwards for future delivery of specific quantities of PGMs at specific prices, and financially settled forwards that provided for net cash settlement of forward sales. See Note 6 “Derivative Instruments” to the Company’s 2012 audited consolidated financial statements for further information.
PGM RECYCLING
The Company has capacity available in its smelter and base metal refinery and purchases catalyst materials from third parties for recycling in those facilities to recover PGMs. The Company has entered into sourcing arrangements for catalyst material with several suppliers. Under these sourcing arrangements, the Company advances cash to suppliers as spent catalyst materials are ready for shipment or in-transit to the Company’s facilities. These advances are reflected as advances on inventory purchases and included in Other current assets on the Company’s Consolidated Balance Sheets until such time as the material has been physically received and title has transferred to the Company. See “Risk Factors – Reliance on a Few Third Parties for Sourcing of Recycling Materials and Advances for Recycling Materials Creates the Potential for Losses.”
The Company regularly enters into fixed forward sales related to recycling of catalysts. These fixed forward sales transactions in the recycling business have not been accounted for as derivatives because they qualify as “normal purchases/normal sales” under generally accepted accounting principles. Metals from processing recycled materials are generally sold forward at the time the material is purchased and then are delivered against the forward sales contracts when processing is completed and the finished ounces are recovered.
All of the Company’s recycling forward sales transactions open at December 31, 2012, will settle at various periods through June 2013. See Note 6 “Derivative Instruments” to the Company’s 2012 audited consolidated financial statements for more information. The Company has credit agreements with certain of its major trading partners that would require the Company to make margin deposits in the event that forward prices for metals exceed the Company’s hedged prices by a predetermined margin limit. No margin deposits were required or outstanding as of December 31, 2012, 2011 or 2010.
OTHER
The Company makes other open market purchases of refined PGMs from time to time for resale to third parties. There were no open market purchases for the year ended December 31, 2012. The Company recognized revenue of $1.1 million and $6.2 million on ounces purchased in the open market and re-sold for the years ended December 31, 2011 and 2010, respectively. These purchases for resale were essentially breakeven transactions undertaken for the convenience of certain customers.
TITLE AND ROYALTIES
Montana, USA
The Company holds 1,525 patented and unpatented lode, tunnel site or mill site claims in Montana covering approximately 23,185 acres along the apex of the J-M Reef mineral zone and on adjacent federal lands utilized for the Company’s operations facilities. The Company believes that approximately 130 of these claims cover the known apex of the J-M Reef. The Company’s remaining unpatented claims either adjoin the apex of the J-M Reef or secure sites for ongoing exploration and surface operations. Prior to the federal moratorium on processing new applications for mining claim patents, the Company had leasehold control on one patented claim under the Mouat Agreement, had been granted patents on 34 of its own claims (a combined total of 735 acres), and had 33 patent applications pending for 135 additional mining claims covering an area of 2,249 acres. The applications included claims owned directly by the Company or held by the Company in leasehold. During the fourth quarter of 2001, 31 new patents were issued to the Company for 126 mining claims covering 2,126 acres. At year-end 2001, patents had been issued for all submitted applications involving the claims owned directly by the Company. In a decision dated April 30, 2002, the Montana State Office of the Bureau of Land Management (BLM) rejected two mineral patent applications submitted prior to July 13, 1993 covering 123 acres in nine mining claims held by the Company in leasehold under the Mouat Agreement. The Company joined with the Mouat interests in appealing the BLM decision to the U.S. Department of the Interior Board of Land Appeals (IBLA). On April 25, 2005, administrative judges for the IBLA ruled in favor of the Mouat Interests’ and Company’s appeal and remanded the cases to the BLM with instruction to issue the pending patents. As of the date of this filing, the Certificates of Patent have not yet been issued; however, the Company considers the matter resolved and expects the patents to be granted in due course.
The Company presently maintains 1,355 active unpatented lode, placer, tunnel site or mill site claims. Unpatented mining claims may be located on lands open to mineral appropriation and are generally considered to be subject to greater title risk than patented claims or other real property interests because the validity of unpatented mining claims is often uncertain and such claims are more commonly subject to challenges of third parties, regulatory or statutory changes, or contests by the federal government. The validity of an unpatented mining claim or mill site claim, in terms of establishing and maintaining possessory rights, depends on strict compliance with a complex body of federal and state statutory and decision law regarding the location, qualifying discovery of valuable minerals, occupancy, and beneficial use, and payment of annual claim maintenance fees by the claimant.
Of the Company’s 1,525 controlled claims, 868 are subject to production royalties, including 840 claims subject to a 5% net smelter royalty (NSR) payable to Franco Nevada U.S. Corporation (formerly Newmont Capital Limited), 143 claims subject to a 0.35% net smelter royalty payable to the Mouat family, and 115 claims subject to both royalties. During 2012, 2011 and 2010, the Company incurred royalty expenses of $17.9 million, $24.1 million and $13.7 million, respectively.
Ontario, Canada
In November of 2010, the Company acquired Marathon PGM Corporation and its PGM-copper assets and, in February 2011, acquired certain adjacent exploration properties and royalty interests of Benton Resources Corp. situated in northwest Ontario, Canada. The Company currently holds mining claims and crown leases totaling approximately 16,152 hectares (39,912 acres) covering the more prospective portions of the Port Coldwell Intrusive Complex. The Coldwell Complex hosts the Marathon PGM-copper deposit and is located near the northern shore of Lake Superior adjacent to the town of Marathon, Ontario. The Company’s aggregate property holdings in the Coldwell Complex include 42 crown leases on 2,856 hectares (7,057 acres) and 83 mining claims comprised of 831 claim units totaling 13,296 hectares (32,855 acres). All of the 83 claims within the 42 crown leases include mining rights, but only 76 of these claims include surface rights. The seven lease claims without surface rights make up a total of 124 hectares (306 acres). It is not likely that a surface lease would be granted for some of these mining lease claims because of their proximity to water bodies. Applications have been submitted for mining and surface leases on a total of 21 mining claims totaling 2,576 hectares (6,365 acres) in order to expand the existing leased area to include the entire footprint of the Marathon project.
In Canada, paramount title to minerals typically vests in the Crown subject only to the burden of Aboriginal title, while the various Ministries of the Provinces enjoy legislative powers to administer the disposition of minerals within their
jurisdiction. In Ontario, mining claims grant the claimant conditional rights of access for exploration of hard rock minerals conducted in compliance with regulations regarding surface disturbance, environmental stewardship and annual expenditures to maintain the validity of the claims. Mining claims in Ontario do not authorize removal of minerals for other than test work and analyses. To commercially extract minerals, a mining lease is necessary. Crown mining leases provide the claimant with a preference right to develop and extract minerals for a (renewable) 21-year term, under more specific conditions of Aboriginal consultation, environmental protection, approved closure/reclamation plans and financial assurances provided to the Crown over the life of the project. The Company believes that its mining claims and crown leases provide adequate security of mineral and surface tenure to advance its planned mine development and mineral exploration activities in the Marathon-Coldwell region of Ontario.
The Company’s Ontario properties in the Coldwell Complex remain subject to certain underlying provisions and production royalty interests. Production royalty interests include: a 2% NSR royalty payable to Teck Cominco Ltd. in respect to the ‘Bamoos leases’ (217 hectares {536 acres}), a 1% NSR royalty payable to Stephen Stares in respect to the ‘Bermuda claim’ (94 hectares {232 acres}): a 2% NSR royalty payable to Franco Nevada (as successors in interest to Newmont and Redstone Resources) in respect to the Par Lake, et.al. leases (1,315 hectares {3,249 acres}); a 1% NSR royalty payable to Stephen Stares in respect to certain of the 'Bermuda Properties' (approximately 7,300 hectares {18,039 acres}); a conditional 2% NSR royalty payable to Rudy Wahl in respect to the ‘Coubran Lake’ claims (752 hectares {1,858 acres}); and a conditional 2.5% NSR royalty payable to Superior Prospects Inc. in respect to the ‘Geordie Lake claims’ (1,520 hectares {3,756 acres}). At the date of filing, approximately 4% of the Company’s stated proven and probable ore reserves at the Marathon PGM-copper deposit are subject to the 2% NSR royalty payable to Teck Cominco Ltd. The Company’s other royalty obligations affect only exploration-stage properties in the Marathon/Coldwell region.
At the Company’s Geordie Lake exploration property located approximately 8 km west of the Marathon PGM-copper deposit, Gryphon Metals, Inc. retains a back-in option to a 12.5% working interest on the ‘Geordie Lake claims’ (1,520 hectares {3,756 acres}). The option can be exercised upon completion and delivery of a feasibility study by the Company and Gryphon making a cash payment to the Company equal to 31.25% of all costs incurred on the property through completion of the feasibility study.
San Juan Province, Argentina
Through its acquisition of Peregrine Metals Ltd. in 2011, the Company is engaged in the exploration and development of precious and base metal mineral properties in South America. The Company’s principal South American focus is the advanced exploration-stage Altar project, located in the San Juan Province of Argentina. The Altar project contains a large porphyry-style copper-gold deposit and is comprised of six mining concessions referred to as the “Altar property” acquired by Peregrine Metals Ltd. (together with its subsidiaries, “Peregrine”) in 2009, five mining concessions known as the "Rio Cenicero concessions” held under option since 2008, one mining concession staked in 2008 and two mining concessions acquired in 2010, as well as ten mining access rights of way, each as described below.
In 2005, Peregrine optioned six mining concessions known as Leona, Loba, Santa Rita, Pampa, RCA II and RCA VII (collectively, the “Altar property”) totaling 4,924 hectares (12,167 acres), from Rio Tinto Mining and Exploration Ltd. (Rio Tinto). In March 2009, Peregrine acquired a 100% interest in the Altar property from Rio Tinto following completion of scheduled payments totaling $2.7 million and a minimum exploration expenditure of $350,000. Pursuant to a transfer agreement dated March 6, 2009 (the “Transfer Agreement”) entered into between Rio Tinto and Peregrine, in accordance with Argentine law, the rights and obligations with respect to the Altar property were transferred from Rio Tinto to Minera Peregrine Argentina S.A., a wholly-owned Peregrine subsidiary.
Rio Tinto retains a 1% NSR royalty on all mineral products produced from the Altar property (the “Rio Tinto Royalty”). The original underlying concession owners, Jan Carlos Robledo and Otto Wildo Simon (Robledo and Simon) also jointly hold an NSR royalty of 1% (the Robledo Royalty) on four of the six concessions comprising part of the Altar property (the Loba, Santa Rita, RCA II and RCA VII concessions), which the Company has the right to purchase at any time for $1.0 million. Until the mine achieves commercial production or the Company exercises its right to purchase the Robledo Royalty, aggregate payments of $80,000 per year must be made to Robledo and Simon. On the date of commencement of commercial production, the annual payments cease and the Robledo Royalty becomes effective. The annual payments are in addition to, and not an advance against, the Robledo Royalty.
On August 14, 2008, Peregrine signed an option agreement (the “Rio Cenicero Option Agreement”) to acquire a 100% interest in exploration and exploitation rights to five mining concessions know as RCA XV, RCA V, RCA X, RCA XII and RCB I (collectively, the “Rio Cenicero concessions”) comprising a total of 3,705 hectares (9,155 acres), from the “Instituto Provincial de Exploraciones y Explotaciones Mineras” (IPEEM) of the Province of San Juan, Argentina. Four of the five Rio Cenicero concessions adjoin the core Altar property on three sides to the east, south and west.
According to the terms of the Rio Cenicero Option Agreement there is a five-year exploration term after which the Company has the option to convert the Rio Cenicero concessions from exploration to exploitation rights. During the exploration phase the requirements to keep the option in good standing include minimal monthly option payments to IPEEM and spending a total of $1.7 million in exploration expenditures over the five years between August 2008, and August 2013. Commencing with the exercise of the exploitation option and the signing of the exploitation agreement, the requirements to keep the Rio Cenicero option in good standing include minimal monthly option payments to IPEEM up until commencement of commercial production, after which the option payments cease and a NSR royalty of 1% becomes payable on all mineral products from the Rio Cenicero concessions.
In November 2008, Peregrine acquired directly by staking a mineral concession comprising 469 hectares (1,159 acres) and identified by affidavit 1124548-M-08. This mineral concession adjoins the Rio Cenicero concessions RCA XV, RCA V, RCA X, and RCA XII to the south.
In March 2010, Peregrine acquired a 100% interest in two mineral concessions totaling 2,847 hectares (7,035 acres) from Rio Tinto for $100,000. The two mineral concessions are identified by affidavit numbers 1414458-R-2005 and 4141487-R-2005 and adjoin the Rio Cenicero concessions RCA XV, RCA V, RCA X and RCA XII to the west and east, respectively. There are no royalty or underlying royalty commitments or other obligations due to Rio Tinto or any third party with respect to these two concessions.
The Altar property, the Rio Cenicero concessions, the mineral concession staked by Peregrine in 2008 and the two mineral concessions acquired in 2010 are known collectively as the “Altar project.” In aggregate, the Altar project mineral concessions total 11,945 hectares (29,517 acres).
REGULATORY AND ENVIRONMENTAL MATTERS
United States
The Company’s business is subject to extensive federal, state and local government controls and regulations, including regulation of mining and exploration which could involve the discharge of materials and contaminants into the environment, disturbance of land, reclamation of disturbed lands, associated potential impacts to threatened or endangered species and other environmental concerns. In particular, statutes including, but not limited to, the Clean Air Act, the Clean Water Act, the Solid Waste Disposal Act, the Emergency Planning and Community Right-to-Know Act, the Endangered Species Act and the National Environmental Policy Act, impose permit requirements, effluent standards, air emission standards, waste handling and disposal restrictions and other design and operational requirements, as well as record keeping and reporting requirements, upon various aspects of mineral exploration, extraction and processing. In addition, the Company’s existing mining operations may become subject to additional environmental control and mitigation requirements if applicable federal, state and local laws and regulations governing environmental protection, land use and species protection are amended or become more stringent in the future. The Company is aware that federal regulation under the Solid Waste Disposal Act governing the manner in which secondary materials and by-products of mineral extraction and beneficiation are handled, stored and reclaimed or reused are subject to frequency review by the agencies which could affect the Company’s facility design, operations, and permitting requirements. See “Risk Factors – Changes to Regulations and Compliance with Regulations Could Affect Production, Increase Costs and Cause Delays.”
The Stillwater Mine and the East Boulder Mine are located on the northern edge of the Absaroka-Beartooth Wilderness Area, about 30 miles north of Yellowstone National Park. Due to the proximity of the Company’s operations to Yellowstone National Park and a wilderness area, the Company’s operations are subject to stringent environmental controls that may adversely impact the Company’s operations. For example, increasingly stringent requirements may be adopted under the Clean Water Act, Clean Air Act or Endangered Species Act which could require installation of environmental controls not required of competitors located elsewhere. The Company’s past and future activities may also cause it to be subject to liabilities under provisions of the Comprehensive Environmental Response, Compensation and Liability Act of 1980, as amended (CERCLA), and analogous state law. Such laws impose strict liability on certain categories of potentially responsible parties including current property owners for releases or threatened releases of hazardous or deleterious substances into the environment that result in cleanup and other remediation costs.
Generally, compliance with the above statutes requires the Company to obtain permits issued by federal, state and local regulatory agencies and to file various and numerous reports that track operational monitoring, compliance, performance and records maintenance activities measuring its operational effect on the environment. Certain permits require periodic renewal or review of their conditions. The Company cannot predict whether it will be able to renew such permits or whether material changes in permit conditions will be imposed. Non-renewal of permits or the imposition of additional conditions could have a material adverse effect on the Company’s financial condition and results of operations.
In an effort to protect the health of the Company's workforce, the Company employs various measures to ensure it is complying fully with strict MSHA limits on DPM exposure for underground miners. These measures include using catalytic converters, filters, and enhanced ventilation regimens, modifying certain mining practices underground that tend to create concentrations of DPM, and utilizing various blends of cleaner-burning biodiesel fuel. The Company believes its underground operations at the Stillwater and East Boulder Mines are in compliance with MSHA’s existing stringent DPM standards. However, no assurance can be given that any lack of compliance in the future will not impact the Company.
Nitrate concentrations in groundwater samples taken near the Company's operations in some cases have shown readings elevated above background and permit levels at both the Stillwater Mine and the East Boulder Mine. These readings result from operational activities and discharges that currently are authorized under permit. Noncompliance with groundwater nitrate standards has occurred in some instances. The Company is addressing this issue through action plans approved by the appropriate federal and state regulatory agencies. In view of its good-faith efforts to comply and progress to date in implementing remedial and advanced treatment technologies, the Company does not believe that failure to be in strict compliance will have a material adverse effect on the Company. The Company fully expects that the remedial measures it is taking will be effective in reducing groundwater nitrate concentrations to a level that meets permit and statutory water quality standards.
The Company believes that its operations and facilities comply in all material respects with current federal, state and local permits and regulations, and that it holds all necessary permits for its operations at the Stillwater and East Boulder mines and to complete essentially all of its planned expansion projects along the J-M Reef. However, compliance with existing and future laws and regulations may require additional control measures and expenditures, which cannot be estimated at this time. Compliance requirements for new or expanded mines and mills may require substantial additional control measures that could materially affect permitting and proposed construction schedules for such facilities. Under certain circumstances, facility construction may be delayed pending regulatory approval. The cost of complying with future laws and regulations may render currently operating or future properties less profitable and could adversely affect the level of the Company’s ore reserves and, in the worst case, render its mining operations uneconomic.
PERMITTING AND RECLAMATION
Operating Permits 00118 and 00149 issued by the Montana Department of Environmental Quality (DEQ) encompass approximately 2,475 acres at the Stillwater Mine located in Stillwater County, Montana and 980 acres at the East Boulder Mine located in Sweet Grass County, Montana. The permits delineate lands that may be subject to surface disturbance. At present, approximately 786 acres have been disturbed at the Stillwater Mine, and 200 acres have been disturbed at the East Boulder Mine. The Company employs concurrent reclamation wherever feasible.
Reclamation regulations affecting the Company’s operations are promulgated and enforced by the Hard Rock Bureau of the Montana DEQ. The USFS may impose additional reclamation requirements during the permitting process. For regulatory purposes, reclamation does not mean restoring the land to its pre-mining state. Rather, it means returning the post-mining land to a state which has stability and utility comparable to pre-mining conditions. Major reclamation requirements include stabilization and re-vegetation of disturbed lands, controlling storm water and drainage from portals and waste rock dumps, removal of roads and structures, the treatment and elimination of process solutions, the reclamation of major tailings storage facilities and the treatment and elimination of mine water prior to discharge in compliance with standards and visual mitigation.
Permits governing air and water quality are issued to the Company by the Montana DEQ, which has been delegated such authority by the federal government. Operating permits issued to the Company by the Montana DEQ and the USFS do not have an expiration date but are subject to periodic reviews. The reviews evaluate bonding levels, monitor reclamation progress, and assess compliance with all applicable permit requirements, mitigation measures and state and federal environmental standards. Closure and reclamation obligations are reviewed and reassessed by the agencies and the Company on a five year rotating schedule. Bonding and financial guarantees are posted with the agencies to cover final reclamation costs at the end of the reconciliation and reassessment process. See “Risk Factors - If the Company is Unable to Obtain surety Coverage to Collateralize Its Reclamation Liabilities, Operating Permits May Be Affected.”
In mid-2000, the Company signed an agreement with a group of local environmental organizations which is known as the “Good Neighbor Agreement” (GNA). Under the terms of the agreement, the group and its affiliates (the “Councils”) agreed not to challenge permit renewals or submittals in exchange for Company participation in programs and cooperative efforts that maintain or improve the local environment. For example, the Company agreed to sponsor efforts that reduce traffic flows on access roads to both the Stillwater Mine and the East Boulder Mine. Additionally, the Company is funding expanded monitoring programs and has funded the development of a watershed partnership for the Boulder River basin to assist residents in improving the quality of surface and ground water. In August of 2005, the GNA was mutually amended to acknowledge the progress made in implementing the agreement and in completing and finalizing many of the agreement requirements. Future commitments were reviewed and amended as appropriate in an effort to bring the agreement current with existing
environmental conditions, updated technical data and changes to schedules and monitoring plans resulting from information gathered during the previous 5-year period. In 2010, the Agreement celebrated ten years of successful implementation which has made it the recognized model within the natural resources industry for successful collaboration and dispute resolution. The Company estimates the total cost of all the environmental programs associated with the implementation of the agreement to be between $0.2 million and $0.3 million, annually.
The Company’s environmental expenses for Montana operations were $4.3 million, $3.8 million, and $3.3 million in 2012, 2011 and 2010, respectively. The Company had capital outlay for environmental facilities during 2012, 2011 and 2010 of $3.1 million, $0.8 million and $0.2 million, respectively. The Company’s ongoing operating expenditures for environmental compliance are expected to total at least $4.0 million per year and will be expensed as incurred.
Ontario, Canada
At Marathon, the Company is continuing with baseline environmental and socio-economic studies and is engaged with federal and provincial regulatory authorities and First Nations and other Aboriginal communities to secure the required permits and approvals for mine construction and operation. In December 2008, the project was accepted under the Major Projects Management Office (MPMO) initiative. A formal project description was submitted to the Canadian Environmental Assessment Agency (CEAA) in March 2010, which triggered the Federal Environmental Assessment (FEA) process. Authorizations are required for the project from certain federal agencies: the Department of Fisheries and Oceans, Transport Canada and Natural Resources Canada. These federal agencies sent letters of recommendation to the Minister of Environment and subsequently on October 7, 2010, the project was referred to an independent review panel. The panel is charged with representing the concerns of both the federal and the provincial regulatory organizations, as well as other affected parties. The Company cannot predict when or whether operating permits will be obtained or whether material changes in permit requirements, conditions or the regulatory process will be imposed. Any significant delay or denial in the permit approval process could have a negative effect on the Company’s future financial condition and results of operations. See “Risk Factors – The Marathon Acquisition Introduces Significant New Uncertainties as to the Company's Future Performance and Commitments.”
San Juan Province, Argentina
The Altar project, described in more detail above under “Title and Royalties” is currently an advanced stage exploration project. In Argentina, the Environmental Law for Mining Business, Law No 24.585, is incorporated into the Mining Code. It aims to protect the environment and preserve natural and cultural heritage, which may be susceptible to impact by mining activities. Activities specified in the above-mentioned regulations cover the following activities or project stages:
| |
| • | Final Closure of the Mine |
The law states that approval of the Environmental Impact Assessment (EIA) must be sought before beginning any of these activities and it must be prepared by the holder of the mining concession. The EIA must be updated at least every two years or at any time a substantial change to the project is expected. The EIA must contain a detailed discussion of the status of the project, a description of the area of influence, a review of current project activities and plans, and details of possible impacts to the soil, water, atmosphere, flora and fauna, relief, and socio-cultural environment. It must also include contingency plans for dealing with the prevention, mitigation, rehabilitation, and restoration of, or compensation for, any environmental damage as appropriate. The enforcing authority must approve or reject the report within 60 working days of its submission. The approved Environmental Impact Statement (Declaracion de Impacto Ambiental, or DIA) is the legal instrument allowing work to proceed. Considering the fact that the Altar property is owned outright and the Rio Cenicero concessions are under an option agreement, Minera Peregrine must treat the two properties separately in terms of environmental permitting.
Different studies to fulfill the Altar Base Line Study have been conducted on the project since 2005 and the area for the Baseline study was extended to the Rio Cenicero area in 2009. The Baseline study results are used to prepare the Exploration EIA updates and will also be used in the preparation of an eventual Extraction EIA that will be presented to obtain the permits to construct and operate the Altar project. In addition to baseline study work to be conducted in Argentina, similar baseline work is being conducted in Chile to preserve various project options. As already noted, the Exploration EIAs must be updated every two years. Upon completion of the Feasibility Study or in parallel with the Feasibility Study, the Extraction EIA must be prepared and presented to the Application Authorities. The Extraction EIA has the same structure as the Exploration EIA but places more emphasis on the predictions of the impacts of the project and on associated mitigation measures.
The Company has a history of outstanding environmental performance and is committed to construct and operate the Marathon and Altar facilities in a safe and environmentally sound manner, in full compliance with relevant federal and provincial laws and using best environmental practices. The Company prides itself on its ability to work with communities and regulatory agencies, focusing on the design, construction and operation of facilities in a manner that ensures they are managed proactively to protect the environment.
COMPETITION: PALLADIUM AND PLATINUM MARKET
GENERAL
Palladium and platinum are rare precious metals with unique physical qualities that are used in diverse industrial applications and in the jewelry industry. The development of a less expensive alternative alloy or synthetic material with the same characteristics as PGMs for industrial purposes could reduce demand for the Company’s products and drive down PGM prices. Although the Company is unaware of any such alloy or material, there can be no assurance that none will be developed. Jewelry demand is influenced by a variety of external factors, including fashion trends, metal prices and the general state of the economy. Adverse changes in any of these factors could negatively affect the Company’s financial performance.
Significant quantities of palladium and platinum are held in inventory by investors, trading houses and government entities. The number of ounces in each of these inventories is not always disclosed publicly, nor is it clear under what circumstances these holdings might be brought to market. For example, in the past the Russian Federation has held large inventories of palladium as a strategic stockpile, exporting and selling substantial volumes from time to time without warning into the market. There is no official disclosure of the size of the Russian inventories or clarity as to plans for future sales, but some observers have suggested that reduced exports in recent years indicate the Russian government inventories now are nearly depleted. Also, exchange-traded funds, or ETFs, for palladium and platinum have been introduced in recent years that enable more investors to participate in the PGM markets, potentially resulting in more metal being held in inventory. The overhang from these significant investment holdings of palladium and platinum makes it more difficult to predict accurately future supply and demand for these metals and may contribute to added PGM price volatility.
The Company competes with other suppliers of PGMs, some of which are significantly larger than the Company and have access to greater mineral reserves and financial and commercial resources. Some significant suppliers produce platinum in greater quantities than palladium and thus currently enjoy higher average revenue per PGM ounce than the Company. Some significant suppliers of PGMs produce palladium and platinum as by-products of other production and consequently, on a relative basis, are not as directly affected by changes in the price of palladium as the Company is. See “Global Supply” below. New mines may be developed over the next several years, potentially increasing supply. Furthermore, the volume of PGMs recovered through recycling scrap sources, mostly spent automotive and industrial catalysts, is increasing. There can be no assurance that the Company will be successful in competing with these existing and emerging PGM producers. See “Risk Factors” and “Management’s Discussion and Analysis of Financial Condition and Results of Operations.”
GLOBAL DEMAND
The unique physical qualities of PGMs include: (1) a high melting point; (2) excellent conductivity and ductility; (3) a high level of resistance to corrosion; (4) strength and durability; and (5) strong catalytic properties. Johnson Matthey estimates that in 2012 demand for palladium (including recycling volumes) grew by 15.1% to 9.7 million ounces. Their Platinum 2012 Interim Review Report published in November 2012 (Johnson Matthey or the Johnson Matthey report), projected that 2012 palladium demand was strong in the automotive catalyst and investment markets; however, demand from jewelry and electrical components declined.
The largest application for palladium is in automotive catalytic converters. In 2012, this industry consumed approximately 6.48 million ounces or about 66% of gross worldwide palladium demand. (Johnson Matthey estimates that, in addition to primary production, an additional 2.24 million palladium ounces were generated from recycling automotive catalytic converters, jewelry and electronic scrap during 2012, down from about 2.35 million ounces in 2011.) Industrial demand for palladium includes applications in electronics and the chemical industry; Johnson Matthey indicates gross year-on-year industrial demand for palladium decreased during 2012 by 4.7% to about 1.74 million ounces. Johnson Matthey estimates that this sector comprised about 18% of total 2012 palladium demand. Palladium is used industrially in the production of electronic components for personal computers, cellular telephones, facsimile machines and other devices, as well as in chemical processes as a catalyst. Total palladium jewelry demand worldwide for 2012 is estimated by Johnson Matthey to have decreased by about 11% from the previous year to about 450,000 ounces. Johnson Matthey also reported that dentistry continues to be a large consumer of palladium for dental alloys, and that dental demand declined slightly in 2012 to approximately 540,000 ounces, or 5.6% of total net palladium demand in 2012. According to Johnson Matthey, investment demand grew in 2012 by an estimated 385,000 ounces. That compares to net investment liquidation of about 565,000 ounces
during 2011. According to Johnson Matthey (and others), the outlook for palladium over the next year appears largely positive, driven primarily by continuing recovery in the automotive sector, the outlook for stimulus in the Chinese economy during 2013, declining Russian government stockpile sales of palladium and the increasing share of palladium used in the after-treatment systems of diesel catalytic converters.
Over the past decade, the pricing disparity between platinum and palladium has driven research into substituting palladium for platinum in diesel catalytic converters, and the technical limit on palladium content reportedly has now risen to as much as 50% of the total PGMs in diesel catalytic converters - although Johnson Matthey indicates current diesel production models on average probably contain about 30% palladium. (Auto industry sources have indicated recently that in the U.S. the move to palladium in gasoline catalytic converters is essentially complete; many current U.S. models now use no platinum at all in the catalytic converter.) Jewelry consumption of palladium reportedly has been declining in China, partially due to higher prices, but interest in palladium jewelry has grown in other markets. The effect of introducing exchange-traded funds for palladium and platinum has been to broaden access for retail investors seeking exposure to PGMs but also seems to have increased market pricing volatility, particularly for palladium. Johnson Matthey estimates that for 2012 the palladium supply was in deficit by about 915,000 ounces, the result of limited Russian inventory sales and growth in automotive demand. (The deficit is presumably accommodated through drawing down above-ground inventories of finished metal.) Based on London Bullion Market Association afternoon postings, the market price of palladium during 2012 ranged from a high of $722 per ounce on February 29, 2012 to a low on July 23, 2012 of $565 per ounce, and closed 2012 at a price of $699 per ounce.
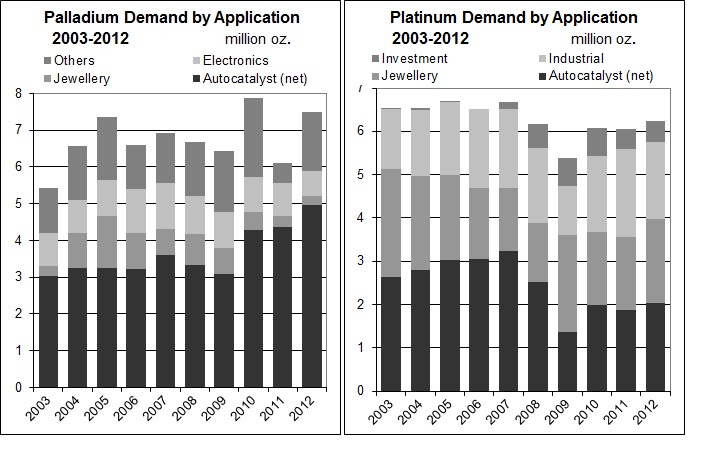
Charts reproduced from the Johnson Matthey Platinum 2012 Interim Review. Permission to reproduce was neither sought nor obtained.
Johnson Matthey has projected that 2012 total demand for platinum was essentially unchanged, declining very slightly to about 8.07 million ounces in 2012 from 8.095 million ounces in 2011. (Johnson Matthey estimates that platinum supplied from all recycling sources totaled 1.83 million ounces in 2012, down from about 2.05 million ounces in 2011.) Platinum purchases by the auto catalyst sector declined during 2012 by 1.1% to 3.07 million ounces, driven principally by continuing weakness during 2012 in the market for diesel-powered automobiles in Europe.
Jewelry demand for platinum increased in 2012 by an estimated 9.9% to about 2.7 million ounces. This increase reflects modest strength in the Chinese and other Asian markets during 2012.
Industrial uses of platinum include the production of data storage disks, fiberglass, paints, nitric acid, anti-cancer drugs, fiber optic cables, fertilizers, unleaded and high-octane gasoline and fuel cells. Johnson Matthey projects that gross industrial consumption of platinum during 2012 declined by about 22.4% to 1.32 million ounces, reflecting weakening demand from the automotive and industrial sectors.
The outlook for platinum demand for the next year or so is primarily dependent on the strength of the economic recovery, which as it progresses should gradually restore diesel demand in Europe and support growth in industrial demand for the metal.
Jewelry demand is sensitive to metal prices and, along with investment demand, has been a bright spot for platinum in 2012. To a large extent, however, the platinum outlook in 2013 likely is more sensitive to supply side issues in South Africa than to a still elusive European economic recovery.
Johnson Matthey estimates that the total platinum supply in 2012 was in deficit by about 400,000 ounces. The price of platinum during 2012, based on London Bullion Market Association afternoon postings, ranged from a high of $1,729 per ounce, reached on February 23, 2012, compared to a low of $1,390 per ounce on August 3, 2012, and it closed the year trading at $1,523 per ounce. See “Risk Factors – Users of PGMs May Reduce Their Consumption and Substitute Other Materials for Palladium and Platinum.”
GLOBAL SUPPLY
On the supply side, Johnson Matthey noted that their preliminary estimate includes only about 250,000 ounces of palladium transferred out of Russian state inventories during the year and then subsequently sold. Going forward, these Russian inventory sales constitute a significant uncertainty in projecting annual palladium supply. Including these state transfers and recycled metal (but excluding the effect of net ETF liquidation in 2011), Johnson Matthey reports that total palladium supplied to market in 2012 of 8.81 million ounces was 9.2% lower than 2011 levels. Besides lower Russian inventory sales, South African and Norilsk Nickel sales also declined.
The leading global sources of palladium and platinum production are mines located in the Republic of South Africa and the Russian Federation. The Johnson Matthey report estimates that, including Russian state inventory sales (but not including recycling), South Africa provided approximately 36% of the palladium and 73% of the platinum sold worldwide during 2012. The same report also estimates that the Russian Federation, both as a by-product of nickel production from Norilsk Nickel and from transfers out of government inventories, provided approximately 43% of the palladium and approximately 13.5% of the platinum sold worldwide in 2012 (see charts below). (In preparing these sourcing charts, Johnson Matthey treats PGM recycling volumes as a net offset against demand, rather than as new supply.)
Charts reproduced from the Johnson Matthey Platinum 2012 Interim Review. Permission to reproduce was neither sought nor obtained.
Supply numbers provided by Johnson Matthey are for metals entering the market and do not necessarily represent metals produced during the years shown. For palladium, this may at times constitute a significant year-to-year difference because of unpredictable releases out of the strategic state inventories held by the Russian Federation, as well as those held by the auto companies and investors. For platinum, this inventory effect is less significant, as inventories held by governments or private institutions have not been as material recently. According to Johnson Matthey, annual worldwide mine production of palladium for 2012 is estimated at 6.32 million ounces, down about 4% from the 6.59 million ounces produced in 2011. Annual worldwide production of platinum for 2012 is estimated at 5.84 million ounces, down almost 10% from about 6.48 million ounces in 2011, as labor unrest in South Africa resulted in significant platinum production losses.
Johnson Matthey comments that the outlook for palladium in the future is particularly sensitive to the status of the Russian state inventories. Specific information on these inventory stocks is not readily available. Johnson Matthey’s outlook assumes negligible Russian inventory sales during 2013, which would result in another large net supply deficit for palladium. However, if sales in 2013 from the Russian state inventories are significant, Johnson Matthey’s anticipated deficit could be reduced or eliminated.
In addition to mine sources, PGMs are recovered from automotive catalytic converters acquired from scrap dealers, and to a lesser extent from industry, jewelry and electronic scrap. A growing industry has developed in the collection and recovery of PGMs from scrap sources, including automotive catalytic converters, electronic and communications equipment and petroleum catalysts. Scrap volumes benefited from strong PGM prices during the first few months of 2012 but then weakened substantially as prices declined later in the year. Johnson Matthey estimates 2012 worldwide recoveries from recycling provided 2.24 million ounces of palladium and 1.83 million ounces of platinum, down from 2.35 million ounces of palladium and 2.05 million ounces of platinum in 2011, driven in 2011 by the economic incentive to recycle while metal prices were high.
PRICES
Stillwater Mining Company’s revenue and earnings depend significantly on world palladium and platinum market prices. The Company has no direct control over these prices, but is working to foster PGM demand growth by encouraging new and expanded uses for these metals. PGM prices can fluctuate widely. The Company does have the ability to hedge prices and until the Ford sales agreement expired on December 31, 2010, benefited from contractual floor prices that tended to mitigate some of the Company’s price exposure. However, except for materials purchased in its recycling activities, the Company does not currently hedge any of its PGM commitments and so is fully exposed to fluctuations in PGM prices. See “Management’s Discussion and Analysis of Financial Condition and Results of Operations – Principal Factors Affecting the Company” and “Factors That May Affect Future Results and Financial Condition.” The volatility of palladium and platinum prices is illustrated in the following table of the London Bullion Market Association afternoon postings of annual high, low and average prices per ounce since 2002. The accompanying charts also demonstrate this volatility. See “Risk Factors – Vulnerability to Metals Price Volatility – Changes in Supply and Demand Could Reduce Profitability.”
|
| | | | | | | | | | | | | | | | | | | | | | | |
| | PALLADIUM | | PLATINUM |
| YEAR | HIGH | | LOW | | AVERAGE | | HIGH | | LOW | | AVERAGE |
| 2002 | $ | 435 |
| | $ | 222 |
| | $ | 338 |
| | $ | 607 |
| | $ | 453 |
| | $ | 539 |
|
| 2003 | $ | 269 |
| | $ | 148 |
| | $ | 201 |
| | $ | 840 |
| | $ | 603 |
| | $ | 691 |
|
| 2004 | $ | 333 |
| | $ | 178 |
| | $ | 230 |
| | $ | 936 |
| | $ | 767 |
| | $ | 846 |
|
| 2005 | $ | 295 |
| | $ | 172 |
| | $ | 201 |
| | $ | 1,012 |
| | $ | 844 |
| | $ | 897 |
|
| 2006 | $ | 404 |
| | $ | 261 |
| | $ | 320 |
| | $ | 1,355 |
| | $ | 982 |
| | $ | 1,143 |
|
| 2007 | $ | 382 |
| | $ | 320 |
| | $ | 355 |
| | $ | 1,544 |
| | $ | 1,118 |
| | $ | 1,303 |
|
| 2008 | $ | 582 |
| | $ | 164 |
| | $ | 352 |
| | $ | 2,273 |
| | $ | 763 |
| | $ | 1,576 |
|
| 2009 | $ | 393 |
| | $ | 179 |
| | $ | 264 |
| | $ | 1,494 |
| | $ | 918 |
| | $ | 1,204 |
|
| 2010 | $ | 797 |
| | $ | 395 |
| | $ | 526 |
| | $ | 1,786 |
| | $ | 1,475 |
| | $ | 1,610 |
|
| 2011 | $ | 858 |
| | $ | 549 |
| | $ | 734 |
| | $ | 1,887 |
| | $ | 1,354 |
| | $ | 1,720 |
|
| 2012 | $ | 722 |
| | $ | 565 |
| | $ | 644 |
| | $ | 1,729 |
| | $ | 1,390 |
| | $ | 1,552 |
|
| 2013* | $ | 773 |
| | $ | 673 |
| | $ | 713 |
| | $ | 1,736 |
| | $ | 1,551 |
| | $ | 1,644 |
|
* (Through February 22, 2013)
History has shown that the market price of palladium can be extremely volatile. After reaching a record high $1,090 per ounce in January 2001, the price of palladium declined over a 27-month period until hitting a low of $148 per ounce in April 2003. Thereafter, the price gradually recovered, posting a high of $582 per ounce in April 2008 and then declining sharply to a low of $164 per ounce in December 2008. Palladium prices recovered significantly during 2009, 2010 and early 2011. During 2012 palladium reached a high of $722 per ounce and averaged $644 per ounce for the year overall, ending the year quoted in London at $704 per ounce. As of February 22, 2013, the market price of palladium (based on the London Bullion Market Association afternoon fixing) was $732 per ounce.
The market price of platinum trended generally upward from $440 per ounce at the end of 2001 to $1,530 at the end of 2007. In late January 2008, following the announcement of electrical power shortages in South Africa, the price rose sharply, peaking in March 2008 at $2,273 per ounce in London. Beginning in June 2008, however, the price declined steeply as the economy deteriorated in the second half of 2008, hitting a low of $763 per ounce before ending 2008 at $898 per ounce. During 2009, 2010 and the first eight months of 2011, prices generally recovered; they then declined late in 2011 in response to European economic weakness. Platinum recorded a high of $1,729 per ounce in February of 2012 and averaged $1,552 per ounce for the year overall, ending the year quoted in London at $1,527 per ounce. On February 22, 2013, the London Bullion Market Association afternoon fixing for platinum was $1,611 per ounce.
AVAILABLE INFORMATION
The Company’s Internet website is www.stillwatermining.com. The Company makes available free of charge through its Internet website its annual reports on Form 10-K, quarterly reports on Form 10-Q, current reports on Form 8-K, corporate proxy statements, and any amendments to those reports, as soon as reasonably practicable after the Company electronically files such materials with, or furnishes them to, the Securities & Exchange Commission. These documents will also be provided free of charge in print, upon request.
The Company's business, operations and financial condition are subject to various risks and uncertainties. Investors should carefully consider the risks and uncertainties described below, together with all of the other information in this Annual Report on Form 10-K and in other documents that the Company files with the U.S. Securities and Exchange Commission. Set forth below are certain risks faced by the Company.
THE COMPANY COULD BE NEGATIVELY AFFECTED AS A RESULT OF THE THREATENED PROXY CONTEST
On February 25, 2013, Clinton Relational Opportunity Master Fund, L.P. (together with certain of its affiliates, the "Clinton Group") submitted to the Company a notice of its intention to nominate eight alternative director nominees to replace the entire Board of Directors of the Company at the 2013 Annual Meeting.
Involvement in a proxy contest with the Clinton Group and the election of the Clinton Group's proposed alternative nominees for the Board of Directors may have an adverse or material adverse effect on the Company's business, operating results, financial condition, the value of the Company's common stock or shareholders' interest in the Company because, among other things:
| |
| • | the Company's efforts in responding to Clinton Group's proxy contest and related actions has been, and may continue to be, a significant distraction for the Company's management and employees and have required, and may continue to require, Company expenditure of significant time and resources. Costs associated with the threatened proxy contest and related actions may be substantial; |
| |
| • | perceived uncertainties among employees and other constituencies as to the Company's future direction as a consequence of these events may make it more difficult to attract and retain qualified personnel and business partners; and |
| |
| • | the potential obligation of the Company to make an offer to repurchase or repay the principal amount, plus interest, of certain of the Company's outstanding indebtedness if the Clinton Group nominees are elected such that they constitute a majority of the Company's Board of Directors. In addition, replacement of a majority of the Company's Board of Directors in such a manner would result in the vesting of the equity under certain Company employee benefit plans. |
The Company believes the future trading price of its common stock could be subject to price fluctuations based on uncertainty associated with the proxy contest and related actions.
VULNERABILITY TO METALS PRICE VOLATILITY - CHANGES IN SUPPLY AND DEMAND COULD REDUCE PROFITABILITY
Because the Company’s primary source of revenue is the sale of platinum group metals, changes in the market price of platinum group metals will significantly affect profitability. Many factors beyond the Company’s control influence the market prices of these metals. These factors include global supply and demand, speculative activities, international, political and economic conditions, currency exchange rates, and production levels and costs in other PGM-producing countries, principally Russia and South Africa.
A prolonged or significant economic contraction in North America or in any of several other key regions worldwide can put downward pressure on market prices of PGMs, particularly if demand for PGMs declines in connection with reduced automobile demand and more restricted availability of investment credit. If investors release substantial volumes of platinum group metals from stockpiles, ETF holdings or otherwise, the increased supply can reduce the prices of palladium and platinum. Changes in currency exchange rates, and particularly a significant weakening of the South African rand, could reduce relative costs of production and improve the competitive cost position of South African PGM producers. This in turn could make additional PGM investment attractive in South Africa and reduce the worldwide competitiveness of the Company’s North American operations.
Exchange-traded funds, or ETFs, for palladium and platinum have been introduced in recent years that enable more investors to participate in the PGM markets, potentially resulting in more metal being held in inventory. The overhang from these significant investment holdings of palladium and platinum makes it more difficult to predict accurately future supply and demand for these metals and may contribute to added PGM price volatility.
Reductions in PGM prices would adversely affect the Company’s revenues, profits and cash flows. Protracted periods of low metal prices could significantly reduce revenues and the availability of required development funds to levels that could cause portions of the Company’s ore reserves and production plan to become uneconomic. This could cause substantial reductions to PGM production or suspension of mining operations, impair asset values, and reduce the Company’s proven and probable ore reserves. See “Business and Properties – Competition: Palladium and Platinum Market” for further explanation of these factors.
Extended periods of high commodity prices may create economic dislocations that may be destabilizing to PGM supply and demand and ultimately to the broader markets. Periods of high PGM market prices generally are beneficial to the Company’s financial performance. However, strong PGM prices also create economic pressure to identify or create alternate technologies that ultimately could depress future long-term demand for PGMs, and at the same time may incentivize development of otherwise marginal mining properties. Similarly, markets for PGM jewelry are primarily driven by discretionary spending that tends to decline during periods of high prices and may drive the industry toward developing new, more affordable jewelry materials. See “Risk Factors – Users of PGMs May Reduce Their Consumption and Substitute Other Materials for Palladium and Platinum” for additional discussion of these risks.
INABILITY TO ACCESS THE CAPITAL MARKETS MAY ADVERSELY AFFECT THE COMPANY
The Company’s credit rating currently is below investment grade and is not expected to achieve investment grade in the immediate future. The rating agencies at various times have expressed concern regarding the Company’s lack of operating diversity, the termination of floor prices in its previous long-term sales agreements, its relatively narrow cash operating margins and volatile pricing environment. The Company’s low credit rating will likely make it comparatively more difficult and more costly to obtain some forms of third-party financing in the future. Should the Company need to access the credit markets in the future, the Company’s lower credit rating may be an impediment to obtaining additional debt or lines of credit at favorable rates. Should the Company require additional credit capacity in the future and be unable to obtain it, the Company might not be able to meet its obligations as they come due and so could be compelled to restructure or seek protection from creditors.
Interest rates at present are near historic lows, and borrowing costs appear likely to rise in the future in step with any significant improvement in economic conditions. However, the availability of credit at reasonable cost remains tight for sub-investment grade borrowers, and the Company may experience limits on its ability to secure external financing. This in turn could constrain the Company’s ability financially to develop new operations or, in the extreme, to maintain its existing operations.
The Company’s expansion plans, particularly its long-term financing requirements for projects at Marathon and Altar, are likely to require substantial funding. While the Company has the flexibility to defer these and other projects, should the Company proceed with development it is likely to require third party financing and/or access to the financial markets. There is no assurance that the Company will be able to access the financial markets when it so desires or that terms and rates will be suitable. As a result of its credit rating and market conditions generally, the Company was not able to access the debt market in the fall of 2011. The Company attempted to go to market with a $300.0 million issuance of high-yield public debt. At the time, the financial markets were in the throes of addressing potential European defaults and related credit issues, creating a very difficult environment for sub-investment grade issuers. At that time, the Company considered raising funds through a senior note offering but withdrew its offering when the terms of the debt were not deemed suitable.
The Company does not provide any formal sinking fund for retiring its outstanding long-term debt. Prior to debt coming due, the Company normally attempts to arrange replacement financing or to marshal internal funds sufficient to retire its maturing debt. However, there can be no assurance that the Company will be able to obtain alternate financing or accumulate sufficient funds internally to meet its repayment obligations as debt comes due in the future. The Company is restricted under the terms of its revolving credit lines from drawing against them to redeem outstanding debt. If the Company does not have adequate liquidity available and is unable to fund the timely repayment of its outstanding debt, it would be in default and could be forced to sell assets or seek protection from creditors.
THE COMPANY NO LONGER HAS CONTRACTUAL FLOOR PRICES AND NOW HAS FIXED DELIVERY COMMITMENTS IN ITS SUPPLY AGREEMENTS
Approximately 56.9% of the Company’s total sales revenues for the year ended December 31, 2012, were derived from mine production. Prior to 2011, the Company was party to sales agreements that contained pricing floors which provided financial protection against significant declines in the price of palladium and to a lesser extent in the price of platinum. The Company’s current mine sales agreements no longer enjoy the benefit of pricing floors. As a result, the Company is fully exposed to any extended downturn in PGM prices. While the Company has sought to mitigate this exposure by expanding the markets for palladium, improving its relative cost profile and by maintaining substantial balance sheet liquidity and lines of
credit, there can be no assurance that these measures would be adequate to sustain operations in the event of an extended period of low PGM prices.
The Company’s major sales agreements prior to 2011 largely were based on delivery commitments tied to percentages of mine production volumes in each month. As a result, the Company had only limited exposure to shortfalls in mine production. The Company’s current sales agreements include fixed delivery commitments each month. Should there be an operating shortfall in any month that leaves the Company short of its delivery commitments, the Company could be required to purchase metal in the open market to make up the delivery shortfall. Such purchases could entail substantial losses if the market price moved adversely during the shortfall period.
The Company has a supply agreement with GM which expires on December 31, 2013, that commits the Company to deliver fixed quantities of palladium each month. The agreement does not include price floors or caps, but provides for pricing at a small discount to a trailing market price. The Company has a platinum supply agreement with Tiffany & Co. The Company also has supply agreements with Johnson Matthey and BASF and a month-to-month agreement with Ford Motor Company. None of these sales agreements include pricing floors. The Company sells any remaining mine production under month-to-month and spot sales arrangements. For more information about the Company’s sales agreements, see “Business and Properties – PGM Sales and Hedging.” For additional discussion of hedging risks, see “Risk Factors – Hedging and Sales Agreements Could Limit the Realization of Higher Metal Prices."
In its recycling business, the Company regularly enters into fixed forward sales contracts and, rarely, into financially settled forward contracts for metal produced from catalyst recycling, normally making these commitments at the time the catalyst material is purchased. For the Company’s fixed forward sales related to recycling of catalysts, the Company is subject to the customers’ compliance with the terms of the agreements, their ability to terminate or suspend the agreements and their willingness and ability to pay. The loss of any of these agreements or failure of a counterpart to perform could require the Company to sell or purchase the contracted metal in the open market, potentially at a significant loss. The Company’s revenues for the year ended December 31, 2012, included 43.1% from recycling sales and tolling fees.
FAILURE TO SECURE SALES AGREEMENTS FOR OUNCES PRODUCED FROM MINE PRODUCTION LEAVES THE COMPANY EXPOSED TO SPOT MARKET TRADING
Based on its trading experience, the Company believes it could readily sell all of its current mine production on a spot basis into terminal markets with virtually no detrimental effect on market prices. Nevertheless, such markets are not entirely predictable, and the absence of firm sales commitments leaves the Company exposed to the vagaries of market demand. If demand for PGMs were to fall sufficiently, the Company could be compelled to sell its uncommitted production at a loss, perhaps putting further downward pressure on prices at the same time. The Company’s intent is to enter into supply agreements from time to time covering a substantial portion of its mined PGM production, but there can be no assurance that such supply agreements will be available in the future. If the selling price of PGMs proves insufficient over an extended period to cover the Company’s operating and capital costs of production, the Company’s operations or capital programs might have to be curtailed, suspended or terminated altogether.
RELIANCE ON THIRD PARTIES FOR SOURCING OF RECYCLING MATERIALS AND ADVANCES FOR RECYCLING MATERIALS CREATES THE POTENTIAL FOR LOSSES
The Company has available smelter and base metal refinery capacity and purchases catalyst materials from third parties for recycling activities to recover PGMs. The Company has entered into sourcing arrangements for catalyst material with numerous suppliers, one of which both brokers and supplies directly a substantial share of the Company’s catalyst for recycling. These arrangements do not include any contractual minimum supply commitments. The Company is subject to the suppliers’ compliance with the terms of these arrangements and their ability to terminate or suspend the agreement. Should one or more of these sourcing arrangements be terminated, the Company could suffer a loss of profitability as a result of the termination. This loss could negatively affect the Company’s business and results of operations. Similarly, these suppliers typically source material from various third parties in a competitive market, and there can be no assurance of the suppliers’ continuing ability or willingness to source material on behalf of the Company at current volumes and prices. Any continuing issue associated with the suppliers’ ability to source material could reduce the Company’s profitability.
Under these sourcing arrangements for recycling material, in some cases the Company advances cash to support the purchase and collection of spent catalyst materials. These advances normally are made at the time material is ready for shipment or already in transit to the Company’s facilities. The advances are included in Other current assets on the Company’s Consolidated Balance Sheets until such time as the material has been received and title has transferred to the Company. In some cases, the Company has a security interest in the materials that the suppliers have procured but the Company has not yet received. However, some of the advances are unsecured and the unsecured portion of these advances is fully at risk.
The Company regularly advances money to its established recycling suppliers for catalyst material that the Company has received and carries in its processing inventories. These advances typically represent some portion of the estimated total value of each shipment until assays are completed determining the actual PGM content of the shipment. Upon completion of the shipment assays, a final settlement takes place based on the actual value of the shipment. However, pending completion of the assays, the payments are based on the estimated PGM content of each shipment, which could vary significantly from the actual PGM content upon assay. Should the estimated PGM content upon assay significantly exceed the actual PGM content, the Company may be at risk for a portion of the amount advanced. This risk normally is mitigated by the established nature of the business relationship with the supplier and by advancing less than a shipment's estimated total value, but should the supplier be unable to settle such an overpayment or seek protection from creditors, the Company could incur a loss to the extent of any overpayment.
The Company has installed new recycling facilities that are intended to facilitate growing the volumes of recycled material that the Company can effectively sample, assay and process. The Company has stated its belief that a business model that allows much faster turnaround of assay results than is now typical in the industry will provide some competitive advantage in growing the volumes of recycling material coming to the Company. However, there is no assurance that this assumption is correct or that the Company’s revised business model will be widely accepted within the industry, particularly in view of the practice of some of the Company’s competitors of offering significant cash working capital advances to their suppliers well ahead of receiving material from those suppliers.
Many of the Company's recycling suppliers are comparatively small businesses with limited assets and relatively little credit capacity. While the Company carefully monitors funds being advanced to such businesses and seeks to limit its exposure to any one supplier, if a problem develops with such a supplier, the Company might not be able to fully recoup amounts advanced to that entity.
AN EXTENDED PERIOD OF LOW RECYCLING VOLUMES AND WEAK PGM PRICES COULD PUT THE COMPANY’S OPERATIONS AT ADDITIONAL RISK
The Company’s recycling segment generates supplemental earnings and cash flow to help support the economics of the mining business when PGM prices are low. The recycling segment in turn depends upon the copper and nickel produced in mine concentrates to extract the PGMs in recycled material within the Company’s processing facilities. The economics of the recycling segment to a large extent have been regarded as incremental within the processing operations, with the result that the recycling business is allocated only its incremental share of the total cost of the processing facilities.
Volumes of recycling materials available in the marketplace diminished substantially in response to the drop in PGM prices in late 2008 and early 2009, and after recovering, declined again in mid-2012. These lower recycling volumes resulted in less earnings and cash flow from the recycling segment, and therefore less economic support for the mining operations. Should it become necessary at any point to reduce or suspend operations at the mines, the proportion of processing costs allocated to the recycling segment would increase substantially, making the recycling segment less profitable. Further, the ability to operate the smelter and refinery without significant volumes of mine concentrates and the contained copper and nickel has never been demonstrated and would likely require modification to the processing facilities. There is no assurance that the recycling facilities can operate profitably in the absence of significant mine concentrates, or that capital would be available to complete necessary modifications to the processing facilities.
THE COMPANY MAY BE COMPETITIVELY DISADVANTAGED AS A PRIMARY PGM PRODUCER WITH A PREPONDERANCE OF PALLADIUM AND WITH A U.S. DOLLAR-BASED COST STRUCTURE
The Company’s products compete in a global market place with the products of other primary producers of PGMs and with companies that produce PGMs as a by-product. In many cases, the other primary producers mine ore reserves with a higher ratio of platinum to palladium than the Company, and as a result they enjoy higher average realizations per ounce. The Company also competes with mining companies that produce PGMs as a by-product of their primary commodity, principally nickel.
Because the Company’s U.S. based cost structure is denominated in dollars, in periods when the U.S. dollar is relatively strong the Company’s competitors may still operate profitably, while the Company may not. Furthermore, non-primary producers of PGMs who regard PGMs as a by-product will generally continue to produce and sell PGMs when prices are low, as PGMs are not their principal commodity. In some cases, labor arrangements and local legal or political considerations may incentivize competitors to continue operating unprofitable facilities even in the face of negative cash margins.
PGM ACQUISITION OPPORTUNITIES MAY BE LIMITED
The Company has focused considerable attention on identifying attractive opportunities to acquire additional PGM assets, which led to the acquisition of Marathon. However, the availability of attractive acquisition opportunities in PGMs is quite limited, particularly on a scale that the Company can reasonably manage. Consequently, the opportunity for acquiring additional PGM assets may be limited. While the Company’s primary focus remains on PGMs, as resources permit it may also continue to evaluate opportunities in gold and silver, potentially in combination with copper and nickel.
ACHIEVEMENT OF THE COMPANY’S PRODUCTION GOALS IS SUBJECT TO UNCERTAINTIES
Based on the complexity and uncertainty involved in operating underground mines, it is challenging to provide accurate production and cost forecasts. The Company cannot be certain that either the Stillwater Mine or the East Boulder Mine will achieve the production levels forecasted or that the expected operating cost levels will be achieved or that funding will be available from internal and external sources in requisite amounts or on acceptable terms to sustain the necessary ongoing development work. Failure to achieve the Company’s production forecast may negatively affect the Company’s revenues, profits and cash flows. As the extent of underground operations continues to expand at depth and horizontally, it is likely that operating costs will increase from year to year unless productivity is increased commensurately. Also, as additional underground infrastructure is constructed, amortization expense may increase unless additional ore reserves are identified. Such increased costs could adversely affect the Company’s profitability.
The East Boulder Mine commenced commercial operations in 2002 and has never reached its original planned 2,000 ton-per-day operating rate on a sustained basis. Ore grades at the East Boulder Mine also are typically lower than comparable grades at the Stillwater Mine. Partially as a result, production costs per ounce at the East Boulder Mine have generally been significantly higher than at the Stillwater Mine. The Company has put in place various operating plans and programs that are intended to reduce or limit increases in production costs at both the East Boulder Mine and the Stillwater Mine; however, there can be no assurance that these plans and programs will be implemented effectively or that they can be sustained. Actual production, cash operating costs and economic returns achieved in the future may differ significantly from those currently estimated or those established in future studies and estimates.
During 2007 and 2008, attrition rates at the Stillwater and East Boulder Mines exceeded already high historical experience, resulting in shortages of skilled miners and disruptions to mining efficiency. With a change to its work schedule and the more difficult economic conditions during 2009, the Company saw these attrition rates decline to levels well below the historical trend, with accompanying improvements in productivity. Employee attrition rates in recent years have remained essentially comparable to those in 2009. While the Company believes that the improvements in productivity realized during 2009 were attributable to more than just a more stable workforce, if the economy recovers significantly in the future the competition for skilled miners may resume and the Company may see its employee attrition rates climb. This in turn could prove disruptive to the Company’s workforce, result in lower productivity and restrict the Company's ability to expand its annual production rates if insufficient manpower is available to staff the expansion projects. See “Risk Factors – Limited Availability of Additional Mining Personnel and Uncertainty of Labor Relations May Affect the Company’s Ability to Achieve Its Production Targets” below for further discussion of this and related issues.
CAPITAL COSTS FOR NEW MINE DEVELOPMENTS ARE DIFFICULT TO ESTIMATE AND MAY CHANGE OVER TIME
The Company is involved in various exploration and development activities, some of which likely would require substantial future capital expenditures to bring into production. The Company normally performs engineering studies before committing to such projects which include a detailed review of the project design and anticipated costs to construct and operate the proposed facilities. Experience in the mining industry has demonstrated that as a project progresses, various factors may cause the initial estimates of such costs to escalate, sometimes significantly. Examples of these factors include unforeseen construction delays, background inflation, lack of timely availability of contractors or required equipment, labor unrest, political and environmental obstacles, late changes to the project design, and so forth. There is no assurance that the Company's projects will not experience such cost escalation as they advance, which could impair the economics of these projects, require additional funding that might not be available or might be costly to secure, and could weaken the Company's financial position.
ORE RESERVES ARE VERY DIFFICULT TO ESTIMATE AND ORE RESERVE ESTIMATES MAY REQUIRE ADJUSTMENT IN THE FUTURE; CHANGES IN ORE GRADES, MINING PRACTICES AND ECONOMIC FACTORS COULD MATERIALLY AFFECT THE COMPANY’S PRODUCTION AND REPORTED RESULTS
Ore reserve estimates are necessarily imprecise and depend to some extent on statistical inferences drawn from limited drilling samples, which may prove unreliable or unrepresentative. Reported ore reserves are comprised of a proven component and a probable component. (See Glossary for definitions.) For proven ore reserves in the Company's Montana operations,
distances between samples can range from 25 to 100 feet, but are typically spaced at 50-foot intervals both horizontally and vertically. The sample data for proven ore reserves consists of survey data, lithologic data and assay results. The Company enters this data into a 3-dimensional modeling software package, where it is analyzed to produce a 3-dimensional solid block model of the resource. The assay values are further analyzed by a geostatistical modeling technique (kriging) to establish a grade distribution within the 3-dimensional block model. Dilution is then applied to the model and a diluted tonnage and grade are calculated for each block.
Probable ore reserves are based on longer projections, up to a maximum radius of 1,000 feet beyond the limit of existing drillhole sample intercepts of the J-M Reef obtained from surface and underground drilling. Statistical modeling and established continuity of the J-M Reef as determined from results of mining activity to date support the Company’s technical confidence in estimates of tonnage and grade over this projection distance. Where appropriate, projections for the probable ore reserve determination are constrained by any known or anticipated restrictive geologic features. The probable ore reserve estimate of tons and grade is based on the projection of factors calculated from adjacent proven ore reserve blocks or from diamond drilling data where available. As a result, probable ore reserve estimates are less reliable than estimates of proven ore reserves. Both proven and probable ore reserve projections are also limited where appropriate by certain modifying factors, including geologic evidence, economic criteria and mining constraints.
Conversion of probable ore reserves to proven ore reserves is calculated by dividing the actual proven tons converted for a given area by the expected tonnage based on a probable yield expectation for that given area. Actual period-to-period conversion of probable ore reserves to proven ore reserves may result in increases or decreases to the total reported amount of ore reserves. Conversion, an indicator of the success in upgrading probable ore reserves to proven ore reserves, is evaluated annually as described under “Business and Properties – Proven and Probable Ore Reserves”. Conversion rates are affected by a number of factors, including geological variability, quantity of tonnage represented by the period drilling, applicable mining methods and changes in safe mining practices, economic considerations and new regulatory requirements.
The following table illustrates, for each year’s development program, the actual percent conversion rates of probable ore reserve into proven ore tons experienced by year from 2003 through 2012:
|
| | | | | | | | | | | | | | | | | | | | | | |
| Year ended December 31, | | Historic
Weighted
Average (1) | | 2012 | | 2011 | | 2010 | | 2009 | | 2008 | | 2007 | | 2006 | | 2005 | | 2004 | | 2003 |
| (In percent) | | | | | | | | | | | | | | | | | | | | | | |
| Stillwater Mine | | 89 | | 100 | | 80 | | 70 | | 83 | | 74 | | 68 | | 94 | | 101 | | 62 | | 52 |
| East Boulder Mine | | 100 | | 126 | | 116 | | 97 | | 24 | | 71 | | 107 | | 91 | | 110 | | 125 | | 86 |
| |
| (1) | Historic Weighted Average period is 1997 through 2012. |
Ore reserve estimates are expressions of professional judgment based on knowledge, experience and industry practice. The Company cannot be certain that its estimated ore reserves are accurate, and future conversion and production experience could differ materially from such estimates. Should the Company encounter mineralization or formations at any of its mines or projects different from those predicted by drilling, sampling and similar examinations, reserve estimates may have to be adjusted and mining plans may have to be altered in a way that might adversely affect the Company’s operations. Declines in the market prices of PGMs may render the mining of some or all of the Company’s ore reserves uneconomic. The grade of ore may vary significantly from time to time and between the Stillwater Mine and the East Boulder Mine, as with any mining operation. The Company cannot provide assurance that any particular quantity of metal may be recovered from the ore reserves. Moreover, short-term factors relating to the ore reserves, such as the availability of production workplaces, the need for additional development of the ore body or the processing of new or different ore types or grades, may impair the Company’s profitability in any particular accounting period.
AN EXTENDED PERIOD OF LOW PGM PRICES COULD RESULT IN A REDUCTION OF ORE RESERVES AND POTENTIAL ASSET IMPAIRMENT CHARGE
The Company reviews and evaluates its long-lived assets for impairment when events or changes in circumstances indicate that the related carrying amounts of its assets may not be recoverable. Impairment is considered to exist if the total estimated future cash flows on an undiscounted basis are less than the carrying amount of the asset. Estimations of future cash flows take into account estimates of recoverable ounces, PGM prices (considering current and historical prices, long-term sales contracts prices, price trends and related factors), production levels and capital and reclamation expenditures, all based on life-of-mine plans and projections.
If the Company determines that the carrying value of a long-lived asset is not recoverable and the asset is impaired, then
the Company must determine the fair value of the impaired asset. If fair value is lower than the carrying value of the assets, then the carrying value must be adjusted down to the fair value. If the fair value of the impaired asset is not readily determinable through equivalent or comparable market price information, the Company normally engages the services of third-party valuation experts to develop or corroborate fair value assessments.
Were the Company to experience a prolonged period of low PGM prices adversely affecting the determination of ore reserves, the Company could face one or more impairment adjustments. Assumptions underlying future cash flows are subject to risks and uncertainties. Any differences between projections and actual outcomes for key factors such as PGM prices, recoverable ounces, and/or the Company’s operating performance could have a material effect on the Company’s ability to recover the carrying amounts of its long-lived assets, potentially resulting in impairment charges in the future. Absent modifications to the Company’s operating plans, the Company has estimated that as of December 31, 2012, the combined long-term PGM market price level below which ore reserves start to be constrained economically is about $681 per combined ounce of PGM based on a palladium to platinum ratio of 3.479 to 1. Expressed on the same basis, the Company's combined average realization for palladium and platinum using London spot prices quoted on the last trading day of 2012 was $883 per ounce.
Lower PGM prices also can affect the economic justification of ore reserves. The Company reviews its ore reserves annually and has reviewed them as of December 31, 2012. As in past years, the Company also engaged Behre Dolbear as third-party independent geological experts to review and provide an opinion on the Company’s ore reserve calculations. The Company performs its ore reserve economic assessment using a twelve-quarter trailing price in order to level out short-term volatility in metals prices, viewing the twelve-quarter trailing average as a reasonable surrogate for long-term future PGM prices over the period when the reserves will be mined. The Company’s combined twelve-quarter trailing weighted average price for palladium and platinum at December 31, 2012, was about $856 per ounce based on a palladium to platinum ratio of 3.479 to 1 ($634 per ounce for palladium and $1,627 per ounce for platinum). At this combined price, the Company’s geologic ore reserves at each mine can be shown to generate (undiscounted) positive cash flow over the life of the reserve. Consequently, the Company’s ore reserves were not constrained economically at December 31, 2012.
It is important to note that if PGM prices were to fall for an extended period, the trailing twelve-quarter price will gradually decline. Also, normal inflation, abnormally increasing costs for commodities used in mining and increasing travel distances within the mine all exert upward pressure on mining and processing costs, which in a stable or declining pricing environment may reduce operating margins. Consequently, following the Company’s methodology, there can be no assurance that the Company’s reported proven and probable ore reserves will not be constrained economically in the future.
USERS OF PGMS MAY REDUCE THEIR CONSUMPTION AND SUBSTITUTE OTHER MATERIALS FOR PALLADIUM AND PLATINUM
High PGM prices may lead users of PGMs to substitute other materials for palladium and platinum or to reduce the amounts they consume. The automobile, jewelry, electronics and dental industries are the largest consumers of palladium. In varying degrees, all of these applications are sensitive to prices. In response to supply concerns and high market prices for palladium, some automobile manufacturers in the past have sought alternatives to palladium - although no practical alternatives to palladium, platinum and rhodium in automotive catalytic converters have been identified to date. During periods of high palladium prices, there has been some substitution in the past of other metals for palladium in electronics and dental applications. High platinum prices likewise tend to reduce demand by driving consumers toward alternative metals. The principal demand for platinum is in the automobile and chemical industries and for jewelry. Substitution in these industries may increase if PGM market prices rise or if supply becomes unreliable. Significant substitution for any reason, in the absence of alternative uses for PGMs being identified, could result in a material and sustained PGM price decrease, which would negatively affect the Company’s revenues and profitability.
High PGM prices also drive users toward ever more efficient utilization of PGMs. In the past, the development of new flow geometries and substrate configurations have resulted in “thrifting down” the amount of PGMs in catalytic converters required to meet specific emission standards. Recently, apparently in response to high PGM prices, certain researchers have announced technological innovations that in the future may allow further significant reductions in the volume of PGMs required in each catalytic converter. These emerging applications could tend to drive down PGM demand in the future and result in lower PGM prices, as well as reducing the volume of material available for recycle at the end of a catalytic converter’s useful life.
To the extent existing and future environmental regulations tend to create disincentives for the use of internal combustion engines, demand for palladium and platinum in automotive catalytic converters could be reduced. Small engines in general tend to have smaller catalytic converters and use less PGMs than larger engines. Less demand for PGMs as a result of these trends could drive down PGM prices and could impair the Company’s financial performance.
IF THE COMPANY IS UNABLE TO OBTAIN SURETY COVERAGE TO COLLATERALIZE ITS RECLAMATION LIABILITIES, OPERATING PERMITS MAY BE AFFECTED
The Company is required to post surety bonds, letters of credit, cash or other acceptable financial instruments to guarantee the future performance of reclamation activities at its operating mines. The total availability of bonding capacity from the U.S. insurance industry is limited. During 2008, in addressing regulatory concerns triggered by the economic downturn, the Company increased bonding levels for its mining operations. Further increases in bonding requirements are expected in the future. As of December 31, 2012, the Stillwater Mine and the East Boulder Mine carried reclamation bonds totaling $19.5 million and $13.8 million, respectively. If increased surety requirements are imposed in the future and the Company finds itself unable to obtain the required bonds or otherwise provide acceptable collateral, the ability to operate under existing operating permits would likely be curtailed, which could have a significant adverse effect on the Company’s operations. As of December 31, 2012, the amount of collateral posted in support of these reclamation guarantees, in the form of irrevocable letters of credit was $17.5 million.
MINING RISKS AND POTENTIAL INADEQUACY OF INSURANCE COVERAGE – THE COMPANY’S BUSINESS IS SUBJECT TO SIGNIFICANT RISKS THAT MAY NOT BE COVERED BY INSURANCE
Underground mining and milling, smelting and refining operations involve a number of risks and hazards, including:
| |
| • | unusual and unexpected rock formations affecting ore or wall rock characteristics; |
| |
| • | ground or slope failures; |
| |
| • | cave-ins, ground water influx, rock bursts and other mining or ground-related problems; |
| |
| • | organized labor disputes or work slow-downs; |
| |
| • | metallurgical and other processing, smelting or refining problems; |
| |
| • | wild fires, flooding and periodic interruptions due to inclement or hazardous weather conditions or other acts of God; |
| |
| • | mechanical equipment failure and facility performance problems, and |
| |
| • | availability and cost of critical materials, power, equipment and skilled manpower. |
Such risks could result in damage to, or destruction of, mineral properties or production facilities, personal injury or death, environmental damage, delays in mining or processing, monetary losses and possible legal liability. Some fatal accidents and other non-fatal serious injuries have occurred at the Company’s mines since operations began in 1986. During the fourth quarter of 2011, the Company experienced a tragic fatality in a single-vehicle accident underground at the Stillwater Mine. Future industrial accidents or occupational disease occurrences could have a material adverse effect on the Company’s business and operations. The Company cannot be certain that its insurance will cover certain risks associated with mining or that it will be able to maintain insurance to cover these risks at economically feasible premiums. The Company might also become subject to liability for environmental damage or other hazards which may be uninsurable or for which it may elect not to insure because of premium costs or commercial impracticality. Such events could result in a prolonged interruption in operations that would have a negative effect on the Company’s ability to generate revenues, profits, and cash flow.
HEDGING AND SALES AGREEMENTS COULD LIMIT THE REALIZATION OF HIGHER METAL PRICES
From time to time, the Company may enter into derivative contracts and other hedging arrangements for its mined output in an effort to reduce the negative effect of price changes on its cash flow. These arrangements typically consist of contracts that require the Company to deliver specific quantities of metal, or to financially settle the obligation in the future, at specific prices. The Company may also hedge pricing through the sale of call options and the purchase of put options. See “Business and Properties – PGM Sales and Hedging” for a discussion of the Company’s hedge positions. While hedging transactions are intended to reduce the negative effects of price decreases, they have also prevented the Company at times from benefiting fully from price increases. If PGM prices are above the price at which future production has been hedged, the Company will experience an opportunity loss upon settlement.
CHANGES TO REGULATIONS AND COMPLIANCE WITH REGULATIONS COULD AFFECT PRODUCTION, INCREASE COSTS AND CAUSE DELAYS
The Company’s business is subject to extensive federal, state and local environmental controls and regulations, including regulations associated with the implementation of the Clean Air Act, Clean Water Act, Resource Conservation and Recovery Act, Metals Mines Reclamation Act and numerous permit stipulations as documented in the Record of Decision for each operating entity. Properties controlled by the Company in Canada and Argentina are subject to analogous federal and provincial controls and regulations in those respective countries. The body of environmental laws is continually changing and, as a general matter, is becoming more restrictive. Compliance with these regulations requires the Company to obtain permits issued by
federal, state, provincial and local regulatory agencies. Certain permits require periodic renewal and/or review of the Company’s performance. The Company cannot predict whether it will be able to secure or renew such permits or whether material changes in permit conditions will be imposed. Nonrenewal of permits, the inability to secure new permits, or the imposition of additional conditions could eliminate or severely restrict the Company’s ability to conduct its operations.
Compliance with existing and future environmental laws and regulations may require additional control measures and expenditures, which the Company cannot reasonably predict. Environmental compliance requirements for new or expanded mining operations may require substantial additional control measures that could materially affect permitting and proposed construction schedules for such facilities. Under certain circumstances, facility construction may be delayed pending regulatory approval. Expansion plans or new mining and processing facilities may require new environmental permitting. In some cases private parties may pursue successive legal challenges seeking to block approval or renewal of the Company’s existing or proposed permits. See “Business and Properties – Regulatory and Environmental Matters.”
The Company’s activities are also subject to extensive federal, state, foreign, provincial and local laws and regulations governing matters relating to mine safety, occupational health, labor standards, prospecting, exploration, production, exports, smelting and refining operations and taxes. Compliance with these and other laws and regulations, could require additional capital outlays, which could negatively affect the Company’s cash flow.
The Company’s existing mining operations are located adjacent to the Absaroka-Beartooth Wilderness Area and are situated approximately 30 miles from the northern boundary of Yellowstone National Park. While the Company works closely and cooperatively with local environmental organizations, the Montana DEQ and the USFS, there can be no assurance that future political or regulatory efforts will not further restrict or seek to terminate the Company’s operations in this sensitive area.
The Company employs various measures in its operating facilities in an effort to protect the health of the Company’s workforce and to comply with stringent MSHA limits on DPM exposure for the underground miners. These measures include using catalytic converters, filters and enhanced ventilation regimens on mining equipment, modifying certain mining practices underground that may tend to concentrate DPM emissions, and utilizing various cleaner-burning biodiesel blends. As a result of its internal efforts to reduce DPM exposure, the Company believes it is currently in compliance with the DPM standards at both the Stillwater Mine and the East Boulder Mine. However, no assurance can be given that any lack of compliance in the future will not impact the Company.
Various legislative initiatives at the federal, state and provincial level have been introduced and, in some cases, enacted mandating additional safety and health measures for mining employees and providing stronger penalties for failure to comply. The Company believes it has a highly effective safety program in place for its employees, but there can be no assurance that the Company will be in compliance with future legislated initiatives or that the Company will not incur significant penalties under these initiatives.
LIMITED AVAILABILITY OF ADDITIONAL MINING PERSONNEL AND UNCERTAINTY OF LABOR RELATIONS MAY AFFECT THE COMPANY’S ABILITY TO ACHIEVE ITS PRODUCTION TARGETS
The Company’s operations depend significantly on the availability of qualified miners. Historically, the Company has experienced periods of high turnover with respect to its miners, particularly during the strong metal markets of 2007 and early 2008. In addition, the Company must compete for individuals skilled in the operation and development of underground mining properties. The number of such persons is limited, and significant competition exists to obtain their skills. The Company cannot be certain that it will be able to maintain an adequate supply of miners and other personnel or that its labor expenses will not increase as a result of a shortage in supply of such workers. Failure to maintain an adequate supply of miners could result in lower mine production and impair the Company’s financial performance.
The Company had 1,664 employees (including its activities in Canada and South America) at December 31, 2012. About 796 employees located at the Stillwater Mine and the Columbus processing facilities are covered by a collective bargaining agreement with the United Steel Workers (USW) Local 11-0001, expiring June 1, 2015. As of December 31, 2012, about 282 employees at the East Boulder Mine were covered by a separate collective bargaining agreement with USW Local 11-0001, which expires December 31, 2015.
In response to the limited availability of skilled underground miners, the Company has instituted a new-miner training program, whereby from time to time it hires individuals largely inexperienced in mining and provides intensive, supervised training in skills critical to underground mining at the Company’s operations. This training program requires dedicating significant time, expense and personnel to the training effort. These new and less experienced miners, even after training, generally will require several years of experience to achieve the productivity level of the Company’s regular mining workforce. There is no assurance that these new miners will achieve the assumed level of productivity as they gain experience, that the Company will be able to retain these new workers in the face of other employment opportunities, nor that the training program will supply enough qualified miners to keep up with future miner attrition rates and accommodate the Company's growth plans.
UNCERTAINTY OF TITLE TO PROPERTIES – THE VALIDITY OF UNPATENTED MINING CLAIMS IS SUBJECT TO TITLE RISK
Montana
The Company has a number of unpatented mining and mill site claims. See “Business and Properties – Title and Royalties.” The validity of unpatented mining claims on public lands is often uncertain and possessory rights of claimants may be subject to challenge. Unpatented mining claims may be located on lands open to appropriation of mineral rights and are generally considered to be subject to greater title risk than other real property interests because the validity of unpatented mining claims is often uncertain and vulnerable to challenges by third parties or the federal government. The validity of an unpatented mining or mill site claim, in terms of its location and its maintenance, depends on strict compliance with a complex body of federal and state statutory and decisional law and, for unpatented mining claims, the existence of a discovery of valuable minerals. In addition, few public records exist to definitively control the issues of validity and ownership of unpatented mining claims or mill sites. While the Company pays annual maintenance fees and has obtained mineral title reports and legal opinions for some of the unpatented mining claims or mill sites in accordance with the mining laws and what the Company believes is standard industry practice, the Company cannot be certain that the mining laws will not be changed nor that the Company’s possessory rights to any of its unpatented claims may not be deemed defective and challenged. Any change in the mining law could include the imposition of a federal royalty provision on unpatented claims, which could have an adverse effect on the Company’s economic performance.
Canada
In Canada, paramount title to minerals typically vests in the Crown subject only to the burden of Aboriginal title, while the various Ministries of the Provinces enjoy legislative powers to administer the disposition of minerals within their jurisdiction. In Ontario, mining claims grant the claimant conditional rights of access for exploration of hard rock minerals conducted in compliance with regulations regarding surface disturbance, environmental stewardship and annual expenditures to maintain the validity of the claims. Mining claims in Ontario do not authorize removal of minerals for other than test work and analyses. To commercially extract minerals, a mining lease is necessary. Crown mining leases provide the claimant with a preference right to develop and extract minerals for a (renewable) 21-year term, under more specific conditions of Aboriginal consultation, environmental protection, approved closure/reclamation plans and financial assurances provided to the Crown over the life of the project. While the Company believes that its mining claims and crown leases provide adequate security of mineral and surface tenure to advance its planned mine development and mineral exploration activities in the Marathon-Coldwell region of Ontario, there can be no assurance that this tenure will not be challenged in the future nor that all necessary mining leases will ultimately be issued.
The Company holds mining claims and crown leases covering the more prospective portions of the Port Coldwell Intrusive Complex. The Company’s aggregate property holdings in the Coldwell Complex include 42 crown leases and 77 mining claims comprised of 780 claim units. Thirty-seven of the leases grant both surface and mineral rights while five of the leases presently grant mineral rights only. Applications have been submitted for surface leases on the 5 mineral leases as well as for both mineral and surface crown leases on certain additional property currently held by the Company under valid mining claims. There can be no assurance that these surface leases will be forthcoming.
Argentina
The Company holds a 100% interest in nine mining concessions and holds options on five other mining concessions associated with the Altar project in Argentina. Several of these concessions require that the Company meet periodic option payments, minimum exploration expenditure commitments, or both. Failure to meet these minimum obligations could result in the forfeiture of such concessions. Future mining on these properties will require securing mining permits and obtaining control of surface rights on these properties. There is no guarantee that the Company will be able to secure these permits or purchase the surface rights on acceptable terms.
THE PROCESS OF UPGRADING ORE THROUGH THE CONCENTRATOR, SMELTING AND REFINING STAGES ADDS ENVIRONMENTAL RISKS
The Company’s processing facilities include concentrators at each mine site that grind the ore and extract the contained metal sulfides, and a smelter and base metal refinery located in Columbus, Montana. These processes ultimately produce a PGM filter cake that is shipped for final refining to third party refiners. The Columbus operations involve pyrometallurgical and hydrometallurgical processes that utilize high temperatures, pressures, caustic chemicals and acids to extract PGMs and other metals from the concentrates. These processes also generate waste gases that are scrubbed to eliminate sulfur dioxide emissions. While the environmental and safety performance of these facilities to date has been outstanding, there can be no assurance that incidents such as solution spills, sulfur dioxide discharges, explosions or accidents involving hot metals and product spills in transportation will not occur in the future. Such incidents potentially could result in more stringent environmental or operating restrictions on these facilities and additional expenses to the Company, which could have a negative impact on its results of operations and cash flows. Further, the Company processes virtually all of its metals through these processing facilities, and any incident interrupting processing operations for an extended period would have a material adverse effect on the Company’s performance.
THE COMPANY IS SUBJECT TO INCOME TAXES IN VARIOUS JURISDICTIONS; INCOME TAX STRUCTURES ARE SUBJECT TO CHANGES THAT COULD INCREASE THE COMPANY’S EFFECTIVE TAX RATE
In the U.S., the Company enjoys certain beneficial tax provisions afforded to natural resource companies that have the effect of reducing the Company’s overall effective tax rate. Preliminary discussions in the U.S. Congress with regard to restructuring the corporate income tax include consideration of reducing or eliminating some or all of these preferential benefits. While it is not possible at this time to predict the direction such changes might ultimately take, if such changes were enacted they could increase the effective tax rate paid by the Company for federal and state income taxes.
Outside the U.S., the Company currently has no operating income. However, the economics of potential future mine developments in Canada and Argentina are sensitive to income tax costs, and unfavorable legislated changes to income tax structures in those countries could render the respective projects uneconomic and compel the Company to defer development or write off its investment in them.
THE MARATHON ACQUISITION INTRODUCES SIGNIFICANT NEW UNCERTAINTIES AS TO THE COMPANY’S FUTURE PERFORMANCE AND COMMITMENTS
The Company’s Marathon assets, although perceived by the Company as an attractive opportunity, introduce a number of significant risks, all of which must be managed and all or any combination of which could create difficulties for the Company in the future. Among these risks, many of which are not yet fully defined, are the following:
| |
| • | Remaining uncertainty as to the ultimate extent, quality, final grade, mineability and appropriate concentrator technology for the Marathon resource; |
| |
| • | Lack of a final engineering study to better gauge the capital cost of installing the mine, the equipment required and its availability, the timing of the construction, and access to local infrastructure in support of a future operation; |
| |
| • | Uncertainty as to future PGM and copper prices, which could significantly affect the financial viability of the proposed Marathon development; |
| |
| • | Need for employees to manage the project and to staff the mining operations, their numbers, required skill sets and availability; |
| |
| • | Negotiation of terms for a processing agreement with a third-party copper smelter to take the concentrates produced by the Marathon operations; |
| |
| • | Ability to complete project permitting in coordination with the various responsible agencies and affected groups within an acceptable time frame; |
| |
| • | Agreement with the Aboriginal and non-native communities in the region; |
| |
| • | Ability to source or acquire the required mine and mill equipment on a timely basis; |
| |
| • | Availability of required financing for the Marathon project, internally and/or externally; |
| |
| • | Future significant exposure to exchange rate risk between the Canadian dollar and the U.S. dollar; and |
| |
| • | Other factors involving the integration of Marathon into the Company, including various legal, accounting, tax and human resource matters. |
While the Company believes to the extent possible it is addressing each of these areas of risk, there can be no assurance that unforeseen matters may not arise that would adversely affect the Company’s ability to effectively manage and develop its Canadian prospects.
THE PEREGRINE ACQUISITION RAISES ADDITIONAL UNCERTAINTIES AS TO THE COMPANY’S FUTURE PERFORMANCE AND COMMITMENTS
The Company’s acquisition of Peregrine in 2011 also introduces a number of significant risks. All or any combination of these could create problems for the Company in the future. Among these risks, many of which are not yet fully defined, are the following:
| |
| • | Significant uncertainty as to the ultimate extent, quality, final grade and economic viability of the Argentine resources; |
| |
| • | Lack of clarity on the capital cost of any future development in Argentina including associated infrastructure required; the total cost to develop Altar is likely to be much larger than the Company’s current total market capitalization; |
| |
| • | Uncertainty as to the ultimate ability to economically beneficiate the Altar minerals; |
| |
| • | Uncertainty as to future precious metal and copper prices, which could significantly affect the financial viability of any future Argentine development; |
| |
| • | The need to acquire a skilled workforce to manage the property and its future development and operation; |
| |
| • | Lack of firm, economically viable arrangements for processing concentrates produced by the Argentine operations; |
| |
| • | Need to establish an effective community relations function to oversee property issues, permitting, environmental concerns and corporate relations; |
| |
| • | Ability to source or acquire the required equipment on a timely basis and meet the significant infrastructure needs that will support a future project; |
| |
| • | Arrangement of the required financing for exploration and project development, whether internal or external, including appropriate currency provisions; |
| |
| • | Future significant exposure to exchange rate risk, particularly in view of Argentina’s high inflation rate; |
| |
| • | Recent political events that have resulted in certain Argentine assets being nationalized and complicated the ability to move funds in and out of the country; and |
| |
| • | Other factors involving the integration of Peregrine Metals Ltd. into the Company, including various legal, accounting, political, tax and human resource matters. |
While the Company believes to the extent possible it is addressing each of these areas of risk, there can be no assurance that unforeseen matters may not arise that would adversely affect the Company’s ability to effectively manage and develop its Argentine prospects.
THE COMPANY MAY EXPERIENCE POLITICAL RISKS IN ITS FOREIGN OPERATIONS
The Company recently acquired Marathon and Peregrine which represent significant development properties in Canada and Argentina, respectively. The Company has no prior experience operating in foreign countries. The process of obtaining the requisite permits and approvals for drilling and development may subject the Company to issues, costs and delays which were not previously anticipated. Further, government regulations and actions, including increased taxes, expropriation and requirements for government or local ownership could materially affect a project.
ITEM 3
LEGAL PROCEEDINGS
The Company is involved in various claims and legal actions arising in the ordinary course of business, primarily employee lawsuits and employee injury claims. In the opinion of management, the ultimate disposition of these types of matters is not expected to have a material adverse effect on the Company’s consolidated financial position, results of operations or liquidity.
ITEM 4
MINE SAFETY DISCLOSURE
Valuing the people in the Company's workforce means being committed to their safety and well-being. The Company's goal is that “Everyone Goes Home Safe - Every Day”. Integrating leadership and culture to improve safety performance, the Company's safety system includes incidence tracking and analysis, near miss reporting, hazard recognition and workplace start-of-shift inspections, team safety meetings, annual refresher training, task training, standard operating procedures training, safety sweeps, audits and stand-downs and financial incentives for working safely. The Company works closely with Mine Safety and Health Administration (MSHA), inspectors to act on their findings and incorporate their suggestions. Management also strives to maintain a consistent “tone at the top” that gives working safely priority over all other Company objectives.
Under the recently enacted Dodd-Frank Act, each operator of a coal or other mine is required to include certain mine safety results within its periodic reports filed with the Securities and Exchange Commission. In accordance with the reporting requirements included in Section 1503(a) of the Dodd-Frank Wall Street Reform and Consumer Protection Act and Item 104 of
Regulation S-K (17 CFR 229.104), the required mine safety results regarding certain mining safety and health matters for each of the Company’s mine locations that are covered under the scope of the Dodd-Frank Act are included in Exhibit 95 of this 2012 Annual Report on Form 10-K. In 2012, the Company received a total of 89 violations of mandatory health or safety standards that could significantly and substantially contribute to the cause and effect of a coal or other mine safety or health hazard under section 104 of the Federal Mine Safety and Health Act. See Exhibit 95 “Mine Safety Disclosures” of the Company’s 2012 Annual Report on Form 10-K for more information.
PART II
ITEM 5
MARKET FOR REGISTRANT’S COMMON EQUITY, RELATED STOCKHOLDER MATTERS AND ISSUER PURCHASES OF EQUITY SECURITIES
PRICE RANGE OF COMMON STOCK
The Company's common stock began trading on the New York Stock Exchange in 1997 under the symbol “SWC.” The following table sets forth, for the periods indicated, the high and low sales price per share of the Company's common stock. The Company has never declared or paid a cash dividend on its common stock and has no current intention to do so in the foreseeable future.
|
| | | | | | | | |
| | | Sales Price per Share |
| | | High | | Low |
| 2011 | | | | |
| First Quarter | | $ | 25.90 |
| | $ | 19.4 |
|
| Second Quarter | | 24.34 |
| | 17.16 |
|
| Third Quarter | | 24.04 |
| | 8.26 |
|
| Fourth Quarter | | 12.88 |
| | 7.31 |
|
| 2012 | | | | |
| First Quarter | | $ | 15.24 |
| | $ | 10.72 |
|
| Second Quarter | | 13.23 |
| | 7.77 |
|
| Third Quarter | | 14.07 |
| | 7.47 |
|
| Fourth Quarter | | 12.91 |
| | 10.05 |
|
The Company's common stock began trading on the Toronto Stock Exchange (TSX) in 2011 under the symbol “SWC.U.” The following table sets forth, for the periods indicated, the high and low sales price per share of the Company's common stock on the TSX.
|
| | | | | | | | |
| | | Sales Price per Share (in Canadian dollars) |
| | | High | | Low |
| 2011 | | | | |
| Third Quarter | | $ | 15.56 |
| | $ | 8.53 |
|
| Fourth Quarter | | 12.49 |
| | 8.07 |
|
| 2012 | | | | |
| First Quarter | | $ | 15.21 |
| | $ | 12.08 |
|
| Second Quarter | | 13.15 |
| | 7.77 |
|
| Third Quarter | | 13.85 |
| | 7.53 |
|
| Fourth Quarter | | 12.90 |
| | 10.00 |
|
On October 17, 2012, the Company completed an additional issuance of $396.75 million of 1.75% senior unsecured convertible debentures, due October 15, 2032. Credit Suisse Securities (USA) LLC and Wells Fargo Securities, LLC acted as
representatives of the underwriters. Each $1,000 principal amount of these new debentures is initially convertible, under certain circumstances and during certain periods, into 60.4961 shares (subject to customary anti-dilution adjustments) of the Company's common stock, which represents an initial conversion price of $16.53 per share. The debentures also include an embedded conversion enhancement feature that is equivalent to including with each debenture a warrant initially exercisable for 30.2481 shares initially at $16.53 per share (both subject to customary anti-dilution adjustments). The Company, at its election, may settle conversions of the debentures in cash, shares of its common stock or any combination of cash and shares of its common stock. Debenture holders have the right to redeem their debentures (at face value plus accrued and unpaid interest up to, but excluding, the relevant repurchase date) on October 15 of each of 2019, 2024, 2029, and upon the occurrence of certain corporate events. The Company will have the right to call the debentures at any time on or after October 20, 2019. The debentures were bifurcated under U.S. GAAP into separate debt and equity components, and reflect an effective maturity (to the first optional redemption date) of seven years. The residual amount recorded within equity is treated for accounting purposes as additional debt discount and accreted as an additional non-cash interest charge to earnings over the expected life. Debt and equity issuance costs totaling about $12.4 million were deducted from the gross proceeds and the debt discount is being amortized ratably over 84 months. Net proceeds of the offering will be used to retire the Company's $166.5 million of outstanding 1.875% convertible debentures upon their expected redemption in March of 2013, and for general corporate purposes.
PERFORMANCE GRAPH
The following chart compares the yearly percentage change in the Company’s cumulative total stockholder return on Common Stock, with the cumulative total return on the following indices, assuming an initial investment of $100 on December 31, 2007 and the reinvestment of all dividends: (i) the Russell 2000 and (ii) the Peer Group. The performance shown is not necessarily indicative of future performance.
Cumulative Total Return
|
| | | | | | | | | | | | | | | | | | | |
| | 12/31/2008 | | 12/31/2009 | | 12/31/2010 | | 12/31/2011 | | 12/31/2012 |
| Stillwater Mining Company | $ | 51.14 |
| | $ | 98.14 |
| | $ | 221.01 |
| | $ | 108.28 |
| | $ | 132.30 |
|
| Russell 2000 | 66.21 |
| | 84.20 |
| | 106.82 |
| | 102.36 |
| | 119.09 |
|
| Peer Group | 39.81 |
| | 76.07 |
| | 87.06 |
| | 51.82 |
| | 44.66 |
|
Notwithstanding anything to the contrary set forth in any of the Company’s previous or future filings made under the Securities Act of 1933, as amended, or the Exchange Act that might incorporate this report or future filings made by the Company under those statutes, the preceding stock performance graph is not to be incorporated by reference into any such prior filings, nor shall such graph or report be incorporated by reference into any future filings made by the Company under those statutes. The Peer Group referenced above includes Stillwater Mining Company, Anglo American Platinum Limited, Impala Platinum Holdings Limited, Lonmin PLC, and North American Palladium Limited.
ITEM 6
SELECTED FINANCIAL DATA
|
| | | | | | | | | | | | | | | | | | | | |
| (In thousands, except per share and current ratio data) | | 2012 | | 2011 | | 2010 | | 2009 | | 2008 |
| INCOME STATEMENT DATA | | | | | | | | | | |
| Revenues | | | | | | | | | | |
| Mine production | | $ | 455,426 |
| | $ | 528,007 |
| | $ | 381,044 |
| | $ | 306,892 |
| | $ | 360,364 |
|
| PGM recycling | | 344,818 |
| | 376,820 |
| | 168,612 |
| | 81,788 |
| | 475,388 |
|
| Other | | — |
| | 1,142 |
| | 6,222 |
| | 5,752 |
| | 19,980 |
|
| Total revenues | | $ | 800,244 |
| | $ | 905,969 |
| | $ | 555,878 |
| | $ | 394,432 |
| | $ | 855,732 |
|
| Costs and Expenses | | | | | | | | | | |
| Costs of metals sold: | | | | | | | | | | |
| Mine production | | 288,922 |
| | 269,573 |
| | 229,986 |
| | 209,140 |
| | 283,793 |
|
| PGM recycling | | 334,949 |
| | 358,566 |
| | 157,310 |
| | 75,920 |
| | 448,351 |
|
| Other | | — |
| | 1,141 |
| | 6,379 |
| | 5,741 |
| | 19,892 |
|
| Total costs of metals sold | | 623,871 |
| | 629,280 |
| | 393,675 |
| | 290,801 |
| | 752,036 |
|
| Depletion, depreciation and amortization | | | | | | | | | | |
| Mine production | | 56,960 |
| | 61,312 |
| | 71,121 |
| | 70,239 |
| | 82,792 |
|
| PGM recycling | | 1,055 |
| | 1,066 |
| | 472 |
| | 178 |
| | 192 |
|
| Total depletion, depreciation and amortization | | 58,015 |
| | 62,378 |
| | 71,593 |
| | 70,417 |
| | 82,984 |
|
| General and administrative | | 40,948 |
| | 42,072 |
| | 33,016 |
| | 25,080 |
| | 26,712 |
|
| Impairment of property, plant and equipment | | — |
| | — |
| | — |
| | — |
| | 67,254 |
|
| Operating income (loss) | | $ | 43,636 |
| | $ | 155,206 |
| | $ | 54,712 |
| | $ | 4,288 |
| | $ | (117,358 | ) |
| Induced conversion loss | | $ | — |
| | $ | — |
| | $ | — |
| | $ | (8,097 | ) | | $ | — |
|
| Total income tax benefit (provision) | | $ | 4,039 |
| | $ | (11,235 | ) | | $ | — |
| | $ | 30 |
| | $ | 32 |
|
| Net income (loss) | | $ | 54,416 |
| | $ | 144,295 |
| | $ | 50,365 |
| | $ | (8,655 | ) | | $ | (115,797 | ) |
| Net unrealized gains/(losses) on securities available-for-sale | | $ | 862 |
| | $ | (109 | ) | | $ | (762 | ) | | $ | 70 |
| | $ | 5,865 |
|
| Comprehensive income (loss) attributable to common stockholders | | $ | 55,907 |
| | $ | 144,186 |
| | $ | 49,603 |
| | $ | (8,585 | ) | | $ | (109,932 | ) |
| Weighted average common shares outstanding | | | | | | | | | | |
| Basic | | 116,162 |
| | 105,846 |
| | 97,967 |
| | 94,852 |
| | 93,025 |
|
| Diluted | | 131,441 |
| | 113,946 |
| | 99,209 |
| | 94,852 |
| | 93,025 |
|
| Basic earnings (loss) per share attributable to common stockholders | | $ | 0.47 |
| | $ | 1.36 |
| | $ | 0.51 |
| | $ | (0.09 | ) | | $ | (1.24 | ) |
| Diluted earnings (loss) per share attributable to common stockholders | | $ | 0.46 |
| | $ | 1.30 |
| | $ | 0.51 |
| | $ | (0.09 | ) | | $ | (1.24 | ) |
| CASH FLOW DATA | | | | | | | | | | |
| Net cash provided by operating activities | | $ | 103,894 |
| | $ | 219,683 |
| | $ | 123,897 |
| | $ | 59,672 |
| | $ | 114,243 |
|
| Net cash used in investing activities | | $ | (324,808 | ) | | $ | (129,593 | ) | | $ | (272,034 | ) | | $ | (54,723 | ) | | $ | (74,567 | ) |
| Net cash provided by (used in) financing activities | | $ | 491,497 |
| | $ | (356 | ) | | $ | 844 |
| | $ | (88 | ) | | $ | 60,683 |
|
| BALANCE SHEET DATA | | | | | | | | | | |
| Cash and cash equivalents | | $ | 379,680 |
| | $ | 109,097 |
| | $ | 19,363 |
| | $ | 166,656 |
| | $ | 161,795 |
|
| Investments, at fair market value | | $ | 261,983 |
| | $ | 49,533 |
| | $ | 188,988 |
| | $ | 34,515 |
| | $ | 18,994 |
|
| Inventories | | $ | 153,208 |
| | $ | 131,856 |
| | $ | 101,806 |
| | $ | 88,967 |
| | $ | 72,038 |
|
| Total current assets | | $ | 852,862 |
| | $ | 325,926 |
| | $ | 349,367 |
| | $ | 319,021 |
| | $ | 282,395 |
|
| Mineral properties and mine development, net | | $ | 899,225 |
| | $ | 865,034 |
| | $ | 428,983 |
| | $ | 266,982 |
| | $ | 285,017 |
|
| Property, plant and equipment, net | | $ | 122,677 |
| | $ | 99,379 |
| | $ | 80,804 |
| | $ | 91,884 |
| | $ | 108,395 |
|
| Total assets | | $ | 1,890,763 |
| | $ | 1,327,324 |
| | $ | 909,470 |
| | $ | 725,195 |
| | $ | 722,889 |
|
| Current portion of long-term debt and capital lease obligations | | $ | 168,432 |
| | $ | — |
| | $ | — |
| | $ | — |
| | $ | 97 |
|
| Total current liabilities | | $ | 246,848 |
| | $ | 74,335 |
| | $ | 58,202 |
| | $ | 49,476 |
| | $ | 55,108 |
|
| Long-term debt and capital lease obligations | | $ | 292,685 |
| | $ | 196,046 |
| | $ | 196,010 |
| | $ | 195,977 |
| | $ | 210,947 |
|
| Total liabilities | | $ | 758,183 |
| | $ | 483,356 |
| | $ | 326,398 |
| | $ | 278,384 |
| | $ | 301,735 |
|
| Stockholders’ equity | | $ | 1,080,819 |
| | $ | 843,968 |
| | $ | 583,072 |
| | $ | 446,811 |
| | $ | 421,154 |
|
| Working capital | | $ | 606,014 |
| | $ | 251,591 |
| | $ | 291,165 |
| | $ | 269,545 |
| | $ | 227,287 |
|
| Current ratio | | 3.5 | | 4.4 |
| | 6.0 | | 6.4 | | 5.1 |
SELECTED FINANCIAL DATA (Continued) |
| | | | | | | | | | | | | | | | | | | | |
| (In thousands, except per ounce and per ton costs) | | 2012 | | 2011 | | 2010 | | 2009 | | 2008 |
| OPERATING AND COST DATA FOR MINE PRODUCTION | | | | | | | | | | |
| Consolidated: | | | | | | | | | | |
| Ounces produced: | | | | | | | | | | |
| Palladium | | 396 |
| | 399 |
| | 374 |
| | 407 |
| | 384 |
|
| Platinum | | 118 |
| | 119 |
| | 111 |
| | 123 |
| | 115 |
|
| Total | | 514 |
| | 518 |
| | 485 |
| | 530 |
| | 499 |
|
| Tons milled | | 1081 |
| | 1,131 |
| | 1,095 |
| | 1,086 |
| | 1,060 |
|
| Mill head grade (ounce per ton) | | 0.51 |
| | 0.49 | | 0.48 | | 0.52 | | 0.50 |
| Sub-grade tons milled (1) | | 69 |
| | 79 |
| | 86 |
| | 98 |
| | 146 |
|
| Sub-grade mill head grade (ounce per ton) | | 0.16 |
| | 0.17 | | 0.17 | | 0.20 | | 0.17 |
| Total tons milled (1) | | 1,150 |
| | 1,210 |
| | 1,181 |
| | 1,184 |
| | 1,206 |
|
| Combined mill head grade (ounce per ton) | | 0.49 |
| | 0.47 | | 0.46 | | 0.50 | | 0.46 |
| Total mill recovery (%) | | 92 |
| | 91 |
| | 91 |
| | 91 |
| | 91 |
|
| Total operating costs per ounce (Non-GAAP) (2) | | $ | 407 |
| | $ | 327 |
| | $ | 331 |
| | $ | 310 |
| | $ | 336 |
|
| Total cash costs per ounce (Non-GAAP) (2) | | $ | 484 |
| | $ | 420 |
| | $ | 397 |
| | $ | 360 |
| | $ | 405 |
|
| Total production costs per ounce (Non-GAAP) (2) | | $ | 599 |
| | $ | 532 |
| | $ | 546 |
| | $ | 495 |
| | $ | 569 |
|
| Total operating costs per ton milled (Non-GAAP) (2) | | $ | 182 |
| | $ | 140 |
| | $ | 136 |
| | $ | 139 |
| | $ | 139 |
|
| Total cash costs per ton milled (Non-GAAP) (2) | | $ | 216 |
| | $ | 180 |
| | $ | 163 |
| | $ | 161 |
| | $ | 167 |
|
| Total production costs per ton milled (Non-GAAP) (2) | | $ | 267 |
| | $ | 228 |
| | $ | 224 |
| | $ | 222 |
| | $ | 236 |
|
| Stillwater Mine: | | | | | | | | | | |
| Ounces produced: | | | | | | | | | | |
| Palladium | | 290 |
| | 297 |
| | 271 |
| | 302 |
| | 268 |
|
| Platinum | | 88 |
| | 90 |
| | 81 |
| | 92 |
| | 81 |
|
| Total | | 378 |
| | 387 |
| | 352 |
| | 394 |
| | 349 |
|
| Tons milled | | 673 |
| | 736 |
| | 713 |
| | 727 |
| | 690 |
|
| Mill head grade (ounce per ton) | | 0.60 |
| | 0.56 | | 0.53 | | 0.58 | | 0.54 |
| Sub-grade tons milled (1) | | 36 |
| | 57 |
| | 68 |
| | 50 |
| | 78 |
|
| Sub-grade mill head grade (ounce per ton) | | 0.21 |
| | 0.20 | | 0.18 | | 0.20 | | 0.16 |
| Total tons milled (1) | | 709 |
| | 793 |
| | 781 |
| | 777 |
| | 768 |
|
| Combined mill head grade (ounce per ton) | | 0.58 |
| | 0.53 | | 0.50 | | 0.56 | | 0.51 |
| Total mill recovery (%) | | 92 |
| | 92 |
| | 92 |
| | 92 |
| | 91 |
|
| Total operating costs per ounce (Non-GAAP) (2) | | $ | 384 |
| | $ | 313 |
| | $ | 317 |
| | $ | 297 |
| | $ | 318 |
|
| Total cash costs per ounce (Non-GAAP) (2) | | $ | 456 |
| | $ | 401 |
| | $ | 380 |
| | $ | 344 |
| | $ | 383 |
|
| Total production costs per ounce (Non-GAAP) (2) | | $ | 575 |
| | $ | 520 |
| | $ | 524 |
| | $ | 469 |
| | $ | 521 |
|
| Total operating costs per ton milled (Non-GAAP) (2) | | $ | 205 |
| | $ | 153 |
| | $ | 143 |
| | $ | 150 |
| | $ | 144 |
|
| Total cash costs per ton milled (Non-GAAP) (2) | | $ | 243 |
| | $ | 195 |
| | $ | 171 |
| | $ | 174 |
| | $ | 174 |
|
| Total production costs per ton milled (Non-GAAP) (2) | | $ | 306 |
| | $ | 253 |
| | $ | 236 |
| | $ | 238 |
| | $ | 237 |
|
| East Boulder Mine: | | | | | | | | | | |
| Ounces produced: | | | | | | | | | | |
| Palladium | | 106 |
| | 102 |
| | 103 |
| | 105 |
| | 116 |
|
| Platinum | | 30 |
| | 29 |
| | 30 |
| | 31 |
| | 34 |
|
| Total | | 136 |
| | 131 |
| | 133 |
| | 136 |
| | 150 |
|
| Tons milled | | 408 |
| | 395 |
| | 382 |
| | 359 |
| | 370 |
|
| Mill head grade (ounce per ton) | | 0.37 |
| | 0.37 | | 0.39 | | 0.40 | | 0.42 |
| Sub-grade tons milled (1) | | 33 |
| | 22 |
| | 18 |
| | 48 |
| | 68 |
|
| Sub-grade mill head grade (ounce per ton) | | 0.10 |
| | 0.10 | | 0.15 | | 0.20 | | 0.19 |
| Total tons milled (1) | | 441 |
| | 417 |
| | 400 |
| | 407 |
| | 438 |
|
| Combined mill head grade (ounce per ton) | | 0.35 |
| | 0.35 | | 0.37 | | 0.38 | | 0.38 |
| Total mill recovery (%) | | 90 |
| | 89 |
| | 89 |
| | 89 |
| | 90 |
|
| Total operating costs per ounce (Non-GAAP) (2) | | $ | 470 |
| | $ | 368 |
| | $ | 368 |
| | $ | 347 |
| | $ | 378 |
|
| Total cash costs per ounce (Non-GAAP) (2) | | $ | 562 |
| | $ | 475 |
| | $ | 442 |
| | $ | 407 |
| | $ | 456 |
|
| Total production costs per ounce (Non-GAAP) (2) | | $ | 666 |
| | $ | 569 |
| | $ | 604 |
| | $ | 572 |
| | $ | 682 |
|
| Total operating costs per ton milled (Non-GAAP) (2) | | $ | 145 |
| | $ | 116 |
| | $ | 123 |
| | $ | 116 |
| | $ | 130 |
|
| Total cash costs per ton milled (Non-GAAP) (2) | | $ | 174 |
| | $ | 150 |
| | $ | 147 |
| | $ | 136 |
| | $ | 156 |
|
| Total production costs per ton milled (Non-GAAP) (2) | | $ | 206 |
| | $ | 179 |
| | $ | 201 |
| | $ | 191 |
| | $ | 234 |
|
SELECTED FINANCIAL DATA (Continued)
|
| | | | | | | | | | | | | | | | | | | | |
| (In thousands, where noted) | | 2012 | | 2011 | | 2010 | | 2009 | | 2008 |
| SALES AND PRICE DATA | | | | | | | | | | |
| Ounces sold (000) | | | | | | | | | | |
| Mine production: | | | | | | | | | | |
| Palladium (oz.) | | 386 |
| | 402 |
| | 377 |
| | 393 |
| | 399 |
|
| Platinum (oz.) | | 114 |
| | 114 |
| | 112 |
| | 123 |
| | 115 |
|
| Total | | 500 |
| | 516 |
| | 489 |
| | 516 |
| | 514 |
|
| PGM recycling: (5) | | | | | | | | | | |
| Palladium (oz.) | | 192 |
| | 169 |
| | 81 |
| | 53 |
| | 119 |
|
| Platinum (oz.) | | 119 |
| | 114 |
| | 62 |
| | 40 |
| | 131 |
|
| Rhodium (oz.) | | 25 |
| | 23 |
| | 13 |
| | 9 |
| | 25 |
|
| Total | | 336 |
| | 306 |
| | 156 |
| | 102 |
| | 275 |
|
| Other: (6) | | | | | | | | | | |
| Palladium (oz.) | | — |
| | — |
| | 13 |
| | 12 |
| | 49 |
|
| Platinum (oz.) | | — |
| | 1 |
| | — |
| | 3 |
| | — |
|
| Total | | — |
| | 1 |
| | 13 |
| | 15 |
| | 49 |
|
| By-products from mining: (7) | | | | | | | | | | |
| Rhodium (oz.) | | 4 |
| | 5 |
| | 2 |
| | 4 |
| | 2 |
|
| Gold (oz.) | | 9 |
| | 9 |
| | 9 |
| | 9 |
| | 9 |
|
| Silver (oz.) | | 6 |
| | 6 |
| | 5 |
| | 6 |
| | 10 |
|
| Copper (lb.) | | 742 |
| | 788 |
| | 824 |
| | 776 |
| | 940 |
|
| Nickel (lb.) | | 1,120 |
| | 1,263 |
| | 1,157 |
| | 856 |
| | 932 |
|
| Average realized price per ounce (3) | | | | | | | | | | |
| Mine production: | | | | | | | | | | |
| Palladium ($/oz.) | | $ | 641 |
| | $ | 739 |
| | $ | 495 |
| | $ | 365 |
| | $ | 410 |
|
| Platinum ($/oz.) | | $ | 1,551 |
| | $ | 1,705 |
| | $ | 1,488 |
| | $ | 1,137 |
| | $ | 1,387 |
|
| Combined ($/oz.) (4) | | $ | 849 |
| | $ | 953 |
| | $ | 721 |
| | $ | 549 |
| | $ | 630 |
|
| PGM recycling: (5) | | | | | | | | | | |
| Palladium ($/oz.) | | $ | 645 |
| | $ | 736 |
| | $ | 456 |
| | $ | 282 |
| | $ | 401 |
|
| Platinum ($/oz.) | | $ | 1,542 |
| | $ | 1,757 |
| | $ | 1,539 |
| | $ | 1,143 |
| | $ | 1,735 |
|
| Rhodium ($/oz.) | | $ | 1,377 |
| | $ | 2,098 |
| | $ | 2,354 |
| | $ | 2,088 |
| | $ | 7,807 |
|
| Combined ($/oz.) (4) | | $ | 1,018 |
| | $ | 1,218 |
| | $ | 1,046 |
| | $ | 778 |
| | $ | 1,716 |
|
| Other: (6) | | | | | | | | | | |
| Palladium ($/oz.) | | $ | — |
| | $ | — |
| | $ | 479 |
| | $ | 213 |
| | $ | 409 |
|
| Platinum ($/oz.) | | $ | — |
| | $ | 1,774 |
| | $ | — |
| | $ | 1,041 |
| | $ | — |
|
| By-products from mining: (7) | | | | | | | | | | |
| Rhodium ($/oz.) | | $ | 1,258 |
| | $ | 1,668 |
| | $ | 2,503 |
| | $ | 1,543 |
| | $ | 7,939 |
|
| Gold ($/oz.) | | $ | 1,667 |
| | $ | 1,563 |
| | $ | 1,223 |
| | $ | 983 |
| | $ | 877 |
|
| Silver ($/oz.) | | $ | 31 |
| | $ | 35 |
| | $ | 19 |
| | $ | 15 |
| | $ | 14 |
|
| Copper ($/lb.) | | $ | 3.42 |
| | $ | 3.82 |
| | $ | 3.24 |
| | $ | 2.14 |
| | $ | 2.94 |
|
| Nickel ($/lb.) | | $ | 6.74 |
| | $ | 9.03 |
| | $ | 8.74 |
| | $ | 7.48 |
| | $ | 9.72 |
|
| Average market price per ounce (4) | | | | | | | | | | |
| Palladium ($/oz.) | | $ | 643 |
| | $ | 734 |
| | $ | 525 |
| | $ | 263 |
| | $ | 352 |
|
| Platinum ($/oz.) | | $ | 1,551 |
| | $ | 1,722 |
| | $ | 1,609 |
| | $ | 1,204 |
| | $ | 1,578 |
|
| Combined ($/oz.) (4) | | $ | 850 |
| | $ | 952 |
| | $ | 773 |
| | $ | 487 |
| | $ | 628 |
|
| |
| (1) | Sub-grade tons milled includes reef waste material only. Total tons milled includes ore tons and sub-grade tons only. |
| |
| (2) | Total operating costs include cash costs of mining, processing and administrative expenses at the mine site (including mine site overhead and credits for metals produced other than palladium and platinum from mine production). Total cash costs include total operating costs plus royalties, insurance and taxes other than income taxes. Total production costs include total cash costs plus the following non-cash items: asset retirement costs and depletion, depreciation and amortization. Income taxes, corporate general and administrative expenses, asset impairment write-downs, gain or loss on disposal of property, plant and equipment, restructuring costs, interest income and expense are not included in total operating costs, total cash costs or total production costs. Operating costs per ton, operating costs per ounce, cash costs per ton, cash costs per ounce, production costs per ton and production costs per ounce are non-GAAP measurements that management uses to monitor and evaluate the efficiency of its mining operations. These measures of |
cost are not defined under U.S. Generally Accepted Accounting Principles (GAAP). Please see “Reconciliation of Non-GAAP Measures to Costs of Revenues” and the accompanying discussion for additional detail.
| |
| (3) | The Company’s average realized price represents revenues, which include the effect of any applicable agreement floor and ceiling prices, hedging gains and losses realized on commodity instruments and agreement discounts, divided by ounces sold. The average market price represents the average London Bullion Market Association afternoon postings for the actual months of the period. |
| |
| (4) | The Company reports a combined average realized and market price of palladium and platinum at the same ratio as ounces that are produced from the base metal refinery. |
| |
| (5) | Ounces sold and average realized price per ounce from PGM recycling relate to ounces produced from processing of spent catalyst materials. |
| |
| (6) | Ounces sold and average realized price per ounce from Other relate to ounces purchased in the open market for resale. |
| |
| (7) | By-product metals sold reflect contained metal. Realized prices reflect net values (discounted due to product form and transportation and marketing charges) per unit received. |
RECONCILIATION OF NON-GAAP MEASURES TO COSTS OF REVENUES
The Company utilizes certain non-GAAP measures as indicators in assessing the performance of its mining and processing operations during any period. Because of the processing time required to complete the extraction of finished PGM products, there are typically lags of one to three months between ore production and sale of the finished product. Sales in any period include some portion of material mined and processed from prior periods as the revenue recognition process is completed. Consequently, while costs of revenues (a GAAP measure included in the Company’s Consolidated Statements of Operations and Comprehensive Income) appropriately reflects the expense associated with the materials sold in any period, the Company has developed certain non-GAAP measures to assess the costs associated with its producing and processing activities in a particular period and to compare those costs between periods.
While the Company believes that these non-GAAP measures may also be of value to outside readers, both as general indicators of the Company’s mining efficiency from period to period and as insight into how the Company internally measures its operating performance, these non-GAAP measures are not standardized across the mining industry and in most cases will not be directly comparable to similar measures that may be provided by other companies. These non-GAAP measures are only useful as indicators of relative operational performance in any period, and because they do not take into account the inventory timing differences that are included in costs of revenues, they cannot meaningfully be used to develop measures of earnings or profitability. A reconciliation of these measures to costs of revenues for each period shown is provided as part of the following tables, and a description of each non-GAAP measure is provided below.
Total Costs of Revenues: For the Company as a whole, this measure is equal to total costs of revenues, as reported in the Consolidated Statements of Operations and Comprehensive Income. For the Stillwater Mine, the East Boulder Mine, and other PGM activities, the Company segregates the expenses within total costs of revenues that are directly associated with each of these activities and then allocates the remaining facility costs included in total cost of revenues in proportion to the monthly volumes from each activity. The resulting total costs of revenues measures for the Stillwater Mine, the East Boulder Mine and other PGM activities are equal in total to total costs of revenues as reported in the Company’s Consolidated Statements of Operations and Comprehensive Income.
Total Production Costs (Non-GAAP): Calculated as total costs of revenues (for each mine or combined) adjusted to exclude gains or losses on asset dispositions, costs and profit from recycling activities, revenues from the sale of mined by-products and timing differences resulting from changes in product inventories. This non-GAAP measure provides a comparative measure of the total costs incurred in association with production and processing activities in a period, and may be compared to prior periods or between the Company’s mines.
When divided by the total tons milled in the respective period, Total Production Cost per Ton Milled (Non-GAAP) – measured for each mine or combined – provides an indication of the cost per ton milled in that period. Because of variability of ore grade in the Company’s mining operations, production efficiency underground is frequently measured against ore tons produced rather than contained PGM ounces. Because ore tons are first actually weighed as they are fed into the mill, mill feed is the first point at which production tons are measured precisely. Consequently, Total Production Cost per Ton Milled (Non-GAAP) is a general measure of production efficiency, and is affected both by the level of Total Production Costs (Non-GAAP) and by the volume of tons produced and fed to the mill.
When divided by the total recoverable PGM ounces from production in the respective period, Total Production Cost per Ounce (Non-GAAP) – measured for each mine or combined – provides an indication of the cost per ounce produced in that period. Recoverable PGM ounces from production are an indication of the amount of PGM product extracted through mining in any period. Because extracting PGM material is ultimately the objective of mining, the cost per ounce of extracting and processing PGM ounces in a period is a useful measure for comparing extraction efficiency between periods and between the Company’s mines. Consequently, Total Production Cost per Ounce (Non-GAAP) in any period is a general measure of extraction efficiency, and is affected by the level of Total Production Costs (Non-GAAP), by the grade of the ore produced and by the volume of ore produced in the period.
Total Cash Costs (Non-GAAP): This non-GAAP measure is calculated by excluding the depreciation and amortization and asset retirement costs from Total Production Costs (Non-GAAP) for each mine or combined. The Company uses this measure as a comparative indication of the cash costs related to production and processing in any period.
When divided by the total tons milled in the respective period, Total Cash Cost per Ton Milled (Non-GAAP) – measured for each mine or combined – provides an indication of the level of cash costs incurred per ton milled in that period. Because of variability of ore grade in the Company’s mining operations, production efficiency underground is frequently measured against ore tons produced rather than contained PGM ounces. Because ore tons are first weighed as they are fed into the mill, mill feed is the first point at which production tons are measured precisely. Consequently, Total Cash Cost per Ton Milled (Non-GAAP) is a general measure of production efficiency, and is affected both by the level of Total Cash Costs (Non-GAAP) and by the volume of tons produced and fed to the mill.
When divided by the total recoverable PGM ounces from production in the respective period, Total Cash Cost per Ounce (Non-GAAP) – measured for each mine or combined – provides an indication of the level of cash costs incurred per PGM ounce produced in that period. Recoverable PGM ounces from production are an indication of the amount of PGM product extracted through mining in any period. Because ultimately extracting PGM material is the objective of mining, the cash cost per ounce of extracting and processing PGM ounces in a period is a useful measure for comparing extraction efficiency between periods and between the Company’s mines. Consequently, Total Cash Cost per Ounce (Non-GAAP) in any period is a general measure of extraction efficiency, and is affected by the level of Total Cash Costs (Non-GAAP), by the grade of the ore produced and by the volume of ore produced in the period.
Total Operating Costs (Non-GAAP): This non-GAAP measure is derived from Total Cash Costs (Non-GAAP) for each mine or combined by excluding royalty, tax and insurance expenses from Total Cash Costs (Non-GAAP). Royalties, taxes and insurance costs are contractual or governmental obligations outside of the control of the Company’s mining operations, and in the case of royalties and most taxes, are driven more by the level of sales realizations rather than by operating efficiency. Consequently, Total Operating Costs (Non-GAAP) is a useful indicator of the level of production and processing costs incurred in a period that are under the control of mining operations.
When divided by the total tons milled in the respective period, Total Operating Cost per Ton Milled (Non-GAAP) – measured for each mine or combined – provides an indication of the level of controllable cash costs incurred per ton milled in that period. Because of variability of ore grade in the Company’s mining operations, production efficiency underground is frequently measured against ore tons produced rather than contained PGM ounces. Because ore tons are first actually weighed as they are fed into the mill, mill feed is the first point at which production tons are measured precisely. Consequently, Total Operating Cost per Ton Milled (Non-GAAP) is a general measure of production efficiency, and is affected both by the level of Total Operating Costs (Non-GAAP) and by the volume of tons produced and fed to the mill.
When divided by the total recoverable PGM ounces from production in the respective period, Total Operating Cost per Ounce (Non-GAAP) – measured for each mine or combined – provides an indication of the level of controllable cash costs incurred per PGM ounce produced in that period. Recoverable PGM ounces from production are an indication of the amount of PGM product extracted through mining in any period. Because ultimately extracting PGM material is the objective of mining, the cost per ounce of extracting and processing PGM ounces in a period is a useful measure for comparing extraction efficiency between periods and between the Company’s mines. Consequently, Total Operating Cost per Ounce (Non-GAAP) in any period is a general measure of extraction efficiency, and is affected by the level of Total Operating Costs (Non-GAAP), by the grade of the ore produced and by the volume of ore produced in the period.
|
| | | | | | | | | | | | | | | | | | | | |
| (In thousands, except per ounce and per ton data) | | 2012 | | 2011 | | 2010 | | 2009 | | 2008 |
| Consolidated: | | | | | | | | | | |
| Total operating costs (Non-GAAP) | | $ | 209,069 |
| | $ | 169,375 |
| | $ | 160,738 |
| | $ | 164,142 |
| | $ | 167,660 |
|
| Total cash costs (Non-GAAP) | | $ | 248,662 |
| | $ | 217,340 |
| | $ | 192,785 |
| | $ | 190,757 |
| | $ | 201,915 |
|
| Total production costs (Non-GAAP) | | $ | 307,650 |
| | $ | 275,744 |
| | $ | 264,809 |
| | $ | 262,364 |
| | $ | 284,130 |
|
| Divided by total ounces | | 514 |
| | 518 |
| | 485 |
| | 530 |
| | 499 |
|
| Divided by total tons milled | | 1,150 |
| | 1,210 |
| | 1,181 |
| | 1,184 |
| | 1,206 |
|
| Total operating cost per ounce (Non-GAAP) | | $ | 407 |
| | $ | 327 |
| | $ | 331 |
| | $ | 310 |
| | $ | 336 |
|
| Total cash cost per ounce (Non-GAAP) | | $ | 484 |
| | $ | 420 |
| | $ | 397 |
| | $ | 360 |
| | $ | 405 |
|
| Total production cost per ounce (Non-GAAP) | | $ | 599 |
| | $ | 532 |
| | $ | 546 |
| | $ | 495 |
| | $ | 569 |
|
| Total operating cost per ton milled (Non-GAAP) | | $ | 182 |
| | $ | 140 |
| | $ | 136 |
| | $ | 139 |
| | $ | 139 |
|
| Total cash cost per ton milled (Non-GAAP) | | $ | 216 |
| | $ | 180 |
| | $ | 163 |
| | $ | 161 |
| | $ | 167 |
|
| Total production cost per ton milled (Non-GAAP) | | $ | 267 |
| | $ | 228 |
| | $ | 224 |
| | $ | 222 |
| | $ | 236 |
|
| Reconciliation to consolidated costs of revenues: | | | | | | | | | | |
| Total operating costs (Non-GAAP) | | $ | 209,069 |
| | $ | 169,375 |
| | $ | 160,738 |
| | $ | 164,142 |
| | $ | 167,660 |
|
| Royalties, taxes and other | | 39,593 |
| | 47,965 |
| | 32,047 |
| | 26,615 |
| | 34,255 |
|
| Total cash costs (Non-GAAP) | | $ | 248,662 |
| | $ | 217,340 |
| | $ | 192,785 |
| | $ | 190,757 |
| | $ | 201,915 |
|
| Asset retirement costs | | 635 |
| | 584 |
| | 538 |
| | 606 |
| | 885 |
|
| Depletion, depreciation and amortization | | 56,960 |
| | 61,312 |
| | 71,121 |
| | 70,239 |
| | 82,792 |
|
| Depletion, depreciation and amortization (in inventory) | | 1,393 |
| | (3,492 | ) | | 365 |
| | 762 |
| | (1,462 | ) |
| Total production costs (Non-GAAP) | | $ | 307,650 |
| | $ | 275,744 |
| | $ | 264,809 |
| | $ | 262,364 |
| | $ | 284,130 |
|
| Change in product inventories | | (3,452 | ) | | 903 |
| | 2,627 |
| | (6,797 | ) | | 32,916 |
|
| Cost of PGM recycling | | 334,949 |
| | 358,566 |
| | 157,310 |
| | 75,920 |
| | 448,351 |
|
| PGM recycling - depreciation | | 1,055 |
| | 1,066 |
| | 472 |
| | 178 |
| | 192 |
|
| Add: Profit from by-products | | 30,642 |
| | 35,963 |
| | 27,980 |
| | 23,645 |
| | 36,760 |
|
| Add: Profit from PGM recycling | | 11,042 |
| | 19,416 |
| | 12,070 |
| | 5,908 |
| | 32,671 |
|
| Total consolidated costs of revenues | | $ | 681,886 |
| | $ | 691,658 |
| | $ | 465,268 |
| | $ | 361,218 |
| | $ | 835,020 |
|
| Stillwater Mine: | | | | | | | | | | |
| Total operating costs (Non-GAAP) | | $ | 145,037 |
| | $ | 121,134 |
| | $ | 111,659 |
| | $ | 116,913 |
| | $ | 110,931 |
|
| Total cash costs (Non-GAAP) | | $ | 172,099 |
| | $ | 155,056 |
| | $ | 133,790 |
| | $ | 135,353 |
| | $ | 133,571 |
|
| Total production costs (Non-GAAP) | | $ | 216,940 |
| | $ | 201,212 |
| | $ | 184,226 |
| | $ | 184,614 |
| | $ | 181,812 |
|
| Divided by total ounces | | 378 |
| | 387 |
| | 352 |
| | 394 |
| | 349 |
|
| Divided by total tons milled | | 709 |
| | 794 |
| | 781 |
| | 777 |
| | 768 |
|
| Total operating cost per ounce (Non-GAAP) | | $ | 384 |
| | $ | 313 |
| | $ | 317 |
| | $ | 297 |
| | $ | 318 |
|
| Total cash cost per ounce (Non-GAAP) | | $ | 456 |
| | $ | 401 |
| | $ | 380 |
| | $ | 344 |
| | $ | 383 |
|
| Total production cost per ounce (Non-GAAP) | | $ | 575 |
| | $ | 520 |
| | $ | 524 |
| | $ | 469 |
| | $ | 521 |
|
| Total operating cost per ton milled (Non-GAAP) | | $ | 205 |
| | $ | 153 |
| | $ | 143 |
| | $ | 150 |
| | $ | 144 |
|
| Total cash cost per ton milled (Non-GAAP) | | $ | 243 |
| | $ | 195 |
| | $ | 171 |
| | $ | 174 |
| | $ | 174 |
|
| Total production cost per ton milled (Non-GAAP) | | $ | 306 |
| | $ | 253 |
| | $ | 236 |
| | $ | 238 |
| | $ | 237 |
|
| Reconciliation to costs of revenues: | | | | | | | | | | |
| Total operating costs (Non-GAAP) | | $ | 145,037 |
| | $ | 121,134 |
| | $ | 111,659 |
| | $ | 116,913 |
| | $ | 110,931 |
|
| Royalties, taxes and other | | 27,062 |
| | 33,922 |
| | 22,131 |
| | 18,440 |
| | 22,640 |
|
| Total cash costs (Non-GAAP) | | $ | 172,099 |
| | $ | 155,056 |
| | $ | 133,790 |
| | $ | 135,353 |
| | $ | 133,571 |
|
| Asset retirement costs | | 588 |
| | 541 |
| | 498 |
| | 507 |
| | 645 |
|
| Depletion, depreciation and amortization | | 43,329 |
| | 47,759 |
| | 49,309 |
| | 47,527 |
| | 47,748 |
|
| Depletion, depreciation and amortization (in inventory) | | 924 |
| | (2,144 | ) | | 629 |
| | 1,227 |
| | (152 | ) |
| Total production costs (Non-GAAP) | | $ | 216,940 |
| | $ | 201,212 |
| | $ | 184,226 |
| | $ | 184,614 |
| | $ | 181,812 |
|
| Change in product inventories | | (2,326 | ) | | (252 | ) | | (2,887 | ) | | (7,393 | ) | | 7,524 |
|
| Add: Profit from by-products | | 19,793 |
| | 23,397 |
| | 18,389 |
| | 16,521 |
| | 24,777 |
|
| Add: Profit from PGM recycling | | 8,124 |
| | 14,387 |
| | 8,733 |
| | 4,395 |
| | 21,889 |
|
| Total costs of revenues | | $ | 242,531 |
| | $ | 238,744 |
| | $ | 208,461 |
| | $ | 198,137 |
| | $ | 236,002 |
|
|
| | | | | | | | | | | | | | | | | | | | |
| (In thousands, except per ounce and per ton data) | | 2012 | | 2011 | | 2010 | | 2009 | | 2008 |
| East Boulder Mine: | | | | | | | | | | |
| Total operating costs (Non-GAAP) | | $ | 64,032 |
| | $ | 48,241 |
| | $ | 49,079 |
| | $ | 47,229 |
| | $ | 56,729 |
|
| Total cash costs (Non-GAAP) | | $ | 76,563 |
| | $ | 62,284 |
| | $ | 58,995 |
| | $ | 55,404 |
| | $ | 68,344 |
|
| Total production costs (Non-GAAP) | | $ | 90,710 |
| | $ | 74,532 |
| | $ | 80,583 |
| | $ | 77,750 |
| | $ | 102,318 |
|
| Divided by total ounces | | 136 |
| | 131 |
| | 133 |
| | 136 |
| | 150 |
|
| Divided by total tons milled | | 441 |
| | 416 |
| | 400 |
| | 407 |
| | 438 |
|
| Total operating cost per ounce (Non-GAAP) | | $ | 470 |
| | $ | 368 |
| | $ | 368 |
| | $ | 347 |
| | $ | 378 |
|
| Total cash cost per ounce (Non-GAAP) | | $ | 562 |
| | $ | 475 |
| | $ | 442 |
| | $ | 407 |
| | $ | 456 |
|
| Total production cost per ounce (Non-GAAP) | | $ | 666 |
| | $ | 569 |
| | $ | 604 |
| | $ | 572 |
| | $ | 682 |
|
| Total operating cost per ton milled (Non-GAAP) | | $ | 145 |
| | $ | 116 |
| | $ | 123 |
| | $ | 116 |
| | $ | 130 |
|
| Total cash cost per ton milled (Non-GAAP) | | $ | 174 |
| | $ | 150 |
| | $ | 147 |
| | $ | 136 |
| | $ | 156 |
|
| Total production cost per ton milled (Non-GAAP) | | $ | 206 |
| | $ | 179 |
| | $ | 201 |
| | $ | 191 |
| | $ | 234 |
|
| Reconciliation to costs of revenues: | | | | | | | | | | |
| Total operating costs (Non-GAAP) | | $ | 64,032 |
| | $ | 48,241 |
| | $ | 49,079 |
| | $ | 47,229 |
| | $ | 56,729 |
|
| Royalties, taxes and other | | 12,531 |
| | 14,043 |
| | 9,916 |
| | 8,175 |
| | 11,615 |
|
| Total cash costs (Non-GAAP) | | $ | 76,563 |
| | $ | 62,284 |
| | $ | 58,995 |
| | $ | 55,404 |
| | $ | 68,344 |
|
| Asset retirement costs | | 47 |
| | 43 |
| | 40 |
| | 99 |
| | 240 |
|
| Depletion, depreciation and amortization | | 13,631 |
| | 13,553 |
| | 21,812 |
| | 22,712 |
| | 35,044 |
|
| Depletion, depreciation and amortization (in inventory) | | 469 |
| | (1,348 | ) | | (264 | ) | | (465 | ) | | (1,310 | ) |
| Total production costs (Non-GAAP) | | $ | 90,710 |
| | $ | 74,532 |
| | $ | 80,583 |
| | $ | 77,750 |
| | $ | 102,318 |
|
| Change in product inventories | | (1,126 | ) | | 14 |
| | (865 | ) | | (5,145 | ) | | 5,500 |
|
| Add: Profit from by-products | | 10,849 |
| | 12,566 |
| | 9,591 |
| | 7,124 |
| | 11,983 |
|
| Add: Profit from PGM recycling | | 2,918 |
| | 5,029 |
| | 3,337 |
| | 1,513 |
| | 10,782 |
|
| Total costs of revenues | | $ | 103,351 |
| | $ | 92,141 |
| | $ | 92,646 |
| | $ | 81,242 |
| | $ | 130,583 |
|
| PGM recycling and Other: (1) | | | | | | | | | | |
| Reconciliation to costs of revenues: | | | | | | | | | | |
| Cost of open market purchases | | $ | — |
| | $ | 1,141 |
| | $ | 6,379 |
| | $ | 5,741 |
| | $ | 19,892 |
|
| PGM recycling - depreciation | | 1,055 |
| | 1,066 |
| | 472 |
| | 178 |
| | 192 |
|
| Cost of PGM recycling | | 334,949 |
| | 358,566 |
| | 157,310 |
| | 75,920 |
| | 448,351 |
|
| Total costs of revenues | | $ | 336,004 |
| | $ | 360,773 |
| | $ | 164,161 |
| | $ | 81,839 |
| | $ | 468,435 |
|
| |
| (1) | PGM recycling and Other include PGM recycling and metal purchased on the open market for resale. |
ITEM 7
MANAGEMENT’S DISCUSSION AND ANALYSIS OF
FINANCIAL CONDITION AND RESULTS OF OPERATIONS
The following discussion should be read in conjunction with the Company’s Consolidated Financial Statements and Notes, included elsewhere in this report, and the information contained in Part II, Item 6 “Selected Financial Data.”
OVERVIEW
The Company reported 2012 full year consolidated net income attributable to common stockholders of $55.0 million, or $0.46 per diluted share. PGM prices in 2012 were lower on average than in 2011, but still allowed the Company to operate profitably in each quarter of 2012. The Company's 2012 operating performance was slightly better than its public guidance. Supply and demand fundamentals for palladium and platinum in 2012, the Company's primary products, remain favorable from the Company's perspective, with significant constraints on worldwide supply growth in the face of steadily increasing demand, particularly from the automotive sector, and unrest in South Africa. The Company continued its progress in strengthening its safety culture and in 2012 experienced its best annual safety performance ever.
The Company customarily gives guidance at the beginning of each year with regard to anticipated annual mine production of palladium and platinum, total cash costs per ounce of palladium and platinum mined (a non-GAAP measure described in more detail in Part II, Item 6 "Selected Financial Data" of this report) and capital outlay for the year. Actual 2012 mine production of palladium and platinum totaled 513,700 ounces, slightly better than the Company's 2012 guidance of 500,000 ounces; the higher production was mostly attributable to normal geologic variability within the mines. Total cash costs per ounce of palladium and platinum mined averaged $484 per ounce for the year, better than the $500 per ounce guidance;
most of this favorable cost variance was driven by the higher-than-planned ounces produced during 2012. Capital expenditures incurred in 2012 totaled $116.6 million, less than the Company's initial guidance of $135.0 million for the year; almost all of the under-spending stemmed from expenditures deferred into 2013 on the Marathon project in Canada.
As previously disclosed, the Company's mine plans indicate 2013 production to be approximately 500,000 combined ounces of palladium and platinum. More significant is the almost 16% increase in total cash costs per mined ounce between the 2013 guidance of $560 and the 2012 average of $484. This projected cost growth is driven (1) by the need to maintain and support the ever-expanding depths and travel distances in the underground mines, (2) by contractual wage increases and underlying inflation in materials costs, (3) by the investment in training a large cadre of new miners to support future mine expansions, and (4) to some extent by catching up for longer-term maintenance issues deferred during the economic downturn in 2009 and 2010. In addition, the slightly lower estimated 2013 mine production also accounts for about $15 per ounce of the cost increase.
Capital outlay in 2013 is projected to total $172.8 million, which is $56.2 million above the $116.6 million capital outlay in 2012. The capital outlay at the Stillwater Mine is projected to increase by $29.5 million year-on-year, partially due to spending on the Far West area, the Kiruna haulage system and increased development activity and equipment. East Boulder Mine 2013 capital spending is projected to increase by $3.3 million from 2012, due in part to increased infrastructure spending. Capital outlays on the Blitz and Graham Creek expansion projects situated adjacent to the existing Montana mines will continue in 2013, with spending reduced by $1.7 million year-on-year. Expansion of the Columbus processing facilities,
equipment additions and modifications are contributing factors to the projected increased capital spending in 2013 of $11.8 million. Engineering and environmental work continues at Marathon, with some of the deferred 2012 expenditures projected to occur in 2013, contributing to a $13.3 million year-on-year increase in capital spending. Subject to PGM prices during the year, the Company expects to fund most of this 2013 capital outlay with cash generated from operations.
|
| | | | | | | | | |
| (In millions) | 2013 Plan | 2012 Outlay | 2011 Outlay |
| CAPITAL OUTLAY (1) | | | |
| Stillwater Mine | $ | 87.4 |
| $ | 57.9 |
| $ | 52.5 |
|
| East Boulder Mine | $ | 21.8 |
| $ | 18.5 |
| $ | 17.3 |
|
| Blitz | $ | 16.5 |
| $ | 19.4 |
| $ | 15.7 |
|
| Graham Creek | $ | 4.7 |
| $ | 3.5 |
| $ | — |
|
| Processing and Other | $ | 20.5 |
| $ | 8.7 |
| $ | 4.2 |
|
| Total Montana Outlay | $ | 150.9 |
| $ | 108.0 |
| $ | 89.7 |
|
| Marathon | $ | 21.9 |
| $ | 8.6 |
| $ | 14.4 |
|
| Total Capital Outlay | $ | 172.8 |
| $ | 116.6 |
| $ | 104.1 |
|
(1) Capital outlay excludes approximately $6.3 million of anticipated non-cash capitalized interest in 2013. Capital outlay in 2012 excludes $0.9 million of non-cash capitalized interest. No non-cash capitalized interest was recorded in 2011.
In October of 2012, the Company completed a $396.75 million offering of new 1.75% convertible debentures maturing in 2032 and first redeemable by the note-holders in 2019. The intent of the fundraising was, first, to provide for the refinancing of the Company's $166.5 million of 1.875% convertible debentures redeemable by the holders on March 15, 2013, and second, for other corporate purposes. The additional funding ensures that the Company should have cash available to begin construction of the Marathon PGM-copper project in Canada, assuming all approvals for that project will be secured. The new financing leaves the Company positioned with strong available liquidity at a time when many other companies in the PGM industry are struggling with steeply rising costs and associated liquidity concerns. The Company may require additional financing to complete the funding of its share of the Marathon project. That financing decision will be made at a future date and will depend on the Company's circumstances at that time.
COMPANY STRATEGIC PRIORITIES AND FUNDING CONSIDERATIONS
The Company made appreciable progress during 2012 on all of its key strategic initiatives. The first of these initiatives is designed to optimize the Company's existing operations, which includes giving primary attention to employee safety and environmental compliance, maintaining adequate developed state to sustain current production levels, ensuring that sufficient skilled manpower is available and properly trained, controlling capital and operating costs, and staying current regarding appropriate technological enhancements as they become available. The Company's second key strategic initiative is to develop and strengthen key markets for the Company's principal products - and in particular, for palladium. This initiative generally has required both allocating some funding each year for image-based advertising and carefully monitoring and encouraging newly emerging applications for PGMs. The Company's third key strategic initiative is profitable growth and diversification. The
Company is involved in several significant growth projects that are intended to increase annual PGM production over the next several years. This focus on growing the Company's annual production recognizes underlying supply and demand factors in the PGM market that the Company believes portend stronger PGM pricing, and are of particular benefit to palladium.
Optimizing the Existing Operations
The Company experienced excellent operating performance during 2012. It is generally true that, for mining and processing facilities, safety performance is a strong indicator of operating efficiency and effective labor relations. The Company normally assesses its mine safety performance not just against other U.S. underground metals and non-metal mining operations, but against all U.S. metal and non-metal mining operations, including surface mines and gravel pits. (These statistics exclude coal mines.) The Company's Montana mines are already among the safest U.S. underground metal and non-metal mines, so this broader, more challenging safety universe seems a better target for safety improvement. Measured in terms of incidence reportable under MSHA regulations, the Company's mines had their safest year to date in 2012. During 2012 the Company began implementing the National Mining Association's new CORESafety program, which is comprised of a series of modules designed to assist mining companies in meeting an aggressive set of longer-term safety goals.
The Company also continued its good environmental performance during 2012. All of the Company's mining and processing operations, including the smelter and base metals refinery, are designed to minimize any discharge of pollutants. All water generated from the underground mines is biologically treated to remove any nitrates and then percolated into groundwater or land applied where it can be evaporated or utilized agronomically. Water at the Company's processing facilities (tailings water) is recirculated as process water. Trout fingerling tests in untreated tailings water typically show 100% survival further demonstrating the benign nature of mine contact water. Waste rock from the mines, to the extent possible, is returned underground as fill material; the excess waste rock although not acid generating, may contain some residual nitrates from blasting that may be leached to groundwater. Best Management Practices (BMP's), Land Application and Disposal (LAD) and in some cases insitu biological treatment are utilized to minimize potential impacts to groundwater. Groundwater at both mines is compliant with standards and permit requirements at the property boundaries. Sulfur dioxide generated during processing is scrubbed and converted into gypsum, which is sold commercially for agricultural applications or water treatment. The Company also continues to work pro-actively with local environmental non-government organizations (NGOs) through its contractual Good Neighbor Agreement, which establishes a legal framework for constructive dialogue and information sharing between the Company and its Montana neighbors.
“Developed state” refers to the portion of proven and probable ore reserves that are fully accessible and ready to mine at any point in time. On the whole, an increase in the developed state of a mine provides more flexibility regarding areas to be mined and may permit higher production rates if adequate manpower and processing capacity are available. Because proven ore reserves in the Company's mines represent areas that are well-defined geologically and for which an economically optimized mine plan is in place, total proven reserves are a good surrogate for measuring the Company's developed state. On this basis, the developed state of the Company's Montana mines improved during 2012. Proven reserves at the Stillwater Mine increased to 1.95 million in-situ ounces of palladium and platinum from 1.71 million in-situ ounces at the end of 2011. Similarly, at the East Boulder Mine proven reserves increased to 1.13 million in-situ ounces at December 31, 2012 from 0.91 million ounces at the end of 2011. At a 500,000 ounce per year mining rate, that suggests the Company has about 72 months of developed state ahead of it as of December 31, 2012. That is the best developed state the Company has enjoyed in its history.
Needing to assure that in the future the Company will have enough skilled miners available to offset normal workforce attrition and fully staff the mine expansion projects, the Company has implemented an aggressive new-miner training program. During 2012, about 50 employees were hired into this program at the two Montana mines. The program provides an initial intensive training curriculum, followed by on-the-job training and mentoring by more experienced miners. The program has generated intense local interest, with more applicants than the program can accommodate. In the Company's experience, it typically takes three to five years for a new miner to reach full productivity, so training started now will come to fruition as the Company's current mine expansion projects come on line. If this training program is able to provide enough new miners to go beyond just replacing normal employee attrition, then sufficient skilled manpower should be available to allow the Company to increase its annual production rate as the expansion projects come into production. In the meantime, the Company will bear some additional labor costs as it invests in developing this future workforce.
Although cost increases are significant in 2012 and 2013, they are proceeding in accordance with plan. The mines' 2012 average total cash cost of $484 per ounce (a non-GAAP measure) was about 15% higher than the $420 per ounce experienced in 2011. These higher costs were essentially in line with the mining plan for 2012, and included the anticipated effect of expanding operations underground (“receding face”), contractual wage increases and underlying inflation in materials costs, the investment represented by the new-miner training program, and some catch-up spending following the sharp cutbacks in 2009 and 2010. Also, benefiting from higher PGM prices, the Company has reduced its mining cutoff grades in some areas, taking lower-grade ore that costs more to process but is profitable at current metals prices. Because a portion of the cost increases for 2013 represents investment to support future production growth, increased mine production over the next several years should partially mitigate this rate of cost increases.
From a broader perspective, if the Company's developed state is sufficiently robust, then during temporary down cycles in metals prices, some capital and operating costs can temporarily be scaled back in order to conserve cash. Ultimately, this deferred spending must be caught back up or production rates will suffer. To some extent, capital and operating expenditures during 2012 and 2013 include additional maintenance and infrastructure spending to compensate for cutbacks during the economic downturn in 2009 and 2010. The cumulative annual growth rate in total cash costs per mined ounce for the six years from 2008 projected through 2013, taking into account the economic downturn and subsequent recovery, averages about 7% per year - about what would be expected assuming low underlying inflation and taking the receding face issue into account. Other analyses of relative costs suggest that the Company's cost structure has become increasingly more competitive within the PGM industry over the past several years as competitor costs have escalated sharply. In particular, industry analyses expressing cash costs on a platinum-equivalent basis indicate that, with the strengthening of palladium prices relative to platinum over the past two years, the Company's operations are currently among the most cost competitive of all primary PGM producers. (Analysis on a platinum-equivalent basis purportedly levels out the effect of variation in product mix at different locations.)
Technology improvements generally have evolved slowly in the underground mining industry, but the Company tries to take a proactive role in advancing such changes. For example, the Company was an early adopter of the use of biodiesel fuel blends underground to reduce employees' exposure to airborne diesel particulate matter in the mine. The Company also has introduced large Kiruna electric trucks underground to increase haulage efficiency and expand logistical capacity from the deeper parts of the Stillwater Mine. Currently, the Company is working with a major equipment vendor to devise a low-profile, tractor-mounted rock drill sized to fit within conventional mining stopes, to be used by the miners in place of manually operated jackleg units. The Company expects to take delivery of two of these experimental prototypes during 2013 for testing in the mines.
Developing and Strengthening PGM Markets
The Company first began an active market development program for palladium in late 2004, at a time when palladium jewelry was first being introduced in China as a substitute metal for platinum and white gold. In order to facilitate that shift toward palladium and establish it in the category of a precious metal, the Company developed a set of technical sheets targeting bench jewelers and detailing how to work with palladium in crafting jewelry pieces. These sheets were made available in several languages and widely distributed. Along with this effort, the Company also sponsored image advertising for print material and television, again principally targeting the Chinese market. The intent of these efforts was to increase demand for palladium, thereby supporting its price. Subsequently, the Company also broadened its focus, targeting European and North American jewelry markets, as well, and sponsoring various palladium-centered events at major jewelry shows.
Market development in the precious metals sector has traditionally been driven principally by the mining companies. The larger PGM producers in South Africa produce much more platinum than palladium and have an extensive cooperative marketing program that actively promotes platinum in jewelry and industrial applications, spending large sums each year supporting platinum around the world. Over the years this program has established platinum as the premier jewelry metal and was instrumental early on in securing platinum's use in automotive catalytic converters. Because jewelry purchases are discretionary, the jewelry market for platinum has tended to utilize excess supplies of the metal during periods when industrial demand slackens and prices decline, reducing the effect of pricing cycles. The gold industry has a similar cooperative marketing effort, although the dynamics of the gold market involve government inventories and therefore are different from platinum.
Except for one smaller palladium producer in Canada, the Company is the only primary producer of palladium in the world. Acting mostly on its own, and with only limited resources, the Company has attempted to provide some market support for palladium, both in the jewelry market and industrially. While the Company has attempted to assemble a cooperative effort among other PGM companies, to date it has remained essentially the only participant in this effort. The Company has extended its marketing efforts to include encouraging research into new palladium applications, but for the most part such efforts have adequate independent funding. Consequently, most of the Company's cash marketing expenditures have focused on building palladium's image for the jewelry market.
The Company continually monitors its jewelry marketing expenditures with a view toward adjusting its level of cash outlay as circumstances warrant. As the market for palladium has tightened recently and prices have increased, the Company will reassess whether such expenditures should be reduced, as jewelry demand would normally decline when prices increase. Although it is difficult to measure the direct effect of marketing expenditures on jewelry demand, the Company tries to balance its level of marketing expenditures against the anticipated benefit to be derived from its marketing program.
Profitable Growth and Diversification
Historically, the Company's financial performance and share price have been closely linked with the underlying price of palladium. Since 2000, there have been two extended periods in which the market price of palladium dropped to levels which threatened the Company's economic viability. The first of these periods, lasting from approximately 2001 through 2005, led to a process through which Norilsk Nickel, a large Russian nickel producer with important volumes of by-product palladium, acquired about 55% of the Company in June 2003, consummating the transaction with an infusion of cash and palladium metal. (Norilsk Nickel exited this investment in December 2010.) The second downturn in the palladium price accompanied the most recent U.S. recession and lasted from about mid-2008 until mid-2010. During that period, the Company benefited from favorable palladium floor prices in its long-term automotive supply contracts; the last of which expired at the end of 2010.
The exposure to such extreme cyclicality resulting from the Company's primary dependence upon palladium led management to conclude that some measure of diversification into other metals would be prudent, depending on the opportunity and circumstances. The Company's sole reliance on its Montana mines, with essentially one primary product and only a single major market, was frequently cited by the rating agencies as comprising a high-risk profile. The expiration of the contractual pricing floors at the end of 2010 gave added urgency to addressing this concern, and in November 2010 the Company purchased the Marathon project, an attractive PGM development property in Canada with a significant copper endowment. Once it is operational, this acquisition potentially will provide some geographic and product diversity while also further expanding the Company's core PGM business. In October 2011, the Company completed the acquisition of Peregrine Metals Ltd., an exploration company whose principal asset is the Altar property, a discovery with significant copper and gold resource potential located in Argentina.
Beginning in the second half of 2010, there appear to have been some structural changes emerging in the PGM markets, and particularly for palladium, that have led management to reassess its view of its PGM risk exposure. The most important of these is the steep decline of exports into Europe out of the Russian Federation's strategic stockpiles of palladium. The Russian government does not officially comment on the status of these inventories, but there has been widespread speculation among observers that the Russian stockpiles may be nearly depleted. If so, this would mark a substantial change in the supply-side dynamics of the palladium market. Between 2004 and 2010, exports from the Russian state inventories reportedly averaged over one million ounces of palladium per year, meeting between 10% and 15% of total market demand.
In addition, the widely publicized labor violence experienced in South African mines during 2012 appears to be symptomatic of significant challenges facing those operations. In particular, the strong political opposition to closing uneconomic mines there has resulted in overproduction. This excess supply in turn has driven PGM prices down to levels below many mines' cost of production, resulting in a shortage of cash to reinvest in order to sustain production rates longer term. While this is primarily an issue for platinum, to a lesser extent it also has repercussions for palladium. Norilsk Nickel's output of by-product palladium has also been gradually declining over the past several years, although it is not clear whether this trend will continue indefinitely.
In the face of these substantial constraints on PGM supplies, demand for palladium and platinum continues to grow. The largest market for both metals is in catalytic converters. Currently, palladium dominates the market for catalytic converters in gasoline vehicles, with some vehicles using no platinum at all, while platinum plays a key role in diesel catalytic converters. The European auto market, which is about evenly split between gasoline and diesel, remains depressed, but robust vehicle production growth reportedly has continued in China and south Asia, and North American vehicle production has now nearly returned to prerecession levels. Gasoline engines predominate in Chinese and North American auto production.
With growing PGM demand and constrained supply, prices for both palladium and platinum are now at historically strong levels. Importantly, though, with the sharp reduction in Russian government exports of palladium the historic steep discount in the price of palladium relative to platinum has narrowed substantially. From 2003 through mid-2010, the price of palladium typically averaged between 20% and 25% of the price of platinum; since the middle of 2010 it has averaged between 40% and 45% of the platinum price. The Company's mines produce about 3.4 times as much palladium and platinum, so this pricing realignment, together with relatively strong underlying PGM prices, has benefited the Company.
In view of these changes in the PGM markets, the Company's emphasis has been shifting from a focus on diversification alternatives toward opportunities to benefit from strengthening PGM prices. Besides the Marathon project in Canada, management believes the Blitz and Graham Creek projects situated adjacent to the existing Montana operations, along with acceleration of the newly identified Far West development within a previously undeveloped area of the Stillwater Mine, all provide opportunities for PGM production growth. Specifically, current plans indicate that the Graham Creek project should have first production in early 2015, potentially adding about 30,000 ounces of incremental PGM production per year. The Far West development, which accelerates development in an area of the Stillwater Mine that in due course would have been mined anyway, is expected to come on line in mid-2016, contributing about 20,000 added PGM ounces in 2016 and around 45,000
ounces per year thereafter. It is still too early to assess the definitive production opportunity at the Blitz project, but the Company believes that Blitz might serve to replace depleting production out of the Lower Off-Shaft area at the Stillwater Mine and perhaps also add about 25,000 ounces of incremental production each year. Under current plans, no production is expected out of Blitz before 2018. Altogether, this suggests potential for about a 20% increase in PGM production from the Company's Montana mines over the next five or six years. These growth projections are estimates, however, and there can be no assurance at this point that the Company will have sufficient manpower or other resources to accomplish these targets.
Funding Notes
At current PGM prices the Company believes there should be sufficient cash generated from operations, together with cash on hand, to complete each of these PGM expansion projects of the Far West, Blitz and Graham Creek. Cash and cash equivalents on hand at December 31, 2012, totaled about $379.7 million; taken together with highly liquid short-term investments, available liquidity (excluding undrawn capacity under existing credit lines) was about $641.7 million. Of this total, the Company expects $166.5 million to be utilized in redeeming the Company's outstanding 1.875% convertible debentures on March 15, 2013. The remainder should be available for general corporate purposes, including support for capital projects if needed. These December 31, 2012, cash and liquidity balances include about $43.4 million of cash held in Canada that is dedicated as funding for the Marathon PGM-copper project (and other related properties) and so is not available to the Company for its general corporate purposes.
Total cost to complete the current scope of the Montana expansion projects, including Blitz, Graham Creek and Far West, will be about $211 million over the next five or six years. Of this amount, nearly $40 million has been spent through December 31, 2012. Although, once they are completed, Blitz and Graham Creek should each provide opportunities to increase the Company's annual PGM production. These projects also should be considered as foundational or “backbone” developments that should provide access to undeveloped areas along the J-M Reef from which future mine development can be sourced. At recent PGM price levels these capital projects, along with sustaining capital at the existing Stillwater and East Boulder mines, should be covered out of cash flow from operations.
The Company's most recent estimate of the cost to permit and construct the Marathon project is between $550 and $650 million. A detailed engineering study currently is under way which should provide firmer estimates later in 2013. With the sale of a 25% interest in this project to Mitsubishi Corporation in early 2012, the Company's remaining 75% share of the capital would fall roughly between about $400 million and $500 million. Some of the cash on hand could be used to fund the initial construction spending at Marathon, but management expects to seek additional project debt financing to support this effort in conjunction with its joint venture partner.
In addition to the 1.875% convertible debentures expected to be redeemed on March 15, 2013, the Company has in place $396.75 million of 1.75% convertible debentures that are first redeemable in September 2019; $30 million of 8.0% State of Montana Industrial Revenue Bonds due in July 2020; and a $125 million asset-backed line of credit expiring in December 2016 with approximately $72.2 million of available borrowing base at December 31, 2012. Consequently, management believes the Company currently has adequate liquidity and, aside from the debentures noted previously, no significant debt maturing in the near future.
STATUS OF COMPANY PROJECTS
The Company's growth projects all progressed on several fronts during 2012. At the Blitz project, located adjacent to the Company's Stillwater Mine, a newly acquired TBM was received and assembled underground during 2012, and it began operating in December. The Blitz TBM is a factory reconditioned machine that is 450 feet long, with a new 100-ton cutter head that is 18 feet in diameter and when in operation rotates about six times per minute. Meanwhile, development of a second parallel drift along the J-M Reef about 600 feet above the TBM is also under way using conventional drill-and-blast development methods. Both drifts are planned to extend underground about 23,400 feet to the east of the existing Stillwater Mine infrastructure. Permitting is in progress on a new surface portal situated about four miles to the east of the Stillwater Mine surface facilities. A proposed decline ramp originating from this new portal would intersect the new drifts, providing ventilation and emergency egress for the entire Blitz area. Just over $174 million remains to be incurred on completing the Blitz development over the next five or six years.
At the Graham Creek project, through the end of 2012, the existing TBM has developed about 6,500 feet of new underground footwall lateral extending to the west of the East Boulder Mine. The TBM is expected to complete its planned 8,200 feet of development during the second quarter of 2013. At that point, the Company will begin developing two new ventilation raises in support of future Graham Creek operations. First production from Graham Creek is expected in early 2015 and has the potential to add about 30,000 PGM ounces per year to East Boulder mine production. Estimated capital expenditures remaining to complete the present scope of this project total about $8.9 million.
The Company identified an area within the envelope of the Stillwater Mine where development could be accelerated to provide some production growth ahead of the production timeline for the Blitz project. This area, known as the Far West, is located about three miles to the west of the mine shaft and is underneath the Upper West area of the mine, which has been mined for many years. Development drifts have only accessed this area within the past year or two, and ore appears to be a little higher grade there than in the Upper West with good ore yields. Developing this area may pull some manpower away from the Blitz project for a time but should not significantly delay Blitz development. This project represents an acceleration of development in the Far West area pulling forward capital that would have otherwise been spent in later years. Cost to develop the Far West area is approximately $28 million spread over about three years.
The Company's Marathon project, near the town of Marathon at the northern tip of Lake Superior in the province of Ontario, Canada is progressing through the stages of final engineering and environmental review. The Company disclosed previously that in the course of the final engineering, it identified some problems with the palladium grades reported in the earlier feasibility study prepared for this project. The proven and probable ore reserves cannot be updated until the economic evaluation of the project in the final engineering study is completed. Planned cost of the Marathon project in 2013 is about $21.9 million.
On the environmental front, earlier in 2012 the Company submitted an environmental assessment to the joint federal/provincial Marathon review panel for consideration. Following a comment period, the study has been returned with various comments and questions, some of which have entailed additional data gathering. The Company expects to resubmit the updated documentation during the first half of 2013. The Company also is engaged in discussions with various First Nations and other Aboriginal groups potentially affected by the proposed project. Assuming all issues are resolved in a timely manner, construction of a mine at Marathon might begin in late 2014, with first production likely in early 2017.
In October of 2011, the Company completed the acquisition of Peregrine Metals Ltd., whose principal asset is the Altar copper-gold porphyry exploration project in the San Juan Province of Argentina. This property was acquired with the intent of providing the opportunity to engage in longer-term product diversification. On the basis of definitional drilling to date, the Altar property geologically appears to be exceptional. Drilling there has substantially expanded the boundaries of the resource, to the extent that it appears likely any mine development there would be significantly larger than originally envisioned. (It is important to note that at this point there are no proven and probable reserves at Altar, as establishing such reserves requires completing a feasibility study to assess the associated project economics.)
In view of the continuing improvement in the PGM markets in 2012 and early 2013 and taking into consideration the increased political uncertainty in Argentina, the Company has been cautious in its evaluation of the Altar project. The Company completed its 2012 drilling and evaluation program for about $17 million, less than the $25.0 million originally planned. The Company has further reduced its exploration and general and administrative budget at Altar in 2013 to about $13 million. The Company continues to believe that the Altar asset represents significant long-term potential and also believes it would be unwise to make a definitive statement about its future at this time or to otherwise terminate the project. The Company intends to keep its spending at modest levels for the foreseeable future in order to gain a better gauge on its prospects and ultimate value. In the view of management, the Altar investment represents a valuable option. The Company recognizes that construction of a mine at Altar would be expensive and also recognizes that value may be realized in many ways, including through partnering or the sale of all or a portion of the project. As the Company's projects in Montana and at Marathon come on stream in the years ahead, the Company should have a better reading on Altar and its future in general at that time.
Other 2013 capital projects include somewhat higher than normal spending on sustaining capital at the existing Montana mines. Stillwater Mine spending will include extending the ramp underground for the Kiruna electric truck haulage system and procuring a third Kiruna truck. The Far West incremental development cost, estimated at $8.6 million in 2013, is also included in the Stillwater Mine capital, as is the purchase of some additional underground haulage equipment. The processing and recycling facilities will replace the very old and unreliable gypsum thickener tank, as well as finishing up the slag cleaning facilities at the smelter furnace.
PRINCIPAL FACTORS AFFECTING THE COMPANY
The 28-mile long surface exposure of the J-M Reef which the Company controls represents a relatively small and upwardly-displaced portion of the Stillwater Intrusive Complex, a much larger geologic feature that extends at substantial depth
for several miles northward from the Beartooth front where the Company's mines are located. When the Beartooth Mountains were formed during the Rocky Mountain uplift (Laramide orogeny) about 65 million years ago, the southern-most edge of the Stillwater Complex was detached and tilted steeply upward from the larger feature, exposing the generally north-dipping and PGM-rich J-M Reef near the current mountain front. The PGM reef resource that the Company has developed and mined thus far has averaged about five feet in width. The Company has accessed approximately 9 miles of the total 28 mile exposure and up to one mile of its vertical extent.
The palladium-dominant PGM ores in the J-M Reef have some of the highest PGM grades in the world, which contributes to a comparatively low mining cost per ounce. However, the narrow mining widths resulting from the steeply dipping configuration of the reef make the deposit relatively complex to mine. The Company's mines compete primarily with the platinum-rich PGM ore reserves within South Africa's Bushveld Complex and with the significant PGM by-products from the primary nickel mines controlled by Norilsk Nickel in northern Russia. The platinum-dominant Bushveld PGM deposits typically dip more gradually to depth in comparison to the J-M Reef. However, over time the near-surface Bushveld ores have been depleted, and the remaining underground resources are subject to deeper, hotter and more complex mining conditions, which generally results in comparatively higher mining costs per ounce. The Russian nickel mines of Norilsk Nickel produce palladium-rich PGMs as a major by-product of their primary nickel operations and so at a very low marginal cost. Other global sources of PGMs with which the Company competes include the Great Dike in Zimbabwe, the predominantly nickel-copper operations of Vale and Xstrata at Sudbury in Canada, and North American Palladium's operations at Lac des Iles, also in Canada.
The Company's financial performance relative to its peers depends not only on the level of PGM prices, but also on the differential between the price of platinum and the price of palladium. In periods of low PGM prices, and in particular when palladium prices also are low relative to platinum prices, the Company's palladium-rich production may put it at a disadvantage to comparable mines in South Africa with a higher proportion of platinum in their ores. See “Risk Factors – The Company May Be Competitively Disadvantaged As A Primary PGM Producer With A Preponderance Of Palladium With a U.S. Dollar-Based Cost Structure” for further discussion.
The Stillwater Mine, one of the Company's two Montana mining operations, is situated about 46 road miles to the southwest of Columbus near the town of Nye and accesses the eastern portion of the J-M Reef. The mine's principal horizontal haulage levels extend both to the east and to the west from the mineshaft. The mine's ore concentrating facilities and offices are located on the surface adjacent to the shaft, at an elevation of 5,000 feet above sea level in the Stillwater Valley. The portions of the mine developed below the valley elevation are accessed by a system of internal ramps and via the 1,950 foot vertical shaft that extends to the mine's 3100 level. The Stillwater Mine commenced operations 27 years ago in 1986 and to date has developed portions of the reef along about six horizontal miles on various levels underground, ranging from about the 2000 level at the deepest up to the 7500 level in the Upper West area of the mine. Typically, the lower portion of the Stillwater Mine that is accessed from the shaft - referred to as the “Off-Shaft” area - has produced relatively high average ore grades; however, mineable ore zones in this area tend to exhibit lower continuity of grade and thickness along the reef. By contrast, the western portion of the mine above the 5000 level - the “Upper West” area - generally has somewhat lower average ore grades, but the ore continuity, grade and thickness in this area is relatively consistent along the reef. Consequently, overall ounce production at the Stillwater Mine, is sensitive not only to the total ore tons produced, but also varies from period to period as a result of the relative proportion of total ore produced from each area as production advances systematically. In 2012, the Stillwater Mine produced 377,400 ounces of PGMs down from 386,900 ounces in 2011 – and generated sales revenues of $328.1 million. At December 31, 2012, the Stillwater Mine had 989 employees, including 616 miners.
The Company's other Montana mine, the East Boulder Mine, is located on the western portion of the J-M Reef about 25 miles south of Big Timber. The mine's surface facilities are within the boundaries of the Gallatin National Forest, and access into the mine is provided by two parallel 18,000-foot horizontal rail adits that intersect the reef perpendicularly at the 6,500 foot elevation deep within the mountain. The mine was commissioned in 2002, and to date has developed along about 2.5 horizontal miles of the J-M Reef underground. Mining operations have been developed vertically between elevations of 6,500 and 7,900 feet above sea level. The continuity of grade and thickness in the PGM mineralization at East Boulder is characteristically higher than that observed at the Stillwater Mine. However, average ore grades at East Boulder are lower, with grades to the mill typically averaging between 0.35 and 0.40 ounces per ton. During 2012, the East Boulder Mine produced 136,300 ounces of PGMs compared to 131,000 ounces in 2011 – with sales revenue of $127.3 million. At December 31, 2012, the East Boulder Mine had 373 employees, including 226 miners.
The Company recycles spent catalyst materials through its processing facilities situated along Interstate 90 in Columbus, Montana, recovering palladium, platinum and rhodium from these materials. Recycling materials are weighed and sampled, and then are commingled with concentrates produced at the two mines and fed into the Columbus smelter and base metals refinery. Recycling has proven to be a consistently profitable ancillary activity. However, the recycling business has also proven to be
very sensitive to PGM prices: volumes of recycling material available in the market drop very sharply when PGM prices decline, as does the overall profitability of the business.
The Company believes it enjoys certain competitive advantages in the recycling business. The smelting and refining complex in Columbus, Montana processes concentrates from the Montana mines, which contain not only PGMs, but also significant quantities of nickel and copper as by-products which are key to efficient recovery of PGMs from recycled materials. Copper and nickel sulfides from the ore concentrates bind with the elemental PGMs from recycling in the smelter and so aid in collecting the recycled PGMs. Because of this affinity, the Company is able to recycle catalyst material within its system at an incremental cost lower than most other processors. Moreover, the Company also believes the physical location of its processing facilities provides a logistical advantage over smelters in Europe and South Africa, particularly for North American collectors. And as described below, the Company employs certain technological innovations that may contribute further to its competitive advantage.
The Company has taken steps over the past several years to reposition itself in the recycling business. In May 2009, the Company commissioned a new electric furnace in the Columbus smelter, increasing throughput capacity and creating backup furnace capacity in the event of planned or unforeseen outages. During the third quarter of 2010, the Company commissioned a dedicated catalyst processing and sampling plant that allows for the segregation and handling of multiple batches of recycling material simultaneously. In early 2011, the Company commissioned a new state-of-the-art assay laboratory which utilizes an automated x-ray facility that provides accurate results with faster turnaround times than conventional fire assay methods. New laboratory software supports this automated x-ray system, as well as other laboratory processes. And in late 2012, the Company completed the reconfiguration of its former primary smelting furnace, providing a new slag-cleaning circuit in the smelter that should improve PGM recoveries from the feed stream.
In acquiring recycled automotive catalysts, the Company advances certain funds to its suppliers ahead of actually receiving material in order to facilitate procurement efforts. In general, the Company only advances funds to suppliers when the associated material for recycling is awaiting transit or is already in transit to the Columbus processing facilities. The state-of-the-art recycling, sampling and assay facilities allow the Company to accelerate final settlements with suppliers, thereby allowing them to turn over their working capital faster. Outstanding procurement advances that were not backed up by inventory physically in the Company’s possession totaled $10.2 million at December 31, 2012, and $2.6 million at December 31, 2011.
Following the collapse in most metal prices during the second half of 2008, platinum and palladium market prices gradually recovered during 2009 and generally trended up during most of 2010 and early 2011. The U.S. dollar strengthened and prices for both metals were lower during the second half of 2011 and declined further in mid-2012 before recovering in the 2012 fourth quarter. The price of platinum at year end 2012 in London was $1,527 per ounce and palladium ended 2012 at $704 per ounce. PGM prices have been closely correlated with the ratio of the U.S. dollar to the euro in recent years, and they declined beginning in August of 2011 in response to European economic uncertainty and associated strengthening of the U.S. dollar. Much of 2012 also was characterized by a relatively strong dollar, as European investors in particular sought out the relative safety of the U.S. dollar in the face of European economic uncertainty. Palladium and platinum prices have risen further in early 2013 on investor perceptions of impending shortages in both metals. See 2013 - Looking Forward - "Platinum and Palladium Price History 2008-2012."
Another factor that has influenced PGM prices in recent years has been the introduction of PGM exchange-traded funds (ETFs) into the U.S. market. These were first introduced in January 2010. The ETFs have proven to be a popular investment vehicle, although they may have the effect of increasing price volatility in the PGM markets. Experience suggests that the trading in the platinum ETF tends to be relatively stable in the face of changes in metal prices, while trading in the palladium ETF is much more responsive to pricing changes. For example, volumes held by palladium ETFs increased over the course of 2010, driving prices higher by increasing the total demand for palladium while supply was constrained. However, after peaking at 2.4 million ounces in February of 2011, just before the devastating tsunami hit Japan, ETF holdings of palladium saw substantial liquidation, declining to about 1.7 million total ounces over the remainder of the year. This ETF liquidation arguably exacerbated the decline in the palladium price over that period as ETF volumes were sold. The year 2012 saw some renewed buying interest in the ETFs for both metals.
PGM markets inherently carry certain inherent risks. Compared to other precious metals and major industrial metals, PGM trading volumes normally are relatively thin and their markets have limited liquidity. Consequently, PGM prices historically have been volatile and difficult to forecast. PGM prices may be affected - favorably or unfavorably - by numerous factors, including the level of industrial demand, particularly from the automotive sector; by supply factors that include changes in mine production and inventory activity; and by general shifts in investor sentiment. In particular, although exports from the Russian government inventories appear to have slowed in recent years and according to some are nearing depletion, the Russian Federation does not officially disclose its inventory holdings and there is no sure way to verify that those inventories
are actually approaching exhaustion. Recent PGM prices have been comparatively high by historical standards, and to some extent these price levels are likely affected by investor sentiment that could shift away from precious metals if other markets become more attractive, interest rates rise or prices edge downward. The Company attempts to manage this market volatility in several ways, including by aggressively marketing palladium, by entering into long-term supply agreements, in some limited cases through metal hedging, by investing to maintain and strengthen the developed state of the mines, and by monitoring the Company's liquidity closely to maintain the financial capacity to bridge periods when PGM prices are low.
Automotive demand has continued to strengthen in most major markets since 2010 after its steep decline during the recession in late 2008 and 2009. Total worldwide production of light vehicles in 2012 reportedly was at record levels. According to a Mitsui report issued in early 2013, North American car production in 2012 grew by 13% to 14.5 million vehicles, only slightly below pre-recession levels. And in a year when economic activity in China was viewed as constrained, automobile production there grew by 4.5% to 19 million units. The other BRIC countries overall also saw growth during 2012. The European auto market remains severely depressed, however. Continued growth in worldwide auto demand, coupled with ever more stringent emissions regulations and increasing palladium penetration into diesel catalytic converters, have continued to drive the growing market demand for palladium.
Worldwide mine production of palladium and platinum, which had declined since peaking in 2006, suffered a further decline during 2012 as labor unrest in South Africa shut down mine production for a time at properties owned by each of the major producers. Russian production also declined during 2012. Johnson Matthey’s November 2012 Interim Report, which included 2012 data available through September, projected platinum ounces supplied to market (including recycling) would decline to 7.67 million ounces in 2012 from 8.53 million ounces in 2011. Palladium ounces supplied to market (including recycling and Russian inventory sales) also reportedly were projected to decline to 8.81 million ounces in 2012 from 9.71 million ounces in 2011. For the same 2012 period, Johnson Matthey projected that palladium usage in catalytic converters would grow by 7.5% to 6.48 million ounces, while platinum usage in catalytic converters would remain essentially flat at about 3.1 million ounces.
Of continuing concern in the PGM industry is the lack of an adequate level of reinvestment in the business. A few smaller companies, principally in South Africa, have invested in developing new mines, and Impala has some major new shafts under way, but the amount of new production they are expected to generate will not be sufficient over the longer-term to sustain current production levels. Putting in a large new underground mine on the Bushveld Complex in South Africa reportedly requires an investment of more than a billion dollars in a new shaft and the entire process from conception to production can take ten years or more. Although current PGM prices may seem comparatively robust in U.S. dollars, rising operating costs and an adverse strong exchange rate for the South African rand have limited the benefit of higher metal prices to South African producers. As a result, they have difficulty justifying the kinds of new mining investments that need to be made. When coupled with other challenges in South Africa, including labor unrest, political opposition to idling uneconomic operations, safety issues, power shortages, rapidly escalating wage structures, political uncertainty on several fronts, and a critical shortage of experienced professionals, the outlook for adequate future reinvestment there is troubling.
2012 RESULTS AND COMMENTARY
For the full year 2012, the Company reported net income attributable to common stockholders of $55.0 million, or $0.46 per fully diluted share, a decrease from the $144.3 million, or $1.30 per diluted share, reported for 2011 and slight increase from the $50.4 million, or $0.51 per diluted share earned in 2010. After an exceptionally strong year in 2011, realized prices for palladium and platinum were generally lower during 2012, reflecting a stronger dollar and surplus metal inventories during much of the year. In September of 2011, with the threat of a Greek default overhanging the market and driving down the value of the euro, commodity prices generally fell off sharply and remained lower for the balance of 2011 and most of 2012. The Company's average realized price on sales of mined palladium and platinum was $849 per ounce in 2012, lower than the $953 per ounce average realized in 2011.
The Company’s mine production of palladium and platinum totaled 513,700 ounces in 2012, a decrease of 0.8% compared to 517,900 ounces in 2011. This lower mine production in 2012 relative to 2011 was primarily attributable to normal geological variation within the mines. Revenues from mining including by-product revenues, in 2012 totaled $455.4 million, down from $528.0 million in 2011, on the weaker realized prices and lower sales volumes in 2012.
Stillwater Mine’s total cash costs (a non-GAAP measure) averaged $456 per ounce for the full year 2012, an increase of 13.7% above the $401 per ounce actually realized in 2011. The year-on-year increase is attributable to inflation in labor and materials costs, additional hiring under the new-miner training program and for infrastructure support, and the impact on operations of the continually expanding mining profile underground. Produced ounces of palladium and platinum produced at the Stillwater Mine decreased to 377,400 ounces in 2012 from 386,900 ounces produced in 2011, which also affected total cash costs per ounce.
Capital outlay at the Stillwater Mine totaled $77.3 million in 2012 (including $19.4 million for the Blitz project), ahead of the $68.2 million spent during 2011 (of which $15.7 million was for Blitz), reflecting the replacement of some dated mining equipment. Primary development at the Stillwater Mine, which includes extensions of footwall laterals and ramps, advanced about 26,400 feet during 2012, about 10.6% less than planned. Secondary development, which includes sills developed within the reef and ramps used for direct access into specific mining stopes, advanced about 16,300 feet, 12.5% less than planned. Diamond drilling footages in 2012 at the Stillwater Mine totaled about 307,700 feet, 19.3% less than planned. Despite the lower development and drilling footages, the mine expanded its base of proven reserves during 2012.
Total cash costs per ounce at the East Boulder Mine in 2012 averaged $562 per ounce, lower than planned and 18.3% higher than the $475 per ounce averaged in 2011. As with the Stillwater Mine, the year-on-year difference is attributable to increased labor and materials costs, along with the costs associated with the new-miner training program and normal expansion as the mining faces recede. Mine production at East Boulder increased to 136,300 produced ounces of palladium and platinum in 2012, up 4.0% compared to 131,000 ounces produced in 2011.
Capital outlay at the East Boulder Mine totaled $22.0 million in 2012 (including $3.5 million at Graham Creek) compared to the $17.3 million spent in 2011. Actual primary development at the East Boulder Mine advanced about 13,900 feet and secondary development 9,200 feet in 2012, in total slightly above plan. The overall development footage at the East Boulder Mine was about 8.8% ahead of plan, largely reflecting good progress on the Graham Creek TBM advance. Diamond drilling footage totaled about 152,100 feet at the East Boulder Mine in 2012, about 12.0% less than planned.
The Company is party to a three-year palladium supply agreement with General Motors expiring at the end of 2013 and a one-year platinum supply agreement with Tiffany & Co., and also has a month-to-month agreement with Ford Motor Company and one-year supply agreements with Johnson Matthey and BASF. These agreements typically provide for pricing at a small discount to a trailing market price, although such discounts have become less common recently. For 2013, the Company's mine production of palladium is essentially fully committed. The Company sells the remaining uncommitted share of its mined platinum under month-to-month agreements and in the spot market.
The Company’s smelter and base metal refinery in Columbus, Montana process the PGM ore concentrates from the two mines and also recycles spent PGM catalysts from automotive catalytic converters and from other industrial applications, ultimately recovering palladium, platinum and rhodium from these materials. During 2012, the Company fed about 445,200 combined ounces of recycled palladium, platinum and rhodium into the smelter, of which about 75% was from material purchased directly by the Company and the remainder was toll processed on behalf of others for a fee. Total ounces fed to the smelter during 2012, reflected a decrease of 8.5% compared to the 486,700 recycling ounces fed in 2011. Receipts of recycling material strengthened during the 2012 fourth quarter as PGM prices firmed; this strength has continued into early 2013. Recycling revenues in 2012 were $344.8 million on 336,500 combined ounces sold, in 2011 recycling revenues totaled $376.8 million on sales of 306,200 combined ounces.
In 2012, the Company's recycling operations earned $10.5 million (pre-tax) reflecting a combined average realization (including rhodium) of $1,018 per sold ounce. By comparison, in 2011 the Company's recycling operations contributed $18.8 million (pre-tax) to income, with a combined average realization of $1,218 per sold ounce. Total tons of recycling material processed during 2012, including tolled material, averaged 18.6 tons per day, down from the 20.3 tons per day in 2011. Weaker PGM prices in 2012 created less of an incentive for suppliers to collect recycling material. However, during 2012, the Company was able to enter into new sourcing arrangements for catalyst material with several new suppliers.
The Company’s consolidated total available liquidity, expressed as cash and cash equivalents plus short-term investments, ended 2012 at $641.7 million, comprised of $379.7 million of cash and cash equivalents and $262.0 million of available-for-sale investments. This balance included the net proceeds of the Company's $396.75 million offering of convertible debentures in October 2012. The corresponding year-end 2011 balance was $158.6 million, including $109.1 million of cash and cash equivalents and $49.5 million of available-for-sale investments. Cash generated from operations during 2012 totaled $103.9 million, down from $219.7 million in 2011, driven mostly by the lower PGM prices in 2012. The Company did not incur any new debt in 2011, although at the end of 2011 the Company put in place a $125.0 million asset-backed revolving credit facility.
At the end of 2012, the Company’s Montana workforce totaled 1,632 employees, an increase of 7.2% for the year from 1,522 in December 2011. About 65% of the net manpower increase was attributable to adding new production and maintenance staff at the mines, including hiring for the new-miner training program. The remainder of the 2012 increase was spread evenly over all other functions. Worldwide, the Company had 1,664 employees at December 31, 2012 compared to 1,567 at December 31, 2011.
The Company’s environmental performance continued its excellent track record during 2012. Environmental compliance is a very high priority. The Company has a record of open communication and cooperative, proactive involvement with its
neighbors and with local and regional environmental groups.
The Company's operating permits require that, in conjunction with its mining and processing activities, it must provide adequate financial surety in support of its permit obligations to complete final reclamation and remediation once mining operations cease. As of December 31, 2012, the Company had outstanding approximately $39.4 million of surety bonds mostly in favor of state and federal agencies to guarantee final reclamation and other commitments. Regulatory authorities are currently in the midst of updating an Environmental Impact Statement (EIS) on the Montana properties, which when finalized will determine whether or not the existing surety amounts are sufficient. Upon completion of this review process, it is likely that the Company will be required to provide additional surety bond coverage. As of December 31, 2012, the Company had posted cash and letters of credit totaling $17.5 million to collateralize its surety obligations.
SOCIAL CONSIDERATIONS
Although, like other publicly traded companies the Company primarily seeks to maximize the value it generates for shareholders over time, management believes that ultimately meeting the expectations of all its stakeholders is essential to accomplishing that objective. Thus, the Company's environmental approach reflects its operational integrity; its product awareness, as PGMs are used to clean the environment; and its location sensitivity, given the pristine areas in which the Company's operations are located. Because the Company operates in some exceptionally pristine locations and produces products that are essential to preserving air quality, careful attention to environmental performance and feedback is critical to (and consistent with) the Company's continuing operations as well as to its favorable reputation. The Company is a key employer in the communities where it operates, and actively supports the communities where its employees and their families live allowing the Company to attract highly qualified individuals to these communities. Attractive wages and benefits, coupled with a safe work environment, not only allow the Company to be competitive in the market for employees, but also contribute to the health and economic vigor of the communities where it operates. Investment in state-of-the-art facilities and technologies allows the Company to continually deliver high-quality products to its customers at a competitive price.
The Company's approach to the environment is somewhat unique in the mining industry. The Good Neighbor Agreement, originally signed in 2000 and now in its thirteenth year, commits the Company to work closely with and provide full disclosure to its neighbors and certain regional environmental NGOs. Provisions of the agreement include transporting the majority of employees to and from work in buses so as to minimize traffic on rural roads; quarterly meetings among the parties to the agreement to discuss concerns and consider environmental performance; ongoing Company funding of an independent engineering firm to monitor and report on the Company's environmental records; and open community involvement in Company dealings with regulatory agencies. In addition, the Company has traditionally hosted an annual dinner where the environmental community can meet directly with the Company's board of directors.
The Company's processes overall are designed to minimize their impact on the environment, complying with and in most cases exceeding all applicable regulatory standards. About 50% of the mined tailings typically are returned to the mine after processing and are used as fill. The remaining tailings are placed in lined tailings ponds where much of the constructed embankments have been re-vegetated and contoured to try to match the surrounding topography. Tailings are environmentally inert and are not acid generating. Water from the mines generally meets drinking water standards aside from elevated concentrations of nitrates from the explosives used underground. These nitrates are treated and removed biologically before any water is discharged. Tailings water is recycled through lined facilities back to the concentrators and not discharged to the environment. Regardless, bioassay of tailings water shows 100% survival of trout fingerlings in periodic tests. Biodiesel blends are used as fuel underground, both for their cleaner exhaust and to reduce carbon footprint. Likewise, in an area noted for its abundance of deer, elk and bear, the Stillwater Mine also hosts a large herd of bighorn sheep that winter on the mine property and can be regular visitors to the mine parking lot. The smelter and refinery in Columbus, Montana both use closed-loop processes with almost zero fugitive emissions. The smelter is fully scrubbed virtually eliminating SO2 emissions (the facility emitted 2.7% of its permitted annual level in 2012) while the scrubbers produce synthetic gypsum (calcium sulfate) which is licensed for use by farmers as a soil amendment and for water treatment. Stack emissions are monitored continuously and critical processes can be shut down automatically if SO2 emissions were to exceed permitted levels. However, emissions have yet to exceed such levels. Particulate dust in the scrubber stream is filtered using Gore-tex membranes and returned to the smelter. All process water on the property is ultimately consumed, emitted as steam or evaporated. Storm water is segregated from contact with process materials and routed to infiltration galleries. Slag from the smelter is cooled and recycled back to the mines for reprocessing. The Company has recently modified one of the smelter furnaces for slag cleaning, which should increase PGM recoveries.
The Health, Safety and Environmental committee of the Company's board of directors meets regularly to review the Company's performance in these key areas. Its charter includes mandates “(i) to review the Company's environmental and occupational health and safety policies and programs; (ii) to oversee its environmental and occupational health and safety performance; and (iii) to monitor current and future regulatory issues.” With regard to employee health, the Company's medical benefits include a “wellness” program for employees and their families intended to encourage and educate regarding good health practices. The program includes annual physical checkups, targeted programs for specific health risks, and themes related to physical, emotional and mental health issues. On the safety front, the Company has engineered safe practices into all work tasks and trains to those standards. The Company continually works to establish and maintain a multifaceted “culture of safety,” summarized by the slogan, “Everyone Goes Home Safe - Every Day.” Safety programs include incidence tracking and analysis, near-miss reporting, workplace start-of-shift inspection checklists, team safety meetings, annual refresher training, safety stand-downs and financial incentives for working safely. The Company also works closely with MSHA inspectors to act on their findings and incorporate their suggestions. Recently, the Company has begun to implement the new National Mining Association CORESafety program, which is comprised of 20 separate modules addressing all aspects of mining safety. Management also strives to maintain a consistent “tone at the top” that gives working safely priority over all other objectives.
While the Company's plans are still in the early stages at Marathon and Altar, management intends to implement these key health, safety and environmental principles and practices for its employees and future operations internationally. One early step being taken is the effort to establish early on an effective working relationship with the local communities and environmental agencies in the vicinity of these new properties. Experience suggests that building the mutual confidence and trust that such relationships require takes time and patience. However, the Company's history in Montana suggests that any effort to develop these projects without fully taking into account the concerns of all the affected stakeholders would create delays and be unnecessarily confrontational and expensive.
In light of the Environmental Protection Agency's efforts to regulate carbon dioxide (CO2) emissions as a greenhouse gas, the Company has reassessed its exposure to likely restrictions on such emissions. The Company's principal sources of CO2 emissions are limited to a comparatively few internal combustion engines in vehicles and mining equipment, and to stationary sources such as mine ventilation and process heaters, dryers and converters that consume natural gas. As noted above, the Company already utilizes buses to transport its workforce to and from the mines and utilizes a 70% blend of biodiesel fuels in its operations which reduces workplace diesel particulate matter emissions and its carbon footprint. Consequently, any taxes or added restrictions on emissions are unlikely to have any direct material effect on the Company's operations. The Company's physical exposure to climate change is minimal. The Company's operations are not materially dependent upon weather patterns or seasonal availability of water. The relatively remote location of the mines presents some exposure to severe weather, particularly winter snowfall that can restrict access to the mine sites, but the Company already regularly addresses this issue during the winter months in Montana. Similarly, smoke from summer wildfires can temporarily restrict access to the mines, but their duration tends to be relatively short. Probably the Company's most significant exposure to greenhouse gas regulation is the potential effects of a substantial longer-term movement away from internal combustion engines on the demand for PGMs in catalytic converters. Such a major shift in automotive demand could depress PGM prices and impair the Company's financial performance. Regulatory constraints on other industries also could affect the price or availability of electricity and other materials necessary for mining, potentially driving up the Company's operating costs.
RESULTS OF OPERATIONS
YEAR ENDED DECEMBER 31, 2012 COMPARED TO YEAR ENDED DECEMBER 31, 2011
Revenues – The Company’s total revenues, including proceeds from the sale of by-products, totaled $800.2 million in 2012, a decrease of 11.7% compared to revenues of $906.0 million in 2011. This year-on-year decrease in total revenues reflects lower PGM prices in 2012 as compared to 2011, as well as lower mine sales volumes in 2012.
Revenues from mine production totaled $455.4 million in 2012 (including $30.6 million from by-products), a decrease of 13.7% compared to $528.0 million in 2011 (of which $36.0 million was from by-products). Palladium and platinum ounces sold from mine production were 500,400 in 2012, compared to 516,200 ounces in 2011. The combined average realization on these palladium and platinum sales was $849 per ounce in 2012 and $953 per ounce in 2011.
Revenues from PGM recycling reflected a decrease of 8.5% during 2012, to $344.8 million from $376.8 million in 2011. Recycling ounces sold during 2012 totaled 336,500 ounces, an increase of 9.9% compared to the 306,200 sold in 2011. The Company’s combined average realization on recycling sales (which include palladium, platinum and rhodium) decreased to $1,018 per ounce in 2012 from $1,218 per ounce in 2011, paralleling the decreases in PGM prices generally. In addition to purchased recycling material, the Company toll processed 98,800 ounces of PGMs during 2012, a decrease from 171,600 tolled ounces in 2011. Overall, recycling volumes processed during 2012 totaled 445,200 ounces of PGMs, a decrease of 8.5% from the 486,700 ounces processed in 2011, as weaker PGM prices in 2012 slowed the volume of recycled catalytic converters
available in the market.
In addition to mine and recycled metal sales, the Company makes open market purchases of PGMs from time to time for resale to third parties. During 2012 the Company did not incur any open market purchases but in 2011 it recognized other revenue of $1.1 million for metal purchased in the open market.
Costs of Metals Sold – Cost of metals sold, which excludes depletion, depreciation and amortization expense, was $623.9 million in 2012, compared to $629.3 million in 2011, a negligible decrease of 0.9%. Overall, recycling cost of metals sold decreased to $334.9 million in 2012 from $358.6 million in 2011. The average acquisition cost of metal purchased in the Company’s recycling segment (including palladium, platinum and rhodium) decreased to $946 per ounce in 2012 from $1,127 per ounce in 2011, reflecting lower PGM prices in 2012 in response to reduced demand from the automotive and investment sectors. The cost of metals sold from mine production, totaled $288.9 million in 2012, compared to $269.6 million in the prior year, an increase of 7.2%.
During 2012, the Company’s mining operations produced 513,700 ounces of PGMs, including 395,900 ounces of palladium and 117,800 ounces of platinum. This represents an immaterial decrease of 0.8% from 2011, when the Company’s mining operations produced 517,900 ounces of PGMs, including 398,900 ounces of palladium and 119,000 ounces of platinum. The Stillwater Mine produced 377,400 ounces of PGMs in 2012, compared with 386,900 ounces of PGMs in 2011, a decrease of 2.5%. The East Boulder Mine produced 136,300 ounces of PGMs in 2012, an increase of 4.0% compared with the 131,000 ounces of PGMs produced there in 2011.
In addition to cost of metals sold from mine and recycled metal sales, the Company recognized $1.1 million in costs in 2011 for open market purchases. The Company had no open market purchases for resale during 2012.
Depletion, depreciation and amortization – Depletion, depreciation and amortization expense was $58.0 million in 2012, compared to $62.4 million in 2011. The decrease in expense in 2012 was partially due to slightly lower mine production, as well as greater capitalization of mine support costs associated with the Blitz and Graham Creek projects.
Marketing – The Company continued its market development efforts for palladium during 2012. The Company spent $11.2 million in support of marketing programs during 2012, a decrease from $11.8 million in 2011.
General and administrative – Excluding marketing expenses discussed above, general and administrative costs were $40.9 million in 2012, compared to $42.1 million in 2011, a decrease of about 2.9%. The Company recognized $15.0 million in exploration expenses related to its mineral properties in both Canada and South America in 2012 and $2.5 million in 2011. The Company incurred $1.2 million in research and development expense in 2012 related to refining processes compared to $2.2 million in 2011. In 2012 and 2011, other corporate costs included a $0.6 million provision for the write-off of uncollectable recycling inventory advances.
Interest income and expense – Interest income decreased to $2.3 million in 2012 from $3.6 million in 2011, reflecting lower interest rates and decreased financing income on recycling balances in 2012. The Company’s balance of cash and related liquid assets earning interest increased significantly during the 2012 fourth quarter to $641.7 million at December 31, 2012, from $158.6 million reported at December 31, 2011. The large increase was a direct result of net proceeds of $384.3 million received from the issuance of $396.75 million convertible debentures in the fourth quarter of 2012. Inventories and advances associated with recycling increased to $87.8 million at year-end 2012 from $64.5 million at the end of 2011. The Company’s outstanding long-term debt balance was $292.7 million at December 31, 2012, an increase from $196.0 million at December 31, 2011. Interest expense for years 2012 and 2011 was $10.9 million and $6.5 million, respectively.
Foreign currency transaction gain – The Company recorded a foreign currency transaction gain of $15.2 million in 2012, compared to a gain of $3.2 million in 2011. About $15.4 million and $3.0 million of the 2012 and 2011 gain, respectively, related to the remeasurement into U.S. dollars of the deferred taxes recorded in association with the acquisition of Peregrine Metals Ltd. The gain reflects the effect of the high inflation rate in Argentina as the obligation is remeasured from pesos into U.S. dollars.
Other comprehensive income gain/(loss), net of tax – The Company recorded a gain in other comprehensive income of $0.9 million in 2012 compared to a loss of $0.1 million in 2011. The 2012 and 2011 activity in each case represented net unrealized gains or losses on investments.
YEAR ENDED DECEMBER 31, 2011 COMPARED TO YEAR ENDED DECEMBER 31, 2010
Revenues – The Company’s total revenues, including proceeds from the sale of by-products, totaled $906.0 million in 2011, an increase of 63.0% compared to revenues of $555.9 million in 2010. This substantial year-on-year increase in total
revenues reflects much higher recycling sales volumes in 2011 as compared to 2010, as well as higher PGM prices realized in 2011.
Revenues from mine production totaled $528.0 million in 2011 (including $36.0 million from by-products), up 38.6% compared to $381.0 million in 2010 (of which $28.0 million was from by-products). Palladium and platinum ounces sold from mine production were 516,200 in 2011, compared to 489,400 ounces in 2010. The combined average realization on these palladium and platinum sales (including the effects of hedging and of floor and ceiling prices in the underlying agreements) was $953 per ounce in 2011 and $721 per ounce in 2010.
Revenues from PGM recycling reflected an increase of 123.5% during 2011, to $376.8 million from $168.6 million in 2010. Recycling ounces sold during 2011 totaled 306,200 ounces, an increase of 96.2% compared to the 156,100 ounces sold in 2010. The Company’s combined average realization on recycling sales (which include palladium, platinum and rhodium) increased to $1,218 per ounce in 2011 from $1,046 per ounce in 2010, paralleling the increases in PGM prices generally. In addition to purchased recycling material, the Company toll processed 171,600 ounces of PGMs during 2011, a decrease from 235,900 tolled ounces in 2010. Overall, recycling volumes processed during 2011 totaled 486,700 ounces of PGMs, an increase of 21.9% from the 399,400 ounces processed in 2010, as stronger PGM prices in 2011 increased the volume of recycled catalytic converters available in the market.
In addition to mine and recycled metal sales, the Company recognized other revenue of $1.1 million and $6.2 million for metal purchased in the open market and resold in 2011 and 2010, respectively.
Costs of Metals Sold – Cost of metals sold, which excludes depletion, depreciation and amortization expense, was $629.3 million in 2011, compared to $393.7 million in 2010, an increase of 59.8% . The largest share of this increase was attributable to recycling. Volumes of purchased recycling material were sharply higher in 2011, which along with higher PGM prices increased the total cost to purchase recycling material. Overall, recycling cost of metals sold increased to $358.6 million in 2011 from $157.3 million in 2010. The average acquisition cost of metal purchased in the Company’s recycling segment (including palladium, platinum and rhodium) increased to $1,127 per ounce in 2011 from $1,015 per ounce in 2010, reflecting higher PGM prices in 2011 in response to strengthened demand from the automotive and investment sectors.
During 2011, the Company’s mining operations produced 517,900 ounces of PGMs, including 398,900 ounces of palladium and 119,000 ounces of platinum. This represents a 6.8% increase from 2010, when the Company’s mining operations produced 485,100 ounces of PGMs, including 374,100 ounces of palladium and 111,000 ounces of platinum. The Stillwater Mine produced 386,900 ounces of PGMs in 2011, compared with 351,700 ounces of PGMs in 2010, a 10.0% increase. The East Boulder Mine produced 131,000 ounces of PGMs in 2011, down 1.8% compared with the 133,400 ounces of PGMs produced there in 2010.
The cost of metals sold from mine production, totaled $269.6 million in 2011, compared to $230.0 million in the prior year, an increase of 17.2%. The Company’s mining costs increased during 2011 partly as a result of the lower ore grade realized at the Stillwater Mine.
The cost of metals sold for metal purchased in the open market for resale was $1.1 million in 2011, compared to $6.4 million in 2010.
Depletion, depreciation and amortization – Depletion, depreciation and amortization expense was $62.4 million in 2011, compared to $71.6 million in 2010. The decrease in expense in 2011 was mostly the result of a significant number of the Company’s assets reaching the end of their useful lives for depreciation expense recognition at the end of 2010. The Company has concentrated its capital spending on mine development over the recent years.
Marketing – The Company expanded its market development efforts for palladium during 2011. The Company spent $11.8 million in support of marketing programs during 2011, an increase from $2.4 million in 2010.
General and administrative – Excluding marketing expenses discussed above, general and administrative costs were $42.1 million in 2011, compared to $33.0 million in 2010, an increase of 27.4% including $5.8 million in financing expenses and $4.3 million in expenses related to the acquisition of Peregrine. The Company recognized $2.5 million in exploration expenses related to its mineral properties in both Canada and South America and $2.2 million in research and development expense in 2011 related to refining processes. No related exploration or research and development expenses were recognized in 2010. In 2011 and 2010, other corporate costs included a $0.6 million provision for uncollectable advances.
Interest income and expense – Interest income increased to $3.6 million in 2011 from $2.1 million in 2010, reflecting higher interest rates and increased financing income on recycling balances in 2011. The Company’s balance of cash and related liquid assets earning interest decreased to $158.6 million at December 31, 2011, from $208.4 million reported at December 31,
2010. Inventories and advances associated with recycling increased to $64.5 million at year-end 2011 from $41.5 million at the end of 2010. The Company’s outstanding long-term debt balance was $196.0 million at December 31, 2011, unchanged from $196.0 million at December 31, 2010. Interest expense for years 2011 and 2010 was $6.5 million.
Foreign currency transaction gain – The Company recorded a foreign currency transaction gain of $3.2 million in 2011, compared to a gain of $0.1 million in 2010. About $3.0 million of the 2011 gain related to the remeasurement into U.S. dollars of the deferred tax liability recorded in association with the acquisition of Peregrine Metals Ltd.
Other comprehensive income (loss), net of tax – The Company recorded a loss in other comprehensive income of $0.1 million in 2011 compared to a loss of $0.8 million in 2010. The 2011 and 2010 activity in each case represented net unrealized gains or losses on investments.
LIQUIDITY AND CAPITAL RESOURCES
For 2012, net cash provided by operating activities was $103.9 million compared to $219.7 million and $123.9 million for 2011 and 2010, respectively. The Company’s net cash flow from operating activities is affected by several key factors, including net realized prices for its products, cash costs of production, and the level of PGM production from the mines. Mining productivity rates and ore grades in turn can affect both PGM production and cash costs of production. Net cash flow from operations also includes changes in non-cash working capital, including changes to inventories and advances.
At December 31, 2012 and 2011, the Company’s available balance of cash and cash equivalents and highly liquid short-term investments (excluding restricted cash) was $641.7 million and $158.6 million, respectively, and it reported $461.1 million of debt outstanding at December 31, 2012, and $196.0 million of debt outstanding at December 31, 2011. Available cash and cash equivalents at December 31, 2012 and 2011, was $379.7 million and $109.1 million, respectively.
In addition to available cash and short-term securities, the Company also has access to a $125 million asset-backed revolving credit facility. The amount available to be drawn under this facility is restricted by a contractual borrowing base computation. To date this line has been utilized only to collateralize irrevocable letters of credit. Cash drawings under this credit line bear interest at a spread over LIBOR; the spread varies according to a matrix depending on the amount of utilization under the line. Letters of credit and the unused facility balance bear interest at specified fixed rates. As of December 31, 2012, the Company's remaining availability under the borrowing base was approximately $72.2 million.
The Company, at interest rate levels prevailing at December 31, 2012, will be required to fund approximately $11.2 million in total interest payments during 2013 related to its outstanding debt obligations. The Company's $166.5 million of outstanding 1.875% senior convertible debentures are redeemable at par at the discretion of the holders on March 15, 2013. The Company expects all of these outstanding debentures to be redeemed at that time.
In December of 2009, Standard and Poor's upgraded the Company's debt rating from B- to B, citing improved market conditions and adequate liquidity. In July 2011, Moody's Investors Service upgraded the Company's corporate family rating from Caa1 to B2 with a stable outlook. These represent the Company's current corporate ratings. Both Moody's Investors Service and Standard and Poor's had downgraded the Company's corporate credit rating during 2008 as economic conditions deteriorated. At issue had been the Company's strong dependence on its automotive agreements, lack of geographic or product diversity, metal market price volatility, and difficult cost structure.
The Company’s financial performance is affected by changes in PGM prices. Absent separate hedging arrangements, any change in the price of palladium or platinum generally would flow through almost dollar-for-dollar to cash flow from operations, subject only to certain costs – severance taxes and royalties on mine production – which adjust upward or downward with market prices. At the forecasted 2013 mine production level of 500,000 combined PGM ounces, a one-dollar change in the price of platinum would affect annual cash generated from mining operations by about $0.1 million, and a corresponding change in the price of palladium would affect annual cash generation from mining operations by about $0.4 million. The sensitivity of the recycling business to changes in palladium and platinum prices is more muted and varies according to the provisions in the various recycling agreements. In the Company’s recycling activities, upon purchasing recycled material for processing the Company simultaneously enters into a fixed forward contract that determines the future selling price of the contained PGMs, effectively locking in a sales margin.
Changes in the cash costs of production generally flow through dollar-for-dollar into cash flow from operations. A reduction due to grade in total mine production of 10%, or about 50,000 ounces per year, would reduce cash flow from operations by an estimated $43.7 million per year at the price and cost levels prevailing at December 31, 2012.
During the third quarter of 2010, the Company revised its cash management guidelines to extend the available investment maturities on a portion of its cash balances, broaden the suite of permissible investments, and adjust the percentage limits on certain classes of investments. As a result, during 2010 most of the Company’s cash holdings were transferred into short-term investments. As of December 31, 2012, all of these short-term investments remain highly liquid, but technically they no longer meet the strict definition of cash and cash equivalents. Net cash used in investing activities was $324.8 million, $129.6 million and $272.0 million in 2012, 2011 and 2010, respectively. The Company’s investing activities primarily represent capital outlay and net sales and purchases of short term investments. Capital expenditures totaled $112.1 million, (adjusted to include incurred but unpaid obligations at the end of 2012) $101.9 million and $50.3 million in 2012, 2011 and 2010, respectively. The Company also expended $166.4 million (along with 12.03 million shares of Company common stock with a fair value upon issuance of $96.5 million) in 2011 and $67.5 million in cash (along with 3.88 million shares of Company common stock with a fair value of $73.4 million) in 2010 to acquire equity interests in exploration companies and properties. No such acquisitions were made in 2012.
All significant company-wide repair and maintenance costs in connection with planned major maintenance activities are expensed as incurred. The Company does not accrue in advance for major maintenance activities, but, when practicable, tries to disclose in advance in its public filings any planned major maintenance activities that may affect operations.
Net cash provided by or (used in) financing activities equaled $491.5 million, $(0.4) million and $0.8 million in 2012, 2011 and 2010, respectively.
1.875% CONVERTIBLE DEBENTURES
In March 2008, the Company issued and sold $181.5 million aggregate principal amount of senior convertible debentures due in 2028 (debentures). The debentures pay interest at 1.875% per annum, payable semi-annually on March 15 and September 15 of each year, commencing September 15, 2008. The debentures will mature on March 15, 2028, subject to earlier repurchase or conversion. Each $1,000 principal amount of debentures is initially convertible, at the option of the holders, into approximately 42.5351 shares of the Company's common stock, at any time prior to the maturity date. The conversion rate is subject to certain adjustments, but will not be adjusted for accrued interest or any unpaid interest. The conversion rate initially represents a conversion price of $23.51 per share. Holders of the debentures may require the Company to repurchase all or a portion of their debentures on March 15, 2013, March 15, 2018 and March 15, 2023, or upon the occurrence of certain events including a change in control. The Company may redeem the debentures for cash at any time on or after March 22, 2013.
The debentures were sold to an “accredited investor” within the meaning of Rule 501 under the Securities Act of 1933, as amended (the “Securities Act”), in reliance upon the private placement exemption afforded by Section 4(2) of the Securities Act. The initial investor offered and resold the debentures to “qualified institutional buyers” under Rule 144A of the Securities Act.
In October 2009, the Company undertook the exchange of $15.0 million face amount of the convertible debentures for 1.84 million shares of the Company's common stock. Because the number of shares issued in this transaction exceeded the 42.5351 shares per $1,000 of face value specified in the bond indenture, accounting principles required that the Company expense the value of the excess shares as an “inducement loss.” Consequently, the Company recorded a loss on the exchange transaction of $8.1 million during the fourth quarter of 2009. The debentures so acquired have been retired, leaving $166.5 million face value of the debentures outstanding at December 31, 2012.
The outstanding $166.5 million of convertible debentures will reach their date of first call on March 15, 2013. Absent a significant change in the share price of the Company, the Company believes most holders are likely to redeem their debentures at par, or should the share price be at or above the $23.51 conversion price, convert them into Company shares. If the debentures were to all convert, the Company would be required to issue about 7.1 million new shares of common stock.
1.75% CONVERTIBLE DEBENTURES
In October 2012, the Company completed the issuance of $396.75 million of 1.75% senior unsecured convertible debentures, due October 15, 2032. Each $1,000 principal amount of these new debentures is initially convertible, under certain circumstances and during certain periods, into 60.4961 shares (subject to customary anti-dilution adjustments) of the Company's common stock, which represents an initial conversion price of $16.53 per share. The debentures also include an embedded conversion enhancement feature that is equivalent to including with each debenture a warrant initially exercisable for 30.2481 shares initially at $16.53 per share (both subject to customary anti-dilution adjustments). The Company, at its election, may settle conversions of the debentures in cash, shares of its common stock or any combination of cash and shares of its common stock. Debenture holders have the right to redeem their debentures at face value plus accrued and unpaid interest, to, but excluding, the relevant repurchase date on October 15 of each of 2019, 2024, 2029, and upon the occurrence of certain
corporate events. The Company will have the right to call the debentures at any time on or after October 20, 2019. The debentures were bifurcated under U.S. GAAP into separate debt and equity components, and reflect an effective maturity (to the first optional redemption date) of seven years. The residual amount recorded within equity is treated for accounting purposes as additional debt discount and accreted as an additional non-cash interest charge to earnings over the expected life. Debt and equity issuance costs totaling about $12.4 million were deducted from the gross proceeds of the offering and the debt portion is being amortized ratably over 84 months. Net proceeds of the offering will be used to retire the Company's $166.5 million of outstanding 1.875% convertible debentures upon their expected redemption in March of 2013, and for general corporate purposes.
Amortization of deferred debt issuance costs and interest expense related to the issuance of the 1.75% senior unsecured convertible debentures was $0.2 million and $4.5 million, respectively, for the period ending December 31, 2012. The Company made no cash payments of interest for the period ending December 31, 2012.
ASSET-BACKED REVOLVING CREDIT FACILITY
In December 2011, the Company entered into a $100.0 million asset-backed revolving credit agreement with Wells Fargo Capital Finance, incurring initial debt issuance costs of $1.1 million. Maximum permitted borrowings under this working capital facility at any time are determined by a borrowing base comprised of 85% of eligible accounts receivable and 70% of eligible inventories. Terms of the agreement state that the borrowings will be secured primarily by the Company's accounts receivable, metals inventories and other accounts. The credit agreement includes a financial covenant requiring, whenever the remaining availability under the line is less than 30% of the total borrowing capacity, that the Company's fixed charge coverage ratio be at least 1.0 to 1.0. It also includes other customary restrictions that become tighter as drawings under the facility increase. The facility includes a $50.0 million letter of credit sub-facility. Outstanding borrowings under the revolving credit facility accrue interest at a spread over the London Interbank Offer Rate that varies from 2.25% to 2.75%, decreasing progressively as the percentage drawn against the facility increases. The Company also pays an unused line fee on committed but unutilized commitments under the facility at a rate per annum of 0.375% or 0.5%, depending on utilization of the facility. On January 13, 2012, the Company completed the syndication of this facility to a group of four banks and simultaneously expanded the maximum line of credit to $125.0 million, incurring additional debt issuance costs of $0.2 million. At December 31, 2012, the Company’s remaining availability under the borrowing base was approximately $72.2 million.
CONTRACTUAL OBLIGATIONS
The Company is obligated to make future payments under various debt agreements and regulatory obligations. The following table represents significant contractual cash obligations and other commercial commitments and regulatory commitments, including related interest payments, as of December 31, 2012:
|
| | | | | | | | | | | | | | | | | | | | | | | | | | | | |
| (In thousands) | | 2013 | | 2014 | | 2015 | | 2016 | | 2017 | | Thereafter | | Total |
| 1.875% Convertible debentures | | $ | 166,500 |
| | $ | — |
| | $ | — |
| | $ | — |
| | $ | — |
| | $ | — |
| | $ | 166,500 |
|
| 1.75% Convertible debentures | | — |
| | — |
| | — |
| | — |
| | — |
| | 396,750 |
| | 396,750 |
|
| Exempt Facility Revenue Bonds | | — |
| | — |
| | — |
| | — |
| | — |
| | 30,000 |
| | 30,000 |
|
| Land purchase | | 93 |
| | 89 |
| | 85 |
| | 81 |
| | — |
| | — |
| | 348 |
|
| Operating leases | | 467 |
| | 396 |
| | 146 |
| | 146 |
| | 130 |
| | — |
| | 1,285 |
|
| Capital lease obligation | | 1,855 |
| | 1,958 |
| | 2,066 |
| | 580 |
| | — |
| | — |
| | 6,459 |
|
| Asset retirement obligations | | — |
| | — |
| | — |
| | — |
| | — |
| | 144,271 |
| | 144,271 |
|
Payments of interest (1) | | 11,218 |
| | 9,554 |
| | 9,445 |
| | 9,351 |
| | 9,343 |
| | 18,440 |
| | 67,351 |
|
| Other liabilities | | 13,686 |
| | 5,060 |
| | — |
| | — |
| | — |
| | — |
| | 18,746 |
|
| Total | | $ | 193,819 |
| | $ | 17,057 |
| | $ | 11,742 |
| | $ | 10,158 |
| | $ | 9,473 |
| | $ | 589,461 |
| | $ | 831,710 |
|
| |
| (1) | Interest payments on the 1.875% convertible debentures noted in the above table are calculated up to March 15, 2013, the date the holders of the debentures can exercise their put option. |
Interest payments on the 1.75% convertible debentures noted in the above table are calculated up to October 15, 2019, the date the holders of the debentures can exercise their put option.
(2) Amounts included in other liabilities that are anticipated to be paid in 2013 include property taxes and severance taxes.
FACTORS THAT MAY AFFECT FUTURE RESULTS AND FINANCIAL CONDITION
Some statements contained in this report are forward-looking statements within the meaning of Section 27A of the Securities Act of 1933, as amended, and Section 21E of the Securities Exchange Act of 1934, as amended, and, therefore,
involve uncertainties or risks that could cause actual results to differ materially. These statements may contain words such as “believes,” “anticipates,” “plans,” “expects,” “intends,” “estimates” or similar expressions. Such statements also include, but are not limited to, comments regarding expansion plans, costs, grade, production and recovery rates; permitting; financing needs and the terms of future credit facilities; exchange rates; capital expenditures; increases in processing capacity; cost reduction measures; safety; timing for engineering studies; environmental permitting and compliance; litigating; labor matters; and the palladium, platinum, copper and gold market. These statements are not guarantees of the Company’s future performance and are subject to risks, uncertainties and other important factors that could cause its actual performance or achievements to differ materially from those expressed or implied by these forward-looking statements.
The Company intends that the forward-looking statements contained herein be subject to the above-mentioned statutory safe harbors. Investors are cautioned not to rely on forward-looking statements. The Company disclaims any obligation to update forward-looking statements.
CRITICAL ACCOUNTING POLICIES
PRODUCTION MEASUREMENT
The Company’s production levels for palladium and platinum are driven by the number of ore tons mined, the mill head grade of the ore and the metallurgical recovery percentages. The Company measures its net mine production in terms of the number of ounces contained in the mill concentrate, adjusted for subsequent processing losses expected to be incurred in smelting and refining. The Company defines an ounce of metal as “produced” at the time it is transferred from the mine and received at the concentrator. Depletion, depreciation and amortization costs are inventoried at each stage of production.
MINE DEVELOPMENT EXPENDITURES – CAPITALIZATION AND AMORTIZATION
Mining operations are inherently capital intensive, generally requiring substantial capital investment for the initial and concurrent development and infrastructure of the mine. Many of these expenditures are necessarily incurred well in advance of actual extraction of ore. Underground mining operations such as those conducted by the Company require driving adits and sinking shafts that provide access to the underground ore body and construction and development of infrastructure, including electrical and ventilation systems, rail and other forms of transportation, shop facilities, material handling areas and hoisting systems. Ore mining and removal operations require significant underground facilities used to conduct mining operations and to transport the ore out of the mine to processing facilities located above ground.
Contemporaneously with mining, additional development is undertaken to provide access to ongoing extensions of the ore body, allowing more ore to be produced. In addition to the development costs that have been previously incurred, these ongoing development expenditures are necessary to access and support all future mining activities.
Mine development expenditures incurred to date to increase existing production, develop new ore bodies or develop mineral property substantially in advance of production are capitalized. Mine development expenditures consist of vertical shafts, multiple surface adits and underground infrastructure development including footwall laterals, ramps, rail and transportation, electrical and ventilation systems, shop facilities, material handling areas, ore handling facilities, dewatering and pumping facilities. Many such facilities are required not only for current operations, but also for all future planned operations.
Expenditures incurred to sustain existing production and access specific ore reserve blocks or stopes provide benefit to ore reserve production over limited periods of time (secondary development) and are charged to operations as incurred. These costs include ramp and stope access excavations from primary haulage levels (footwall laterals), stope material rehandling/laydown excavations, stope ore and waste pass excavations and chute installations, stope ventilation raise excavations and stope utility and pipe raise excavations.
The Company calculates amortization of capitalized mine development costs by the application of an amortization rate to current production. The amortization rate for each relevant geological area within a mine is based upon un-amortized capitalized mine development costs and the related ore reserves associated with that area. Capital development expenditures are added to the un-amortized capitalized mine development costs as the related development assets are placed into service. In the calculation of the amortization rate, changes in ore reserves are accounted for as a prospective change in estimate. Ore reserves and the further benefit of capitalized mine development costs are based on significant management assumptions. Any changes in these assumptions, such as a change in the mine plan or a change in estimated proven and probable ore reserves could have a material effect on the expected period of benefit, resulting in a potentially significant change in the amortization rate and/or the valuations of related assets. The Company's proven ore reserves are generally expected to be extracted utilizing its existing mine development infrastructure. Additional capital expenditures will be required to access the Company's estimated probable ore reserves. These anticipated capital expenditures are not included in the current calculation of depletion, depreciation and amortization.
The Company’s method of accounting for development costs is as follows:
| |
| • | Unamortized costs of the shaft at the Stillwater Mine, the initial development at the East Boulder Mine, general mine development and tailings impoundments are treated as life-of-mine infrastructure costs, amortized over total proven and probable reserves at each location, and |
| |
| • | All ongoing development costs of footwall laterals, ramps and associated facilities are amortized over the ore reserves in the immediate and geologically relevant vicinity of the development. |
The calculation of the amortization rate, and therefore the annual amortization charge to operations, could be materially affected to the extent that actual production in the future is different from current forecasts of production based on proven and probable ore reserves. This would generally occur to the extent that there were significant changes in any of the factors or assumptions used in determining ore reserves. These factors could include: (1) an expansion of proven and probable ore reserves through development activities, (2) differences between estimated and actual costs of mining due to differences in ore grades or metal recovery rates, and (3) differences between actual commodity prices and commodity price assumptions used in the estimation of ore reserves.
ASSET IMPAIRMENT
The Company reviews and evaluates its long-lived assets for impairment when events or changes in circumstances indicate that the related carrying amounts may not be recoverable. Impairment is considered to exist if total estimated future cash flows on an undiscounted basis are less than the carrying amount of the asset. The estimation of future cash flows takes into account estimates of recoverable ounces, PGM prices (long-term sales contract prices and historical pricing trends or third-party projections of future prices rather than prices at a point in time as an indicator of longer-term future prices), production levels, and capital and reclamation expenditures, all based on life-of-mine plans and projections. If the assets are impaired, a determination of fair market value is performed, and if fair market value is lower than the carrying value of the assets, the assets are reduced to their fair market value.
Assumptions underlying future cash flows are subject to risks and uncertainties. Any differences between significant assumptions and market conditions such as PGM prices, lower than expected recoverable ounces, and/or the Company's operating performance could have a material effect on the Company's determination of ore reserves, or its ability to recover the carrying amounts of its long-lived assets, resulting in potential additional impairment charges.
Costs incurred to maintain assets on a standby basis are charged to operations. Costs of abandoned projects are charged to operations upon abandonment. The Company assesses, at least quarterly, whether there has been any event or change in circumstances that might indicate that the carrying value of capitalized mining costs and related property, plant and equipment, if any, may not be recoverable out of expected future cash flows and estimated salvage value. If so, the Company then determines if these costs are in excess of their net undiscounted realizable value and, should that be the case, reduces the carrying value of the respective assets to their fair value.
FOREIGN CURRENCY TRANSACTION
With the acquisitions in 2010 and 2011 of certain Canadian and South American assets, the Company now regularly incurs capital and operating expenditures denominated in a foreign currency. The Company has determined that the functional currency for its subsidiaries is the U.S. dollar and therefore reflects all assets, liabilities and expenditures in U.S. dollars for accounting purposes. The Company uses a monthly average exchange rate for converting minor foreign currency expenditures into U.S. dollars, and uses the actual exchange rate incurred in accounting for larger transactions. For balance sheet purposes, monetary assets and liabilities in foreign currencies are recorded based on the exchange rate at the end of the respective period. Any net accounting difference that results from exchange rate differences is recorded as a foreign exchange gain or loss for the relevant period on the consolidated statement of operations.
INCOME TAXES
With the acquisitions in 2010 and 2011 of certain Canadian and South American assets, the Company now is subject to federal and provincial income taxes on its Canadian activities and federal income taxes on its South American activities as well as being subject to U.S. state and federal income taxes.
Income taxes are determined using the asset and liability method. This method gives consideration to the future tax consequences of temporary differences between the carrying amounts and the tax bases of assets and liabilities based on currently enacted tax rates. The effect on deferred tax assets and liabilities of a change in tax rates is recognized in income in the period that includes the enactment date. Deferred taxes associated with the Company's Canadian and South American activities are recorded using the assumption that future earnings and profits associated with these activities will not be repatriated into the U.S. but will be fully utilized in Canada and South America.
In assessing the realizability of deferred tax assets, management considers whether it is more likely than not that some portion or all of the deferred tax assets will not be realized. Each quarter, management considers the scheduled reversal of deferred tax liabilities, projected future taxable income, and tax planning strategies in making this assessment. A valuation allowance has been provided at December 31, 2012 and 2011, for the portion of the Company's net deferred tax assets and certain credits for which it is “more likely than not” that they will not be realized.
POST-CLOSURE RECLAMATION COSTS
The Company recognizes the fair value of a liability for an asset retirement obligation in the period in which it is incurred if a reasonable estimate of fair value can be made. The fair value of the liability is added to the carrying amount of the associated asset and this additional carrying amount is depreciated over the life of the asset. The liability is accreted at the end of each period through charges to operating expense. If the obligation ultimately is settled for other than the carrying amount of the liability, the Company will recognize a gain or loss at the time of settlement.
Accounting for reclamation obligations requires management to make estimates for each mining operation of the timing and amount of future costs the Company will incur to complete final reclamation work required to comply with existing laws and regulations. Actual costs incurred in future periods could differ from amounts estimated. Additionally, future changes to environmental laws and regulations could increase the extent of reclamation and remediation work that the Company is required to perform. Any such increases in future costs could materially affect the amounts charged to operations for reclamation and remediation.
The Company reviewed its asset retirement assumptions at December 31, 2012 and 2011, and determined no corresponding adjustment was required at December 31, 2012 and 2011. See Note 17 “Asset Retirement Obligation” to the Company’s 2012 audited consolidated financial statements for further information.
DERIVATIVE INSTRUMENTS
The Company from time to time may enter into derivative financial instruments, including fixed forward sales, cashless put and call option collars and financially settled forward sales to manage the effect of changes in the prices of palladium and platinum on the Company's revenue. Derivatives are reported on the balance sheet at fair value and, if the derivative is not designated as a hedging instrument, changes in fair value are recognized in earnings in the period of change. If the derivative is designated as a hedge and to the extent such hedge is determined to be highly effective, changes in fair value are either (a) offset by the change in fair value of the hedged asset or liability (if applicable) or (b) reported as a component of other comprehensive income in the period of change, and subsequently recognized in the determination of net income in the period the offsetting hedged transaction occurs. The Company primarily uses derivatives to hedge metal prices and to manage interest rate risk. In the future the Company may also enter into foreign currency hedges to stabilize costs incurred in foreign currencies. The Company at times has entered into financially settled forwards related to its recycling segment which are not accounted for as cash flow hedges. The realized and unrealized gains or losses are recognized in net income in each period. See Note 6 “Derivative Instruments” to the Company’s 2012 audited consolidated financial statements for further information.
ITEM 7A
QUANTITATIVE AND QUALITATIVE DISCLOSURE ABOUT MARKET RISK
The Company is exposed to market risk, including the effects of adverse changes in metal prices, interest rates and foreign currencies as discussed below.
COMMODITY PRICE RISK
The Company produces and sells palladium, platinum and associated by-product metals directly to its customers and also through third parties. As a result, financial performance can be materially affected when prices for these commodities fluctuate. In order to manage commodity price risk and to reduce the impact of fluctuation in prices, the Company has entered into long-term agreements with suppliers and customers, from time to time has employed various derivative financial instruments and attempts to maintain adequate liquidity to sustain operations during a downturn in PGM prices. Because the Company hedges only with instruments that have a high correlation with the value of the hedged transactions, changes in the fair value of the derivatives are expected to be highly effective in offsetting changes in the value of the hedged transaction.
The Company customarily enters into fixed forward sales and from time to time in the past has entered into financially settled forward sales transactions that may or may not be accounted for as cash-flow hedges to mitigate the price risk in its PGM recycling and mine production activities. Under these fixed forward transactions, typically metals contained in the spent catalytic materials are sold forward at the time the materials are purchased and then are delivered against the fixed forward contracts when the finished ounces are recovered. The Company believes such transactions qualify for the exception to hedge
accounting treatment provided for in the accounting literature and so has elected to account for these transactions as normal purchases and normal sales.
Financially settled forward sales provide a mechanism to offset fluctuations in metal prices associated with future production in those circumstances where the Company elects to retain control of the final disposition of the metal. In financially settled forward sales, the parties agree in advance to a net financial settlement in the future based on the difference between the market price of the metal on the settlement date and a forward price set at inception. Consequently, at the settlement date, the Company receives the difference between the forward price and the market price if the market price is below the forward price, and the Company pays the difference between the forward price and the market price if the market price is above the forward price. No metal changes hands between the parties in these financially settled transactions. The Company generally has accounted for financially settled forward transactions as cash flow hedges, as they are not eligible for treatment as normal purchases and normal sales. However, if the Company determines not to document them as cash flow hedges, these transactions are marked to market in each accounting period and the realized and unrealized gains or losses are recognized in net income in each period. As of December 31, 2012 and 2011, the Company was not party to any financially settled forward agreements.
Periodically, the Company also has entered into financially settled forwards related to its recycling segment which are not accounted for as cash flow hedges. The realized and unrealized gains or losses on such transactions therefore are recognized in net income in each period.
INTEREST RATE RISK AND INVESTMENT RISK
At December 31, 2012, all of the Company's outstanding long-term debt was subject to fixed rates of interest. Interest income on payments to the Company's recycling suppliers is generally linked to short-term inter-bank rates. Undrawn letters of credit issued under the Company's revolving credit facility carry a fixed contractual rate of interest, although any cash drawings against the facility would be subject to a floating interest rate. There were no such drawings outstanding as of December 31, 2012 and 2011.
The Company's convertible debentures and industrial revenue bonds do not contain financial covenants, other than change in control protection and, in the case of the convertible debentures, investor make-whole provisions. The Company's asset-backed revolving credit facility includes a single fixed charge coverage covenant that only takes effect when less than 30% of the total borrowing capacity under the line remains available. Because there were no drawings under the revolving credit facility at December 31, 2012, the Company is not constrained by conventional financial covenants at this time. With the recent issue of the $396.75 million convertible debentures, the Company has a higher level of indebtedness, which could affect the Company's ability to pay the principal of and interest on the notes and its creditworthiness in general.
The Company may from time to time invest excess cash balances in short-term instruments. Recent market conditions affecting certain types of short-term investments of some issuers as well as certain financial institutions have resulted in heightened risk in holding some of these investments. There can be no guarantee that further market disruptions affecting various short-term investments or the potential failure of financial institutions will not have a negative effect on the price and liquidity of investments made by the Company.
FOREIGN CURRENCY RISK
With the acquisition of the Marathon assets in Canada in 2010, the Company first gained some modest exposure to fluctuations in the exchange rate between the Canadian dollar and the U.S. dollar. Similarly, the Peregrine acquisition in 2011 has created further exposure to Canadian, Argentine and other foreign currencies. While these exposures currently are limited to foreign cash deposits and expenses incurred for the services of a few foreign-based employees and contractors, along with some associated support costs, as the Company's foreign commitments expand in the future, the exposure will become more material. The Company does not generally hedge this exposure at present, but may consider doing so in the future as the scale of its foreign operations grows.
The Company is exposed to a significant inflation rate in its holdings of Argentine pesos. During 2012, the Company recorded a foreign currency transaction gain of $15.4 million on deferred taxes recorded in association with the acquisition of Peregrine Metals Ltd. The gain was a result of the strengthening of the U.S. dollar in comparison with the Argentine peso. As the deferred taxes will be settled at a future date in pesos, changes in the relative currency values are recognized in the period within Foreign currency transaction gain/(loss) on the Company's Consolidated Statements of Operations and Comprehensive Income. The Company does not generally hedge this exposure at present, but may consider doing so in the future as the scale of its foreign operations grows.
ITEM 8
CONSOLIDATED FINANCIAL STATEMENTS AND SUPPLEMENTARY DATA
Report of Independent Registered Public Accounting Firm
The Board of Directors and Stockholders
Stillwater Mining Company and Subsidiaries:
We have audited the accompanying consolidated balance sheets of Stillwater Mining Company and subsidiaries as of December 31, 2012 and 2011, and the related consolidated statements of operations and comprehensive income (loss), changes in equity, and cash flows for each of the years in the three‑year period ended December 31, 2012. These consolidated financial statements are the responsibility of the Company's management. Our responsibility is to express an opinion on these consolidated financial statements based on our audits.
We conducted our audits in accordance with the standards of the Public Company Accounting Oversight Board (United States). Those standards require that we plan and perform the audit to obtain reasonable assurance about whether the financial statements are free of material misstatement. An audit includes examining, on a test basis, evidence supporting the amounts and disclosures in the financial statements. An audit also includes assessing the accounting principles used and significant estimates made by management, as well as evaluating the overall financial statement presentation. We believe that our audits provide a reasonable basis for our opinion.
In our opinion, the consolidated financial statements referred to above present fairly, in all material respects, the financial position of Stillwater Mining Company and subsidiaries as of December 31, 2012 and 2011, and the results of their operations and their cash flows for each of the years in the three‑year period ended December 31, 2012, in conformity with U.S. generally accepted accounting principles.
We also have audited, in accordance with the standards of the Public Company Accounting Oversight Board (United States), Stillwater Mining Company's internal control over financial reporting as of December 31, 2012, based on criteria established in Internal Control - Integrated Framework issued by the Committee of Sponsoring Organizations of the Treadway Commission (COSO), and our report dated February 27, 2013 expressed an unqualified opinion on the effectiveness of the Company's internal control over financial reporting.
/s/ KPMG LLP
Billings, Montana
February 27, 2013
Report of Independent Registered Public Accounting Firm
The Board of Directors and Stockholders
Stillwater Mining Company and Subsidiaries:
We have audited Stillwater Mining Company's internal control over financial reporting as of December 31, 2012, based on criteria established in Internal Control ‑ Integrated Framework issued by the Committee of Sponsoring Organizations of the Treadway Commission (COSO). Stillwater Mining Company's management is responsible for maintaining effective internal control over financial reporting and for its assessment of the effectiveness of internal control over financial reporting, included in the accompanying Management Report on Internal Control over Financial Reporting. Our responsibility is to express an opinion on the Company's internal control over financial reporting based on our audit.
We conducted our audit in accordance with the standards of the Public Company Accounting Oversight Board (United States). Those standards require that we plan and perform the audit to obtain reasonable assurance about whether effective internal control over financial reporting was maintained in all material respects. Our audit included obtaining an understanding of internal control over financial reporting, assessing the risk that a material weakness exists, and testing and evaluating the design and operating effectiveness of internal control based on the assessed risk. Our audit also included performing such other procedures as we considered necessary in the circumstances. We believe that our audit provides a reasonable basis for our opinion.
A company's internal control over financial reporting is a process designed to provide reasonable assurance regarding the reliability of financial reporting and the preparation of financial statements for external purposes in accordance with generally accepted accounting principles. A company's internal control over financial reporting includes those policies and procedures that (1) pertain to the maintenance of records that, in reasonable detail, accurately and fairly reflect the transactions and dispositions of the assets of the company; (2) provide reasonable assurance that transactions are recorded as necessary to permit preparation of financial statements in accordance with generally accepted accounting principles, and that receipts and expenditures of the company are being made only in accordance with authorizations of management and directors of the company; and (3) provide reasonable assurance regarding prevention or timely detection of unauthorized acquisition, use, or disposition of the company's assets that could have a material effect on the financial statements.
Because of its inherent limitations, internal control over financial reporting may not prevent or detect misstatements. Also, projections of any evaluation of effectiveness to future periods are subject to the risk that controls may become inadequate because of changes in conditions, or that the degree of compliance with the policies or procedures may deteriorate.
In our opinion, Stillwater Mining Company maintained, in all material respects, effective internal control over financial reporting as of December 31, 2012, based on criteria established in Internal Control - Integrated Framework issued by the Committee of Sponsoring Organizations of the Treadway Commission.
We also have audited, in accordance with standards of the Public Company Accounting Oversight Board (United States), the consolidated balance sheets of Stillwater Mining Company and subsidiaries as of December 31, 2012 and 2011, and the related consolidated statements of operations and comprehensive income (loss), changes in equity, and cash flows for each of the years in the three‑year period ended December 31, 2012, and our report dated February 27, 2013, expressed an unqualified opinion on those consolidated financial statements.
/s/ KPMG LLP
Billings, Montana
February 27, 2013
STILLWATER MINING COMPANY
CONSOLIDATED STATEMENTS OF OPERATIONS AND COMPREHENSIVE INCOME
|
| | | | | | | | | | | | |
| (In thousands, except per share data) | | | | | | |
| Year ended December 31, | | 2012 | | 2011 | | 2010 |
| REVENUES | | | | | | |
| Mine production | | $ | 455,426 |
| | $ | 528,007 |
| | $ | 381,044 |
|
| PGM recycling | | 344,818 |
| | 376,820 |
| | 168,612 |
|
| Other | | — |
| | 1,142 |
| | 6,222 |
|
| Total revenues | | 800,244 |
| | 905,969 |
| | 555,878 |
|
| COSTS AND EXPENSES | | | | | | |
| Costs of metals sold | | | | | | |
| Mine production | | 288,922 |
| | 269,573 |
| | 229,986 |
|
| PGM recycling | | 334,949 |
| | 358,566 |
| | 157,310 |
|
| Other | | — |
| | 1,141 |
| | 6,379 |
|
| Total costs of metals sold | | 623,871 |
| | 629,280 |
| | 393,675 |
|
| Depletion, depreciation and amortization | | | | | | |
| Mine production | | 56,960 |
| | 61,312 |
| | 71,121 |
|
| PGM recycling | | 1,055 |
| | 1,066 |
| | 472 |
|
| Total depletion, depreciation and amortization | | 58,015 |
| | 62,378 |
| | 71,593 |
|
| Total costs of revenues | | 681,886 |
| | 691,658 |
| | 465,268 |
|
| Loss on inventory purchases | | 590 |
| | 600 |
| | 595 |
|
| (Gain)/Loss on disposal of property, plant and equipment | | 448 |
| | (128 | ) | | (128 | ) |
| Research and development | | 1,159 |
| | 2,238 |
| | — |
|
| Loss on long-term investments | | 2,562 |
| | — |
| | — |
|
| Abandonment of non-producing property | | 2,835 |
| | — |
| | — |
|
| Marketing | | 11,170 |
| | 11,810 |
| | 2,415 |
|
| Exploration | | 15,010 |
| | 2,513 |
| | — |
|
| General and administrative | | 40,948 |
| | 42,072 |
| | 33,016 |
|
| Total costs and expenses | | 756,608 |
| | 750,763 |
| | 501,166 |
|
| OPERATING INCOME | | 43,636 |
| | 155,206 |
| | 54,712 |
|
| OTHER INCOME (EXPENSE) | | | | | | |
| Other | | 181 |
| | 68 |
| | (6 | ) |
| Interest income | | 2,325 |
| | 3,574 |
| | 2,144 |
|
| Interest expense | | (10,920 | ) | | (6,548 | ) | | (6,536 | ) |
| Foreign currency transaction gain, net | | 15,155 |
| | 3,230 |
| | 51 |
|
| INCOME BEFORE INCOME TAX PROVISION | | 50,377 |
| | 155,530 |
| | 50,365 |
|
| Income tax benefit (provision) | | 4,039 |
| | (11,235 | ) | | — |
|
| NET INCOME | | $ | 54,416 |
| | $ | 144,295 |
| | $ | 50,365 |
|
| Net loss attributable to noncontrolling interest | | (629 | ) | | — |
| | — |
|
| NET INCOME ATTRIBUTABLE TO COMMON STOCKHOLDERS | | $ | 55,045 |
| | $ | 144,295 |
| | $ | 50,365 |
|
| Other comprehensive income/(loss), net of tax | | | | | | |
| Net unrealized gains/(losses) on securities available-for-sale | | 862 |
| | (109 | ) | | (762 | ) |
| COMPREHENSIVE INCOME ATTRIBUTABLE TO COMMON STOCKHOLDERS | | $ | 55,907 |
| | $ | 144,186 |
| | $ | 49,603 |
|
| Comprehensive loss attributable to noncontrolling interest | | (629 | ) | | — |
| | — |
|
| TOTAL COMPREHENSIVE INCOME | | $ | 55,278 |
| | $ | 144,186 |
| | $ | 49,603 |
|
| Weighted average common shares outstanding | | | | | | |
| Basic | | 116,162 |
| | 105,846 |
| | 97,967 |
|
| Diluted | | 131,441 |
| | 113,946 |
| | 99,209 |
|
| Basic earnings per share attributable to common stockholders | | $ | 0.47 |
| | $ | 1.36 |
| | $ | 0.51 |
|
| Diluted earnings per share attributable to common stockholders | | $ | 0.46 |
| | $ | 1.30 |
| | $ | 0.51 |
|
See accompanying notes to consolidated financial statements
STILLWATER MINING COMPANY
CONSOLIDATED BALANCE SHEETS
|
| | | | | | | | |
| (In thousands, except share and per share data) | | | | |
| December 31, | | 2012 | | 2011 |
| ASSETS | | | | |
| Current assets | | | | |
| Cash and cash equivalents | | $ | 379,680 |
| | $ | 109,097 |
|
| Investments, at fair market value | | 261,983 |
| | 49,533 |
|
| Inventories | | 153,208 |
| | 131,856 |
|
| Trade receivables | | 9,953 |
| | 6,188 |
|
| Deferred income taxes | | 21,304 |
| | 19,819 |
|
| Other current assets | | 26,734 |
| | 9,433 |
|
| Total current assets | | 852,862 |
| | 325,926 |
|
| Mineral properties and mine development, net | | 899,225 |
| | 865,034 |
|
| Property, plant and equipment, net | | 122,677 |
| | 99,379 |
|
| Restricted cash | | 35 |
| | 25,070 |
|
| Deferred debt issuance costs | | 9,609 |
| | 2,899 |
|
| Other noncurrent assets | | 6,355 |
| | 9,016 |
|
| Total assets | | $ | 1,890,763 |
| | $ | 1,327,324 |
|
| LIABILITIES AND EQUITY | | | | |
| Current liabilities | | | | |
| Accounts payable | | $ | 28,623 |
| | $ | 26,880 |
|
| Accrued compensation and benefits | | 31,369 |
| | 27,573 |
|
| Property, production and franchise taxes payable | | 13,722 |
| | 14,071 |
|
| Current portion of long-term debt and capital lease obligations | | 168,432 |
| | — |
|
| Income taxes payable | | — |
| | 1,235 |
|
| Other current liabilities | | 4,702 |
| | 4,576 |
|
| Total current liabilities | | 246,848 |
| | 74,335 |
|
| Long-term debt and capital lease obligations | | 292,685 |
| | 196,046 |
|
| Deferred income taxes | | 199,802 |
| | 193,884 |
|
| Accrued workers compensation | | 5,815 |
| | 6,056 |
|
| Asset retirement obligation | | 7,965 |
| | 7,331 |
|
| Other noncurrent liabilities | | 5,068 |
| | 5,704 |
|
| Total liabilities | | 758,183 |
| | 483,356 |
|
| EQUITY | | | | |
| Stockholders’ equity | | | | |
| Preferred stock, $0.01 par value, 1,000,000 shares authorized; none issued | | — |
| | — |
|
| Common stock, $0.01 par value, 200,000,000 shares authorized; 116,951,081 and 115,375,604 shares issued and outstanding | | 1,170 |
| | 1,154 |
|
| Paid-in capital | | 1,058,978 |
| | 878,050 |
|
| Accumulated earnings (deficit) | | 20,770 |
| | (34,275 | ) |
| Accumulated other comprehensive loss | | (99 | ) | | (961 | ) |
| Total stockholders’ equity | | 1,080,819 |
| | 843,968 |
|
| Noncontrolling interest | | 51,761 |
| | — |
|
| Total equity | | 1,132,580 |
| | 843,968 |
|
| Total liabilities and equity | | $ | 1,890,763 |
| | $ | 1,327,324 |
|
See accompanying notes to consolidated financial statements
STILLWATER MINING COMPANY
CONSOLIDATED STATEMENTS OF CASH FLOWS
|
| | | | | | | | | | | | |
| (In thousands) | | | | | | |
| Year ended December 31, | | 2012 | | 2011 | | 2010 |
| CASH FLOWS FROM OPERATING ACTIVITIES | | | | | | |
| Net income | | $ | 54,416 |
| | $ | 144,295 |
| | $ | 50,365 |
|
| Adjustments to reconcile net income to net cash provided by operating activities: | | | | | | |
| Depletion, depreciation and amortization | | 58,015 |
| | 62,378 |
| | 71,593 |
|
| Loss on inventory purchases | | 590 |
| | 600 |
| | 595 |
|
| (Gain)/Loss on disposal of property, plant and equipment | | 448 |
| | (128 | ) | | (128 | ) |
| Loss on long-term investments | | 2,562 |
| | — |
| | — |
|
| Deferred taxes | | (3,937 | ) | | — |
| | — |
|
| Foreign currency transaction gain, net | | (15,155 | ) | | (3,230 | ) | | (51 | ) |
| Abandonment of non-producing property | | 2,835 |
| | — |
| | — |
|
| Accretion of asset retirement obligation | | 634 |
| | 584 |
| | 538 |
|
| Amortization of debt issuance costs | | 1,495 |
| | 988 |
| | 979 |
|
| Accretion of convertible debenture debt discount | | 3,097 |
| | — |
| | — |
|
| Share based compensation and other benefits | | 16,369 |
| | 12,358 |
| | 12,366 |
|
| Changes in operating assets and liabilities: | | | | | | |
| Inventories | | (19,958 | ) | | (34,143 | ) | | (12,474 | ) |
| Trade receivables | | (3,765 | ) | | 1,192 |
| | (5,307 | ) |
| Accrued compensation and benefits | | 3,575 |
| | 2,822 |
| | (1,735 | ) |
| Accounts payable | | (1,772 | ) | | 4,012 |
| | 10,202 |
|
| Property, production and franchise taxes payable | | (970 | ) | | 4,338 |
| | 1,164 |
|
| Income taxes payable | | (1,235 | ) | | 1,235 |
| | — |
|
| Workers compensation | | (241 | ) | | (1,099 | ) | | 2,418 |
|
| Restricted cash | | 25,035 |
| | 13,000 |
| | (25 | ) |
| Excess tax benefit from stock-based compensation | | (7,737 | ) | | — |
| | — |
|
| Other | | (10,407 | ) | | 10,481 |
| | (6,603 | ) |
| NET CASH PROVIDED BY OPERATING ACTIVITIES | | 103,894 |
| | 219,683 |
| | 123,897 |
|
| CASH FLOWS FROM INVESTING ACTIVITIES | | | | | | |
| Capital expenditures | | (112,071 | ) | | (101,940 | ) | | (50,263 | ) |
| Purchase of Marathon PGM assets | | — |
| | — |
| | (63,649 | ) |
| Purchase of Peregrine Metals Ltd. assets | | — |
| | (166,361 | ) | | — |
|
| Purchase of long-term investment | | — |
| | (616 | ) | | (3,858 | ) |
| Proceeds from disposal of property, plant and equipment | | 222 |
| | 277 |
| | 470 |
|
| Purchases of investments | | (280,273 | ) | | (106,417 | ) | | (243,693 | ) |
| Proceeds from maturities of investments | | 67,314 |
| | 245,464 |
| | 88,959 |
|
| NET CASH USED IN INVESTING ACTIVITIES | | (324,808 | ) | | (129,593 | ) | | (272,034 | ) |
| CASH FLOWS FROM FINANCING ACTIVITIES | | | | | | |
| Proceeds from sale of noncontrolling interest, net of transaction costs | | 93,821 |
| | — |
| | — |
|
| Excess tax benefit from stock-based compensation | | 7,737 |
| | — |
| | — |
|
| Issuance of long-term debt | | 403,926 |
| | — |
| | — |
|
| Payments on long-term debt and capital lease obligations | | (1,394 | ) | | — |
| | — |
|
| Payments for issuance costs | | (12,637 | ) | | (1,143 | ) | | — |
|
| Issuance of common stock | | 44 |
| | 787 |
| | 844 |
|
| NET CASH PROVIDED BY (USED IN) FINANCING | | 491,497 |
| | (356 | ) | | 844 |
|
| CASH AND CASH EQUIVALENTS | | | | | | |
| Net increase (decrease) | | 270,583 |
| | 89,734 |
| | (147,293 | ) |
| Balance at beginning of period | | 109,097 |
| | 19,363 |
| | 166,656 |
|
| BALANCE AT END OF PERIOD | | $ | 379,680 |
| | $ | 109,097 |
| | $ | 19,363 |
|
See accompanying notes to consolidated financial statements
STILLWATER MINING COMPANY
CONSOLIDATED STATEMENTS OF CHANGES IN EQUITY
|
| | | | | | | | | | | | | | | | | | | | | | | | | | |
| (In thousands) | Common Shares Outstanding | | Common Stock | | Paid-in Capital | | Accumulated Earnings (Deficit) | | Accumulated Other Comprehensive Loss | | Non-controlling Interest | | Total Equity |
| BALANCE AT DECEMBER 31, 2009 | 96,732 |
| | $ | 967 |
| | $ | 674,869 |
| | $ | (228,935 | ) | | $ | (90 | ) | | $ | — |
| | $ | 446,811 |
|
| Net income | — |
| | — |
| | — |
| | 50,365 |
| | — |
| | — |
| | 50,365 |
|
| Change in fair market value of securities | — |
| | — |
| | — |
| | — |
| | (762 | ) | | — |
| | (762 | ) |
| Common stock issued under employee benefit plans | 319 |
| | 3 |
| | 4,442 |
| | — |
| | — |
| | — |
| | 4,445 |
|
| Stock option expense | — |
| | — |
| | 160 |
| | — |
| | — |
| | — |
| | 160 |
|
| Common stock issued under stock plans | 90 |
| | 1 |
| | 843 |
| | — |
| | — |
| | — |
| | 844 |
|
| Common stock issued under Directors’ deferral plan | 3 |
| | — |
| | 75 |
| | — |
| | — |
| | — |
| | 75 |
|
| Nonvested shares of common stock granted to officers and employees | 856 |
| | 9 |
| | — |
| | — |
| | — |
| | — |
| | 9 |
|
| Common stock issued for acquisition of Marathon PGM assets | 3,882 |
| | 39 |
| | 73,409 |
| | — |
| | — |
| | — |
| | 73,448 |
|
| Amortization of unearned nonvested stock | — |
| | — |
| | 7,775 |
| | — |
| | — |
| | — |
| | 7,775 |
|
| Forfeiture of nonvested stock | — |
| | — |
| | (98 | ) | | — |
| | — |
| | — |
| | (98 | ) |
| BALANCE AT DECEMBER 31, 2010 | 101,882 |
| | $ | 1,019 |
| | $ | 761,475 |
| | $ | (178,570 | ) | | $ | (852 | ) | | $ | — |
| | $ | 583,072 |
|
| Net income | — |
| | — |
| | — |
| | 144,295 |
| | — |
| | — |
| | 144,295 |
|
| Change in fair market value of securities | — |
| | — |
| | — |
| | — |
| | (109 | ) | | — |
| | (109 | ) |
| Common stock issued under employee benefit plans | 371 |
| | 4 |
| | 5,618 |
| | — |
| | — |
| | — |
| | 5,622 |
|
| Stock option expense | — |
| | — |
| | 231 |
| | — |
| | — |
| | — |
| | 231 |
|
| Common stock issued under stock plans | 52 |
| | — |
| | 787 |
| | — |
| | — |
| | — |
| | 787 |
|
| Common stock issued under Directors’ deferral plan | 7 |
| | — |
| | 81 |
| | — |
| | — |
| | — |
| | 81 |
|
| Nonvested shares of common stock granted to officers and employees | 686 |
| | 7 |
| | — |
| | — |
| | — |
| | — |
| | 7 |
|
| Common stock issued for acquisition of Benton Resources Corp. property | 348 |
| | 4 |
| | 6,915 |
| | — |
| | — |
| | — |
| | 6,919 |
|
| Common stock issued for acquisition of Peregrine Metals Ltd. assets | 12,030 |
| | 120 |
| | 96,532 |
| | — |
| | — |
| | — |
| | 96,652 |
|
| Amortization of unearned nonvested stock | — |
| | — |
| | 6,453 |
| | — |
| | — |
| | — |
| | 6,453 |
|
| Forfeiture of nonvested stock | — |
| | — |
| | (42 | ) | | — |
| | — |
| | — |
| | (42 | ) |
| BALANCE AT DECEMBER 31, 2011 | 115,376 |
| | $ | 1,154 |
| | $ | 878,050 |
| | $ | (34,275 | ) | | $ | (961 | ) | | $ | — |
| | $ | 843,968 |
|
| Net income | — |
| | — |
| | — |
| | 55,045 |
| | — |
| | (629 | ) | | 54,416 |
|
| Change in fair market value of securities | — |
| | — |
| | — |
| | — |
| | 862 |
| | — |
| | 862 |
|
| Common stock issued under employee benefit plans | 749 |
| | 8 |
| | 7,890 |
| | — |
| | — |
| | — |
| | 7,898 |
|
| Income tax benefit on share-based compensation | — |
| | — |
| | 7,737 |
| | — |
| | — |
| | — |
| | 7,737 |
|
| Stock option expense | — |
| | — |
| | 97 |
| | — |
| | — |
| | — |
| | 97 |
|
| Common stock issued under stock plans | 74 |
| | 1 |
| | 43 |
| | — |
| | — |
| | — |
| | 44 |
|
| Common stock issued under Directors’ deferral plan | 12 |
| | — |
| | 76 |
| | — |
| | — |
| | — |
| | 76 |
|
| Nonvested shares of common stock granted to officers and employees | 740 |
| | 7 |
| | 47 |
| | — |
| | — |
| | — |
| | 54 |
|
| Equity component of 1.75% Convertible debenture | — |
| | — |
| | 137,173 |
| | — |
| | — |
| | — |
| | 137,173 |
|
| Noncontrolling interest | — |
| | — |
| | 41,431 |
| | — |
| | — |
| | 52,390 |
| | 93,821 |
|
| Valuation allowance | — |
| | — |
| | 35,799 |
| | — |
| | — |
| | — |
| | 35,799 |
|
| Deferred taxes on 1.75% convertible debenture | — |
| | — |
| | (57,526 | ) | | — |
| | — |
| | — |
| | (57,526 | ) |
| Amortization of unearned nonvested stock | — |
| | — |
| | 8,341 |
| | — |
| | — |
| | — |
| | 8,341 |
|
| Forfeiture of nonvested stock | — |
| | — |
| | (180 | ) | | — |
| | — |
| | — |
| | (180 | ) |
| BALANCE AT DECEMBER 31, 2012 | 116,951 |
| | $ | 1,170 |
| | $ | 1,058,978 |
| | $ | 20,770 |
| | $ | (99 | ) | | $ | 51,761 |
| | $ | 1,132,580 |
|
See accompanying notes to consolidated financial statements
STILLWATER MINING COMPANY
NOTES TO THE CONSOLIDATED FINANCIAL STATEMENTS
NOTE 1
NATURE OF OPERATIONS
Stillwater Mining Company (the Company) is engaged in the development, extraction, processing, smelting, refining and marketing of palladium, platinum and associated metals (platinum group metals or PGMs) from a geological formation in south-central Montana known as the J-M Reef and from the recycling of spent catalytic converters. The Company is also engaged in expanding its mining operations on the J-M Reef, developing its Marathon PGM-copper property adjacent to Lake Superior in the province of Ontario, Canada and advancing the exploration of its Altar copper-gold property in the province of San Juan, Argentina.
The Company conducts mining operations at the Stillwater Mine near Nye, Montana, and at the East Boulder Mine south of Big Timber, Montana. Ore extraction at both mines takes place within the J-M Reef. The Company operates concentrating plants at each mining operation to upgrade the mined production into a concentrate form. The Company operates a smelter and base metal refinery at Columbus, Montana which further upgrades the mined concentrates into a PGM-rich filter cake. The filter cake is shipped to third-party custom refiners for final refining before the contained PGMs are sold to third parties.
The Company has two expansion projects along the J-M Reef. The first of these, known as the Blitz project, will develop underground drifts on two levels from the current Stillwater Mine toward the eastern extremity of the reef. The other project, known as Graham Creek, is now well advanced, expanding to the west in areas adjacent to the existing operations at the East Boulder Mine.
Besides processing mine concentrates, the Company also recycles spent catalyst material acquired from third parties at the smelter and base metal refinery to recover the contained PGMs – palladium, platinum and rhodium. The Company currently has catalyst sourcing arrangements with various suppliers who ship spent catalysts to the Company for processing to recover the PGMs. The Company smelts and refines the spent catalysts within the same process stream as the mined production. The Company both purchases recycling materials for its own account and processes them on behalf of others for a fee.
The Company’s operations can be significantly affected by risks and uncertainties associated with the mining and recycling industry as well as those specifically related to its operations. One of the most significant risks and uncertainties the Company faces is price volatility of palladium and platinum.
Additional risks and uncertainties include but are not limited to the following: economic and political events affecting supply and demand for these metals, mineral reserve estimation, environmental restrictions and obligations, governmental regulations, ownership of and access to mineral reserves, stable workforce and increased surety requirements.
The Company evaluates subsequent events through the date the financial statements are issued. No subsequent events were identified that required additional disclosure through the date of this filing.
NOTE 2
SUMMARY OF SIGNIFICANT ACCOUNTING POLICIES
PRINCIPLES OF CONSOLIDATION
The accompanying consolidated financial statements include the accounts of Stillwater Mining Company, its wholly-owned subsidiaries and entities in which it holds a controlling interest (collectively referred to as the “Company”). All intercompany transactions and balances have been eliminated upon consolidation.
CASH AND CASH EQUIVALENTS
Cash and cash equivalents consist of all cash balances and all highly liquid investments purchased with an original maturity of three months or less.
RESTRICTED CASH
Restricted cash consists of cash equivalents that have been posted as collateral in support of the Company's reclamation liabilities on outstanding letters of credit or other obligations. In the case of collateral for outstanding letters of credit, the restrictions on the balances lapse upon expiration of the letters of credit, which have terms of one year or less. Restricted cash is classified as non-current as the Company anticipates renewing the letters of credit (associated with reclamation obligations) upon expiration. Restricted cash covering other obligations is in the form of Certificates of Deposit which the Company also
plans to renew upon expiration.
INVESTMENTS
Investment securities at December 31, 2012 and 2011, consist of mutual funds, federal agency notes and commercial paper with stated maturities less than two years. All securities are deemed by management to be available-for-sale and are reported at fair value. Unrealized holding gains and losses on available-for-sale securities are excluded from earnings and are reported as a separate component of other comprehensive income (loss) until realized. Realized gains and losses are based on the carrying value (cost, net of discounts or premiums) of the sold investment and recorded as a component of other income. A decline in the market value of any available-for-sale security below cost that is deemed to be other-than-temporary results in a reduction of the carrying amount of the security to fair value. The impairment is charged to earnings and a new cost basis for the security is established.
The Company’s long-term investments in several junior exploration companies were originally recorded at cost due to less than 20% equity ownership interest and no significant Company control over the investees. A decline in the market value of these long-term investments that is deemed to be other-than-temporary will result in a reduction of the carrying amount of the investment to fair value. The impairment is charged to earnings and a new cost basis for the investment is established.
INVENTORIES
Mined inventories are carried at the lower of current realizable value or average cost taking into consideration the Company’s long-term sales agreements and average unit costs. Production costs include the cost of direct labor and materials, depletion, depreciation and amortization, and overhead costs relating to mining and processing activities. The value of recycled inventories is determined based on the acquisition cost of the recycled material and includes all inventoriable processing costs, including direct labor, direct materials and third party refining costs which relate to the processing activities. Materials and supplies inventories are valued at the lower of average cost or fair market value.
RECEIVABLES
Trade receivables and other receivable balances recorded in other current assets are reported at outstanding principal amounts, net of any required allowance for doubtful accounts. Management evaluates the collectability of receivable account balances to determine the allowance, if any. Management considers the other party’s credit risk and financial condition, as well as current and projected economic and market conditions, in determining the amount of the allowance. Receivable balances are written off when management determines that the balance is uncollectable. The Company determined that no allowance against its receivable balance at December 31, 2012 and 2011 was necessary.
MINERAL PROPERTIES AND MINE DEVELOPMENT
Costs of acquiring mineral properties and mineral rights are capitalized as incurred. Prior to acquiring such mineral properties or mineral rights, the Company makes a preliminary evaluation to determine that the mineral property has significant potential to develop an economic ore body. The time between initial acquisition and full evaluation of a mineral property’s potential is variable and is determined by many factors including its location relative to existing infrastructure, the mineral property’s stage of development, geological controls and relevant metal prices. When it has been determined that a mineral property can be commercially developed, mining development costs incurred to develop the mineral property are capitalized. Mining exploration costs are expensed as incurred. If a mineable ore body is discovered, such costs are amortized when production begins using the units-of-production method based on the quantities of recoverable metal. If no mineable ore body is discovered, such costs are expensed in the period in which it is determined the mineral property has no future economic value. Costs incurred to maintain assets on a standby basis are charged to operations. Costs of abandoned projects are charged to operations upon abandonment.
Capitalized mine development costs are expenditures incurred to increase existing production, develop new ore bodies or develop mineral property substantially in advance of production. Capitalized mine development costs include a vertical shaft, multiple surface adits and underground infrastructure development including footwall laterals, ramps, rail and transportation, electrical and ventilation systems, shop facilities, material handling areas, ore handling facilities, dewatering and pumping facilities. These expenditures are capitalized and amortized over the life of the mine or over a shorter mining period, depending on the period benefited by those expenditures, using the units-of-production method. The Company utilizes total proven and probable ore reserves, measured in tons, as the basis for determining the life of mine and uses the ore reserves in the immediate and relevant vicinity as the basis for determining the shorter mining period.
The Company calculates amortization of capitalized mine development costs in any vicinity by applying an amortization rate to the relevant current production. The amortization rates are each based upon a ratio of unamortized capitalized mine
development costs to the related ore reserves. Capital development expenditures are added to the unamortized capitalized mine development costs and amortization rates updated as the related assets are placed into service. In the calculation of the amortization rate, changes in ore reserves are accounted for as a prospective change in estimate. Ore reserves and the further benefit of capitalized mine development costs are determined based on management assumptions. Any significant changes in these assumptions, such as a change in the mine plan or a change in estimated proven and probable ore reserves, could have a material effect on the expected period of benefit resulting in a potentially significant change in the amortization rate and/or the valuations of related assets. The Company’s proven ore reserves are generally expected to be extracted utilizing its existing mine development infrastructure. Additional capital expenditures will be required to access the Company’s estimated probable ore reserves. These anticipated capital expenditures are not included in the current calculation of depletion, depreciation and amortization.
Expenditures incurred to sustain existing production and directly access specific ore reserve blocks or stopes provide benefit to ore reserve production over limited periods of time (secondary development) and are charged to operations as incurred. These costs include ramp and stope access excavations from the primary haulage levels (footwall laterals), stope material re-handling/laydown excavations, stope ore and waste pass excavations and chute installations, stope ventilation raise excavations and stope utility and pipe raise excavations.
PROPERTY, PLANT AND EQUIPMENT
Plant facilities and equipment are recorded at cost and depreciated using the straight-line method over estimated useful lives ranging from three to seven years or, for capital leases, the term of the related leases, if shorter. Maintenance and repairs are charged to cost of revenues as incurred.
Interest is capitalized on expenditures related to major construction or development projects and is amortized using the same method as the related asset. Interest capitalization is discontinued when the asset is placed into operation or when development and construction cease.
LEASES
The Company classifies a lease as either capital or operating. All capital leases are depreciated over the shorter of the useful life of the asset or the lease term.
ASSET IMPAIRMENT
The Company reviews and evaluates its long-lived assets, including mineral properties and mine development, for impairment when events or changes in circumstances indicate that the related carrying amounts of its assets may not be recoverable. Impairment is considered to exist if the total estimated future cash flows on an undiscounted basis are less than the carrying amount of the asset. Future cash flows include estimates of recoverable ounces, PGM prices (historical prices or third-party projections of future prices, long-term sales contracts prices, price trends and related factors), production levels and capital and reclamation expenditures, all based on life-of-mine plans and projections. If the assets are impaired, a calculation of fair market value is performed, and if the fair market value is lower than the carrying value of the assets, the assets are reduced to their fair market value.
Assumptions underlying future cash flows are subject to risks and uncertainties. Any differences between significant assumptions and market conditions such as PGM prices, lower than expected recoverable ounces, and/or the Company’s operating performance could have a material effect on the Company’s determination of ore reserves, or its ability to recover the carrying amounts of its long-lived assets resulting in potential additional impairment charges.
FAIR VALUE OF FINANCIAL INSTRUMENTS
The Company’s non-derivative financial instruments consist primarily of cash equivalents, trade receivables, payables, investments, revenue bond debt, convertible debentures and capital lease obligations. The carrying amounts of cash equivalents, trade receivables and payables approximate fair value due to their short maturities. The carrying amounts of investments approximate fair value based on market quotes.
Fair value is defined as the price that would be received to sell an asset or paid to transfer a liability (an exit price) in an orderly transaction between market participants. A fair value hierarchy was established which requires an entity to maximize the use of observable inputs and minimize the use of unobservable inputs when measuring fair value. The fair value hierarchy distinguishes among three levels of inputs that may be utilized when measuring fair value: Level 1 inputs (using quoted prices in active markets for identical assets or liabilities), Level 2 inputs (using external inputs other than Level 1 prices such as quoted prices for similar assets and liabilities in active markets or inputs that are observable for the asset or liability) and Level
3 inputs (unobservable inputs supported by little or no market activity and based on internal assumptions used to measure assets and liabilities). The classification of each financial asset or liability within the above hierarchy is determined based on the lowest level input that is significant to the fair value measurement.
REVENUE RECOGNITION
Revenue is comprised of mine production revenue, PGM recycling revenue and other sales revenue. Mine production revenue consists of the sales of palladium and platinum extracted by the Company’s mining operations, including any realized hedging gains or losses, and is reduced by sales discounts associated with long-term sales agreements. Mine production revenue also consists of the sales of by-products (rhodium, gold, silver, copper and nickel) extracted by mining operations. PGM recycling revenue consists of the sales of recycled palladium, platinum and rhodium derived from spent catalytic materials, including any unrealized and realized hedging gains or losses. Other sales revenue consists of sales of PGMs that were acquired on the open market for resale.
Revenue is recognized when persuasive evidence of an arrangement exists, delivery has occurred either physically or through an irrevocable transfer of metals to customers’ accounts, the price is fixed or determinable, no related obligations remain and collectability is probable. Under the terms of sales contracts and purchase orders received from customers, the Company recognizes revenue when the product is in a refined and saleable form and title passes, which is typically when the product is transferred from the account of the Company to the account of the customer. Under certain of its sales agreements, the Company instructs a third party refiner to transfer metal from the Company’s account to the customer’s account; at this point, the Company’s account at the third party refinery is reduced and the purchaser’s account is increased by the number of ounces of metal sold. These transfers are irrevocable and the Company has no further responsibility for the delivery of the metals. Under other sales agreements, physical conveyance occurs by the Company arranging for shipment of metal from the third party refinery to the purchaser. In these cases, revenue is recognized at the point when title passes contractually to the purchaser. Sales discounts are recognized when the related revenue is recorded. The Company classifies any sales discounts as a reduction in revenue.
NONCONTROLLING INTEREST
Noncontrolling interest relates to the sale of a 25% ownership interest in Stillwater Canada Inc during 2012. Noncontrolling interest is classified in the Consolidated Statements of Operations and Comprehensive Income as part of consolidated net income (loss) and the accumulated amount of noncontrolling interest in the Consolidated Balance Sheets as a component of equity.
HEDGING PROGRAM
From time to time, the Company enters into derivative financial instruments, including fixed forwards, cashless put and call option collars and financially settled forwards to manage the effect of changes in the prices of palladium and platinum on the Company’s revenue and to manage interest rate risk. Derivatives are reported on the balance sheet at fair value and, if the derivative is not designated as a hedging instrument, changes in fair value must be recognized in earnings in the period of change. If the derivative is designated as a hedge, and to the extent such hedge is determined to be highly effective, changes in fair value are either (a) offset by the change in fair value of the hedged asset or liability (if applicable) or (b) reported as a component of other comprehensive income (loss) in the period of change, and subsequently recognized in the determination of net income (loss) in the period the offsetting hedged transaction occurs. If an instrument is settled early, any gains or losses are deferred and recognized as adjustments to the revenue recorded for the related hedged production when the transaction related to the original hedge instrument settles.
Unrealized derivative gains and losses recorded in current and non-current assets and liabilities and amounts recorded in other comprehensive income (loss) and in current period earnings are non-cash items and therefore are taken into account in the preparation of the Company's Consolidated Statements of Cash Flows based on their respective balance sheet classifications.
RECLAMATION AND ENVIRONMENTAL COSTS
The fair value of a liability for an asset retirement obligation is recognized in the period in which it is incurred if a reasonable estimate of fair value can be made. The fair value of the liability is added to the carrying amount of the associated asset and this additional carrying amount is depreciated over the life of the asset. The liability is accreted at the end of each period through charges to operating expense. If the obligation is settled for other than the carrying amount of the liability, the Company will recognize a gain or loss on settlement.
Accounting for reclamation obligations requires management to make estimates for each mining operation of the future costs the Company will incur to complete final reclamation work required to comply with existing laws and regulations. Actual costs incurred in future periods could differ from amounts estimated. Additionally, future changes to environmental laws and
regulations could increase the extent of reclamation and remediation work that the Company is required to perform. Any such increases in future costs could materially impact the amounts charged in future periods to operations for reclamation and remediation.
INCOME TAXES
The Company determines income taxes using the asset and liability method which results in the recognition of deferred tax assets and liabilities for the expected future tax consequences of temporary differences between the carrying amounts and the tax bases of those assets and liabilities, as well as operating loss and tax credit carryforwards, using enacted tax rates in effect in the years in which the differences are expected to reverse. The effect on deferred tax assets and liabilities of a change in tax rates is recognized in income in the period that includes the enactment date. Deferred tax assets and liabilities are recorded on a jurisdictional basis.
In assessing the realizability of U.S. and foreign deferred tax assets, management considers whether it is more likely than not that some portion or all of the deferred tax assets will not be realized. Each quarter, management considers the scheduled reversal of deferred tax liabilities, projected future taxable income, and tax planning strategies in making this assessment. A valuation allowance has been provided at December 31, 2012 and 2011, for the portion of the Company’s net deferred tax assets for which it is more likely than not that they will not be realized.
STOCK-BASED COMPENSATION
Costs resulting from all share-based payment transactions are recognized in the financial statements over the respective vesting periods and determined using a fair-value-based measurement method. The fair values for stock options and other stock-based compensation awards issued to employees are estimated at the date of grant using a Black-Scholes option pricing model.
EARNINGS (LOSS) PER COMMON SHARE
Basic earnings (loss) per share attributable to common stockholders is computed by dividing net income (loss) attributable to common stockholders by the weighted average number of common shares outstanding during the period. Diluted earnings (loss) per share attributable to common stockholders reflects the potential dilution that could occur if the Company’s dilutive outstanding stock options or nonvested shares were exercised and the Company’s convertible debentures were converted. Reported net income (loss) attributable to common stockholders is adjusted for the interest expense net of capitalized interest (including amortization expense of deferred debt and equity fees), the related income tax effect and the income (loss) attributable to the noncontrolling interest in the computation of basic and diluted earnings per share attributable to common stockholders. The Company currently has only one class of equity shares outstanding.
COMPREHENSIVE INCOME (LOSS)
Comprehensive income (loss) includes net income (loss), as well as other changes in stockholders’ equity that result from transactions and events other than those with stockholders. The Company’s only significant elements of other comprehensive income in 2012, 2011 and 2010 consisted of unrealized gains and losses related to available-for-sale marketable securities.
DEBT ISSUANCE COSTS
Debt issuance costs are capitalized and amortized to interest expense using the effective interest method over the lives of the related debt agreements.
ADVERTISING COSTS
Advertising costs are expensed as incurred. Advertising expenses were approximately $10.8 million, $11.3 million, and $2.1 million in 2012, 2011, and 2010, respectively.
USE OF ESTIMATES
The preparation of the Company’s consolidated financial statements in conformity with United States generally accepted accounting principles requires management to make estimates and assumptions that affect the amounts reported in these consolidated financial statements and accompanying notes. The more significant areas requiring the use of management’s estimates relate to mineral reserves, reclamation and environmental obligations, valuation allowance for deferred tax assets, useful lives utilized for depletion, depreciation, amortization and accretion calculations, future cash flows from long-lived assets, fair value of long-lived assets, and fair value of derivatives. Actual results could differ from these estimates.
FOREIGN CURRENCY TRANSACTIONS
The functional currency of the Company’s Canadian and South American subsidiaries is the U.S. dollar. Gains or losses resulting from transactions denominated in Canadian and South American currencies are included in Foreign currency transaction gain, net in the Company's Consolidated Statements of Operations and Comprehensive Income.
RECLASSIFICATION
For 2011, an additional $268.3 million has been reclassified from property, plant and equipment, net, to mineral properties and mine development, net to conform to the Company's Consolidated Balance Sheets.
NOTE 3
SALES
MINE PRODUCTION
The Company mines and processes ores containing palladium, platinum, rhodium, gold, silver, copper and nickel into intermediate and final products for sale to customers. Palladium, platinum, rhodium, gold and silver are sent to third party refineries for final processing from where they are sold to a number of consumers and dealers with whom the Company has established trading relationships. Refined PGMs of 99.95% purity (rhodium of 99.9%) in sponge form are transferred upon sale from the Company’s account at third party refineries to the account of the purchaser. By-product precious metals are normally sold at market prices to customers, brokers or outside refiners. By-products of copper and nickel are produced by the Company at less than commercial grade, so prices for these metals typically reflect a quality discount. By-product sales are included in revenues from mine production. During 2012, 2011 and 2010, total by-product (copper, nickel, gold, silver and mined rhodium) sales were $30.6 million, $36.0 million and $28.0 million, respectively.
The Company has a supply agreement with General Motors Corporation (GM) that provides for fixed quantities of palladium to be delivered each month which expires on December 31, 2013. The Company has a platinum supply agreement with Tiffany & Co., which expires at the end of 2013. The Company also has supply agreements with Johnson Matthey and BASF and a month-to-month agreement with Ford Motor Company. Some of these agreements provide for pricing at a small discount to a trailing market price. Based on the targeted 2012 mine production of about 500,000 ounces, approximately 86% of the Company's mined palladium production and 74% of its platinum production is committed under its supply agreements as of December 31, 2012. The Company currently sells its remaining mine production under spot sales agreements.
Revenue is recognized when persuasive evidence of an agreement exists, delivery has occurred either physically or through an irrevocable transfer of metals to customers' accounts, the price is fixed or determinable, no related obligations remain and collectability is probable.
PGM RECYCLING
The Company purchases spent catalyst materials from third parties and processes these materials in its facilities in Columbus, Montana to recover palladium, platinum and rhodium for sale. It also accepts material supplied from third parties on a tolling basis, processing it for a fee and returning the recovered metals to the supplier. The Company has entered into sourcing arrangements for catalyst material with several suppliers. Under these sourcing arrangements as currently structured, the Company may advance cash against a shipment of material shortly before actually receiving the physical shipment. These advances are included in Other current assets on the Company’s Consolidated Balance Sheets until such time as the material has been physically received and title has transferred to the Company. The Company holds a security interest in materials procured by its largest supplier that have not been received by the Company. Once the material is physically received and title has transferred, the associated advance is reclassified from Other current assets into Inventories on the Company's Consolidated Balance Sheets. Finance charges collected on advances and inventories prior to being earned are included in Other current liabilities on the Company’s Consolidated Balance Sheets. Finance charges are reclassified from Other current liabilities to Interest income ratably from the time the advance is made until the outturn date of the inventory. The Company recorded write-downs of advances on these recycling inventory purchases of $0.6 million in 2012, 2011 and 2010.
At the time the Company purchases recycling material it enters into a fixed forward contract for future delivery of the PGMs contained in the recycled material at a price consistent with the purchase cost of the recycled material. The contract commits the Company to deliver finished metal on a specified date that corresponds to the expected outturn date for the metal from the final refiner. The purpose of this arrangement is to eliminate the Company’s exposure to fluctuations in market prices during processing, while at the same time creating an obligation for the Company to deliver metal at a future point in time that could be subject to operational risks. If the Company were unable to complete the processing of the recycled material by the contractual delivery date, it could be required to deliver finished metal from mine production or purchase finished metal in the
open market to cover its delivery commitments. Metal purchased exposes the Company to the cost (or benefit) of any change in the market price relative to the price stipulated in the delivery contract.
OTHER
The Company makes other open market purchases of PGMs from time to time for resale to third parties. During 2012, the Company did not incur any open market purchases but recognized revenue of $1.1 million and $6.2 million on PGMs purchased in the open market and re-sold for the years ending December 31, 2011 and 2010, respectively.
NOTE 4
CORRECTION OF IMMATERIAL BALANCE SHEET CLASSIFICATION ERROR
In the third quarter of 2012, the Company identified an error in the presentation of the deferred tax asset and liability on the Company's Consolidated Balance Sheets. The error in presentation impacted the balance sheet at December 31, 2011 and the subsequent first two quarters of 2012.
The Company assessed the materiality of this error in accordance with Staff Accounting Bulletin (SAB) No. 108 and determined the error was immaterial to previously reported amounts contained in the periodic reports. The Company intends to correct this error through subsequent periodic filings. The effect of recording this immaterial correction on the balance sheet as of December 31, 2011, and for the fiscal 2012 quarterly periods to be reported in subsequent periodic filings is as follows:
|
| | | | | | | | | | | | | | | | | | | | | |
| | | At December 31, 2011 | | At March 31, 2012 | | At June 30, 2012 |
| | | | | | | |
| (In thousands) | | As Reported | As Revised | | As Reported | As Revised | | As Reported | As Revised |
| Deferred tax asset | | $ | 96,036 |
| $ | 19,819 |
| | $ | 107,150 |
| $ | 20,819 |
| | $ | 109,629 |
| $ | 19,760 |
|
| Total current assets | | $ | 402,143 |
| $ | 325,926 |
| | $ | 413,890 |
| $ | 327,559 |
| | $ | 507,358 |
| $ | 417,489 |
|
| Total assets | | $ | 1,403,541 |
| $ | 1,327,324 |
| | $ | 1,422,088 |
| $ | 1,335,757 |
| | $ | 1,535,907 |
| $ | 1,446,038 |
|
| Deferred tax liability | | $ | 270,101 |
| $ | 193,884 |
| | $ | 279,017 |
| $ | 192,686 |
| | $ | 277,085 |
| $ | 187,216 |
|
| Total liabilities | | $ | 559,573 |
| $ | 483,356 |
| | $ | 571,595 |
| $ | 485,264 |
| | $ | 569,771 |
| $ | 479,902 |
|
| Total liabilities and stockholders' equity | | $ | 1,403,541 |
| $ | 1,327,324 |
| | $ | 1,422,088 |
| $ | 1,335,757 |
| | $ | 1,535,907 |
| $ | 1,446,038 |
|
NOTE 5
NONCONTROLLING INTEREST
In March 2012, the Company entered into an agreement with Mitsubishi Corporation (Mitsubishi) in which a Mitsubishi subsidiary acquired a 25% interest in the Company's previously wholly-owned subsidiary, Stillwater Canada Inc (SCI), which owns the Marathon PGM-copper project and related properties, for approximately US$81.25 million in cash and contributed an additional $13.6 million to satisfy Mitsubishi's portion of the venture's initial cash call. Mitsubishi will be responsible for funding its 25% share of operating, capital and exploration expenditures on the Marathon properties and has agreed to cooperate and support efforts to secure project financing for Marathon. Mitsubishi will have an option to purchase up to 100% of Marathon's future PGM production under a related supply agreement at a relatively small discount to market. The transaction closed on April 10, 2012. The Company incurred transaction costs of approximately $1.1 million related to the agreement with Mitsubishi, which were recorded within Stockholders' Equity on the Company's Consolidated Balance Sheets.
The noncontrolling interests' share of equity in SCI is reflected as Noncontrolling interest in the Company's Consolidated Balance Sheets and was $51.8 million as of December 31, 2012.
The change in the parent company's equity as a result of the sale of the noncontrolling interest in SCI was an increase to Additional paid in capital of $42.5 million, offset by expenses incurred of $1.1 million.
NOTE 6
DERIVATIVE INSTRUMENTS
The Company uses various derivative financial instruments to manage its exposure to changes in interest rates and PGM market commodity prices. Some of these derivative transactions are designated as hedges. Because the Company hedges only with instruments that have a high correlation with the value of the underlying exposures, changes in the derivatives’ fair value are expected to be offset by changes in the value of the hedged transaction.
COMMODITY DERIVATIVES
The Company customarily enters into fixed forward contracts and on occasion enters into financially settled forward contracts to offset the price risk in its PGM recycling activity. From time to time, it also has entered into these types of contracts on portions of its mine production. Under these customary fixed forward transactions, the Company agrees to deliver a stated quantity of metal on a specific future date at a price stipulated in advance. The Company uses fixed forward transactions primarily to price in advance the metals acquired for processing in its recycling segment. Under financially settled forward transactions, at each settlement date the Company receives the difference between the forward price and the market price if the market price is below the forward price and the Company pays the difference between the forward price and the market price if the market price is above the forward price. These financially settled forward contracts are settled in cash at maturity and do not require physical delivery of metal at settlement. The Company has typically used financially settled forward contracts with third parties to reduce its exposure to price risk on metal it is obligated to deliver under long-term sales agreements.
MINE PRODUCTION
At present, the Company has not entered into derivative instruments to hedge its mined production.
PGM RECYCLING
The Company customarily enters into fixed forward sales relating to PGM recycling of catalysts materials. The metals from PGM recycled materials are typically sold forward at the time of purchase and delivered against the fixed forward contracts when the ounces are recovered. All of the fixed forward sales contracts open at December 31, 2012, will settle at various periods through June 2013. The Company has credit agreements with its major trading partners that provide for margin deposits in the event that forward prices for metals exceed the Company’s hedged prices by a predetermined margin limit. As of December 31, 2012 and 2011, no such margin deposits were outstanding or due.
The following is a summary of the Company’s commodity derivatives as of December 31, 2012:
|
| | | | | | | | | | | | | | | | | | | | | |
| PGM Recycling: | | | | | | | | | | | | |
| Fixed Forwards | | | | | | | | | | | | |
| | | Platinum | | Palladium | | Rhodium |
| Settlement Period | | Ounces | | Average Price | | Ounces | | Average Price | | Ounces | | Average Price |
| First Quarter 2013 | | 31,362 |
| | $ | 1,599 |
| | 50,262 |
| | $ | 660 |
| | 8,458 |
| | $ | 1,121 |
|
| Second Quarter 2013 | | 3,395 |
| | $ | 1,592 |
| | 5,244 |
| | $ | 684 |
| | 1,350 |
| | $ | 1,074 |
|
NOTE 7
SHARE-BASED COMPENSATION
STOCK PLANS
The Company sponsors stock option plans (the “Plans”) that enable the Company to grant stock options or other equity based compensation to employees and non-employee directors. Effective in March 2011, the Company ceased offering stock options as incentive compensation to employees and non-employee directors and began to (and expects to continue to) issue only cash awards or restricted stock units in lieu of stock options. The Company continues to have previously issued stock options that remain outstanding under three separate plans: the 1994 Incentive Plan, the General Employee Plan and the 2004 Equity Incentive Plan. In April 2012, stockholders approved the 2012 Equity Incentive Plan. At inception of the plans, approximately 16.4 million shares of common stock were authorized under the Plans, including approximately 5.0 million, 5.2 million, 1.4 million and 4.8 million authorized shares for the 2012 Equity Incentive Plan, 2004 Equity Incentive Plan, the General Employee Plan and the 1994 Incentive Plan (as amended by the 1998 Incentive Plan), respectively. The 1998 Incentive Plan and the General Plan have been terminated and no additional options, shares or units may be issued under these two terminated plans. Approximately 5.4 million shares were available and reserved for grant under the 2004 and 2012 Equity Incentive Plans combined as of December 31, 2012.
The Compensation Committee of the Company’s Board of Directors administers the Plans and determines the type of equity awards to be issued, the exercise period, vesting period and all other terms of instruments issued under the Plans. Directors’ options vest over a period of six months after date of grant. Employees’ options and the majority of restricted stock units vest in equal annual installments over a three year period after date of grant. Some restricted stock units vest 100% one
year after the date of grant. Officers’ and directors’ options expire ten years after the date of grant. All other employee options expire five to ten years after the date of grant, depending upon the original grant date.
The Company received less than $0.1 million in cash from the exercise of stock options in 2012 and $0.8 million in cash from the exercise of stock options in each of the years 2011 and 2010.
NONVESTED SHARES:
Nonvested share activity during 2012, 2011 and 2010, is detailed in the following table:
|
| | | | | | | |
| Year ended December 31, | | Nonvested Shares | | Weighted- Average Grant- Date Fair Value |
| Nonvested shares at December 31, 2009 | | 1,966,770 |
| | $ | 4.96 |
|
| Granted | | 722,812 |
| | 11.77 |
|
| Vested | | (1,109,728 | ) | | 5.66 |
|
| Forfeited | | (15,968 | ) | | 7.40 |
|
| Nonvested shares at December 31, 2010 | | 1,563,886 |
| | $ | 7.51 |
|
| Granted | | 369,417 |
| | 22.49 |
|
| Vested | | (429,425 | ) | | 15.10 |
|
| Forfeited | | (1,267 | ) | | 18.78 |
|
| Nonvested shares at December 31, 2011 | | 1,502,611 |
| | $ | 10.95 |
|
| Granted | | 653,712 |
| | 13.12 |
|
| Vested | | (927,228 | ) | | 7.98 |
|
| Forfeited | | (79,762 | ) | | 13.80 |
|
| Nonvested shares at December 31, 2012 | | 1,149,333 |
| | $ | 14.38 |
|
Compensation expense, included within General and administrative in the Company's Consolidated Statements of Operations and Comprehensive Income, related to grants of nonvested shares for years ended 2012, 2011 and 2010 was $8.2 million, $6.4 million and $7.7 million, respectively.
The following table presents the compensation expense of the nonvested shares outstanding at December 31, 2012 to be recognized over the remaining vesting periods:
|
| | | | |
| (In millions) | | Compensation Expense |
| 2013 | | $ | 4.7 |
|
| 2014 | | 2.4 |
|
| 2015 | | 0.4 |
|
| Total | | $ | 7.5 |
|
DEFERRAL PLANS
The Stillwater Mining Company Non-Employee Directors’ Deferral Plan, allows non-employee directors to defer all or any portion of the compensation received as directors, in accordance with the provisions of Section 409A of the Internal Revenue Code and associated Treasury regulations. All amounts deferred under this plan are fully vested, and each participant elects the deferral period and form of the compensation (cash or Company common stock). The plan provides for a Company matching contribution equal to 20% of the participant’s deferred stock amount. Compensation expense that was deferred in common stock related to the Non-Employee Directors’ Deferral Plan was $83,400, $69,150 and $37,350 in 2012, 2011 and 2010, respectively. The Company match was made in Company common stock. There were no cash deferrals related to the Non-Employee Directors’ Deferral Plan in 2012 and 2011. In 2010, compensation expense that was deferred in cash related to the Non-Employee Directors’ Deferral Plan was $88,700.
The Stillwater Mining Company Nonqualified Deferred Compensation Plan, allows officers of the Company to defer up to 60% of their salaries and up to 100% of cash compensation other than salary in accordance with the provisions of Section 409A of the Internal Revenue Code and associated Treasury regulations. All amounts deferred under this plan are fully vested, and each participant elects the deferral period and form of the compensation (cash or Company common stock). For each Plan year, the Company matches the amount of compensation deferred during that year up to a maximum of 8% of the participant’s total compensation for the calendar year. Compensation expense deferred in cash was $342,000, $248,800 and $226,400 in 2012, 2011 and 2010, respectively.
STOCK OPTIONS
The Company recognizes compensation expense associated with its stock option grants based on their fair market value on the date of grant using a Black-Scholes option pricing model. The Company recognizes stock option expense ratably over the vesting period of the options. If options are canceled or forfeited prior to vesting, the Company stops recognizing the related expense effective with the date of forfeiture. The compensation expense recorded in General and administrative expense in the Company's Consolidated Statements of Operations and Comprehensive Income, related to the fair value of stock options was approximately $0.1 million for the year ended December 31, 2012 and approximately $0.2 million for each of the reporting periods of 2011 and 2010.
The fair value for options in 2011 and 2010 was estimated at the date of grant using a Black-Scholes option pricing model with the following weighted-average assumptions:
|
| | | | | | |
| Year ended December 31, | | 2011 | | 2010 |
| Weighted average expected lives (years) | | 3.5 |
| | 3.6 |
|
| Interest rate | | 0.8 | % | | 1.3 | % |
| Volatility | | 67 | % | | 67 | % |
| Dividend yield | | — |
| | — |
|
Stock option activity for the years ended December 31, 2012, 2011 and 2010, is summarized as follows (excluding the effect of nonvested shares):
|
| | | | | | | | | | | |
| Year Ended December 31, | | Shares | | Weighted Average Exercise Price | | Weighted- Average Grant- Date Fair Value |
| Options outstanding at December 31, 2009 | | 792,758 |
| | $ | 20.87 |
| | |
| Options exercisable at December 31, 2009 | | 741,723 |
| | 21.57 |
| | |
| 2010 Activity | | | | | | |
| Options granted | | 47,592 |
| | 15.52 |
| | $ | 7.52 |
|
| Options exercised | | (89,971 | ) | | 9.38 |
| | |
| Options canceled/forfeited | | (154,440 | ) | | 27.20 |
| | |
| Options outstanding at December 31, 2010 | | 595,939 |
| | $ | 20.54 |
| | |
| Options exercisable at December 31, 2010 | | 530,724 |
| | 21.32 |
| | |
| 2011 Activity | | | | | | |
| Options granted | | 103,479 |
| | 6.87 |
| | $ | 5.14 |
|
| Options exercised | | (52,131 | ) | | 15.10 |
| | |
| Options canceled/forfeited | | (155,175 | ) | | 33.25 |
| | |
| Options outstanding at December 31, 2011 | | 492,112 |
| | $ | 14.23 |
| | |
| Options exercisable at December 31, 2011 | | 454,966 |
| | 14.06 |
| | |
| 2012 Activity | | | | | | |
| Options granted | | — |
| | — |
| |
|
| Options exercised | | (16,552 | ) | | 2.61 |
| | |
| Options canceled/forfeited | | (233,041 | ) | | 18.86 |
| | |
| Options outstanding at December 31, 2012 | | 242,519 |
| | $ | 10.57 |
| | |
| Options exercisable at December 31, 2012 | | 224,933 |
| | 10.08 |
| | |
The total intrinsic value of stock options exercised during the years ended December 31, 2012, 2011 and 2010 was $0.2 million, $0.4 million, and $0.6 million, respectively. At December 31, 2012, the total intrinsic value was $0.8 million and $0.8 million for stock options outstanding and exercisable, respectively. The Company issued 96,154 replacement options to Peregrine Metals Ltd. shareholders upon closing the acquisition of Peregrine Metals Ltd. in the fourth quarter of 2011. These replacement options were included as part of the total consideration paid.
The following table summarizes information for outstanding and exercisable options as of December 31, 2012:
|
| | | | | | | | | | | | | | | | |
| | | | | Options Outstanding | | Options Exercisable |
Range of Exercise Price | | Number Outstanding | | Average Remaining Contract Life | | Weighted Average Exercise Price | | Number Exercisable | | Weighted Average Exercise Price |
| $ 1.69 - $ 4.66 | | 11,886 |
| | 2.2 | | $ | 2.23 |
| | 11,886 |
| | $ | 2.23 |
|
| $ 4.67 - $ 9.33 | | 111,291 |
| | 2.7 | | $ | 6.72 |
| | 111,291 |
| | $ | 6.72 |
|
| $ 9.34 - $13.99 | | 42,991 |
| | 5.0 | | $ | 12.03 |
| | 37,045 |
| | $ | 12.03 |
|
| $14.00 - $18.65 | | 53,151 |
| | 2.9 | | $ | 15.10 |
| | 49,757 |
| | $ | 15.01 |
|
| $18.66 - $23.31 | | 21,600 |
| | 7.3 | | $ | 19.98 |
| | 14,423 |
| | $ | 19.91 |
|
| $23.32 - $24.55 | | 1,600 |
| | 8.1 | | $ | 24.41 |
| | 531 |
| | $ | 24.41 |
|
| | | 242,519 |
| | 3.6 | | $ | 10.57 |
| | 224,933 |
| | $ | 10.08 |
|
A summary of the status of the Company’s nonvested stock options as of December 31, 2012, and changes during the year then ended, is presented below:
|
| | | | | | | |
| Nonvested Options | | Options | | Weighted- Average Grant- Date Fair Value |
| Nonvested options at January 1, 2012 | | 37,146 |
| | $ | 7.86 |
|
| Options granted | | — |
| | — |
|
| Options vested | | (18,092 | ) | | 7.46 |
|
| Options forfeited | | (1,468 | ) | | 8.97 |
|
| Nonvested options at December 31, 2012 | | 17,586 |
| | $ | 8.19 |
|
Total compensation cost related to nonvested stock options not yet recognized is $32,700 and $450 for 2013 and 2014, respectively.
EMPLOYEE BENEFIT PLANS
The Company has two savings plans, which qualify under section 401(k) of the U.S. Internal Revenue Code, covering essentially all non-bargaining and bargaining employees. Employees may elect to contribute up to 60% of their eligible compensation, subject to the Employee Retirement Income Security Act of 1974 (ERISA) limitations. The Company is required to make matching contributions equal to 100% of the employee’s contribution up to 8% of the employee’s compensation. Matching contributions are made with common stock of the Company. During 2012, 2011 and 2010, the Company issued approximately 0.7 million, 0.4 million and 0.3 million shares of common stock, respectively, with a market value on the respective grant dates of $7.9 million, $5.6 million and $4.4 million, respectively, to match employees’ contributions. The Company made no cash contributions to the plans in 2012, 2011 and 2010.
NOTE 8
INCOME TAXES
The components of the Company’s deferred income tax liabilities (assets) are comprised of the following temporary differences and carryforwards at December 31, 2012 and 2011:
|
| | | | | | | | |
| December 31, (In thousands) | | 2012 | | 2011 |
| Mine development and mineral interests-US | | $ | 112,867 |
| | $ | 94,661 |
|
| Mine development and mineral interests-Canada | | 49,758 |
| | 35,969 |
|
| Mineral interests-South America | | 111,961 |
| | 138,096 |
|
| Long-term debt | | 56,281 |
| | — |
|
| Total deferred tax liabilities | | 330,867 |
| | 268,726 |
|
| Noncurrent liabilities | | (12,644 | ) | | (11,997 | ) |
| Property and equipment | | (14,214 | ) | | (20,360 | ) |
| Current liabilities | | (20,243 | ) | | (18,493 | ) |
| Long-term investments | | (2,372 | ) | | (1,376 | ) |
| Inventory | | (1,061 | ) | | (1,326 | ) |
| AMT credit and other carryforwards | | (5,989 | ) | | (11,709 | ) |
| Exploration | | (4,815 | ) | | — |
|
| Net operating loss and other carryforwards | | (109,556 | ) | | (112,275 | ) |
| Total deferred tax assets | | (170,894 | ) | | (177,536 | ) |
| Valuation allowance | | 18,525 |
| | 82,875 |
|
| Net deferred tax assets | | (152,369 | ) | | (94,661 | ) |
| Net deferred tax liabilities | | $ | 178,498 |
| | $ | 174,065 |
|
In assessing the realizability of deferred tax assets, management considers whether it is more likely than not that some portion or all of the deferred tax assets will not be realized. Management considers the scheduled reversal of deferred tax liabilities, projected future taxable income, and tax planning strategies in making this assessment. The Company provided a valuation allowance in 2012 to reflect the estimated amount of deferred tax assets which may not be realized, which principally relate to foreign and state net operating losses, as well as certain tax credits. The Company provided a valuation allowance in 2011 to reflect the estimated amount of deferred tax assets which may not be realized principally due to the expiration of the net operating loss carryforwards (NOLs) as management considered it more likely than not that the NOLs would not be realized based upon projected future taxable income. The NOLs and other carryforwards for 2012 above represent $99.3 million from U.S. operations and $10.3 million from foreign operations. The NOLs for 2011 above represent $110.9 million from U.S. operations and $1.4 million from foreign operations.
Reconciliation of the income tax provision at the applicable statutory income tax rates to the effective rate is as follows:
|
| | | | | | | | | | | | |
| Year ended December 31, (In thousands) | | 2012 | | 2011 | | 2010 |
| Income before income taxes | | $ | 50,377 |
| | $ | 155,530 |
| | $ | 50,365 |
|
| Income tax expense at statutory rates | | $ | 18,302 |
| | $ | 53,648 |
| | $ | 17,642 |
|
| State income tax expense, net of federal benefit | | 4,173 |
| | 6,898 |
| | 2,212 |
|
| Percentage depletion | | (4,985 | ) | | (37,163 | ) | | — |
|
| Foreign currency transaction gain, net | | (5,304 | ) | | (1,131 | ) | | — |
|
| NOL utilization adjustment | | (4,277 | ) | | — |
| | — |
|
| Compensation related adjustment | | 2,026 |
| | 1,700 |
| | 1,306 |
|
| Change in valuation allowance | | (14,514 | ) | | (13,937 | ) | | (18,980 | ) |
| Other | | 540 |
| | 1,220 |
| | (2,180 | ) |
| Net income tax (benefit) provision | | $ | (4,039 | ) | | $ | 11,235 |
| | $ | — |
|
At December 31, 2012, the Company had approximately $265.3 million of regular federal tax net operating loss carryforwards in the US expiring from 2019 through 2028. Usage of $112.1 million of these net operating losses is limited to approximately $9.5 million annually as a result of the change in control of the Company that occurred in connection with the Norilsk Nickel transaction in 2003. Usage of $153.2 million of these net operating losses is limited to approximately $79.0 million annually, exclusive of any net realized built-in gains, as a result of the exit of Norilsk Nickel in 2010. The Company had $5.7 million of alternative minimum tax credit carryforwards which will not expire and $0.3 million in general business credits expiring in 2031. The Company had approximately $122.9 million of state tax net operating loss carryforwards expiring during 2013 through 2018. The Company also had $31.8 million of foreign net operating loss carryforwards, expiration of which varies by foreign jurisdiction.
No cash payments for state income taxes were made in 2012, 2011 and 2010. A U.S. federal estimated tax payment in the amount of $4.8 million was made in 2012, which related to 2011. The Company has net tax receivables of $9.3 million relating to prior year tax filings.
The Company’s policy is to recognize interest and penalties on unrecognized tax benefits in Income tax provision in the Company's Consolidated Statements of Operations and Comprehensive Income. There was no interest or penalties of this nature for the year ended December 31, 2011. The Company has included expense of $0.2 million for unrecognized tax benefit for the year ended December 31, 2012. The tax years subject to examination by the taxing authorities are the years ending December 31, 2011, 2010 and 2009, although net operating loss and credit carryforwards from all years are subject to examination and adjustments for three years following the year in which utilized.
The income tax (benefit) provision is comprised of the following: |
| | | | | | | | | | | |
| Year ended December 31, (In thousands) | | 2012 | | 2011 | | 2010 |
| Current | | | | | | |
| Federal | | $ | 1,721 |
| | $ | 11,235 |
| | — |
|
| State | | $ | 200 |
| | $ | — |
| | — |
|
| Foreign | | $ | — |
| | $ | — |
| | — |
|
| Current income tax | | $ | 1,921 |
| | $ | 11,235 |
| | — |
|
| Deferred | | | | | | |
| Federal | | $ | — |
| | $ | — |
| | — |
|
| State | | $ | — |
| | $ | — |
| | — |
|
| Foreign | | $ | (5,960 | ) | | $ | — |
| | — |
|
| Deferred income tax benefit | | $ | (5,960 | ) | | $ | — |
| | — |
|
| Income tax (benefit) provision | | $ | (4,039 | ) | | $ | 11,235 |
| | — |
|
The components of income before income taxes by tax jurisdiction for the years ended December 31, 2012, 2011 and 2010 were as follows: |
| | | | | | | | | | |
| (In millions) | | 2012 | 2011 | 2010 |
| United States | | $ | 60,166 |
| $ | 157,215 |
| $ | 50,406 |
|
| Canada | | (7,690 | ) | (2,632 | ) | (41 | ) |
| Other | | (2,099 | ) | 947 |
| — |
|
| Income before income taxes | | $ | 50,377 |
| $ | 155,530 |
| $ | 50,365 |
|
NOTE 9
COMPREHENSIVE GAIN/LOSS
Comprehensive gain/loss consists of earnings items and other gains and losses affecting stockholders’ equity that are excluded from current net income. As of December 31, 2012, 2011 and 2010, such items consisted of unrealized gains/losses on available-for-sale marketable securities.
The following summary sets forth the changes in Accumulated other comprehensive (loss) during 2012, 2011 and 2010:
|
| | | | |
| (In thousands) | | Available-for-Sale Securities |
| Balance at December 31, 2009 | | $ | (90 | ) |
| Change in value | | (762 | ) |
| Comprehensive loss | | $ | (762 | ) |
| Balance at December 31, 2010 | | $ | (852 | ) |
| Change in value | | (109 | ) |
| Comprehensive loss | | $ | (109 | ) |
| Balance at December 31, 2011 | | $ | (961 | ) |
| Change in value | | 862 |
|
| Comprehensive gain | | $ | 862 |
|
| Balance at December 31, 2012 | | $ | (99 | ) |
NOTE 10
SEGMENT INFORMATION
The Company operates five reportable business segments: Mine Production, PGM Recycling, Canadian Properties, South American Properties and All Other. These segments are managed separately based on fundamental differences in their operations and geographic separation.
The Mine Production segment consists of two business components: the Stillwater Mine and the East Boulder Mine. The Mine Production segment is engaged in the development, extraction, processing and refining of PGMs. The Company sells PGMs from mine production under long-term sales agreements, through forward sales instruments and in open PGM markets. The financial results of the Stillwater Mine and the East Boulder Mine have been aggregated, as both have similar products, processes, customers, distribution methods and economic characteristics.
The PGM Recycling segment is engaged in the recycling of spent catalyst material to recover the PGMs contained in the material. The Company allocates costs of the smelter and base metal refinery to both the Mine Production segment and to the PGM Recycling segment for internal and segment reporting purposes because the Company’s smelting and refining facilities support the PGM extraction requirements of both business segments. The Company also accepts material supplied from third parties on a tolling basis, processing it for a fee and returning the recovered metals to the supplier.
The Canadian Properties segment consists of the Marathon PGM assets (the majority of which is the Marathon project mineral property) and the Coldwell Complex exploration mineral properties. The Marathon project mineral property is a large PGM and copper deposit located near the town of Marathon, Ontario, Canada. The Marathon project is currently in the environmental review and permitting stage and will not be in production for several years. The Coldwell Complex exploration mineral properties are located adjacent to the Marathon property. Financial information available for this segment consists of total asset values, general and administrative costs, exploration costs and capital expenditures as the properties are developed.
The South American Properties segment consists of the Peregrine Metals Ltd. assets. The principal Peregrine property is the Altar project, a copper-gold discovery, located in the San Juan province of Argentina. The Peregrine project is currently in the exploration stage. Financial information available for this segment consists of total asset values, general and administrative costs and exploration costs.
The All Other group primarily consists of assets, revenues, and expenses of various corporate and support functions and the marketing expenditures related to promoting palladium.
The following financial information relates to the Company’s business segments:
|
| | | | | | | | | | | | | | | | | | | | | | | | |
| (In thousands) | | Mine Production | | PGM Recycling | | Canadian Properties | | South American Properties | | All Other | | Total |
| Year ended December 31, 2012 | | | | | | |
| Revenues | | $ | 455,426 |
| | $ | 344,818 |
| | $ | — |
| | $ | — |
| | $ | — |
| | $ | 800,244 |
|
| Depletion, depreciation and amortization | | $ | 56,960 |
| | $ | 1,055 |
| | $ | — |
| | $ | — |
| | $ | — |
| | $ | 58,015 |
|
| General and administrative expenses | | $ | — |
| | $ | — |
| | $ | 3,785 |
| | $ | 3,334 |
| | $ | 33,829 |
| | $ | 40,948 |
|
| Interest income | | $ | — |
| | $ | 2,293 |
| | $ | 29 |
| | $ | 208 |
| | $ | (205 | ) | | $ | 2,325 |
|
| Interest expense | | $ | — |
| | $ | — |
| | $ | 12 |
| | $ | — |
| | $ | 10,908 |
| | $ | 10,920 |
|
| Income (loss) before income taxes | | $ | 109,255 |
| | $ | 10,452 |
| | $ | (7,344 | ) | | $ | (2,254 | ) | | $ | (59,732 | ) | | $ | 50,377 |
|
| Capital expenditures | | $ | 96,307 |
| | $ | 353 |
| | $ | 8,319 |
| | $ | 18 |
| | $ | 7,074 |
| | $ | 112,071 |
|
| Total assets | | $ | 470,251 |
| | $ | 92,899 |
| | $ | 258,918 |
| | $ | 412,836 |
| | $ | 655,859 |
| | $ | 1,890,763 |
|
| | | | | | | | | | | | | |
| (In thousands) | | Mine Production | | PGM Recycling | | Canadian Properties | | South American Properties | | All Other | | Total |
| Year ended December 31, 2011 | | | | | | |
| Revenues | | $ | 528,007 |
| | $ | 376,820 |
| | $ | — |
| | $ | — |
| | $ | 1,142 |
| | $ | 905,969 |
|
| Depletion, depreciation and amortization | | $ | 61,312 |
| | $ | 1,066 |
| | $ | — |
| | $ | — |
| | $ | — |
| | $ | 62,378 |
|
| General and administrative expenses | | $ | — |
| | $ | — |
| | $ | 2,511 |
| | $ | 2,163 |
| | $ | 37,398 |
| | $ | 42,072 |
|
| Interest income | | $ | — |
| | $ | 2,228 |
| | $ | — |
| | $ | 66 |
| | $ | 1,280 |
| | $ | 3,574 |
|
| Interest expense | | $ | — |
| | $ | — |
| | $ | — |
| | $ | — |
| | $ | 6,548 |
| | $ | 6,548 |
|
| Income (loss) before income taxes | | $ | 197,250 |
| | $ | 18,816 |
| | $ | (2,576 | ) | | $ | (2,097 | ) | | $ | (55,863 | ) | | $ | 155,530 |
|
| Capital expenditures | | $ | 88,056 |
| | $ | 243 |
| | $ | 13,470 |
| | $ | 63 |
| | $ | 108 |
| | $ | 101,940 |
|
| Total assets | | $ | 416,740 |
| | $ | 70,901 |
| | $ | 196,706 |
| | $ | 440,942 |
| | $ | 202,035 |
| | $ | 1,327,324 |
|
| | | | | | | | | | | | | |
| (In thousands) | | Mine Production | | PGM Recycling | | Canadian Properties | | South American Properties | | All Other | | Total |
| Year ended December 31, 2010 | | | | | | |
| Revenues | | $ | 381,044 |
| | $ | 168,612 |
| | $ | — |
| | $ | — |
| | $ | 6,222 |
| | $ | 555,878 |
|
| Depletion, depreciation and amortization | | $ | 71,121 |
| | $ | 472 |
| | $ | — |
| | $ | — |
| | $ | — |
| | $ | 71,593 |
|
| General and administrative expenses | | $ | — |
| | $ | — |
| | $ | 40 |
| | $ | — |
| | $ | 32,976 |
| | $ | 33,016 |
|
| Interest income | | $ | — |
| | $ | 1,240 |
| | $ | — |
| | $ | — |
| | $ | 904 |
| | $ | 2,144 |
|
| Interest expense | | $ | — |
| | $ | — |
| | $ | — |
| | $ | — |
| | $ | 6,536 |
| | $ | 6,536 |
|
| Income (loss) before income taxes | | $ | 80,072 |
| | $ | 11,475 |
| | $ | (40 | ) | | $ | — |
| | $ | (41,142 | ) | | $ | 50,365 |
|
| Capital expenditures | | $ | 44,703 |
| | $ | 5,022 |
| | $ | 46 |
| | $ | — |
| | $ | 492 |
| | $ | 50,263 |
|
| Total assets | | $ | 384,377 |
| | $ | 51,223 |
| | $ | 182,080 |
| | $ | — |
| | $ | 291,790 |
| | $ | 909,470 |
|
NOTE 11
INVESTMENTS
The Company classifies the marketable securities in which it invests as available-for-sale securities. These securities are measured at fair market value in the financial statements with unrealized gains or losses recorded in Other comprehensive income (loss) in the Company's Consolidated Statements of Operations and Comprehensive Income. At the time the securities are sold, or otherwise disposed of, gross realized gains and losses are included in net income. Gross realized gains and losses are based on the carrying value (cost, net of discounts or premiums) of the sold investment.
The amortized cost, gross unrealized gains, gross unrealized losses, and fair market value of available-for-sale investment securities by major security type and class of security at December 31, are as follows:
|
| | | | | | | | | | | | | | | | |
| (In thousands) | | Amortized Cost | | Gross unrealized gains | | Gross unrealized losses | | Fair market value |
| 2012 | | | | | | | | |
| Federal agency notes | | $ | 124,682 |
| | $ | 33 |
| | $ | — |
| | $ | 124,715 |
|
| Commercial paper | | 137,661 |
| | — |
| | (393 | ) | | 137,268 |
|
| Mutual funds | | 1,556 |
| | 261 |
| | — |
| | 1,817 |
|
| Total | | $ | 263,899 |
| | $ | 294 |
| | $ | (393 | ) | | $ | 263,800 |
|
| 2011 | | | | | | | | |
| Federal agency notes | | $ | 18,759 |
| | $ | — |
| | $ | (138 | ) | | $ | 18,621 |
|
| Commercial paper | | 31,795 |
| | — |
| | (883 | ) | | 30,912 |
|
| Mutual funds | | 1,219 |
| | 60 |
| | — |
| | 1,279 |
|
| Total | | $ | 51,773 |
| | $ | 60 |
| | $ | (1,021 | ) | | $ | 50,812 |
|
The mutual funds included in the investment table above are included in Other noncurrent assets on the Company's Consolidated Balance Sheets.
The Company has long-term investments in several Canadian junior exploration companies, recorded on the balance sheet at cost. The Company determined that its long-term investments were other than temporarily impaired and recorded a loss of $2.6 million for the year ended December 31, 2012. At December 31, 2012, these long-term investments totaled $2.9 million and are recorded in Other noncurrent assets on the Company's Consolidated Balance Sheets.
NOTE 12
INVENTORIES
For purposes of inventory accounting, the market value of inventory is generally deemed equal to the Company’s current cost of replacing the inventory, provided that: (1) the market value of the inventory may not exceed the estimated selling price of such inventory in the ordinary course of business less reasonably predictable costs of completion and disposal, and (2) the market value may not be less than net realizable value reduced by an allowance for a normal profit margin. No reduction to inventory value was necessary during 2012 and 2011.
The costs of mined PGM inventories as of any date are determined based on combined production costs per ounce and include all inventoriable production costs, including direct labor, direct materials, depreciation and amortization and other overhead costs relating to mining and processing activities incurred as of such date.
The costs of recycled PGM inventories as of any date are determined based on the acquisition cost of the recycled material and include all inventoriable processing costs, including direct labor, direct materials and third party refining costs which relate to the processing activities incurred as of such date.
Inventories reflected in the accompanying balance sheets at December 31, consisted of the following:
|
| | | | | | | | |
| (In thousands) | | 2012 | | 2011 |
| Metals inventory | | | | |
| Raw ore | | $ | 3,505 |
| | $ | 1,179 |
|
| Concentrate and in-process | | 51,498 |
| | 43,379 |
|
| Finished goods | | 74,942 |
| | 66,194 |
|
| | | 129,945 |
| | 110,752 |
|
| Materials and supplies | | 23,263 |
| | 21,104 |
|
| Total inventory | | $ | 153,208 |
| | $ | 131,856 |
|
The Company also holds in its possession, but does not reflect in inventory, materials it processes on a toll basis for customers until the tolled material is transported to a third party refiner.
NOTE 13
EARNINGS PER COMMON SHARE
Basic earnings per share attributable to common stockholders is computed by dividing net earnings available to common stockholders by the weighted average number of common shares outstanding during the period. Diluted earnings per share attributable to common stockholders reflects the potential dilution that could occur if the Company’s dilutive outstanding stock options or nonvested shares were exercised or vested and the Company’s convertible debt was converted. For the purposes of calculating earnings per share attributable to common stockholders, reported net income attributable to common stockholders was adjusted for the interest expense, net of capitalized interest (including amortization expense of deferred debt fees), the related income tax effect and the income (loss) attributable to the noncontrolling interest in the computation of basic and diluted earnings per share attributable to common stockholders. The Company currently has only one class of equity shares outstanding.
Outstanding options to purchase 121,569 weighted shares of common stock were excluded from the computation of diluted earnings per share attributable to common stockholders for 2012, because the market price at the end of the period was lower than the exercise price, and therefore the effect would have been antidilutive. Outstanding options to purchase 273,965 and 439,440 weighted shares of common stock were excluded from the computation of diluted earnings per share attributable to common stockholders for 2011 and 2010, respectively, because the market price at the end of the period was lower than the exercise price, and therefore the effect would have been antidilutive.
The effect of outstanding nonvested shares was to increase diluted weighted average shares outstanding by 762,060, 957,604 and 1,189,253 shares for 2012, 2011 and 2010, respectively.
Approximately, 14.5 million and 7.1 million shares of common stock applicable to outstanding convertible debentures were included in the computation of diluted weighted average shares in 2012 and 2011, respectively, because the net effect of assuming all the outstanding debentures were converted would have been antidilutive. All shares of common stock applicable to outstanding convertible debentures were excluded from the computation of diluted weighted average shares in 2010.
Reconciliations showing the computation of basic and diluted shares and the related impact on income for the years ended December 31, 2012 and 2011 are shown in the following table: |
| | | | | | | | | | | | | | | | | |
| | Year Ended | | Year Ended |
| | December 31, 2012 | | December 31, 2011 |
| (In thousands, except per share amounts) | Income (Numerator) | | Weighted Average Shares (Denominator) | | Per Share Amount | | Income (Numerator) | | Weighted Average Shares (Denominator) | | Per Share Amount |
| Basic EPS | | | | | | | | | | | |
| Net income attributable to common stockholders | 55,045 |
| | 116,162 |
| | 0.47 |
| | 144,295 |
| | 105,846 |
| | 1.36 |
|
| Effect of Dilutive Securities | | | | | | | | | | | |
| Stock options | — |
| | 58 |
| | | | — |
| | 60 |
| | |
| Nonvested shares | — |
| | 762 |
| | | | — |
| | 958 |
| | |
| 1.875% Convertible debentures, net of tax | 2,355 |
| | 7,082 |
| | | | 3,651 |
| | 7,082 |
| | |
| 1.75% Convertible debentures, net of tax | 2,774 |
| | 7,377 |
| | | | — |
| | — |
| | |
| Diluted EPS | | | | | | | | | | | |
| Net income attributable to common stockholders and assumed conversions | 60,174 |
| | 131,441 |
| | 0.46 |
| | 147,946 |
| | 113,946 |
| | 1.30 |
|
NOTE 14
DEBT AND CAPITAL LEASE OBLIGATIONS
1.875% CONVERTIBLE DEBENTURES
In March 2008, the Company issued and sold $181.5 million aggregate principal amount of senior unsecured convertible debentures due March 15, 2028 (debentures). The debentures pay interest at 1.875% per annum, payable semi-annually on March 15 and September 15 of each year, and commenced paying interest on September 15, 2008. The debentures will mature on March 15, 2028, subject to earlier repurchase or conversion. Each $1,000 principal amount of debentures is initially convertible, at the option of the holders, into approximately 42.5351 shares of the Company’s common stock, at any time prior to the maturity date. The conversion rate is subject to certain adjustments, but will not be adjusted for accrued interest or any unpaid interest. The conversion rate initially represents a conversion price of $23.51 per share. Holders of the debentures may require the Company to repurchase all or a portion of their debentures on March 15, 2013, March 15, 2018 and March 15, 2023, or at any time before March 15, 2028 upon the occurrence of certain events including a change in control. The Company may redeem the debentures for cash beginning on or after March 22, 2013. The outstanding balance of $166.5 million is reported as a short-term debt obligation as of December 31, 2012.
Amortization expense related to the issuance costs of the debentures was $0.9 million for the years ended December 31, 2012, 2011 and 2010, respectively. Interest expense on the debentures was $3.1 million for the years ended December 31, 2012, 2011 and 2010, respectively, and the Company made cash payments of $3.1 million for interest on the debentures during the years ended December 31, 2012, 2011 and 2010.
In October 2009, the Company undertook the exchange of $15.0 million face amount of the convertible debentures for 1.84 million shares of the Company’s common stock. The debentures so acquired were retired, leaving $166.5 million face value of the debentures outstanding at December 31, 2009.
1.75% CONVERTIBLE DEBENTURES
In October 2012, the Company completed the issuance of $396.75 million of 1.75% senior unsecured convertible debentures, due October 15, 2032. Each $1,000 principal amount of these new debentures is initially convertible, under certain circumstances and during certain periods, into 60.4961 shares (subject to customary anti-dilution adjustments) of the Company's common stock, which represents an initial conversion price of $16.53 per share. The debentures also include an embedded conversion enhancement feature that is equivalent to including with each debenture a warrant initially exercisable for 30.2481 shares initially at $16.53 per share (also subject to customary anti-dilution adjustments). The Company, at its election, may settle conversions of the debentures in cash, shares of its common stock or any combination of cash and shares of its common stock. Debenture holders have the right to redeem their debentures at face value plus accrued and unpaid interest to, but excluding, the relevant repurchase date on October 15, of each of 2019, 2024, 2029, and upon the occurrence of certain corporate events. The Company will have the right to call the debentures at any time on or after October 20, 2019. The debentures were bifurcated under U.S. GAAP into separate debt and equity components, and reflect an effective maturity (to the first optional redemption date) of seven years. The residual amount of $141.6 million recorded within equity is treated for accounting purposes as additional debt discount and accreted as an additional non-cash interest charge to earnings over the expected life. Debt and equity issuance costs totaling approximately $12.4 million were deducted from the gross proceeds of the offering and the debt portion is being amortized ratably over 84 months. Net proceeds of $384.3 million from the offering will be used to retire the Company's $166.5 million of outstanding 1.875% convertible debentures upon their expected redemption on March 15, 2013, and for general corporate purposes.
The senior unsecured convertible debentures have an effective interest rate of 8.50% and a stated interest rate of 1.75% with interest paid semi-annually. The balance outstanding for the year ended December 31, 2012 was $258.2 million, which is net of unamortized discount of $138.5 million.
Amortization of debt issuance costs and interest expense related to the issuance of the 1.75% senior unsecured convertible debentures was $0.2 million and $4.5 million, respectively, for the period ending December 31, 2012. The Company made no cash payments for the period ending December 31, 2012.
EXEMPT FACILITY REVENUE BONDS
During 2000, the Company completed a $30.0 million offering of Exempt Facility Revenue Bonds, Series 2000, through the State of Montana Board of Investments. The bonds were issued by the State of Montana Board of Investments to finance a portion of the costs of constructing and equipping certain sewage and solid waste disposal facilities at both the Stillwater Mine and the East Boulder Mine. The bonds mature on July 1, 2020, and have a stated interest rate of 8.00% with interest paid semi-annually. The bonds have an effective interest rate of 8.57%. Net proceeds from the offering were $28.7 million. The balance
outstanding for the year ended December 31, 2012 was $29.6 million, which is net of unamortized discount of $0.4 million. The outstanding balance for years ending December 31, 2011 and 2010 was $29.5 million net of unamortized discount of $0.5 million. The Company made cash payments of $2.4 million for interest on the revenue bonds during 2012, 2011 and 2010.
ASSET-BACKED REVOLVING CREDIT FACILITY
In December 2011, the Company signed a $100.0 million asset-backed revolving credit agreement with Wells Fargo Capital Finance, incurring debt issuance costs of $1.1 million. Borrowings under this working capital facility are limited to a borrowing base comprised of 85% of eligible accounts receivable and 70% of eligible inventories. Terms of the agreement state that the borrowings will be secured by the Company’s accounts receivable, metals inventories and other accounts. The asset-backed revolving credit facility includes a single fixed-charge coverage covenant ratio of at least 1.0 to 1.0 that only takes effect when less than 30% of the total borrowing capacity under the line remains available as well as other customary provisions that become more restrictive as drawings under the facility increase. The facility includes a $50.0 million letter of credit sub-facility. Outstanding borrowings under the facility accrue interest at a spread over the London Interbank Offer Rate that varies from 2.25% to 2.75%, decreasing progressively as the percentage drawn against the facility increases. The Company also pays an unused line fee on the committed but unutilized balance under the facility at a rate per annum of 0.375% or 0.5%, depending on utilization of the facility. In January 2012, the Company completed the syndication of this facility to a group of four banks and simultaneously expanded the maximum line of credit to $125.0 million, incurring additional debt issuance costs of $0.2 million. The Company recognized approximately, $1.0 million in fees associated with the asset-backed revolving credit facility for the year ended December 31, 2012. Amortization expense related to the issuance costs of the credit agreement for the year ended December 31, 2012 was approximately $0.3 million. As of December 31, 2012 there was no drawn balance under this revolving credit facility, although approximately $17.5 million in undrawn irrevocable letters of credit have been issued under this facility as collateral for sureties.
CAPITAL LEASE OBLIGATIONS
On June 1, 2012, the Company entered into a lease agreement with General Electric Capital Corporation (GECC) covering the acquisition of a tunnel-boring machine for use on the Blitz project adjacent to the Stillwater Mine. The transaction is structured as a capital lease with a four-year term; lease payments are due quarterly in advance. In the third quarter of 2012, the Company increased the lease balance due under the original GECC capital lease by $0.7 million. The Company made cash payments of $1.6 million on its capital lease obligations for the year ended December 31, 2012. These cash payments included interest of $0.2 million. As of December 31, 2012, the outstanding balance under the capital lease was $6.5 million.
The following is a schedule by year of the future minimum lease payments for the capital lease together with the present value of the net minimum lease payments: |
| | | | |
| Year ended December 31, 2012 (In thousands) | | |
| 2013 | | $ | 2,168 |
|
| 2014 | | 2,168 |
|
| 2015 | | 2,168 |
|
| 2016 | | 590 |
|
| Total minimum lease payments | | 7,094 |
|
| Less interest at rates ranging from 5.21% to 5.46% (before tax) | | 635 |
|
| Net minimum lease payments | | 6,459 |
|
| Less current portion | | 1,855 |
|
| Total long-term capital lease obligation | | $ | 4,604 |
|
CAPITALIZED INTEREST
The Company capitalizes interest incurred on its various debt instruments as a cost of properties under development. For the period ended December 31, 2012, the Company capitalized interest of $0.9 million. Capitalized interest is recorded as a reduction of interest expense on the Company's Consolidated Statements of Operations and Comprehensive Income. The Company did not record capitalized interest as a cost of properties under development in the comparable period of 2011.
NOTE 15
MINERAL PROPERTIES AND MINE DEVELOPMENT
Mineral properties and mine development at December 31, 2012 and 2011, consisted of the following:
|
| | | | | | | | |
| (In thousands) | | 2012 | | 2011 |
| Mineral Properties: | | | | |
| Ontario, Canada | | | | |
| Marathon property | | $ | 184,609 |
| | $ | 172,649 |
|
| Land improvements | | 13,390 |
| | 6,668 |
|
| Benton property | | 14,056 |
| | 14,056 |
|
| San Juan, Argentina | | | | |
| Altar property | | 392,387 |
| | 403,095 |
|
| Mine Development: | | | | |
| Montana, United States of America | | | | |
| Stillwater Mine | | $ | 464,882 |
| | $ | 414,340 |
|
| East Boulder Mine | | 155,878 |
| | 139,463 |
|
| | | 1,225,202 |
| | 1,150,271 |
|
| Less accumulated depletion and amortization | | (325,977 | ) | | (285,237 | ) |
| Total mineral properties and mine development | | $ | 899,225 |
| | $ | 865,034 |
|
The Company acquired the assets of Peregrine Metals Ltd., a Canadian exploration company, in October 2011 for $166.4 million in cash (net of cash acquired) and approximately 12.03 million Stillwater common shares with a fair value of $96.5 million on the date of acquisition. During the year ended December 31, 2012, the Company recorded adjustments to the purchase price of its foreign mineral interests to reflect final tax bases and rates applicable to the properties.
NOTE 16
PROPERTY, PLANT AND EQUIPMENT
Property, plant and equipment at December 31, consisted of the following:
|
| | | | | | | | |
| (In thousands) | | 2012 | | 2011 |
| Machinery and equipment | | $ | 107,957 |
| | $ | 77,734 |
|
| Buildings and structural components | | 145,347 |
| | 140,962 |
|
| Land | | 8,418 |
| | 8,091 |
|
| Construction-in-progress: | | | | |
| Stillwater Mine | | 18,515 |
| | 17,808 |
|
| East Boulder Mine | | 888 |
| | 727 |
|
| Marathon | | 238 |
| | 218 |
|
| Other | | 11,247 |
| | 5,214 |
|
| | | 292,610 |
| | 250,754 |
|
| Less accumulated depreciation | | (169,933 | ) | | (151,375 | ) |
| Total property, plant, and equipment | | $ | 122,677 |
| | $ | 99,379 |
|
The Company’s capital outlay for the years ended December 31, was as follows:
|
| | | | | | | | | | | | |
| (In thousands) | | 2012 | | 2011 | | 2010 |
| Stillwater Mine | | $ | 86,541 |
| | $ | 69,168 |
| | $ | 34,093 |
|
| East Boulder Mine | | 10,443 |
| | 18,888 |
| | 6,513 |
|
| Marathon project | | 8,319 |
| | 13,470 |
| | 45 |
|
| Altar project | | 18 |
| | 63 |
| | — |
|
| Other | | 7,427 |
| | 351 |
| | 9,612 |
|
| Total capital outlay | | $ | 112,748 |
| | $ | 101,940 |
| | $ | 50,263 |
|
| Acquired by capital lease transactions | | (677 | ) | | — |
| | — |
|
| Total cash paid | | $ | 112,071 |
| | $ | 101,940 |
| | $ | 50,263 |
|
NOTE 17
ASSET RETIREMENT OBLIGATION
The following summary sets forth the annual changes to the Company’s asset retirement obligation in 2012, 2011 and 2010:
|
| | | | | | | | | | | | |
| (In thousands) | | Stillwater Mine | | East Boulder Mine | | Total |
| Balance at December 31, 2009 | | $ | 5,755 |
| | $ | 454 |
| | $ | 6,209 |
|
| Accretion expense | | 498 |
| | 40 |
| | 538 |
|
| Balance at December 31, 2010 | | $ | 6,253 |
| | $ | 494 |
| | $ | 6,747 |
|
| Accretion expense | | 541 |
| | 43 |
| | 584 |
|
| Balance at December 31, 2011 | | $ | 6,794 |
| | $ | 537 |
| | $ | 7,331 |
|
| Accretion expense | | 587 |
| | 47 |
| | 634 |
|
| Balance at December 31, 2012 | | $ | 7,381 |
| | $ | 584 |
| | $ | 7,965 |
|
No adjustments were made to the asset retirement obligations in 2012, 2011 and 2010. The Company estimates the mine life of the Stillwater Mine and the East Boulder Mine to the year 2031 and 2078, respectively.
At December 31, 2012, the Company had posted surety bonds with the State of Montana in the amount of $33.3 million to satisfy the current financial guarantee requirements determined by the regulatory agencies. The final updated environmental impact statement (EIS) was completed during the second quarter of 2012 and the Company is expecting the review process to extend through the second quarter of 2013 and anticipates these financial guarantee requirements may increase.
NOTE 18
FAIR VALUE MEASUREMENTS
Fair value is defined as the price that would be received to sell an asset or paid to transfer a liability (an exit price) in an orderly transaction between market participants. A three-level fair value hierarchy prioritizes the inputs used to measure fair value. This hierarchy requires an entity to maximize the use of observable inputs and minimize the use of unobservable inputs when measuring fair value. The classification of each financial asset or liability within the hierarchy is determined based on the lowest level input that is significant to the fair value measurement. The three levels of inputs used to measure fair value are as follows:
| |
| • | Level 1 – Quoted prices in active markets for identical assets or liabilities. |
| |
| • | Level 2 – Observable inputs other than quoted prices included in Level 1 such as quoted prices for similar assets and liabilities in active markets; quoted prices for identical or similar assets and liabilities in markets that are not active; or inputs that are observable or can be corroborated by observable market data. |
| |
| • | Level 3 – Unobservable inputs that are supported by little or no market activity and that are significant to the fair value of the assets or liabilities. |
Financial assets and liabilities measured at fair value on a recurring basis at December 31, 2012 and 2011 consisted of the following:
|
| | | | | | | | | | | | | | | | |
| (In thousands) | | Fair Value Measurements |
| At December 31, 2012 | | Total | | Level 1 | | Level 2 | | Level 3 |
| Mutual funds | | $ | 1,817 |
| | $ | 1,817 |
| | $ | — |
| | $ | — |
|
| Investments | | | | | | | | |
| Federal agency notes | | $ | 124,715 |
| | $ | — |
| | $ | 124,715 |
| | $ | — |
|
| Commercial paper | | $ | 137,268 |
| | $ | — |
| | $ | 137,268 |
| | $ | — |
|
|
| | | | | | | | | | | | | | | | |
| (In thousands) | | Fair Value Measurements |
| At December 31, 2011 | | Total | | Level 1 | | Level 2 | | Level 3 |
| Mutual funds | | $ | 1,279 |
| | $ | 1,279 |
| | $ | — |
| | $ | — |
|
| Investments | | | | | | | | |
| Federal agency notes | | $ | 18,621 |
| | $ | — |
| | $ | 18,621 |
| | $ | — |
|
| Commercial paper | | $ | 30,912 |
| | $ | — |
| | $ | 30,912 |
| | $ | — |
|
The fair value of mutual funds and investments is based on market prices which are readily available. Unrealized gains or losses on mutual funds and investments are recorded in Accumulated other comprehensive loss on the Company's Consolidated Balance Sheets.
Financial assets and liabilities measured at fair value on a nonrecurring basis at December 31, 2012 and 2011 consisted of the following:
|
| | | | | | | | | | | | | | | | |
| (In thousands) | | Fair Value Measurements |
| At December 31, 2012 | | Total | | Level 1 | | Level 2 | | Level 3 |
| 1.875 % Convertible debentures | | $ | 166,292 |
| | $ | — |
| | $ | 166,292 |
| | $ | — |
|
| 1.75% Convertible debentures | | $ | 302,466 |
| | $ | — |
| | $ | 302,466 |
| | $ | — |
|
| Exempt facility revenue bonds | | $ | 29,968 |
| | $ | — |
| | $ | — |
| | $ | 29,968 |
|
|
| | | | | | | | | | | | | | | | |
| (In thousands) | | Fair Value Measurements |
| At December 31, 2011 | | Total | | Level 1 | | Level 2 | | Level 3 |
| 1.875% Convertible debentures | | $ | 160,256 |
| | $ | — |
| | $ | 160,256 |
| | $ | — |
|
| Exempt facility revenue bonds | | $ | 27,269 |
| | $ | — |
| | $ | — |
| | $ | 27,269 |
|
The Company used implicit interest rates of comparable unsecured obligations to calculate the fair value of the Company’s $30.0 million 8% Series 2000 exempt facility industrial revenue bonds at December 31, 2012 and 2011. The Company used its current trading data to determine the fair value of each of its convertible debentures, the $166.5 million, 1.875% convertible debentures and the $396.75 million, 1.75% convertible debentures at December 31, 2012 and the $166.5 million, 1.875% convertible debenture at December 31, 2011.
The fair value of the Company's long-term investments in certain Canadian exploration companies are evaluated at reporting periods including December 31, 2012 based on market prices which are readily available.
NOTE 19
RELATED PARTIES
Mitsubishi Corporation owns a 25% interest in the Company's previously wholly-owned subsidiary, Stillwater Canada Inc (SCI), which owns the Marathon PGM-copper project and related properties located in Ontario, Canada. Stillwater Mining Company made sales of $206.4 million to Mitsubishi Corporation in 2012.
NOTE 20
COMMITMENTS AND CONTINGENCIES
The Company manages risk through insurance coverage, credit monitoring and diversification of suppliers and customers. The Company also seeks to maintain adequate liquidity to offset the risk of pricing cycles.
REFINING AGREEMENTS
The Company has contracted with two entities to refine its filter cake production. Even though there are a limited number of PGM refiners, the Company believes that it is not economically dependent upon any one refiner.
OPERATING LEASES
The Company has operating leases for various mining equipment, office equipment and office space expiring at various dates through August 1, 2017. Total rental expense for cancelable and non-cancelable operating leases was $2.4 million, $1.5 million and $1.3 million in 2012, 2011 and 2010, respectively. Future minimum lease payments for operating leases with terms in excess of one year are as follows: |
| | | | |
| Year ended (In thousands) | | Minimum Lease Payment |
| 2013 | | $ | 467 |
|
| 2014 | | 396 |
|
| 2015 | | 146 |
|
| 2016 | | 146 |
|
| 2017 | | 130 |
|
| Total | | $ | 1,285 |
|
SIGNIFICANT CUSTOMERS
Total sales to significant customers as a percentage of total revenues for the years ended December 31, were as follows:
|
| | | | | | | | |
| | 2012(1) | | 2011(1) | | 2010(1) |
| Customer A | 26 | % | | 28 | % | | 17 | % |
| Customer B | 18 | % | | 17 | % | | 49 | % |
| Customer C | 17 | % | | — | % | | — | % |
| Customer D | 10 | % | | — | % | | — | % |
| Customer E | — | % | | 19 | % | | 12 | % |
| | 71 | % | | 64 | % | | 78 | % |
(1) The “—” symbol represents less than 10% of total revenues
LABOR UNION CONTRACTS
As of December 31, 2012, the Company had approximately 59% and 18% of its active labor force covered by collective bargaining agreements expiring on June 1, 2015 and December 31, 2015, respectively.
LEGAL PROCEEDINGS
The Company is involved in various claims and legal actions arising in the ordinary course of business, primarily employee lawsuits. In the opinion of management, the ultimate disposition of these matters is not expected to have a material adverse effect on the Company’s consolidated financial position, results of operations or liquidity.
NOTE 21
QUARTERLY DATA (UNAUDITED)
Quarterly earnings data for the years ended December 31, 2012 and 2011 were as follows:
|
| | | | | | | | | | | | | | | | | | | | | | | | | |
| (In thousands, except per share data) | | 2012 Quarter Ended |
| | | March 31 | | June 30 | | September 30 | | December 31 |
| | | As Reported | As Revised | | As Reported | As Revised | | As Reported | As Revised | | |
| Revenue | | $ | 203,051 |
| $ | 203,051 |
| | $ | 212,775 |
| $ | 212,775 |
| | $ | 181,044 |
| $ | 181,044 |
| | $ | 203,374 |
|
| Depletion, depreciation and amortization | | $ | 14,672 |
| $ | 14,672 |
| | $ | 14,862 |
| $ | 14,862 |
| | $ | 14,107 |
| $ | 14,107 |
| | $ | 14,374 |
|
| Operating income | | $ | 1,767 |
| $ | 1,767 |
| | $ | 13,627 |
| $ | 13,627 |
| | $ | 9,645 |
| $ | 9,645 |
| | $ | 18,597 |
|
| Net income | | $ | 2,439 |
| $ | 5,940 |
| | $ | 17,829 |
| $ | 18,797 |
| | $ | 12,692 |
| $ | 12,803 |
| | $ | 16,876 |
|
| Comprehensive income attributable to common stockholders | | $ | 2,747 |
| $ | 6,248 |
| | $ | 18,091 |
| $ | 19,046 |
| | $ | 13,417 |
| $ | 13,497 |
| | $ | 17,116 |
|
| Basic earnings per share attributable to common stockholders | | $ | 0.02 |
| $ | 0.05 |
| | $ | 0.16 |
| $ | 0.17 |
| | $ | 0.11 |
| $ | 0.11 |
| | $ | 0.14 |
|
| Diluted earnings per share attributable to common stockholders | | $ | 0.02 |
| $ | 0.05 |
| | $ | 0.15 |
| $ | 0.17 |
| | $ | 0.11 |
| $ | 0.11 |
| | $ | 0.13 |
|
The company has recorded an immaterial error correction to recognize deferred tax benefits associated with its foreign exploration activities. For the quarters ended March 31, 2012, June 30, 2012 and September 30, 2012, the Company revised net income by $3.5 million, $1.0 million and $0.1 million, respectively, to recognize the tax benefit.
|
| | | | | | | | | | | | | | | | |
| (In thousands, except per share data) | | 2011 Quarter Ended |
| | | March 31 | | June 30 | | September 30 | | December 31 |
| Revenue | | $ | 170,061 |
| | $ | 222,605 |
| | $ | 253,652 |
| | $ | 259,651 |
|
| Depletion, depreciation and amortization | | $ | 16,063 |
| | $ | 15,660 |
| | $ | 15,628 |
| | $ | 15,027 |
|
| Operating income | | $ | 40,939 |
| | $ | 49,117 |
| | $ | 44,156 |
| | $ | 20,994 |
|
| Net income | | $ | 36,192 |
| | $ | 42,698 |
| | $ | 40,741 |
| | $ | 24,664 |
|
| Comprehensive income attributable to common stockholders | | $ | 36,002 |
| | $ | 42,784 |
| | $ | 40,506 |
| | $ | 24,894 |
|
| Basic earnings per share attributable to common stockholders | | $ | 0.35 |
| | $ | 0.41 |
| | $ | 0.40 |
| | $ | 0.21 |
|
| Diluted earnings per share attributable to common stockholders | | $ | 0.34 |
| | $ | 0.39 |
| | $ | 0.37 |
| | $ | 0.21 |
|
ITEM 9A
CONTROLS AND PROCEDURES
| |
| (a) | Disclosure Controls and Procedures. |
The Company’s management, with the participation of the Company’s Chief Executive Officer and Chief Financial Officer, has evaluated the effectiveness of the Company’s disclosure controls and procedures (as such term is defined in Rules 13a-15(e) and 15d-15(e) under the Securities Exchange Act of 1934, as amended (the “Exchange Act”)), as of the end of the period covered by this report. Based on such evaluation, the Company’s Chief Executive Officer and Chief Financial Officer have concluded that, as of the end of such period, the Company’s disclosure controls and procedures are effective in recording, processing, summarizing and reporting, on a timely basis, information required to be disclosed by the Company in the reports that it files or submits under the Exchange Act.
| |
| (b) | Changes in Internal Control Over Financial Reporting. |
In evaluating the registrant’s internal control over financial reporting, as required by Rules 13a-15(d) and 15d-15(d) of the Exchange Act, for the year ended December 31, 2012, management determined that during the fourth quarter of 2012 there were no changes to the registrant’s internal control over financial reporting (as such term is defined in Rules 13a-15(f) and 15d-15(f) of the Exchange Act) that have materially affected, or are reasonably likely to materially affect, the registrant’s internal control over financial reporting.
| |
| (c) | Internal Control Over Financial Reporting. |
The Company, under the supervision and with the participation of the Company’s Chief Executive Officer and Chief Financial Officer, has conducted an evaluation of the effectiveness of its internal control over financial reporting as of December 31, 2012, and has concluded that, as December 31, 2012, the Company’s internal control over financial reporting was effective.
The Company’s independent registered public accounting firm has issued an audit opinion on the effectiveness of the Company’s internal control over financial reporting. This report appears within Item 8 of this Annual Report on Form 10-K.
MANAGEMENT’S REPORT ON INTERNAL CONTROL OVER FINANCIAL REPORTING
Our management is responsible for establishing and maintaining adequate internal control over financial reporting, as such term is defined in Rule 13a-15(f) of the Exchange Act. Under the supervision and with the participation of our management, including our Chief Executive Officer and Chief Financial Officer, we conducted an evaluation of the effectiveness of our internal control over financial reporting based upon the framework in Internal Control Integrated Framework issued by the Committee of Sponsoring Organizations of the Treadway Commission (COSO). Based on that evaluation, our management concluded that our internal control over financial reporting is effective, as of December 31, 2012.
PART III
ITEM 10
DIRECTORS, EXECUTIVE OFFICERS AND CORPORATE GOVERNANCE
With regard to directors and corporate governance, reference is made to the information set forth under the caption “Nominees for Election” in the Company’s Proxy Statement for the 2013 Annual Meeting of Stockholders to be filed pursuant to Regulation 14A, which information is incorporated herein by reference.
Set forth below is certain information concerning the individuals who were executive officers of the Company as of December 31, 2012.
|
| | | | |
| Name | | Age | | Position |
| Francis R. McAllister | | 70 | | Chairman of the Board and Chief Executive Officer |
| Gregory A. Wing | | 63 | | Vice President and Chief Financial Officer |
| Terrell I. Ackerman | | 59 | | Vice President of Corporate Development |
| Kevin G. Shiell | | 55 | | Vice President of Mining Operations |
The following are brief biographies of the Company’s executive officers:
EXECUTIVE OFFICERS
Francis R. McAllister (age 70) was appointed Chairman of the Board and Chief Executive Officer of the Company effective February 12, 2001. Mr. McAllister was appointed a Director of the Company on January 9, 2001. Prior to his appointment to the Board, Mr. McAllister served with ASARCO Incorporated from 1966 to 1999, as Chairman and Chief Executive Officer in 1999, as Chief Operating Officer from 1998 to 1999, as Executive Vice President – Copper Operations from 1993 to 1998, as Chief Financial Officer from 1982 to 1993 and in various professional and management positions from 1966 to 1982. He currently serves on the Board of Directors of Cliffs Natural Resources Incorporated, an iron ore mining company. Mr. McAllister earned his M.B.A. from New York University, his Bachelor of Science – Finance from the University of Utah, and attended the Advanced Management Program at Harvard Business School.
Gregory A. Wing (age 63) has been Vice President and Chief Financial Officer of the Company since March 22, 2004. Previously, Mr. Wing served as the Vice President of Finance and Chief Financial Officer of Black Beauty Coal Company from 1995 through 2003. Prior to joining Black Beauty, Mr. Wing was with The Pittsburg and Midway Coal Mining Company, a subsidiary of Chevron Corporation, as Manager of Financial Planning and Analysis. From 1986 to 1989, he was employed by Chevron Corporation as Senior Analyst in Corporation Planning, and from 1980 to 1986, he was with Arabian American Oil Company in Dhahran, Saudi Arabia. Mr. Wing earned a Bachelor of Arts in Physics and an M.B.A. in Accounting and Finance, from the University of California at Berkeley.
Terrell I. Ackerman (age 59) is currently Vice President of Corporate Development. In his current role, Mr. Ackerman is responsible for the Company's international exploration and development projects. Prior to this appointment in August 2011, Mr. Ackerman served as the Vice President, General Manager of East Boulder Operations. He was Vice President of Planning & Processing Operations from March 2002 to November 2008. Mr. Ackerman joined the Company in March 2000 as Director of Corporate Planning after 2 years as an independent consultant. During 1998 and 1999, Mr. Ackerman conducted feasibility studies, operational and mine planning reviews for various underground operations. Prior to this time, Mr. Ackerman was Vice President and General Manager of BHP Copper’s San Manuel Operation in Arizona. Mr. Ackerman held increasing roles of accountability for Magma Copper Company starting as an underground engineer in training in 1976. Mr. Ackerman earned a Bachelor of Science degree in Mine Engineering from the University of Idaho, College of Mines.
Kevin G. Shiell (age 55) is currently Vice President of Mining Operations. Mr. Shiell was appointed Vice President of the Company in May of 2010. Mr. Shiell has 34 years of underground mining experience. Prior to his current appointment, he served as General Manager of the Stillwater Mine and Operations. During 2006 to 2008, he was General Manager at the East Boulder Mine. Prior to joining Stillwater, Mr. Shiell was Mine Superintendent with Dynatec Corporation. He was with Addwest Minerals as Mine Superintendent and Manager of Operations. From 1979 to 1995, Mr. Shiell was with Hecla Mining Company where he held various positions including miner, supervisor, trainer, and planner, as well as mine and safety foreman. And from 1978 to 1979, he was with Day Mines and United Nuclear Homestake operations. Mr. Shiell is a member of the Northwest Mining Association.
For information concerning the Company’s executive officers, reference is made to the information set forth under the caption “Section 16(a) Beneficial Ownership Compliance” in the Company’s Proxy Statement for the 2013 Annual Meeting of Stockholders to be filed pursuant to Regulation 14A, which information is incorporated herein by reference.
AUDIT COMMITTEE FINANCIAL EXPERT
Federal regulations and New York Stock Exchange (NYSE) listing requirements, require the board to determine if a member of its audit committee is an “audit committee financial expert”. According to these requirements, an audit committee member can be designated an audit committee financial expert only when the audit committee member satisfies five specified qualification requirements, such as experience (or “experience actively supervising” others engaged in) preparing, auditing, analyzing, or evaluating financial statements presenting a level of accounting complexity comparable to what is encountered in connection with the Company’s financial statements. The regulations further require such qualifications to have been acquired through specified means of experience or education. The Board has designated Michael S. Parrett as an audit committee financial expert. Mr. Parrett meets the independence standards for audit committee members under the NYSE Listed Company and SEC rules.
CODE OF ETHICS
The Company’s code of ethics requires honest and ethical conduct; avoidance of conflicts of interest; compliance with applicable governmental laws, rules and regulations; full, fair, accurate, timely, and understandable disclosure in reports and documents filed with the SEC and in other public communications made; and accountability for adherence to the code. The code of ethics can be accessed via the Company’s internet website at www.stillwatermining.com. Printed copies will be provided upon request.
CORPORATE GOVERNANCE
The Company’s corporate governance principles, corporate governance and nominating committee charter, compensation committee charter and audit committee charter can be accessed via the Company’s internet website at www.stillwatermining.com
NYSE CEO CERTIFICATION
Pursuant to Section 303A.12(a) of the NYSE Listed Company Manual, the Company’s chief executive officer submitted a certification, dated April 30, 2012, that to his knowledge, as of such date, the Company was not in violation of any NYSE listing standards.
ITEM 11
EXECUTIVE COMPENSATION
Reference is made to the information set forth under the caption “Executive Compensation” in the Company’s Proxy Statement for the 2013 Annual Meeting of Stockholders to be filed pursuant to Regulation 14A, which information is incorporated herein by reference.
ITEM 12
SECURITY OWNERSHIP OF CERTAIN BENEFICIAL
OWNERS AND MANAGEMENT AND RELATED STOCKHOLDERS MATTERS
Reference is made to the information set forth under the caption “Security Ownership of Principal Stockholders and Management” in the Company’s Proxy Statement for the 2013 Annual Meeting of Stockholders to be filed pursuant to Regulation 14A, which information is incorporated herein by reference.
ITEM 13
CERTAIN RELATIONSHIPS AND RELATED TRANSACTIONS, AND DIRECTOR INDEPENDENCE
Reference is made to the information set forth under the caption “Certain Relationships and Related Transactions and Director Independence” in the Company’s Proxy Statement for the 2013 Annual Meeting of Stockholders to be filed pursuant to Regulation 14A, which information is incorporated herein by reference.
ITEM 14
PRINCIPAL ACCOUNTING FEES AND SERVICES
Reference is made to the information set forth under the caption “Principal Accounting Fees and Services” in the Company’s Proxy Statement for the 2013 Annual Meeting of Stockholders to be filed pursuant to Regulation 14A, which information is incorporated herein by reference.
PART IV
ITEM 15
EXHIBITS, FINANCIAL STATEMENT SCHEDULES
(a) Documents filed as part of this Form 10-K
1. Financial Statements and Supplementary Data
|
| |
| | Page |
| Report of Independent Registered Public Accounting Firm | |
| Consolidated Statements of Operations and Comprehensive Income | |
| Consolidated Balance Sheets | |
| Consolidated Statements of Cash Flows | |
| Consolidated Statements of Changes in Equity | |
| Notes to the Consolidated Financial Statements | |
2. Financial Statement Schedules (not applicable)
(b) See Exhibit Index below
(c) Not applicable
EXHIBITS
|
| | |
| Number | | Description |
| | |
| 2.1 | | Exchange Agreement for 10,000 shares of common stock, dated October 1, 1993 (incorporated by reference to Exhibit 2.1 to the Registrant’s Registration Statement on Form S-1 (File No. 33-85904) as declared effective by the Commission on December 15, 1994 (the “1994 S-1”)). |
| | |
| 3.1 | | Restated Certificate of Incorporation of Stillwater Mining Company, dated October 23, 2003 (incorporated by reference to Exhibit 3.1 to the Registrant’s Form 10-Q for the quarterly period ended September 30, 2003, filed on October 27, 2003). |
| | |
| 3.2 | | Amended and Restated By-Laws of Stillwater Mining Company, (incorporated by reference to Exhibit 3.2 to the Registrant’s Form 8-K filed on December 29, 2004). |
| | |
| 10.1 | | Credit Agreement by and among Wells Fargo Capital Finance, LLC, and Stillwater Mining Company (incorporated by reference to Exhibit 10.1 of the Registrant’s Form 8-K, dated December 29, 2011). |
| | |
| 10.2 | | First Amendment Agreement between Stillwater Mining Company and Wells Fargo Capital Finance LLC, dated January 13, 2012. (incorporated by reference to Exhibit 10.1 to the Registrant’s Form 8-K filed on January 18, 2012). |
| | | |
| 10.3 | | Conveyance of Royalty Interest and Agreement between Stillwater Mining Company and Manville Mining Company, dated October 1, 1993 (incorporated by reference to Exhibit 10.9 to the Registrant’s 1994 S-1). |
| | |
| 10.7 | | Employment Agreement between Francis R. McAllister and Stillwater Mining Company, dated July 23, 2001 (incorporated by reference to Exhibit 10.1 to the Registrant’s Form 10-Q for the quarterly period ended September 30, 2001). |
| | |
| 10.8 | | Employment agreement between John R. Stark and Stillwater Mining Company, dated July 23, 2001 (incorporated by reference to Exhibit 10.18 to the Registrant’s Form 10-K for the year ended December 31, 2001). |
| | |
| 10.12 | | Refining Agreement between Stillwater Mining Company and Catalyst and Chemicals Division of Johnson Matthey Inc. dated July 27, 2000 (incorporated by reference to Exhibit 10.22 of the Registrant’s 2000 10-K) (portions of the agreement have been omitted pursuant to a confidential treatment request). |
| | |
| 10.17 | | Employment Agreement between Terrell I. Ackerman and Stillwater Mining Company, dated May 8, 2002 (incorporated by reference to Exhibit 10.34 of the Registrant’s 2002 10-K). |
| | |
| 10.18 | | Amended and Restated General Employee Stock Plan, dated October 23, 2003 (incorporated by reference to Exhibit 10.1 to the Registrant’s Form 10-Q for the quarterly period ended September 30, 2003). |
| | |
| 10.22 | | Amended and Restated Refining Agreement between Stillwater Mining Company and Chemicals Catalyst and Refining Division of Johnson Matthey Inc. dated October 1, 2010, (portions of the agreement have been omitted pursuant to a confidential treatment request), (incorporated by reference to Exhibit 10.22 to the Registrant’s Form 10-K filed on February 22, 2011). |
| | |
| 10.24 | | Employment Agreement between Gregory A. Wing and Stillwater Mining Company, dated as of March 22, 2004 (incorporated by reference to Exhibit 10.40 to the Registrant’s Form 10-K filed on March 15, 2004). |
| | |
| 10.34 | | 409A Nonqualified Deferred Compensation Plan, (incorporated by reference to Exhibit 10.34 to the Registrant’s Form 10-K filed on March 16, 2006). |
| | |
| 10.35 | | 2004 Equity Incentive Plan (incorporated by reference to Appendix A to the Registrant’s Proxy statement, dated April 29, 2004). |
| | |
| 10.36 | | 409A Non-Employee Directors Deferred Compensation Plan (incorporated by reference to Exhibit 10.1 to the Registrant’s Form-8K dated May 9, 2005). |
| 10.37 | | 2012 Equity Incentive Plan (incorporated by reference to Appendix A to the Registrant’s Proxy statement, dated March 23, 2012). |
| 10.39 | | Articles of Agreement between Stillwater Mining Company (Stillwater Mine & Mill, and the Processing and Warehouse facilities) and United Steel Workers (USW) Local 11-0001, ratified July 9, 2011 (incorporated by reference to Exhibit 10.1 to the Registrant’s Form 10-Q filed on August 3, 2011). |
| | |
| 10.42 | | Palladium and Rhodium Sales Agreement, made as of August 8, 2007, between Stillwater Mining Company and General Motors Corporation, (portions of the agreement have been omitted pursuant to a confidential treatment request), (incorporated by reference to Exhibit 10.4 to the Registrant’s Form 10-Q filed on November 6, 2007). |
| | |
|
| | |
| Number | | Description |
| 10.43 | | First Amendment Agreement to Palladium and Rhodium Sales Agreement between Stillwater Mining Company and General Motors Corporation, dated December 9, 2008 (portions of the agreement have been omitted pursuant to a confidential treatment request) (incorporated by reference to Exhibit 10.43 to the Registrant’s Form 10-K filed on March 16, 2009). |
| | |
| 10.44 | | Articles of Agreement between Stillwater Mining Company East Boulder Operation and United Steel Workers International Union, Local 11-001, East Boulder Unit, dated January 1, 2012 (incorporated by reference to Exhibit 99.1 to the Registrant’s Form 8-K filed on April 5, 2012). |
| | |
| 10.45 | | Form of 1.875% Convertible Senior Notes due 2028 (incorporated by reference to Exhibit 4.2 to the Registrant’s Form 8-K, dated March 14, 2008). |
| | |
| 10.47 | | Indenture, dated as of March 12, 2008, among Stillwater Mining Company, Law Debenture Trust Company of New York, and Deutsche Bank Trust Company Americas. (incorporated by reference to Exhibit 4.1 to the Registrant's Form 8-K, dated March 14, 2008). |
| | | |
| 10.48 | | Registration Rights Agreement, dated as of March 12, 2008, between Stillwater Mining Company and Deutsche Bank, (incorporated by reference to Exhibit 4.3 to the Registrant’s Form 8-K, dated March 14, 2008). |
| | |
| 10.49 | | Amended and Restated Secondary Materials Processing Agreement, dated as of June 7, 2005, among Stillwater Mining Company and Power Mount Incorporated, (incorporated by reference to Exhibit 10.1 to the Registrant's Form 8-K, dated December 9, 2008),(portions of the agreement have been omitted pursuant to a confidential treatment request). |
| | |
| 10.50 | | Purchase Agreement, Stillwater Mining Company and Deutsche Bank, dated March 6, 2008. (incorporated by reference to Exhibit 99.1 to the Registrant’s Form 8-K, dated March 7, 2008). |
| | |
| 10.51 | | Second Amendment Agreement to Palladium and Rhodium Sales Agreement between Stillwater Mining Company and General Motors Corporation, dated March 5, 2009 (portions of the agreement have been omitted pursuant to a confidential treatment request), (incorporated by reference to Exhibit 10.1 to the Registrant’s Form 10-Q filed on August 7, 2009). |
| | |
| 10.52 | | Palladium Sales Agreement between Stillwater Mining Company and General Motors LLC, dated January 1, 2011 (portions of the agreement have been omitted pursuant to a confidential treatment request), (incorporated by reference to Exhibit 10.52 to the Registrant’s Form 10-K filed on February 22, 2011). |
| | |
| 10.53 | | Amendment to Employment Agreement between Francis R. McAllister and Stillwater Mining Company, dated November 3, 2010, (incorporated by reference to Exhibit 10.53 to the Registrant's Form 10-K filed on February 22, 2011). |
| | |
| 10.54 | | Amendment to Employment Agreement between John R. Stark and Stillwater Mining Company, dated November 3, 2010, (incorporated by reference to Exhibit 10.54 to the Registrant's Form 10-K filed on February 22, 2011). |
| | |
| 10.55 | | Amendment to Employment Agreement between Gregory A. Wing and Stillwater Mining Company, dated November 3, 2010, (incorporated by reference to Exhibit 10.55 to the Registrant's Form 10-K filed on February 22, 2011). |
| | |
| 10.56 | | Amendment to Employment Agreement between Terrell A. Ackerman and Stillwater Mining Company, dated November 3, 2010, (incorporated by reference to Exhibit 10.56 to the Registrant's Form 10-K filed on February 22, 2011). |
| | | |
| 10.57 | | Platinum and Palladium Purchase and Supply Agreement, made as of January 1, 2012, between Stillwater Mining Company and Ford Motor Company, (portions of the agreement have been omitted pursuant to a confidential treatment request), (incorporated by reference to Exhibit 10.1 to the Registrant's Form 10-Q filed on October 30, 2012). |
| | | |
| 10.58 | | Second Amendment Agreement between Stillwater Mining Company and Wells Fargo Capital Finance, LLC, dated May 29, 2012, (incorporated by reference to the Registrant's Form 8-K filed on October 12, 2012). |
| | |
| 10.59 | | First Supplemental Indenture between Stillwater Mining Company and Law Debenture Trust Company of New York dated October 17, 2012, (incorporated by reference to Exhibit 4.1 to the Registrant's Form 8-K filed on October 17, 2012). |
| | | |
| 10.60 | | Form of 1.75% Convertible Senior Notes due 2032, (incorporated by reference to Exhibit 4.2 to the Registrant's Form 8-K filed on October 17, 2012). |
| | | |
|
| | |
| Number | | Description |
| 10.61 | | Second Amended and Restated Secondary Materials Processing Agreement, dated November 1, 2012, among Stillwater Mining Company and Power Mount Incorporated, (filed herewith), (confidential portions of this agreement have been omitted pursuant to a request for confidential treatment and have been filed separately with the Securities and Exchange Commission, filed on the Registrant's Form 8-K, dated February 27, 2013). |
| | | |
| 18.1 | | Preferability letter from KPMG LLP dated March 30, 2005, (incorporated by reference to Exhibit 18.1 to the Registrant's Form 10-K filed on March 31, 2005). |
| | |
| 18.2 | | Preferability letter from KPMG LLP dated May 5, 2010, (incorporated by reference to Exhibit 18.1 to the Registrant’s Form 10-Q filed on May 5, 2010). |
| | |
| 23.1 | | Consent of KPMG LLP, Independent Registered Public Accounting Firm (filed herewith). |
| | |
| 23.2 | | Consent of Behre Dolbear & Company, Inc., (filed herewith). |
| | |
| 31.1 | | Rule 13a-14(a)/15d-14(a) Certification – Chief Executive Officer, (filed herewith). |
| | |
| 31.2 | | Rule 13a-14(a)/15d-14(a) Certification – Vice President and Chief Financial Officer, (filed herewith). |
| | |
| 32.1 | | Section 1350 Certification, (filed herewith). |
| | |
| 32.2 | | Section 1350 Certification, (filed herewith). |
| | |
| 95.0 | | Mine Safety Disclosures |
| | |
| 101.INS | | XBRL Instance |
| | | |
| 101.SCH | | XBRL Taxonomy Extension Schema |
| | | |
| 101.CAL | | XBRL Taxonomy Extension Calculation |
| | | |
| 101.DEF | | XBRL Taxonomy Extension Definition |
| | | |
| 101.LAB | | XBRL Taxonomy Extension Labels |
| | | |
| 101.PRE | | XBRL Taxonomy Extension Presentation |
SIGNATURES
Pursuant to the requirements of Section 13 or 15(d) of the Securities Exchange Act of 1934, the Registrant has duly caused this report to be signed on its behalf by the undersigned, thereunto duly authorized.
|
| | | | | |
| | | | STILLWATER MINING COMPANY |
| | | | (“Registrant”) |
| | | | |
| Dated: | February 27, 2013 | | By: | | /s/ Francis R. McAllister |
| | | | | | Francis R. McAllister |
| | | | | | Chairman and Chief Executive Officer |
Pursuant to the requirements of the Securities Exchange Act of 1934, this report has been signed below by the following persons on behalf of the registrant and in the capacities and on the dates indicated.
|
| | | | |
| Signature | | Title | | Date |
| | | | | |
| /s/ Francis R. McAllister | | Chairman, Chief Executive | | February 27, 2013 |
| Francis R. McAllister | | Officer and Director | | |
| | | (Principal Executive Officer) | | |
| | | | | |
| /s/ Gregory A. Wing | | Vice President and Chief | | February 27, 2013 |
| Gregory A. Wing | | Financial Officer | | |
| | | (Principal Financial and Accounting Officer) | | |
| | | | | |
| /s/ Craig L. Fuller | | Director | | February 27, 2013 |
| Craig L. Fuller | | | | |
| | | | | |
| /s/ Patrick M. James | | Director | | February 27, 2013 |
| Patrick M. James | | | | |
| | | | | |
| /s/ Steven S. Lucas | | Director | | February 27, 2013 |
| Steven S. Lucas | | | | |
| | | | | |
| /s/ Sheryl K. Pressler | | Director | | February 27, 2013 |
| Sheryl K. Pressler | | | | |
| | | | | |
| /s/ Michael S. Parrett | | Director | | February 27, 2013 |
| Michael S. Parrett | | | | |
| | | | | |
| /s/ Michael Schiavone | | Director | | February 27, 2013 |
| Michael Schiavone | | | | |
| | | | | |
| /s/ Gary A. Sugar | | Director | | February 27, 2013 |
| Gary A. Sugar | | | | |
| | | | | |
| /s/ George M. Bee | | Director | | February 27, 2013 |
| George M. Bee | | | | |