| | |
| UNITED STATES
SECURITIES AND EXCHANGE COMMISSION |
| | |
| CERTIFIED SHAREHOLDER REPORT OF REGISTERED
MANAGEMENT INVESTMENT COMPANIES
|
| | |
| Investment Company Act file number: | (811-07237) |
| | |
| Exact name of registrant as specified in charter: | Putnam Investment Funds |
| | |
| Address of principal executive offices: | One Post Office Square, Boston, Massachusetts 02109 |
| | |
| Name and address of agent for service: | Robert T. Burns, Vice President
One Post Office Square
Boston, Massachusetts 02109 |
| | |
| Copy to: | John W. Gerstmayr, Esq.
Ropes & Gray LLP
800 Boylston Street
Boston, Massachusetts 02199-3600 |
| | |
| Registrant’s telephone number, including area code: | (617) 292-1000 |
| | |
| Date of fiscal year end: | July 31, 2013 |
| | |
| Date of reporting period: | August 1, 2012 — January 31, 2013 |
| | |
|
Item 1. Report to Stockholders: | |
| | |
| The following is a copy of the report transmitted to stockholders pursuant to Rule 30e-1 under the Investment Company Act of 1940: | |
Putnam
Research
Fund
Semiannual report
1 | 31 | 13
| | | |
| Message from the Trustees | 1 | | |
| | |
| About the fund | 2 | | |
| | |
| Performance snapshot | 4 | | |
| | |
| Interview with your fund’s portfolio manager | 5 | | |
| | |
| Your fund’s performance | 10 | | |
| | |
| Your fund’s expenses | 12 | | |
| | |
| Terms and definitions | 14 | | |
| | |
| Other information for shareholders | 15 | | |
| | |
| Financial statements | 16 | | |
| | |
Consider these risks before investing: Growth stocks may be more susceptible to earnings disappointments, and value stocks may fail to rebound. The prices of stocks in the fund’s portfolio may fall or fail to rise over extended periods of time for a variety of reasons, including both general financial market conditions and factors related to a specific company or industry.
Message from the Trustees
Dear Fellow Shareholder:
Stock markets around the world have continued to show strength into 2013, with the S&P 500 Index delivering its best January return since 1997. Investors witnessed several positive developments, including the U.S. fiscal cliff bill that Congress passed on January 1, 2013; the improving employment and housing situations; a more stable Europe; and China’s “soft landing” and positive growth.
Today’s market environment is one of slow and steady improvement, but uncertainties linger. Questions remain about potential economic fallout from the upcoming debt ceiling and budget sequestration debates in the United States. And the sovereign debt situation in Europe, while stabilized, is far from resolved.
At Putnam, our investment team is focused on actively managing risk and pursuing returns in today’s volatile global market. As always, it is important to rely on the guidance of your financial advisor to help you manage your investment portfolio in accordance with your goals and risk tolerance.
We would also like to extend a welcome to new shareholders of the fund and to thank all of our investors for your continued confidence in Putnam.

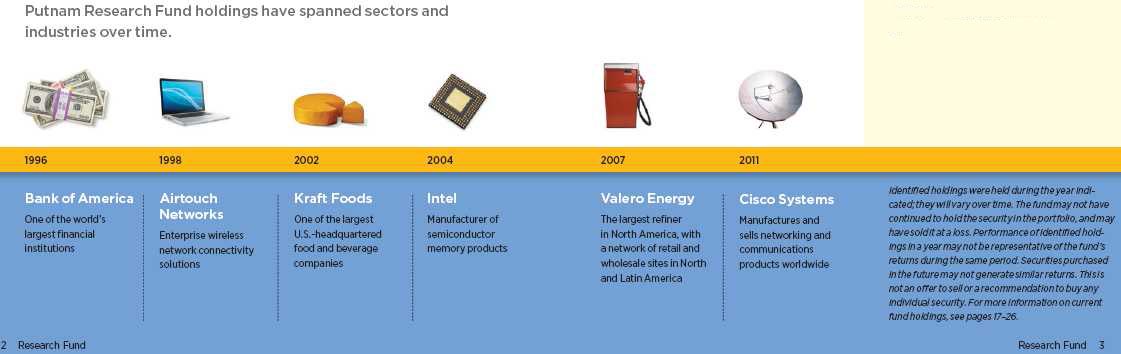
About the fund
Building a portfolio of best ideas
Research is at the heart of investing. Whether it is undertaken by Wall Street firms or by Putnam’s in-house analysts, research is used by investment managers to assess whether a company’s stock is undervalued, overvalued, or on target at its current price.
One approach to determining a company’s worth is to measure its tangible assets, such as physical plants or inventory. Other measures of worth are less quantifiable and may involve the evaluation of the company’s long-term competitive advantage, the expertise of its management team, or the success of its research and development efforts.
Analysts consider these factors along with financial yardsticks such as the price-to-earnings ratio and earnings growth. By digging deep into the information available, analysts work to develop a set of expectations about the financial and competitive health of a specific company versus other firms in the industry — both in the United States and across the broader global marketplace. Of course, there is no foolproof way to uncover all information about a company, and surprises can always occur.
Putnam’s equity analysts gather information from on-site interviews with company management and through meetings with sources who are able to provide additional information about the company’s true worth and likely future direction.
By including Putnam Research Fund as part of a diversified portfolio, you are investing in what we like to call a “best ideas” fund: It represents the select stock picks of Putnam’s large-cap equity analysts, incorporated into a single portfolio that can include both growth- and value-style stocks.
Putnam’s research analysts specialize in sectors and industries
Consumer staples Broadcasting, lodging/tourism, department stores, retail, electronics, food, household goods, homebuilding, restaurants
Energy Integrated oil and gas, drilling, exploration, equipment, services
Financials Banking, brokerage, consumer finance, insurance, real estate investment trusts, mortgage finance
Health care Biotechnology, equipment, pharmaceuticals, services
Industrials Aerospace and defense, construction and farm machinery, electrical components, office services
Technology Computer hardware/software, semiconductors, services
Materials Gold, metals, paper products/packaging, specialty chemicals, steel
Telecommunications Alternative carriers, wireless services
Utilities Electric utilities, gas utilities, independent power producers
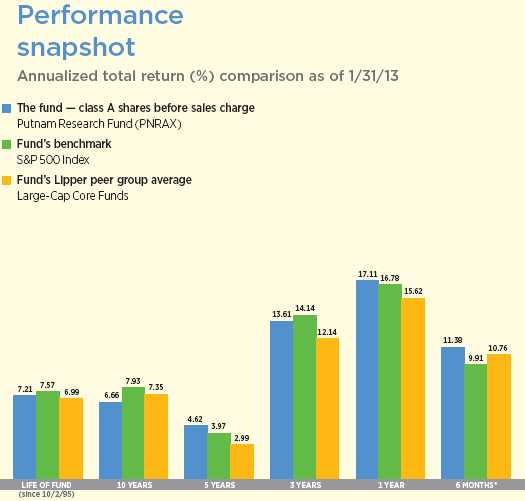
Current performance may be lower or higher than the quoted past performance, which cannot guarantee future results. Share price, principal value, and return will fluctuate, and you may have a gain or a loss when you sell your shares. Performance of class A shares assumes reinvestment of distributions and does not account for taxes. Fund returns in the bar chart do not reflect a sales charge of 5.75%; had they, returns would have been lower. See pages 5 and 10–12 for additional performance information. For a portion of the periods, the fund had expense limitations, without which returns would have been lower. A short-term trading fee of 1.00% may have applied to redemptions (including exchanges into another fund) of shares purchased before January 2, 2013, and held for 7 days or less. No short-term trading fee applies to shares purchased on or after January 2, 2013. To obtain most recent month-end performance, visit putnam.com.
* Returns for the six-month period are not annualized, but cumulative.
Interview with your fund’s portfolio manager

Putnam Research Fund surpassed its benchmark for the six-month period ended January 31, 2013. What was the primary factor driving this result?
Nearly all of the fund’s outperformance relative to its benchmark, the S&P 500 Index, came from stock selection. While nearly every sector in the broad equity market experienced positive performance, our process of emphasizing what we consider the best stock ideas served the fund well across all sectors.
Did the fund’s performance benefit from any notable market trends?
As the period progressed, stocks of some of the largest “mega-cap” U.S. companies — companies with market capitalizations of around $200 billion — began to underperform large-, midsize-, and small-company stocks. This marked a shift in investor sentiment from a bias toward “safety-trade” stocks to a greater level of comfort with investments with higher perceived risk. This development was broadly positive for the fund because it holds benchmark-relative underweights to some of the largest-company stocks.
In addition, valuation played a positive role for the fund, as cheaper stocks — which the fund favors — began to outperform more expensive stocks. While this is generally true over the long term, it had not been the case for sustained periods over the past few years.

This comparison shows your fund’s performance in the context of broad market indexes for the six months ended 1/31/13. See pages 4 and 10–12 for additional fund performance information. Index descriptions can be found on page 14.
Lastly, over the past year and longer we have seen a gradual lessening of uncertainty regarding Europe’s sovereign debt situation, and this trend continued through the semi-annual period. A positive development for global markets has been Europe’s significant fiscal healing, as the deficits for some of the most indebted eurozone countries were halved between 2010 and 2013.
In addition, labor markets in Europe outside Germany have become more competitive, which we believe has improved the prospects for economic growth in a number of European countries and offset some of the impact of fiscal austerity on the general populace. As Europe’s outlook continued to brighten during the period, equities around the globe tended to perform better.
What is your assessment of U.S. corporate health?
Our outlook is quite positive, particularly in the wake of fourth-quarter 2012 earnings strength. Notably, earnings were weak in the third quarter, but in October and November we believed that many companies were poised for an earnings reacceleration by year-end. That largely played out as we expected. In addition, corporate outlooks for 2013 are generally optimistic, particularly as companies hope to capitalize on pent-up demand and typically appear more willing to make capital expenditures to expand their businesses.
Another factor that we believe supports stronger U.S. corporate health is the lessening of concerns over the economic climate in Europe and economic growth in China. With strong corporate fundamentals and improving macroeconomic data, we think U.S. companies may be in a good position to perform well over the course of 2013.
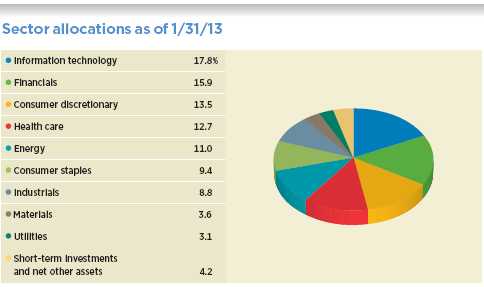
Allocations are represented as a percentage of the fund’s net assets. Summary information may differ from the portfolio schedule included in the financial statements due to the inclusion of derivative securities, any interest accruals, the exclusion of as-of trades, if any, and the use of different classifications of securities for presentation purposes. Holdings and allocations may vary over time.

Which holdings or strategies were top contributors to the fund’s performance?
The top contributor for the period was the stock of solar-facility maker First Solar, which in the fund’s prior fiscal year had been the largest detractor from returns. We maintained a meaningful exposure to the company, however, on the strength of our positive assessment of its prospects for a turnaround. Indeed, we thought the company’s pipeline of projects was promising enough to suggest that the market had drastically underestimated the stock’s potential. Toward period-end, we trimmed this position, locking in profits for the fund.
The second-largest contributor was our underweight position in Coca-Cola relative to the benchmark. As I mentioned earlier, the market began to move away from more defensive, higher-quality, mega-cap companies during the past six months, and Coca-Cola shares lost value due to that trend.
Other contributors included the fund’s positions in Citigroup and JPMorgan. Overall, the financials sector performed well during the period. Many large banks continued to repair their balance sheets, even as they saw a resumption of loan growth and a decline in the amount of their non-performing loans. Consequently, earnings in the sector began to normalize while perceived risks declined in intensity.
Which holdings or strategies held fund performance back?
The fund had an underweight position in financial bellwether Goldman Sachs, which did not help the fund relative to the benchmark as the company performed well. In general, our analysis of opportunities in the
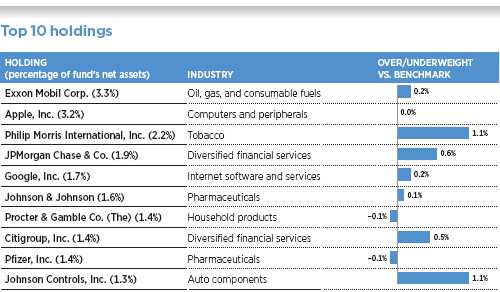
This table shows the fund’s top 10 holdings by percentage of the fund’s net assets as of 1/31/13. Short-term holdings are excluded. Holdings will vary over time.
financials sector led us to emphasize other companies, in this case at the expense of the size of our exposure to Goldman Sachs.
Our decision not to hold the stock of Home Depot also hurt the fund’s benchmark-relative performance. We have a positive assessment of the housing market’s potential — where we see signs that a rebound is already underway — and the fund is exposed to the housing sector through investment in other companies. However, we missed out on what proved to be a strong improvement in Home Depot’s stock price as the housing market made steps toward recovery during the period and businesses tied to home renovations grew.
Software and professional health-care services provider Allscripts Healthcare Solutions was the third-largest detractor from returns. The company is one of the largest players in the area of digital medical records, but had experienced turmoil in its management ranks and downward pressure on earnings over the course of 2012. During the fund’s reporting period, the market eagerly received news that the company was considering a leveraged buyout with private equity firms, but hopes were dashed and the stock sold off when those plans were abandoned. We sold the stock before period-end.
What is your outlook for equities?
As of the start of February 2013, some market observers wonder whether the stock market has reached a peak. The S&P 500 Index is in the neighborhood of 1500, a key confidence level last seen in 2007 and 2000. In other words, we are at the top of a trading range that is more than a decade long, and some are wondering, where do we go from here? We feel positive about the market’s ability to climb higher for a couple of reasons. First, company earnings per share have grown substantially since 2007 and 2000.
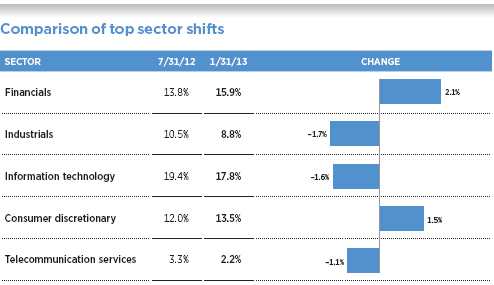
This chart shows the fund’s largest allocation shifts, by percentage, over the past six months. Allocations are represented as a percentage of the fund’s net assets. Current period summary information may differ from the portfolio schedule included in the financial statements due to the inclusion of derivative securities, any interest accruals, the exclusion of as-of trades, if any, and the use of different classifications of securities for presentation purposes. Holdings and allocations may vary over time.
Second, price-to-earnings ratios have largely compressed relative to these earlier periods, which suggests that stocks are generally cheaper than they were during the market’s prior peaks.
On the plus side, we note that a number of economic indicators are below their peak levels and, we believe, may be poised for sustained improvement. Housing and autos as a percentage of U.S. GDP, capital expenditures, employment, and inventories are all at or below what we consider mid-cycle levels, which suggests the possibility for continued expansion. Combined with unsteady but gradual improvements in Europe (Italy, for example, still presents certain unique risks), we feel the outlook for improving economic fundamentals in the United States suggests we could be facing a multi-year period of healthy economic growth, which would bode well for stocks.
Having said that, we do not expect market strength to progress in a straight line. Eventually, the United States will need to make its advance with less Federal Reserve easing and may face an environment of higher interest rates. In addition, the threat of geopolitical conflict hovers over certain flash points around the globe. For these reasons, the one- to two-year outlook looks good to us, though we expect volatility from different sources to occasionally cause market unease.
Thank you, Aaron, for bringing us up to date.
The views expressed in this report are exclusively those of Putnam Management and are subject to change. They are not meant as investment advice.
Please note that the holdings discussed in this report may not have been held by the fund for the entire period. Portfolio composition is subject to review in accordance with the fund’s investment strategy and may vary in the future. Current and future portfolio holdings are subject to risk.
Portfolio Manager Aaron M. Cooper is Director of Global Equity Research at Putnam. He holds an A.B. from Harvard University. A CFA charterholder, he joined Putnam in 2011 and has been in the investment industry since 1999.
In addition to Aaron, your fund’s managers are Kelsey Chen, Ph.D.; Steven W. Curbow; Neil P. Desai; Ferat Ongoren; and Walter D. Scully.
IN THE NEWS
Mixed signals are coming from the U.S. economy. On the positive side, the unemployment rate continues to tick down, the housing sector is recovering, and the stock market has reached multi-year highs. But uncertainty remains. The nation’s GDP was essentially flat in the fourth quarter of 2012, after several consecutive quarters of expansion. A precipitous drop in military spending contributed to the slowdown, and many questions remain about government spending and its impact on GDP going forward. Consumer confidence recently dropped following the tax increases resulting from the fiscal cliff resolution, as people anticipate the pinch of less take-home pay. The next few months should provide clearer direction for the markets on government spending and the resilience of the recovery.
Your fund’s performance
This section shows your fund’s performance, price, and distribution information for periods ended January 31, 2013, the end of the first half of its current fiscal year. In accordance with regulatory requirements for mutual funds, we also include performance information as of the most recent calendar quarter-end and expense information taken from the fund’s current prospectus. Performance should always be considered in light of a fund’s investment strategy. Data represent past performance. Past performance does not guarantee future results. More recent returns may be less or more than those shown. Investment return and principal value will fluctuate, and you may have a gain or a loss when you sell your shares. Performance information does not reflect any deduction for taxes a shareholder may owe on fund distributions or on the redemption of fund shares. For the most recent month-end performance, please visit the Individual Investors section at putnam.com or call Putnam at 1-800-225-1581. Class R and class Y shares are not available to all investors. See the Terms and Definitions section in this report for definitions of the share classes offered by your fund.
Fund performance Total return for periods ended 1/31/13
| | | | | | | | | | |
| | Class A | Class B | Class C | Class M | Class R | Class Y |
| (inception dates) | (10/2/95) | (6/15/98) | (2/1/99) | (6/15/98) | (1/21/03) | (4/4/00) |
|
| | Before | After | | | | | Before | After | Net | Net |
| | sales | sales | Before | After | Before | After | sales | sales | asset | asset |
| | charge | charge | CDSC | CDSC | CDSC | CDSC | charge | charge | value | value |
|
| Annual average | | | | | | | | | | |
| (life of fund) | 7.21% | 6.84% | 6.37% | 6.37% | 6.40% | 6.40% | 6.67% | 6.45% | 6.94% | 7.41% |
|
| 10 years | 90.60 | 79.65 | 76.58 | 76.58 | 76.59 | 76.59 | 81.18 | 74.91 | 85.88 | 95.21 |
| Annual average | 6.66 | 6.03 | 5.85 | 5.85 | 5.85 | 5.85 | 6.12 | 5.75 | 6.40 | 6.92 |
|
| 5 years | 25.31 | 18.08 | 20.55 | 18.55 | 20.63 | 20.63 | 22.12 | 17.81 | 23.71 | 26.80 |
| Annual average | 4.62 | 3.38 | 3.81 | 3.46 | 3.82 | 3.82 | 4.08 | 3.33 | 4.35 | 4.86 |
|
| 3 years | 46.65 | 38.21 | 43.26 | 40.26 | 43.36 | 43.36 | 44.33 | 39.30 | 45.45 | 47.68 |
| Annual average | 13.61 | 11.39 | 12.73 | 11.94 | 12.76 | 12.76 | 13.01 | 11.68 | 13.30 | 13.88 |
|
| 1 year | 17.11 | 10.37 | 16.17 | 11.17 | 16.14 | 15.14 | 16.45 | 12.41 | 16.74 | 17.31 |
|
| 6 months | 11.38 | 4.96 | 10.95 | 5.95 | 10.93 | 9.93 | 11.05 | 7.17 | 11.21 | 11.53 |
|
Current performance may be lower or higher than the quoted past performance, which cannot guarantee future results. After-sales-charge returns for class A and M shares reflect the deduction of the maximum 5.75% and 3.50% sales charge, respectively, levied at the time of purchase. Class B share returns after contingent deferred sales charge (CDSC) reflect the applicable CDSC, which is 5% in the first year, declining over time to 1% in the sixth year, and is eliminated thereafter. Class C share returns after CDSC reflect a 1% CDSC for the first year that is eliminated thereafter. Class R and Y shares have no initial sales charge or CDSC. Performance for class B, C, M, R, and Y shares before their inception is derived from the historical performance of class A shares, adjusted for the applicable sales charge (or CDSC) and the higher operating expenses for such shares, except for class Y shares, for which 12b-1 fees are not applicable.
Recent performance may have benefited from one or more legal settlements.
For a portion of the periods, the fund had expense limitations, without which returns would have been lower.
Class B share performance does not reflect conversion to class A shares.
A short-term trading fee of 1.00% may have applied to redemptions (including exchanges into another fund) of shares purchased before January 2, 2013, and held for 7 days or less. No short-term trading fee applies to shares purchased on or after January 2, 2013.
Comparative index returns For periods ended 1/31/13
| | |
| | | Lipper Large-Cap Core |
| | S&P 500 Index | Funds category average* |
|
| Annual average (life of fund) | 7.57% | 6.99% |
|
| 10 years | 114.48 | 104.62 |
| Annual average | 7.93 | 7.35 |
|
| 5 years | 21.51 | 16.23 |
| Annual average | 3.97 | 2.99 |
|
| 3 years | 48.71 | 41.15 |
| Annual average | 14.14 | 12.14 |
|
| 1 year | 16.78 | 15.62 |
|
| 6 months | 9.91 | 10.76 |
|
Index and Lipper results should be compared with fund performance before sales charge, before CDSC, or at net asset value.
* Over the 6-month, 1-year, 3-year, 5-year, 10-year, and life-of-fund periods ended 1/31/13, there were 957, 937, 860, 755, 496, and 151 funds, respectively, in this Lipper category.
Fund price and distribution information For the six-month period ended 1/31/13
| | | | | | |
| Distributions | Class A | Class B | Class C | Class M | Class R | Class Y |
|
| Number | 1 | 1 | 1 | 1 | 1 | 1 |
|
| Income | $0.189 | $0.056 | $0.067 | $0.103 | $0.154 | $0.233 |
|
| Capital gains | — | — | — | — | — | — |
|
| Total | $0.189 | $0.056 | $0.067 | $0.103 | $0.154 | $0.233 |
|
| | Before | After | Net | Net | Before | After | Net | Net |
| | sales | sales | asset | asset | sales | sales | asset | asset |
| Share value | charge | charge | value | value | charge | charge | value | value |
|
| 7/31/12 | $16.35 | $17.35 | $15.34 | $15.38 | $15.74 | $16.31 | $16.26 | $16.45 |
|
| 1/31/13 | 18.01 | 19.11 | 16.96 | 16.99 | 17.37 | 18.00 | 17.92 | 18.10 |
|
The classification of distributions, if any, is an estimate. Before-sales-charge share value and current dividend rate for class A and M shares, if applicable, do not take into account any sales charge levied at the time of purchase. After-sales-charge share value, current dividend rate, and current 30-day SEC yield, if applicable, are calculated assuming that the maximum sales charge (5.75% for class A shares and 3.50% for class M shares) was levied at the time of purchase. Final distribution information will appear on your year-end tax forms.
Fund performance as of most recent calendar quarter
Total return for periods ended 12/31/12
| | | | | | | | | | |
| | Class A | Class B | Class C | Class M | Class R | Class Y |
| (inception dates) | (10/2/95) | (6/15/98) | (2/1/99) | (6/15/98) | (1/21/03) | (4/4/00) |
|
| | Before | After | | | | | Before | After | Net | Net |
| | sales | sales | Before | After | Before | After | sales | sales | asset | asset |
| | charge | charge | CDSC | CDSC | CDSC | CDSC | charge | charge | value | value |
|
| Annual average | | | | | | | | | | |
| (life of fund) | 6.95% | 6.59% | 6.12% | 6.12% | 6.15% | 6.15% | 6.42% | 6.20% | 6.69% | 7.16% |
|
| 10 years | 76.12 | 65.99 | 63.25 | 63.25 | 63.31 | 63.31 | 67.48 | 61.56 | 71.91 | 80.62 |
| Annual average | 5.82 | 5.20 | 5.02 | 5.02 | 5.03 | 5.03 | 5.29 | 4.91 | 5.57 | 6.09 |
|
| 5 years | 11.52 | 5.13 | 7.32 | 5.32 | 7.37 | 7.37 | 8.81 | 5.03 | 10.16 | 12.92 |
| Annual average | 2.20 | 1.01 | 1.42 | 1.04 | 1.43 | 1.43 | 1.70 | 0.99 | 1.95 | 2.46 |
|
| 3 years | 34.74 | 26.97 | 31.63 | 28.63 | 31.65 | 31.65 | 32.70 | 28.05 | 33.75 | 35.74 |
| Annual average | 10.45 | 8.28 | 9.59 | 8.75 | 9.60 | 9.60 | 9.89 | 8.59 | 10.18 | 10.72 |
|
| 1 year | 17.60 | 10.85 | 16.70 | 11.70 | 16.66 | 15.66 | 17.06 | 12.94 | 17.28 | 17.87 |
|
| 6 months | 7.76 | 1.59 | 7.38 | 2.38 | 7.36 | 6.36 | 7.56 | 3.82 | 7.70 | 7.92 |
|
See the discussion following the Fund performance table on page 10 for information about the calculation of fund performance.
Your fund’s expenses
As a mutual fund investor, you pay ongoing expenses, such as management fees, distribution fees (12b-1 fees), and other expenses. Using the following information, you can estimate how these expenses affect your investment and compare them with the expenses of other funds. You may also pay one-time transaction expenses, including sales charges (loads) and redemption fees, which are not shown in this section and would have resulted in higher total expenses. For more information, see your fund’s prospectus or talk to your financial representative.
Expense ratios
| | | | | | |
| | Class A | Class B | Class C | Class M | Class R | Class Y |
|
| Total annual operating expenses | | | | | | |
| for the fiscal year ended 7/31/12 | 1.25% | 2.00% | 2.00% | 1.75% | 1.50% | 1.00% |
|
| Annualized expense ratio for the | | | | | | |
| six-month period ended 1/31/13 | 1.21% | 1.96% | 1.96% | 1.71% | 1.46% | 0.96% |
|
Fiscal-year expense information in this table is taken from the most recent prospectus, is subject to change, and may differ from that shown for the annualized expense ratio and in the financial highlights of this report. Expenses are shown as a percentage of average net assets.
Expenses per $1,000
The following table shows the expenses you would have paid on a $1,000 investment in the fund from August 1, 2012, to January 31, 2013. It also shows how much a $1,000 investment would be worth at the close of the period, assuming actual returns and expenses.
| | | | | | |
| | Class A | Class B | Class C | Class M | Class R | Class Y |
|
| Expenses paid per $1,000*† | $6.45 | $10.42 | $10.42 | $9.10 | $7.77 | $5.12 |
|
| Ending value (after expenses) | $1,113.80 | $1,109.50 | $1,109.30 | $1,110.50 | $1,112.10 | $1,115.30 |
|
* Expenses for each share class are calculated using the fund’s annualized expense ratio for each class, which represents the ongoing expenses as a percentage of average net assets for the six months ended 1/31/13. The expense ratio may differ for each share class.
† Expenses are calculated by multiplying the expense ratio by the average account value for the period; then multiplying the result by the number of days in the period; and then dividing that result by the number of days in the year.
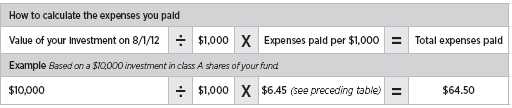
Estimate the expenses you paid
To estimate the ongoing expenses you paid for the six months ended January 31, 2013, use the following calculation method. To find the value of your investment on August 1, 2012, call Putnam at 1-800-225-1581.
Compare expenses using the SEC’s method
The Securities and Exchange Commission (SEC) has established guidelines to help investors assess fund expenses. Per these guidelines, the following table shows your fund’s expenses based on a $1,000 investment, assuming a hypothetical 5% annualized return. You can use this information to compare the ongoing expenses (but not transaction expenses or total costs) of investing in the fund with those of other funds. All mutual fund shareholder reports will provide this information to help you make this comparison. Please note that you cannot use this information to estimate your actual ending account balance and expenses paid during the period.
| | | | | | |
| | Class A | Class B | Class C | Class M | Class R | Class Y |
|
| Expenses paid per $1,000*† | $6.16 | $9.96 | $9.96 | $8.69 | $7.43 | $4.89 |
|
| Ending value (after expenses) | $1,019.11 | $1,015.32 | $1,015.32 | $1,016.59 | $1,017.85 | $1,020.37 |
|
* Expenses for each share class are calculated using the fund’s annualized expense ratio for each class, which represents the ongoing expenses as a percentage of average net assets for the six months ended 1/31/13. The expense ratio may differ for each share class.
† Expenses are calculated by multiplying the expense ratio by the average account value for the period; then multiplying the result by the number of days in the period; and then dividing that result by the number of days in the year.
Terms and definitions
Important terms
Total return shows how the value of the fund’s shares changed over time, assuming you held the shares through the entire period and reinvested all distributions in the fund.
Before sales charge, or net asset value, is the price, or value, of one share of a mutual fund, without a sales charge. Before-sales-charge figures fluctuate with market conditions, and are calculated by dividing the net assets of each class of shares by the number of outstanding shares in the class.
After sales charge is the price of a mutual fund share plus the maximum sales charge levied at the time of purchase. After-sales-charge performance figures shown here assume the 5.75% maximum sales charge for class A shares and 3.50% for class M shares.
Contingent deferred sales charge (CDSC) is generally a charge applied at the time of the redemption of class B or C shares and assumes redemption at the end of the period. Your fund’s class B CDSC declines over time from a 5% maximum during the first year to 1% during the sixth year. After the sixth year, the CDSC no longer applies. The CDSC for class C shares is 1% for one year after purchase.
Share classes
Class A shares are generally subject to an initial sales charge and no CDSC (except on certain redemptions of shares bought without an initial sales charge).
Class B shares are not subject to an initial sales charge. They may be subject to a CDSC.
Class C shares are not subject to an initial sales charge and are subject to a CDSC only if the shares are redeemed during the first year.
Class M shares have a lower initial sales charge and a higher 12b-1 fee than class A shares and no CDSC (except on certain redemptions of shares bought without an initial sales charge).
Class R shares are not subject to an initial sales charge or CDSC and are available only to certain defined contribution plans.
Class Y shares are not subject to an initial sales charge or CDSC, and carry no 12b-1 fee. They are generally only available to corporate and institutional clients and clients in other approved programs.
Comparative indexes
Barclays U.S. Aggregate Bond Index is an unmanaged index of U.S. investment-grade fixed-income securities.
BofA (Bank of America) Merrill Lynch U.S. 3-Month Treasury Bill Index is an unmanaged index that seeks to measure the performance of U.S. Treasury bills available in the marketplace.
S&P 500 Index is an unmanaged index of common stock performance.
Indexes assume reinvestment of all distributions and do not account for fees. Securities and performance of a fund and an index will differ. You cannot invest directly in an index.
Lipper is a third-party industry-ranking entity that ranks mutual funds. Its rankings do not reflect sales charges. Lipper rankings are based on total return at net asset value relative to other funds that have similar current investment styles or objectives as determined by Lipper. Lipper may change a fund’s category assignment at its discretion. Lipper category averages reflect performance trends for funds within a category.
Other information for shareholders
Important notice regarding delivery of shareholder documents
In accordance with Securities and Exchange Commission (SEC) regulations, Putnam sends a single copy of annual and semiannual shareholder reports, prospectuses, and proxy statements to Putnam shareholders who share the same address, unless a shareholder requests otherwise. If you prefer to receive your own copy of these documents, please call Putnam at 1-800-225-1581, and Putnam will begin sending individual copies within 30 days.
Proxy voting
Putnam is committed to managing our mutual funds in the best interests of our shareholders. The Putnam funds’ proxy voting guidelines and procedures, as well as information regarding how your fund voted proxies relating to portfolio securities during the 12-month period ended June 30, 2012, are available in the Individual Investors section of putnam.com, and on the SEC’s website, www.sec.gov. If you have questions about finding forms on the SEC’s website, you may call the SEC at 1-800-SEC-0330. You may also obtain the Putnam funds’ proxy voting guidelines and procedures at no charge by calling Putnam’s Shareholder Services at 1-800-225-1581.
Fund portfolio holdings
The fund will file a complete schedule of its portfolio holdings with the SEC for the first and third quarters of each fiscal year on Form N-Q. Shareholders may obtain the fund’s Forms N-Q on the SEC’s website at www.sec.gov. In addition, the fund’s Forms N-Q may be reviewed and copied at the SEC’s Public Reference Room in Washington, D.C. You may call the SEC at 1-800-SEC-0330 for information about the SEC’s website or the operation of the Public Reference Room.
Trustee and employee fund ownership
Putnam employees and members of the Board of Trustees place their faith, confidence, and, most importantly, investment dollars in Putnam mutual funds. As of January 31, 2013, Putnam employees had approximately $364,000,000 and the Trustees had approximately $87,000,000 invested in Putnam mutual funds. These amounts include investments by the Trustees’ and employees’ immediate family members as well as investments through retirement and deferred compensation plans.
Financial statements
A guide to financial statements
These sections of the report, as well as the accompanying Notes, constitute the fund’s financial statements.
The fund’s portfolio lists all the fund’s investments and their values as of the last day of the reporting period. Holdings are organized by asset type and industry sector, country, or state to show areas of concentration and diversification.
Statement of assets and liabilities shows how the fund’s net assets and share price are determined. All investment and non-investment assets are added together. Any unpaid expenses and other liabilities are subtracted from this total. The result is divided by the number of shares to determine the net asset value per share, which is calculated separately for each class of shares. (For funds with preferred shares, the amount subtracted from total assets includes the liquidation preference of preferred shares.)
Statement of operations shows the fund’s net investment gain or loss. This is done by first adding up all the fund’s earnings — from dividends and interest income — and subtracting its operating expenses to determine net investment income (or loss). Then, any net gain or loss the fund realized on the sales of its holdings — as well as any unrealized gains or losses over the period — is added to or subtracted from the net investment result to determine the fund’s net gain or loss for the fiscal period.
Statement of changes in net assets shows how the fund’s net assets were affected by the fund’s net investment gain or loss, by distributions to shareholders, and by changes in the number of the fund’s shares. It lists distributions and their sources (net investment income or realized capital gains) over the current reporting period and the most recent fiscal year-end. The distributions listed here may not match the sources listed in the Statement of operations because the distributions are determined on a tax basis and may be paid in a different period from the one in which they were earned. Dividend sources are estimated at the time of declaration. Actual results may vary. Any non-taxable return of capital cannot be determined until final tax calculations are completed after the end of the fund’s fiscal year.
Financial highlights provide an overview of the fund’s investment results, per-share distributions, expense ratios, net investment income ratios, and portfolio turnover in one summary table, reflecting the five most recent reporting periods. In a semiannual report, the highlights table also includes the current reporting period.
The fund’s portfolio 1/31/13 (Unaudited)
| | |
| COMMON STOCKS (97.9%)* | Shares | Value |
|
| Aerospace and defense (5.2%) | | |
| Boeing Co. (The) | 10,024 | $740,473 |
|
| Embraer SA ADR (Brazil) | 25,569 | 843,010 |
|
| General Dynamics Corp. | 22,560 | 1,495,728 |
|
| Honeywell International, Inc. | 41,766 | 2,850,112 |
|
| L-3 Communications Holdings, Inc. | 20,400 | 1,548,768 |
|
| Northrop Grumman Corp. S | 17,497 | 1,138,005 |
|
| Precision Castparts Corp. | 2,480 | 454,832 |
|
| Raytheon Co. | 6,283 | 330,988 |
|
| Rockwell Collins, Inc. | 4 | 236 |
|
| United Technologies Corp. S | 23,933 | 2,095,813 |
|
| | | 11,497,965 |
| Air freight and logistics (0.6%) | | |
| FedEx Corp. S | 4,839 | 490,917 |
|
| United Parcel Service, Inc. Class B | 10,211 | 809,630 |
|
| | | 1,300,547 |
| Auto components (1.4%) | | |
| American Axle & Manufacturing Holdings, Inc. † S | 13,171 | 153,837 |
|
| BorgWarner, Inc. † | 1,220 | 90,500 |
|
| Johnson Controls, Inc. | 92,413 | 2,873,120 |
|
| | | 3,117,457 |
| Automobiles (0.5%) | | |
| Ford Motor Co. | 70,939 | 918,660 |
|
| General Motors Co. † | 1,713 | 48,118 |
|
| Tesla Motors, Inc. † S | 5,850 | 219,434 |
|
| | | 1,186,212 |
| Beverages (1.2%) | | |
| Beam, Inc. | 14,899 | 913,905 |
|
| Coca-Cola Enterprises, Inc. | 52,701 | 1,837,684 |
|
| | | 2,751,589 |
| Biotechnology (1.5%) | | |
| Amgen, Inc. | 9,407 | 803,922 |
|
| Celgene Corp. † S | 18,557 | 1,836,401 |
|
| Gilead Sciences, Inc. † | 19,888 | 784,582 |
|
| | | 3,424,905 |
| Building products (0.6%) | | |
| Fortune Brands Home & Security, Inc. † | 33,219 | 1,087,590 |
|
| Owens Corning, Inc. † | 8,195 | 341,486 |
|
| | | 1,429,076 |
| Capital markets (1.9%) | | |
| Ameriprise Financial, Inc. | 4,833 | 320,525 |
|
| Apollo Global Management, LLC Class A | 2,990 | 66,587 |
|
| BlackRock, Inc. | 884 | 208,872 |
|
| Blackstone Group LP (The) | 7,625 | 141,063 |
|
| Charles Schwab Corp. (The) S | 32,179 | 531,919 |
|
| Franklin Resources, Inc. | 2,706 | 370,397 |
|
| Goldman Sachs Group, Inc. (The) | 2,698 | 398,926 |
|
| Invesco, Ltd. | 11,183 | 304,737 |
|
| KKR & Co. LP | 9,834 | 165,998 |
|
| Morgan Stanley | 43,312 | 989,679 |
|
| State Street Corp. | 11,763 | 654,611 |
|
| | | 4,153,314 |
| | |
| COMMON STOCKS (97.9%)* cont. | Shares | Value |
|
| Chemicals (2.4%) | | |
| Agrium, Inc. (Canada) | 3,200 | $363,168 |
|
| Albemarle Corp. S | 3,180 | 194,966 |
|
| Celanese Corp. Ser. A | 5,070 | 237,682 |
|
| Dow Chemical Co. (The) | 26,200 | 843,640 |
|
| Eastman Chemical Co. | 7,994 | 568,773 |
|
| FMC Corp. | 3,820 | 234,815 |
|
| Intrepid Potash, Inc. S | 7,600 | 177,080 |
|
| LyondellBasell Industries NV Class A | 12,750 | 808,605 |
|
| Monsanto Co. | 12,650 | 1,282,078 |
|
| Mosaic Co. (The) | 5,551 | 339,999 |
|
| Tronox, Ltd. Class A S | 11,187 | 211,994 |
|
| | | 5,262,800 |
| Commercial banks (2.2%) | | |
| Comerica, Inc. | 2,072 | 71,194 |
|
| Fifth Third Bancorp | 20,251 | 329,889 |
|
| PNC Financial Services Group, Inc. | 3,489 | 215,620 |
|
| Regions Financial Corp. | 37,151 | 289,035 |
|
| U.S. Bancorp | 48,625 | 1,609,488 |
|
| Wells Fargo & Co. | 69,305 | 2,413,893 |
|
| | | 4,929,119 |
| Commercial services and supplies (0.9%) | | |
| ADT Corp. (The) | 8,955 | 425,363 |
|
| Iron Mountain, Inc. | 1,774 | 60,689 |
|
| Republic Services, Inc. | 13,027 | 415,431 |
|
| Tyco International, Ltd. | 39,845 | 1,204,514 |
|
| | | 2,105,997 |
| Communications equipment (1.8%) | | |
| Cisco Systems, Inc. | 71,103 | 1,462,589 |
|
| F5 Networks, Inc. † | 6,047 | 634,209 |
|
| Qualcomm, Inc. | 30,270 | 1,998,728 |
|
| | | 4,095,526 |
| Computers and peripherals (5.4%) | | |
| Apple, Inc. | 15,798 | 7,192,987 |
|
| EMC Corp. † | 98,194 | 2,416,554 |
|
| Hewlett-Packard Co. S | 38,703 | 638,987 |
|
| NetApp, Inc. † S | 9,209 | 331,524 |
|
| SanDisk Corp. † S | 26,738 | 1,336,633 |
|
| | | 11,916,685 |
| Construction and engineering (0.1%) | | |
| KBR, Inc. | 6,369 | 198,840 |
|
| | | 198,840 |
| Consumer finance (0.5%) | | |
| American Express Co. | 5,466 | 321,455 |
|
| Capital One Financial Corp. | 4,734 | 266,619 |
|
| Discover Financial Services | 12,992 | 498,763 |
|
| SLM Corp. | 1,235 | 20,859 |
|
| | | 1,107,696 |
| Containers and packaging (0.1%) | | |
| Sealed Air Corp. | 6,880 | 128,794 |
|
| | | 128,794 |
| | |
| COMMON STOCKS (97.9%)* cont. | Shares | Value |
|
| Diversified financial services (5.0%) | | |
| Bank of America Corp. | 212,973 | $2,410,854 |
|
| Citigroup, Inc. | 74,517 | 3,141,637 |
|
| CME Group, Inc. S | 7,415 | 428,884 |
|
| IntercontinentalExchange, Inc. † | 664 | 92,130 |
|
| JPMorgan Chase & Co. | 88,820 | 4,178,981 |
|
| Moody’s Corp. | 11,363 | 622,920 |
|
| Nasdaq OMX Group, Inc. (The) | 5,504 | 155,873 |
|
| | | 11,031,279 |
| Diversified telecommunication services (2.2%) | | |
| AT&T, Inc. | 64,085 | 2,229,517 |
|
| Verizon Communications, Inc. | 58,548 | 2,553,278 |
|
| | | 4,782,795 |
| Electric utilities (2.1%) | | |
| American Electric Power Co., Inc. S | 15,904 | 720,292 |
|
| Duke Energy Corp. | 8,592 | 590,614 |
|
| Edison International | 13,679 | 659,191 |
|
| FirstEnergy Corp. | 21,281 | 861,668 |
|
| NextEra Energy, Inc. S | 15,661 | 1,128,375 |
|
| PPL Corp. | 18,371 | 556,458 |
|
| Southern Co. (The) | 2,472 | 109,337 |
|
| | | 4,625,935 |
| Electrical equipment (0.2%) | | |
| Eaton Corp PLC | 9,313 | 530,375 |
|
| | | 530,375 |
| Electronic equipment, instruments, and components (0.1%) | | |
| TE Connectivity, Ltd. | 5,094 | 198,055 |
|
| | | 198,055 |
| Energy equipment and services (2.8%) | | |
| Cameron International Corp. † | 11,400 | 721,734 |
|
| Halliburton Co. | 37,100 | 1,509,228 |
|
| McDermott International, Inc. † S | 15,120 | 184,010 |
|
| Nabors Industries, Ltd. † | 35,700 | 595,119 |
|
| Oil States International, Inc. † | 3,600 | 279,288 |
|
| Petrofac, Ltd. (United Kingdom) | 25,597 | 664,976 |
|
| Schlumberger, Ltd. | 27,500 | 2,146,375 |
|
| | | 6,100,730 |
| Food and staples retail (1.5%) | | |
| Costco Wholesale Corp. | 4,623 | 473,118 |
|
| CVS Caremark Corp. | 9,550 | 488,960 |
|
| Kroger Co. (The) | 23,413 | 648,540 |
|
| Wal-Mart Stores, Inc. S | 20,304 | 1,420,265 |
|
| Walgreen Co. S | 8,497 | 339,540 |
|
| | | 3,370,423 |
| Food products (1.8%) | | |
| Archer Daniels-Midland Co. S | 12,900 | 368,037 |
|
| Dean Foods Co. † | 3,039 | 55,644 |
|
| General Mills, Inc. | 9,951 | 417,345 |
|
| H.J. Heinz Co. | 605 | 36,681 |
|
| Hershey Co. (The) S | 5,252 | 417,271 |
|
| Hillshire Brands Co. | 7,167 | 222,034 |
|
| Hormel Foods Corp. | 2,298 | 79,534 |
|
| | |
| COMMON STOCKS (97.9%)* cont. | Shares | Value |
|
| Food products cont. | | |
| JM Smucker Co. (The) | 1,898 | $168,220 |
|
| Kellogg Co. | 1,853 | 108,401 |
|
| Kraft Foods Group, Inc. | 10,868 | 502,319 |
|
| McCormick & Co., Inc. Class A (Non Voting Shares) | 1 | 62 |
|
| Mead Johnson Nutrition Co. S | 6,161 | 468,236 |
|
| Mondelez International, Inc. Class A | 33,138 | 920,905 |
|
| Tyson Foods, Inc. Class A | 4,831 | 106,862 |
|
| WhiteWaves Foods Co. Class A † | 2,946 | 47,696 |
|
| | | 3,919,247 |
| Health-care equipment and supplies (2.0%) | | |
| Abbott Laboratories | 20,163 | 683,122 |
|
| Baxter International, Inc. | 13,166 | 893,181 |
|
| Boston Scientific Corp. † | 28,626 | 213,836 |
|
| CareFusion Corp. † | 11,076 | 343,799 |
|
| Covidien PLC | 12,446 | 775,884 |
|
| Intuitive Surgical, Inc. † | 340 | 195,289 |
|
| Medtronic, Inc. | 6,047 | 281,790 |
|
| St. Jude Medical, Inc. S | 12,744 | 518,681 |
|
| Zimmer Holdings, Inc. S | 6,249 | 466,175 |
|
| | | 4,371,757 |
| Health-care providers and services (2.3%) | | |
| Aetna, Inc. S | 12,425 | 599,258 |
|
| Air Methods Corp. S | 10,663 | 466,186 |
|
| Catamaran Corp. † | 11,664 | 605,245 |
|
| CIGNA Corp. | 2,661 | 155,243 |
|
| Express Scripts Holding Co. † | 17,417 | 930,416 |
|
| Humana, Inc. | 10,492 | 780,185 |
|
| Tenet Healthcare Corp. † | 9,350 | 363,061 |
|
| UnitedHealth Group, Inc. | 22,948 | 1,266,959 |
|
| | | 5,166,553 |
| Hotels, restaurants, and leisure (2.0%) | | |
| Las Vegas Sands Corp. | 5,847 | 323,047 |
|
| McDonald’s Corp. | 21,227 | 2,022,721 |
|
| Norwegian Cruise Line Holdings, Ltd. † | 8,170 | 215,443 |
|
| Penn National Gaming, Inc. † S | 9,057 | 440,714 |
|
| Starbucks Corp. | 12,527 | 703,015 |
|
| Wyndham Worldwide Corp. | 14,096 | 786,416 |
|
| | | 4,491,356 |
| Household durables (0.4%) | | |
| M.D.C. Holdings, Inc. | 6,186 | 243,234 |
|
| M/I Homes, Inc. † S | 8,058 | 219,500 |
|
| PulteGroup, Inc. † S | 15,883 | 329,413 |
|
| | | 792,147 |
| Household products (1.6%) | | |
| Colgate-Palmolive Co. | 4,034 | 433,131 |
|
| Procter & Gamble Co. (The) | 42,644 | 3,205,123 |
|
| | | 3,638,254 |
| Independent power producers and energy traders (0.6%) | | |
| Calpine Corp. † | 37,474 | 739,362 |
|
| NRG Energy, Inc. S | 22,904 | 549,696 |
|
| | | 1,289,058 |
| | |
| COMMON STOCKS (97.9%)* cont. | Shares | Value |
|
| Insurance (4.0%) | | |
| ACE, Ltd. S | 6,970 | $594,750 |
|
| Aflac, Inc. S | 14,111 | 748,730 |
|
| Allstate Corp. (The) | 11,910 | 522,849 |
|
| American International Group, Inc. † | 24,882 | 941,286 |
|
| Aon PLC S | 6,491 | 374,790 |
|
| Assured Guaranty, Ltd. | 23,231 | 421,178 |
|
| Berkshire Hathaway, Inc. Class B † | 15,996 | 1,550,492 |
|
| Chubb Corp. (The) | 6,154 | 494,228 |
|
| Hartford Financial Services Group, Inc. (The) S | 18,993 | 471,026 |
|
| Marsh & McLennan Cos., Inc. S | 12,290 | 436,049 |
|
| MetLife, Inc. | 23,819 | 889,401 |
|
| Prudential Financial, Inc. | 6,366 | 368,464 |
|
| Travelers Cos., Inc. (The) | 8,040 | 630,818 |
|
| XL Group PLC S | 14,448 | 400,499 |
|
| | | 8,844,560 |
| Internet and catalog retail (1.4%) | | |
| Amazon.com, Inc. † | 7,429 | 1,972,400 |
|
| HomeAway, Inc. † S | 10,856 | 260,218 |
|
| Priceline.com, Inc. † | 1,351 | 926,070 |
|
| | | 3,158,688 |
| Internet software and services (2.6%) | | |
| eBay, Inc. † | 28,075 | 1,570,235 |
|
| Facebook, Inc. Class A † | 18,456 | 571,582 |
|
| Google, Inc. Class A † | 4,851 | 3,665,852 |
|
| | | 5,807,669 |
| IT Services (2.9%) | | |
| Alliance Data Systems Corp. † | 489 | 77,066 |
|
| Cognizant Technology Solutions Corp. † | 8,848 | 691,737 |
|
| Computer Sciences Corp. | 15,137 | 632,727 |
|
| Fidelity National Information Services, Inc. | 20,599 | 764,429 |
|
| IBM Corp. | 9,545 | 1,938,303 |
|
| Visa, Inc. Class A | 14,440 | 2,280,220 |
|
| | | 6,384,482 |
| Leisure equipment and products (0.4%) | | |
| Hasbro, Inc. S | 21,289 | 795,570 |
|
| | | 795,570 |
| Life sciences tools and services (0.5%) | | |
| Agilent Technologies, Inc. S | 8,062 | 361,016 |
|
| Thermo Fisher Scientific, Inc. | 10,081 | 727,243 |
|
| | | 1,088,259 |
| Machinery (0.8%) | | |
| Joy Global, Inc. | 7,863 | 496,706 |
|
| Navistar International Corp. † S | 12,860 | 335,517 |
|
| Pall Corp. | 1,394 | 95,210 |
|
| Parker Hannifin Corp. S | 2,306 | 214,389 |
|
| Stanley Black & Decker, Inc. | 6,485 | 498,243 |
|
| Xylem, Inc. | 2,797 | 78,120 |
|
| | | 1,718,185 |
| Media (3.8%) | | |
| Comcast Corp. Class A | 64,617 | 2,460,615 |
|
| DIRECTV † | 4,215 | 215,555 |
|
| | |
| COMMON STOCKS (97.9%)* cont. | Shares | Value |
|
| Media cont. | | |
| DISH Network Corp. Class A | 38,449 | $1,432,994 |
|
| News Corp. Class A | 43,826 | 1,215,733 |
|
| Time Warner, Inc. | 23,324 | 1,178,328 |
|
| Viacom, Inc. Class B | 14,368 | 867,109 |
|
| Walt Disney Co. (The) | 19,821 | 1,067,955 |
|
| | | 8,438,289 |
| Metals and mining (0.7%) | | |
| Barrick Gold Corp. (Canada) | 4,361 | 139,203 |
|
| Freeport-McMoRan Copper & Gold, Inc. Class B (Indonesia) | 19,225 | 677,681 |
|
| Kinross Gold Corp. (Canada) | 12,462 | 102,562 |
|
| Newmont Mining Corp. | 1,433 | 61,562 |
|
| Nucor Corp. S | 7,007 | 322,392 |
|
| Pretium Resources, Inc. (Canada) † | 3,701 | 41,300 |
|
| Walter Energy, Inc. S | 2,815 | 105,703 |
|
| Xstrata PLC (United Kingdom) | 3,672 | 68,808 |
|
| | | 1,519,211 |
| Multi-utilities (0.3%) | | |
| Dominion Resources, Inc. | 4,139 | 223,961 |
|
| PG&E Corp. | 5,190 | 221,302 |
|
| Sempra Energy | 3,172 | 238,059 |
|
| | | 683,322 |
| Multiline retail (1.4%) | | |
| Dollar General Corp. † | 15,308 | 707,536 |
|
| Macy’s, Inc. | 19,975 | 789,212 |
|
| Nordstrom, Inc. S | 13,553 | 748,532 |
|
| Target Corp. | 12,615 | 762,072 |
|
| | | 3,007,352 |
| Oil, gas, and consumable fuels (8.3%) | | |
| Anadarko Petroleum Corp. | 21,642 | 1,731,793 |
|
| CONSOL Energy, Inc. | 4,736 | 148,426 |
|
| EXCO Resources, Inc. S | 17,041 | 109,233 |
|
| Exxon Mobil Corp. | 81,558 | 7,337,773 |
|
| Marathon Oil Corp. | 50,385 | 1,693,440 |
|
| Noble Energy, Inc. | 11,988 | 1,292,187 |
|
| Occidental Petroleum Corp. | 15,585 | 1,375,688 |
|
| PBF Energy, Inc. † S | 4,800 | 160,320 |
|
| Royal Dutch Shell PLC ADR (United Kingdom) | 17,324 | 1,221,688 |
|
| Southwestern Energy Co. † S | 40,465 | 1,387,950 |
|
| Spectra Energy Corp. | 20,800 | 577,824 |
|
| Suncor Energy, Inc. (Canada) | 39,782 | 1,353,384 |
|
| | | 18,389,706 |
| Paper and forest products (0.5%) | | |
| International Paper Co. | 15,120 | 626,270 |
|
| MeadWestvaco Corp. | 12,069 | 378,363 |
|
| | | 1,004,633 |
| Pharmaceuticals (6.4%) | | |
| AbbVie, Inc. † | 41,937 | 1,538,669 |
|
| Actavis, Inc. † | 10,003 | 864,159 |
|
| Auxilium Pharmaceuticals, Inc. † | 31,535 | 580,244 |
|
| Bristol-Myers Squibb Co. | 11,953 | 431,981 |
|
| Eli Lilly & Co. | 32,911 | 1,766,992 |
|
| | |
| COMMON STOCKS (97.9%)* cont. | Shares | Value |
|
| Pharmaceuticals cont. | | |
| Johnson & Johnson S | 48,625 | $3,594,360 |
|
| Merck & Co., Inc. | 53,550 | 2,316,038 |
|
| Pfizer, Inc. | 110,057 | 3,002,355 |
|
| Zoetis, Inc. † | 3,380 | 87,880 |
|
| | | 14,182,678 |
| Professional services (0.1%) | | |
| Verisk Analytics, Inc. Class A † | 5,690 | 313,860 |
|
| | | 313,860 |
| Real estate investment trusts (REITs) (2.3%) | | |
| American Tower Corp. Class A R | 16,137 | 1,228,833 |
|
| Apartment Investment & Management Co. Class A R | 2,371 | 64,681 |
|
| AvalonBay Communities, Inc. R | 1,825 | 236,867 |
|
| Boston Properties, Inc. R | 2,461 | 259,094 |
|
| Equity Residential Trust R | 5,240 | 290,244 |
|
| HCP, Inc. R | 7,375 | 342,126 |
|
| Health Care REIT, Inc. R | 4,170 | 262,043 |
|
| Host Hotels & Resorts, Inc. R | 11,798 | 198,088 |
|
| Kimco Realty Corp. R S | 6,644 | 137,996 |
|
| Plum Creek Timber Co., Inc. R | 2,650 | 127,677 |
|
| Prologis, Inc. R | 7,548 | 301,165 |
|
| Public Storage R | 2,355 | 362,505 |
|
| Simon Property Group, Inc. R | 4,959 | 794,333 |
|
| Ventas, Inc. R | 4,829 | 320,114 |
|
| Vornado Realty Trust R | 2,765 | 233,532 |
|
| | | 5,159,298 |
| Real estate management and development (—%) | | |
| CBRE Group, Inc. Class A † | 4,938 | 106,562 |
|
| | | 106,562 |
| Semiconductors and semiconductor equipment (2.1%) | | |
| ASML Holding NV ADR (Netherlands) S | 3,829 | 287,520 |
|
| Broadcom Corp. Class A | 2,145 | 69,605 |
|
| First Solar, Inc. † S | 5,479 | 154,398 |
|
| Intel Corp. S | 56,202 | 1,182,490 |
|
| Lam Research Corp. † | 13,089 | 538,481 |
|
| Texas Instruments, Inc. S | 43,676 | 1,444,802 |
|
| Xilinx, Inc. | 24,683 | 900,683 |
|
| | | 4,577,979 |
| Software (3.0%) | | |
| Microsoft Corp. | 94,931 | 2,607,755 |
|
| Oracle Corp. | 62,585 | 2,222,393 |
|
| Red Hat, Inc. † | 4,832 | 268,466 |
|
| Salesforce.com, Inc. † | 2,527 | 434,973 |
|
| Symantec Corp. † | 20,068 | 436,880 |
|
| VMware, Inc. Class A † S | 9,675 | 739,944 |
|
| | | 6,710,411 |
| Specialty retail (1.6%) | | |
| AutoZone, Inc. † S | 1,353 | 500,204 |
|
| Bed Bath & Beyond, Inc. † S | 21,042 | 1,235,165 |
|
| Best Buy Co., Inc. S | 5,925 | 96,341 |
|
| CarMax, Inc. † | 4,037 | 159,139 |
|
| Lowe’s Cos., Inc. | 13,978 | 533,820 |
|
| | |
| COMMON STOCKS (97.9%)* cont. | Shares | Value |
|
| Specialty retail cont. | | |
| Staples, Inc. S | 12,141 | $163,661 |
|
| TJX Cos., Inc. (The) | 20,520 | 927,094 |
|
| | | 3,615,424 |
| Textiles, apparel, and luxury goods (0.6%) | | |
| Coach, Inc. | 11,377 | 580,227 |
|
| Michael Kors Holdings, Ltd. (Hong Kong) † | 5,385 | 302,260 |
|
| NIKE, Inc. Class B | 6,665 | 360,243 |
|
| | | 1,242,730 |
| Tobacco (3.2%) | | |
| Altria Group, Inc. S | 56,154 | 1,891,267 |
|
| Lorillard, Inc. | 6,549 | 255,869 |
|
| Philip Morris International, Inc. | 56,002 | 4,937,131 |
|
| | | 7,084,267 |
| Water utilities (0.1%) | | |
| American Water Works Co., Inc. | 7,040 | 269,491 |
|
| | | 269,491 |
| | | |
| Total common stocks (cost $197,448,310) | | $217,017,112 |
| |
| |
| CONVERTIBLE PREFERRED STOCKS (0.2%)* | Shares | Value |
|
| United Technologies Corp. $3.75 cv. pfd. | 6,584 | $374,893 |
|
| Total convertible preferred stocks (cost $329,200) | | $374,893 |
| | | |
| PURCHASED EQUITY OPTIONS | Expiration | Contract | |
| OUTSTANDING (—%)* | date/strike | amount | Value |
|
| General Dynamics Corp. (Call) | Feb-13/$75.00 | 46,310 | $2 |
|
| Total purchased equity options outstanding (cost $17,598) | | $2 |
| | |
| SHORT-TERM INVESTMENTS (15.9%)* | Principal amount/shares | Value |
|
| U.S. Treasury Bills with effective yields ranging from 0.158% | | |
| to 0.159%, February 7, 2013 | $419,000 | $418,989 |
|
| U.S. Treasury Bills with effective yields ranging from 0.128% | | |
| to 0.131%, January 9, 2014 # | 160,000 | 159,795 |
|
| Putnam Cash Collateral Pool, LLC 0.18% d | 30,491,811 | 30,491,811 |
|
| Putnam Money Market Liquidity Fund 0.10% L | 4,247,665 | 4,247,665 |
|
| Total short-term investments (cost $35,318,266) | | $35,318,260 |
| |
| |
| TOTAL INVESTMENTS | | |
|
| Total investments (cost $233,113,374) | | $252,710,267 |
Key to holding’s abbreviations
| |
| ADR | American Depository Receipts: represents ownership of foreign securities on deposit with a custodian bank |
Notes to the fund’s portfolio
Unless noted otherwise, the notes to the fund’s portfolio are for the close of the fund’s reporting period, which ran from August 1, 2012 through January 31, 2013 (the reporting period). Within the following notes to the portfolio, references to “ASC 820” represent Accounting Standards Codification ASC 820 Fair Value Measurements and Disclosures and references to “OTC”, if any, represent over-the-counter.
* Percentages indicated are based on net assets of $221,700,609.
† Non-income-producing security.
# This security, in part or in entirety, was pledged and segregated with the broker to cover margin requirements for futures contracts at the close of the reporting period.
d Affiliated company. See Note 1 to the financial statements regarding securities lending. The rate quoted in the security description is the annualized 7-day yield of the fund at the close of the reporting period.
L Affiliated company (Note 6). The rate quoted in the security description is the annualized 7-day yield of the fund at the close of the reporting period.
R Real Estate Investment Trust.
S Security on loan, in part or in entirety, at the close of the reporting period (Note 1).
At the close of the reporting period, the fund maintained liquid assets totaling $46,509 to cover certain derivatives contracts.
FORWARD CURRENCY CONTRACTS at 1/31/13 (aggregate face value $1,884,291) (Unaudited)
| | | | | |
| | Contract | Delivery | | Aggregate | Unrealized |
| Counterparty | Currency | type | date | Value | face value | (depreciation) |
|
| Credit Suisse International | | | | | |
|
| Euro | Sell | 2/20/13 | $1,931,379 | $1,884,291 | $(47,088) |
|
| Total | | | | | $(47,088) |
FUTURES CONTRACTS OUTSTANDING at 1/31/13 (Unaudited)
| | | | | |
| | Number of | | | Expiration | Unrealized |
| | contracts | Value | | date | appreciation |
|
| S&P 500 Index (Long) | 5 | $1,866,625 | | Mar-13 | $60,106 |
|
| Total | | | | | $60,106 |
ASC 820 establishes a three-level hierarchy for disclosure of fair value measurements. The valuation hierarchy is based upon the transparency of inputs to the valuation of the fund’s investments. The three levels are defined as follows:
Level 1: Valuations based on quoted prices for identical securities in active markets.
Level 2: Valuations based on quoted prices in markets that are not active or for which all significant inputs are observable, either directly or indirectly.
Level 3: Valuations based on inputs that are unobservable and significant to the fair value measurement.
The following is a summary of the inputs used to value the fund’s net assets as of the close of the reporting period:
| | | | |
| | | | | Valuation inputs | |
|
| Investments in securities: | | Level 1 | Level 2 | Level 3 |
|
| Common stocks: | | | | |
|
| Consumer discretionary | | $29,845,225 | $— | $— |
|
| Consumer staples | | 20,763,780 | — | — |
|
| Energy | | 24,490,436 | — | — |
|
| Financials | | 35,331,828 | — | — |
|
| Health care | | 28,234,152 | — | — |
|
| Industrials | | 19,094,845 | — | — |
|
| Information technology | | 39,690,807 | — | — |
|
| Materials | | 7,915,438 | — | — |
|
| Telecommunication services | | 4,782,795 | — | — |
|
| Utilities | | 6,867,806 | — | — |
|
| Total common stocks | | 217,017,112 | — | — |
| | | | | |
| Convertible preferred stocks | | 374,893 | — | — |
|
| Purchased equity options outstanding | | — | 2 | — |
|
| Short-term investments | | 4,247,665 | 31,070,595 | — |
|
| Totals by level | | $221,639,670 | $31,070,597 | $— |
| | | | | |
| | | | | Valuation inputs | |
|
| Other financial instruments: | | Level 1 | Level 2 | Level 3 |
|
| Forward currency contracts | | $— | $(47,088) | $— |
|
| Futures contracts | | 60,106 | — | — |
|
| Totals by level | | $60,106 | $(47,088) | $— |
The accompanying notes are an integral part of these financial statements.
Statement of assets and liabilities 1/31/13 (Unaudited)
| |
| ASSETS | |
|
| Investment in securities, at value, including $29,831,920 of securities on loan (Note 1): | |
| Unaffiliated issuers (identified cost $198,373,898) | $217,970,791 |
| Affiliated issuers (identified cost $34,739,476) (Notes 1 and 6) | 34,739,476 |
|
| Foreign currency (cost $4) (Note 1) | 3 |
|
| Dividends, interest and other receivables | 272,685 |
|
| Receivable for shares of the fund sold | 65,889 |
|
| Receivable for investments sold | 3,474,974 |
|
| Total assets | 256,523,818 |
| |
| LIABILITIES | |
|
| Payable for investments purchased | 3,692,818 |
|
| Payable for shares of the fund repurchased | 148,709 |
|
| Payable for compensation of Manager (Note 2) | 105,494 |
|
| Payable for custodian fees (Note 2) | 15,213 |
|
| Payable for investor servicing fees (Note 2) | 50,323 |
|
| Payable for Trustee compensation and expenses (Note 2) | 127,600 |
|
| Payable for administrative services (Note 2) | 2,136 |
|
| Payable for distribution fees (Note 2) | 59,581 |
|
| Payable for variation margin (Note 1) | 2,500 |
|
| Unrealized depreciation on forward currency contracts (Note 1) | 47,088 |
|
| Collateral on securities loaned, at value (Note 1) | 30,491,811 |
|
| Other accrued expenses | 79,936 |
|
| Total liabilities | 34,823,209 |
| | |
| Net assets | $221,700,609 |
|
| |
| REPRESENTED BY | |
|
| Paid-in capital (Unlimited shares authorized) (Notes 1 and 4) | $318,838,909 |
|
| Distributions in excess of net investment income (Note 1) | (529,746) |
|
| Accumulated net realized loss on investments and foreign currency transactions (Note 1) | (116,218,518) |
|
| Net unrealized appreciation of investments and assets and liabilities in foreign currencies | 19,609,964 |
|
| Total — Representing net assets applicable to capital shares outstanding | $221,700,609 |
(Continued on next page)
Statement of assets and liabilities (Continued)
| |
| COMPUTATION OF NET ASSET VALUE AND OFFERING PRICE | |
|
| Net asset value and redemption price per class A share | |
| ($186,332,825 divided by 10,348,229 shares) | $18.01 |
|
| Offering price per class A share (100/94.25 of $18.01)* | $19.11 |
|
| Net asset value and offering price per class B share ($10,136,956 divided by 597,688 shares)** | $16.96 |
|
| Net asset value and offering price per class C share ($10,988,848 divided by 646,724 shares)** | $16.99 |
|
| Net asset value and redemption price per class M share ($3,769,889 divided by 216,979 shares) | $17.37 |
|
| Offering price per class M share (100/96.50 of $17.37)* | $18.00 |
|
| Net asset value, offering price and redemption price per class R share | |
| ($163,461 divided by 9,121 shares) | $17.92 |
|
| Net asset value, offering price and redemption price per class Y share | |
| ($10,308,630 divided by 569,429 shares) | $18.10 |
|
* On single retail sales of less than $50,000. On sales of $50,000 or more the offering price is reduced.
** Redemption price per share is equal to net asset value less any applicable contingent deferred sales charge.
The accompanying notes are an integral part of these financial statements.
Statement of operations Six months ended 1/31/13 (Unaudited)
| |
| INVESTMENT INCOME | |
|
| Dividends (net of foreign tax of $6,930) | $2,494,128 |
|
| Interest (including interest income of $2,818 from investments in affiliated issuers) (Note 6) | 20,947 |
|
| Securities lending (Note 1) | 68,433 |
|
| Total investment income | 2,583,508 |
| |
| EXPENSES | |
|
| Compensation of Manager (Note 2) | 612,489 |
|
| Investor servicing fees (Note 2) | 311,001 |
|
| Custodian fees (Note 2) | 20,668 |
|
| Trustee compensation and expenses (Note 2) | 11,147 |
|
| Distribution fees (Note 2) | 347,887 |
|
| Administrative services (Note 2) | 3,724 |
|
| Other | 77,232 |
|
| Total expenses | 1,384,148 |
| | |
| Expense reduction (Note 2) | (6,817) |
|
| Net expenses | 1,377,331 |
| | |
| Net investment income | 1,206,177 |
|
| |
| Net realized gain on investments (Notes 1 and 3) | 9,817,494 |
|
| Net realized gain on futures contracts (Note 1) | 146,033 |
|
| Net realized loss on foreign currency transactions (Note 1) | (111,256) |
|
| Net realized gain on written options (Notes 1 and 3) | 17,615 |
|
| Net unrealized depreciation of assets and liabilities in foreign currencies during the period | (66,548) |
|
| Net unrealized appreciation of investments and futures contracts during the period | 12,153,701 |
|
| Net gain on investments | 21,957,039 |
| | |
| Net increase in net assets resulting from operations | $23,163,216 |
|
The accompanying notes are an integral part of these financial statements.
Statement of changes in net assets
| | |
| INCREASE (DECREASE) IN NET ASSETS | Six months ended 1/31/13* | Year ended 7/31/12 |
|
| Operations: | | |
| Net investment income | $1,206,177 | $1,602,400 |
|
| Net realized gain on investments | | |
| and foreign currency transactions | 9,869,886 | 7,250,915 |
|
| Net unrealized appreciation of investments and assets | | |
| and liabilities in foreign currencies | 12,087,153 | 3,762,180 |
|
| Net increase in net assets resulting from operations | 23,163,216 | 12,615,495 |
|
| Distributions to shareholders (Note 1): | | |
| From ordinary income | | |
| Net investment income | | |
|
| Class A | (1,963,228) | (1,593,744) |
|
| Class B | (35,048) | — |
|
| Class C | (43,464) | (17,573) |
|
| Class M | (22,486) | (15,382) |
|
| Class R | (1,696) | (1,057) |
|
| Class Y | (122,596) | (63,770) |
|
| Increase in capital from settlement payments | — | 24,032 |
|
| Redemption fees (Note 1) | 13 | 297 |
|
| Decrease from capital share transactions (Note 4) | (9,588,999) | (19,769,035) |
|
| Total increase (decrease) in net assets | 11,385,712 | (8,820,737) |
| |
| NET ASSETS | | |
|
| Beginning of period | 210,314,897 | 219,135,634 |
|
| End of period (including distributions in excess of net | | |
| investment income of $529,746 and undistributed net | | |
| investment income of $452,595, respectively) | $221,700,609 | $210,314,897 |
|
* Unaudited
The accompanying notes are an integral part of these financial statements.
|
| This page left blank intentionally. |
Financial highlights (For a common share outstanding throughout the period)
| | | | | | | | | | | | | | | |
| INVESTMENT OPERATIONS: | | | | LESS DISTRIBUTIONS: | | | | | | RATIOS AND SUPPLEMENTAL DATA: | |
|
| | | | | | | | | | | | | | | Ratio | |
| | Net asset | | Net realized | | | | | | | | | | Ratio | of net investment | |
| | value, | | and unrealized | Total from | From | | | | | | Total return | Net assets, | of expenses | income (loss) | |
| | beginning | Net investment | gain (loss) | investment | net investment | From | Total | Redemption | Non-recurring | Net asset value, | at net asset | end of period | to average | to average | Portfolio |
| Period ended | of period | income (loss) a | on investments | operations | income | return of capital | distributions | fees e | reimbursements | end of period | value (%) b | (in thousands) | net assets (%) c | net assets (%) | turnover (%) |
|
| Class A | | | | | | | | | | | | | | | |
| January 31, 2013 ** | $16.35 | .10 | 1.75 | 1.85 | (.19) | — | (.19) | — | — | $18.01 | 11.38 * | $186,333 | .61 * | .60 * | 45 * |
| July 31, 2012 | 15.51 | .13 | .85 | .98 | (.14) | — | (.14) | — | — e,h | 16.35 | 6.37 | 178,021 | 1.26 | .85 | 108 |
| July 31, 2011 | 13.08 | .08 | 2.41 | 2.49 | (.08) | — | (.08) | — | .02 f | 15.51 | 19.24 | 183,969 | 1.23 | .53 | 99 |
| July 31, 2010 | 11.59 | .07 | 1.53 | 1.60 | (.10) | (.01) | (.11) | — | — | 13.08 | 13.80 | 184,136 | 1.26 d | .53 d | 106 |
| July 31, 2009 | 13.99 | .11 | (2.41) g | (2.30) | (.10) | — | (.10) | — | — | 11.59 | (16.26) g | 179,816 | 1.18 d | 1.04 d | 130 |
| July 31, 2008 | 16.74 | .08 | (2.78) | (2.70) | (.05) | — | (.05) | — | — | 13.99 | (16.16) | 271,560 | 1.24 d | .51 d | 119 |
|
| Class B | | | | | | | | | | | | | | | |
| January 31, 2013 ** | $15.34 | .04 | 1.64 | 1.68 | (.06) | — | (.06) | — | — | $16.96 | 10.95 * | $10,137 | .99 * | .22 * | 45 * |
| July 31, 2012 | 14.54 | .01 | .79 | .80 | — | — | — | — | — e,h | 15.34 | 5.50 | 10,441 | 2.01 | .11 | 108 |
| July 31, 2011 | 12.28 | (.03) | 2.27 | 2.24 | — | — | — | — | .02 f | 14.54 | 18.40 | 14,078 | 1.98 | (.21) | 99 |
| July 31, 2010 | 10.87 | (.02) | 1.43 | 1.41 | — e | — e | — e | — | — | 12.28 | 12.99 | 18,522 | 2.01 d | (.20) d | 106 |
| July 31, 2009 | 13.09 | .03 | (2.25) g | (2.22) | — | — | — | — | — | 10.87 | (16.96) g | 27,769 | 1.93 d | .31 d | 130 |
| July 31, 2008 | 15.73 | (.04) | (2.60) | (2.64) | — | — | — | — | — | 13.09 | (16.78) | 65,767 | 1.99 d | (.24) d | 119 |
|
| Class C | | | | | | | | | | | | | | | |
| January 31, 2013 ** | $15.38 | .04 | 1.64 | 1.68 | (.07) | — | (.07) | — | — | $16.99 | 10.93 * | $10,989 | .99 * | .22 * | 45 * |
| July 31, 2012 | 14.60 | .01 | .79 | .80 | (.02) | — | (.02) | — | — e,h | 15.38 | 5.51 | 10,525 | 2.01 | .10 | 108 |
| July 31, 2011 | 12.33 | (.03) | 2.28 | 2.25 | — | — | — | — | .02 f | 14.60 | 18.41 | 11,443 | 1.98 | (.22) | 99 |
| July 31, 2010 | 10.94 | (.03) | 1.45 | 1.42 | (.03) | — e | (.03) | — | — | 12.33 | 12.97 | 10,736 | 2.01 d | (.22) d | 106 |
| July 31, 2009 | 13.17 | .03 | (2.26) g | (2.23) | — | — | — | — | — | 10.94 | (16.93) g | 10,874 | 1.93 d | .29 d | 130 |
| July 31, 2008 | 15.83 | (.04) | (2.62) | (2.66) | — | — | — | — | — | 13.17 | (16.80) | 16,486 | 1.99 d | (.24) d | 119 |
|
| Class M | | | | | | | | | | | | | | | |
| January 31, 2013 ** | $15.74 | .06 | 1.67 | 1.73 | (.10) | — | (.10) | — | — | $17.37 | 11.05 * | $3,770 | .86 * | .35 * | 45 * |
| July 31, 2012 | 14.94 | .05 | .81 | .86 | (.06) | — | (.06) | — | — e,h | 15.74 | 5.78 | 3,692 | 1.76 | .35 | 108 |
| July 31, 2011 | 12.59 | — e | 2.34 | 2.34 | (.01) | — | (.01) | — | .02 f | 14.94 | 18.77 | 4,084 | 1.73 | .03 | 99 |
| July 31, 2010 | 11.17 | — e | 1.47 | 1.47 | (.05) | — e | (.05) | — | — | 12.59 | 13.19 | 3,961 | 1.76 d | .03 d | 106 |
| July 31, 2009 | 13.44 | .05 | (2.30) g | (2.25) | (.02) | — | (.02) | — | — | 11.17 | (16.69) g | 4,254 | 1.68 d | .54 d | 130 |
| July 31, 2008 | 16.11 | — e | (2.67) | (2.67) | — | — | — | — | — | 13.44 | (16.57) | 7,030 | 1.74 d | .01 d | 119 |
|
| Class R | | | | | | | | | | | | | | | |
| January 31, 2013 ** | $16.26 | .08 | 1.73 | 1.81 | (.15) | — | (.15) | — | — | $17.92 | 11.21 * | $163 | .73 * | .47 * | 45 * |
| July 31, 2012 | 15.44 | .09 | .84 | .93 | (.11) | — | (.11) | — | — e,h | 16.26 | 6.06 | 176 | 1.51 | .60 | 108 |
| July 31, 2011 | 13.02 | .04 | 2.42 | 2.46 | (.06) | — | (.06) | — | .02 f | 15.44 | 19.06 | 143 | 1.48 | .28 | 99 |
| July 31, 2010 | 11.55 | .04 | 1.52 | 1.56 | (.08) | (.01) | (.09) | — | — | 13.02 | 13.47 | 102 | 1.51 d | .28 d | 106 |
| July 31, 2009 | 13.92 | .09 | (2.40) g | (2.31) | (.06) | — | (.06) | — | — | 11.55 | (16.51) g | 103 | 1.43 d | .77 d | 130 |
| July 31, 2008 | 16.65 | .04 | (2.76) | (2.72) | (.01) | — | (.01) | — | — | 13.92 | (16.34) | 101 | 1.49 d | .27 d | 119 |
|
| Class Y | | | | | | | | | | | | | | | |
| January 31, 2013 ** | $16.45 | .12 | 1.76 | 1.88 | (.23) | — | (.23) | — | — | $18.10 | 11.53 * | $10,309 | .48 * | .71 * | 45 * |
| July 31, 2012 | 15.62 | .17 | .83 | 1.00 | (.17) | — | (.17) | — | — e,h | 16.45 | 6.54 | 7,461 | 1.01 | 1.10 | 108 |
| July 31, 2011 | 13.16 | .12 | 2.44 | 2.56 | (.12) | — | (.12) | — | .02 f | 15.62 | 19.66 | 5,418 | .98 | .77 | 99 |
| July 31, 2010 | 11.66 | .10 | 1.54 | 1.64 | (.13) | (.01) | (.14) | — | — | 13.16 | 14.05 | 3,802 | 1.01 d | .78 d | 106 |
| July 31, 2009 | 14.10 | .14 | (2.43) g | (2.29) | (.15) | — | (.15) | — | — | 11.66 | (16.04) g | 3,838 | .93 d | 1.30 d | 130 |
| July 31, 2008 | 16.88 | .12 | (2.80) | (2.68) | (.10) | — | (.10) | — | — | 14.10 | (15.96) | 5,026 | .99 d | .76 d | 119 |
|
See notes to financial highlights at the end of this section.
The accompanying notes are an integral part of these financial statements.
| | | |
| 32 | Research Fund | Research Fund | 33 |
Financial highlights (Continued)
* Not annualized.
** Unaudited.
a Per share net investment income (loss) has been determined on the basis of the weighted average number of shares outstanding during the period.
b Total return assumes dividend reinvestment and does not reflect the effect of sales charges.
c Includes amounts paid through expense offset and brokerage/service arrangements (Note 2).
d Reflects an involuntary contractual expense limitation in effect during the period. For periods prior to July 31, 2010 certain fund expenses were waived in connection with the fund’s investment in Putnam Prime Money Market Fund.
As a result of such limitation and/or waivers, the expenses of each class reflect a reduction of the following amounts:
| |
| | Percentage of |
| | average net assets |
|
| July 31, 2010 | 0.03% |
|
| July 31, 2009 | 0.27 |
|
| July 31, 2008 | 0.03 |
|
e Amount represents less than $0.01 per share.
f Reflects a non-recurring reimbursement related to restitution amounts in connection with a distribution plan approved by the Securities and Exchange Commission (the SEC), which amounted to $0.02 per share outstanding on July 21, 2011. Also reflects a non-recurring reimbursement related to short-term trading related lawsuits, which amounted to less than $0.01 per share outstanding on May 11, 2011.
g Reflects a non-recurring litigation payment received by the fund from Tyco International, Ltd. which amounted to the following amounts per share outstanding on March 13, 2009:
| |
| | Per share |
|
| Class A | $0.15 |
|
| Class B | 0.14 |
|
| Class C | 0.14 |
|
| Class M | 0.14 |
|
| Class R | 0.15 |
|
| Class Y | 0.15 |
|
This payment resulted in an increase to total returns of 1.08% for the year ended July 31, 2009.
h Reflects a non-recurring reimbursement pursuant to a settlement between the SEC and Canadian Imperial Holdings, Inc./CIBC World Markets Corp. which amounted to less than $0.01 per share outstanding on November 29, 2011.
The accompanying notes are an integral part of these financial statements.
Notes to financial statements 1/31/13 (Unaudited)
Within the following Notes to financial statements, references to “State Street” represent State Street Bank and Trust Company, references to “the SEC” represent the Securities and Exchange Commission, references to “Putnam Management” represent Putnam Investment Management, LLC, the fund’s manager, an indirect wholly-owned subsidiary of Putnam Investments, LLC and references to “OTC”, if any, represent over-the-counter. Unless otherwise noted, the “reporting period” represents the period from August 1, 2012 through January 31, 2013.
Putnam Research Fund (the fund) is a diversified series of Putnam Investment Funds (the Trust), a Massachusetts business trust registered under the Investment Company Act of 1940, as amended, as an open-end management investment company. The investment objective of the fund is to seek capital appreciation by investing mainly in common stocks (growth or value stocks or both) of large U.S. companies that Putnam Management believes have favorable investment potential. The fund may purchase stocks of companies with stock prices that reflect a value lower than that which Putnam Management places on the company. Putnam Management also may consider other factors Putnam Management believes will cause the stock price to rise. Putnam Management may consider, among other factors, a company’s valuation, financial strength, growth potential, competitive position in its industry, projected future earnings, cash flows and dividends when deciding whether to buy or sell investments.
The fund offers class A, class B, class C, class M, class R and class Y shares. Class A and class M shares are sold with a maximum front-end sales charge of 5.75% and 3.50%, respectively, and generally do not pay a contingent deferred sales charge. Class B shares, which convert to class A shares after approximately eight years, do not pay a front-end sales charge and are subject to a contingent deferred sales charge if those shares are redeemed within six years of purchase. Class C shares have a one-year 1.00% contingent deferred sales charge and do not convert to class A shares. Class R shares, which are not available to all investors, are sold at net asset value. The expenses for class A, class B, class C, class M and class R shares may differ based on the distribution fee of each class, which is identified in Note 2. Class Y shares, which are sold at net asset value, are generally subject to the same expenses as class A, class B, class C, class M and class R shares, but do not bear a distribution fee. Class Y shares are not available to all investors.
In the normal course of business, the fund enters into contracts that may include agreements to indemnify another party under given circumstances. The fund’s maximum exposure under these arrangements is unknown as this would involve future claims that may be, but have not yet been, made against the fund. However, the fund’s management team expects the risk of material loss to be remote.
Note 1: Significant accounting policies
The following is a summary of significant accounting policies consistently followed by the fund in the preparation of its financial statements. The preparation of financial statements is in conformity with accounting principles generally accepted in the United States of America and requires management to make estimates and assumptions that affect the reported amounts of assets and liabilities in the financial statements and the reported amounts of increases and decreases in net assets from operations. Actual results could differ from those estimates. Subsequent events after the Statement of assets and liabilities date through the date that the financial statements were issued have been evaluated in the preparation of the financial statements.
A short-term trading fee of 1.00% may have applied to redemptions (including exchanges into another fund) of shares purchased before January 2, 2013 and held for 7 days or less. The short-term trading fee was accounted for as an addition to paid-in-capital. For shares purchased on or after January 2, 2013, this short-term trading fee no longer applies.
Investment income, realized and unrealized gains and losses and expenses of the fund are borne pro-rata based on the relative net assets of each class to the total net assets of the fund, except that each class bears expenses unique to that class (including the distribution fees applicable to such classes). Each class votes as a class only with respect to its own distribution plan or other matters on which a class vote is required by law or determined by the Trustees. If the fund were liquidated, shares of each class would receive their pro-rata share of the net assets of the fund. In addition, the Trustees declare separate dividends on each class of shares.
Security valuation Investments for which market quotations are readily available are valued at the last reported sales price on their principal exchange, or official closing price for certain markets, and are classified as Level 1 securities under Accounting Standards Codification ASC 820 Fair Value Measurements and Disclosures (ASC 820). If no sales are reported, as in the case of some securities that are traded OTC, a security is valued at its last reported bid price and is generally categorized as a Level 2 security.
Investments in open-end investment companies (excluding exchange traded funds), if any, which can be classified as Level 1 or Level 2 securities, are based on their net asset value. The net asset value of such investment companies equals the total value of their assets less their liabilities and divided by the number of their outstanding shares.
Many securities markets and exchanges outside the U.S. close prior to the close of the New York Stock Exchange and therefore the closing prices for securities in such markets or on such exchanges may not fully reflect events that occur after such close but before the close of the New York Stock Exchange. Accordingly, on certain days, the fund will fair value foreign equity securities taking into account multiple factors including movements in the U.S. securities markets, currency valuations and comparisons to the valuation of American Depository Receipts, exchange-traded funds and futures contracts. These securities, which would generally be classified as Level 1 securities, will be transferred to Level 2 of the fair value hierarchy when they are valued at fair value. The number of days on which fair value prices will be used will depend on market activity and it is possible that fair value prices will be used by the fund to a significant extent. Securities quoted in foreign currencies, if any, are translated into U.S. dollars at the current exchange rate.
To the extent a pricing service or dealer is unable to value a security or provides a valuation that Putnam Management does not believe accurately reflects the security’s fair value, the security will be valued at fair value by Putnam Management. Certain investments, including certain restricted and illiquid securities and derivatives, are also valued at fair value following procedures approved by the Trustees. These valuations consider such factors as significant market or specific security events such as interest rate or credit quality changes, various relationships with other securities, discount rates, U.S. Treasury, U.S. swap and credit yields, index levels, convexity exposures and recovery rates. These securities are classified as Level 2 or as Level 3 depending on the priority of the significant inputs.
Such valuations and procedures are reviewed periodically by the Trustees. The fair value of securities is generally determined as the amount that the fund could reasonably expect to realize from an orderly disposition of such securities over a reasonable period of time. By its nature, a fair value price is a good faith estimate of the value of a security in a current sale and does not reflect an actual market price, which may be different by a material amount.
Security transactions and related investment income Security transactions are recorded on the trade date (the date the order to buy or sell is executed). Gains or losses on securities sold are determined on the identified cost basis.
Interest income, net of any applicable withholding taxes, is recorded on the accrual basis. Dividend income, net of any applicable withholding taxes, is recognized on the ex-dividend date except that certain dividends from foreign securities, if any, are recognized as soon as the fund is informed of the ex-dividend date. Non-cash dividends, if any, are recorded at the fair market value of the securities received. Dividends representing a return of capital or capital gains, if any, are reflected as a reduction of cost and/or as a realized gain.
All premiums/discounts are amortized/accreted on a yield-to-maturity basis.
Foreign currency translation The accounting records of the fund are maintained in U.S. dollars. The market value of foreign securities, currency holdings, and other assets and liabilities is recorded in the books and records of the fund after translation to U.S. dollars based on the exchange rates on that day. The cost of each security is determined using historical exchange rates. Income and withholding taxes are translated at prevailing exchange rates when earned or incurred. The fund does not isolate that portion of realized or unrealized gains or losses resulting from changes in the foreign exchange rate on investments from fluctuations arising from changes in the market prices of the securities. Such gains and losses are included with the net realized and unrealized gain or loss on investments. Net realized gains and losses on foreign currency transactions represent net realized exchange gains or losses on closed forward currency contracts, disposition of foreign currencies, currency gains and losses realized between the trade and settlement dates on securities transactions and the difference between the amount of investment income and foreign withholding taxes recorded on the fund’s books and the U.S. dollar equivalent amounts actually received or paid. Net unrealized appreciation and depreciation of assets and liabilities in foreign currencies arise from changes in the value of open forward currency contracts and assets and liabilities other than investments at the period end, resulting from changes in the exchange rate.
Options contracts The fund uses options contracts to hedge against changes in values of securities it owns, owned or expects to own and to enhance the return on securities owned.
The potential risk to the fund is that the change in value of options contracts may not correspond to the change in value of the hedged instruments. In addition, losses may arise from changes in the value of the underlying instruments, if there is an illiquid secondary market for the contracts, if interest or exchange rates move unexpectedly or if the counterparty to the contract is unable to perform. Realized gains and losses on purchased options are
included in realized gains and losses on investment securities. If a written call option is exercised, the premium originally received is recorded as an addition to sales proceeds. If a written put option is exercised, the premium originally received is recorded as a reduction to the cost of investments.
Exchange traded options are valued at the last sale price or, if no sales are reported, the last bid price for purchased options and the last ask price for written options. OTC traded options are valued using prices supplied by dealers. Certain options contracts include premiums that do not settle until the expiration date of the contract.
Written option contracts outstanding at period end, if any, are listed after the fund’s portfolio. For the fund’s average contract amount, see Note 5.
Futures contracts The fund uses futures contracts to equitize cash.
The potential risk to the fund is that the change in value of futures contracts may not correspond to the change in value of the hedged instruments. In addition, losses may arise from changes in the value of the underlying instruments, if there is an illiquid secondary market for the contracts, if interest or exchange rates move unexpectedly or if the counterparty to the contract is unable to perform. With futures, there is minimal counterparty credit risk to the fund since futures are exchange traded and the exchange’s clearinghouse, as counterparty to all exchange traded futures, guarantees the futures against default. Risks may exceed amounts recognized on the Statement of assets and liabilities. When the contract is closed, the fund records a realized gain or loss equal to the difference between the value of the contract at the time it was opened and the value at the time it was closed.
Futures contracts are valued at the quoted daily settlement prices established by the exchange on which they trade. The fund and the broker agree to exchange an amount of cash equal to the daily fluctuation in the value of the futures contract. Such receipts or payments are known as “variation margin.”
Futures contracts outstanding at period end, if any, are listed after the fund’s portfolio. For the fund’s average number of contracts, see Note 5.
Forward currency contracts The fund buys and sells forward currency contracts, which are agreements between two parties to buy and sell currencies at a set price on a future date. These contracts are used to hedge foreign exchange risk.
The U.S. dollar value of forward currency contracts is determined using current forward currency exchange rates supplied by a quotation service. The market value of the contract will fluctuate with changes in currency exchange rates. The contract is marked to market daily and the change in market value is recorded as an unrealized gain or loss. The fund records a realized gain or loss equal to the difference between the value of the contract at the time it was opened and the value at the time it was closed when the contract matures or by delivery of the currency. The fund could be exposed to risk if the value of the currency changes unfavorably, if the counterparties to the contracts are unable to meet the terms of their contracts or if the fund is unable to enter into a closing position. Risks may exceed amounts recognized on the Statement of assets and liabilities.
Forward currency contracts outstanding at period end, if any, are listed after the fund’s portfolio. For the fund’s average contract amount, see Note 5.
Total return swap contracts The fund entered into OTC total return swap contracts, which are arrangements to exchange a market linked return for a periodic payment, both based on a notional principal amount, to gain exposure to specific sectors or industries.
To the extent that the total return of the security, index or other financial measure underlying the transaction exceeds or falls short of the offsetting interest rate obligation, the fund will receive a payment from or make a payment to the counterparty. OTC total return swap contracts are marked to market daily based upon quotations from an independent pricing service or market makers and the change, if any, is recorded as an unrealized gain or loss. Payments received or made are recorded as realized gains or losses. Certain OTC total return swap contracts may include extended effective dates. Payments related to these swap contracts are accrued based on the terms of the contract. The fund could be exposed to credit or market risk due to unfavorable changes in the fluctuation of interest rates or in the price of the underlying security or index, the possibility that there is no liquid market for these agreements or that the counterparty may default on its obligation to perform. The fund’s maximum risk of loss from counterparty risk is the fair value of the contract. This risk may be mitigated by having a master netting arrangement between the fund and the counterparty. Risk of loss may exceed amounts recognized on the Statement of assets and liabilities.
OTC total return swap contracts outstanding at period end, if any, are listed after the fund’s portfolio. For the fund’s average notional amount, see Note 5.
Master agreements The fund is a party to ISDA (International Swaps and Derivatives Association, Inc.) Master Agreements (Master Agreements) with certain counterparties that govern OTC derivative and foreign exchange contracts entered into from time to time. The Master Agreements may contain provisions regarding, among other things, the parties’ general obligations, representations, agreements, collateral requirements, events of default and early termination. With respect to certain counterparties, in accordance with the terms of the Master Agreements, collateral posted to the fund is held in a segregated account by the fund’s custodian and with respect to those amounts which can be sold or repledged, are presented in the fund’s portfolio.
Collateral pledged by the fund is segregated by the fund’s custodian and identified in the fund’s portfolio. Collateral can be in the form of cash or debt securities issued by the U.S. Government or related agencies or other securities as agreed to by the fund and the applicable counterparty. Collateral requirements are determined based on the fund’s net position with each counterparty.
Termination events applicable to the fund may occur upon a decline in the fund’s net assets below a specified threshold over a certain period of time. Termination events applicable to counterparties may occur upon a decline in the counterparty’s long-term and short-term credit ratings below a specified level. In each case, upon occurrence, the other party may elect to terminate early and cause settlement of all derivative and foreign exchange contracts outstanding, including the payment of any losses and costs resulting from such early termination, as reasonably determined by the terminating party. Any decision by one or more of the fund’s counterparties to elect early termination could impact the fund’s future derivative activity.
At the close of the reporting period, the fund had a net liability position of $47,088 on open derivative contracts subject to the Master Agreements. There was no collateral posted by the fund for these agreements.
Securities lending The fund may lend securities, through its agent, to qualified borrowers in order to earn additional income. The loans are collateralized by cash in an amount at least equal to the market value of the securities loaned. The market value of securities loaned is determined daily and any additional required collateral is allocated to the fund on the next business day. The risk of borrower default will be borne by the fund’s agent; the fund will bear the risk of loss with respect to the investment of the cash collateral. Income from securities lending is included in investment income on the Statement of operations. Cash collateral is invested in Putnam Cash Collateral Pool, LLC, a limited liability company managed by an affiliate of Putnam Management. Investments in Putnam Cash Collateral Pool, LLC are valued at its closing net asset value each business day. There are no management fees charged to Putnam Cash Collateral Pool, LLC. At the close of the reporting period, the value of securities loaned amounted to $29,831,920 and the fund received cash collateral of $30,491,811.
Interfund lending The fund, along with other Putnam funds, may participate in an interfund lending program pursuant to an exemptive order issued by the SEC. This program allows the fund to borrow from or lend to other Putnam funds that permit such transactions. Interfund lending transactions are subject to each fund’s investment policies and borrowing and lending limits. Interest earned or paid on the interfund lending transaction will be based on the average of certain current market rates. During the reporting period, the fund did not utilize the program.
Line of credit The fund participates, along with other Putnam funds, in a $315 million unsecured committed line of credit and a $185 million unsecured uncommitted line of credit, both provided by State Street. Borrowings may be made for temporary or emergency purposes, including the funding of shareholder redemption requests and trade settlements. Interest is charged to the fund based on the fund’s borrowing at a rate equal to the Federal Funds rate plus 1.25% for the committed line of credit and the Federal Funds rate plus 1.30% for the uncommitted line of credit. A closing fee equal to 0.02% of the committed line of credit and $50,000 for the uncommitted line of credit has been paid by the participating funds. In addition, a commitment fee of 0.11% per annum on any unutilized portion of the committed line of credit is allocated to the participating funds based on their relative net assets and paid quarterly. During the reporting period, the fund had no borrowings against these arrangements.
Federal taxes It is the policy of the fund to distribute all of its taxable income within the prescribed time period and otherwise comply with the provisions of the Internal Revenue Code of 1986, as amended (the Code), applicable to regulated investment companies. It is also the intention of the fund to distribute an amount sufficient to avoid imposition of any excise tax under Section 4982 of the Code.
The fund is subject to the provisions of Accounting Standards Codification ASC 740 Income Taxes (ASC 740). ASC 740 sets forth a minimum threshold for financial statement recognition of the benefit of a tax position taken or expected to be taken in a tax return. The fund did not have a liability to record for any unrecognized tax benefits in the accompanying financial statements. No provision has been made for federal taxes on income, capital gains or
unrealized appreciation on securities held nor for excise tax on income and capital gains. Each of the fund’s federal tax returns for the prior three fiscal years remains subject to examination by the Internal Revenue Service.
The fund may also be subject to taxes imposed by governments of countries in which it invests. Such taxes are generally based on either income or gains earned or repatriated. The fund accrues and applies such taxes to net investment income, net realized gains and net unrealized gains as income and/or capital gains are earned. In some cases, the fund may be entitled to reclaim all or a portion of such taxes, and such reclaim amounts, if any, are reflected as an asset on the fund’s books. In many cases, however, the fund may not receive such amounts for an extended period of time, depending on the country of investment.
At July 31, 2012, the fund had a capital loss carryover of $124,979,912 available to the extent allowed by the Code to offset future net capital gain, if any. The amounts of the carryovers and the expiration dates are:
| | | |
| Loss carryover |
| Short-term | Long-term | Total | Expiration |
|
| $74,176,197 | N/A | $74,176,197 | July 31, 2017 |
|
| 50,803,715 | N/A | 50,803,715 | July 31, 2018 |
|
Under the Regulated Investment Company Modernization Act of 2010, the fund will be permitted to carry forward capital losses incurred in taxable years beginning after December 22, 2010 for an unlimited period. However, any losses incurred will be required to be utilized prior to the losses incurred in pre-enactment tax years. As a result of this ordering rule, pre-enactment capital loss carryforwards may be more likely to expire unused. Additionally, post-enactment capital losses that are carried forward will retain their character as either short-term or long-term capital losses rather than being considered all short-term as under previous law.
The aggregate identified cost on a tax basis is $234,156,131, resulting in gross unrealized appreciation and depreciation of $24,560,934 and $6,006,798, respectively, or net unrealized appreciation of $18,554,136.
Distributions to shareholders Distributions to shareholders from net investment income are recorded by the fund on the ex-dividend date. Distributions from capital gains, if any, are recorded on the ex-dividend date and paid at least annually. The amount and character of income and gains to be distributed are determined in accordance with income tax regulations, which may differ from generally accepted accounting principles. Dividend sources are estimated at the time of declaration. Actual results may vary. Any non-taxable return of capital cannot be determined until final tax calculations are completed after the end of the fund’s fiscal year. Reclassifications are made to the fund’s capital accounts to reflect income and gains available for distribution (or available capital loss carryovers) under income tax regulations.
Expenses of the Trust Expenses directly charged or attributable to any fund will be paid from the assets of that fund. Generally, expenses of the Trust will be allocated among and charged to the assets of each fund on a basis that the Trustees deem fair and equitable, which may be based on the relative assets of each fund or the nature of the services performed and relative applicability to each fund.
Note 2: Management fee, administrative services and other transactions
The fund pays Putnam Management a management fee (based on the fund’s average net assets and computed and paid monthly) at annual rates that may vary based on the average of the aggregate net assets of most open-end funds, as defined in the fund’s management contract, sponsored by Putnam Management. Such annual rates may vary as follows:
| | | | |
| 0.710% | of the first $5 billion, | | 0.510% | of the next $50 billion, |
| |
|
| 0.660% | of the next $5 billion, | | 0.490% | of the next $50 billion, |
| |
|
| 0.610% | of the next $10 billion, | | 0.480% | of the next $100 billion and |
| |
|
| 0.560% | of the next $10 billion, | | 0.475% | of any excess thereafter. |
| |
|
Putnam Management has contractually agreed, through June 30, 2013, to waive fees or reimburse the fund’s expenses to the extent necessary to limit the cumulative expenses of the fund, exclusive of brokerage, interest, taxes, investment-related expenses, extraordinary expenses, acquired fund fees and expenses and payments under the fund’s investor servicing contract, investment management contract and distribution plans, on a fiscal
year-to-date basis to an annual rate of 0.20% of the fund’s average net assets over such fiscal year-to-date period. During the reporting period, the fund’s expenses were not reduced as a result of this limit.
Putnam Investments Limited (PIL), an affiliate of Putnam Management, is authorized by the Trustees to manage a separate portion of the assets of the fund as determined by Putnam Management from time to time. Putnam Management pays a quarterly sub-management fee to PIL for its services at an annual rate of 0.35% of the average net assets of the portion of the fund managed by PIL.
The Putnam Advisory Company, LLC (PAC), an affiliate of Putnam Management, is authorized by the Trustees to manage a separate portion of the assets of the fund, as designated from time to time by Putnam Management or PIL. Putnam Management or PIL, as applicable, pays a quarterly sub-advisory fee to PAC for its services at the annual rate of 0.35% of the average net assets of the portion of the fund’s assets for which PAC is engaged as sub-adviser.
The fund reimburses Putnam Management an allocated amount for the compensation and related expenses of certain officers of the fund and their staff who provide administrative services to the fund. The aggregate amount of all such reimbursements is determined annually by the Trustees.
Custodial functions for the fund’s assets are provided by State Street. Custody fees are based on the fund’s asset level, the number of its security holdings and transaction volumes.
Putnam Investor Services, Inc., an affiliate of Putnam Management, provides investor servicing agent functions to the fund. Putnam Investor Services, Inc. received fees for investor servicing based on the fund’s retail asset level, the number of shareholder accounts in the fund and the level of defined contribution plan assets in the fund. Investor servicing fees will not exceed an annual rate of 0.32% of the fund’s average net assets. Prior to March 1, 2012, investor servicing fees could not exceed an annual rate of 0.375% of the fund’s average net assets. During the reporting period, the expenses for each class of shares related to investor servicing fees were as follows:
| | | | |
| Class A | $262,296 | | Class R | 279 |
| |
|
| Class B | 14,777 | | Class Y | 12,845 |
| |
|
| Class C | 15,476 | | Total | $311,001 |
| |
|
| Class M | 5,328 | | | |
| | |
The fund has entered into expense offset arrangements with Putnam Investor Services, Inc. and State Street whereby Putnam Investor Services, Inc.’s and State Street’s fees are reduced by credits allowed on cash balances. The fund also reduced expenses through brokerage/service arrangements. For the reporting period, the fund’s expenses were reduced by $292 under the expense offset arrangements and by $6,525 under the brokerage/service arrangements.
Each independent Trustee of the fund receives an annual Trustee fee, of which $164, as a quarterly retainer, has been allocated to the fund, and an additional fee for each Trustees meeting attended. Trustees also are reimbursed for expenses they incur relating to their services as Trustees.
The fund has adopted a Trustee Fee Deferral Plan (the Deferral Plan) which allows the Trustees to defer the receipt of all or a portion of Trustees fees payable on or after July 1, 1995. The deferred fees remain invested in certain Putnam funds until distribution in accordance with the Deferral Plan.
The fund has adopted an unfunded noncontributory defined benefit pension plan (the Pension Plan) covering all Trustees of the fund who have served as a Trustee for at least five years and were first elected prior to 2004. Benefits under the Pension Plan are equal to 50% of the Trustee’s average annual attendance and retainer fees for the three years ended December 31, 2005. The retirement benefit is payable during a Trustee’s lifetime, beginning the year following retirement, for the number of years of service through December 31, 2006. Pension expense for the fund is included in Trustee compensation and expenses in the Statement of operations. Accrued pension liability is included in Payable for Trustee compensation and expenses in the Statement of assets and liabilities. The Trustees have terminated the Pension Plan with respect to any Trustee first elected after 2003.
The fund has adopted distribution plans (the Plans) with respect to its class A, class B, class C, class M and class R shares pursuant to Rule 12b–1 under the Investment Company Act of 1940. The purpose of the Plans is to compensate Putnam Retail Management Limited Partnership, an indirect wholly-owned subsidiary of Putnam Investments, LLC, for services provided and expenses incurred in distributing shares of the fund. The Plans provide for payments by the fund to Putnam Retail Management Limited Partnership at an annual rate of up to 0.35%, 1.00%, 1.00%, 1.00% and 1.00% of the average net assets attributable to class A, class B, class C, class M and class R shares,
respectively. The Trustees have approved payment by the fund at an annual rate of 0.25%, 1.00%, 1.00%, 0.75% and 0.50% of the average net assets attributable to class A, class B, class C, class M and class R shares, respectively. During the reporting period, the class specific expenses related to distribution fees were as follows:
| | | | |
| Class A | $228,196 | | Class M | 13,904 |
| |
|
| Class B | 51,432 | | Class R | 481 |
| |
|
| Class C | 53,874 | | Total | $347,887 |
| |
|
For the reporting period, Putnam Retail Management Limited Partnership, acting as underwriter, received net commissions of $5,640 and $184 from the sale of class A and class M shares, respectively, and received $5,245 and $48 in contingent deferred sales charges from redemptions of class B and class C shares, respectively.
A deferred sales charge of up to 1.00% and 0.65% is assessed on certain redemptions of class A and class M shares, respectively. For the reporting period, Putnam Retail Management Limited Partnership, acting as underwriter, received no monies on class A and class M redemptions.
Note 3: Purchases and sales of securities
During the reporting period, cost of purchases and proceeds from sales of investment securities other than short-term investments aggregated $92,536,644 and $103,166,013, respectively. There were no purchases or proceeds from sales of long-term U.S. government securities.
Written option transactions during the reporting period are summarized as follows:
| | |
| | Written equity option | Written equity option |
| | contract amounts | premiums |
|
| Written options outstanding at the | | |
| beginning of the reporting period | — | $— |
|
| Options opened | 165,333 | 43,863 |
| Options exercised | — | — |
| Options expired | — | — |
| Options closed | (165,333) | (43,863) |
|
| Written options outstanding at the | | |
| end of the reporting period | — | $— |
|
Note 4: Capital shares
At the close of the reporting period, there was an unlimited number of shares of beneficial interest authorized. Transactions in capital shares were as follows:
| | | | |
| | Six months ended 1/31/13 | Year ended 7/31/12 |
|
| Class A | Shares | Amount | Shares | Amount |
|
| Shares sold | 229,166 | $3,940,334 | 883,571 | $13,393,161 |
|
| Shares issued in connection with | | | | |
| reinvestment of distributions | 110,509 | 1,878,645 | 102,076 | 1,516,848 |
|
| | 339,675 | 5,818,979 | 985,647 | 14,910,009 |
|
| Shares repurchased | (882,529) | (15,154,541) | (1,952,537) | (30,160,307) |
|
| Net decrease | (542,854) | $(9,335,562) | (966,890) | $(15,250,298) |
|
| | | | |
| | Six months ended 1/31/13 | Year ended 7/31/12 |
|
| Class B | Shares | Amount | Shares | Amount |
|
| Shares sold | 29,525 | $476,561 | 72,068 | $1,036,832 |
|
| Shares issued in connection with | | | | |
| reinvestment of distributions | 2,122 | 34,023 | — | — |
|
| | 31,647 | 510,584 | 72,068 | 1,036,832 |
|
| Shares repurchased | (114,678) | (1,843,942) | (359,641) | (5,191,775) |
|
| Net decrease | (83,031) | $(1,333,358) | (287,573) | $(4,154,943) |
|
| |
| | Six months ended 1/31/13 | Year ended 7/31/12 |
|
| Class C | Shares | Amount | Shares | Amount |
|
| Shares sold | 23,998 | $391,922 | 28,943 | $410,694 |
|
| Shares issued in connection with | | | | |
| reinvestment of distributions | 2,561 | 41,134 | 1,165 | 16,355 |
|
| | 26,559 | 433,056 | 30,108 | 427,049 |
|
| Shares repurchased | (64,356) | (1,042,087) | (129,521) | (1,877,317) |
|
| Net decrease | (37,797) | $(609,031) | (99,413) | $(1,450,268) |
|
| |
| | Six months ended 1/31/13 | Year ended 7/31/12 |
|
| Class M | Shares | Amount | Shares | Amount |
|
| Shares sold | 1,987 | $32,958 | 11,467 | $166,644 |
|
| Shares issued in connection with | | | | |
| reinvestment of distributions | 1,356 | 22,269 | 1,063 | 15,253 |
|
| | 3,343 | 55,227 | 12,530 | 181,897 |
|
| Shares repurchased | (20,955) | (346,660) | (51,413) | (761,834) |
|
| Net decrease | (17,612) | $(291,433) | (38,883) | $(579,937) |
|
| |
| | Six months ended 1/31/13 | Year ended 7/31/12 |
|
| Class R | Shares | Amount | Shares | Amount |
|
| Shares sold | 2,216 | $37,924 | 2,955 | $45,116 |
|
| Shares issued in connection with | | | | |
| reinvestment of distributions | 100 | 1,696 | 71 | 1,057 |
|
| | 2,316 | 39,620 | 3,026 | 46,173 |
|
| Shares repurchased | (4,015) | (71,052) | (1,444) | (22,560) |
|
| Net increase (decrease) | (1,699) | $(31,432) | 1,582 | $23,613 |
|
| |
| | Six months ended 1/31/13 | Year ended 7/31/12 |
|
| Class Y | Shares | Amount | Shares | Amount |
|
| Shares sold | 162,467 | $2,822,441 | 163,207 | $2,552,634 |
|
| Shares issued in connection with | | | | |
| reinvestment of distributions | 7,118 | 121,639 | 4,215 | 62,934 |
|
| | 169,585 | 2,944,080 | 167,422 | 2,615,568 |
|
| Shares repurchased | (53,613) | (932,263) | (60,956) | (972,770) |
|
| Net increase | 115,972 | $2,011,817 | 106,466 | $1,642,798 |
|
Note 5: Summary of derivative activity
The average volume of activity for the reporting period for any derivative type that was held during the period is listed below and was as follows:
| |
| Purchased equity option contracts (number of contracts) | 20,000 |
|
| Written equity option contracts (number of contracts) | —* |
|
| Futures contracts (number of contracts) | 5 |
|
| Forward currency contracts (contract amount) | $1,900,000 |
|
* For the reporting period, the transaction volume was minimal.
The following is a summary of the market values of derivative instruments as of the close of the reporting period:
Market values of derivative instruments as of the close of the reporting period
| | | | |
| | Asset derivatives | Liability derivatives |
|
| Derivatives not | | | | |
| accounted for as | Statement of | | Statement of | |
| hedging instruments | assets and | | assets and | |
| under ASC 815 | liabilities location | Market value | liabilities location | Market value |
|
| Foreign exchange | | | | |
| contracts | — | $— | Payables | $47,088 |
|
| | Receivables, Net | | | |
| | assets — Unrealized | | | |
| Equity contracts | appreciation | 60,108* | — | — |
|
| Total | | $60,108 | | $47,088 |
|
* Includes cumulative appreciation of futures contracts as reported in the fund’s portfolio. Only current day’s variation margin is reported within the Statement of assets and liabilities.
The following is a summary of realized and change in unrealized gains or losses of derivative instruments on the Statement of operations for the reporting period (see Note 1):
Amount of realized gain or (loss) on derivatives recognized in net gain or (loss) on investments
| | | | |
| Derivatives not accounted for | | | Forward | |
| as hedging instruments under | | | currency | |
| ASC 815 | Options | Futures | contracts | Total |
|
| Foreign exchange contracts | $— | $— | $(110,854) | $(110,854) |
|
| Equity contracts | 89,872 | 146,033 | — | 235,905 |
|
| Total | $89,872 | $146,033 | $(110,854) | $125,051 |
|
Change in unrealized appreciation or (depreciation) on derivatives recognized in net gain or (loss) on investments
| | | | |
| Derivatives not accounted for | | | Forward | |
| as hedging instruments under | | | currency | |
| ASC 815 | Options | Futures | contracts | Total |
|
| Foreign exchange contracts | $— | $— | $(66,601) | $(66,601) |
|
| Equity contracts | (17,596) | (5,629) | — | (23,225) |
|
| Total | $(17,596) | $(5,629) | $(66,601) | $(89,826) |
|
Note 6: Transactions with affiliated issuer
Transactions during the reporting period with Putnam Money Market Liquidity Fund, which is under common ownership and control, were as follows:
| | | | | |
| | Market value at | | | | Market value |
| | the beginning | | | | at the end of |
| | of the reporting | | | Investment | the reporting |
| Name of affiliate | period | Purchase cost | Sale proceeds | income | period |
|
| Putnam Money Market | | | | | |
| Liquidity Fund* | $4,337,767 | $20,272,097 | $20,362,199 | $2,818 | $4,247,665 |
|
* Management fees charged to Putnam Money Market Liquidity Fund have been waived by Putnam Management.
Note 7: Market, credit and other risks
In the normal course of business, the fund trades financial instruments and enters into financial transactions where risk of potential loss exists due to changes in the market (market risk) or failure of the contracting party to the transaction to perform (credit risk). The fund may be exposed to additional credit risk that an institution or other entity with which the fund has unsettled or open transactions will default. Investments in foreign securities involve certain risks, including those related to economic instability, unfavorable political developments, and currency fluctuations.
Note 8: New accounting pronouncement
In December 2011, the FASB issued ASU No. 2011–11 “Disclosures about Offsetting Assets and Liabilities”. The update creates new disclosure requirements requiring entities to disclose both gross and net information for derivatives and other financial instruments that are either offset in the Statement of assets and liabilities or subject to an enforceable master netting arrangement or similar agreement. The disclosure requirements are effective for annual reporting periods beginning on or after January 1, 2013 and interim periods within those annual periods. Putnam Management is currently evaluating the application of ASU 2011–11 and its impact, if any, on the fund’s financial statements.
Fund information
Founded over 75 years ago, Putnam Investments was built around the concept that a balance between risk and reward is the hallmark of a well-rounded financial program. We manage over 100 funds across income, value, blend, growth, asset allocation, absolute return, and global sector categories.
| | |
| Investment Manager | Trustees | Robert R. Leveille |
| Putnam Investment | Jameson A. Baxter, Chair | Vice President and |
| Management, LLC | Liaquat Ahamed | Chief Compliance Officer |
| One Post Office Square | Ravi Akhoury | |
| Boston, MA 02109 | Barbara M. Baumann | Michael J. Higgins |
| | Charles B. Curtis | Vice President and Treasurer |
| Investment Sub-Manager | Robert J. Darretta | |
| Putnam Investments Limited | Katinka Domotorffy | Janet C. Smith |
| 57–59 St James’s Street | John A. Hill | Vice President, |
| London, England SW1A 1LD | Paul L. Joskow | Principal Accounting Officer, |
| | Elizabeth T. Kennan | and Assistant Treasurer |
| Investment Sub-Advisor | Kenneth R. Leibler | |
| The Putnam Advisory | Robert E. Patterson | Susan G. Malloy |
| Company, LLC | George Putnam, III | Vice President and |
| One Post Office Square | Robert L. Reynolds | Assistant Treasurer |
| Boston, MA 02109 | W. Thomas Stephens | |
| | | James P. Pappas |
| Marketing Services | Officers | Vice President |
| Putnam Retail Management | Robert L. Reynolds | |
| One Post Office Square | President | Mark C. Trenchard |
| Boston, MA 02109 | | Vice President and |
| | Jonathan S. Horwitz | BSA Compliance Officer |
| Custodian | Executive Vice President, | |
| State Street Bank | Principal Executive Officer, and | Judith Cohen |
| and Trust Company | Compliance Liaison | Vice President, Clerk, and |
| | | Associate Treasurer |
| Legal Counsel | Steven D. Krichmar | |
| Ropes & Gray LLP | Vice President and | Nancy E. Florek |
| | Principal Financial Officer | Vice President, Proxy |
| | | Manager, Assistant Clerk, and |
| | Robert T. Burns | Associate Treasurer |
| | Vice President and | |
| | Chief Legal Officer | |
This report is for the information of shareholders of Putnam Research Fund. It may also be used as sales literature when preceded or accompanied by the current prospectus, the most recent copy of Putnam’s Quarterly Performance Summary, and Putnam’s Quarterly Ranking Summary. For more recent performance, please visit putnam.com. Investors should carefully consider the investment objectives, risks, charges, and expenses of a fund, which are described in its prospectus. For this and other information or to request a prospectus or summary prospectus, call 1-800-225-1581 toll free. Please read the prospectus carefully before investing. The fund’s Statement of Additional Information contains additional information about the fund’s Trustees and is available without charge upon request by calling 1-800-225-1581.

| |
| Item 3. Audit Committee Financial Expert: |
| |
| Item 4. Principal Accountant Fees and Services: |
| |
| Item 5. Audit Committee of Listed Registrants |
| |
| Item 6. Schedule of Investments: |
| |
| The registrant’s schedule of investments in unaffiliated issuers is included in the report to shareholders in Item 1 above. |
| |
| Item 7. Disclosure of Proxy Voting Policies and Procedures For Closed-End Management Investment Companies: |
| |
| Item 8. Portfolio Managers of Closed-End Investment Companies |
| |
| Item 9. Purchases of Equity Securities by Closed-End Management Investment Companies and Affiliated Purchasers: |
| |
| Item 10. Submission of Matters to a Vote of Security Holders: |
| |
| Item 11. Controls and Procedures: |
| |
| (a) The registrant’s principal executive officer and principal financial officer have concluded, based on their evaluation of the effectiveness of the design and operation of the registrant’s disclosure controls and procedures as of a date within 90 days of the filing date of this report, that the design and operation of such procedures are generally effective to provide reasonable assurance that information required to be disclosed by the registrant in this report is recorded, processed, summarized and reported within the time periods specified in the Commission’s rules and forms. |
| |
| (b) Changes in internal control over financial reporting: Not applicable |
| |
| (a)(2) Separate certifications for the principal executive officer and principal financial officer of the registrant as required by Rule 30a-2(a) under the Investment Company Act of 1940, as amended, are filed herewith. |
| |
| (b) The certifications required by Rule 30a-2(b) under the Investment Company Act of 1940, as amended, are filed herewith. |
| |
| By (Signature and Title): |
| |
| /s/Janet C. Smith
Janet C. Smith
Principal Accounting Officer
|
| |
| Pursuant to the requirements of the Securities Exchange Act of 1934 and the Investment Company Act of 1940, this report has been signed below by the following persons on behalf of the registrant and in the capacities and on the dates indicated. |
| |
| By (Signature and Title): |
| |
| /s/Jonathan S. Horwitz
Jonathan S. Horwitz
Principal Executive Officer
|
| |
| By (Signature and Title): |
| |
| /s/Steven D. Krichmar
Steven D. Krichmar
Principal Financial Officer
|