| | |
| UNITED STATES
SECURITIES AND EXCHANGE COMMISSION |
| | |
| CERTIFIED SHAREHOLDER REPORT OF REGISTERED
MANAGEMENT INVESTMENT COMPANIES
|
| | |
| Investment Company Act file number: | (811- 07237) |
| | |
| Exact name of registrant as specified in charter: | Putnam Investment Funds |
| | |
| Address of principal executive offices: | One Post Office Square, Boston, Massachusetts 02109 |
| | |
| Name and address of agent for service: | Robert T. Burns, Vice President
One Post Office Square
Boston, Massachusetts 02109 |
| | |
| Copy to: | John W. Gerstmayr, Esq.
Ropes & Gray LLP
800 Boylston Street
Boston, Massachusetts 02199-3600 |
| | |
| Registrant’s telephone number, including area code: | (617) 292-1000 |
| | |
| Date of fiscal year end: | August 31, 2013 |
| | |
| Date of reporting period: | September 1, 2012 — February 28, 2013 |
| | |
|
Item 1. Report to Stockholders: | |
| | |
| The following is a copy of the report transmitted to stockholders pursuant to Rule 30e-1 under the Investment Company Act of 1940: | |
Putnam
International Capital
Opportunities Fund
Semiannual report
2 | 28 | 13
| | | |
| Message from the Trustees | 1 | | |
| | |
| About the fund | 2 | | |
| | |
| Performance snapshot | 4 | | |
| | |
| Interview with your fund’s portfolio manager | 5 | | |
| | |
| Your fund’s performance | 11 | | |
| | |
| Your fund’s expenses | 13 | | |
| | |
| Terms and definitions | 15 | | |
| | |
| Other information for shareholders | 16 | | |
| | |
| Financial statements | 17 | | |
| | |
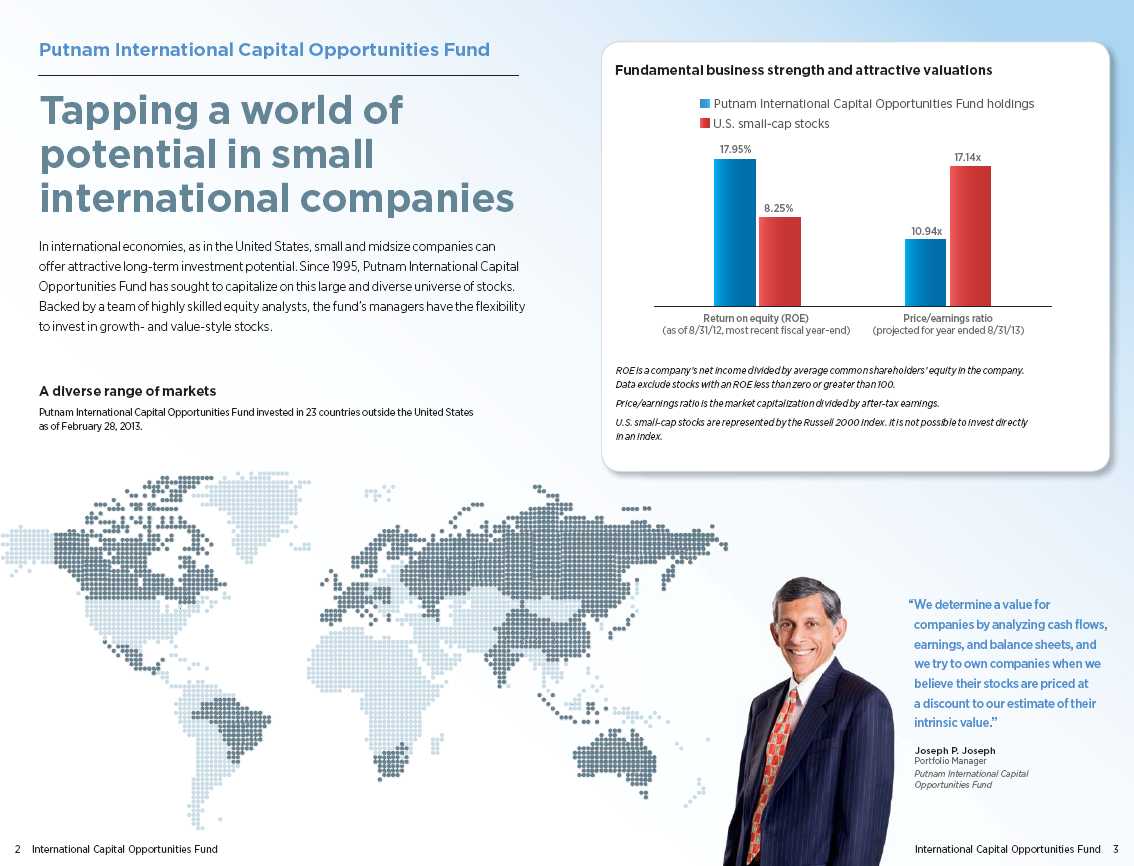
Consider these risks before investing: International investing involves certain risks, such as currency fluctuations, economic instability, and political developments. Additional risks may be associated with emerging-market securities, including illiquidity and volatility. Investments in small and/or midsize companies increase the risk of greater price fluctuations. Derivatives also involve the risk of increasing investment exposure or, in the case of many over-the-counter instruments, of the potential inability to terminate or sell derivatives positions and the potential failure of the other party to the instrument to meet its obligations. Growth stocks may be more susceptible to earnings disappointments, and value stocks may fail to rebound. The prices of stocks in the fund’s portfolio may fall or fail to rise over extended periods of time for a variety of reasons, including both general financial market conditions and factors related to a specific company or industry. You can lose money by investing in the fund.
Message from the Trustees
Dear Fellow Shareholder:
The U.S. stock market has set record highs recently, thanks to steadily improving housing and employment data and the Federal Reserve’s pledge to continue to add stimulus until it believes the economy has meaningfully improved. The federal budget battle continues among Washington lawmakers, but investors appear to believe that a resolution will eventually take place.
The by-now familiar risks that have buffeted markets for a few years have not gone away entirely, but they appear to be steadily abating. Europe, while having slumped further into recession, is slowly addressing its sovereign debt problem; China’s economy appears to be improving; and here in the United States economic recovery is underway.
Times like these require a measured, balanced approach to investing. At Putnam, our investment team is actively focused on managing risk while pursuing returns. The guidance of your financial advisor is also important in helping to ensure that your portfolio remains in line with your individual goals and tolerance for risk.
We would like to extend a welcome to new shareholders of the fund and to thank all of our investors for your continued confidence in Putnam.

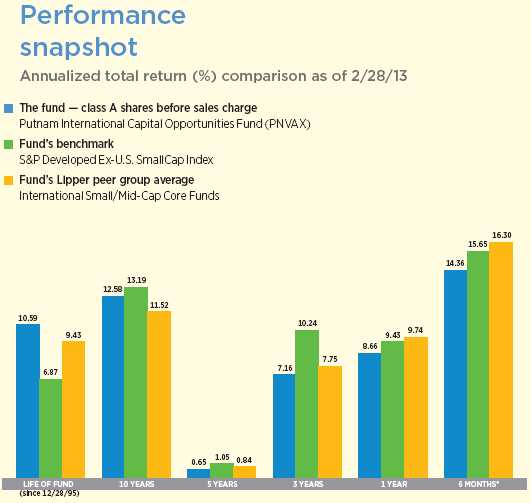
Current performance may be lower or higher than the quoted past performance, which cannot guarantee future results. Share price, principal value, and return will fluctuate, and you may have a gain or a loss when you sell your shares. Performance of class A shares assumes reinvestment of distributions and does not account for taxes. Fund returns in the bar chart do not reflect a sales charge of 5.75%; had they, returns would have been lower. See pages 5 and 11–13 for additional performance information. For a portion of the periods, the fund had expense limitations, without which returns would have been lower. A short-term trading fee of 1% may apply to redemptions or exchanges from certain funds within the time period specified in the fund’s prospectus. To obtain the most recent month-end performance, visit putnam.com.
* Returns for the six-month period are not annualized, but cumulative.
| |
| 4 | International Capital Opportunities Fund |
Interview with your fund’s portfolio manager

Putnam International Capital Opportunities Fund delivered a strong absolute return during the period, but the fund performed just below its benchmark’s 15.65% return. What key factors drove this result?
Stock selection was the most important contributor to the fund’s overall return. The fund did slightly lag its benchmark, though, because of volatility experienced by some of the portfolio holdings. In the course of the period, we took steps to lower the portfolio’s volatility, and we are optimistic that this could help with results relative to the benchmark in the months ahead.
How would you describe the investment environment for small- and mid-cap international stocks during the period?
It was generally a strong investment environment, which took its cue from the U.S. economy’s continuing recovery. For its part, the U.S. economy seemed to gain its direction from signs of health in the housing market. We suspect that the U.S. consumer is feeling the wealth effect of rebounding home equity values. For one thing, U.S. consumers in aggregate have not appeared to wilt in the face of the new year’s higher payroll or other income taxes. To us, this suggests that housing is once again playing a positive psychological role for the average consumer — and consumer spending is a
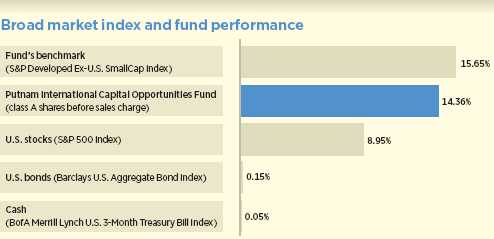
This comparison shows your fund’s performance in the context of broad market indexes for the six months ended 2/28/13. See pages 4 and 11–13 for additional fund performance information. Index descriptions can be found on page 15.
| |
| International Capital Opportunities Fund | 5 |
critical component of U.S. economic growth. With U.S. trends setting a positive tone, international markets, particularly in the small- and mid-cap space, were largely led upward. We see this trajectory continuing in the months ahead — and we anticipate even more upside potential in international relative to U.S. stocks.
Does your anticipation of an upward trajectory include the European economy and markets?
We see Europe in a stabilization phase, but its stock markets, in our view, have room to run. Some of the biggest risks that beset Europe with varying degrees of urgency in 2012 — such as a potential breakup of the European Union and a failure of the euro currency — appear to have been severely curtailed by the efforts of eurozone policymakers. Consequently, we wouldn’t be surprised to see healthy economic growth emerge from Europe sometime in the next 12 to 24 months. As of the end of the reporting period, however, European stocks appeared to be priced for a long, slow recovery, so we generally have an easy time finding what we consider attractive opportunities — companies with strong balance sheets and steady cash flows. These are companies that have the kind of staying power that we believe will help them thrive once the European economy is more fully on track.
Japanese stocks solidly ran up during the period, partly as a result of the yen trending steeply downward. How do these developments affect your outlook for Japanese equities?
The large decline in the value of the yen relative to other major currencies has helped make some Japanese companies more competitive relative to their counterparts in other countries. If the currency continues to depreciate, this could have an important
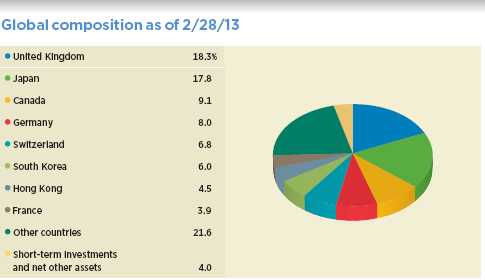
Country allocations are represented as a percentage of the fund’s net assets. Summary information may differ from the information in the portfolio schedule notes included in the financial statements due to the inclusion of derivative securities, any interest accruals, the exclusion of as-of trades, if any, and the use of different classifications of securities for presentation purposes. Holdings and allocations may vary over time.
| |
| 6 | International Capital Opportunities Fund |
effect on Japanese equities over a longer time frame, which could be an important catalyst for renewed economic health in Japan.

Having said that, Japanese stocks moved up very quickly at the end of 2012 and into the early months of 2013. As many investors began chasing Japanese equity returns, Japanese stocks that we formerly would have called relatively cheap became far less attractively priced in just a matter of weeks. In the portfolio, we held on to the stocks we already owned, which was beneficial for the fund’s returns in an absolute sense, but we did not make any substantive changes to the fund’s allocation to Japanese stocks.
Did you make any large changes in sector allocations during the period?
We made a couple of shifts worth noting. Specifically, we reduced consumer discretionary, health-care, and information technology weightings and redeployed the proceeds from these stock sales into consumer staples and financials. Among the latter, we increased the portfolio’s exposure to insurance companies, but we continue to be underweight in real estate investment trusts, which appear in general to be fully valued.
Which stocks contributed most to the fund’s performance during the period?
A Canada-based mining company, Inmet, was the largest contributor to the fund’s return. The company’s share price rose when another mining company, First Quantum, made an offer to acquire Inmet. We sold the stock after the bid was announced, locking in profits for the fund.
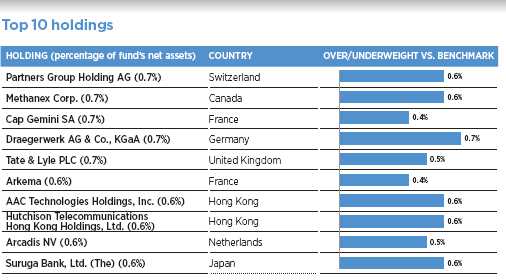
This table shows the fund’s top 10 holdings by percentage of the fund’s net assets as of 2/28/13. Summary information may differ from the portfolio schedule included in the financial statements due to the inclusion of derivative securities, any interest accruals, the exclusion of as-of trades, if any, and the use of different classifications of securities for presentation purposes. Holdings will vary over time.
| |
| International Capital Opportunities Fund | 7 |
The second-largest contributor to the fund’s performance was GS Home Shopping, a South Korean version of the U.S.-based Home Shopping Network. Formerly, the company emphasized home appliances, which was a relatively low-margin business. Management initiated an important shift in focus, however, as the company began selling more low-priced apparel — a higher-margin business that gained traction with the downturn-weary South Korean consumer. The company also continued its expansion into a variety of other countries, including India and Thailand — moves that should help maintain the company’s long-term performance potential.
Another top contributor was Japan-based Suruga Bank, which performed well as the Japanese real estate market improved. Suruga’s net interest income increased as a result of its ability to make more mortgage loans. In addition, the company has an arrangement with the Japan Post Bank — one of the world’s largest savings banks in terms of consumer assets — whereby the Post Bank refers banking business to Suruga. This was an additional source of growth for the company.
Which stocks detracted the most from the fund’s return during the period?
The largest detractor from returns was Royal Imtech, a Netherlands-based technical services provider that offers a wide range of businesses in electrical services, energy distribution, and information and communication technology. Unfortunately, the company reported issues related to receivable collections during the period that made us reconsider the position and ultimately led us to sell it.
The second-largest detractor was SmarTone, a mobile phone operator based in Hong Kong. The company’s operating expenses
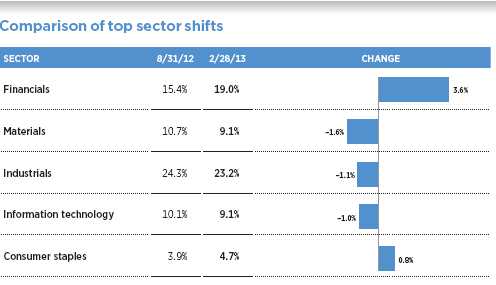
This chart shows the fund’s largest allocation shifts, by percentage, over the past six months. Allocations are represented as a percentage of the fund’s net assets. Current period summary information may differ from the portfolio schedule included in the financial statements due to the inclusion of derivative securities, any interest accruals, the exclusion of as-of trades, if any, and the use of different classifications of securities for presentation purposes. Holdings and allocations may vary over time.
| |
| 8 | International Capital Opportunities Fund |
rose during the period as it transitioned more of its customers to its 4G network. The company is also getting reduced revenue from roaming charges due to price competition. We continue to like the stock, however, because the company has not stopped paying out close to 100% of its free cash flow to shareholders. Also, we think the 4G transition poses merely a short-term cost setback for the company. In our estimation, it should gradually gain scale as more customers move on to the new network.
The next-largest detractors were the South Korea-based mobile gaming companies, Daum and NHN, each of which have segments devoted to the mobile social gaming market. Concerns flared up in the period over the expectation that government regulation was slated to become more restrictive for this aspect of Daum’s and NHN’s businesses, and the share prices of both companies lagged. By period-end, we sold our position in NHN but continued to hold Daum with confidence in its longer-term potential.
From your perspective, what are the key developments to watch for in international equity markets in the months ahead?
For the past year, international small- and mid-cap stocks have been much more attractive from a valuation standpoint than their U.S. counterparts. Despite the fact that international markets have had a good run, we are still able to find what we consider cheap stocks. In the U.S. equity space, by contrast, it is relatively more difficult to find cheaply valued stocks. While we cannot say how long this difference will persist, the comparison is rather stark in our analysis, which makes us that much more optimistic about international equity investing in 2013.
Lastly, I would say the market all too frequently assumes that acquiring attractively valued stocks requires that one must compromise on quality. We disagree with this assumption, and feel we are able to locate both attributes — good value and high quality — quite frequently among international stocks today. This is nowhere more true, in our opinion, than in Europe, where we believe strong security-selection ability can help us establish compelling positions in stocks with attractive risk/ reward characteristics.
Thank you, Joe, for this update on the fund.
The views expressed in this report are exclusively those of Putnam Management and are subject to change. They are not meant as investment advice.
Please note that the holdings discussed in this report may not have been held by the fund for the entire period. Portfolio composition is subject to review in accordance with the fund’s investment strategy and may vary in the future. Current and future portfolio holdings are subject to risk.
Portfolio Manager Joseph P. Joseph has an M.B.A. from the Stern School of Business at New York University and a B.A. from Loyola College. He joined Putnam in 1994 and has been in the investment industry since 1987.
In addition to Joe, your fund’s portfolio managers are Randy J. Farina, CFA, and John McLanahan, CFA.
| |
| International Capital Opportunities Fund | 9 |
IN THE NEWS
The global economy continues to expand, but the rate of expansion slowed recently. Manufacturing production and services activity worldwide both eased in February, according to data compiled by JPMorgan and Market Economics. Economic growth was led by the United States, followed by China, Germany, the United Kingdom, Brazil, India, Russia, and Ireland. The rate of increase, however, dropped in most of those countries, with the United States and Russia being the exceptions. Japan’s economic output, meanwhile, was stagnant. In the still-troubled eurozone, conditions weakened substantially in France, Italy, and Spain, with output contracting sharply in these countries’ manufacturing and services sectors. While the global economic deceleration was considered slight by most observers, the expansion rate hit a four-month low in February. As the employment picture improves in the United States and around the world, economists hope that jobs growth will spur further demand.
| |
| 10 | International Capital Opportunities Fund |
Your fund’s performance
This section shows your fund’s performance, price, and distribution information for periods ended February 28, 2013, the end of the first half of its current fiscal year. In accordance with regulatory requirements for mutual funds, we also include performance information as of the most recent calendar quarter-end and expense information taken from the fund’s current prospectus. Performance should always be considered in light of a fund’s investment strategy. Data represent past performance. Past performance does not guarantee future results. More recent returns may be less or more than those shown. Investment return and principal value will fluctuate, and you may have a gain or a loss when you sell your shares. Performance information does not reflect any deduction for taxes a shareholder may owe on fund distributions or on the redemption of fund shares. For the most recent month-end performance, please visit the Individual Investors section at putnam.com or call Putnam at 1-800-225-1581. Class R and class Y shares are not available to all investors. See the Terms and Definitions section in this report for definitions of the share classes offered by your fund.
Fund performance Total return for periods ended 2/28/13
| | | | | | | | | | |
| | Class A | Class B | Class C | Class M | Class R | Class Y |
| (inception dates) | (12/28/95) | (10/30/96) | (7/26/99) | (10/30/96) | (1/21/03) | (2/1/00) |
|
| | Before | After | | | | | Before | After | Net | Net |
| | sales | sales | Before | After | Before | After | sales | sales | asset | asset |
| | charge | charge | CDSC | CDSC | CDSC | CDSC | charge | charge | value | value |
|
| Annual average | | | | | | | | | | |
| (life of fund) | 10.59% | 10.21% | 9.76% | 9.76% | 9.76% | 9.76% | 10.03% | 9.81% | 10.33% | 10.80% |
|
| 10 years | 226.98 | 208.18 | 203.51 | 203.51 | 203.39 | 203.39 | 211.27 | 200.37 | 219.97 | 235.55 |
| Annual average | 12.58 | 11.91 | 11.74 | 11.74 | 11.74 | 11.74 | 12.02 | 11.63 | 12.33 | 12.87 |
|
| 5 years | 3.29 | –2.65 | –0.52 | –2.46 | –0.50 | –0.50 | 0.78 | –2.75 | 2.06 | 4.60 |
| Annual average | 0.65 | –0.54 | –0.10 | –0.50 | –0.10 | –0.10 | 0.16 | –0.56 | 0.41 | 0.90 |
|
| 3 years | 23.05 | 15.97 | 20.31 | 17.31 | 20.27 | 20.27 | 21.23 | 16.99 | 22.17 | 23.99 |
| Annual average | 7.16 | 5.06 | 6.36 | 5.46 | 6.35 | 6.35 | 6.63 | 5.37 | 6.90 | 7.43 |
|
| 1 year | 8.66 | 2.41 | 7.86 | 2.86 | 7.86 | 6.86 | 8.13 | 4.35 | 8.39 | 8.94 |
|
| 6 months | 14.36 | 7.78 | 13.92 | 8.92 | 13.92 | 12.92 | 14.09 | 10.10 | 14.21 | 14.50 |
|
Current performance may be lower or higher than the quoted past performance, which cannot guarantee future results. After-sales-charge returns for class A and M shares reflect the deduction of the maximum 5.75% and 3.50% sales charge, respectively, levied at the time of purchase. Class B share returns after contingent deferred sales charge (CDSC) reflect the applicable CDSC, which is 5% in the first year, declining over time to 1% in the sixth year, and is eliminated thereafter. Class C share returns after CDSC reflect a 1% CDSC for the first year that is eliminated thereafter. Class R and Y shares have no initial sales charge or CDSC. Performance for class B, C, M, R, and Y shares before their inception is derived from the historical performance of class A shares, adjusted for the applicable sales charge (or CDSC) and the higher operating expenses for such shares, except for class Y shares, for which 12b-1 fees are not applicable.
Recent performance may have benefited from one or more legal settlements.
For a portion of the periods, the fund had expense limitations, without which returns would have been lower.
Class B share performance does not reflect conversion to class A shares.
A short-term trading fee of 1% may apply to redemptions or exchanges from certain funds within the time period specified in the fund’s prospectus.
| |
| International Capital Opportunities Fund | 11 |
Comparative index returns For periods ended 2/28/13
| | |
| | | Lipper International Small/ |
| | S&P Developed | Mid-Cap Core Funds |
| | Ex-U.S. SmallCap Index | category average* |
|
| Annual average (life of fund) | 6.87% | 9.43% |
|
| 10 years | 245.25 | 201.33 |
| Annual average | 13.19 | 11.52 |
|
| 5 years | 5.34 | 4.78 |
| Annual average | 1.05 | 0.84 |
|
| 3 years | 33.96 | 25.70 |
| Annual average | 10.24 | 7.75 |
|
| 1 year | 9.43 | 9.74 |
|
| 6 months | 15.65 | 16.30 |
|
Index and Lipper results should be compared with fund performance before sales charge, before CDSC, or at net asset value.
* Over the 6-month, 1-year, 3-year, 5-year, 10-year, and life-of-fund periods ended 2/28/13, there were 52, 50, 40, 33, 23, and 8 funds, respectively, in this Lipper category.
Fund price and distribution information For the six-month period ended 2/28/13
| | | | | | |
| Distributions | Class A | Class B | Class C | Class M | Class R | Class Y |
|
| Number | 1 | 1 | 1 | 1 | 1 | 1 |
|
| Income | $0.387 | $0.113 | $0.129 | $0.226 | $0.253 | $0.472 |
|
| Capital gains | — | — | — | — | — | — |
|
| Total | $0.387 | $0.113 | $0.129 | $0.226 | $0.253 | $0.472 |
|
| | Before | After | Net | Net | Before | After | Net | Net |
| | sales | sales | asset | asset | sales | sales | asset | asset |
| Share value | charge | charge | value | value | charge | charge | value | value |
|
| 8/31/12 | $30.33 | $32.18 | $30.09 | $30.07 | $30.14 | $31.23 | $29.81 | $30.37 |
|
| 2/28/13 | 34.28 | 36.37 | 34.16 | 34.12 | 34.15 | 35.39 | 33.78 | 34.28 |
|
The classification of distributions, if any, is an estimate. Before-sales-charge share value and current dividend rate for class A and M shares, if applicable, do not take into account any sales charge levied at the time of purchase. After-sales-charge share value, current dividend rate, and current 30-day SEC yield, if applicable, are calculated assuming that the maximum sales charge (5.75% for class A shares and 3.50% for class M shares) was levied at the time of purchase. Final distribution information will appear on your year-end tax forms.
| |
| 12 | International Capital Opportunities Fund |
Fund performance as of most recent calendar quarter
Total return for periods ended 3/31/13
| | | | | | | | | | |
| | Class A | Class B | Class C | Class M | Class R | Class Y |
| (inception dates) | (12/28/95) | (10/30/96) | (7/26/99) | (10/30/96) | (1/21/03) | (2/1/00) |
|
| | Before | After | | | | | Before | After | Net | Net |
| | sales | sales | Before | After | Before | After | sales | sales | asset | asset |
| | charge | charge | CDSC | CDSC | CDSC | CDSC | charge | charge | value | value |
|
| Annual average | | | | | | | | | | |
| (life of fund) | 10.65% | 10.27% | 9.82% | 9.82% | 9.82% | 9.82% | 10.09% | 9.87% | 10.39% | 10.86% |
|
| 10 years | 238.23 | 218.78 | 213.55 | 213.55 | 213.64 | 213.64 | 221.78 | 210.52 | 230.62 | 246.82 |
| Annual average | 12.96 | 12.29 | 12.11 | 12.11 | 12.11 | 12.11 | 12.40 | 12.00 | 12.70 | 13.24 |
|
| 5 years | 5.63 | –0.45 | 1.72 | –0.27 | 1.71 | 1.71 | 3.02 | –0.59 | 4.35 | 6.94 |
| Annual average | 1.10 | –0.09 | 0.34 | –0.05 | 0.34 | 0.34 | 0.60 | –0.12 | 0.85 | 1.35 |
|
| 3 years | 15.50 | 8.86 | 12.94 | 9.94 | 12.89 | 12.89 | 13.77 | 9.79 | 14.66 | 16.36 |
| Annual average | 4.92 | 2.87 | 4.14 | 3.21 | 4.12 | 4.12 | 4.39 | 3.16 | 4.66 | 5.18 |
|
| 1 year | 10.14 | 3.80 | 9.30 | 4.30 | 9.30 | 8.30 | 9.58 | 5.74 | 9.85 | 10.38 |
|
| 6 months | 11.35 | 4.95 | 10.94 | 5.94 | 10.93 | 9.93 | 11.07 | 7.19 | 11.22 | 11.50 |
|
See the discussion following the Fund performance table on page 11 for information about the calculation of fund performance.
Your fund’s expenses
As a mutual fund investor, you pay ongoing expenses, such as management fees, distribution fees (12b-1 fees), and other expenses. Using the following information, you can estimate how these expenses affect your investment and compare them with the expenses of other funds. You may also pay one-time transaction expenses, including sales charges (loads) and redemption fees, which are not shown in this section and would have resulted in higher total expenses. For more information, see your fund’s prospectus or talk to your financial representative.
Expense ratios
| | | | | | |
| | Class A | Class B | Class C | Class M | Class R | Class Y |
|
| Total annual operating expenses | | | | | | |
| for the fiscal year ended 8/31/12 | 1.41% | 2.16% | 2.16% | 1.91% | 1.66% | 1.16% |
|
| Annualized expense ratio for | | | | | | |
| the six-month period ended | | | | | | |
| 2/28/13* | 1.43% | 2.18% | 2.18% | 1.93% | 1.68% | 1.18% |
|
Fiscal-year expense information in this table is taken from the most recent prospectus, is subject to change, and may differ from that shown for the annualized expense ratio and in the financial highlights of this report. Expenses are shown as a percentage of average net assets.
* Includes an increase of 0.11% from annualizing the performance fee adjustment for the six months ended 2/28/13.
| |
| International Capital Opportunities Fund | 13 |
Expenses per $1,000
The following table shows the expenses you would have paid on a $1,000 investment in the fund from September 1, 2012, to February 28, 2013. It also shows how much a $1,000 investment would be worth at the close of the period, assuming actual returns and expenses.
| | | | | | |
| | Class A | Class B | Class C | Class M | Class R | Class Y |
|
| Expenses paid per $1,000*† | $7.60 | $11.56 | $11.56 | $10.24 | $8.92 | $6.28 |
|
| Ending value (after expenses) | $1,143.60 | $1,139.20 | $1,139.20 | $1,140.90 | $1,142.10 | $1,145.00 |
|
* Expenses for each share class are calculated using the fund’s annualized expense ratio for each class, which represents the ongoing expenses as a percentage of average net assets for the six months ended 2/28/13. The expense ratio may differ for each share class.
† Expenses are calculated by multiplying the expense ratio by the average account value for the period; then multiplying the result by the number of days in the period; and then dividing that result by the number of days in the year.
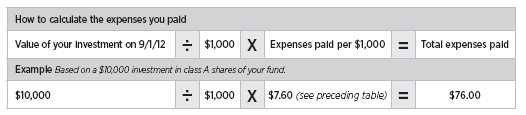
Estimate the expenses you paid
To estimate the ongoing expenses you paid for the six months ended February 28, 2013, use the following calculation method. To find the value of your investment on September 1, 2012, call Putnam at 1-800-225-1581.
Compare expenses using the SEC’s method
The Securities and Exchange Commission (SEC) has established guidelines to help investors assess fund expenses. Per these guidelines, the following table shows your fund’s expenses based on a $1,000 investment, assuming a hypothetical 5% annualized return. You can use this information to compare the ongoing expenses (but not transaction expenses or total costs) of investing in the fund with those of other funds. All mutual fund shareholder reports will provide this information to help you make this comparison. Please note that you cannot use this information to estimate your actual ending account balance and expenses paid during the period.
| | | | | | |
| | Class A | Class B | Class C | Class M | Class R | Class Y |
|
| Expenses paid per $1,000*† | $7.15 | $10.89 | $10.89 | $9.64 | $8.40 | $5.91 |
|
| Ending value (after expenses) | $1,017.70 | $1,013.98 | $1,013.98 | $1,015.22 | $1,016.46 | $1,018.94 |
|
* Expenses for each share class are calculated using the fund’s annualized expense ratio for each class, which represents the ongoing expenses as a percentage of average net assets for the six months ended 2/28/13. The expense ratio may differ for each share class.
† Expenses are calculated by multiplying the expense ratio by the average account value for the period; then multiplying the result by the number of days in the period; and then dividing that result by the number of days in the year.
| |
| 14 | International Capital Opportunities Fund |
Terms and definitions
Important terms
Total return shows how the value of the fund’s shares changed over time, assuming you held the shares through the entire period and reinvested all distributions in the fund.
Before sales charge, or net asset value, is the price, or value, of one share of a mutual fund, without a sales charge. Before-sales-charge figures fluctuate with market conditions, and are calculated by dividing the net assets of each class of shares by the number of outstanding shares in the class.
After sales charge is the price of a mutual fund share plus the maximum sales charge levied at the time of purchase. After-sales-charge performance figures shown here assume the 5.75% maximum sales charge for class A shares and 3.50% for class M shares.
Contingent deferred sales charge (CDSC) is generally a charge applied at the time of the redemption of class B or C shares and assumes redemption at the end of the period. Your fund’s class B CDSC declines over time from a 5% maximum during the first year to 1% during the sixth year. After the sixth year, the CDSC no longer applies. The CDSC for class C shares is 1% for one year after purchase.
Share classes
Class A shares are generally subject to an initial sales charge and no CDSC (except on certain redemptions of shares bought without an initial sales charge).
Class B shares are not subject to an initial sales charge. They may be subject to a CDSC.
Class C shares are not subject to an initial sales charge and are subject to a CDSC only if the shares are redeemed during the first year.
Class M shares have a lower initial sales charge and a higher 12b-1 fee than class A shares and no CDSC (except on certain redemptions of shares bought without an initial sales charge).
Class R shares are not subject to an initial sales charge or CDSC and are available only to certain defined contribution plans.
Class Y shares are not subject to an initial sales charge or CDSC, and carry no 12b-1 fee. They are generally only available to corporate and institutional clients and clients in other approved programs.
Comparative indexes
Barclays U.S. Aggregate Bond Index is an unmanaged index of U.S. investment-grade fixed-income securities.
BofA (Bank of America) Merrill Lynch U.S. 3-Month Treasury Bill Index is an unmanaged index that seeks to measure the performance of U.S. Treasury bills available in the marketplace.
S&P 500 Index is an unmanaged index of common stock performance.
S&P Developed Ex-U.S. SmallCap Index is an unmanaged index of small-cap stocks from developed countries, excluding the United States.
Indexes assume reinvestment of all distributions and do not account for fees. Securities and performance of a fund and an index will differ. You cannot invest directly in an index.
Lipper is a third-party industry-ranking entity that ranks mutual funds. Its rankings do not reflect sales charges. Lipper rankings are based on total return at net asset value relative to other funds that have similar current investment styles or objectives as determined by Lipper. Lipper may change a fund’s category assignment at its discretion. Lipper category averages reflect performance trends for funds within a category.
| |
| International Capital Opportunities Fund | 15 |
Other information for shareholders
Important notice regarding delivery of shareholder documents
In accordance with Securities and Exchange Commission (SEC) regulations, Putnam sends a single copy of annual and semiannual shareholder reports, prospectuses, and proxy statements to Putnam shareholders who share the same address, unless a shareholder requests otherwise. If you prefer to receive your own copy of these documents, please call Putnam at 1-800-225-1581, and Putnam will begin sending individual copies within 30 days.
Proxy voting
Putnam is committed to managing our mutual funds in the best interests of our shareholders. The Putnam funds’ proxy voting guidelines and procedures, as well as information regarding how your fund voted proxies relating to portfolio securities during the 12-month period ended June 30, 2012, are available in the Individual Investors section of putnam.com, and on the SEC’s website, www.sec.gov. If you have questions about finding forms on the SEC’s website, you may call the SEC at 1-800-SEC-0330. You may also obtain the Putnam funds’ proxy voting guidelines and procedures at no charge by calling Putnam’s Shareholder Services at 1-800-225-1581.
Fund portfolio holdings
The fund will file a complete schedule of its portfolio holdings with the SEC for the first and third quarters of each fiscal year on Form N-Q. Shareholders may obtain the fund’s Forms N-Q on the SEC’s website at www.sec.gov. In addition, the fund’s Forms N-Q may be reviewed and copied at the SEC’s Public Reference Room in Washington, D.C. You may call the SEC at 1-800-SEC-0330 for information about the SEC’s website or the operation of the Public Reference Room.
Trustee and employee fund ownership
Putnam employees and members of the Board of Trustees place their faith, confidence, and, most importantly, investment dollars in Putnam mutual funds. As of February 28, 2013, Putnam employees had approximately $366,000,000 and the Trustees had approximately $87,000,000 invested in Putnam mutual funds. These amounts include investments by the Trustees’ and employees’ immediate family members as well as investments through retirement and deferred compensation plans.
| |
| 16 | International Capital Opportunities Fund |
Financial statements
A guide to financial statements
These sections of the report, as well as the accompanying Notes, constitute the fund’s financial statements.
The fund’s portfolio lists all the fund’s investments and their values as of the last day of the reporting period. Holdings are organized by asset type and industry sector, country, or state to show areas of concentration and diversification.
Statement of assets and liabilities shows how the fund’s net assets and share price are determined. All investment and non-investment assets are added together. Any unpaid expenses and other liabilities are subtracted from this total. The result is divided by the number of shares to determine the net asset value per share, which is calculated separately for each class of shares. (For funds with preferred shares, the amount subtracted from total assets includes the liquidation preference of preferred shares.)
Statement of operations shows the fund’s net investment gain or loss. This is done by first adding up all the fund’s earnings — from dividends and interest income — and subtracting its operating expenses to determine net investment income (or loss). Then, any net gain or loss the fund realized on the sales of its holdings — as well as any unrealized gains or losses over the period — is added to or subtracted from the net investment result to determine the fund’s net gain or loss for the fiscal period.
Statement of changes in net assets shows how the fund’s net assets were affected by the fund’s net investment gain or loss, by distributions to shareholders, and by changes in the number of the fund’s shares. It lists distributions and their sources (net investment income or realized capital gains) over the current reporting period and the most recent fiscal year-end. The distributions listed here may not match the sources listed in the Statement of operations because the distributions are determined on a tax basis and may be paid in a different period from the one in which they were earned. Dividend sources are estimated at the time of declaration. Actual results may vary. Any non-taxable return of capital cannot be determined until final tax calculations are completed after the end of the fund’s fiscal year.
Financial highlights provide an overview of the fund’s investment results, per-share distributions, expense ratios, net investment income ratios, and portfolio turnover in one summary table, reflecting the five most recent reporting periods. In a semiannual report, the highlights table also includes the current reporting period.
| |
| International Capital Opportunities Fund | 17 |
The fund’s portfolio 2/28/13 (Unaudited)
| | |
| COMMON STOCKS (96.1%)* | Shares | Value |
|
| Australia (3.4%) | | |
| Abacus Property Group R | 1,893,764 | $4,277,069 |
|
| Cardno, Ltd. S | 568,769 | 4,157,652 |
|
| Flight Centre, Ltd. S | 161,774 | 5,371,401 |
|
| Lend Lease Group | 306,514 | 3,329,048 |
|
| Medusa Mining, Ltd. S | 580,223 | 2,527,869 |
|
| Monadelphous Group, Ltd. S | 194,955 | 4,945,250 |
|
| Wotif.com Holdings, Ltd. S | 862,251 | 4,324,312 |
|
| | | 28,932,601 |
| Austria (0.9%) | | |
| Andritz AG | 78,347 | 5,520,240 |
|
| Bank Austria Creditanstalt AG (acquired 8/7/08, cost $—) FΔΔ | 471 | — |
|
| EVN AG S | 129,468 | 1,852,553 |
|
| | | 7,372,793 |
| Canada (9.6%) | | |
| AuRico Gold, Inc. † | 565,600 | 3,537,572 |
|
| Calfrac Well Services, Ltd. | 181,895 | 4,303,746 |
|
| Canaccord Financial, Inc. | 564,643 | 4,090,069 |
|
| Canadian Real Estate Investment Trust R | 66,700 | 3,040,550 |
|
| Centerra Gold, Inc. | 554,100 | 3,599,971 |
|
| Corus Entertainment, Inc. Class B S | 184,300 | 4,542,939 |
|
| Dollarama, Inc. | 92,800 | 5,453,265 |
|
| Domtar Corp. | 63,309 | 4,720,319 |
|
| Ensign Energy Services, Inc. S | 298,724 | 4,964,974 |
|
| Industrial Alliance Insurance and Financial Services, Inc. | 90,000 | 3,229,091 |
|
| InnVest Real Estate Investment Trust R | 713,600 | 3,093,132 |
|
| Lululemon Athletica, Inc. † | 65,399 | 4,383,398 |
|
| Lundin Mining Corp. † | 921,348 | 4,172,310 |
|
| MacDonald Dettwiler & Associates, Ltd. | 62,500 | 4,318,182 |
|
| Methanex Corp. S | 165,996 | 6,076,460 |
|
| Metro, Inc. S | 76,200 | 4,772,614 |
|
| Mullen Group, Ltd. | 207,100 | 4,400,059 |
|
| Open Text Corp. † | 90,774 | 4,997,081 |
|
| Peyto Exploration and Development Corp. S | 208,907 | 5,098,850 |
|
| | | 82,794,582 |
| China (1.2%) | | |
| AAC Technologies Holdings, Inc. | 1,306,000 | 5,559,500 |
|
| China BlueChemical, Ltd. | 6,950,000 | 4,455,914 |
|
| | | 10,015,414 |
| Denmark (2.2%) | | |
| D/S Norden | 107,994 | 3,432,626 |
|
| DSV A/S | 131,380 | 3,222,458 |
|
| H. Lundbeck A/S | 206,456 | 3,499,694 |
|
| Sydbank A/S † | 200,653 | 4,071,647 |
|
| Topdanmark A/S † | 20,099 | 4,623,743 |
|
| | | 18,850,168 |
| France (3.9%) | | |
| Arkema | 55,140 | 5,583,737 |
|
| Cap Gemini SA | 117,199 | 5,757,729 |
|
| Ingenico S | 88,611 | 5,353,248 |
|
| |
| 18 | International Capital Opportunities Fund |
| | |
| COMMON STOCKS (96.1%)* cont. | Shares | Value |
|
| France cont. | | |
| M6-Metropole Television | 191,833 | $3,147,477 |
|
| Publicis Group SA | 77,583 | 5,128,354 |
|
| SEB SA | 49,957 | 3,714,010 |
|
| Teleperformance | 125,498 | 5,166,384 |
|
| | | 33,850,939 |
| Germany (8.0%) | | |
| Aurubis AG S | 71,739 | 5,033,456 |
|
| Bertrandt AG S | 34,123 | 3,781,431 |
|
| Bilfinger SE | 47,147 | 4,949,718 |
|
| Carl Zeiss Meditec AG S | 122,190 | 3,826,010 |
|
| Celesio AG | 129,783 | 2,346,620 |
|
| Draegerwerk AG & Co., KGaA (Preference) S | 44,305 | 5,664,567 |
|
| Gerry Weber International AG | 107,117 | 4,844,684 |
|
| Gildemeister AG | 216,114 | 5,356,590 |
|
| Hugo Boss AG | 44,287 | 5,134,427 |
|
| Krones AG | 26,955 | 1,754,865 |
|
| Lanxess AG | 56,811 | 4,810,245 |
|
| Leoni AG | 114,888 | 5,179,559 |
|
| MTU Aero Engines Holding AG | 54,476 | 5,066,097 |
|
| Software AG | 120,144 | 4,737,452 |
|
| Stada Arzneimittel AG | 83,539 | 3,265,414 |
|
| Vossloh AG | 28,624 | 3,006,379 |
|
| | | 68,757,514 |
| Hong Kong (3.3%) | | |
| China New Town Development Co., Ltd. † | 1 | — |
|
| Dah Sing Financial Holdings | 751,600 | 4,042,248 |
|
| Hutchison Telecommunications Hong Kong Holdings, Ltd. | 11,266,000 | 5,536,127 |
|
| SmarTone Telecommunications Holdings, Ltd. | 2,516,000 | 4,598,300 |
|
| Techtronic Industries Co. | 2,231,000 | 4,445,684 |
|
| Television Broadcasts, Ltd. | 672,000 | 5,122,439 |
|
| Wing Hang Bank, Ltd. | 448,500 | 4,978,794 |
|
| | | 28,723,592 |
| Ireland (2.4%) | | |
| C&C Group PLC | 765,410 | 4,890,920 |
|
| Kerry Group PLC Class A | 97,801 | 5,480,002 |
|
| Kingspan Group PLC | 439,973 | 5,090,481 |
|
| United Drug PLC | 1,113,383 | 4,829,863 |
|
| | | 20,291,266 |
| Italy (2.3%) | | |
| Ansaldo STS SpA | 511,142 | 4,929,091 |
|
| Danieli & Co. SpA S | 167,342 | 4,469,860 |
|
| De’Longhi SpA | 323,387 | 4,962,471 |
|
| Recordati SpA | 501,928 | 4,975,396 |
|
| | | 19,336,818 |
| Japan (17.8%) | | |
| ABC-Mart, Inc. S | 83,600 | 2,916,300 |
|
| Advance Residence Investment Corp. R | 2,261 | 4,798,451 |
|
| Aeon Credit Service Co., Ltd. | 137,700 | 3,204,880 |
|
| Asics Corp. | 338,000 | 5,315,635 |
|
| Capcom Co., Ltd. | 238,300 | 3,657,508 |
|
| |
| International Capital Opportunities Fund | 19 |
| | |
| COMMON STOCKS (96.1%)* cont. | Shares | Value |
|
| Japan cont. | | |
| Century Tokyo Leasing Corp. | 139,500 | $3,249,061 |
|
| Dainippon Sumitomo Pharma Co., Ltd. | 335,200 | 4,840,688 |
|
| Disco Corp. | 80,200 | 4,591,972 |
|
| Fuyo General Lease Co., Ltd. | 96,100 | 3,425,232 |
|
| Gunma Bank, Ltd. (The) | 880,000 | 4,783,236 |
|
| Horiba, Ltd. | 151,200 | 4,719,967 |
|
| Itochu Techno-Solutions Corp. | 97,500 | 4,258,733 |
|
| Japan Petroleum Exploration Co. | 64,700 | 2,452,549 |
|
| Japan Real Estate Investment Corp. R | 485 | 5,320,506 |
|
| JSR Corp. | 241,800 | 4,927,684 |
|
| Kakaku.com, Inc. | 121,700 | 4,726,076 |
|
| Kobayashi Pharmaceutical Co., Ltd. | 58,400 | 2,768,927 |
|
| Kurita Water Industries, Ltd. | 213,400 | 4,262,572 |
|
| Kuroda Electric Co., Ltd. | 245,300 | 2,809,305 |
|
| Mandom Corp. | 124,300 | 3,876,152 |
|
| Misumi Group, Inc. | 174,200 | 4,442,398 |
|
| Mitsubishi Tanabe Pharma Corp. | 250,700 | 3,556,148 |
|
| Moshi Moshi Hotline, Inc. | 347,000 | 4,903,731 |
|
| Musashino Bank, Ltd. (The) | 82,900 | 2,928,002 |
|
| Nihon Kohden Corp. | 138,600 | 4,814,200 |
|
| Nippo Corp. | 263,000 | 3,454,368 |
|
| Nitto Denko Corp. | 90,100 | 5,294,555 |
|
| NTT Urban Development Corp. | 3,317 | 3,376,606 |
|
| Ono Pharmaceutical Co., Ltd. | 67,300 | 3,568,401 |
|
| Park24 Co., Ltd. | 197,000 | 3,599,773 |
|
| Rinnai Corp. | 59,900 | 4,300,531 |
|
| Sanwa Holdings Corp. | 908,000 | 4,641,431 |
|
| Shimamura Co., Ltd. | 41,200 | 4,208,619 |
|
| Suruga Bank, Ltd. (The) | 376,000 | 5,522,997 |
|
| Suzuken Co., Ltd. | 81,300 | 2,827,775 |
|
| Taikisha, Ltd. | 232,000 | 5,066,754 |
|
| Toridoll.corp S | 152,900 | 1,522,477 |
|
| Unipres Corp. | 204,700 | 4,564,983 |
|
| | | 153,499,183 |
| Mexico (0.6%) | | |
| Grupo Financiero Banorte SAB de CV | 724,600 | 5,358,766 |
|
| | | 5,358,766 |
| Netherlands (1.8%) | | |
| Aalberts Industries NV | 224,434 | 4,968,084 |
|
| Arcadis NV | 197,745 | 5,523,562 |
|
| Koninklijke Boskalis Westminster NV | 115,897 | 4,953,729 |
|
| | | 15,445,375 |
| Norway (2.4%) | | |
| DNO International ASA † | 1,113,863 | 1,998,368 |
|
| Fred Olsen Energy ASA | 97,400 | 4,229,499 |
|
| SpareBank 1 SR-Bank ASA | 615,119 | 4,945,429 |
|
| Subsea 7 SA | 192,353 | 4,547,558 |
|
| TGS-NOPEC Geophysical Co. ASA | 136,879 | 5,164,357 |
|
| | | 20,885,211 |
| |
| 20 | International Capital Opportunities Fund |
| | |
| COMMON STOCKS (96.1%)* cont. | Shares | Value |
|
| Russia (0.4%) | | |
| Oriflame Cosmetics SA SDR S | 90,329 | $3,117,360 |
|
| | | 3,117,360 |
| Singapore (1.0%) | | |
| Great Eastern Holdings, Ltd. | 219,000 | 3,180,580 |
|
| M1, Ltd. | 2,261,000 | 5,110,141 |
|
| | | 8,290,721 |
| South Korea (6.0%) | | |
| BS Financial Group, Inc. | 309,870 | 4,477,174 |
|
| Daelim Industrial Co., Ltd. | 40,484 | 3,593,932 |
|
| Daum Communications Corp. | 52,380 | 4,608,345 |
|
| DGB Financial Group, Inc. | 322,930 | 4,840,476 |
|
| Dong-A Pharmaceutical Co., Ltd. | 46,073 | 5,301,809 |
|
| Dongbu Insurance Co., Ltd. | 100,980 | 4,421,036 |
|
| GS Home Shopping, Inc. | 29,324 | 5,258,271 |
|
| Hyundai Marine & Fire Insurance Co., Ltd. | 142,870 | 4,144,971 |
|
| Hyundai Mipo Dockyard | 25,887 | 2,802,961 |
|
| LIG Insurance Co., Ltd. | 126,380 | 2,722,924 |
|
| S1 Corp. | 78,398 | 4,985,032 |
|
| Seah Besteel Corp. | 160,564 | 4,938,756 |
|
| | | 52,095,687 |
| Spain (0.5%) | | |
| Prosegur Compania de Securidad SA | 679,914 | 3,994,396 |
|
| | | 3,994,396 |
| Sweden (2.1%) | | |
| AF AB Class B | 176,081 | 5,047,648 |
|
| Boliden AB | 265,009 | 4,477,092 |
|
| Intrum Justita AB | 260,723 | 4,676,791 |
|
| JM AB S | 184,004 | 4,202,132 |
|
| | | 18,403,663 |
| Switzerland (6.8%) | | |
| Actelion, Ltd. | 100,064 | 5,151,068 |
|
| Aryzta AG | 90,604 | 5,207,335 |
|
| Baloise Holding AG | 48,296 | 4,328,297 |
|
| Banque Cantonale Vaudoise (BCV) | 7,736 | 4,403,576 |
|
| Barry Callebaut AG | 5,074 | 4,955,460 |
|
| Bucher Industries AG | 22,990 | 5,034,519 |
|
| Burckhardt Compression Holding AG | 12,103 | 4,364,533 |
|
| Dufry AG † | 33,987 | 4,633,031 |
|
| Forbo Holding AG | 6,703 | 4,399,470 |
|
| Georg Fischer AG | 11,517 | 5,205,204 |
|
| Partners Group Holding AG | 26,499 | 6,116,501 |
|
| Sika AG | 1,999 | 4,953,309 |
|
| | | 58,752,303 |
| Taiwan (0.7%) | | |
| Radiant Opto-Electronics Corp. | 666,543 | 2,407,502 |
|
| TSRC Corp. | 1,839,200 | 3,788,607 |
|
| | | 6,196,109 |
| Turkmenistan (0.5%) | | |
| Dragon Oil PLC | 501,544 | 4,691,648 |
|
| | | 4,691,648 |
| |
| International Capital Opportunities Fund | 21 |
| | |
| COMMON STOCKS (96.1%)* cont. | Shares | Value |
|
| United Kingdom (17.2%) | | |
| Aberdeen Asset Management PLC | 746,310 | $4,856,550 |
|
| Amlin PLC | 629,060 | 4,065,695 |
|
| Ashmore Group PLC | 796,845 | 4,331,561 |
|
| Aveva Group PLC | 126,315 | 4,414,397 |
|
| Barratt Developments PLC † | 1,370,007 | 4,978,746 |
|
| Berkeley Group Holdings PLC † | 171,421 | 4,943,338 |
|
| Bunzl PLC | 273,832 | 5,231,277 |
|
| Burberry Group PLC | 209,110 | 4,365,980 |
|
| Cape PLC | 821,156 | 2,894,937 |
|
| Close Brothers Group PLC | 295,213 | 4,675,968 |
|
| DS Smith PLC | 1,503,683 | 5,490,227 |
|
| Halma PLC | 579,575 | 4,328,160 |
|
| IMI PLC | 270,899 | 5,011,178 |
|
| Inchcape PLC | 611,468 | 4,690,943 |
|
| Interserve PLC | 728,372 | 5,449,831 |
|
| Intertek Group PLC | 96,632 | 4,895,766 |
|
| Meggitt PLC | 722,078 | 4,982,013 |
|
| Mitie Group PLC | 1,134,578 | 4,939,499 |
|
| Morgan Sindall Group PLC | 258,246 | 2,114,899 |
|
| Next PLC | 83,910 | 5,338,079 |
|
| Persimmon PLC | 327,253 | 4,530,701 |
|
| Provident Financial PLC | 133,948 | 2,971,336 |
|
| Rathbone Brothers PLC | 145,989 | 3,115,722 |
|
| Rotork PLC | 123,449 | 5,342,566 |
|
| Savills PLC | 675,657 | 5,430,979 |
|
| Schroders PLC | 164,453 | 4,971,494 |
|
| Spectris PLC | 142,721 | 5,143,365 |
|
| Speedy Hire PLC | 5,365,898 | 3,398,501 |
|
| Tate & Lyle PLC | 457,664 | 5,635,968 |
|
| UBM PLC | 418,242 | 4,912,845 |
|
| Ultra Electronics Holdings PLC | 103,917 | 2,662,722 |
|
| Whitbread PLC | 125,551 | 4,806,630 |
|
| William Hill PLC | 565,528 | 3,463,241 |
|
| | | 148,385,114 |
| United States (1.1%) | | |
| Amdocs, Ltd. | 134,692 | 4,912,217 |
|
| Aspen Insurance Holdings, Ltd. | 137,514 | 4,931,252 |
|
| | | 9,843,469 |
| | | |
| Total common stocks (cost $687,009,604) | | $827,884,692 |
|
| |
| U.S. TREASURY OBLIGATIONS (0.1%)* | Principal amount | Value |
|
| U.S. Treasury Notes 1/4s, April 30, 2014 i | $440,000 | $440,629 |
|
| U.S. Treasury Notes 1/4s, May 31, 2014 i | 220,000 | 220,262 |
|
| Total U.S. treasury obligations (cost $660,891) | | $660,891 |
| |
| 22 | International Capital Opportunities Fund |
| | | | |
| WARRANTS (—%)*† | Expiration | Strike | | |
| | date | price | Warrants | Value |
|
| Nieuwe Steen Investments NV (Netherlands) F | 4/1/13 | EUR 0.01 | 126,921 | $166 |
|
| Total warrants (cost $—) | | | | $166 |
| | |
| SHORT-TERM INVESTMENTS (11.9%)* | Principal amount/shares | Value |
|
| Putnam Cash Collateral Pool, LLC 0.21% d | 66,554,366 | $66,554,366 |
|
| Putnam Short Term Investment Fund 0.10% L | 32,967,027 | 32,967,027 |
|
| SSgA Prime Money Market Fund 0.08% P | 760,000 | 760,000 |
|
| U.S. Treasury Bills with an effective yield of 0.172%, | | |
| May 30, 2013 Δ | $491,000 | 490,871 |
|
| U.S. Treasury Bills with effective yields ranging from 0.182% | | |
| to 0.189%, May 2, 2013 Δ | 1,195,000 | 1,194,804 |
|
| U.S. Treasury Bills with effective yields ranging from 0.140% | | |
| to 0.147%, February 6, 2014 Δ | 613,000 | 612,113 |
|
| Total short-term investments (cost $102,578,954) | | $102,579,181 |
|
| |
| TOTAL INVESTMENTS | | |
|
| Total investments (cost $790,249,449) | | $931,124,930 |
| |
| Key to holding’s currency abbreviations |
| |
| EUR | Euro |
| |
| Key to holding’s abbreviations |
| |
| SDR | Swedish Depository Receipts: represents ownership of foreign securities on deposit with a custodian bank |
| | |
Notes to the fund’s portfolio
Unless noted otherwise, the notes to the fund’s portfolio are for the close of the fund’s reporting period, which ran from September 1, 2012 through February 28, 2013 (the reporting period). Within the following notes to the portfolio, references to “ASC 820” represent Accounting Standards Codification ASC 820 Fair Value Measurements and Disclosures and references to “OTC”, if any, represent over-the-counter.
* Percentages indicated are based on net assets of $861,125,318.
† Non-income-producing security.
Δ This security, in part or in entirety, was pledged and segregated with the custodian for collateral on certain derivative contracts at the close of the reporting period.
ΔΔ Security is restricted with regard to public resale. The total market value of this security and any other restricted securities (excluding 144A securities), if any, held at the close of the reporting period was less than $1, or less than 0.1% of net assets.
d Affiliated company. See Note 1 to the financial statements regarding securities lending. The rate quoted in the security description is the annualized 7-day yield of the fund at the close of the reporting period.
F Is valued at fair value following procedures approved by the Trustees. Securities may be classified as Level 2 or Level 3 for ASC 820 based on the securities’ valuation inputs. At the close of the reporting period, fair value pricing was also used for certain foreign securities in the portfolio (Note 1).
i Security was pledged, or purchased with cash that was pledged, to the fund for collateral on certain derivative contracts (Note 1).
L Affiliated company (Note 6). The rate quoted in the security description is the annualized 7-day yield of the fund at the close of the reporting period.
P Security was pledged, or purchased with cash that was pledged, to the fund for collateral on certain derivatives contracts. The rate quoted in the security description is the annualized 7-day yield of the fund at the close of the reporting period (Note 1).
| |
| International Capital Opportunities Fund | 23 |
R Real Estate Investment Trust.
S Security on loan, in part or in entirety, at the close of the reporting period (Note 1).
At the close of the reporting period, the fund maintained liquid assets totaling $2,561,511 to cover certain derivatives contracts.
Debt obligations are considered secured unless otherwise indicated.
The dates shown on debt obligations are the original maturity dates.
The fund had the following sector concentrations greater than 10% at the close of the reporting period (as a percentage of net assets):
| |
| Industrials | 23.2% |
| Financials | 19.0 |
| Consumer discretionary | 17.3 |
FORWARD CURRENCY CONTRACTS at 2/28/13 (aggregate face value $204,974,298) (Unaudited)
| | | | | | |
| | | | | | Unrealized |
| | Contract | Delivery | | Aggregate | appreciation/ |
| Counterparty | Currency | type | date | Value | face value | (depreciation) |
|
| Bank of America N.A. | | | | | | |
|
| | Australian Dollar | Buy | 4/17/13 | $2,117,226 | $2,154,632 | $(37,406) |
|
| | Euro | Buy | 3/20/13 | 3,567,954 | 3,731,352 | (163,398) |
|
| Barclays Bank PLC | | | | | | |
|
| | British Pound | Buy | 3/20/13 | 2,559,037 | 2,659,690 | (100,653) |
|
| | Canadian Dollar | Sell | 4/17/13 | 1,320,234 | 1,362,736 | 42,502 |
|
| | Euro | Buy | 3/20/13 | 8,138,815 | 8,507,956 | (369,141) |
|
| | Hong Kong Dollar | Sell | 5/15/13 | 9,456,187 | 9,459,975 | 3,788 |
|
| | Japanese Yen | Buy | 5/15/13 | 3,724,459 | 3,732,726 | (8,267) |
|
| | Singapore Dollar | Buy | 5/15/13 | 1,596,895 | 1,596,835 | 60 |
|
| | Swedish Krona | Buy | 3/20/13 | 11,793 | 12,073 | (280) |
|
| | Swiss Franc | Buy | 3/20/13 | 1,380,591 | 1,429,597 | (49,006) |
|
| Citibank, N.A. | | | | | | |
|
| | Australian Dollar | Buy | 4/17/13 | 4,123,179 | 4,196,106 | (72,927) |
|
| | British Pound | Buy | 3/20/13 | 506,802 | 526,592 | (19,790) |
|
| | Danish Krone | Sell | 3/20/13 | 9,334,105 | 9,713,373 | 379,268 |
|
| | Euro | Buy | 3/20/13 | 12,560,957 | 13,133,361 | (572,404) |
|
| | Singapore Dollar | Buy | 5/15/13 | 5,752,731 | 5,754,939 | (2,208) |
|
| Credit Suisse International | | | | | | |
|
| | Australian Dollar | Buy | 4/17/13 | 3,367,281 | 3,426,508 | (59,227) |
|
| | British Pound | Buy | 3/20/13 | 5,634,129 | 5,856,142 | (222,013) |
|
| | Canadian Dollar | Sell | 4/17/13 | 698,816 | 722,676 | 23,860 |
|
| | Euro | Buy | 3/20/13 | 8,810,466 | 9,209,733 | (399,267) |
|
| | Japanese Yen | Buy | 5/15/13 | 5,054,927 | 5,067,026 | (12,099) |
|
| | New Zealand Dollar | Buy | 4/17/13 | 1,560,502 | 1,594,823 | (34,321) |
|
| | Norwegian Krone | Sell | 3/20/13 | 5,220,574 | 5,472,802 | 252,228 |
|
| Deutsche Bank AG | | | | | | |
|
| | Australian Dollar | Buy | 4/17/13 | 3,297,342 | 3,355,274 | (57,932) |
|
| Euro | Buy | 3/20/13 | 16,065,975 | 16,728,002 | (662,027) |
|
| HSBC Bank USA, National Association | | | | | |
|
| Australian Dollar | Buy | 4/17/13 | 2,892,262 | 2,943,816 | (51,554) |
|
| Euro | Sell | 3/20/13 | 9,610,860 | 10,045,847 | 434,987 |
|
| Norwegian Krone | Sell | 3/20/13 | 6,397,769 | 6,706,689 | 308,920 |
|
| |
| 24 | International Capital Opportunities Fund |
FORWARD CURRENCY CONTRACTS at 2/28/13 (aggregate face value $204,974,298) (Unaudited) cont.
| | | | | | |
| | | | | | | Unrealized |
| | | Contract | Delivery | | Aggregate | appreciation/ |
| Counterparty | Currency | type | date | Value | face value | (depreciation) |
|
| JPMorgan Chase Bank N.A. | | | | | |
|
| | Australian Dollar | Buy | 4/17/13 | $1,807,537 | $1,839,507 | $(31,970) |
|
| | British Pound | Buy | 3/20/13 | 2,843,307 | 2,953,511 | (110,204) |
|
| | Euro | Buy | 3/20/13 | 33,034 | 34,523 | (1,489) |
|
| | Japanese Yen | Buy | 5/15/13 | 1,579,667 | 1,583,688 | (4,021) |
|
| State Street Bank and Trust Co. | | | | | |
|
| | Australian Dollar | Buy | 4/17/13 | 5,265,119 | 5,358,140 | (93,021) |
|
| | Canadian Dollar | Sell | 4/17/13 | 316,376 | 326,541 | 10,165 |
|
| | Euro | Buy | 3/20/13 | 6,535,416 | 6,831,233 | (295,817) |
|
| | Israeli Shekel | Buy | 4/17/13 | 4,536,957 | 4,553,942 | (16,985) |
|
| | Norwegian Krone | Sell | 3/20/13 | 3,333,954 | 3,495,420 | 161,466 |
|
| | Swedish Krona | Buy | 3/20/13 | 8,767,242 | 8,972,421 | (205,179) |
|
| UBS AG | | | | | | |
|
| | Australian Dollar | Buy | 4/17/13 | 4,262,244 | 4,336,919 | (74,675) |
|
| | British Pound | Buy | 3/20/13 | 2,770,799 | 2,879,487 | (108,688) |
|
| | Canadian Dollar | Sell | 4/17/13 | 2,996,462 | 3,038,668 | 42,206 |
|
| | Euro | Sell | 3/20/13 | 10,118,124 | 10,578,758 | 460,634 |
|
| | Norwegian Krone | Buy | 3/20/13 | 196,272 | 205,802 | (9,530) |
|
| WestPac Banking Corp. | | | | | |
|
| | Australian Dollar | Buy | 4/17/13 | 3,618,127 | 3,681,926 | (63,799) |
|
| | British Pound | Buy | 3/20/13 | 1,543,310 | 1,603,728 | (60,418) |
|
| | Euro | Sell | 3/20/13 | 3,441,562 | 3,598,803 | 157,241 |
|
| Total | | | | | | $(1,692,391) |
| |
| International Capital Opportunities Fund | 25 |
ASC 820 establishes a three-level hierarchy for disclosure of fair value measurements. The valuation hierarchy is based upon the transparency of inputs to the valuation of the fund’s investments. The three levels are defined as follows:
Level 1: Valuations based on quoted prices for identical securities in active markets.
Level 2: Valuations based on quoted prices in markets that are not active or for which all significant inputs are observable, either directly or indirectly.
Level 3: Valuations based on inputs that are unobservable and significant to the fair value measurement.
The following is a summary of the inputs used to value the fund’s net assets as of the close of the reporting period:
| | | |
| | | Valuation inputs | |
|
| Investments in securities: | Level 1 | Level 2 | Level 3 |
|
| Common stocks: | | | |
|
| Australia | $— | $28,932,601 | $— |
|
| Austria | — | 7,372,793 | — |
|
| Canada | 82,794,582 | — | — |
|
| China | — | 10,015,414 | — |
|
| Denmark | — | 18,850,168 | — |
|
| France | — | 33,850,939 | — |
|
| Germany | — | 68,757,514 | — |
|
| Hong Kong | — | 28,723,592 | — |
|
| Ireland | — | 20,291,266 | — |
|
| Italy | — | 19,336,818 | — |
|
| Japan | — | 153,499,183 | — |
|
| Mexico | 5,358,766 | — | — |
|
| Netherlands | — | 15,445,375 | — |
|
| Norway | — | 20,885,211 | — |
|
| Russia | — | 3,117,360 | — |
|
| Singapore | — | 8,290,721 | — |
|
| South Korea | — | 52,095,687 | — |
|
| Spain | — | 3,994,396 | — |
|
| Sweden | — | 18,403,663 | — |
|
| Switzerland | — | 58,752,303 | — |
|
| Taiwan | — | 6,196,109 | — |
|
| Turkmenistan | — | 4,691,648 | — |
|
| United Kingdom | — | 148,385,114 | — |
|
| United States | 9,843,469 | — | — |
|
| Total common stocks | 97,996,817 | 729,887,875 | — |
| | | | |
| Warrants | — | — | 166 |
|
| U.S. treasury obligations | — | 660,891 | — |
|
| Short-term investments | 33,727,027 | 68,852,154 | — |
|
| Totals by level | $131,723,844 | $799,400,920 | $166 |
| | | | | |
| | | Valuation inputs | |
|
| Other financial instruments: | Level 1 | Level 2 | Level 3 |
|
| Forward currency contracts | $— | $(1,692,391) | $— |
|
| Totals by level | $— | $(1,692,391) | $— |
At the start and close of the reporting period, Level 3 investments in securities were not considered a significant portion of the fund’s portfolio.
The accompanying notes are an integral part of these financial statements.
| |
| 26 | International Capital Opportunities Fund |
Statement of assets and liabilities 2/28/13 (Unaudited)
| |
| ASSETS | |
|
| Investment in securities, at value, including $59,913,545 of securities on loan (Note 1): | |
| Unaffiliated issuers (identified cost $690,728,056) | $831,603,537 |
| Affiliated issuers (identified cost $99,521,393) (Notes 1 and 6) | 99,521,393 |
|
| Cash | 687 |
|
| Foreign currency (cost $211,849) (Note 1) | 211,674 |
|
| Dividends, interest and other receivables | 989,360 |
|
| Foreign Tax reclaim | 292,344 |
|
| Receivable for shares of the fund sold | 651,900 |
|
| Receivable for investments sold | 1,407,171 |
|
| Unrealized appreciation on forward currency contracts (Note 1) | 2,277,325 |
|
| Total assets | 936,955,391 |
| |
| LIABILITIES | |
|
| Payable for shares of the fund repurchased | 2,095,961 |
|
| Payable for compensation of Manager (Note 2) | 538,919 |
|
| Payable for custodian fees (Note 2) | 81,602 |
|
| Payable for investor servicing fees (Note 2) | 403,476 |
|
| Payable for Trustee compensation and expenses (Note 2) | 225,275 |
|
| Payable for administrative services (Note 2) | 10,104 |
|
| Payable for distribution fees (Note 2) | 353,754 |
|
| Unrealized depreciation on forward currency contracts (Note 1) | 3,969,716 |
|
| Collateral on securities loaned, at value (Note 1) | 66,554,366 |
|
| Collateral on certain derivative contracts, at value (Note 1) | 1,420,891 |
|
| Other accrued expenses | 176,009 |
|
| Total liabilities | 75,830,073 |
| | |
| Net assets | $861,125,318 |
|
| |
| REPRESENTED BY | |
|
| Paid-in capital (Unlimited shares authorized) (Notes 1 and 4) | $912,129,611 |
|
| Undistributed net investment income (Note 1) | 618,732 |
|
| Accumulated net realized loss on investments and foreign currency transactions (Note 1) | (190,783,641) |
|
| Net unrealized appreciation of investments and assets and liabilities in foreign currencies | 139,160,616 |
|
| Total — Representing net assets applicable to capital shares outstanding | $861,125,318 |
(Continued on next page)
| |
| International Capital Opportunities Fund | 27 |
Statement of assets and liabilities (Continued)
| |
| COMPUTATION OF NET ASSET VALUE AND OFFERING PRICE | |
|
| Net asset value and redemption price per class A share | |
| ($603,468,651 divided by 17,603,157 shares) | $34.28 |
|
| Offering price per class A share (100/94.25 of $34.28)* | $36.37 |
|
| Net asset value and offering price per class B share ($20,392,181 divided by 596,979 shares)** | $34.16 |
|
| Net asset value and offering price per class C share ($40,314,432 divided by 1,181,440 shares)** | $34.12 |
|
| Net asset value and redemption price per class M share ($7,925,361 divided by 232,099 shares) | $34.15 |
|
| Offering price per class M share (100/96.50 of $34.15)* | $35.39 |
|
| Net asset value, offering price and redemption price per class R share | |
| ($67,467,546 divided by 1,997,362 shares) | $33.78 |
|
| Net asset value, offering price and redemption price per class Y share | |
| ($121,557,147 divided by 3,546,213 shares) | $34.28 |
|
* On single retail sales of less than $50,000. On sales of $50,000 or more the offering price is reduced.
** Redemption price per share is equal to net asset value less any applicable contingent deferred sales charge.
The accompanying notes are an integral part of these financial statements.
| |
| 28 | International Capital Opportunities Fund |
Statement of operations Six months ended 2/28/13 (Unaudited)
| |
| INVESTMENT INCOME | |
|
| Dividends (net of foreign tax of $612,816) | $6,371,943 |
|
| Interest (including interest income of $15,416 from investments in affiliated issuers) (Note 6) | 15,701 |
|
| Securities lending (Note 1) | 197,919 |
|
| Total investment income | 6,585,563 |
| |
| EXPENSES | |
|
| Compensation of Manager (Note 2) | 3,539,632 |
|
| Investor servicing fees (Note 2) | 1,211,386 |
|
| Custodian fees (Note 2) | 81,388 |
|
| Trustee compensation and expenses (Note 2) | 42,951 |
|
| Distribution fees (Note 2) | 1,266,221 |
|
| Administrative services (Note 2) | 14,475 |
|
| Other | 167,900 |
|
| Total expenses | 6,323,953 |
| | |
| Expense reduction (Note 2) | (741) |
|
| Net expenses | 6,323,212 |
| | |
| Net investment income | 262,351 |
|
| |
| Net realized gain on investments (Notes 1 and 3) | 52,099,093 |
|
| Net realized loss on foreign currency transactions (Note 1) | (1,096,057) |
|
| Net unrealized depreciation of assets and liabilities in foreign currencies during the period | (1,100,207) |
|
| Net unrealized appreciation of investments during the period | 64,967,192 |
|
| Net gain on investments | 114,870,021 |
| | |
| Net increase in net assets resulting from operations | $115,132,372 |
|
The accompanying notes are an integral part of these financial statements.
| |
| International Capital Opportunities Fund | 29 |
Statement of changes in net assets
| | |
| INCREASE (DECREASE) IN NET ASSETS | Six months ended 2/28/13* | Year ended 8/31/12 |
|
| Operations: | | |
| Net investment income | $262,351 | $13,889,231 |
|
| Net realized gain (loss) on investments | | |
| and foreign currency transactions | 51,003,036 | (30,508,623) |
|
| Net unrealized appreciation (depreciation) of investments | | |
| and assets and liabilities in foreign currencies | 63,866,985 | (28,199,676) |
|
| Net increase (decrease) in net assets resulting | | |
| from operations | 115,132,372 | (44,819,068) |
|
| Distributions to shareholders (Note 1): | | |
| From ordinary income | | |
| Net investment income | | |
|
| Class A | (6,926,613) | (19,036,576) |
|
| Class B | (69,775) | (475,307) |
|
| Class C | (154,638) | (917,269) |
|
| Class M | (53,011) | (184,024) |
|
| Class R | (583,768) | (3,324,589) |
|
| Class Y | (1,687,227) | (3,309,906) |
|
| Increase in capital from settlement payments | — | 238,808 |
|
| Redemption fees (Note 1) | 7,214 | 43,529 |
|
| Decrease from capital share transactions (Note 4) | (92,040,763) | (152,697,470) |
|
| Total increase (decrease) in net assets | 13,623,791 | (224,481,872) |
| |
| NET ASSETS | | |
|
| Beginning of period | 847,501,527 | 1,071,983,399 |
|
| End of period (including undistributed net investment | | |
| income of $618,732 and $9,831,413, respectively) | $861,125,318 | $847,501,527 |
|
* Unaudited
The accompanying notes are an integral part of these financial statements.
| |
| 30 | International Capital Opportunities Fund |
|
| This page left blank intentionally. |
| |
| International Capital Opportunities Fund | 31 |
Financial highlights (For a common share outstanding throughout the period)
| | | | | | | | | | | | | | | |
| INVESTMENT OPERATIONS: | | LESS DISTRIBUTIONS: | | RATIOS AND SUPPLEMENTAL DATA: |
|
| | | | | | | | | | | | | | | Ratio | |
| | Net asset | | Net realized | | | | | | | | | | Ratio | of net investment | |
| | value, | | and unrealized | Total from | From | From | | | | | Total return | Net assets, | of expenses | income (loss) | |
| | beginning | Net investment | gain (loss) | investment | net investment | net realized gain | Total | Redemption | Non-recurring | Net asset value, | at net asset | end of period | to average | to average | Portfolio |
| Period ended | of period | income (loss) a | on investments | operations | income | on investments | distributions | fees b | reimbursements | end of period | value (%) c | (in thousands) | net assets (%) d | net assets (%) | turnover (%) |
|
| Class A | | | | | | | | | | | | | | | |
| February 28, 2013** | $30.33 | .02 | 4.32 | 4.34 | (.39) | — | (.39) | — | — | $34.28 | 14.36* | $603,469 | .71* | .05* | 24* |
| August 31, 2012 | 32.47 | .47 | (1.75) | (1.28) | (.87) | — | (.87) | — | .01 e | 30.33 | (3.57) | 578,024 | 1.41 | 1.58 | 34 |
| August 31, 2011 | 28.17 | .33 | 4.14 | 4.47 | (.30) | — | (.30) | — | .13 f,g | 32.47 | 16.26 | 754,251 | 1.47 | .95 | 23 |
| August 31, 2010 | 28.69 | .20 | (.61) | (.41) | (.12) | — | (.12) | — | .01 h | 28.17 | (1.43) | 793,406 | 1.64 i | .66 | 27 |
| August 31, 2009 | 32.09 | .39 | (3.35) | (2.96) | (.47) | — | (.47) | — | .03 j,k | 28.69 | (8.33) | 874,265 | 1.64 i,l | 1.78 l | 84 |
| August 31, 2008 | 41.54 | .63 | (8.27) | (7.64) | (1.50) | (.31) | (1.81) | — | — | 32.09 | (19.01) | 1,259,641 | 1.47 l | 1.68 l | 41 |
|
| Class B | | | | | | | | | | | | | | | |
| February 28, 2013** | $30.09 | (.10) | 4.28 | 4.18 | (.11) | — | (.11) | — | — | $34.16 | 13.92* | $20,392 | 1.08* | (.32)* | 24* |
| August 31, 2012 | 32.08 | .24 | (1.68) | (1.44) | (.56) | — | (.56) | — | .01 e | 30.09 | (4.27) | 20,546 | 2.16 | .81 | 34 |
| August 31, 2011 | 27.80 | .05 | 4.10 | 4.15 | — | — | — | — | .13 f,g | 32.08 | 15.40 | 30,517 | 2.22 | .15 | 23 |
| August 31, 2010 | 28.42 | (.06) | (.57) | (.63) | — | — | — | — | .01 h | 27.80 | (2.18) | 41,441 | 2.39 i | (.19) | 27 |
| August 31, 2009 | 31.30 | .22 | (3.10) | (2.88) | (.03) | — | (.03) | — | .03 j,k | 28.42 | (9.04) | 72,873 | 2.39 i,l | 1.04 l | 84 |
| August 31, 2008 | 40.45 | .27 | (7.99) | (7.72) | (1.12) | (.31) | (1.43) | — | — | 31.30 | (19.61) | 166,262 | 2.22 l | .74 l | 41 |
|
| Class C | | | | | | | | | | | | | | | |
| February 28, 2013** | $30.07 | (.10) | 4.28 | 4.18 | (.13) | — | (.13) | — | — | $34.12 | 13.92* | $40,314 | 1.08* | (.32)* | 24* |
| August 31, 2012 | 32.11 | .24 | (1.70) | (1.46) | (.59) | — | (.59) | — | .01 e | 30.07 | (4.30) | 38,301 | 2.16 | .81 | 34 |
| August 31, 2011 | 27.87 | .07 | 4.09 | 4.16 | (.05) | — | (.05) | — | .13 f,g | 32.11 | 15.38 | 53,823 | 2.22 | .20 | 23 |
| August 31, 2010 | 28.48 | (.03) | (.59) | (.62) | — | — | — | — | .01 h | 27.87 | (2.14) | 55,847 | 2.39 i | (.10) | 27 |
| August 31, 2009 | 31.61 | .22 | (3.20) | (2.98) | (.18) | — | (.18) | — | .03 j,k | 28.48 | (9.02) | 62,683 | 2.39 i,l | 1.02 l | 84 |
| August 31, 2008 | 40.96 | .33 | (8.14) | (7.81) | (1.23) | (.31) | (1.54) | — | — | 31.61 | (19.63) | 99,261 | 2.22 l | .89 l | 41 |
|
| Class M | | | | | | | | | | | | | | | |
| February 28, 2013** | $30.14 | (.06) | 4.30 | 4.24 | (.23) | — | (.23) | — | — | $34.15 | 14.09* | $7,925 | .96* | (.20)* | 24* |
| August 31, 2012 | 32.22 | .32 | (1.72) | (1.40) | (.69) | — | (.69) | — | .01 e | 30.14 | (4.06) | 7,397 | 1.91 | 1.09 | 34 |
| August 31, 2011 | 27.95 | .16 | 4.11 | 4.27 | (.13) | — | (.13) | — | .13 f,g | 32.22 | 15.71 | 9,013 | 1.97 | .46 | 23 |
| August 31, 2010 | 28.50 | .04 | (.60) | (.56) | — | — | — | — | .01 h | 27.95 | (1.93) | 9,345 | 2.14 i | .15 | 27 |
| August 31, 2009 | 31.66 | .28 | (3.23) | (2.95) | (.24) | — | (.24) | — | .03 j,k | 28.50 | (8.79) | 10,957 | 2.14 i,l | 1.28 l | 84 |
| August 31, 2008 | 40.97 | .40 | (8.12) | (7.72) | (1.28) | (.31) | (1.59) | — | — | 31.66 | (19.40) | 17,334 | 1.97 l | 1.08 l | 41 |
|
| Class R | | | | | | | | | | | | | | | |
| February 28, 2013** | $29.81 | (.01) | 4.23 | 4.22 | (.25) | — | (.25) | — | — | $33.78 | 14.21* | $67,468 | .83* | (.02)* | 24* |
| August 31, 2012 | 31.95 | .38 | (1.70) | (1.32) | (.83) | — | (.83) | — | .01 e | 29.81 | (3.78) | 98,121 | 1.66 | 1.30 | 34 |
| August 31, 2011 | 27.73 | .26 | 4.06 | 4.32 | (.23) | — | (.23) | — | .13 f,g | 31.95 | 15.99 | 107,047 | 1.72 | .76 | 23 |
| August 31, 2010 | 28.29 | .15 | (.63) | (.48) | (.09) | — | (.09) | — | .01 h | 27.73 | (1.67) | 85,829 | 1.89 i | .51 | 27 |
| August 31, 2009 | 31.72 | .31 | (3.31) | (3.00) | (.46) | — | (.46) | — | .03 j,k | 28.29 | (8.55) | 58,878 | 1.89 i,l | 1.42 l | 84 |
| August 31, 2008 | 41.17 | .58 | (8.23) | (7.65) | (1.49) | (.31) | (1.80) | — | — | 31.72 | (19.21) | 23,843 | 1.72 l | 1.59 l | 41 |
|
| Class Y | | | | | | | | | | | | | | | |
| February 28, 2013** | $30.37 | .05 | 4.33 | 4.38 | (.47) | — | (.47) | — | — | $34.28 | 14.50* | $121,557 | .59* | .16* | 24* |
| August 31, 2012 | 32.54 | .55 | (1.76) | (1.21) | (.97) | — | (.97) | — | .01 e | 30.37 | (3.33) | 105,113 | 1.16 | 1.84 | 34 |
| August 31, 2011 | 28.22 | .44 | 4.13 | 4.57 | (.38) | — | (.38) | — | .13 f,g | 32.54 | 16.58 | 117,332 | 1.22 | 1.27 | 23 |
| August 31, 2010 | 28.73 | .29 | (.63) | (.34) | (.18) | — | (.18) | — | .01 h | 28.22 | (1.19) | 117,828 | 1.39 i | .97 | 27 |
| August 31, 2009 | 32.21 | .43 | (3.38) | (2.95) | (.56) | — | (.56) | — | .03 j,k | 28.73 | (8.11) | 105,588 | 1.39 i,l | 2.00 l | 84 |
| August 31, 2008 | 41.69 | .72 | (8.30) | (7.58) | (1.59) | (.31) | (1.90) | — | — | 32.21 | (18.82) | 117,703 | 1.22 l | 1.93 l | 41 |
|
See notes to financial highlights at the end of this section.
The accompanying notes are an integral part of these financial statements.
| | | |
| 32 | International Capital Opportunities Fund | International Capital Opportunities Fund | 33 |
Financial highlights (Continued)
* Not annualized.
** Unaudited.
a Per share net investment income (loss) has been determined on the basis of the weighted average number of shares outstanding during the period.
b Amount represents less than $0.01 per share.
c Total return assumes dividend reinvestment and does not reflect the effect of sales charges.
d Includes amounts paid through expense offset and brokerage/service arrangements (Note 2).
e Reflects a non-recurring reimbursement pursuant to a settlement between the Securities and Exchange Commission (the SEC) and Canadian Imperial Holdings, Inc. and CIBC World Markets Corp., which amounted to $0.01 per share outstanding as of November 29, 2011.
f Reflects a non-recurring reimbursement related to restitution amounts in connection with a distribution plan approved by the SEC which amounted $0.12 per share outstanding on July 21, 2011. Also reflects a non-recurring reimbursement related to short-term trading related lawsuits, which amounted $0.01 per share outstanding as of May 11, 2011.
g Reflects a non-recurring reimbursement pursuant to a settlement between the SEC and Zurich Capital Markets, Inc., which amounted to less than $0.01 per share outstanding as of December 21, 2010.
h Reflects a non-recurring reimbursement pursuant to a settlement between the SEC and Prudential Securities, Inc., which amounted to $0.01 per share outstanding as of March 30, 2010.
i Includes interest accrued in connection with certain terminated derivatives contracts, which amounted to less than 0.01% of average net assets as of August 31, 2010 and August 31, 2009.
j Reflects a non-recurring reimbursement pursuant to a settlement between the SEC and Bear, Stearns & Co., Inc. and Bear Stearns Securities Corp., which amounted to $0.02 per share outstanding as of May 21, 2009.
k Reflects a non-recurring reimbursement pursuant to a settlement between the SEC and Millennium Partners, L.P., Millennium Management, L.L.C., and Millennium International Management, L.L.C., which amounted to $0.01 per share outstanding as of June 23, 2009.
l Reflects an involuntary contractual expense limitation and/or waivers of certain fund expenses in connection with investments in Putnam Prime Money Market Fund in effect during the period. As a result of such limitation and/or waivers, the expenses of each class reflect a reduction of the following amounts:
| |
| | Percentage of |
| | average net assets |
|
| August 31, 2009 | 0.07% |
|
| August 31, 2008 | <0.01 |
|
The accompanying notes are an integral part of these financial statements.
| |
| 34 | International Capital Opportunities Fund |
Notes to financial statements 2/28/13 (Unaudited)
Within the following Notes to financial statements, references to “State Street” represent State Street Bank and Trust Company, references to “the SEC” represent the Securities and Exchange Commission, references to “Putnam Management” represent Putnam Investment Management, LLC, the fund’s manager, an indirect wholly-owned subsidiary of Putnam Investments, LLC and references to “OTC”, if any, represent over-the-counter. Unless otherwise noted, the “reporting period” represents the period from September 1, 2012 through February 28, 2013.
Putnam International Capital Opportunities Fund (the fund) is a diversified series of Putnam Investment Funds (the Trust), a Massachusetts business trust registered under the Investment Company Act of 1940, as amended, as an open-end management investment company. The investment objective of the fund is to seek long-term capital appreciation by investing primarily in common stocks (growth or value stocks or both) of small and midsize companies outside the United States that Putnam Management believes have favorable investment potential. The fund invests mainly in developed countries, but may invest in emerging markets.
The fund offers class A, class B, class C, class M, class R, and class Y shares. Class A and class M shares are sold with a maximum front-end sales charge of 5.75% and 3.50%, respectively, and generally do not pay a contingent deferred sales charge. Class B shares, which convert to class A shares after approximately eight years, do not pay a front-end sales charge and are subject to a contingent deferred sales charge if those shares are redeemed within six years of purchase. Class C shares have a one-year 1.00% contingent deferred sales charge and do not convert to class A shares. Class R shares, which are not available to all investors, are sold at net asset value. The expenses for class A, class B, class C, class M and class R shares may differ based on the distribution fee of each class, which is identified in Note 2. Class Y shares, which are sold at net asset value, are generally subject to the same expenses as class A, class B, class C, class M and class R shares, but do not bear a distribution fee. Class Y shares are not available to all investors.
In the normal course of business, the fund enters into contracts that may include agreements to indemnify another party under given circumstances. The fund’s maximum exposure under these arrangements is unknown as this would involve future claims that may be, but have not yet been, made against the fund. However, the fund’s management team expects the risk of material loss to be remote.
Note 1: Significant accounting policies
The following is a summary of significant accounting policies consistently followed by the fund in the preparation of its financial statements. The preparation of financial statements is in conformity with accounting principles generally accepted in the United States of America and requires management to make estimates and assumptions that affect the reported amounts of assets and liabilities in the financial statements and the reported amounts of increases and decreases in net assets from operations. Actual results could differ from those estimates. Subsequent events after the Statement of assets and liabilities date through the date that the financial statements were issued have been evaluated in the preparation of the financial statements.
A 1.00% redemption fee may apply on shares that are redeemed (either by selling or exchanging into another fund) within 90 days of purchase. The redemption fee is accounted for as an addition to paid-in-capital.
Investment income, realized and unrealized gains and losses and expenses of the fund are borne pro-rata based on the relative net assets of each class to the total net assets of the fund, except that each class bears expenses unique to that class (including the distribution fees applicable to such classes). Each class votes as a class only with respect to its own distribution plan or other matters on which a class vote is required by law or determined by the Trustees. If the fund were liquidated, shares of each class would receive their pro-rata share of the net assets of the fund. In addition, the Trustees declare separate dividends on each class of shares.
Security valuation Investments for which market quotations are readily available are valued at the last reported sales price on their principal exchange, or official closing price for certain markets, and are classified as Level 1 securities under Accounting Standards Codification ASC 820 Fair Value Measurements and Disclosures (ASC 820). If no sales are reported, as in the case of some securities that are traded OTC, a security is valued at its last reported bid price and is generally categorized as a Level 2 security.
Investments in open-end investment companies (excluding exchange traded funds), if any, which can be classified as Level 1 or Level 2 securities, are based on their net asset value. The net asset value of such investment companies equals the total value of their assets less their liabilities and divided by the number of their outstanding shares.
| |
| International Capital Opportunities Fund | 35 |
Market quotations are not considered to be readily available for certain debt obligations and other investments; such investments are valued on the basis of valuations furnished by an independent pricing service approved by the Trustees or dealers selected by Putnam Management. Such services or dealers determine valuations for normal institutional-size trading units of such securities using methods based on market transactions for comparable securities and various relationships, generally recognized by institutional traders, between securities (which considers such factors as security prices, yields, maturities and ratings). These securities will generally be categorized as Level 2.
Many securities markets and exchanges outside the U.S. close prior to the close of the New York Stock Exchange and therefore the closing prices for securities in such markets or on such exchanges may not fully reflect events that occur after such close but before the close of the New York Stock Exchange. Accordingly, on certain days, the fund will fair value foreign equity securities taking into account multiple factors including movements in the U.S. securities markets, currency valuations and comparisons to the valuation of American Depository Receipts, exchange-traded funds and futures contracts. These securities, which would generally be classified as Level 1 securities, will be transferred to Level 2 of the fair value hierarchy when they are valued at fair value. The number of days on which fair value prices will be used will depend on market activity and it is possible that fair value prices will be used by the fund to a significant extent. At the close of the reporting period, fair value pricing was used for certain foreign securities in the portfolio. Securities quoted in foreign currencies, if any, are translated into U.S. dollars at the current exchange rate.
To the extent a pricing service or dealer is unable to value a security or provides a valuation that Putnam Management does not believe accurately reflects the security’s fair value, the security will be valued at fair value by Putnam Management. Certain investments, including certain restricted and illiquid securities and derivatives, are also valued at fair value following procedures approved by the Trustees. These valuations consider such factors as significant market or specific security events such as interest rate or credit quality changes, various relationships with other securities, discount rates, U.S. Treasury, U.S. swap and credit yields, index levels, convexity exposures and recovery rates. These securities are classified as Level 2 or as Level 3 depending on the priority of the significant inputs.
Such valuations and procedures are reviewed periodically by the Trustees. The fair value of securities is generally determined as the amount that the fund could reasonably expect to realize from an orderly disposition of such securities over a reasonable period of time. By its nature, a fair value price is a good faith estimate of the value of a security in a current sale and does not reflect an actual market price, which may be different by a material amount.
Security transactions and related investment income Security transactions are recorded on the trade date (the date the order to buy or sell is executed). Gains or losses on securities sold are determined on the identified cost basis.
Interest income, net of any applicable withholding taxes, is recorded on the accrual basis. Dividend income, net of any applicable withholding taxes, is recognized on the ex-dividend date except that certain dividends from foreign securities, if any, are recognized as soon as the fund is informed of the ex-dividend date. Non-cash dividends, if any, are recorded at the fair market value of the securities received. Dividends representing a return of capital or capital gains, if any, are reflected as a reduction of cost and/or as a realized gain. All premiums/discounts are amortized/ accreted on a yield-to-maturity basis.
Foreign currency translation The accounting records of the fund are maintained in U.S. dollars. The market value of foreign securities, currency holdings, and other assets and liabilities is recorded in the books and records of the fund after translation to U.S. dollars based on the exchange rates on that day. The cost of each security is determined using historical exchange rates. Income and withholding taxes are translated at prevailing exchange rates when earned or incurred. The fund does not isolate that portion of realized or unrealized gains or losses resulting from changes in the foreign exchange rate on investments from fluctuations arising from changes in the market prices of the securities. Such gains and losses are included with the net realized and unrealized gain or loss on investments. Net realized gains and losses on foreign currency transactions represent net realized exchange gains or losses on closed forward currency contracts, disposition of foreign currencies, currency gains and losses realized between the trade and settlement dates on securities transactions and the difference between the amount of investment income and foreign withholding taxes recorded on the fund’s books and the U.S. dollar equivalent amounts actually received or paid. Net unrealized appreciation and depreciation of assets and liabilities in foreign currencies arise from changes in the value of open forward currency contracts and assets and liabilities other than investments at the period end, resulting from changes in the exchange rate.
| |
| 36 | International Capital Opportunities Fund |
Forward currency contracts The fund buys and sells forward currency contracts, which are agreements between two parties to buy and sell currencies at a set price on a future date. These contracts are used to hedge foreign exchange risk.
The U.S. dollar value of forward currency contracts is determined using current forward currency exchange rates supplied by a quotation service. The market value of the contract will fluctuate with changes in currency exchange rates. The contract is marked to market daily and the change in market value is recorded as an unrealized gain or loss. The fund records a realized gain or loss equal to the difference between the value of the contract at the time it was opened and the value at the time it was closed when the contract matures or by delivery of the currency. The fund could be exposed to risk if the value of the currency changes unfavorably, if the counterparties to the contracts are unable to meet the terms of their contracts or if the fund is unable to enter into a closing position. Risks may exceed amounts recognized on the Statement of assets and liabilities.
Forward currency contracts outstanding at period end, if any, are listed after the fund’s portfolio. For the fund’s average contract amount, see Note 5.
Master agreements The fund is a party to ISDA (International Swaps and Derivatives Association, Inc.) Master Agreements (Master Agreements) with certain counterparties that govern OTC derivative and foreign exchange contracts entered into from time to time. The Master Agreements may contain provisions regarding, among other things, the parties’ general obligations, representations, agreements, collateral requirements, events of default and early termination. With respect to certain counterparties, in accordance with the terms of the Master Agreements, collateral posted to the fund is held in a segregated account by the fund’s custodian and with respect to those amounts which can be sold or repledged, are presented in the fund’s portfolio. Collateral posted to the fund which cannot be sold or repledged totaled $245,370 at the close of the reporting period.
Collateral pledged by the fund is segregated by the fund’s custodian and identified in the fund’s portfolio. Collateral can be in the form of cash or debt securities issued by the U.S. Government or related agencies or other securities as agreed to by the fund and the applicable counterparty. Collateral requirements are determined based on the fund’s net position with each counterparty.
Termination events applicable to the fund may occur upon a decline in the fund’s net assets below a specified threshold over a certain period of time. Termination events applicable to counterparties may occur upon a decline in the counterparty’s long-term and short-term credit ratings below a specified level. In each case, upon occurrence, the other party may elect to terminate early and cause settlement of all derivative and foreign exchange contracts outstanding, including the payment of any losses and costs resulting from such early termination, as reasonably determined by the terminating party. Any decision by one or more of the fund’s counterparties to elect early termination could impact the fund’s future derivative activity.
At the close of the reporting period, the fund had a net liability position of $2,727,715 on open derivative contracts subject to the Master Agreements. Collateral posted by the fund for these agreements totaled $2,030,809.
Securities lending The fund may lend securities, through its agent, to qualified borrowers in order to earn additional income. The loans are collateralized by cash in an amount at least equal to the market value of the securities loaned. The market value of securities loaned is determined daily and any additional required collateral is allocated to the fund on the next business day. The risk of borrower default will be borne by the fund’s agent; the fund will bear the risk of loss with respect to the investment of the cash collateral. Income from securities lending is included in investment income on the Statement of operations. Cash collateral is invested in Putnam Cash Collateral Pool, LLC, a limited liability company managed by an affiliate of Putnam Management. Investments in Putnam Cash Collateral Pool, LLC are valued at its closing net asset value each business day. There are no management fees charged to Putnam Cash Collateral Pool, LLC. At the close of the reporting period, the value of securities loaned amounted to $63,326,214 which includes an amount for securities that are deemed worthless at period end. Certain of these securities were sold prior to the close of the reporting period and are included in Receivable for investments sold on the Statement of assets and liabilities. The fund received cash collateral of $66,554,366.
Interfund lending The fund, along with other Putnam funds, may participate in an interfund lending program pursuant to an exemptive order issued by the SEC. This program allows the fund to borrow from or lend to other Putnam funds that permit such transactions. Interfund lending transactions are subject to each fund’s investment policies and borrowing and lending limits. Interest earned or paid on the interfund lending transaction will be based on the average of certain current market rates. During the reporting period, the fund did not utilize the program.
Line of credit The fund participates, along with other Putnam funds, in a $315 million unsecured committed line of credit and a $185 million unsecured uncommitted line of credit, both provided by State Street. Borrowings may be
| |
| International Capital Opportunities Fund | 37 |
made for temporary or emergency purposes, including the funding of shareholder redemption requests and trade settlements. Interest is charged to the fund based on the fund’s borrowing at a rate equal to the Federal Funds rate plus 1.25% for the committed line of credit and the Federal Funds rate plus 1.30% for the uncommitted line of credit. A closing fee equal to 0.02% of the committed line of credit and $50,000 for the uncommitted line of credit has been paid by the participating funds. In addition, a commitment fee of 0.11% per annum on any unutilized portion of the committed line of credit is allocated to the participating funds based on their relative net assets and paid quarterly. During the reporting period, the fund had no borrowings against these arrangements.
Federal taxes It is the policy of the fund to distribute all of its taxable income within the prescribed time period and otherwise comply with the provisions of the Internal Revenue Code of 1986, as amended (the Code), applicable to regulated investment companies. It is also the intention of the fund to distribute an amount sufficient to avoid imposition of any excise tax under Section 4982 of the Code.
The fund is subject to the provisions of Accounting Standards Codification ASC 740 Income Taxes (ASC 740). ASC 740 sets forth a minimum threshold for financial statement recognition of the benefit of a tax position taken or expected to be taken in a tax return. The fund did not have a liability to record for any unrecognized tax benefits in the accompanying financial statements. No provision has been made for federal taxes on income, capital gains or unrealized appreciation on securities held nor for excise tax on income and capital gains. Each of the fund’s federal tax returns for the prior three fiscal years remains subject to examination by the Internal Revenue Service.
The fund may also be subject to taxes imposed by governments of countries in which it invests. Such taxes are generally based on either income or gains earned or repatriated. The fund accrues and applies such taxes to net investment income, net realized gains and net unrealized gains as income and/or capital gains are earned. In some cases, the fund may be entitled to reclaim all or a portion of such taxes, and such reclaim amounts, if any, are reflected as an asset on the fund’s books. In many cases, however, the fund may not receive such amounts for an extended period of time, depending on the country of investment.
At August 31, 2012, the fund had a capital loss carryover of $226,111,749 available to the extent allowed by the Code to offset future net capital gain, if any. The amounts of the carryovers and the expiration dates are:
| | | |
| | Loss carryover | |
|
| Short-term | Long-term | Total | Expiration |
|
| $521,234 | $15,850,801 | $16,372,035 | * |
|
| 123,465,164 | N/A | 123,465,164 | August 31, 2017 |
|
| 86,274,550 | N/A | 86,274,550 | August 31, 2018 |
|
* Under the Regulated Investment Company Modernization Act of 2010, the fund will be permitted to carry forward capital losses incurred in taxable years beginning after December 22, 2010 for an unlimited period. However, any losses incurred will be required to be utilized prior to the losses incurred in pre-enactment tax years. As a result of this ordering rule, pre-enactment capital loss carryforwards may be more likely to expire unused. Additionally, post-enactment capital losses that are carried forward will retain their character as either short-term or long-term capital losses rather than being considered all short-term as under previous law.
Pursuant to federal income tax regulations applicable to regulated investment companies, the fund has elected to defer certain capital losses of $10,760,109 recognized during the period between November 1, 2011 and August 31, 2012 to its fiscal year ending August 31, 2013.
The aggregate identified cost on a tax basis is $795,164,268, resulting in gross unrealized appreciation and depreciation of $173,991,095 and $38,030,433, respectively, or net unrealized appreciation of $135,960,662.
Distributions to shareholders Distributions to shareholders from net investment income are recorded by the fund on the ex-dividend date. Distributions from capital gains, if any, are recorded on the ex-dividend date and paid at least annually. The amount and character of income and gains to be distributed are determined in accordance with income tax regulations, which may differ from generally accepted accounting principles. Dividend sources are estimated at the time of declaration. Actual results may vary. Any non-taxable return of capital cannot be determined until final tax calculations are completed after the end of the fund’s fiscal year. Reclassifications are made to the fund’s capital accounts to reflect income and gains available for distribution (or available capital loss carryovers) under income tax regulations.
| |
| 38 | International Capital Opportunities Fund |
Expenses of the Trust Expenses directly charged or attributable to any fund will be paid from the assets of that fund. Generally, expenses of the Trust will be allocated among and charged to the assets of each fund on a basis that the Trustees deem fair and equitable, which may be based on the relative assets of each fund or the nature of the services performed and relative applicability to each fund.
Note 2: Management fee, administrative services and other transactions
The fund pays Putnam Management a management fee (base fee) (based on the fund’s average net assets and computed and paid monthly) at annual rates that may vary based on the average of the aggregate net assets of most open-end funds, as defined in the fund’s management contract, sponsored by Putnam Management. Such annual rates may vary as follows:
| | | | |
| 1.080% | of the first $5 billion, | | 0.880% | of the next $50 billion, |
| |
|
| 1.030% | of the next $5 billion, | | 0.860% | of the next $50 billion, |
| |
|
| 0.980% | of the next $10 billion, | | 0.850% | of the next $100 billion and |
| |
|
| 0.930% | of the next $10 billion, | | 0.845% | of any excess thereafter. |
| |
|
In addition, beginning with January 2011, the monthly management fee consists of the monthly base fee plus or minus a performance adjustment for the month. The performance adjustment is determined based on performance over the thirty-six month period then ended. Each month, the performance adjustment is calculated by multiplying the performance adjustment rate and the fund’s average net assets over the performance period and the result is divided by twelve. The resulting dollar amount is added to, or subtracted from the base fee for that month. The performance adjustment rate is equal to 0.03 multiplied by the difference between the fund’s annualized performance (measured by the fund’s class A shares) and the annualized performance of the S&P Developed/Ex-U.S. SmallCap Index, each measured over the performance period. The maximum annualized performance adjustment rates are +/– 0.21%. The monthly base fee is determined based on the fund’s average net assets for the month, while the performance adjustment is determined based on the fund’s average net assets over the performance period of up to thirty-six months. This means it is possible that, if the fund underperforms significantly over the performance period, and the fund’s assets have declined significantly over that period, the negative performance adjustment may exceed the base fee. In this event, Putnam Management would make a payment to the fund.
Because the performance adjustment is based on the fund’s performance relative to its applicable benchmark index, and not its absolute performance, the performance adjustment could increase Putnam Management’s fee even if the fund’s shares lose value during the performance period provided that the fund outperformed its benchmark index, and could decrease Putnam Management’s fee even if the fund’s shares increase in value during the performance period provided that the fund underperformed its benchmark index.
For the reporting period, the base fee represented an effective rate (excluding the impact from any expense waivers in effect) of 0.463% of the fund’s average net assets before a decrease of $454,969 (0.053% of the fund’s average net assets) based on performance.
Putnam Management has contractually agreed, through June 30, 2013, to waive fees or reimburse the fund’s expenses to the extent necessary to limit the cumulative expenses of the fund, exclusive of brokerage, interest, taxes, investment-related expenses, extraordinary expenses, acquired fund fees and expenses and payments under the fund’s investor servicing contract, investment management contract and distribution plans, on a fiscal year-to-date basis to an annual rate of 0.20% of the fund’s average net assets over such fiscal year-to-date period. During the reporting period, the fund’s expenses were not reduced as a result of this limit.
Putnam Investments Limited (PIL), an affiliate of Putnam Management, is authorized by the Trustees to manage a separate portion of the assets of the fund as determined by Putnam Management from time to time. Putnam Management pays a quarterly sub-management fee to PIL for its services at an annual rate of 0.35% of the average net assets of the portion of the fund managed by PIL.
The fund reimburses Putnam Management an allocated amount for the compensation and related expenses of certain officers of the fund and their staff who provide administrative services to the fund. The aggregate amount of all such reimbursements is determined annually by the Trustees.
Custodial functions for the fund’s assets are provided by State Street. Custody fees are based on the fund’s asset level, the number of its security holdings and transaction volumes.
| |
| International Capital Opportunities Fund | 39 |
Putnam Investor Services, Inc., an affiliate of Putnam Management, provides investor servicing agent functions to the fund. Putnam Investor Services, Inc. received fees for investor servicing based on the fund’s retail asset level, the number of shareholder accounts in the fund and the level of defined contribution plan assets in the fund. Investor servicing fees will not exceed an annual rate of 0.32% of the fund’s average net assets. During the reporting period, the expenses for each class of shares related to investor servicing fees were as follows:
| | | | |
| Class A | $837,036 | | Class R | 114,927 |
| |
|
| Class B | 28,805 | | Class Y | 164,230 |
| |
|
| Class C | 55,572 | | Total | $1,211,386 |
| |
|
| Class M | 10,816 | | | |
| | |
The fund has entered into expense offset arrangements with Putnam Investor Services, Inc. and State Street whereby Putnam Investor Services, Inc.’s and State Street’s fees are reduced by credits allowed on cash balances. The fund also reduced expenses through brokerage/service arrangements. For the reporting period, the fund’s expenses were reduced by $663 under the expense offset arrangements and by $78 under the brokerage/ service arrangements.
Each independent Trustee of the fund receives an annual Trustee fee, of which $654, as a quarterly retainer, has been allocated to the fund, and an additional fee for each Trustees meeting attended. Trustees also are reimbursed for expenses they incur relating to their services as Trustees.
The fund has adopted a Trustee Fee Deferral Plan (the Deferral Plan) which allows the Trustees to defer the receipt of all or a portion of Trustees fees payable on or after July 1, 1995. The deferred fees remain invested in certain Putnam funds until distribution in accordance with the Deferral Plan.
The fund has adopted an unfunded noncontributory defined benefit pension plan (the Pension Plan) covering all Trustees of the fund who have served as a Trustee for at least five years and were first elected prior to 2004. Benefits under the Pension Plan are equal to 50% of the Trustee’s average annual attendance and retainer fees for the three years ended December 31, 2005. The retirement benefit is payable during a Trustee’s lifetime, beginning the year following retirement, for the number of years of service through December 31, 2006. Pension expense for the fund is included in Trustee compensation and expenses in the Statement of operations. Accrued pension liability is included in Payable for Trustee compensation and expenses in the Statement of assets and liabilities. The Trustees have terminated the Pension Plan with respect to any Trustee first elected after 2003.
The fund has adopted distribution plans (the Plans) with respect to its class A, class B, class C, class M and class R shares pursuant to Rule 12b–1 under the Investment Company Act of 1940. The purpose of the Plans is to compensate Putnam Retail Management Limited Partnership, an indirect wholly-owned subsidiary of Putnam Investments, LLC, for services provided and expenses incurred in distributing shares of the fund. The Plans provide for payments by the fund to Putnam Retail Management Limited Partnership at an annual rate of up to 0.35%, 1.00%, 1.00%, 1.00% and 1.00% of the average net assets attributable to class A, class B, class C, class M and class R shares, respectively. The Trustees have approved payment by the fund at an annual rate of 0.25%, 1.00%, 1.00%, 0.75% and 0.50% of the average net assets attributable to class A, class B, class C, class M and class R shares, respectively. During the reporting period, the class specific expenses related to distribution fees were as follows:
| | | | |
| Class A | $737,122 | | Class M | 28,589 |
| |
|
| Class B | 101,581 | | Class R | 203,121 |
| |
|
| Class C | 195,808 | | Total | $1,266,221 |
| |
|
For the reporting period, Putnam Retail Management Limited Partnership, acting as underwriter, received net commissions of $15,300 and $78 from the sale of class A and class M shares, respectively, and received $5,496 and $113 in contingent deferred sales charges from redemptions of class B and class C shares, respectively.
A deferred sales charge of up to 1.00% and 0.65% is assessed on certain redemptions of class A and class M shares, respectively. For the reporting period, Putnam Retail Management Limited Partnership, acting as underwriter, received $6 and no monies on class A and class M redemptions, respectively.
| |
| 40 | International Capital Opportunities Fund |
Note 3: Purchases and sales of securities
During the reporting period, cost of purchases and proceeds from sales of investment securities other than short-term investments aggregated $200,962,789 and $310,828,840, respectively. There were no purchases or proceeds from sales of long-term U.S. government securities.
Note 4: Capital shares
At the close of the reporting period, there was an unlimited number of shares of beneficial interest authorized. Transactions in capital shares were as follows:
| | | | |
| | Six months ended 2/28/13 | Year ended 8/31/12 |
|
| Class A | Shares | Amount | Shares | Amount |
|
| Shares sold | 620,683 | $20,399,768 | 1,705,260 | $50,391,820 |
|
| Shares issued in connection with | | | | |
| reinvestment of distributions | 199,417 | 6,532,899 | 647,022 | 17,463,122 |
|
| | 820,100 | 26,932,667 | 2,352,282 | 67,854,942 |
|
| Shares repurchased | (2,272,319) | (74,032,294) | (6,525,462) | (192,861,045) |
|
| Net decrease | (1,452,219) | $(47,099,627) | (4,173,180) | $(125,006,103) |
|
| |
| | Six months ended 2/28/13 | Year ended 8/31/12 |
|
| Class B | Shares | Amount | Shares | Amount |
|
| Shares sold | 14,132 | $460,208 | 56,308 | $1,666,770 |
|
| Shares issued in connection with | | | | |
| reinvestment of distributions | 2,043 | 66,781 | 16,760 | 451,010 |
|
| | 16,175 | 526,989 | 73,068 | 2,117,780 |
|
| Shares repurchased | (102,082) | (3,285,655) | (341,394) | (10,076,160) |
|
| Net decrease | (85,907) | $(2,758,666) | (268,326) | $(7,958,380) |
|
| |
| | Six months ended 2/28/13 | Year ended 8/31/12 |
|
| Class C | Shares | Amount | Shares | Amount |
|
| Shares sold | 37,600 | $1,237,635 | 63,747 | $1,871,129 |
|
| Shares issued in connection with | | | | |
| reinvestment of distributions | 4,213 | 137,541 | 29,691 | 798,701 |
|
| | 41,813 | 1,375,176 | 93,438 | 2,669,830 |
|
| Shares repurchased | (134,080) | (4,334,714) | (495,957) | (14,589,911) |
|
| Net decrease | (92,267) | $(2,959,538) | (402,519) | $(11,920,081) |
|
| |
| | Six months ended 2/28/13 | Year ended 8/31/12 |
|
| Class M | Shares | Amount | Shares | Amount |
|
| Shares sold | 6,520 | $216,395 | 7,152 | $207,068 |
|
| Shares issued in connection with | | | | |
| reinvestment of distributions | 1,567 | 51,181 | 6,524 | 175,552 |
|
| | 8,087 | 267,576 | 13,676 | 382,620 |
|
| Shares repurchased | (21,373) | (690,300) | (48,038) | (1,416,668) |
|
| Net decrease | (13,286) | $(422,724) | (34,362) | $(1,034,048) |
|
| |
| International Capital Opportunities Fund | 41 |
| | | | |
| | Six months ended 2/28/13 | Year ended 8/31/12 |
|
| Class R | Shares | Amount | Shares | Amount |
|
| Shares sold | 555,973 | $17,787,875 | 2,608,219 | $76,077,975 |
|
| Shares issued in connection with | | | | |
| reinvestment of distributions | 17,693 | 571,299 | 122,063 | 3,243,226 |
|
| | 573,666 | 18,359,174 | 2,730,282 | 79,321,201 |
|
| Shares repurchased | (1,868,194) | (59,654,977) | (2,788,577) | (81,462,703) |
|
| Net decrease | (1,294,528) | $(41,295,803) | (58,295) | $(2,141,502) |
|
| |
| | Six months ended 2/28/13 | Year ended 8/31/12 |
|
| Class Y | Shares | Amount | Shares | Amount |
|
| Shares sold | 664,250 | $21,626,895 | 1,172,369 | $34,619,214 |
|
| Shares issued in connection with | | | | |
| reinvestment of distributions | 47,724 | 1,562,479 | 108,829 | 2,936,197 |
|
| | 711,974 | 23,189,374 | 1,281,198 | 37,555,411 |
|
| Shares repurchased | (626,759) | (20,693,779) | (1,426,077) | (42,192,767) |
|
| Net increase (decrease) | 85,215 | $2,495,595 | (144,879) | $(4,637,356) |
|
Note 5: Summary of derivative activity
The average volume of activity for the reporting period for any derivative type that was held during the period is listed below and was as follows:
| |
| Forward currency contracts (contract amount) | $252,900,000 |
|
| Warrants (number of warrants) | 130,000 |
|
The following is a summary of the market values of derivative instruments as of the close of the reporting period:
Market values of derivative instruments as of the close of the reporting period
| | | | |
| | Asset derivatives | Liability derivatives |
|
| Derivatives not | | | | |
| accounted for as | Statement of | | Statement of | |
| hedging instruments | assets and | | assets and | |
| under ASC 815 | liabilities location | Market value | liabilities location | Market value |
|
| Foreign exchange | | | | |
| contracts | Receivables | $2,277,325 | Payables | $3,969,716 |
|
| Equity contracts | Investments | 166 | Payables | — |
|
| Total | | $2,277,491 | | $3,969,716 |
|
The following is a summary of realized and change in unrealized gains or losses of derivative instruments on the Statement of operations for the reporting period (see Note 1):
Amount of realized gain or (loss) on derivatives recognized in net gain or (loss) on investments
| | |
| Derivatives not accounted for as hedging | Forward currency | |
| instruments under ASC 815 | contracts | Total |
|
| Foreign exchange contracts | $(1,004,197) | $(1,004,197) |
|
| Total | $(1,004,197) | $(1,004,197) |
|
| |
| 42 | International Capital Opportunities Fund |
Change in unrealized appreciation or (depreciation) on derivatives recognized in net gain or (loss) on investments
| | | |
| Derivatives not accounted for as hedging | | Forward currency | |
| instruments under ASC 815 | Warrants | contracts | Total |
|
| Foreign exchange contracts | $— | $(1,089,278) | $(1,089,278) |
|
| Equity contracts | 6 | — | $6 |
|
| Total | $6 | $(1,089,278) | $(1,089,272) |
|
Note 6: Transactions with affiliated issuer
Transactions during the reporting period with a company which is under common ownership or control, or with companies in which the fund owned at least 5% of the voting securities, were as follows:
| | | | | |
| | Market value at | | | | Market value |
| | the beginning | | | | at the end of |
| | of the reporting | | | Investment | the reporting |
| Name of affiliates | period | Purchase cost | Sale proceeds | income | period |
|
| Putnam Money Market | | | | | |
| Liquidity Fund* | $17,980,559 | $111,732,429 | $129,712,988 | $15,081 | $— |
|
| Putnam Short Term | | | | | |
| Investment Fund* | — | 34,965,923 | 1,998,896 | 335 | 32,967,027 |
|
Market values are shown for those securities affiliated during the reporting period.
* Management fees charged to Putnam Money Market Liquidity Fund and Putnam Short Term Investment Fund have been waived by Putnam Management.
Note 7: Market, credit and other risks
In the normal course of business, the fund trades financial instruments and enters into financial transactions where risk of potential loss exists due to changes in the market (market risk) or failure of the contracting party to the transaction to perform (credit risk). The fund may be exposed to additional credit risk that an institution or other entity with which the fund has unsettled or open transactions will default. Investments in foreign securities involve certain risks, including those related to economic instability, unfavorable political developments, and currency fluctuations.
Note 8: New accounting pronouncement
In December 2011, the FASB issued ASU No. 2011–11 “Disclosures about Offsetting Assets and Liabilities”. The update creates new disclosure requirements requiring entities to disclose both gross and net information for derivatives and other financial instruments that are either offset in the Statement of assets and liabilities or subject to an enforceable master netting arrangement or similar agreement. The disclosure requirements are effective for annual reporting periods beginning on or after January 1, 2013 and interim periods within those annual periods. Putnam Management is currently evaluating the application of ASU 2011–11 and its impact, if any, on the fund’s financial statements.
| |
| International Capital Opportunities Fund | 43 |
Services for shareholders
Investor services
Systematic investment plan Tell us how much you wish to invest regularly — weekly, semimonthly, or monthly — and the amount you choose will be transferred automatically from your checking or savings account. There’s no additional fee for this service, and you can suspend it at any time. This plan may be a great way to save for college expenses or to plan for your retirement.
Please note that regular investing does not guarantee a profit or protect against loss in a declining market. Before arranging a systematic investment plan, consider your financial ability to continue making purchases in periods when prices are low.
Systematic exchange You can make regular transfers from one Putnam fund to another Putnam fund. There are no additional fees for this service, and you can cancel or change your options at any time.
Dividends PLUS You can choose to have the dividend distributions from one of your Putnam funds automatically reinvested in another Putnam fund at no additional charge.
Free exchange privilege You can exchange money between Putnam funds free of charge, as long as they are the same class of shares. A signature guarantee is required if you are exchanging more than $500,000. The fund reserves the right to revise or terminate the exchange privilege.
Reinstatement privilege If you’ve sold Putnam shares or received a check for a dividend or capital gain, you may reinvest the proceeds with Putnam within 90 days of the transaction and they will be reinvested at the fund’s current net asset value — with no sales charge. However, reinstatement of class B shares may have special tax consequences. Ask your financial or tax representative for details.
Check-writing service You have ready access to many Putnam accounts. It’s as simple as writing a check, and there are no special fees or service charges. For more information about the check-writing service, call Putnam or visit our website.
Dollar cost averaging When you’re investing for long-term goals, it’s time, not timing, that counts. Investing on a systematic basis is a better strategy than trying to figure out when the markets will go up or down. This means investing the same amount of money regularly over a long period. This method of investing is called dollar cost averaging. When a fund’s share price declines, your investment dollars buy more shares at lower prices. When it increases, they buy fewer shares. Over time, you will pay a lower average price per share.
For more information
Visit the Individual Investors section at putnam.com A secure section of our website contains complete information on your account, including balances and transactions, updated daily. You may also conduct transactions, such as exchanges, additional investments, and address changes. Log on today to get your password.
Call us toll free at 1-800-225-1581 Ask a helpful Putnam representative or your financial advisor for details about any of these or other services, or see your prospectus.
| |
| 44 | International Capital Opportunities Fund |
Fund information
Founded over 75 years ago, Putnam Investments was built around the concept that a balance between risk and reward is the hallmark of a well-rounded financial program. We manage over 100 funds across income, value, blend, growth, asset allocation, absolute return, and global sector categories.
| | |
| Investment Manager | Trustees | Robert R. Leveille |
| Putnam Investment | Jameson A. Baxter, Chair | Vice President and |
| Management, LLC | Liaquat Ahamed | Chief Compliance Officer |
| One Post Office Square | Ravi Akhoury | |
| Boston, MA 02109 | Barbara M. Baumann | Michael J. Higgins |
| | Charles B. Curtis | Vice President and Treasurer |
| Investment Sub-Manager | Robert J. Darretta | |
| Putnam Investments Limited | Katinka Domotorffy | Janet C. Smith |
| 57–59 St James’s Street | John A. Hill | Vice President, |
| London, England SW1A 1LD | Paul L. Joskow | Principal Accounting Officer, |
| | Elizabeth T. Kennan | and Assistant Treasurer |
| Marketing Services | Kenneth R. Leibler | |
| Putnam Retail Management | Robert E. Patterson | Susan G. Malloy |
| One Post Office Square | George Putnam, III | Vice President and |
| Boston, MA 02109 | Robert L. Reynolds | Assistant Treasurer |
| | W. Thomas Stephens | |
| Custodian | | James P. Pappas |
| State Street Bank | Officers | Vice President |
| and Trust Company | Robert L. Reynolds | |
| | President | Mark C. Trenchard |
| Legal Counsel | | Vice President and |
| Ropes & Gray LLP | Jonathan S. Horwitz | BSA Compliance Officer |
| | Executive Vice President, | |
| | Principal Executive Officer, and | Judith Cohen |
| | Compliance Liaison | Vice President, Clerk, and |
| | | Associate Treasurer |
| | Steven D. Krichmar | |
| | Vice President and | Nancy E. Florek |
| | Principal Financial Officer | Vice President, Proxy |
| | | Manager, Assistant Clerk, and |
| | Robert T. Burns | Associate Treasurer |
| | Vice President and | |
| | Chief Legal Officer | |
This report is for the information of shareholders of Putnam International Capital Opportunities Fund. It may also be used as sales literature when preceded or accompanied by the current prospectus, the most recent copy of Putnam’s Quarterly Performance Summary, and Putnam’s Quarterly Ranking Summary. For more recent performance, please visit putnam.com. Investors should carefully consider the investment objectives, risks, charges, and expenses of a fund, which are described in its prospectus. For this and other information or to request a prospectus or summary prospectus, call 1-800-225-1581 toll free. Please read the prospectus carefully before investing. The fund’s Statement of Additional Information contains additional information about the fund’s Trustees and is available without charge upon request by calling 1-800-225-1581.
| |
| Item 3. Audit Committee Financial Expert: |
| |
| Item 4. Principal Accountant Fees and Services: |
| |
| Item 5. Audit Committee of Listed Registrants |
| |
| Item 6. Schedule of Investments: |
| |
| The registrant’s schedule of investments in unaffiliated issuers is included in the report to shareholders in Item 1 above. |
| |
| Item 7. Disclosure of Proxy Voting Policies and Procedures For Closed-End Management Investment Companies: |
| |
| Item 8. Portfolio Managers of Closed-End Investment Companies |
| |
| Item 9. Purchases of Equity Securities by Closed-End Management Investment Companies and Affiliated Purchasers: |
| |
| Item 10. Submission of Matters to a Vote of Security Holders: |
| |
| Item 11. Controls and Procedures: |
| |
| (a) The registrant’s principal executive officer and principal financial officer have concluded, based on their evaluation of the effectiveness of the design and operation of the registrant’s disclosure controls and procedures as of a date within 90 days of the filing date of this report, that the design and operation of such procedures are generally effective to provide reasonable assurance that information required to be disclosed by the registrant in this report is recorded, processed, summarized and reported within the time periods specified in the Commission’s rules and forms. |
| |
| (b) Changes in internal control over financial reporting: Not applicable |
| |
| (a)(2) Separate certifications for the principal executive officer and principal financial officer of the registrant as required by Rule 30a-2(a) under the Investment Company Act of 1940, as amended, are filed herewith. |
| |
| (b) The certifications required by Rule 30a-2(b) under the Investment Company Act of 1940, as amended, are filed herewith. |
| |
| By (Signature and Title): |
| |
| /s/Janet C. Smith
Janet C. Smith
Principal Accounting Officer
|
| |
| Pursuant to the requirements of the Securities Exchange Act of 1934 and the Investment Company Act of 1940, this report has been signed below by the following persons on behalf of the registrant and in the capacities and on the dates indicated. |
| |
| By (Signature and Title): |
| |
| /s/Jonathan S. Horwitz
Jonathan S. Horwitz
Principal Executive Officer
|
| |
| By (Signature and Title): |
| |
| /s/Steven D. Krichmar
Steven D. Krichmar
Principal Financial Officer
|