| | |
| UNITED STATES
SECURITIES AND EXCHANGE COMMISSION |
| | |
| CERTIFIED SHAREHOLDER REPORT OF REGISTERED
MANAGEMENT INVESTMENT COMPANIES
|
| | |
| Investment Company Act file number: | (811-07237) |
| | |
| Exact name of registrant as specified in charter: | Putnam Investment Funds |
| | |
| Address of principal executive offices: | One Post Office Square, Boston, Massachusetts 02109 |
| | |
| Name and address of agent for service: | Robert T. Burns, Vice President
One Post Office Square
Boston, Massachusetts 02109 |
| | |
| Copy to: | John W. Gerstmayr, Esq.
Ropes & Gray LLP
800 Boylston Street
Boston, Massachusetts 02199-3600 |
| | |
| Registrant’s telephone number, including area code: | (617) 292-1000 |
| | |
| Date of fiscal year end: | July 31, 2014 |
| | |
| Date of reporting period: | August 1, 2013 — January 31, 2014 |
| | |
|
Item 1. Report to Stockholders: | |
| | |
| The following is a copy of the report transmitted to stockholders pursuant to Rule 30e-1 under the Investment Company Act of 1940: | |
Putnam
Growth Opportunities
Fund
Semiannual report
1 | 31 | 14
| | | |
| Message from the Trustees | 1 | | |
| | |
| About the fund | 2 | | |
| | |
| Performance snapshot | 4 | | |
| | |
| Interview with your fund’s portfolio manager | 5 | | |
| | |
| Your fund’s performance | 10 | | |
| | |
| Your fund’s expenses | 12 | | |
| | |
| Terms and definitions | 14 | | |
| | |
| Other information for shareholders | 15 | | |
| | |
| Trustee approval of management contract | 16 | | |
| | |
| Financial statements | 23 | | |
| | |
| Shareholder meeting results | 51 | | |
| | |
Consider these risks before investing: Growth stocks may be more susceptible to earnings disappointments, and the market may not favor growth-style investing. Stock prices may fall or fail to rise over time for several reasons, including general financial market conditions and factors related to a specific issuer or industry. You can lose money by investing in the fund.
Message from the Trustees
Dear Fellow Shareholder:
In early 2014, stock prices fluctuated while most bond markets advanced, reversing the trends that dominated the two asset classes during 2013. Although the economic recovery appears to remain intact and previous market forces may re-emerge, the shift in short-term trends reminds investors once again about the value of portfolio diversification.
In this environment, we believe Putnam’s commitment to active fundamental research and taking a proactive view about risk is well suited to uncovering attractive investment opportunities.
We are pleased to report that this focus continues to earn Putnam high marks among industry peers. In 2013 — and for the third time in five years — Barron’s ranked Putnam one of the top two mutual fund families based on total returns across asset classes.
Lastly, for guidance on today’s markets, we also believe that you are well served by consulting with your financial advisor, who can help you assess your individual needs, time horizon, and risk tolerance — crucial for guiding you toward your investment goals.
As always, thank you for investing with Putnam.

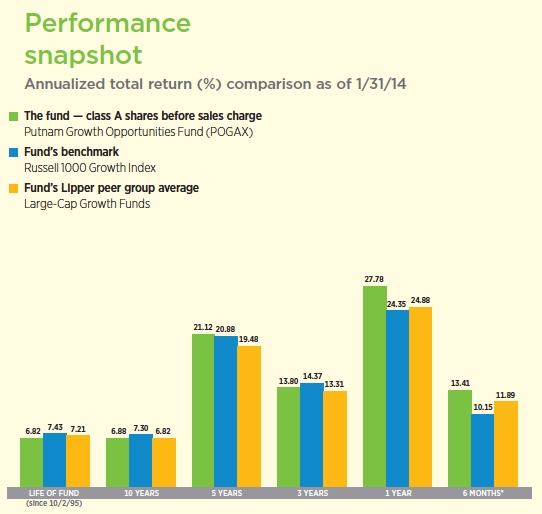
Current performance may be lower or higher than the quoted past performance, which cannot guarantee future results. Share price, principal value, and return will fluctuate, and you may have a gain or a loss when you sell your shares. Performance of class A shares assumes reinvestment of distributions and does not account for taxes. Fund returns in the bar chart do not reflect a sales charge of 5.75%; had they, returns would have been lower. See pages 5 and 10–12 for additional performance information. For a portion of the periods, the fund had expense limitations, without which returns would have been lower. To obtain the most recent month-end performance, visit putnam.com.
* Returns for the six-month period are not annualized, but cumulative.
| |
| 4 | Growth Opportunities Fund |
Interview with your fund’s portfolio manager

Rob, what can you tell us about the investing environment for the six months ended January 31, 2014?
The equity market continued its impressive advance during the period, and for the 2013 calendar year, stocks delivered their best annual performance since the 1990s. Throughout 2013, major U.S. stock market indexes achieved and surpassed record highs several times, buoyed in part by economic growth. While an economic recovery appears to be under way, its pace has been slower than we would like. However, I believe this combination of not-too-fast, not-too-slow growth is what fueled the market rally.
During the past six months, stocks did encounter some volatility, particularly in October, as a result of the U.S. congressional budget debate and the 16-day partial shutdown of the federal government. Investors also remained anxious about the Federal Reserve Board’s plans to taper quantitative easing — the Fed’s bond-buying program that was designed to stimulate the economy. However, it is worth noting that the market responded favorably in late December when the Fed announced its first modest reduction in asset purchases. The market also had a setback in January 2014, the final month of the semiannual period. The S&P 500 Index, a broad measure of U.S. stock market performance, declined 3.5%, its largest one-month decline since May 2012.
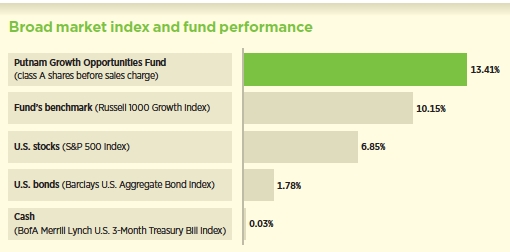
This comparison shows your fund’s performance in the context of broad market indexes for the six months ended 1/31/14. See pages 4 and 10–12 for additional fund performance information. Index descriptions can be found on page 14.
| |
| Growth Opportunities Fund | 5 |
How did the fund perform for the period?
The fund delivered a solid return for the period and also outperformed its benchmark, the Russell 1000 Growth Index. In addition, the fund outpaced the average return for funds in its peer group, Lipper Large-Cap Growth Funds.
What strategies or holdings contributed to fund performance?
One key contributor to fund returns for the period was our decision to not hold a position in technology giant IBM, which underperformed. While IBM is a growing company in some respects, its organic revenue growth is not compelling enough, in our view. Instead, within the technology sector, we have sought opportunities in companies that we believe offer more promising sales growth potential over the long term.
Also worth noting is the performance of Actavis, a generic pharmaceutical company formed when Watson Pharmaceuticals acquired Actavis Group in November 2012. Its stock price advanced considerably, particularly following the announcement that the company was acquiring Warner Chilcott, a specialty pharmaceutical firm. The acquisition was viewed as positive because it would broaden Actavis’s lineup of branded pharmaceutical products and was expected to provide tax advantages due to the fact that Warner Chilcott is domiciled in Ireland.
We continued to be pleased with the performance of Priceline.com, an online travel booking company that has been in the fund’s portfolio for several years. Hotels and airlines make their services accessible through the Priceline.com website, providing a convenient way for travelers to make plans via the Internet. The Priceline.com site serves as a
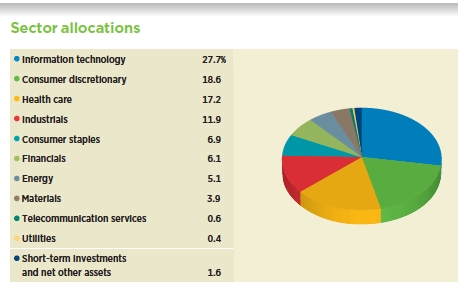
Allocations are shown as a percentage of the fund’s net assets as of 1/31/14. Short-term investments and net other assets, if any, represent the market value weights of cash, derivatives, short-term securities, and other unclassified assets in the portfolio. Summary information may differ from the portfolio schedule included in the financial statements due to the inclusion of derivative securities, any interest accruals, the exclusion of as-of trades, if any, and the use of different classifications of securities for presentation purposes. Holdings and allocations may vary over time.
| |
| 6 | Growth Opportunities Fund |
convenient and efficient distribution arm for hotels worldwide, particularly smaller ones. Priceline’s business model also benefits from what we believe are powerful and sustainable long-term trends — increased global travel and the use of the Internet to research, plan, and book trips.

Could you discuss some strategies or holdings that detracted from fund returns?
A top detractor for the period was the fund’s position in networking company Cisco Systems. This stock underperformed due to a considerable change in Cisco’s growth outlook, as the company recently forecast several quarters of negative growth for 2014. It appears this unexpected change in its growth prospects is the result of potential weakness in international markets, as customers grow concerned about security breaches. In addition, investors have become skeptical about the company’s management strategy and acquisition track record.
Another disappointment was the stock of EMC, an information technology company. The company struggled as the growth rate for its storage products slowed considerably. At the same time, EMC owns a significant portion of VMware, a company focused on cloud-based infrastructure whose sales and performance also slowed. EMC was sold from the portfolio by the close of the period.
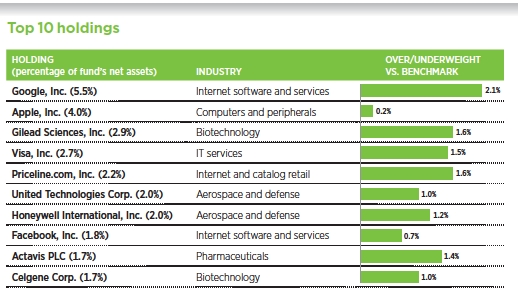
This table shows the fund’s top 10 holdings by percentage of the fund’s net assets as of 1/31/14. Short-term holdings and derivatives, if any, are excluded. Holdings may vary over time.
| |
| Growth Opportunities Fund | 7 |
As the fund enters the second half of its fiscal year, what is your outlook for the markets and the economy?
After several years of solid stock market gains, I believe it is important to manage our expectations for performance in the year ahead. While I don’t believe the double-digit, record-breaking returns of 2013 are sustainable, I do believe stocks may offer the potential for further gains, particularly if corporate earnings continue to improve.
I am also optimistic from a stock-selection perspective. While some would argue that it is difficult to find growth opportunities in today’s economy, I believe many companies are innovating in ways that will enable them to grow and capture additional market share. The key to my investment strategy is to employ disciplined fundamental research and analysis to find companies with fundamental strength, a competitive edge and the potential to produce strong profits.
Thank you, Rob, for this fund update.
The views expressed in this report are exclusively those of Putnam Management and are subject to change. They are not meant as investment advice.
Please note that the holdings discussed in this report may not have been held by the fund for the entire period. Portfolio composition is subject to review in accordance with the fund’s investment strategy and may vary in the future. Current and future portfolio holdings are subject to risk.
Portfolio Manager Robert M. Brookby has an M.B.A. from Harvard Business School and a B.A. from Northwestern University. Rob joined Putnam in 2008 and has been in the investment industry since 1999.

This chart shows the fund’s largest allocation shifts, by percentage, over the past six months. Allocations are shown as a percentage of the fund’s net assets. Current period summary information may differ from the portfolio schedule included in the financial statements due to the inclusion of derivative securities, any interest accruals, the exclusion of as-of trades, if any, and the use of different classifications of securities for presentation purposes. Holdings and allocations may vary over time.
| |
| 8 | Growth Opportunities Fund |
IN THE NEWS
The U.S. federal deficit this year will dip to its lowest level since 2007, but the trend may be short-lived. The Congressional Budget Office (CBO) has projected that the U.S. deficit will fall to $514 billion by the end of the current fiscal year on September 30, 2014, down from $680 billion last fiscal year and the recent peak of $1.4 trillion in 2009. Government spending cuts, tax hikes, and the overall economic expansion all helped to lower the deficit, which has been the focus of intense political debate in Washington. However, in coming years as baby boomers age, spending will accelerate on such government programs as Medicare and Social Security, widening the deficit. Without more robust economic growth, spending for Social Security, Medicare (including offsetting receipts), Medicaid, the Children’s Health Insurance Program, and subsidies for health insurance purchased through exchanges will rise from 9.7% of GDP in 2014 to 11.7% in 2024, the CBO estimates.
| |
| Growth Opportunities Fund | 9 |
Your fund’s performance
This section shows your fund’s performance, price, and distribution information for periods ended January 31, 2014, the end of the first half of its current fiscal year. In accordance with regulatory requirements for mutual funds, we also include performance information as of the most recent calendar quarter-end and expense information taken from the fund’s current prospectus. Performance should always be considered in light of a fund’s investment strategy. Data represent past performance. Past performance does not guarantee future results. More recent returns may be less or more than those shown. Investment return and principal value will fluctuate, and you may have a gain or a loss when you sell your shares. Performance information does not reflect any deduction for taxes a shareholder may owe on fund distributions or on the redemption of fund shares. For the most recent month-end performance, please visit the Individual Investors section at putnam.com or call Putnam at 1-800-225-1581. Class R, R5, R6, and Y shares are not available to all investors. See the Terms and Definitions section in this report for definitions of the share classes offered by your fund.
Fund performance Total return for periods ended 1/31/14
| | | | | | | | | | | | |
| | Class A | Class B | Class C | Class M | Class R | Class R5 | Class R6 | Class Y |
| (inception dates) | (10/2/95) | (8/1/97) | (2/1/99) | (8/1/97) | (1/21/03) | (7/2/12) | (7/2/12) | (7/1/99) |
|
| | Before | After | | | | | Before | After | Net | Net | Net | Net |
| | sales | sales | Before | After | Before | After | sales | sales | asset | asset | asset | asset |
| | charge | charge | CDSC | CDSC | CDSC | CDSC | charge | charge | value | value | value | value |
|
| Annual average | | | | | | | | | | | | |
| (life of fund) | 6.82% | 6.48% | 6.45% | 6.45% | 6.03% | 6.03% | 6.25% | 6.05% | 6.55% | 7.06% | 7.07% | 7.05% |
|
| 10 years | 94.54 | 83.35 | 83.13 | 83.13 | 80.45 | 80.45 | 85.11 | 78.63 | 89.66 | 99.93 | 100.25 | 99.54 |
| Annual average | 6.88 | 6.25 | 6.24 | 6.24 | 6.08 | 6.08 | 6.35 | 5.97 | 6.61 | 7.17 | 7.19 | 7.15 |
|
| 5 years | 160.63 | 145.64 | 150.93 | 148.93 | 150.91 | 150.91 | 154.05 | 145.16 | 157.42 | 164.27 | 164.69 | 163.75 |
| Annual average | 21.12 | 19.69 | 20.20 | 20.01 | 20.20 | 20.20 | 20.50 | 19.64 | 20.82 | 21.45 | 21.49 | 21.41 |
|
| 3 years | 47.39 | 38.91 | 44.08 | 41.08 | 44.16 | 44.16 | 45.23 | 40.14 | 46.26 | 48.83 | 49.07 | 48.53 |
| Annual average | 13.80 | 11.58 | 12.95 | 12.16 | 12.96 | 12.96 | 13.24 | 11.91 | 13.51 | 14.17 | 14.23 | 14.10 |
|
| 1 year | 27.78 | 20.43 | 26.82 | 21.82 | 26.79 | 25.79 | 27.08 | 22.64 | 27.43 | 28.21 | 28.36 | 28.08 |
|
| 6 months | 13.41 | 6.89 | 12.96 | 7.96 | 12.99 | 11.99 | 13.14 | 9.18 | 13.25 | 13.59 | 13.65 | 13.56 |
|
Current performance may be lower or higher than the quoted past performance, which cannot guarantee future results. After-sales-charge returns for class A and M shares reflect the deduction of the maximum 5.75% and 3.50% sales charge, respectively, levied at the time of purchase. Class B share returns after contingent deferred sales charge (CDSC) reflect the applicable CDSC, which is 5% in the first year, declining over time to 1% in the sixth year, and is eliminated thereafter. Class C share returns after CDSC reflect a 1% CDSC for the first year that is eliminated thereafter. Class R, R5, R6, and Y shares have no initial sales charge or CDSC. Performance for class B, C, M, R, and Y shares before their inception is derived from the historical performance of class A shares, adjusted for the applicable sales charge (or CDSC) and the higher operating expenses for such shares, except for class Y shares, for which 12b-1 fees are not applicable. Performance for class R5 and R6 shares prior to their inception is derived from the historical performance of class Y shares and has not been adjusted for the lower investor servicing fees applicable to class R5 and R6 shares; had it, returns would have been higher.
Recent performance may have benefited from one or more legal settlements.
For a portion of the periods, the fund had expense limitations, without which returns would have been lower.
Class B share performance reflects conversion to class A shares after eight years.
| |
| 10 | Growth Opportunities Fund |
Comparative index returns For periods ended 1/31/14
| | |
| | | Lipper Large-Cap Growth |
| | Russell 1000 Growth Index | Funds category average* |
|
| Annual average (life of fund) | 7.43% | 7.21% |
|
| 10 years | 102.26 | 94.74 |
| Annual average | 7.30 | 6.82 |
|
| 5 years | 158.09 | 144.59 |
| Annual average | 20.88 | 19.48 |
|
| 3 years | 49.61 | 45.66 |
| Annual average | 14.37 | 13.31 |
|
| 1 year | 24.35 | 24.88 |
|
| 6 months | 10.15 | 11.89 |
|
Index and Lipper results should be compared with fund performance before sales charge, before CDSC, or at net asset value.
* Over the 6-month, 1-year, 3-year, 5-year, 10-year, and life-of-fund periods ended 1/31/14, there were 746, 722, 607, 536, 376, and 93 funds, respectively, in this Lipper category.
Fund price and distribution information For the six-month period ended 1/31/14
| | | | | | | | |
| Distributions | Class A | Class B | Class C | Class M | Class R | Class R5 | Class R6 | Class Y |
|
| Number | 1 | 1 | 1 | 1 | 1 | 1 | 1 | 1 |
|
| Income | $0.048 | — | — | — | $0.023 | $0.095 | $0.109 | $0.082 |
|
| Short-term capital gains | — | — | — | — | — | — | — | — |
|
| Long-term capital gains | 0.996 | 0.996 | 0.996 | 0.996 | 0.996 | 0.996 | 0.996 | 0.996 |
|
| Total | $1.044 | $0.996 | $0.996 | $0.996 | $1.019 | $1.091 | $1.105 | $1.078 |
|
| | Before | After | Net | Net | Before | After | Net | Net | Net | Net |
| | sales | sales | asset | asset | sales | sales | asset | asset | asset | asset |
| Share value | charge | charge | value | value | charge | charge | value | value | value | value |
|
| 7/31/13 | $21.94 | $23.28 | $19.77 | $20.03 | $20.50 | $21.24 | $21.48 | $22.67 | $22.67 | $22.62 |
|
| 1/31/14 | 23.82 | 25.27 | 21.32 | 21.62 | 22.18 | 22.98 | 23.29 | 24.64 | 24.64 | 24.59 |
|
The classification of distributions, if any, is an estimate. Before-sales-charge share value and current dividend rate for class A and M shares, if applicable, do not take into account any sales charge levied at the time of purchase. After-sales-charge share value, current dividend rate, and current 30-day SEC yield, if applicable, are calculated assuming that the maximum sales charge (5.75% for class A shares and 3.50% for class M shares) was levied at the time of purchase. Final distribution information will appear on your year-end tax forms.
| |
| Growth Opportunities Fund | 11 |
Fund performance as of most recent calendar quarter
Total return for periods ended 12/31/13
| | | | | | | | | | | | |
| | Class A | Class B | Class C | Class M | Class R | Class R5 | Class R6 | Class Y |
| (inception dates) | (10/2/95) | (8/1/97) | (2/1/99) | (8/1/97) | (1/21/03) | (7/2/12) | (7/2/12) | (7/1/99) |
|
| | Before | After | | | | | Before | After | Net | Net | Net | Net |
| | sales | sales | Before | After | Before | After | sales | sales | asset | asset | asset | asset |
| | charge | charge | CDSC | CDSC | CDSC | CDSC | charge | charge | value | value | value | value |
|
| Annual average | | | | | | | | | | | | |
| (life of fund) | 6.97% | 6.62% | 6.60% | 6.60% | 6.18% | 6.18% | 6.40% | 6.20% | 6.71% | 7.21% | 7.22% | 7.20% |
|
| 10 years | 101.33 | 89.75 | 89.39 | 89.39 | 86.82 | 86.82 | 91.47 | 84.76 | 96.37 | 106.90 | 107.06 | 106.42 |
| Annual average | 7.25 | 6.62 | 6.59 | 6.59 | 6.45 | 6.45 | 6.71 | 6.33 | 6.98 | 7.54 | 7.55 | 7.52 |
|
| 5 years | 156.65 | 141.90 | 147.06 | 145.06 | 147.21 | 147.21 | 150.38 | 141.62 | 153.47 | 160.49 | 160.70 | 159.89 |
| Annual average | 20.75 | 19.32 | 19.83 | 19.63 | 19.84 | 19.84 | 20.15 | 19.30 | 20.44 | 21.10 | 21.12 | 21.05 |
|
| 3 years | 55.09 | 46.17 | 51.62 | 48.62 | 51.67 | 51.67 | 52.80 | 47.45 | 53.96 | 56.59 | 56.71 | 56.22 |
| Annual average | 15.75 | 13.49 | 14.88 | 14.12 | 14.89 | 14.89 | 15.18 | 13.82 | 15.47 | 16.12 | 16.15 | 16.03 |
|
| 1 year | 36.58 | 28.72 | 35.58 | 30.58 | 35.57 | 34.57 | 35.88 | 31.13 | 36.25 | 37.13 | 37.18 | 36.89 |
|
| 6 months | 22.92 | 15.85 | 22.47 | 17.47 | 22.49 | 21.49 | 22.65 | 18.36 | 22.78 | 23.16 | 23.14 | 23.05 |
|
See the discussion following the Fund performance table on page 10 for information about the calculation of fund performance.
Your fund’s expenses
As a mutual fund investor, you pay ongoing expenses, such as management fees, distribution fees (12b-1 fees), and other expenses. Using the following information, you can estimate how these expenses affect your investment and compare them with the expenses of other funds. You may also pay one-time transaction expenses, including sales charges (loads) and redemption fees, which are not shown in this section and would have resulted in higher total expenses. For more information, see your fund’s prospectus or talk to your financial representative.
Expense ratios
| | | | | | | | |
| | Class A | Class B | Class C | Class M | Class R | Class R5 | Class R6 | Class Y |
|
| Total annual operating expenses for | | | | | | | | |
| the fiscal year ended 7/31/13 | 1.13% | 1.88% | 1.88% | 1.63% | 1.38% | 0.75% | 0.65% | 0.88% |
|
| Annualized expense ratio for the | | | | | | | | |
| six-month period ended 1/31/14* | 1.12% | 1.87% | 1.87% | 1.62% | 1.37% | 0.79% | 0.69% | 0.87% |
|
Fiscal-year expense information in this table is taken from the most recent prospectus, is subject to change, and may differ from that shown for the annualized expense ratio and in the financial highlights of this report. Expenses are shown as a percentage of average net assets.
* Includes a decrease of 0.02% from annualizing the performance fee adjustment for the six months ended 1/31/14.
| |
| 12 | Growth Opportunities Fund |
Expenses per $1,000
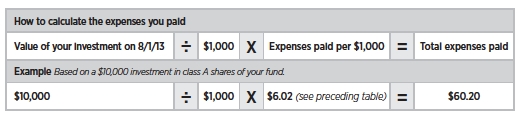
The following table shows the expenses you would have paid on a $1,000 investment in the fund from August 1, 2013, to January 31, 2014. It also shows how much a $1,000 investment would be worth at the close of the period, assuming actual returns and expenses.
| | | | | | | | |
| | Class A | Class B | Class C | Class M | Class R | Class R5 | Class R6 | Class Y |
|
| Expenses paid per $1,000*† | $6.02 | $10.04 | $10.04 | $8.70 | $7.36 | $4.25 | $3.72 | $4.68 |
|
| Ending value (after expenses) | $1,134.10 | $1,129.60 | $1,129.90 | $1,131.40 | $1,132.50 | $1,135.90 | $1,136.50 | $1,135.60 |
|
* Expenses for each share class are calculated using the fund’s annualized expense ratio for each class, which represents the ongoing expenses as a percentage of average net assets for the six months ended 1/31/14. The expense ratio may differ for each share class.
† Expenses are calculated by multiplying the expense ratio by the average account value for the period; then multiplying the result by the number of days in the period; and then dividing that result by the number of days in the year.
Estimate the expenses you paid
To estimate the ongoing expenses you paid for the six months ended January 31, 2014, use the following calculation method. To find the value of your investment on August 1, 2013, call Putnam at 1-800-225-1581.
Compare expenses using the SEC’s method
The Securities and Exchange Commission (SEC) has established guidelines to help investors assess fund expenses. Per these guidelines, the following table shows your fund’s expenses based on a $1,000 investment, assuming a hypothetical 5% annualized return. You can use this information to compare the ongoing expenses (but not transaction expenses or total costs) of investing in the fund with those of other funds. All mutual fund shareholder reports will provide this information to help you make this comparison. Please note that you cannot use this information to estimate your actual ending account balance and expenses paid during the period.
| | | | | | | | |
| | Class A | Class B | Class C | Class M | Class R | Class R5 | Class R6 | Class Y |
|
| Expenses paid per $1,000*† | $5.70 | $9.50 | $9.50 | $8.24 | $6.97 | $4.02 | $3.52 | $4.43 |
|
| Ending value (after expenses) | $1,019.56 | $1,015.78 | $1,015.78 | $1,017.04 | $1,018.30 | $1,021.22 | $1,021.73 | $1,020.82 |
|
* Expenses for each share class are calculated using the fund’s annualized expense ratio for each class, which represents the ongoing expenses as a percentage of average net assets for the six months ended 1/31/14. The expense ratio may differ for each share class.
† Expenses are calculated by multiplying the expense ratio by the average account value for the six-month period; then multiplying the result by the number of days in the six-month period; and then dividing that result by the number of days in the year.
| |
| Growth Opportunities Fund | 13 |
Terms and definitions
Important terms
Total return shows how the value of the fund’s shares changed over time, assuming you held the shares through the entire period and reinvested all distributions in the fund.
Before sales charge, or net asset value, is the price, or value, of one share of a mutual fund, without a sales charge. Before-sales-charge figures fluctuate with market conditions, and are calculated by dividing the net assets of each class of shares by the number of outstanding shares in the class.
After sales charge is the price of a mutual fund share plus the maximum sales charge levied at the time of purchase. After-sales-charge performance figures shown here assume the 5.75% maximum sales charge for class A shares and 3.50% for class M shares.
Contingent deferred sales charge (CDSC) is generally a charge applied at the time of the redemption of class B or C shares and assumes redemption at the end of the period. Your fund’s class B CDSC declines over time from a 5% maximum during the first year to 1% during the sixth year. After the sixth year, the CDSC no longer applies. The CDSC for class C shares is 1% for one year after purchase.
Share classes
Class A shares are generally subject to an initial sales charge and no CDSC (except on certain redemptions of shares bought without an initial sales charge).
Class B shares are not subject to an initial sales charge. They may be subject to a CDSC.
Class C shares are not subject to an initial sales charge and are subject to a CDSC only if the shares are redeemed during the first year.
Class M shares have a lower initial sales charge and a higher 12b-1 fee than class A shares and no CDSC (except on certain redemptions of shares bought without an initial sales charge).
Class R shares are not subject to an initial sales charge or CDSC and are available only to certain employer-sponsored retirement plans.
Class R5 shares and class R6 shares are not subject to an initial sales charge or CDSC, and carry no 12b-1 fee. They are only available to employer-sponsored retirement plans.
Class Y shares are not subject to an initial sales charge or CDSC, and carry no 12b-1 fee. They are generally only available to corporate and institutional clients and clients in other approved programs.
Comparative indexes
Barclays U.S. Aggregate Bond Index is an unmanaged index of U.S. investment-grade fixed-income securities.
BofA Merrill Lynch U.S. 3-Month Treasury Bill Index is an unmanaged index that seeks to measure the performance of U.S. Treasury bills available in the marketplace.
Russell 1000 Growth Index is an unmanaged index of those companies in the large-cap Russell 1000 Index chosen for their growth orientation.
S&P 500 Index is an unmanaged index of common stock performance.
Indexes assume reinvestment of all distributions and do not account for fees. Securities and performance of a fund and an index will differ. You cannot invest directly in an index.
Lipper is a third-party industry-ranking entity that ranks mutual funds. Its rankings do not reflect sales charges. Lipper rankings are based on total return at net asset value relative to other funds that have similar current investment styles or objectives as determined by Lipper. Lipper may change a fund’s category assignment at its discretion. Lipper category averages reflect performance trends for funds within a category.
| |
| 14 | Growth Opportunities Fund |
Other information for shareholders
Important notice regarding delivery of shareholder documents
In accordance with Securities and Exchange Commission (SEC) regulations, Putnam sends a single copy of annual and semiannual shareholder reports, prospectuses, and proxy statements to Putnam shareholders who share the same address, unless a shareholder requests otherwise. If you prefer to receive your own copy of these documents, please call Putnam at 1-800-225-1581, and Putnam will begin sending individual copies within 30 days.
Proxy voting
Putnam is committed to managing our mutual funds in the best interests of our shareholders. The Putnam funds’ proxy voting guidelines and procedures, as well as information regarding how your fund voted proxies relating to portfolio securities during the 12-month period ended June 30, 2013, are available in the Individual Investors section of putnam.com, and on the SEC’s website, www.sec.gov. If you have questions about finding forms on the SEC’s website, you may call the SEC at 1-800-SEC-0330. You may also obtain the Putnam funds’ proxy voting guidelines and procedures at no charge by calling Putnam’s Shareholder Services at 1-800-225-1581.
Fund portfolio holdings
The fund will file a complete schedule of its portfolio holdings with the SEC for the first and third quarters of each fiscal year on Form N-Q. Shareholders may obtain the fund’s Forms N-Q on the SEC’s website at www.sec.gov. In addition, the fund’s Forms N-Q may be reviewed and copied at the SEC’s Public Reference Room in Washington, D.C. You may call the SEC at 1-800-SEC-0330 for information about the SEC’s website or the operation of the Public Reference Room.
Trustee and employee fund ownership
Putnam employees and members of the Board of Trustees place their faith, confidence, and, most importantly, investment dollars in Putnam mutual funds. As of January 31, 2014, Putnam employees had approximately $433,000,000 and the Trustees had approximately $105,000,000 invested in Putnam mutual funds. These amounts include investments by the Trustees’ and employees’ immediate family members as well as investments through retirement and deferred compensation plans.
| |
| Growth Opportunities Fund | 15 |
Trustee approval of management contract
Putnam Investment Management (“Putnam Management”) serves as investment manager to your fund under a management contract. In addition, Putnam Management’s affiliate, Putnam Investments Limited (“PIL”), provides services to your fund under a sub-management contract between Putnam Management and PIL. Putnam Management is majority owned (directly and indirectly) by Power Corporation of Canada, a diversified international management and holding company with interests in companies in the financial services, communications and other business sectors. Until his death on October 8, 2013, The Honourable Paul G. Desmarais, both directly and through holding companies, controlled a majority of the voting shares of Power Corporation of Canada. Upon his death, Mr. Desmarais’ voting control of shares of Power Corporation of Canada was transferred to The Desmarais Family Residuary Trust (the “Transfer”). As a technical matter, the Transfer may have constituted an “assignment” within the meaning of the Investment Company Act of 1940, as amended (the “1940 Act”), causing your fund’s existing management and sub-management contracts to terminate automatically. On October 18, 2013, the Trustees, including all of the Trustees who are not “interested persons” (as this term is defined in the 1940 Act) of the Putnam funds (the “Independent Trustees”), approved interim management contracts between the Putnam funds and Putnam Management and the continuance of your fund’s sub-management contract to address this possibility and to avoid disruption of investment advisory and other services provided to the Putnam funds. At a subsequent meeting on November 22, 2013, the Trustees, including all of the Independent Trustees, approved new definitive management contracts between the Putnam funds and Putnam Management and determined to recommend their approval to the shareholders of the Putnam funds at a shareholder meeting called for February 27, 2014. The Trustees also approved new sub-management contracts, to be effective at the same time as the new definitive management contracts. The fund’s shareholders approved your fund’s new management contract at a special meeting on February 27, 2014.
In considering whether to approve your fund’s interim management contract and the continuance of your fund’s sub-management contract in October, and in considering whether to approve your fund’s new definitive management contract and its new sub-management contract in November, the Trustees took into account that they had recently approved the continuation (through June 30, 2014) of the fund’s previous management and sub-management contracts at their meeting in June 2013. The Trustees considered that the terms of the interim management contract and new definitive management contract were identical to those of the previous management contract, except for the effective dates and initial terms and for certain non-substantive changes. They also considered that the terms of the sub-management contract were identical to those of the previous sub-management contract, except for the effective dates and initial terms. In light of the substantial similarity between the proposed contracts and the previous versions of these contracts approved by the Trustees at their June 2013 meeting, the Trustees relied to a considerable extent on their review of these contracts in connection with their June meeting. In addition, the Trustees considered a number other factors relating to the Transfer, including, but not limited to, the following:
• Information about the operations of The Desmarais Family Residuary Trust, including that Paul Desmarais, Jr. and André Desmarais,
| |
| 16 | Growth Opportunities Fund |
Mr. Desmarais’ sons, were expected to exercise, jointly, voting control over the Power Corporation of Canada shares controlled by The Desmarais Family Residuary Trust.
• That Paul Desmarais, Jr. and André Desmarais had been playing active managerial roles at Power Corporation of Canada, with responsibility for the oversight of Power Corporation of Canada’s subsidiaries, including Putnam Investments, since Power Corporation of Canada had acquired Putnam Investments in 2007, including serving as Directors of Putnam Investments, and that the Transfer would not affect their responsibilities as officers of Power Corporation of Canada.
• The intention expressed by representatives of Power Corporation of Canada and its subsidiaries, Power Financial Corporation and Great-West Lifeco, that there would be no change to the operations or management of Putnam Investments, to Putnam Management’s management of the funds or to investment, advisory and other services provided to the funds by Putnam Management and its affiliates as a result of the Transfer.
• Putnam Management’s assurances that, following the Transfer, Putnam Management would continue to provide the same level of services to each fund and that the Transfer will not have an adverse impact on the ability of Putnam Management and its affiliates to continue to provide high quality investment advisory and other services to the funds.
• Putnam Management’s assurances that there are no current plans to make any changes to the operations of the funds, existing management fees, expense limitations, distribution arrangements, or the quality of any services provided to the funds or their shareholders, as a result of the Transfer.
• The benefits that the funds have received and may potentially receive as a result of Putnam Management being a member of the Power Corporation of Canada group of companies, which promotes the stability of the Putnam organization.
• Putnam Investments’ commitment to bear a reasonable share of the expenses incurred by the Putnam Funds in connection with the Transfer.
General conclusions in connection with the Trustees’ June 2013 approval of the fund’s management and sub-management contracts
As noted above, in connection with their deliberations in October and November 2013, in addition to the factors described above, the Trustees considered their recent approval of your fund’s management and sub-management contracts in June 2013. The Board oversees the management of each fund and, as required by law, determines annually whether to approve the continuance of your fund’s management and sub-management contracts. The Board, with the assistance of its Contract Committee, requests and evaluates all information it deems reasonably necessary under the circumstances in connection with its annual contract review. The Contract Committee consists solely of Independent Trustees.
At the outset of the review process, members of the Board’s independent staff and independent legal counsel met with representatives of Putnam Management to review the annual contract review materials furnished to the Contract Committee during the course of the previous year’s review and to discuss possible changes in these materials that might be necessary or desirable for the coming year. Following these discussions and in consultation with the Contract Committee, the Independent Trustees’ independent legal counsel requested that Putnam Management furnish specified information, together with any additional information that Putnam Management considered relevant, to the Contract Committee. Over the
| |
| Growth Opportunities Fund | 17 |
course of several months ending in June 2013, the Contract Committee met on a number of occasions with representatives of Putnam Management, and separately in executive session, to consider the information that Putnam Management provided. Throughout this process, the Contract Committee was assisted by the members of the Board’s independent staff and by independent legal counsel for the Putnam funds and the Independent Trustees.
In May 2013, the Contract Committee met in executive session to discuss and consider its preliminary recommendations with respect to the continuance of the contracts. At the Trustees’ June 20, 2013 meeting, the Contract Committee met in executive session with the other Independent Trustees to review a summary of the key financial data that the Contract Committee considered in the course of its review. The Contract Committee then presented its written report, which summarized the key factors that the Committee had considered and set forth its final recommendations. The Contract Committee then recommended, and the Independent Trustees approved, the continuance of your fund’s management and sub-management contracts, effective July 1, 2013, subject to certain changes in the sub-management contract noted below. (Because PIL is an affiliate of Putnam Management and Putnam Management remains fully responsible for all services provided by PIL, the Trustees have not evaluated PIL as a separate entity, and all subsequent references to Putnam Management below should be deemed to include reference to PIL as necessary or appropriate in the context.)
The Independent Trustees’ June 2013 approval was based on the following conclusions:
• That the fee schedule in effect for your fund represented reasonable compensation in light of the nature and quality of the services being provided to the fund, the fees paid by competitive funds, and the costs incurred by Putnam Management in providing services to the fund, and
• That the fee schedule represented an appropriate sharing between fund shareholders and Putnam Management of such economies of scale as may exist in the management of the fund at current asset levels.
These conclusions were based on a comprehensive consideration of all information provided to the Trustees and were not the result of any single factor. Some of the factors that figured particularly in the Trustees’ deliberations and how the Trustees considered these factors are described below, although individual Trustees may have evaluated the information presented differently, giving different weights to various factors. It is also important to recognize that the management arrangements for your fund and the other Putnam funds are the result of many years of review and discussion between the Independent Trustees and Putnam Management, that some aspects of the arrangements may receive greater scrutiny in some years than others, and that the Trustees’ conclusions may be based, in part, on their consideration of fee arrangements in previous years. For example, with some minor exceptions, the current fee arrangements in the management contracts for the Putnam funds were implemented at the beginning of 2010 following extensive review and discussion by the Trustees, as well as approval by shareholders.
As noted above, the Trustees considered administrative revisions to your fund’s sub-management contract. Putnam Management recommended that the sub-management contract be revised to reduce the sub-management fee that Putnam Management pays to PIL with respect to the portion of the portfolios of certain funds, but not your fund, that may be allocated to PIL from time to time. The Independent Trustees’ approval of this recommendation was based on their conclusion that these changes would have no practical
| |
| 18 | Growth Opportunities Fund |
effect on Putnam Management’s continued responsibility for the management of these funds or the costs borne by fund shareholders and would not result in any reduction in the nature and quality of services provided to the funds.
Management fee schedules and total expenses
The Trustees reviewed the management fee schedules in effect for all Putnam funds, including fee levels and breakpoints. The Trustees also reviewed the total expenses of each Putnam fund, recognizing that in most cases management fees represented the major, but not the sole, determinant of total costs to shareholders.
In reviewing fees and expenses, the Trustees generally focus their attention on material changes in circumstances — for example, changes in assets under management, changes in a fund’s investment style, changes in Putnam Management’s operating costs or profitability, or changes in competitive practices in the mutual fund industry — that suggest that consideration of fee changes might be warranted. The Trustees concluded that the circumstances did not warrant changes to the management fee structure of your fund.
Under its management contract, your fund has the benefit of breakpoints in its management fee schedule that provide shareholders with economies of scale in the form of reduced fee levels as assets under management in the Putnam family of funds increase. The Trustees concluded that the fee schedule in effect for your fund represented an appropriate sharing of economies of scale between fund shareholders and Putnam Management.
In addition, your fund’s management contract provides that its management fees will be adjusted up or down depending upon whether your fund’s performance is better or worse than the performance of an appropriate index of securities prices specified in the management contract. In the course of reviewing investment performance, the Trustees examined the operation of your fund’s performance fees and concluded that these fees were operating effectively to align further Putnam Management’s economic interests with those of the fund’s shareholders.
As in the past, the Trustees also focused on the competitiveness of each fund’s total expense ratio. In order to ensure that expenses of the Putnam funds continue to meet competitive standards, the Trustees and Putnam Management have implemented certain expense limitations. These expense limitations were: (i) a contractual expense limitation applicable to all retail open-end funds of 32 basis points on investor servicing fees and expenses and (ii) a contractual expense limitation applicable to all open-end funds of 20 basis points on so-called “other expenses” (i.e., all expenses exclusive of management fees, investor servicing fees, distribution fees, investment-related expenses, interest, taxes, brokerage commissions, extraordinary expenses and acquired fund fees and expenses). These expense limitations serve in particular to maintain competitive expense levels for funds with large numbers of small shareholder accounts and funds with relatively small net assets. Most funds had sufficiently low expenses that these expense limitations did not apply. However, in the case of your fund, the first of the expense limitations applied during its fiscal year ending in 2012. Putnam Management’s support for these expense limitations was an important factor in the Trustees’ decision to approve the continuance of your fund’s management and sub-management contracts.
The Trustees reviewed comparative fee and expense information for a custom group of competitive funds selected by Lipper Inc. This comparative information included your fund’s percentile ranking for effective management fees and total expenses (excluding any
| |
| Growth Opportunities Fund | 19 |
applicable 12b-1 fee), which provides a general indication of your fund’s relative standing. In the custom peer group, your fund ranked in the first quintile in effective management fees (determined for your fund and the other funds in the custom peer group based on fund asset size and the applicable contractual management fee schedule) and in the second quintile in total expenses (excluding any applicable 12b-1 fees) as of December 31, 2012 (the first quintile representing the least expensive funds and the fifth quintile the most expensive funds). The fee and expense data reported by Lipper as of December 31, 2012 reflected the most recent fiscal year-end data available in Lipper’s database at that time.
In connection with their review of the management fees and total expenses of the Putnam funds, the Trustees also reviewed the costs of the services provided and the profits realized by Putnam Management and its affiliates from their contractual relationships with the funds. This information included trends in revenues, expenses and profitability of Putnam Management and its affiliates relating to the investment management, investor servicing and distribution services provided to the funds. In this regard, the Trustees also reviewed an analysis of Putnam Management’s revenues, expenses and profitability, allocated on a fund-by-fund basis, with respect to the funds’ management, distribution, and investor servicing contracts. For each fund, the analysis presented information about revenues, expenses and profitability for each of the agreements separately and for the agreements taken together on a combined basis. The Trustees concluded that, at current asset levels, the fee schedules in place represented reasonable compensation for the services being provided and represented an appropriate sharing of such economies of scale as may exist in the management of the Putnam funds at that time.
The information examined by the Trustees as part of their annual contract review for the Putnam funds has included for many years information regarding fees charged by Putnam Management and its affiliates to institutional clients such as defined benefit pension plans, college endowments, and the like. This information included comparisons of those fees with fees charged to the funds, as well as an assessment of the differences in the services provided to these different types of clients. The Trustees observed that the differences in fee rates between institutional clients and mutual funds are by no means uniform when examined by individual asset sectors, suggesting that differences in the pricing of investment management services to these types of clients may reflect historical competitive forces operating in separate markets. The Trustees considered the fact that in many cases fee rates across different asset classes are higher on average for mutual funds than for institutional clients, as well as the differences between the services that Putnam Management provides to the Putnam funds and those that it provides to its institutional clients. The Trustees did not rely on these comparisons to any significant extent in concluding that the management fees paid by your fund are reasonable.
Investment performance
The quality of the investment process provided by Putnam Management represented a major factor in the Trustees’ evaluation of the quality of services provided by Putnam Management under your fund’s management contract. The Trustees were assisted in their review of the Putnam funds’ investment process and performance by the work of the investment oversight committees of the Trustees, which meet on a regular basis with the funds’ portfolio teams and with the Chief Investment Officer and other senior members of Putnam Management’s Investment Division throughout the year. The Trustees concluded that Putnam Management
| |
| 20 | Growth Opportunities Fund |
generally provides a high-quality investment process — based on the experience and skills of the individuals assigned to the management of fund portfolios, the resources made available to them, and in general Putnam Management’s ability to attract and retain high-quality personnel — but also recognized that this does not guarantee favorable investment results for every fund in every time period.
The Trustees considered that 2012 was a year of strong competitive performance for many of the Putnam funds, with only a relatively small number of exceptions. They noted that this strong performance was exemplified by the fact that the Putnam funds were recognized by Barron’s as the best performing mutual fund complex for 2012 — the second time in four years that Putnam Management has achieved this distinction for the Putnam funds. They also noted, however, the disappointing investment performance of some funds for periods ended December 31, 2012 and considered information provided by Putnam Management regarding the factors contributing to the underperformance and actions being taken to improve the performance of these particular funds. The Trustees indicated their intention to continue to monitor performance trends to assess the effectiveness of these efforts and to evaluate whether additional actions to address areas of underperformance are warranted.
For purposes of evaluating investment performance, the Trustees generally focus on competitive industry rankings for the one-year, three-year, and five-year periods. For a number of Putnam funds with relatively unique investment mandates, the Trustees evaluated performance based on comparisons of their total returns with the returns of selected investment benchmarks or targeted returns. In the case of your fund, the Trustees considered that its class A share cumulative total return performance at net asset value was in the following quartiles of its Lipper Inc. peer group (Lipper Large-Cap Growth Funds) for the one-year, three-year and five-year periods ended December 31, 2012 (the first quartile representing the best-performing funds and the fourth quartile the worst-performing funds):
| | | |
| One-year period | 1st | | |
| | |
| Three-year period | 2nd | | |
| | |
| Five-year period | 1st | | |
| | |
For the five-year period ended December 31, 2012, your fund’s performance was in the top decile of its Lipper peer group. Over the one-year, three-year and five-year periods ended December 31, 2012, there were 713, 640 and 563 funds, respectively, in your fund’s Lipper peer group. (When considering performance information, shareholders should be mindful that past performance is not a guarantee of future results.)
Brokerage and soft-dollar allocations; investor servicing
The Trustees considered various potential benefits that Putnam Management may receive in connection with the services it provides under the management contract with your fund. These include benefits related to brokerage allocation and the use of soft dollars, whereby a portion of the commissions paid by a fund for brokerage may be used to acquire research services that are expected to be useful to Putnam Management in managing the assets of the fund and of other clients. Subject to policies established by the Trustees, soft dollars generated by these means are used primarily to acquire brokerage and research services that enhance Putnam Management’s investment capabilities and supplement Putnam Management’s internal research efforts. However, the Trustees noted that a portion of available soft dollars continues to be used to pay fund expenses. The Trustees indicated their continued intent to monitor regulatory and industry developments in this area with the assistance of their Brokerage Committee and
| |
| Growth Opportunities Fund | 21 |
also indicated their continued intent to monitor the allocation of the Putnam funds’ brokerage in order to ensure that the principle of seeking best price and execution remains paramount in the portfolio trading process.
Putnam Management may also receive benefits from payments that the funds make to Putnam Management’s affiliates for investor or distribution services. In conjunction with the annual review of your fund’s management and sub-management contracts, the Trustees reviewed your fund’s investor servicing agreement with Putnam Investor Services, Inc. (“PSERV”) and its distributor’s contracts and distribution plans with Putnam Retail Management Limited Partnership (“PRM”), both of which are affiliates of Putnam Management. The Trustees concluded that the fees payable by the funds to PSERV and PRM, as applicable, for such services are reasonable in relation to the nature and quality of such services, the fees paid by competitive funds, and the costs incurred by PSERV and PRM, as applicable, in providing such services.
| |
| 22 | Growth Opportunities Fund |
Financial statements
A guide to financial statements
These sections of the report, as well as the accompanying Notes, constitute the fund’s financial statements.
The fund’s portfolio lists all the fund’s investments and their values as of the last day of the reporting period. Holdings are organized by asset type and industry sector, country, or state to show areas of concentration and diversification.
Statement of assets and liabilities shows how the fund’s net assets and share price are determined. All investment and non-investment assets are added together. Any unpaid expenses and other liabilities are subtracted from this total. The result is divided by the number of shares to determine the net asset value per share, which is calculated separately for each class of shares. (For funds with preferred shares, the amount subtracted from total assets includes the liquidation preference of preferred shares.)
Statement of operations shows the fund’s net investment gain or loss. This is done by first adding up all the fund’s earnings — from dividends and interest income — and subtracting its operating expenses to determine net investment income (or loss). Then, any net gain or loss the fund realized on the sales of its holdings — as well as any unrealized gains or losses over the period — is added to or subtracted from the net investment result to determine the fund’s net gain or loss for the fiscal period.
Statement of changes in net assets shows how the fund’s net assets were affected by the fund’s net investment gain or loss, by distributions to shareholders, and by changes in the number of the fund’s shares. It lists distributions and their sources (net investment income or realized capital gains) over the current reporting period and the most recent fiscal year-end. The distributions listed here may not match the sources listed in the Statement of operations because the distributions are determined on a tax basis and may be paid in a different period from the one in which they were earned. Dividend sources are estimated at the time of declaration. Actual results may vary. Any non-taxable return of capital cannot be determined until final tax calculations are completed after the end of the fund’s fiscal year.
Financial highlights provide an overview of the fund’s investment results, per-share distributions, expense ratios, net investment income ratios, and portfolio turnover in one summary table, reflecting the five most recent reporting periods. In a semiannual report, the highlights table also includes the current reporting period.
| |
| Growth Opportunities Fund | 23 |
The fund’s portfolio 1/31/14 (Unaudited)
| | |
| COMMON STOCKS (98.5%)* | Shares | Value |
|
| Aerospace and defense (4.8%) | | |
| General Dynamics Corp. | 35,200 | $3,566,112 |
|
| Honeywell International, Inc. | 94,800 | 8,648,604 |
|
| United Technologies Corp. | 77,800 | 8,870,756 |
|
| | | 21,085,472 |
| Airlines (1.1%) | | |
| Delta Air Lines, Inc. | 101,500 | 3,106,915 |
|
| Spirit Airlines, Inc. † | 34,900 | 1,636,810 |
|
| | | 4,743,725 |
| Auto components (0.9%) | | |
| Johnson Controls, Inc. | 30,500 | 1,406,660 |
|
| TRW Automotive Holdings Corp. † | 33,560 | 2,488,474 |
|
| | | 3,895,134 |
| Beverages (2.4%) | | |
| Beam, Inc. | 26,900 | 2,240,770 |
|
| Brown-Forman Corp. Class B | 37,300 | 2,872,100 |
|
| Coca-Cola Enterprises, Inc. | 64,900 | 2,809,521 |
|
| Monster Beverage Corp. † | 29,500 | 2,003,050 |
|
| Remy Cointreau SA (France) | 8,387 | 626,433 |
|
| | | 10,551,874 |
| Biotechnology (6.4%) | | |
| Alkermes PLC † | 36,900 | 1,796,292 |
|
| Celgene Corp. † | 47,900 | 7,277,447 |
|
| Cubist Pharmaceuticals, Inc. † S | 46,100 | 3,369,449 |
|
| Gilead Sciences, Inc. † | 158,961 | 12,820,205 |
|
| Merrimack Pharmaceuticals, Inc. † S | 83,600 | 438,900 |
|
| Neuralstem, Inc. † S | 165,065 | 543,064 |
|
| Vertex Pharmaceuticals, Inc. † | 19,704 | 1,557,404 |
|
| | | 27,802,761 |
| Building products (0.4%) | | |
| Fortune Brands Home & Security, Inc. | 38,200 | 1,721,292 |
|
| | | 1,721,292 |
| Capital markets (1.4%) | | |
| Carlyle Group LP (The) (Partnership shares) | 37,600 | 1,308,856 |
|
| Charles Schwab Corp. (The) | 191,700 | 4,757,994 |
|
| | | 6,066,850 |
| Chemicals (2.9%) | | |
| Chemtura Corp. † | 96,500 | 2,420,220 |
|
| Dow Chemical Co. (The) | 57,400 | 2,612,274 |
|
| Monsanto Co. | 59,900 | 6,382,345 |
|
| Potash Corp. of Saskatchewan, Inc. (Canada) S | 43,100 | 1,349,892 |
|
| | | 12,764,731 |
| Commercial banks (0.4%) | | |
| Ally Financial, Inc. † | 201 | 1,587,900 |
|
| | | 1,587,900 |
| Commercial services and supplies (0.9%) | | |
| KAR Auction Services, Inc. | 46,793 | 1,301,781 |
|
| Tyco International, Ltd. | 70,788 | 2,866,206 |
|
| | | 4,167,987 |
| Communications equipment (2.0%) | | |
| Cisco Systems, Inc. | 49,700 | 1,088,927 |
|
| Juniper Networks, Inc. † | 70,900 | 1,886,649 |
|
| |
| 24 | Growth Opportunities Fund |
| | |
| COMMON STOCKS (98.5%)* cont. | Shares | Value |
|
| Communications equipment cont. | | |
| Oplink Communications, Inc. † | 82,300 | $1,393,339 |
|
| Qualcomm, Inc. | 60,748 | 4,508,717 |
|
| | | 8,877,632 |
| Computers and peripherals (5.5%) | | |
| Apple, Inc. | 34,690 | 17,365,814 |
|
| NetApp, Inc. | 26,000 | 1,100,840 |
|
| SanDisk Corp. | 29,659 | 2,062,783 |
|
| Western Digital Corp. | 38,500 | 3,317,545 |
|
| | | 23,846,982 |
| Construction materials (0.3%) | | |
| Eagle Materials, Inc. | 16,500 | 1,299,375 |
|
| | | 1,299,375 |
| Consumer finance (0.5%) | | |
| American Express Co. | 25,600 | 2,176,512 |
|
| | | 2,176,512 |
| Diversified financial services (1.3%) | | |
| Bank of America Corp. | 109,300 | 1,830,775 |
|
| CME Group, Inc. | 50,500 | 3,775,380 |
|
| | | 5,606,155 |
| Electrical equipment (0.3%) | | |
| Eaton Corp PLC | 17,600 | 1,286,384 |
|
| | | 1,286,384 |
| Electronic equipment, instruments, and components (0.7%) | | |
| Anixter International, Inc. | 17,300 | 1,517,556 |
|
| Hollysys Automation Technologies, Ltd. (China) † | 101,600 | 1,713,992 |
|
| | | 3,231,548 |
| Energy equipment and services (2.2%) | | |
| Halliburton Co. | 58,200 | 2,852,382 |
|
| Oil States International, Inc. † | 16,300 | 1,531,385 |
|
| Schlumberger, Ltd. | 58,600 | 5,131,602 |
|
| | | 9,515,369 |
| Food and staples retail (2.2%) | | |
| Costco Wholesale Corp. | 31,500 | 3,539,340 |
|
| CVS Caremark Corp. | 69,400 | 4,699,768 |
|
| Whole Foods Market, Inc. | 30,600 | 1,599,156 |
|
| | | 9,838,264 |
| Food products (0.9%) | | |
| Mead Johnson Nutrition Co. | 41,826 | 3,216,001 |
|
| S&W Seed Co. † S | 117,745 | 733,551 |
|
| | | 3,949,552 |
| Health-care equipment and supplies (2.7%) | | |
| Baxter International, Inc. | 51,400 | 3,510,620 |
|
| GenMark Diagnostics, Inc. † S | 119,227 | 1,540,413 |
|
| St. Jude Medical, Inc. | 48,300 | 2,933,259 |
|
| Zeltiq Aesthetics, Inc. † | 29,697 | 608,492 |
|
| Zimmer Holdings, Inc. | 34,400 | 3,232,568 |
|
| | | 11,825,352 |
| Health-care providers and services (1.4%) | | |
| Catamaran Corp. † | 61,400 | 2,985,268 |
|
| Express Scripts Holding Co. † | 24,600 | 1,837,374 |
|
| LifePoint Hospitals, Inc. † | 25,900 | 1,372,959 |
|
| | | 6,195,601 |
| |
| Growth Opportunities Fund | 25 |
| | |
| COMMON STOCKS (98.5%)* cont. | Shares | Value |
|
| Hotels, restaurants, and leisure (3.6%) | | |
| Bloomin’ Brands, Inc. † | 74,895 | $1,720,338 |
|
| Hilton Worldwide Holdings, Inc. † | 142,459 | 3,084,237 |
|
| Marriott International, Inc. Class A | 75,700 | 3,732,010 |
|
| Starbucks Corp. | 47,900 | 3,406,648 |
|
| Wyndham Worldwide Corp. | 50,734 | 3,599,070 |
|
| | | 15,542,303 |
| Household durables (0.7%) | | |
| Panasonic Corp. (Japan) | 88,600 | 1,026,744 |
|
| Whirlpool Corp. | 15,200 | 2,026,160 |
|
| | | 3,052,904 |
| Independent power producers and energy traders (0.4%) | | |
| Calpine Corp. † | 90,132 | 1,710,705 |
|
| | | 1,710,705 |
| Industrial conglomerates (0.7%) | | |
| Siemens AG (Germany) | 22,595 | 2,863,324 |
|
| | | 2,863,324 |
| Insurance (1.3%) | | |
| American International Group, Inc. | 46,400 | 2,225,344 |
|
| Hartford Financial Services Group, Inc. (The) | 78,100 | 2,596,825 |
|
| Prudential PLC (United Kingdom) | 50,751 | 1,024,514 |
|
| | | 5,846,683 |
| Internet and catalog retail (4.5%) | | |
| Amazon.com, Inc. † | 19,300 | 6,922,717 |
|
| Bigfoot GmbH (acquired 8/2/13, cost $395,677) (Private) | | |
| (Brazil) † ∆∆ F | 18 | 301,281 |
|
| Ctrip.com International, Ltd. ADR (China) † S | 19,484 | 769,813 |
|
| Groupon, Inc. † S | 127,200 | 1,330,512 |
|
| Priceline.com, Inc. † | 8,350 | 9,559,832 |
|
| Zalando AG (acquired 9/30/13, cost $672,602) (Private) | | |
| (Germany) † ∆∆ F | 15 | 569,958 |
|
| | | 19,454,113 |
| Internet software and services (8.7%) | | |
| Baidu, Inc. ADR (China) † | 12,300 | 1,924,950 |
|
| eBay, Inc. † | 83,400 | 4,436,880 |
|
| Facebook, Inc. Class A † | 122,400 | 7,658,568 |
|
| Google, Inc. Class A † | 20,365 | 24,050,454 |
|
| | | 38,070,852 |
| IT Services (3.9%) | | |
| Cognizant Technology Solutions Corp. † | 22,100 | 2,141,932 |
|
| Computer Sciences Corp. | 16,300 | 984,683 |
|
| MasterCard, Inc. Class A | 27,000 | 2,043,360 |
|
| Visa, Inc. Class A | 54,000 | 11,633,220 |
|
| | | 16,803,195 |
| Leisure equipment and products (0.2%) | | |
| Sega Sammy Holdings, Inc. (Japan) | 43,000 | 1,035,754 |
|
| | | 1,035,754 |
| Life sciences tools and services (1.7%) | | |
| PerkinElmer, Inc. | 43,300 | 1,887,880 |
|
| Thermo Fisher Scientific, Inc. | 48,240 | 5,554,354 |
|
| | | 7,442,234 |
| |
| 26 | Growth Opportunities Fund |
| | |
| COMMON STOCKS (98.5%)* cont. | Shares | Value |
|
| Machinery (1.0%) | | |
| Caterpillar, Inc. S | 14,700 | $1,380,477 |
|
| Ingersoll-Rand PLC | 25,800 | 1,516,782 |
|
| TriMas Corp. † | 36,829 | 1,281,649 |
|
| | | 4,178,908 |
| Marine (0.4%) | | |
| Kirby Corp. † | 16,500 | 1,646,535 |
|
| | | 1,646,535 |
| Media (4.5%) | | |
| CBS Corp. Class B (non-voting shares) | 74,500 | 4,374,640 |
|
| Comcast Corp. Class A | 99,300 | 5,406,885 |
|
| DISH Network Corp. Class A † | 26,600 | 1,499,708 |
|
| Liberty Global PLC Class A (United Kingdom) † | 46,000 | 3,676,780 |
|
| Madison Square Garden Co. (The) Class A † | 39,400 | 2,286,382 |
|
| Rightmove PLC (United Kingdom) | 15,637 | 650,867 |
|
| Time Warner Cable, Inc. | 4,200 | 559,734 |
|
| Time Warner, Inc. | 18,200 | 1,143,506 |
|
| | | 19,598,502 |
| Metals and mining (0.2%) | | |
| Constellium NV Class A (Netherlands) † | 33,700 | 873,167 |
|
| | | 873,167 |
| Multiline retail (0.6%) | | |
| Dollar General Corp. † | 48,568 | 2,735,350 |
|
| | | 2,735,350 |
| Oil, gas, and consumable fuels (2.9%) | | |
| Anadarko Petroleum Corp. | 28,437 | 2,294,582 |
|
| Energy Transfer Equity LP | 36,900 | 1,539,468 |
|
| EOG Resources, Inc. | 15,500 | 2,561,220 |
|
| Gulfport Energy Corp. † | 27,800 | 1,694,410 |
|
| Kodiak Oil & Gas Corp. † | 183,000 | 1,941,630 |
|
| QEP Resources, Inc. | 81,800 | 2,526,802 |
|
| | | 12,558,112 |
| Paper and forest products (0.5%) | | |
| International Paper Co. | 44,500 | 2,124,430 |
|
| | | 2,124,430 |
| Personal products (0.4%) | | |
| Coty, Inc. Class A | 125,932 | 1,698,823 |
|
| | | 1,698,823 |
| Pharmaceuticals (5.0%) | | |
| AbbVie, Inc. | 33,000 | 1,624,590 |
|
| Actavis PLC † | 40,000 | 7,559,200 |
|
| Allergan, Inc. | 35,700 | 4,091,220 |
|
| Astellas Pharma, Inc. (Japan) | 30,000 | 1,878,634 |
|
| AstraZeneca PLC ADR (United Kingdom) S | 40,200 | 2,552,700 |
|
| Bristol-Myers Squibb Co. | 34,900 | 1,743,953 |
|
| Eli Lilly & Co. | 43,800 | 2,365,638 |
|
| | | 21,815,935 |
| Professional services (0.5%) | | |
| Nielsen Holdings NV | 51,000 | 2,156,790 |
|
| | | 2,156,790 |
| Real estate investment trusts (REITs) (0.9%) | | |
| Altisource Residential Corp. (Virgin Islands) | 32,369 | 971,070 |
|
| American Tower Corp. | 36,000 | 2,911,680 |
|
| | | 3,882,750 |
| |
| Growth Opportunities Fund | 27 |
| | | | |
| COMMON STOCKS (98.5%)* cont. | | | Shares | Value |
|
| Real estate management and development (0.4%) | | | |
| RE/MAX Holdings, Inc. Class A † | | | 53,670 | $1,565,017 |
|
| | | | | 1,565,017 |
| Road and rail (1.8%) | | | | |
| Genesee & Wyoming, Inc. Class A † | | | 11,500 | 1,038,910 |
|
| Union Pacific Corp. | | | 40,300 | 7,021,872 |
|
| | | | | 8,060,782 |
| Semiconductors and semiconductor equipment (1.9%) | | | |
| Applied Materials, Inc. | | | 118,400 | 1,991,488 |
|
| Fairchild Semiconductor International, Inc. † | | | 80,700 | 1,029,732 |
|
| Magnachip Semiconductor Corp. (South Korea) † | | | 54,633 | 863,748 |
|
| Micron Technology, Inc. † | | | 190,221 | 4,382,692 |
|
| | | | | 8,267,660 |
| Software (5.0%) | | | | |
| Electronic Arts, Inc. † | | | 116,800 | 3,083,520 |
|
| Mentor Graphics Corp. | | | 79,100 | 1,645,280 |
|
| Microsoft Corp. | | | 101,100 | 3,826,635 |
|
| Oracle Corp. | | | 145,900 | 5,383,710 |
|
| Red Hat, Inc. † | | | 64,500 | 3,644,250 |
|
| ServiceNow, Inc. † | | | 14,800 | 938,764 |
|
| SS&C Technologies Holdings, Inc. † | | | 41,958 | 1,628,810 |
|
| TiVo, Inc. † | | | 139,500 | 1,728,405 |
|
| | | | | 21,879,374 |
| Specialty retail (2.0%) | | | | |
| Bed Bath & Beyond, Inc. † S | | | 18,300 | 1,168,455 |
|
| Home Depot, Inc. (The) | | | 49,700 | 3,819,445 |
|
| TJX Cos., Inc. (The) | | | 66,200 | 3,797,232 |
|
| | | | | 8,785,132 |
| Textiles, apparel, and luxury goods (1.7%) | | | | |
| Michael Kors Holdings, Ltd. (Hong Kong) † | | | 31,300 | 2,501,809 |
|
| NIKE, Inc. Class B | | | 45,900 | 3,343,815 |
|
| Tumi Holdings, Inc. † | | | 70,800 | 1,418,124 |
|
| | | | | 7,263,748 |
| Tobacco (0.9%) | | | | |
| Philip Morris International, Inc. | | | 50,600 | 3,953,882 |
|
| | | | | 3,953,882 |
| Wireless telecommunication services (0.6%) | | | | |
| Vodafone Group PLC ADR (United Kingdom) | | | 74,400 | 2,757,264 |
|
| | | | | 2,757,264 |
| | | | | |
| Total common stocks (cost $346,423,254) | | | | $429,660,680 |
| |
| WARRANTS (—%)*† | Expiration | Strike | | |
| | date | price | Warrants | Value |
|
| Citigroup, Inc. | 1/4/19 | $106.10 | 163,930 | $103,604 |
|
| Neuralstem, Inc. Ser. J F | 1/3/19 | 3.64 | 82,533 | — |
|
| Total warrants (cost $165,569) | | | | $103,604 |
| |
| 28 | Growth Opportunities Fund |
| | |
| SHORT-TERM INVESTMENTS (4.3%)* | Principal amount/shares | Value |
|
| Putnam Cash Collateral Pool, LLC 0.15% d | 10,878,000 | $10,878,000 |
|
| Putnam Short Term Investment Fund 0.07% L | 7,439,131 | 7,439,131 |
|
| U.S. Treasury Bills with an effective yield of 0.10%, | | |
| January 8, 2015 ∆ | $466,000 | 465,605 |
|
| U.S. Treasury Bills with effective yields ranging from 0.09% | | |
| to 0.10%, August 21, 2014 ∆ | 110,000 | 109,962 |
|
| Total short-term investments (cost $18,892,630) | | $18,892,698 |
| |
| TOTAL INVESTMENTS | | |
|
| Total investments (cost $365,481,453) | | $448,656,982 |
Key to holding’s abbreviations
| |
| ADR | American Depository Receipts: represents ownership of foreign securities on deposit with a |
| | custodian bank |
| OTC | Over-the-counter |
Notes to the fund’s portfolio
Unless noted otherwise, the notes to the fund’s portfolio are for the close of the fund’s reporting period, which ran from August 1, 2013 through January 31, 2014 (the reporting period). Within the following notes to the portfolio, references to “ASC 820” represent Accounting Standards Codification 820 Fair Value Measurements and Disclosures and references to “OTC”, if any, represent over-the-counter.
* Percentages indicated are based on net assets of $436,031,384.
† Non-income-producing security.
∆∆ Security is restricted with regard to public resale. The total fair value of this security and any other restricted securities (excluding 144A securities), if any, held at the close of the reporting period was $871,239, or 0.2% of net assets.
∆ This security, in part or in entirety, was pledged and segregated with the custodian for collateral on certain derivative contracts at the close of the reporting period.
d Affiliated company. See Note 1 to the financial statements regarding securities lending. The rate quoted in the security description is the annualized 7-day yield of the fund at the close of the reporting period.
F Security is valued at fair value following procedures approved by the Trustees. Securities may be classified as Level 2 or Level 3 for ASC 820 based on the securities’ valuation inputs.
L Affiliated company (Note 5). The rate quoted in the security description is the annualized 7-day yield of the fund at the close of the reporting period.
S Security on loan, in part or in entirety, at the close of the reporting period (Note 1).
At the close of the reporting period, the fund maintained liquid assets totaling $62,358 to cover certain derivatives contracts.
FORWARD CURRENCY CONTRACTS at 1/31/14 (aggregate face value $8,316,440) (Unaudited)
| | | | | | |
| | | | | | Unrealized |
| | Contract | Delivery | | Aggregate | appreciation/ |
| Counterparty | Currency | type | date | Value | face value | (depreciation) |
|
| Barclays Bank PLC | | | | | |
| Japanese Yen | Sell | 2/19/14 | $5,374,373 | $5,325,585 | $(48,788) |
|
| UBS AG | | | | | |
| Euro | Sell | 3/19/14 | 2,996,315 | 2,990,855 | (5,460) |
|
| Total | | | | | $(54,248) |
| |
| Growth Opportunities Fund | 29 |
OTC TOTAL RETURN SWAP CONTRACTS OUTSTANDING at 1/31/14 (Unaudited)
| | | | | | | |
| | | Upfront | | | Payments | Total return | Unrealized |
| Swap counterparty/ | premium | Termination | | received (paid) by | received by | appreciation/ |
| Notional amount | received (paid) | date | | fund per annum | or paid by fund | (depreciation) |
|
| Deutsche Bank AG | | | | | | |
| baskets | 34,139 | $— | 9/15/14 | | (3 month USD- | A basket | $(21,404) |
| | | | | | LIBOR-BBA plus | (DBCTPU7P) of | |
| | | | | | 0.36%) | common stocks | |
|
| Total | | $— | | | | | $(21,404) |
ASC 820 establishes a three-level hierarchy for disclosure of fair value measurements. The valuation hierarchy is based upon the transparency of inputs to the valuation of the fund’s investments. The three levels are defined as follows:
Level 1: Valuations based on quoted prices for identical securities in active markets.
Level 2: Valuations based on quoted prices in markets that are not active or for which all significant inputs are observable, either directly or indirectly.
Level 3: Valuations based on inputs that are unobservable and significant to the fair value measurement.
The following is a summary of the inputs used to value the fund’s net assets as of the close of the reporting period:
| | | |
| | | Valuation inputs | |
|
| Investments in securities: | Level 1 | Level 2 | Level 3 |
|
| Common stocks*: | | | |
|
| Consumer discretionary | $80,491,701 | $— | $871,239 |
|
| Consumer staples | 29,992,395 | — | — |
|
| Energy | 22,073,481 | — | — |
|
| Financials | 25,143,967 | 1,587,900 | — |
|
| Health care | 75,081,883 | — | — |
|
| Industrials | 51,911,199 | — | — |
|
| Information technology | 120,977,243 | — | — |
|
| Materials | 17,061,703 | — | — |
|
| Telecommunication services | 2,757,264 | — | — |
|
| Utilities | 1,710,705 | — | — |
|
| Total common stocks | 427,201,541 | 1,587,900 | 871,239 |
| | | | |
| Warrants | 103,604 | — | — |
|
| Short-term investments | 7,439,131 | 11,453,567 | — |
|
| Totals by level | $434,744,276 | $13,041,467 | $871,239 |
| | | | |
| | | Valuation inputs | |
|
| Other financial instruments: | Level 1 | Level 2 | Level 3 |
|
| Forward currency contracts | $— | $(54,248) | $— |
|
| Total return swap contracts | — | (21,404) | — |
|
| Totals by level | $— | $(75,652) | $— |
* Common stock classifications are presented at the sector level, which may differ from the fund’s portfolio presentation.
At the start and close of the reporting period, Level 3 investments in securities were not considered a significant portion of the fund’s portfolio.
The accompanying notes are an integral part of these financial statements.
| |
| 30 | Growth Opportunities Fund |
Statement of assets and liabilities 1/31/14 (Unaudited)
| |
| ASSETS | |
|
| Investment in securities, at value, including $9,305,407 of securities on loan (Note 1): | |
| Unaffiliated issuers (identified cost $347,164,322) | $430,339,851 |
| Affiliated issuers (identified cost $18,317,131) (Notes 1 and 5) | 18,317,131 |
|
| Dividends, interest and other receivables | 252,285 |
|
| Receivable for shares of the fund sold | 191,554 |
|
| Receivable for investments sold | 7,583,426 |
|
| Total assets | 456,684,247 |
| |
| LIABILITIES | |
|
| Payable for investments purchased | 8,205,428 |
|
| Payable for shares of the fund repurchased | 593,424 |
|
| Payable for compensation of Manager (Note 2) | 203,537 |
|
| Payable for custodian fees (Note 2) | 12,498 |
|
| Payable for investor servicing fees (Note 2) | 151,573 |
|
| Payable for Trustee compensation and expenses (Note 2) | 226,873 |
|
| Payable for administrative services (Note 2) | 744 |
|
| Payable for distribution fees (Note 2) | 117,262 |
|
| Unrealized depreciation on OTC swap contracts (Note 1) | 21,404 |
|
| Unrealized depreciation on forward currency contracts (Note 1) | 54,248 |
|
| Collateral on securities loaned, at value (Note 1) | 10,878,000 |
|
| Other accrued expenses | 187,872 |
|
| Total liabilities | 20,652,863 |
| | |
| Net assets | $436,031,384 |
|
| |
| REPRESENTED BY | |
|
| Paid-in capital (Unlimited shares authorized) (Notes 1 and 4) | $305,642,903 |
|
| Distributions in excess of net investment income (Note 1) | (81,452) |
|
| Accumulated net realized gain on investments and foreign currency transactions (Note 1) | 47,371,422 |
|
| Net unrealized appreciation of investments and assets and liabilities in foreign currencies | 83,098,511 |
|
| Total — Representing net assets applicable to capital shares outstanding | $436,031,384 |
(Continued on next page)
| |
| Growth Opportunities Fund | 31 |
Statement of assets and liabilities (Continued)
| |
| COMPUTATION OF NET ASSET VALUE AND OFFERING PRICE | |
|
| Net asset value and redemption price per class A share | |
| ($366,407,236 divided by 15,384,028 shares) | $23.82 |
|
| Offering price per class A share (100/94.25 of $23.82)* | $25.27 |
|
| Net asset value and offering price per class B share ($20,777,033 divided by 974,587 shares)** | $21.32 |
|
| Net asset value and offering price per class C share ($17,878,133 divided by 826,968 shares)** | $21.62 |
|
| Net asset value and redemption price per class M share ($5,428,973 divided by 244,763 shares) | $22.18 |
|
| Offering price per class M share (100/96.50 of $22.18)* | $22.98 |
|
| Net asset value, offering price and redemption price per class R share | |
| ($2,700,122 divided by 115,913 shares) | $23.29 |
|
| Net asset value, offering price and redemption price per class R5 share | |
| ($14,478 divided by 587 shares)† | $24.64 |
|
| Net asset value, offering price and redemption price per class R6 share | |
| ($7,966,814 divided by 323,379 shares) | $24.64 |
|
| Net asset value, offering price and redemption price per class Y share | |
| ($14,858,595 divided by 604,339 shares) | $24.59 |
|
* On single retail sales of less than $50,000. On sales of $50,000 or more the offering price is reduced.
** Redemption price per share is equal to net asset value less any applicable contingent deferred sales charge.
† Net asset value may not recalculate due to the rounding of fractional shares.
The accompanying notes are an integral part of these financial statements.
| |
| 32 | Growth Opportunities Fund |
Statement of operations Six months ended 1/31/14 (Unaudited)
| |
| INVESTMENT INCOME | |
|
| Dividends (net of foreign tax of $27,200) | $2,404,985 |
|
| Interest (including interest income of $2,890 from investments in affiliated issuers) (Note 5) | 2,939 |
|
| Securities lending (Note 1) | 20,052 |
|
| Total investment income | 2,427,976 |
| |
| EXPENSES | |
|
| Compensation of Manager (Note 2) | 1,125,383 |
|
| Investor servicing fees (Note 2) | 474,898 |
|
| Custodian fees (Note 2) | 13,387 |
|
| Trustee compensation and expenses (Note 2) | 14,634 |
|
| Distribution fees (Note 2) | 656,653 |
|
| Administrative services (Note 2) | 6,924 |
|
| Other | 179,008 |
|
| Total expenses | 2,470,887 |
| | |
| Expense reduction (Note 2) | (6,785) |
|
| Net expenses | 2,464,102 |
| | |
| Net investment loss | (36,126) |
|
| |
| Net realized gain on investments (Notes 1 and 3) | 47,035,962 |
|
| Net realized gain on swap contracts (Note 1) | 824,706 |
|
| Net realized loss on foreign currency transactions (Note 1) | (3,397) |
|
| Net unrealized depreciation of assets and liabilities in foreign currencies during the period | (54,884) |
|
| Net unrealized appreciation of investments and swap contracts during the period | 2,752,465 |
|
| Net gain on investments | 50,554,852 |
| | |
| Net increase in net assets resulting from operations | $50,518,726 |
|
The accompanying notes are an integral part of these financial statements.
| |
| Growth Opportunities Fund | 33 |
Statement of changes in net assets
| | |
| INCREASE IN NET ASSETS | Six months ended 1/31/14* | Year ended 7/31/13 |
|
| Operations: | | |
| Net investment income (loss) | $(36,126) | $776,598 |
|
| Net realized gain on investments | | |
| and foreign currency transactions | 47,857,271 | 46,371,527 |
|
| Net unrealized appreciation of investments and assets | | |
| and liabilities in foreign currencies | 2,697,581 | 33,940,640 |
|
| Net increase in net assets resulting from operations | 50,518,726 | 81,088,765 |
|
| Distributions to shareholders (Note 1): | | |
| From ordinary income | | |
| Net investment income | | |
|
| Class A | (711,598) | (977,102) |
|
| Class B | — | — |
|
| Class C | — | — |
|
| Class M | — | — |
|
| Class R | (2,478) | (710) |
|
| Class R5 | (53) | (62) |
|
| Class R6 | (34,181) | (14,992) |
|
| Class Y | (46,017) | (104,112) |
|
| From net realized long-term gain on investments | | |
| Class A | (14,765,563) | — |
|
| Class B | (958,664) | — |
|
| Class C | (788,150) | — |
|
| Class M | (234,014) | — |
|
| Class R | (107,303) | — |
|
| Class R5 | (560) | — |
|
| Class R6 | (312,330) | — |
|
| Class Y | (558,003) | — |
|
| Increase in capital from settlement payments | 1,251,118 | — |
|
| Redemption fees (Note 1) | — | 49 |
|
| Increase (decrease) from capital share transactions (Note 4) | 9,748,956 | (23,705,538) |
|
| Total increase in net assets | 42,999,886 | 56,286,298 |
| |
| NET ASSETS | | |
|
| Beginning of period | 393,031,498 | 336,745,200 |
|
| End of period (including distributions in excess of net | | |
| investment income of $81,452 and undistributed net | | |
| investment income of $749,001, respectively) | $436,031,384 | $393,031,498 |
|
* Unaudited
The accompanying notes are an integral part of these financial statements.
| |
| 34 | Growth Opportunities Fund |
|
| This page left blank intentionally. |
| |
| Growth Opportunities Fund | 35 |
Financial highlights (For a common share outstanding throughout the period)
| | | | | | | | | | | | | | | | |
| INVESTMENT OPERATIONS: | LESS DISTRIBUTIONS: | | | | RATIOS AND SUPPLEMENTAL DATA: |
|
| | | | | | | | | | | | | | | | Ratio of | |
| | Net asset | Net | Net realized | | From | From | | | | | | | | Ratio | net investment | |
| | value, | investment | and unrealized | Total from | net | net realized | From | | | | | | Net assets, | of expenses | income (loss) | |
| | beginning | income | gain (loss) | investment | investment | gain | return | Total | Redemption | Non-recurring | Net asset value, | Total return at net | end of period | to average | to average | Portfolio |
| Period ended | of period | (loss) a | on investments | operations | income | on investments | of capital | distributions | fees | reimbursements | end of period | asset value (%) b | (in thousands) | net assets (%) c | net assets (%) | turnover (%) |
|
| Class A | | | | | | | | | | | | | | | | |
| January 31, 2014** | $21.94 | — d | 2.86 | 2.86 | (.05) | (1.00) | — | (1.05) | — | .07 e | $23.82 | 13.41 * | $366,407 | .56 * | .02 * | 51 * |
| July 31, 2013 | 17.57 | .05 | 4.38 | 4.43 | (.06) | — | — | (.06) | — d | — | 21.94 | 25.30 | 330,392 | 1.13 | .28 | 3 |
| July 31, 2012 | 17.18 | .05 | .34 | .39 | — | — | — | — | — d | — | 17.57 | 2.27 | 282,145 | 1.17 | .32 | 56 |
| July 31, 2011 | 13.82 | (.01) | 3.35 f | 3.34 | — | — | — | — | — d | .02 g | 17.18 | 24.31 f | 295,289 | 1.22 | (.05) | 68 |
| July 31, 2010 | 12.24 | (.02) | 1.66 h | 1.64 | (.06) | — | — d | (.06) | — d | — | 13.82 | 13.39 h | 261,202 | 1.32 i | (.17) i | 96 |
| July 31, 2009 | 13.54 | .05 | (1.35) j | (1.30) | — | — | — | — | — d | — d,k | 12.24 | (9.60) j | 254,606 | 1.27 i | .49 i | 160 |
|
| Class B | | | | | | | | | | | | | | | | |
| January 31, 2014** | $19.77 | (.07) | 2.56 | 2.49 | — | (1.00) | — | (1.00) | — | .06 e | $21.32 | 12.96 * | $20,777 | .94 * | (.35) * | 51 * |
| July 31, 2013 | 15.89 | (.08) | 3.96 | 3.88 | — | — | — | — | — d | — | 19.77 | 24.42 | 19,926 | 1.88 | (.46) | 89 |
| July 31, 2012 | 15.66 | (.06) | .29 | .23 | — | — | — | — | — d | — | 15.89 | 1.47 | 18,678 | 1.92 | (.43) | 56 |
| July 31, 2011 | 12.69 | (.12) | 3.07 f | 2.95 | — | — | — | — | — d | .02 g | 15.66 | 23.40 f | 24,683 | 1.97 | (.80) | 68 |
| July 31, 2010 | 11.28 | (.11) | 1.52 h | 1.41 | — | — | — | — | — d | — | 12.69 | 12.50 h | 28,983 | 2.07 i | (.91) i | 96 |
| July 31, 2009 | 12.57 | (.02) | (1.27) j | (1.29) | — | — | — | — | — d | — d,k | 11.28 | (10.26) j | 37,357 | 2.02 i | (.20) i | 160 |
|
| Class C | | | | | | | | | | | | | | | | |
| January 31, 2014** | $20.03 | (.08) | 2.61 | 2.53 | — | (1.00) | — | (1.00) | — | .06 e | $21.62 | 12.99 * | $17,878 | .94 * | (.36) * | 51 * |
| July 31, 2013 | 16.10 | (.08) | 4.01 | 3.93 | — | — | — | — | — d | — | 20.03 | 24.41 | 15,402 | 1.88 | (.47) | 89 |
| July 31, 2012 | 15.87 | (.07) | .30 | .23 | — | — | — | — | — d | — | 16.10 | 1.45 | 13,099 | 1.92 | (.43) | 56 |
| July 31, 2011 | 12.86 | (.12) | 3.11 f | 2.99 | — | — | — | — | — d | .02 g | 15.87 | 23.41 f | 13,781 | 1.97 | (.80) | 68 |
| July 31, 2010 | 11.43 | (.12) | 1.55 h | 1.43 | — | — | — | — | — d | — | 12.86 | 12.51 h | 12,321 | 2.07 i | (.92) i | 96 |
| July 31, 2009 | 12.74 | (.02) | (1.29) j | (1.31) | — | — | — | — | — d | — d,k | 11.43 | (10.28) j | 12,159 | 2.02 i | (.25) i | 160 |
|
| Class M | | | | | | | | | | | | | | | | |
| January 31, 2014** | $20.50 | (.05) | 2.66 | 2.61 | — | (1.00) | — | (1.00) | — | .07 e | $22.18 | 13.14 * | $5,429 | .82 * | (.23) * | 51 * |
| July 31, 2013 | 16.44 | (.04) | 4.10 | 4.06 | — | — | — | — | — d | — | 20.50 | 24.70 | 5,041 | 1.63 | (.21) | 89 |
| July 31, 2012 | 16.17 | (.03) | .30 | .27 | — | — | — | — | — d | — | 16.44 | 1.67 | 4,588 | 1.67 | (.18) | 56 |
| July 31, 2011 | 13.07 | (.09) | 3.17 f | 3.08 | — | — | — | — | — d | .02 g | 16.17 | 23.72 f | 5,271 | 1.72 | (.55) | 68 |
| July 31, 2010 | 11.58 | (.09) | 1.58 h | 1.49 | — d | — | — d | — d | — d | — | 13.07 | 12.88 h | 4,460 | 1.82 i | (.67) i | 96 |
| July 31, 2009 | 12.88 | — d | (1.30) j | (1.30) | — | — | — | — | — d | — d,k | 11.58 | (10.09) j | 4,470 | 1.77 i | — i,l | 160 |
|
| Class R | | | | | | | | | | | | | | | | |
| January 31, 2014** | $21.48 | (.02) | 2.78 | 2.76 | (.02) | (1.00) | — | (1.02) | — | .07 e | $23.29 | 13.25 * | $2,700 | .69 * | (.11) * | 51 * |
| July 31, 2013 | 17.19 | — d | 4.30 | 4.30 | (.01) | — | — | (.01) | — d | — | 21.48 | 25.01 | 2,270 | 1.38 | .01 | 89 |
| July 31, 2012 | 16.86 | .01 | .32 | .33 | — | — | — | — | — d | — | 17.19 | 1.96 | 1,632 | 1.42 | .06 | 56 |
| July 31, 2011 | 13.59 | (.05) | 3.30 f | 3.25 | — | — | — | — | — d | .02 g | 16.86 | 24.06 f | 630 | 1.47 | (.31) | 68 |
| July 31, 2010 | 12.05 | (.06) | 1.64 h | 1.58 | (.04) | — | — d | (.04) | — d | — | 13.59 | 13.08 h | 241 | 1.57 i | (.43) i | 96 |
| July 31, 2009 | 13.36 | .02 | (1.33) j | (1.31) | — | — | — | — | — d | — d,k | 12.05 | (9.81) j | 183 | 1.52 i | .22 i | 160 |
|
| Class R5 | | | | | | | | | | | | | | | | |
| January 31, 2014** | $22.67 | .05 | 2.95 | 3.00 | (.10) | (1.00) | — | (1.10) | — | .07 e | $24.64 | 13.59 * | $14 | .40 * | .19 * | 51 * |
| July 31, 2013 | 18.12 | .13 | 4.53 | 4.66 | (.11) | — | — | (.11) | — | — | 22.67 | 25.82 | 13 | .75 | .65 | 89 |
| July 31, 2012† | 17.89 | — d | .23 | .23 | — | — | — | — | — | — | 18.12 | 1.29 * | 10 | .06 * | (.01) * | 56 |
|
| Class R6 | | | | | | | | | | | | | | | | |
| January 31, 2014** | $22.67 | .06 | 2.95 | 3.01 | (.11) | (1.00) | — | (1.11) | — | .07 e | $24.64 | 13.65 * | $7,967 | .35 * | .23 * | 51 * |
| July 31, 2013 | 18.12 | .11 m | 4.57 | 4.68 | (.13) | — | — | (.13) | — d | — | 22.67 | 25.94 | 6,821 | .65 | .47 m | 89 |
| July 31, 2012† | 17.89 | — d | .23 | .23 | — | — | — | — | — | — | 18.12 | 1.29 * | 10 | .05 * | — *l | 56 |
|
See notes to financial highlights at the end of this section.
The accompanying notes are an integral part of these financial statements.
| | | |
| 36 | Growth Opportunities Fund | Growth Opportunities Fund | 37 |
Financial highlights (Continued)
| | | | | | | | | | | | | | | | |
| INVESTMENT OPERATIONS: | | LESS DISTRIBUTIONS: | | | | | RATIOS AND SUPPLEMENTAL DATA: |
|
| | | | | | | | | | | | | | | | Ratio of | |
| | Net asset | Net | Net realized | | From | From | | | | | | | | Ratio | net investment | |
| | value, | investment | and unrealized | Total from | net | net realized | From | | | | | | Net assets, | of expenses | income (loss) | |
| | beginning | income | gain (loss) | investment | investment | gain | return | Total | Redemption | Non-recurring | Net asset value, | Total return at net | end of period | to average | to average | Portfolio |
| Period ended | of period | (loss) a | on investments | operations | income | on investments | of capital | distributions | fees | reimbursements | end of period | asset value (%) b | (in thousands) | net assets (%) c | net assets (%) | turnover (%) |
|
| Class Y | | | | | | | | | | | | | | | | |
| January 31, 2014** | $22.62 | .04 | 2.94 | 2.98 | (.08) | (1.00) | — | (1.08) | — | .07 e | $24.59 | 13.56 * | $14,859 | .44 * | .15 * | 51 * |
| July 31, 2013 | 18.12 | .11 | 4.51 | 4.62 | (.12) | — | — | (.12) | — d | — | 22.62 | 25.60 | 13,166 | .88 | .57 | 89 |
| July 31, 2012 | 17.68 | .10 | .34 | .44 | — | — | — | — | — d | — | 18.12 | 2.49 | 16,582 | .92 | .57 | 56 |
| July 31, 2011 | 14.18 | .03 | 3.45 f | 3.48 | — | — | — | — | — d | .02 g | 17.68 | 24.68 f | 12,395 | .97 | .19 | 68 |
| July 31, 2010 | 12.55 | .01 | 1.71 h | 1.72 | (.09) | — | — d | (.09) | — d | — | 14.18 | 13.69 h | 6,163 | 1.07 i | .08 i | 96 |
| July 31, 2009 | 13.85 | .08 | (1.38) j | (1.30) | — | — | — | — | — d | — d,k | 12.55 | (9.39) j | 5,638 | 1.02 i | .73 i | 160 |
|
* Not annualized.
** Unaudited.
† For the period July 3, 2012 (commencement of operations) to July 31, 2012.
a Per share net investment income (loss) has been determined on the basis of the weighted average number of shares outstanding during the period.
b Total return assumes dividend reinvestment and does not reflect the effect of sales charges.
c Includes amounts paid through expense offset and/or brokerage/service arrangements (Note 2).
d Amount represents less than $0.01 per share.
e Reflects a non-recurring reimbursement pursuant to a settlement between the Securities and Exchange Commission (the SEC) and Morgan Stanley & Co. which amounted to the following per share outstanding on November 27, 2013:
| | |
| | Per share | |
| |
| Class A | $0.07 | |
| |
| Class B | 0.06 | |
| |
| Class C | 0.06 | |
| |
| Class M | 0.07 | |
| |
| Class R | 0.07 | |
| |
| Class R5 | 0.07 | |
| |
| Class R6 | 0.07 | |
| |
| Class Y | 0.07 | |
| |
f Reflects a non-recurring litigation payment received by the fund from Enron Corporation which amounted to the following amounts per share outstanding on January 19, 2011:
| | |
| | Per share | |
| |
| Class A | $0.15 | |
| |
| Class B | 0.14 | |
| |
| Class C | 0.14 | |
| |
| Class M | 0.14 | |
| |
| Class R | 0.15 | |
| |
| Class Y | 0.15 | |
| |
This payment resulted in an increase to total returns of 1.08% for the year ended July 31, 2011.
g Reflects a non-recurring reimbursement related to restitution amounts in connection with a distribution plan approved by the SEC, which amounted to $0.02 per share outstanding on July 21, 2011. Also reflects a non-recurring reimbursement related to short-term trading related lawsuits, which amounted to less than $0.01 per share outstanding on May 11, 2011.
h Reflects a non-recurring litigation payment received by the fund from Enron Corporation which amounted to the following amounts per share outstanding on December 28, 2009:
| | |
| | Per share | |
| |
| Class A | $0.09 | |
| |
| Class B | 0.09 | |
| |
| Class C | 0.09 | |
| |
| Class M | 0.09 | |
| |
| Class R | 0.09 | |
| |
| Class Y | 0.10 | |
| |
This payment resulted in an increase to total returns of 0.74% for the year ended July 31, 2010.
i Reflects an involuntary contractual expense limitation in effect during the period. For periods prior to July 31, 2010, certain fund expenses were waived in connection with the fund’s investment in Putnam Prime Money Market Fund. As a result of such limitation and/or waivers, the expenses of each class reflect a reduction of the following amounts:
| | |
| | Percentage of | |
| | average net assets | |
| |
| July 31, 2010 | 0.05% | |
| |
| July 31, 2009 | 0.25 | |
| |
j Reflects a non-recurring litigation payment received by the fund from Enron Corporation which amounted to the following amounts per share outstanding on December 29, 2008:
| | |
| | Per share | |
| |
| Class A | $0.44 | |
| |
| Class B | 0.41 | |
| |
| Class C | 0.41 | |
| |
| Class M | 0.42 | |
| |
| Class R | 0.43 | |
| |
| Class Y | 0.45 | |
| |
This payment resulted in an increase to total returns of 3.25% for the year ended July 31, 2009.
k Reflects a non-recurring reimbursement pursuant to a settlement between the SEC and Millennium Partners, L.P., Millennium Management, L.L.C., and Millennium International Management, L.L.C., which amounted to less than $0.01 per share outstanding on June 23, 2009.
l Amount represents less than 0.01% of average net assets.
m The net investment income ratio and per share amount shown for the period ending July 31, 2013 may not correspond with the expected class specific differences for the period due to the timing of subscriptions into the class.
| |
| The accompanying notes are an integral part of these financial statements. | The accompanying notes are an integral part of these financial statements. |
| | | |
| 38 | Growth Opportunities Fund | Growth Opportunities Fund | 39 |
Notes to financial statements 1/31/14 (Unaudited)
Within the following Notes to financial statements, references to “State Street” represent State Street Bank and Trust Company, references to “the SEC” represent the Securities and Exchange Commission, references to “Putnam Management” represent Putnam Investment Management, LLC, the fund’s manager, an indirect wholly-owned subsidiary of Putnam Investments, LLC and references to “OTC”, if any, represent over-the-counter. Unless otherwise noted, the “reporting period” represents the period from August 1, 2013 through January 31, 2014.
Putnam Growth Opportunities Fund (the fund) is a diversified series of Putnam Investment Funds (the Trust), a Massachusetts business trust registered under the Investment Company Act of 1940, as amended, as an open-end management investment company. The investment objective of the fund is to seek capital appreciation. The fund invests mainly in common stocks of large U.S. companies, with a focus on growth stocks. Growth stocks are issued by companies whose earnings are expected to grow faster than those of similar firms, and whose business growth and other characteristics may lead to an increase in stock price. Putnam Management may consider, among other factors, a company’s valuation, financial strength, growth potential, competitive position in its industry, projected future earnings, cash flows and dividends when deciding whether to buy or sell investments.
The fund offers class A, class B, class C, class M, class R, class R5, class R6 and class Y shares. Class A and class M shares are sold with a maximum front-end sales charge of 5.75% and 3.50%, respectively, and generally do not pay a contingent deferred sales charge. Class B shares, which convert to class A shares after approximately eight years, do not pay a front-end sales charge and are subject to a contingent deferred sales charge if those shares are redeemed within six years of purchase. Class C shares have a one-year 1.00% contingent deferred sales charge and do not convert to class A shares. Class R shares, which are not available to all investors, are sold at net asset value. The expenses for class A, class B, class C, class M and class R shares may differ based on the distribution fee of each class, which is identified in Note 2. Class R5, class R6 and class Y shares, which are sold at net asset value, are generally subject to the same expenses as class A, class B, class C, class M and class R shares, but do not bear a distribution fee and in the case of class R5 and class R6 shares, bear a lower investor servicing fee, which is identified in Note 2. Class R5, class R6 and class Y shares are not available to all investors.
In the normal course of business, the fund enters into contracts that may include agreements to indemnify another party under given circumstances. The fund’s maximum exposure under these arrangements is unknown as this would involve future claims that may be, but have not yet been, made against the fund. However, the fund’s management team expects the risk of material loss to be remote.
Note 1: Significant accounting policies
The following is a summary of significant accounting policies consistently followed by the fund in the preparation of its financial statements. The preparation of financial statements is in conformity with accounting principles generally accepted in the United States of America and requires management to make estimates and assumptions that affect the reported amounts of assets and liabilities in the financial statements and the reported amounts of increases and decreases in net assets from operations. Actual results could differ from those estimates. Subsequent events after the Statement of assets and liabilities date through the date that the financial statements were issued have been evaluated in the preparation of the financial statements.
A short-term trading fee of 1.00% may have applied to redemptions (including exchanges into another fund) of shares purchased before January 2, 2013 and held for 7 days or less. The short-term trading fee was accounted for as an addition to paid-in-capital. No short-term trading fee applies to shares purchased on or after January 2, 2013.
Investment income, realized and unrealized gains and losses and expenses of the fund are borne pro-rata based on the relative net assets of each class to the total net assets of the fund, except that each class bears expenses unique to that class (including the distribution fees applicable to such classes). Each class votes as a class only with respect to its own distribution plan or other matters on which a class vote is required by law or determined by the Trustees. If the fund were liquidated, shares of each class would receive their pro-rata share of the net assets of the fund. In addition, the Trustees declare separate dividends on each class of shares.
Security valuation Investments for which market quotations are readily available are valued at the last reported sales price on their principal exchange, or official closing price for certain markets, and are classified as Level 1 securities under Accounting Standards Codification 820 Fair Value Measurements and Disclosures (ASC 820). If no sales are reported, as in the case of some securities that are traded OTC, a security is valued at its last reported bid price and is generally categorized as a Level 2 security.
| |
| 40 | Growth Opportunities Fund |
Investments in open-end investment companies (excluding exchange traded funds), if any, which can be classified as Level 1 or Level 2 securities, are valued based on their net asset value. The net asset value of such investment companies equals the total value of their assets less their liabilities and divided by the number of their outstanding shares.
Market quotations are not considered to be readily available for certain debt obligations and other investments; such investments are valued on the basis of valuations furnished by an independent pricing service approved by the Trustees or dealers selected by Putnam Management. Such services or dealers determine valuations for normal institutional-size trading units of such securities using methods based on market transactions for comparable securities and various relationships, generally recognized by institutional traders, between securities (which consider such factors as security prices, yields, maturities and ratings). These securities will generally be categorized as Level 2. Short-term securities with remaining maturities of 60 days or less may be valued at amortized cost, which approximates fair value and are classified as Level 2 securities.
Many securities markets and exchanges outside the U.S. close prior to the close of the New York Stock Exchange and therefore the closing prices for securities in such markets or on such exchanges may not fully reflect events that occur after such close but before the close of the New York Stock Exchange. Accordingly, on certain days, the fund will fair value foreign equity securities taking into account multiple factors including movements in the U.S. securities markets, currency valuations and comparisons to the valuation of American Depository Receipts, exchange-traded funds and futures contracts. These securities, which would generally be classified as Level 1 securities, will be transferred to Level 2 of the fair value hierarchy when they are valued at fair value. The number of days on which fair value prices will be used will depend on market activity and it is possible that fair value prices will be used by the fund to a significant extent. Securities quoted in foreign currencies, if any, are translated into U.S. dollars at the current exchange rate.
To the extent a pricing service or dealer is unable to value a security or provides a valuation that Putnam Management does not believe accurately reflects the security’s fair value, the security will be valued at fair value by Putnam Management in accordance with policies and procedures approved by the Trustees. Certain investments, including certain restricted and illiquid securities and derivatives, are also valued at fair value following procedures approved by the Trustees. These valuations consider such factors as significant market or specific security events such as interest rate or credit quality changes, various relationships with other securities, discount rates, U.S. Treasury, U.S. swap and credit yields, index levels, convexity exposures and recovery rates. These securities are classified as Level 2 or as Level 3 depending on the priority of the significant inputs.
Such valuations and procedures are reviewed periodically by the Trustees. The fair value of securities is generally determined as the amount that the fund could reasonably expect to realize from an orderly disposition of such securities over a reasonable period of time. By its nature, a fair value price is a good faith estimate of the value of a security in a current sale and does not reflect an actual market price, which may be different by a material amount.
Security transactions and related investment income Security transactions are recorded on the trade date (the date the order to buy or sell is executed). Gains or losses on securities sold are determined on the identified cost basis.
Interest income, net of any applicable withholding taxes, is recorded on the accrual basis. Dividend income, net of any applicable withholding taxes, is recognized on the ex-dividend date except that certain dividends from foreign securities, if any, are recognized as soon as the fund is informed of the ex-dividend date. Non-cash dividends, if any, are recorded at the fair value of the securities received. Dividends representing a return of capital or capital gains, if any, are reflected as a reduction of cost and/or as a realized gain.
All premiums/discounts are amortized/accreted on a yield-to-maturity basis.
Foreign currency translation The accounting records of the fund are maintained in U.S. dollars. The fair value of foreign securities, currency holdings, and other assets and liabilities is recorded in the books and records of the fund after translation to U.S. dollars based on the exchange rates on that day. The cost of each security is determined using historical exchange rates. Income and withholding taxes are translated at prevailing exchange rates when earned or incurred. The fund does not isolate that portion of realized or unrealized gains or losses resulting from changes in the foreign exchange rate on investments from fluctuations arising from changes in the market prices of the securities. Such gains and losses are included with the net realized and unrealized gain or loss on investments. Net realized gains and losses on foreign currency transactions represent net realized exchange gains or losses on closed forward currency contracts, disposition of foreign currencies, currency gains and losses realized between the trade and settlement dates on securities transactions and the difference between the amount of investment income and foreign withholding taxes recorded on the fund’s books and the U.S. dollar equivalent
| |
| Growth Opportunities Fund | 41 |
amounts actually received or paid. Net unrealized appreciation and depreciation of assets and liabilities in foreign currencies arise from changes in the value of open forward currency contracts and assets and liabilities other than investments at the period end, resulting from changes in the exchange rate.
Forward currency contracts The fund buys and sells forward currency contracts, which are agreements between two parties to buy and sell currencies at a set price on a future date. These contracts are used to hedge foreign exchange risk.
The U.S. dollar value of forward currency contracts is determined using current forward currency exchange rates supplied by a quotation service. The fair value of the contract will fluctuate with changes in currency exchange rates. The contract is marked to market daily and the change in fair value is recorded as an unrealized gain or loss. The fund records a realized gain or loss equal to the difference between the value of the contract at the time it was opened and the value at the time it was closed when the contract matures or by delivery of the currency. The fund could be exposed to risk if the value of the currency changes unfavorably, if the counterparties to the contracts are unable to meet the terms of their contracts or if the fund is unable to enter into a closing position. Risks may exceed amounts recognized on the Statement of assets and liabilities.
Forward currency contracts outstanding at period end, if any, are listed after the fund’s portfolio.
Total return swap contracts The fund entered into OTC total return swap contracts, which are arrangements to exchange a market linked return for a periodic payment, both based on a notional principal amount, to gain exposure to specific sectors or industries.
To the extent that the total return of the security, index or other financial measure underlying the transaction exceeds or falls short of the offsetting interest rate obligation, the fund will receive a payment from or make a payment to the counterparty. OTC total return swap contracts are marked to market daily based upon quotations from an independent pricing service or market makers and the change, if any, is recorded as an unrealized gain or loss. Payments received or made are recorded as realized gains or losses. Certain OTC total return swap contracts may include extended effective dates. Payments related to these swap contracts are accrued based on the terms of the contract. The fund could be exposed to credit or market risk due to unfavorable changes in the fluctuation of interest rates or in the price of the underlying security or index, the possibility that there is no liquid market for these agreements or that the counterparty may default on its obligation to perform. The fund’s maximum risk of loss from counterparty risk is the fair value of the contract. This risk may be mitigated by having a master netting arrangement between the fund and the counterparty. Risk of loss may exceed amounts recognized on the Statement of assets and liabilities.
OTC total return swap contracts outstanding, including their respective notional amounts at period end, if any, are listed after the fund’s portfolio.
Master agreements The fund is a party to ISDA (International Swaps and Derivatives Association, Inc.) Master Agreements (Master Agreements) with certain counterparties that govern OTC derivative and foreign exchange contracts entered into from time to time. The Master Agreements may contain provisions regarding, among other things, the parties’ general obligations, representations, agreements, collateral requirements, events of default and early termination. With respect to certain counterparties, in accordance with the terms of the Master Agreements, collateral posted to the fund is held in a segregated account by the fund’s custodian and with respect to those amounts which can be sold or repledged, are presented in the fund’s portfolio.
Collateral pledged by the fund is segregated by the fund’s custodian and identified in the fund’s portfolio. Collateral can be in the form of cash or debt securities issued by the U.S. Government or related agencies or other securities as agreed to by the fund and the applicable counterparty. Collateral requirements are determined based on the fund’s net position with each counterparty.
Termination events applicable to the fund may occur upon a decline in the fund’s net assets below a specified threshold over a certain period of time. Termination events applicable to counterparties may occur upon a decline in the counterparty’s long-term and short-term credit ratings below a specified level. In each case, upon occurrence, the other party may elect to terminate early and cause settlement of all derivative and foreign exchange contracts outstanding, including the payment of any losses and costs resulting from such early termination, as reasonably determined by the terminating party. Any decision by one or more of the fund’s counterparties to elect early termination could impact the fund’s future derivative activity.
At the close of the reporting period, the fund had a net liability position of $75,652 on open derivative contracts subject to the Master Agreements. Collateral posted by the fund for these agreements totaled $575,594.
| |
| 42 | Growth Opportunities Fund |
Securities lending The fund may lend securities, through its agent, to qualified borrowers in order to earn additional income. The loans are collateralized by cash in an amount at least equal to the fair value of the securities loaned. The fair value of securities loaned is determined daily and any additional required collateral is allocated to the fund on the next business day. The risk of borrower default will be borne by the fund’s agent; the fund will bear the risk of loss with respect to the investment of the cash collateral. Income from securities lending is included in investment income on the Statement of operations. Cash collateral is invested in Putnam Cash Collateral Pool, LLC, a limited liability company managed by an affiliate of Putnam Management. Investments in Putnam Cash Collateral Pool, LLC are valued at its closing net asset value each business day. There are no management fees charged to Putnam Cash Collateral Pool, LLC. At the close of the reporting period, the value of securities loaned amounted to $10,405,903. Certain of these securities were sold prior to the close of the reporting period and are included in Receivable for investments sold on the Statement of assets and liabilities. The fund received cash collateral of $10,878,000.
Interfund lending The fund, along with other Putnam funds, may participate in an interfund lending program pursuant to an exemptive order issued by the SEC. This program allows the fund to borrow from or lend to other Putnam funds that permit such transactions. Interfund lending transactions are subject to each fund’s investment policies and borrowing and lending limits. Interest earned or paid on the interfund lending transaction will be based on the average of certain current market rates. During the reporting period, the fund did not utilize the program.
Line of credit The fund participates, along with other Putnam funds, in a $315 million unsecured committed line of credit and a $185 million unsecured uncommitted line of credit, both provided by State Street. Borrowings may be made for temporary or emergency purposes, including the funding of shareholder redemption requests and trade settlements. Interest is charged to the fund based on the fund’s borrowing at a rate equal to the Federal Funds rate plus 1.25% for the committed line of credit and the Federal Funds rate plus 1.30% for the uncommitted line of credit. A closing fee equal to 0.02% of the committed line of credit and $50,000 for the uncommitted line of credit has been paid by the participating funds. In addition, a commitment fee of 0.11% per annum on any unutilized portion of the committed line of credit is allocated to the participating funds based on their relative net assets and paid quarterly. During the reporting period, the fund had no borrowings against these arrangements.
Federal taxes It is the policy of the fund to distribute all of its taxable income within the prescribed time period and otherwise comply with the provisions of the Internal Revenue Code of 1986, as amended (the Code), applicable to regulated investment companies. It is also the intention of the fund to distribute an amount sufficient to avoid imposition of any excise tax under Section 4982 of the Code.
The fund is subject to the provisions of Accounting Standards Codification 740 Income Taxes (ASC 740). ASC 740 sets forth a minimum threshold for financial statement recognition of the benefit of a tax position taken or expected to be taken in a tax return. The fund did not have a liability to record for any unrecognized tax benefits in the accompanying financial statements. No provision has been made for federal taxes on income, capital gains or unrealized appreciation on securities held nor for excise tax on income and capital gains. Each of the fund’s federal tax returns for the prior three fiscal years remains subject to examination by the Internal Revenue Service.
The fund may also be subject to taxes imposed by governments of countries in which it invests. Such taxes are generally based on either income or gains earned or repatriated. The fund accrues and applies such taxes to net investment income, net realized gains and net unrealized gains as income and/or capital gains are earned. In some cases, the fund may be entitled to reclaim all or a portion of such taxes, and such reclaim amounts, if any, are reflected as an asset on the fund’s books. In many cases, however, the fund may not receive such amounts for an extended period of time, depending on the country of investment.
The aggregate identified cost on a tax basis is $365,579,168, resulting in gross unrealized appreciation and depreciation of $89,365,424 and $6,287,610, respectively, or net unrealized appreciation of $83,077,814.
Distributions to shareholders Distributions to shareholders from net investment income are recorded by the fund on the ex-dividend date. Distributions from capital gains, if any, are recorded on the ex-dividend date and paid at least annually. The amount and character of income and gains to be distributed are determined in accordance with income tax regulations, which may differ from generally accepted accounting principles. Dividend sources are estimated at the time of declaration. Actual results may vary. Any non-taxable return of capital cannot be determined until final tax calculations are completed after the end of the fund’s fiscal year. Reclassifications are made to the fund’s capital accounts to reflect income and gains available for distribution (or available capital loss carryovers) under income tax regulations.
| |
| Growth Opportunities Fund | 43 |
Expenses of the Trust Expenses directly charged or attributable to any fund will be paid from the assets of that fund. Generally, expenses of the Trust will be allocated among and charged to the assets of each fund on a basis that the Trustees deem fair and equitable, which may be based on the relative assets of each fund or the nature of the services performed and relative applicability to each fund.
Note 2: Management fee, administrative services and other transactions
The fund pays Putnam Management a management fee (base fee) (based on the fund’s average net assets and computed and paid monthly) at annual rates that may vary based on the average of the aggregate net assets of most open-end funds, as defined in the fund’s management contract, sponsored by Putnam Management. Such annual rates may vary as follows:
| | | | |
| 0.710% | of the first $5 billion, | | 0.510% | of the next $50 billion, |
| |
|
| 0.660% | of the next $5 billion, | | 0.490% | of the next $50 billion, |
| |
|
| 0.610% | of the next $10 billion, | | 0.480% | of the next $100 billion and |
| |
|
| 0.560% | of the next $10 billion, | | 0.475% | of any excess thereafter. |
| |
|
The fund’s shareholders approved the fund’s current management contract with Putnam Management effective February 27, 2014. Shareholders were asked to approve the fund’s management contract following the death on October 8, 2013 of The Honourable Paul G. Desmarais, who had controlled directly and indirectly a majority of the voting shares of Power Corporation of Canada, the ultimate parent company of Putnam Management. The substantive terms of the management contract, including terms relating to fees, are identical to the terms of the fund’s previous management contract and reflect the rates provided in the table above.
In addition, beginning with January 2011, the monthly management fee consists of the monthly base fee plus or minus a performance adjustment for the month. The performance adjustment is determined based on performance over the thirty-six month period then ended. Each month, the performance adjustment is calculated by multiplying the performance adjustment rate and the fund’s average net assets over the performance period and the result is divided by twelve. The resulting dollar amount is added to, or subtracted from the base fee for that month. The performance adjustment rate is equal to 0.03 multiplied by the difference between the fund’s annualized performance (measured by the fund’s class A shares) and the annualized performance of the Russell 1000 Growth Index, each measured over the performance period. The maximum annualized performance adjustment rates are +/– 0.12%. The monthly base fee is determined based on the fund’s average net assets for the month, while the performance adjustment is determined based on the fund’s average net assets over the performance period of up to thirty-six months. This means it is possible that, if the fund underperforms significantly over the performance period, and the fund’s assets have declined significantly over that period, the negative performance adjustment may exceed the base fee. In this event, Putnam Management would make a payment to the fund.
Because the performance adjustment is based on the fund’s performance relative to its applicable benchmark index, and not its absolute performance, the performance adjustment could increase Putnam Management’s fee even if the fund’s shares lose value during the performance period provided that the fund outperformed its benchmark index, and could decrease Putnam Management’s fee even if the fund’s shares increase in value during the performance period provided that the fund underperformed its benchmark index.
For the reporting period, the base fee represented an effective rate (excluding the impact from any expense waivers in effect) of 0.281% of the fund’s average net assets before a decrease of $43,096 (0.010% of the fund’s average net assets) based on performance.
Putnam Management has contractually agreed, through June 30, 2014, to waive fees or reimburse the fund’s expenses to the extent necessary to limit the cumulative expenses of the fund, exclusive of brokerage, interest, taxes, investment-related expenses, extraordinary expenses, acquired fund fees and expenses and payments under the fund’s investor servicing contract, investment management contract and distribution plans, on a fiscal year-to-date basis to an annual rate of 0.20% of the fund’s average net assets over such fiscal year-to-date period. During the reporting period, the fund’s expenses were not reduced as a result of this limit.
| |
| 44 | Growth Opportunities Fund |
Putnam Investments Limited (PIL), an affiliate of Putnam Management, is authorized by the Trustees to manage a separate portion of the assets of the fund as determined by Putnam Management from time to time. Putnam Management pays a quarterly sub-management fee to PIL for its services at an annual rate of 0.35% of the average net assets of the portion of the fund managed by PIL.
The fund reimburses Putnam Management an allocated amount for the compensation and related expenses of certain officers of the fund and their staff who provide administrative services to the fund. The aggregate amount of all such reimbursements is determined annually by the Trustees.
Custodial functions for the fund’s assets are provided by State Street. Custody fees are based on the fund’s asset level, the number of its security holdings and transaction volumes.
Putnam Investor Services, Inc., an affiliate of Putnam Management, provides investor servicing agent functions to the fund. Putnam Investor Services, Inc. received fees for investor servicing (except for Class R5 and R6 shares) based on the fund’s retail asset level, the number of shareholder accounts in the fund and the level of defined contribution plan assets in the fund. Class R5 shares pay a monthly fee based on the average net assets of class R5 shares at an annual rate of 0.15%. Class R6 shares pay a monthly fee based on the average net assets of class R6 shares at an annual rate of 0.05%. Investor servicing fees will not exceed an annual rate of 0.32% of the fund’s average net assets. During the reporting period, the expenses for each class of shares related to investor servicing fees were as follows:
| | | | |
| Class A | $405,472 | | Class R5 | 10 |
| |
|
| Class B | 23,765 | | Class R6 | 1,896 |
| |
|
| Class C | 19,493 | | Class Y | 15,279 |
| |
|
| Class M | 6,124 | | Total | $474,898 |
| |
|
| Class R | 2,859 | | | |
| | |
The fund has entered into expense offset arrangements with Putnam Investor Services, Inc. and State Street whereby Putnam Investor Services, Inc.’s and State Street’s fees are reduced by credits allowed on cash balances. The fund also reduced expenses through brokerage/service arrangements. For the reporting period, the fund’s expenses were reduced by $355 under the expense offset arrangements and by $6,430 under the brokerage/service arrangements.
Each independent Trustee of the fund receives an annual Trustee fee, of which $284, as a quarterly retainer, has been allocated to the fund, and an additional fee for each Trustees meeting attended. Trustees also are reimbursed for expenses they incur relating to their services as Trustees.
The fund has adopted a Trustee Fee Deferral Plan (the Deferral Plan) which allows the Trustees to defer the receipt of all or a portion of Trustees fees payable on or after July 1, 1995. The deferred fees remain invested in certain Putnam funds until distribution in accordance with the Deferral Plan.
The fund has adopted an unfunded noncontributory defined benefit pension plan (the Pension Plan) covering all Trustees of the fund who have served as a Trustee for at least five years and were first elected prior to 2004. Benefits under the Pension Plan are equal to 50% of the Trustee’s average annual attendance and retainer fees for the three years ended December 31, 2005. The retirement benefit is payable during a Trustee’s lifetime, beginning the year following retirement, for the number of years of service through December 31, 2006. Pension expense for the fund is included in Trustee compensation and expenses in the Statement of operations. Accrued pension liability is included in Payable for Trustee compensation and expenses in the Statement of assets and liabilities. The Trustees have terminated the Pension Plan with respect to any Trustee first elected after 2003.
The fund has adopted distribution plans (the Plans) with respect to its class A, class B, class C, class M and class R shares pursuant to Rule 12b–1 under the Investment Company Act of 1940. The purpose of the Plans is to compensate Putnam Retail Management Limited Partnership, an indirect wholly-owned subsidiary of Putnam Investments, LLC, for services provided and expenses incurred in distributing shares of the fund. The Plans provide for payments by the fund to Putnam Retail Management Limited Partnership at an annual rate of up to 0.35%, 1.00%, 1.00%, 1.00% and 1.00% of the average net assets attributable to class A, class B, class C, class M and class R shares, respectively. The Trustees have approved payment by the fund at an annual rate of 0.25%, 1.00%, 1.00%,
| |
| Growth Opportunities Fund | 45 |
0.75% and 0.50% of the average net assets attributable to class A, class B, class C, class M and class R shares, respectively. During the reporting period, the class specific expenses related to distribution fees were as follows:
| | | | |
| Class A | $441,809 | | Class M | 20,016 |
| |
|
| Class B | 103,546 | | Class R | 6,234 |
| |
|
| Class C | 85,048 | | Total | $656,653 |
| |
|
For the reporting period, Putnam Retail Management Limited Partnership, acting as underwriter, received net commissions of $29,276 and $328 from the sale of class A and class M shares, respectively, and received $5,533 and $89 in contingent deferred sales charges from redemptions of class B and class C shares, respectively.
A deferred sales charge of up to 1.00% and 0.65% is assessed on certain redemptions of class A and class M shares, respectively. For the reporting period, Putnam Retail Management Limited Partnership, acting as underwriter, received no monies on class A and class M redemptions.
Note 3: Purchases and sales of securities
During the reporting period, cost of purchases and proceeds from sales of investment securities other than short-term investments aggregated $207,402,236 and $215,705,056, respectively. There were no purchases or proceeds from sales of long-term U.S. government securities.
Note 4: Capital shares
At the close of the reporting period, there was an unlimited number of shares of beneficial interest authorized. Transactions in capital shares were as follows:
| | | | |
| | Six months ended 1/31/14 | Year ended 7/31/13 |
|
| Class A | Shares | Amount | Shares | Amount |
|
| Shares sold | 794,262 | $18,564,456 | 1,271,393 | $25,074,541 |
|
| Shares issued in connection with | | | | |
| reinvestment of distributions | 634,760 | 14,853,393 | 50,244 | 930,841 |
|
| | 1,429,022 | 33,417,849 | 1,321,637 | 26,005,382 |
|
| Shares repurchased | (1,104,459) | (25,637,715) | (2,323,325) | (45,007,895) |
|
| Net increase (decrease) | 324,563 | $7,780,134 | (1,001,688) | $(19,002,513) |
|
| |
| | Six months ended 1/31/14 | Year ended 7/31/13 |
|
| Class B | Shares | Amount | Shares | Amount |
|
| Shares sold | 59,648 | $1,240,007 | 229,526 | $4,032,496 |
|
| Shares issued in connection with | | | | |
| reinvestment of distributions | 44,040 | 923,518 | — | — |
|
| | 103,688 | 2,163,525 | 229,526 | 4,032,496 |
|
| Shares repurchased | (137,186) | (2,847,125) | (396,719) | (6,964,851) |
|
| Net decrease | (33,498) | $(683,600) | (167,193) | $(2,932,355) |
|
| |
| | Six months ended 1/31/14 | Year ended 7/31/13 |
|
| Class C | Shares | Amount | Shares | Amount |
|
| Shares sold | 75,709 | $1,608,136 | 100,005 | $1,825,300 |
|
| Shares issued in connection with | | | | |
| reinvestment of distributions | 33,752 | 717,895 | — | — |
|
| | 109,461 | 2,326,031 | 100,005 | 1,825,300 |
|
| Shares repurchased | (51,341) | (1,089,049) | (144,497) | (2,575,117) |
|
| Net increase (decrease) | 58,120 | $1,236,982 | (44,492) | $(749,817) |
|
| |
| 46 | Growth Opportunities Fund |
| | | | |
| | Six months ended 1/31/14 | Year ended 7/31/13 |
|
| Class M | Shares | Amount | Shares | Amount |
|
| Shares sold | 6,542 | $140,360 | 5,947 | $107,098 |
|
| Shares issued in connection with | | | | |
| reinvestment of distributions | 10,722 | 233,850 | — | — |
|
| | 17,264 | 374,210 | 5,947 | 107,098 |
|
| Shares repurchased | (18,376) | (403,596) | (39,063) | (704,244) |
|
| Net decrease | (1,112) | $(29,386) | (33,116) | $(597,146) |
|
| |
| | Six months ended 1/31/14 | Year ended 7/31/13 |
|
| Class R | Shares | Amount | Shares | Amount |
|
| Shares sold | 17,563 | $400,201 | 37,086 | $728,834 |
|
| Shares issued in connection with | | | | |
| reinvestment of distributions | 4,794 | 109,781 | 39 | 710 |
|
| | 22,357 | 509,982 | 37,125 | 729,544 |
|
| Shares repurchased | (12,094) | (270,021) | (26,411) | (489,967) |
|
| Net increase | 10,263 | $239,961 | 10,714 | $239,577 |
|
| |
| | Six months ended 1/31/14 | Year ended 7/31/13 |
|
| Class R5 | Shares | Amount | Shares | Amount |
|
| Shares sold | — | $— | — | $— |
|
| Shares issued in connection with | | | | |
| reinvestment of distributions | 25 | 613 | 3 | 62 |
|
| | 25 | 613 | 3 | 62 |
|
| Shares repurchased | — | — | — | — |
|
| Net increase | 25 | $613 | 3 | $62 |
|
| |
| | Six months ended 1/31/14 | Year ended 7/31/13 |
|
| Class R6 | Shares | Amount | Shares | Amount |
|
| Shares sold | 42,289 | $1,007,614 | 324,789 | $6,801,182 |
|
| Shares issued in connection with | | | | |
| reinvestment of distributions | 14,325 | 346,511 | 723 | 14,992 |
|
| | 56,614 | 1,354,125 | 325,512 | 6,816,174 |
|
| Shares repurchased | (34,156) | (823,970) | (25,150) | (544,832) |
|
| Net increase | 22,458 | $530,155 | 300,362 | $6,271,342 |
|
| |
| | Six months ended 1/31/14 | Year ended 7/31/13 |
|
| Class Y | Shares | Amount | Shares | Amount |
|
| Shares sold | 145,781 | $3,556,009 | 184,260 | $3,667,385 |
|
| Shares issued in connection with | | | | |
| reinvestment of distributions | 23,521 | 568,032 | 3,781 | 71,878 |
|
| | 169,302 | 4,124,041 | 188,041 | 3,739,263 |
|
| Shares repurchased | (147,018) | (3,449,944) | (521,326) | (10,673,951) |
|
| Net increase (decrease) | 22,284 | $674,097 | (333,285) | $(6,934,688) |
|
| |
| Growth Opportunities Fund | 47 |
At the close of the reporting period, Putnam Investments, LLC owned the following shares of the fund:
| | | |
| | Shares owned | Percentage of ownership | Value |
|
| Class R5 | 587 | 100.00% | $14,478 |
|
| Class R6 | 588 | 0.18 | 14,488 |
|
Note 5: Affiliated transactions
Transactions during the reporting period with Putnam Short Term Investment Fund, which is under common ownership and control, were as follows:
| | | | | |
| | Fair value at the | | | | Fair value at |
| | beginning of | | | | the end of |
| | the reporting | | | Investment | the reporting |
| Name of affiliate | period | Purchase cost | Sale proceeds | income | period |
|
| Putnam Short Term | | | | | |
| Investment Fund* | $2,617,421 | $57,665,018 | $52,843,308 | $2,890 | $7,439,131 |
|
* Management fees charged to Putnam Short Term Investment Fund have been waived by Putnam Management.
Note 6: Market, credit and other risks
In the normal course of business, the fund trades financial instruments and enters into financial transactions where risk of potential loss exists due to changes in the market (market risk) or failure of the contracting party to the transaction to perform (credit risk). The fund may be exposed to additional credit risk that an institution or other entity with which the fund has unsettled or open transactions will default. Investments in foreign securities involve certain risks, including those related to economic instability, unfavorable political developments, and currency fluctuations.
Note 7: Summary of derivative activity
The volume of activity for the reporting period for any derivative type that was held during the period is listed below and was as follows based on an average of the holdings at the end of each fiscal quarter:
| |
| Forward currency contracts (contract amount) | $5,900,000 |
|
| OTC total return swap contracts (notional) | $6,000,000 |
|
| Warrants (number of warrants) | 200,000 |
|
The following is a summary of the fair value of derivative instruments as of the close of the reporting period:
Fair value of derivative instruments as of the close of the reporting period
| | | | |
| | Asset derivatives | Liability derivatives |
|
| Derivatives not | | | | |
| accounted for as | Statement of | | Statement of | |
| hedging instruments | assets and | | assets and | |
| under ASC 815 | liabilities location | Fair value | liabilities location | Fair value |
|
| Foreign | | | | |
| exchange contracts | Receivables | $— | Payables | $54,248 |
|
| Equity contracts | Investments | 103,604 | Payables | 21,404 |
|
| Total | | $103,604 | | $75,652 |
|
| |
| 48 | Growth Opportunities Fund |
The following is a summary of realized and change in unrealized gains or losses of derivative instruments on the Statement of operations for the reporting period (see Note 1):
Amount of realized gain or (loss) on derivatives recognized in net gain or (loss) on investments
| | | |
| Derivatives not accounted for as hedging | Forward currency | | |
| instruments under ASC 815 | contracts | Swaps | Total |
|
| Foreign exchange contracts | $(4,314) | $— | $(4,314) |
|
| Equity contracts | — | 824,706 | $824,706 |
|
| Total | $(4,314) | $824,706 | $820,392 |
|
Change in unrealized appreciation or (depreciation) on derivatives recognized in net gain or (loss) on investments
| | | | |
| Derivatives not accounted for | | Forward | | |
| as hedging instruments under | | currency | | |
| ASC 815 | Warrants | contracts | Swaps | Total |
|
| Foreign exchange contracts | $— | $(54,248) | $— | $(54,248) |
|
| Equity contracts | (24,261) | — | (42,569) | $(66,830) |
|
| Total | $(24,261) | $(54,248) | $(42,569) | $(121,078) |
|
| |
| Growth Opportunities Fund | 49 |
Note 8: Offsetting of financial and derivative assets and liabilities
The following table summarizes any derivatives, repurchase agreements, reverse repurchase agreements, securities lending and borrowing transactions, at the end of the reporting period, that are subject to an enforceable master netting agreement or similar agreement. For financial reporting purposes, the fund does not offset financial assets and financial liabilities that are subject to the master netting agreements in the Statement of assets and liabilities.
| | | | | |
| | Barclays Bank PLC | Deutsche Bank AG | Goldman Sachs Bank USA | UBS AG | Total |
|
| Assets: | | | | | |
|
| Securities on loan** | $— | $— | $10,405,903 | $— | $10,405,903 |
|
| Total Assets | $— | $— | $10,405,903 | $— | $10,405,903 |
|
| Liabilities: | | | | | |
|
| OTC Total return swap contracts*# | $— | $21,404 | $— | $— | $21,404 |
|
| Forward currency contracts# | 48,788 | — | — | 5,460 | $54,248 |
|
| Total Liabilities | $48,788 | $21,404 | $— | $5,460 | $75,652 |
|
| Total Financial and Derivative Net Assets | $(48,788) | $(21,404) | $10,405,903 | $(5,460) | $10,330,251 |
|
| Total collateral received (pledged)##† | $— | $(21,404) | $10,405,903 | $(5,460) | $10,379,039 |
|
| Net amount | $(48,788) | $— | $— | $— | $(48,788) |
|
*Excludes premiums, if any. Included in unrealized appreciation and depreciation on OTC swap contracts on the Statement of assets and liabilities.
**Included with Investments in securities and receivable for investments sold on the Statement of assets and liabilities.
†Additional collateral may be required from certain brokers based on individual agreements.
#Covered by master netting agreement. (Note 1)
##Any over-collateralization of total financial and derivative net assets is not shown.
| |
| 50 | Growth Opportunities Fund |
Shareholder meeting results (Unaudited)
February 27, 2014 special meeting
At the meeting, each of the nominees for Trustees was elected, with all funds of the Trust voting together as a single class, as follows:
| | |
| | Votes for | Votes withheld |
|
| Liaquat Ahamed | 85,592,208 | 4,519,297 |
|
| Ravi Akhoury | 85,715,018 | 4,396,488 |
|
| Barbara M. Baumann | 86,248,127 | 3,863,378 |
|
| Jameson A. Baxter | 86,148,643 | 3,962,863 |
|
| Charles B. Curtis | 86,111,568 | 3,999,938 |
|
| Robert J. Darretta | 86,122,587 | 3,988,918 |
|
| Katinka Domotorffy | 85,970,364 | 4,141,142 |
|
| John A. Hill | 86,124,882 | 3,986,624 |
|
| Paul L. Joskow | 86,157,699 | 3,953,807 |
|
| Kenneth R. Leibler | 86,141,312 | 3,970,194 |
|
| Robert E. Patterson | 86,183,587 | 3,927,919 |
|
| George Putnam, III | 86,119,771 | 3,991,735 |
|
| Robert L. Reynolds | 86,203,661 | 3,907,845 |
|
| W. Thomas Stephens | 86,109,990 | 4,001,516 |
|
A proposal to approve a new management contract between the fund and Putnam Management was approved as follows:
| | | |
| Votes | Votes | | Broker |
| for | against | Abstentions | non-votes |
|
| 8,466,899 | 319,918 | 611,856 | 2,179,008 |
|
March 7, 2014 special meeting
A proposal to adopt an Amended and Restated Declaration of Trust, with respect to which the February 27, 2014 meeting had been adjourned, was approved, with all funds of the Trust voting together as a single class, as follows:
| | | |
| Votes | Votes | | Broker |
| for | against | Abstentions | non-votes |
|
| 68,444,155 | 3,118,645 | 4,434,966 | 15,274,146 |
|
All tabulations are rounded to the nearest whole number.
| |
| Growth Opportunities Fund | 51 |
Services for shareholders
Investor services
Systematic investment plan Tell us how much you wish to invest regularly — weekly, semimonthly, or monthly — and the amount you choose will be transferred automatically from your checking or savings account. There’s no additional fee for this service, and you can suspend it at any time. This plan may be a great way to save for college expenses or to plan for your retirement.
Please note that regular investing does not guarantee a profit or protect against loss in a declining market. Before arranging a systematic investment plan, consider your financial ability to continue making purchases in periods when prices are low.
Systematic exchange You can make regular transfers from one Putnam fund to another Putnam fund. There are no additional fees for this service, and you can cancel or change your options at any time.
Dividends PLUS You can choose to have the dividend distributions from one of your Putnam funds automatically reinvested in another Putnam fund at no additional charge.
Free exchange privilege You can exchange money between Putnam funds free of charge, as long as they are the same class of shares. A signature guarantee is required if you are exchanging more than $500,000. The fund reserves the right to revise or terminate the exchange privilege.
Reinstatement privilege If you’ve sold Putnam shares or received a check for a dividend or capital gain, you may reinvest the proceeds with Putnam within 90 days of the transaction and they will be reinvested at the fund’s current net asset value — with no sales charge. However, reinstatement of class B shares may have special tax consequences. Ask your financial or tax representative for details.
Check-writing service You have ready access to many Putnam accounts. It’s as simple as writing a check, and there are no special fees or service charges. For more information about the check-writing service, call Putnam or visit our website.
Dollar cost averaging When you’re investing for long-term goals, it’s time, not timing, that counts. Investing on a systematic basis is a better strategy than trying to figure out when the markets will go up or down. This means investing the same amount of money regularly over a long period. This method of investing is called dollar cost averaging. When a fund’s share price declines, your investment dollars buy more shares at lower prices. When it increases, they buy fewer shares. Over time, you will pay a lower average price per share.
For more information
Visit the Individual Investors section at putnam.com A secure section of our website contains complete information on your account, including balances and transactions, updated daily. You may also conduct transactions, such as exchanges, additional investments, and address changes. Log on today to get your password.
Call us toll free at 1-800-225-1581 Ask a helpful Putnam representative or your financial advisor for details about any of these or other services, or see your prospectus.
| |
| 52 | Growth Opportunities Fund |
Fund information
Founded over 75 years ago, Putnam Investments was built around the concept that a balance between risk and reward is the hallmark of a well-rounded financial program. We manage over 100 funds across income, value, blend, growth, asset allocation, absolute return, and global sector categories.
| | |
| Investment Manager | Trustees | Robert R. Leveille |
| Putnam Investment | Jameson A. Baxter, Chair | Vice President and |
| Management, LLC | Liaquat Ahamed | Chief Compliance Officer |
| One Post Office Square | Ravi Akhoury | |
| Boston, MA 02109 | Barbara M. Baumann | Michael J. Higgins |
| | Charles B. Curtis | Vice President, Treasurer, |
| Investment Sub-Manager | Robert J. Darretta | and Clerk |
| Putnam Investments Limited | Katinka Domotorffy | |
| 57–59 St James’s Street | John A. Hill | Janet C. Smith |
| London, England SW1A 1LD | Paul L. Joskow | Vice President, |
| | Kenneth R. Leibler | Principal Accounting Officer, |
| Marketing Services | Robert E. Patterson | and Assistant Treasurer |
| Putnam Retail Management | George Putnam, III | |
| One Post Office Square | Robert L. Reynolds | Susan G. Malloy |
| Boston, MA 02109 | W. Thomas Stephens | Vice President and |
| | | Assistant Treasurer |
| Custodian | Officers | |
| State Street Bank | Robert L. Reynolds | James P. Pappas |
| and Trust Company | President | Vice President |
| | | |
| Legal Counsel | Jonathan S. Horwitz | Mark C. Trenchard |
| Ropes & Gray LLP | Executive Vice President, | Vice President and |
| | Principal Executive Officer, and | BSA Compliance Officer |
| Compliance Liaison | |
| | | Nancy E. Florek |
| | Steven D. Krichmar | Vice President, Director of |
| | Vice President and | Proxy Voting and Corporate |
| | Principal Financial Officer | Governance, Assistant Clerk, |
| | | and Associate Treasurer |
| | Robert T. Burns | |
| | Vice President and | |
| | Chief Legal Officer | |
This report is for the information of shareholders of Putnam Growth Opportunities Fund. It may also be used as sales literature when preceded or accompanied by the current prospectus, the most recent copy of Putnam’s Quarterly Performance Summary, and Putnam’s Quarterly Ranking Summary. For more recent performance, please visit putnam.com. Investors should carefully consider the investment objectives, risks, charges, and expenses of a fund, which are described in its prospectus. For this and other information or to request a prospectus or summary prospectus, call 1-800-225-1581 toll free. Please read the prospectus carefully before investing. The fund’s Statement of Additional Information contains additional information about the fund’s Trustees and is available without charge upon request by calling 1-800-225-1581.
| |
| Item 3. Audit Committee Financial Expert: |
| |
| Item 4. Principal Accountant Fees and Services: |
| |
| Item 5. Audit Committee of Listed Registrants |
| |
| Item 6. Schedule of Investments: |
| |
| The registrant’s schedule of investments in unaffiliated issuers is included in the report to shareholders in Item 1 above. |
| |
| Item 7. Disclosure of Proxy Voting Policies and Procedures For Closed-End Management Investment Companies: |
| |
| Item 8. Portfolio Managers of Closed-End Investment Companies |
| |
| Item 9. Purchases of Equity Securities by Closed-End Management Investment Companies and Affiliated Purchasers: |
| |
| Item 10. Submission of Matters to a Vote of Security Holders: |
| |
| Item 11. Controls and Procedures: |
| |
| (a) The registrant’s principal executive officer and principal financial officer have concluded, based on their evaluation of the effectiveness of the design and operation of the registrant’s disclosure controls and procedures as of a date within 90 days of the filing date of this report, that the design and operation of such procedures are generally effective to provide reasonable assurance that information required to be disclosed by the registrant in this report is recorded, processed, summarized and reported within the time periods specified in the Commission’s rules and forms. |
| |
| (b) Changes in internal control over financial reporting: Not applicable |
| |
| (a)(2) Separate certifications for the principal executive officer and principal financial officer of the registrant as required by Rule 30a-2(a) under the Investment Company Act of 1940, as amended, are filed herewith. |
| |
| (b) The certifications required by Rule 30a-2(b) under the Investment Company Act of 1940, as amended, are filed herewith. |
| |
| By (Signature and Title): |
| |
| /s/Janet C. Smith
Janet C. Smith
Principal Accounting Officer
|
| |
| Pursuant to the requirements of the Securities Exchange Act of 1934 and the Investment Company Act of 1940, this report has been signed below by the following persons on behalf of the registrant and in the capacities and on the dates indicated. |
| |
| By (Signature and Title): |
| |
| /s/Jonathan S. Horwitz
Jonathan S. Horwitz
Principal Executive Officer
|
| |
| By (Signature and Title): |
| |
| /s/Steven D. Krichmar
Steven D. Krichmar
Principal Financial Officer
|