| | |
| UNITED STATES
SECURITIES AND EXCHANGE COMMISSION |
| | |
| CERTIFIED SHAREHOLDER REPORT OF REGISTERED
MANAGEMENT INVESTMENT COMPANIES
|
| | |
| Investment Company Act file number: | (811-07237) |
| | |
| Exact name of registrant as specified in charter: | Putnam Investment Funds |
| | |
| Address of principal executive offices: | One Post Office Square, Boston, Massachusetts 02109 |
| | |
| Name and address of agent for service: | Robert T. Burns, Vice President
One Post Office Square
Boston, Massachusetts 02109 |
| | |
| Copy to: | John W. Gerstmayr, Esq.
Ropes & Gray LLP
800 Boylston Street
Boston, Massachusetts 02199-3600 |
| | |
| Registrant’s telephone number, including area code: | (617) 292-1000 |
| | |
| Date of fiscal year end: | April 30, 2014 |
| | |
| Date of reporting period: | May 1, 2013 — October 31, 2013 |
| | |
|
Item 1. Report to Stockholders: | |
| | |
| The following is a copy of the report transmitted to stockholders pursuant to Rule 30e-1 under the Investment Company Act of 1940: | |
Putnam
Capital Opportunities
Fund
Semiannual report
10 | 31 | 13
| | | |
| Message from the Trustees | 1 | | |
| | |
| About the fund | 2 | | |
| | |
| Performance snapshot | 4 | | |
| | |
| Interview with your fund’s portfolio manager | 5 | | |
| | |
| Your fund’s performance | 10 | | |
| | |
| Your fund’s expenses | 12 | | |
| | |
| Terms and definitions | 14 | | |
| | |
| Other information for shareholders | 15 | | |
| | |
| Trustee approval of management contract | 16 | | |
| | |
| Financial statements | 22 | | |
| | |
Consider these risks before investing: Investments in small and/or midsize companies increase the risk of greater price fluctuations. Growth stocks may be more susceptible to earnings disappointments, and value stocks may fail to rebound. Stock prices may fall or fail to rise over time for several reasons, including general financial market conditions and factors related to a specific issuer or industry. You can lose money by investing in the fund.
Message from the Trustees
Dear Fellow Shareholder:
In the final months of 2013, we continue to see business conditions as generally positive for well-diversified investment portfolios. Financial markets have shown surprising resilience in the face of recent headwinds, most notably the confrontation over the federal budget and debt ceiling, which took a toll on the economy during October. With Congressional negotiations now continuing into 2014, there is hope that lawmakers may reach an agreement beneficial to the economy, even as investors remain alert to the risk of additional disruption.
Fortunately, equity markets have easily overcome recent obstacles. Supported by generally solid corporate earnings and healthy balance sheets, stock market gains to this point are far above the long-term average for a single year. International stocks have also performed well, particularly in Europe and Japan. While bonds have lagged behind stocks, many fixed-income sectors have advanced, reminding investors of the need for flexible and selective approaches. The sting of rising interest rates has been felt primarily by Treasuries and other government bonds.
At Putnam, we believe markets in flux can often provide the best opportunity for realizing the benefits of financial advice and active portfolio management. An experienced advisor can help investors stay focused on their long-term goals without getting distracted by daily economic and political events. Challenging times also call for innovative and alternative investment strategies managed by experts. In seeking returns for fund shareholders, Putnam’s investment professionals engage in fundamental research, active investing, and risk management strategies.
We would like to welcome new shareholders of the fund and to thank you for investing with Putnam. We would also like to extend our thanks to Elizabeth Kennan, who has retired from the Board of Trustees, for her 20 years of dedicated service.

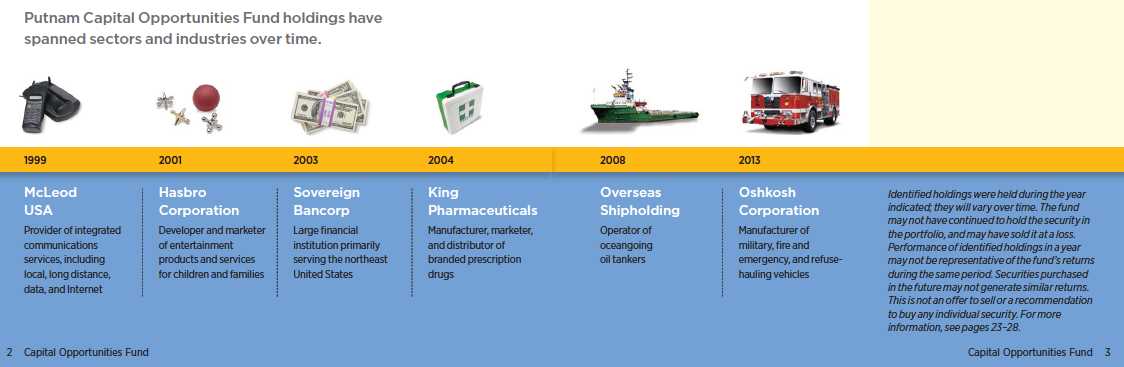
About the fund
Seeking overlooked, underpriced small and midsize companies
Every company, whatever its industry, growth rate, or size, has an underlying value. This value is based in part on the cash flows the company generates. The price of a company’s stock, however, may not accurately reflect this underlying value. A stock may be mispriced for different reasons, and it is often the result of behavioral bias — when investors overreact to short-term factors.
Mispriced stocks can provide attractive opportunities for investors who have the expertise and insight to identify them. The managers of Putnam Capital Opportunities Fund look for stocks they believe are trading below their intrinsic value and can appreciate over time. It is up to the managers to uncover the reasons behind a stock’s valuation and to determine whether the market’s generally held assumptions are on target.
The fund focuses on stocks of small and midsize companies, which are typically covered by fewer analysts than are large companies. With fewer analysts following these stocks, there may be more overlooked investment opportunities to pursue.
In seeking stocks with long-term growth potential, the managers draw on their own experience as well as that of the analysts in
Putnam’s Global Equity Research organization. Because the fund is managed in the blend style, the managers are not focused solely on either growth- or value-style stocks and can choose from thousands of small and midsize U.S. companies. This flexibility means the fund’s portfolio is broadly diversified, which can help reduce the risk of investing in a narrow range of sectors or stocks.
In all their decisions, the managers are guided by Putnam’s risk controls, which call for regular review of fund holdings and the discipline to trim or sell stocks when they reach or exceed what is considered their true worth.
Investor overreaction can mean investment opportunities
An important factor in the analysis for Putnam Capital Opportunities Fund is “behavioral insight.” Investors frequently focus on short-term financial performance while ignoring the potential for a stock to outperform over the long term. For example, investors may overreact to a specific event, such as a management change, and either sell off the stock or buy it in large quantities. This overreaction can skew a stock’s price out of proportion to the real impact of the event. The result can develop into a buying or a selling opportunity for astute investment managers.
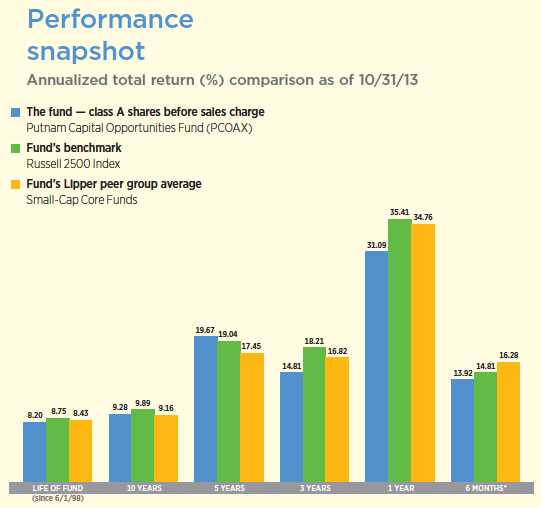
Current performance may be lower or higher than the quoted past performance, which cannot guarantee future results. Share price, principal value, and return will fluctuate, and you may have a gain or a loss when you sell your shares. Performance of class A shares assumes reinvestment of distributions and does not account for taxes. Fund returns in the bar chart do not reflect a sales charge of 5.75%; had they, returns would have been lower. See pages 5 and 10–12 for additional performance information. For a portion of the periods, the fund had expense limitations, without which returns would have been lower. To obtain the most recent month-end performance, visit putnam.com.
* Returns for the six-month period are not annualized, but cumulative.
| |
| 4 | Capital Opportunities Fund |
Interview with your fund’s portfolio manager

How would you describe the investment environment for the six-month reporting period ended October 31, 2013?
Fewer global risks dominated the market environment than the previous reporting period. Europe’s economy seemed to gain more stability, with growth turning positive in the second quarter, effectively ending the region’s recession, while the U.S. economy improved modestly. The U.S. housing market recovery continued. Consumers gained confidence and spending increased on large ticket items, contributing to a rebound in the automotive industry, which likely benefited from the low-interest-rate environment and pent-up demand. Still, consumers demonstrated some caution about the economic recovery, as evidenced by sluggish spending in many of the lower-cost segments of the retail sector.
In the spring, markets also experienced volatility following comments from the Federal Reserve chairman about the possibility of the central bank reducing its $85-billion-per-month asset-purchasing program. Initial comments from Fed Chairman Ben Bernanke set off months of speculation about rising rates and fueled market volatility, particularly in the bond market. At its September meeting, the Fed decided against tapering. Although economic data had improved, the job market continued to exhibit a slow recovery. The unemployment rate had dropped slightly, only to edge higher in October. At the same time, stock markets

This comparison shows your fund’s performance in the context of broad market indexes for the six months ended 10/31/13. See pages 4 and 10–12 for additional fund performance information. Index descriptions can be found on page 14.
| |
| Capital Opportunities Fund | 5 |
rallied and many of the U.S. indexes reached record highs.
Against this backdrop, Putnam Capital Opportunities Fund slightly underperformed its benchmark, the Russell 2500 Index, and the average return of its Lipper peer group, Small-Cap Core Funds. During the period, small-cap growth stocks outperformed small-cap value stocks in the broader market. Putnam Capital Opportunities Fund is in the core space, but the portfolio tends to lean toward value, which did not help performance. Also, stock selection and cash allocation detracted from performance.
What effects did the 16-day partial U.S. government shutdown and debt limit debate have on markets?
The political debate seemed to generate investor uncertainty, but not to the extent that we witnessed in 2012 when the government struggled with similar budget deficit and national debt issues. The markets seemed to handle it better this time, even with the government shutdown. In our view, the events provoked some anxiety among consumers and curbed spending. But the shutdown was temporary and Congress reached some agreements for the near term. Meanwhile, equity market indexes set record highs.
As the stock market rallied during the period, what trends did you observe in small-cap stocks compared with large-cap stocks, and what might that be signaling?
Small-cap stocks outperformed large-cap stocks during the period. Typically, when small caps outperform, it’s a sign that the economy is improving. Small-cap stocks tend to have a higher beta — and therefore are more sensitive to the economic environment.
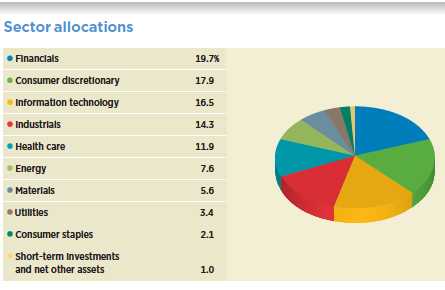
Allocations are shown as a percentage of the fund’s net assets as of 10/31/13. Short-term investments and net other assets, if any, represent the market value weights of cash, derivatives, short-term securities, and other unclassified assets in the portfolio. Summary information may differ from the portfolio schedule included in the financial statements due to the inclusion of derivative securities, any interest accruals, the exclusion of as-of trades, if any, and the use of different classifications of securities for presentation purposes. Holdings and allocations may vary over time.
| |
| 6 | Capital Opportunities Fund |

Regarding trends in industry sectors, consumer staples was the best-performing sector, followed by energy, industrials, and information technology. There was no clear signal about the overall economy from the sectors as performance was mixed between defensive and offensive industries. One trend — poor performance in the utilities sector, based on a rising-interest-rate environment — emerged after the Fed began talking about quantitative tapering.
Did you make any changes in the positioning of the portfolio during the period?
We increased the fund’s exposure to consumer discretionary stocks, finding some valuation opportunities in that area. Energy stocks also sold off sharply during the period, creating what we consider to be attractive valuations. As a result, we increased our allocation to the energy sector. In addition, some regional bank stocks in the portfolio performed well during the past couple of years, so we reduced the fund’s holdings and harvested some gains in this sector during the period. The portfolio remains underweight to REITs relative to the benchmark, as valuations remain high despite the sell-off during the period. The portfolio is also underweight to utilities. In our view, if interest rates rise, the fund will be positioned appropriately.
What is the fund’s investment philosophy and stock selection process?
We base our stock selection on bottom-up, fundamental research, using a valuation model to evaluate every company owned in the portfolio. We look for companies
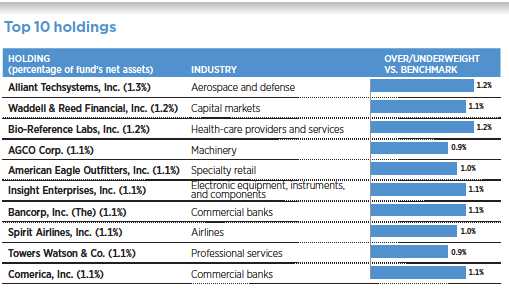
This table shows the fund’s top 10 holdings by percentage of the fund’s net assets as of 10/31/13. Short-term holdings and derivatives, if any, are excluded. Holdings may vary over time.
| |
| Capital Opportunities Fund | 7 |
with what we consider to be the best risk-reward — upside versus downside — profile. This strategy gives the portfolio a value investing tilt. We seek to combine those characteristics with companies with improving fundamentals and relatively solid balance sheets. In our view, the portfolio has a good mix of valuation and quality. We also try to look at a company and the business environment with a longer-term view of two to three years, rather than what the environment may be like for the next quarter or the next year.
Which holdings contributed to fund performance during the period?
Boise, Inc., a manufacturer of paper and corrugated cardboard, was the top contributor to fund performance. Boise was acquired by Packaging Corp. of America during the period. We sold the stock after the acquisition was announced, which was the basis for the contribution to performance.
Spirit Airlines, a low-cost airline based in Florida, was also a leading contributor to performance. Spirit is known for its no-frills, low-cost offerings, which have been popular among cost-conscious consumers. The airline has been profitable, compared with other larger airlines, and has added capacity. Spirit has expanded its network along the East Coast and to many vacation destinations in the Caribbean and Latin America.
Harman International Industries also contributed. Harman is a manufacturer of high-end audio systems and infotainment systems primarily sold to auto manufacturers. The company benefited from improved auto sales during the period and broader adoption of its systems in luxury cars. Penetration into the auto market continues to improve, and the company is moving toward increasing the placement of its systems in lower-cost vehicles.
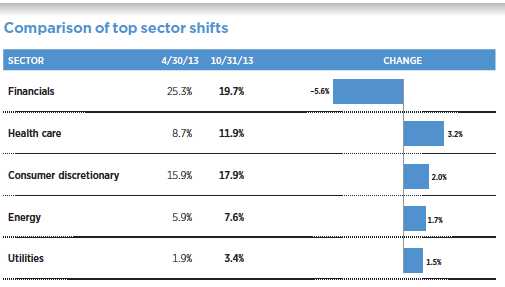
This chart shows the fund’s largest allocation shifts, by percentage, over the past six months. Allocations are shown as a percentage of the fund’s net assets. Current period summary information may differ from the portfolio schedule included in the financial statements due to the inclusion of derivative securities, any interest accruals, the exclusion of as-of trades, if any, and the use of different classifications of securities for presentation purposes. Holdings and allocations may vary over time.
| |
| 8 | Capital Opportunities Fund |
Towers Watson, provider of human resources solutions, also helped. Towers Watson has a business called Exchange Solutions, which serves as an insurance broker for large companies seeking medical plans for retired employees. Exchange Solutions has experienced significant growth since it was launched several years ago.
Which holdings detracted from fund performance?
ValueClick, a provider of online marketing services, sales leads, and display advertising, hurt performance. Company growth slowed because of declines in its traditional display business and an increasingly competitive business environment.
McDermott International, an engineering, procurement, construction, and installation company focused on the offshore oil and gas markets, was another top detractor. The company has experienced some problems with certain projects it bid on a few years ago, including cost overruns, which have impeded the execution of those projects. What’s more, the chief executive officer announced that he would retire effective December 2013. While performance problems hurt its stock price, we still hold the stock in the portfolio because we believe that it is undervalued.
Francesca’s Holdings, a women’s apparel and accessories company, detracted from performance. The stock price suffered from a challenging retail environment, particularly for apparel. Across the industry, apparel companies, especially those in the low-cost segment, suffered during the period. Gas prices increased considerably and consumers were already struggling, which hindered spending. We still hold the stock and like the company because we believe it can offer high returns on capital. In addition, the store is a fairly new concept and we believe it has the opportunity to expand into several new markets.
Chemed, another detractor, owns two businesses: Roto-Rooter and Vitas Innovative Hospice Care. Vitas was affected when the government made rule changes around Hospice Medicare reimbursements that resulted in weak admissions.
What is your outlook for the economy, and how will you be positioning the fund in the coming months?
In our view, we expect the slowly improving global economic recovery to continue. As I mentioned, there are signs that many countries in Europe have stabilized or are improving. Over time, the global recovery may help U.S. companies expand exports, which may provide more traction to the economic recovery in the United States. The portfolio is positioned for this scenario, and we have increased exposure to consumer discretionary and technology companies, where our research is uncovering what we believe to be the best valuation opportunities.
Thank you, Joe, for your time and insights today.
The views expressed in this report are exclusively those of Putnam Management and are subject to change. They are not meant as investment advice.
Please note that the holdings discussed in this report may not have been held by the fund for the entire period. Portfolio composition is subject to review in accordance with the fund’s investment strategy and may vary in the future. Current and future portfolio holdings are subject to risk.
Portfolio Manager Joseph P. Joseph has an M.B.A. from the Stern School of Business at New York University and a B.A. from Loyola College. He joined Putnam in 1994 and has been in the investment industry since 1987.
In addition to Joe, your fund’s portfolio managers are Randy J. Farina, CFA®, and John McLanahan, CFA®.
| |
| Capital Opportunities Fund | 9 |
Your fund’s performance
This section shows your fund’s performance, price, and distribution information for periods ended October 31, 2013, the end of the first half of its current fiscal year. In accordance with regulatory requirements for mutual funds, we also include performance information as of the most recent calendar quarter-end and expense information taken from the fund’s current prospectus. Performance should always be considered in light of a fund’s investment strategy. Data represent past performance. Past performance does not guarantee future results. More recent returns may be less or more than those shown. Investment return and principal value will fluctuate, and you may have a gain or a loss when you sell your shares. Performance information does not reflect any deduction for taxes a shareholder may owe on fund distributions or on the redemption of fund shares. For the most recent month-end performance, please visit the Individual Investors section at putnam.com or call Putnam at 1-800-225-1581. Class R, class R5, class R6, and class Y shares are not available to all investors. See the Terms and Definitions section in this report for definitions of the share classes offered by your fund.
Fund performance Total return for periods ended 10/31/13
| | | | | | | | | | | | |
| | Class A | Class B | Class C | Class M | Class R | Class R5 | Class R6 | Class Y |
| (inception dates) | (6/1/98) | (6/29/98) | (7/26/99) | (6/29/98) | (1/21/03) | (7/2/12) | (7/2/12) | (10/2/00) |
|
| | Before | After | | | | | Before | After | Net | Net | Net | Net |
| | sales | sales | Before | After | Before | After | sales | sales | asset | asset | asset | asset |
| | charge | charge | CDSC | CDSC | CDSC | CDSC | charge | charge | value | value | value | value |
|
| Annual average | | | | | | | | | | | | |
| (life of fund) | 8.20% | 7.79% | 7.40% | 7.40% | 7.40% | 7.40% | 7.65% | 7.40% | 7.93% | 8.45% | 8.46% | 8.44% |
|
| 10 years | 142.98 | 129.01 | 125.35 | 125.35 | 125.24 | 125.24 | 130.98 | 122.90 | 136.80 | 149.62 | 149.89 | 149.26 |
| Annual average | 9.28 | 8.64 | 8.46 | 8.46 | 8.46 | 8.46 | 8.73 | 8.35 | 9.00 | 9.58 | 9.59 | 9.56 |
|
| 5 years | 145.48 | 131.36 | 136.33 | 134.33 | 136.41 | 136.41 | 139.21 | 130.84 | 142.38 | 149.16 | 149.43 | 148.80 |
| Annual average | 19.67 | 18.27 | 18.77 | 18.57 | 18.78 | 18.78 | 19.06 | 18.21 | 19.37 | 20.03 | 20.06 | 20.00 |
|
| 3 years | 51.34 | 42.64 | 47.86 | 44.86 | 47.94 | 47.94 | 48.94 | 43.73 | 50.19 | 52.61 | 52.78 | 52.39 |
| Annual average | 14.81 | 12.57 | 13.93 | 13.15 | 13.94 | 13.94 | 14.20 | 12.85 | 14.52 | 15.13 | 15.17 | 15.08 |
|
| 1 year | 31.09 | 23.55 | 30.09 | 25.09 | 30.10 | 29.10 | 30.46 | 25.89 | 30.79 | 31.68 | 31.83 | 31.49 |
|
| 6 months | 13.92 | 7.37 | 13.44 | 8.44 | 13.53 | 12.53 | 13.56 | 9.59 | 13.71 | 14.13 | 14.12 | 14.02 |
|
Current performance may be lower or higher than the quoted past performance, which cannot guarantee future results. After-sales-charge returns for class A and M shares reflect the deduction of the maximum 5.75% and 3.50% sales charge, respectively, levied at the time of purchase. Class B share returns after contingent deferred sales charge (CDSC) reflect the applicable CDSC, which is 5% in the first year, declining over time to 1% in the sixth year, and is eliminated thereafter. Class C share returns after CDSC reflect a 1% CDSC for the first year that is eliminated thereafter. Class R, R5, R6, and Y shares have no initial sales charge or CDSC. Performance for class B, C, M, R, and Y shares before their inception is derived from the historical performance of class A shares, adjusted for the applicable sales charge (or CDSC) and the higher operating expenses for such shares, except for class Y shares, for which 12b-1 fees are not applicable. Performance for class R5 and R6 shares prior to their inception is derived from the historical performance of class Y shares and has not been adjusted for the lower investor servicing fees applicable to class R5 and R6 shares; had it, returns would have been higher.
For a portion of the periods, the fund had expense limitations, without which returns would have been lower.
Class B share performance does not reflect conversion to class A shares.
| |
| 10 | Capital Opportunities Fund |
Comparative index returns For periods ended 10/31/13
| | |
| | | Lipper Small-Cap Core Funds |
| | Russell 2500 Index | category average* |
|
| Annual average (life of fund) | 8.75% | 8.43% |
|
| 10 years | 156.76 | 142.50 |
| Annual average | 9.89 | 9.16 |
|
| 5 years | 139.05 | 124.68 |
| Annual average | 19.04 | 17.45 |
|
| 3 years | 65.20 | 59.83 |
| Annual average | 18.21 | 16.82 |
|
| 1 year | 35.41 | 34.76 |
|
| 6 months | 14.81 | 16.28 |
|
Index and Lipper results should be compared with fund performance before sales charge, before CDSC, or at net asset value.
* Over the 6-month, 1-year, 3-year, 5-year, 10-year, and life-of-fund periods ended 10/31/13, there were 738, 710, 637, 578, 348, and 142 funds, respectively, in this Lipper category.
Fund price and distribution information For the six-month period ended 10/31/13
| | | | | | | | |
| | Class A | Class B | Class C | Class M | Class R | Class R5 | Class R6 | Class Y |
|
| | Before | After | Net | Net | Before | After | Net | Net | Net | Net |
| | sales | sales | asset | asset | sales | sales | asset | asset | asset | asset |
| Share value | charge | charge | value | value | charge | charge | value | value | value | value |
|
| 4/30/13 | $14.01 | $14.86 | $12.50 | $12.64 | $13.05 | $13.52 | $13.71 | $14.37 | $14.38 | $14.34 |
|
| 10/31/13 | 15.96 | 16.93 | 14.18 | 14.35 | 14.82 | 15.36 | 15.59 | 16.40 | 16.41 | 16.35 |
|
The classification of distributions, if any, is an estimate. Before-sales-charge share value and current dividend rate for class A and M shares, if applicable, do not take into account any sales charge levied at the time of purchase. After-sales-charge share value, current dividend rate, and current 30-day SEC yield, if applicable, are calculated assuming that the maximum sales charge (5.75% for class A shares and 3.50% for class M shares) was levied at the time of purchase. Final distribution information will appear on your year-end tax forms.
The fund made no distributions during the period.
| |
| Capital Opportunities Fund | 11 |
Fund performance as of most recent calendar quarter
Total return for periods ended 9/30/13
| | | | | | | | | | | | |
| | Class A | Class B | Class C | Class M | Class R | Class R5 | Class R6 | Class Y |
| (inception dates) | (6/1/98) | (6/29/98) | (7/26/99) | (6/29/98) | (1/21/03) | (7/2/12) | (7/2/12) | (10/2/00) |
|
| | Before | After | | | | | Before | After | Net | Net | Net | Net |
| | sales | sales | Before | After | Before | After | sales | sales | asset | asset | asset | asset |
| | charge | charge | CDSC | CDSC | CDSC | CDSC | charge | charge | value | value | value | value |
|
| Annual average | | | | | | | | | | | | |
| (life of fund) | 7.99% | 7.57% | 7.19% | 7.19% | 7.19% | 7.19% | 7.44% | 7.19% | 7.72% | 8.24% | 8.25% | 8.23% |
|
| 10 years | 150.97 | 136.54 | 132.91 | 132.91 | 132.85 | 132.85 | 138.67 | 130.31 | 144.71 | 157.88 | 158.16 | 157.47 |
| Annual average | 9.64 | 8.99 | 8.82 | 8.82 | 8.82 | 8.82 | 9.09 | 8.70 | 9.36 | 9.94 | 9.95 | 9.92 |
|
| 5 years | 87.37 | 76.60 | 80.47 | 78.47 | 80.44 | 80.44 | 82.64 | 76.25 | 84.95 | 90.00 | 90.21 | 89.70 |
| Annual average | 13.38 | 12.05 | 12.53 | 12.28 | 12.53 | 12.53 | 12.80 | 12.00 | 13.09 | 13.70 | 13.72 | 13.66 |
|
| 3 years | 52.64 | 43.86 | 49.34 | 46.34 | 49.30 | 49.30 | 50.42 | 45.16 | 51.51 | 54.04 | 54.21 | 53.80 |
| Annual average | 15.14 | 12.89 | 14.30 | 13.53 | 14.29 | 14.29 | 14.58 | 13.23 | 14.85 | 15.49 | 15.53 | 15.43 |
|
| 1 year | 24.48 | 17.33 | 23.58 | 18.58 | 23.57 | 22.57 | 23.83 | 19.50 | 24.21 | 24.96 | 25.10 | 24.76 |
|
| 6 months | 9.31 | 3.03 | 8.92 | 3.92 | 8.98 | 7.98 | 9.00 | 5.19 | 9.15 | 9.49 | 9.56 | 9.45 |
|
See the discussion following the Fund performance table on page 10 for information about the calculation of fund performance.
Your fund’s expenses
As a mutual fund investor, you pay ongoing expenses, such as management fees, distribution fees (12b-1 fees), and other expenses. Using the following information, you can estimate how these expenses affect your investment and compare them with the expenses of other funds. You may also pay one-time transaction expenses, including sales charges (loads) and redemption fees, which are not shown in this section and would have resulted in higher total expenses. For more information, see your fund’s prospectus or talk to your financial representative.
Expense ratios
| | | | | | | | |
| | Class A | Class B | Class C | Class M | Class R | Class R5 | Class R6 | Class Y |
|
| Total annual operating expenses for | | | | | | | | |
| the fiscal year ended 4/30/13 | 1.25% | 2.00% | 2.00% | 1.75% | 1.50% | 0.86%* | 0.76%* | 1.00% |
|
| Annualized expense ratio for the | | | | | | | | |
| six-month period ended 10/31/13 | 1.19% | 1.94% | 1.94% | 1.69% | 1.44% | 0.84% | 0.74% | 0.94% |
|
Fiscal-year expense information in this table is taken from the most recent prospectus, is subject to change, and may differ from that shown for the annualized expense ratio and in the financial highlights of this report. Expenses are shown as a percentage of average net assets.
* Other expenses for class R5 and class R6 shares have been annualized.
| |
| 12 | Capital Opportunities Fund |
Expenses per $1,000
The following table shows the expenses you would have paid on a $1,000 investment in the fund from May 1, 2013, to October 31, 2013. It also shows how much a $1,000 investment would be worth at the close of the period, assuming actual returns and expenses.
| | | | | | | | |
| | Class A | Class B | Class C | Class M | Class R | Class R5 | Class R6 | Class Y |
|
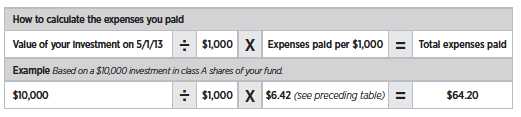
| Expenses paid per $1,000*† | $6.42 | $10.44 | $10.44 | $9.10 | $7.76 | $4.53 | $3.99 | $5.07 |
|
| Ending value (after expenses) | $1,139.20 | $1,134.40 | $1,135.30 | $1,135.60 | $1,137.10 | $1,141.30 | $1,141.20 | $1,140.20 |
|
* Expenses for each share class are calculated using the fund’s annualized expense ratio for each class, which represents the ongoing expenses as a percentage of average net assets for the six months ended 10/31/13. The expense ratio may differ for each share class.
† Expenses are calculated by multiplying the expense ratio by the average account value for the period; then multiplying the result by the number of days in the period; and then dividing that result by the number of days in the year.
Estimate the expenses you paid
To estimate the ongoing expenses you paid for the six months ended October 31, 2013, use the following calculation method. To find the value of your investment on May 1, 2013, call Putnam at 1-800-225-1581.
Compare expenses using the SEC’s method
The Securities and Exchange Commission (SEC) has established guidelines to help investors assess fund expenses. Per these guidelines, the following table shows your fund’s expenses based on a $1,000 investment, assuming a hypothetical 5% annualized return. You can use this information to compare the ongoing expenses (but not transaction expenses or total costs) of investing in the fund with those of other funds. All mutual fund shareholder reports will provide this information to help you make this comparison. Please note that you cannot use this information to estimate your actual ending account balance and expenses paid during the period.
| | | | | | | | |
| | Class A | Class B | Class C | Class M | Class R | Class R5 | Class R6 | Class Y |
|
| Expenses paid per $1,000*† | $6.06 | $9.86 | $9.86 | $8.59 | $7.32 | $4.28 | $3.77 | $4.79 |
|
| Ending value (after expenses) | $1,019.21 | $1,015.43 | $1,015.43 | $1,016.69 | $1,017.95 | $1,020.97 | $1,021.48 | $1,020.47 |
|
* Expenses for each share class are calculated using the fund’s annualized expense ratio for each class, which represents the ongoing expenses as a percentage of average net assets for the six months ended 10/31/13. The expense ratio may differ for each share class.
† Expenses are calculated by multiplying the expense ratio by the average account value for the six-month period; then multiplying the result by the number of days in the six-month period; and then dividing that result by the number of days in the year.
| |
| Capital Opportunities Fund | 13 |
Terms and definitions
Important terms
Total return shows how the value of the fund’s shares changed over time, assuming you held the shares through the entire period and reinvested all distributions in the fund.
Before sales charge, or net asset value, is the price, or value, of one share of a mutual fund, without a sales charge. Before-sales-charge figures fluctuate with market conditions, and are calculated by dividing the net assets of each class of shares by the number of outstanding shares in the class.
After sales charge is the price of a mutual fund share plus the maximum sales charge levied at the time of purchase. After-sales-charge performance figures shown here assume the 5.75% maximum sales charge for class A shares and 3.50% for class M shares.
Contingent deferred sales charge (CDSC) is generally a charge applied at the time of the redemption of class B or C shares and assumes redemption at the end of the period. Your fund’s class B CDSC declines over time from a 5% maximum during the first year to 1% during the sixth year. After the sixth year, the CDSC no longer applies. The CDSC for class C shares is 1% for one year after purchase.
Share classes
Class A shares are generally subject to an initial sales charge and no CDSC (except on certain redemptions of shares bought without an initial sales charge).
Class B shares are not subject to an initial sales charge. They may be subject to a CDSC.
Class C shares are not subject to an initial sales charge and are subject to a CDSC only if the shares are redeemed during the first year.
Class M shares have a lower initial sales charge and a higher 12b-1 fee than class A shares and no CDSC (except on certain redemptions of shares bought without an initial sales charge).
Class R shares are not subject to an initial sales charge or CDSC and are available only to certain defined contribution plans.
Class R5 shares and class R6 shares are not subject to an initial sales charge or CDSC, and carry no 12b-1 fee. They are only available to employer-sponsored retirement plans.
Class Y shares are not subject to an initial sales charge or CDSC, and carry no 12b-1 fee. They are generally only available to corporate and institutional clients and clients in other approved programs.
Comparative indexes
Barclays U.S. Aggregate Bond Index is an unmanaged index of U.S. investment-grade fixed-income securities.
BofA Merrill Lynch U.S. 3-Month Treasury Bill Index is an unmanaged index that seeks to measure the performance of U.S. Treasury bills available in the marketplace.
Russell 2500 Index is an unmanaged index of 2,500 small and midsize companies in the Russell 3000 Index.
S&P 500 Index is an unmanaged index of common stock performance.
Indexes assume reinvestment of all distributions and do not account for fees. Securities and performance of a fund and an index will differ. You cannot invest directly in an index.
Lipper is a third-party industry-ranking entity that ranks mutual funds. Its rankings do not reflect sales charges. Lipper rankings are based on total return at net asset value relative to other funds that have similar current investment styles or objectives as determined by Lipper. Lipper may change a fund’s category assignment at its discretion. Lipper category averages reflect performance trends for funds within a category.
| |
| 14 | Capital Opportunities Fund |
Other information for shareholders
Important notice regarding delivery of shareholder documents
In accordance with Securities and Exchange Commission (SEC) regulations, Putnam sends a single copy of annual and semiannual shareholder reports, prospectuses, and proxy statements to Putnam shareholders who share the same address, unless a shareholder requests otherwise. If you prefer to receive your own copy of these documents, please call Putnam at 1-800-225-1581, and Putnam will begin sending individual copies within 30 days.
Proxy voting
Putnam is committed to managing our mutual funds in the best interests of our shareholders. The Putnam funds’ proxy voting guidelines and procedures, as well as information regarding how your fund voted proxies relating to portfolio securities during the 12-month period ended June 30, 2013, are available in the Individual Investors section of putnam.com, and on the SEC’s website, www.sec.gov. If you have questions about finding forms on the SEC’s website, you may call the SEC at 1-800-SEC-0330. You may also obtain the Putnam funds’ proxy voting guidelines and procedures at no charge by calling Putnam’s Shareholder Services at 1-800-225-1581.
Fund portfolio holdings
The fund will file a complete schedule of its portfolio holdings with the SEC for the first and third quarters of each fiscal year on Form N-Q. Shareholders may obtain the fund’s Forms N-Q on the SEC’s website at www.sec.gov. In addition, the fund’s Forms N-Q may be reviewed and copied at the SEC’s Public Reference Room in Washington, D.C. You may call the SEC at 1-800-SEC-0330 for information about the SEC’s website or the operation of the Public Reference Room.
Trustee and employee fund ownership
Putnam employees and members of the Board of Trustees place their faith, confidence, and, most importantly, investment dollars in Putnam mutual funds. As of October 31, 2013, Putnam employees had approximately $414,000,000 and the Trustees had approximately $99,000,000 invested in Putnam mutual funds. These amounts include investments by the Trustees’ and employees’ immediate family members as well as investments through retirement and deferred compensation plans.
| |
| Capital Opportunities Fund | 15 |
Trustee approval of management contract
General conclusions
The Board of Trustees of the Putnam funds oversees the management of each fund and, as required by law, determines annually whether to approve the continuance of your fund’s management contract with Putnam Investment Management (“Putnam Management”) and the sub-management contract with respect to your fund between Putnam Management and its affiliate, Putnam Investments Limited (“PIL”). The Board of Trustees, with the assistance of its Contract Committee, requests and evaluates all information it deems reasonably necessary under the circumstances in connection with its annual contract review. The Contract Committee consists solely of Trustees who are not “interested persons” (as this term is defined in the Investment Company Act of 1940, as amended (the “1940 Act”)) of the Putnam funds (“Independent Trustees”).
At the outset of the review process, members of the Board’s independent staff and independent legal counsel met with representatives of Putnam Management to review the annual contract review materials furnished to the Contract Committee during the course of the previous year’s review and to discuss possible changes in these materials that might be necessary or desirable for the coming year. Following these discussions and in consultation with the Contract Committee, the Independent Trustees’ independent legal counsel requested that Putnam Management furnish specified information, together with any additional information that Putnam Management considered relevant, to the Contract Committee. Over the course of several months ending in June 2013, the Contract Committee met on a number of occasions with representatives of Putnam Management, and separately in executive session, to consider the information that Putnam Management provided. Throughout this process, the Contract Committee was assisted by the members of the Board’s independent staff and by independent legal counsel for the Putnam funds and the Independent Trustees.
In May 2013, the Contract Committee met in executive session to discuss and consider its preliminary recommendations with respect to the continuance of the contracts. At the Trustees’ June 20, 2013 meeting, the Contract Committee met in executive session with the other Independent Trustees to review a summary of the key financial data that the Contract Committee considered in the course of its review. The Contract Committee then presented its written report, which summarized the key factors that the Committee had considered and set forth its final recommendations. The Contract Committee then recommended, and the Independent Trustees approved, the continuance of your fund’s management and sub-management contracts, effective July 1, 2013, subject to certain changes in the sub-management contract noted below. (Because PIL is an affiliate of Putnam Management and Putnam Management remains fully responsible for all services provided by PIL, the Trustees have not evaluated PIL as a separate entity, and all subsequent references to Putnam Management below should be deemed to include reference to PIL as necessary or appropriate in the context.)
The Independent Trustees’ approval was based on the following conclusions:
• That the fee schedule in effect for your fund represented reasonable compensation in light of the nature and quality of the services being provided to the fund, the fees paid by competitive funds, and the costs incurred by Putnam Management in providing services to the fund, and
• That the fee schedule represented an appropriate sharing between fund
| |
| 16 | Capital Opportunities Fund |
shareholders and Putnam Management of such economies of scale as may exist in the management of the fund at current asset levels.
These conclusions were based on a comprehensive consideration of all information provided to the Trustees and were not the result of any single factor. Some of the factors that figured particularly in the Trustees’ deliberations and how the Trustees considered these factors are described below, although individual Trustees may have evaluated the information presented differently, giving different weights to various factors. It is also important to recognize that the management arrangements for your fund and the other Putnam funds are the result of many years of review and discussion between the Independent Trustees and Putnam Management, that some aspects of the arrangements may receive greater scrutiny in some years than others, and that the Trustees’ conclusions may be based, in part, on their consideration of fee arrangements in previous years. For example, with some minor exceptions, the current fee arrangements in the management contracts for the Putnam funds were implemented at the beginning of 2010 following extensive review and discussion by the Trustees, as well as approval by shareholders.
As noted above, the Trustees considered administrative revisions to your fund’s sub-management contract. Putnam Management recommended that the sub-management contract be revised to reduce the sub-management fee that Putnam Management pays to PIL with respect to the portion of the portfolios of certain funds, but not your fund, that may be allocated to PIL from time to time. The Independent Trustees’ approval of this recommendation was based on their conclusion that these changes would have no practical effect on Putnam Management’s continued responsibility for the management of these funds or the costs borne by fund shareholders and would not result in any reduction in the nature and quality of services provided to the funds.
Management fee schedules and total expenses
The Trustees reviewed the management fee schedules in effect for all Putnam funds, including fee levels and breakpoints. The Trustees also reviewed the total expenses of each Putnam fund, recognizing that in most cases management fees represented the major, but not the sole, determinant of total costs to shareholders.
In reviewing fees and expenses, the Trustees generally focus their attention on material changes in circumstances — for example, changes in assets under management, changes in a fund’s investment style, changes in Putnam Management’s operating costs or profitability, or changes in competitive practices in the mutual fund industry — that suggest that consideration of fee changes might be warranted. The Trustees concluded that the circumstances did not warrant changes to the management fee structure of your fund.
Under its management contract, your fund has the benefit of breakpoints in its management fee schedule that provide shareholders with economies of scale in the form of reduced fee levels as assets under management in the Putnam family of funds increase. The Trustees concluded that the fee schedule in effect for your fund represented an appropriate sharing of economies of scale between fund shareholders and Putnam Management.
As in the past, the Trustees also focused on the competitiveness of each fund’s total expense ratio. In order to ensure that expenses of the Putnam funds continue to meet competitive standards, the Trustees and Putnam Management have implemented certain expense limitations. These expense limitations were: (i) a contractual expense limitation applicable to all retail open-end funds of 32 basis points on investor servicing fees and expenses and
| |
| Capital Opportunities Fund | 17 |
(ii) a contractual expense limitation applicable to all open-end funds of 20 basis points on so-called “other expenses” (i.e., all expenses exclusive of management fees, investor servicing fees, distribution fees, investment-related expenses, interest, taxes, brokerage commissions, extraordinary expenses and acquired fund fees and expenses). These expense limitations serve in particular to maintain competitive expense levels for funds with large numbers of small shareholder accounts and funds with relatively small net assets. Most funds, including your fund, had sufficiently low expenses that these expense limitations did not apply. Putnam Management’s support for these expense limitations was an important factor in the Trustees’ decision to approve the continuance of your fund’s management and sub-management contracts.
The Trustees reviewed comparative fee and expense information for a custom group of competitive funds selected by Lipper Inc. This comparative information included your fund’s percentile ranking for effective management fees and total expenses (excluding any applicable 12b-1 fee), which provides a general indication of your fund’s relative standing. In the custom peer group, your fund ranked in the first quintile in effective management fees (determined for your fund and the other funds in the custom peer group based on fund asset size and the applicable contractual management fee schedule) and in the first quintile in total expenses (excluding any applicable 12b-1 fees) as of December 31, 2012 (the first quintile representing the least expensive funds and the fifth quintile the most expensive funds). The fee and expense data reported by Lipper as of December 31, 2012 reflected the most recent fiscal year-end data available in Lipper’s database at that time.
In connection with their review of the management fees and total expenses of the Putnam funds, the Trustees also reviewed the costs of the services provided and the profits realized by Putnam Management and its affiliates from their contractual relationships with the funds. This information included trends in revenues, expenses and profitability of Putnam Management and its affiliates relating to the investment management, investor servicing and distribution services provided to the funds. In this regard, the Trustees also reviewed an analysis of Putnam Management’s revenues, expenses and profitability, allocated on a fund-by-fund basis, with respect to the funds’ management, distribution, and investor servicing contracts. For each fund, the analysis presented information about revenues, expenses and profitability for each of the agreements separately and for the agreements taken together on a combined basis. The Trustees concluded that, at current asset levels, the fee schedules in place represented reasonable compensation for the services being provided and represented an appropriate sharing of such economies of scale as may exist in the management of the Putnam funds at that time.
The information examined by the Trustees as part of their annual contract review for the Putnam funds has included for many years information regarding fees charged by Putnam Management and its affiliates to institutional clients such as defined benefit pension plans, college endowments, and the like. This information included comparisons of those fees with fees charged to the funds, as well as an assessment of the differences in the services provided to these different types of clients. The Trustees observed that the differences in fee rates between institutional clients and mutual funds are by no means uniform when examined by individual asset sectors, suggesting that differences in the pricing of investment management services to these types of clients may reflect historical competitive forces operating in separate markets. The Trustees considered the fact that in many cases fee rates across different asset classes are higher on average
| |
| 18 | Capital Opportunities Fund |
for mutual funds than for institutional clients, as well as the differences between the services that Putnam Management provides to the Putnam funds and those that it provides to its institutional clients. The Trustees did not rely on these comparisons to any significant extent in concluding that the management fees paid by your fund are reasonable.
Investment performance
The quality of the investment process provided by Putnam Management represented a major factor in the Trustees’ evaluation of the quality of services provided by Putnam Management under your fund’s management contract. The Trustees were assisted in their review of the Putnam funds’ investment process and performance by the work of the investment oversight committees of the Trustees, which meet on a regular basis with the funds’ portfolio teams and with the Chief Investment Officer and other senior members of Putnam Management’s Investment Division throughout the year. The Trustees concluded that Putnam Management generally provides a high-quality investment process — based on the experience and skills of the individuals assigned to the management of fund portfolios, the resources made available to them, and in general Putnam Management’s ability to attract and retain high-quality personnel — but also recognized that this does not guarantee favorable investment results for every fund in every time period.
The Trustees considered that 2012 was a year of strong competitive performance for many of the Putnam funds, with only a relatively small number of exceptions. They noted that this strong performance was exemplified by the fact that the Putnam funds were recognized by Barron’s as the best performing mutual fund complex for 2012 — the second time in four years that Putnam Management has achieved this distinction for the Putnam funds. They also noted, however, the disappointing investment performance of some funds for periods ended December 31, 2012 and considered information provided by Putnam Management regarding the factors contributing to the underperformance and actions being taken to improve the performance of these particular funds. The Trustees indicated their intention to continue to monitor performance trends to assess the effectiveness of these efforts and to evaluate whether additional actions to address areas of underperformance are warranted.
For purposes of evaluating investment performance, the Trustees generally focus on competitive industry rankings for the one-year, three-year, and five-year periods. For a number of Putnam funds with relatively unique investment mandates, the Trustees evaluated performance based on comparisons of their total returns with the returns of selected investment benchmarks or targeted returns. In the case of your fund, the Trustees considered that its class A share cumulative total return performance at net asset value was in the following quartiles of its Lipper Inc. peer group (Lipper Small-Cap Core Funds) for the one-year, three-year and five-year periods ended December 31, 2012 (the first quartile representing the best-performing funds and the fourth quartile the worst-performing funds):
| | | |
| One-year period | 3rd | | |
| | |
| Three-year period | 2nd | | |
| | |
| Five-year period | 1st | | |
| | |
Over the one-year, three-year and five-year periods ended December 31, 2012, there were 705, 623 and 539 funds, respectively, in your fund’s Lipper peer group. (When considering performance information, shareholders should be mindful that past performance is not a guarantee of future results.)
Brokerage and soft-dollar allocations; investor servicing
The Trustees considered various potential benefits that Putnam Management may receive in connection with the services it provides under
| |
| Capital Opportunities Fund | 19 |
the management contract with your fund. These include benefits related to brokerage allocation and the use of soft dollars, whereby a portion of the commissions paid by a fund for brokerage may be used to acquire research services that are expected to be useful to Putnam Management in managing the assets of the fund and of other clients. Subject to policies established by the Trustees, soft dollars generated by these means are used primarily to acquire brokerage and research services that enhance Putnam Management’s investment capabilities and supplement Putnam Management’s internal research efforts. However, the Trustees noted that a portion of available soft dollars continues to be used to pay fund expenses. The Trustees indicated their continued intent to monitor regulatory and industry developments in this area with the assistance of their Brokerage Committee and also indicated their continued intent to monitor the allocation of the Putnam funds’ brokerage in order to ensure that the principle of seeking best price and execution remains paramount in the portfolio trading process.
Putnam Management may also receive benefits from payments that the funds make to Putnam Management’s affiliates for investor or distribution services. In conjunction with the annual review of your fund’s management and sub-management contracts, the Trustees reviewed your fund’s investor servicing agreement with Putnam Investor Services, Inc. (“PSERV”) and its distributor’s contracts and distribution plans with Putnam Retail Management Limited Partnership (“PRM”), both of which are affiliates of Putnam Management. The Trustees concluded that the fees payable by the funds to PSERV and PRM, as applicable, for such services are reasonable in relation to the nature and quality of such services, the fees paid by competitive funds, and the costs incurred by PSERV and PRM, as applicable, in providing such services.
Consideration of your fund’s interim management contract and the continuance of the fund’s sub-management contract
Following the Trustees’ approval of the continuance of your fund’s management and sub-management contracts, on October 8, 2013, The Honourable Paul G. Desmarais passed away. Mr. Desmarais, both directly and though holding companies, controlled a majority of the voting shares of Power Corporation of Canada, the ultimate parent company of Putnam Management. Upon his death, Mr. Desmarais’ voting control of shares of Power Corporation of Canada was transferred to The Desmarais Family Residuary Trust (the “Transfer”). As a technical matter, the Transfer may have constituted an “assignment” within the meaning of the Investment Company Act of 1940, causing the fund’s existing management and sub-management contracts to terminate automatically. On October 18, 2013, the Trustees approved your fund’s interim management contract and the continuance of your fund’s sub-management contract to address this possibility and to avoid disruption of investment advisory and other services provided to your fund. At a subsequent meeting on November 22, 2013, the Trustees, including all of the Independent Trustees, approved new definitive management contracts between the Putnam funds and Putnam Management and determined to recommend their approval to the shareholders of the Putnam funds at a shareholder meeting to be held in early 2014.
In considering whether to approve your fund’s interim management contract and new definitive management contract and the continuance of your fund’s sub-management contract, the Trustees took into account that they had most recently approved the annual continuation of the fund’s previous management and sub-management contracts at their meeting in June 2013, as described above.
| |
| 20 | Capital Opportunities Fund |
The Trustees considered that the terms of the interim management contract and new definitive management contract were identical to the previous management contract, except for the effective dates and initial terms and for certain non-substantive changes. They also considered that the sub-management contract was identical to the previous sub-management contract, except for the effective dates and initial terms. Because the proposed contracts were substantially identical to the previous versions of these contracts approved by the Trustees at their June 2013 meeting, the Trustees relied to a considerable extent on their prior approval of these contracts. In addition, the Trustees considered a number other factors relating to the Transfer, including, but not limited to, the following:
• Information about the operations of The Desmarais Family Residuary Trust, including that Paul Desmarais, Jr. and André Desmarais, Mr. Desmarais’ sons, were expected to exercise, jointly, voting control over the Power Corporation of Canada shares controlled by The Desmarais Family Residuary Trust.
• That Paul Desmarais, Jr. and André Desmarais had been playing active managerial roles at Power Corporation of Canada, with responsibility for the oversight of Power Corporation of Canada’s subsidiaries, including Putnam Investments, since Power Corporation of Canada had acquired Putnam Investments in 2007, including serving as Directors of Putnam Investments, and that the Transfer would not affect their responsibilities as officers of Power Corporation of Canada.
• The intention expressed by representatives of Power Corporation of Canada and its subsidiaries, Power Financial Corporation and Great-West Lifeco, that there would be no change to the operations or management of Putnam Investments, to Putnam Management’s management of the funds or to investment, advisory and other services provided to the funds by Putnam Management and its affiliates as a result of the Transfer.
• Putnam Management’s assurances that, following the Transfer, Putnam Management would continue to provide the same level of services to each fund and that the Transfer will not have an adverse impact on the ability of Putnam Management and its affiliates to continue to provide high quality investment advisory and other services to the funds.
• Putnam Management’s assurances that there are no current plans to make any changes to the operations of the funds, existing management fees, expense limitations, distribution arrangements, or the quality of any services provided to the funds or their shareholders, as a result of the Transfer.
• The benefits that the funds have received and may potentially receive as a result of Putnam Management being a member of the Power Corporation of Canada group of companies, which promotes the stability of the Putnam organization.
| |
| Capital Opportunities Fund | 21 |
Financial statements
A guide to financial statements
These sections of the report, as well as the accompanying Notes, constitute the fund’s financial statements.
The fund’s portfolio lists all the fund’s investments and their values as of the last day of the reporting period. Holdings are organized by asset type and industry sector, country, or state to show areas of concentration and diversification.
Statement of assets and liabilities shows how the fund’s net assets and share price are determined. All investment and non-investment assets are added together. Any unpaid expenses and other liabilities are subtracted from this total. The result is divided by the number of shares to determine the net asset value per share, which is calculated separately for each class of shares. (For funds with preferred shares, the amount subtracted from total assets includes the liquidation preference of preferred shares.)
Statement of operations shows the fund’s net investment gain or loss. This is done by first adding up all the fund’s earnings — from dividends and interest income — and subtracting its operating expenses to determine net investment income (or loss). Then, any net gain or loss the fund realized on the sales of its holdings — as well as any unrealized gains or losses over the period — is added to or subtracted from the net investment result to determine the fund’s net gain or loss for the fiscal period.
Statement of changes in net assets shows how the fund’s net assets were affected by the fund’s net investment gain or loss, by distributions to shareholders, and by changes in the number of the fund’s shares. It lists distributions and their sources (net investment income or realized capital gains) over the current reporting period and the most recent fiscal year-end. The distributions listed here may not match the sources listed in the Statement of operations because the distributions are determined on a tax basis and may be paid in a different period from the one in which they were earned. Dividend sources are estimated at the time of declaration. Actual results may vary. Any non-taxable return of capital cannot be determined until final tax calculations are completed after the end of the fund’s fiscal year.
Financial highlights provide an overview of the fund’s investment results, per-share distributions, expense ratios, net investment income ratios, and portfolio turnover in one summary table, reflecting the five most recent reporting periods. In a semiannual report, the highlights table also includes the current reporting period.
| |
| 22 | Capital Opportunities Fund |
The fund’s portfolio 10/31/13 (Unaudited)
| | |
| COMMON STOCKS (99.0%)* | Shares | Value |
|
| Aerospace and defense (2.9%) | | |
| AeroVironment, Inc. † S | 120,700 | $3,272,177 |
|
| Alliant Techsystems, Inc. | 48,800 | 5,312,856 |
|
| Orbital Sciences Corp. † | 108,200 | 2,496,174 |
|
| Triumph Group, Inc. | 19,700 | 1,411,505 |
|
| | | 12,492,712 |
| Airlines (2.6%) | | |
| Allegiant Travel Co. | 20,200 | 2,106,254 |
|
| Republic Airways Holdings, Inc. † | 355,800 | 4,191,324 |
|
| Spirit Airlines, Inc. † | 105,500 | 4,552,325 |
|
| | | 10,849,903 |
| Auto components (2.8%) | | |
| Autoliv, Inc. (Sweden) S | 25,203 | 2,248,864 |
|
| BorgWarner, Inc. | 19,423 | 2,003,094 |
|
| Lear Corp. | 54,100 | 4,186,799 |
|
| TRW Automotive Holdings Corp. † | 46,100 | 3,462,571 |
|
| | | 11,901,328 |
| Biotechnology (1.2%) | | |
| Cubist Pharmaceuticals, Inc. † | 38,561 | 2,390,782 |
|
| Myriad Genetics, Inc. † S | 102,900 | 2,508,702 |
|
| | | 4,899,484 |
| Capital markets (2.5%) | | |
| E*Trade Financial Corp. † | 115,100 | 1,946,341 |
|
| Janus Capital Group, Inc. | 353,900 | 3,492,993 |
|
| Waddell & Reed Financial, Inc. Class A | 82,322 | 5,083,384 |
|
| | | 10,522,718 |
| Chemicals (1.0%) | | |
| Koppers Holdings, Inc. | 29,800 | 1,326,398 |
|
| Methanex Corp. (Canada) | 49,559 | 2,882,351 |
|
| | | 4,208,749 |
| Commercial banks (6.0%) | | |
| Associated Banc-Corp. | 130,600 | 2,123,556 |
|
| Bancorp, Inc. (The) † | 282,286 | 4,564,565 |
|
| BOK Financial Corp. | 39,800 | 2,436,954 |
|
| Bond Street Holdings, LLC 144A Class A † F | 38,819 | 582,285 |
|
| Comerica, Inc. | 103,900 | 4,498,870 |
|
| East West Bancorp, Inc. | 126,032 | 4,246,018 |
|
| F.N.B. Corp. S | 153,900 | 1,925,289 |
|
| First Citizens BancShares, Inc. Class A | 9,944 | 2,105,443 |
|
| Popular, Inc. (Puerto Rico) † | 73,360 | 1,852,340 |
|
| Valley National Bancorp S | 126,898 | 1,237,256 |
|
| | | 25,572,576 |
| Commercial services and supplies (0.7%) | | |
| ACCO Brands Corp. † S | 495,700 | 2,899,845 |
|
| | | 2,899,845 |
| Communications equipment (1.3%) | | |
| F5 Networks, Inc. † | 27,000 | 2,200,770 |
|
| Netgear, Inc. † | 43,400 | 1,248,184 |
|
| Polycom, Inc. † | 216,354 | 2,250,082 |
|
| | | 5,699,036 |
| |
| Capital Opportunities Fund | 23 |
| | |
| COMMON STOCKS (99.0%)* cont. | Shares | Value |
|
| Construction and engineering (0.7%) | | |
| URS Corp. | 57,400 | $3,112,228 |
|
| | | 3,112,228 |
| Containers and packaging (0.5%) | | |
| Owens-Illinois, Inc. † | 71,300 | 2,266,627 |
|
| | | 2,266,627 |
| Diversified consumer services (2.4%) | | |
| DeVry, Inc. S | 99,900 | 3,586,410 |
|
| H&R Block, Inc. | 82,326 | 2,341,351 |
|
| ITT Educational Services, Inc. † S | 102,500 | 4,112,300 |
|
| | | 10,040,061 |
| Diversified financial services (0.6%) | | |
| CBOE Holdings, Inc. | 55,300 | 2,682,050 |
|
| | | 2,682,050 |
| Electric utilities (1.2%) | | |
| El Paso Electric Co. | 61,800 | 2,173,506 |
|
| Pepco Holdings, Inc. S | 52,800 | 1,017,984 |
|
| Portland General Electric Co. S | 64,800 | 1,859,760 |
|
| | | 5,051,250 |
| Electrical equipment (0.9%) | | |
| AZZ, Inc. | 39,400 | 1,769,060 |
|
| Brady Corp. Class A | 63,700 | 1,859,403 |
|
| | | 3,628,463 |
| Electronic equipment, instruments, and components (2.7%) | | |
| Arrow Electronics, Inc. † | 84,400 | 4,052,888 |
|
| Avnet, Inc. | 72,600 | 2,882,220 |
|
| Insight Enterprises, Inc. † | 217,400 | 4,580,618 |
|
| | | 11,515,726 |
| Energy equipment and services (4.4%) | | |
| Atwood Oceanics, Inc. † | 41,700 | 2,215,521 |
|
| Helmerich & Payne, Inc. S | 37,900 | 2,939,145 |
|
| Key Energy Services, Inc. † S | 238,458 | 1,864,742 |
|
| McDermott International, Inc. † S | 291,200 | 2,058,784 |
|
| Nabors Industries, Ltd. | 235,800 | 4,121,784 |
|
| Oil States International, Inc. † | 23,651 | 2,569,208 |
|
| Superior Energy Services, Inc. † | 107,900 | 2,894,957 |
|
| | | 18,664,141 |
| Food and staples retail (0.2%) | | |
| Nash Finch Co. | 36,523 | 1,024,835 |
|
| | | 1,024,835 |
| Food products (0.6%) | | |
| Darling International, Inc. † | 108,400 | 2,522,468 |
|
| | | 2,522,468 |
| Gas utilities (1.5%) | | |
| Chesapeake Utilities Corp. | 48,100 | 2,617,121 |
|
| Laclede Group, Inc. (The) | 41,000 | 1,929,870 |
|
| UGI Corp. | 46,600 | 1,927,842 |
|
| | | 6,474,833 |
| Health-care equipment and supplies (1.8%) | | |
| Greatbatch, Inc. † | 86,600 | 3,301,192 |
|
| PhotoMedex, Inc. † S | 88,500 | 1,118,640 |
|
| Thoratec Corp. † | 75,570 | 3,263,868 |
|
| | | 7,683,700 |
| |
| 24 | Capital Opportunities Fund |
| | |
| COMMON STOCKS (99.0%)* cont. | Shares | Value |
|
| Health-care providers and services (6.6%) | | |
| Bio-Reference Labs, Inc. † S | 153,300 | $4,968,453 |
|
| Chemed Corp. S | 40,400 | 2,739,928 |
|
| Ensign Group, Inc. (The) | 68,700 | 2,925,246 |
|
| Hanger, Inc. † | 69,500 | 2,550,650 |
|
| Magellan Health Services, Inc. † | 25,600 | 1,502,720 |
|
| Mednax, Inc. † S | 32,800 | 3,575,856 |
|
| Owens & Minor, Inc. S | 65,000 | 2,432,300 |
|
| Patterson Cos., Inc. | 92,200 | 3,919,422 |
|
| Select Medical Holdings Corp. | 415,000 | 3,519,200 |
|
| | | 28,133,775 |
| Hotels, restaurants, and leisure (0.9%) | | |
| Cheesecake Factory, Inc. (The) S | 78,004 | 3,685,689 |
|
| | | 3,685,689 |
| Household durables (1.1%) | | |
| Harman International Industries, Inc. | 22,358 | 1,811,445 |
|
| Jarden Corp. † | 50,000 | 2,768,000 |
|
| | | 4,579,445 |
| Household products (0.6%) | | |
| Energizer Holdings, Inc. S | 25,100 | 2,462,561 |
|
| | | 2,462,561 |
| Insurance (6.7%) | | |
| American Financial Group, Inc. | 25,983 | 1,461,804 |
|
| Amtrust Financial Services, Inc. S | 67,539 | 2,590,796 |
|
| Aspen Insurance Holdings, Ltd. | 52,475 | 2,047,050 |
|
| Endurance Specialty Holdings, Ltd. S | 26,279 | 1,452,966 |
|
| Genworth Financial, Inc. Class A † | 257,300 | 3,738,569 |
|
| HCC Insurance Holdings, Inc. | 30,807 | 1,406,340 |
|
| Horace Mann Educators Corp. | 59,000 | 1,634,300 |
|
| Protective Life Corp. | 37,200 | 1,714,176 |
|
| Stancorp Financial Group S | 29,522 | 1,738,846 |
|
| Symetra Financial Corp. | 188,500 | 3,530,605 |
|
| Torchmark Corp. S | 32,900 | 2,397,094 |
|
| Validus Holdings, Ltd. | 64,800 | 2,558,304 |
|
| W.R. Berkley Corp. | 45,887 | 2,014,898 |
|
| | | 28,285,748 |
| Internet software and services (1.1%) | | |
| IAC/InterActiveCorp. | 45,029 | 2,404,098 |
|
| ValueClick, Inc. † S | 128,837 | 2,474,959 |
|
| | | 4,879,057 |
| IT Services (5.1%) | | |
| Alliance Data Systems Corp. † S | 16,728 | 3,965,540 |
|
| Booz Allen Hamilton Holding Corp. | 112,000 | 2,217,600 |
|
| Broadridge Financial Solutions, Inc. | 78,000 | 2,742,480 |
|
| CACI International, Inc. Class A † S | 42,300 | 3,044,754 |
|
| Global Payments, Inc. | 51,295 | 3,051,027 |
|
| Mantech International Corp. Class A | 145,900 | 4,076,446 |
|
| NeuStar, Inc. Class A † S | 59,726 | 2,742,618 |
|
| | | 21,840,465 |
| Leisure equipment and products (0.4%) | | |
| Polaris Industries, Inc. S | 13,685 | 1,792,051 |
|
| | | 1,792,051 |
| |
| Capital Opportunities Fund | 25 |
| | |
| COMMON STOCKS (99.0%)* cont. | Shares | Value |
|
| Life sciences tools and services (0.4%) | | |
| Bruker Corp. † | 77,700 | $1,588,965 |
|
| | | 1,588,965 |
| Machinery (4.2%) | | |
| Actuant Corp. Class A | 48,600 | 1,825,416 |
|
| AGCO Corp. | 79,828 | 4,660,359 |
|
| Kennametal, Inc. | 54,700 | 2,516,200 |
|
| Oshkosh Corp. † | 88,254 | 4,200,008 |
|
| Timken Co. | 26,700 | 1,410,027 |
|
| WABCO Holdings, Inc. † | 37,600 | 3,221,568 |
|
| | | 17,833,578 |
| Media (0.9%) | | |
| Valassis Communications, Inc. S | 141,970 | 3,884,299 |
|
| | | 3,884,299 |
| Metals and mining (2.0%) | | |
| Commercial Metals Co. | 96,400 | 1,769,904 |
|
| IAMGOLD Corp. (Canada) | 245,200 | 1,250,520 |
|
| Kaiser Aluminum Corp. S | 31,000 | 2,090,950 |
|
| Reliance Steel & Aluminum Co. | 48,117 | 3,526,495 |
|
| | | 8,637,869 |
| Multi-utilities (0.7%) | | |
| TECO Energy, Inc. S | 66,100 | 1,134,937 |
|
| Vectren Corp. | 51,500 | 1,798,380 |
|
| | | 2,933,317 |
| Multiline retail (1.3%) | | |
| Big Lots, Inc. † S | 99,341 | 3,612,039 |
|
| Dillards, Inc. Class A | 23,500 | 1,926,530 |
|
| | | 5,538,569 |
| Oil, gas, and consumable fuels (3.2%) | | |
| Delek US Holdings, Inc. | 109,577 | 2,799,692 |
|
| HollyFrontier Corp. | 37,300 | 1,718,038 |
|
| Tesoro Corp. | 68,800 | 3,363,632 |
|
| Whiting Petroleum Corp. † | 37,728 | 2,523,626 |
|
| World Fuel Services Corp. S | 80,900 | 3,086,335 |
|
| | | 13,491,323 |
| Paper and forest products (2.1%) | | |
| Clearwater Paper Corp. † | 39,000 | 2,036,580 |
|
| Domtar Corp. (Canada) S | 39,300 | 3,329,103 |
|
| Schweitzer-Mauduit International, Inc. | 53,400 | 3,304,392 |
|
| | | 8,670,075 |
| Personal products (0.5%) | | |
| Inter Parfums, Inc. | 60,724 | 2,135,056 |
|
| | | 2,135,056 |
| Pharmaceuticals (1.9%) | | |
| Jazz Pharmaceuticals PLC † | 38,000 | 3,448,120 |
|
| Medicines Co. (The) † | 66,200 | 2,245,504 |
|
| Questcor Pharmaceuticals, Inc. S | 38,400 | 2,356,608 |
|
| | | 8,050,232 |
| Professional services (2.7%) | | |
| Huron Consulting Group, Inc. † | 59,100 | 3,461,487 |
|
| Navigant Consulting, Inc. † | 200,100 | 3,471,735 |
|
| Towers Watson & Co. Class A | 39,300 | 4,512,033 |
|
| | | 11,445,255 |
| |
| 26 | Capital Opportunities Fund |
| | |
| COMMON STOCKS (99.0%)* cont. | Shares | Value |
|
| Real estate investment trusts (REITs) (3.1%) | | |
| Brandywine Realty Trust | 146,300 | $2,081,849 |
|
| Capstead Mortgage Corp. | 162,900 | 1,927,107 |
|
| Kimco Realty Corp. | 57,622 | 1,237,721 |
|
| Mack-Cali Realty Corp. S | 66,200 | 1,361,072 |
|
| National Health Investors, Inc. | 20,262 | 1,266,780 |
|
| Omega Healthcare Investors, Inc. S | 74,142 | 2,464,480 |
|
| Redwood Trust, Inc. S | 87,300 | 1,529,496 |
|
| Two Harbors Investment Corp. | 144,200 | 1,345,386 |
|
| | | 13,213,891 |
| Real estate management and development (0.8%) | | |
| Jones Lang LaSalle, Inc. | 35,100 | 3,341,520 |
|
| | | 3,341,520 |
| Semiconductors and semiconductor equipment (3.8%) | | |
| KLA-Tencor Corp. | 42,226 | 2,770,026 |
|
| Kulicke & Soffa Industries, Inc. (Singapore) † | 267,400 | 3,449,460 |
|
| Lam Research Corp. † | 79,568 | 4,314,973 |
|
| Omnivision Technologies, Inc. † S | 120,000 | 1,681,200 |
|
| Skyworks Solutions, Inc. † | 86,106 | 2,219,813 |
|
| Teradyne, Inc. † S | 106,100 | 1,855,689 |
|
| | | 16,291,161 |
| Software (2.3%) | | |
| FactSet Research Systems, Inc. S | 12,308 | 1,340,834 |
|
| Manhattan Associates, Inc. † | 21,600 | 2,300,616 |
|
| Open Text Corp. (Canada) S | 45,100 | 3,307,634 |
|
| Synopsys, Inc. † | 81,031 | 2,953,580 |
|
| | | 9,902,664 |
| Specialty retail (6.4%) | | |
| Aaron’s, Inc. | 63,114 | 1,790,544 |
|
| American Eagle Outfitters, Inc. S | 297,700 | 4,611,373 |
|
| ANN, Inc. † | 63,700 | 2,252,432 |
|
| Big 5 Sporting Goods Corp. | 113,000 | 2,136,830 |
|
| Buckle, Inc. (The) S | 37,238 | 1,822,428 |
|
| Cato Corp. (The) Class A | 46,344 | 1,388,930 |
|
| Chico’s FAS, Inc. | 102,500 | 1,757,875 |
|
| Foot Locker, Inc. S | 109,700 | 3,806,590 |
|
| Francesca’s Holdings Corp. † S | 74,412 | 1,338,672 |
|
| Genesco, Inc. † S | 45,500 | 3,099,005 |
|
| Jos. A. Bank Clothiers, Inc. † S | 61,463 | 2,948,995 |
|
| | | 26,953,674 |
| Textiles, apparel, and luxury goods (1.5%) | | |
| Crocs, Inc. † | 148,945 | 1,814,150 |
|
| Deckers Outdoor Corp. † S | 26,956 | 1,855,381 |
|
| Steven Madden, Ltd. † | 71,104 | 2,608,095 |
|
| | | 6,277,626 |
| Tobacco (0.2%) | | |
| Universal Corp. S | 17,494 | 927,701 |
|
| | | 927,701 |
| | | |
| Total common stocks (cost $336,516,551) | | $420,488,299 |
| |
| Capital Opportunities Fund | 27 |
| | |
| SHORT-TERM INVESTMENTS (20.7%)* | Shares | Value |
|
| Putnam Short Term Investment Fund 0.07% L | 5,083,127 | $5,083,127 |
|
| Putnam Cash Collateral Pool, LLC 0.15% d | 82,914,841 | 82,914,841 |
|
| Total short-term investments (cost $87,997,968) | | $87,997,968 |
| |
| TOTAL INVESTMENTS | | |
|
| Total investments (cost $424,514,519) | | $508,486,267 |
Notes to the fund’s portfolio
Unless noted otherwise, the notes to the fund’s portfolio are for the close of the fund’s reporting period, which ran from May 1, 2013 through October 31, 2013 (the reporting period). Within the following notes to the portfolio, references to “ASC 820” represent Accounting Standards Codification 820 Fair Value Measurements and Disclosures and references to “OTC”, if any, represent over-the-counter.
* Percentages indicated are based on net assets of $424,789,114.
† Non-income-producing security.
d Affiliated company. See Note 1 to the financial statements regarding securities lending. The rate quoted in the security description is the annualized 7-day yield of the fund at the close of the reporting period.
F Is valued at fair value following procedures approved by the Trustees. Securities may be classified as Level 2 or Level 3 for ASC 820 based on the securities’ valuation inputs.
L Affiliated company (Note 5). The rate quoted in the security description is the annualized 7-day yield of the fund at the close of the reporting period.
S Security on loan, in part or in entirety, at the close of the reporting period (Note 1).
144A after the name of an issuer represents securities exempt from registration under Rule 144A under the Securities Act of 1933, as amended. These securities may be resold in transactions exempt from registration, normally to qualified institutional buyers.
ASC 820 establishes a three-level hierarchy for disclosure of fair value measurements. The valuation hierarchy is based upon the transparency of inputs to the valuation of the fund’s investments. The three levels are defined as follows:
Level 1: Valuations based on quoted prices for identical securities in active markets.
Level 2: Valuations based on quoted prices in markets that are not active or for which all significant inputs are observable, either directly or indirectly.
Level 3: Valuations based on inputs that are unobservable and significant to the fair value measurement.
The following is a summary of the inputs used to value the fund’s net assets as of the close of the reporting period:
| | | |
| | | Valuation inputs | |
|
| Investments in securities: | Level 1 | Level 2 | Level 3 |
|
| Common stocks*: | | | |
|
| Consumer discretionary | $74,652,742 | $— | $— |
|
| Consumer staples | 9,072,621 | — | — |
|
| Energy | 32,155,464 | — | — |
|
| Financials | 83,036,218 | 582,285 | — |
|
| Health care | 50,356,156 | — | — |
|
| Industrials | 62,261,984 | — | — |
|
| Information technology | 70,128,109 | — | — |
|
| Materials | 23,783,320 | — | — |
|
| Utilities | 14,459,400 | — | — |
|
| Total common stocks | 419,906,014 | 582,285 | — |
| | | | |
| Short-term investments | 5,083,127 | 82,914,841 | — |
|
| Totals by level | $424,989,141 | $83,497,126 | $— |
* Common stock classifications are presented at the sector level, which may differ from the fund’s portfolio presentation.
The accompanying notes are an integral part of these financial statements.
| |
| 28 | Capital Opportunities Fund |
Statement of assets and liabilities 10/31/13 (Unaudited)
| |
| ASSETS | |
|
| Investment in securities, at value, including $79,968,681 of securities on loan (Note 1): | |
| Unaffiliated issuers (identified cost $336,516,551) | $420,488,299 |
| Affiliated issuers (identified cost $87,997,968) (Notes 1 and 5) | 87,997,968 |
|
| Dividends, interest and other receivables | 202,681 |
|
| Receivable for shares of the fund sold | 418,393 |
|
| Receivable for investments sold | 2,264,898 |
|
| Total assets | 511,372,239 |
| |
| LIABILITIES | |
|
| Payable for investments purchased | 2,679,536 |
|
| Payable for shares of the fund repurchased | 280,074 |
|
| Payable for compensation of Manager (Note 2) | 222,133 |
|
| Payable for custodian fees (Note 2) | 3,799 |
|
| Payable for investor servicing fees (Note 2) | 161,903 |
|
| Payable for Trustee compensation and expenses (Note 2) | 136,728 |
|
| Payable for administrative services (Note 2) | 1,512 |
|
| Payable for distribution fees (Note 2) | 105,431 |
|
| Collateral on securities loaned, at value (Note 1) | 82,914,841 |
|
| Other accrued expenses | 77,168 |
|
| Total liabilities | 86,583,125 |
| |
| Net assets | $424,789,114 |
| |
| REPRESENTED BY | |
|
| Paid-in capital (Unlimited shares authorized) (Notes 1 and 4) | $344,872,471 |
|
| Undistributed net investment income (Note 1) | 1,534,865 |
|
| Accumulated net realized loss on investments (Note 1) | (5,589,970) |
|
| Net unrealized appreciation of investments | 83,971,748 |
|
| Total — Representing net assets applicable to capital shares outstanding | $424,789,114 |
| |
| COMPUTATION OF NET ASSET VALUE AND OFFERING PRICE | |
|
| Net asset value and redemption price per class A share | |
| ($293,248,913 divided by 18,374,462 shares) | $15.96 |
|
| Offering price per class A share (100/94.25 of $15.96)* | $16.93 |
|
| Net asset value and offering price per class B share ($13,344,536 divided by 940,847 shares)** | $14.18 |
|
| Net asset value and offering price per class C share ($26,622,058 divided by 1,855,482 shares)** | $14.35 |
|
| Net asset value and redemption price per class M share ($4,591,716 divided by 309,730 shares) | $14.82 |
|
| Offering price per class M share (100/96.50 of $14.82)* | $15.36 |
|
| Net asset value, offering price and redemption price per class R share | |
| ($19,675,329 divided by 1,261,667 shares) | $15.59 |
|
| Net asset value, offering price and redemption price per class R5 share | |
| ($13,593 divided by 829 shares) | $16.40 |
|
| Net asset value, offering price and redemption price per class R6 share | |
| ($9,742,841 divided by 593,564 shares) | $16.41 |
|
| Net asset value, offering price and redemption price per class Y share | |
| ($57,550,128 divided by 3,519,927 shares) | $16.35 |
|
* On single retail sales of less than $50,000. On sales of $50,000 or more the offering price is reduced.
** Redemption price per share is equal to net asset value less any applicable contingent deferred sales charge.
The accompanying notes are an integral part of these financial statements.
| |
| Capital Opportunities Fund | 29 |
Statement of operations Six months ended 10/31/13 (Unaudited)
| |
| INVESTMENT INCOME | |
|
| Dividends (net of foreign tax of $11,656) | $2,480,813 |
|
| Interest (including interest income of $1,434 from investments in affiliated issuers) (Note 5) | 2,254 |
|
| Securities lending (Note 1) | 107,257 |
|
| Total investment income | 2,590,324 |
| |
| EXPENSES | |
|
| Compensation of Manager (Note 2) | 1,273,478 |
|
| Investor servicing fees (Note 2) | 491,488 |
|
| Custodian fees (Note 2) | 5,893 |
|
| Trustee compensation and expenses (Note 2) | 14,158 |
|
| Distribution fees (Note 2) | 607,012 |
|
| Administrative services (Note 2) | 4,404 |
|
| Other | 90,462 |
|
| Total expenses | 2,486,895 |
| | |
| Expense reduction (Note 2) | (4,067) |
|
| Net expenses | 2,482,828 |
| | |
| Net investment income | 107,496 |
|
| |
| Net realized gain on investments (Notes 1 and 3) | 33,543,148 |
|
| Net unrealized appreciation of investments during the period | 18,485,021 |
|
| Net gain on investments | 52,028,169 |
| | |
| Net increase in net assets resulting from operations | $52,135,665 |
|
The accompanying notes are an integral part of these financial statements.
| |
| 30 | Capital Opportunities Fund |
Statement of changes in net assets
| | |
| INCREASE IN NET ASSETS | Six months ended 10/31/13* | Year ended 4/30/13 |
|
| Operations: | | |
| Net investment income | $107,496 | $1,628,771 |
|
| Net realized gain on investments | 33,543,148 | 46,771,490 |
|
| Net unrealized appreciation (depreciation) of investments | 18,485,021 | (8,550,345) |
|
| Net increase in net assets resulting from operations | 52,135,665 | 39,849,916 |
|
| Distributions to shareholders (Note 1): | | |
| From ordinary income | | |
| Net investment income | | |
|
| Class A | — | (100,416) |
|
| Class R5 | — | (13) |
|
| Class R6 | — | (18) |
|
| Class Y | — | (133,905) |
|
| Redemption fees (Note 1) | 1,213 | 12,076 |
|
| Decrease from capital share transactions (Note 4) | (11,960,101) | (10,039,638) |
|
| Total increase in net assets | 40,176,777 | 29,588,002 |
| |
| NET ASSETS | | |
|
| Beginning of period | 384,612,337 | 355,024,335 |
|
| End of period (including undistributed net investment | | |
| income of $1,534,865 and $1,427,369, respectively) | $424,789,114 | $384,612,337 |
|
* Unaudited
The accompanying notes are an integral part of these financial statements.
| |
| Capital Opportunities Fund | 31 |
Financial highlights (For a common share outstanding throughout the period)
| | | | | | | | | | | | | | | |
| INVESTMENT OPERATIONS: | | | LESS DISTRIBUTIONS: | | | | RATIOS AND SUPPLEMENTAL DATA: |
|
| | | | | | | | | | | | | | | Ratio | |
| | Net asset | | Net realized | | | | | | | | | | Ratio | of net investment | |
| | value, | | and unrealized | Total from | From | | | | | | Total return | Net assets, | of expenses | income (loss) | |
| | beginning | Net investment | gain (loss) | investment | net investment | From | Total | Redemption | Non-recurring | Net asset value, | at net asset | end of period | to average | to average | Portfolio |
| Period ended | of period | income (loss) a | on investments | operations | income | return of capital | distributions | fees b | reimbursements | end of period | value (%) c | (in thousands) | net assets (%) d | net assets (%) | turnover (%) |
|
| Class A | | | | | | | | | | | | | | | |
| October 31, 2013** | $14.01 | .01 | 1.94 | 1.95 | — | — | — | — | — | $15.96 | 13.92 * | $293,249 | .60 * | .05 * | 33 * |
| April 30, 2013 | 12.56 | .07 | 1.39 | 1.46 | (.01) | — | (.01) | — | — | 14.01 | 11.59 | 268,152 | 1.25 | .52 | 70 |
| April 30, 2012 | 13.26 | .01 | (.72) | (.71) | — | — | — | — | .01 e | 12.56 | (5.28) | 253,278 | 1.27 | .05 | 29 |
| April 30, 2011 | 10.35 | — b | 2.91 | 2.91 | — | — | — | — | — | 13.26 | 28.12 | 291,660 | 1.28 | .04 | 23 |
| April 30, 2010 | 6.49 | .01 | 3.88 | 3.89 | (.03) | — b | (.03) | — | — | 10.35 | 60.03 | 234,809 | 1.39 | .09 | 30 |
| April 30, 2009 | 9.25 | .05 | (2.75) | (2.70) | (.06) | — | (.06) | — | — | 6.49 | (29.16) | 163,115 | 1.35 f | .71 f | 58 |
|
| Class B | | | | | | | | | | | | | | | |
| October 31, 2013** | $12.50 | (.04) | 1.72 | 1.68 | — | — | — | — | — | $14.18 | 13.44 * | $13,345 | .97 * | (.33) * | 33 * |
| April 30, 2013 | 11.29 | (.03) | 1.24 | 1.21 | — | — | — | — | — | 12.50 | 10.72 | 12,546 | 2.00 | (.24) | 70 |
| April 30, 2012 | 12.00 | (.07) | (.65) | (.72) | — | — | — | — | .01 e | 11.29 | (5.92) | 14,734 | 2.02 | (.70) | 29 |
| April 30, 2011 | 9.43 | (.07) | 2.64 | 2.57 | — | — | — | — | — | 12.00 | 27.25 | 23,730 | 2.03 | (.69) | 23 |
| April 30, 2010 | 5.94 | (.05) | 3.54 | 3.49 | — | — | — | — | — | 9.43 | 58.75 | 34,146 | 2.14 | (.65) | 30 |
| April 30, 2009 | 8.45 | — b | (2.51) | (2.51) | — | — | — | — | — | 5.94 | (29.70) | 34,319 | 2.10 f | (.05) f | 58 |
|
| Class C | | | | | | | | | | | | | | | |
| October 31, 2013** | $12.64 | (.04) | 1.75 | 1.71 | — | — | — | — | — | $14.35 | 13.53 * | $26,622 | .97 * | (.33) * | 33 * |
| April 30, 2013 | 11.42 | (.03) | 1.25 | 1.22 | — | — | — | — | — | 12.64 | 10.68 | 24,203 | 2.00 | (.24) | 70 |
| April 30, 2012 | 12.14 | (.07) | (.66) | (.73) | — | — | — | — | .01 e | 11.42 | (5.93) | 20,965 | 2.02 | (.69) | 29 |
| April 30, 2011 | 9.55 | (.07) | 2.66 | 2.59 | — | — | — | — | — | 12.14 | 27.12 | 21,286 | 2.03 | (.72) | 23 |
| April 30, 2010 | 6.02 | (.05) | 3.58 | 3.53 | — | — | — | — | — | 9.55 | 58.64 | 13,492 | 2.14 | (.66) | 30 |
| April 30, 2009 | 8.55 | — b | (2.53) | (2.53) | — | — | — | — | — | 6.02 | (29.59) | 8,907 | 2.10 f | (.04) f | 58 |
|
| Class M | | | | | | | | | | | | | | | |
| October 31, 2013** | $13.05 | (.03) | 1.80 | 1.77 | — | — | — | — | — | $14.82 | 13.56 * | $4,592 | .85 * | (.20) * | 33 * |
| April 30, 2013 | 11.75 | — b | 1.30 | 1.30 | — | — | — | — | — | 13.05 | 11.06 | 4,323 | 1.75 | .01 | 70 |
| April 30, 2012 | 12.46 | (.05) | (.67) | (.72) | — | — | — | — | .01 e | 11.75 | (5.70) | 4,573 | 1.77 | (.45) | 29 |
| April 30, 2011 | 9.78 | (.05) | 2.73 | 2.68 | — | — | — | — | — | 12.46 | 27.40 | 6,327 | 1.78 | (.45) | 23 |
| April 30, 2010 | 6.15 | (.03) | 3.66 | 3.63 | — | — | — | — | — | 9.78 | 59.03 | 5,700 | 1.89 | (.41) | 30 |
| April 30, 2009 | 8.73 | .01 | (2.59) | (2.58) | — b | — | — b | — | — | 6.15 | (29.50) | 4,034 | 1.85 f | .20 f | 58 |
|
| Class R | | | | | | | | | | | | | | | |
| October 31, 2013** | $13.71 | (.01) | 1.89 | 1.88 | — | — | — | — | — | $15.59 | 13.71 * | $19,675 | .72 * | (.08) * | 33 * |
| April 30, 2013 | 12.32 | .03 | 1.36 | 1.39 | — | — | — | — | — | 13.71 | 11.28 | 17,077 | 1.50 | .26 | 70 |
| April 30, 2012 | 13.03 | (.02) | (.70) | (.72) | — | — | — | — | .01 e | 12.32 | (5.45) | 13,450 | 1.52 | (.19) | 29 |
| April 30, 2011 | 10.19 | (.03) | 2.87 | 2.84 | — | — | — | — | — | 13.03 | 27.87 | 9,100 | 1.53 | (.23) | 23 |
| April 30, 2010 | 6.41 | (.01) | 3.81 | 3.80 | (.02) | — b | (.02) | — | — | 10.19 | 59.27 | 3,337 | 1.64 | (.17) | 30 |
| April 30, 2009 | 9.12 | .03 | (2.70) | (2.67) | (.04) | — | (.04) | — | — | 6.41 | (29.22) | 1,845 | 1.60 f | .46 f | 58 |
|
| Class R5 | | | | | | | | | | | | | | | |
| October 31, 2013** | $14.37 | .04 | 1.99 | 2.03 | — | — | — | — | — | $16.40 | 14.13 * | $14 | .42 * | .22 * | 33 * |
| April 30, 2013† | 12.08 | .11 | 2.20 | 2.31 | (.02) | — | (.02) | — | — | 14.37 | 19.11 * | 12 | .71 * | .81 * | 70 |
|
| Class R6 | | | | | | | | | | | | | | | |
| October 31, 2013** | $14.38 | .04 | 1.99 | 2.03 | — | — | — | — | — | $16.41 | 14.12 * | $9,743 | .37 * | .28 * | 33 * |
| April 30, 2013† | 12.08 | .04 | 2.28 | 2.32 | (.02) | — | (.02) | — | — | 14.38 | 19.25 * | 8,922 | .63 * | .25 * | 70 |
|
See notes to financial highlights at the end of this section.
The accompanying notes are an integral part of these financial statements.
| | | |
| 32 | Capital Opportunities Fund | Capital Opportunities Fund | 33 |
Financial highlights (Continued)
| | | | | | | | | | | | | | | |
| INVESTMENT OPERATIONS: | | | LESS DISTRIBUTIONS: | | | | | RATIOS AND SUPPLEMENTAL DATA: |
|
| | | | | | | | | | | | | | | Ratio | |
| | Net asset | | Net realized | | | | | | | | | | Ratio | of net investment | |
| | value, | | and unrealized | Total from | From | | | | | | Total return | Net assets, | of expenses | income (loss) | |
| | beginning | Net investment | gain (loss) | investment | net investment | From | Total | Redemption | Non-recurring | Net asset value, | at net asset | end of period | to average | to average | Portfolio |
| Period ended | of period | income (loss) a | on investments | operations | income | return of capital | distributions | fees b | reimbursements | end of period | value (%) c | (in thousands) | net assets (%) d | net assets (%) | turnover (%) |
|
| Class Y | | | | | | | | | | | | | | | |
| October 31, 2013** | $14.34 | .03 | 1.98 | 2.01 | — | — | — | — | — | $16.35 | 14.02 * | $57,550 | .47 * | .17 * | 33 * |
| April 30, 2013 | 12.85 | .10 | 1.43 | 1.53 | (.04) | — | (.04) | — | — | 14.34 | 11.91 | 49,378 | 1.00 | .77 | 70 |
| April 30, 2012 | 13.53 | .04 | (.73) | (.69) | — | — | — | — | .01 e | 12.85 | (5.03) | 48,025 | 1.02 | .31 | 29 |
| April 30, 2011 | 10.53 | .03 | 2.97 | 3.00 | — | — | — | — | — | 13.53 | 28.49 | 40,547 | 1.03 | .28 | 23 |
| April 30, 2010 | 6.61 | .03 | 3.94 | 3.97 | (.05) | — b | (.05) | — | — | 10.53 | 60.20 | 22,430 | 1.14 | .33 | 30 |
| April 30, 2009 | 9.43 | .08 | (2.82) | (2.74) | (.08) | — | (.08) | — | — | 6.61 | (28.92) | 13,283 | 1.10 f | 1.00 f | 58 |
|
* Not annualized.
** Unaudited.
† For the period July 3, 2012 (commencement of operations) to April 30, 2013.
a Per share net investment income (loss) has been determined on the basis of the weighted average number of shares outstanding during the period.
b Amount represents less than $0.01 per share.
c Total return assumes dividend reinvestment and does not reflect the effect of sales charges.
d Includes amounts paid through expense offset and/or brokerage/service arrangements (Note 2).
e Reflects a non-recurring reimbursement related to restitution amounts in connection with a distribution plan approved by the Securities and Exchange Commission (the SEC) which amounted to $0.01 per share outstanding on July 21, 2011. Also reflects a non-recurring reimbursement related to short-term trading related lawsuits, which amounted to less than $0.01 per share outstanding on May 11, 2011.
f Reflects an involuntary contractual expense limitation and/or waivers of certain fund expenses in connection with investments in Putnam Prime Money Market Fund in effect during the period. As a result of such limitation and/or waivers, the expenses of each class reflect a reduction of the following amounts:
| |
| | Percentage of |
| | average net assets |
|
| April 30, 2009 | 0.01% |
|
The accompanying notes are an integral part of these financial statements.
| | | |
| 34 | Capital Opportunities Fund | Capital Opportunities Fund | 35 |
Notes to financial statements 10/31/13 (Unaudited)
Within the following Notes to financial statements, references to “State Street” represent State Street Bank and Trust Company, references to “the SEC” represent the Securities and Exchange Commission, references to “Putnam Management” represent Putnam Investment Management, LLC, the fund’s manager, an indirect wholly-owned subsidiary of Putnam Investments, LLC and references to “OTC”, if any, represent over-the-counter. Unless otherwise noted, the “reporting period” represents the period from May 1, 2013 through October 31, 2013.
Putnam Capital Opportunities Fund (the fund) is a diversified series of Putnam Investment Funds (the Trust), a Massachusetts business trust registered under the Investment Company Act of 1940, as amended, as an open-end management investment company. The investment objective of the fund is to seek long-term growth of capital. The fund invests mainly in common stocks (growth or value stocks or both) of small and midsize U.S. companies that Putnam Management believes have favorable investment potential. For example, the fund may purchase stocks of companies with stock prices that reflect a value lower than that which Putnam Management places on the company. Putnam Management may also consider other factors it believes will cause the stock price to rise. Putnam Management may consider, among other factors, a company’s valuation, financial strength, growth potential, competitive position in its industry, projected future earnings, cash flows and dividends when deciding whether to buy or sell investments.
The fund offers class A, class B, class C, class M, class R, class R5, class R6 and class Y shares. Class A and class M shares are sold with a maximum front-end sales charge of 5.75% and 3.50%, respectively, and generally do not pay a contingent deferred sales charge. Class B shares, which convert to class A shares after approximately eight years, do not pay a front-end sales charge and are subject to a contingent deferred sales charge if those shares are redeemed within six years of purchase. Class C shares have a one-year 1.00% contingent deferred sales charge and do not convert to class A shares. Class R shares, which are not available to all investors, are sold at net asset value. The expenses for class A, class B, class C, class M and class R shares may differ based on the distribution fee of each class, which is identified in Note 2. Class R5, class R6 and class Y shares, which are sold at net asset value, are generally subject to the same expenses as class A, class B, class C, class M and class R shares, but do not bear a distribution fee and in the case of class R5 and class R6 shares, bear a lower investor servicing fee, which is identified in Note 2. Class R5, class R6 and class Y shares are not available to all investors.
In the normal course of business, the fund enters into contracts that may include agreements to indemnify another party under given circumstances. The fund’s maximum exposure under these arrangements is unknown as this would involve future claims that may be, but have not yet been, made against the fund. However, the fund’s management team expects the risk of material loss to be remote.
Note 1: Significant accounting policies
The following is a summary of significant accounting policies consistently followed by the fund in the preparation of its financial statements. The preparation of financial statements is in conformity with accounting principles generally accepted in the United States of America and requires management to make estimates and assumptions that affect the reported amounts of assets and liabilities in the financial statements and the reported amounts of increases and decreases in net assets from operations. Actual results could differ from those estimates. Subsequent events after the Statement of assets and liabilities date through the date that the financial statements were issued have been evaluated in the preparation of the financial statements.
A short-term trading fee of 1.00% may have applied to redemptions (including exchanges into another fund) of shares purchased before June 24, 2013 and held for 60 days or less. The short-term trading fee was accounted for as an addition to paid-in-capital. No short-term trading fee applies to shares purchased on or after June 24, 2013.
Investment income, realized and unrealized gains and losses and expenses of the fund are borne pro-rata based on the relative net assets of each class to the total net assets of the fund, except that each class bears expenses unique to that class (including the distribution fees applicable to such classes). Each class votes as a class only with respect to its own distribution plan or other matters on which a class vote is required by law or determined by the Trustees. If the fund were liquidated, shares of each class would receive their pro-rata share of the net assets of the fund. In addition, the Trustees declare separate dividends on each class of shares.
Security valuation Investments for which market quotations are readily available are valued at the last reported sales price on their principal exchange, or official closing price for certain markets, and are classified as Level 1 securities under Accounting Standards Codification 820 Fair Value Measurements and Disclosures (ASC 820). If no
| |
| 36 | Capital Opportunities Fund |
sales are reported, as in the case of some securities that are traded OTC, a security is valued at its last reported bid price and is generally categorized as a Level 2 security.
Investments in open-end investment companies (excluding exchange traded funds), if any, which can be classified as Level 1 or Level 2 securities, are valued based on their net asset value. The net asset value of such investment companies equals the total value of their assets less their liabilities and divided by the number of their outstanding shares.
Many securities markets and exchanges outside the U.S. close prior to the close of the New York Stock Exchange and therefore the closing prices for securities in such markets or on such exchanges may not fully reflect events that occur after such close but before the close of the New York Stock Exchange. Accordingly, on certain days, the fund will fair value foreign equity securities taking into account multiple factors including movements in the U.S. securities markets, currency valuations and comparisons to the valuation of American Depository Receipts, exchange-traded funds and futures contracts. These securities, which would generally be classified as Level 1 securities, will be transferred to Level 2 of the fair value hierarchy when they are valued at fair value. The number of days on which fair value prices will be used will depend on market activity and it is possible that fair value prices will be used by the fund to a significant extent. Securities quoted in foreign currencies, if any, are translated into U.S. dollars at the current exchange rate.
To the extent a pricing service or dealer is unable to value a security or provides a valuation that Putnam Management does not believe accurately reflects the security’s fair value, the security will be valued at fair value by Putnam Management in accordance with policies and procedures approved by the Trustees. Certain investments, including certain restricted and illiquid securities and derivatives, are also valued at fair value following procedures approved by the Trustees. These valuations consider such factors as significant market or specific security events such as interest rate or credit quality changes, various relationships with other securities, discount rates, U.S. Treasury, U.S. swap and credit yields, index levels, convexity exposures and recovery rates. These securities are classified as Level 2 or as Level 3 depending on the priority of the significant inputs.
Such valuations and procedures are reviewed periodically by the Trustees. The fair value of securities is generally determined as the amount that the fund could reasonably expect to realize from an orderly disposition of such securities over a reasonable period of time. By its nature, a fair value price is a good faith estimate of the value of a security in a current sale and does not reflect an actual market price, which may be different by a material amount.
Security transactions and related investment income Security transactions are recorded on the trade date (the date the order to buy or sell is executed). Gains or losses on securities sold are determined on the identified cost basis.
Interest income, net of any applicable withholding taxes, is recorded on the accrual basis. Dividend income, net of any applicable withholding taxes, is recognized on the ex-dividend date except that certain dividends from foreign securities, if any, are recognized as soon as the fund is informed of the ex-dividend date. Non-cash dividends, if any, are recorded at the fair market value of the securities received. Dividends representing a return of capital or capital gains, if any, are reflected as a reduction of cost and/or as a realized gain.
Securities lending The fund may lend securities, through its agent, to qualified borrowers in order to earn additional income. The loans are collateralized by cash in an amount at least equal to the market value of the securities loaned. The market value of securities loaned is determined daily and any additional required collateral is allocated to the fund on the next business day. The risk of borrower default will be borne by the fund’s agent; the fund will bear the risk of loss with respect to the investment of the cash collateral. Income from securities lending is included in investment income on the Statement of operations. Cash collateral is invested in Putnam Cash Collateral Pool, LLC, a limited liability company managed by an affiliate of Putnam Management. Investments in Putnam Cash Collateral Pool, LLC are valued at its closing net asset value each business day. There are no management fees charged to Putnam Cash Collateral Pool, LLC. At the close of the reporting period, the value of securities loaned amounted to $80,483,048. Certain of these securities were sold prior to the close of the reporting period and are included in Receivable for investments sold on the Statement of assets and liabilities. The fund received cash collateral of $82,914,841.
Interfund lending The fund, along with other Putnam funds, may participate in an interfund lending program pursuant to an exemptive order issued by the SEC. This program allows the fund to borrow from or lend to other Putnam funds that permit such transactions. Interfund lending transactions are subject to each fund’s investment policies and borrowing and lending limits. Interest earned or paid on the interfund lending transaction will be based on the average of certain current market rates. During the reporting period, the fund did not utilize the program.
| |
| Capital Opportunities Fund | 37 |
Line of credit The fund participates, along with other Putnam funds, in a $315 million unsecured committed line of credit and a $185 million unsecured uncommitted line of credit, both provided by State Street. Borrowings may be made for temporary or emergency purposes, including the funding of shareholder redemption requests and trade settlements. Interest is charged to the fund based on the fund’s borrowing at a rate equal to the Federal Funds rate plus 1.25% for the committed line of credit and the Federal Funds rate plus 1.30% for the uncommitted line of credit. A closing fee equal to 0.02% of the committed line of credit and $50,000 for the uncommitted line of credit has been paid by the participating funds. In addition, a commitment fee of 0.11% per annum on any unutilized portion of the committed line of credit is allocated to the participating funds based on their relative net assets and paid quarterly. During the reporting period, the fund had no borrowings against these arrangements.
Federal taxes It is the policy of the fund to distribute all of its taxable income within the prescribed time period and otherwise comply with the provisions of the Internal Revenue Code of 1986, as amended (the Code), applicable to regulated investment companies. It is also the intention of the fund to distribute an amount sufficient to avoid imposition of any excise tax under Section 4982 of the Code.
The fund is subject to the provisions of Accounting Standards Codification 740 Income Taxes (ASC 740). ASC 740 sets forth a minimum threshold for financial statement recognition of the benefit of a tax position taken or expected to be taken in a tax return. The fund did not have a liability to record for any unrecognized tax benefits in the accompanying financial statements. No provision has been made for federal taxes on income, capital gains or unrealized appreciation on securities held nor for excise tax on income and capital gains. Each of the fund’s federal tax returns for the prior three fiscal years remains subject to examination by the Internal Revenue Service.
At April 30, 2013, the fund had a capital loss carryover of $38,748,560 available to the extent allowed by the Code to offset future net capital gain, if any. The amounts of the carryovers and the expiration dates are:
| | | |
| Loss carryover |
|
| Short-term | Long-term | Total | Expiration |
|
| $38,748,560 | N/A | $38,748,560 | April 30, 2018 |
|
Under the Regulated Investment Company Modernization Act of 2010, the fund will be permitted to carry forward capital losses incurred in taxable years beginning after December 22, 2010 for an unlimited period. However, any losses incurred will be required to be utilized prior to the losses incurred in pre-enactment tax years. As a result of this ordering rule, pre-enactment capital loss carryforwards may be more likely to expire unused. Additionally, post-enactment capital losses that are carried forward will retain their character as either short-term or long-term capital losses rather than being considered all short-term as under previous law.
Pursuant to federal income tax regulations applicable to regulated investment companies, the Fund has elected to defer certain capital losses of $228,541 recognized during the period between November 1, 2012 and April 30, 2013 to its fiscal year ending April 30, 2014.
The aggregate identified cost on a tax basis is $424,670,536, resulting in gross unrealized appreciation and depreciation of $93,822,506 and $10,006,775, respectively, or net unrealized appreciation of $83,815,731.
Distributions to shareholders Distributions to shareholders from net investment income are recorded by the fund on the ex-dividend date. Distributions from capital gains, if any, are recorded on the ex-dividend date and paid at least annually. The amount and character of income and gains to be distributed are determined in accordance with income tax regulations, which may differ from generally accepted accounting principles. Dividend sources are estimated at the time of declaration. Actual results may vary. Any non-taxable return of capital cannot be determined until final tax calculations are completed after the end of the fund’s fiscal year. Reclassifications are made to the fund’s capital accounts to reflect income and gains available for distribution (or available capital loss carryovers) under income tax regulations.
Expenses of the Trust Expenses directly charged or attributable to any fund will be paid from the assets of that fund. Generally, expenses of the Trust will be allocated among and charged to the assets of each fund on a basis that the Trustees deem fair and equitable, which may be based on the relative assets of each fund or the nature of the services performed and relative applicability to each fund.
| |
| 38 | Capital Opportunities Fund |
Note 2: Management fee, administrative services and other transactions
The fund pays Putnam Management a management fee (based on the fund’s average net assets and computed and paid monthly) at annual rates that may vary based on the average of the aggregate net assets of most open-end funds, as defined in the fund’s management contract, sponsored by Putnam Management. Such annual rates may vary as follows:
| | | | |
| 0.780% | of the first $5 billion, | | 0.580% | of the next $50 billion, |
| |
|
| 0.730% | of the next $5 billion, | | 0.560% | of the next $50 billion, |
| |
|
| 0.680% | of the next $10 billion, | | 0.550% | of the next $100 billion and |
| |
|
| 0.630% | of the next $10 billion, | | 0.545% | of any excess thereafter. |
| |
|
Following the death on October 8, 2013 of The Honourable Paul G. Desmarais, who controlled directly and indirectly a majority of the voting shares of Power Corporation of Canada, the ultimate parent company of Putnam Management, the Trustees of the fund approved an interim management contract with Putnam Management. Consistent with Rule 15a–4 under the Investment Company Act of 1940, the interim management contract will remain in effect until the earlier to occur of (i) approval by the fund’s shareholders of a new management contract and (ii) March 7, 2014. Except with respect to termination, the substantive terms of the interim management contract, including terms relating to fees payable to Putnam Management, are identical to the terms of the fund’s previous management contract with Putnam Management. The Trustees of the fund also approved the continuance, effective October 8, 2013, of the sub-management contract between Putnam Management and Putnam Investments Limited (PIL) described below, for a term no longer than March 7, 2014. The Trustees of the fund have called a shareholder meeting for February 27, 2014, at which shareholders of the fund will consider approval of a proposed new management contract between the fund and Putnam Management. The substantive terms of the proposed new management contract, including terms relating to fees, are identical to the terms of the fund’s previous management contract.
Putnam Management has contractually agreed, through June 30, 2014, to waive fees or reimburse the fund’s expenses to the extent necessary to limit the cumulative expenses of the fund, exclusive of brokerage, interest, taxes, investment-related expenses, extraordinary expenses, acquired fund fees and expenses and payments under the fund’s investor servicing contract, investment management contract and distribution plans, on a fiscal year-to-date basis to an annual rate of 0.20% of the fund’s average net assets over such fiscal year-to-date period. This expense limitation remains in place under the interim management contract described above. During the reporting period, the fund’s expenses were not reduced as a result of this limit.
PIL, an affiliate of Putnam Management, is authorized by the Trustees to manage a separate portion of the assets of the fund as determined by Putnam Management from time to time. Putnam Management pays a quarterly sub-management fee to PIL for its services at an annual rate of 0.35% of the average net assets of the portion of the fund managed by PIL.
The fund reimburses Putnam Management an allocated amount for the compensation and related expenses of certain officers of the fund and their staff who provide administrative services to the fund. The aggregate amount of all such reimbursements is determined annually by the Trustees.
Custodial functions for the fund’s assets are provided by State Street. Custody fees are based on the fund’s asset level, the number of its security holdings and transaction volumes.
Putnam Investor Services, Inc., an affiliate of Putnam Management, provides investor servicing agent functions to the fund. Putnam Investor Services, Inc. received fees for investor servicing (except for Class R5 and R6 shares) based on the fund’s retail asset level, the number of shareholder accounts in the fund and the level of defined contribution plan assets in the fund. Class R5 shares pay a monthly fee based on the average net assets of class R5 shares at an annual rate of 0.15%. Class R6 shares pay a monthly fee based on the average net assets of class R6 shares at an annual rate of 0.05%. Investor servicing fees will not exceed an annual rate of 0.32% of the fund’s average net assets. During the reporting period, the expenses for each class of shares related to investor servicing fees were as follows:
| | | | |
| Class A | $346,119 | | Class R5 | 10 |
| |
|
| Class B | 15,982 | | Class R6 | 2,340 |
| |
|
| Class C | 31,929 | | Class Y | 66,301 |
| |
|
| Class M | 5,594 | | Total | $491,488 |
| |
|
| Class R | 23,213 | | | |
| | |
| |
| Capital Opportunities Fund | 39 |
The fund has entered into expense offset arrangements with Putnam Investor Services, Inc. and State Street whereby Putnam Investor Services, Inc.’s and State Street’s fees are reduced by credits allowed on cash balances. The fund also reduced expenses through brokerage/service arrangements. For the reporting period, the fund’s expenses were reduced by $181 under the expense offset arrangements and by $3,886 under the brokerage/service arrangements.
Each independent Trustee of the fund receives an annual Trustee fee, of which $280, as a quarterly retainer, has been allocated to the fund, and an additional fee for each Trustees meeting attended. Trustees also are reimbursed for expenses they incur relating to their services as Trustees.
The fund has adopted a Trustee Fee Deferral Plan (the Deferral Plan) which allows the Trustees to defer the receipt of all or a portion of Trustees fees payable on or after July 1, 1995. The deferred fees remain invested in certain Putnam funds until distribution in accordance with the Deferral Plan.
The fund has adopted an unfunded noncontributory defined benefit pension plan (the Pension Plan) covering all Trustees of the fund who have served as a Trustee for at least five years and were first elected prior to 2004. Benefits under the Pension Plan are equal to 50% of the Trustee’s average annual attendance and retainer fees for the three years ended December 31, 2005. The retirement benefit is payable during a Trustee’s lifetime, beginning the year following retirement, for the number of years of service through December 31, 2006. Pension expense for the fund is included in Trustee compensation and expenses in the Statement of operations. Accrued pension liability is included in Payable for Trustee compensation and expenses in the Statement of assets and liabilities. The Trustees have terminated the Pension Plan with respect to any Trustee first elected after 2003.
The fund has adopted distribution plans (the Plans) with respect to its class A, class B, class C, class M and class R shares pursuant to Rule 12b–1 under the Investment Company Act of 1940. The purpose of the Plans is to compensate Putnam Retail Management Limited Partnership, an indirect wholly-owned subsidiary of Putnam Investments, LLC, for services provided and expenses incurred in distributing shares of the fund. The Plans provide for payments by the fund to Putnam Retail Management Limited Partnership at an annual rate of up to 0.35%, 1.00%, 1.00%, 1.00% and 1.00% of the average net assets attributable to class A, class B, class C, class M and class R shares, respectively. The Trustees have approved payment by the fund at an annual rate of 0.25%, 1.00%, 1.00%, 0.75% and 0.50% of the average net assets attributable to class A, class B, class C, class M and class R shares, respectively. During the reporting period, the class specific expenses related to distribution fees were as follows:
| | | | |
| Class A | $349,896 | | Class M | 16,917 |
| |
|
| Class B | 64,433 | | Class R | 47,017 |
| |
|
| Class C | 128,749 | | Total | $607,012 |
| |
|
For the reporting period, Putnam Retail Management Limited Partnership, acting as underwriter, received net commissions of $15,511 and $212 from the sale of class A and class M shares, respectively, and received $3,046 and $127 in contingent deferred sales charges from redemptions of class B and class C shares, respectively.
A deferred sales charge of up to 1.00% and 0.65% is assessed on certain redemptions of class A and class M shares, respectively. For the reporting period, Putnam Retail Management Limited Partnership, acting as underwriter, received no monies on class A and class M redemptions.
Note 3: Purchases and sales of securities
During the reporting period, cost of purchases and proceeds from sales of investment securities other than short-term investments aggregated $132,408,676 and $141,619,121, respectively. There were no purchases or proceeds from sales of long-term U.S. government securities.
| |
| 40 | Capital Opportunities Fund |
Note 4: Capital shares
At the close of the reporting period, there was an unlimited number of shares of beneficial interest authorized. Transactions in capital shares were as follows:
| | | | |
| | Six months ended 10/31/13 | Year ended 4/30/13 |
|
| Class A | Shares | Amount | Shares | Amount |
|
| Shares sold | 982,013 | $14,736,622 | 3,794,819 | $46,739,723 |
|
| Shares issued in connection with | | | | |
| reinvestment of distributions | — | — | 7,499 | 92,537 |
|
| | 982,013 | 14,736,622 | 3,802,318 | 46,832,260 |
|
| Shares repurchased | (1,746,268) | (25,722,433) | (4,825,440) | (60,176,451) |
|
| Net decrease | (764,255) | $(10,985,811) | (1,023,122) | $(13,344,191) |
|
| |
| | Six months ended 10/31/13 | Year ended 4/30/13 |
|
| Class B | Shares | Amount | Shares | Amount |
|
| Shares sold | 55,322 | $736,987 | 107,730 | $1,223,420 |
|
| Shares issued in connection with | | | | |
| reinvestment of distributions | — | — | — | — |
|
| | 55,322 | 736,987 | 107,730 | 1,223,420 |
|
| Shares repurchased | (118,194) | (1,562,129) | (409,477) | (4,621,424) |
|
| Net decrease | (62,872) | $(825,142) | (301,747) | $(3,398,004) |
|
| |
| | Six months ended 10/31/13 | Year ended 4/30/13 |
|
| Class C | Shares | Amount | Shares | Amount |
|
| Shares sold | 153,242 | $2,059,296 | 484,288 | $5,568,515 |
|
| Shares issued in connection with | | | | |
| reinvestment of distributions | — | — | — | — |
|
| | 153,242 | 2,059,296 | 484,288 | 5,568,515 |
|
| Shares repurchased | (211,992) | (2,854,266) | (406,324) | (4,639,363) |
|
| Net increase (decrease) | (58,750) | $(794,970) | 77,964 | $929,152 |
|
| |
| | Six months ended 10/31/13 | Year ended 4/30/13 |
|
| Class M | Shares | Amount | Shares | Amount |
|
| Shares sold | 9,795 | $136,076 | 12,164 | $140,682 |
|
| Shares issued in connection with | | | | |
| reinvestment of distributions | — | — | — | — |
|
| | 9,795 | 136,076 | 12,164 | 140,682 |
|
| Shares repurchased | (31,362) | (437,432) | (69,970) | (803,196) |
|
| Net decrease | (21,567) | $(301,356) | (57,806) | $(662,514) |
|
| |
| | Six months ended 10/31/13 | Year ended 4/30/13 |
|
| Class R | Shares | Amount | Shares | Amount |
|
| Shares sold | 259,134 | $3,767,007 | 743,657 | $9,147,169 |
|
| Shares issued in connection with | | | | |
| reinvestment of distributions | — | — | — | — |
|
| | 259,134 | 3,767,007 | 743,657 | 9,147,169 |
|
| Shares repurchased | (243,256) | (3,558,205) | (589,902) | (7,111,298) |
|
| Net increase | 15,878 | $208,802 | 153,755 | $2,035,871 |
|
| |
| Capital Opportunities Fund | 41 |
| | | | |
| | | | For the period 7/3/12 |
| | | | (commencement of operations) |
| | Six months ended 10/31/13 | to 4/30/13 |
|
| Class R5 | Shares | Amount | Shares | Amount |
|
| Shares sold | — | $— | 828 | $10,000 |
|
| Shares issued in connection with | | | | |
| reinvestment of distributions | — | — | 1 | 13 |
|
| | — | — | 829 | 10,013 |
|
| Shares repurchased | — | — | — | — |
|
| Net increase | — | $— | 829 | $10,013 |
|
| |
| | | | For the period 7/3/12 |
| | | | (commencement of operations ) |
| | Six months ended 10/31/13 | to 4/30/13 |
|
| Class R6 | Shares | Amount | Shares | Amount |
|
| Shares sold | 19,202 | $291,369 | 629,053 | $9,074,435 |
|
| Shares issued in connection with | | | | |
| reinvestment of distributions | — | — | 1 | 18 |
|
| | 19,202 | 291,369 | 629,054 | 9,074,453 |
|
| Shares repurchased | (46,175) | (714,953) | (8,517) | (120,791) |
|
| Net increase (decrease) | (26,973) | $(423,584) | 620,537 | $8,953,662 |
|
| |
| | Six months ended 10/31/13 | Year ended 4/30/13 |
|
| Class Y | Shares | Amount | Shares | Amount |
|
| Shares sold | 423,924 | $6,499,174 | 1,335,475 | $17,417,010 |
|
| Shares issued in connection with | | | | |
| reinvestment of distributions | — | — | 10,005 | 126,168 |
|
| | 423,924 | 6,499,174 | 1,345,480 | 17,543,178 |
|
| Shares repurchased | (348,443) | (5,337,214) | (1,637,503) | (22,106,805) |
|
| Net increase (decrease) | 75,481 | $1,161,960 | (292,023) | $(4,563,627) |
|
At the close of the reporting period, Putnam Investments, LLC owned the following class shares of the fund:
| | | |
| | Shares owned | Percentage of ownership | Value |
|
| Class R5 | 829 | 100% | $13,593 |
|
| Class R6 | 829 | 0.1 | 13,604 |
|
Note 5: Affiliated Transactions
Transactions during the reporting period with Putnam Short Term Investment Fund, which is under common ownership and control, were as follows:
| | | | | |
| | Market value at | | | | Market value |
| | the beginning | | | | at the end of |
| | of the reporting | | | Investment | the reporting |
| Name of affiliate | period | Purchase cost | Sale proceeds | income | period |
|
| Putnam Short Term | | | | | |
| Investment Fund* | $10,492,979 | $30,491,809 | $35,901,661 | $1,434 | $5,083,127 |
|
* Management fees charged to Putnam Short Term Investment Fund have been waived by Putnam Management.
| |
| 42 | Capital Opportunities Fund |
Note 6: Market, credit and other risks
In the normal course of business, the fund trades financial instruments and enters into financial transactions where risk of potential loss exists due to changes in the market (market risk) or failure of the contracting party to the transaction to perform (credit risk). The fund may be exposed to additional credit risk that an institution or other entity with which the fund has unsettled or open transactions will default. Investments in foreign securities involve certain risks, including those related to economic instability, unfavorable political developments, and currency fluctuations.
Note 7: Offsetting of financial and derivative assets and liabilities
The following table summarizes any derivatives, repurchase agreements, reverse repurchase agreements, securities lending and borrowing transactions, at the end of the reporting period, that are subject to an enforceable master netting agreement or similar agreement.
| | |
| | Goldman Sachs Bank USA | Total |
|
| Assets: | | |
|
| Securities on loan** | $79,968,681 | $79,968,681 |
|
| Total Assets | $79,968,681 | $79,968,681 |
|
| Total Financial and Derivative Net Assets | $79,968,681 | $79,968,681 |
|
| Total collateral received (pledged)##† | $79,968,681 | $79,968,681 |
|
| Net amount | $— | $— |
|
**Included with Investments in securities on the Statement of assets and liabilities
##Any over-collateralization of total financial and derivative net assets is not shown.
†Additional collateral may be required from certain brokers based on individual agreements.
| |
| Capital Opportunities Fund | 43 |
Services for shareholders
Investor services
Systematic investment plan Tell us how much you wish to invest regularly — weekly, semimonthly, or monthly — and the amount you choose will be transferred automatically from your checking or savings account. There’s no additional fee for this service, and you can suspend it at any time. This plan may be a great way to save for college expenses or to plan for your retirement.
Please note that regular investing does not guarantee a profit or protect against loss in a declining market. Before arranging a systematic investment plan, consider your financial ability to continue making purchases in periods when prices are low.
Systematic exchange You can make regular transfers from one Putnam fund to another Putnam fund. There are no additional fees for this service, and you can cancel or change your options at any time.
Dividends PLUS You can choose to have the dividend distributions from one of your Putnam funds automatically reinvested in another Putnam fund at no additional charge.
Free exchange privilege You can exchange money between Putnam funds free of charge, as long as they are the same class of shares. A signature guarantee is required if you are exchanging more than $500,000. The fund reserves the right to revise or terminate the exchange privilege.
Reinstatement privilege If you’ve sold Putnam shares or received a check for a dividend or capital gain, you may reinvest the proceeds with Putnam within 90 days of the transaction and they will be reinvested at the fund’s current net asset value — with no sales charge. However, reinstatement of class B shares may have special tax consequences. Ask your financial or tax representative for details.
Check-writing service You have ready access to many Putnam accounts. It’s as simple as writing a check, and there are no special fees or service charges. For more information about the check-writing service, call Putnam or visit our website.
Dollar cost averaging When you’re investing for long-term goals, it’s time, not timing, that counts. Investing on a systematic basis is a better strategy than trying to figure out when the markets will go up or down. This means investing the same amount of money regularly over a long period. This method of investing is called dollar cost averaging. When a fund’s share price declines, your investment dollars buy more shares at lower prices. When it increases, they buy fewer shares. Over time, you will pay a lower average price per share.
For more information
Visit the Individual Investors section at putnam.com A secure section of our website contains complete information on your account, including balances and transactions, updated daily. You may also conduct transactions, such as exchanges, additional investments, and address changes. Log on today to get your password.
Call us toll free at 1-800-225-1581 Ask a helpful Putnam representative or your financial advisor for details about any of these or other services, or see your prospectus.
| |
| 44 | Capital Opportunities Fund |
Fund information
Founded over 75 years ago, Putnam Investments was built around the concept that a balance between risk and reward is the hallmark of a well-rounded financial program. We manage over 100 funds across income, value, blend, growth, asset allocation, absolute return, and global sector categories.
| | |
| Investment Manager | Trustees | Robert R. Leveille |
| Putnam Investment | Jameson A. Baxter, Chair | Vice President and |
| Management, LLC | Liaquat Ahamed | Chief Compliance Officer |
| One Post Office Square | Ravi Akhoury | |
| Boston, MA 02109 | Barbara M. Baumann | Michael J. Higgins |
| | Charles B. Curtis | Vice President, Treasurer, |
| Investment Sub-Manager | Robert J. Darretta | and Clerk |
| Putnam Investments Limited | Katinka Domotorffy | |
| 57–59 St James’s Street | John A. Hill | Janet C. Smith |
| London, England SW1A 1LD | Paul L. Joskow | Vice President, |
| | Kenneth R. Leibler | Principal Accounting Officer, |
| Marketing Services | Robert E. Patterson | and Assistant Treasurer |
| Putnam Retail Management | George Putnam, III | |
| One Post Office Square | Robert L. Reynolds | Susan G. Malloy |
| Boston, MA 02109 | W. Thomas Stephens | Vice President and |
| | | Assistant Treasurer |
| Custodian | Officers | |
| State Street Bank | Robert L. Reynolds | James P. Pappas |
| and Trust Company | President | Vice President |
| | | |
| Legal Counsel | Jonathan S. Horwitz | Mark C. Trenchard |
| Ropes & Gray LLP | Executive Vice President, | Vice President and |
| | Principal Executive Officer, and | BSA Compliance Officer |
| Compliance Liaison | |
| | | Nancy E. Florek |
| | Steven D. Krichmar | Vice President, Director of |
| | Vice President and | Proxy Voting and Corporate |
| | Principal Financial Officer | Governance, Assistant Clerk, |
| | | and Associate Treasurer |
| | Robert T. Burns | |
| | Vice President and | |
| | Chief Legal Officer | |
This report is for the information of shareholders of Putnam Capital Opportunities Fund. It may also be used as sales literature when preceded or accompanied by the current prospectus, the most recent copy of Putnam’s Quarterly Performance Summary, and Putnam’s Quarterly Ranking Summary. For more recent performance, please visit putnam.com. Investors should carefully consider the investment objectives, risks, charges, and expenses of a fund, which are described in its prospectus. For this and other information or to request a prospectus or summary prospectus, call 1-800-225-1581 toll free. Please read the prospectus carefully before investing. The fund’s Statement of Additional Information contains additional information about the fund’s Trustees and is available without charge upon request by calling 1-800-225-1581.
| |
| Item 3. Audit Committee Financial Expert: |
| |
| Item 4. Principal Accountant Fees and Services: |
| |
| Item 5. Audit Committee of Listed Registrants |
| |
| Item 6. Schedule of Investments: |
| |
| The registrant’s schedule of investments in unaffiliated issuers is included in the report to shareholders in Item 1 above. |
| |
| Item 7. Disclosure of Proxy Voting Policies and Procedures For Closed-End Management Investment Companies: |
| |
| Item 8. Portfolio Managers of Closed-End Investment Companies |
| |
| Item 9. Purchases of Equity Securities by Closed-End Management Investment Companies and Affiliated Purchasers: |
| |
| Item 10. Submission of Matters to a Vote of Security Holders: |
| |
| Item 11. Controls and Procedures: |
| |
| (a) The registrant’s principal executive officer and principal financial officer have concluded, based on their evaluation of the effectiveness of the design and operation of the registrant’s disclosure controls and procedures as of a date within 90 days of the filing date of this report, that the design and operation of such procedures are generally effective to provide reasonable assurance that information required to be disclosed by the registrant in this report is recorded, processed, summarized and reported within the time periods specified in the Commission’s rules and forms. |
| |
| (b) Changes in internal control over financial reporting: Not applicable |
| |
| (a)(2) Separate certifications for the principal executive officer and principal financial officer of the registrant as required by Rule 30a-2(a) under the Investment Company Act of 1940, as amended, are filed herewith. |
| |
| (b) The certifications required by Rule 30a-2(b) under the Investment Company Act of 1940, as amended, are filed herewith. |
| |
| By (Signature and Title): |
| |
| /s/Janet C. Smith
Janet C. Smith
Principal Accounting Officer
|
| |
| Pursuant to the requirements of the Securities Exchange Act of 1934 and the Investment Company Act of 1940, this report has been signed below by the following persons on behalf of the registrant and in the capacities and on the dates indicated. |
| |
| By (Signature and Title): |
| |
| /s/Jonathan S. Horwitz
Jonathan S. Horwitz
Principal Executive Officer
|
| |
| By (Signature and Title): |
| |
| /s/Steven D. Krichmar
Steven D. Krichmar
Principal Financial Officer
|