CERTIFIED SHAREHOLDER REPORT OF REGISTERED MANAGEMENT INVESTMENT COMPANIES
Investment Company Act file number:
(811-07237)
Exact name of registrant as specified in charter:
Putnam Investment Funds
Address of principal executive offices:
One Post Office Square, Boston, Massachusetts 02109
Name and address of agent for service:
Robert T. Burns, Vice President One Post Office Square Boston, Massachusetts 02109
Copy to:
Bryan Chegwidden, Esq. Ropes & Gray LLP 1211 Avenue of the Americas New York, New York 10036
Registrant’s telephone number, including area code:
(617) 292-1000
Date of fiscal year end:
April 30, 2015
Date of reporting period:
May 1, 2014 – October 31, 2014
Item 1. Report to Stockholders:
The following is a copy of the report transmitted to stockholders pursuant to Rule 30e-1 under the Investment Company Act of 1940:
Putnam Multi-Cap Value Fund
Putnam Multi-Cap Value Fund
Semiannual report 10 | 31 | 14
Message from the Trustees
1
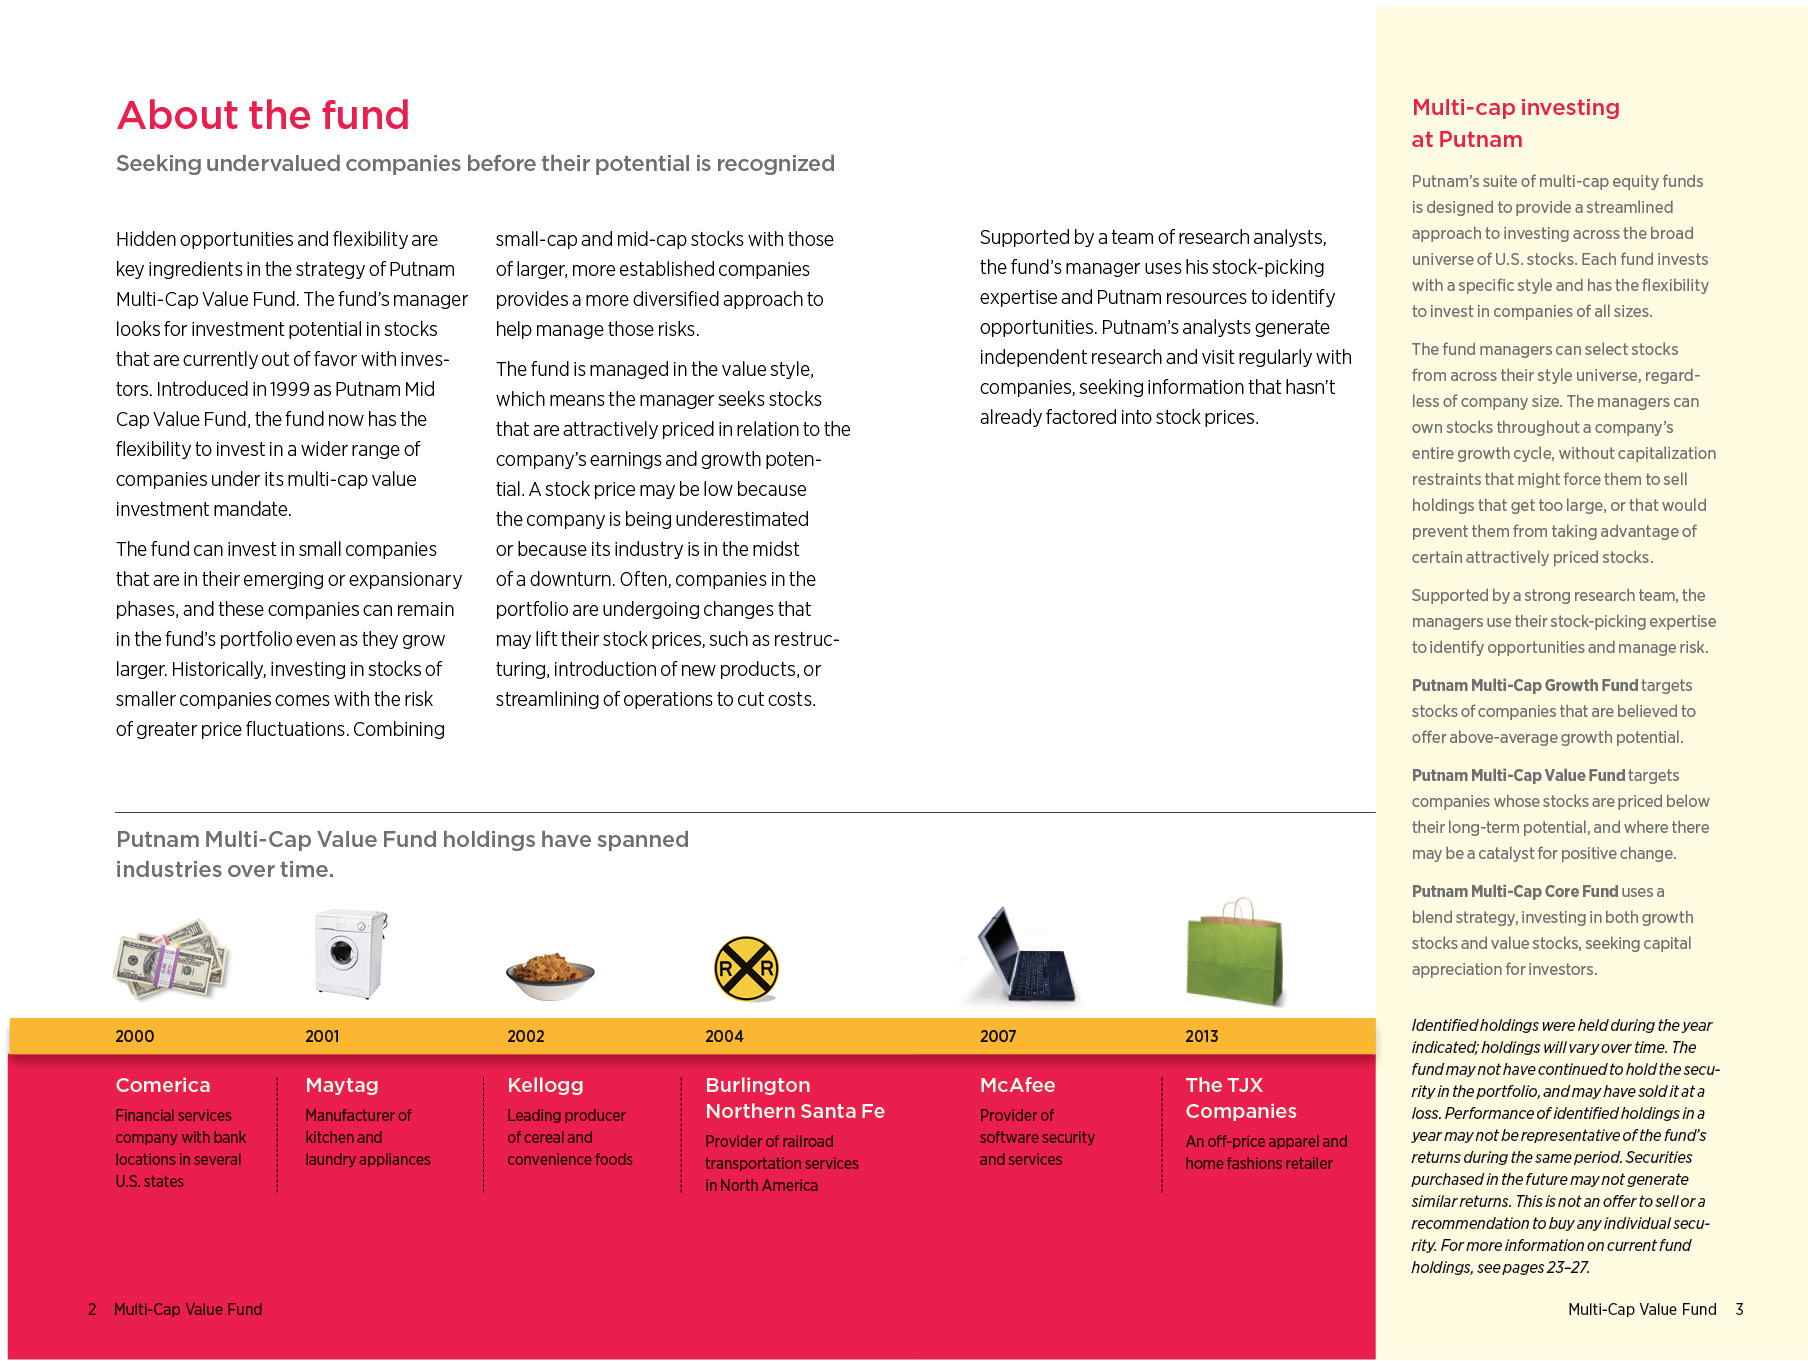
About the fund
2
Performance snapshot
4
Interview with your fund’s portfolio manager
5
Your fund’s performance
11
Your fund’s expenses
13
Terms and definitions
15
Other information for shareholders
16
Trustee approval of management contract
17
Financial statements
22
Consider these risks before investing: Investments in small and/or midsize companies increase the risk of greater price fluctuations. Value stocks may fail to rebound, and the market may not favor value-style investing. Stock prices may fall or fail to rise over time for several reasons, including general financial market conditions and factors related to a specific issuer or industry. You can lose money by investing in the fund.
Message from the Trustees
Dear Fellow Shareholder:
The U.S. economic recovery has been steadily gaining momentum all year, thanks to positive developments in the key areas of employment, corporate earnings, consumer spending, and energy costs. With the U.S. midterm elections behind us, major stock market indexes achieved record highs in early November.
In October, the nation’s unemployment rate dropped to the lowest level since July 2008. Moreover, third-quarter earnings left investors feeling more confident about equity values and the overall health of corporations. For fixed-income markets, the outlook is more muted. The U.S. Federal Reserve ended its record bond-buying stimulus program in October, and appears to be on track to raise short-term interest rates in mid-2015.
While hardly booming, the U.S. economy has nevertheless emerged as a pillar of strength in the global economy. Meanwhile, the rest of the world may need to do more to nurture growth. Central banks in Europe, Japan, and China have recently augmented their stimulus policies, intending to shore up faltering recoveries. While risks have emerged, it is important to note that markets encountering adversity can still harbor investment potential.
As we head into the new year, it may be an appropriate time for you to meet with your financial advisor to ensure that your portfolio is properly diversified and aligned with your objectives and risk tolerance. Putnam offers a wide range of strategies for all environments, as well as new ways of thinking about building portfolios for today’s markets.
As always, thank you for investing with Putnam.
Respectfully yours,
Robert L. Reynolds President and Chief Executive Officer Putnam Investments
Jameson A. Baxter Chair, Board of Trustees
December 10, 2014
Performance snapshot
Annualized total return (%) comparison as of 10/31/14
Current performance may be lower or higher than the quoted past performance, which cannot guarantee future results. Share price, principal value, and return will fluctuate, and you may have a gain or a loss when you sell your shares. Performance of class A shares assumes reinvestment of distributions and does not account for taxes. Fund returns in the bar chart do not reflect a sales charge of 5.75%; had they, returns would have been lower. See pages 5 and 11–13 for additional performance information. For a portion of the periods, the fund had expense limitations, without which returns would have been lower. To obtain the most recent month-end performance, visit putnam.com.
*Returns for the six-month period are not annualized, but cumulative.
4 Multi-Cap Value Fund
Interview with your fund’s portfolio manager
James A. Polk, CFA
The six-month reporting period ended October 31, 2014, were marked by periods of volatility. How did the fund perform in this environment?
The fund put up a respectable single-digit relative return for the six-month reporting period, but it was indeed a period of some market turbulence, which can have short-term effects on individual holdings. A variety of factors influenced investor behavior during the period. Investors bid up equity prices on evidence of continuing acceleration in the U.S. economy and statements by the Federal Reserve Board signaling the central bank’s intention to maintain short-term interest rates at their current low levels. But the markets’ advances were also stalled at times, with concerns over such events as the outbreak of the deadly Ebola virus in West Africa, the geopolitical unrest in Ukraine, and the burgeoning threat of militant insurgents in Syria and Iraq, all of which gave investors pause. Overall, I’d say that the equity markets projected a somewhat defensive feel during the period.
Against this unsettled backdrop, the fund’s return lagged that of its benchmark, the Russell 3000 Value Index. In my view, there were two primary reasons for this somewhat disappointing performance relative to the index. First, the fund’s emphasis on the smaller-cap segment of the value market was a detracting factor, as larger-cap value stocks widely outperformed their smaller
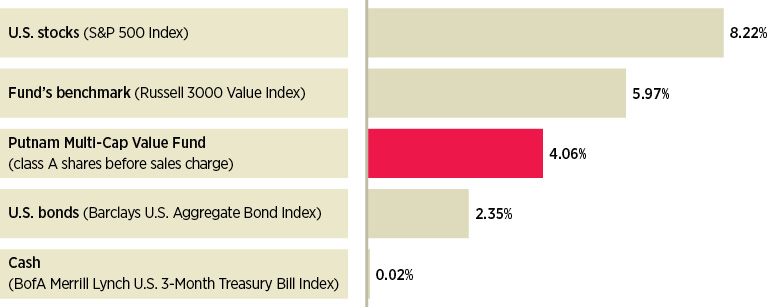
Broad market index and fund performance
This comparison shows your fund’s performance in the context of broad market indexes for the six months ended 10/31/14. See pages 4 and 11–13 for additional fund performance information. Index descriptions can be found on page 15.
Multi-Cap Value Fund 5
counterparts. I believe the defensive feel of the market drove many investors toward the larger-cap segment. Second, some of the fund’s individual holdings faced difficulties during the period, with some of its holdings in the financials and energy sectors accounting for large chunks of the fund’s relative underperformance.
Energy had been a fairly strong-performing sector earlier in 2014, but during the past six months, it was the only sector to record a negative return. What caused the sector to drop?
The energy sector was doing well this past spring, as investors were anticipating more robust global growth and were putting more capital into a sector that would fuel that growth and spur greater energy production worldwide. But slower-than-expected global growth — particularly in economies such as China’s — tempered demand. As supply began to outstrip demand, energy prices and capital expenditures by energy producers fell precipitously. Within the energy sector, companies that provide oil-field services and offshore drilling services were hit especially hard. Although the fund was underweight relative to the index in its allocation to the energy sector, the positive effects of that positioning were overshadowed by the weak performance of some holdings in the services-related segments of the energy sector.
But there’s also a positive side to this story. Lower energy prices at the gas pump are likely to have a favorable effect on the U.S. consumer. Since the U.S. economy is generally heavily driven by the consumer, lower energy prices could well flow through to other segments of the economy in the months ahead.
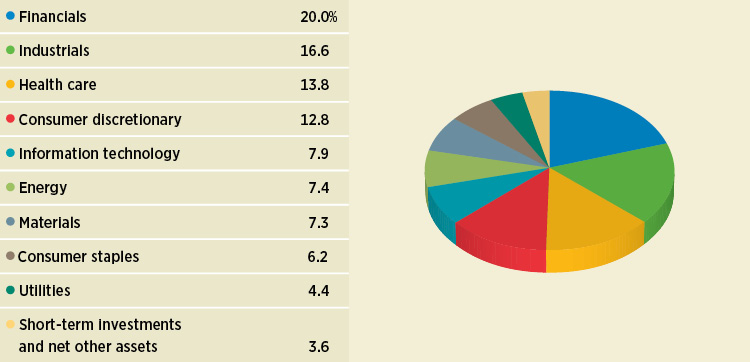
Sector allocations
Allocations are shown as a percentage of the fund’s net assets as of 10/31/14. Short-term investments and net other assets, if any, represent the market value weights of cash, derivatives, short-term securities, and other unclassified assets in the portfolio. Summary information may differ from the portfolio schedule included in the financial statements due to the inclusion of derivative securities, any interest accruals, the exclusion of as-of trades, if any, and the use of different classifications of securities for presentation purposes. Holdings and allocations may vary over time.
6 Multi-Cap Value Fund
“I believe the defensive feel of the market drove many investors toward the larger-cap segment.”
Jim Polk
By comparison, the financials sector was one of the strongest performers in the benchmark during the period. How did the fund perform within financials?
Financial stocks had fairly strong performance, driven by moderate loan expansion in the U.S. housing market and fewer credit losses. Low interest rates, which compress lending margins, continued to hamper the sector, however. The fund was significantly underweight in large-cap financial stocks, which made up the majority of the index. That underweight position relative to the index detracted a bit from performance, but it was more a question of stock selection — those names we chose not to own as well as those we did own — that drove a good deal of the fund’s relative underperformance.
Health care was one of the strongest sectors during the period. Did the fund benefit from that strength?
Indeed, our position in the health-care sector provided a significant boost to the fund’s performance versus the benchmark. Health care’s long-term drivers — principally an aging global population and the search for innovative solutions — remain intact, and our overweight position in the sector helped. The fund benefited further from many of its holdings, which in some cases, were helped by one of the other driving trends in the sector, namely consolidation.
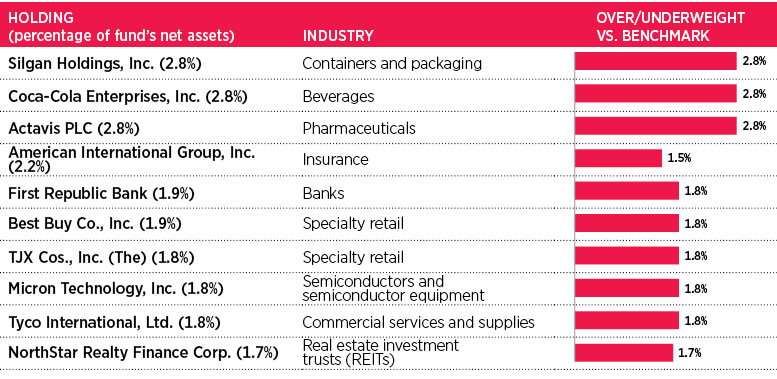
Top 10 equity holdings
This table shows the fund’s top 10 holdings by percentage of the fund’s net assets as of 10/31/14. Short-term holdings and derivatives, if any, are excluded. Holdings may vary over time.
Multi-Cap Value Fund 7
Which holdings were the biggest contributors to the fund’s relative performance?
The top contributor for the fund was its position in Covidien, a global health-care products company based in Ireland, whose share price soared in mid-June on news that it would be acquired by Medtronic. We subsequently sold our stake in Covidien to lock in profits. The second and third contributors also were health-care names — Actavis and Jazz Pharmaceuticals, both headquartered in Ireland. Actavis, a pharmaceutical company, saw its share price rise as the dynamics of industry consolidation defined the company as both a potential acquirer and a potential acquisition target. Jazz is a biopharmaceutical company whose fortunes are rising on the back of an approved drug for narcolepsy, as well as the possibility that it, too, might eventually be an acquisition target. Hillshire Brands, an American food company that markets meat and bakery products, also rose on news that it would be acquired by U.S.-based Tyson Foods. We sold our position in Hillshire Brands toward the end of the period.
Which holdings detracted from fund results?
Not surprisingly, the fund’s two biggest detractors were holdings within the energy sector: Talisman Energy and Halliburton, both of which were stocks not included in the benchmark. Talisman is a stock that the fund acquired and continued to hold because of its potential as a turnaround story, in our view. This Canadian enterprise is a global oil and gas exploration and production company that, under new management, is trying to sell some of its noncore assets in order to pay down debt and rationalize its operations. When energy prices plummeted, the company not only saw its revenues decline,
Comparison of top sector shifts
This chart shows the fund’s largest allocation shifts, by percentage, over the past six months. Allocations are shown as a percentage of the fund’s net assets. Current period summary information may differ from the portfolio schedule included in the financial statements due to the inclusion of derivative securities, any interest accruals, the exclusion of as-of trades, if any, and the use of different classifications of securities for presentation purposes. Holdings and allocations may vary over time.
8 Multi-Cap Value Fund
but its prospects for selling assets also dimmed, taking a big toll on the company’s share price. The share price of Halliburton, a leading U.S. oil-field services company, also took a hard hit during the period, as the energy malaise started to dry up the company’s order book.
The fund’s position in Genworth Financial, a U.S. insurance firm, also detracted, as investors bid down the share price over concerns about the adequacy of liability reserves for the company’s long-term care products. Alliant Techsystems, a U.S. aerospace and sporting goods company, lost ground because of thinner margins in its defense contracting businesses and decelerating growth in its sporting goods segment. Coca-Cola Enterprises, the anchor bottler of Coca-Cola beverages in western Europe, was another disappointing holding, as its share price dipped on slower sales growth in the still-struggling eurozone economy, as well as the negative foreign exchange effects of a strengthening U.S. dollar.
What is your outlook as we head into 2015?
I believe the U.S. economy is continuing to do better. I believe that lower oil prices will begin to flow through to the consumer and help support other sectors of the economy. Equity valuations, in my opinion, have been high, but are not overly stretched given the current pace of economic expansion in the United States. I do not see a lot on the short-term horizon that is particularly negative for equities. The eurozone economy has not been great, but it doesn’t appear to be getting any worse. It may in fact start getting better, in my view, thanks to accommodative support from the European Central Bank. China remains something of a question mark in the short term, although I do believe the world’s second-largest economy will continue to grow.
On the more distant horizon, I think there remains some worry about how the equity markets will react once the Federal Reserve begins, as it must, to raise interest rates. That said, however, I believe the Fed will err on the side of moderation until growth in the U.S. economy is a good deal stronger.
Thank you, Jim, for bringing us up to date.
The views expressed in this report are exclusively those of Putnam Management and are subject to change. They are not meant as investment advice.
Please note that the holdings discussed in this report may not have been held by the fund for the entire period. Portfolio composition is subject to review in accordance with the fund’s investment strategy and may vary in the future. Current and future portfolio holdings are subject to risk.
Portfolio Manager James A. Polk has an M.B.A. from Babson College and a B.A. from Colby College. He joined Putnam in 1998 and has been in the investment industry since 1994.
Multi-Cap Value Fund 9
IN THE NEWS
In the aftermath of November’s U.S. elections, it’s worth noting that U.S. stocks have gained during every six-month period following midterm votes since 1940. During the past 74 years, 18 midterm elections have been held. In every instance, stocks, as measured by the S&P 500 Index*, have delivered a positive return for the November 1–April 30 period. Gains have often been significant, with stocks delivering an average 17.91% return. The biggest advance of 26.88% took place in 1970–1971. The second biggest return — 26.57% — occurred in 1942–1943. The lowest return was 0.75% in 1946–1947. Why has the market consistently advanced following every midterm election, despite varying economic conditions across these periods? Many market observers believe that it comes down to clarity — in other words, each instance might be considered a “relief rally,” as election-related uncertainty tends to diminish.
*Returns for 1966 and earlier based on Ibbotson U.S. Large Stock Total Return Extended Index.
10 Multi-Cap Value Fund
Your fund’s performance
This section shows your fund’s performance, price, and distribution information for periods ended October 31, 2014, the end of the first half of its current fiscal year. In accordance with regulatory requirements for mutual funds, we also include performance information as of the most recent calendar quarter-end and expense information taken from the fund’s current prospectus. Performance should always be considered in light of a fund’s investment strategy. Data represent past performance. Past performance does not guarantee future results. More recent returns may be less or more than those shown. Investment return and principal value will fluctuate, and you may have a gain or a loss when you sell your shares. Performance information does not reflect any deduction for taxes a shareholder may owe on fund distributions or on the redemption of fund shares. For the most recent month-end performance, please visit the Individual Investors section at putnam.com or call Putnam at 1-800-225-1581. Class R and Y shares are not available to all investors. See the Terms and Definitions section in this report for definitions of the share classes offered by your fund.
Fund performance Total return for periods ended 10/31/14
Class A
Class B
Class C
Class M
Class R
Class Y
(inception dates)
(11/1/99)
(1/16/01)
(1/16/01)
(1/16/01)
(4/1/03)
(4/2/02)
Before sales charge
After sales charge
Before CDSC
After CDSC
Before CDSC
After CDSC
Before sales charge
After sales charge
Net asset value
Net asset value
Annual average
(life of fund)
10.44%
10.01%
10.17%
10.17%
9.62%
9.62%
9.89%
9.63%
10.17%
10.68%
10 years
139.80
126.02
131.11
131.11
122.52
122.52
128.07
120.08
133.90
146.13
Annual average
9.14
8.50
8.74
8.74
8.33
8.33
8.59
8.21
8.87
9.42
5 years
132.61
119.24
123.78
121.78
123.78
123.78
126.77
118.83
129.60
135.36
Annual average
18.39
17.00
17.48
17.27
17.48
17.48
17.79
16.96
18.08
18.67
3 years
75.40
65.31
71.40
68.40
71.51
71.51
72.76
66.71
73.97
76.68
Annual average
20.60
18.24
19.67
18.97
19.70
19.70
19.99
18.57
20.27
20.89
1 year
13.06
6.56
12.20
7.20
12.25
11.25
12.51
8.57
12.75
13.39
6 months
4.06
–1.93
3.67
–1.33
3.68
2.68
3.79
0.16
3.87
4.21
Current performance may be lower or higher than the quoted past performance, which cannot guarantee future results. After-sales-charge returns for class A and M shares reflect the deduction of the maximum 5.75% and 3.50% sales charge, respectively, levied at the time of purchase. Class B share returns after contingent deferred sales charge (CDSC) reflect the applicable CDSC, which is 5% in the first year, declining over time to 2% in the fifth year, and is eliminated thereafter. Class C share returns after CDSC reflect a 1% CDSC for the first year that is eliminated thereafter. Class R and Y shares have no initial sales charge or CDSC. Performance for class B, C, M, R, and Y shares before their inception is derived from the historical performance of class A shares, adjusted for the applicable sales charge (or CDSC) and the higher operating expenses for such shares, except for class Y shares, for which 12b-1 fees are not applicable.
For a portion of the periods, the fund had expense limitations, without which returns would have been lower.
Class B share performance reflects conversion to class A shares after five years.
Multi-Cap Value Fund 11
Comparative index returns For periods ended 10/31/14
Russell 3000 Value Index
Lipper Multi-Cap Value Funds category average*
Annual average (life of fund)
6.68%
7.61%
10 years
113.76
107.06
Annual average
7.89
7.42
5 years
114.31
105.95
Annual average
16.47
15.46
3 years
73.78
67.00
Annual average
20.23
18.58
1 year
15.76
12.52
6 months
5.97
3.88
Index and Lipper results should be compared with fund performance before sales charge, before CDSC, or at net asset value.
*Over the 6-month, 1-year, 3-year, 5-year, 10-year, and life-of-fund periods ended 10/31/14, there were 287, 272, 241, 221, 138, and 44 funds, respectively, in this Lipper category.
Fund price and distribution information For the six-month period ended 10/31/14
Class A
Class B
Class C
Class M
Class R
Class Y
Share value
Before sales charge
After sales charge
Net asset value
Net asset value
Before sales charge
After sales charge
Net asset value
Net asset value
4/30/14
$19.47
$20.66
$18.27
$18.21
$18.74
$19.42
$19.10
$19.49
10/31/14
20.26
21.50
18.94
18.88
19.45
20.16
19.84
20.31
The classification of distributions, if any, is an estimate. Before-sales-charge share value and current dividend rate for class A and M shares, if applicable, do not take into account any sales charge levied at the time of purchase. After-sales-charge share value, current dividend rate, and current 30-day SEC yield, if applicable, are calculated assuming that the maximum sales charge (5.75% for class A shares and 3.50% for class M shares) was levied at the time of purchase. Final distribution information will appear on your year-end tax forms.
The fund made no distributions during the period.
12 Multi-Cap Value Fund
Fund performance as of most recent calendar quarter Total return for periods ended 9/30/14
Class A
Class B
Class C
Class M
Class R
Class Y
(inception dates)
(11/1/99)
(1/16/01)
(1/16/01)
(1/16/01)
(4/1/03)
(4/2/02)
Before sales charge
After sales charge
Before CDSC
After CDSC
Before CDSC
After CDSC
Before sales charge
After sales charge
Net asset value
Net asset value
Annual average
(life of fund)
10.28%
9.85%
10.01%
10.01%
9.46%
9.46%
9.73%
9.47%
10.02%
10.52%
10 years
136.82
123.20
128.20
128.20
119.58
119.58
125.17
117.28
130.92
142.95
Annual average
9.00
8.36
8.60
8.60
8.18
8.18
8.46
8.07
8.73
9.28
5 years
108.70
96.70
100.82
98.82
100.79
100.79
103.30
96.18
105.85
111.14
Annual average
15.85
14.49
14.96
14.73
14.96
14.96
15.25
14.43
15.53
16.12
3 years
92.27
81.22
87.81
84.81
87.96
87.96
89.42
82.79
90.86
93.67
Annual average
24.35
21.92
23.38
22.72
23.41
23.41
23.73
22.27
24.04
24.65
1 year
15.34
8.71
14.44
9.44
14.49
13.49
14.78
10.76
15.06
15.62
6 months
0.61
–5.17
0.16
–4.84
0.22
–0.78
0.32
–3.19
0.47
0.72
See the discussion following the fund performance table on page 11 for information about the calculation of fund performance.
Your fund’s expenses
As a mutual fund investor, you pay ongoing expenses, such as management fees, distribution fees (12b-1 fees), and other expenses. Using the following information, you can estimate how these expenses affect your investment and compare them with the expenses of other funds. You may also pay one-time transaction expenses, including sales charges (loads) and redemption fees, which are not shown in this section and would have resulted in higher total expenses. For more information, see your fund’s prospectus or talk to your financial representative.
Expense ratios
Class A
Class B
Class C
Class M
Class R
Class Y
Total annual operating expenses for the fiscal year ended 4/30/14
1.11%
1.86%
1.86%
1.61%
1.36%
0.86%
Annualized expense ratio for the six-month period ended 10/31/14
1.07%
1.82%
1.82%
1.57%
1.32%
0.82%
Fiscal-year expense information in this table is taken from the most recent prospectus, is subject to change, and may differ from that shown for the annualized expense ratio and in the financial highlights of this report.
Expenses are shown as a percentage of average net assets.
Multi-Cap Value Fund 13
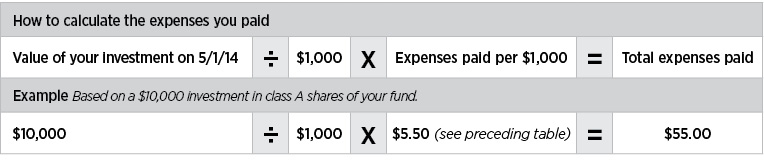
Expenses per $1,000
The following table shows the expenses you would have paid on a $1,000 investment in the fund from May 1, 2014, to October 31, 2014. It also shows how much a $1,000 investment would be worth at the close of the period, assuming actual returns and expenses.
Class A
Class B
Class C
Class M
Class R
Class Y
Expenses paid per $1,000*†
$5.50
$9.34
$9.34
$8.06
$6.78
$4.22
Ending value (after expenses)
$1,040.60
$1,036.70
$1,036.80
$1,037.90
$1,038.70
$1,042.10
*Expenses for each share class are calculated using the fund’s annualized expense ratio for each class, which represents the ongoing expenses as a percentage of average net assets for the six months ended 10/31/14. The expense ratio may differ for each share class.
†Expenses are calculated by multiplying the expense ratio by the average account value for the period; then multiplying the result by the number of days in the period; and then dividing that result by the number of days in the year.
Estimate the expenses you paid
To estimate the ongoing expenses you paid for the six months ended October 31, 2014, use the following calculation method. To find the value of your investment on May 1, 2014, call Putnam at 1-800-225-1581.
Compare expenses using the SEC’s method
The Securities and Exchange Commission (SEC) has established guidelines to help investors assess fund expenses. Per these guidelines, the following table shows your fund’s expenses based on a $1,000 investment, assuming a hypothetical 5% annualized return. You can use this information to compare the ongoing expenses (but not transaction expenses or total costs) of investing in the fund with those of other funds. All mutual fund shareholder reports will provide this information to help you make this comparison. Please note that you cannot use this information to estimate your actual ending account balance and expenses paid during the period.
Class A
Class B
Class C
Class M
Class R
Class Y
Expenses paid per $1,000*†
$5.45
$9.25
$9.25
$7.98
$6.72
$4.18
Ending value (after expenses)
$1,019.81
$1,016.03
$1,016.03
$1,017.29
$1,018.55
$1,021.07
*Expenses for each share class are calculated using the fund’s annualized expense ratio for each class, which represents the ongoing expenses as a percentage of average net assets for the six months ended 10/31/14. The expense ratio may differ for each share class.
†Expenses are calculated by multiplying the expense ratio by the average account value for the six-month period; then multiplying the result by the number of days in the six-month period; and then dividing that result by the number of days in the year.
14 Multi-Cap Value Fund
Terms and definitions
Important terms
Total return shows how the value of the fund’s shares changed over time, assuming you held the shares through the entire period and reinvested all distributions in the fund.
Before sales charge, or net asset value, is the price, or value, of one share of a mutual fund, without a sales charge. Before-sales-charge figures fluctuate with market conditions, and are calculated by dividing the net assets of each class of shares by the number of outstanding shares in the class.
After sales charge is the price of a mutual fund share plus the maximum sales charge levied at the time of purchase. After-sales-charge performance figures shown here assume the 5.75% maximum sales charge for class A shares and 3.50% for class M shares.
Contingent deferred sales charge (CDSC) is generally a charge applied at the time of the redemption of class B or C shares and assumes redemption at the end of the period. Your fund’s class B CDSC declines over time from a 5% maximum during the first year to 2% during the fifth year. After the fifth year, the CDSC no longer applies. The CDSC for class C shares is 1% for one year after purchase.
Share classes
Class A shares are generally subject to an initial sales charge and no CDSC (except on certain redemptions of shares bought without an initial sales charge).
Class B shares are not subject to an initial sales charge and may be subject to a CDSC.
Class C shares are not subject to an initial sales charge and are subject to a CDSC only if the shares are redeemed during the first year.
Class M shares have a lower initial sales charge and a higher 12b-1 fee than class A shares and no CDSC (except on certain redemptions of shares bought without an initial sales charge).
Class R shares are not subject to an initial sales charge or CDSC and are available only to certain employer-sponsored retirement plans.
Class Y shares are not subject to an initial sales charge or CDSC, and carry no 12b-1 fee. They are generally only available to corporate and institutional clients and clients in other approved programs.
Comparative indexes
Barclays U.S. Aggregate Bond Index is an unmanaged index of U.S. investment-grade fixed-income securities.
BofA Merrill Lynch U.S. 3-Month Treasury Bill Index is an unmanaged index that seeks to measure the performance of U.S. Treasury bills available in the marketplace.
Russell 3000 Value Index is an unmanaged index of those companies in the broad-market Russell 3000 Index chosen for their value orientation.
S&P 500 Index is an unmanaged index of common stock performance.
Indexes assume reinvestment of all distributions and do not account for fees. Securities and performance of a fund and an index will differ. You cannot invest directly in an index.
Lipper is a third-party industry-ranking entity that ranks mutual funds. Its rankings do not reflect sales charges. Lipper rankings are based on total return at net asset value relative to other funds that have similar current investment styles or objectives as determined by Lipper. Lipper may change a fund’s category assignment at its discretion. Lipper category averages reflect performance trends for funds within a category.
Multi-Cap Value Fund 15
Other information for shareholders
Important notice regarding delivery of shareholder documents
In accordance with Securities and Exchange Commission (SEC) regulations, Putnam sends a single copy of annual and semiannual shareholder reports, prospectuses, and proxy statements to Putnam shareholders who share the same address, unless a shareholder requests otherwise. If you prefer to receive your own copy of these documents, please call Putnam at 1-800-225-1581, and Putnam will begin sending individual copies within 30 days.
Proxy voting
Putnam is committed to managing our mutual funds in the best interests of our shareholders. The Putnam funds’ proxy voting guidelines and procedures, as well as information regarding how your fund voted proxies relating to portfolio securities during the 12-month period ended June 30, 2014, are available in the Individual Investors section of putnam.com, and on the SEC’s website, www.sec.gov. If you have questions about finding forms on the SEC’s website, you may call the SEC at 1-800-SEC-0330. You may also obtain the Putnam funds’ proxy voting guidelines and procedures at no charge by calling Putnam’s Shareholder Services at 1-800-225-1581.
Fund portfolio holdings
The fund will file a complete schedule of its portfolio holdings with the SEC for the first and third quarters of each fiscal year on Form N-Q. Shareholders may obtain the fund’s Form N-Q on the SEC’s website at www.sec.gov. In addition, the fund’s Form N-Q may be reviewed and copied at the SEC’s Public Reference Room in Washington, D.C. You may call the SEC at 1-800-SEC-0330 for information about the SEC’s website or the operation of the Public Reference Room.
Trustee and employee fund ownership
Putnam employees and members of the Board of Trustees place their faith, confidence, and, most importantly, investment dollars in Putnam mutual funds. As of October 31, 2014, Putnam employees had approximately $494,000,000 and the Trustees had approximately $139,000,000 invested in Putnam mutual funds. These amounts include investments by the Trustees’ and employees’ immediate family members as well as investments through retirement and deferred compensation plans.
16 Multi-Cap Value Fund
Trustee approval of management contract
General conclusions
The Board of Trustees of the Putnam funds oversees the management of each fund and, as required by law, determines annually whether to approve the continuance of your fund’s management contract with Putnam Investment Management, LLC (“Putnam Management”) and the sub-management contract with respect to your fund between Putnam Management and its affiliate, Putnam Investments Limited (“PIL”). The Board of Trustees, with the assistance of its Contract Committee, requests and evaluates all information it deems reasonably necessary under the circumstances in connection with its annual contract review. The Contract Committee consists solely of Trustees who are not “interested persons” (as this term is defined in the Investment Company Act of 1940, as amended (the “1940 Act”)) of the Putnam funds (“Independent Trustees”).
At the outset of the review process, members of the Board’s independent staff and independent legal counsel met with representatives of Putnam Management to review the annual contract review materials furnished to the Contract Committee during the course of the previous year’s review and to discuss possible changes in these materials that might be necessary or desirable for the coming year. Following these discussions and in consultation with the Contract Committee, the Independent Trustees’ independent legal counsel requested that Putnam Management furnish specified information, together with any additional information that Putnam Management considered relevant, to the Contract Committee. Over the course of several months ending in June 2014, the Contract Committee met on a number of occasions with representatives of Putnam Management, and separately in executive session, to consider the information that Putnam Management provided, as well as supplemental information provided in response to additional requests made by the Contract Committee. Throughout this process, the Contract Committee was assisted by the members of the Board’s independent staff and by independent legal counsel for the Putnam funds and the Independent Trustees.
In May 2014, the Contract Committee met in executive session to discuss and consider its preliminary recommendations with respect to the continuance of the contracts. At the Trustees’ June 20, 2014 meeting, the Contract Committee met in executive session with the other Independent Trustees to review a summary of the key financial, performance and other data that the Contract Committee considered in the course of its review. The Contract Committee then presented its written report, which summarized the key factors that the Committee had considered and set forth its final recommendations. The Contract Committee then recommended, and the Independent Trustees approved, the continuance of your fund’s management and sub-management contracts, effective July 1, 2014. (Because PIL is an affiliate of Putnam Management and Putnam Management remains fully responsible for all services provided by PIL, the Trustees have not attempted to evaluate PIL as a separate entity, and all subsequent references to Putnam Management below should be deemed to include reference to PIL as necessary or appropriate in the context.)
The Independent Trustees’ approval was based on the following conclusions:
•That the fee schedule in effect for your fund represented reasonable compensation in light of the nature and quality of the services being provided to the fund, the fees paid by competitive funds, and the costs incurred by Putnam Management in providing services to the fund; and
Multi-Cap Value Fund 17
•That the fee schedule in effect for your fund represented an appropriate sharing between fund shareholders and Putnam Management of such economies of scale as may exist in the management of the fund at current asset levels.
These conclusions were based on a comprehensive consideration of all information provided to the Trustees and were not the result of any single factor. Some of the factors that figured particularly in the Trustees’ deliberations and how the Trustees considered these factors are described below, although individual Trustees may have evaluated the information presented differently, giving different weights to various factors. It is also important to recognize that the management arrangements for your fund and the other Putnam funds are the result of many years of review and discussion between the Independent Trustees and Putnam Management, that some aspects of the arrangements may receive greater scrutiny in some years than others, and that the Trustees’ conclusions may be based, in part, on their consideration of fee arrangements in previous years. For example, with some minor exceptions, the current fee arrangements under the management contracts for the Putnam funds were implemented at the beginning of 2010 following extensive review by the Contract Committee and discussions with representatives of Putnam Management, as well as approval by shareholders. Shareholders also voted overwhelmingly to approve these fee arrangements in early 2014, when they were asked to approve new management contracts (with the same fees and substantially identical other provisions) following the possible termination of the previous management contracts as a result of the death of the Honorable Paul G. Desmarais. (Mr. Desmarais, both directly and through holding companies, controlled a majority of the voting shares of Power Corporation of Canada, which (directly and indirectly) is the majority owner of Putnam Management. Mr. Desmarais’ voting control of shares of Power Corporation of Canada was transferred to The Desmarais Family Residuary Trust upon his death and this transfer, as a technical matter, may have constituted an “assignment” within the meaning of the 1940 Act, causing the Putnam funds’ management contracts to terminate automatically.)
Management fee schedules and total expenses
The Trustees reviewed the management fee schedules in effect for all Putnam funds, including fee levels and breakpoints. The Trustees also reviewed the total expenses of each Putnam fund, recognizing that in most cases management fees represented the major, but not the sole, determinant of total costs to shareholders.
In reviewing fees and expenses, the Trustees generally focus their attention on material changes in circumstances — for example, changes in assets under management, changes in a fund’s investment style, changes in Putnam Management’s operating costs or profitability, or changes in competitive practices in the mutual fund industry — that suggest that consideration of fee changes might be warranted. The Trustees concluded that the circumstances did not warrant changes to the management fee structure of your fund.
Under its management contract, your fund has the benefit of breakpoints in its management fee schedule that provide shareholders with economies of scale in the form of reduced fee levels as assets under management in the Putnam family of funds increase. The Trustees concluded that the fee schedule in effect for your fund represented an appropriate sharing of economies of scale between fund shareholders and Putnam Management.
As in the past, the Trustees also focused on the competitiveness of each fund’s total expense ratio. In order to ensure that expenses of the Putnam funds continue to meet competitive standards, the Trustees and Putnam
18 Multi-Cap Value Fund
Management have implemented certain expense limitations. These expense limitations were: (i) a contractual expense limitation applicable to all retail open-end funds of 32 basis points on investor servicing fees and expenses and (ii) a contractual expense limitation applicable to all open-end funds of 20 basis points on so-called “other expenses” (i.e., all expenses exclusive of management fees, investor servicing fees, distribution fees, investment-related expenses, interest, taxes, brokerage commissions, extraordinary expenses and acquired fund fees and expenses). These expense limitations serve in particular to maintain competitive expense levels for funds with large numbers of small shareholder accounts and funds with relatively small net assets. Most funds, including your fund, had sufficiently low expenses that these expense limitations did not apply. Putnam Management’s support for these expense limitation arrangements was an important factor in the Trustees’ decision to approve the continuance of your fund’s management and sub-management contracts.
The Trustees reviewed comparative fee and expense information for a custom group of competitive funds selected by Lipper Inc. (“Lipper”). This comparative information included your fund’s percentile ranking for effective management fees and total expenses (excluding any applicable 12b-1 fee), which provides a general indication of your fund’s relative standing. In the custom peer group, your fund ranked in the first quintile in effective management fees (determined for your fund and the other funds in the custom peer group based on fund asset size and the applicable contractual management fee schedule) and in the second quintile in total expenses (excluding any applicable 12b-1 fees) as of December 31, 2013 (the first quintile representing the least expensive funds and the fifth quintile the most expensive funds). The fee and expense data reported by Lipper as of December 31, 2013 reflected the most recent fiscal year-end data available in Lipper’s database at that time.
In connection with their review of the management fees and total expenses of the Putnam funds, the Trustees also reviewed the costs of the services provided and the profits realized by Putnam Management and its affiliates from their contractual relationships with the funds. This information included trends in revenues, expenses and profitability of Putnam Management and its affiliates relating to the investment management, investor servicing and distribution services provided to the funds. In this regard, the Trustees also reviewed an analysis of Putnam Management’s revenues, expenses and profitability, allocated on a fund-by-fund basis, with respect to the funds’ management, distribution, and investor servicing contracts. For each fund, the analysis presented information about revenues, expenses and profitability for each of the agreements separately and for the agreements taken together on a combined basis. The Trustees concluded that, at current asset levels, the fee schedules in place represented reasonable compensation for the services being provided and represented an appropriate sharing of such economies of scale as may exist in the management of the Putnam funds at that time.
The information examined by the Trustees as part of their annual contract review for the Putnam funds has included for many years information regarding fees charged by Putnam Management and its affiliates to institutional clients such as defined benefit pension plans, college endowments, and the like. This information included comparisons of those fees with fees charged to the Putnam funds, as well as an assessment of the differences in the services provided to these different types of clients. The Trustees observed that the differences in fee rates between institutional clients and mutual funds are by no means uniform when examined by individual asset sectors, suggesting that
Multi-Cap Value Fund 19
differences in the pricing of investment management services to these types of clients may reflect historical competitive forces operating in separate markets. The Trustees considered the fact that in many cases fee rates across different asset classes are higher on average for mutual funds than for institutional clients, as well as the differences between the services that Putnam Management provides to the Putnam funds and those that it provides to its institutional clients. The Trustees did not rely on these comparisons to any significant extent in concluding that the management fees paid by your fund are reasonable.
Investment performance
The quality of the investment process provided by Putnam Management represented a major factor in the Trustees’ evaluation of the quality of services provided by Putnam Management under your fund’s management contract. The Trustees were assisted in their review of the Putnam funds’ investment process and performance by the work of the investment oversight committees of the Trustees, which meet on a regular basis with the funds’ portfolio teams and with the Chief Investment Officer and other senior members of Putnam Management’s Investment Division throughout the year. The Trustees concluded that Putnam Management generally provides a high-quality investment process — based on the experience and skills of the individuals assigned to the management of fund portfolios, the resources made available to them, and in general Putnam Management’s ability to attract and retain high-quality personnel — but also recognized that this does not guarantee favorable investment results for every fund in every time period.
The Trustees considered that 2013 was a year of strong competitive performance for many of the Putnam funds, with only a relatively small number of exceptions. They noted that this strong performance was exemplified by the fact that the Putnam funds were recognized by Barron’s as the second-best performing mutual fund complex for both 2013 and the five-year period ended December 31, 2013. They also noted, however, the disappointing investment performance of some funds for periods ended December 31, 2013 and considered information provided by Putnam Management regarding the factors contributing to the underperformance and actions being taken to improve the performance of these particular funds. The Trustees indicated their intention to continue to monitor performance trends to assess the effectiveness of these efforts and to evaluate whether additional actions to address areas of underperformance are warranted. For purposes of evaluating investment performance, the Trustees generally focus on competitive industry rankings for the one-year, three-year and five-year periods. For a number of Putnam funds with relatively unique investment mandates for which meaningful competitive performance rankings are not considered available, the Trustees evaluated performance based on comparisons of fund returns with the returns of selected investment benchmarks. In the case of your fund, the Trustees considered that its class A share cumulative total return performance at net asset value was in the following quartiles of its Lipper peer group (Lipper Multi-Cap Value Funds) for the one-year, three-year and five-year periods ended December 31, 2013 (the first quartile representing the best-performing funds and the fourth quartile the worst-performing funds):
One-year period
1st
Three-year period
2nd
Five-year period
1st
For the one-year period ended December 31, 2013, your fund’s performance was in the top decile of its Lipper peer group. Over the one-year, three-year and five-year periods ended December 31, 2013, there were 295, 257 and 232 funds, respectively, in your fund’s Lipper peer group. (When considering performance information, shareholders should be mindful
20 Multi-Cap Value Fund
that past performance is not a guarantee of future results.)
Brokerage and soft-dollar allocations; investor servicing
The Trustees considered various potential benefits that Putnam Management may receive in connection with the services it provides under the management contract with your fund. These include benefits related to brokerage allocation and the use of soft dollars, whereby a portion of the commissions paid by a fund for brokerage may be used to acquire research services that are expected to be useful to Putnam Management in managing the assets of the fund and of other clients. Subject to policies established by the Trustees, soft dollars generated by these means are used primarily to acquire brokerage and research services that enhance Putnam Management’s investment capabilities and supplement Putnam Management’s internal research efforts. However, the Trustees noted that a portion of available soft dollars continues to be used to pay fund expenses. The Trustees indicated their continued intent to monitor regulatory and industry developments in this area with the assistance of their Brokerage Committee and also indicated their continued intent to monitor the allocation of the Putnam funds’ brokerage in order to ensure that the principle of seeking best price and execution remains paramount in the portfolio trading process.
Putnam Management may also receive benefits from payments that the funds make to Putnam Management’s affiliates for investor or distribution services. In conjunction with the annual review of your fund’s management and sub-management contracts, the Trustees reviewed your fund’s investor servicing agreement with Putnam Investor Services, Inc. (“PSERV”) and its distributor’s contracts and distribution plans with Putnam Retail Management Limited Partnership (“PRM”), both of which are affiliates of Putnam Management. The Trustees concluded that the fees payable by the funds to PSERV and PRM, as applicable, for such services are reasonable in relation to the nature and quality of such services, the fees paid by competitive funds, and the costs incurred by PSERV and PRM, as applicable, in providing such services.
Multi-Cap Value Fund 21
Financial statements
A guide to financial statements
These sections of the report, as well as the accompanying Notes, constitute the fund’s financial statements.
The fund’s portfolio lists all the fund’s investments and their values as of the last day of the reporting period. Holdings are organized by asset type and industry sector, country, or state to show areas of concentration and diversification.
Statement of assets and liabilities shows how the fund’s net assets and share price are determined. All investment and non-investment assets are added together. Any unpaid expenses and other liabilities are subtracted from this total. The result is divided by the number of shares to determine the net asset value per share, which is calculated separately for each class of shares. (For funds with preferred shares, the amount subtracted from total assets includes the liquidation preference of preferred shares.)
Statement of operations shows the fund’s net investment gain or loss. This is done by first adding up all the fund’s earnings — from dividends and interest income — and subtracting its operating expenses to determine net investment income (or loss). Then, any net gain or loss the fund realized on the sales of its holdings — as well as any unrealized gains or losses over the period — is added to or subtracted from the net investment result to determine the fund’s net gain or loss for the fiscal period.
Statement of changes in net assets shows how the fund’s net assets were affected by the fund’s net investment gain or loss, by distributions to shareholders, and by changes in the number of the fund’s shares. It lists distributions and their sources (net investment income or realized capital gains) over the current reporting period and the most recent fiscal year-end. The distributions listed here may not match the sources listed in the Statement of operations because the distributions are determined on a tax basis and may be paid in a different period from the one in which they were earned. Dividend sources are estimated at the time of declaration. Actual results may vary. Any non-taxable return of capital cannot be determined until final tax calculations are completed after the end of the fund’s fiscal year.
Financial highlights provide an overview of the fund’s investment results, per-share distributions, expense ratios, net investment income ratios, and portfolio turnover in one summary table, reflecting the five most recent reporting periods. In a semiannual report, the highlights table also includes the current reporting period.
22 Multi-Cap Value Fund
The fund’s portfolio 10/31/14 (Unaudited)
COMMON STOCKS (96.3%)*
Shares
Value
Aerospace and defense (6.9%)
Alliant Techsystems, Inc.
23,800
$2,783,648
General Dynamics Corp.
42,300
5,911,848
Honeywell International, Inc.
72,300
6,949,476
L-3 Communications Holdings, Inc.
48,700
5,915,102
Northrop Grumman Corp.
48,700
6,718,652
28,278,726
Airlines (0.5%)
American Airlines Group, Inc.
52,100
2,154,335
2,154,335
Auto components (0.5%)
Johnson Controls, Inc.
44,400
2,097,900
2,097,900
Banks (5.9%)
City National Corp.
54,000
4,250,340
Fifth Third Bancorp
146,200
2,922,538
First Republic Bank
153,800
7,833,034
Old National Bancorp
92,500
1,345,875
PacWest Bancorp
99,200
4,231,872
Regions Financial Corp.
351,200
3,487,416
24,071,075
Beverages (2.8%)
Coca-Cola Enterprises, Inc.
262,200
11,366,370
11,366,370
Capital markets (4.4%)
Ameriprise Financial, Inc.
47,862
6,038,749
Carlyle Group LP (The)
81,300
2,256,888
Charles Schwab Corp. (The)
152,700
4,377,909
E*Trade Financial Corp. †
111,000
2,475,300
KKR & Co. LP
121,600
2,621,696
17,770,542
Chemicals (1.4%)
Dow Chemical Co. (The)
91,100
4,500,340
Quaker Chemical Corp.
15,900
1,305,072
5,805,412
Commercial services and supplies (1.8%)
Tyco International, Ltd.
167,020
7,170,169
7,170,169
Containers and packaging (5.3%)
MeadWestvaco Corp.
51,400
2,270,338
Packaging Corp. of America
49,200
3,546,336
Sealed Air Corp.
121,000
4,386,250
Silgan Holdings, Inc.
232,442
11,426,849
21,629,773
Diversified consumer services (0.5%)
ITT Educational Services, Inc. † S
186,551
1,886,031
1,886,031
Electric utilities (2.1%)
Edison International
69,700
4,361,826
Entergy Corp.
50,900
4,276,618
8,638,444
Multi-Cap Value Fund 23
COMMON STOCKS (96.3%)* cont.
Shares
Value
Electrical equipment (1.5%)
AMETEK, Inc.
114,775
$5,985,516
5,985,516
Electronic equipment, instruments, and components (0.8%)
Anixter International, Inc.
23,490
2,000,643
SYNNEX Corp.
19,200
1,328,256
3,328,899
Energy equipment and services (3.8%)
Ensco PLC Class A (United Kingdom)
41,100
1,668,249
Halliburton Co.
124,400
6,859,416
Transocean, Ltd. (Switzerland) S
199,500
5,951,085
Weatherford International PLC †
72,600
1,192,092
15,670,842
Food products (1.5%)
Kellogg Co.
70,200
4,489,992
Pinnacle Foods, Inc.
54,896
1,855,485
6,345,477
Health-care equipment and supplies (5.7%)
Alere, Inc. †
160,775
6,426,177
Medtronic, Inc.
92,900
6,332,064
Merit Medical Systems, Inc. †
363,423
5,505,858
OraSure Technologies, Inc. †
175,800
1,573,410
Zimmer Holdings, Inc.
29,600
3,292,704
23,130,213
Health-care providers and services (1.2%)
Mednax, Inc. †
77,200
4,819,596
4,819,596
Hotels, restaurants, and leisure (0.4%)
Penn National Gaming, Inc. †
110,000
1,439,900
1,439,900
Household durables (4.3%)
Garmin, Ltd.
27,600
1,531,248
Harman International Industries, Inc.
53,400
5,731,956
Jarden Corp. †
69,700
4,536,773
Whirlpool Corp.
32,700
5,626,035
17,426,012
Independent power and renewable electricity producers (0.5%)
NRG Energy, Inc.
61,700
1,849,766
1,849,766
Insurance (6.1%)
American International Group, Inc.
170,200
9,117,614
Genworth Financial, Inc. Class A †
183,500
2,567,165
Hartford Financial Services Group, Inc. (The)
144,234
5,708,782
Prudential PLC (United Kingdom)
106,145
2,449,368
XL Group PLC
141,700
4,800,796
24,643,725
IT Services (2.1%)
Computer Sciences Corp.
76,800
4,638,720
Fidelity National Information Services, Inc.
65,100
3,801,189
8,439,909
Leisure products (0.4%)
Brunswick Corp.
36,500
1,708,200
1,708,200
24 Multi-Cap Value Fund
COMMON STOCKS (96.3%)* cont.
Shares
Value
Machinery (3.2%)
Pall Corp.
38,900
$3,556,238
Snap-On, Inc.
51,100
6,752,354
Wabtec Corp.
33,328
2,876,206
13,184,798
Media (1.4%)
Live Nation Entertainment, Inc. †
84,200
2,189,200
Regal Entertainment Group Class A S
158,900
3,519,635
5,708,835
Multi-utilities (1.8%)
Ameren Corp.
92,300
3,907,982
PG&E Corp.
66,200
3,331,184
7,239,166
Oil, gas, and consumable fuels (3.5%)
EnCana Corp. (Canada)
46,300
862,569
Energen Corp.
15,900
1,076,430
EOG Resources, Inc.
46,900
4,457,845
EP Energy Corp. Class A † S
95,200
1,389,920
QEP Resources, Inc.
96,200
2,411,734
Scorpio Tankers, Inc.
181,900
1,587,987
Talisman Energy, Inc. (Canada)
412,900
2,634,302
14,420,787
Paper and forest products (0.5%)
KapStone Paper and Packaging Corp. †
69,400
2,134,744
2,134,744
Personal products (1.8%)
Avon Products, Inc.
90,700
943,280
Coty, Inc. Class A †
389,400
6,464,040
7,407,320
Pharmaceuticals (6.8%)
Actavis PLC †
46,600
11,311,684
Endo International PLC †
66,000
4,416,720
Impax Laboratories, Inc. †
100,400
2,908,588
Jazz Pharmaceuticals PLC †
14,200
2,397,528
Mylan, Inc. †
42,000
2,249,100
Teva Pharmaceutical Industries, Ltd. ADR (Israel)
81,400
4,596,658
27,880,278
Real estate investment trusts (REITs) (3.1%)
American Capital Agency Corp.
104,000
2,364,960
Boston Properties, Inc.
26,900
3,409,575
NorthStar Realty Finance Corp.
376,500
6,995,370
12,769,905
Real estate management and development (0.7%)
RE/MAX Holdings, Inc. Class A
84,316
2,698,112
2,698,112
Road and rail (1.8%)
Genesee & Wyoming, Inc. Class A †
40,600
3,905,720
Union Pacific Corp.
29,500
3,435,275
7,340,995
Semiconductors and semiconductor equipment (2.1%)
Maxim Integrated Products, Inc.
42,400
1,244,016
Micron Technology, Inc. †
218,300
7,223,547
8,467,563
Multi-Cap Value Fund 25
COMMON STOCKS (96.3%)* cont.
Shares
Value
Software (0.8%)
Symantec Corp.
132,600
$3,291,132
3,291,132
Specialty retail (5.4%)
Best Buy Co., Inc.
223,100
7,616,634
Express, Inc. †
129,700
1,941,609
Gap, Inc. (The)
49,600
1,879,344
GNC Holdings, Inc. Class A
20,300
843,871
Michaels Cos., Inc. (The) †
116,700
2,133,276
TJX Cos., Inc. (The)
118,600
7,509,752
21,924,486
Technology hardware, storage, and peripherals (2.1%)
Hewlett-Packard Co.
45,900
1,646,892
NetApp, Inc.
54,503
2,332,728
QLogic Corp. †
103,700
1,224,697
SanDisk Corp.
35,700
3,360,798
8,565,115
Trading companies and distributors (0.9%)
DXP Enterprises, Inc. †
16,500
1,093,785
WESCO International, Inc. †
29,400
2,422,854
3,516,639
Total common stocks (cost $318,607,607)
$392,206,707
SHORT-TERM INVESTMENTS (7.2%)*
Shares
Value
Putnam Cash Collateral Pool, LLC 0.18% d
7,774,986
$7,774,986
Putnam Short Term Investment Fund 0.09% L
21,411,953
21,411,953
Total short-term investments (cost $29,186,939)
$29,186,939
TOTAL INVESTMENTS
Total investments (cost $347,794,546)
$421,393,646
Key to holding’s abbreviations
ADR
American Depository Receipts: represents ownership of foreign securities on deposit with a custodian bank
Notes to the fund’s portfolio
Unless noted otherwise, the notes to the fund’s portfolio are for the close of the fund’s reporting period, which ran from May 1, 2014 through October 31, 2014 (the reporting period). Within the following notes to the portfolio, references to “ASC 820” represent Accounting Standards Codification 820 Fair Value Measurements and Disclosures and references to “OTC”, if any, represent over-the-counter.
*
Percentages indicated are based on net assets of $407,216,810.
†
Non-income-producing security.
d
Affiliated company. See Note 1 to the financial statements regarding securities lending. The rate quoted in the security description is the annualized 7-day yield of the fund at the close of the reporting period.
L
Affiliated company (Note 5). The rate quoted in the security description is the annualized 7-day yield of the fund at the close of the reporting period.
S
Security on loan, in part or in entirety, at the close of the reporting period (Note 1).
26 Multi-Cap Value Fund
ASC 820 establishes a three-level hierarchy for disclosure of fair value measurements. The valuation hierarchy is based upon the transparency of inputs to the valuation of the fund’s investments. The three levels are defined as follows:
Level 1: Valuations based on quoted prices for identical securities in active markets.
Level 2: Valuations based on quoted prices in markets that are not active or for which all significant inputs are observable, either directly or indirectly.
Level 3: Valuations based on inputs that are unobservable and significant to the fair value measurement.
The following is a summary of the inputs used to value the fund’s net assets as of the close of the reporting period:
Valuation inputs
Investments in securities:
Level 1
Level 2
Level 3
Common stocks*:
Consumer discretionary
$52,191,364
$—
$—
Consumer staples
25,119,167
—
—
Energy
30,091,629
—
—
Financials
81,953,359
—
—
Health care
55,830,087
—
—
Industrials
67,631,178
—
—
Information technology
32,092,618
—
—
Materials
29,569,929
—
—
Utilities
17,727,376
—
—
Total common stocks
392,206,707
—
—
Short-term investments
21,411,953
7,774,986
—
Totals by level
$413,618,660
$7,774,986
$—
*Common stock classifications are presented at the sector level, which may differ from the fund’s portfolio presentation.
During the reporting period, transfers within the fair value hierarchy (other than certain transfers involving non-U.S. equity securities as described in Note 1) did not represent, in the aggregate, more than 1% of the fund’s net assets measured as of the end of the period.
The accompanying notes are an integral part of these financial statements.
Multi-Cap Value Fund 27
Statement of assets and liabilities 10/31/14 (Unaudited)
ASSETS
Investment in securities, at value, including $7,735,645 of securities on loan (Note 1):
Affiliated issuers (identified cost $29,186,939) (Notes 1 and 5)
29,186,939
Dividends, interest and other receivables
248,833
Receivable for shares of the fund sold
1,129,330
Receivable for investments sold
672,484
Prepaid assets
27,101
Total assets
423,471,394
LIABILITIES
Payable for investments purchased
7,662,208
Payable for shares of the fund repurchased
214,628
Payable for compensation of Manager (Note 2)
180,826
Payable for custodian fees (Note 2)
4,737
Payable for investor servicing fees (Note 2)
116,088
Payable for Trustee compensation and expenses (Note 2)
136,324
Payable for administrative services (Note 2)
1,111
Payable for distribution fees (Note 2)
99,200
Collateral on securities loaned, at value (Note 1)
7,774,986
Other accrued expenses
64,476
Total liabilities
16,254,584
Net assets
$407,216,810
REPRESENTED BY
Paid-in capital (Unlimited shares authorized) (Notes 1 and 4)
$299,732,758
Undistributed net investment income (Note 1)
2,305,248
Accumulated net realized gain on investments
31,579,704
Net unrealized appreciation of investments
73,599,100
Total — Representing net assets applicable to capital shares outstanding
$407,216,810
COMPUTATION OF NET ASSET VALUE AND OFFERING PRICE
Net asset value and redemption price per class A share ($332,229,890 divided by 16,400,617 shares)
$20.26
Offering price per class A share (100/94.25 of $20.26)*
$21.50
Net asset value and offering price per class B share ($8,234,168 divided by 434,715 shares)**
$18.94
Net asset value and offering price per class C share ($21,567,099 divided by 1,142,432 shares)**
$18.88
Net asset value and redemption price per class M share ($4,286,768 divided by 220,405 shares)
$19.45
Offering price per class M share (100/96.50 of $19.45)*
$20.16
Net asset value, offering price and redemption price per class R share ($13,470,014 divided by 678,776 shares)
$19.84
Net asset value, offering price and redemption price per class Y share ($27,428,871 divided by 1,350,689 shares)
$20.31
*
On single retail sales of less than $50,000. On sales of $50,000 or more the offering price is reduced.
**
Redemption price per share is equal to net asset value less any applicable contingent deferred sales charge.
The accompanying notes are an integral part of these financial statements.
28 Multi-Cap Value Fund
Statement of operations Six months ended 10/31/14 (Unaudited)
INVESTMENT INCOME
Dividends (net of foreign tax of $32,479)
$3,217,339
Interest (including interest income of $5,704 from investments in affiliated issuers) (Note 5)
5,704
Securities lending (Note 1)
18,069
Total investment income
3,241,112
EXPENSES
Compensation of Manager (Note 2)
1,122,107
Investor servicing fees (Note 2)
417,163
Custodian fees (Note 2)
7,276
Trustee compensation and expenses (Note 2)
9,025
Distribution fees (Note 2)
615,766
Administrative services (Note 2)
3,815
Other
116,967
Total expenses
2,292,119
Expense reduction (Note 2)
(22,721)
Net expenses
2,269,398
Net investment income
971,714
Net realized gain on investments (Notes 1 and 3)
21,461,056
Net realized gain on foreign currency transactions (Note 1)
1,089
Net realized gain on written options (Notes 1 and 3)
652,966
Net unrealized depreciation of investments during the period
(7,275,664)
Net gain on investments
14,839,447
Net increase in net assets resulting from operations
$15,811,161
The accompanying notes are an integral part of these financial statements.
Multi-Cap Value Fund 29
Statement of changes in net assets
INCREASE IN NET ASSETS
Six months ended 10/31/14*
Year ended 4/30/14
Operations:
Net investment income
$971,714
$2,967,660
Net realized gain on investments
22,115,111
46,304,977
Net unrealized appreciation (depreciation) of investments
(7,275,664)
37,799,610
Net increase in net assets resulting from operations
15,811,161
87,072,247
Distributions to shareholders (Note 1):
From ordinary income
Net investment income
Class A
—
(1,728,570)
Class M
—
(5,371)
Class R
—
(40,218)
Class Y
—
(164,504)
Increase (decrease) from capital share transactions (Note 4)
(8,811,138)
2,277,796
Total increase in net assets
7,000,023
87,411,380
NET ASSETS
Beginning of period
400,216,787
312,805,407
End of period (including undistributed net investment income of $2,305,248 and $1,333,534, respectively)
$407,216,810
$400,216,787
*
Unaudited.
The accompanying notes are an integral part of these financial statements.
30 Multi-Cap Value Fund
This page left blank intentionally.
Multi-Cap Value Fund 31
Financial highlights (For a common share outstanding throughout the period)
INVESTMENT OPERATIONS:
LESS DISTRIBUTIONS:
RATIOS AND SUPPLEMENTAL DATA:
Period ended
Net asset value, beginning of period
Net investment income (loss)a
Net realized and unrealized gain (loss) on investments
Total from investment operations
From net investment income
Total distributions
Redemption fees
Non-recurring reimbursements
Net asset value, end of period
Total return at net asset value (%)b
Net assets, end of period (in thousands)
Ratio of expenses to average net assets (%)c
Ratio of net investment income (loss) to average net assets (%)
Portfolio turnover (%)
Class A
October 31, 2014**
$19.47
.05
.74
.79
—
—
—
—
$20.26
4.06*
$332,230
.54*
.27*
42*
April 30, 2014
15.27
.16
4.14
4.30
(.10)
(.10)
—
—
19.47
28.21
327,158
1.11
.88
77
April 30, 2013
13.26
.14
2.08
2.22
(.21)
(.21)
—
—
15.27
16.98
259,910
1.15
1.04
81
April 30, 2012
13.49
.04
(.22)
(.18)
(.05)
(.05)
—
—e
13.26
(1.28)
418,178
1.17
.32
82
April 30, 2011
11.66
.01
1.82
1.83
—d
—d
—d
—
13.49
15.71
477,121
1.18
.06
98
April 30, 2010
7.61
.01
4.05
4.06
(.01)
(.01)
—d
—f
11.66
53.44
494,841
1.30g
.09g
98
Class B
October 31, 2014**
$18.27
(.02)
.69
.67
—
—
—
—
$18.94
3.67*
$8,234
.92*
(.11) *
42*
April 30, 2014
14.36
.02
3.89
3.91
—
—
—
—
18.27
27.23
8,681
1.86
.13
77
April 30, 2013
12.48
.04
1.95
1.99
(.11)
(.11)
—
—
14.36
16.10
9,179
1.90
.34
81
April 30, 2012
12.74
(.05)
(.21)
(.26)
—
—
—
—e
12.48
(2.04)
11,422
1.92
(.45)
82
April 30, 2011
11.09
(.08)
1.73
1.65
—
—
—d
—
12.74
14.88
16,283
1.93
(.69)
98
April 30, 2010
7.28
(.06)
3.87
3.81
—
—
—d
—f
11.09
52.34
18,509
2.05g
(.67)g
98
Class C
October 31, 2014**
$18.21
(.02)
.69
.67
—
—
—
—
$18.88
3.68*
$21,567
.92*
(.11) *
42*
April 30, 2014
14.31
.02
3.88
3.90
—
—
—
—
18.21
27.25
21,011
1.86
.13
77
April 30, 2013
12.46
.05
1.94
1.99
(.14)
(.14)
—
—
14.31
16.12
15,532
1.90
.37
81
April 30, 2012
12.72
(.05)
(.21)
(.26)
—
—
—
—e
12.46
(2.04)
14,876
1.92
(.44)
82
April 30, 2011
11.07
(.08)
1.73
1.65
—
—
—d
—
12.72
14.91
18,569
1.93
(.70)
98
April 30, 2010
7.27
(.06)
3.86
3.80
—
—
—d
—f
11.07
52.27
16,894
2.05g
(.67)g
98
Class M
October 31, 2014**
$18.74
—d
.71
.71
—
—
—
—
$19.45
3.79*
$4,287
.79*
.02*
42*
April 30, 2014
14.71
.06
3.99
4.05
(.02)
(.02)
—
—
18.74
27.56
4,349
1.61
.38
77
April 30, 2013
12.80
.08
2.00
2.08
(.17)
(.17)
—
—
14.71
16.42
3,673
1.65
.62
81
April 30, 2012
13.04
(.02)
(.22)
(.24)
—
—
—
—e
12.80
(1.84)
3,750
1.67
(.19)
82
April 30, 2011
11.32
(.05)
1.77
1.72
—
—
—d
—
13.04
15.19
4,158
1.68
(.44)
98
April 30, 2010
7.41
(.04)
3.95
3.91
—
—
—d
—f
11.32
52.77
4,299
1.80g
(.43)g
98
Class R
October 31, 2014**
$19.10
.03
.71
.74
—
—
—
—
$19.84
3.87*
$13,470
.67*
.14*
42*
April 30, 2014
14.98
.11
4.08
4.19
(.07)
(.07)
—
—
19.10
27.97
12,301
1.36
.63
77
April 30, 2013
13.03
.11
2.04
2.15
(.20)
(.20)
—
—
14.98
16.69
8,787
1.40
.86
81
April 30, 2012
13.27
.01
(.23)
(.22)
(.02)
(.02)
—
—e
13.03
(1.62)
8,819
1.42
.07
82
April 30, 2011
11.49
(.02)
1.80
1.78
—
—
—d
—
13.27
15.49
10,832
1.43
(.20)
98
April 30, 2010
7.51
(.02)
4.00
3.98
—
—
—d
—f
11.49
53.00
9,265
1.55g
(.17)g
98
Class Y
October 31, 2014**
$19.49
.08
.74
.82
—
—
—
—
$20.31
4.21*
$27,429
.41*
.40*
42*
April 30, 2014
15.28
.20
4.15
4.35
(.14)
(.14)
—
—
19.49
28.54
26,716
.86
1.11
77
April 30, 2013
13.29
.18
2.08
2.26
(.27)
(.27)
—
—
15.28
17.28
15,724
.90
1.36
81
April 30, 2012
13.53
.07
(.22)
(.15)
(.09)
(.09)
—
—e
13.29
(1.08)
15,357
.92
.56
82
April 30, 2011
11.69
.04
1.83
1.87
(.03)
(.03)
—d
—
13.53
16.04
15,088
.93
.38
98
April 30, 2010
7.63
.03
4.07
4.10
(.04)
(.04)
—d
—f
11.69
53.79
51,132
1.05g
.33g
98
See notes to financial highlights at the end of this section.
The accompanying notes are an integral part of these financial statements.
32
Multi-Cap Value Fund
Multi-Cap Value Fund
33
Financial highlights (Continued)
*Not annualized.
**Unaudited.
a Per share net investment income (loss) has been determined on the basis of the weighted average number of shares outstanding during the period.
b Total return assumes dividend reinvestment and does not reflect the effect of sales charges.
c Includes amounts paid through expense offset and/or brokerage/service arrangements, if any (Note 2). Also excludes acquired fund fees and expenses, if any.
d Amount represents less than $0.01 per share.
e Reflects a non-recurring reimbursement related to restitution amounts in connection with a distribution plan approved by the Securities and Exchange Commission (the SEC) which amounted to less than $0.01 per share outstanding on July 21, 2011. Also reflects a non-recurring reimbursement related to short-term trading related lawsuits, which amounted to less than $0.01 per share outstanding on May 11, 2011.
f Reflects a non-recurring reimbursement pursuant to a settlement between the SEC and Prudential Securities, Inc., which amounted to less than $0.01 per share outstanding as of March 30, 2010.
g Reflects an involuntary contractual expense limitation in effect during the period. As a result of such limitation, the expenses of each class reflect a reduction of 0.02% of average net assets.
The accompanying notes are an integral part of these financial statements.
34 Multi-Cap Value Fund
Notes to financial statements 10/31/14 (Unaudited)
Within the following Notes to financial statements, references to “State Street” represent State Street Bank and Trust Company, references to “the SEC” represent the Securities and Exchange Commission, references to “Putnam Management” represent Putnam Investment Management, LLC, the fund’s manager, an indirect wholly-owned subsidiary of Putnam Investments, LLC and references to “OTC”, if any, represent over-the-counter. Unless otherwise noted, the “reporting period” represents the period from May 1, 2014 through October 31, 2014.
Putnam Multi-Cap Value Fund (the fund) is a diversified series of Putnam Investment Funds (the Trust), a Massachusetts business trust registered under the Investment Company Act of 1940, as amended, as an open-end management investment company. The goal of the fund is to seek capital appreciation and, as a secondary objective, current income. The fund invests mainly in common stocks of U.S. companies of any size, with a focus on value stocks. Value stocks are issued by companies that Putnam Management believes are currently undervalued by the market. If Putnam Management is correct and other investors ultimately recognize the value of the company, the price of its stock may rise. Putnam Management may consider, among other factors, a company’s valuation, financial strength, growth potential, competitive position in its industry, projected future earnings, cash flows and dividends when deciding whether to buy or sell investments.
The fund offers class A, class B, class C, class M, class R and class Y shares. Class A and class M shares are sold with a maximum front-end sales charge of 5.75% and 3.50%, respectively, and generally do not pay a contingent deferred sales charge. Class B shares, which convert to class A shares after approximately five years, do not pay a front-end sales charge and are subject to a contingent deferred sales charge if those shares are redeemed within five years of purchase. Class C shares have a one-year 1.00% contingent deferred sales charge and do not convert to class A shares. Class R shares, which are not available to all investors, are sold at net asset value. The expenses for class A, class B, class C, class M and class R shares may differ based on the distribution fee of each class, which is identified in Note 2. Class Y shares, which are sold at net asset value, are generally subject to the same expenses as class A, class B, class C, class M and class R shares, but do not bear a distribution fee. Class Y shares are not available to all investors.
In the normal course of business, the fund enters into contracts that may include agreements to indemnify another party under given circumstances. The fund’s maximum exposure under these arrangements is unknown as this would involve future claims that may be, but have not yet been, made against the fund. However, the fund’s management team expects the risk of material loss to be remote.
Note 1: Significant accounting policies
The following is a summary of significant accounting policies consistently followed by the fund in the preparation of its financial statements. The preparation of financial statements is in conformity with accounting principles generally accepted in the United States of America and requires management to make estimates and assumptions that affect the reported amounts of assets and liabilities in the financial statements and the reported amounts of increases and decreases in net assets from operations. Actual results could differ from those estimates. Subsequent events after the Statement of assets and liabilities date through the date that the financial statements were issued have been evaluated in the preparation of the financial statements.
Investment income, realized and unrealized gains and losses and expenses of the fund are borne pro-rata based on the relative net assets of each class to the total net assets of the fund, except that each class bears expenses unique to that class (including the distribution fees applicable to such classes). Each class votes as a class only with respect to its own distribution plan or other matters on which a class vote is required by law or determined by the Trustees. If the fund were liquidated, shares of each class would receive their pro-rata share of the net assets of the fund. In addition, the Trustees declare separate dividends on each class of shares.
Security valuation Investments for which market quotations are readily available are valued at the last reported sales price on their principal exchange, or official closing price for certain markets, and are classified as Level 1 securities under Accounting Standards Codification 820 Fair Value Measurements and Disclosures (ASC 820). If no sales are reported, as in the case of some securities that are traded OTC, a security is valued at its last reported bid price and is generally categorized as a Level 2 security.
Investments in open-end investment companies (excluding exchange traded funds), if any, which can be classified as Level 1 or Level 2 securities, are valued based on their net asset value. The net asset value of such investment companies equals the total value of their assets less their liabilities and divided by the number of their outstanding shares.
Multi-Cap Value Fund 35
Many securities markets and exchanges outside the U.S. close prior to the close of the New York Stock Exchange and therefore the closing prices for securities in such markets or on such exchanges may not fully reflect events that occur after such close but before the close of the New York Stock Exchange. Accordingly, on certain days, the fund will fair value foreign equity securities taking into account multiple factors including movements in the U.S. securities markets, currency valuations and comparisons to the valuation of American Depository Receipts, exchange-traded funds and futures contracts. These securities, which would generally be classified as Level 1 securities, will be transferred to Level 2 of the fair value hierarchy when they are valued at fair value. The number of days on which fair value prices will be used will depend on market activity and it is possible that fair value prices will be used by the fund to a significant extent. Securities quoted in foreign currencies, if any, are translated into U.S. dollars at the current exchange rate. Short-term securities with remaining maturities of 60 days or less may be valued at amortized cost, which approximates fair value and are classified as Level 2 securities.
To the extent a pricing service or dealer is unable to value a security or provides a valuation that Putnam Management does not believe accurately reflects the security’s fair value, the security will be valued at fair value by Putnam Management in accordance with policies and procedures approved by the Trustees. Certain investments, including certain restricted and illiquid securities and derivatives, are also valued at fair value following procedures approved by the Trustees. These valuations consider such factors as significant market or specific security events such as interest rate or credit quality changes, various relationships with other securities, discount rates, U.S. Treasury, U.S. swap and credit yields, index levels, convexity exposures and recovery rates. These securities are classified as Level 2 or as Level 3 depending on the priority of the significant inputs.
Such valuations and procedures are reviewed periodically by the Trustees. The fair value of securities is generally determined as the amount that the fund could reasonably expect to realize from an orderly disposition of such securities over a reasonable period of time. By its nature, a fair value price is a good faith estimate of the value of a security in a current sale and does not reflect an actual market price, which may be different by a material amount.
Security transactions and related investment income Security transactions are recorded on the trade date (the date the order to buy or sell is executed). Gains or losses on securities sold are determined on the identified cost basis.
Interest income, net of any applicable withholding taxes, is recorded on the accrual basis. Dividend income, net of any applicable withholding taxes, is recognized on the ex-dividend date except that certain dividends from foreign securities, if any, are recognized as soon as the fund is informed of the ex-dividend date. Non-cash dividends, if any, are recorded at the fair value of the securities received. Dividends representing a return of capital or capital gains, if any, are reflected as a reduction of cost and/or as a realized gain.
Options contracts The fund uses options contracts to manage downside risks.
The potential risk to the fund is that the change in value of options contracts may not correspond to the change in value of the hedged instruments. In addition, losses may arise from changes in the value of the underlying instruments if there is an illiquid secondary market for the contracts, if interest or exchange rates move unexpectedly or if the counterparty to the contract is unable to perform. Realized gains and losses on purchased options are included in realized gains and losses on investment securities. If a written call option is exercised, the premium originally received is recorded as an addition to sales proceeds. If a written put option is exercised, the premium originally received is recorded as a reduction to the cost of investments.
Exchange traded options are valued at the last sale price or, if no sales are reported, the last bid price for purchased options and the last ask price for written options. OTC traded options are valued using prices supplied by dealers.
Options on swaps are similar to options on securities except that the premium paid or received is to buy or grant the right to enter into a previously agreed upon interest rate or credit default contract. Forward premium swap option contracts include premiums that have extended settlement dates. The delayed settlement of the premiums is factored into the daily valuation of the option contracts. In the case of interest rate cap and floor contracts, in return for a premium, ongoing payments between two parties are based on interest rates exceeding a specified rate, in the case of a cap contract, or falling below a specified rate in the case of a floor contract.
Written option contracts outstanding at period end, if any, are listed after the fund’s portfolio.
Master agreements The fund is a party to ISDA (International Swaps and Derivatives Association, Inc.) Master Agreements (Master Agreements) with certain counterparties that govern OTC derivative and foreign exchange contracts entered into from time to time. The Master Agreements may contain provisions regarding, among other things, the parties’ general obligations, representations, agreements, collateral requirements, events of default and early termination. With respect to certain counterparties, in accordance with the terms of the Master Agreements,
36 Multi-Cap Value Fund
collateral posted to the fund is held in a segregated account by the fund’s custodian and with respect to those amounts which can be sold or repledged, is presented in the fund’s portfolio.
Collateral pledged by the fund is segregated by the fund’s custodian and identified in the fund’s portfolio. Collateral can be in the form of cash or debt securities issued by the U.S. Government or related agencies or other securities as agreed to by the fund and the applicable counterparty. Collateral requirements are determined based on the fund’s net position with each counterparty.
Termination events applicable to the fund may occur upon a decline in the fund’s net assets below a specified threshold over a certain period of time. Termination events applicable to counterparties may occur upon a decline in the counterparty’s long-term and short-term credit ratings below a specified level. In each case, upon occurrence, the other party may elect to terminate early and cause settlement of all derivative and foreign exchange contracts outstanding, including the payment of any losses and costs resulting from such early termination, as reasonably determined by the terminating party. Any decision by one or more of the fund’s counterparties to elect early termination could impact the fund’s future derivative activity.
At the close of the reporting period, the fund did not have a net liability position on open derivative contracts subject to the Master Agreements.
Securities lending The fund may lend securities, through its agent, to qualified borrowers in order to earn additional income. The loans are collateralized by cash in an amount at least equal to the fair value of the securities loaned. The fair value of securities loaned is determined daily and any additional required collateral is allocated to the fund on the next business day. The risk of borrower default will be borne by the fund’s agent; the fund will bear the risk of loss with respect to the investment of the cash collateral. Income from securities lending is included in investment income on the Statement of operations. Cash collateral is invested in Putnam Cash Collateral Pool, LLC, a limited liability company managed by an affiliate of Putnam Management. Investments in Putnam Cash Collateral Pool, LLC are valued at its closing net asset value each business day. There are no management fees charged to Putnam Cash Collateral Pool, LLC. At the close of the reporting period, the fund received cash collateral of $7,774,986 and the value of securities loaned amounted to $7,735,645.
Interfund lending The fund, along with other Putnam funds, may participate in an interfund lending program pursuant to an exemptive order issued by the SEC. This program allows the fund to borrow from or lend to other Putnam funds that permit such transactions. Interfund lending transactions are subject to each fund’s investment policies and borrowing and lending limits. Interest earned or paid on the interfund lending transaction will be based on the average of certain current market rates. During the reporting period, the fund did not utilize the program.
Lines of credit The fund participates, along with other Putnam funds, in a $392.5 million unsecured committed line of credit and a $235.5 million unsecured uncommitted line of credit, both provided by State Street. Borrowings may be made for temporary or emergency purposes, including the funding of shareholder redemption requests and trade settlements. Interest is charged to the fund based on the fund’s borrowing at a rate equal to the Federal Funds rate plus 1.25% for the committed line of credit and the Federal Funds rate plus 1.30% for the uncommitted line of credit. A closing fee equal to 0.04% of the committed line of credit and 0.04% of the uncommitted line of credit has been paid by the participating funds. In addition, a commitment fee of 0.11% per annum on any unutilized portion of the committed line of credit is allocated to the participating funds based on their relative net assets and paid quarterly. During the reporting period, the fund had no borrowings against these arrangements.
Federal taxes It is the policy of the fund to distribute all of its taxable income within the prescribed time period and otherwise comply with the provisions of the Internal Revenue Code of 1986, as amended (the Code), applicable to regulated investment companies. It is also the intention of the fund to distribute an amount sufficient to avoid imposition of any excise tax under Section 4982 of the Code.
The fund is subject to the provisions of Accounting Standards Codification 740 Income Taxes (ASC 740). ASC 740 sets forth a minimum threshold for financial statement recognition of the benefit of a tax position taken or expected to be taken in a tax return. The fund did not have a liability to record for any unrecognized tax benefits in the accompanying financial statements. No provision has been made for federal taxes on income, capital gains or unrealized appreciation on securities held nor for excise tax on income and capital gains. Each of the fund’s federal tax returns for the prior three fiscal years remains subject to examination by the Internal Revenue Service.
The aggregate identified cost on a tax basis is $347,611,460, resulting in gross unrealized appreciation and depreciation of $81,264,725 and $7,482,539, respectively, or net unrealized appreciation of $73,782,186.
Distributions to shareholders Distributions to shareholders from net investment income are recorded by the fund on the ex-dividend date. Distributions from capital gains, if any, are recorded on the ex-dividend date and paid at
Multi-Cap Value Fund 37
least annually. The amount and character of income and gains to be distributed are determined in accordance with income tax regulations, which may differ from generally accepted accounting principles. Dividend sources are estimated at the time of declaration. Actual results may vary. Any non-taxable return of capital cannot be determined until final tax calculations are completed after the end of the fund’s fiscal year. Reclassifications are made to the fund’s capital accounts to reflect income and gains available for distribution (or available capital loss carryovers) under income tax regulations.
Expenses of the Trust Expenses directly charged or attributable to any fund will be paid from the assets of that fund. Generally, expenses of the Trust will be allocated among and charged to the assets of each fund on a basis that the Trustees deem fair and equitable, which may be based on the relative assets of each fund or the nature of the services performed and relative applicability to each fund.
Note 2: Management fee, administrative services and other transactions
The fund pays Putnam Management a management fee (based on the fund’s average net assets and computed and paid monthly) at annual rates that may vary based on the average of the aggregate net assets of most open-end funds, as defined in the fund’s management contract, sponsored by Putnam Management. Such annual rates may vary as follows:
0.710%
of the first $5 billion,
0.660%
of the next $5 billion,
0.610%
of the next $10 billion,
0.560%
of the next $10 billion,
0.510%
of the next $50 billion,
0.490%
of the next $50 billion,
0.480%
of the next $100 billion and
0.475%
of any excess thereafter.
Putnam Management has contractually agreed, through June 30, 2015, to waive fees or reimburse the fund’s expenses to the extent necessary to limit the cumulative expenses of the fund, exclusive of brokerage, interest, taxes, investment-related expenses, extraordinary expenses, acquired fund fees and expenses and payments under the fund’s investor servicing contract, investment management contract and distribution plans, on a fiscal year-to-date basis to an annual rate of 0.20% of the fund’s average net assets over such fiscal year-to-date period. During the reporting period, the fund’s expenses were not reduced as a result of this limit.
Putnam Investments Limited (PIL), an affiliate of Putnam Management, is authorized by the Trustees to manage a separate portion of the assets of the fund as determined by Putnam Management from time to time. Putnam Management pays a quarterly sub-management fee to PIL for its services at an annual rate of 0.35% of the average net assets of the portion of the fund managed by PIL.
The fund reimburses Putnam Management an allocated amount for the compensation and related expenses of certain officers of the fund and their staff who provide administrative services to the fund. The aggregate amount of all such reimbursements is determined annually by the Trustees.
Custodial functions for the fund’s assets are provided by State Street. Custody fees are based on the fund’s asset level, the number of its security holdings and transaction volumes.
Putnam Investor Services, Inc., an affiliate of Putnam Management, provides investor servicing agent functions to the fund. Putnam Investor Services, Inc. received fees for investor servicing based on the fund’s retail asset level, the number of shareholder accounts in the fund and the level of defined contribution plan assets in the fund. Investor servicing fees will not exceed an annual rate of 0.32% of the fund’s average net assets. During the reporting period, the expenses for each class of shares related to investor servicing fees were as follows:
Class A
$339,884
Class B
8,662
Class C
22,212
Class M
4,440
Class R
13,235
Class Y
28,730
Total
$417,163
The fund has entered into expense offset arrangements with Putnam Investor Services, Inc. and State Street whereby Putnam Investor Services, Inc.’s and State Street’s fees are reduced by credits allowed on cash balances. The fund also reduced expenses through brokerage/service arrangements. For the reporting period, the fund’s expenses were reduced by $331 under the expense offset arrangements and by $22,390 under the brokerage/service arrangements.
38 Multi-Cap Value Fund
Each Independent Trustee of the fund receives an annual Trustee fee, of which $229, as a quarterly retainer, has been allocated to the fund, and an additional fee for each Trustees meeting attended. Trustees also are reimbursed for expenses they incur relating to their services as Trustees.
The fund has adopted a Trustee Fee Deferral Plan (the Deferral Plan) which allows the Trustees to defer the receipt of all or a portion of Trustees fees payable on or after July 1, 1995. The deferred fees remain invested in certain Putnam funds until distribution in accordance with the Deferral Plan.
The fund has adopted an unfunded noncontributory defined benefit pension plan (the Pension Plan) covering all Trustees of the fund who have served as a Trustee for at least five years and were first elected prior to 2004. Benefits under the Pension Plan are equal to 50% of the Trustee’s average annual attendance and retainer fees for the three years ended December 31, 2005. The retirement benefit is payable during a Trustee’s lifetime, beginning the year following retirement, for the number of years of service through December 31, 2006. Pension expense for the fund is included in Trustee compensation and expenses in the Statement of operations. Accrued pension liability is included in Payable for Trustee compensation and expenses in the Statement of assets and liabilities. The Trustees have terminated the Pension Plan with respect to any Trustee first elected after 2003.
The fund has adopted distribution plans (the Plans) with respect to its class A, class B, class C, class M and class R shares pursuant to Rule 12b–1 under the Investment Company Act of 1940. The purpose of the Plans is to compensate Putnam Retail Management Limited Partnership, an indirect wholly-owned subsidiary of Putnam Investments, LLC, for services provided and expenses incurred in distributing shares of the fund. The Plans provide for payments by the fund to Putnam Retail Management Limited Partnership at an annual rate of up to 0.35%, 1.00%, 1.00%, 1.00% and 1.00% of the average net assets attributable to class A, class B, class C, class M and class R shares, respectively. The Trustees have approved payment by the fund at an annual rate of 0.25%, 1.00%, 1.00%, 0.75% and 0.50% of the average net assets attributable to class A, class B, class C, class M and class R shares, respectively. During the reporting period, the class specific expenses related to distribution fees were as follows:
Class A
$415,966
Class B
42,411
Class C
108,697
Class M
16,300
Class R
32,392
Total
$615,766
For the reporting period, Putnam Retail Management Limited Partnership, acting as underwriter, received net commissions of $60,779 and $411 from the sale of class A and class M shares, respectively, and received $6,937 and $354 in contingent deferred sales charges from redemptions of class B and class C shares, respectively.
A deferred sales charge of up to 1.00% and 0.65% is assessed on certain redemptions of class A and class M shares, respectively. For the reporting period, Putnam Retail Management Limited Partnership, acting as underwriter, received $3 and no monies on class A and class M redemptions, respectively.
Note 3: Purchases and sales of securities
During the reporting period, cost of purchases and proceeds from sales, excluding short-term investments were as follows:
Cost of purchases
Proceeds from sales
Investments in securities (Long-term)
$162,146,986
$172,312,796
U.S. government securities (Long-term)
—
—
Total
$162,146,986
$172,312,796
Multi-Cap Value Fund 39
Written option transactions during the reporting period are summarized as follows:
Written option contract amounts
Written option premiums
Written options outstanding at the beginning of the reporting period
$—
$—
Options opened
1,070,436
652,966
Options exercised
—
—
Options expired
(1,070,436)
(652,966)
Options closed
—
—
Written options outstanding at the end of the reporting period
$—
$—
Note 4: Capital shares
At the close of the reporting period, there was an unlimited number of shares of beneficial interest authorized. Transactions in capital shares were as follows:
Six months ended 10/31/14
Year ended 4/30/14
Class A
Shares
Amount
Shares
Amount
Shares sold
847,235
$16,767,784
1,940,303
$34,755,400
Shares issued in connection with reinvestment of distributions
—
—
90,211
1,670,704
847,235
16,767,784
2,030,514
36,426,104
Shares repurchased
(1,251,249)
(24,770,503)
(2,249,243)
(39,771,881)
Net decrease
(404,014)
$(8,002,719)
(218,729)
$(3,345,777)
Six months ended 10/31/14
Year ended 4/30/14
Class B
Shares
Amount
Shares
Amount
Shares sold
36,896
$684,858
92,100
$1,560,632
Shares issued in connection with reinvestment of distributions
—
—
—
���
36,896
684,858
92,100
1,560,632
Shares repurchased
(77,274)
(1,431,362)
(256,214)
(4,271,831)
Net decrease
(40,378)
$(746,504)
(164,114)
$(2,711,199)
Six months ended 10/31/14
Year ended 4/30/14
Class C
Shares
Amount
Shares
Amount
Shares sold
110,165
$2,031,061
211,280
$3,580,144
Shares issued in connection with reinvestment of distributions
—
—
—
—
110,165
2,031,061
211,280
3,580,144
Shares repurchased
(121,474)
(2,246,589)
(142,883)
(2,387,601)
Net increase (decrease)
(11,309)
$(215,528)
68,397
$1,192,543
40 Multi-Cap Value Fund
Six months ended 10/31/14
Year ended 4/30/14
Class M
Shares
Amount
Shares
Amount
Shares sold
4,983
$93,719
19,134
$341,988
Shares issued in connection with reinvestment of distributions
—
—
297
5,311
4,983
93,719
19,431
347,299
Shares repurchased
(16,649)
(318,937)
(37,103)
(624,384)
Net decrease
(11,666)
$(225,218)
(17,672)
$(277,085)
Six months ended 10/31/14
Year ended 4/30/14
Class R
Shares
Amount
Shares
Amount
Shares sold
129,753
$2,515,346
205,961
$3,620,951
Shares issued in connection with reinvestment of distributions
—
—
2,151
39,109
129,753
2,515,346
208,112
3,660,060
Shares repurchased
(95,143)
(1,848,867)
(150,370)
(2,617,586)
Net increase
34,610
$666,479
57,742
$1,042,474
Six months ended 10/31/14
Year ended 4/30/14
Class Y
Shares
Amount
Shares
Amount
Shares sold
391,981
$7,840,970
613,860
$11,337,202
Shares issued in connection with reinvestment of distributions
—
—
8,024
148,601
391,981
7,840,970
621,884
11,485,803
Shares repurchased
(411,964)
(8,128,618)
(280,255)
(5,108,963)
Net increase (decrease)
(19,983)
$(287,648)
341,629
$6,376,840
Note 5: Affiliated transactions
Transactions during the reporting period with Putnam Short Term Investment Fund, which is under common ownership and control, were as follows:
Name of affiliate
Fair value at the beginning of the reporting period
Purchase cost
Sale proceeds
Investment income
Fair value at the end of the reporting period
Putnam Short Term Investment Fund*
$12,326,395
$75,529,455
$66,443,897
$5,704
$21,411,953
*Management fees charged to Putnam Short Term Investment Fund have been waived by Putnam Management.
Note 6: Market, credit and other risks
In the normal course of business, the fund trades financial instruments and enters into financial transactions where risk of potential loss exists due to changes in the market (market risk) or failure of the contracting party to the transaction to perform (credit risk). The fund may be exposed to additional credit risk that an institution or other entity with which the fund has unsettled or open transactions will default. Investments in foreign securities involve certain risks, including those related to economic instability, unfavorable political developments, and currency fluctuations.
Multi-Cap Value Fund 41
Note 7: Summary of derivative activity
The volume of activity for the reporting period for any derivative type that was held during the period is listed below and was as follows based on an average of the holdings at the end of each fiscal quarter:
Written equity option contracts (contract amount) (Note 3)
$460,000
As of the close of the reporting period, the fund did not hold any derivative instruments.
The following is a summary of realized gains or losses of derivative instruments on the Statement of operations for the reporting period (see Note 1) (there were no unrealized gains or losses on derivative instruments):
Amount of realized gain or (loss) on derivatives recognized in net gain or (loss) on investments
Derivatives not accounted for as hedging instruments under ASC 815
Options
Total
Equity contracts
$(203,383)
$(203,383)
Total
$(203,383)
$(203,383)
42 Multi-Cap Value Fund
Putnam family of funds
The following is a list of Putnam’s open-end mutual funds offered to the public. Investors should carefully consider the investment objective, risks, charges, and expenses of a fund before investing. For a prospectus, or a summary prospectus if available, containing this and other information for any Putnam fund or product, contact your financial advisor or call Putnam Investor Services at 1-800-225-1581. Please read the prospectus carefully before investing.
Growth
Growth Opportunities Fund
International Growth Fund
Multi-Cap Growth Fund
Small Cap Growth Fund
Voyager Fund
Blend
Asia Pacific Equity Fund
Capital Opportunities Fund
Capital Spectrum Fund
Emerging Markets Equity Fund
Equity Spectrum Fund
Europe Equity Fund
Global Equity Fund
International Capital Opportunities Fund
International Equity Fund
Investors Fund
Low Volatility Equity Fund
Multi-Cap Core Fund
Research Fund
Strategic Volatility Equity Fund
Value
Convertible Securities Fund
Equity Income Fund
Global Dividend Fund
The Putnam Fund for Growth and Income
International Value Fund
Multi-Cap Value Fund
Small Cap Value Fund
Income
American Government Income Fund
Diversified Income Trust
Emerging Markets Income Fund
Floating Rate Income Fund
Global Income Trust
High Yield Advantage Fund
High Yield Trust
Income Fund
Money Market Fund*
Short Duration Income Fund
U.S. Government Income Trust
Tax-free Income
AMT-Free Municipal Fund
Intermediate-Term Municipal Income Fund
Short-Term Municipal Income Fund
Tax Exempt Income Fund
Tax Exempt Money Market Fund*
Tax-Free High Yield Fund
State tax-free income funds†:
Arizona, California, Massachusetts, Michigan, Minnesota, New Jersey, New York, Ohio, and Pennsylvania.
* An investment in a money market fund is not insured or guaranteed by the Federal Deposit Insurance Corporation or any other government agency. Although the fund seeks to preserve the value of your investment at $1.00 per share, it is possible to lose money by investing in the fund.
†Not available in all states.
Multi-Cap Value Fund 43
Absolute Return
Absolute Return 100 Fund®
Absolute Return 300 Fund®
Absolute Return 500 Fund®
Absolute Return 700 Fund®
Global Sector
Global Consumer Fund
Global Energy Fund
Global Financials Fund
Global Health Care Fund
Global Industrials Fund
Global Natural Resources Fund
Global Sector Fund
Global Technology Fund
Global Telecommunications Fund
Global Utilities Fund
Asset Allocation
George Putnam Balanced Fund
Global Asset Allocation Funds — four investment portfolios that spread your money across a variety of stocks, bonds, and money market instruments.
Dynamic Asset Allocation Balanced Fund
Dynamic Asset Allocation Conservative Fund
Dynamic Asset Allocation Growth Fund
Dynamic Risk Allocation Fund
Retirement Income Lifestyle Funds — portfolios with managed allocations to stocks, bonds, and money market investments to generate retirement income.
Retirement Income Fund Lifestyle 1
Retirement Income Fund Lifestyle 2
Retirement Income Fund Lifestyle 3
RetirementReady® Funds — portfolios with adjusting allocations to stocks, bonds, and money market instruments, becoming more conservative over time.
RetirementReady® 2055 Fund
RetirementReady® 2050 Fund
RetirementReady® 2045 Fund
RetirementReady® 2040 Fund
RetirementReady® 2035 Fund
RetirementReady® 2030 Fund
RetirementReady® 2025 Fund
RetirementReady® 2020 Fund
RetirementReady® 2015 Fund
Check your account balances and the most recent month-end performance in the Individual Investors section at putnam.com.
44 Multi-Cap Value Fund
Fund information
Founded over 75 years ago, Putnam Investments was built around the concept that a balance between risk and reward is the hallmark of a well-rounded financial program. We manage over 100 funds across income, value, blend, growth, asset allocation, absolute return, and global sector categories.
Investment Manager
Putnam Investment Management, LLC One Post Office Square Boston, MA 02109
Investment Sub-Manager
Putnam Investments Limited 57–59 St James’s Street London, England SW1A 1LD
Marketing Services
Putnam Retail Management One Post Office Square Boston, MA 02109
Custodian
State Street Bank and Trust Company
Legal Counsel
Ropes & Gray LLP
Trustees
Jameson A. Baxter, Chair Liaquat Ahamed Ravi Akhoury Barbara M. Baumann Charles B. Curtis Robert J. Darretta Katinka Domotorffy John A. Hill Paul L. Joskow Kenneth R. Leibler Robert E. Patterson George Putnam, III Robert L. Reynolds W. Thomas Stephens
Officers
Robert L. Reynolds President
Jonathan S. Horwitz Executive Vice President, Principal Executive Officer, and Compliance Liaison
Steven D. Krichmar Vice President and Principal Financial Officer
Robert T. Burns Vice President and Chief Legal Officer
Robert R. Leveille Vice President and Chief Compliance Officer
Michael J. Higgins Vice President, Treasurer, and Clerk
Janet C. Smith Vice President, Principal Accounting Officer, and Assistant Treasurer
Susan G. Malloy Vice President and Assistant Treasurer
James P. Pappas Vice President
Mark C. Trenchard Vice President and BSA Compliance Officer
Nancy E. Florek Vice President, Director of Proxy Voting and Corporate Governance, Assistant Clerk, and Associate Treasurer
This report is for the information of shareholders of Putnam Multi-Cap Value Fund. It may also be used as sales literature when preceded or accompanied by the current prospectus, the most recent copy of Putnam’s Quarterly Performance Summary, and Putnam’s Quarterly Ranking Summary. For more recent performance, please visit putnam.com. Investors should carefully consider the investment objectives, risks, charges, and expenses of a fund, which are described in its prospectus. For this and other information or to request a prospectus or summary prospectus, call 1-800-225-1581 toll free. Please read the prospectus carefully before investing. The fund’s Statement of Additional Information contains additional information about the fund’s Trustees and is available without charge upon request by calling 1-800-225-1581.
Item 2. Code of Ethics:
Not applicable
Item 3. Audit Committee Financial Expert:
Not applicable
Item 4. Principal Accountant Fees and Services:
Not applicable
Item 5. Audit Committee of Listed Registrants
Not applicable
Item 6. Schedule of Investments:
The registrant’s schedule of investments in unaffiliated issuers is included in the report to shareholders in Item 1 above.
Item 7. Disclosure of Proxy Voting Policies and Procedures For Closed-End Management Investment Companies:
Not applicable
Item 8. Portfolio Managers of Closed-End Investment Companies
Not Applicable
Item 9. Purchases of Equity Securities by Closed-End Management Investment Companies and Affiliated Purchasers:
Not applicable
Item 10. Submission of Matters to a Vote of Security Holders:
Not applicable
Item 11. Controls and Procedures:
(a) The registrant’s principal executive officer and principal financial officer have concluded, based on their evaluation of the effectiveness of the design and operation of the registrant’s disclosure controls and procedures as of a date within 90 days of the filing date of this report, that the design and operation of such procedures are generally effective to provide reasonable assurance that information required to be disclosed by the registrant in this report is recorded, processed, summarized and reported within the time periods specified in the Commission’s rules and forms.
(b) Changes in internal control over financial reporting: Not applicable
Item 12. Exhibits:
(a)(1) Not applicable
(a)(2) Separate certifications for the principal executive officer and principal financial officer of the registrant as required by Rule 30a-2(a) under the Investment Company Act of 1940, as amended, are filed herewith.
(b) The certifications required by Rule 30a-2(b) under the Investment Company Act of 1940, as amended, are filed herewith.
Putnam Investment Funds
By (Signature and Title):
/s/ Janet C. Smith Janet C. Smith Principal Accounting Officer
Date: December 29, 2014
Pursuant to the requirements of the Securities Exchange Act of 1934 and the Investment Company Act of 1940, this report has been signed below by the following persons on behalf of the registrant and in the capacities and on the dates indicated.
By (Signature and Title):
/s/ Jonathan S. Horwitz Jonathan S. Horwitz Principal Executive Officer
Date: December 29, 2014
By (Signature and Title):
/s/ Steven D. Krichmar Steven D. Krichmar Principal Financial Officer
Date: December 29, 2014
We use cookies on this site to provide a more responsive and personalized service. Continuing to browse, clicking I Agree, or closing this banner indicates agreement. See our Cookie Policy for more information.