CERTIFIED SHAREHOLDER REPORT OF REGISTERED MANAGEMENT INVESTMENT COMPANIES
Investment Company Act file number:
(811-07237)
Exact name of registrant as specified in charter:
Putnam Investment Funds
Address of principal executive offices:
One Post Office Square, Boston, Massachusetts 02109
Name and address of agent for service:
Robert T. Burns, Vice President One Post Office Square Boston, Massachusetts 02109
Copy to:
Bryan Chegwidden, Esq. Ropes & Gray LLP 1211 Avenue of the Americas New York, New York 10036
Registrant’s telephone number, including area code:
(617) 292-1000
Date of fiscal year end:
July 31, 2015
Date of reporting period:
August 1, 2014 – January 31, 2015
Item 1. Report to Stockholders:
The following is a copy of the report transmitted to stockholders pursuant to Rule 30e-1 under the Investment Company Act of 1940:
Putnam Research Fund
Semiannual report 1 | 31 | 15
Message from the Trustees
1
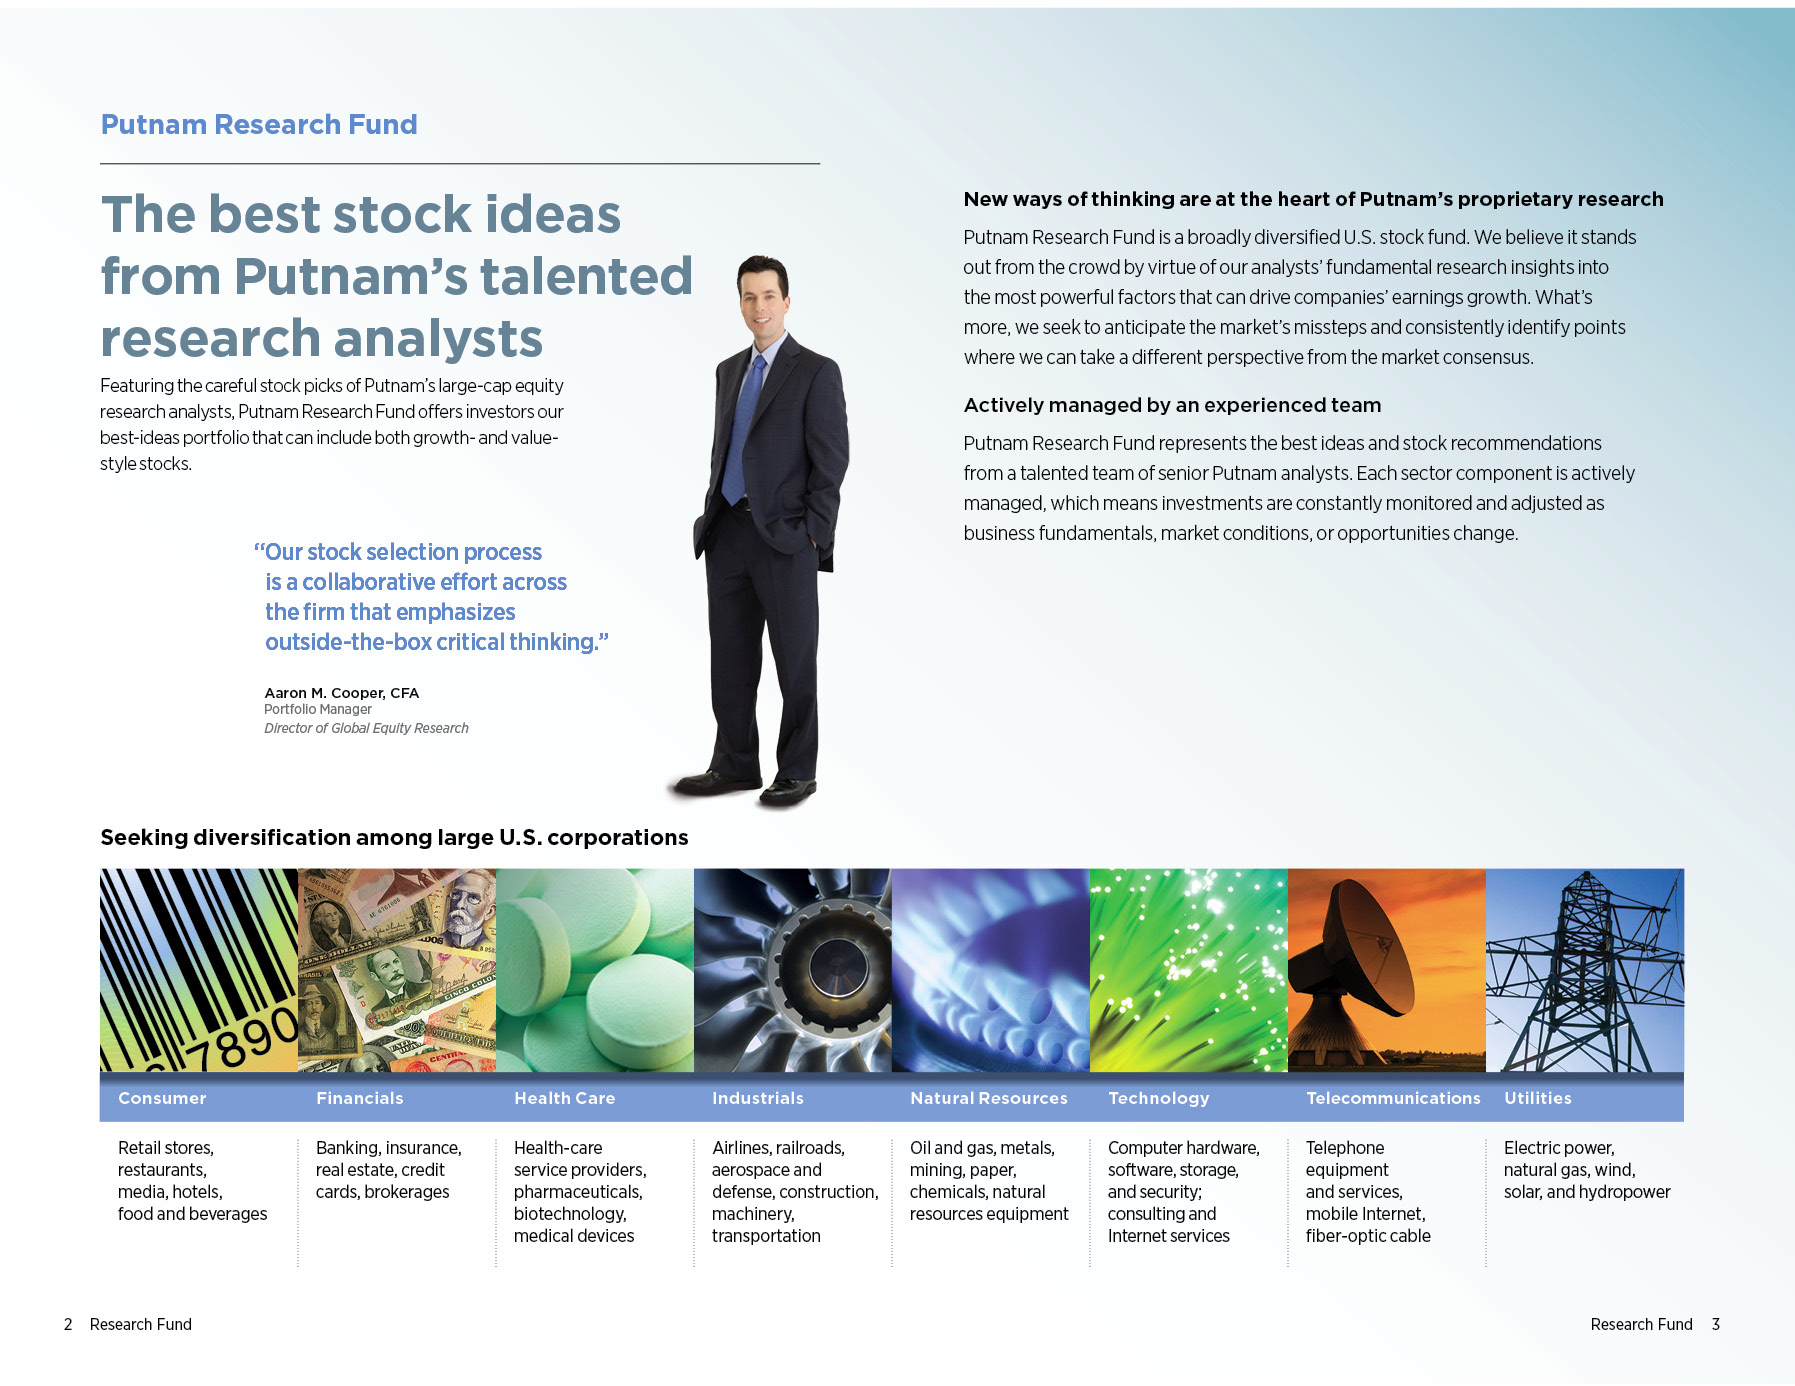
About the fund
2
Performance snapshot
4
Interview with your fund’s portfolio manager
5
Your fund’s performance
10
Your fund’s expenses
12
Terms and definitions
14
Other information for shareholders
15
Financial statements
16
Consider these risks before investing: Growth stocks may be more susceptible to earnings disappointments, and value stocks may fail to rebound. Stock prices may fall or fail to rise over time for several reasons, including general financial market conditions and factors related to a specific issuer or industry. You can lose money by investing in the fund.
Message from the Trustees
Dear Fellow Shareholder:
The U.S. economic recovery is gaining steam, with three consecutive quarters of positive GDP growth, accelerated hiring, and rising consumer confidence, which recently hit multi-year highs. U.S. markets, however, have experienced some turbulence since the start of the year.
Cheaper energy prices benefit consumers and many businesses, but the sharp decline in oil prices has also fostered uncertainty. A stronger U.S. dollar may hurt profits for many large multinational companies headquartered in the United States that rely on exports for growth. In addition, investors appear to be anticipating when the Federal Reserve will begin raising interest rates. Overseas growth, meanwhile, remains tepid at best.
In an economically uncertain environment, it can be worthwhile to consider a range of investment opportunities. Putnam invests across many asset classes and pursues flexible strategies that seek out opportunities for growth or income with careful awareness of risk. Our experienced equity and fixed-income teams employ new ways of thinking and integrate innovative investment ideas into time-tested, traditional strategies. In today’s environment, it is also important to rely on your financial advisor, who can ensure your portfolio matches your individual goals and tolerance for risk.
As always, thank you for investing with Putnam.
Respectfully yours,
Robert L. Reynolds President and Chief Executive Officer Putnam Investments
Jameson A. Baxter Chair, Board of Trustees
March 11, 2015
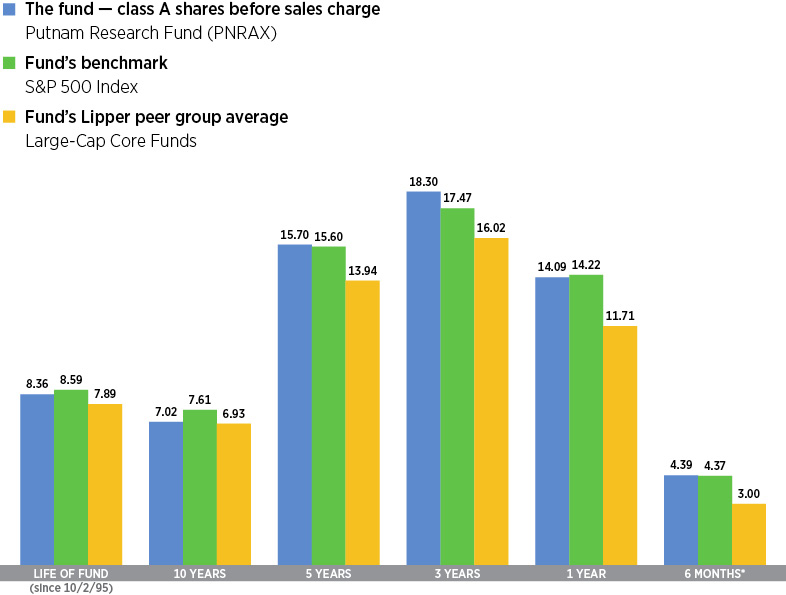
Performance snapshot
Annualized total return (%) comparison as of 1/31/15
Current performance may be lower or higher than the quoted past performance, which cannot guarantee future results. Share price, principal value, and return will fluctuate, and you may have a gain or a loss when you sell your shares. Performance of class A shares assumes reinvestment of distributions and does not account for taxes. Fund returns in the bar chart do not reflect a sales charge of 5.75%; had they, returns would have been lower. See pages 5 and 10–12 for additional performance information. For a portion of the periods, the fund had expense limitations, without which returns would have been lower. To obtain the most recent month-end performance, visit putnam.com.
*Returns for the six-month period are not annualized, but cumulative.
4 Research Fund
Interview with your fund’s portfolio manager
Aaron M. Cooper, CFA
How would you describe the U.S. stock market and economic environment during the six-month reporting period ended January 31, 2015, and how did Putnam Research Fund perform?
Despite some wild swings in performance in the last calendar quarter of 2014 and into January 2015, the U.S. stock market enjoyed a fairly positive economic backdrop for the six-month period. U.S. growth maintained its momentum from the first half of 2014, and the economy and markets continued to benefit from low interest rates and inflation.
By the end of the period, broad measures of U.S. stock performance registered mid-single-digit gains, and Putnam Research Fund performed in line with its benchmark, the S&P 500 Index. Overall, the fund recorded positive results in a variety of areas, including health-care, technology, industrials, and consumer-related stocks.
During the second half of 2014, the price of oil declined sharply. What implications does this have for the economy and the fund?
In the short term, we expected that markets would register no small amount of pain from oil priced below $50 per barrel — as they would from oil priced below $80. Longer term, it is possible that the pain may be dwarfed by the economic benefits of revitalized consumption: the “tax cut” of lower oil and fuel prices that feeds directly into the average consumer’s wallet.
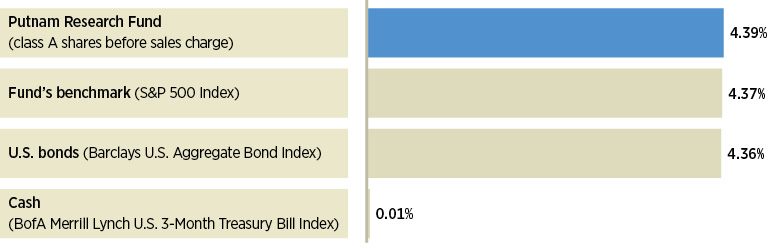
Broad market index and fund performance
This comparison shows your fund’s performance in the context of broad market indexes for the six months ended 1/31/15. See pages 4 and 10–12 for additional fund performance information. Index descriptions can be found on page 14.
Research Fund 5
Oil price weakness may also have important implications for a variety of energy services-related stocks, including stocks in the fund’s portfolio, as well as for natural resource companies that are positioned at the higher end of the cost curve. For companies with higher cost structures, a low and falling oil price can make it less economically feasible to invest in operations. Having said that, a variety of companies that performed poorly over the course of the oil price decline appear to us to have been unfairly punished by the market.
How strong was corporate earnings growth during the period, and how cheap or expensive did stocks appear to you toward the final months?
Earnings maintained a strong pace through much of the period, growing on average at a high-single-digit rate in the second half of 2014, which we considered a signal of continued corporate strength.
Stock valuations across most sectors appeared to us to reach fair levels toward the end of the period. Some of the factors that were tailwinds for profit margin expansion for much of the period seemed, in our view, likely to slow down somewhat in 2015. Wages, for example, look poised to grow in a number of sectors, which could have the effect of dampening margin expansion and making corporate earnings growth more reliant on revenue growth and global GDP growth.
Which stocks or strategies were especially positive for the fund during the period?
Avoiding some benchmark components that performed poorly, including large multinational oil and gas producers Chevron and ConocoPhillips, boosted the fund’s relative results.
The stock of Alibaba, the leading online retail company in China that is often likened to Amazon.com, also helped relative results.
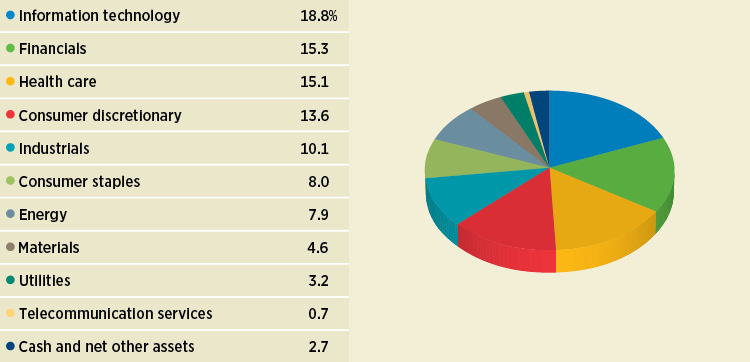
Sector allocations
Allocations are shown as a percentage of the fund’s net assets as of 1/31/15. Cash and net other assets, if any, represent the market value weights of cash, derivatives, short-term securities, and other unclassified assets in the portfolio. Summary information may differ from the portfolio schedule included in the financial statements due to the inclusion of derivative securities, any interest accruals, the exclusion of as-of trades, if any, and the use of different classifications of securities for presentation purposes. Holdings and allocations may vary over time.
6 Research Fund
“Avoiding some benchmark components that performed poorly boosted the fund’s relative results.”
Aaron Cooper
After Alibaba went public this past summer, we bought the stock, which is not part of the benchmark S&P 500 Index, and it performed well on the strength of what we consider to be the company’s high growth prospects, robust market position, and diverse set of business opportunities. This stock was the second-largest contributor to relative returns during the period, and we continued to hold the position at period-end.
We found another strong out-of-benchmark performer in Symrise, a Germany-based fragrances and flavors manufacturer. During the period, the company accelerated its profit growth — and beat analyst expectations for earnings results — by successfully acquiring and integrating France-based Diana Ingredients. In addition, the stock benefited from the market’s general expectation that the European Central Bank would launch a government bond-buying program early in 2015 — improving sentiment across many sectors — which the central bank subsequently announced at its January meeting. We continued to hold the stock of Symrise at the end of the period.
What was the impact of derivatives on the fund’s relative performance?
During the period, one strategy that stood out for its positive impact on performance involved our use of forward currency contracts. These contracts, which are agreements between two parties to buy and sell currencies at a set price on a future date, can be used to hedge against foreign currency weakness, which was pronounced during the period.
Top 10 holdings
This table shows the fund’s top 10 holdings by percentage of the fund’s net assets as of 1/31/15. Short-term holdings and derivatives, if any, are excluded. Holdings may vary over time.
Research Fund 7
Which stocks or strategies dampened the fund’s relative performance during the period?
Though we avoided the stocks of some energy companies, to the fund’s benefit during the period, we did own other energy stocks in the portfolio that hurt the fund’s relative performance. It is worth remembering that Putnam Research Fund generally takes a sector-neutral approach to investing in large-company stocks; in other words, it typically does not make bets on certain sectors outperforming or underperforming other sectors but maintains roughly index-equivalent exposures to all of the sectors represented in the S&P 500.
Accordingly, the fund’s exposures to a variety of energy companies, including — among others — EP Energy and QEP Resources, two oil exploration and production companies, and Halliburton, an oilfield services company, all detracted from relative returns. In some cases, we had established overweight positions in these stocks relative to the benchmark, as we believed they represented comparatively better energy-related investment opportunities, while in other cases, we had chosen stocks outside the benchmark based on our conviction in their potential to add value to the fund.
What is your outlook for the U.S. stock market?
We believe the United States is effectively in the second half of its economic upturn. Economic indicators have generally been positive, but it has been harder to find what we consider to be cheaply valued stocks. Also, because the Federal Reserve has stopped adding further economic stimulus, we believe there is potential for greater market volatility. Moreover, economic weakness overseas can be a double-edged
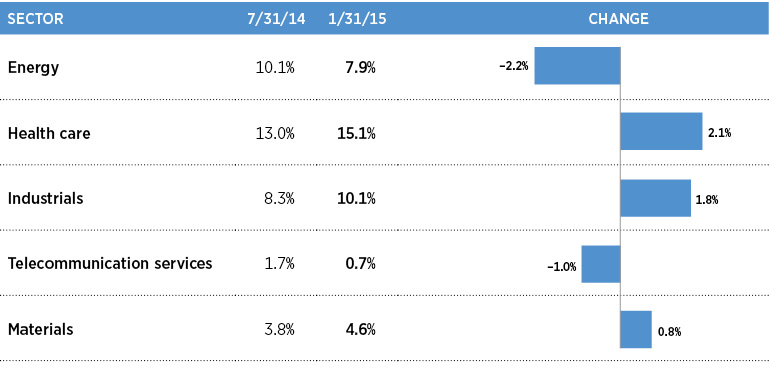
Comparison of top sector shifts
This chart shows the fund’s largest allocation shifts, by percentage, over the past six months. Allocations are shown as a percentage of the fund’s net assets. Current period summary information may differ from the portfolio schedule included in the financial statements due to the inclusion of derivative securities, any interest accruals, the exclusion of as-of trades, if any, and the use of different classifications of securities for presentation purposes. Holdings and allocations may vary over time.
8 Research Fund
sword. Europe and Japan have been struggling to stimulate their economies and avoid deflation. While we think this has introduced heightened risks to U.S. growth, it also has helped to keep interest rates and inflation low around the world, which we believe has the potential to extend the current positive economic trends we have been experiencing domestically.
Thank you, Aaron, for this update on the fund.
The views expressed in this report are exclusively those of Putnam Management and are subject to change. They are not meant as investment advice.
Please note that the holdings discussed in this report may not have been held by the fund for the entire period. Portfolio composition is subject to review in accordance with the fund’s investment strategy and may vary in the future. Current and future portfolio holdings are subject to risk.
Portfolio Manager Aaron M. Cooper is Director of Global Equity Research at Putnam. He holds an A.B. from Harvard University. Aaron joined Putnam in 2011 and has been in the investment industry since 1999.
In addition to Aaron, your fund’s managers are Jacquelyne J. Cavanaugh; Kelsey Chen, Ph.D.; Neil P. Desai; Kathryn B. Lakin; Ferat Ongoren; and Walter D. Scully.
IN THE NEWS
How can an increase in the unemployment rate — to 5.7% in January 2015 from 5.6% in December 2014 — mean good news? The answer: More than one million people entered the workforce in January — which includes those actively seeking work. This is good news because it appeared that many people had abandoned looking for a job altogether in the wake of the Great Recession. That’s changing. The labor participation rate ticked up to 62.9% in January from 62.7% in December, according to the Bureau of Labor Statistics (BLS). Many believe that, for the economic recovery to continue, more people who have been sitting on the sidelines will need to reenter the labor market, even though they may not land a job right away. The BLS also noted that 257,000 jobs were added in January, slightly above expectations. More importantly, figures from previous months were revised higher: There were 329,000 additional jobs in December and an even more impressive 423,000 jobs in November. The BLS also reported a gain in average hourly earnings, which rose 0.5% in January after declining slightly in December. Wage growth might be luring people back to the workforce, particularly within lower-paying industries such as retail.
Research Fund 9
Your fund’s performance
This section shows your fund’s performance, price, and distribution information for periods ended January 31, 2015, the end of the first half of its current fiscal year. In accordance with regulatory requirements for mutual funds, we also include performance information as of the most recent calendar quarter-end and expense information taken from the fund’s current prospectus. Performance should always be considered in light of a fund’s investment strategy. Data represent past performance. Past performance does not guarantee future results. More recent returns may be less or more than those shown. Investment return and principal value will fluctuate, and you may have a gain or a loss when you sell your shares. Performance information does not reflect any deduction for taxes a shareholder may owe on fund distributions or on the redemption of fund shares. For the most recent month-end performance, please visit the Individual Investors section at putnam.com or call Putnam at 1-800-225-1581. Class R and Y shares are not available to all investors. See the Terms and Definitions section in this report for definitions of the share classes offered by your fund.
Fund performance Total return for periods ended 1/31/15
Class A
Class B
Class C
Class M
Class R
Class Y
(inception dates)
(10/2/95)
(6/15/98)
(2/1/99)
(6/15/98)
(1/21/03)
(4/4/00)
Before sales charge
After sales charge
Before CDSC
After CDSC
Before CDSC
After CDSC
Before sales charge
After sales charge
Net asset value
Net asset value
Annual average
(life of fund)
8.36%
8.03%
7.99%
7.99%
7.55%
7.55%
7.82%
7.62%
8.10%
8.57%
10 years
97.06
85.73
85.41
85.41
82.72
82.72
87.46
80.90
92.22
102.09
Annual average
7.02
6.39
6.37
6.37
6.21
6.21
6.49
6.11
6.75
7.29
5 years
107.34
95.42
99.55
97.55
99.72
99.72
102.13
95.06
104.70
109.94
Annual average
15.70
14.34
14.82
14.59
14.84
14.84
15.11
14.30
15.40
15.99
3 years
65.57
56.05
61.82
58.82
61.80
61.80
63.08
57.37
64.29
66.76
Annual average
18.30
15.99
17.40
16.67
17.40
17.40
17.71
16.32
18.00
18.59
1 year
14.09
7.53
13.21
8.21
13.23
12.23
13.51
9.54
13.81
14.36
6 months
4.39
–1.61
3.98
–1.02
3.97
2.97
4.11
0.46
4.26
4.52
Current performance may be lower or higher than the quoted past performance, which cannot guarantee future results. After-sales-charge returns for class A and M shares reflect the deduction of the maximum 5.75% and 3.50% sales charge, respectively, levied at the time of purchase. Class B share returns after contingent deferred sales charge (CDSC) reflect the applicable CDSC, which is 5% in the first year, declining over time to 1% in the sixth year, and is eliminated thereafter. Class C share returns after CDSC reflect a 1% CDSC for the first year that is eliminated thereafter. Class R and Y shares have no initial sales charge or CDSC. Performance for class B, C, M, R, and Y shares before their inception is derived from the historical performance of class A shares, adjusted for the applicable sales charge (or CDSC) and the higher operating expenses for such shares, except for class Y shares, for which 12b-1 fees are not applicable.
Recent performance may have benefited from one or more legal settlements.
For a portion of the periods, the fund had expense limitations, without which returns would have been lower.
Class B share performance reflects conversion to class A shares after eight years.
10 Research Fund
Comparative index returns For periods ended 1/31/15
S&P 500 Index
Lipper Large-Cap Core Funds category average*
Annual average (life of fund)
8.59%
7.89%
10 years
108.25
96.56
Annual average
7.61
6.93
5 years
106.41
92.49
Annual average
15.60
13.94
3 years
62.09
56.34
Annual average
17.47
16.02
1 year
14.22
11.71
6 months
4.37
3.00
Index and Lipper results should be compared with fund performance before sales charge, before CDSC, or at net asset value.
*Over the 6-month, 1-year, 3-year, 5-year, 10-year, and life-of-fund periods ended 1/31/15, there were 872, 859, 758, 694, 485, and 126 funds, respectively, in this Lipper category.
Fund price and distribution information For the six-month period ended 1/31/15
Distributions
Class A
Class B
Class C
Class M
Class R
Class Y
Number
1
1
1
1
1
1
Income
$0.252
$0.067
$0.086
$0.142
$0.266
$0.312
Capital gains
—
—
—
—
—
—
Total
$0.252
$0.067
$0.086
$0.142
$0.266
$0.312
Share value
Before sales charge
After sales charge
Net asset value
Net asset value
Before sales charge
After sales charge
Net asset value
Net asset value
7/31/14
$24.22
$25.70
$22.71
$22.74
$23.30
$24.15
$24.08
$24.39
1/31/15
25.04
26.57
23.55
23.56
24.12
24.99
24.85
25.19
The classification of distributions, if any, is an estimate. Before-sales-charge share value and current dividend rate for class A and M shares, if applicable, do not take into account any sales charge levied at the time of purchase. After-sales-charge share value, current dividend rate, and current 30-day SEC yield, if applicable, are calculated assuming that the maximum sales charge (5.75% for class A shares and 3.50% for class M shares) was levied at the time of purchase. Final distribution information will appear on your year-end tax forms.
Research Fund 11
Fund performance as of most recent calendar quarter Total return for periods ended 12/31/14
Class A
Class B
Class C
Class M
Class R
Class Y
(inception dates)
(10/2/95)
(6/15/98)
(2/1/99)
(6/15/98)
(1/21/03)
(4/4/00)
Before sales charge
After sales charge
Before CDSC
After CDSC
Before CDSC
After CDSC
Before sales charge
After sales charge
Net asset value
Net asset value
Annual average
(life of fund)
8.56%
8.22%
8.18%
8.18%
7.74%
7.74%
8.02%
7.82%
8.29%
8.77%
10 years
99.20
87.75
87.42
87.42
84.74
84.74
89.53
82.89
94.34
104.28
Annual average
7.13
6.50
6.48
6.48
6.33
6.33
6.60
6.22
6.87
7.40
5 years
105.16
93.36
97.50
95.50
97.53
97.53
100.03
93.02
102.57
107.74
Annual average
15.46
14.10
14.58
14.35
14.58
14.58
14.87
14.06
15.16
15.75
3 years
79.07
68.77
75.10
72.10
75.05
75.05
76.44
70.27
77.63
80.39
Annual average
21.43
19.06
20.53
19.84
20.52
20.52
20.84
19.41
21.11
21.73
1 year
14.60
8.01
13.75
8.75
13.78
12.78
14.09
10.09
14.32
14.91
6 months
5.31
–0.75
4.91
–0.09
4.90
3.90
5.06
1.38
5.15
5.43
See the discussion following the fund performance table on page 10 for information about the calculation of fund performance.
Your fund’s expenses
As a mutual fund investor, you pay ongoing expenses, such as management fees, distribution fees (12b-1 fees), and other expenses. Using the following information, you can estimate how these expenses affect your investment and compare them with the expenses of other funds. You may also pay one-time transaction expenses, including sales charges (loads) and redemption fees, which are not shown in this section and would have resulted in higher total expenses. For more information, see your fund’s prospectus or talk to your financial representative.
Expense ratios
Class A
Class B
Class C
Class M
Class R
Class Y
Total annual operating expenses for the fiscal year ended 7/31/14
1.14%
1.89%
1.89%
1.64%
1.39%
0.89%
Annualized expense ratio for the six-month period ended 1/31/15
1.10%
1.85%
1.85%
1.60%
1.35%
0.85%
Fiscal-year expense information in this table is taken from the most recent prospectus, is subject to change, and may differ from that shown for the annualized expense ratio and in the financial highlights of this report.
Expenses are shown as a percentage of average net assets.
12 Research Fund
Expenses per $1,000
The following table shows the expenses you would have paid on a $1,000 investment in the fund from August 1, 2014, to January 31, 2015. It also shows how much a $1,000 investment would be worth at the close of the period, assuming actual returns and expenses.
Class A
Class B
Class C
Class M
Class R
Class Y
Expenses paid per $1,000*†
$5.67
$9.51
$9.51
$8.23
$6.95
$4.38
Ending value (after expenses)
$1,043.90
$1,039.80
$1,039.70
$1,041.10
$1,042.60
$1,045.20
*Expenses for each share class are calculated using the fund’s annualized expense ratio for each class, which represents the ongoing expenses as a percentage of average net assets for the six months ended 1/31/15. The expense ratio may differ for each share class.
†Expenses are calculated by multiplying the expense ratio by the average account value for the period; then multiplying the result by the number of days in the period; and then dividing that result by the number of days in the year.
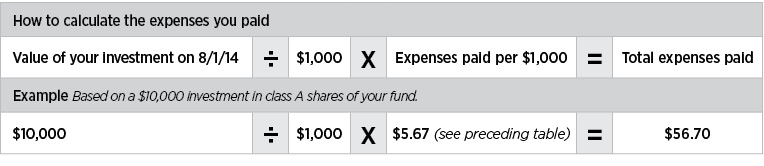
Estimate the expenses you paid
To estimate the ongoing expenses you paid for the six months ended January 31, 2015, use the following calculation method. To find the value of your investment on August 1, 2014, call Putnam at 1-800-225-1581.
Compare expenses using the SEC’s method
The Securities and Exchange Commission (SEC) has established guidelines to help investors assess fund expenses. Per these guidelines, the following table shows your fund’s expenses based on a $1,000 investment, assuming a hypothetical 5% annualized return. You can use this information to compare the ongoing expenses (but not transaction expenses or total costs) of investing in the fund with those of other funds. All mutual fund shareholder reports will provide this information to help you make this comparison. Please note that you cannot use this information to estimate your actual ending account balance and expenses paid during the period.
Class A
Class B
Class C
Class M
Class R
Class Y
Expenses paid per $1,000*†
$5.60
$9.40
$9.40
$8.13
$6.87
$4.33
Ending value (after expenses)
$1,019.66
$1,015.88
$1,015.88
$1,017.14
$1,018.40
$1,020.92
*Expenses for each share class are calculated using the fund’s annualized expense ratio for each class, which represents the ongoing expenses as a percentage of average net assets for the six months ended 1/31/15. The expense ratio may differ for each share class.
†Expenses are calculated by multiplying the expense ratio by the average account value for the six-month period; then multiplying the result by the number of days in the six-month period; and then dividing that result by the number of days in the year.
Research Fund 13
Terms and definitions
Important terms
Total return shows how the value of the fund’s shares changed over time, assuming you held the shares through the entire period and reinvested all distributions in the fund.
Before sales charge, or net asset value, is the price, or value, of one share of a mutual fund, without a sales charge. Before-sales-charge figures fluctuate with market conditions, and are calculated by dividing the net assets of each class of shares by the number of outstanding shares in the class.
After sales charge is the price of a mutual fund share plus the maximum sales charge levied at the time of purchase. After-sales-charge performance figures shown here assume the 5.75% maximum sales charge for class A shares and 3.50% for class M shares.
Contingent deferred sales charge (CDSC) is generally a charge applied at the time of the redemption of class B or C shares and assumes redemption at the end of the period. Your fund’s class B CDSC declines over time from a 5% maximum during the first year to 1% during the sixth year. After the sixth year, the CDSC no longer applies. The CDSC for class C shares is 1% for one year after purchase.
Share classes
Class A shares are generally subject to an initial sales charge and no CDSC (except on certain redemptions of shares bought without an initial sales charge).
Class B shares are not subject to an initial sales charge and may be subject to a CDSC.
Class C shares are not subject to an initial sales charge and are subject to a CDSC only if the shares are redeemed during the first year.
Class M shares have a lower initial sales charge and a higher 12b-1 fee than class A shares and no CDSC (except on certain redemptions of shares bought without an initial sales charge).
Class R shares are not subject to an initial sales charge or CDSC and are available only to certain employer-sponsored retirement plans.
Class Y shares are not subject to an initial sales charge or CDSC, and carry no 12b-1 fee. They are generally only available to corporate and institutional clients and clients in other approved programs.
Comparative indexes
Barclays U.S. Aggregate Bond Index is an unmanaged index of U.S. investment-grade fixed-income securities.
BofA Merrill Lynch U.S. 3-Month Treasury Bill Index is an unmanaged index that seeks to measure the performance of U.S. Treasury bills available in the marketplace.
S&P 500 Index is an unmanaged index of common stock performance.
Indexes assume reinvestment of all distributions and do not account for fees. Securities and performance of a fund and an index will differ. You cannot invest directly in an index.
Lipper is a third-party industry-ranking entity that ranks mutual funds. Its rankings do not reflect sales charges. Lipper rankings are based on total return at net asset value relative to other funds that have similar current investment styles or objectives as determined by Lipper. Lipper may change a fund’s category assignment at its discretion. Lipper category averages reflect performance trends for funds within a category.
14 Research Fund
Other information for shareholders
Important notice regarding delivery of shareholder documents
In accordance with Securities and Exchange Commission (SEC) regulations, Putnam sends a single copy of annual and semiannual shareholder reports, prospectuses, and proxy statements to Putnam shareholders who share the same address, unless a shareholder requests otherwise. If you prefer to receive your own copy of these documents, please call Putnam at 1-800-225-1581, and Putnam will begin sending individual copies within 30 days.
Proxy voting
Putnam is committed to managing our mutual funds in the best interests of our shareholders. The Putnam funds’ proxy voting guidelines and procedures, as well as information regarding how your fund voted proxies relating to portfolio securities during the 12-month period ended June 30, 2014, are available in the Individual Investors section of putnam.com, and on the SEC’s website, www.sec.gov. If you have questions about finding forms on the SEC’s website, you may call the SEC at 1-800-SEC-0330. You may also obtain the Putnam funds’ proxy voting guidelines and procedures at no charge by calling Putnam’s Shareholder Services at 1-800-225-1581.
Fund portfolio holdings
The fund will file a complete schedule of its portfolio holdings with the SEC for the first and third quarters of each fiscal year on Form N-Q. Shareholders may obtain the fund’s Form N-Q on the SEC’s website at www.sec.gov. In addition, the fund’s Form N-Q may be reviewed and copied at the SEC’s Public Reference Room in Washington, D.C. You may call the SEC at 1-800-SEC-0330 for information about the SEC’s website or the operation of the Public Reference Room.
Trustee and employee fund ownership
Putnam employees and members of the Board of Trustees place their faith, confidence, and, most importantly, investment dollars in Putnam mutual funds. As of January 31, 2015, Putnam employees had approximately $470,000,000 and the Trustees had approximately $138,000,000 invested in Putnam mutual funds. These amounts include investments by the Trustees’ and employees’ immediate family members as well as investments through retirement and deferred compensation plans.
Research Fund 15
Financial statements
A guide to financial statements
These sections of the report, as well as the accompanying Notes, constitute the fund’s financial statements.
The fund’s portfolio lists all the fund’s investments and their values as of the last day of the reporting period. Holdings are organized by asset type and industry sector, country, or state to show areas of concentration and diversification.
Statement of assets and liabilities shows how the fund’s net assets and share price are determined. All investment and non-investment assets are added together. Any unpaid expenses and other liabilities are subtracted from this total. The result is divided by the number of shares to determine the net asset value per share, which is calculated separately for each class of shares. (For funds with preferred shares, the amount subtracted from total assets includes the liquidation preference of preferred shares.)
Statement of operations shows the fund’s net investment gain or loss. This is done by first adding up all the fund’s earnings — from dividends and interest income — and subtracting its operating expenses to determine net investment income (or loss). Then, any net gain or loss the fund realized on the sales of its holdings — as well as any unrealized gains or losses over the period — is added to or subtracted from the net investment result to determine the fund’s net gain or loss for the fiscal period.
Statement of changes in net assets shows how the fund’s net assets were affected by the fund’s net investment gain or loss, by distributions to shareholders, and by changes in the number of the fund’s shares. It lists distributions and their sources (net investment income or realized capital gains) over the current reporting period and the most recent fiscal year-end. The distributions listed here may not match the sources listed in the Statement of operations because the distributions are determined on a tax basis and may be paid in a different period from the one in which they were earned. Dividend sources are estimated at the time of declaration. Actual results may vary. Any non-taxable return of capital cannot be determined until final tax calculations are completed after the end of the fund’s fiscal year.
Financial highlights provide an overview of the fund’s investment results, per-share distributions, expense ratios, net investment income ratios, and portfolio turnover in one summary table, reflecting the five most recent reporting periods. In a semiannual report, the highlights table also includes the current reporting period.
16 Research Fund
The fund’s portfolio 1/31/15 (Unaudited)
COMMON STOCKS (96.6%)*
Shares
Value
Aerospace and defense (5.2%)
Airbus Group NV (France)
20,321
$1,082,100
Embraer SA ADR (Brazil) S
523
18,441
General Dynamics Corp.
7,765
1,034,376
Honeywell International, Inc.
16,736
1,636,111
L-3 Communications Holdings, Inc.
34,014
4,187,804
Northrop Grumman Corp.
18,477
2,899,965
Raytheon Co.
9,371
937,569
United Technologies Corp.
25,143
2,885,914
14,682,280
Airlines (0.6%)
American Airlines Group, Inc.
12,659
621,304
Spirit Airlines, Inc. †
16,216
1,202,254
1,823,558
Banks (5.8%)
Bank of America Corp.
106,811
1,618,187
Citigroup, Inc.
68,192
3,201,614
Fifth Third Bancorp
12,587
217,755
JPMorgan Chase & Co.
73,851
4,016,017
KeyCorp
132,375
1,719,551
Regions Financial Corp.
101,936
886,843
Wells Fargo & Co.
88,156
4,577,060
16,237,027
Beverages (1.2%)
Coca-Cola Enterprises, Inc.
10,544
443,902
Dr. Pepper Snapple Group, Inc.
3,095
239,151
PepsiCo, Inc.
28,511
2,673,762
3,356,815
Biotechnology (3.5%)
Biogen Idec, Inc. †
6,121
2,382,048
Celgene Corp. † S
24,104
2,872,233
Gilead Sciences, Inc. †
42,072
4,410,408
Retrophin, Inc. † S
21,018
269,871
9,934,560
Building products (0.8%)
Allegion PLC (Ireland)
12,438
671,776
Fortune Brands Home & Security, Inc. S
35,341
1,582,923
2,254,699
Capital markets (2.3%)
Ameriprise Financial, Inc.
7,935
991,399
Carlyle Group LP (The)
32,228
847,596
Charles Schwab Corp. (The)
76,182
1,979,208
Invesco, Ltd.
6,489
238,341
KKR & Co. LP
55,231
1,326,096
Morgan Stanley
11,171
377,692
State Street Corp.
3,565
254,933
WisdomTree Investments, Inc.
27,909
486,175
6,501,440
Chemicals (3.2%)
Air Products & Chemicals, Inc.
3,229
470,175
Axalta Coating Systems, Ltd. †
34,406
883,202
Research Fund 17
COMMON STOCKS (96.6%)* cont.
Shares
Value
Chemicals cont.
Axiall Corp.
6,320
$279,660
CF Industries Holdings, Inc.
2,092
638,855
Croda International PLC (United Kingdom)
7,272
290,672
Dow Chemical Co. (The)
23,862
1,077,608
Huntsman Corp.
15,683
344,399
LyondellBasell Industries NV Class A
7,617
602,429
Monsanto Co.
12,183
1,437,350
Praxair, Inc.
4,282
516,366
Sherwin-Williams Co. (The)
5,755
1,561,159
Symrise AG (Germany)
11,100
728,666
Tronox, Ltd. Class A S
5,564
117,623
8,948,164
Commercial services and supplies (0.6%)
Rollins, Inc.
13,668
451,727
Tyco International PLC
28,588
1,166,676
1,618,403
Communications equipment (0.4%)
QUALCOMM, Inc.
17,076
1,066,567
1,066,567
Construction materials (0.3%)
CaesarStone Sdot-Yam, Ltd. (Israel) S
9,414
584,609
Martin Marietta Materials, Inc.
926
99,767
Vulcan Materials Co.
2,550
179,801
864,177
Consumer finance (1.2%)
American Express Co.
27,370
2,208,485
Capital One Financial Corp.
5,746
420,665
Discover Financial Services
12,545
682,197
3,311,347
Containers and packaging (0.5%)
MeadWestvaco Corp.
3,485
175,226
Packaging Corp. of America
7,901
599,291
Sealed Air Corp.
14,228
576,234
Smurfit Kappa Group PLC (Ireland)
7,413
180,822
1,531,573
Diversified consumer services (0.3%)
Bright Horizons Family Solutions, Inc. †
9,802
475,887
H&R Block, Inc.
5,746
196,973
Weight Watchers International, Inc. † S
9,824
162,685
835,545
Diversified financial services (0.8%)
Berkshire Hathaway, Inc. Class B †
7,721
1,111,129
CME Group, Inc.
14,815
1,263,720
2,374,849
Diversified telecommunication services (0.8%)
Verizon Communications, Inc.
47,144
2,154,952
2,154,952
Electric utilities (1.4%)
American Electric Power Co., Inc.
14,123
887,066
Edison International
15,945
1,086,652
Exelon Corp.
38,418
1,384,585
NextEra Energy, Inc.
6,135
670,187
4,028,490
18 Research Fund
COMMON STOCKS (96.6%)* cont.
Shares
Value
Electrical equipment (0.3%)
Hubbell, Inc. Class B
8,560
$907,702
907,702
Electronic equipment, instruments, and components (0.1%)
Anixter International, Inc. †
3,877
292,171
292,171
Energy equipment and services (1.0%)
Baker Hughes, Inc.
10,562
612,490
Halliburton Co.
18,530
741,015
Schlumberger, Ltd.
18,968
1,562,774
2,916,279
Food and staples retail (1.9%)
Costco Wholesale Corp.
10,011
1,431,473
CVS Health Corp.
19,818
1,945,335
Diplomat Pharmacy, Inc. † S
7,513
184,594
Wal-Mart Stores, Inc.
11,883
1,009,817
Walgreens Boots Alliance, Inc.
10,008
738,090
5,309,309
Food products (1.9%)
Freshpet, Inc. † S
5,443
83,223
Hershey Co. (The)
4,750
485,498
JM Smucker Co. (The)
2,722
280,774
Kellogg Co.
7,345
481,685
Keurig Green Mountain, Inc.
12,306
1,508,223
Kraft Foods Group, Inc.
10,374
677,837
Mead Johnson Nutrition Co.
6,122
602,956
Mondelez International, Inc. Class A
27,688
975,725
Pinnacle Foods, Inc.
6,708
241,287
S&W Seed Co. †
4,700
24,158
5,361,366
Health-care equipment and supplies (2.0%)
Abbott Laboratories
10,522
470,965
Baxter International, Inc.
1,923
135,206
Becton Dickinson and Co.
7,045
972,774
Boston Scientific Corp. †
59,272
877,818
Cooper Cos., Inc. (The)
1,838
289,761
Medtronic PLC
27,319
1,950,577
Zimmer Holdings, Inc.
7,428
832,679
5,529,780
Health-care providers and services (2.5%)
Aetna, Inc.
3,533
324,400
AmerisourceBergen Corp.
5,535
526,102
Anthem, Inc.
4,087
551,582
Cardinal Health, Inc.
10,781
896,871
CIGNA Corp.
11,356
1,213,161
Express Scripts Holding Co. †
7,163
578,126
HCA Holdings, Inc. †
8,382
593,446
McKesson Corp.
5,833
1,240,387
Premier, Inc. Class A †
14,663
476,548
Universal Health Services, Inc. Class B
5,420
555,713
6,956,336
Research Fund 19
COMMON STOCKS (96.6%)* cont.
Shares
Value
Health-care technology (0.2%)
Castlight Health, Inc. Class B † S
42,373
$376,272
Cerner Corp. †
4,346
288,357
664,629
Hotels, restaurants, and leisure (1.8%)
Hilton Worldwide Holdings, Inc. †
27,698
719,317
Penn National Gaming, Inc. †
30,273
453,187
Restaurant Brands International LP (Units) (Canada) †
62
2,274
Restaurant Brands International, Inc. (Canada) †
10,561
408,499
Starbucks Corp.
10,942
957,753
Vail Resorts, Inc.
5,781
507,341
Wyndham Worldwide Corp.
8,251
691,351
Wynn Resorts, Ltd.
3,958
585,586
Yum! Brands, Inc.
9,744
704,296
5,029,604
Household durables (0.4%)
PulteGroup, Inc.
25,453
524,077
Whirlpool Corp.
2,343
466,444
990,521
Household products (0.5%)
Energizer Holdings, Inc.
11,849
1,516,790
1,516,790
Independent power and renewable electricity producers (0.9%)
Calpine Corp. †
42,370
884,686
NextEra Energy Partners LP
9,458
379,171
NRG Energy, Inc.
47,089
1,161,215
2,425,072
Industrial conglomerates (0.2%)
Siemens AG (Germany)
4,603
483,470
483,470
Insurance (2.2%)
American International Group, Inc.
37,293
1,822,509
Assured Guaranty, Ltd.
40,388
986,275
Genworth Financial, Inc. Class A †
85,711
598,263
Hartford Financial Services Group, Inc. (The)
34,176
1,329,446
MetLife, Inc.
5,840
271,560
Prudential PLC (United Kingdom)
43,665
1,062,135
6,070,188
Internet and catalog retail (2.0%)
Amazon.com, Inc. †
8,456
2,997,906
Ctrip.com International, Ltd. ADR (China) † S
13,401
637,285
Groupon, Inc. †
41,645
298,178
Priceline Group, Inc. (The) †
1,582
1,596,997
5,530,366
Internet software and services (4.3%)
Alibaba Group Holding, Ltd. ADR (China) † S
19,600
1,745,968
Facebook, Inc. Class A †
42,500
3,226,175
Google, Inc. Class A †
42
22,577
Google, Inc. Class C †
10,249
5,478,295
Pandora Media, Inc. † S
10,380
172,308
Tencent Holdings, Ltd. (China)
25,400
428,786
Yahoo!, Inc. †
19,286
848,391
11,922,500
20 Research Fund
COMMON STOCKS (96.6%)* cont.
Shares
Value
IT Services (1.9%)
Computer Sciences Corp.
12,084
$733,257
Fidelity National Information Services, Inc.
12,734
794,984
MasterCard, Inc. Class A
17,992
1,475,884
Visa, Inc. Class A
8,901
2,268,954
5,273,079
Leisure products (0.2%)
Brunswick Corp.
8,291
450,035
450,035
Life sciences tools and services (0.5%)
Agilent Technologies, Inc.
18,471
697,650
Thermo Fisher Scientific, Inc.
1,866
233,642
Waters Corp. †
3,005
357,745
1,289,037
Machinery (0.4%)
Oshkosh Corp.
12,497
535,496
Pall Corp.
6,412
620,425
1,155,921
Media (4.4%)
Charter Communications, Inc. Class A †
8,802
1,330,114
Comcast Corp. Class A
48,803
2,593,635
DISH Network Corp. Class A †
21,861
1,537,921
Liberty Global PLC Ser. C (United Kingdom)
32,483
1,480,900
Live Nation Entertainment, Inc. †
42,306
1,005,614
Time Warner Cable, Inc.
1,828
248,846
Time Warner, Inc.
26,156
2,038,337
Walt Disney Co. (The)
23,779
2,162,938
12,398,305
Metals and mining (0.3%)
Agnico-Eagle Mines, Ltd. (Canada)
1,483
50,007
Alcoa, Inc.
7,912
123,823
Allegheny Technologies, Inc.
1,600
45,648
Freeport-McMoRan, Inc. (Indonesia)
17,126
287,888
Goldcorp, Inc. (Canada)
2,050
49,262
Hi-Crush Partners LP (Units)
4,748
154,927
Newmont Mining Corp.
2,162
54,374
Nucor Corp.
3,310
144,482
910,411
Multi-utilities (0.7%)
PG&E Corp.
20,317
1,194,843
Sempra Energy
6,835
764,973
1,959,816
Multiline retail (0.5%)
Dollar General Corp. †
11,003
737,861
Macy’s, Inc.
10,170
649,660
1,387,521
Oil, gas, and consumable fuels (6.9%)
Anadarko Petroleum Corp.
18,430
1,506,653
Antero Resources Corp. † S
9,711
336,486
Cabot Oil & Gas Corp.
15,751
417,402
Cheniere Energy, Inc. †
8,164
582,746
CONSOL Energy, Inc.
5,020
145,329
EnCana Corp. (Canada)
17,781
217,639
Research Fund 21
COMMON STOCKS (96.6%)* cont.
Shares
Value
Oil, gas, and consumable fuels cont.
Energen Corp.
2,721
$172,566
EOG Resources, Inc.
40,887
3,640,170
EP Energy Corp. Class A † S
18,293
189,333
Exxon Mobil Corp.
69,310
6,059,080
Gaztransport Et Technigaz SA (France)
15,445
873,707
Genel Energy PLC (United Kingdom) †
16,786
158,158
Gulfport Energy Corp. †
6,710
258,268
MarkWest Energy Partners LP
9,762
575,275
QEP Resources, Inc.
15,471
312,824
Royal Dutch Shell PLC ADR (United Kingdom)
13,096
804,749
Suncor Energy, Inc. (Canada)
7,727
230,342
Total SA ADR (France)
33,207
1,710,493
Valero Energy Corp.
14,572
770,567
Whiting Petroleum Corp. †
9,022
270,840
19,232,627
Paper and forest products (0.1%)
Boise Cascade Co. †
3,821
154,521
Louisiana-Pacific Corp. † S
4,578
74,942
229,463
Personal products (1.7%)
Avon Products, Inc. S
71,652
554,586
Coty, Inc. Class A †
116,551
2,216,800
Estee Lauder Cos., Inc. (The) Class A
28,879
2,038,569
4,809,955
Pharmaceuticals (6.4%)
AbbVie, Inc.
35,167
2,122,328
Actavis PLC †
8,984
2,394,595
Allergan, Inc.
6,446
1,413,350
Bristol-Myers Squibb Co.
40,577
2,445,576
Eli Lilly & Co.
23,579
1,697,688
Endo International PLC †
4,512
359,200
Johnson & Johnson
14,327
1,434,706
Merck & Co., Inc.
35,060
2,113,417
Mylan, Inc. †
21,000
1,116,150
Perrigo Co. PLC
7,025
1,065,974
Pfizer, Inc.
54,049
1,689,031
17,852,015
Real estate investment trusts (REITs) (2.8%)
Altisource Residential Corp. R
6,624
119,298
American Tower Corp. R
18,415
1,785,334
AvalonBay Communities, Inc. R
3,980
688,500
Boston Properties, Inc. R
4,290
595,452
Equity Lifestyle Properties, Inc. R
6,207
339,709
Essex Property Trust, Inc. R
1,396
315,566
Federal Realty Investment Trust R
833
119,760
Gaming and Leisure Properties, Inc. R
17,135
559,115
General Growth Properties R
16,515
498,423
Paramount Group, Inc. † R
1,387
26,838
Pebblebrook Hotel Trust R
2,932
136,162
Plum Creek Timber Co., Inc. R S
3,671
163,433
22 Research Fund
COMMON STOCKS (96.6%)* cont.
Shares
Value
Real estate investment trusts (REITs) cont.
Prologis, Inc. R
5,124
$231,297
Public Storage R
1,710
343,436
Simon Property Group, Inc. R
3,574
710,011
Urban Edge Properties † R
1,681
39,907
Ventas, Inc. R
8,516
679,662
Vornado Realty Trust R
3,362
371,299
7,723,202
Real estate management and development (0.2%)
RE/MAX Holdings, Inc. Class A
21,120
702,874
702,874
Road and rail (1.3%)
Canadian Pacific Railway, Ltd. (Canada)
1,596
278,166
Genesee & Wyoming, Inc. Class A †
6,534
538,728
Union Pacific Corp.
24,296
2,847,734
3,664,628
Semiconductors and semiconductor equipment (4.2%)
Applied Materials, Inc.
62,971
1,438,258
Avago Technologies, Ltd.
13,882
1,428,180
Broadcom Corp. Class A
32,068
1,360,806
Intel Corp.
46,797
1,546,173
Lam Research Corp.
16,539
1,264,241
Micron Technology, Inc. †
88,494
2,589,777
Skyworks Solutions, Inc.
9,643
800,851
Texas Instruments, Inc.
24,079
1,287,023
11,715,309
Software (3.3%)
Activision Blizzard, Inc.
5,253
109,761
Electronic Arts, Inc. †
5,535
303,650
Microsoft Corp.
105,978
4,281,511
Oracle Corp.
64,400
2,697,716
Salesforce.com, Inc. †
29,397
1,659,461
TiVo, Inc. †
14,825
155,070
9,207,169
Specialty retail (2.4%)
Advance Auto Parts, Inc.
411
65,349
Autonation, Inc. †
990
59,024
AutoZone, Inc. †
382
228,039
Bed Bath & Beyond, Inc. †
11,027
824,489
Best Buy Co., Inc.
1,517
53,398
Chico’s FAS, Inc.
7,340
122,431
Five Below, Inc. † S
21,736
724,244
GameStop Corp. Class A
116
4,089
Gap, Inc. (The)
16,846
693,887
GNC Holdings, Inc. Class A
2,865
127,034
Home Depot, Inc. (The)
19,200
2,004,864
Michaels Cos., Inc. (The) †
3,642
93,964
O’Reilly Automotive, Inc. †
1,280
239,821
Office Depot, Inc. †
19,465
147,934
Staples, Inc.
5,432
92,616
TJX Cos., Inc. (The)
20,419
1,346,429
6,827,612
Research Fund 23
COMMON STOCKS (96.6%)* cont.
Shares
Value
Technology hardware, storage, and peripherals (4.7%)
Apple, Inc.
87,963
$10,305,745
EMC Corp.
48,848
1,266,629
Hewlett-Packard Co.
22,321
806,458
Western Digital Corp.
7,880
766,172
13,145,004
Textiles, apparel, and luxury goods (1.4%)
Hanesbrands, Inc.
4,022
447,970
lululemon athletica, Inc. (Canada) † S
2,775
183,816
Michael Kors Holdings, Ltd. †
13,092
926,783
NIKE, Inc. Class B
16,724
1,542,789
Tumi Holdings, Inc. † S
32,119
728,138
3,829,496
Tobacco (0.7%)
Philip Morris International, Inc.
24,388
1,956,891
1,956,891
Trading companies and distributors (0.3%)
HD Supply Holdings, Inc. †
30,054
866,457
866,457
Water utilities (0.2%)
American Water Works Co., Inc.
8,406
471,913
471,913
Total common stocks (cost $240,232,804)
$270,489,269
CONVERTIBLE PREFERRED STOCKS (0.1%)*
Shares
Value
United Technologies Corp. $3.75 cv. pfd.
4,194
$251,346
Total convertible preferred stocks (cost $209,700)
$251,346
PURCHASED OPTIONS OUTSTANDING (—%)*
Expiration date/strike price
Contract amount
Value
L-3 Communications Holdings, Inc. (Call)
Feb-15/$130.00
$12,765
$5,499
Total purchased options outstanding (cost $21,732)
$5,499
SHORT-TERM INVESTMENTS (8.1%)*
Principal amount/shares
Value
Putnam Cash Collateral Pool, LLC 0.19% d
Shares 10,875,733
$10,875,733
Putnam Short Term Investment Fund 0.10% L
Shares 10,213,585
10,213,585
SSgA Prime Money Market Fund Class N 0.01% P
Shares 960,000
960,000
U.S. Treasury Bills with effective yields ranging from 0.02% to 0.03%, April 16, 2015 # Δ
$130,000
129,998
U.S. Treasury Bills with an effective yield of 0.03%, April 2, 2015 #
270,000
269,997
U.S. Treasury Bills with effective yields ranging from 0.02% to 0.04%, April 9, 2015 # Δ
45,000
45,000
U.S. Treasury Bills with effective yields ranging from zero% to 0.02%, February 19, 2015 # Δ
120,000
120,000
Total short-term investments (cost $22,614,295)
$22,614,313
TOTAL INVESTMENTS
Total investments (cost $263,078,531)
$293,360,427
24 Research Fund
Key to holding’s abbreviations
ADR
American Depository Receipts: represents ownership of foreign securities on deposit with a custodian bank
bp
Basis points
Notes to the fund’s portfolio
Unless noted otherwise, the notes to the fund’s portfolio are for the close of the fund’s reporting period, which ran from August 1, 2014 through January 31, 2015 (the reporting period). Within the following notes to the portfolio, references to “ASC 820” represent Accounting Standards Codification 820 Fair Value Measurements and Disclosures and references to “OTC”, if any, represent over-the-counter.
*
Percentages indicated are based on net assets of $280,128,711.
†
This security is non-income-producing.
#
This security, in part or in entirety, was pledged and segregated with the broker to cover margin requirements for futures contracts at the close of the reporting period.
Δ
This security, in part or in entirety, was pledged and segregated with the custodian for collateral on certain derivative contracts at the close of the reporting period.
d
Affiliated company. See Note 1 to the financial statements regarding securities lending. The rate quoted in the security description is the annualized 7-day yield of the fund at the close of the reporting period.
L
Affiliated company (Note 5). The rate quoted in the security description is the annualized 7-day yield of the fund at the close of the reporting period.
P
This security was pledged, or purchased with cash that was pledged, to the fund for collateral on certain derivative contracts. The rate quoted in the security description is the annualized 7-day yield of the fund at the close of the reporting period (Note 1).
R
Real Estate Investment Trust.
S
Security on loan, in part or in entirety, at the close of the reporting period (Note 1).
At the close of the reporting period, the fund maintained liquid assets totaling $289,644 to cover certain derivative contracts and the settlement of certain securities.
FORWARD CURRENCY CONTRACTS at 1/31/15 (aggregate face value $23,115,058) (Unaudited)
Counterparty
Currency
Contract type
Delivery date
Value
Aggregate face value
Unrealized appreciation/ (depreciation)
Barclays Bank PLC
Canadian Dollar
Buy
4/15/15
$1,647,971
$1,749,340
$(101,369)
Swiss Franc
Buy
3/18/15
650,093
619,043
31,050
Citibank, N.A.
Euro
Sell
3/18/15
5,499,746
6,081,792
582,046
Credit Suisse International
Canadian Dollar
Sell
4/15/15
677,744
729,853
52,109
Euro
Buy
3/18/15
765,072
846,112
(81,040)
Swiss Franc
Sell
3/18/15
501,322
477,336
(23,986)
Deutsche Bank AG
British Pound
Sell
3/18/15
2,966,361
3,144,454
178,093
Euro
Sell
3/18/15
182,338
155,207
(27,131)
HSBC Bank USA, National Association
British Pound
Sell
3/18/15
636,036
664,562
28,526
Canadian Dollar
Buy
4/15/15
601,242
647,488
(46,246)
Euro
Sell
3/18/15
987,200
984,820
(2,380)
Research Fund 25
FORWARD CURRENCY CONTRACTS at 1/31/15 (aggregate face value $23,115,058) (Unaudited) cont.
Counterparty
Currency
Contract type
Delivery date
Value
Aggregate face value
Unrealized appreciation/ (depreciation)
JPMorgan Chase Bank N.A.
Canadian Dollar
Sell
4/15/15
$2,909,503
$3,134,861
$225,358
Euro
Sell
3/18/15
907,619
978,561
70,942
Norwegian Krone
Buy
3/18/15
488,681
495,131
(6,450)
Norwegian Krone
Sell
3/18/15
488,681
544,480
55,799
State Street Bank and Trust Co.
Euro
Buy
3/18/15
791,976
875,822
(83,846)
WestPac Banking Corp.
Euro
Sell
3/18/15
895,636
986,196
90,560
Total
$942,035
FUTURES CONTRACTS OUTSTANDING at 1/31/15 (Unaudited)
Number of contracts
Value
Expiration date
Unrealized appreciation/ (depreciation)
S&P 500 Index E-Mini (Long)
81
$8,053,020
Mar-15
$(164,330)
Total
$(164,330)
OTC TOTAL RETURN SWAP CONTRACTS OUTSTANDING at 1/31/15 (Unaudited)
Swap counterparty/ Notional amount
Upfront premium received (paid)
Termination date
Payments received (paid) by fund per annum
Total return received by or paid by fund
Unrealized appreciation/ (depreciation)
Goldman Sachs International
units
797
$—
12/1/15
3 month USD-LIBOR-BBA minus 50bp
Russell 2000 Total Return Index
$(53,516)
JPMorgan Chase Bank N.A.
baskets
7,622
—
7/16/15
(3 month USD-LIBOR-BBA plus 30 bp)
A basket (JPCMPTMD) of common stocks
5,734
Total
$—
$(47,782)
26 Research Fund
ASC 820 establishes a three-level hierarchy for disclosure of fair value measurements. The valuation hierarchy is based upon the transparency of inputs to the valuation of the fund’s investments. The three levels are defined as follows:
Level 1: Valuations based on quoted prices for identical securities in active markets.
Level 2: Valuations based on quoted prices in markets that are not active or for which all significant inputs are observable, either directly or indirectly.
Level 3: Valuations based on inputs that are unobservable and significant to the fair value measurement.
The following is a summary of the inputs used to value the fund’s net assets as of the close of the reporting period:
Valuation inputs
Investments in securities:
Level 1
Level 2
Level 3
Common stocks*:
Consumer discretionary
$37,279,005
$—
$—
Consumer staples
22,311,126
—
—
Energy
21,117,041
1,031,865
—
Financials
41,858,792
1,062,135
—
Health care
42,226,357
—
—
Industrials
25,891,548
1,565,570
—
Information technology
52,193,013
428,786
—
Materials
11,283,628
1,200,160
—
Telecommunication services
2,154,952
—
—
Utilities
8,885,291
—
—
Total common stocks
265,200,753
5,288,516
—
Convertible preferred stocks
—
251,346
—
Purchased options outstanding
—
5,499
—
Short-term investments
11,173,585
11,440,728
—
Totals by level
$276,374,338
$16,986,089
$—
Valuation inputs
Other financial instruments:
Level 1
Level 2
Level 3
Forward currency contracts
$—
$942,035
$—
Futures contracts
(164,330)
—
—
Total return swap contracts
—
(47,782)
—
Totals by level
$(164,330)
$894,253
$—
*Common stock classifications are presented at the sector level, which may differ from the fund’s portfolio presentation.
During the reporting period, transfers within the fair value hierarchy, if any, (other than certain transfers involving non-U.S. equity securities as described in Note 1) did not represent, in the aggregate, more than 1% of the fund’s net assets measured as of the end of the period.
The accompanying notes are an integral part of these financial statements.
Research Fund 27
Statement of assets and liabilities 1/31/15 (Unaudited)
ASSETS
Investment in securities, at value, including $10,310,706 of securities on loan (Note 1):
Affiliated issuers (identified cost $21,089,318) (Notes 1 and 5)
21,089,318
Foreign currency (cost $3) (Note 1)
3
Dividends, interest and other receivables
233,082
Receivable for shares of the fund sold
260,521
Receivable for investments sold
8,477,680
Unrealized appreciation on forward currency contracts (Note 1)
1,314,483
Unrealized appreciation on OTC swap contracts (Note 1)
5,734
Prepaid assets
36,684
Total assets
303,688,614
LIABILITIES
Payable to custodian
20,867
Payable for investments purchased
10,380,233
Payable for shares of the fund repurchased
258,158
Payable for compensation of Manager (Note 2)
132,097
Payable for custodian fees (Note 2)
9,806
Payable for investor servicing fees (Note 2)
87,111
Payable for Trustee compensation and expenses (Note 2)
135,322
Payable for administrative services (Note 2)
2,381
Payable for distribution fees (Note 2)
73,979
Payable for variation margin (Note 1)
121,905
Unrealized depreciation on OTC swap contracts (Note 1)
53,516
Unrealized depreciation on forward currency contracts (Note 1)
372,448
Collateral on securities loaned, at value (Note 1)
10,875,733
Collateral on certain derivative contracts, at value (Note 1)
960,000
Other accrued expenses
76,347
Total liabilities
23,559,903
Net assets
$280,128,711
REPRESENTED BY
Paid-in capital (Unlimited shares authorized) (Notes 1 and 4)
$296,707,691
Distributions in excess of net investment income (Note 1)
(1,877,086)
Accumulated net realized loss on investments and foreign currency transactions (Note 1)
(45,712,994)
Net unrealized appreciation of investments and assets and liabilities in foreign currencies
31,011,100
Total — Representing net assets applicable to capital shares outstanding
$280,128,711
(Continued on next page)
The accompanying notes are an integral part of these financial statements.
28 Research Fund
Statement of assets and liabilities (Continued)
COMPUTATION OF NET ASSET VALUE AND OFFERING PRICE
Net asset value and redemption price per class A share ($232,663,293 divided by 9,291,288 shares)
$25.04
Offering price per class A share (100/94.25 of $25.04)*
$26.57
Net asset value and offering price per class B share ($9,371,118 divided by 397,840 shares)**
$23.55
Net asset value and offering price per class C share ($14,799,061 divided by 628,082 shares)**
$23.56
Net asset value and redemption price per class M share ($4,592,983 divided by 190,425 shares)
$24.12
Offering price per class M share (100/96.50 of $24.12)*
$24.99
Net asset value, offering price and redemption price per class R share ($940,153 divided by 37,836 shares)
$24.85
Net asset value, offering price and redemption price per class Y share ($17,762,103 divided by 705,192 shares)
$25.19
*
On single retail sales of less than $50,000. On sales of $50,000 or more the offering price is reduced.
**
Redemption price per share is equal to net asset value less any applicable contingent deferred sales charge.
The accompanying notes are an integral part of these financial statements.
Research Fund 29
Statement of operations Six months ended 1/31/15 (Unaudited)
INVESTMENT INCOME
Dividends (net of foreign tax of $16,565)
$2,197,726
Interest (including interest income of $3,902 from investments in affiliated issuers) (Note 5)
3,905
Securities lending (Note 1)
30,972
Total investment income
2,232,603
EXPENSES
Compensation of Manager (Note 2)
766,453
Investor servicing fees (Note 2)
276,880
Custodian fees (Note 2)
22,780
Trustee compensation and expenses (Note 2)
2,149
Distribution fees (Note 2)
432,715
Administrative services (Note 2)
4,200
Other
107,717
Total expenses
1,612,894
Expense reduction (Note 2)
(9,216)
Net expenses
1,603,678
Net investment income
628,925
Net realized gain on investments (Notes 1 and 3)
11,450,697
Net increase from payments by affiliates (Note 2)
8,071
Net realized loss on swap contracts (Note 1)
(92,287)
Net realized gain on futures contracts (Note 1)
34,675
Net realized gain on foreign currency transactions (Note 1)
1,032,151
Net realized gain on written options (Notes 1 and 3)
13,906
Net unrealized appreciation of assets and liabilities in foreign currencies during the period
820,601
Net unrealized depreciation of investments, futures contracts, swap contracts and written options during the period
(2,267,707)
Net gain on investments
11,000,107
Net increase in net assets resulting from operations
$11,629,032
The accompanying notes are an integral part of these financial statements.
30 Research Fund
Statement of changes in net assets
INCREASE IN NET ASSETS
Six months ended 1/31/15*
Year ended 7/31/14
Operations:
Net investment income
$628,925
$1,971,441
Net realized gain on investments and foreign currency transactions
12,447,213
40,704,490
Net unrealized appreciation (depreciation) of investments and assets and liabilities in foreign currencies
(1,447,106)
1,261,896
Net increase in net assets resulting from operations
11,629,032
43,937,827
Distributions to shareholders (Note 1):
From ordinary income
Net investment income
Class A
(2,319,114)
(1,490,424)
Class B
(26,766)
(3,993)
Class C
(52,817)
(14,513)
Class M
(27,109)
(11,836)
Class R
(8,931)
(895)
Class Y
(210,413)
(114,657)
Increase (decrease) from capital share transactions (Note 4)
5,172,281
(15,914,750)
Total increase in net assets
14,156,163
26,386,759
NET ASSETS
Beginning of period
265,972,548
239,585,789
End of period (including distributions in excess of net investment income of $1,877,086 and undistributed net investment income of $139,139, respectively)
$280,128,711
$265,972,548
*
Unaudited.
The accompanying notes are an integral part of these financial statements.
Research Fund 31
Financial highlights (For a common share outstanding throughout the period)
INVESTMENT OPERATIONS:
LESS DISTRIBUTIONS:
RATIOS AND SUPPLEMENTAL DATA:
Period ended
Net asset value, beginning of period
Net investment income (loss)a
Net realized and unrealized gain (loss) on investments
Total from investment operations
From net investment income
From return of capital
Total distributions
Redemption fees
Non-recurring reimbursements
Net asset value, end of period
Total return at net asset value (%)b
Net assets, end of period (in thousands)
Ratio of expenses to average net assets (%)c
Ratio of net investment income (loss) to average net assets (%)
Portfolio turnover (%)
Class A
January 31, 2015**
$24.22
.06
1.01
1.07
(.25)
—
(.25)
—
—
$25.04
4.39*
$232,663
.55*
.26*
53*
July 31, 2014
20.46
.19
3.73
3.92
(.16)
—
(.16)
—
—
24.22
19.22
224,634
1.14
.84
96
July 31, 2013
16.35
.17
4.13
4.30
(.19)
—
(.19)
—e
—
20.46
26.53
201,220
1.19
.95
96
July 31, 2012
15.51
.13
.85
.98
(.14)
—
(.14)
—e
—e,g
16.35
6.37
178,021
1.26
.85
108
July 31, 2011
13.08
.08
2.41
2.49
(.08)
—
(.08)
—e
.02f
15.51
19.24
183,969
1.23
.53
99
July 31, 2010
11.59
.07
1.53
1.60
(.10)
(.01)
(.11)
—e
—
13.08
13.80
184,136
1.26d
.53d
106
Class B
January 31, 2015**
$22.71
(.03)
.94
.91
(.07)
—
(.07)
—
—
$23.55
3.98*
$9,371
.93*
(.12) *
53*
July 31, 2014
19.20
.02
3.50
3.52
(.01)
—
(.01)
—
—
22.71
18.33
9,558
1.89
.11
96
July 31, 2013
15.34
.04
3.88
3.92
(.06)
—
(.06)
—e
—
19.20
25.60
10,098
1.94
.22
96
July 31, 2012
14.54
.01
.79
.80
—
—
—
—e
—e,g
15.34
5.50
10,441
2.01
.11
108
July 31, 2011
12.28
(.03)
2.27
2.24
—
—
—
—e
.02f
14.54
18.40
14,078
1.98
(.21)
99
July 31, 2010
10.87
(.02)
1.43
1.41
—e
—e
—e
—e
—
12.28
12.99
18,522
2.01d
(.20)d
106
Class C
January 31, 2015**
$22.74
(.03)
.94
.91
(.09)
—
(.09)
—
—
$23.56
3.97*
$14,799
.93*
(.12) *
53*
July 31, 2014
19.23
.02
3.51
3.53
(.02)
—
(.02)
—
—
22.74
18.38
13,974
1.89
.09
96
July 31, 2013
15.38
.03
3.89
3.92
(.07)
—
(.07)
—e
—
19.23
25.55
12,227
1.94
.20
96
July 31, 2012
14.60
.01
.79
.80
(.02)
—
(.02)
—e
—e,g
15.38
5.51
10,525
2.01
.10
108
July 31, 2011
12.33
(.03)
2.28
2.25
—
—
—
—e
.02f
14.60
18.41
11,443
1.98
(.22)
99
July 31, 2010
10.94
(.03)
1.45
1.42
(.03)
—e
(.03)
—e
—
12.33
12.97
10,736
2.01d
(.22)d
106
Class M
January 31, 2015**
$23.30
—e
.96
.96
(.14)
—
(.14)
—
—
$24.12
4.11*
$4,593
.80*
.01*
53*
July 31, 2014
19.69
.08
3.59
3.67
(.06)
—
(.06)
—
—
23.30
18.67
4,281
1.64
.35
96
July 31, 2013
15.74
.08
3.97
4.05
(.10)
—
(.10)
—e
—
19.69
25.88
4,019
1.69
.46
96
July 31, 2012
14.94
.05
.81
.86
(.06)
—
(.06)
—e
—e,g
15.74
5.78
3,692
1.76
.35
108
July 31, 2011
12.59
—e
2.34
2.34
(.01)
—
(.01)
—e
.02f
14.94
18.77
4,084
1.73
.03
99
July 31, 2010
11.17
—e
1.47
1.47
(.05)
—e
(.05)
—e
—
12.59
13.19
3,961
1.76d
.03d
106
Class R
January 31, 2015**
$24.08
.02
1.02
1.04
(.27)
—
(.27)
—
—
$24.85
4.26*
$940
.68*
.08*
53*
July 31, 2014
20.33
.13
3.72
3.85
(.10)
—
(.10)
—
—
24.08
18.97
245
1.39
.57
96
July 31, 2013
16.26
.12
4.10
4.22
(.15)
—
(.15)
—e
—
20.33
26.17
244
1.44
.69
96
July 31, 2012
15.44
.09
.84
.93
(.11)
—
(.11)
—e
—e,g
16.26
6.06
176
1.51
.60
108
July 31, 2011
13.02
.04
2.42
2.46
(.06)
—
(.06)
—e
.02f
15.44
19.06
143
1.48
.28
99
July 31, 2010
11.55
.04
1.52
1.56
(.08)
(.01)
(.09)
—e
—
13.02
13.47
102
1.51d
.28d
106
Class Y
January 31, 2015**
$24.39
.09
1.02
1.11
(.31)
—
(.31)
—
—
$25.19
4.52*
$17,762
.43*
.37*
53*
July 31, 2014
20.59
.25
3.76
4.01
(.21)
—
(.21)
—
—
24.39
19.57
13,281
.89
1.09
96
July 31, 2013
16.45
.22
4.15
4.37
(.23)
—
(.23)
—e
—
20.59
26.87
11,778
.94
1.17
96
July 31, 2012
15.62
.17
.83
1.00
(.17)
—
(.17)
—e
—e,g
16.45
6.54
7,461
1.01
1.10
108
July 31, 2011
13.16
.12
2.44
2.56
(.12)
—
(.12)
—e
.02f
15.62
19.66
5,418
.98
.77
99
July 31, 2010
11.66
.10
1.54
1.64
(.13)
(.01)
(.14)
—e
—
13.16
14.05
3,802
1.01d
.78d
106
See notes to financial highlights at the end of this section.
The accompanying notes are an integral part of these financial statements.
32
Research Fund
Research Fund
33
Financial highlights (Continued)
*Not annualized.
**Unaudited.
aPer share net investment income (loss) has been determined on the basis of the weighted average number of shares outstanding during the period.
bTotal return assumes dividend reinvestment and does not reflect the effect of sales charges.
cIncludes amounts paid through expense offset and/or brokerage/service arrangements, if any (Note 2). Also excludes acquired fund fees and expenses, if any.
dReflects an involuntary contractual expense limitation in effect during the period. As a result of such limitation, the expenses of each class reflect a reduction of 0.03% of average net assets for the period ended July 31, 2010.
eAmount represents less than $0.01 per share.
fReflects a non-recurring reimbursement related to restitution amounts in connection with a distribution plan approved by the Securities and Exchange Commission (SEC), which amounted to $0.02 per share outstanding on July 21, 2011. Also reflects a non-recurring reimbursement related to short-term trading related lawsuits, which amounted to less than $0.01 per share outstanding on May 11, 2011.
gReflects a non-recurring reimbursement pursuant to a settlement between the SEC and Canadian Imperial Holdings, Inc./CIBC World Markets Corp. which amounted to less than $0.01 per share outstanding on November 29, 2011.
The accompanying notes are an integral part of these financial statements.
34 Research Fund
Notes to financial statements 1/31/15 (Unaudited)
Within the following Notes to financial statements, references to “State Street” represent State Street Bank and Trust Company, references to “the SEC” represent the Securities and Exchange Commission, references to “Putnam Management” represent Putnam Investment Management, LLC, the fund’s manager, an indirect wholly-owned subsidiary of Putnam Investments, LLC and references to “OTC”, if any, represent over-the-counter. Unless otherwise noted, the “reporting period” represents the period from August 1, 2014 through January 31, 2015.
Putnam Research Fund (the fund) is a diversified series of Putnam Investment Funds (the Trust), a Massachusetts business trust registered under the Investment Company Act of 1940, as amended, as an open-end management investment company. The goal of the fund is to seek capital appreciation. The fund invests mainly in common stocks (growth or value stocks or both) of large U.S. companies that Putnam Management believes have favorable investment potential. For example, the fund may purchase stocks of companies with stock prices that reflect a value lower than that which Putnam Management places on the company. Putnam Management may also consider other factors it believes will cause the stock price to rise. Putnam Management may consider, among other factors, a company’s valuation, financial strength, growth potential, competitive position in its industry, projected future earnings, cash flows and dividends when deciding whether to buy or sell investments.
The fund offers class A, class B, class C, class M, class R and class Y shares. Class A and class M shares are sold with a maximum front-end sales charge of 5.75% and 3.50%, respectively, and generally do not pay a contingent deferred sales charge. Class B shares, which convert to class A shares after approximately eight years, do not pay a front-end sales charge and are subject to a contingent deferred sales charge if those shares are redeemed within six years of purchase. Class C shares have a one-year 1.00% contingent deferred sales charge and do not convert to class A shares. Class R shares, which are not available to all investors, are sold at net asset value. The expenses for class A, class B, class C, class M and class R shares may differ based on the distribution fee of each class, which is identified in Note 2. Class Y shares, which are sold at net asset value, are generally subject to the same expenses as class A, class B, class C, class M and class R shares, but do not bear a distribution fee. Class Y shares are not available to all investors.
In the normal course of business, the fund enters into contracts that may include agreements to indemnify another party under given circumstances. The fund’s maximum exposure under these arrangements is unknown as this would involve future claims that may be, but have not yet been, made against the fund. However, the fund’s management team expects the risk of material loss to be remote.
Note 1: Significant accounting policies
The following is a summary of significant accounting policies consistently followed by the fund in the preparation of its financial statements. The preparation of financial statements is in conformity with accounting principles generally accepted in the United States of America and requires management to make estimates and assumptions that affect the reported amounts of assets and liabilities in the financial statements and the reported amounts of increases and decreases in net assets from operations. Actual results could differ from those estimates. Subsequent events after the Statement of assets and liabilities date through the date that the financial statements were issued have been evaluated in the preparation of the financial statements.
Investment income, realized and unrealized gains and losses and expenses of the fund are borne pro-rata based on the relative net assets of each class to the total net assets of the fund, except that each class bears expenses unique to that class (including the distribution fees applicable to such classes). Each class votes as a class only with respect to its own distribution plan or other matters on which a class vote is required by law or determined by the Trustees. If the fund were liquidated, shares of each class would receive their pro-rata share of the net assets of the fund. In addition, the Trustees declare separate dividends on each class of shares.
Security valuation Portfolio securities and other investments are valued using policies and procedures adopted by the Board of Trustees. The Trustees have formed a Pricing Committee to oversee the implementation of these procedures and has delegated responsibility for valuing the fund’s assets in accordance with these procedures to Putnam Management. Putnam Management has established an internal Valuation Committee that is responsible for making fair value determinations, evaluating the effectiveness of the pricing policies of the fund and reporting to the Pricing Committee.
Investments for which market quotations are readily available are valued at the last reported sales price on their principal exchange, or official closing price for certain markets, and are classified as Level 1 securities under Accounting Standards Codification 820 Fair Value Measurements and Disclosures (ASC 820). If no sales are
Research Fund 35
reported, as in the case of some securities that are traded OTC, a security is valued at its last reported bid price and is generally categorized as a Level 2 security.
Investments in open-end investment companies (excluding exchange-traded funds), if any, which can be classified as Level 1 or Level 2 securities, are valued based on their net asset value. The net asset value of such investment companies equals the total value of their assets less their liabilities and divided by the number of their outstanding shares.
Market quotations are not considered to be readily available for certain debt obligations and other investments; such investments are valued on the basis of valuations furnished by an independent pricing service approved by the Trustees or dealers selected by Putnam Management. Such services or dealers determine valuations for normal institutional-size trading units of such securities using methods based on market transactions for comparable securities and various relationships, generally recognized by institutional traders, between securities (which consider such factors as security prices, yields, maturities and ratings). These securities will generally be categorized as Level 2. Short-term securities with remaining maturities of 60 days or less may be valued at amortized cost, which approximates fair value, and are classified as Level 2 securities.
Many securities markets and exchanges outside the U.S. close prior to the close of the New York Stock Exchange and therefore the closing prices for securities in such markets or on such exchanges may not fully reflect events that occur after such close but before the close of the New York Stock Exchange. Accordingly, on certain days, the fund will fair value foreign equity securities taking into account multiple factors including movements in the U.S. securities markets, currency valuations and comparisons to the valuation of American Depository Receipts, exchange-traded funds and futures contracts. These securities, which would generally be classified as Level 1 securities, will be transferred to Level 2 of the fair value hierarchy when they are valued at fair value. The number of days on which fair value prices will be used will depend on market activity and it is possible that fair value prices will be used by the fund to a significant extent. At the close of the reporting period, fair value pricing was used for certain foreign securities in the portfolio. Securities quoted in foreign currencies, if any, are translated into U.S. dollars at the current exchange rate.
To the extent a pricing service or dealer is unable to value a security or provides a valuation that Putnam Management does not believe accurately reflects the security’s fair value, the security will be valued at fair value by Putnam Management in accordance with policies and procedures approved by the Trustees. Certain investments, including certain restricted and illiquid securities and derivatives, are also valued at fair value following procedures approved by the Trustees. These valuations consider such factors as significant market or specific security events such as interest rate or credit quality changes, various relationships with other securities, discount rates, U.S. Treasury, U.S. swap and credit yields, index levels, convexity exposures, recovery rates, sales and other multiples and resale restrictions. These securities are classified as Level 2 or as Level 3 depending on the priority of the significant inputs.
To assess the continuing appropriateness of fair valuations, the Valuation Committee reviews and affirms the reasonableness of such valuations on a regular basis after considering all relevant information that is reasonably available. Such valuations and procedures are reviewed periodically by the Trustees. The fair value of securities is generally determined as the amount that the fund could reasonably expect to realize from an orderly disposition of such securities over a reasonable period of time. By its nature, a fair value price is a good faith estimate of the value of a security in a current sale and does not reflect an actual market price, which may be different by a material amount.
Security transactions and related investment income Security transactions are recorded on the trade date (the date the order to buy or sell is executed). Gains or losses on securities sold are determined on the identified cost basis.
Interest income, net of any applicable withholding taxes, is recorded on the accrual basis. Dividend income, net of any applicable withholding taxes, is recognized on the ex-dividend date except that certain dividends from foreign securities, if any, are recognized as soon as the fund is informed of the ex-dividend date. Non-cash dividends, if any, are recorded at the fair value of the securities received. Dividends representing a return of capital or capital gains, if any, are reflected as a reduction of cost and/or as a realized gain.
All premiums/discounts are amortized/accreted on a yield-to-maturity basis.
Foreign currency translation The accounting records of the fund are maintained in U.S. dollars. The fair value of foreign securities, currency holdings, and other assets and liabilities is recorded in the books and records of the fund after translation to U.S. dollars based on the exchange rates on that day. The cost of each security is determined using historical exchange rates. Income and withholding taxes are translated at prevailing exchange rates when earned or incurred. The fund does not isolate that portion of realized or unrealized gains or losses resulting
36 Research Fund
from changes in the foreign exchange rate on investments from fluctuations arising from changes in the market prices of the securities. Such gains and losses are included with the net realized and unrealized gain or loss on investments. Net realized gains and losses on foreign currency transactions represent net realized exchange gains or losses on closed forward currency contracts, disposition of foreign currencies, currency gains and losses realized between the trade and settlement dates on securities transactions and the difference between the amount of investment income and foreign withholding taxes recorded on the fund’s books and the U.S. dollar equivalent amounts actually received or paid. Net unrealized appreciation and depreciation of assets and liabilities in foreign currencies arise from changes in the value of open forward currency contracts and assets and liabilities other than investments at the period end, resulting from changes in the exchange rate.
Options contracts The fund uses options contracts to hedge against changes in values of securities it owns, owned or expects to own, and to manage downside risks.
The potential risk to the fund is that the change in value of options contracts may not correspond to the change in value of the hedged instruments. In addition, losses may arise from changes in the value of the underlying instruments if there is an illiquid secondary market for the contracts, if interest or exchange rates move unexpectedly or if the counterparty to the contract is unable to perform. Realized gains and losses on purchased options are included in realized gains and losses on investment securities. If a written call option is exercised, the premium originally received is recorded as an addition to sales proceeds. If a written put option is exercised, the premium originally received is recorded as a reduction to the cost of investments.
Exchange-traded options are valued at the last sale price or, if no sales are reported, the last bid price for purchased options and the last ask price for written options. OTC traded options are valued using prices supplied by dealers.
Options on swaps are similar to options on securities except that the premium paid or received is to buy or grant the right to enter into a previously agreed upon interest rate or credit default contract. Forward premium swap option contracts include premiums that have extended settlement dates. The delayed settlement of the premiums is factored into the daily valuation of the option contracts. In the case of interest rate cap and floor contracts, in return for a premium, ongoing payments between two parties are based on interest rates exceeding a specified rate, in the case of a cap contract, or falling below a specified rate in the case of a floor contract.
Written option contracts outstanding at period end, if any, are listed after the fund’s portfolio.
Futures contracts The fund uses futures contracts to equitize cash.
The potential risk to the fund is that the change in value of futures contracts may not correspond to the change in value of the hedged instruments. In addition, losses may arise from changes in the value of the underlying instruments, if there is an illiquid secondary market for the contracts, if interest or exchange rates move unexpectedly or if the counterparty to the contract is unable to perform. With futures, there is minimal counterparty credit risk to the fund since futures are exchange traded and the exchange’s clearinghouse, as counterparty to all exchange traded futures, guarantees the futures against default. Risks may exceed amounts recognized on the Statement of assets and liabilities. When the contract is closed, the fund records a realized gain or loss equal to the difference between the value of the contract at the time it was opened and the value at the time it was closed.
Futures contracts are valued at the quoted daily settlement prices established by the exchange on which they trade. The fund and the broker agree to exchange an amount of cash equal to the daily fluctuation in the value of the futures contract. Such receipts or payments are known as “variation margin.”
Futures contracts outstanding at period end, if any, are listed after the fund’s portfolio.
Forward currency contracts The fund buys and sells forward currency contracts, which are agreements between two parties to buy and sell currencies at a set price on a future date. These contracts are used to hedge foreign exchange risk.
The U.S. dollar value of forward currency contracts is determined using current forward currency exchange rates supplied by a quotation service. The fair value of the contract will fluctuate with changes in currency exchange rates. The contract is marked to market daily and the change in fair value is recorded as an unrealized gain or loss. The fund records a realized gain or loss equal to the difference between the value of the contract at the time it was opened and the value at the time it was closed when the contract matures or by delivery of the currency. The fund could be exposed to risk if the value of the currency changes unfavorably, if the counterparties to the contracts are unable to meet the terms of their contracts or if the fund is unable to enter into a closing position. Risks may exceed amounts recognized on the Statement of assets and liabilities.
Forward currency contracts outstanding at period end, if any, are listed after the fund’s portfolio.
Research Fund 37
Total return swap contracts The fund entered into OTC total return swap contracts, which are arrangements to exchange a market linked return for a periodic payment, both based on a notional principal amount, to manage exposure to specific sectors or industries and to manage exposure to specific securities.
To the extent that the total return of the security, index or other financial measure underlying the transaction exceeds or falls short of the offsetting interest rate obligation, the fund will receive a payment from or make a payment to the counterparty. OTC total return swap contracts are marked to market daily based upon quotations from an independent pricing service or market makers and the change, if any, is recorded as an unrealized gain or loss. Payments received or made are recorded as realized gains or losses. Certain OTC total return swap contracts may include extended effective dates. Payments related to these swap contracts are accrued based on the terms of the contract. The fund could be exposed to credit or market risk due to unfavorable changes in the fluctuation of interest rates or in the price of the underlying security or index, the possibility that there is no liquid market for these agreements or that the counterparty may default on its obligation to perform. The fund’s maximum risk of loss from counterparty risk is the fair value of the contract. This risk may be mitigated by having a master netting arrangement between the fund and the counterparty. Risk of loss may exceed amounts recognized on the Statement of assets and liabilities.
OTC total return swap contracts outstanding, including their respective notional amounts at period end, if any, are listed after the fund’s portfolio.
Master agreements The fund is a party to ISDA (International Swaps and Derivatives Association, Inc.) Master Agreements (Master Agreements) with certain counterparties that govern OTC derivative and foreign exchange contracts entered into from time to time. The Master Agreements may contain provisions regarding, among other things, the parties’ general obligations, representations, agreements, collateral requirements, events of default and early termination. With respect to certain counterparties, in accordance with the terms of the Master Agreements, collateral posted to the fund is held in a segregated account by the fund’s custodian and with respect to those amounts which can be sold or repledged, is presented in the fund’s portfolio.
Collateral pledged by the fund is segregated by the fund’s custodian and identified in the fund’s portfolio. Collateral can be in the form of cash or debt securities issued by the U.S. Government or related agencies or other securities as agreed to by the fund and the applicable counterparty. Collateral requirements are determined based on the fund’s net position with each counterparty.
Termination events applicable to the fund may occur upon a decline in the fund’s net assets below a specified threshold over a certain period of time. Termination events applicable to counterparties may occur upon a decline in the counterparty’s long-term and short-term credit ratings below a specified level. In each case, upon occurrence, the other party may elect to terminate early and cause settlement of all derivative and foreign exchange contracts outstanding, including the payment of any losses and costs resulting from such early termination, as reasonably determined by the terminating party. Any decision by one or more of the fund’s counterparties to elect early termination could impact the fund’s future derivative activity.
At the close of the reporting period, the fund had a net liability position of $275,199 on open derivative contracts subject to the Master Agreements. Collateral posted by the fund at period end for these agreements totaled $151,000 and may include amounts related to unsettled agreements.
Securities lending The fund may lend securities, through its agent, to qualified borrowers in order to earn additional income. The loans are collateralized by cash in an amount at least equal to the fair value of the securities loaned. The fair value of securities loaned is determined daily and any additional required collateral is allocated to the fund on the next business day. The risk of borrower default will be borne by the fund’s agent; the fund will bear the risk of loss with respect to the investment of the cash collateral. Income from securities lending is included in investment income on the Statement of operations. Cash collateral is invested in Putnam Cash Collateral Pool, LLC, a limited liability company managed by an affiliate of Putnam Management. Investments in Putnam Cash Collateral Pool, LLC are valued at its closing net asset value each business day. There are no management fees charged to Putnam Cash Collateral Pool, LLC. At the close of the reporting period, the fund received cash collateral of $10,875,733 and the value of securities loaned amounted to $10,473,165. Certain of these securities were sold prior to the close of the reporting period and are included in Receivable for investments sold on the Statement of assets and liabilities.
Interfund lending The fund, along with other Putnam funds, may participate in an interfund lending program pursuant to an exemptive order issued by the SEC. This program allows the fund to borrow from or lend to other Putnam funds that permit such transactions. Interfund lending transactions are subject to each fund’s investment
38 Research Fund
policies and borrowing and lending limits. Interest earned or paid on the interfund lending transaction will be based on the average of certain current market rates. During the reporting period, the fund did not utilize the program.
Lines of credit The fund participates, along with other Putnam funds, in a $392.5 million unsecured committed line of credit and a $235.5 million unsecured uncommitted line of credit, both provided by State Street. Borrowings may be made for temporary or emergency purposes, including the funding of shareholder redemption requests and trade settlements. Interest is charged to the fund based on the fund’s borrowing at a rate equal to the Federal Funds rate plus 1.25% for the committed line of credit and the Federal Funds rate plus 1.30% for the uncommitted line of credit. A closing fee equal to 0.04% of the committed line of credit and 0.04% of the uncommitted line of credit has been paid by the participating funds. In addition, a commitment fee of 0.11% per annum on any unutilized portion of the committed line of credit is allocated to the participating funds based on their relative net assets and paid quarterly. During the reporting period, the fund had no borrowings against these arrangements.
Federal taxes It is the policy of the fund to distribute all of its taxable income within the prescribed time period and otherwise comply with the provisions of the Internal Revenue Code of 1986, as amended (the Code), applicable to regulated investment companies. It is also the intention of the fund to distribute an amount sufficient to avoid imposition of any excise tax under Section 4982 of the Code.
The fund is subject to the provisions of Accounting Standards Codification 740 Income Taxes (ASC 740). ASC 740 sets forth a minimum threshold for financial statement recognition of the benefit of a tax position taken or expected to be taken in a tax return. The fund did not have a liability to record for any unrecognized tax benefits in the accompanying financial statements. No provision has been made for federal taxes on income, capital gains or unrealized appreciation on securities held nor for excise tax on income and capital gains. Each of the fund’s federal tax returns for the prior three fiscal years remains subject to examination by the Internal Revenue Service.
The fund may also be subject to taxes imposed by governments of countries in which it invests. Such taxes are generally based on either income or gains earned or repatriated. The fund accrues and applies such taxes to net investment income, net realized gains and net unrealized gains as income and/or capital gains are earned. In some cases, the fund may be entitled to reclaim all or a portion of such taxes, and such reclaim amounts, if any, are reflected as an asset on the fund’s books. In many cases, however, the fund may not receive such amounts for an extended period of time, depending on the country of investment.
At July 31, 2014, the fund had a capital loss carryover of $58,069,513 available to the extent allowed by the Code to offset future net capital gain, if any. The amounts of the carryovers and the expiration dates are:
Loss carryover
Short-term
Long-term
Total
Expiration
$7,265,798
N/A
$7,265,798
July 31, 2017
50,803,715
N/A
50,803,715
July 31, 2018
Under the Regulated Investment Company Modernization Act of 2010, the fund will be permitted to carry forward capital losses incurred in taxable years beginning after December 22, 2010 for an unlimited period. However, any losses incurred will be required to be utilized prior to the losses incurred in pre-enactment tax years. As a result of this ordering rule, pre-enactment capital loss carryforwards may be more likely to expire unused. Additionally, post-enactment capital losses that are carried forward will retain their character as either short-term or long-term capital losses rather than being considered all short-term as under previous law.
The aggregate identified cost on a tax basis is $263,232,435, resulting in gross unrealized appreciation and depreciation of $39,048,075 and $8,920,083, respectively, or net unrealized appreciation of $30,127,992.
Distributions to shareholders Distributions to shareholders from net investment income are recorded by the fund on the ex-dividend date. Distributions from capital gains, if any, are recorded on the ex-dividend date and paid at least annually. The amount and character of income and gains to be distributed are determined in accordance with income tax regulations, which may differ from generally accepted accounting principles. Dividend sources are estimated at the time of declaration. Actual results may vary. Any non-taxable return of capital cannot be determined until final tax calculations are completed after the end of the fund’s fiscal year. Reclassifications are made to the fund’s capital accounts to reflect income and gains available for distribution (or available capital loss carryovers) under income tax regulations.
Research Fund 39
Expenses of the Trust Expenses directly charged or attributable to any fund will be paid from the assets of that fund. Generally, expenses of the Trust will be allocated among and charged to the assets of each fund on a basis that the Trustees deem fair and equitable, which may be based on the relative assets of each fund or the nature of the services performed and relative applicability to each fund.
Note 2: Management fee, administrative services and other transactions
The fund pays Putnam Management a management fee (based on the fund’s average net assets and computed and paid monthly) at annual rates that may vary based on the average of the aggregate net assets of most open-end funds, as defined in the fund’s management contract, sponsored by Putnam Management. Such annual rates may vary as follows:
0.710%
of the first $5 billion,
0.660%
of the next $5 billion,
0.610%
of the next $10 billion,
0.560%
of the next $10 billion,
0.510%
of the next $50 billion,
0.490%
of the next $50 billion,
0.480%
of the next $100 billion and
0.475%
of any excess thereafter.
Putnam Management has contractually agreed, through June 30, 2015, to waive fees or reimburse the fund’s expenses to the extent necessary to limit the cumulative expenses of the fund, exclusive of brokerage, interest, taxes, investment-related expenses, extraordinary expenses, acquired fund fees and expenses and payments under the fund’s investor servicing contract, investment management contract and distribution plans, on a fiscal year-to-date basis to an annual rate of 0.20% of the fund’s average net assets over such fiscal year-to-date period. During the reporting period, the fund’s expenses were not reduced as a result of this limit.
Putnam Investments Limited (PIL), an affiliate of Putnam Management, is authorized by the Trustees to manage a separate portion of the assets of the fund as determined by Putnam Management from time to time. Putnam Management pays a quarterly sub-management fee to PIL for its services at an annual rate of 0.35% of the average net assets of the portion of the fund managed by PIL.
The Putnam Advisory Company, LLC (PAC), an affiliate of Putnam Management, is authorized by the Trustees to manage a separate portion of the assets of the fund, as designated from time to time by Putnam Management or PIL. Putnam Management or PIL, as applicable, pays a quarterly sub-advisory fee to PAC for its services at the annual rate of 0.35% of the average net assets of the portion of the fund’s assets for which PAC is engaged as sub-adviser.
Putnam Management voluntarily reimbursed the fund $8,071 for a trading error which occurred during the reporting period. The effect of the loss incurred and the reimbursement by Putnam Management of such amounts had no material impact on total return.
The fund reimburses Putnam Management an allocated amount for the compensation and related expenses of certain officers of the fund and their staff who provide administrative services to the fund. The aggregate amount of all such reimbursements is determined annually by the Trustees.
Custodial functions for the fund’s assets are provided by State Street. Custody fees are based on the fund’s asset level, the number of its security holdings and transaction volumes.
Putnam Investor Services, Inc., an affiliate of Putnam Management, provides investor servicing agent functions to the fund. Putnam Investor Services, Inc. received fees for investor servicing based on the fund’s retail asset level, the number of shareholder accounts in the fund and the level of defined contribution plan assets in the fund. Investor servicing fees will not exceed an annual rate of 0.32% of the fund’s average net assets. During the reporting period, the expenses for each class of shares related to investor servicing fees were as follows:
Class A
$232,025
Class B
9,510
Class C
14,559
Class M
4,519
Class R
615
Class Y
15,652
Total
$276,880
The fund has entered into expense offset arrangements with Putnam Investor Services, Inc. and State Street whereby Putnam Investor Services, Inc.’s and State Street’s fees are reduced by credits allowed on cash balances. The fund also reduced expenses through brokerage/service arrangements. For the reporting period, the fund’s
40 Research Fund
expenses were reduced by $250 under the expense offset arrangements and by $8,966 under the brokerage/service arrangements.
Each Independent Trustee of the fund receives an annual Trustee fee, of which $161, as a quarterly retainer, has been allocated to the fund, and an additional fee for each Trustees meeting attended. Trustees also are reimbursed for expenses they incur relating to their services as Trustees.
The fund has adopted a Trustee Fee Deferral Plan (the Deferral Plan) which allows the Trustees to defer the receipt of all or a portion of Trustees fees payable on or after July 1, 1995. The deferred fees remain invested in certain Putnam funds until distribution in accordance with the Deferral Plan.
The fund has adopted an unfunded noncontributory defined benefit pension plan (the Pension Plan) covering all Trustees of the fund who have served as a Trustee for at least five years and were first elected prior to 2004. Benefits under the Pension Plan are equal to 50% of the Trustee’s average annual attendance and retainer fees for the three years ended December 31, 2005. The retirement benefit is payable during a Trustee’s lifetime, beginning the year following retirement, for the number of years of service through December 31, 2006. Pension expense for the fund is included in Trustee compensation and expenses in the Statement of operations. Accrued pension liability is included in Payable for Trustee compensation and expenses in the Statement of assets and liabilities. The Trustees have terminated the Pension Plan with respect to any Trustee first elected after 2003.
The fund has adopted distribution plans (the Plans) with respect to its class A, class B, class C, class M and class R shares pursuant to Rule 12b–1 under the Investment Company Act of 1940. The purpose of the Plans is to compensate Putnam Retail Management Limited Partnership, an indirect wholly-owned subsidiary of Putnam Investments, LLC, for services provided and expenses incurred in distributing shares of the fund. The Plans provide for payments by the fund to Putnam Retail Management Limited Partnership at an annual rate of up to 0.35%, 1.00%, 1.00%, 1.00% and 1.00% of the average net assets attributable to class A, class B, class C, class M and class R shares, respectively. The Trustees have approved payment by the fund at an annual rate of 0.25%, 1.00%, 1.00%, 0.75% and 0.50% of the average net assets attributable to class A, class B, class C, class M and class R shares, respectively. During the reporting period, the class specific expenses related to distribution fees were as follows:
Class A
$292,558
Class B
48,005
Class C
73,495
Class M
17,110
Class R
1,547
Total
$432,715
For the reporting period, Putnam Retail Management Limited Partnership, acting as underwriter, received net commissions of $10,375 and $92 from the sale of class A and class M shares, respectively, and received $2,350 and $160 in contingent deferred sales charges from redemptions of class B and class C shares, respectively.
A deferred sales charge of up to 1.00% and 0.65% is assessed on certain redemptions of class A and class M shares, respectively. For the reporting period, Putnam Retail Management Limited Partnership, acting as underwriter, received $11 and no monies on class A and class M redemptions, respectively.
Note 3: Purchases and sales of securities
During the reporting period, cost of purchases and proceeds from sales, excluding short-term investments were as follows:
Cost of purchases
Proceeds from sales
Investments in securities (Long-term)
$147,864,530
$141,968,429
U.S. government securities (Long-term)
—
—
Total
$147,864,530
$141,968,429
Research Fund 41
Written option transactions during the reporting period are summarized as follows:
Written option contract amounts
Written option premiums
Written options outstanding at the beginning of the reporting period
$9,801
$3,379
Options opened
22,398
10,527
Options exercised
—
—
Options expired
(32,199)
(13,906)
Options closed
—
—
Written options outstanding at the end of the reporting period
$—
$—
Note 4: Capital shares
At the close of the reporting period, there were an unlimited number of shares of beneficial interest authorized. Transactions in capital shares were as follows:
Six months ended 1/31/15
Year ended 7/31/14
Class A
Shares
Amount
Shares
Amount
Shares sold
402,211
$10,111,106
477,913
$11,170,273
Shares issued in connection with reinvestment of distributions
85,802
2,223,974
64,913
1,431,341
488,013
12,335,080
542,826
12,601,614
Shares repurchased
(470,811)
(11,841,609)
(1,105,107)
(24,781,344)
Net increase (decrease)
17,202
$493,471
(562,281)
$(12,179,730)
Six months ended 1/31/15
Year ended 7/31/14
Class B
Shares
Amount
Shares
Amount
Shares sold
26,487
$630,783
34,195
$713,463
Shares issued in connection with reinvestment of distributions
1,073
26,198
187
3,887
27,560
656,981
34,382
717,350
Shares repurchased
(50,559)
(1,191,770)
(139,550)
(2,948,417)
Net decrease
(22,999)
$(534,789)
(105,168)
$(2,231,067)
Six months ended 1/31/15
Year ended 7/31/14
Class C
Shares
Amount
Shares
Amount
Shares sold
63,575
$1,510,515
44,977
$953,787
Shares issued in connection with reinvestment of distributions
1,971
48,132
648
13,487
65,546
1,558,647
45,625
967,274
Shares repurchased
(52,069)
(1,237,627)
(66,761)
(1,415,912)
Net increase (decrease)
13,477
$321,020
(21,136)
$(448,638)
42 Research Fund
Six months ended 1/31/15
Year ended 7/31/14
Class M
Shares
Amount
Shares
Amount
Shares sold
15,613
$370,691
4,332
$94,512
Shares issued in connection with reinvestment of distributions
1,080
26,977
553
11,777
16,693
397,668
4,885
106,289
Shares repurchased
(10,024)
(241,249)
(25,220)
(549,678)
Net increase (decrease)
6,669
$156,419
(20,335)
$(443,389)
Six months ended 1/31/15
Year ended 7/31/14
Class R
Shares
Amount
Shares
Amount
Shares sold
31,198
$772,592
2,859
$64,735
Shares issued in connection with reinvestment of distributions
323
8,315
41
895
31,521
780,907
2,900
65,630
Shares repurchased
(3,838)
(93,061)
(4,756)
(101,882)
Net increase (decrease)
27,683
$687,846
(1,856)
$(36,252)
Six months ended 1/31/15
Year ended 7/31/14
Class Y
Shares
Amount
Shares
Amount
Shares sold
194,714
$4,896,573
82,360
$1,865,588
Shares issued in connection with reinvestment of distributions
7,856
204,817
5,153
114,251
202,570
5,101,390
87,513
1,979,839
Shares repurchased
(41,973)
(1,053,076)
(114,910)
(2,555,513)
Net increase (decrease)
160,597
$4,048,314
(27,397)
$(575,674)
Note 5: Affiliated transactions
Transactions during the reporting period with Putnam Short Term Investment Fund, which is under common ownership and control, were as follows:
Name of affiliate
Fair value at the beginning of the reporting period
Purchase cost
Sale proceeds
Investment income
Fair value at the end of the reporting period
Putnam Short Term Investment Fund*
$8,807,537
$26,525,668
$25,119,620
$3,902
$10,213,585
Totals
$8,807,537
$26,525,668
$25,119,620
$3,902
$10,213,585
*Management fees charged to Putnam Short Term Investment Fund have been waived by Putnam Management.
Note 6: Market, credit and other risks
In the normal course of business, the fund trades financial instruments and enters into financial transactions where risk of potential loss exists due to changes in the market (market risk) or failure of the contracting party to the transaction to perform (credit risk). The fund may be exposed to additional credit risk that an institution or other entity with which the fund has unsettled or open transactions will default. Investments in foreign securities involve certain risks, including those related to economic instability, unfavorable political developments, and currency fluctuations.
Research Fund 43
Note 7: Summary of derivative activity
The volume of activity for the reporting period for any derivative type that was held during the period is listed below and was as follows based on an average of the holdings at the end of each fiscal quarter:
Written equity option contracts (contract amount) (Note 3)
$6,000
Futures contracts (number of contracts)
50
Forward currency contracts (contract amount)
$26,400,000
OTC total return swap contracts (notional)
$2,600,000
The following is a summary of the fair value of derivative instruments as of the close of the reporting period:
Fair value of derivative instruments as of the close of the reporting period
Asset derivatives
Liability derivatives
Derivatives not accounted for as hedging instruments under ASC 815
Statement of assets and liabilities location
Fair value
Statement of assets and liabilities location
Fair value
Foreign exchange contracts
Receivables
$1,314,483
Payables
$372,448
Equity contracts
Investments, Receivables
11,233
Payables, Net assets — Unrealized depreciation
217,846*
Total
$1,325,716
$590,294
*Includes cumulative depreciation of futures contracts as reported in the fund’s portfolio. Only current day’s variation margin is reported within the Statement of assets and liabilities.
The following is a summary of realized and change in unrealized gains or losses of derivative instruments on the Statement of operations for the reporting period (see Note 1):
Amount of realized gain or (loss) on derivatives recognized in net gain or (loss) on investments
Derivatives not accounted for as hedging instruments under ASC 815
Options
Futures
Forward currency contracts
Swaps
Total
Foreign exchange contracts
$—
$—
$1,033,852
$—
$1,033,852
Equity contracts
(15,604)
34,675
—
(92,287)
$(73,216)
Total
$(15,604)
$34,675
$1,033,852
$(92,287)
$960,636
Change in unrealized appreciation or (depreciation) on derivatives recognized in net gain or (loss) on investments
Derivatives not accounted for as hedging instruments under ASC 815
Options
Futures
Forward currency contracts
Swaps
Total
Foreign exchange contracts
$—
$—
$821,317
$—
$821,317
Equity contracts
(9,121)
(95,046)
—
(33,318)
$(137,485)
Total
$(9,121)
$(95,046)
$821,317
$(33,318)
$683,832
44 Research Fund
This page left blank intentionally.
Research Fund 45
46 Research Fund
Note 8: Offsetting of financial and derivative assets and liabilities
The following table summarizes any derivatives, repurchase agreements and reverse repurchase agreements, at the end of the reporting period, that are subject to an enforceable master netting agreement or similar agreement. For securities lending transactions or borrowing transactions associated with securities sold short, if any, see Note 1. For financial reporting purposes, the fund does not offset financial assets and financial liabilities that are subject to the master netting agreements in the Statement of assets and liabilities.
Barclays Bank PLC
Citibank, N.A.
Credit Suisse International
Deutsche Bank AG
Goldman Sachs International
HSBC Bank USA, National Association
JPMorgan Chase Bank N.A.
Merrill Lynch, Pierce, Fenner & Smith, Inc.
State Street Bank and Trust Co.
WestPac Banking Corp.
Total
Assets:
OTC Total return swap contracts*#
$—
$—
$—
$—
$—
$—
$5,734
$—
$—
$—
$5,734
Futures contracts§
—
—
—
—
—
—
—
—
—
—
—
Forward currency contracts#
31,050
582,046
52,109
178,093
—
28,526
352,099
—
—
90,560
1,314,483
Purchased options**#
—
—
—
—
5,499
—
—
—
—
—
5,499
Total Assets
$31,050
$582,046
$52,109
$178,093
$5,499
$28,526
$357,833
$—
$—
$90,560
$1,325,716
Liabilities:
OTC Total return swap contracts*#
—
—
—
—
53,516
—
—
—
—
—
53,516
Futures contracts§
—
—
—
—
—
—
—
121,905
—
—
121,905
Forward currency contracts#
101,369
—
105,026
27,131
—
48,626
6,450
—
83,846
—
372,448
Written options#
—
—
—
—
—
—
—
—
—
—
—
Total Liabilities
$101,369
$—
$105,026
$27,131
$53,516
$48,626
$6,450
$121,905
$83,846
$—
$547,869
Total Financial and Derivative Net Assets
$(70,319)
$582,046
$(52,917)
$150,962
$(48,017)
$(20,100)
$351,383
$(121,905)
$(83,846)
$90,560
$777,847
Total collateral received (pledged)†##
$—
$582,046
$—
$110,000
$(48,017)
$—
$240,000
$—
$—
$—
Net amount
$(70,319)
$—
$(52,917)
$40,962
$—
$(20,100)
$111,383
$(121,905)
$(83,846)
$90,560
*
Excludes premiums, if any. Included in unrealized appreciation and depreciation on OTC swap contracts on the Statement of assets and liabilities.
**
Included with Investments in securities on the Statement of assets and liabilities.
†
Additional collateral may be required from certain brokers based on individual agreements.
#
Covered by master netting agreement (Note 1).
##
Any over-collateralization of total financial and derivative net assets is not shown. Collateral may include amounts related to unsettled agreements.
§
Includes current day’s variation margin only as reported on the Statement of assets and liabilities, which is not collateralized. Cumulative appreciation/(depreciation) for futures contracts is represented in the tables listed after the fund’s portfolio.
Research Fund 47
Services for shareholders
Investor services
Systematic investment plan Tell us how much you wish to invest regularly — weekly, semimonthly, or monthly — and the amount you choose will be transferred automatically from your checking or savings account. There’s no additional fee for this service, and you can suspend it at any time. This plan may be a great way to save for college expenses or to plan for your retirement.
Please note that regular investing does not guarantee a profit or protect against loss in a declining market. Before arranging a systematic investment plan, consider your financial ability to continue making purchases in periods when prices are low.
Systematic exchange You can make regular transfers from one Putnam fund to another Putnam fund. There are no additional fees for this service, and you can cancel or change your options at any time.
Dividends PLUS You can choose to have the dividend distributions from one of your Putnam funds automatically reinvested in another Putnam fund at no additional charge.
Free exchange privilege You can exchange money between Putnam funds free of charge, as long as they are the same class of shares. A signature guarantee is required if you are exchanging more than $500,000. The fund reserves the right to revise or terminate the exchange privilege.
Reinstatement privilege If you’ve sold Putnam shares or received a check for a dividend or capital gain, you may reinvest the proceeds with Putnam within 90 days of the transaction and they will be reinvested at the fund’s current net asset value — with no sales charge. However, reinstatement of class B shares may have special tax consequences. Ask your financial or tax representative for details.
Check-writing service You have ready access to many Putnam accounts. It’s as simple as writing a check, and there are no special fees or service charges. For more information about the check-writing service, call Putnam or visit our website.
Dollar cost averaging When you’re investing for long-term goals, it’s time, not timing, that counts. Investing on a systematic basis is a better strategy than trying to figure out when the markets will go up or down. This means investing the same amount of money regularly over a long period. This method of investing is called dollar cost averaging. When a fund’s share price declines, your investment dollars buy more shares at lower prices. When it increases, they buy fewer shares. Over time, you will pay a lower average price per share.
For more information
Visit the Individual Investors section at putnam.com A secure section of our website contains complete information on your account, including balances and transactions, updated daily. You may also conduct transactions, such as exchanges, additional investments, and address changes. Log on today to get your password.
Call us toll free at 1-800-225-1581 Ask a helpful Putnam representative or your financial advisor for details about any of these or other services, or see your prospectus.
48 Research Fund
Fund information
Founded over 75 years ago, Putnam Investments was built around the concept that a balance between risk and reward is the hallmark of a well-rounded financial program. We manage over 100 funds across income, value, blend, growth, asset allocation, absolute return, and global sector categories.
Investment Manager
Putnam Investment Management, LLC One Post Office Square Boston, MA 02109
Investment Sub-Manager
Putnam Investments Limited 57–59 St James’s Street London, England SW1A 1LD
Investment Sub-Advisor
The Putnam Advisory Company, LLC One Post Office Square Boston, MA 02109
Marketing Services
Putnam Retail Management One Post Office Square Boston, MA 02109
Custodian
State Street Bank and Trust Company
Legal Counsel
Ropes & Gray LLP
Trustees
Jameson A. Baxter, Chair Liaquat Ahamed Ravi Akhoury Barbara M. Baumann Charles B. Curtis Robert J. Darretta Katinka Domotorffy John A. Hill Paul L. Joskow Kenneth R. Leibler Robert E. Patterson George Putnam, III Robert L. Reynolds W. Thomas Stephens
Officers
Robert L. Reynolds President
Jonathan S. Horwitz Executive Vice President, Principal Executive Officer, and Compliance Liaison
Steven D. Krichmar Vice President and Principal Financial Officer
Robert T. Burns Vice President and Chief Legal Officer
Robert R. Leveille Vice President and Chief Compliance Officer
Michael J. Higgins Vice President, Treasurer, and Clerk
Janet C. Smith Vice President, Principal Accounting Officer, and Assistant Treasurer
Susan G. Malloy Vice President and Assistant Treasurer
James P. Pappas Vice President
Mark C. Trenchard Vice President and BSA Compliance Officer
Nancy E. Florek Vice President, Director of Proxy Voting and Corporate Governance, Assistant Clerk, and Associate Treasurer
This report is for the information of shareholders of Putnam Research Fund. It may also be used as sales literature when preceded or accompanied by the current prospectus, the most recent copy of Putnam’s Quarterly Performance Summary, and Putnam’s Quarterly Ranking Summary. For more recent performance, please visit putnam.com. Investors should carefully consider the investment objectives, risks, charges, and expenses of a fund, which are described in its prospectus. For this and other information or to request a prospectus or summary prospectus, call 1-800-225-1581 toll free. Please read the prospectus carefully before investing. The fund’s Statement of Additional Information contains additional information about the fund’s Trustees and is available without charge upon request by calling 1-800-225-1581.
Item 2. Code of Ethics:
Not applicable
Item 3. Audit Committee Financial Expert:
Not applicable
Item 4. Principal Accountant Fees and Services:
Not applicable
Item 5. Audit Committee of Listed Registrants
Not applicable
Item 6. Schedule of Investments:
The registrant’s schedule of investments in unaffiliated issuers is included in the report to shareholders in Item 1 above.
Item 7. Disclosure of Proxy Voting Policies and Procedures For Closed-End Management Investment Companies:
Not applicable
Item 8. Portfolio Managers of Closed-End Investment Companies
Not Applicable
Item 9. Purchases of Equity Securities by Closed-End Management Investment Companies and Affiliated Purchasers:
Not applicable
Item 10. Submission of Matters to a Vote of Security Holders:
Not applicable
Item 11. Controls and Procedures:
(a) The registrant’s principal executive officer and principal financial officer have concluded, based on their evaluation of the effectiveness of the design and operation of the registrant’s disclosure controls and procedures as of a date within 90 days of the filing date of this report, that the design and operation of such procedures are generally effective to provide reasonable assurance that information required to be disclosed by the registrant in this report is recorded, processed, summarized and reported within the time periods specified in the Commission’s rules and forms.
(b) Changes in internal control over financial reporting: Not applicable
Item 12. Exhibits:
(a)(1) Not applicable
(a)(2) Separate certifications for the principal executive officer and principal financial officer of the registrant as required by Rule 30a-2(a) under the Investment Company Act of 1940, as amended, are filed herewith.
(b) The certifications required by Rule 30a-2(b) under the Investment Company Act of 1940, as amended, are filed herewith.
Putnam Investment Funds
By (Signature and Title):
/s/ Janet C. Smith Janet C. Smith Principal Accounting Officer
Date: March 31, 2015
Pursuant to the requirements of the Securities Exchange Act of 1934 and the Investment Company Act of 1940, this report has been signed below by the following persons on behalf of the registrant and in the capacities and on the dates indicated.
By (Signature and Title):
/s/ Jonathan S. Horwitz Jonathan S. Horwitz Principal Executive Officer
Date: March 31, 2015
By (Signature and Title):
/s/ Steven D. Krichmar Steven D. Krichmar Principal Financial Officer
Date: March 31, 2015
We use cookies on this site to provide a more responsive and personalized service. Continuing to browse, clicking I Agree, or closing this banner indicates agreement. See our Cookie Policy for more information.