| | |
| UNITED STATES
SECURITIES AND EXCHANGE COMMISSION |
| | |
| CERTIFIED SHAREHOLDER REPORT OF REGISTERED
MANAGEMENT INVESTMENT COMPANIES
|
| | |
| Investment Company Act file number: | (811-07237) |
| | |
| Exact name of registrant as specified in charter: | Putnam Investment Funds |
| | |
| Address of principal executive offices: | One Post Office Square, Boston, Massachusetts 02109 |
| | |
| Name and address of agent for service: | Robert T. Burns, Vice President
One Post Office Square
Boston, Massachusetts 02109 |
| | |
| Copy to: | Bryan Chegwidden, Esq.
Ropes & Gray LLP
1211 Avenue of the Americas
New York, New York 10036 |
| | |
| Registrant’s telephone number, including area code: | (617) 292-1000 |
| | |
| Date of fiscal year end: | February 29, 2016 |
| | |
| Date of reporting period: | March 1, 2015 – August 31, 2015 |
| | |
|
Item 1. Report to Stockholders: | |
| | |
| The following is a copy of the report transmitted to stockholders pursuant to Rule 30e-1 under the Investment Company Act of 1940: | |
Putnam
Small Cap Value
Fund
Semiannual report
8 | 31 | 15
| | | |
| Message from the Trustees | 1 | | |
| | |
| About the fund | 2 | | |
| | |
| Performance snapshot | 4 | | |
| | |
| Interview with your fund’s portfolio manager | 5 | | |
| | |
| Your fund’s performance | 11 | | |
| | |
| Your fund’s expenses | 13 | | |
| | |
| Terms and definitions | 15 | | |
| | |
| Other information for shareholders | 16 | | |
| | |
| Trustee approval of management contract | 17 | | |
| | |
| Financial statements | 22 | | |
| | |
Consider these risks before investing: Investments in small and/or midsize companies increase the risk of greater price fluctuations. Value stocks may fail to rebound, and the market may not favor value-style investing. Stock prices may fall or fail to rise over time for several reasons, including general financial market conditions and factors related to a specific issuer or industry. You can lose money by investing in the fund.
Message from the Trustees
Dear Fellow Shareholder:
A string of negative developments has kept markets on edge in recent months. Greece’s debt crisis flared, oil prices dropped again, and the People’s Bank of China, in an effort to stem a slumping economy, unexpectedly devalued the yuan. The cumulative effect of these events appeared to contribute to a brief correction in global stock markets during late summer.
Through it all, the U.S. economy has remained resilient, which is likely to prompt the Federal Reserve to raise interest rates for the first time in over a decade. If higher interest rates in the U.S. markets attract global capital, regions outside of the United States could experience greater market volatility and constrained growth.
In contrast, central banks in Europe, Japan, and China appear committed, for the foreseeable future, to low-interest-rate policies to foster growth. The different trajectories of central bank policies may be another source of volatility.
Amid changing market conditions, you may find it reassuring to know that Putnam’s portfolio managers have deep experience and research-driven viewpoints that guide their investment decisions. The interview in the following pages provides you with additional insight into current economic and market conditions, as well as a review of your fund’s performance. We also would encourage you to consult with your financial advisor to discuss whether your mix of investments requires any adjustment to stay on track toward your long-term goals.
In closing, we would like to recognize Charles Curtis, who recently retired as a Putnam Trustee, for his 14 years of dedicated service. And, as always, thank you for investing with Putnam.

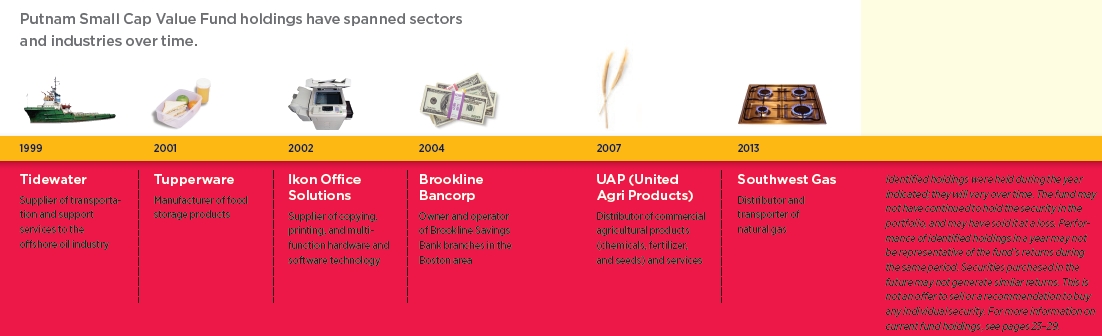
About the fund
Seeking to uncover opportunities that others may have overlooked
Small-cap investing can often be as much an art as a science. The small-cap universe is large and can change quickly, and many promising smaller companies fail to capture Wall Street’s attention. Finding companies that offer the best prospects for success takes a trained eye and a disciplined approach.
Because of their size, smaller companies are usually more agile than larger ones and are often able to respond more quickly to market changes or demand for new products and services. Many small-cap companies are in the early stages of their corporate lives, having recently made the transition to being publicly traded. They also react differently to economic conditions than do larger companies. On one hand, an uptick in the economy can make it easier for small companies and start-ups to obtain financing; conversely, smaller companies with less robust balance sheets often have greater difficulty weathering a market downturn.
Putnam Small Cap Value Fund’s manager, Eric Harthun, looks for stocks issued by companies that he considers to be undervalued or that appear to have improving businesses or a catalyst that may unlock their value. Events such as a change in management, restructuring, or a new product often have this effect. In addition, Eric considers stocks that have recently fallen out of favor with investors. Because stocks of smaller companies are historically more volatile than those of blue-chip companies, he also carefully considers each stock’s risk/reward profile.
In-depth analysis is key to successful stock selection
Drawing on the expertise of a dedicated team of stock analysts, the fund’s portfolio manager seeks attractive value stocks. Once a stock is selected for the portfolio, it is regularly assessed to ensure that it continues to be attractive. Areas of focus include:
Valuation Considering how each stock is valued, seeking stocks whose valuations are attractive relative to the company’s growth potential.
Change Focusing on company fundamentals against the broader context of industry trends to identify whether individual companies possess a catalyst for positive change.
Quality Seeking high-quality companies, with characteristics such as solid management teams, sound business models, and high levels of free-cash flow.
| | | |
| 2 | Small Cap Value Fund | Small Cap Value Fund | 3 |
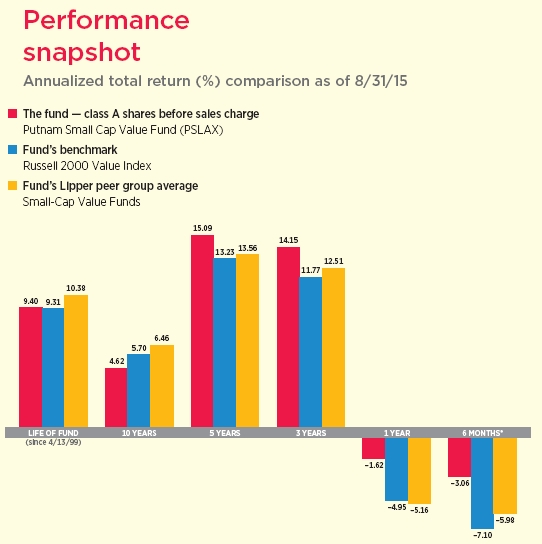
Current performance may be lower or higher than the quoted past performance, which cannot guarantee future results. Share price, principal value, and return will fluctuate, and you may have a gain or a loss when you sell your shares. Performance of class A shares assumes reinvestment of distributions and does not account for taxes. Fund returns in the bar chart do not reflect a sales charge of 5.75%; had they, returns would have been lower. See pages 5 and 11–13 for additional performance information. For a portion of the periods, the fund had expense limitations, without which returns would have been lower. To obtain the most recent month-end performance, visit putnam.com.
* Returns for the six-month period are not annualized, but cumulative.
Interview with your fund’s portfolio manager

Eric, what was the market environment like for small-cap stocks during the six-month reporting period ended August 31, 2015?
The U.S. employment rate and other economic indicators continued to improve during the reporting period, but the Federal Reserve left its benchmark federal funds rate unchanged, adding that it expected to begin raising short-term rates before the end of 2015. Investors weighed a dynamic confluence of additional factors, including the strong U.S. dollar; low crude oil prices; the Greek debt crisis; and slower growth in China, which contributed to heightened volatility in the financial markets worldwide.
With all the uncertainty, the equity markets became agitated in July, but the volume rose considerably in August when the People’s Bank of China unexpectedly devalued the Chinese yuan against the U.S. dollar. The surprise announcement followed earlier reports that China’s exports fell in July and that producer prices continued their nearly four-year deflationary trend. Many analysts concluded that the devaluation was a further indication of the economic stress in China despite the government’s previous efforts to boost exports and stimulate the domestic economy.
The unexpected announcement sent global equity markets sharply lower before rebounding on reassuring comments from central bankers and positive U.S. data. However, worries about the pace of global
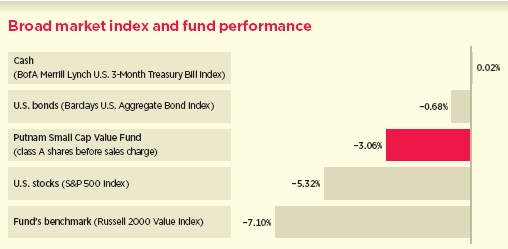
This comparison shows your fund’s performance in the context of broad market indexes for the six months ended 8/31/15. See pages 4 and 11–13 for additional fund performance information. Index descriptions can be found on page 15.
growth and considerable market volatility persisted, intensifying the debate about whether the U.S. recovery had picked up enough for Fed officials to introduce the first rate increase in nearly a decade.
While absolute returns for all equity asset classes were negative, U.S. small-cap stocks showed greater resilience than U.S. mid- and large-cap stocks, as well as international stocks, during the six-month reporting period. We believe this was due in large part to the strong U.S. dollar. A strong dollar makes exports less competitive, affecting corporate earnings of large, multinational companies by reducing the value of profits from international operations. Smaller companies tend to be more insulated from the effects of the strong dollar, since they are more domestically focused than large companies.
How did Putnam Small Cap Value Fund perform in this environment?
While the fund’s absolute return at net asset value was negative for the six months ended August 31, 2015, its overall performance was better than that of its benchmark, the Russell 2000 Value Index, and the average return of its Lipper peer group.
Performance results were strongest in the financials, consumer discretionary, and industrials sectors. Effective stock selection within financials contributed the most to performance. Substantial contributors included the fund’s investments in StanCorp Financial, which is not in the benchmark, and a greater-than-benchmark weighting in Walker & Dunlop. In addition, the beneficial effects of an underweight allocation to the consumer discretionary sector complemented positive stock selection effects within the sector. The top contributors to performance within the sector included out-of-benchmark
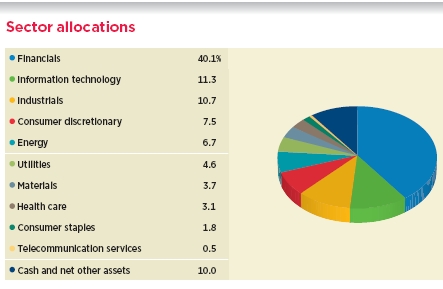
Allocations are shown as a percentage of the fund’s net assets as of 8/31/15. Cash and net other assets, if any, represent the market value weights of cash, derivatives, short-term securities, and other unclassified assets in the portfolio. Summary information may differ from the portfolio schedule included in the financial statements due to the inclusion of derivative securities, any interest accruals, the exclusion of as-of trades, if any, and the use of different classifications of securities for presentation purposes. Holdings and allocations may vary over time.
positions in Smith & Wesson and Installed Building Products. Top contributors to performance within industrials included an overweight position in Quality Distribution and an out-of-benchmark position in PGT. The stock of Quality Distribution appreciated significantly following the company’s announcement that it was being acquired. We sold the holding to lock in profits soon after the transaction was announced this past May.

The fund’s investments in four of the ten sectors that compose the benchmark — information technology, materials, health care, and telecommunications services — detracted from the fund’s performance returns. Positive stock selection effects within the consumer staples sector offset the negative effects of an underweight to the sector.
Were there any significant changes in the fund’s strategy during the period as a result of the increased market volatility?
I did not make any significant changes to the portfolio’s investment strategy. Given the high degree of uncertainty in the market today, I believe it is as important as ever to hold true to our disciplined investment philosophy and process. I continued to manage the fund with a bottom-up, research-driven investment process. Stocks are selected based on their fundamental characteristics rather than on economic or sector-level expectations. Over the course of the six-month reporting period, I modestly increased the portfolio’s exposure to the energy sector and decreased exposure to the industrials and financials sectors.
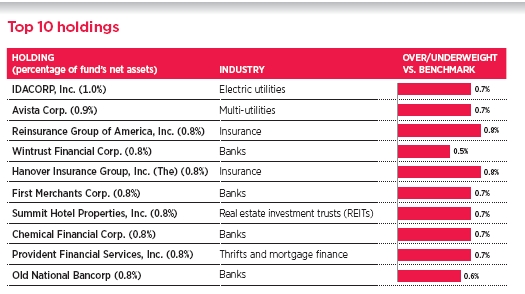
This table shows the fund’s top 10 holdings by percentage of the fund’s net assets as of 8/31/15. Short-term investments and derivatives, if any, are excluded. Holdings may vary over time.
What holdings or strategies detracted from investment results during the reporting period?
The fund’s biggest disappointment was Pernix Therapeutics in the health-care sector. Pernix acquires, develops, and commercializes prescription drugs. The company focuses on buying drugs that are not blockbusters and then re-marketing them. With the recent acquisition of a drug, Pernix’s inventory levels climbed — resulting in higher price discounting to increase sales, which hurt earnings. Given our deteriorating outlook for the company, we sold the stock before the close of the reporting period.
In the energy sector, investments in Aegean Marine Petroleum Network, a marine fuel logistics firm that supplies marine fuel to vessels at sea, detracted from results. The company’s stock price suffered in the wake of falling energy prices. Low fuel prices reduced barriers to entry in the market, which increased competition and pressured the company’s profit margins.
What holdings contributed most to performance during the reporting period?
The top performer was StanCorp Financial, which provides insurance and retirement products. The company’s stock rallied strongly in late July after Meiji Yasuda Life Insurance announced that it had reached an agreement to acquire StanCorp at a significant premium.
The second best-performing stock, Walker & Dunlop, also hailed from the financials sector. The company originates loans for multi-family units in the $10–$25 million range. I bought the stock believing that Fannie Mae and Freddie Mac would become more aggressive in lending due to political changes, which, in turn, would accelerate refinancings in commercial real estate. This view proved to be correct, as Walker & Dunlop’s stock
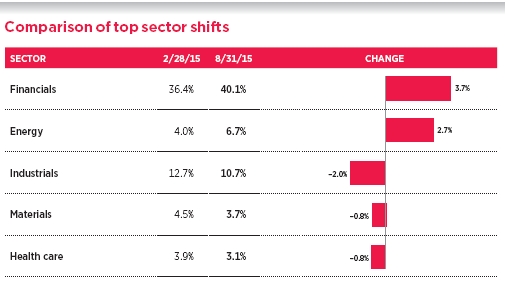
This chart shows the fund’s largest allocation shifts, by percentage, over the past six months. Allocations are shown as a percentage of the fund’s net assets. Current period summary information may differ from the portfolio schedule included in the financial statements due to the inclusion of derivative securities, any interest accruals, the exclusion of as-of trades, if any, and the use of different classifications of securities for presentation purposes. Holdings and allocations may vary over time.
rose strongly as a result of management’s ability to dramatically grow its market share in a competitive landscape that is populated with some of the country’s largest banks and mortgage brokerage firms.
In the consumer discretionary sector, Installed Building Products, a residential insulation installation business, has effected a number of successful acquisitions recently and continues to expand its reach. This holding is benefitting from the housing recovery, which I believe can compensate for the company’s exposure to commodity prices.
After the recent market correction, what are your expectations for the performance of small-cap stocks in the coming months?
For some time, I have been cognizant of the extended U.S. bull market, which has seen stock market valuations approach the top quartile of their historical averages. In the closing weeks of the period, however, a confluence of economic and geopolitical crosscurrents contributed to a sharp and sudden correction and extreme day-to-day volatility.
Small-cap stocks tend to experience greater price volatility than large-cap stocks because they are more narrowly focused in a segment of an industry, while large-cap stocks are market leaders with a greater diversity of revenue sources — which often include global sources. However, in an interesting twist of fate, U.S. large caps demonstrated greater volatility during the August correction than small caps. Large U.S. multinational companies generally source more of their earnings from overseas where, as we see today, the economies are considerably weaker than they are in the United States. Those weaker foreign earnings are then converted back into a stronger U.S. dollar compared with a year ago, further diminishing the earnings. On the surface, it appeared that investors saw greater risk in the global outlook than in the U.S. outlook, helping small caps outperform.
However, I don’t consider small caps immune from volatility in the coming months. At the same time, meaningful market corrections can create compelling investment opportunities. I will continue to look for inexpensively priced, high-quality companies that possess some sort of overlooked catalyst with the potential to drive stock prices higher.
Thank you, Eric, for your time and insights today.
The views expressed in this report are exclusively those of Putnam Management and are subject to change. They are not meant as investment advice.
Please note that the holdings discussed in this report may not have been held by the fund for the entire period. Portfolio composition is subject to review in accordance with the fund’s investment strategy and may vary in the future. Current and future portfolio holdings are subject to risk.
Portfolio Manager Eric N. Harthun has an M.B.A. from The University of Chicago Booth School of Business and a B.S. from San Diego State University. He joined Putnam in 2000 and has been in the investment industry since 1994.
IN THE NEWS
Collapsing commodity prices caused turbulence in global markets this summer. One of the leading factors pressuring prices was the economic slowdown in China. China remains the world’s second-largest economy and the largest consumer of most commodities, representing about 40% to 50% of global commodity demand. Much of China’s slowdown has been attributed to government efforts to transform the economy by changing the engine of growth from exports to consumer spending. With less need to build new infrastructure, the demand for commodities such as oil, copper, and steel has fallen. As a result, global prices of such commodities have dropped nearly 20% year to date. Furthermore, the price of crude oil is more than 50% below levels seen in 2014, although supply and demand factors outside China have played a significant role in the price movements for this commodity. Global oil supplies surged as North American companies increased production, and the United States emerged as one of the world’s largest producers. Meanwhile, OPEC has continued to maintain last year’s levels of oil production, but demand growth has moderated.
Your fund’s performance
This section shows your fund’s performance, price, and distribution information for periods ended August 31, 2015, the end of the first half of its current fiscal year. In accordance with regulatory requirements for mutual funds, we also include performance information as of the most recent calendar quarter-end and expense information taken from the fund’s current prospectus. Performance should always be considered in light of a fund’s investment strategy. Data represent past performance. Past performance does not guarantee future results. More recent returns may be less or more than those shown. Investment return and principal value will fluctuate, and you may have a gain or a loss when you sell your shares. Performance information does not reflect any deduction for taxes a shareholder may owe on fund distributions or on the redemption of fund shares. For the most recent month-end performance, please visit the Individual Investors section at putnam.com or call Putnam at 1-800-225-1581. Class R, R5, R6, and Y shares are not available to all investors. See the Terms and Definitions section in this report for definitions of the share classes offered by your fund.
Fund performance Total return for periods ended 8/31/15
| | | | | | | | | | | | |
| | Class A | Class B | Class C | Class M | Class R | Class R5 | Class R6 | Class Y |
| (inception dates) | (4/13/99) | (5/3/99) | (7/26/99) | (3/29/00) | (3/30/07) | (11/1/13) | (11/1/13) | (1/3/01) |
|
| | Before | After | | | | | Before | After | Net | Net | Net | Net |
| sales | sales | Before | After | Before | After | sales | sales | asset | asset | asset | asset |
| charge | charge | CDSC | CDSC | CDSC | CDSC | charge | charge | value | value | value | value |
|
| Annual average | | | | | | | | | | | | |
| (life of fund) | 9.40% | 9.00% | 9.10% | 9.10% | 8.59% | 8.59% | 8.86% | 8.62% | 9.13% | 9.65% | 9.67% | 9.65% |
|
| 10 years | 57.15 | 48.12 | 50.39 | 50.39 | 45.89 | 45.89 | 49.60 | 44.36 | 53.30 | 61.42 | 61.72 | 61.22 |
| Annual average | 4.62 | 4.01 | 4.17 | 4.17 | 3.85 | 3.85 | 4.11 | 3.74 | 4.36 | 4.90 | 4.92 | 4.89 |
|
| 5 years | 101.90 | 90.29 | 94.31 | 92.31 | 94.61 | 94.61 | 97.02 | 90.12 | 99.30 | 104.60 | 104.97 | 104.34 |
| Annual average | 15.09 | 13.73 | 14.21 | 13.97 | 14.24 | 14.24 | 14.53 | 13.71 | 14.79 | 15.39 | 15.44 | 15.36 |
|
| 3 years | 48.72 | 40.17 | 45.25 | 42.25 | 45.37 | 45.37 | 46.40 | 41.27 | 47.47 | 49.86 | 50.13 | 49.67 |
| Annual average | 14.15 | 11.91 | 13.25 | 12.47 | 13.28 | 13.28 | 13.55 | 12.21 | 13.82 | 14.43 | 14.50 | 14.39 |
|
| 1 year | –1.62 | –7.28 | –2.39 | –7.09 | –2.32 | –3.25 | –2.10 | –5.52 | –1.88 | –1.34 | –1.17 | –1.37 |
|
| 6 months | –3.06 | –8.64 | –3.44 | –8.26 | –3.44 | –4.40 | –3.27 | –6.66 | –3.17 | –2.89 | –2.83 | –2.96 |
|
Current performance may be lower or higher than the quoted past performance, which cannot guarantee future results. After-sales-charge returns for class A and M shares reflect the deduction of the maximum 5.75% and 3.50% sales charge, respectively, levied at the time of purchase. Class B share returns after contingent deferred sales charge (CDSC) reflect the applicable CDSC, which is 5% in the first year, declining over time to 1% in the sixth year, and is eliminated thereafter. Class C share returns after CDSC reflect a 1% CDSC for the first year that is eliminated thereafter. Class R, R5, R6, and Y shares have no initial sales charge or CDSC. Performance for class B, C, M, R, and Y shares before their inception is derived from the historical performance of class A shares, adjusted for the applicable sales charge (or CDSC) and the higher operating expenses for such shares, except for class Y shares, for which 12b-1 fees are not applicable. Performance for class R5 and R6 shares prior to their inception is derived from the historical performance of class Y shares and has not been adjusted for the lower investor servicing fees applicable to class R5 and R6 shares; had it, returns would have been higher.
For a portion of the periods, the fund had expense limitations, without which returns would have been lower.
Class B share performance reflects conversion to class A shares after six years.
Comparative index returns For periods ended 8/31/15
| | |
| | | Lipper Small-Cap Value |
| | Russell 2000 Value Index | Funds category average* |
|
| Annual average (life of fund) | 9.31% | 10.38% |
|
| 10 years | 74.08 | 88.92 |
| Annual average | 5.70 | 6.46 |
|
| 5 years | 86.15 | 89.52 |
| Annual average | 13.23 | 13.56 |
|
| 3 years | 39.63 | 42.71 |
| Annual average | 11.77 | 12.51 |
|
| 1 year | –4.95 | –5.16 |
|
| 6 months | –7.10 | –5.98 |
|
Index and Lipper results should be compared with fund performance before sales charge, before CDSC, or at net asset value.
* Over the 6-month, 1-year, 3-year, 5-year, 10-year, and life-of-fund periods ended 8/31/15, there were 311, 300, 254, 209, 141, and 59 funds, respectively, in this Lipper category.
Fund price and distribution information For the six-month period ended 8/31/15
| | | | | | | | |
| | Class A | Class B | Class C | Class M | Class R | Class R5 | Class R6 | Class Y |
|
| | Before | After | Net | Net | Before | After | Net | Net | Net | Net |
| | sales | sales | asset | asset | sales | sales | asset | asset | asset | asset |
| Share value | charge | charge | value | value | charge | charge | value | value | value | value |
|
| 2/28/15 | $15.34 | $16.28 | $13.10 | $13.09 | $14.06 | $14.57 | $15.12 | $15.90 | $15.90 | $15.86 |
|
| 8/31/15 | 14.87 | 15.78 | 12.65 | 12.64 | 13.60 | 14.09 | 14.64 | 15.44 | 15.45 | 15.39 |
|
The classification of distributions, if any, is an estimate. Before-sales-charge share value and current dividend rate for class A and M shares, if applicable, do not take into account any sales charge levied at the time of purchase. After-sales-charge share value, current dividend rate, and current 30-day SEC yield, if applicable, are calculated assuming that the maximum sales charge (5.75% for class A shares and 3.50% for class M shares) was levied at the time of purchase. Final distribution information will appear on your year-end tax forms.
The fund made no distributions during the period.
Fund performance as of most recent calendar quarter
Total return for periods ended 9/30/15
| | | | | | | | | | | | |
| | Class A | Class B | Class C | Class M | Class R | Class R5 | Class R6 | Class Y |
| (inception dates) | (4/13/99) | (5/3/99) | (7/26/99) | (3/29/00) | (3/30/07) | (11/1/13) | (11/1/13) | (1/3/01) |
|
| | Before | After | | | | | Before | After | Net | Net | Net | Net |
| sales | sales | Before | After | Before | After | sales | sales | asset | asset | asset | asset |
| charge | charge | CDSC | CDSC | CDSC | CDSC | charge | charge | value | value | value | value |
|
| Annual average | | | | | | | | | | | | |
| (life of fund) | 9.11% | 8.72% | 8.82% | 8.82% | 8.31% | 8.31% | 8.58% | 8.34% | 8.84% | 9.38% | 9.39% | 9.37% |
|
| 10 years | 51.66 | 42.94 | 45.11 | 45.11 | 40.77 | 40.77 | 44.39 | 39.34 | 47.99 | 55.91 | 56.10 | 55.69 |
| Annual average | 4.25 | 3.64 | 3.79 | 3.79 | 3.48 | 3.48 | 3.74 | 3.37 | 4.00 | 4.54 | 4.55 | 4.53 |
|
| 5 years | 74.64 | 64.60 | 68.28 | 66.28 | 68.20 | 68.20 | 70.28 | 64.32 | 72.45 | 77.21 | 77.42 | 76.96 |
| Annual average | 11.80 | 10.48 | 10.97 | 10.71 | 10.96 | 10.96 | 11.23 | 10.44 | 11.52 | 12.12 | 12.15 | 12.09 |
|
| 3 years | 39.80 | 31.76 | 36.75 | 33.75 | 36.60 | 36.60 | 37.69 | 32.87 | 38.74 | 41.05 | 41.22 | 40.86 |
| Annual average | 11.82 | 9.63 | 11.00 | 10.18 | 10.96 | 10.96 | 11.25 | 9.94 | 11.53 | 12.15 | 12.19 | 12.10 |
|
| 1 year | 0.63 | –5.16 | –0.08 | –4.88 | –0.09 | –1.05 | 0.13 | –3.37 | 0.40 | 1.03 | 1.07 | 0.95 |
|
| 6 months | –7.54 | –12.86 | –7.85 | –12.46 | –7.86 | –8.78 | –7.74 | –10.96 | –7.59 | –7.33 | –7.27 | –7.35 |
|
See the discussion following the fund performance table on page 11 for information about the calculation of fund performance.
Your fund’s expenses
As a mutual fund investor, you pay ongoing expenses, such as management fees, distribution fees (12b-1 fees), and other expenses. Using the following information, you can estimate how these expenses affect your investment and compare them with the expenses of other funds. You may also pay one-time transaction expenses, including sales charges (loads) and redemption fees, which are not shown in this section and would have resulted in higher total expenses. For more information, see your fund’s prospectus or talk to your financial representative.
Expense ratios
| | | | | | | | |
| | Class A | Class B | Class C | Class M | Class R | Class R5 | Class R6 | Class Y |
|
| Total annual operating expenses for | | | | | | | | |
| the fiscal year ended 2/28/15 | 1.44% | 2.19% | 2.19% | 1.94% | 1.69% | 1.14% | 1.04% | 1.19% |
|
| Annualized expense ratio for the | | | | | | | | |
| six-month period ended 8/31/15 | 1.13% | 1.88% | 1.88% | 1.63% | 1.38% | 0.85% | 0.75% | 0.88% |
|
Fiscal-year expense information in this table is taken from the most recent prospectus, is subject to change, and may differ from that shown for the annualized expense ratio and in the financial highlights of this report.
Prospectus expense information also includes the impact of acquired fund fees and expenses of 0.26%, which is not included in the financial highlights or annualized expense ratios. Expenses are shown as a percentage of average net assets.
Expenses per $1,000
The following table shows the expenses you would have paid on a $1,000 investment in the fund from March 1, 2015, to August 31, 2015. It also shows how much a $1,000 investment would be worth at the close of the period, assuming actual returns and expenses.
| | | | | | | | |
| | Class A | Class B | Class C | Class M | Class R | Class R5 | Class R6 | Class Y |
|
| Expenses paid per $1,000*† | $5.59 | $9.29 | $9.29 | $8.06 | $6.83 | $4.21 | $3.72 | $4.36 |
|
| Ending value (after expenses) | $969.40 | $965.60 | $965.60 | $967.30 | $968.30 | $971.10 | $971.70 | $970.40 |
|
* Expenses for each share class are calculated using the fund’s annualized expense ratio for each class, which represents the ongoing expenses as a percentage of average net assets for the six months ended 8/31/15. The expense ratio may differ for each share class.
† Expenses are calculated by multiplying the expense ratio by the average account value for the period; then multiplying the result by the number of days in the period; and then dividing that result by the number of days in the year.
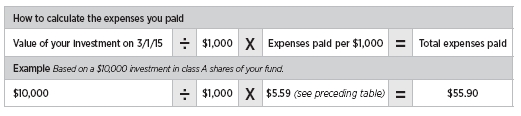
Estimate the expenses you paid
To estimate the ongoing expenses you paid for the six months ended August 31, 2015, use the following calculation method. To find the value of your investment on March 1, 2015, call Putnam at 1-800-225-1581.
Compare expenses using the SEC’s method
The Securities and Exchange Commission (SEC) has established guidelines to help investors assess fund expenses. Per these guidelines, the following table shows your fund’s expenses based on a $1,000 investment, assuming a hypothetical 5% annualized return. You can use this information to compare the ongoing expenses (but not transaction expenses or total costs) of investing in the fund with those of other funds. All mutual fund shareholder reports will provide this information to help you make this comparison. Please note that you cannot use this information to estimate your actual ending account balance and expenses paid during the period.
| | | | | | | | |
| | Class A | Class B | Class C | Class M | Class R | Class R5 | Class R6 | Class Y |
|
| Expenses paid per $1,000*† | $5.74 | $9.53 | $9.53 | $8.26 | $7.00 | $4.32 | $3.81 | $4.47 |
|
| Ending value (after expenses) | $1,019.46 | $1,015.69 | $1,015.69 | $1,016.94 | $1,018.20 | $1,020.86 | $1,021.37 | $1,020.71 |
|
* Expenses for each share class are calculated using the fund’s annualized expense ratio for each class, which represents the ongoing expenses as a percentage of average net assets for the six months ended 8/31/15. The expense ratio may differ for each share class.
† Expenses are calculated by multiplying the expense ratio by the average account value for the six-month period; then multiplying the result by the number of days in the six-month period; and then dividing that result by the number of days in the year.
Terms and definitions
Important terms
Total return shows how the value of the fund’s shares changed over time, assuming you held the shares through the entire period and reinvested all distributions in the fund.
Before sales charge, or net asset value, is the price, or value, of one share of a mutual fund, without a sales charge. Before-sales-charge figures fluctuate with market conditions, and are calculated by dividing the net assets of each class of shares by the number of outstanding shares in the class.
After sales charge is the price of a mutual fund share plus the maximum sales charge levied at the time of purchase. After-sales-charge performance figures shown here assume the 5.75% maximum sales charge for class A shares and 3.50% for class M shares.
Contingent deferred sales charge (CDSC) is generally a charge applied at the time of the redemption of class B or C shares and assumes redemption at the end of the period. Your fund’s class B CDSC declines over time from a 5% maximum during the first year to 1% during the sixth year. After the sixth year, the CDSC no longer applies. The CDSC for class C shares is 1% for one year after purchase.
Share classes
Class A shares are generally subject to an initial sales charge and no CDSC (except on certain redemptions of shares bought without an initial sales charge).
Class B shares are not subject to an initial sales charge and may be subject to a CDSC.
Class C shares are not subject to an initial sales charge and are subject to a CDSC only if the shares are redeemed during the first year.
Class M shares have a lower initial sales charge and a higher 12b-1 fee than class A shares and no CDSC (except on certain redemptions of shares bought without an initial sales charge).
Class R shares are not subject to an initial sales charge or CDSC and are available only to employer-sponsored retirement plans.
Class R5 and R6 shares are not subject to an initial sales charge or CDSC, and carry no 12b-1 fee. They are available to employer-sponsored retirement plans.
Class Y shares are not subject to an initial sales charge or CDSC, and carry no 12b-1 fee. They are generally only available to corporate and institutional clients and clients in other approved programs.
Comparative indexes
Barclays U.S. Aggregate Bond Index is an unmanaged index of U.S. investment-grade fixed-income securities.
BofA Merrill Lynch U.S. 3-Month Treasury Bill Index is an unmanaged index that seeks to measure the performance of U.S. Treasury bills available in the marketplace.
Russell 2000 Value Index is an unmanaged index of those companies in the small-cap Russell 2000 Index chosen for their value orientation.
S&P 500 Index is an unmanaged index of common stock performance.
Indexes assume reinvestment of all distributions and do not account for fees. Securities and performance of a fund and an index will differ. You cannot invest directly in an index.
Lipper is a third-party industry-ranking entity that ranks mutual funds. Its rankings do not reflect sales charges. Lipper rankings are based on total return at net asset value relative to other funds that have similar current investment styles or objectives as determined by Lipper. Lipper may change a fund’s category assignment at its discretion. Lipper category averages reflect performance trends for funds within a category.
Other information for shareholders
Important notice regarding delivery of shareholder documents
In accordance with Securities and Exchange Commission (SEC) regulations, Putnam sends a single copy of annual and semiannual shareholder reports, prospectuses, and proxy statements to Putnam shareholders who share the same address, unless a shareholder requests otherwise. If you prefer to receive your own copy of these documents, please call Putnam at 1-800-225-1581, and Putnam will begin sending individual copies within 30 days.
Proxy voting
Putnam is committed to managing our mutual funds in the best interests of our shareholders. The Putnam funds’ proxy voting guidelines and procedures, as well as information regarding how your fund voted proxies relating to portfolio securities during the 12-month period ended June 30, 2015, are available in the Individual Investors section of putnam.com, and on the SEC’s website, www.sec.gov. If you have questions about finding forms on the SEC’s website, you may call the SEC at 1-800-SEC-0330. You may also obtain the Putnam funds’ proxy voting guidelines and procedures at no charge by calling Putnam’s Shareholder Services at 1-800-225-1581.
Fund portfolio holdings
The fund will file a complete schedule of its portfolio holdings with the SEC for the first and third quarters of each fiscal year on Form N-Q. Shareholders may obtain the fund’s Form N-Q on the SEC’s website at www.sec.gov. In addition, the fund’s Form N-Q may be reviewed and copied at the SEC’s Public Reference Room in Washington, D.C. You may call the SEC at 1-800-SEC-0330 for information about the SEC’s website or the operation of the Public Reference Room.
Trustee and employee fund ownership
Putnam employees and members of the Board of Trustees place their faith, confidence, and, most importantly, investment dollars in Putnam mutual funds. As of August 31, 2015, Putnam employees had approximately $492,000,000 and the Trustees had approximately $137,000,000 invested in Putnam mutual funds. These amounts include investments by the Trustees’ and employees’ immediate family members as well as investments through retirement and deferred compensation plans.
Trustee approval of management contract
General conclusions
The Board of Trustees of The Putnam Funds oversees the management of each fund and, as required by law, determines annually whether to approve the continuance of your fund’s management contract with Putnam Investment Management, LLC (“Putnam Management”) and the sub-management contract with respect to your fund between Putnam Management and its affiliate, Putnam Investments Limited (“PIL”). The Board, with the assistance of its Contract Committee, requests and evaluates all information it deems reasonably necessary under the circumstances in connection with its annual contract review. The Contract Committee consists solely of Trustees who are not “interested persons” (as this term is defined in the Investment Company Act of 1940, as amended (the “1940 Act”)) of The Putnam Funds (“Independent Trustees”).
At the outset of the review process, members of the Board’s independent staff and independent legal counsel met with representatives of Putnam Management to review the annual contract review materials furnished to the Contract Committee during the course of the previous year’s review and to discuss possible changes in these materials that might be necessary or desirable for the coming year. Following these discussions and in consultation with the Contract Committee, the Independent Trustees’ independent legal counsel requested that Putnam Management and its affiliates furnish specified information, together with any additional information that Putnam Management considered relevant, to the Contract Committee. Over the course of several months ending in June 2015, the Contract Committee met on a number of occasions with representatives of Putnam Management, and separately in executive session, to consider the information that Putnam Management provided, as well as supplemental information provided in response to additional requests made by the Contract Committee. Throughout this process, the Contract Committee was assisted by the members of the Board’s independent staff and by independent legal counsel for The Putnam Funds and the Independent Trustees.
In May 2015, the Contract Committee met in executive session to discuss and consider its recommendations with respect to the continuance of the contracts. At the Trustees’ June 19, 2015 meeting, the Contract Committee met in executive session with the other Independent Trustees to review a summary of the key financial, performance and other data that the Contract Committee considered in the course of its review. The Contract Committee then presented its written report, which summarized the key factors that the Committee had considered and set forth its recommendations. The Contract Committee then recommended, and the Independent Trustees approved, the continuance of your fund’s management and sub-management contracts, effective July 1, 2015. (Because PIL is an affiliate of Putnam Management and Putnam Management remains fully responsible for all services provided by PIL, the Trustees have not attempted to evaluate PIL as a separate entity, and all subsequent references to Putnam Management below should be deemed to include reference to PIL as necessary or appropriate in the context.)
The Independent Trustees’ approval was based on the following conclusions:
• That the fee schedule in effect for your fund represented reasonable compensation in light of the nature and quality of the services being provided to the fund, the fees paid by competitive funds, the costs incurred by Putnam Management in providing services to the fund, and the continued application of certain reductions and waivers noted below; and
• That the fee schedule in effect for your fund represented an appropriate sharing between fund shareholders and Putnam Management of such economies of scale as may exist in the management of the fund at current asset levels.
These conclusions were based on a comprehensive consideration of all information provided to the Trustees and were not the result of any single factor. Some of the factors that figured particularly in the Trustees’ deliberations and how the Trustees considered these factors are described below, although individual Trustees may have evaluated the information presented differently, giving different weights to various factors. It is also important to recognize that the management arrangements for your fund and the other Putnam funds are the result of many years of review and discussion between the Independent Trustees and Putnam Management, that some aspects of the arrangements may receive greater scrutiny in some years than others, and that the Trustees’ conclusions may be based, in part, on their consideration of fee arrangements in previous years. For example, with some minor exceptions, the funds’ current fee arrangements were implemented at the beginning of 2010 following extensive review by the Contract Committee and discussions with representatives of Putnam Management, as well as approval by shareholders.
Management fee schedules and total expenses
The Trustees reviewed the management fee schedules in effect for all Putnam funds, including fee levels and breakpoints. The Trustees also reviewed the total expenses of each Putnam fund, recognizing that in most cases management fees represented the major, but not the sole, determinant of total costs to shareholders.
In reviewing fees and expenses, the Trustees generally focus their attention on material changes in circumstances — for example, changes in assets under management, changes in a fund’s investment style, changes in Putnam Management’s operating costs or profitability, or changes in competitive practices in the mutual fund industry — that suggest that consideration of fee changes might be warranted. The Trustees concluded that the circumstances did not warrant changes to the management fee structure of your fund.
Under its management contract, your fund has the benefit of breakpoints in its management fee schedule that provide shareholders with economies of scale in the form of reduced fee levels as assets under management in the Putnam family of funds increase. The Trustees concluded that the fee schedule in effect for your fund represented an appropriate sharing of economies of scale between fund shareholders and Putnam Management.
As in the past, the Trustees also focused on the competitiveness of each fund’s total expense ratio. In order to support the effort to have fund expenses meet competitive standards, the Trustees and Putnam Management have implemented certain expense limitations. These expense limitations were: (i) a contractual expense limitation applicable to all retail open-end funds of 32 basis points on investor servicing fees and expenses and (ii) a contractual expense limitation applicable to your fund and all but two of the other open-end funds of 20 basis points on so-called “other expenses” (i.e., all expenses exclusive of management fees, distribution fees, investor servicing fees, investment-related expenses, interest, taxes, brokerage commissions, acquired fund fees and expenses and extraordinary expenses). These expense limitations attempt to maintain competitive expense levels for funds with large numbers of small shareholder accounts and funds with relatively small net assets. Most funds, including your fund, had sufficiently low expenses that these expense limitations were not operative. Putnam Management’s support
for these expense limitation arrangements was an important factor in the Trustees’ decision to approve the continuance of your fund’s management and sub-management contracts.
The Trustees reviewed comparative fee and expense information for a custom group of competitive funds selected by Lipper Inc. (“Lipper”). This comparative information included your fund’s percentile ranking for effective management fees and total expenses (excluding any applicable 12b-1 fee), which provides a general indication of your fund’s relative standing. In the custom peer group, your fund ranked in the first quintile in effective management fees (determined for your fund and the other funds in the custom peer group based on fund asset size and the applicable contractual management fee schedule) and in the first quintile in total expenses (excluding any applicable 12b-1 fees) as of December 31, 2014 (the first quintile representing the least expensive funds and the fifth quintile the most expensive funds). The fee and expense data reported by Lipper as of December 31, 2014 reflected the most recent fiscal year-end data available in Lipper’s database at that time.
In connection with their review of fund management fees and total expenses, the Trustees also reviewed the costs of the services provided and the profits realized by Putnam Management and its affiliates from their contractual relationships with the funds. This information included trends in revenues, expenses and profitability of Putnam Management and its affiliates relating to the investment management, investor servicing and distribution services provided to the funds. In this regard, the Trustees also reviewed an analysis of Putnam Management’s revenues, expenses and profitability, allocated on a fund-by-fund basis, with respect to the funds’ management, distribution, and investor servicing contracts. For each fund, the analysis presented information about revenues, expenses and profitability for each of the agreements separately and for the agreements taken together on a combined basis. The Trustees concluded that, at current asset levels, the fee schedules in place represented reasonable compensation for the services being provided and represented an appropriate sharing of such economies of scale as may exist in the management of the Putnam funds at that time.
The information examined by the Trustees as part of their annual contract review for the Putnam funds has included for many years information regarding fees charged by Putnam Management and its affiliates to institutional clients such as defined benefit pension plans, college endowments, and the like. This information included comparisons of those fees with fees charged to the Putnam funds, as well as an assessment of the differences in the services provided to these different types of clients. The Trustees observed that the differences in fee rates between institutional clients and mutual funds are by no means uniform when examined by individual asset sectors, suggesting that differences in the pricing of investment management services to these types of clients may reflect historical competitive forces operating in separate markets. The Trustees considered the fact that in many cases fee rates across different asset classes are higher on average for mutual funds than for institutional clients, as well as the differences between the services that Putnam Management provides to the Putnam funds and those that it provides to its institutional clients. The Trustees did not rely on these comparisons to any significant extent in concluding that the management fees paid by your fund are reasonable.
Investment performance
The quality of the investment process provided by Putnam Management represented a major factor in the Trustees’ evaluation of the quality of services provided by Putnam Management under your fund’s management contract. The Trustees were assisted in their review of the
Putnam funds’ investment process and performance by the work of the investment oversight committees of the Trustees, which meet on a regular basis with the funds’ portfolio teams and with the Chief Investment Officer and other senior members of Putnam Management’s Investment Division throughout the year. The Trustees concluded that Putnam Management generally provides a high-quality investment process — based on the experience and skills of the individuals assigned to the management of fund portfolios, the resources made available to them, and in general Putnam Management’s ability to attract and retain high-quality personnel — but also recognized that this does not guarantee favorable investment results for every fund in every time period.
The Trustees considered that 2014 was a year of strong competitive performance for many of the Putnam funds, with generally strong results for the U.S. equity, money market and global asset allocation funds, but relatively mixed results for the international and global equity and fixed income funds. They noted that the longer-term performance of the Putnam funds continued to be strong, exemplified by the fact that the Putnam funds were recognized by Barron’s as the sixth-best performing mutual fund complex for the five-year period ended December 31, 2014. They also noted, however, the disappointing investment performance of some funds for periods ended December 31, 2014 and considered information provided by Putnam Management regarding the factors contributing to the underperformance and actions being taken to improve the performance of these particular funds. The Trustees indicated their intention to continue to monitor performance trends to assess the effectiveness of these efforts and to evaluate whether additional actions to address areas of underperformance are warranted.
For purposes of evaluating investment performance, the Trustees generally focus on competitive industry rankings for the one-year, three-year and five-year periods. For a number of Putnam funds with relatively unique investment mandates for which meaningful competitive performance rankings are not considered to be available, the Trustees evaluated performance based on comparisons of fund returns with the returns of selected investment benchmarks. In the case of your fund, the Trustees considered that its class A share cumulative total return performance at net asset value was in the following quartiles of its Lipper peer group (Lipper Small-Cap Value Funds) for the one-year, three-year and five-year periods ended December 31, 2014 (the first quartile representing the best-performing funds and the fourth quartile the worst-performing funds):
| | | |
| One-year period | 3rd | | |
| | |
| Three-year period | 2nd | | |
| | |
| Five-year period | 2nd | | |
| | |
Over the one-year, three-year and five-year periods ended December 31, 2014, there were 295, 250 and 203 funds, respectively, in your fund’s Lipper peer group. (When considering performance information, shareholders should be mindful that past performance is not a guarantee of future results.)
The Trustees also considered Putnam Management’s continued efforts to support fund performance through initiatives including structuring compensation for portfolio managers and research analysts to enhance accountability for fund performance, emphasizing accountability in the portfolio management process, and affirming its commitment to a fundamental-driven approach to investing. The Trustees noted further that Putnam Management continued to strengthen its fundamental research capabilities by adding new investment personnel.
Brokerage and soft-dollar allocations; investor servicing
The Trustees considered various potential benefits that Putnam Management may
receive in connection with the services it provides under the management contract with your fund. These include benefits related to brokerage allocation and the use of soft dollars, whereby a portion of the commissions paid by a fund for brokerage may be used to acquire research services that are expected to be useful to Putnam Management in managing the assets of the fund and of other clients. Subject to policies established by the Trustees, soft dollars generated by these means are used primarily to acquire brokerage and research services that enhance Putnam Management’s investment capabilities and supplement Putnam Management’s internal research efforts. However, the Trustees noted that a portion of available soft dollars continues to be used to pay fund expenses. The Trustees indicated their continued intent to monitor regulatory and industry developments in this area with the assistance of their Brokerage Committee and also indicated their continued intent to monitor the allocation of the Putnam funds’ brokerage in order to ensure that the principle of seeking best price and execution remains paramount in the portfolio trading process.
Putnam Management may also receive benefits from payments that the funds make to Putnam Management’s affiliates for investor or distribution services. In conjunction with the annual review of your fund’s management and sub-management contracts, the Trustees reviewed your fund’s investor servicing agreement with Putnam Investor Services, Inc. (“PSERV”) and its distributor’s contracts and distribution plans with Putnam Retail Management Limited Partnership (“PRM”), both of which are affiliates of Putnam Management. The Trustees concluded that the fees payable by the funds to PSERV and PRM, as applicable, for such services are reasonable in relation to the nature and quality of such services, the fees paid by competitive funds, and the costs incurred by PSERV and PRM, as applicable, in providing such services.
Financial statements
A guide to financial statements
These sections of the report, as well as the accompanying Notes, constitute the fund’s financial statements.
The fund’s portfolio lists all the fund’s investments and their values as of the last day of the reporting period. Holdings are organized by asset type and industry sector, country, or state to show areas of concentration and diversification.
Statement of assets and liabilities shows how the fund’s net assets and share price are determined. All investment and non-investment assets are added together. Any unpaid expenses and other liabilities are subtracted from this total. The result is divided by the number of shares to determine the net asset value per share, which is calculated separately for each class of shares. (For funds with preferred shares, the amount subtracted from total assets includes the liquidation preference of preferred shares.)
Statement of operations shows the fund’s net investment gain or loss. This is done by first adding up all the fund’s earnings — from dividends and interest income — and subtracting its operating expenses to determine net investment income (or loss). Then, any net gain or loss the fund realized on the sales of its holdings — as well as any unrealized gains or losses over the period — is added to or subtracted from the net investment result to determine the fund’s net gain or loss for the fiscal period.
Statement of changes in net assets shows how the fund’s net assets were affected by the fund’s net investment gain or loss, by distributions to shareholders, and by changes in the number of the fund’s shares. It lists distributions and their sources (net investment income or realized capital gains) over the current reporting period and the most recent fiscal year-end. The distributions listed here may not match the sources listed in the Statement of operations because the distributions are determined on a tax basis and may be paid in a different period from the one in which they were earned. Dividend sources are estimated at the time of declaration. Actual results may vary. Any non-taxable return of capital cannot be determined until final tax calculations are completed after the end of the fund’s fiscal year.
Financial highlights provide an overview of the fund’s investment results, per-share distributions, expense ratios, net investment income ratios, and portfolio turnover in one summary table, reflecting the five most recent reporting periods. In a semiannual report, the highlights table also includes the current reporting period.
The fund’s portfolio 8/31/15 (Unaudited)
| | |
| COMMON STOCKS (86.2%)* | Shares | Value |
|
| Aerospace and defense (0.9%) | | |
| Engility Holdings, Inc. | 74,200 | $2,062,760 |
|
| Vectrus, Inc. † | 51,000 | 1,267,350 |
|
| | 3,330,110 |
| Air freight and logistics (0.6%) | | |
| Atlas Air Worldwide Holdings, Inc. † S | 42,300 | 1,747,413 |
|
| Park-Ohio Holdings Corp. | 15,049 | 542,667 |
|
| | 2,290,080 |
| Auto components (1.3%) | | |
| Goodyear Tire & Rubber Co. (The) | 83,300 | 2,479,841 |
|
| Stoneridge, Inc. † | 161,340 | 1,969,961 |
|
| | 4,449,802 |
| Banks (14.7%) | | |
| Ameris Bancorp | 78,823 | 2,149,503 |
|
| Banc of California, Inc. | 138,158 | 1,711,778 |
|
| Berkshire Hills Bancorp, Inc. | 66,100 | 1,849,478 |
|
| BNC Bancorp | 98,800 | 2,041,208 |
|
| Chemical Financial Corp. | 84,651 | 2,703,753 |
|
| Eagle Bancorp, Inc. † | 30,790 | 1,290,409 |
|
| First Connecticut Bancorp, Inc. | 60,980 | 1,036,660 |
|
| First Merchants Corp. | 106,400 | 2,768,528 |
|
| First NBC Bank Holding Co. † S | 29,388 | 1,028,580 |
|
| Franklin Financial Network, Inc. † S | 84,697 | 2,005,625 |
|
| Fulton Financial Corp. | 213,300 | 2,593,728 |
|
| Great Western Bancorp, Inc. | 85,800 | 2,159,586 |
|
| Hanmi Financial Corp. | 89,700 | 2,174,328 |
|
| Lakeland Financial Corp. | 46,700 | 1,918,903 |
|
| Old National Bancorp | 190,700 | 2,631,660 |
|
| Pacific Premier Bancorp, Inc. † | 113,200 | 2,123,632 |
|
| Popular, Inc. (Puerto Rico) † | 48,320 | 1,418,675 |
|
| ServisFirst Bancshares, Inc. | 59,994 | 2,249,175 |
|
| Simmons First National Corp. Class A | 48,012 | 2,106,286 |
|
| Southside Bancshares, Inc. S | 60,165 | 1,566,697 |
|
| Sterling Bancorp | 158,000 | 2,216,740 |
|
| Tristate Capital Holdings, Inc. † S | 168,674 | 2,113,485 |
|
| WesBanco, Inc. | 59,200 | 1,822,768 |
|
| Western Alliance Bancorp † | 43,300 | 1,321,516 |
|
| Wintrust Financial Corp. | 55,700 | 2,840,700 |
|
| Yadkin Financial Corp. | 90,400 | 1,882,128 |
|
| | 51,725,529 |
| Beverages (0.5%) | | |
| Cott Corp. (Canada) | 150,910 | 1,593,610 |
|
| | 1,593,610 |
| Biotechnology (1.4%) | | |
| Eagle Pharmaceuticals, Inc. † S | 16,000 | 1,256,800 |
|
| Emergent BioSolutions, Inc. † | 73,321 | 2,440,856 |
|
| PDL BioPharma, Inc. | 207,400 | 1,171,810 |
|
| | | 4,869,466 |
| | |
| COMMON STOCKS (86.2%)* cont. | Shares | Value |
|
| Building products (1.9%) | | |
| CaesarStone Sdot-Yam, Ltd. (Israel) | 29,436 | $1,171,258 |
|
| Continental Building Products, Inc. † | 100,443 | 2,007,856 |
|
| NCI Building Systems, Inc. † | 97,491 | 1,016,831 |
|
| PGT, Inc. † | 171,571 | 2,293,904 |
|
| | 6,489,849 |
| Capital markets (1.0%) | | |
| Cowen Group, Inc. Class A † S | 272,054 | 1,439,166 |
|
| OM Asset Management PLC (United Kingdom) | 124,803 | 2,061,746 |
|
| | 3,500,912 |
| Chemicals (2.9%) | | |
| American Vanguard Corp. S | 117,500 | 1,569,800 |
|
| Cabot Corp. | 35,900 | 1,215,933 |
|
| Chemours Co. (The) † | 75,000 | 725,250 |
|
| Ferro Corp. † | 158,000 | 1,943,400 |
|
| Minerals Technologies, Inc. | 37,297 | 2,006,206 |
|
| Olin Corp. S | 56,900 | 1,135,724 |
|
| Orion Engineered Carbons SA (Luxembourg) | 94,300 | 1,546,520 |
|
| | 10,142,833 |
| Commercial services and supplies (2.3%) | | |
| ARC Document Solutions, Inc. † | 199,000 | 1,321,360 |
|
| Deluxe Corp. | 37,400 | 2,169,574 |
|
| Ennis, Inc. | 76,721 | 1,252,854 |
|
| Knoll, Inc. | 87,300 | 2,088,216 |
|
| Pitney Bowes, Inc. | 70,900 | 1,404,529 |
|
| | 8,236,533 |
| Construction and engineering (0.8%) | | |
| EMCOR Group, Inc. | 37,800 | 1,742,202 |
|
| Orion Marine Group, Inc. † | 138,700 | 995,866 |
|
| | 2,738,068 |
| Consumer finance (1.2%) | | |
| Encore Capital Group, Inc. † S | 54,440 | 2,211,897 |
|
| PRA Group, Inc. † S | 38,200 | 2,035,678 |
|
| | 4,247,575 |
| Diversified consumer services (0.6%) | | |
| Carriage Services, Inc. | 96,400 | 2,212,380 |
|
| | 2,212,380 |
| Diversified telecommunication services (0.5%) | | |
| Iridium Communications, Inc. † S | 217,700 | 1,621,865 |
|
| | 1,621,865 |
| Electric utilities (2.5%) | | |
| ALLETE, Inc. | 39,800 | 1,901,644 |
|
| IDACORP, Inc. | 59,900 | 3,556,263 |
|
| PNM Resources, Inc. | 68,500 | 1,754,285 |
|
| Portland General Electric Co. | 49,700 | 1,716,638 |
|
| | 8,928,830 |
| Electrical equipment (0.4%) | | |
| General Cable Corp. | 96,100 | 1,398,255 |
|
| | 1,398,255 |
| Electronic equipment, instruments, and components (2.8%) | | |
| Neonode, Inc. † S | 354,600 | 1,038,978 |
|
| Newport Corp. † | 117,400 | 1,796,220 |
|
| Plexus Corp. † | 45,600 | 1,735,992 |
|
| | |
| COMMON STOCKS (86.2%)* cont. | Shares | Value |
|
| Electronic equipment, instruments, and components cont. | | |
| SuperCom, Ltd. (Israel) † | 147,632 | $1,474,844 |
|
| SYNNEX Corp. | 23,700 | 1,876,803 |
|
| TTM Technologies, Inc. † | 284,800 | 1,942,336 |
|
| | 9,865,173 |
| Energy equipment and services (1.9%) | | |
| Core Laboratories NV S | 15,300 | 1,769,904 |
|
| Independence Contract Drilling, Inc. † S | 102,536 | 710,574 |
|
| Key Energy Services, Inc. † S | 426,831 | 303,562 |
|
| Matrix Service Co. † | 106,900 | 2,138,000 |
|
| Patterson-UTI Energy, Inc. | 89,300 | 1,453,804 |
|
| Tidewater, Inc. | 24,100 | 432,113 |
|
| | 6,807,957 |
| Food and staples retail (0.7%) | | |
| SpartanNash Co. | 88,090 | 2,492,947 |
|
| | 2,492,947 |
| Food products (0.6%) | | |
| B&G Foods, Inc. | 71,300 | 2,166,807 |
|
| | 2,166,807 |
| Gas utilities (0.6%) | | |
| Southwest Gas Corp. | 35,300 | 1,944,677 |
|
| | 1,944,677 |
| Health-care equipment and supplies (1.0%) | | |
| Alere, Inc. † | 34,800 | 1,808,556 |
|
| Lantheus Holdings, Inc. † | 265,416 | 1,648,233 |
|
| | 3,456,789 |
| Health-care providers and services (0.5%) | | |
| Ensign Group, Inc. (The) | 39,949 | 1,875,606 |
|
| | 1,875,606 |
| Hotels, restaurants, and leisure (0.6%) | | |
| ClubCorp Holdings, Inc. | 94,200 | 2,120,442 |
|
| | 2,120,442 |
| Household durables (1.6%) | | |
| Century Communities, Inc. † | 103,100 | 2,268,200 |
|
| Installed Building Products, Inc. † S | 43,611 | 1,165,286 |
|
| WCI Communities, Inc. † | 87,245 | 2,174,145 |
|
| | 5,607,631 |
| Independent power and renewable electricity producers (0.5%) | | |
| Dynegy, Inc. † | 74,500 | 1,918,375 |
|
| | 1,918,375 |
| Insurance (7.7%) | | |
| Allied World Assurance Co. Holdings AG | 64,400 | 2,572,136 |
|
| American Financial Group, Inc. | 36,832 | 2,543,618 |
|
| AMERISAFE, Inc. | 39,700 | 1,855,578 |
|
| Endurance Specialty Holdings, Ltd. | 29,600 | 1,887,000 |
|
| Hanover Insurance Group, Inc. (The) | 35,300 | 2,785,170 |
|
| Maiden Holdings, Ltd. (Bermuda) | 169,700 | 2,431,801 |
|
| National General Holdings Corp. | 94,600 | 1,734,018 |
|
| PartnerRe, Ltd. | 18,200 | 2,519,062 |
|
| Patriot National, Inc. † | 119,931 | 1,950,078 |
|
| Reinsurance Group of America, Inc. | 32,719 | 2,973,503 |
|
| StanCorp Financial Group, Inc. | 11,800 | 1,341,778 |
|
| Validus Holdings, Ltd. | 53,913 | 2,387,268 |
|
| | | 26,981,010 |
| | |
| COMMON STOCKS (86.2%)* cont. | Shares | Value |
|
| Internet software and services (2.2%) | | |
| Everyday Health, Inc. † | 159,700 | $1,558,672 |
|
| j2 Global, Inc. | 29,800 | 2,073,484 |
|
| Monster Worldwide, Inc. † S | 316,633 | 2,301,922 |
|
| Web.com Group, Inc. † | 86,100 | 1,853,733 |
|
| | 7,787,811 |
| IT Services (1.7%) | | |
| Convergys Corp. | 101,400 | 2,291,640 |
|
| Everi Holdings, Inc. † | 309,400 | 1,599,598 |
|
| Perficient, Inc. † | 125,800 | 2,083,248 |
|
| | 5,974,486 |
| Leisure products (0.7%) | | |
| Smith & Wesson Holding Corp. † | 129,000 | 2,332,320 |
|
| | 2,332,320 |
| Machinery (0.7%) | | |
| Briggs & Stratton Corp. | 122,600 | 2,449,548 |
|
| | 2,449,548 |
| Media (1.2%) | | |
| Live Nation Entertainment, Inc. † | 55,600 | 1,368,872 |
|
| Madison Square Garden Co. (The) Class A † | 13,700 | 965,028 |
|
| MDC Partners, Inc. Class A | 100,250 | 1,968,910 |
|
| | 4,302,810 |
| Metals and mining (0.8%) | | |
| Globe Specialty Metals, Inc. | 122,195 | 1,678,959 |
|
| Horsehead Holding Corp. † S | 135,400 | 1,107,572 |
|
| | 2,786,531 |
| Multi-utilities (0.9%) | | |
| Avista Corp. | 102,500 | 3,217,475 |
|
| | 3,217,475 |
| Oil, gas, and consumable fuels (4.7%) | | |
| Aegean Marine Petroleum Network, Inc. (Greece) S | 146,115 | 1,236,133 |
|
| Bill Barrett Corp. † S | 61,200 | 334,764 |
|
| Callon Petroleum Co. † S | 161,384 | 1,479,891 |
|
| Energen Corp. | 29,300 | 1,523,600 |
|
| EP Energy Corp. Class A † S | 108,000 | 765,720 |
|
| Gulfport Energy Corp. † | 39,200 | 1,404,536 |
|
| Memorial Resource Development Corp. † | 95,600 | 1,855,596 |
|
| PBF Energy, Inc. Class A | 71,300 | 2,133,296 |
|
| Ring Energy, Inc. † S | 114,409 | 1,172,692 |
|
| Scorpio Tankers, Inc. | 267,935 | 2,534,665 |
|
| SM Energy Co. S | 27,500 | 1,009,250 |
|
| Stone Energy Corp. † | 133,400 | 756,378 |
|
| Whiting Petroleum Corp. † | 16,513 | 319,196 |
|
| | 16,525,717 |
| Pharmaceuticals (0.2%) | | |
| POZEN, Inc. † S | 68,600 | 598,878 |
|
| | 598,878 |
| Professional services (1.6%) | | |
| Heidrick & Struggles International, Inc. | 94,100 | 1,834,009 |
|
| Kforce, Inc. | 65,700 | 1,760,103 |
|
| On Assignment, Inc. † | 52,000 | 1,870,960 |
|
| | | 5,465,072 |
| | |
| COMMON STOCKS (86.2%)* cont. | Shares | Value |
|
| Real estate investment trusts (REITs) (7.5%) | | |
| AG Mortgage Investment Trust, Inc. S | 95,100 | $1,572,003 |
|
| American Assets Trust, Inc. | 43,601 | 1,679,511 |
|
| CBL & Associates Properties, Inc. | 90,500 | 1,346,640 |
|
| Cherry Hill Mortgage Investment Corp. | 94,238 | 1,522,886 |
|
| Colony Capital, Inc. Class A | 83,500 | 1,812,785 |
|
| Education Realty Trust, Inc. | 36,264 | 1,060,722 |
|
| EPR Properties | 29,700 | 1,511,433 |
|
| Healthcare Trust of America, Inc. Class A | 35,450 | 851,155 |
|
| iStar, Inc. † | 185,100 | 2,308,197 |
|
| MFA Financial, Inc. | 209,660 | 1,490,683 |
|
| One Liberty Properties, Inc. | 50,570 | 1,103,943 |
|
| Piedmont Office Realty Trust, Inc. Class A | 59,500 | 1,009,120 |
|
| RAIT Financial Trust | 284,200 | 1,474,998 |
|
| Rayonier, Inc. | 99,300 | 2,283,900 |
|
| Summit Hotel Properties, Inc. | 224,814 | 2,726,994 |
|
| Two Harbors Investment Corp. | 177,600 | 1,680,096 |
|
| ZAIS Financial Corp. | 46,800 | 690,768 |
|
| | 26,125,834 |
| Real estate management and development (0.5%) | | |
| RE/MAX Holdings, Inc. Class A | 43,820 | 1,607,318 |
|
| | 1,607,318 |
| Road and rail (0.5%) | | |
| Ryder System, Inc. | 19,300 | 1,582,021 |
|
| | 1,582,021 |
| Semiconductors and semiconductor equipment (2.2%) | | |
| Advanced Energy Industries, Inc. † | 78,300 | 1,900,341 |
|
| Cypress Semiconductor Corp. † | 152,415 | 1,524,150 |
|
| FormFactor, Inc. † | 250,500 | 1,665,825 |
|
| Mattson Technology, Inc. † | 392,535 | 1,103,023 |
|
| Xcerra Corp. † | 223,600 | 1,399,736 |
|
| | 7,593,075 |
| Software (1.0%) | | |
| AVG Technologies NV (Netherlands) † | 99,589 | 2,303,494 |
|
| Glu Mobile, Inc. † S | 233,200 | 1,070,388 |
|
| | 3,373,882 |
| Specialty retail (0.9%) | | |
| Ascena Retail Group, Inc. † | 85,500 | 1,031,985 |
|
| Express, Inc. † S | 102,900 | 2,099,160 |
|
| | 3,131,145 |
| Technology hardware, storage, and peripherals (1.4%) | | |
| BancTec, Inc. 144A CVR F † | 160,833 | — |
|
| Logitech International SA (Switzerland) | 117,310 | 1,553,184 |
|
| QLogic Corp. † | 200,500 | 2,073,170 |
|
| Quantum Corp. † S | 1,188,700 | 1,390,779 |
|
| | 5,017,133 |
| Textiles, apparel, and luxury goods (0.6%) | | |
| Steven Madden, Ltd. † | 52,600 | 2,149,236 |
|
| | 2,149,236 |
| Thrifts and mortgage finance (3.9%) | | |
| BofI Holding, Inc. † | 7,300 | 845,632 |
|
| Meta Financial Group, Inc. | 51,700 | 2,244,814 |
|
| NMI Holdings, Inc. Class A † | 183,900 | 1,530,048 |
|
| | |
| COMMON STOCKS (86.2%)* cont. | Shares | Value |
|
| Thrifts and mortgage finance cont. | | |
| Provident Financial Services, Inc. | 140,700 | $2,664,858 |
|
| Walker & Dunlop, Inc. † | 70,849 | 1,723,756 |
|
| Washington Federal, Inc. | 96,500 | 2,189,585 |
|
| WSFS Financial Corp. | 94,000 | 2,587,820 |
|
| | 13,786,513 |
| Trading companies and distributors (1.0%) | | |
| Rush Enterprises, Inc. Class A † | 68,500 | 1,748,120 |
|
| Stock Building Supply Holdings, Inc. † | 96,327 | 1,813,837 |
|
| | | 3,561,957 |
| | | |
| Total common stocks (cost $283,980,685) | | $302,381,873 |
| |
| |
| INVESTMENT COMPANIES (3.7%)* | Shares | Value |
|
| American Capital, Ltd. † | 152,500 | $2,121,275 |
|
| Hercules Technology Growth Capital, Inc. S | 199,853 | 2,318,295 |
|
| Solar Capital, Ltd. | 127,080 | 2,250,587 |
|
| TCP Capital Corp. | 146,619 | 2,290,189 |
|
| TPG Specialty Lending, Inc. S | 115,501 | 2,016,647 |
|
| TriplePoint Venture Growth BDC Corp. | 165,561 | 1,973,487 |
|
| Total investment companies (cost $14,520,905) | | $12,970,480 |
| |
| |
| SHORT-TERM INVESTMENTS (19.4%)* | Shares | Value |
|
| Putnam Cash Collateral Pool, LLC 0.26% d | 33,406,827 | $33,406,827 |
|
| Putnam Short Term Investment Fund 0.13% L | 34,737,072 | 34,737,072 |
|
| Total short-term investments (cost $68,143,899) | | $68,143,899 |
| |
| |
| TOTAL INVESTMENTS | | |
|
| Total investments (cost $366,645,489) | | $383,496,252 |
Key to holding’s abbreviations
| |
| CVR | Contingent Value Rights |
Notes to the fund’s portfolio
Unless noted otherwise, the notes to the fund’s portfolio are for the close of the fund’s reporting period, which ran from March 1, 2015 through August 31, 2015 (the reporting period). Within the following notes to the portfolio, references to “ASC 820” represent Accounting Standards Codification 820 Fair Value Measurements and Disclosures and references to “OTC”, if any, represent over-the-counter.
* Percentages indicated are based on net assets of $350,592,992.
† This security is non-income-producing.
d Affiliated company. See Note 1 to the financial statements regarding securities lending. The rate quoted in the security description is the annualized 7-day yield of the fund at the close of the reporting period.
F This security is valued at fair value following procedures approved by the Trustees. Securities may be classified as Level 2 or Level 3 for ASC 820 based on the securities’ valuation inputs (Note 1).
L Affiliated company (Note 5). The rate quoted in the security description is the annualized 7-day yield of the fund at the close of the reporting period.
S Security on loan, in part or in entirety, at the close of the reporting period (Note 1).
144A after the name of an issuer represents securities exempt from registration under Rule 144A under the Securities Act of 1933, as amended. These securities may be resold in transactions exempt from registration, normally to qualified institutional buyers.
ASC 820 establishes a three-level hierarchy for disclosure of fair value measurements. The valuation hierarchy is based upon the transparency of inputs to the valuation of the fund’s investments. The three levels are defined as follows:
Level 1: Valuations based on quoted prices for identical securities in active markets.
Level 2: Valuations based on quoted prices in markets that are not active or for which all significant inputs are observable, either directly or indirectly.
Level 3: Valuations based on inputs that are unobservable and significant to the fair value measurement.
The following is a summary of the inputs used to value the fund’s net assets as of the close of the reporting period:
| | | |
| | | Valuation inputs | |
|
| Investments in securities: | Level 1 | Level 2 | Level 3 |
|
| Common stocks*: | | | |
|
| Consumer discretionary | $26,305,766 | $— | $— |
|
| Consumer staples | 6,253,364 | — | — |
|
| Energy | 23,333,674 | — | — |
|
| Financials | 127,974,691 | — | — |
|
| Health care | 10,800,739 | — | — |
|
| Industrials | 37,541,493 | — | — |
|
| Information technology | 39,611,560 | — | —** |
|
| Materials | 12,929,364 | — | — |
|
| Telecommunication services | 1,621,865 | — | — |
|
| Utilities | 16,009,357 | — | — |
|
| Total common stocks | 302,381,873 | — | — |
| | | | |
| Investment companies | 12,970,480 | — | — |
|
| Short-term investments | 34,737,072 | 33,406,827 | — |
|
| Totals by level | $350,089,425 | $33,406,827 | $— |
* Common stock classifications are presented at the sector level, which may differ from the fund’s portfolio presentation.
** Value of Level 3 security is $—.
During the reporting period, transfers within the fair value hierarchy, if any, (other than certain transfers involving non-U.S. equity securities as described in Note 1) did not represent, in the aggregate, more than 1% of the fund’s net assets measured as of the end of the period. Transfers are accounted for using the end of period pricing valuation method.
At the start and close of the reporting period, Level 3 investments in securities represented less than 1% of the fund’s net assets and were not considered a significant portion of the fund’s portfolio.
The accompanying notes are an integral part of these financial statements.
Statement of assets and liabilities 8/31/15 (Unaudited)
| |
| ASSETS | |
|
| Investment in securities, at value, including $32,678,741 of securities on loan (Note 1): | |
| Unaffiliated issuers (identified cost $298,501,590) | $315,352,353 |
| Affiliated issuers (identified cost $68,143,899) (Notes 1 and 5) | 68,143,899 |
|
| Cash | 270,401 |
|
| Dividends, interest and other receivables | 419,207 |
|
| Receivable for shares of the fund sold | 1,311,321 |
|
| Receivable for investments sold | 245,495 |
|
| Prepaid assets | 47,851 |
|
| Total assets | 385,790,527 |
| |
| LIABILITIES | |
|
| Payable for shares of the fund repurchased | 1,197,984 |
|
| Payable for compensation of Manager (Note 2) | 187,053 |
|
| Payable for investor servicing fees (Note 2) | 102,533 |
|
| Payable for custodian fees (Note 2) | 10,083 |
|
| Payable for Trustee compensation and expenses (Note 2) | 108,929 |
|
| Payable for administrative services (Note 2) | 1,277 |
|
| Payable for distribution fees (Note 2) | 89,904 |
|
| Collateral on securities loaned, at value (Note 1) | 33,406,827 |
|
| Other accrued expenses | 92,945 |
|
| Total liabilities | 35,197,535 |
| | |
| Net assets | $350,592,992 |
|
| |
| REPRESENTED BY | |
|
| Paid-in capital (Unlimited shares authorized) (Notes 1 and 4) | $315,728,979 |
|
| Undistributed net investment income (Note 1) | 1,652,638 |
|
| Accumulated net realized gain on investments (Note 1) | 16,360,612 |
|
| Net unrealized appreciation of investments | 16,850,763 |
|
| Total — Representing net assets applicable to capital shares outstanding | $350,592,992 |
(Continued on next page)
Statement of assets and liabilities (Continued)
| |
| COMPUTATION OF NET ASSET VALUE AND OFFERING PRICE | |
|
| Net asset value and redemption price per class A share | |
| ($160,497,509 divided by 10,795,335 shares) | $14.87 |
|
| Offering price per class A share (100/94.25 of $14.87)* | $15.78 |
|
| Net asset value and offering price per class B share ($2,980,350 divided by 235,569 shares)** | $12.65 |
|
| Net asset value and offering price per class C share ($17,580,406 divided by 1,391,387 shares)** | $12.64 |
|
| Net asset value and redemption price per class M share ($1,223,389 divided by 89,970 shares) | $13.60 |
|
| Offering price per class M share (100/96.50 of $13.60)* | $14.09 |
|
| Net asset value, offering price and redemption price per class R share | |
| ($903,858 divided by 61,746 shares) | $14.64 |
|
| Net asset value, offering price and redemption price per class R5 share | |
| ($13,098 divided by 848 shares)† | $15.44 |
|
| Net asset value, offering price and redemption price per class R6 share | |
| ($14,090,927 divided by 912,330 shares) | $15.45 |
|
| Net asset value, offering price and redemption price per class Y share | |
| ($153,303,455 divided by 9,958,498 shares) | $15.39 |
|
* On single retail sales of less than $50,000. On sales of $50,000 or more the offering price is reduced.
** Redemption price per share is equal to net asset value less any applicable contingent deferred sales charge.
† Net asset value may not recalculate due to rounding of fractional shares.
The accompanying notes are an integral part of these financial statements.
Statement of operations Six months ended 8/31/15 (Unaudited)
| |
| INVESTMENT INCOME | |
|
| Dividends (net of foreign tax of $16,380) | $3,456,898 |
|
| Interest (including interest income of $14,433 from investments in affiliated issuers) (Note 5) | 14,455 |
|
| Securities lending (Note 1) | 116,878 |
|
| Total investment income | 3,588,231 |
| |
| EXPENSES | |
|
| Compensation of Manager (Note 2) | 1,127,734 |
|
| Investor servicing fees (Note 2) | 328,275 |
|
| Custodian fees (Note 2) | 12,410 |
|
| Trustee compensation and expenses (Note 2) | 10,607 |
|
| Distribution fees (Note 2) | 329,862 |
|
| Administrative services (Note 2) | 3,872 |
|
| Other | 133,420 |
|
| Total expenses | 1,946,180 |
| | |
| Expense reduction (Note 2) | (10,587) |
|
| Net expenses | 1,935,593 |
| | |
| Net investment income | 1,652,638 |
|
| |
| Net realized gain on investments (Notes 1 and 3) | 15,001,894 |
|
| Net unrealized depreciation of investments during the period | (27,798,996) |
|
| Net loss on investments | (12,797,102) |
| | |
| Net decrease in net assets resulting from operations | $(11,144,464) |
|
The accompanying notes are an integral part of these financial statements.
Statement of changes in net assets
| | |
| INCREASE (DECREASE) IN NET ASSETS | Six months ended 8/31/15* | Year ended 2/28/15 |
|
| Operations: | | |
| Net investment income | $1,652,638 | $2,154,420 |
|
| Net realized gain on investments | 15,001,894 | 2,669,501 |
|
| Net unrealized appreciation (depreciation) of investments | (27,798,996) | 6,145,536 |
|
| Net increase (decrease) in net assets resulting | | |
| from operations | (11,144,464) | 10,969,457 |
|
| Distributions to shareholders (Note 1): | | |
| From ordinary income | | |
| Net investment income | | |
|
| Class A | — | (1,271,722) |
|
| Class B | — | (2,950) |
|
| Class C | — | (54,140) |
|
| Class M | — | (5,116) |
|
| Class R | — | (4,259) |
|
| Class R5 | — | (109) |
|
| Class R6 | — | (142,975) |
|
| Class Y | — | (1,294,315) |
|
| From net realized long-term gain on investments | | |
| Class A | — | (5,503,055) |
|
| Class B | — | (134,990) |
|
| Class C | — | (662,877) |
|
| Class M | — | (51,367) |
|
| Class R | — | (23,493) |
|
| Class R5 | — | (339) |
|
| Class R6 | — | (403,220) |
|
| Class Y | — | (4,112,174) |
|
| Increase from capital share transactions (Note 4) | 4,516,840 | 56,464,239 |
|
| Total increase (decrease) in net assets | (6,627,624) | 53,766,595 |
| |
| NET ASSETS | | |
|
| Beginning of period | 357,220,616 | 303,454,021 |
|
| End of period (including undistributed net investment | | |
| income of $1,652,638 and $— , respectively) | $350,592,992 | $357,220,616 |
|
* Unaudited.
The accompanying notes are an integral part of these financial statements.
Financial highlights (For a common share outstanding throughout the period)
| | | | | | | | | | | | | | | |
| INVESTMENT OPERATIONS: | LESS DISTRIBUTIONS: | | | | RATIOS AND SUPPLEMENTAL DATA: |
|
| | | | | | | | | | | | | | | Ratio | |
| | Net asset | | Net realized | | | | | | | | | | Ratio | of net investment | |
| | value, | | and unrealized | Total from | From | From | | | | | Total return | Net assets, | of expenses | income (loss) | |
| | beginning | Net investment | gain (loss) | investment | net investment | net realized gain | Total | Redemption | Non-recurring | Net asset value, | at net asset | end of period | to average | to average | Portfolio |
| Period ended | of period | income (loss)a | on investments | operations | income | on investments | distributions | fees | reimbursements | end of period | value (%)b | (in thousands) | net assets (%)c | net assets (%) | turnover (%) |
|
| Class A | | | | | | | | | | | | | | | |
| August 31, 2015** | $15.34 | .07 | (.54) | (.47) | — | — | — | — | — | $14.87 | (3.06)* | $160,498 | .57* | .42* | 31* |
| February 28, 2015 | 15.45 | .09 | .42 | .51 | (.12) | (.50) | (.62) | — | — | 15.34 | 3.40 | 172,363 | 1.18 | .60 | 54 |
| February 28, 2014 | 12.05 | .05 | 3.51 | 3.56 | (.10) | (.06) | (.16) | —d | — | 15.45 | 29.58 | 171,473 | 1.21 | .33 | 68 |
| February 28, 2013 | 10.54 | .08 | 1.44 | 1.52 | (.01) | — | (.01) | —d | — | 12.05 | 14.40 | 133,547 | 1.28 | .71 | 64 |
| February 29, 2012 | 10.62 | .02 | (.08) | (.06) | (.03) | — | (.03) | —d | .01e | 10.54 | (.46) | 135,453 | 1.30 | .24 | 64 |
| February 28, 2011 | 8.10 | .02 | 2.50 | 2.52 | —d | — | —d | —d | — | 10.62 | 31.13 | 162,096 | 1.30 | .20 | 68 |
|
| Class B | | | | | | | | | | | | | | | |
| August 31, 2015** | $13.10 | .01 | (.46) | (.45) | — | — | — | — | — | $12.65 | (3.44)* | $2,980 | .95* | .04* | 31* |
| February 28, 2015 | 13.28 | (.02) | .35 | .33 | (.01) | (.50) | (.51) | — | — | 13.10 | 2.60 | 3,398 | 1.93 | (.16) | 54 |
| February 28, 2014 | 10.39 | (.05) | 3.01 | 2.96 | (.01) | (.06) | (.07) | —d | — | 13.28 | 28.55 | 4,215 | 1.96 | (.41) | 68 |
| February 28, 2013 | 9.15 | —d | 1.24 | 1.24 | — | — | — | —d | — | 10.39 | 13.55 | 3,764 | 2.03 | (.04) | 64 |
| February 29, 2012 | 9.26 | (.04) | (.08) | (.12) | — | — | — | —d | .01e | 9.15 | (1.19) | 4,247 | 2.05 | (.51) | 64 |
| February 28, 2011 | 7.11 | (.04) | 2.19 | 2.15 | — | — | — | —d | — | 9.26 | 30.24 | 5,471 | 2.05 | (.54) | 68 |
|
| Class C | | | | | | | | | | | | | | | |
| August 31, 2015** | $13.09 | .01 | (.46) | (.45) | — | — | — | — | — | $12.64 | (3.44)* | $17,580 | .95* | .04* | 31* |
| February 28, 2015 | 13.29 | (.02) | .36 | .34 | (.04) | (.50) | (.54) | — | — | 13.09 | 2.68 | 17,701 | 1.93 | (.15) | 54 |
| February 28, 2014 | 10.41 | (.05) | 3.02 | 2.97 | (.03) | (.06) | (.09) | —d | — | 13.29 | 28.58 | 14,732 | 1.96 | (.43) | 68 |
| February 28, 2013 | 9.17 | —d | 1.24 | 1.24 | — | — | — | —d | — | 10.41 | 13.52 | 9,244 | 2.03 | (.05) | 64 |
| February 29, 2012 | 9.28 | (.04) | (.08) | (.12) | — | — | — | —d | .01e | 9.17 | (1.19) | 9,397 | 2.05 | (.51) | 64 |
| February 28, 2011 | 7.13 | (.04) | 2.19 | 2.15 | — | — | — | —d | — | 9.28 | 30.15 | 10,927 | 2.05 | (.54) | 68 |
|
| Class M | | | | | | | | | | | | | | | |
| August 31, 2015** | $14.06 | .02 | (.48) | (.46) | — | — | — | — | — | $13.60 | (3.27)* | $1,223 | .82* | .17* | 31* |
| February 28, 2015 | 14.22 | .01 | .38 | .39 | (.05) | (.50) | (.55) | — | — | 14.06 | 2.85 | 1,524 | 1.68 | .10 | 54 |
| February 28, 2014 | 11.11 | (.02) | 3.22 | 3.20 | (.03) | (.06) | (.09) | —d | — | 14.22 | 28.87 | 1,460 | 1.71 | (.16) | 68 |
| February 28, 2013 | 9.76 | .02 | 1.33 | 1.35 | — | — | — | —d | — | 11.11 | 13.83 | 1,294 | 1.78 | .22 | 64 |
| February 29, 2012 | 9.85 | (.02) | (.08) | (.10) | — | — | — | —d | .01e | 9.76 | (.91) | 1,418 | 1.80 | (.26) | 64 |
| February 28, 2011 | 7.55 | (.03) | 2.33 | 2.30 | — | — | — | —d | — | 9.85 | 30.46 | 1,544 | 1.80 | (.30) | 68 |
|
| Class R | | | | | | | | | | | | | | | |
| August 31, 2015** | $15.12 | .04 | (.52) | (.48) | — | — | — | — | — | $14.64 | (3.17)* | $904 | .70* | .28* | 31* |
| February 28, 2015 | 15.25 | .05 | .41 | .46 | (.09) | (.50) | (.59) | — | — | 15.12 | 3.14 | 772 | 1.43 | .35 | 54 |
| February 28, 2014 | 11.91 | .01 | 3.46 | 3.47 | (.07) | (.06) | (.13) | —d | — | 15.25 | 29.20 | 567 | 1.46 | .07 | 68 |
| February 28, 2013 | 10.44 | .05 | 1.42 | 1.47 | — | — | — | —d | — | 11.91 | 14.08 | 381 | 1.53 | .47 | 64 |
| February 29, 2012 | 10.52 | —d | (.09) | (.09) | — | — | — | —d | .01e | 10.44 | (.76) | 303 | 1.55 | (.02) | 64 |
| February 28, 2011 | 8.04 | (.01) | 2.49 | 2.48 | — | — | — | —d | — | 10.52 | 30.85 | 368 | 1.55 | (.06) | 68 |
|
| Class R5 | | | | | | | | | | | | | | | |
| August 31, 2015** | $15.90 | .09 | (.55) | (.46) | — | — | — | — | — | $15.44 | (2.89)* | $13 | .43* | .55* | 31* |
| February 28, 2015 | 15.98 | .15 | .43 | .58 | (.16) | (.50) | (.66) | — | — | 15.90 | 3.76 | 12 | .88 | .90 | 54 |
| February 28, 2014† | 14.98 | .03 | 1.13 | 1.16 | (.10) | (.06) | (.16) | — | — | 15.98 | 7.78* | 11 | .29* | .22* | 68 |
|
| Class R6 | | | | | | | | | | | | | | | |
| August 31, 2015** | $15.90 | .10 | (.55) | (.45) | — | — | — | — | — | $15.45 | (2.83)* | $14,091 | .38* | .61* | 31* |
| February 28, 2015 | 15.99 | .16 | .43 | .59 | (.18) | (.50) | (.68) | — | — | 15.90 | 3.81 | 13,129 | .78 | 1.00 | 54 |
| February 28, 2014† | 14.98 | .01 | 1.16 | 1.17 | (.10) | (.06) | (.16) | — | — | 15.99 | 7.87* | 14,260 | .25* | .08* | 68 |
|
See notes to financial highlights at the end of this section.
The accompanying notes are an integral part of these financial statements.
| | | |
| 34 | Small Cap Value Fund | Small Cap Value Fund | 35 |
Financial highlights (Continued)
| | | | | | | | | | | | | | | |
| INVESTMENT OPERATIONS: | | LESS DISTRIBUTIONS: | | | | RATIOS AND SUPPLEMENTAL DATA: |
|
| | | | | | | | | | | | | | | Ratio | |
| | Net asset | | Net realized | | | | | | | | | | Ratio | of net investment | |
| | value, | | and unrealized | Total from | From | From | | | | | Total return | Net assets, | of expenses | income (loss) | |
| | beginning | Net investment | gain (loss) | investment | net investment | net realized gain | Total | Redemption | Non-recurring | Net asset value, | at net asset | end of period | to average | to average | Portfolio |
| Period ended | of period | income (loss)a | on investments | operations | income | on investments | distributions | fees | reimbursements | end of period | value (%)b | (in thousands) | net assets (%)c | net assets (%) | turnover (%) |
|
| Class Y | | | | | | | | | | | | | | | |
| August 31, 2015** | $15.86 | .09 | (.56) | (.47) | — | — | — | — | — | $15.39 | (2.96)* | $153,303 | .45* | .54* | 31* |
| February 28, 2015 | 15.95 | .14 | .43 | .57 | (.16) | (.50) | (.66) | — | — | 15.86 | 3.68 | 148,321 | .93 | .86 | 54 |
| February 28, 2014 | 12.44 | .08 | 3.62 | 3.70 | (.13) | (.06) | (.19) | —d | — | 15.95 | 29.82 | 96,735 | .96 | .51 | 68 |
| February 28, 2013 | 10.88 | .10 | 1.50 | 1.60 | (.04) | — | (.04) | —d | — | 12.44 | 14.70 | 20,091 | 1.03 | .94 | 64 |
| February 29, 2012 | 10.97 | .05 | (.09) | (.04) | (.06) | — | (.06) | —d | .01e | 10.88 | (.27) | 14,980 | 1.05 | .49 | 64 |
| February 28, 2011 | 8.36 | .04 | 2.59 | 2.63 | (.02) | — | (.02) | —d | — | 10.97 | 31.53 | 15,040 | 1.05 | .46 | 68 |
|
* Not annualized.
** Unaudited.
† For the period November 1, 2013 (commencement of operations) to February 28, 2014.
a Per share net investment income (loss) has been determined on the basis of the weighted average number of shares outstanding during the period.
b Total return assumes dividend reinvestment and does not reflect the effect of sales charges.
c Includes amounts paid through expense offset and brokerage/service arrangements, if any. Also excludes acquired fund fees, if any (Note 2).
d Amount represents less than $0.01 per share.
e Reflects a non-recurring reimbursement related to restitution amounts in connection with a distribution plan approved by the Securities Exchange Commission (the SEC) which amounted to $0.01 per share outstanding on July 21, 2011. Also reflects a non-recurring reimbursement related to short-term trading related lawsuits, which amounted to less than $0.01 per share outstanding on May 11, 2011.
The accompanying notes are an integral part of these financial statements.
| | | |
| 36 | Small Cap Value Fund | Small Cap Value Fund | 37 |
Notes to financial statements 8/31/15 (Unaudited)
Within the following Notes to financial statements, references to “State Street” represent State Street Bank and Trust Company, references to “the SEC” represent the Securities and Exchange Commission, references to “Putnam Management” represent Putnam Investment Management, LLC, the fund’s manager, an indirect wholly-owned subsidiary of Putnam Investments, LLC and references to “OTC”, if any, represent over-the-counter. Unless otherwise noted, the “reporting period” represents the period from March 1, 2015 through August 31, 2015.
Putnam Small Cap Value Fund (the fund) is a diversified series of Putnam Investment Funds (the Trust), a Massachusetts business trust registered under the Investment Company Act of 1940, as amended, as an open-end management investment company. The goal of the fund is to seek capital appreciation by investing mainly in common stocks of small U.S. companies, with a focus on value stocks. Value stocks are issued by companies that Putnam Management believes are currently undervalued by the market. Under normal circumstances, the fund invests at least 80% of its net assets in companies of a size similar to those in the Russell 2000 Value Index. As of April 30, 2015, the index was composed of companies having market capitalizations of between approximately $5.18 million and approximately $6.72 billion.
The fund offers class A, class B, class C, class M, class R, class R5, class R6 and class Y shares. Class A and class M shares are sold with a maximum front-end sales charge of 5.75% and 3.50%, respectively, and generally do not pay a contingent deferred sales charge. Class B shares, which convert to class A shares after approximately six years, do not pay a front-end sales charge and are subject to a contingent deferred sales charge if those shares are redeemed within six years of purchase. Class C shares have a one-year 1.00% contingent deferred sales charge and do not convert to class A shares. Class R shares, which are not available to all investors, are sold at net asset value. The expenses for class A, class B, class C, class M and class R shares may differ based on the distribution fee of each class, which is identified in Note 2. Class R5, class R6 and class Y shares, which are sold at net asset value, are generally subject to the same expenses as class A, class B, class C, class M and class R shares, but do not bear a distribution fee and in the case of class R5 and class R6 shares, bear a lower investor servicing fee, which is identified in Note 2. Class R5, class R6 and class Y shares are not available to all investors.
In the normal course of business, the fund enters into contracts that may include agreements to indemnify another party under given circumstances. The fund’s maximum exposure under these arrangements is unknown as this would involve future claims that may be, but have not yet been, made against the fund. However, the fund’s management team expects the risk of material loss to be remote.
Note 1: Significant accounting policies
The following is a summary of significant accounting policies consistently followed by the fund in the preparation of its financial statements. The preparation of financial statements is in conformity with accounting principles generally accepted in the United States of America and requires management to make estimates and assumptions that affect the reported amounts of assets and liabilities in the financial statements and the reported amounts of increases and decreases in net assets from operations. Actual results could differ from those estimates. Subsequent events after the Statement of assets and liabilities date through the date that the financial statements were issued have been evaluated in the preparation of the financial statements.
Investment income, realized and unrealized gains and losses and expenses of the fund are borne pro-rata based on the relative net assets of each class to the total net assets of the fund, except that each class bears expenses unique to that class (including the distribution fees applicable to such classes). Each class votes as a class only with respect to its own distribution plan or other matters on which a class vote is required by law or determined by the Trustees. If the fund were liquidated, shares of each class would receive their pro-rata share of the net assets of the fund. In addition, the Trustees declare separate dividends on each class of shares.
Security valuation Portfolio securities and other investments are valued using policies and procedures adopted by the Board of Trustees. The Trustees have formed a Pricing Committee to oversee the implementation of these procedures and have delegated responsibility for valuing the fund’s assets in accordance with these procedures to Putnam Management. Putnam Management has established an internal Valuation Committee that is responsible for making fair value determinations, evaluating the effectiveness of the pricing policies of the fund and reporting to the Pricing Committee.
Investments for which market quotations are readily available are valued at the last reported sales price on their principal exchange, or official closing price for certain markets, and are classified as Level 1 securities under Accounting Standards Codification 820 Fair Value Measurements and Disclosures (ASC 820). If no sales are
reported, as in the case of some securities that are traded OTC, a security is valued at its last reported bid price and is generally categorized as a Level 2 security.
Investments in open-end investment companies (excluding exchange-traded funds), if any, which can be classified as Level 1 or Level 2 securities, are valued based on their net asset value. The net asset value of such investment companies equals the total value of their assets less their liabilities and divided by the number of their outstanding shares.
Many securities markets and exchanges outside the U.S. close prior to the close of the New York Stock Exchange and therefore the closing prices for securities in such markets or on such exchanges may not fully reflect events that occur after such close but before the close of the New York Stock Exchange. Accordingly, on certain days, the fund will fair value foreign equity securities taking into account multiple factors including movements in the U.S. securities markets, currency valuations and comparisons to the valuation of American Depository Receipts, exchange-traded funds and futures contracts. These securities, which would generally be classified as Level 1 securities, will be transferred to Level 2 of the fair value hierarchy when they are valued at fair value. The number of days on which fair value prices will be used will depend on market activity and it is possible that fair value prices will be used by the fund to a significant extent. Securities quoted in foreign currencies, if any, are translated into U.S. dollars at the current exchange rate. Short-term securities with remaining maturities of 60 days or less may be valued at amortized cost, which approximates fair value, and are classified as Level 2 securities.
To the extent a pricing service or dealer is unable to value a security or provides a valuation that Putnam Management does not believe accurately reflects the security’s fair value, the security will be valued at fair value by Putnam Management in accordance with policies and procedures approved by the Trustees. Certain investments, including certain restricted and illiquid securities and derivatives, are also valued at fair value following procedures approved by the Trustees. These valuations consider such factors as significant market or specific security events such as interest rate or credit quality changes, various relationships with other securities, discount rates, U.S. Treasury, U.S. swap and credit yields, index levels, convexity exposures, recovery rates, sales and other multiples and resale restrictions. These securities are classified as Level 2 or as Level 3 depending on the priority of the significant inputs.
To assess the continuing appropriateness of fair valuations, the Valuation Committee reviews and affirms the reasonableness of such valuations on a regular basis after considering all relevant information that is reasonably available. Such valuations and procedures are reviewed periodically by the Trustees. The fair value of securities is generally determined as the amount that the fund could reasonably expect to realize from an orderly disposition of such securities over a reasonable period of time. By its nature, a fair value price is a good faith estimate of the value of a security in a current sale and does not reflect an actual market price, which may be different by a material amount.
Security transactions and related investment income Security transactions are recorded on the trade date (the date the order to buy or sell is executed). Gains or losses on securities sold are determined on the identified cost basis.
Interest income, net of any applicable withholding taxes, is recorded on the accrual basis. Dividend income, net of any applicable withholding taxes, is recognized on the ex-dividend date except that certain dividends from foreign securities, if any, are recognized as soon as the fund is informed of the ex-dividend date. Non-cash dividends, if any, are recorded at the fair value of the securities received. Dividends representing a return of capital or capital gains, if any, are reflected as a reduction of cost and/or as a realized gain.
Securities lending The fund may lend securities, through its agent, to qualified borrowers in order to earn additional income. The loans are collateralized by cash in an amount at least equal to the fair value of the securities loaned. The fair value of securities loaned is determined daily and any additional required collateral is allocated to the fund on the next business day. The risk of borrower default will be borne by the fund’s agent; the fund will bear the risk of loss with respect to the investment of the cash collateral. Income from securities lending is included in investment income on the Statement of operations. Cash collateral is invested in Putnam Cash Collateral Pool, LLC, a limited liability company managed by an affiliate of Putnam Management. Investments in Putnam Cash Collateral Pool, LLC are valued at its closing net asset value each business day. There are no management fees charged to Putnam Cash Collateral Pool, LLC. At the close of the reporting period, the fund received cash collateral of $33,406,827 and the value of securities loaned amounted to $32,810,241. Certain of these securities were sold prior to the close of the reporting period and are included in Receivable for investments sold on the Statement of assets and liabilities.
Interfund lending The fund, along with other Putnam funds, may participate in an interfund lending program pursuant to an exemptive order issued by the SEC. This program allows the fund to borrow from or lend to other Putnam funds that permit such transactions. Interfund lending transactions are subject to each fund’s investment
policies and borrowing and lending limits. Interest earned or paid on the interfund lending transaction will be based on the average of certain current market rates. During the reporting period, the fund did not utilize the program.
Lines of credit The fund participates, along with other Putnam funds, in a $392.5 million syndicated unsecured committed line of credit provided by State Street ($292.5 million) and Northern Trust Company ($100 million) and a $235.5 million unsecured uncommitted line of credit provided by State Street. Prior to September 24, 2015, the fund participated in a $392.5 million unsecured committed line of credit provided by State Street and the same unsecured uncommitted line of credit. Borrowings may be made for temporary or emergency purposes, including the funding of shareholder redemption requests and trade settlements. Interest is charged to the fund based on the fund’s borrowing at a rate equal to the higher of (1) the Federal Funds rate and (2) the overnight LIBOR (the Federal Funds rate prior to September 24, 2015) plus 1.25% for the committed line of credit and the Federal Funds rate plus 1.30% for the uncommitted line of credit. A closing fee equal to 0.04% of the committed line of credit and 0.04% of the uncommitted line of credit has been paid by the participating funds. In addition, a commitment fee of 0.16% (0.11% Prior to September 24, 2015) per annum on any unutilized portion of the committed line of credit is allocated to the participating funds based on their relative net assets and paid quarterly. During the reporting period, the fund had no borrowings against these arrangements.
Federal taxes It is the policy of the fund to distribute all of its taxable income within the prescribed time period and otherwise comply with the provisions of the Internal Revenue Code of 1986, as amended (the Code), applicable to regulated investment companies. It is also the intention of the fund to distribute an amount sufficient to avoid imposition of any excise tax under Section 4982 of the Code.
The fund is subject to the provisions of Accounting Standards Codification 740 Income Taxes (ASC 740). ASC 740 sets forth a minimum threshold for financial statement recognition of the benefit of a tax position taken or expected to be taken in a tax return. The fund did not have a liability to record for any unrecognized tax benefits in the accompanying financial statements. No provision has been made for federal taxes on income, capital gains or unrealized appreciation on securities held nor for excise tax on income and capital gains. Each of the fund’s federal tax returns for the prior three fiscal years remains subject to examination by the Internal Revenue Service.
The aggregate identified cost on a tax basis is $366,865,323, resulting in gross unrealized appreciation and depreciation of $42,668,812 and $26,037,883, respectively, or net unrealized appreciation of $16,630,929.
Distributions to shareholders Distributions to shareholders from net investment income are recorded by the fund on the ex-dividend date. Distributions from capital gains, if any, are recorded on the ex-dividend date and paid at least annually. The amount and character of income and gains to be distributed are determined in accordance with income tax regulations, which may differ from generally accepted accounting principles. Dividend sources are estimated at the time of declaration. Actual results may vary. Any non-taxable return of capital cannot be determined until final tax calculations are completed after the end of the fund’s fiscal year. Reclassifications are made to the fund’s capital accounts to reflect income and gains available for distribution (or available capital loss carryovers) under income tax regulations.
Expenses of the Trust Expenses directly charged or attributable to any fund will be paid from the assets of that fund. Generally, expenses of the Trust will be allocated among and charged to the assets of each fund on a basis that the Trustees deem fair and equitable, which may be based on the relative assets of each fund or the nature of the services performed and relative applicability to each fund.
Note 2: Management fee, administrative services and other transactions
The fund pays Putnam Management a management fee (based on the fund’s average net assets and computed and paid monthly) at annual rates that may vary based on the average of the aggregate net assets of most open-end funds, as defined in the fund’s management contract, sponsored by Putnam Management. Such annual rates may vary as follows:
| | | | |
| 0.780% | of the first $5 billion, | | 0.580% | of the next $50 billion, |
| |
|
| 0.730% | of the next $5 billion, | | 0.560% | of the next $50 billion, |
| |
|
| 0.680% | of the next $10 billion, | | 0.550% | of the next $100 billion and |
| |
|
| 0.630% | of the next $10 billion, | | 0.545% | of any excess thereafter. |
| |
|
Putnam Management has contractually agreed, through June 30, 2017, to waive fees or reimburse the fund’s expenses to the extent necessary to limit the cumulative expenses of the fund, exclusive of brokerage, interest, taxes, investment-related expenses, extraordinary expenses, acquired fund fees and expenses and payments
under the fund’s investor servicing contract, investment management contract and distribution plans, on a fiscal year-to-date basis to an annual rate of 0.20% of the fund’s average net assets over such fiscal year-to-date period. During the reporting period, the fund’s expenses were not reduced as a result of this limit.
Putnam Investments Limited (PIL), an affiliate of Putnam Management, is authorized by the Trustees to manage a separate portion of the assets of the fund as determined by Putnam Management from time to time. Putnam Management pays a quarterly sub-management fee to PIL for its services at an annual rate of 0.35% of the average net assets of the portion of the fund managed by PIL.
The fund reimburses Putnam Management an allocated amount for the compensation and related expenses of certain officers of the fund and their staff who provide administrative services to the fund. The aggregate amount of all such reimbursements is determined annually by the Trustees.
Custodial functions for the fund’s assets are provided by State Street. Custody fees are based on the fund’s asset level, the number of its security holdings and transaction volumes.
Putnam Investor Services, Inc., an affiliate of Putnam Management, provides investor servicing agent functions to the fund. Putnam Investor Services, Inc. received fees for investor servicing (except for class R5 and R6 shares) that included (1) a per account fee for each direct and underlying non-defined contribution account (“retail account”) of the fund and each of the other funds in its specified category, which was totaled and then allocated to each fund in the category based on its average daily net assets; (2) a specified rate of the fund’s assets attributable to defined contribution plan accounts; and (3) a specified rate based on the average net assets in retail accounts. Putnam Investor Services has agreed that the aggregate investor servicing fees for each fund’s retail and defined contribution accounts will not exceed an annual rate of 0.320% of the fund’s average assets attributable to such accounts. Class R5 shares paid a monthly fee based on the average net assets of class R5 shares at an annual rate of 0.15%. Class R6 shares paid a monthly fee based on the average net assets of class R6 shares at an annual rate of 0.05%. During the reporting period, the expenses for each class of shares related to investor servicing fees were as follows:
| | | | |
| Class A | $157,639 | | Class R5 | 10 |
| |
|
| Class B | 3,013 | | Class R6 | 3,324 |
| |
|
| Class C | 16,873 | | Class Y | 145,276 |
| |
|
| Class M | 1,322 | | Total | $328,275 |
| |
|
| Class R | 818 | | | |
| | |
The fund has entered into expense offset arrangements with Putnam Investor Services, Inc. and State Street whereby Putnam Investor Services, Inc.’s and State Street’s fees are reduced by credits allowed on cash balances. The fund also reduced expenses through brokerage/service arrangements. For the reporting period, the fund’s expenses were reduced by $447 under the expense offset arrangements and by $10,140 under the brokerage/service arrangements.
Each Independent Trustee of the fund receives an annual Trustee fee, of which $207, as a quarterly retainer, has been allocated to the fund, and an additional fee for each Trustees meeting attended. Trustees also are reimbursed for expenses they incur relating to their services as Trustees.
The fund has adopted a Trustee Fee Deferral Plan (the Deferral Plan) which allows the Trustees to defer the receipt of all or a portion of Trustees fees payable on or after July 1, 1995. The deferred fees remain invested in certain Putnam funds until distribution in accordance with the Deferral Plan.
The fund has adopted an unfunded noncontributory defined benefit pension plan (the Pension Plan) covering all Trustees of the fund who have served as a Trustee for at least five years and were first elected prior to 2004. Benefits under the Pension Plan are equal to 50% of the Trustee’s average annual attendance and retainer fees for the three years ended December 31, 2005. The retirement benefit is payable during a Trustee’s lifetime, beginning the year following retirement, for the number of years of service through December 31, 2006. Pension expense for the fund is included in Trustee compensation and expenses in the Statement of operations. Accrued pension liability is included in Payable for Trustee compensation and expenses in the Statement of assets and liabilities. The Trustees have terminated the Pension Plan with respect to any Trustee first elected after 2003.
The fund has adopted distribution plans (the Plans) with respect to its class A, class B, class C, class M and class R shares pursuant to Rule 12b–1 under the Investment Company Act of 1940. The purpose of the Plans is to compensate Putnam Retail Management Limited Partnership, an indirect wholly-owned subsidiary of Putnam Investments, LLC, for services provided and expenses incurred in distributing shares of the fund. The Plans provide for payments
by the fund to Putnam Retail Management Limited Partnership at an annual rate of up to 0.35%, 1.00%, 1.00%, 1.00% and 1.00% of the average net assets attributable to class A, class B, class C, class M and class R shares, respectively. The Trustees have approved payment by the fund at an annual rate of 0.25%, 1.00%, 1.00%, 0.75% and 0.50% of the average net assets attributable to class A, class B, class C, class M and class R shares, respectively. During the reporting period, the class specific expenses related to distribution fees were as follows:
| | | | |
| Class A | $214,221 | | Class M | 5,390 |
| |
|
| Class B | 16,379 | | Class R | 2,220 |
| |
|
| Class C | 91,652 | | Total | $329,862 |
| |
|
For the reporting period, Putnam Retail Management Limited Partnership, acting as underwriter, received net commissions of $9,062 and $60 from the sale of class A and class M shares, respectively, and received $541 and $76 in contingent deferred sales charges from redemptions of class B and class C shares, respectively.
A deferred sales charge of up to 1.00% and 0.65% is assessed on certain redemptions of class A and class M shares, respectively. For the reporting period, Putnam Retail Management Limited Partnership, acting as underwriter, received $2 and no monies on class A and class M redemptions, respectively.
Note 3: Purchases and sales of securities
During the reporting period, the cost of purchases and the proceeds from sales, excluding short-term investments, were as follows:
| | |
| | Cost of purchases | Proceeds from sales |
|
| Investments in securities (Long-term) | $122,032,683 | $103,356,069 |
|
| U.S. government securities (Long-term) | — | — |
|
| Total | $122,032,683 | $103,356,069 |
|
Note 4: Capital shares
At the close of the reporting period, there were an unlimited number of shares of beneficial interest authorized. Transactions in capital shares were as follows:
| | | | |
| | Six months ended 8/31/15 | Year ended 2/28/15 |
|
| Class A | Shares | Amount | Shares | Amount |
|
| Shares sold | 614,720 | $9,566,300 | 2,055,957 | $31,376,863 |
|
| Shares issued in connection with | | | | |
| reinvestment of distributions | — | — | 436,136 | 6,515,868 |
|
| | 614,720 | 9,566,300 | 2,492,093 | 37,892,731 |
|
| Shares repurchased | (1,056,355) | (16,419,148) | (2,356,871) | (35,893,663) |
|
| Net increase (decrease) | (441,635) | $(6,852,848) | 135,222 | $1,999,068 |
|
| |
| | Six months ended 8/31/15 | Year ended 2/28/15 |
|
| Class B | Shares | Amount | Shares | Amount |
|
| Shares sold | 23,838 | $315,446 | 35,038 | $459,338 |
|
| Shares issued in connection with | | | | |
| reinvestment of distributions | — | — | 10,525 | 134,619 |
|
| | 23,838 | 315,446 | 45,563 | 593,957 |
|
| Shares repurchased | (47,573) | (627,436) | (103,741) | (1,356,831) |
|
| Net decrease | (23,735) | $(311,990) | (58,178) | $(762,874) |
|
| | | | |
| | Six months ended 8/31/15 | Year ended 2/28/15 |
|
| Class C | Shares | Amount | Shares | Amount |
|
| Shares sold | 135,772 | $1,793,131 | 374,455 | $4,925,180 |
|
| Shares issued in connection with | | | | |
| reinvestment of distributions | — | — | 52,682 | 672,755 |
|
| | 135,772 | 1,793,131 | 427,137 | 5,597,935 |
|
| Shares repurchased | (97,115) | (1,277,683) | (182,897) | (2,383,719) |
|
| Net increase | 38,657 | $515,448 | 244,240 | $3,214,216 |
|
| |
| | Six months ended 8/31/15 | Year ended 2/28/15 |
|
| Class M | Shares | Amount | Shares | Amount |
|
| Shares sold | 1,160 | $16,421 | 10,547 | $147,069 |
|
| Shares issued in connection with | | | | |
| reinvestment of distributions | — | — | 3,863 | 52,994 |
|
| | 1,160 | 16,421 | 14,410 | 200,063 |
|
| Shares repurchased | (19,580) | (283,135) | (8,721) | (121,504) |
|
| Net increase (decrease) | (18,420) | $(266,714) | 5,689 | $78,559 |
|
| |
| | Six months ended 8/31/15 | Year ended 2/28/15 |
|
| Class R | Shares | Amount | Shares | Amount |
|
| Shares sold | 17,078 | $262,566 | 21,952 | $330,949 |
|
| Shares issued in connection with | | | | |
| reinvestment of distributions | — | — | 1,883 | 27,752 |
|
| | 17,078 | 262,566 | 23,835 | 358,701 |
|
| Shares repurchased | (6,403) | (98,899) | (9,952) | (149,494) |
|
| Net increase | 10,675 | $163,667 | 13,883 | $209,207 |
|
| |
| | Six months ended 8/31/15 | Year ended 2/28/15 |
|
| Class R5 | Shares | Amount | Shares | Amount |
|
| Shares sold | 186 | $2,986 | 58 | $910 |
|
| Shares issued in connection with | | | | |
| reinvestment of distributions | — | — | 29 | 448 |
|
| | 186 | 2,986 | 87 | 1,358 |
|
| Shares repurchased | (99) | (1,586) | — | — |
|
| Net increase | 87 | $1,400 | 87 | $1,358 |
|
| |
| | Six months ended 8/31/15 | Year ended 2/28/15 |
|
| Class R6 | Shares | Amount | Shares | Amount |
|
| Shares sold | 120,402 | $1,938,125 | 40,877 | $651,553 |
|
| Shares issued in connection with | | | | |
| reinvestment of distributions | — | — | 35,284 | 546,195 |
|
| | 120,402 | 1,938,125 | 76,161 | 1,197,748 |
|
| Shares repurchased | (33,572) | (541,171) | (142,527) | (2,247,813) |
|
| Net increase (decrease) | 86,830 | $1,396,954 | (66,366) | $(1,050,065) |
|
| | | | |
| | Six months ended 8/31/15 | Year ended 2/28/15 |
|
| Class Y | Shares | Amount | Shares | Amount |
|
| Shares sold | 2,010,117 | $32,314,239 | 5,848,560 | $92,912,819 |
|
| Shares issued in connection with | | | | |
| reinvestment of distributions | — | — | 344,715 | 5,325,849 |
|
| | 2,010,117 | 32,314,239 | 6,193,275 | 98,238,668 |
|
| Shares repurchased | (1,401,983) | (22,443,316) | (2,906,434) | (45,463,898) |
|
| Net increase | 608,134 | $9,870,923 | 3,286,841 | $52,774,770 |
|
At the close of the reporting period, Putnam Investments, LLC owned the following shares of the fund:
| | | |
| | Shares owned | Percentage of ownership | Value |
|
| Class R5 | 703 | 82.9% | $10,854 |
|
| Class R6 | 704 | 0.1 | 10,877 |
|
Note 5: Affiliated transactions
Transactions during the reporting period with Putnam Money Market Liquidity Fund and Putnam Short Term Investment Fund, which are under common ownership or control, were as follows:
| | | | | |
| | Fair value at the | | | | Fair value at |
| | beginning of | | | | the end of |
| | the reporting | | | Investment | the reporting |
| Name of affiliate | period | Purchase cost | Sale proceeds | income | period |
|
| Putnam Money Market | | | | | |
| Liquidity Fund* | $— | $3,226,251 | $3,226,251 | $86 | $— |
|
| Putnam Short Term | | | | | |
| Investment Fund* | 36,101,320 | 65,976,093 | 67,340,341 | 14,347 | 34,737,072 |
|
| Totals | $36,101,320 | $69,202,344 | $70,566,592 | $14,433 | $34,737,072 |
|
* Management fees charged to Putnam Money Market Liquidity Fund and Putnam Short Term Investment Fund have been waived by Putnam Management.
Note 6: Market, credit and other risks
In the normal course of business, the fund trades financial instruments and enters into financial transactions where risk of potential loss exists due to changes in the market (market risk) or failure of the contracting party to the transaction to perform (credit risk). The fund may be exposed to additional credit risk that an institution or other entity with which the fund has unsettled or open transactions will default. Investments in foreign securities involve certain risks, including those related to economic instability, unfavorable political developments, and currency fluctuations.
Fund information
Founded over 75 years ago, Putnam Investments was built around the concept that a balance between risk and reward is the hallmark of a well-rounded financial program. We manage over 100 funds across income, value, blend, growth, asset allocation, absolute return, and global sector categories.
| | |
| Investment Manager | Trustees | Robert T. Burns |
| Putnam Investment | Jameson A. Baxter, Chair | Vice President and |
| Management, LLC | Liaquat Ahamed | Chief Legal Officer |
| One Post Office Square | Ravi Akhoury | |
| Boston, MA 02109 | Barbara M. Baumann | Robert R. Leveille |
| | Robert J. Darretta | Vice President and |
| Investment Sub-Manager | Katinka Domotorffy | Chief Compliance Officer |
| Putnam Investments Limited | John A. Hill | |
| 57–59 St James’s Street | Paul L. Joskow | Michael J. Higgins |
| London, England SW1A 1LD | Kenneth R. Leibler | Vice President, Treasurer, |
| | Robert E. Patterson | and Clerk |
| Marketing Services | George Putnam, III | |
| Putnam Retail Management | Robert L. Reynolds | Janet C. Smith |
| One Post Office Square | W. Thomas Stephens | Vice President, |
| Boston, MA 02109 | | Principal Accounting Officer, |
| | Officers | and Assistant Treasurer |
| Custodian | Robert L. Reynolds | |
| State Street Bank | President | Susan G. Malloy |
| and Trust Company | | Vice President and |
| | Jonathan S. Horwitz | Assistant Treasurer |
| Legal Counsel | Executive Vice President, | |
| Ropes & Gray LLP | Principal Executive Officer, and | James P. Pappas |
| Compliance Liaison | Vice President |
| | | |
| | Steven D. Krichmar | Mark C. Trenchard |
| | Vice President and | Vice President and |
| | Principal Financial Officer | BSA Compliance Officer |
| | |
| | | Nancy E. Florek |
| | | Vice President, Director of |
| | | Proxy Voting and Corporate |
| | | Governance, Assistant Clerk, |
| | | and Associate Treasurer |
This report is for the information of shareholders of Putnam Small Cap Value Fund. It may also be used as sales literature when preceded or accompanied by the current prospectus, the most recent copy of Putnam’s Quarterly Performance Summary, and Putnam’s Quarterly Ranking Summary. For more recent performance, please visit putnam.com. Investors should carefully consider the investment objectives, risks, charges, and expenses of a fund, which are described in its prospectus. For this and other information or to request a prospectus or summary prospectus, call 1-800-225-1581 toll free. Please read the prospectus carefully before investing. The fund’s Statement of Additional Information contains additional information about the fund’s Trustees and is available without charge upon request by calling 1-800-225-1581.
| |
| Item 3. Audit Committee Financial Expert: |
| |
| Item 4. Principal Accountant Fees and Services: |
| |
| Item 5. Audit Committee of Listed Registrants |
| |
| Item 6. Schedule of Investments: |
| |
| The registrant’s schedule of investments in unaffiliated issuers is included in the report to shareholders in Item 1 above. |
| |
| Item 7. Disclosure of Proxy Voting Policies and Procedures For Closed-End Management Investment Companies: |
| |
| Item 8. Portfolio Managers of Closed-End Investment Companies |
| |
| Item 9. Purchases of Equity Securities by Closed-End Management Investment Companies and Affiliated Purchasers: |
| |
| Item 10. Submission of Matters to a Vote of Security Holders: |
| |
| Item 11. Controls and Procedures: |
| |
| (a) The registrant’s principal executive officer and principal financial officer have concluded, based on their evaluation of the effectiveness of the design and operation of the registrant’s disclosure controls and procedures as of a date within 90 days of the filing date of this report, that the design and operation of such procedures are generally effective to provide reasonable assurance that information required to be disclosed by the registrant in this report is recorded, processed, summarized and reported within the time periods specified in the Commission’s rules and forms. |
| |
| (b) Changes in internal control over financial reporting: Not applicable |
| |
| (a)(2) Separate certifications for the principal executive officer and principal financial officer of the registrant as required by Rule 30a-2(a) under the Investment Company Act of 1940, as amended, are filed herewith. |
| |
| (b) The certifications required by Rule 30a-2(b) under the Investment Company Act of 1940, as amended, are filed herewith. |
| |
| By (Signature and Title): |
| |
| /s/ Janet C. Smith
Janet C. Smith
Principal Accounting Officer
|
| |
| Pursuant to the requirements of the Securities Exchange Act of 1934 and the Investment Company Act of 1940, this report has been signed below by the following persons on behalf of the registrant and in the capacities and on the dates indicated. |
| |
| By (Signature and Title): |
| |
| /s/ Jonathan S. Horwitz
Jonathan S. Horwitz
Principal Executive Officer
|
| |
| By (Signature and Title): |
| |
| /s/ Steven D. Krichmar
Steven D. Krichmar
Principal Financial Officer
|