CERTIFIED SHAREHOLDER REPORT OF REGISTERED MANAGEMENT INVESTMENT COMPANIES
Investment Company Act file number:
(811-07237)
Exact name of registrant as specified in charter:
Putnam Investment Funds
Address of principal executive offices:
One Post Office Square, Boston, Massachusetts 02109
Name and address of agent for service:
Robert T. Burns, Vice President One Post Office Square Boston, Massachusetts 02109
Copy to:
Bryan Chegwidden, Esq. Ropes & Gray LLP 1211 Avenue of the Americas New York, New York 10036
Registrant’s telephone number, including area code:
(617) 292-1000
Date of fiscal year end:
September 30, 2015
Date of reporting period:
October 1, 2014 – March 31, 2015
Item 1. Report to Stockholders:
The following is a copy of the report transmitted to stockholders pursuant to Rule 30e-1 under the Investment Company Act of 1940:
Putnam International Growth Fund
Semiannual report 3 | 31 | 15
Message from the Trustees
1
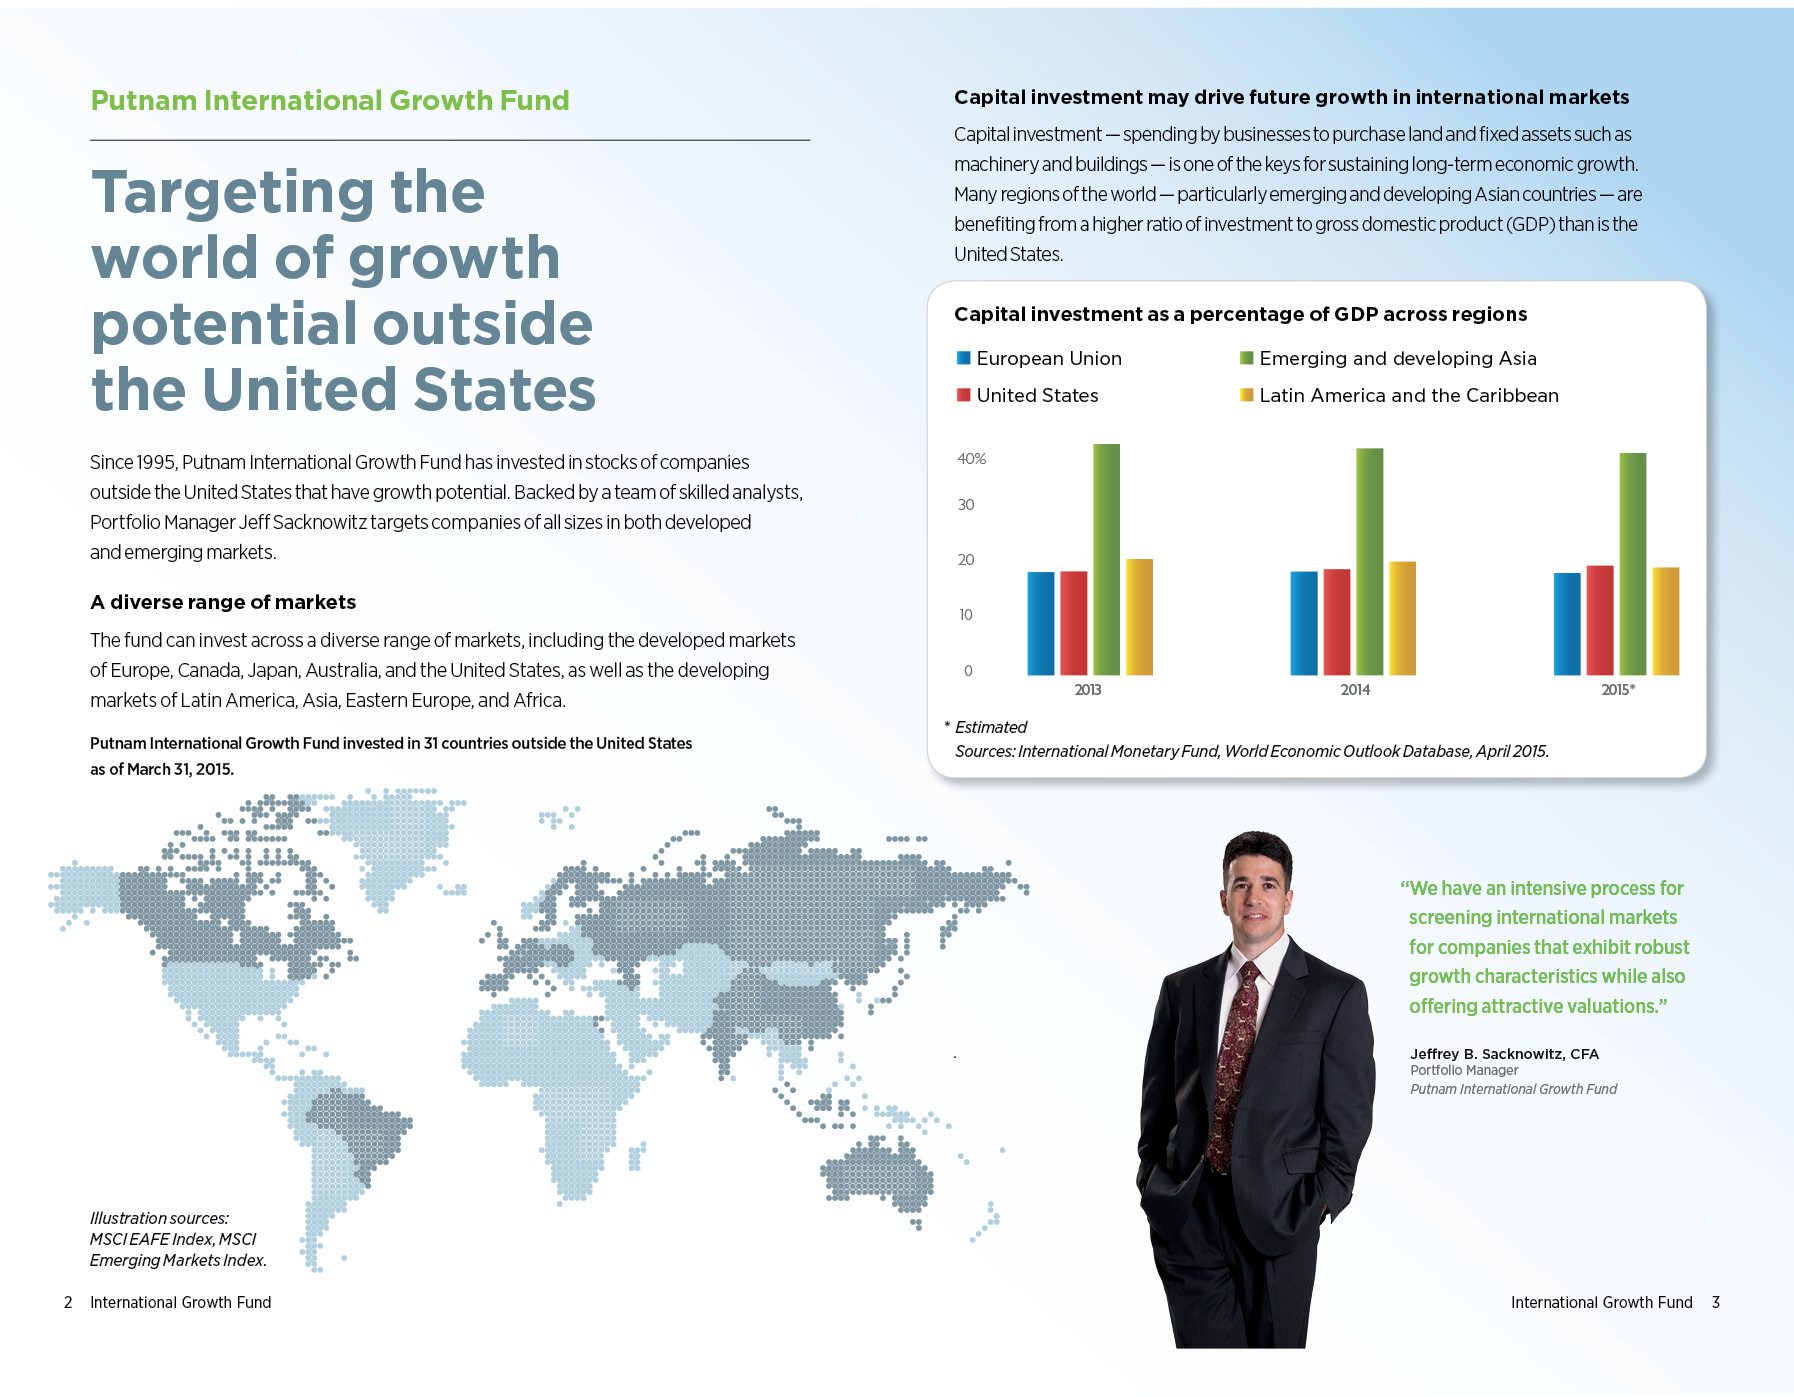
About the fund
2
Performance snapshot
4
Interview with your fund’s portfolio manager
5
Your fund’s performance
11
Your fund’s expenses
13
Terms and definitions
15
Other information for shareholders
16
Financial statements
17
Consider these risks before investing: International investing involves currency, economic, and political risks. Emerging-market securities carry illiquidity and volatility risks. Investments in small and/or midsize companies increase the risk of greater price fluctuations. Growth stocks may be more susceptible to earnings disappointments, and the market may not favor growth-style investing. Stock prices may fall or fail to rise over time for several reasons, including general financial market conditions and factors related to a specific company or industry. Risks associated with derivatives include increased investment exposure (which may be considered leverage) and, in the case of over-the-counter instruments, the potential inability to terminate or sell derivatives positions and the potential failure of the other party to the instrument to meet its obligations. You can lose money by investing in the fund.
Message from the Trustees
Dear Fellow Shareholder:
The month of March 2015 marked the six-year milestone of the bull market in U.S. stocks, and this June will be the sixth anniversary of the beginning of the U.S. economic recovery as dated by the National Bureau of Economic Research, which has traced the chronology of U.S. business cycles back to 1854.
While six years is above the historical average on both counts, reaching these milestones does not necessarily indicate anything about the sustainability of the expansion or the market advance. However, we believe it is an unusually long period for the Federal Reserve to have refrained from raising interest rates. The Fed now appears poised to act, and speculation is mounting about where equity and fixed-income markets around the world could go from this point forward. Your portfolio manager provides a perspective in the following pages.
At this juncture of the market cycle, you might consult your financial advisor who can help you review your goals and risk profile, and explain the importance of timely adjustments to keep your portfolio equipped for all seasons.
As you make progress toward your long-term financial goals, markets may move in different directions. With Putnam, you are aligned with a group of portfolio managers and analysts who are experienced in navigating through changing markets with consistent strategies. They are dedicated to active, fundamental research, and to helping you meet your financial needs.
As always, thank you for investing with Putnam.
Respectfully yours,
Robert L. Reynolds President and Chief Executive Officer Putnam Investments
Jameson A. Baxter Chair, Board of Trustees
May 6, 2015
Performance snapshot
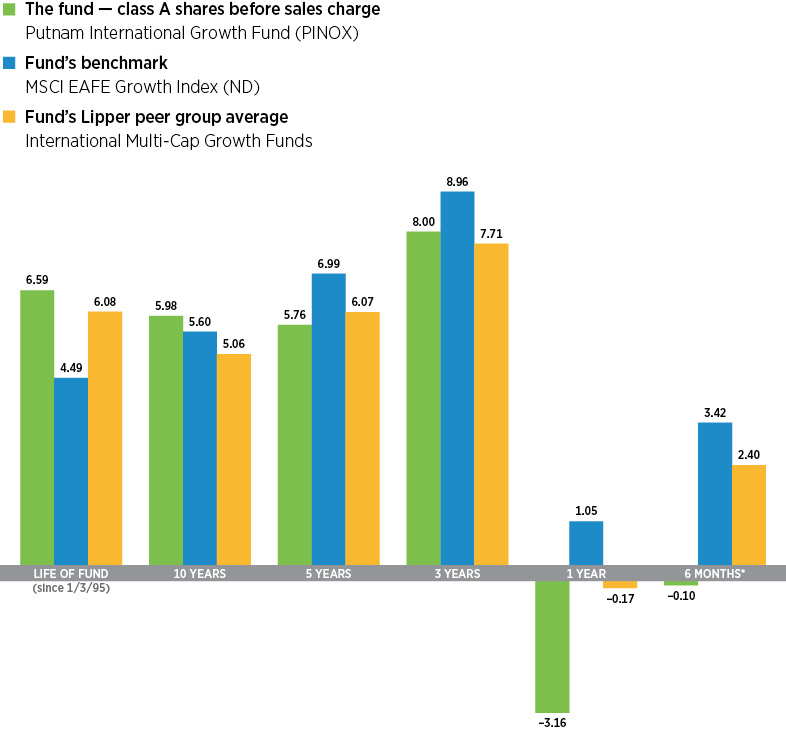
Annualized total return (%) comparison as of 3/31/15
Current performance may be lower or higher than the quoted past performance, which cannot guarantee future results. Share price, principal value, and return will fluctuate, and you may have a gain or a loss when you sell your shares. Performance of class A shares assumes reinvestment of distributions and does not account for taxes. Fund returns in the bar chart do not reflect a sales charge of 5.75%; had they, returns would have been lower. See pages 5 and 11–12 for additional performance information. For a portion of the periods, the fund had expense limitations, without which returns would have been lower. To obtain the most recent month-end performance, visit putnam.com.
Recent performance may have benefited from one or more legal settlements.
*Returns for the six-month period are not annualized, but cumulative.
4 International Growth Fund
Interview with your fund’s portfolio manager
Jeffrey B. Sacknowitz, CFA
For the first half of the fund’s fiscal year, the fund lagged its benchmark, the MSCI EAFE Growth Index [ND]. What accounts for this underperformance?
During the six-month period ended March 31, 2015, stock selection in several areas hurt the fund’s results. Some energy-related stocks in the portfolio performed poorly due to the substantial decline in the price of oil during the period, while the fund’s exposures to smaller-cap companies in emerging markets also weighed on returns. In most of these cases of recent underperformance, however, we continue to believe our stock selection will eventually produce strong results for shareholders.
European equities surprised to the upside during the period. Did your exposures in this region help or hurt relative performance?
The European Central Bank’s launched a new stimulus program in March 2015, and the lead up to this policy event helped depress the value of the euro versus the U.S. dollar, which was a significant benefit to European exporters’ earnings. In the fund, we had a bias toward larger-cap European stocks during the period, but smaller-cap companies tended to do better in this time frame.
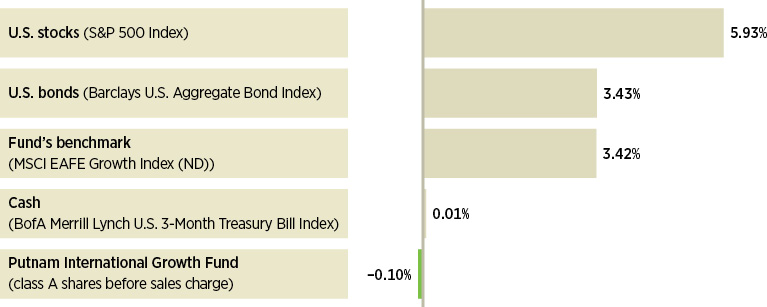
Broad market index and fund performance
This comparison shows your fund’s performance in the context of broad market indexes for the six months ended 3/31/15. See pages 4 and 11–12 for additional fund performance information. Index descriptions can be found on page 15.
International Growth Fund 5
Japanese stocks performed well during the period, particularly from January through March 2015. What factors drove this market upward?
The key factor was the momentum that has been building for better corporate governance in Japan. This momentum, plus the yen’s general weakness relative to the U.S. dollar — which is especially positive for Japanese exporters — aided Japanese stocks’ results.
The major change in governance concerns the way the Japanese government has put its weight behind policies that provide stronger incentives for companies to improve their profitability. For decades, Japanese companies tended to prioritize being good stewards to their own corporate family over producing profits. This entailed keeping bloated balance sheets, maintaining non-core businesses, and placing little emphasis on creating long-term value for shareholders. Now the government and other relevant Japanese institutions have embraced measures that put pressure on Japanese companies to raise ROE, or return on equity, above 5% each year.
Investors around the world have generally applauded this change in mindset, and we believe the momentum behind better corporate governance in Japan should continue to make Japanese stocks attractive.
Which stocks were among the largest detractors from results?
Ezion, a Singapore-listed offshore oil-servicing company, was the largest detractor from the fund’s benchmark-relative return. The company makes liftboats — self-propelled, “jack-up” boats with wide platforms that are used to service offshore oil rigs — and it is one of the few companies with its capabilities operating in the Asia-Pacific region. The stock came under pressure during the period because investors generally steered clear
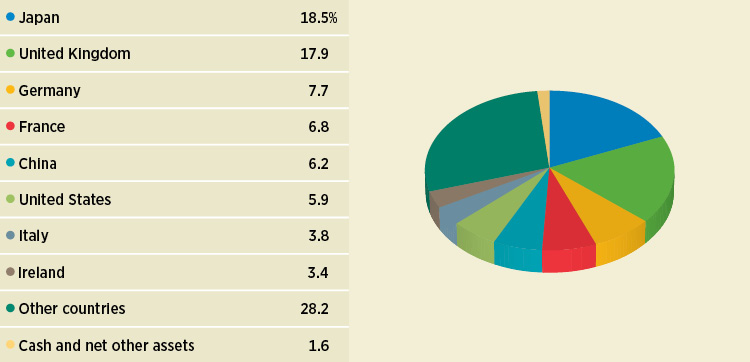
Global composition
Allocations are shown as a percentage of the fund’s net assets as of 3/31/15. Cash and net other assets, if any, represent the market value weights of cash, derivatives, short-term securities, and other unclassified assets in the portfolio. Summary information may differ from the information in the portfolio schedule notes included in the financial statements due to the inclusion of derivative securities, any interest accruals, and the exclusion of as-of trades, if any. Holdings and allocations may vary over time.
6 International Growth Fund
“We believe the momentum behind better corporate governance in Japan should continue to make Japanese stocks attractive.”
Jeff Sacknowitz
of energy stocks, particularly offshore oil producers and related servicing companies, in light of oil’s steep price decline. In our view, the market painted this and some other companies with too broad a brush, and we maintained it in the portfolio at period-end.
Another energy company that we feel experienced undue pressure was Genel Energy, an oil exploration and production company with operations in Iraq. We thought this stock represented less market-related and more idiosyncratic forms of risk — in other words, that it would rise or fall on the basis of outcomes that uniquely pertain to it rather than to the industry as a whole. We believed the key question with this oil producer was whether the Iraqi government would permit the Kurdish authorities to receive payments for oil shipped from Kurdistan by Genel, which in turn would allow Genel to receive payments for the shipments. Based on our assessment, we were convinced this would happen — and it did happen during the period. However, because of the substantial decline in the price of oil during the period, the market became anxious about virtually all energy-related companies, and investors sold-off Genel as a result of this general fear. As of the end of the period, we continued to believe in the long-term value of the company, and we maintained a position in the stock.
As I mentioned earlier, a variety of small-cap emerging-market stocks detracted from performance. One example is China Pioneer Pharma. Investors worried that the company’s products would be under severe pricing pressure due to “price tendering processes”
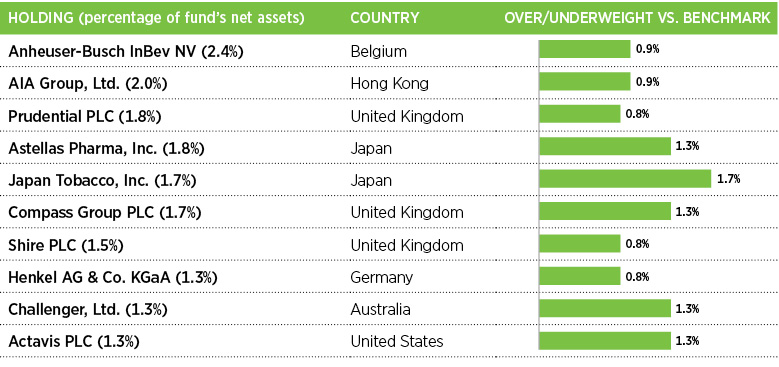
Top 10 holdings
This table shows the fund’s top 10 holdings by percentage of the fund’s net assets as of 3/31/15. Short-term investments and derivatives, if any, are excluded. Holdings will vary over time.
International Growth Fund 7
occurring in various Chinese provinces during 2015. We held the stock through this period of uncertainty. Shortly after the close of the period, our view was vindicated and the stock recovered.
What were some of the largest contributors to the fund’s relative results?
Our benchmark-relative overweight to a French cable company, Numericable, was a top contributor. This company took over the number-two mobile telecommunications player in France, SFR, during the period, which helped drive Numericable’s stock price appreciation. As a participant in the ongoing consolidation of the French telecom industry, Numericable is in a good position to benefit from more rationally priced mobile and data-delivery services, in our view. In addition, we see opportunities for the company to bundle telecommunication services for its customers and expand its market share, even as it has been realizing cost-cutting potential through a simplification of its business model.
Luxottica Group was another top contributor. This company makes or holds licensing rights to a significant portion of the high-end sunglasses available in the United States. Luxottica Group is an Italian company, but a large portion of its earnings derives from U.S. dollar-based sales. The pronounced change in value between the weakening euro and the strengthening dollar during the period — which is a theme we anticipated and positioned the portfolio to take advantage of — had a substantial positive impact on Luxottica’s earnings, and the stock rose on this news.
The stock of China Biologic Products also performed well. This company focuses on the medical supply of blood plasma in China, which is a market that has few competitors and chronic undersupply. After a series of negative experiences with tainted plasma, the
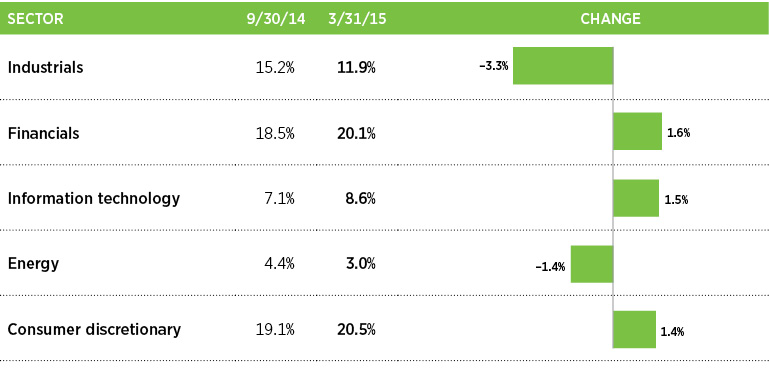
Comparison of top sector shifts
This chart shows the fund’s largest allocation shifts, by percentage, over the past six months. Allocations are shown as a percentage of the fund’s net assets. Current period summary information may differ from the portfolio schedule included in the financial statements due to the inclusion of derivative securities, any interest accruals, the exclusion of as-of trades, if any, and the use of different classifications of securities for presentation purposes. Holdings and allocations may vary over time.
8 International Growth Fund
Chinese government became very conservative in its quality control of this critical medical resource. Fortunately for China Biologic Products, the company passed the quality tests administered by the government. We liked this stock for what we considered its strong management, its success in garnering approvals to establish plasma collection facilities, and for the substantial regulatory barriers to entry in this industry. We maintained the position at period-end.
What is your outlook for international growth opportunities?
With respect to Japan, we are positive about the near-term prospects for exporters, and we think the corporate governance changes gaining momentum are promising for a variety of Japanese stocks. Over the longer term, however, the Japanese economy gives us cause for concern. Japan has a very high debt-to-GDP ratio, on the order of 240%; continued budget deficits; and a developing problem with its shrinking workforce, which is expected to contract by a half to a full percentage point per year over the next decade. So while we believe that investing in Japan’s markets at the moment offers ample opportunities to seek sources of unanticipated growth, Japan’s economy on a longer time horizon raises difficult questions.
Europe, by contrast, should remain a comparative bright spot for investors, in our view. We think the benefits of an already weakened euro have not yet been reflected in analysts’ expectations for European exporters’ earnings. Even if the currency does not weaken much from current levels versus the dollar, we think profit margins for many European companies are likely to improve based on the euro’s devaluation over the past 12 months and the incipient signs of an economic rebound in several parts of Europe.
As always, while we remain cognizant of global macroeconomic conditions, we will continue to focus on our best ideas and to let our fundamental stock-selection process drive the fund’s performance.
Thank you, Jeff, for your time and insights today.
The views expressed in this report are exclusively those of Putnam Management and are subject to change. They are not meant as investment advice.
Please note that the holdings discussed in this report may not have been held by the fund for the entire period. Portfolio composition is subject to review in accordance with the fund’s investment strategy and may vary in the future. Current and future portfolio holdings are subject to risk.
Portfolio Manager Jeffrey B. Sacknowitz has an M.A. in Political Economy and International Relations from Princeton University, an M.A. in International Relations and Japanese Politics from the University of Tokyo, and a B.A. from Colgate University. He joined Putnam in 1999 and has been in the investment industry since 1993.
International Growth Fund 9
IN THE NEWS
Although the U.S. economy is showing positive trends, uneven growth in consumer spending remains a bit perplexing. Despite rising personal income and lower energy costs, consumer spending in the United States rose by only 0.1% in February after dropping 0.2% in January, according to the Commerce Department. Harsh winter weather during those months, with heavy snowfalls blanketing the Northeast and Midwest, may have discouraged millions of Americans from heading to stores. Amid weak spending, the pace of hiring also slowed to 126,000 new jobs in March, the lowest since December 2013. These soft readings, however, might be as temporary as the weather. The personal savings rate rose from 5.5% in January to 5.8% in February, with Americans reaching their highest levels in savings in more than two years. In short, consumers have money to spend, and a rebound in economic activity, along the lines of that seen in 2014, may be likely.
10 International Growth Fund
Your fund’s performance
This section shows your fund’s performance, price, and distribution information for periods ended March 31, 2015, the end of the first half of its current fiscal year. In accordance with regulatory requirements for mutual funds, we also include expense information taken from the fund’s current prospectus. Performance should always be considered in light of a fund’s investment strategy. Data represent past performance. Past performance does not guarantee future results. More recent returns may be less or more than those shown. Investment return and principal value will fluctuate, and you may have a gain or a loss when you sell your shares. Performance information does not reflect any deduction for taxes a shareholder may owe on fund distributions or on the redemption of fund shares. For the most recent month-end performance, please visit the Individual Investors section at putnam.com or call Putnam at 1-800-225-1581. Class R and Y shares are not available to all investors. See the Terms and Definitions section in this report for definitions of the share classes offered by your fund.
Fund performance Total return for periods ended 3/31/15
Class A
Class B
Class C
Class M
Class R
Class Y
(inception dates)
(1/3/95)
(7/21/95)
(2/1/99)
(7/21/95)
(12/1/03)
(10/4/05)
Before sales charge
After sales charge
Before CDSC
After CDSC
Before CDSC
After CDSC
Before sales charge
After sales charge
Net asset value
Net asset value
Annual average
(life of fund)
6.59%
6.28%
6.28%
6.28%
5.79%
5.79%
6.06%
5.88%
6.33%
6.71%
10 years
78.73
68.45
68.17
68.17
65.73
65.73
69.99
64.04
74.23
83.02
Annual average
5.98
5.35
5.34
5.34
5.18
5.18
5.45
5.07
5.71
6.23
5 years
32.33
24.72
27.47
25.47
27.34
27.34
29.03
24.51
30.68
33.98
Annual average
5.76
4.52
4.97
4.64
4.95
4.95
5.23
4.48
5.50
6.02
3 years
25.96
18.72
23.13
20.13
23.16
23.16
24.05
19.71
24.97
26.86
Annual average
8.00
5.89
7.18
6.30
7.19
7.19
7.45
6.18
7.71
8.25
1 year
–3.16
–8.72
–3.89
–8.69
–3.91
–4.87
–3.66
–7.03
–3.46
–2.94
6 months
–0.10
–5.85
–0.46
–5.44
–0.51
–1.50
–0.33
–3.82
–0.21
0.00
Current performance may be lower or higher than the quoted past performance, which cannot guarantee future results. After-sales-charge returns for class A and M shares reflect the deduction of the maximum 5.75% and 3.50% sales charge, respectively, levied at the time of purchase. Class B share returns after contingent deferred sales charge (CDSC) reflect the applicable CDSC, which is 5% in the first year, declining over time to 1% in the sixth year, and is eliminated thereafter. Class C share returns after CDSC reflect a 1% CDSC for the first year that is eliminated thereafter. Class R and Y shares have no initial sales charge or CDSC. Performance for class B, C, M, R, and Y shares before their inception is derived from the historical performance of class A shares, adjusted for the applicable sales charge (or CDSC) and the higher operating expenses for such shares, except for class Y shares, for which 12b-1 fees are not applicable.
Recent performance may have benefited from one or more legal settlements.
For a portion of the periods, the fund had expense limitations, without which returns would have been lower.
Class B share performance reflects conversion to class A shares after eight years.
International Growth Fund 11
Comparative index returns For periods ended 3/31/15
MSCI EAFE Growth Index (ND)
Lipper International Multi-Cap Growth Funds category average*
Annual average (life of fund)
4.49%
6.08%
10 years
72.48
65.82
Annual average
5.60
5.06
5 years
40.17
35.20
Annual average
6.99
6.07
3 years
29.35
25.25
Annual average
8.96
7.71
1 year
1.05
–0.17
6 months
3.42
2.40
Index and Lipper results should be compared with fund performance before sales charge, before CDSC, or at net asset value.
*Over the 6-month, 1-year, 3-year, 5-year, 10-year, and life-of-fund periods ended 3/31/15, there were 400, 391, 344, 320, 166, and 31 funds, respectively, in this Lipper category.
Fund price and distribution information For the six-month period ended 3/31/15
Class A
Class B
Class C
Class M
Class R
Class Y
Share value
Before sales charge
After sales charge
Net asset value
Net asset value
Before sales charge
After sales charge
Net asset value
Net asset value
9/30/14
$19.05
$20.21
$17.38
$17.80
$17.96
$18.61
$18.74
$19.15
3/31/15
19.03
20.19
17.30
17.71
17.90
18.55
18.70
19.15
The classification of distributions, if any, is an estimate. Before-sales-charge share value and current dividend rate for class A and M shares, if applicable, do not take into account any sales charge levied at the time of purchase. After-sales-charge share value, current dividend rate, and current 30-day SEC yield, if applicable, are calculated assuming that the maximum sales charge (5.75% for class A shares and 3.50% for class M shares) was levied at the time of purchase. Final distribution information will appear on your year-end tax forms.
The fund made no distributions during the period.
12 International Growth Fund
Your fund’s expenses
As a mutual fund investor, you pay ongoing expenses, such as management fees, distribution fees (12b-1 fees), and other expenses. Using the following information, you can estimate how these expenses affect your investment and compare them with the expenses of other funds. You may also pay one-time transaction expenses, including sales charges (loads) and redemption fees, which are not shown in this section and would have resulted in higher total expenses. For more information, see your fund’s prospectus or talk to your financial representative.
Expense ratios
Class A
Class B
Class C
Class M
Class R
Class Y
Total annual operating expenses for the fiscal year ended 9/30/14
1.50%
2.25%
2.25%
2.00%
1.75%
1.25%
Annualized expense ratio for the six-month period ended 3/31/15
1.49%
2.24%
2.24%
1.99%
1.74%
1.24%
Fiscal-year expense information in this table is taken from the most recent prospectus, is subject to change, and may differ from that shown for the annualized expense ratio and in the financial highlights of this report.
Expenses are shown as a percentage of average net assets.
Expenses per $1,000
The following table shows the expenses you would have paid on a $1,000 investment in the fund from October 1, 2014, to March 31, 2015. It also shows how much a $1,000 investment would be worth at the close of the period, assuming actual returns and expenses.
Class A
Class B
Class C
Class M
Class R
Class Y
Expenses paid per $1,000*†
$7.43
$11.14
$11.14
$9.91
$8.67
$6.18
Ending value (after expenses)
$999.00
$995.40
$994.90
$996.70
$997.90
$1,000.00
*Expenses for each share class are calculated using the fund’s annualized expense ratio for each class, which represents the ongoing expenses as a percentage of average net assets for the six months ended 3/31/15. The expense ratio may differ for each share class.
†Expenses are calculated by multiplying the expense ratio by the average account value for the period; then multiplying the result by the number of days in the period; and then dividing that result by the number of days in the year.
International Growth Fund 13
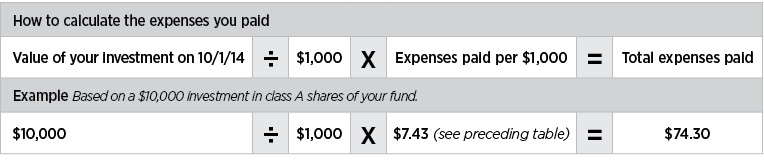
Estimate the expenses you paid
To estimate the ongoing expenses you paid for the six months ended March 31, 2015, use the following calculation method. To find the value of your investment on October 1, 2014, call Putnam at 1-800-225-1581.
Compare expenses using the SEC’s method
The Securities and Exchange Commission (SEC) has established guidelines to help investors assess fund expenses. Per these guidelines, the following table shows your fund’s expenses based on a $1,000 investment, assuming a hypothetical 5% annualized return. You can use this information to compare the ongoing expenses (but not transaction expenses or total costs) of investing in the fund with those of other funds. All mutual fund shareholder reports will provide this information to help you make this comparison. Please note that you cannot use this information to estimate your actual ending account balance and expenses paid during the period.
Class A
Class B
Class C
Class M
Class R
Class Y
Expenses paid per $1,000*†
$7.49
$11.25
$11.25
$10.00
$8.75
$6.24
Ending value (after expenses)
$1,017.50
$1,013.76
$1,013.76
$1,015.01
$1,016.26
$1,018.75
*Expenses for each share class are calculated using the fund’s annualized expense ratio for each class, which represents the ongoing expenses as a percentage of average net assets for the six months ended 3/31/15. The expense ratio may differ for each share class.
†Expenses are calculated by multiplying the expense ratio by the average account value for the six-month period; then multiplying the result by the number of days in the six-month period; and then dividing that result by the number of days in the year.
14 International Growth Fund
Terms and definitions
Important terms
Total return shows how the value of the fund’s shares changed over time, assuming you held the shares through the entire period and reinvested all distributions in the fund.
Before sales charge, or net asset value, is the price, or value, of one share of a mutual fund, without a sales charge. Before-sales-charge figures fluctuate with market conditions, and are calculated by dividing the net assets of each class of shares by the number of outstanding shares in the class.
After sales charge is the price of a mutual fund share plus the maximum sales charge levied at the time of purchase. After-sales-charge performance figures shown here assume the 5.75% maximum sales charge for class A shares and 3.50% for class M shares.
Contingent deferred sales charge (CDSC) is generally a charge applied at the time of the redemption of class B or C shares and assumes redemption at the end of the period. Your fund’s class B CDSC declines over time from a 5% maximum during the first year to 1% during the sixth year. After the sixth year, the CDSC no longer applies. The CDSC for class C shares is 1% for one year after purchase.
Share classes
Class A shares are generally subject to an initial sales charge and no CDSC (except on certain redemptions of shares bought without an initial sales charge).
Class B shares are not subject to an initial sales charge and may be subject to a CDSC.
Class C shares are not subject to an initial sales charge and are subject to a CDSC only if the shares are redeemed during the first year.
Class M shares have a lower initial sales charge and a higher 12b-1 fee than class A shares and no CDSC (except on certain redemptions of shares bought without an initial sales charge).
Class R shares are not subject to an initial sales charge or CDSC and are available only to employer-sponsored retirement plans.
Class Y shares are not subject to an initial sales charge or CDSC, and carry no 12b-1 fee. They are generally only available to corporate and institutional clients and clients in other approved programs.
Comparative indexes
Barclays U.S. Aggregate Bond Index is an unmanaged index of U.S. investment-grade fixed-income securities.
BofA Merrill Lynch U.S. 3-Month Treasury Bill Index is an unmanaged index that seeks to measure the performance of U.S. Treasury bills available in the marketplace.
MSCI EAFE Growth Index (ND) is an unmanaged index that measures the performance in 20 countries within Europe, Australasia, and the Far East with a greater-than-average growth orientation.
S&P 500 Index is an unmanaged index of common stock performance.
Indexes assume reinvestment of all distributions and do not account for fees. Securities and performance of a fund and an index will differ. You cannot invest directly in an index.
Lipper is a third-party industry-ranking entity that ranks mutual funds. Its rankings do not reflect sales charges. Lipper rankings are based on total return at net asset value relative to other funds that have similar current investment styles or objectives as determined by Lipper. Lipper may change a fund’s category assignment at its discretion. Lipper category averages reflect performance trends for funds within a category.
International Growth Fund 15
Other information for shareholders
Important notice regarding delivery of shareholder documents
In accordance with Securities and Exchange Commission (SEC) regulations, Putnam sends a single copy of annual and semiannual shareholder reports, prospectuses, and proxy statements to Putnam shareholders who share the same address, unless a shareholder requests otherwise. If you prefer to receive your own copy of these documents, please call Putnam at 1-800-225-1581, and Putnam will begin sending individual copies within 30 days.
Proxy voting
Putnam is committed to managing our mutual funds in the best interests of our shareholders. The Putnam funds’ proxy voting guidelines and procedures, as well as information regarding how your fund voted proxies relating to portfolio securities during the 12-month period ended June 30, 2014, are available in the Individual Investors section of putnam.com, and on the SEC’s website, www.sec.gov. If you have questions about finding forms on the SEC’s website, you may call the SEC at 1-800-SEC-0330. You may also obtain the Putnam funds’ proxy voting guidelines and procedures at no charge by calling Putnam’s Shareholder Services at 1-800-225-1581.
Fund portfolio holdings
The fund will file a complete schedule of its portfolio holdings with the SEC for the first and third quarters of each fiscal year on Form N-Q. Shareholders may obtain the fund’s Form N-Q on the SEC’s website at www.sec.gov. In addition, the fund’s Form N-Q may be reviewed and copied at the SEC’s Public Reference Room in Washington, D.C. You may call the SEC at 1-800-SEC-0330 for information about the SEC’s website or the operation of the Public Reference Room.
Trustee and employee fund ownership
Putnam employees and members of the Board of Trustees place their faith, confidence, and, most importantly, investment dollars in Putnam mutual funds. As of March 31, 2015, Putnam employees had approximately $494,000,000 and the Trustees had approximately $141,000,000 invested in Putnam mutual funds. These amounts include investments by the Trustees’ and employees’ immediate family members as well as investments through retirement and deferred compensation plans.
16 International Growth Fund
Financial statements
A guide to financial statements
These sections of the report, as well as the accompanying Notes, constitute the fund’s financial statements.
The fund’s portfolio lists all the fund’s investments and their values as of the last day of the reporting period. Holdings are organized by asset type and industry sector, country, or state to show areas of concentration and diversification.
Statement of assets and liabilities shows how the fund’s net assets and share price are determined. All investment and non-investment assets are added together. Any unpaid expenses and other liabilities are subtracted from this total. The result is divided by the number of shares to determine the net asset value per share, which is calculated separately for each class of shares. (For funds with preferred shares, the amount subtracted from total assets includes the liquidation preference of preferred shares.)
Statement of operations shows the fund’s net investment gain or loss. This is done by first adding up all the fund’s earnings — from dividends and interest income — and subtracting its operating expenses to determine net investment income (or loss). Then, any net gain or loss the fund realized on the sales of its holdings — as well as any unrealized gains or losses over the period — is added to or subtracted from the net investment result to determine the fund’s net gain or loss for the fiscal period.
Statement of changes in net assets shows how the fund’s net assets were affected by the fund’s net investment gain or loss, by distributions to shareholders, and by changes in the number of the fund’s shares. It lists distributions and their sources (net investment income or realized capital gains) over the current reporting period and the most recent fiscal year-end. The distributions listed here may not match the sources listed in the Statement of operations because the distributions are determined on a tax basis and may be paid in a different period from the one in which they were earned. Dividend sources are estimated at the time of declaration. Actual results may vary. Any non-taxable return of capital cannot be determined until final tax calculations are completed after the end of the fund’s fiscal year.
Financial highlights provide an overview of the fund’s investment results, per-share distributions, expense ratios, net investment income ratios, and portfolio turnover in one summary table, reflecting the five most recent reporting periods. In a semiannual report, the highlights table also includes the current reporting period.
International Growth Fund 17
The fund’s portfolio 3/31/15 (Unaudited)
COMMON STOCKS (97.3%)*
Shares
Value
Aerospace and defense (1.4%)
Airbus Group NV (France)
45,509
$2,957,196
Bombardier, Inc. Class B (Canada)
828,800
1,635,940
4,593,136
Airlines (0.8%)
International Consolidated Airlines Group SA (Spain) †
286,032
2,556,975
2,556,975
Auto components (2.0%)
Bridgestone Corp. (Japan)
75,400
3,025,504
Toyota Industries Corp. (Japan)
61,400
3,518,807
6,544,311
Automobiles (2.9%)
Tata Motors, Ltd. (India)
321,955
2,809,365
Toyota Motor Corp. (Japan)
55,200
3,852,494
Yamaha Motor Co., Ltd. (Japan)
122,300
2,953,404
9,615,263
Banks (7.2%)
Banca Popolare di Milano Scarl (Italy) †
2,379,430
2,400,486
Bank of Ireland (Ireland) †
9,388,468
3,561,076
BNP Paribas SA (France)
23,561
1,432,929
Credicorp, Ltd. (Peru)
14,000
1,968,820
Dubai Islamic Bank PJSC (United Arab Emirates) †
691,309
1,165,625
Grupo Financiero Banorte SAB de CV (Mexico)
273,400
1,585,177
ING Groep NV GDR (Netherlands) †
259,974
3,813,136
Metro Bank PLC (acquired 1/15/14, cost $1,092,323) (Private) (United Kingdom) †ΔΔ F
Sports Direct International PLC (United Kingdom) †
215,410
1,939,177
WH Smith PLC (United Kingdom)
92,838
1,787,902
3,727,079
Technology hardware, storage, and peripherals (1.2%)
Lenovo Group, Ltd. (China)
1,006,000
1,465,314
Samsung Electronics Co., Ltd. (South Korea)
1,951
2,529,086
3,994,400
Textiles, apparel, and luxury goods (2.1%)
Gerry Weber International AG (Germany)
50,182
1,737,435
Luxottica Group SpA (Italy)
46,506
2,952,567
Moncler SpA (Italy)
138,095
2,314,924
7,004,926
Thrifts and mortgage finance (0.3%)
Dewan Housing Finance Corp., Ltd. (India)
127,656
952,728
952,728
Tobacco (1.7%)
Japan Tobacco, Inc. (Japan)
178,000
5,624,072
5,624,072
Trading companies and distributors (2.1%)
Mitsubishi Corp. (Japan)
142,400
2,870,688
Wolseley PLC (United Kingdom)
70,769
4,185,836
7,056,524
Transportation infrastructure (0.7%)
Sumitomo Warehouse Co., Ltd. (The) (Japan)
413,000
2,287,666
2,287,666
Water utilities (0.2%)
Sound Global, Ltd. (China) † F S
899,000
728,698
728,698
Wireless telecommunication services (0.7%)
Bharti Infratel, Ltd. (India)
401,225
2,471,602
2,471,602
Total common stocks (cost $297,031,011)
$321,919,972
INVESTMENT COMPANIES (1.1%)*
Shares
Value
Market Vectors Russia ETF (Russia)
111,700
$1,900,017
Market Vectors Vietnam ETF (Vietnam) S
108,200
1,826,416
Total investment companies (cost $4,224,597)
$3,726,433
U.S. TREASURY OBLIGATIONS (—%)*
Principal amount
Value
U.S. Treasury Notes 1.000%, May 31, 2018 i
$130,000
$130,582
Total U.S. treasury obligations (cost $130,582)
$130,582
22 International Growth Fund
SHORT-TERM INVESTMENTS (4.1%)*
Principal amount/shares
Value
Putnam Cash Collateral Pool, LLC 0.22% d
Shares 7,970,550
$7,970,550
Putnam Short Term Investment Fund 0.09% L
Shares 4,057,157
4,057,157
SSgA Prime Money Market Fund Class N 0.02% P
Shares 230,000
230,000
U.S. Treasury Bills with an effective yield of 0.03%, April 16, 2015 Δ
$100,000
99,999
U.S. Treasury Bills with an effective yield of 0.02%, April 23, 2015 Δ
260,000
259,996
U.S. Treasury Bills with an effective yield of 0.01%, April 30, 2015 Δ
250,000
249,998
U.S. Treasury Bills with an effective yield of 0.01%, May 14, 2015 Δ
394,000
393,996
U.S. Treasury Bills with an effective yield of 0.02%, May 21, 2015 Δ
150,000
149,995
U.S. Treasury Bills with an effective yield of 0.02%, May 28, 2015
$6,000
6,000
Total short-term investments (cost $13,417,691)
$13,417,691
TOTAL INVESTMENTS
Total investments (cost $314,803,881)
$339,194,678
Key to holding’s abbreviations
ADR
American Depository Receipts: represents ownership of foreign securities on deposit with a custodian bank
ETF
Exchange Traded Fund
GDR
Global Depository Receipts: represents ownership of foreign securities on deposit with a custodian bank
PJSC
Public Joint Stock Company
Notes to the fund’s portfolio
Unless noted otherwise, the notes to the fund’s portfolio are for the close of the fund’s reporting period, which ran from October 1, 2014 through March 31, 2015 (the reporting period). Within the following notes to the portfolio, references to “ASC 820” represent Accounting Standards Codification 820 Fair Value Measurements and Disclosures and references to “OTC”, if any, represent over-the-counter.
*
Percentages indicated are based on net assets of 330,882,954.
†
This security is non-income-producing.
ΔΔ
This security is restricted with regard to public resale. The total fair value of this security and any other restricted securities (excluding 144A securities), if any, held at the close of the reporting period was $1,266,053, or 0.4% of net assets.
Δ
This security, in part or in entirety, was pledged and segregated with the custodian for collateral on certain derivative contracts at the close of the reporting period.
d
Affiliated company. See Note 1 to the financial statements regarding securities lending. The rate quoted in the security description is the annualized 7-day yield of the fund at the close of the reporting period.
F
This security is valued at fair value following procedures approved by the Trustees. Securities may be classified as Level 2 or Level 3 for ASC 820 based on the securities’ valuation inputs. At the close of the reporting period, fair value pricing was also used for certain foreign securities in the portfolio (Note 1).
i
This security was pledged, or purchased with cash that was pledged, to the fund for collateral on certain derivative contracts (Note 1).
L
Affiliated company (Note 5). The rate quoted in the security description is the annualized 7-day yield of the fund at the close of the reporting period.
International Growth Fund 23
P
This security was pledged, or purchased with cash that was pledged, to the fund for collateral on certain derivative contracts. The rate quoted in the security description is the annualized 7-day yield of the fund at the close of the reporting period (Note 1).
S
Security on loan, in part or in entirety, at the close of the reporting period (Note 1).
At the close of the reporting period, the fund maintained liquid assets totaling $528,274 to cover certain derivative contracts and the settlement of certain securities.
Debt obligations are considered secured unless otherwise indicated.
144A after the name of an issuer represents securities exempt from registration under Rule 144A under the Securities Act of 1933, as amended. These securities may be resold in transactions exempt from registration, normally to qualified institutional buyers.
The dates shown on debt obligations are the original maturity dates.
DIVERSIFICATION BY COUNTRY
Distribution of investments by country of risk at the close of the reporting period, excluding collateral received, if any (as a percentage of Portfolio Value):
Japan
18.5%
United Kingdom
17.9
Germany
7.7
United States
7.5
France
6.8
China
6.2
Italy
3.8
Ireland
3.4
Belgium
3.2
India
2.9
Hong Kong
2.9
Switzerland
2.6
Australia
2.0
Spain
1.8
Sweden
1.7
Netherlands
1.6
Canada
1.1
Taiwan
1.0
Turkey
0.9
Indonesia
0.8
South Korea
0.8
Singapore
0.7
Portugal
0.7
United Arab Emirates
0.7
Peru
0.6
Russia
0.6
Vietnam
0.6
Mexico
0.5
Other
0.5
Total
100.0%
FORWARD CURRENCY CONTRACTS at 3/31/15 (aggregate face value $86,061,097) (Unaudited)
Counterparty
Currency
Contract type
Delivery date
Value
Aggregate face value
Unrealized appreciation/ (depreciation)
Bank of America N.A.
British Pound
Buy
6/17/15
$4,033,198
$4,181,564
$(148,366)
Barclays Bank PLC
Canadian Dollar
Buy
4/15/15
232,487
330,077
(97,590)
Euro
Sell
6/17/15
2,097,405
2,182,471
85,066
Hong Kong Dollar
Buy
5/20/15
973,097
973,044
53
Japanese Yen
Buy
5/20/15
364,503
371,772
(7,269)
Singapore Dollar
Buy
5/20/15
1,103,156
1,124,023
(20,867)
Swiss Franc
Buy
6/17/15
679,828
690,885
(11,057)
Citibank, N.A.
British Pound
Sell
6/17/15
182,957
189,669
6,712
Danish Krone
Buy
6/17/15
9,305,407
9,672,330
(366,923)
24 International Growth Fund
FORWARD CURRENCY CONTRACTS at 3/31/15 (aggregate face value $86,061,097) (Unaudited) cont.
Counterparty
Currency
Contract type
Delivery date
Value
Aggregate face value
Unrealized appreciation/ (depreciation)
Citibank, N.A. cont.
Euro
Buy
6/17/15
$436,466
$406,657
$29,809
Japanese Yen
Sell
5/20/15
7,214,714
7,279,998
65,284
Credit Suisse International
Australian Dollar
Buy
4/15/15
2,357,925
2,474,424
(116,499)
Canadian Dollar
Sell
4/15/15
1,887,283
2,024,199
136,916
Euro
Buy
6/17/15
1,511,647
1,526,087
(14,440)
Norwegian Krone
Buy
6/17/15
1,789,956
1,870,300
(80,344)
Swiss Franc
Buy
6/17/15
1,671,286
1,699,941
(28,655)
Deutsche Bank AG
Australian Dollar
Sell
4/15/15
830,776
875,529
44,753
British Pound
Sell
6/17/15
2,431,513
2,477,029
45,516
Euro
Buy
6/17/15
507,076
529,673
(22,597)
HSBC Bank USA, National Association
British Pound
Sell
6/17/15
1,539,711
1,594,326
54,615
Euro
Sell
6/17/15
2,217,851
2,315,858
98,007
JPMorgan Chase Bank N.A.
British Pound
Sell
6/17/15
3,336,214
3,458,733
122,519
Euro
Sell
6/17/15
6,079,526
6,350,893
271,367
Japanese Yen
Buy
5/20/15
2,040,381
1,974,047
66,334
Norwegian Krone
Buy
6/17/15
899,680
939,960
(40,280)
Singapore Dollar
Buy
5/20/15
1,532,861
1,561,196
(28,335)
South Korean Won
Sell
5/20/15
2,436,362
2,477,928
41,566
Swedish Krona
Buy
6/17/15
1,412,306
1,456,306
(44,000)
Swiss Franc
Buy
6/17/15
3,953,756
4,019,721
(65,965)
State Street Bank and Trust Co.
Australian Dollar
Sell
4/15/15
1,104,455
1,163,979
59,524
British Pound
Sell
6/17/15
852,364
883,719
31,355
Euro
Sell
6/17/15
3,910,758
3,984,182
73,424
Israeli Shekel
Buy
4/15/15
115,925
109,891
6,034
Japanese Yen
Sell
5/20/15
1,098,189
1,112,451
14,262
Swiss Franc
Buy
6/17/15
6,342,855
6,419,614
(76,759)
UBS AG
British Pound
Sell
6/17/15
86,586
89,773
3,187
Euro
Buy
6/17/15
150,476
156,470
(5,994)
Swiss Franc
Buy
6/17/15
3,926,918
3,994,016
(67,098)
WestPac Banking Corp.
Euro
Sell
6/17/15
1,070,768
1,118,362
47,594
Total
$60,859
International Growth Fund 25
ASC 820 establishes a three-level hierarchy for disclosure of fair value measurements. The valuation hierarchy is based upon the transparency of inputs to the valuation of the fund’s investments. The three levels are defined as follows:
Level 1: Valuations based on quoted prices for identical securities in active markets.
Level 2: Valuations based on quoted prices in markets that are not active or for which all significant inputs are observable, either directly or indirectly.
Level 3: Valuations based on inputs that are unobservable and significant to the fair value measurement.
The following is a summary of the inputs used to value the fund’s net assets as of the close of the reporting period:
Valuation inputs
Investments in securities:
Level 1
Level 2
Level 3
Common stocks*:
Consumer discretionary
$6,679,405
$60,929,356
$185,118
Consumer staples
2,283,807
35,042,469
—
Energy
—
9,754,009
—
Financials
7,757,398
57,858,896
1,080,935
Health care
11,767,127
32,821,930
—
Industrials
1,635,940
37,782,315
—
Information technology
8,898,525
19,714,470
—
Materials
2,307,070
7,226,548
—
Telecommunication services
—
10,114,505
—
Utilities
—
8,080,149
—
Total common stocks
41,329,272
279,324,647
1,266,053
Investment companies
3,726,433
—
—
U.S. treasury obligations
—
130,582
—
Short-term investments
4,287,157
9,130,534
—
Totals by level
$49,342,862
$288,585,763
$1,266,053
Valuation inputs
Other financial instruments:
Level 1
Level 2
Level 3
Forward currency contracts
$—
$60,859
$—
Totals by level
$—
$60,859
$—
* Common stock classifications are presented at the sector level, which may differ from the fund’s portfolio presentation.
During the reporting period, transfers within the fair value hierarchy, if any, (other than certain transfers involving non-U.S. equity securities as described in Note 1) did not represent, in the aggregate, more than 1% of the fund’s net assets measured as of the end of the period.
At the start and close of the reporting period, Level 3 investments in securities represented less than 1% of the fund’s net assets and were not considered a significant portion of the fund’s portfolio.
The accompanying notes are an integral part of these financial statements.
26 International Growth Fund
Statement of assets and liabilities 3/31/15 (Unaudited)
ASSETS
Investment in securities, at value, including $7,560,976 of securities on loan (Note 1):
Affiliated issuers (identified cost $12,027,707) (Notes 1 and 5)
12,027,707
Cash
100,350
Foreign currency (cost $113,353) (Note 1)
113,439
Dividends, interest and other receivables
655,226
Foreign tax reclaim
189,992
Receivable for shares of the fund sold
159,077
Receivable for investments sold
43,033
Unrealized appreciation on forward currency contracts (Note 1)
1,303,897
Prepaid assets
30,063
Total assets
341,789,755
LIABILITIES
Payable for investments purchased
117
Payable for shares of the fund repurchased
423,396
Payable for compensation of Manager (Note 2)
251,597
Payable for custodian fees (Note 2)
26,087
Payable for investor servicing fees (Note 2)
82,424
Payable for Trustee compensation and expenses (Note 2)
242,156
Payable for administrative services (Note 2)
1,124
Payable for distribution fees (Note 2)
196,101
Unrealized depreciation on forward currency contracts (Note 1)
1,243,038
Collateral on securities loaned, at value (Note 1)
7,970,550
Collateral on certain derivative contracts, at value (Note 1)
360,582
Other accrued expenses
109,629
Total liabilities
10,906,801
Net assets
$330,882,954
REPRESENTED BY
Paid-in capital (Unlimited shares authorized) (Notes 1 and 4)
$383,506,566
Undistributed net investment income (Note 1)
790,866
Accumulated net realized loss on investments and foreign currency transactions (Note 1)
(77,846,651)
Net unrealized appreciation of investments and assets and liabilities in foreign currencies
24,432,173
Total — Representing net assets applicable to capital shares outstanding
$330,882,954
(Continued on next page)
The accompanying notes are an integral part of these financial statements.
International Growth Fund 27
Statement of assets and liabilities (Continued)
COMPUTATION OF NET ASSET VALUE AND OFFERING PRICE
Net asset value and redemption price per class A share ($287,289,291 divided by 15,097,972 shares)
$19.03
Offering price per class A share (100/94.25 of $19.03)*
$20.19
Net asset value and offering price per class B share ($5,722,244 divided by 330,831 shares)**
$17.30
Net asset value and offering price per class C share ($8,720,530 divided by 492,311 shares)**
$17.71
Net asset value and redemption price per class M share ($5,723,950 divided by 319,760 shares)
$17.90
Offering price per class M share (100/96.50 of $17.90)*
$18.55
Net asset value, offering price and redemption price per class R share ($2,238,150 divided by 119,670 shares)
$18.70
Net asset value, offering price and redemption price per class Y share ($21,188,789 divided by 1,106,309 shares)
$19.15
*
On single retail sales of less than $50,000. On sales of $50,000 or more, the offering price is reduced.
**
Redemption price per share is equal to net asset value less any applicable contingent deferred sales charge.
The accompanying notes are an integral part of these financial statements.
28 International Growth Fund
Statement of operations Six months ended 3/31/15 (Unaudited)
INVESTMENT INCOME
Dividends (net of foreign tax of $121,875)
$2,674,743
Interest (including interest income of $3,091 from investments in affiliated issuers) (Note 5)
3,257
Securities lending (Note 1)
46,734
Total investment income
2,724,734
EXPENSES
Compensation of Manager (Note 2)
1,531,933
Investor servicing fees (Note 2)
330,377
Custodian fees (Note 2)
48,901
Trustee compensation and expenses (Note 2)
2,798
Distribution fees (Note 2)
463,797
Administrative services (Note 2)
5,045
Other
160,225
Total expenses
2,543,076
Expense reduction (Note 2)
(21,126)
Net expenses
2,521,950
Net investment income
202,784
Net realized gain on investments (Notes 1 and 3)
2,856,998
Net realized loss on foreign currency transactions (Note 1)
(3,769,835)
Net realized gain on written options (Notes 1 and 3)
868,172
Net unrealized appreciation of assets and liabilities in foreign currencies during the period
1,178,477
Net unrealized depreciation of investments and written options during the period
(2,207,410)
Net loss on investments
(1,073,598)
Net decrease in net assets resulting from operations
$(870,814)
The accompanying notes are an integral part of these financial statements.
International Growth Fund ��� 29
Statement of changes in net assets
INCREASE (DECREASE) IN NET ASSETS
Six months ended 3/31/15*
Year ended 9/30/14
Operations:
Net investment income
$202,784
$1,062,400
Net realized gain (loss) on investments and foreign currency transactions
(44,665)
39,896,080
Net unrealized depreciation of investments and assets and liabilities in foreign currencies
(1,028,933)
(19,480,494)
Net increase (decrease) in net assets resulting from operations
(870,814)
21,477,986
Distributions to shareholders (Note 1):
From ordinary income
Net investment income
Class A
—
(723,227)
Class R
—
(395)
Class Y
—
(94,346)
Decrease from capital share transactions (Note 4)
(20,022,238)
(20,475,728)
Total increase (decrease) in net assets
(20,893,052)
184,290
NET ASSETS
Beginning of period
351,776,006
351,591,716
End of period (including undistributed net investment income of $790,866 and $588,082, respectively)
$330,882,954
$351,776,006
*
Unaudited.
The accompanying notes are an integral part of these financial statements.
30 International Growth Fund
This page left blank intentionally.
International Growth Fund 31
Financial highlights (For a common share outstanding throughout the period)
INVESTMENT OPERATIONS:
LESS DISTRIBUTIONS:
RATIOS AND SUPPLEMENTAL DATA:
Period ended
Net asset value, beginning of period
Net investment income (loss)a
Net realized and unrealized gain (loss) on investments
Total from investment operations
From net investment income
Total distributions
Redemption fees
Non-recurring reimbursements
Net asset value, end of period
Total return at net asset value (%)b
Net assets, end of period (in thousands)
Ratio of expenses to average net assets (%)c
Ratio of net investment income (loss) to average net assets (%)
Portfolio turnover (%)
Class A
March 31, 2015**
$19.05
.01
(.03)
(.02)
—
—
—
—
$19.03
(.10)*
$287,289
.74*
.07*
46*
September 30, 2014
18.00
.06
1.03
1.09
(.04)
(.04)
—
—
19.05
6.07
305,408
1.50
.32
110
September 30, 2013
15.03
.09
2.95
3.04
(.07)
(.07)
—d
—
18.00
20.30
307,077
1.53
.56
127
September 30, 2012
13.10
.09
2.30
2.39
(.50)
(.50)
—d
.04e
15.03
19.14
286,059
1.56
.60
108
September 30, 2011
15.47
.10
(2.44)
(2.34)
(.19)
(.19)
—d
.16f,g,h
13.10
(14.33)
276,049
1.59
.59
121
September 30, 2010
14.53
.06
1.21
1.27
(.37)
(.37)
—d
.04i
15.47
9.17
359,067
1.67j,k
.42j
162
Class B
March 31, 2015**
$17.38
(.05)
(.03)
(.08)
—
—
—
—
$17.30
(.46) *
$5,722
1.12*
(.30)*
46*
September 30, 2014
16.51
(.08)
.95
.87
—
—
—
—
17.38
5.27
6,593
2.25
(.47)
110
September 30, 2013
13.82
(.03)
2.72
2.69
—
—
—d
—
16.51
19.46
7,870
2.28
(.22)
127
September 30, 2012
12.04
(.02)
2.13
2.11
(.37)
(.37)
—d
.04e
13.82
18.24
8,854
2.31
(.19)
108
September 30, 2011
14.22
(.03)
(2.25)
(2.28)
(.06)
(.06)
—d
.16f,g,h
12.04
(14.97)
10,474
2.34
(.21)
121
September 30, 2010
13.39
(.05)
1.11
1.06
(.27)
(.27)
—d
.04i
14.22
8.29
17,777
2.42j,k
(.38)j
162
Class C
March 31, 2015**
$17.80
(.05)
(.04)
(.09)
—
—
—
—
$17.71
(.51)*
$8,721
1.12*
(.30)*
46*
September 30, 2014
16.91
(.08)
.97
.89
—
—
—
—
17.80
5.26
9,016
2.25
(.42)
110
September 30, 2013
14.16
(.03)
2.78
2.75
—
—
—d
—
16.91
19.42
8,626
2.28
(.19)
127
September 30, 2012
12.35
(.02)
2.18
2.16
(.39)
(.39)
—d
.04e
14.16
18.24
7,671
2.31
(.14)
108
September 30, 2011
14.60
(.02)
(2.31)
(2.33)
(.08)
(.08)
—d
.16f,g,h
12.35
(14.96)
7,293
2.34
(.15)
121
September 30, 2010
13.75
(.05)
1.14
1.09
(.28)
(.28)
—d
.04i
14.60
8.31
9,093
2.42j,k
(.33)j
162
Class M
March 31, 2015**
$17.96
(.03)
(.03)
(.06)
—
—
—
—
$17.90
(.33)*
$5,724
.99*
(.18)*
46*
September 30, 2014
17.02
(.03)
.97
.94
—
—
—
—
17.96
5.52
5,944
2.00
(.18)
110
September 30, 2013
14.22
.01
2.79
2.80
—
—
—d
—
17.02
19.69
6,332
2.03
.06
127
September 30, 2012
12.40
.01
2.19
2.20
(.42)
(.42)
—d
.04e
14.22
18.56
5,840
2.06
.09
108
September 30, 2011
14.65
.01
(2.30)
(2.29)
(.12)
(.12)
—d
.16f,g,h
12.40
(14.72)
6,300
2.09
.08
121
September 30, 2010
13.80
(.01)
1.13
1.12
(.31)
(.31)
—d
.04i
14.65
8.53
8,701
2.17j,k
(.09)j
162
Class R
March 31, 2015**
$18.74
(.01)
(.03)
(.04)
—
—
—
—
$18.70
(.21)*
$2,238
.87*
(.05)*
46*
September 30, 2014
17.72
.01
1.01
1.02
—d
—d
—
—
18.74
5.77
2,396
1.75
.06
110
September 30, 2013
14.80
.05
2.91
2.96
(.04)
(.04)
—d
—
17.72
20.00
2,389
1.78
.31
127
September 30, 2012
12.90
.05
2.28
2.33
(.47)
(.47)
—d
.04e
14.80
18.86
2,032
1.81
.38
108
September 30, 2011
15.25
.06
(2.41)
(2.35)
(.16)
(.16)
—d
.16f,g,h
12.90
(14.57)
1,557
1.84
.37
121
September 30, 2010
14.34
.02
1.19
1.21
(.34)
(.34)
—d
.04i
15.25
8.86
1,871
1.92j,k
.15j
162
Class Y
March 31, 2015**
$19.15
.04
(.04)
—
—
—
—
—
$19.15
—*
$21,189
.62*
.20*
46*
September 30, 2014
18.09
.12
1.03
1.15
(.09)
(.09)
—
—
19.15
6.35
22,419
1.25
.59
110
September 30, 2013
15.11
.14
2.95
3.09
(.11)
(.11)
—d
—
18.09
20.55
19,298
1.28
.86
127
September 30, 2012
13.17
.08
2.37
2.45
(.55)
(.55)
—d
.04e
15.11
19.49
12,925
1.31
.54
108
September 30, 2011
15.55
.14
(2.45)
(2.31)
(.23)
(.23)
—d
.16f,g,h
13.17
(14.11)
23,939
1.34
.87
121
September 30, 2010
14.60
.09
1.22
1.31
(.40)
(.40)
—d
.04i
15.55
9.43
28,405
1.42j,k
.65j
162
See notes to financial highlights at the end of this section.
The accompanying notes are an integral part of these financial statements.
32
International Growth Fund
International Growth Fund
33
Financial highlights (Continued)
* Not annualized.
** Unaudited.
a Per share net investment income (loss) has been determined on the basis of the weighted average number of shares outstanding during the period.
b Total return assumes dividend reinvestment and does not reflect the effect of sales charges.
c Includes amounts paid through expense offset and brokerage/service arrangements, if any (Note 2). Also excludes acquired fund fees and expenses, if any.
d Amount represents less than $0.01 per share.
e Reflects a non-recurring reimbursement pursuant to a settlement between the Securities and Exchange Commission (the SEC) and Canadian Imperial Holdings, Inc. and CIBC World Markets Corp., which amounted to $0.04 per share outstanding on November 29, 2011.
f Reflects a non-recurring reimbursement pursuant to a settlement between the SEC and Southwest Securities, Inc. (SWS), which amounted to less than $0.01 per share outstanding as of August 22, 2011.
g Reflects a non-recurring reimbursement related to restitution amounts in connection with a distribution plan approved by the SEC, which amounted to $0.14 per share outstanding on July 21, 2011. Also reflects a non-recurring reimbursement related to short-term trading related lawsuits, which amounted to $0.01 per share outstanding on May 11, 2011.
h Reflects a non-recurring reimbursement pursuant to a settlement between the SEC and Zurich Capital Markets, Inc., which amounted to $0.01 per share outstanding as of December 21, 2010.
i Reflects a non-recurring reimbursement pursuant to a settlement between the SEC and Prudential Securities, Inc., which amounted to $0.04 per share outstanding as of March 30, 2010.
j Reflects an involuntary contractual expense limitation in effect during the period. As a result of such limitation, the expenses of each class reflect a reduction of the following amount:
Percentage of average net assets
September 30, 2010
0.02%
k Includes interest accrued in connection with certain terminated derivatives contracts, which amounted to less than 0.01% of average net assets as of September 30, 2010.
The accompanying notes are an integral part of these financial statements.
34 International Growth Fund
Notes to financial statements 3/31/15 (Unaudited)
Within the following Notes to financial statements, references to “State Street” represent State Street Bank and Trust Company, references to “the SEC” represent the Securities and Exchange Commission, references to “Putnam Management” represent Putnam Investment Management, LLC, the fund’s manager, an indirect wholly-owned subsidiary of Putnam Investments, LLC and references to “OTC”, if any, represent over-the-counter. Unless otherwise noted, the “reporting period” represents the period from October 1, 2014 through March 31, 2015.
Putnam International Growth Fund (the fund) is a diversified series of Putnam Investment Funds (the Trust), a Massachusetts business trust registered under the Investment Company Act of 1940, as amended, as an open-end management investment company. The goal of the fund is to seek long-term capital appreciation by investing mainly in common stocks of companies of any size in established and emerging markets outside the United States. The fund invests mainly in growth stocks, which are issued by companies whose earnings are expected to grow faster than those of similar firms, and whose business growth and other characteristics may lead to an increase in stock price. Putnam Management may consider, among other factors, a company’s valuation, financial strength, growth potential, competitive position in its industry, projected future earnings, cash flows and dividends when deciding whether to buy or sell investments.
The fund offers class A, class B, class C, class M, class R and class Y shares. Class A and class M shares are sold with a maximum front-end sales charge of 5.75% and 3.50%, respectively, and generally do not pay a contingent deferred sales charge. Class B shares, which convert to class A shares after approximately eight years, do not pay a front-end sales charge and are subject to a contingent deferred sales charge if those shares are redeemed within six years of purchase. Class C shares have a one-year 1.00% contingent deferred sales charge and do not convert to class A shares. Class R shares, which are not available to all investors, are sold at net asset value. The expenses for class A, class B, class C, class M and class R shares may differ based on the distribution fee of each class, which is identified in Note 2. Class Y shares, which are sold at net asset value, are generally subject to the same expenses as class A, class B, class C, class M and class R shares, but do not bear a distribution fee. Class Y shares are not available to all investors.
In the normal course of business, the fund enters into contracts that may include agreements to indemnify another party under given circumstances. The fund’s maximum exposure under these arrangements is unknown as this would involve future claims that may be, but have not yet been, made against the fund. However, the fund’s management team expects the risk of material loss to be remote.
Note 1: Significant accounting policies
The following is a summary of significant accounting policies consistently followed by the fund in the preparation of its financial statements. The preparation of financial statements is in conformity with accounting principles generally accepted in the United States of America and requires management to make estimates and assumptions that affect the reported amounts of assets and liabilities in the financial statements and the reported amounts of increases and decreases in net assets from operations. Actual results could differ from those estimates. Subsequent events after the Statement of assets and liabilities date through the date that the financial statements were issued have been evaluated in the preparation of the financial statements.
Investment income, realized and unrealized gains and losses and expenses of the fund are borne pro-rata based on the relative net assets of each class to the total net assets of the fund, except that each class bears expenses unique to that class (including the distribution fees applicable to such classes). Each class votes as a class only with respect to its own distribution plan or other matters on which a class vote is required by law or determined by the Trustees. If the fund were liquidated, shares of each class would receive their pro-rata share of the net assets of the fund. In addition, the Trustees declare separate dividends on each class of shares.
Security valuation Portfolio securities and other investments are valued using policies and procedures adopted by the Board of Trustees. The Trustees have formed a Pricing Committee to oversee the implementation of these procedures and have delegated responsibility for valuing the fund’s assets in accordance with these procedures to Putnam Management. Putnam Management has established an internal Valuation Committee that is responsible for making fair value determinations, evaluating the effectiveness of the pricing policies of the fund and reporting to the Pricing Committee.
Investments for which market quotations are readily available are valued at the last reported sales price on their principal exchange, or official closing price for certain markets, and are classified as Level 1 securities under Accounting Standards Codification 820 Fair Value Measurements and Disclosures (ASC 820). If no sales are
International Growth Fund 35
reported, as in the case of some securities that are traded OTC, a security is valued at its last reported bid price and is generally categorized as a Level 2 security.
Investments in open-end investment companies (excluding exchange-traded funds), if any, which can be classified as Level 1 or Level 2 securities, are valued based on their net asset value. The net asset value of such investment companies equals the total value of their assets less their liabilities and divided by the number of their outstanding shares.
Market quotations are not considered to be readily available for certain debt obligations and other investments; such investments are valued on the basis of valuations furnished by an independent pricing service approved by the Trustees or dealers selected by Putnam Management. Such services or dealers determine valuations for normal institutional-size trading units of such securities using methods based on market transactions for comparable securities and various relationships, generally recognized by institutional traders, between securities (which consider such factors as security prices, yields, maturities and ratings). These securities will generally be categorized as Level 2. Short-term securities with remaining maturities of 60 days or less may be valued at amortized cost, which approximates fair value, and are classified as Level 2 securities.
Many securities markets and exchanges outside the U.S. close prior to the close of the New York Stock Exchange and therefore the closing prices for securities in such markets or on such exchanges may not fully reflect events that occur after such close but before the close of the New York Stock Exchange. Accordingly, on certain days, the fund will fair value foreign equity securities taking into account multiple factors including movements in the U.S. securities markets, currency valuations and comparisons to the valuation of American Depository Receipts, exchange-traded funds and futures contracts. These securities, which would generally be classified as Level 1 securities, will be transferred to Level 2 of the fair value hierarchy when they are valued at fair value. The number of days on which fair value prices will be used will depend on market activity and it is possible that fair value prices will be used by the fund to a significant extent. At the close of the reporting period, fair value pricing was used for certain foreign securities in the portfolio. Securities quoted in foreign currencies, if any, are translated into U.S. dollars at the current exchange rate.
To the extent a pricing service or dealer is unable to value a security or provides a valuation that Putnam Management does not believe accurately reflects the security’s fair value, the security will be valued at fair value by Putnam Management in accordance with policies and procedures approved by the Trustees. Certain investments, including certain restricted and illiquid securities and derivatives, are also valued at fair value following procedures approved by the Trustees. These valuations consider such factors as significant market or specific security events such as interest rate or credit quality changes, various relationships with other securities, discount rates, U.S. Treasury, U.S. swap and credit yields, index levels, convexity exposures, recovery rates, sales and other multiples and resale restrictions. These securities are classified as Level 2 or as Level 3 depending on the priority of the significant inputs.
To assess the continuing appropriateness of fair valuations, the Valuation Committee reviews and affirms the reasonableness of such valuations on a regular basis after considering all relevant information that is reasonably available. Such valuations and procedures are reviewed periodically by the Trustees. The fair value of securities is generally determined as the amount that the fund could reasonably expect to realize from an orderly disposition of such securities over a reasonable period of time. By its nature, a fair value price is a good faith estimate of the value of a security in a current sale and does not reflect an actual market price, which may be different by a material amount.
Security transactions and related investment income Security transactions are recorded on the trade date (the date the order to buy or sell is executed). Gains or losses on securities sold are determined on the identified cost basis.
Interest income, net of any applicable withholding taxes, is recorded on the accrual basis. Dividend income, net of any applicable withholding taxes, is recognized on the ex-dividend date except that certain dividends from foreign securities, if any, are recognized as soon as the fund is informed of the ex-dividend date. Non-cash dividends, if any, are recorded at the fair value of the securities received. Dividends representing a return of capital or capital gains, if any, are reflected as a reduction of cost and/or as a realized gain. All premiums/discounts are amortized/accreted on a yield-to-maturity basis.
Foreign currency translation The accounting records of the fund are maintained in U.S. dollars. The fair value of foreign securities, currency holdings, and other assets and liabilities is recorded in the books and records of the fund after translation to U.S. dollars based on the exchange rates on that day. The cost of each security is determined using historical exchange rates. Income and withholding taxes are translated at prevailing exchange rates when earned or incurred. The fund does not isolate that portion of realized or unrealized gains or losses resulting
36 International Growth Fund
from changes in the foreign exchange rate on investments from fluctuations arising from changes in the market prices of the securities. Such gains and losses are included with the net realized and unrealized gain or loss on investments. Net realized gains and losses on foreign currency transactions represent net realized exchange gains or losses on closed forward currency contracts, disposition of foreign currencies, currency gains and losses realized between the trade and settlement dates on securities transactions and the difference between the amount of investment income and foreign withholding taxes recorded on the fund’s books and the U.S. dollar equivalent amounts actually received or paid. Net unrealized appreciation and depreciation of assets and liabilities in foreign currencies arise from changes in the value of open forward currency contracts and assets and liabilities other than investments at the period end, resulting from changes in the exchange rate.
Options contracts The fund uses options contracts to hedge against changes in values of securities it owns, owned or expects to own.
The potential risk to the fund is that the change in value of options contracts may not correspond to the change in value of the hedged instruments. In addition, losses may arise from changes in the value of the underlying instruments if there is an illiquid secondary market for the contracts, if interest or exchange rates move unexpectedly or if the counterparty to the contract is unable to perform. Realized gains and losses on purchased options are included in realized gains and losses on investment securities. If a written call option is exercised, the premium originally received is recorded as an addition to sales proceeds. If a written put option is exercised, the premium originally received is recorded as a reduction to the cost of investments.
Exchange-traded options are valued at the last sale price or, if no sales are reported, the last bid price for purchased options and the last ask price for written options. OTC traded options are valued using prices supplied by dealers.
Options on swaps are similar to options on securities except that the premium paid or received is to buy or grant the right to enter into a previously agreed upon interest rate or credit default contract. Forward premium swap option contracts include premiums that have extended settlement dates. The delayed settlement of the premiums is factored into the daily valuation of the option contracts. In the case of interest rate cap and floor contracts, in return for a premium, ongoing payments between two parties are based on interest rates exceeding a specified rate, in the case of a cap contract, or falling below a specified rate in the case of a floor contract.
Written option contracts outstanding at period end, if any, are listed after the fund’s portfolio.
Forward currency contracts The fund buys and sells forward currency contracts, which are agreements between two parties to buy and sell currencies at a set price on a future date. These contracts are used to hedge foreign exchange risk.
The U.S. dollar value of forward currency contracts is determined using current forward currency exchange rates supplied by a quotation service. The fair value of the contract will fluctuate with changes in currency exchange rates. The contract is marked to market daily and the change in fair value is recorded as an unrealized gain or loss. The fund records a realized gain or loss equal to the difference between the value of the contract at the time it was opened and the value at the time it was closed when the contract matures or by delivery of the currency. The fund could be exposed to risk if the value of the currency changes unfavorably, if the counterparties to the contracts are unable to meet the terms of their contracts or if the fund is unable to enter into a closing position. Risks may exceed amounts recognized on the Statement of assets and liabilities.
Forward currency contracts outstanding at period end, if any, are listed after the fund’s portfolio.
Master agreements The fund is a party to ISDA (International Swaps and Derivatives Association, Inc.) Master Agreements (Master Agreements) with certain counterparties that govern OTC derivative and foreign exchange contracts entered into from time to time. The Master Agreements may contain provisions regarding, among other things, the parties’ general obligations, representations, agreements, collateral requirements, events of default and early termination. With respect to certain counterparties, in accordance with the terms of the Master Agreements, collateral posted to the fund is held in a segregated account by the fund’s custodian and, with respect to those amounts which can be sold or repledged, is presented in the fund���s portfolio.
Collateral pledged by the fund is segregated by the fund’s custodian and identified in the fund’s portfolio. Collateral can be in the form of cash or debt securities issued by the U.S. Government or related agencies or other securities as agreed to by the fund and the applicable counterparty. Collateral requirements are determined based on the fund’s net position with each counterparty.
Termination events applicable to the fund may occur upon a decline in the fund’s net assets below a specified threshold over a certain period of time. Termination events applicable to counterparties may occur upon a decline
International Growth Fund 37
in the counterparty’s long-term and short-term credit ratings below a specified level. In each case, upon occurrence, the other party may elect to terminate early and cause settlement of all derivative and foreign exchange contracts outstanding, including the payment of any losses and costs resulting from such early termination, as reasonably determined by the terminating party. Any decision by one or more of the fund’s counterparties to elect early termination could impact the fund’s future derivative activity.
At the close of the reporting period, the fund had a net liability position of $638,075 on open derivative contracts subject to the Master Agreements. Collateral posted by the fund at period end for these agreements totaled $459,000 and may include amounts related to unsettled agreements.
Securities lending The fund may lend securities, through its agent, to qualified borrowers in order to earn additional income. The loans are collateralized by cash in an amount at least equal to the fair value of the securities loaned. The fair value of securities loaned is determined daily and any additional required collateral is allocated to the fund on the next business day. The risk of borrower default will be borne by the fund’s agent; the fund will bear the risk of loss with respect to the investment of the cash collateral. Income from securities lending is included in investment income on the Statement of operations. Cash collateral is invested in Putnam Cash Collateral Pool, LLC, a limited liability company managed by an affiliate of Putnam Management. Investments in Putnam Cash Collateral Pool, LLC are valued at its closing net asset value each business day. There are no management fees charged to Putnam Cash Collateral Pool, LLC. At the close of the reporting period, the fund received cash collateral of $7,970,550 and the value of securities loaned amounted to $7,560,976.
Interfund lending The fund, along with other Putnam funds, may participate in an interfund lending program pursuant to an exemptive order issued by the SEC. This program allows the fund to borrow from or lend to other Putnam funds that permit such transactions. Interfund lending transactions are subject to each fund’s investment policies and borrowing and lending limits. Interest earned or paid on the interfund lending transaction will be based on the average of certain current market rates. During the reporting period, the fund did not utilize the program.
Lines of credit The fund participates, along with other Putnam funds, in a $392.5 million unsecured committed line of credit and a $235.5 million unsecured uncommitted line of credit, both provided by State Street. Borrowings may be made for temporary or emergency purposes, including the funding of shareholder redemption requests and trade settlements. Interest is charged to the fund based on the fund’s borrowing at a rate equal to the Federal Funds rate plus 1.25% for the committed line of credit and the Federal Funds rate plus 1.30% for the uncommitted line of credit. A closing fee equal to 0.04% of the committed line of credit and 0.04% of the uncommitted line of credit has been paid by the participating funds. In addition, a commitment fee of 0.11% per annum on any unutilized portion of the committed line of credit is allocated to the participating funds based on their relative net assets and paid quarterly. During the reporting period, the fund had no borrowings against these arrangements.
Federal taxes It is the policy of the fund to distribute all of its taxable income within the prescribed time period and otherwise comply with the provisions of the Internal Revenue Code of 1986, as amended (the Code), applicable to regulated investment companies. It is also the intention of the fund to distribute an amount sufficient to avoid imposition of any excise tax under Section 4982 of the Code.
The fund is subject to the provisions of Accounting Standards Codification 740 Income Taxes (ASC 740). ASC 740 sets forth a minimum threshold for financial statement recognition of the benefit of a tax position taken or expected to be taken in a tax return. The fund did not have a liability to record for any unrecognized tax benefits in the accompanying financial statements. No provision has been made for federal taxes on income, capital gains or unrealized appreciation on securities held nor for excise tax on income and capital gains. Each of the fund’s federal tax returns for the prior three fiscal years remains subject to examination by the Internal Revenue Service.
The fund may also be subject to taxes imposed by governments of countries in which it invests. Such taxes are generally based on either income or gains earned or repatriated. The fund accrues and applies such taxes to net investment income, net realized gains and net unrealized gains as income and/or capital gains are earned. In some cases, the fund may be entitled to reclaim all or a portion of such taxes, and such reclaim amounts, if any, are reflected as an asset on the fund’s books. In many cases, however, the fund may not receive such amounts for an extended period of time, depending on the country of investment.
38 International Growth Fund
At September 30, 2014, the fund had a capital loss carryover of $77,467,127 available to the extent allowed by the Code to offset future net capital gain, if any. The amounts of the carryovers and the expiration dates are:
Loss carryover
Short-term
Long-term
Total
Expiration
$21,852,008
N/A
$21,852,008
September 30, 2017
55,615,119
N/A
55,615,119
September 30, 2018
Under the Regulated Investment Company Modernization Act of 2010, the fund will be permitted to carry forward capital losses incurred in taxable years beginning after December 22, 2010 for an unlimited period. However, any losses incurred will be required to be utilized prior to the losses incurred in pre-enactment tax years. As a result of this ordering rule, pre-enactment capital loss carryforwards may be more likely to expire unused. Additionally, post-enactment capital losses that are carried forward will retain their character as either short-term or long-term capital losses rather than being considered all short-term as under previous law.
Pursuant to federal income tax regulations applicable to regulated investment companies, the fund has elected to defer $130,974 to its fiscal year ending September 30, 2015 of late year ordinary losses ((i) ordinary losses recognized during the period between January 1, 2014 and September 30, 2014, and (ii) specified ordinary and currency losses recognized during the period between November 1, 2013 and September 30, 2014), to its fiscal year ending September 30, 2015.
The aggregate identified cost on a tax basis is $315,118,711, resulting in gross unrealized appreciation and depreciation of $42,706,930 and $18,630,963, respectively, or net unrealized appreciation of $24,075,967.
Distributions to shareholders Distributions to shareholders from net investment income are recorded by the fund on the ex-dividend date. Distributions from capital gains, if any, are recorded on the ex-dividend date and paid at least annually. The amount and character of income and gains to be distributed are determined in accordance with income tax regulations, which may differ from generally accepted accounting principles. Dividend sources are estimated at the time of declaration. Actual results may vary. Any non-taxable return of capital cannot be determined until final tax calculations are completed after the end of the fund’s fiscal year. Reclassifications are made to the fund’s capital accounts to reflect income and gains available for distribution (or available capital loss carryovers) under income tax regulations.
Expenses of the Trust Expenses directly charged or attributable to any fund will be paid from the assets of that fund. Generally, expenses of the Trust will be allocated among and charged to the assets of each fund on a basis that the Trustees deem fair and equitable, which may be based on the relative assets of each fund or the nature of the services performed and relative applicability to each fund.
Note 2: Management fee, administrative services and other transactions
The fund pays Putnam Management a management fee (base fee) (based on the fund’s average net assets and computed and paid monthly) at annual rates that may vary based on the average of the aggregate net assets of most open-end funds, as defined in the fund’s management contract, sponsored by Putnam Management. Such annual rates may vary as follows:
1.080%
of the first $5 billion,
1.030%
of the next $5 billion,
0.980%
of the next $10 billion,
0.930%
of the next $10 billion,
0.880%
of the next $50 billion,
0.860%
of the next $50 billion,
0.850%
of the next $100 billion and
0.845%
of any excess thereafter.
In addition, the monthly management fee consists of the monthly base fee plus or minus a performance adjustment for the month. The performance adjustment is determined based on performance over the thirty-six month period then ended. Each month, the performance adjustment is calculated by multiplying the performance adjustment rate and the fund’s average net assets over the performance period and the result is divided by twelve. The resulting dollar amount is added to, or subtracted from the base fee for that month. The performance adjustment rate is equal to 0.03 multiplied by the difference between the fund’s annualized performance (measured by the fund’s class A shares) and the annualized performance of the MSCI EAFE Growth Index (Net Dividends), each measured over the performance period. The maximum annualized performance adjustment rates are +/–0.21%.
International Growth Fund 39
The monthly base fee is determined based on the fund’s average net assets for the month, while the performance adjustment is determined based on the fund’s average net assets over the performance period of up to thirty-six months. This means it is possible that, if the fund underperforms significantly over the performance period, and the fund’s assets have declined significantly over that period, the negative performance adjustment may exceed the base fee. In this event, Putnam Management would make a payment to the fund.
Because the performance adjustment is based on the fund’s performance relative to its applicable benchmark index, and not its absolute performance, the performance adjustment could increase Putnam Management’s fee even if the fund’s shares lose value during the performance period provided that the fund outperformed its benchmark index, and could decrease Putnam Management’s fee even if the fund’s shares increase in value during the performance period provided that the fund underperformed its benchmark index.
For the reporting period, the base fee represented an effective rate (excluding the impact from any expense waivers in effect) of 0.458% of the fund’s average net assets before a decrease of $5,846 (0.002% of the fund’s average net assets) based on performance.
Putnam Management has contractually agreed, through June 30, 2015, to waive fees or reimburse the fund’s expenses to the extent necessary to limit the cumulative expenses of the fund, exclusive of brokerage, interest, taxes, investment-related expenses, extraordinary expenses, acquired fund fees and expenses and payments under the fund’s investor servicing contract, investment management contract and distribution plans, on a fiscal year-to-date basis to an annual rate of 0.20% of the fund’s average net assets over such fiscal year-to-date period. During the reporting period, the fund’s expenses were not reduced as a result of this limit.
Putnam Investments Limited (PIL), an affiliate of Putnam Management, is authorized by the Trustees to manage a separate portion of the assets of the fund as determined by Putnam Management from time to time. Putnam Management pays a quarterly sub-management fee to PIL for its services at an annual rate of 0.35% of the average net assets of the portion of the fund managed by PIL.
The Putnam Advisory Company, LLC (PAC), an affiliate of Putnam Management, is authorized by the Trustees to manage a separate portion of the assets of the fund, as designated from time to time by Putnam Management or PIL. Putnam Management or PIL, as applicable, pays a quarterly sub-advisory fee to PAC for its services at the annual rate of 0.35% of the average net assets of the portion of the fund’s assets for which PAC is engaged as sub-adviser.
The fund reimburses Putnam Management an allocated amount for the compensation and related expenses of certain officers of the fund and their staff who provide administrative services to the fund. The aggregate amount of all such reimbursements is determined annually by the Trustees.
Custodial functions for the fund’s assets are provided by State Street. Custody fees are based on the fund’s asset level, the number of its security holdings and transaction volumes.
Putnam Investor Services, Inc., an affiliate of Putnam Management, provides investor servicing agent functions to the fund. Putnam Investor Services, Inc. received fees for investor servicing that included (1) a per account fee for each direct and underlying non-defined contribution account (“retail account”) of the fund and each of the other funds in its specified category, which was totaled and then allocated to each fund in the category based on its average daily net assets; (2) a specified rate of the fund’s assets attributable to defined contribution plan accounts; and (3) for the portion of the fund’s fiscal year beginning after January 1, 2015, a specified rate based on the average net assets in retail accounts. Putnam Investor Services has agreed that the aggregate investor servicing fees for each fund’s retail and defined contribution accounts will not exceed an annual rate of 0.320% of the fund’s average assets attributable to such accounts. During the reporting period, the expenses for each class of shares related to investor servicing fees were as follows:
Class A
$286,732
Class B
5,933
Class C
8,524
Class M
5,606
Class R
2,239
Class Y
21,343
Total
$330,377
The fund has entered into expense offset arrangements with Putnam Investor Services, Inc. and State Street whereby Putnam Investor Services, Inc.’s and State Street’s fees are reduced by credits allowed on cash balances. The fund also reduced expenses through brokerage/service arrangements. For the reporting period, the fund’s
40 International Growth Fund
expenses were reduced by $243 under the expense offset arrangements and by $20,883 under the brokerage/service arrangements.
Each Independent Trustee of the fund receives an annual Trustee fee, of which $185, as a quarterly retainer, has been allocated to the fund, and an additional fee for each Trustees meeting attended. Trustees also are reimbursed for expenses they incur relating to their services as Trustees.
The fund has adopted a Trustee Fee Deferral Plan (the Deferral Plan) which allows the Trustees to defer the receipt of all or a portion of Trustees fees payable on or after July 1, 1995. The deferred fees remain invested in certain Putnam funds until distribution in accordance with the Deferral Plan.
The fund has adopted an unfunded noncontributory defined benefit pension plan (the Pension Plan) covering all Trustees of the fund who have served as a Trustee for at least five years and were first elected prior to 2004. Benefits under the Pension Plan are equal to 50% of the Trustee’s average annual attendance and retainer fees for the three years ended December 31, 2005. The retirement benefit is payable during a Trustee’s lifetime, beginning the year following retirement, for the number of years of service through December 31, 2006. Pension expense for the fund is included in Trustee compensation and expenses in the Statement of operations. Accrued pension liability is included in Payable for Trustee compensation and expenses in the Statement of assets and liabilities. The Trustees have terminated the Pension Plan with respect to any Trustee first elected after 2003.
The fund has adopted distribution plans (the Plans) with respect to its class A, class B, class C, class M and class R shares pursuant to Rule 12b–1 under the Investment Company Act of 1940. The purpose of the Plans is to compensate Putnam Retail Management Limited Partnership, an indirect wholly-owned subsidiary of Putnam Investments, LLC, for services provided and expenses incurred in distributing shares of the fund. The Plans provide for payments by the fund to Putnam Retail Management Limited Partnership at an annual rate of up to 0.35%, 1.00%, 1.00%, 1.00% and 1.00% of the average net assets attributable to class A, class B, class C, class M and class R shares, respectively. The Trustees have approved payment by the fund at an annual rate of 0.25%, 1.00%, 1.00%, 0.75% and 0.50% of the average net assets attributable to class A, class B, class C, class M and class R shares, respectively. During the reporting period, the class specific expenses related to distribution fees were as follows:
Class A
$363,478
Class B
30,079
Class C
43,238
Class M
21,331
Class R
5,671
Total
$463,797
For the reporting period, Putnam Retail Management Limited Partnership, acting as underwriter, received net commissions of $11,962 and $86 from the sale of class A and class M shares, respectively, and received $1,888 and $77 in contingent deferred sales charges from redemptions of class B and class C shares, respectively.
A deferred sales charge of up to 1.00% and 0.65% is assessed on certain redemptions of class A and class M shares, respectively. For the reporting period, Putnam Retail Management Limited Partnership, acting as underwriter, received $59 and no monies on class A and class M redemptions, respectively.
Note 3: Purchases and sales of securities
During the reporting period, the cost of purchases and the proceeds from sales, excluding short-term investments, were as follows:
Cost of purchases
Proceeds from sales
Investments in securities (Long-term)
$151,005,577
$168,687,111
U.S. government securities (Long-term)
—
—
Total
$151,005,577
$168,687,111
International Growth Fund 41
Written option transactions during the reporting period are summarized as follows:
Written option contract amounts
Written option premiums
Written options outstanding at the beginning of the reporting period
$678,817
$356,038
Options opened
626,927
638,682
Options exercised
—
—
Options expired
(997,092)
(858,913)
Options closed
(308,652)
(135,807)
Written options outstanding at the end of the reporting period
$—
$—
Note 4: Capital shares
At the close of the reporting period, there were an unlimited number of shares of beneficial interest authorized. Transactions in capital shares were as follows:
Six months ended 3/31/15
Year ended 9/30/14
Class A
Shares
Amount
Shares
Amount
Shares sold
417,631
$7,757,872
789,013
$15,327,812
Shares issued in connection with reinvestment of distributions
—
—
35,239
673,418
417,631
7,757,872
824,252
16,001,230
Shares repurchased
(1,355,291)
(25,202,877)
(1,849,434)
(35,884,406)
Net decrease
(937,660)
$(17,445,005)
(1,025,182)
$(19,883,176)
Six months ended 3/31/15
Year ended 9/30/14
Class B
Shares
Amount
Shares
Amount
Shares sold
14,051
$239,506
39,570
$699,949
Shares issued in connection with reinvestment of distributions
—
—
—
—
14,051
239,506
39,570
699,949
Shares repurchased
(62,651)
(1,060,915)
(136,880)
(2,420,841)
Net decrease
(48,600)
$(821,409)
(97,310)
$(1,720,892)
Six months ended 3/31/15
Year ended 9/30/14
Class C
Shares
Amount
Shares
Amount
Shares sold
31,227
$541,363
62,410
$1,138,949
Shares issued in connection with reinvestment of distributions
—
—
—
—
31,227
541,363
62,410
1,138,949
Shares repurchased
(45,516)
(785,067)
(66,006)
(1,204,243)
Net decrease
(14,289)
$(243,704)
(3,596)
$(65,294)
42 International Growth Fund
Six months ended 3/31/15
Year ended 9/30/14
Class M
Shares
Amount
Shares
Amount
Shares sold
4,257
$74,617
11,502
$208,917
Shares issued in connection with reinvestment of distributions
—
—
—
—
4,257
74,617
11,502
208,917
Shares repurchased
(15,411)
(269,921)
(52,580)
(961,851)
Net decrease
(11,154)
$(195,304)
(41,078)
$(752,934)
Six months ended 3/31/15
Year ended 9/30/14
Class R
Shares
Amount
Shares
Amount
Shares sold
16,564
$304,937
25,780
$492,122
Shares issued in connection with reinvestment of distributions
—
—
18
345
16,564
304,937
25,798
492,467
Shares repurchased
(24,723)
(455,292)
(32,781)
(619,083)
Net decrease
(8,159)
$(150,355)
(6,983)
$(126,616)
Six months ended 3/31/15
Year ended 9/30/14
Class Y
Shares
Amount
Shares
Amount
Shares sold
148,762
$2,794,434
299,373
$5,871,241
Shares issued in connection with reinvestment of distributions
—
—
4,228
81,087
148,762
2,794,434
303,601
5,952,328
Shares repurchased
(213,286)
(3,960,895)
(199,401)
(3,879,144)
Net increase (decrease)
(64,524)
$(1,166,461)
104,200
$2,073,184
Note 5: Affiliated transactions
Transactions during the reporting period with Putnam Short Term Investment Fund, which is under common ownership and control, were as follows:
Name of affiliate
Fair value at the beginning of the reporting period
Purchase cost
Sale proceeds
Investment income
Fair value at the end of the reporting period
Putnam Short Term Investment Fund*
$7,377,503
$58,490,112
$61,810,458
$3,091
$4,057,157
Totals
$7,377,503
$58,490,112
$61,810,458
$3,091
$4,057,157
*Management fees charged to Putnam Short Term Investment Fund have been waived by Putnam Management.
Note 6: Market, credit and other risks
In the normal course of business, the fund trades financial instruments and enters into financial transactions where risk of potential loss exists due to changes in the market (market risk) or failure of the contracting party to the transaction to perform (credit risk). The fund may be exposed to additional credit risk that an institution or other entity with which the fund has unsettled or open transactions will default. Investments in foreign securities involve certain risks, including those related to economic instability, unfavorable political developments, and currency fluctuations.
International Growth Fund 43
Note 7: Summary of derivative activity
The volume of activity for the reporting period for any derivative type that was held during the period is listed below and was as follows based on an average of the holdings at the end of each fiscal quarter:
Written equity option contracts (contract amount) (Note 3)
$97,000
Forward currency contracts (contract amount)
$120,400,000
The following is a summary of the fair value of derivative instruments as of the close of the reporting period:
Fair value of derivative instruments as of the close of the reporting period
Asset derivatives
Liability derivatives
Derivatives not accounted for as hedging instruments under ASC 815
Statement of assets and liabilities location
Fair value
Statement of assets and liabilities location
Fair value
Foreign exchange contracts
Receivables
$1,303,897
Payables
$1,243,038
Total
$1,303,897
$1,243,038
The following is a summary of realized and change in unrealized gains or losses of derivative instruments on the Statement of operations for the reporting period (see Note 1):
Amount of realized gain or (loss) on derivatives recognized in net gain or (loss) on investments
Derivatives not accounted for as hedging instruments under ASC 815
Options
Forward currency contracts
Total
Foreign exchange contracts
$—
$(3,684,381)
$(3,684,381)
Equity contracts
(186,391)
—
$(186,391)
Total
$(186,391)
$(3,684,381)
$(3,870,772)
Change in unrealized appreciation or (depreciation) on derivatives recognized in net gain or (loss) on investments
Derivatives not accounted for as hedging instruments under ASC 815
Forward currency contracts
Total
Foreign exchange contracts
$1,183,482
$1,183,482
Total
$1,183,482
$1,183,482
44 International Growth Fund
This page left blank intentionally.
International Growth Fund 45
Note 8: Offsetting of financial and derivative assets and liabilities
The following table summarizes any derivatives, repurchase agreements and reverse repurchase agreements, at the end of the reporting period, that are subject to an enforceable master netting agreement or similar agreement. For securities lending transactions or borrowing transactions associated with securities sold short, if any, see Note 1. For financial reporting purposes, the fund does not offset financial assets and financial liabilities that are subject to the master netting agreements in the Statement of assets and liabilities.
Bank of America N.A.
Barclays Bank PLC
Citibank, N.A.
Credit Suisse International
Deutsche Bank AG
HSBC Bank USA, National Association
JPMorgan Chase Bank N.A.
State Street Bank and Trust Co.
UBS AG
WestPac Banking Corp.
Total
Assets:
Forward currency contracts#
$—
$85,119
$101,805
$136,916
$90,269
$152,622
$501,786
$184,599
$3,187
$47,594
$1,303,897
Total Assets
$—
$85,119
$101,805
$136,916
$90,269
$152,622
$501,786
$184,599
$3,187
$47,594
$1,303,897
Liabilities:
Forward currency contracts#
148,366
136,783
366,923
239,938
22,597
—
178,580
76,759
73,092
—
1,243,038
Total Liabilities
$148,366
$136,783
$366,923
$239,938
$22,597
$—
$178,580
$76,759
$73,092
$—
$1,243,038
Total Financial and Derivative Net Assets
$(148,366)
$(51,664)
$(265,118)
$(103,022)
$67,672
$152,622
$323,206
$107,840
$(69,905)
$47,594
$60,859
Total collateral received (pledged)†##
$(148,366)
$(51,664)
$(120,000)
$—
$—
$130,582
$230,000
$—
$(43,000)
$—
Net amount
$—
$—
$(145,118)
$(103,022)
$67,672
$22,040
$93,206
$107,840
$(26,905)
$47,594
†
Additional collateral may be required from certain brokers based on individual agreements.
#
Covered by master netting agreement (Note 1).
##
Any over-collateralization of total financial and derivative net assets is not shown. Collateral may include amounts related to unsettled agreements.
46
International Growth Fund
International Growth Fund
47
Services for shareholders
Investor services
Systematic investment plan Tell us how much you wish to invest regularly — weekly, semimonthly, or monthly — and the amount you choose will be transferred automatically from your checking or savings account. There’s no additional fee for this service, and you can suspend it at any time. This plan may be a great way to save for college expenses or to plan for your retirement.
Please note that regular investing does not guarantee a profit or protect against loss in a declining market. Before arranging a systematic investment plan, consider your financial ability to continue making purchases in periods when prices are low.
Systematic exchange You can make regular transfers from one Putnam fund to another Putnam fund. There are no additional fees for this service, and you can cancel or change your options at any time.
Dividends PLUS You can choose to have the dividend distributions from one of your Putnam funds automatically reinvested in another Putnam fund at no additional charge.
Free exchange privilege You can exchange money between Putnam funds free of charge, as long as they are the same class of shares. A signature guarantee is required if you are exchanging more than $500,000. The fund reserves the right to revise or terminate the exchange privilege.
Reinstatement privilege If you’ve sold Putnam shares or received a check for a dividend or capital gain, you may reinvest the proceeds with Putnam within 90 days of the transaction and they will be reinvested at the fund’s current net asset value — with no sales charge. However, reinstatement of class B shares may have special tax consequences. Ask your financial or tax representative for details.
Check-writing service You have ready access to many Putnam accounts. It’s as simple as writing a check, and there are no special fees or service charges. For more information about the check-writing service, call Putnam or visit our website.
Dollar cost averaging When you’re investing for long-term goals, it’s time, not timing, that counts. Investing on a systematic basis is a better strategy than trying to figure out when the markets will go up or down. This means investing the same amount of money regularly over a long period. This method of investing is called dollar cost averaging. When a fund’s share price declines, your investment dollars buy more shares at lower prices. When it increases, they buy fewer shares. Over time, you will pay a lower average price per share.
For more information
Visit the Individual Investors section at putnam.com A secure section of our website contains complete information on your account, including balances and transactions, updated daily. You may also conduct transactions, such as exchanges, additional investments, and address changes. Log on today to get your password.
Call us toll free at 1-800-225-1581 Ask a helpful Putnam representative or your financial advisor for details about any of these or other services, or see your prospectus.
48 International Growth Fund
Fund information
Founded over 75 years ago, Putnam Investments was built around the concept that a balance between risk and reward is the hallmark of a well-rounded financial program. We manage over 100 funds across income, value, blend, growth, asset allocation, absolute return, and global sector categories.
Investment Manager
Putnam Investment Management, LLC One Post Office Square Boston, MA 02109
Investment Sub-Manager
Putnam Investments Limited 57–59 St James’s Street London, England SW1A 1LD
Investment Sub-Advisor
The Putnam Advisory Company, LLC One Post Office Square Boston, MA 02109
Marketing Services
Putnam Retail Management One Post Office Square Boston, MA 02109
Custodian
State Street Bank and Trust Company
Legal Counsel
Ropes & Gray LLP
Trustees
Jameson A. Baxter, Chair Liaquat Ahamed Ravi Akhoury Barbara M. Baumann Charles B. Curtis Robert J. Darretta Katinka Domotorffy John A. Hill Paul L. Joskow Kenneth R. Leibler Robert E. Patterson George Putnam, III Robert L. Reynolds W. Thomas Stephens
Officers
Robert L. Reynolds President
Jonathan S. Horwitz Executive Vice President, Principal Executive Officer, and Compliance Liaison
Steven D. Krichmar Vice President and Principal Financial Officer
Robert T. Burns Vice President and Chief Legal Officer
Robert R. Leveille Vice President and Chief Compliance Officer
Michael J. Higgins Vice President, Treasurer, and Clerk
Janet C. Smith Vice President, Principal Accounting Officer, and Assistant Treasurer
Susan G. Malloy Vice President and Assistant Treasurer
James P. Pappas Vice President
Mark C. Trenchard Vice President and BSA Compliance Officer
Nancy E. Florek Vice President, Director of Proxy Voting and Corporate Governance, Assistant Clerk, and Associate Treasurer
This report is for the information of shareholders of Putnam International Growth Fund. It may also be used as sales literature when preceded or accompanied by the current prospectus, the most recent copy of Putnam’s Quarterly Performance Summary, and Putnam’s Quarterly Ranking Summary. For more recent performance, please visit putnam.com. Investors should carefully consider the investment objectives, risks, charges, and expenses of a fund, which are described in its prospectus. For this and other information or to request a prospectus or summary prospectus, call 1-800-225-1581 toll free. Please read the prospectus carefully before investing. The fund’s Statement of Additional Information contains additional information about the fund’s Trustees and is available without charge upon request by calling 1-800-225-1581.
Item 2. Code of Ethics:
Not applicable
Item 3. Audit Committee Financial Expert:
Not applicable
Item 4. Principal Accountant Fees and Services:
Not applicable
Item 5. Audit Committee of Listed Registrants
Not applicable
Item 6. Schedule of Investments:
The registrant’s schedule of investments in unaffiliated issuers is included in the report to shareholders in Item 1 above.
Item 7. Disclosure of Proxy Voting Policies and Procedures For Closed-End Management Investment Companies:
Not applicable
Item 8. Portfolio Managers of Closed-End Investment Companies
Not Applicable
Item 9. Purchases of Equity Securities by Closed-End Management Investment Companies and Affiliated Purchasers:
Not applicable
Item 10. Submission of Matters to a Vote of Security Holders:
Not applicable
Item 11. Controls and Procedures:
(a) The registrant’s principal executive officer and principal financial officer have concluded, based on their evaluation of the effectiveness of the design and operation of the registrant’s disclosure controls and procedures as of a date within 90 days of the filing date of this report, that the design and operation of such procedures are generally effective to provide reasonable assurance that information required to be disclosed by the registrant in this report is recorded, processed, summarized and reported within the time periods specified in the Commission’s rules and forms.
(b) Changes in internal control over financial reporting: Not applicable
Item 12. Exhibits:
(a)(1) Not applicable
(a)(2) Separate certifications for the principal executive officer and principal financial officer of the registrant as required by Rule 30a-2(a) under the Investment Company Act of 1940, as amended, are filed herewith.
(b) The certifications required by Rule 30a-2(b) under the Investment Company Act of 1940, as amended, are filed herewith.
Putnam Investment Funds
By (Signature and Title):
/s/ Janet C. Smith Janet C. Smith Principal Accounting Officer
Date: May 29, 2015
Pursuant to the requirements of the Securities Exchange Act of 1934 and the Investment Company Act of 1940, this report has been signed below by the following persons on behalf of the registrant and in the capacities and on the dates indicated.
By (Signature and Title):
/s/ Jonathan S. Horwitz Jonathan S. Horwitz Principal Executive Officer
Date: May 29, 2015
By (Signature and Title):
/s/ Steven D. Krichmar Steven D. Krichmar Principal Financial Officer
Date: May 29, 2015
We use cookies on this site to provide a more responsive and personalized service. Continuing to browse, clicking I Agree, or closing this banner indicates agreement. See our Cookie Policy for more information.