| | |
| UNITED STATES
SECURITIES AND EXCHANGE COMMISSION |
| | |
| CERTIFIED SHAREHOLDER REPORT OF REGISTERED
MANAGEMENT INVESTMENT COMPANIES
|
| | |
| Investment Company Act file number: | (811-07237) |
| | |
| Exact name of registrant as specified in charter: | Putnam Investment Funds |
| | |
| Address of principal executive offices: | 100 Federal Street, Boston, Massachusetts 02110 |
| | |
| Name and address of agent for service: | Robert T. Burns, Vice President
100 Federal Street
Boston, Massachusetts 02110 |
| | |
| Copy to: | Bryan Chegwidden, Esq.
Ropes & Gray LLP
1211 Avenue of the Americas
New York, New York 10036 |
| | |
| Registrant's telephone number, including area code: | (617) 292-1000 |
| | |
| Date of fiscal year end: | August 31, 2021 |
| | |
| Date of reporting period: | September 1, 2020 — February 28, 2021 |
| | |
|
Item 1. Report to Stockholders: | |
| | |
| The following is a copy of the report transmitted to stockholders pursuant to Rule 30e-1 under the Investment Company Act of 1940: | |
Putnam
International Capital
Opportunities Fund
Semiannual report
2 | 28 | 21
Message from the Trustees
April 12, 2021
Dear Fellow Shareholder:
Optimism about society emerging from the Covid-19 pandemic remains tempered by concern about newer, more aggressive strains of the virus. On the plus side, the U.S. infection rate has declined and the pace of vaccinations is accelerating. The economy registered growth above 4% in the fourth quarter of 2020, and recent employment data is encouraging.
Investors must keep in mind that when the bond market sees stronger economic growth and the chance of inflation ahead, bond prices typically fall and yields rise. In such conditions, stock prices might also weaken as investors consider how rising yields could change borrowing costs.
No matter how markets move, Putnam remains active with strategies that seek superior investment performance. The portfolio managers and analysts keep their focus on research and potential risks, a discipline intended to serve you through changing conditions.
As always, thank you for investing with Putnam.

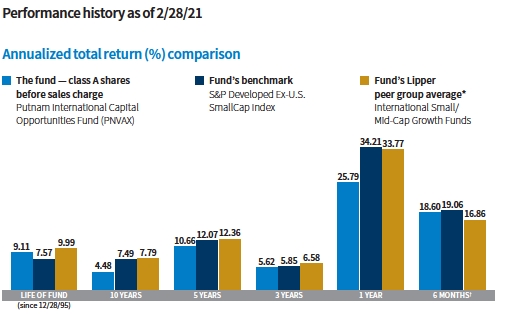
Current performance may be lower or higher than the quoted past performance, which cannot guarantee future results. Share price, principal value, and return will fluctuate, and you may have a gain or a loss when you sell your shares. Performance of class A shares assumes reinvestment of distributions and does not account for taxes. Fund returns in the bar chart do not reflect a sales charge of 5.75%; had they, returns would have been lower. See below and pages 7–9 for additional performance information. For a portion of the periods, the fund had expense limitations, without which returns would have been lower. To obtain the most recent month-end performance, visit putnam.com.
* Source: Lipper, a Refinitiv company.
† Returns for the six-month period are not annualized, but cumulative.

This comparison shows your fund’s performance in the context of broad market indexes for the six months ended 2/28/21. See above and pages 7–9 for additional fund performance information. Index descriptions can be found on pages 12–13.
* Source: Bloomberg Index Services Limited.
|
| 2 International Capital Opportunities Fund |


How was the market environment during the six-month reporting period?
The Covid-19 pandemic had a significant impact on global markets in 2020. As the initial shock of the pandemic began to wane, we saw a shift in the market. Investors who had been favoring companies that benefited from lockdowns started looking to stocks that could benefit from a return to normal. This trend accelerated following the announcement of a successful Covid-19 vaccine in November 2020. Entering this period, we positioned the fund with a focus on companies that we believed were overly punished by the temporary impact of Covid-19. With the Pfizer vaccine announcement, a path to normalization became more clear and many of these stocks appreciated.
During the reporting period, the fund posted a return of 18.60%, underperforming its benchmark, the S&P Developed Ex-U.S. Small Cap Index, which returned 19.06%.
What were some stocks that helped fund performance during the period?
Sino-American Silicon, a manufacturer of silicon wafers, was a top contributor to fund performance. During the period, the company
|
| International Capital Opportunities Fund 3 |

Allocations are shown as a percentage of the fund’s net assets as of 2/28/21. Cash and net other assets, if any, represent the market value weights of cash, derivatives, short-term securities, and other unclassified assets in the portfolio. Summary information may differ from the information in the portfolio schedule included in the financial statements due to the inclusion of derivative securities, any interest accruals, the exclusion of as-of trades, if any, the use of different classifications of securities for presentation purposes, and rounding. Holdings and allocations may vary over time.
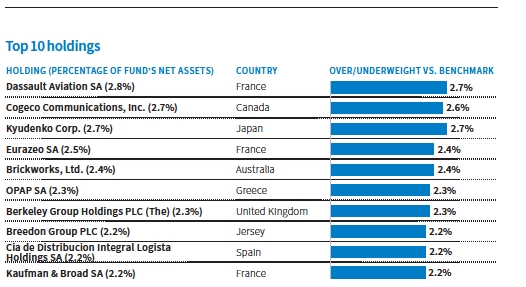
This table shows the fund’s top 10 holdings by percentage of the fund’s net assets as of 2/28/21. Short-term investments and derivatives, if any, are excluded. Holdings may vary over time.
|
| 4 International Capital Opportunities Fund |
benefited from strong wafer demand. Also, its subsidiary, Globalwafers, announced its acquisition of Siltronics, making the combined entity the third-largest global silicon wafer producer. This action consolidated the wafer industry, with the top three players now controlling about 80% of the market.
Jet2, formerly Dart Group plc, an airline and holiday package tour operator based in the United Kingdom, was another significant contributor to performance. While this was a challenging period for the airline industry, the Pfizer vaccine announcement gave the sector and Jet2 a significant boost. We believe Jet2 has one of the stronger balance sheets in the sector, leaving it well positioned to capitalize on a likely post-pandemic surge in travel. The improved industry outlook led to stock outperformance.
What were some stocks that detracted from fund performance during the period?
Berkeley Group is a U.K.-based homebuilder with a dominant London presence. Its stock underperformed during the period primarily due to perceptions of a negative impact from the pandemic. Business performance, however, has been remarkably resilient. During 2020, London experienced a large exodus of residents. This trend contributed to investors pricing in a bearish outlook for London home-builders. We believe that the migration trend is a temporary Covid-19-induced phenomenon and that Berkeley Group’s stock price decline reflected an overreaction by investors.
PALTAC is Japan’s largest wholesaler of cosmetics, daily necessities, and over-the-counter pharmaceuticals. The market perceived that the company would experience a negative impact from the pandemic, as approximately 60% of its sales are to drug stores exposed to inbound tourists. This sentiment weighed on the stock. Despite this, PALTAC has proven resilient, with growing revenue and earnings. We believe the company has strong fundamentals and the temporary disruptions caused by the pandemic do not change its intrinsic value.

How did your sector allocations influence fund performance during the period?
Our sector allocation decisions largely made a positive contribution to performance relative to the benchmark. An overweight position in the consumer discretionary sector and underweight positions in the real estate, health care, and utilities sectors contributed to performance.
Our investment process emphasizes bottom-up stock selection. The sector weightings reflect a combination of the conviction in our best ideas with a disciplined portfolio construction approach. Over time, our goal is for stock-specific returns to drive performance, with sector allocation being a neutral contributor to returns.
During the period, we meaningfully increased our weighting in the consumer discretionary and technology sectors. At the close of the period, consumer discretionary and communication services were our largest overweight sectors, relative to the benchmark, and real estate and materials were our biggest underweight exposures. Many of our allocations reflect our focus on companies that we believe were unduly punished by transitory effects of the pandemic. As always, we look for businesses we believe have defensible competitive moats, strong balance sheets, and stocks trading at significant discounts to the company’s intrinsic value.
What is your outlook for the markets, and how is the fund positioned?
We believe international small-cap stocks continue to offer a compelling investment opportunity. Based on our analysis of relative valuations over the past 20 years, non-U.S. small-cap stocks are in the top decile of
|
| International Capital Opportunities Fund 5 |
cheapness compared with the broader S&P 500 Index. In addition, volatility and shifts created by the pandemic have led to a variety of investment opportunities. These ideas span both companies that we believe are pandemic-related beneficiaries likely to see ongoing momentum from a more digitalized world, and companies that are experiencing a boost from a return to normal.
Thank you, Karan, for this update on the fund.
The views expressed in this report are exclusively those of Putnam Management and are subject to change. They are not meant as investment advice.
Please note that the holdings discussed in this report may not have been held by the fund for the entire period. Portfolio composition is subject to review in accordance with the fund’s investment strategy and may vary in the future. Current and future portfolio holdings are subject to risk.
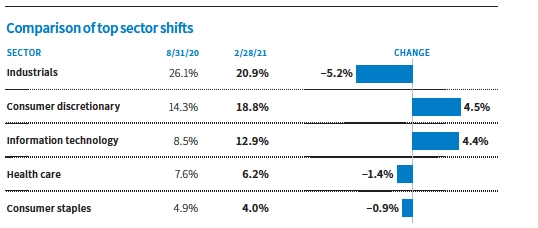
This chart shows the fund’s largest allocation shifts, by percentage, over the past six months. Allocations are shown as a percentage of the fund’s net assets. Current period summary information may differ from the portfolio schedule included in the financial statements due to the inclusion of derivative securities, any interest accruals, the exclusion of as-of trades, if any, the use of different classifications of securities for presentation purposes, and rounding. Holdings and allocations may vary over time.
|
| 6 International Capital Opportunities Fund |
Your fund’s performance
This section shows your fund’s performance, price, and distribution information for periods ended February 28, 2021, the end of the first half of its current fiscal year. In accordance with regulatory requirements for mutual funds, we also include performance information as of the most recent calendar quarter-end and expense information taken from the fund’s current prospectus. Performance should always be considered in light of a fund’s investment strategy. Data represent past performance. Past performance does not guarantee future results. More recent returns may be less or more than those shown. Investment return and principal value will fluctuate, and you may have a gain or a loss when you sell your shares. Performance information does not reflect any deduction for taxes a shareholder may owe on fund distributions or on the redemption of fund shares. For the most recent month-end performance, please visit the Individual Investors section at putnam.com or call Putnam at 1-800-225-1581. Class R, R6, and Y shares are not available to all investors. See the Terms and definitions section in this report for definitions of the share classes offered by your fund.
Fund performance Total return for periods ended 2/28/21
| | | | | | | | | |
| | Annual | | | | | | | | |
| | average | | Annual | | Annual | | Annual | | |
| | (life of fund) | 10 years | average | 5 years | average | 3 years | average | 1 year | 6 months |
| Class A (12/28/95) | | | | | | | | | |
| Before sales charge | 9.11% | 54.97% | 4.48% | 65.95% | 10.66% | 17.82% | 5.62% | 25.79% | 18.60% |
| After sales charge | 8.86 | 46.06 | 3.86 | 56.41 | 9.36 | 11.05 | 3.55 | 18.55 | 11.78 |
| Class B (10/30/96) | | | | | | | | | |
| Before CDSC | 8.85 | 45.96 | 3.85 | 59.83 | 9.83 | 15.19 | 4.83 | 24.83 | 18.17 |
| After CDSC | 8.85 | 45.96 | 3.85 | 57.83 | 9.56 | 12.21 | 3.91 | 19.83 | 13.17 |
| Class C (7/26/99) | | | | | | | | | |
| Before CDSC | 8.79 | 43.74 | 3.69 | 59.86 | 9.84 | 15.18 | 4.82 | 24.82 | 18.14 |
| After CDSC | 8.79 | 43.74 | 3.69 | 59.86 | 9.84 | 15.18 | 4.82 | 23.82 | 17.14 |
| Class R (1/21/03) | | | | | | | | | |
| Net asset value | 8.85 | 51.17 | 4.22 | 63.89 | 10.39 | 16.95 | 5.36 | 25.48 | 18.44 |
| Class R6 (5/22/18) | | | | | | | | | |
| Net asset value | 9.36 | 59.63 | 4.79 | 68.83 | 11.04 | 19.27 | 6.05 | 26.31 | 18.82 |
| Class Y (2/1/00) | | | | | | | | | |
| Net asset value | 9.34 | 58.87 | 4.74 | 68.03 | 10.94 | 18.70 | 5.88 | 26.08 | 18.74 |
Current performance may be lower or higher than the quoted past performance, which cannot guarantee future results. After-sales-charge returns for class A shares reflect the deduction of the maximum 5.75% sales charge levied at the time of purchase. Class B share returns after contingent deferred sales charge (CDSC) reflect the applicable CDSC, which is 5% in the first year, declining over time to 1% in the sixth year, and is eliminated thereafter. Class C share returns after CDSC reflect a 1% CDSC for the first year that is eliminated thereafter. Class R, R6, and Y shares have no initial sales charge or CDSC. Performance for class B, C, R, and Y shares before their inception is derived from the historical performance of class A shares, adjusted for the applicable sales charge (or CDSC) and the higher operating expenses for such shares, except for class Y shares, for which 12b-1 fees are not applicable. Performance for class R6 shares prior to their inception is derived from the historical performance of class Y shares and has not been adjusted for the lower investor servicing fees applicable to class R6 shares; had it, returns would have been higher.
For a portion of the periods, the fund had expense limitations, without which returns would have been lower.
The fund has had performance fee adjustments that may have had a positive or negative impact on returns.
Class B share performance reflects conversion to class A shares after eight years.
Class C share performance reflects conversion to class A shares after 10 years.
|
| International Capital Opportunities Fund 7 |
Comparative index returns For periods ended 2/28/21
| | | | | | | | | |
| | Annual | | | | | | | | |
| | average | | Annual | | Annual | | Annual | | |
| | (life of fund) | 10 years | average | 5 years | average | 3 years | average | 1 year | 6 months |
| S&P Developed | | | | | | | | | |
| Ex-U.S. SmallCap | 7.57% | 105.85% | 7.49% | 76.82% | 12.07% | 18.60% | 5.85% | 34.21% | 19.06% |
| Index | | | | | | | | | |
| Lipper International | | | | | | | | | |
| Small/Mid-Cap | | | | | | | | | |
| Growth Funds | 9.99 | 115.10 | 7.79 | 80.50 | 12.36 | 21.67 | 6.58 | 33.77 | 16.86 |
| category average* | | | | | | | | | |
Index and Lipper results should be compared with fund performance before sales charge, before CDSC, or at net asset value.
* Over the 6-month, 1-year, 3-year, 5-year, 10-year, and life-of-fund periods ended 2/28/21, there were 209, 209, 189, 160, 97, and 5 funds, respectively, in this Lipper category.
Fund price and distribution information For the six-month period ended 2/28/21
| | | | | | | | |
| Distributions | | Class A | | Class B | Class C | Class R | Class R6 | Class Y |
| Number | | 1 | | 1 | 1 | 1 | 1 | 1 |
| Income | | $0.349 | | — | $0.018 | $0.236 | $0.513 | $0.436 |
| Capital gains | | | | | | | | |
| Long-term gains | | 0.873 | | $0.873 | 0.873 | 0.873 | 0.873 | 0.873 |
| Short-term gains | | 0.634 | | 0.634 | 0.634 | 0.634 | 0.634 | 0.634 |
| Total | | $1.856 | | $1.507 | $1.525 | $1.743 | $2.020 | $1.943 |
| | Before | | After | Net | Net | Net | Net | Net |
| | sales | | sales | asset | asset | asset | asset | asset |
| Share value | charge | | charge | value | value | value | value | value |
| 8/31/20 | $37.10 | | $39.36 | $36.52 | $36.28 | $36.36 | $37.45 | $37.29 |
| 2/28/21 | 42.12 | | 44.69 | 41.63 | 41.32 | 41.30 | 42.45 | 42.31 |
The classification of distributions, if any, is an estimate. Before-sales-charge share value and current dividend rate for class A shares, if applicable, do not take into account any sales charge levied at the time of purchase. After-sales-charge share value, current dividend rate, and current 30-day SEC yield, if applicable, are calculated assuming that the maximum sales charge (5.75% for class A shares) was levied at the time of purchase. Final distribution information will appear on your year-end tax forms.
|
| 8 International Capital Opportunities Fund |
Fund performance as of most recent calendar quarter Total return for periods ended 3/31/21
| | | | | | | | | |
| | Annual | | | | | | | | |
| | average | | Annual | | Annual | | Annual | | |
| | (life of fund) | 10 years | average | 5 years | average | 3 years | average | 1 year | 6 months |
| Class A (12/28/95) | | | | | | | | | |
| Before sales charge | 9.24% | 62.06% | 4.95% | 59.45% | 9.78% | 22.68% | 7.05% | 58.02% | 24.80% |
| After sales charge | 8.99 | 52.74 | 4.33 | 50.28 | 8.49 | 15.62 | 4.96 | 48.93 | 17.62 |
| Class B (10/30/96) | | | | | | | | | |
| Before CDSC | 8.99 | 52.59 | 4.32 | 53.59 | 8.96 | 19.96 | 6.26 | 56.86 | 24.34 |
| After CDSC | 8.99 | 52.59 | 4.32 | 51.59 | 8.68 | 16.96 | 5.36 | 51.86 | 19.34 |
| Class C (7/26/99) | | | | | | | | | |
| Before CDSC | 8.99 | 52.56 | 4.31 | 53.62 | 8.97 | 19.96 | 6.25 | 56.84 | 24.34 |
| After CDSC | 8.99 | 52.56 | 4.31 | 53.62 | 8.97 | 19.96 | 6.25 | 55.84 | 23.34 |
| Class R (1/21/03) | | | | | | | | | |
| Net asset value | 8.98 | 58.03 | 4.68 | 57.48 | 9.51 | 21.75 | 6.78 | 57.62 | 24.64 |
| Class R6 (5/22/18) | | | | | | | | | |
| Net asset value | 9.50 | 66.99 | 5.26 | 62.25 | 10.16 | 24.23 | 7.50 | 58.69 | 25.06 |
| Class Y (2/1/00) | | | | | | | | | |
| Net asset value | 9.47 | 66.14 | 5.21 | 61.43 | 10.05 | 23.59 | 7.32 | 58.41 | 24.94 |
See the discussion following the fund performance table on page 7 for information about the calculation of fund performance.
Effective 3/1/21, class C shares will generally convert to class A shares after eight years. In this table, Class C share performance reflects conversion to class A shares after eight years.
Your fund’s expenses
As a mutual fund investor, you pay ongoing expenses, such as management fees, distribution fees (12b-1 fees), and other expenses. Using the following information, you can estimate how these expenses affect your investment and compare them with the expenses of other funds. You may also pay one-time transaction expenses, including sales charges (loads) and redemption fees, which are not shown in this section and would have resulted in higher total expenses. For more information, see your fund’s prospectus or talk to your financial representative.
Expense ratios
| | | | | | |
| | Class A | Class B | Class C | Class R | Class R6 | Class Y |
| Total annual operating expenses for the | | | | | | |
| fiscal year ended 8/31/20 | 1.54% | 2.29% | 2.29% | 1.79% | 1.11% | 1.29% |
| Annualized expense ratio for the | | | | | | |
| six-month period ended 2/28/21* | 1.48% | 2.23% | 2.23% | 1.73% | 1.06% | 1.23% |
Fiscal year expense information in this table is taken from the most recent prospectus, is subject to change, and may differ from that shown for the annualized expense ratio and in the financial highlights of this report.
Expenses are shown as a percentage of average net assets.
* Includes a decrease of 0.01% from annualizing the performance fee adjustment for the six months ended 2/28/21.
|
| International Capital Opportunities Fund 9 |
Expenses per $1,000
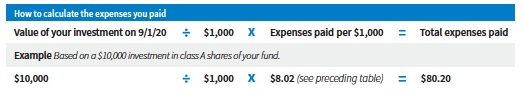
The following table shows the expenses you would have paid on a $1,000 investment in each class of the fund from 9/1/20 to 2/28/21. It also shows how much a $1,000 investment would be worth at the close of the period, assuming actual returns and expenses.
| | | | | | |
| | Class A | Class B | Class C | Class R | Class R6 | Class Y |
| Expenses paid per $1,000*† | $8.02 | $12.06 | $12.06 | $9.37 | $5.75 | $6.67 |
| Ending value (after expenses) | $1,186.00 | $1,181.70 | $1,181.40 | $1,184.40 | $1,188.20 | $1,187.40 |
* Expenses for each share class are calculated using the fund’s annualized expense ratio for each class, which represents the ongoing expenses as a percentage of average net assets for the six months ended 2/28/21. The expense ratio may differ for each share class.
† Expenses are calculated by multiplying the expense ratio by the average account value for the period; then multiplying the result by the number of days in the period; and then dividing that result by the number of days in the year.
Estimate the expenses you paid
To estimate the ongoing expenses you paid for the six months ended 2/28/21, use the following calculation method. To find the value of your investment on 9/1/20, call Putnam at 1-800-225-1581.
Compare expenses using the SEC’s method
The Securities and Exchange Commission (SEC) has established guidelines to help investors assess fund expenses. Per these guidelines, the following table shows your fund’s expenses based on a $1,000 investment, assuming a hypothetical 5% annualized return. You can use this information to compare the ongoing expenses (but not transaction expenses or total costs) of investing in the fund with those of other funds. All mutual fund shareholder reports will provide this information to help you make this comparison. Please note that you cannot use this information to estimate your actual ending account balance and expenses paid during the period.
| | | | | | |
| | Class A | Class B | Class C | Class R | Class R6 | Class Y |
| Expenses paid per $1,000*† | $7.40 | $11.13 | $11.13 | $8.65 | $5.31 | $6.16 |
| Ending value (after expenses) | $1,017.46 | $1,013.74 | $1,013.74 | $1,016.22 | $1,019.54 | $1,018.70 |
* Expenses for each share class are calculated using the fund’s annualized expense ratio for each class, which represents the ongoing expenses as a percentage of average net assets for the six months ended 2/28/21. The expense ratio may differ for each share class.
† Expenses are calculated by multiplying the expense ratio by the average account value for the six-month period; then multiplying the result by the number of days in the six-month period; and then dividing that result by the number of days in the year.
|
| 10 International Capital Opportunities Fund |
Consider these risks before investing
The value of investments in the fund’s portfolio may fall or fail to rise over extended periods of time for a variety of reasons, including general economic, political, or financial market conditions; investor sentiment and market perceptions; government actions; geopolitical events or changes; and factors related to a specific issuer, geography, industry, or sector. These and other factors may lead to increased volatility and reduced liquidity in the fund’s portfolio holdings. International investing involves currency, economic, and political risks. Emerging-market securities carry illiquidity and volatility risks. Investments in small and/or midsize companies increase the risk of greater price fluctuations. Growth stocks may be more susceptible to earnings disappointments, and value stocks may fail to rebound. Risks associated with derivatives include increased investment exposure (which may be considered leverage) and, in the case of over-the-counter instruments, the potential inability to terminate or sell derivatives positions and the potential failure of the other party to the instrument to meet its obligations. Our investment techniques, analyses, and judgments may not produce the outcome we intend. The investments we select for the fund may not perform as well as other securities that we do not select for the fund. We, or the fund’s other service providers, may experience disruptions or operating errors that could have a negative effect on the fund. You can lose money by investing in the fund.
|
| International Capital Opportunities Fund 11 |
Terms and definitions
Important terms
Total return shows how the value of the fund’s shares changed over time, assuming you held the shares through the entire period and reinvested all distributions in the fund.
Before sales charge, or net asset value, is the price, or value, of one share of a mutual fund, without a sales charge. Before-sales-charge figures fluctuate with market conditions, and are calculated by dividing the net assets of each class of shares by the number of outstanding shares in the class.
After sales charge is the price of a mutual fund share plus the maximum sales charge levied at the time of purchase. After-sales-charge performance figures shown here assume the 5.75% maximum sales charge for class A shares.
Contingent deferred sales charge (CDSC) is generally a charge applied at the time of the redemption of class B or C shares and assumes redemption at the end of the period. Your fund’s class B CDSC declines over time from a 5% maximum during the first year to 1% during the sixth year. After the sixth year, the CDSC no longer applies. The CDSC for class C shares is 1% for one year after purchase.
Share classes
Class A shares are generally subject to an initial sales charge and no CDSC (except on certain redemptions of shares bought without an initial sales charge).
Class B shares are closed to new investments and are only available by exchange from another Putnam fund or through dividend and/or capital gains reinvestment. They are not subject to an initial sales charge and may be subject to a CDSC.
Class C shares are not subject to an initial sales charge and are subject to a CDSC only if the shares are redeemed during the first year.
Class R shares are not subject to an initial sales charge or CDSC and are only available to employer-sponsored retirement plans.
Class R6 shares are not subject to an initial sales charge or CDSC and carry no 12b-1 fee. They are generally only available to employer-sponsored retirement plans, corporate and institutional clients, and clients in other approved programs.
Class Y shares are not subject to an initial sales charge or CDSC and carry no 12b-1 fee. They are generally only available to corporate and institutional clients and clients in other approved programs.
Comparative indexes
Bloomberg Barclays U.S. Aggregate Bond Index is an unmanaged index of U.S. investment-grade fixed-income securities.
ICE BofA (Intercontinental Exchange Bank of America) U.S. 3-Month Treasury Bill Index is an unmanaged index that seeks to measure the performance of U.S. Treasury bills available in the marketplace.
S&P 500 Index is an unmanaged index of common stock performance.
S&P Developed Ex-U.S. SmallCap Index is an unmanaged index of small-cap stocks from developed countries, excluding the United States.
Indexes assume reinvestment of all distributions and do not account for fees. Securities and performance of a fund and an index will differ. You cannot invest directly in an index.
BLOOMBERG® is a trademark and service mark of Bloomberg Finance L.P. and its affiliates (collectively “Bloomberg”). BARCLAYS® is a trademark and service mark of Barclays Bank Plc (collectively with its affiliates, “Barclays”), used under license. Bloomberg or Bloomberg’s licensors, including Barclays, own all proprietary rights in the Bloomberg Barclays Indices. Neither Bloomberg nor Barclays approves or endorses this material, or guarantees the accuracy or completeness of any information herein, or makes any warranty, express or limited, as to the results to be obtained
|
| 12 International Capital Opportunities Fund |
therefrom, and to the maximum extent allowed by law, neither shall have any liability or responsibility for injury or damages arising in connection therewith.
ICE Data Indices, LLC (“ICE BofA”), used with permission. ICE BofA permits use of the ICE BofA indices and related data on an “as is” basis; makes no warranties regarding same; does not guarantee the suitability, quality, accuracy, timeliness, and/or completeness of the ICE BofA indices or any data included in, related to, or derived therefrom; assumes no liability in connection with the use of the foregoing; and does not sponsor, endorse, or recommend Putnam Investments, or any of its products or services.
Lipper, a Refinitiv company, is a third-party industry-ranking entity that ranks mutual funds. Its rankings do not reflect sales charges. Lipper rankings are based on total return at net asset value relative to other funds that have similar current investment styles or objectives as determined by Lipper. Lipper may change a fund’s category assignment at its discretion. Lipper category averages reflect performance trends for funds within a category.
Other information for shareholders
Important notice regarding delivery of shareholder documents
In accordance with Securities and Exchange Commission (SEC) regulations, Putnam sends a single copy of annual and semiannual shareholder reports, prospectuses, and proxy statements to Putnam shareholders who share the same address, unless a shareholder requests otherwise. If you prefer to receive your own copy of these documents, please call Putnam at 1-800-225-1581, and Putnam will begin sending individual copies within 30 days.
Proxy voting
Putnam is committed to managing our mutual funds in the best interests of our shareholders. The Putnam funds’ proxy voting guidelines and procedures, as well as information regarding how your fund voted proxies relating to portfolio securities during the 12-month period ended June 30, 2020, are available in the Individual Investors section of putnam.com and on the SEC’s website, www.sec.gov. If you have questions about finding forms on the SEC’s website, you may call the SEC at 1-800-SEC-0330. You may also obtain the Putnam funds’ proxy voting guidelines and procedures at no charge by calling Putnam’s Shareholder Services at 1-800-225-1581.
Fund portfolio holdings
The fund will file a complete schedule of its portfolio holdings with the SEC for the first and third quarters of each fiscal year on Form N-PORT within 60 days of the end of such fiscal quarter. Shareholders may obtain the fund’s Form N-PORT on the SEC’s website at www.sec.gov.
Prior to its use of Form N-PORT, the fund filed its complete schedule of its portfolio holdings with the SEC on Form N-Q, which is available online at www.sec.gov.
Trustee and employee fund ownership
Putnam employees and members of the Board of Trustees place their faith, confidence, and, most importantly, investment dollars in Putnam mutual funds. As of February 28, 2021, Putnam employees had approximately $555,000,000 and the Trustees had approximately $78,000,000 invested in Putnam mutual funds. These amounts include investments by the Trustees’ and employees’ immediate family members as well as investments through retirement and deferred compensation plans.
|
| International Capital Opportunities Fund 13 |
Financial statements
These sections of the report, as well as the accompanying Notes, constitute the fund’s financial statements.
The fund’s portfolio lists all the fund’s investments and their values as of the last day of the reporting period. Holdings are organized by asset type and industry sector, country, or state to show areas of concentration and diversification.
Statement of assets and liabilities shows how the fund’s net assets and share price are determined. All investment and non-investment assets are added together. Any unpaid expenses and other liabilities are subtracted from this total. The result is divided by the number of shares to determine the net asset value per share, which is calculated separately for each class of shares. (For funds with preferred shares, the amount subtracted from total assets includes the liquidation preference of preferred shares.)
Statement of operations shows the fund’s net investment gain or loss. This is done by first adding up all the fund’s earnings — from dividends and interest income — and subtracting its operating expenses to determine net investment income (or loss). Then, any net gain or loss the fund realized on the sales of its holdings — as well as any unrealized gains or losses over the period — is added to or subtracted from the net investment result to determine the fund’s net gain or loss for the fiscal period.
Statement of changes in net assets shows how the fund’s net assets were affected by the fund’s net investment gain or loss, by distributions to shareholders, and by changes in the number of the fund’s shares. It lists distributions and their sources (net investment income or realized capital gains) over the current reporting period and the most recent fiscal year-end. The distributions listed here may not match the sources listed in the Statement of operations because the distributions are determined on a tax basis and may be paid in a different period from the one in which they were earned. Dividend sources are estimated at the time of declaration. Actual results may vary. Any non-taxable return of capital cannot be determined until final tax calculations are completed after the end of the fund’s fiscal year.
Financial highlights provide an overview of the fund’s investment results, per-share distributions, expense ratios, net investment income ratios, and portfolio turnover in one summary table, reflecting the five most recent reporting periods. In a semiannual report, the highlights table also includes the current reporting period.
|
| 14 International Capital Opportunities Fund |
The fund’s portfolio 2/28/21 (Unaudited)
| | |
| COMMON STOCKS (99.7%)* | Shares | Value |
| Australia (3.2%) | | |
| Brickworks, Ltd. | 611,146 | $8,784,198 |
| Mineral Resources, Ltd. | 98,151 | 2,863,804 |
| | | 11,648,002 |
| Canada (9.8%) | | |
| CI Financial Corp. | 460,300 | 6,445,502 |
| Cogeco Communications, Inc. | 109,500 | 9,901,120 |
| Constellation Software, Inc. | 5,615 | 7,270,115 |
| Dream Office Real Estate Investment Trust R | 301,200 | 4,719,415 |
| Home Capital Group, Inc. † | 265,100 | 6,543,133 |
| Topicus.com, Inc. † | 10,442 | 542,039 |
| | | 35,421,324 |
| Chile (1.8%) | | |
| Liberty Latin America, Ltd. Class C † | 584,986 | 6,411,447 |
| | | 6,411,447 |
| China (1.9%) | | |
| China Traditional Chinese Medicine Holdings Co., Ltd. | 7,240,000 | 4,340,388 |
| Sichuan Languang Justbon Services Group Co., Ltd. Class H | 403,700 | 2,417,583 |
| | | 6,757,971 |
| Denmark (1.5%) | | |
| Royal Unibrew A/S | 51,175 | 5,267,050 |
| | | 5,267,050 |
| France (11.6%) | | |
| Dassault Aviation SA † | 9,255 | 9,969,244 |
| Eurazeo SA † | 124,527 | 9,215,178 |
| Euronext NV | 34,616 | 3,724,745 |
| Kaufman & Broad SA | 180,078 | 7,961,853 |
| Nexity SA | 155,177 | 7,573,706 |
| Thermador Groupe | 39,005 | 3,557,789 |
| | | 42,002,515 |
| Germany (2.7%) | | |
| CompuGroup Medical SE & Co. KgaA | 41,432 | 3,552,555 |
| CTS Eventim AG & Co. KGaA † | 91,792 | 6,227,344 |
| | | 9,779,899 |
| Greece (4.0%) | | |
| Motor Oil (Hellas) Corinth Refineries SA | 448,088 | 6,135,487 |
| OPAP SA | 613,495 | 8,257,629 |
| | | 14,393,116 |
| Hong Kong (1.0%) | | |
| Melco International Development, Ltd. | 1,723,000 | 3,571,974 |
| | | 3,571,974 |
| India (1.9%) | | |
| Indian Energy Exchange, Ltd. | 1,680,961 | 6,710,348 |
| | | 6,710,348 |
| Ireland (2.4%) | | |
| Dalata Hotel Group PLC † | 939,426 | 4,721,004 |
| Hibernia REIT PLC R | 2,940,168 | 3,999,408 |
| | | 8,720,412 |
|
| International Capital Opportunities Fund 15 |
| | |
| COMMON STOCKS (99.7%)* cont. | Shares | Value |
| Italy (0.7%) | | |
| DiaSorin SpA | 13,159 | $2,576,563 |
| | | 2,576,563 |
| Japan (22.0%) | | |
| Amano Corp. | 258,200 | 5,784,339 |
| Benefit One, Inc. | 61,000 | 1,537,089 |
| Daiho Corp. | 69,900 | 2,419,729 |
| Daiseki Co., Ltd. | 187,800 | 5,875,632 |
| Fukui Computer Holdings, Inc. | 253,500 | 7,954,946 |
| JINS Holdings, Inc. | 51,900 | 3,573,770 |
| Kobe Bussan Co., Ltd. | 152,300 | 3,907,693 |
| Kyowa Exeo Corp. | 176,400 | 4,504,534 |
| Kyudenko Corp. | 293,100 | 9,623,810 |
| Nabtesco Corp. | 76,600 | 3,248,107 |
| Nakanishi, Inc. | 196,100 | 3,747,415 |
| NSD Co., Ltd. | 298,500 | 5,096,581 |
| Open House Co., Ltd. | 97,500 | 3,731,882 |
| PALTAC Corp. | 134,000 | 7,253,436 |
| Sato Holdings Corp. | 89,900 | 2,104,231 |
| Solasto Corp. | 236,800 | 3,194,506 |
| TechnoPro Holdings, Inc. | 81,700 | 5,932,342 |
| | | 79,490,042 |
| Jersey (2.2%) | | |
| Breedon Group PLC † | 6,281,791 | 8,136,156 |
| | | 8,136,156 |
| Mexico (2.0%) | | |
| Megacable Holdings SAB de CV (Units) | 2,153,334 | 7,436,470 |
| | | 7,436,470 |
| Russia (0.7%) | | |
| Globaltrans Investment PLC | 375,591 | 2,501,659 |
| | | 2,501,659 |
| South Korea (2.8%) | | |
| Hana Financial Group, Inc. | 155,438 | 5,125,926 |
| i-SENS, Inc. | 60,106 | 1,286,648 |
| Vieworks Co., Ltd. | 129,411 | 3,651,383 |
| | | 10,063,957 |
| Spain (3.2%) | | |
| Cia de Distribucion Integral Logista Holdings SA | 413,304 | 7,973,118 |
| Fomento de Construcciones y Contratas SA | 297,848 | 3,524,268 |
| | | 11,497,386 |
| Sweden (1.3%) | | |
| BHG Group AB † | 308,856 | 4,783,818 |
| | | 4,783,818 |
| Switzerland (1.4%) | | |
| Swissquote Group Holding SA | 42,579 | 4,927,773 |
| | | 4,927,773 |
| Taiwan (6.3%) | | |
| CTCI Corp. | 1,549,000 | 2,029,926 |
| Elite Material Co., Ltd. | 1,234,000 | 7,487,515 |
|
| 16 International Capital Opportunities Fund |
| | |
| COMMON STOCKS (99.7%)* cont. | Shares | Value |
| Taiwan cont. | | |
| Lite-On Technology Corp. | 2,875,000 | $6,131,407 |
| Sino-American Silicon Products, Inc. | 1,189,000 | 7,129,091 |
| | | 22,777,939 |
| United Kingdom (15.3%) | | |
| Admiral Group PLC | 148,800 | 6,400,913 |
| Afren PLC † F | 4,060,504 | 6 |
| Berkeley Group Holdings PLC (The) | 145,632 | 8,194,862 |
| Cairn Energy PLC | 506,833 | 1,344,019 |
| Jet2 PLC † | 151,872 | 3,076,220 |
| Domino’s Pizza Group PLC | 918,608 | 3,916,579 |
| Dr. Martens PLC † | 503,568 | 3,461,551 |
| Liberty Global PLC Class C † | 304,800 | 7,406,640 |
| Nomad Foods, Ltd. † | 218,400 | 5,158,608 |
| PageGroup PLC † | 1,124,316 | 7,485,019 |
| Trainline PLC † | 345,858 | 2,485,843 |
| Vivo Energy PLC | 5,449,590 | 6,610,463 |
| | | 55,540,723 |
| Total common stocks (cost $319,225,924) | | $360,416,544 |
| |
| | Principal | |
| U.S. TREASURY OBLIGATIONS (0.1%)* | amount | Value |
| U.S. Treasury Notes 2.00%, 8/31/21 i | $218,000 | $222,262 |
| Total U.S. treasury obligations (cost $222,262) | | $222,262 |
| | | |
| | Principal amount/ | |
| SHORT-TERM INVESTMENTS (0.8%)* | | shares | Value |
| Putnam Short Term Investment Fund Class P 0.12% L | Shares | 609,039 | $609,039 |
| State Street Institutional U.S. Government Money Market Fund, | | | |
| Premier Class 0.03% P | Shares | 300,000 | 300,000 |
| U.S. Treasury Bills 0.074%, 3/18/21 ∆ | | $300,000 | 299,996 |
| U.S. Treasury Bills 0.081%, 4/15/21 ∆ | | 300,000 | 299,985 |
| U.S. Treasury Bills 0.077%, 5/13/21 ∆ | | 100,000 | 99,990 |
| U.S. Treasury Bills 0.053%, 6/3/21 ∆ | | 800,000 | 799,886 |
| U.S. Treasury Bills 0.046%, 6/10/21 ∆ | | 200,000 | 199,975 |
| U.S. Treasury Cash Management Bills 0.059%, 5/25/21 ∆ | | 300,000 | 299,972 |
| Total short-term investments (cost $2,908,810) | | | $2,908,843 |
| |
| TOTAL INVESTMENTS | | | |
| Total investments (cost $322,356,996) | | | $363,547,649 |
Notes to the fund’s portfolio
Unless noted otherwise, the notes to the fund’s portfolio are for the close of the fund’s reporting period, which ran from September 1, 2020 through February 28, 2021 (the reporting period). Within the following notes to the portfolio, references to “Putnam Management” represent Putnam Investment Management, LLC, the fund’s manager, an indirect wholly-owned subsidiary of Putnam Investments, LLC and references to “ASC 820” represent Accounting Standards Codification 820 Fair Value Measurements and Disclosures.
* Percentages indicated are based on net assets of $361,670,514.
† This security is non-income-producing.
|
| International Capital Opportunities Fund 17 |
∆ This security, in part or in entirety, was pledged and segregated with the custodian for collateral on certain derivative contracts at the close of the reporting period. Collateral at period end totaled $1,895,870 and is included in Investments in securities on the Statement of assets and liabilities (Notes 1 and 5).
F This security is valued by Putnam Management at fair value following procedures approved by the Trustees. Securities are classified as Level 3 for ASC 820 based on the securities’ valuation inputs. At the close of the reporting period, fair value pricing was also used for certain foreign securities in the portfolio (Note 1). i This security was pledged, or purchased with cash that was pledged, to the fund for collateral on certain derivative contracts (Note 1).
L Affiliated company (Note 5). The rate quoted in the security description is the annualized 7-day yield of the fund at the close of the reporting period.
P This security was pledged, or purchased with cash that was pledged, to the fund for collateral on certain derivative contracts. The rate quoted in the security description is the annualized 7-day yield of the fund at the close of the reporting period.
R Real Estate Investment Trust.
At the close of the reporting period, the fund maintained liquid assets totaling $2,234,037 to cover certain derivative contracts.
Unless otherwise noted, the rates quoted in Short-term investments security descriptions represent the weighted average yield to maturity.
The fund had the following sector concentrations greater than 10% at the close of the reporting period (as a percentage of net assets):
| | |
| Industrials | 20.8% | |
| Consumer discretionary | 18.9 | |
| Financials | 13.6 | |
| Information technology | 13.1 | |
| Communication services | 10.3 | |
| | | | | | |
| FORWARD CURRENCY CONTRACTS at 2/28/21 (aggregate face value $259,377,389) (Unaudited) |
| | | | | | | Unrealized |
| | | Contract | Delivery | | Aggregate | appreciation/ |
| Counterparty | Currency | type* | date | Value | face value | (depreciation) |
| Bank of America N.A. | | | | | |
| | Australian Dollar | Buy | 4/21/21 | $431,893 | $437,055 | $(5,162) |
| �� | British Pound | Buy | 3/17/21 | 6,593,595 | 6,438,937 | 154,658 |
| | Euro | Sell | 3/17/21 | 4,799,133 | 4,824,693 | 25,560 |
| | Japanese Yen | Sell | 5/19/21 | 435,504 | 442,205 | 6,701 |
| | Swedish Krona | Buy | 3/17/21 | 894,939 | 903,314 | (8,375) |
| | Swedish Krona | Sell | 3/17/21 | 894,939 | 917,161 | 22,222 |
| Barclays Bank PLC | | | | | | |
| | British Pound | Sell | 3/17/21 | 11,516,463 | 11,137,213 | (379,250) |
| | Euro | Sell | 3/17/21 | 2,022,511 | 2,040,808 | 18,297 |
| | Hong Kong Dollar | Buy | 5/20/21 | 694,848 | 695,326 | (478) |
| | Japanese Yen | Sell | 5/19/21 | 7,914,105 | 8,034,287 | 120,182 |
| | Swedish Krona | Buy | 3/17/21 | 925,238 | 933,060 | (7,822) |
| | Swedish Krona | Sell | 3/17/21 | 925,238 | 948,261 | 23,023 |
| Citibank, N.A. | | | | | | |
| | Australian Dollar | Buy | 4/21/21 | 116,362 | 117,753 | (1,391) |
| | British Pound | Buy | 3/17/21 | 5,550,836 | 5,383,383 | 167,453 |
| | Canadian Dollar | Sell | 4/21/21 | 4,336,044 | 4,353,995 | 17,951 |
| | Chilean Peso | Sell | 4/21/21 | 5,218,931 | 5,292,754 | 73,823 |
|
| 18 International Capital Opportunities Fund |
| | | | | | |
| FORWARD CURRENCY CONTRACTS at 2/28/21 (aggregate face value $259,377,389) (Unaudited) cont. |
| | | | | | | Unrealized |
| | | Contract | Delivery | | Aggregate | appreciation/ |
| Counterparty | Currency | type* | date | Value | face value | (depreciation) |
| Citibank, N.A. cont. | | | | | |
| | Danish Krone | Buy | 3/17/21 | $1,634,701 | $1,648,239 | $(13,538) |
| | Euro | Buy | 3/17/21 | 4,354,005 | 4,393,344 | (39,339) |
| | Swedish Krona | Buy | 3/17/21 | 973,719 | 981,825 | (8,106) |
| | Swedish Krona | Sell | 3/17/21 | 973,719 | 997,949 | 24,230 |
| | Swiss Franc | Buy | 3/17/21 | 1,862,920 | 1,875,973 | (13,053) |
| | Swiss Franc | Sell | 3/17/21 | 1,862,920 | 1,913,598 | 50,678 |
| Goldman Sachs International | | | | | |
| | Canadian Dollar | Sell | 4/21/21 | 2,867,356 | 2,878,466 | 11,110 |
| | Chinese Yuan (Offshore) | Sell | 5/20/21 | 2,787,917 | 2,793,538 | 5,621 |
| | Euro | Sell | 3/17/21 | 725,869 | 732,355 | 6,486 |
| | Japanese Yen | Buy | 5/19/21 | 1,578,634 | 1,603,000 | (24,366) |
| | Swiss Franc | Buy | 3/17/21 | 1,206,021 | 1,238,887 | (32,866) |
| | Swiss Franc | Sell | 3/17/21 | 1,206,021 | 1,214,479 | 8,458 |
| HSBC Bank USA, National Association | | | | | |
| | British Pound | Sell | 3/17/21 | 3,042,168 | 2,776,447 | (265,721) |
| | Canadian Dollar | Buy | 4/21/21 | 1,495,250 | 1,501,028 | (5,778) |
| | Chinese Yuan (Offshore) | Sell | 5/20/21 | 674,704 | 676,069 | 1,365 |
| | Euro | Buy | 3/17/21 | 1,582,572 | 1,557,560 | 25,012 |
| | Hong Kong Dollar | Buy | 5/20/21 | 4,121,665 | 4,124,381 | (2,716) |
| | Japanese Yen | Sell | 5/19/21 | 1,839,546 | 1,867,801 | 28,255 |
| | Norwegian Krone | Buy | 3/17/21 | 1,867,161 | 1,860,812 | 6,349 |
| | Swiss Franc | Buy | 3/17/21 | 1,165,659 | 1,173,883 | (8,224) |
| | Swiss Franc | Sell | 3/17/21 | 1,165,659 | 1,197,187 | 31,528 |
| JPMorgan Chase Bank N.A. | | | | | |
| | Australian Dollar | Buy | 4/21/21 | 5,021,174 | 5,081,476 | (60,302) |
| | British Pound | Sell | 3/17/21 | 10,291,041 | 9,953,791 | (337,250) |
| | Japanese Yen | Buy | 5/19/21 | 1,792,981 | 1,820,603 | (27,622) |
| | New Zealand Dollar | Buy | 4/21/21 | 1,172,943 | 1,178,525 | (5,582) |
| | Norwegian Krone | Buy | 3/17/21 | 877,933 | 874,570 | 3,363 |
| | Singapore Dollar | Buy | 5/19/21 | 3,959,233 | 3,960,503 | (1,270) |
| | South Korean Won | Buy | 5/20/21 | 8,846,738 | 8,909,064 | (62,326) |
| | Swedish Krona | Buy | 3/17/21 | 8,140,074 | 8,180,835 | (40,761) |
| | Swiss Franc | Buy | 3/17/21 | 27,329,133 | 28,074,647 | (745,514) |
| Morgan Stanley & Co. International PLC | | | | |
| | Australian Dollar | Buy | 4/21/21 | 31,938 | 32,316 | (378) |
| | British Pound | Sell | 3/17/21 | 1,838,064 | 1,760,834 | (77,230) |
| | Canadian Dollar | Sell | 4/21/21 | 2,350,655 | 2,355,325 | 4,670 |
| | Euro | Buy | 3/17/21 | 4,208,205 | 4,225,209 | (17,004) |
| | Japanese Yen | Sell | 5/19/21 | 2,674,276 | 2,716,236 | 41,960 |
| | Swedish Krona | Buy | 3/17/21 | 4,309,078 | 4,416,157 | (107,079) |
| | Swedish Krona | Sell | 3/17/21 | 4,309,078 | 4,346,444 | 37,366 |
| | Swiss Franc | Sell | 3/17/21 | 2,383,557 | 2,471,152 | 87,595 |
|
| International Capital Opportunities Fund 19 |
| | | | | | |
| FORWARD CURRENCY CONTRACTS at 2/28/21 (aggregate face value $259,377,389) (Unaudited) cont. |
| | | | | | | Unrealized |
| | | Contract | Delivery | | Aggregate | appreciation/ |
| Counterparty | Currency | type* | date | Value | face value | (depreciation) |
| State Street Bank and Trust Co. | | | | | |
| | Australian Dollar | Buy | 4/21/21 | $3,026,403 | $3,062,419 | $(36,016) |
| | British Pound | Sell | 3/17/21 | 5,956,291 | 5,771,573 | (184,718) |
| | Canadian Dollar | Buy | 4/21/21 | 2,974,547 | 2,986,218 | (11,671) |
| | Chinese Yuan (Offshore) | Sell | 5/20/21 | 1,371,058 | 1,373,677 | 2,619 |
| | Euro | Buy | 3/17/21 | 7,676,899 | 7,754,018 | (77,119) |
| | Hong Kong Dollar | Sell | 5/20/21 | 877,776 | 878,319 | 543 |
| | Israeli Shekel | Buy | 4/21/21 | 2,654,701 | 2,765,842 | (111,141) |
| | Japanese Yen | Buy | 5/19/21 | 2,058,141 | 2,089,864 | (31,723) |
| |
| | Swedish Krona | Buy | 3/17/21 | 961,151 | 969,438 | (8,287) |
| | Swedish Krona | Sell | 3/17/21 | 961,151 | 985,037 | 23,886 |
| | Swiss Franc | Buy | 3/17/21 | 3,720,013 | 3,818,606 | (98,593) |
| | Swiss Franc | Sell | 3/17/21 | 3,720,011 | 3,746,046 | 26,035 |
| Toronto-Dominion Bank | | | | | |
| | Canadian Dollar | Sell | 4/21/21 | 1,507,667 | 1,513,418 | 5,751 |
| | Euro | Buy | 3/17/21 | 734,076 | 740,596 | (6,520) |
| UBS AG | | | | | | |
| | Australian Dollar | Buy | 4/21/21 | 2,774,671 | 2,802,911 | (28,240) |
| | British Pound | Buy | 3/17/21 | 948,570 | 917,623 | 30,947 |
| | Canadian Dollar | Buy | 4/21/21 | 6,021,945 | 6,048,377 | (26,432) |
| | Chinese Yuan (Offshore) | Sell | 5/20/21 | 961,204 | 961,473 | 269 |
| | Euro | Sell | 3/17/21 | 8,907,521 | 8,956,385 | 48,864 |
| | Japanese Yen | Sell | 5/19/21 | 1,656,717 | 1,656,355 | (362) |
| | Swedish Krona | Buy | 3/17/21 | 1,155,691 | 1,184,409 | (28,718) |
| | Swedish Krona | Sell | 3/17/21 | 1,155,691 | 1,165,748 | 10,057 |
| | Swiss Franc | Buy | 3/17/21 | 865,088 | 888,442 | (23,354) |
| | Swiss Franc | Sell | 3/17/21 | 865,088 | 871,182 | 6,094 |
| WestPac Banking Corp. | | | | | |
| | Australian Dollar | Buy | 4/21/21 | 1,586,120 | 1,605,076 | (18,956) |
| | British Pound | Sell | 3/17/21 | 1,103,229 | 1,067,092 | (36,137) |
| | Canadian Dollar | Sell | 4/21/21 | 2,324,879 | 2,336,835 | 11,956 |
| | Euro | Buy | 3/17/21 | 5,339,974 | 5,418,608 | (78,634) |
| | Japanese Yen | Buy | 5/19/21 | 2,735,756 | 2,777,089 | (41,333) |
| Unrealized appreciation | | | | | 1,170,937 |
| Unrealized (depreciation) | | | | | (3,146,457) |
| Total | | | | | | $(1,975,520) |
* The exchange currency for all contracts listed is the United States Dollar.
|
| 20 International Capital Opportunities Fund |
ASC 820 establishes a three-level hierarchy for disclosure of fair value measurements. The valuation hierarchy is based upon the transparency of inputs to the valuation of the fund’s investments. The three levels are defined as follows:
Level 1: Valuations based on quoted prices for identical securities in active markets.
Level 2: Valuations based on quoted prices in markets that are not active or for which all significant inputs are observable, either directly or indirectly.
Level 3: Valuations based on inputs that are unobservable and significant to the fair value measurement.
The following is a summary of the inputs used to value the fund’s net assets as of the close of the reporting period:
| | | |
| | | | Valuation inputs | |
| Investments in securities: | Level 1 | Level 2 | Level 3 |
| Common stocks *: | | | |
| Australia | $11,648,002 | $— | $— |
| Canada | 35,421,324 | — | — |
| Chile | 6,411,447 | — | — |
| China | 6,757,971 | — | — |
| Denmark | — | 5,267,050 | — |
| France | — | 42,002,515 | — |
| Germany | — | 9,779,899 | — |
| Greece | — | 14,393,116 | — |
| Hong Kong | 3,571,974 | — | — |
| India | 6,710,348 | — | — |
| Ireland | — | 8,720,412 | — |
| Italy | — | 2,576,563 | — |
| Japan | 79,490,042 | — | — |
| Jersey | — | 8,136,156 | — |
| Mexico | 7,436,470 | — | — |
| Russia | — | 2,501,659 | — |
| South Korea | 10,063,957 | — | — |
| Spain | — | 11,497,386 | — |
| Sweden | — | 4,783,818 | — |
| Switzerland | — | 4,927,773 | — |
| Taiwan | 22,777,939 | — | — |
| United Kingdom | 16,026,799 | 39,513,918 | 6 |
| Total common stocks | 206,316,273 | 154,100,265 | 6 |
| U.S. treasury obligations | — | 222,262 | — |
| Short-term investments | 300,000 | 2,608,843 | — |
| Totals by level | $206,616,273 | $156,931,370 | $6 |
| | | | | |
| | | | Valuation inputs | |
| Other financial instruments: | Level 1 | Level 2 | Level 3 |
| Forward currency contracts | $— | $(1,975,520) | $— |
| Totals by level | $— | $(1,975,520) | $— |
* Common stock classifications are presented at the sector level, which may differ from the fund’s portfolio presentation.
At the start and close of the reporting period, Level 3 investments in securities represented less than 1% of the fund’s net assets and were not considered a significant portion of the fund’s portfolio.
The accompanying notes are an integral part of these financial statements.
|
| International Capital Opportunities Fund 21 |
Statement of assets and liabilities 2/28/21 (Unaudited)
| |
| ASSETS | |
| Investment in securities, at value (Notes 1 and 8): | |
| Unaffiliated issuers (identified cost $321,747,957) | $362,938,610 |
| Affiliated issuers (identified cost $609,039) (Notes 1 and 5) | 609,039 |
| Foreign currency (cost $467,374) (Note 1) | 463,436 |
| Foreign tax reclaim | 169,324 |
| Dividends, interest and other receivables | 543,593 |
| Receivable for shares of the fund sold | 155,116 |
| Receivable for investments sold | 1,502,051 |
| Unrealized appreciation on forward currency contracts (Note 1) | 1,170,937 |
| Prepaid assets | 41,838 |
| Total assets | 367,593,944 |
| |
| LIABILITIES | |
| Payable for investments purchased | 1,301,340 |
| Payable for shares of the fund repurchased | 106,895 |
| Payable for compensation of Manager (Note 2) | 254,476 |
| Payable for custodian fees (Note 2) | 46,358 |
| Payable for investor servicing fees (Note 2) | 121,495 |
| Payable for Trustee compensation and expenses (Note 2) | 207,696 |
| Payable for administrative services (Note 2) | 997 |
| Payable for distribution fees (Note 2) | 136,904 |
| Unrealized depreciation on forward currency contracts (Note 1) | 3,146,457 |
| Collateral on certain derivative contracts at value (Notes 1 and 8) | 522,262 |
| Other accrued expenses | 78,550 |
| Total liabilities | 5,923,430 |
| | |
| Net assets | $361,670,514 |
| |
| REPRESENTED BY | |
| Paid-in capital (Unlimited shares authorized) (Notes 1 and 4) | $309,850,243 |
| Total distributable earnings (Note 1) | 51,820,271 |
| Total — Representing net assets applicable to capital shares outstanding | $361,670,514 |
(Continued on next page)
|
| 22 International Capital Opportunities Fund |
Statement of assets and liabilities cont.
| |
| COMPUTATION OF NET ASSET VALUE AND OFFERING PRICE | |
| Net asset value and redemption price per class A share | |
| ($304,381,006 divided by 7,227,276 shares) | $42.12 |
| Offering price per class A share (100/94.25 of $42.12)* | $44.69 |
| Net asset value and offering price per class B share ($1,745,677 divided by 41,935 shares)** | $41.63 |
| Net asset value and offering price per class C share ($4,024,580 divided by 97,404 shares)** | $41.32 |
| Net asset value, offering price and redemption price per class R share | |
| ($9,518,831 divided by 230,499 shares) | $41.30 |
| Net asset value, offering price and redemption price per class R6 share | |
| ($12,840,474 divided by 302,459 shares) | $42.45 |
| Net asset value, offering price and redemption price per class Y share | |
| ($29,159,946 divided by 689,222 shares) | $42.31 |
*On single retail sales of less than $50,000. On sales of $50,000 or more the offering price is reduced.
**Redemption price per share is equal to net asset value less any applicable contingent deferred sales charge.
The accompanying notes are an integral part of these financial statements.
|
| International Capital Opportunities Fund 23 |
Statement of operations Six months ended 2/28/21 (Unaudited)
| |
| INVESTMENT INCOME | |
| Dividends (net of foreign tax of $308,829) | $3,331,913 |
| Interest (including interest income of $4,061 from investments in affiliated issuers) (Note 5) | 4,324 |
| Securities lending (net of expenses) (Notes 1 and 5) | 828 |
| Total investment income | 3,337,065 |
| |
| EXPENSES | |
| Compensation of Manager (Note 2) | 1,552,836 |
| Investor servicing fees (Note 2) | 359,206 |
| Custodian fees (Note 2) | 35,474 |
| Trustee compensation and expenses (Note 2) | 7,608 |
| Distribution fees (Note 2) | 411,145 |
| Administrative services (Note 2) | 5,963 |
| Other | 123,975 |
| Total expenses | 2,496,207 |
| Expense reduction (Note 2) | (323) |
| Net expenses | 2,495,884 |
| | |
| Net investment income | 841,181 |
| |
| REALIZED AND UNREALIZED GAIN (LOSS) | |
| Net realized gain (loss) on: | |
| Securities from unaffiliated issuers (Notes 1 and 3) | 27,397,064 |
| Foreign currency transactions (Note 1) | (11,989) |
| Forward currency contracts (Note 1) | 2,781,542 |
| Total net realized gain | 30,166,617 |
| Change in net unrealized appreciation (depreciation) on: | |
| Securities from unaffiliated issuers | 30,837,183 |
| Assets and liabilities in foreign currencies | (15,631) |
| Forward currency contracts | (3,369,588) |
| Total change in net unrealized appreciation | 27,451,964 |
| | |
| Net gain on investments | 57,618,581 |
| |
| Net increase in net assets resulting from operations | $58,459,762 |
The accompanying notes are an integral part of these financial statements.
|
| 24 International Capital Opportunities Fund |
Statement of changes in net assets
| | |
| INCREASE (DECREASE) IN NET ASSETS | Six months ended 2/28/21* | Year ended 8/31/20 |
| Operations | | |
| Net investment income | $841,181 | $1,418,608 |
| Net realized gain on investments | | |
| and foreign currency transactions | 30,166,617 | 344,114 |
| Change in net unrealized appreciation of investments | | |
| and assets and liabilities in foreign currencies | 27,451,964 | 25,886,542 |
| Net increase in net assets resulting from operations | 58,459,762 | 27,649,264 |
| Distributions to shareholders (Note 1): | | |
| From ordinary income | | |
| Net investment income | | |
| Class A | (2,470,030) | (2,710,201) |
| Class B | — | (21,779) |
| Class C | (1,784) | (48,792) |
| Class R | (52,441) | (94,410) |
| Class R6 | (151,981) | (110,483) |
| Class Y | (292,222) | (299,893) |
| Net realized short-term gain on investments | | |
| Class A | (4,487,104) | — |
| Class B | (27,185) | — |
| Class C | (62,844) | — |
| Class R | (140,879) | — |
| Class R6 | (187,829) | — |
| Class Y | (424,928) | — |
| From net realized long-term gain on investments | | |
| Class A | (6,178,614) | (1,454,384) |
| Class B | (37,433) | (11,687) |
| Class C | (86,535) | (26,184) |
| Class R | (193,987) | (50,663) |
| Class R6 | (258,636) | (59,289) |
| Class Y | (585,113) | (160,933) |
| Decrease from capital share transactions (Note 4) | (7,955,647) | (38,187,992) |
| Total increase (decrease) in net assets | 34,864,570 | (15,587,426) |
| |
| NET ASSETS | | |
| Beginning of period | 326,805,944 | 342,393,370 |
| End of period | $361,670,514 | $326,805,944 |
*Unaudited.
The accompanying notes are an integral part of these financial statements.
|
| International Capital Opportunities Fund 25 |
Financial highlights (For a common share outstanding throughout the period)
| | | | | | | | | | | | | | |
| | INVESTMENT OPERATIONS | LESS DISTRIBUTIONS | RATIOS AND SUPPLEMENTAL DATA |
| | | | | | | | | | | | | Ratio of | Ratio of net | |
| | Net asset | | Net realized | | | From | | | | | | expenses | investment | |
| | value, | | and unrealized | Total from | From net | net realized | | Non-recurring | Net asset | Total return | Net assets, | to average | income (loss) | Portfolio |
| | beginning | Net investment | gain (loss) on | investment | investment | gain on | Total | reimburse | value, end | at net asset | end of period | net assets | to average | turnover |
| Period ended | of period | income (loss)a | investments | operations | income | investments | distributions | ments | of period | value (%)b | (in thousands) | (%)c | net assets (%) | (%) |
| Class A | | | | | | | | | | | | | | |
| February 28, 2021** | $37.10 | .09 | 6.79 | 6.88 | (.35) | (1.51) | (1.86) | — | $42.12 | 18.60* | $304,381 | .73 | .24* | 22* |
| August 31, 2020 | 34.55 | .15 | 2.93 | 3.08 | (.34) | (.19) | (.53) | — | 37.10 | 8.83 | 272,957 | 1.54 | .42 | 44 |
| August 31, 2019 | 41.27 | .17 | (3.72) | (3.55) | — | (3.17) | (3.17) | —e,h | 34.55 | (7.69) | 278,379 | 1.50 | .48 | 42 |
| August 31, 2018 | 40.19 | .51 | 1.73 | 2.24 | (.97) | (.19) | (1.16) | — | 41.27 | 5.54 | 347,828 | 1.37 | 1.22 | 44 |
| August 31, 2017 | 33.90 | .38 | 6.73 | 7.11 | (.82) | — | (.82) | —d,e | 40.19 | 21.59 | 346,173 | 1.29 | 1.07 | 103 |
| August 31, 2016 | 34.27 | .63 | (.44) | .19 | (.56) | — | (.56) | — | 33.90 | .52 | 346,192 | 1.22g | 1.86g | 92 |
| Class B | | | | | | | | | | | | | | |
| February 28, 2021** | $36.52 | (.05) | 6.67 | 6.62 | — | (1.51) | (1.51) | — | $41.63 | 18.17* | $1,746 | 1.10* | (.14)* | 22* |
| August 31, 2020 | 34.27 | (.13) | 2.91 | 2.78 | (.34) | (.19) | (.53) | — | 36.52 | 8.02 | 1,750 | 2.29 | (.38) | 44 |
| August 31, 2019 | 41.26 | (.11) | (3.71) | (3.82) | — | (3.17) | (3.17) | —e,h | 34.27 | (8.40) | 2,480 | 2.25 | (.29) | 42 |
| August 31, 2018 | 40.16 | .21 | 1.71 | 1.92 | (.63) | (.19) | (.82) | — | 41.26 | 4.74 | 4,073 | 2.12 | .52 | 44 |
| August 31, 2017 | 33.80 | .11 | 6.76 | 6.87 | (.51) | — | (.51) | —d,e | 40.16 | 20.70 | 5,520 | 2.04 | .32 | 103 |
| August 31, 2016 | 34.12 | .36 | (.44) | (.08) | (.24) | — | (.24) | — | 33.80 | (.24) | 6,764 | 1.97g | 1.08g | 92 |
| Class C | | | | | | | | | | | | | | |
| February 28, 2021** | $36.28 | (.05) | 6.62 | 6.57 | (.02) | (1.51) | (1.53) | — | $41.32 | 18.14* | $4,025 | 1.10* | (.14)* | 22* |
| August 31, 2020 | 34.04 | (.13) | 2.90 | 2.77 | (.34) | (.19) | (.53) | — | 36.28 | 8.04 | 3,879 | 2.29 | (.38) | 44 |
| August 31, 2019 | 41.01 | (.10) | (3.70) | (3.80) | — | (3.17) | (3.17) | —e,h | 34.04 | (8.40) | 5,553 | 2.25 | (.29) | 42 |
| August 31, 2018 | 39.96 | .26f | 1.65 | 1.91 | (.67) | (.19) | (.86) | — | 41.01 | 4.74 | 8,491 | 2.12 | .64f | 44 |
| August 31, 2017 | 33.65 | .12 | 6.72 | 6.84 | (.53) | — | (.53) | —d,e | 39.96 | 20.72 | 24,301 | 2.04 | .34 | 103 |
| August 31, 2016 | 34.02 | .37 | (.45) | (.08) | (.29) | — | (.29) | — | 33.65 | (.26) | 25,610 | 1.97g | 1.11g | 92 |
| Class R | | | | | | | | | | | | | | |
| February 28, 2021** | $36.36 | .04 | 6.65 | 6.69 | (.24) | (1.51) | (1.75) | — | $41.30 | 18.44* | $9,519 | .85* | .11* | 22* |
| August 31, 2020 | 33.95 | .06 | 2.88 | 2.94 | (.34) | (.19) | (.53) | — | 36.36 | 8.57 | 8,766 | 1.79 | .17 | 44 |
| August 31, 2019 | 40.72 | .08 | (3.68) | (3.60) | — | (3.17) | (3.17) | —e,h | 33.95 | (7.93) | 9,914 | 1.75 | .22 | 42 |
| August 31, 2018 | 39.66 | .41 | 1.70 | 2.11 | (.86) | (.19) | (1.05) | — | 40.72 | 5.28 | 15,380 | 1.62 | 1.00 | 44 |
| August 31, 2017 | 33.44 | .29 | 6.65 | 6.94 | (.72) | — | (.72) | —d,e | 39.66 | 21.31 | 17,974 | 1.54 | .84 | 103 |
| August 31, 2016 | 33.79 | .54 | (.45) | .09 | (.44) | — | (.44) | — | 33.44 | .24 | 19,742 | 1.47g | 1.61g | 92 |
| Class R6 | | | | | | | | | | | | | | |
| February 28, 2021** | $37.45 | .18 | 6.84 | 7.02 | (.51) | (1.51) | (2.02) | — | $42.45 | 18.82* | $12,840 | .52* | .44* | 22* |
| August 31, 2020 | 34.72 | .31 | 2.95 | 3.26 | (.34) | (.19) | (.53) | — | 37.45 | 9.31 | 11,393 | 1.11 | .86 | 44 |
| August 31, 2019 | 41.29 | .33 | (3.73) | (3.40) | — | (3.17) | (3.17) | —e,h | 34.72 | (7.30) | 11,955 | 1.06 | .92 | 42 |
| August 31, 2018† | 42.19 | .13 | (1.03) | (.90) | — | — | — | — | 41.29 | (2.13)* | 12,695 | .27* | .32* | 44 |
| Class Y | | | | | | | | | | | | | | |
| February 28, 2021** | $37.29 | .15 | 6.82 | 6.97 | (.44) | (1.51) | (1.95) | — | $42.31 | 18.74* | $29,160 | .61* | .36* | 22* |
| August 31, 2020 | 34.64 | .22 | 2.96 | 3.18 | (.34) | (.19) | (.53) | — | 37.29 | 9.09 | 28,060 | 1.29 | .61 | 44 |
| August 31, 2019 | 41.27 | .28 | (3.74) | (3.46) | — | (3.17) | (3.17) | —e,h | 34.64 | (7.46) | 30,794 | 1.25 | .77 | 42 |
| August 31, 2018 | 40.19 | .64 | 1.70 | 2.34 | (1.07) | (.19) | (1.26) | — | 41.27 | 5.79 | 34,311 | 1.12 | 1.54 | 44 |
| August 31, 2017 | 33.91 | .50 | 6.69 | 7.19 | (.91) | — | (.91) | —d,e | 40.19 | 21.90 | 54,499 | 1.04 | 1.40 | 103 |
| August 31, 2016 | 34.30 | .68 | (.42) | .26 | (.65) | — | (.65) | — | 33.91 | .74 | 44,636 | .97g | 2.03g | 92 |
See notes to financial highlights at the end of this section.
The accompanying notes are an integral part of these financial statements.
| |
| 26 International Capital Opportunities Fund | International Capital Opportunities Fund 27 |
Financial highlights cont.
* Not annualized.
** Unaudited.
† For the period May 22, 2018 (commencement of operations) to August 31, 2018.
a Per share net investment income (loss) has been determined on the basis of the weighted average number of shares outstanding during the period.
b Total return assumes dividend reinvestment and does not reflect the effect of sales charges.
c Includes amounts paid through expense offset and brokerage/service arrangements, if any (Note 2). Also excludes acquired fund fees and expenses, if any.
d Reflects a non-recurring reimbursement pursuant to a settlement between the Securities and Exchange Commission (the SEC) and Haidar Capital Management/Haidar Capital Advisors which amounted to less than $0.01 per share outstanding on February 15, 2017.
e Amount represents less than $0.01 per share.
f The net investment income ratio and per share amount shown for the period ending August 31, 2018 may not correspond with the expected class specific differences for the period due to the timing of redemptions out of the class.
g Reflects a voluntary waiver of certain fund expenses in effect during the period. As a result of such waiver, the expenses of each class reflect a reduction of less than 0.01% as a percentage of average net assets.
h Reflects a non-recurring reimbursement pursuant to a settlement between the SEC and Canadian Imperial Holdings, Inc. and CIBC World Market Corp. which amounted to less than $0.01 per share outstanding on March 6, 2019.
The accompanying notes are an integral part of these financial statements.
|
| 28 International Capital Opportunities Fund |
Notes to financial statements 2/28/21 (Unaudited)
Within the following Notes to financial statements, references to “State Street” represent State Street Bank and Trust Company, references to “the SEC” represent the Securities and Exchange Commission, references to “Putnam Management” represent Putnam Investment Management, LLC, the fund’s manager, an indirect wholly-owned subsidiary of Putnam Investments, LLC and references to “OTC”, if any, represent over-the-counter. Unless otherwise noted, the “reporting period” represents the period from September 1, 2020 through February 28, 2021.
Putnam International Capital Opportunities Fund (the fund) is a diversified series of Putnam Investment Funds (the Trust), a Massachusetts business trust registered under the Investment Company Act of 1940, as amended, as an open-end management investment company. The goal of the fund is to seek long-term capital appreciation. The fund invests mainly in common stocks (growth or value stocks or both) of small and midsize companies outside the United States that Putnam Management believes have favorable investment potential. For example, the fund may purchase stocks of companies with stock prices that reflect a value lower than that which Putnam Management places on the company. The fund may also consider other factors that Putnam Management believes will cause the stock price to rise. The fund invests mainly in developed countries, but may invest in emerging markets. Putnam Management may consider, among other factors, a company’s valuation, financial strength, growth potential, competitive position in its industry, projected future earnings, cash flows and dividends when deciding whether to buy or sell investments. The fund may also use derivatives such as futures, options, certain foreign currency transactions, warrants and swap contracts, for both hedging and non-hedging purposes.
The fund offers class A, class B, class C, class R, class R6 and class Y shares. Purchases of class B shares are closed to new and existing investors except by exchange from class B shares of another Putnam fund or through dividend and/or capital gains reinvestment. Class A shares are sold with a maximum front-end sales charge of 5.75%. Class A shares generally are not subject to a contingent deferred sales charge, and class R, class R6 and class Y shares are not subject to a contingent deferred sales charge. Class B shares, which convert to class A shares after approximately eight years, are not subject to a front-end sales charge and are subject to a contingent deferred sales charge if those shares are redeemed within six years of purchase. Class C shares are subject to a one-year 1.00% contingent deferred sales charge and generally convert to class A shares after approximately ten years. Effective March 1, 2021, class C shares will generally convert to class A shares after approximately eight years. Class R shares, which are not available to all investors, are sold at net asset value. The expenses for class A, class B, class C and class R shares may differ based on the distribution fee of each class, which is identified in Note 2. Class R6 and class Y shares, which are sold at net asset value, are generally subject to the same expenses as class A, class B, class C and class R shares, but do not bear a distribution fee, and in the case of class R6 shares, bear a lower investor servicing fee, which is identified in Note 2. Class R6 and class Y shares are not available to all investors.
In the normal course of business, the fund enters into contracts that may include agreements to indemnify another party under given circumstances. The fund’s maximum exposure under these arrangements is unknown as this would involve future claims that may be, but have not yet been, made against the fund. However, the fund’s management team expects the risk of material loss to be remote.
The fund has entered into contractual arrangements with an investment adviser, administrator, distributor, shareholder servicing agent and custodian, who each provide services to the fund. Unless expressly stated otherwise, shareholders are not parties to, or intended beneficiaries of these contractual arrangements, and these contractual arrangements are not intended to create any shareholder right to enforce them against the service providers or to seek any remedy under them against the service providers, either directly or on behalf of the fund.
Under the fund’s Amended and Restated Agreement and Declaration of Trust, any claims asserted against or on behalf of the Putnam Funds, including claims against Trustees and Officers, must be brought in state and federal courts located within the Commonwealth of Massachusetts.
Note 1: Significant accounting policies
The following is a summary of significant accounting policies consistently followed by the fund in the preparation of its financial statements. The preparation of financial statements is in conformity with accounting principles generally accepted in the United States of America and requires management to make estimates and assumptions that affect the reported amounts of assets and liabilities in the financial statements and the reported amounts of increases and decreases in net assets from operations. Actual results could differ from those estimates. Subsequent events after the Statement of assets and liabilities date through the date that the financial statements were issued have been evaluated in the preparation of the financial statements.
|
| International Capital Opportunities Fund 29 |
Investment income, realized and unrealized gains and losses and expenses of the fund are borne pro-rata based on the relative net assets of each class to the total net assets of the fund, except that each class bears expenses unique to that class (including the distribution fees applicable to such classes). Each class votes as a class only with respect to its own distribution plan or other matters on which a class vote is required by law or determined by the Trustees. If the fund were liquidated, shares of each class would receive their pro-rata share of the net assets of the fund. In addition, the Trustees declare separate dividends on each class of shares.
Security valuation Portfolio securities and other investments are valued using policies and procedures adopted by the Board of Trustees. The Trustees have formed a Pricing Committee to oversee the implementation of these procedures and have delegated responsibility for valuing the fund’s assets in accordance with these procedures to Putnam Management. Putnam Management has established an internal Valuation Committee that is responsible for making fair value determinations, evaluating the effectiveness of the pricing policies of the fund and reporting to the Pricing Committee.
Investments (including securities sold short, if any) for which market quotations are readily available are valued at the last reported sales price on their principal exchange, or official closing price for certain markets, and are classified as Level 1 securities under Accounting Standards Codification 820 Fair Value Measurements and Disclosures (ASC 820). If no sales are reported, as in the case of some securities that are traded OTC, a security is valued at its last reported bid price (ask price for securities sold short, if any) and is generally categorized as a Level 2 security.
Investments in open-end investment companies (excluding exchange-traded funds), if any, which can be classified as Level 1 or Level 2 securities, are valued based on their net asset value. The net asset value of such investment companies equals the total value of their assets less their liabilities and divided by the number of their outstanding shares.
Market quotations are not considered to be readily available for certain debt obligations (including short-term investments with remaining maturities of 60 days or less) and other investments; such investments are valued on the basis of valuations furnished by an independent pricing service approved by the Trustees or dealers selected by Putnam Management. Such services or dealers determine valuations for normal institutional-size trading units of such securities using methods based on market transactions for comparable securities and various relationships, generally recognized by institutional traders, between securities (which consider such factors as security prices, yields, maturities and ratings). These securities will generally be categorized as Level 2.
Many securities markets and exchanges outside the U.S. close prior to the scheduled close of the New York Stock Exchange and therefore the closing prices for securities in such markets or on such exchanges may not fully reflect events that occur after such close but before the scheduled close of the New York Stock Exchange. Accordingly, on certain days, the fund will fair value certain foreign equity securities taking into account multiple factors including movements in the U.S. securities markets, currency valuations and comparisons to the valuation of American Depository Receipts, exchange-traded funds and futures contracts. The foreign equity securities, which would generally be classified as Level 1 securities, will be transferred to Level 2 of the fair value hierarchy when they are valued at fair value. The number of days on which fair value prices will be used will depend on market activity and it is possible that fair value prices will be used by the fund to a significant extent. At the close of the reporting period, fair value pricing was used for certain foreign securities in the portfolio. Securities quoted in foreign currencies, if any, are translated into U.S. dollars at the current exchange rate.
To the extent a pricing service or dealer is unable to value a security or provides a valuation that Putnam Management does not believe accurately reflects the security’s fair value, the security will be valued at fair value by Putnam Management in accordance with policies and procedures approved by the Trustees. Certain investments, including certain restricted and illiquid securities and derivatives, are also valued at fair value following procedures approved by the Trustees. These valuations consider such factors as significant market or specific security events such as interest rate or credit quality changes, various relationships with other securities, discount rates, U.S. Treasury, U.S. swap and credit yields, index levels, convexity exposures, recovery rates, sales and other multiples and resale restrictions. These securities are classified as Level 2 or as Level 3 depending on the priority of the significant inputs.
To assess the continuing appropriateness of fair valuations, the Valuation Committee reviews and affirms the reasonableness of such valuations on a regular basis after considering all relevant information that is reasonably available. Such valuations and procedures are reviewed periodically by the Trustees. The fair value of securities is generally determined as the amount that the fund could reasonably expect to realize from an orderly disposition of such securities over a reasonable period of time. By its nature, a fair value price is a good faith estimate of the value of a security in a current sale and does not reflect an actual market price, which may be different by a material amount.
|
| 30 International Capital Opportunities Fund |
Security transactions and related investment income Security transactions are recorded on the trade date (the date the order to buy or sell is executed). Gains or losses on securities sold are determined on the identified cost basis.
Interest income, net of any applicable withholding taxes, if any, and including amortization and accretion of premiums and discounts on debt securities, is recorded on the accrual basis. Dividend income, net of any applicable withholding taxes, is recognized on the ex-dividend date except that certain dividends from foreign securities, if any, are recognized as soon as the fund is informed of the ex-dividend date. Non-cash dividends, if any, are recorded at the fair value of the securities received. Dividends representing a return of capital or capital gains, if any, are reflected as a reduction of cost and/or as a realized gain.
Foreign currency translation The accounting records of the fund are maintained in U.S. dollars. The fair value of foreign securities, currency holdings, and other assets and liabilities is recorded in the books and records of the fund after translation to U.S. dollars based on the exchange rates on that day. The cost of each security is determined using historical exchange rates. Income and withholding taxes are translated at prevailing exchange rates when earned or incurred. The fund does not isolate that portion of realized or unrealized gains or losses resulting from changes in the foreign exchange rate on investments from fluctuations arising from changes in the market prices of the securities. Such gains and losses are included with the net realized and unrealized gain or loss on investments. Net realized gains and losses on foreign currency transactions represent net realized exchange gains or losses on disposition of foreign currencies, currency gains and losses realized between the trade and settlement dates on securities transactions and the difference between the amount of investment income and foreign withholding taxes recorded on the fund’s books and the U.S. dollar equivalent amounts actually received or paid. Net unrealized appreciation and depreciation of assets and liabilities in foreign currencies arise from changes in the value of assets and liabilities other than investments at the period end, resulting from changes in the exchange rate.
Forward currency contracts The fund buys and sells forward currency contracts, which are agreements between two parties to buy and sell currencies at a set price on a future date. These contracts are used to hedge foreign exchange risk.
The U.S. dollar value of forward currency contracts is determined using current forward currency exchange rates supplied by a quotation service. The fair value of the contract will fluctuate with changes in currency exchange rates. The contract is marked to market daily and the change in fair value is recorded as an unrealized gain or loss. The fund records a realized gain or loss equal to the difference between the value of the contract at the time it was opened and the value at the time it was closed when the contract matures or by delivery of the currency. The fund could be exposed to risk if the value of the currency changes unfavorably, if the counterparties to the contracts are unable to meet the terms of their contracts or if the fund is unable to enter into a closing position. Risks may exceed amounts recognized on the Statement of assets and liabilities.
Forward currency contracts outstanding at period end, if any, are listed after the fund’s portfolio.
Master agreements The fund is a party to ISDA (International Swaps and Derivatives Association, Inc.) Master Agreements that govern OTC derivative and foreign exchange contracts and Master Securities Forward Transaction Agreements that govern transactions involving mortgage-backed and other asset-backed securities that may result in delayed delivery (Master Agreements) with certain counterparties entered into from time to time. The Master Agreements may contain provisions regarding, among other things, the parties’ general obligations, representations, agreements, collateral requirements, events of default and early termination. With respect to certain counterparties, in accordance with the terms of the Master Agreements, collateral pledged to the fund is held in a segregated account by the fund’s custodian and, with respect to those amounts which can be sold or repledged, are presented in the fund’s portfolio.
Collateral pledged by the fund is segregated by the fund’s custodian and identified in the fund’s portfolio. Collateral can be in the form of cash or debt securities issued by the U.S. Government or related agencies or other securities as agreed to by the fund and the applicable counterparty. Collateral requirements are determined based on the fund’s net position with each counterparty.
With respect to ISDA Master Agreements, termination events applicable to the fund may occur upon a decline in the fund’s net assets below a specified threshold over a certain period of time. Termination events applicable to counterparties may occur upon a decline in the counterparty’s long-term or short-term credit ratings below a specified level. In each case, upon occurrence, the other party may elect to terminate early and cause settlement of all derivative and foreign exchange contracts outstanding, including the payment of any losses and costs
|
| International Capital Opportunities Fund 31 |
resulting from such early termination, as reasonably determined by the terminating party. Any decision by one or more of the fund’s counterparties to elect early termination could impact the fund’s future derivative activity.
At the close of the reporting period, the fund had a net liability position of $2,429,832 on open derivative contracts subject to the Master Agreements. Collateral pledged by the fund at period end for these agreements totaled $1,895,870 and may include amounts related to unsettled agreements.
Securities lending The fund may lend securities, through its agent, to qualified borrowers in order to earn additional income. The loans are collateralized by cash in an amount at least equal to the fair value of the securities loaned. The fair value of securities loaned is determined daily and any additional required collateral is allocated to the fund on the next business day. The remaining maturities of the securities lending transactions are considered overnight and continuous. The risk of borrower default will be borne by the fund’s agent; the fund will bear the risk of loss with respect to the investment of the cash collateral. Income from securities lending, net of expenses, is included in investment income on the Statement of operations. Cash collateral is invested in Putnam Cash Collateral Pool, LLC, a limited liability company managed by an affiliate of Putnam Management. Investments in Putnam Cash Collateral Pool, LLC are valued at its closing net asset value each business day. There are no management fees charged to Putnam Cash Collateral Pool, LLC. At the close of the reporting period, the fund had no securities out on loan.
Interfund lending The fund, along with other Putnam funds, may participate in an interfund lending program pursuant to an exemptive order issued by the SEC. This program allows the fund to borrow from or lend to other Putnam funds that permit such transactions. Interfund lending transactions are subject to each fund’s investment policies and borrowing and lending limits. Interest earned or paid on the interfund lending transaction will be based on the average of certain current market rates. During the reporting period, the fund did not utilize the program.
Lines of credit The fund participates, along with other Putnam funds, in a $317.5 million unsecured committed line of credit and a $235.5 million unsecured uncommitted line of credit, both provided by State Street. Borrowings may be made for temporary or emergency purposes, including the funding of shareholder redemption requests and trade settlements. Interest is charged to the fund based on the fund’s borrowing at a rate equal to 1.25% plus the higher of (1) the Federal Funds rate and (2) the Overnight Bank Funding Rate (overnight LIBOR prior to October 16, 2020) for the committed line of credit and 1.30% plus the higher of (1) the Federal Funds rate and (2) the Overnight Bank Funding Rate (1.30% prior to October 16, 2020) for the uncommitted line of credit. A closing fee equal to 0.04% of the committed line of credit and 0.04% of the uncommitted line of credit has been paid by the participating funds. In addition, a commitment fee of 0.21% per annum on any unutilized portion of the committed line of credit is allocated to the participating funds based on their relative net assets and paid quarterly. During the reporting period, the fund had no borrowings against these arrangements.
Federal taxes It is the policy of the fund to distribute all of its taxable income within the prescribed time period and otherwise comply with the provisions of the Internal Revenue Code of 1986, as amended (the Code), applicable to regulated investment companies. It is also the intention of the fund to distribute an amount sufficient to avoid imposition of any excise tax under Section 4982 of the Code.
The fund is subject to the provisions of Accounting Standards Codification 740 Income Taxes (ASC 740). ASC 740 sets forth a minimum threshold for financial statement recognition of the benefit of a tax position taken or expected to be taken in a tax return. The fund did not have a liability to record for any unrecognized tax benefits in the accompanying financial statements. No provision has been made for federal taxes on income, capital gains or unrealized appreciation on securities held nor for excise tax on income and capital gains. Each of the fund’s federal tax returns for the prior three fiscal years remains subject to examination by the Internal Revenue Service.
The fund may also be subject to taxes imposed by governments of countries in which it invests. Such taxes are generally based on either income or gains earned or repatriated. The fund accrues and applies such taxes to net investment income, net realized gains and net unrealized gains as income and/or capital gains are earned. In some cases, the fund may be entitled to reclaim all or a portion of such taxes, and such reclaim amounts, if any, are reflected as an asset on the fund’s books. In many cases, however, the fund may not receive such amounts for an extended period of time, depending on the country of investment.
Tax cost of investments includes adjustments to net unrealized appreciation (depreciation) which may not necessarily be final tax cost basis adjustments, but closely approximate the tax basis unrealized gains and losses that may be realized and distributed to shareholders. The aggregate identified cost on a tax basis is $324,412,095, resulting in gross unrealized appreciation and depreciation of $63,927,416 and $26,767,382, respectively, or net unrealized appreciation of $37,160,034.
|
| 32 International Capital Opportunities Fund |
Distributions to shareholders Distributions to shareholders from net investment income are recorded by the fund on the ex-dividend date. Distributions from capital gains, if any, are recorded on the ex-dividend date and paid at least annually. The amount and character of income and gains to be distributed are determined in accordance with income tax regulations, which may differ from generally accepted accounting principles. Dividend sources are estimated at the time of declaration. Actual results may vary. Any non-taxable return of capital cannot be determined until final tax calculations are completed after the end of the fund’s fiscal year. Reclassifications are made to the fund’s capital accounts to reflect income and gains available for distribution (or available capital loss carryovers) under income tax regulations.
Note 2: Management fee, administrative services and other transactions
The fund pays Putnam Management a management fee (base fee) (based on the fund’s average net assets and computed and paid monthly) at annual rates that may vary based on the average of the aggregate net assets of all open-end mutual funds sponsored by Putnam Management (excluding net assets of funds that are invested in, or that are invested in by, other Putnam funds to the extent necessary to avoid “double counting” of those assets). Such annual rates may vary as follows:
| | | | |
| 1.080% | of the first $5 billion, | | 0.880% | of the next $50 billion, |
| 1.030% | of the next $5 billion, | | 0.860% | of the next $50 billion, |
| 0.980% | of the next $10 billion, | | 0.850% | of the next $100 billion and |
| 0.930% | of the next $10 billion, | | 0.845% | of any excess thereafter. |
In addition, the monthly management fee consists of the monthly base fee plus or minus a performance adjustment for the month. The performance adjustment is determined based on performance over the thirty-six month period then ended. Each month, the performance adjustment is calculated by multiplying the performance adjustment rate and the fund’s average net assets over the performance period and dividing the result by twelve. The resulting dollar amount is added to, or subtracted from the base fee for that month. The performance adjustment rate is equal to 0.03 multiplied by the difference between the fund’s annualized performance (measured by the fund’s class A shares) and the annualized performance of the S&P Developed Ex-U.S. SmallCap Index each measured over the performance period. The maximum annualized performance adjustment rate is +/–0.21%. The monthly base fee is determined based on the fund’s average net assets for the month, while the performance adjustment is determined based on the fund’s average net assets over the thirty-six month performance period. This means it is possible that, if the fund underperforms significantly over the performance period, and the fund’s assets have declined significantly over that period, the negative performance adjustment may exceed the base fee. In this event, Putnam Management would make a payment to the fund.
Because the performance adjustment is based on the fund’s performance relative to its applicable benchmark index, and not its absolute performance, the performance adjustment could increase Putnam Management’s fee even if the fund’s shares lose value during the performance period provided that the fund outperformed its benchmark index, and could decrease Putnam Management’s fee even if the fund’s shares increase in value during the performance period provided that the fund underperformed its benchmark index.
For the reporting period, the management fee represented an effective rate (excluding the impact of any expense waiver in effect) of 0.449% of the fund’s average net assets, which included an effective base fee of 0.454% and an decrease of 0.005% ($17,534) based on performance.
Putnam Management has contractually agreed, through December 30, 2021, to waive fees and/or reimburse the fund’s expenses to the extent necessary to limit the cumulative expenses of the fund, exclusive of brokerage, interest, taxes, investment-related expenses, extraordinary expenses, acquired fund fees and expenses and payments under the fund’s investor servicing contract, investment management contract and distribution plans, on a fiscal year-to-date basis to an annual rate of 0.20% of the fund’s average net assets over such fiscal year-to-date period. During the reporting period, the fund’s expenses were not reduced as a result of this limit.
Putnam Investments Limited (PIL), an affiliate of Putnam Management, is authorized by the Trustees to manage a separate portion of the assets of the fund as determined by Putnam Management from time to time. PIL did not manage any portion of the assets of the fund during the reporting period. If Putnam Management were to engage the services of PIL, Putnam Management would pay a quarterly sub-management fee to PIL for its services at an annual rate of 0.35% of the average net assets of the portion of the fund managed by PIL.
|
| International Capital Opportunities Fund 33 |
The Putnam Advisory Company, LLC (PAC), an affiliate of Putnam Management, is authorized by the Trustees to manage a separate portion of the assets of the fund, as designated from time to time by Putnam Management or PIL. Putnam Management or PIL, as applicable, pays a quarterly sub-advisory fee to PAC for its services at the annual rate of 0.35% of the average net assets of the portion of the fund’s assets for which PAC is engaged as sub-adviser.
The fund reimburses Putnam Management an allocated amount for the compensation and related expenses of certain officers of the fund and their staff who provide administrative services to the fund. The aggregate amount of all such reimbursements is determined annually by the Trustees.
Custodial functions for the fund’s assets are provided by State Street. Custody fees are based on the fund’s asset level, the number of its security holdings and transaction volumes.
Putnam Investor Services, Inc., an affiliate of Putnam Management, provides investor servicing agent functions to the fund. Putnam Investor Services, Inc. received fees for investor servicing for class A, class B, class C, class R and class Y shares that included (1) a per account fee for each direct and underlying non-defined contribution account (retail account) of the fund; (2) a specified rate of the fund’s assets attributable to defined contribution plan accounts; and (3) a specified rate based on the average net assets in retail accounts. Putnam Investor Services, Inc. has agreed that the aggregate investor servicing fees for each fund’s retail and defined contribution accounts for these share classes will not exceed an annual rate of 0.25% of the fund’s average assets attributable to such accounts.
Class R6 shares paid a monthly fee based on the average net assets of class R6 shares at an annual rate of 0.05%.
During the reporting period, the expenses for each class of shares related to investor servicing fees were as follows:
| | | | |
| Class A | $309,912 | | Class R6 | 3,047 |
| Class B | 1,875 | | Class Y | 30,321 |
| Class C | 4,269 | | Total | $359,206 |
| Class R | 9,782 | | | |
The fund has entered into expense offset arrangements with Putnam Investor Services, Inc. and State Street whereby Putnam Investor Services, Inc.’s and State Street’s fees are reduced by credits allowed on cash balances. For the reporting period, the fund’s expenses were reduced by $323 under the expense offset arrangements.
Each Independent Trustee of the fund receives an annual Trustee fee, of which $252, as a quarterly retainer, has been allocated to the fund, and an additional fee for each Trustees meeting attended. Trustees also are reimbursed for expenses they incur relating to their services as Trustees.
The fund has adopted a Trustee Fee Deferral Plan (the Deferral Plan) which allows the Trustees to defer the receipt of all or a portion of Trustees fees payable on or after July 1, 1995. The deferred fees remain invested in certain Putnam funds until distribution in accordance with the Deferral Plan.
The fund has adopted an unfunded noncontributory defined benefit pension plan (the Pension Plan) covering all Trustees of the fund who have served as a Trustee for at least five years and were first elected prior to 2004. Benefits under the Pension Plan are equal to 50% of the Trustee’s average annual attendance and retainer fees for the three years ended December 31, 2005. The retirement benefit is payable during a Trustee’s lifetime, beginning the year following retirement, for the number of years of service through December 31, 2006. Pension expense for the fund is included in Trustee compensation and expenses in the Statement of operations. Accrued pension liability is included in Payable for Trustee compensation and expenses in the Statement of assets and liabilities. The Trustees have terminated the Pension Plan with respect to any Trustee first elected after 2003.
The fund has adopted distribution plans (the Plans) with respect to the following share classes pursuant to Rule 12b–1 under the Investment Company Act of 1940. The purpose of the Plans is to compensate Putnam Retail Management Limited Partnership, an indirect wholly-owned subsidiary of Putnam Investments, LLC, for services provided and expenses incurred in distributing shares of the fund. The Plans provide payments by the fund to Putnam Retail Management Limited Partnership at an annual rate of up to the following amounts (Maximum %) of the average net assets attributable to each class. The Trustees have approved payment by the fund at the
|
| 34 International Capital Opportunities Fund |
following annual rate (Approved %) of the average net assets attributable to each class. During the reporting period, the class-specific expenses related to distribution fees were as follows:
| | | |
| | Maximum % | Approved % | Amount |
| Class A | 0.35% | 0.25% | $359,925 |
| Class B | 1.00% | 1.00% | 8,701 |
| Class C | 1.00% | 1.00% | 19,814 |
| Class R | 1.00% | 0.50% | 22,705 |
| Total | | | $411,145 |
For the reporting period, Putnam Retail Management Limited Partnership, acting as underwriter, received net commissions of $6,228 from the sale of class A shares and received $197 and $31 in contingent deferred sales charges from redemptions of class B and class C shares, respectively.
A deferred sales charge of up to 1.00% is assessed on certain redemptions of class A shares. For the reporting period, Putnam Retail Management Limited Partnership, acting as underwriter, received $45 on class A redemptions.
Note 3: Purchases and sales of securities
During the reporting period, the cost of purchases and the proceeds from sales, excluding short-term investments, were as follows:
| | |
| | Cost of purchases | Proceeds from sales |
| Investments in securities (Long-term) | $75,416,427 | $94,780,335 |
| U.S. government securities (Long-term) | — | — |
| Total | $75,416,427 | $94,780,335 |
The fund may purchase or sell investments from or to other Putnam funds in the ordinary course of business, which can reduce the fund’s transaction costs, at prices determined in accordance with SEC requirements and policies approved by the Trustees. During the reporting period, purchases or sales of long-term securities from or to other Putnam funds, if any, did not represent more than 5% of the fund’s total cost of purchases and/or total proceeds from sales.
Note 4: Capital shares
At the close of the reporting period, there were an unlimited number of shares of beneficial interest authorized. Transactions, including, if applicable, direct exchanges pursuant to share conversions, in capital shares were as follows:
| | | | |
| | SIX MONTHS ENDED 2/28/21 | YEAR ENDED 8/31/20 |
| Class A | Shares | Amount | Shares | Amount |
| Shares sold | 95,271 | $3,886,489 | 308,338 | $11,052,352 |
| Shares issued in connection with | | | | |
| reinvestment of distributions | 301,048 | 12,514,561 | 100,989 | 3,967,837 |
| | 396,319 | 16,401,050 | 409,327 | 15,020,189 |
| Shares repurchased | (526,318) | (21,023,074) | (1,109,682) | (39,071,251) |
| Net decrease | (129,999) | $(4,622,024) | (700,355) | $(24,051,062) |
|
| International Capital Opportunities Fund 35 |
| | | | |
| | SIX MONTHS ENDED 2/28/21 | YEAR ENDED 8/31/20 |
| Class B | Shares | Amount | Shares | Amount |
| Shares sold | 308 | $11,814 | 536 | $19,731 |
| Shares issued in connection with | | | | |
| reinvestment of distributions | 1,564 | 64,340 | 859 | 33,409 |
| | 1,872 | 76,154 | 1,395 | 53,140 |
| Shares repurchased | (7,860) | (308,354) | (25,839) | (902,036) |
| Net decrease | (5,988) | $(232,200) | (24,444) | $(848,896) |
| |
| | SIX MONTHS ENDED 2/28/21 | YEAR ENDED 8/31/20 |
| Class C | Shares | Amount | Shares | Amount |
| Shares sold | 2,499 | $98,625 | 7,646 | $264,857 |
| Shares issued in connection with | | | | |
| reinvestment of distributions | 3,680 | 150,280 | 1,885 | 72,771 |
| | 6,179 | 248,905 | 9,531 | 337,628 |
| Shares repurchased | (15,710) | (624,371) | (65,710) | (2,309,956) |
| Net decrease | (9,531) | $(375,466) | (56,179) | $(1,972,328) |
| |
| | | | YEAR ENDED 8/31/20 * |
| Class M | | | Shares | Amount |
| Shares sold | | | 217 | $7,721 |
| Shares issued in connection with reinvestment of distributions | | — | — |
| | | | 217 | 7,721 |
| Shares repurchased | | | (97,368) | (3,689,997) |
| Net increase (decrease) | | | (97,151) | $(3,682,276) |
| |
| | SIX MONTHS ENDED 2/28/21 | YEAR ENDED 8/31/20 |
| Class R | Shares | Amount | Shares | Amount |
| Shares sold | 33,421 | $1,332,215 | 76,212 | $2,615,284 |
| Shares issued in connection with | | | | |
| reinvestment of distributions | 9,497 | 387,275 | 3,718 | 143,417 |
| | 42,918 | 1,719,490 | 79,930 | 2,758,701 |
| Shares repurchased | (53,517) | (2,084,385) | (130,839) | (4,564,800) |
| Net decrease | (10,599) | $(364,895) | (50,909) | $(1,806,099) |
| |
| | SIX MONTHS ENDED 2/28/21 | YEAR ENDED 8/31/20 |
| Class R6 | Shares | Amount | Shares | Amount |
| Shares sold | 16,799 | $680,219 | 32,246 | $1,143,237 |
| Shares issued in connection with | | | | |
| reinvestment of distributions | 14,293 | 598,445 | 4,294 | 169,772 |
| | 31,092 | 1,278,664 | 36,540 | 1,313,009 |
| Shares repurchased | (32,854) | (1,335,394) | (76,618) | (2,782,671) |
| Net decrease | (1,762) | $(56,730) | (40,078) | $(1,469,662) |
|
| 36 International Capital Opportunities Fund |
| | | | |
| | SIX MONTHS ENDED 2/28/21 | YEAR ENDED 8/31/20 |
| Class Y | Shares | Amount | Shares | Amount |
| Shares sold | 51,542 | $2,042,431 | 247,329 | $9,127,807 |
| Shares issued in connection with | | | | |
| reinvestment of distributions | 29,107 | 1,214,935 | 10,881 | 428,941 |
| | 80,649 | 3,257,366 | 258,210 | 9,556,748 |
| Shares repurchased | (143,893) | (5,561,698) | (394,732) | (13,914,417) |
| Net decrease | (63,244) | $(2,304,332) | (136,522) | $(4,357,669) |
* Effective November 25, 2019, the fund converted all of its class M shares to class A shares and class M shares were no longer able to be purchased.
Note 5: Affiliated transactions
Transactions during the reporting period with any company which is under common ownership or control were as follows:
| | | | | |
| | | | | | Shares |
| | | | | | outstanding |
| | | | | | and fair |
| | Fair value as | Purchase | Sale | Investment | value as |
| Name of affiliate | of 8/31/20 | cost | proceeds | income | of 2/28/21 |
| Short-term investments | | | | | |
| Putnam Short Term | | | | | |
| Investment Fund* | $2,630,050 | $51,492,354 | $53,513,365 | $4,061 | $609,039 |
| Total Short-term | | | | | |
| investments | $2,630,050 | $51,492,354 | $53,513,365 | $4,061 | $609,039 |
* Management fees charged to Putnam Short Term Investment Fund have been waived by Putnam Management. There were no realized or unrealized gains or losses during the period.
Note 6: Market, credit and other risks
In the normal course of business, the fund trades financial instruments and enters into financial transactions where risk of potential loss exists due to changes in the market (market risk) or failure of the contracting party to the transaction to perform (credit risk). The fund may be exposed to additional credit risk that an institution or other entity with which the fund has unsettled or open transactions will default. Investments in foreign securities involve certain risks, including those related to economic instability, unfavorable political developments, and currency fluctuations.
Beginning in January 2020, global financial markets have experienced, and may continue to experience, significant volatility resulting from the spread of a virus known as Covid–19. The outbreak of Covid–19 has resulted in travel and border restrictions, quarantines, supply chain disruptions, lower consumer demand, and general market uncertainty. The effects of Covid–19 have adversely affected, and may continue to adversely affect, the global economy, the economies of certain nations, and individual issuers, all of which may negatively impact the fund’s performance.
Note 7: Summary of derivative activity
The volume of activity for the reporting period for any derivative type that was held during the period is listed below and was based on an average of the holdings at the end of each fiscal quarter:
| |
| Forward currency contracts (contract amount) | $273,600,000 |
|
| International Capital Opportunities Fund 37 |
The following is a summary of the fair value of derivative instruments as of the close of the reporting period:
| | | | |
| Fair value of derivative instruments as of the close of the reporting period | |
| | ASSET DERIVATIVES | LIABILITY DERIVATIVES |
| Derivatives not | | | | |
| accounted for as | Statement of | | Statement of | |
| hedging instruments | assets and | | assets and | |
| under ASC 815 | liabilities location | Fair value | liabilities location | Fair value |
| Foreign exchange | | | | |
| contracts | Receivables | $1,170,937 | Payables | $3,146,457 |
| Total | | $1,170,937 | | $3,146,457 |
The following is a summary of realized and change in unrealized gains or losses of derivative instruments in the Statement of operations for the reporting period (Note 1):
| | |
| Amount of realized gain or (loss) on derivatives recognized in net gain or (loss) on investments | |
| Derivatives not accounted for as | Forward currency | |
| hedging instruments under ASC 815 | contracts | Total |
| Foreign exchange contracts | $2,781,542 | $2,781,542 |
| Total | $2,781,542 | $2,781,542 |
| |
| Change in unrealized appreciation or (depreciation) on derivatives recognized in net gain or (loss) |
| on investments | | |
| Derivatives not accounted for as | Forward currency | |
| hedging instruments under ASC 815 | contracts | Total |
| Foreign exchange contracts | $(3,369,588) | $(3,369,588) |
| Total | $(3,369,588) | $(3,369,588) |
|
| 38 International Capital Opportunities Fund |
|
| This page left blank intentionally. |
|
| International Capital Opportunities Fund 39 |
Note 8: Offsetting of financial and derivative assets and liabilities
The following table summarizes any derivatives, repurchase agreements and reverse repurchase agreements, at the end of the reporting period, that are subject to an enforceable master netting agreement or similar agreement. For securities lending transactions or borrowing transactions associated with securities sold short, if any, see Note 1. For financial reporting purposes, the fund does not offset financial assets and financial liabilities that are subject to the master netting agreements in the Statement of assets and liabilities.
| | | | | | | | | | | | |
| | Bank of
America N. A. | Barclays Bank
PLC | Citibank, N. A. | Goldman
Sachs
International | HSBC Bank
USA, National
Association | JPMorgan
Chase Bank
N. A. | Morgan
Stanley & Co.
International
PLC | State Street
Bank and
Trust Co. | Toronto-
Dominion
Bank | UBS AG | WestPac
Banking Corp. | Total |
| Assets: | | | | | | | | | | | | |
| Forward currency contracts# | $209,141 | $161,502 | $334,135 | $31,675 | $92,509 | $3,363 | $171,591 | $53,083 | $5,751 | $96,231 | $11,956 | $1,170,937 |
| Total Assets | $209,141 | $161,502 | $334,135 | $31,675 | $92,509 | $3,363 | $171,591 | $53,083 | $5,751 | $96,231 | $11,956 | $1,170,937 |
| Liabilities: | | | | | | | | | | | | |
| Forward currency contracts# | 13,537 | 387,550 | 75,427 | 57,232 | 282,439 | 1,280,627 | 201,691 | 559,268 | 6,520 | 107,106 | 175,060 | 3,146,457 |
| Total Liabilities | $13,537 | $387,550 | $75,427 | $57,232 | $282,439 | $1,280,627 | $201,691 | $559,268 | $6,520 | $107,106 | $175,060 | $3,146,457 |
| Total Financial and Derivative | | | | | | | | | | | | |
| Net Assets | $195,604 | $(226,048) | $258,708 | $(25,557) | $(189,930) | $(1,277,264) | $(30,100) | $(506,185) | $(769) | $(10,875) | $(163,104) | $(1,975,520) |
| Total collateral received | | | | | | | | | | | | |
| (pledged)†## | $195,604 | $(226,048) | $190,000 | $(25,557) | $(131,000) | $(834,929) | $(20,998) | $(352,966) | $— | $110,000 | $— | |
| Net amount | $— | $— | $68,708 | $— | $(58,930) | $(442,335) | $(9,102) | $(153,219) | $(769) | $(120,875) | $(163,104) | |
| Controlled collateral received | | | | | | | | | | | | |
| (including TBA commitments)** | $222,262 | $— | $190,000 | $— | $— | $— | $— | $— | $— | $110,000 | $— | $522,262 |
| Uncontrolled collateral received | $— | $— | $— | $— | $— | $— | $— | $— | $— | $— | $— | $— |
| Collateral (pledged) (including | | | | | | | | | | | | |
| TBA commitments)** | $— | $(492,977) | $— | $(63,000) | $(131,000) | $(834,929) | $(20,998) | $(352,966) | $— | $— | $— | $(1,895,870) |
**Included with Investments in securities on the Statement of assets and liabilities.
† Additional collateral may be required from certain brokers based on individual agreements.
# Covered by master netting agreement (Note 1).
##Any over-collateralization of total financial and derivative net assets is not shown. Collateral may include amounts related to unsettled agreements.
| |
| 40 International Capital Opportunities Fund | International Capital Opportunities Fund 41 |
Putnam family of funds
The following is a list of Putnam’s open-end mutual funds offered to the public. Investors should carefully consider the investment objective, risks, charges, and expenses of a fund before investing. For a prospectus, or a summary prospectus if available, containing this and other information for any Putnam fund or product, contact your financial advisor or call Putnam Investor Services at 1-800-225-1581. Please read the prospectus carefully before investing.
| |
| Blend | Income |
| Emerging Markets Equity Fund | Convertible Securities Fund |
| Focused Equity Fund | Diversified Income Trust |
| Focused International Equity Fund | Floating Rate Income Fund |
| International Capital Opportunities Fund | Global Income Trust |
| International Equity Fund | Government Money Market Fund* |
| Multi-Cap Core Fund | High Yield Fund |
| Research Fund | Income Fund |
| | Money Market Fund† |
| Global Sector | Mortgage Opportunities Fund |
| Global Health Care Fund | Mortgage Securities Fund |
| Global Technology Fund | Short Duration Bond Fund |
| | Ultra Short Duration Income Fund |
| Growth | |
| Growth Opportunities Fund | Tax-free Income |
| Small Cap Growth Fund | Intermediate-Term Municipal Income Fund |
| Sustainable Future Fund | Short-Term Municipal Income Fund |
| Sustainable Leaders Fund | Strategic Intermediate Municipal Fund |
| | Tax Exempt Income Fund |
| Value | Tax-Free High Yield Fund |
| International Value Fund | |
| Large Cap Value Fund | State tax-free income funds‡: |
| Small Cap Value Fund | California, Massachusetts, Minnesota, |
| | New Jersey, New York, Ohio, and Pennsylvania. |
|
| 42 International Capital Opportunities Fund |
| |
| Absolute Return | Asset Allocation (cont.) |
| Fixed Income Absolute Return Fund | Putnam Retirement Advantage Maturity Fund |
| Multi-Asset Absolute Return Fund | Putnam Retirement Advantage 2065 Fund |
| | Putnam Retirement Advantage 2060 Fund |
| Putnam PanAgora§ | Putnam Retirement Advantage 2055 Fund |
| Putnam PanAgora Risk Parity Fund | Putnam Retirement Advantage 2050 Fund |
| | Putnam Retirement Advantage 2045 Fund |
| Asset Allocation | Putnam Retirement Advantage 2040 Fund |
| Dynamic Risk Allocation Fund | Putnam Retirement Advantage 2035 Fund |
| George Putnam Balanced Fund | Putnam Retirement Advantage 2030 Fund |
| | Putnam Retirement Advantage 2025 Fund |
| Dynamic Asset Allocation Balanced Fund | |
| Dynamic Asset Allocation Conservative Fund | RetirementReady® Maturity Fund |
| Dynamic Asset Allocation Growth Fund | RetirementReady® 2065 Fund |
| | RetirementReady® 2060 Fund |
| | RetirementReady® 2055 Fund |
| | RetirementReady® 2050 Fund |
| | RetirementReady® 2045 Fund |
| | RetirementReady® 2040 Fund |
| | RetirementReady® 2035 Fund |
| | RetirementReady® 2030 Fund |
| | RetirementReady® 2025 Fund |
* You could lose money by investing in the fund. Although the fund seeks to preserve the value of your investment at $1.00 per share, it cannot guarantee it will do so. An investment in the fund is not insured or guaranteed by the Federal Deposit Insurance Corporation or any other government agency. The fund’s sponsor has no legal obligation to provide financial support to the fund, and you should not expect that the sponsor will provide financial support to the fund at any time.
† You could lose money by investing in the fund. Although the fund seeks to preserve the value of your investment at $1.00 per share, it cannot guarantee it will do so. The fund may impose a fee upon sale of your shares or may temporarily suspend your ability to sell shares if the fund’s liquidity falls below required minimums because of market conditions or other factors. An investment in the fund is not insured or guaranteed by the Federal Deposit Insurance Corporation or any other government agency. The fund’s sponsor has no legal obligation to provide financial support to the fund, and you should not expect that the sponsor will provide financial support to the fund at any time.
‡ Not available in all states.
§ Sub-advised by PanAgora Asset Management.
Check your account balances and the most recent month-end performance in the Individual Investors section at putnam.com.
|
| International Capital Opportunities Fund 43 |
Services for shareholders
Investor services
Systematic investment plan Tell us how much you wish to invest regularly — weekly, semimonthly, or monthly — and the amount you choose will be transferred automatically from your checking or savings account. There’s no additional fee for this service, and you can suspend it at any time. This plan may be a great way to save for college expenses or to plan for your retirement.
Please note that regular investing does not guarantee a profit or protect against loss in a declining market. Before arranging a systematic investment plan, consider your financial ability to continue making purchases in periods when prices are low.
Systematic exchange You can make regular transfers from one Putnam fund to another Putnam fund. There are no additional fees for this service, and you can cancel or change your options at any time.
Dividends PLUS You can choose to have the dividend distributions from one of your Putnam funds automatically reinvested in another Putnam fund at no additional charge.
Free exchange privilege You can exchange money between Putnam funds free of charge, as long as they are the same class of shares. A signature guarantee is required if you are exchanging more than $500,000. The fund reserves the right to revise or terminate the exchange privilege.
Reinstatement privilege If you’ve sold Putnam shares or received a check for a dividend or capital gain, you may reinvest the proceeds with Putnam within 90 days of the transaction and they will be reinvested at the fund’s current net asset value — with no sales charge. However, reinstatement of class B shares may have special tax consequences. Ask your financial or tax representative for details.
Check-writing service You have ready access to many Putnam accounts. It’s as simple as writing a check, and there are no special fees or service charges. For more information about the check-writing service, call Putnam or visit our website.
Dollar cost averaging When you’re investing for long-term goals, it’s time, not timing, that counts. Investing on a systematic basis is a better strategy than trying to figure out when the markets will go up or down. This means investing the same amount of money regularly over a long period. This method of investing is called dollar cost averaging. When a fund’s share price declines, your investment dollars buy more shares at lower prices. When it increases, they buy fewer shares. Over time, you will pay a lower average price per share.
For more information
Visit the Individual Investors section at putnam.com A secure section of our website contains complete information on your account, including balances and transactions, updated daily. You may also conduct transactions, such as exchanges, additional investments, and address changes. Log on today to get your password.
Call us toll free at 1-800-225-1581 Ask a helpful Putnam representative or your financial advisor for details about any of these or other services, or see your prospectus.
|
| 44 International Capital Opportunities Fund |
Fund information
Founded over 80 years ago, Putnam Investments was built around the concept that a balance between risk and reward is the hallmark of a well-rounded financial program. We manage funds across income, value, blend, growth, sustainable, asset allocation, absolute return, and global sector categories.
| | |
| Investment Manager | Trustees | Michael J. Higgins |
| Putnam Investment | Kenneth R. Leibler, Chair | Vice President, Treasurer, |
| Management, LLC | Liaquat Ahamed | and Clerk |
| 100 Federal Street | Ravi Akhoury | |
| Boston, MA 02110 | Barbara M. Baumann | Jonathan S. Horwitz |
| | Katinka Domotorffy | Executive Vice President, |
| Investment Sub-Advisor | Catharine Bond Hill | Principal Executive Officer, |
| Putnam Investments Limited | Paul L. Joskow | and Compliance Liaison |
| 16 St James’s Street | George Putnam, III | |
| London, England SW1A 1ER | Robert L. Reynolds | Richard T. Kircher |
| | Manoj P. Singh | Vice President and BSA |
| Marketing Services | Mona K. Sutphen | Compliance Officer |
| Putnam Retail Management | | |
| 100 Federal Street | Officers | Susan G. Malloy |
| Boston, MA 02110 | Robert L. Reynolds | Vice President and |
| | President | Assistant Treasurer |
| Custodian | | |
| State Street Bank | Robert T. Burns | Denere P. Poulack |
| and Trust Company | Vice President and | Assistant Vice President, Assistant |
| | Chief Legal Officer | Clerk, and Assistant Treasurer |
| Legal Counsel | | |
| Ropes & Gray LLP | James F. Clark | Janet C. Smith |
| | Vice President, Chief Compliance | Vice President, |
| | Officer, and Chief Risk Officer | Principal Financial Officer, |
| | | Principal Accounting Officer, |
| | Nancy E. Florek | and Assistant Treasurer |
| | Vice President, Director of | |
| | Proxy Voting and Corporate | Mark C. Trenchard |
| | Governance, Assistant Clerk, | Vice President |
| | and Assistant Treasurer | |
This report is for the information of shareholders of Putnam International Capital Opportunities Fund. It may also be used as sales literature when preceded or accompanied by the current prospectus, the most recent copy of Putnam’s Quarterly Performance Summary, and Putnam’s Quarterly Ranking Summary. For more recent performance, please visit putnam.com. Investors should carefully consider the investment objectives, risks, charges, and expenses of a fund, which are described in its prospectus. For this and other information or to request a prospectus or summary prospectus, call 1-800-225-1581 toll free. Please read the prospectus carefully before investing. The fund’s Statement of Additional Information contains additional information about the fund’s Trustees and is available without charge upon request by calling 1-800-225-1581.

| |
| Item 3. Audit Committee Financial Expert: |
| |
| Item 4. Principal Accountant Fees and Services: |
| |
| Item 5. Audit Committee of Listed Registrants |
| |
| Item 6. Schedule of Investments: |
| |
| The registrant's schedule of investments in unaffiliated issuers is included in the report to shareholders in Item 1 above. |
| |
| Item 7. Disclosure of Proxy Voting Policies and Procedures For Closed-End Management Investment Companies: |
| |
| Item 8. Portfolio Managers of Closed-End Investment Companies |
| |
| Item 9. Purchases of Equity Securities by Closed-End Management Investment Companies and Affiliated Purchasers: |
| |
| Item 10. Submission of Matters to a Vote of Security Holders: |
| |
| Item 11. Controls and Procedures: |
| |
| (a) The registrant's principal executive officer and principal financial officer have concluded, based on their evaluation of the effectiveness of the design and operation of the registrant's disclosure controls and procedures as of a date within 180 days of the filing date of this report, that the design and operation of such procedures are generally effective to provide reasonable assurance that information required to be disclosed by the registrant in this report is recorded, processed, summarized and reported within the time periods specified in the Commission's rules and forms. |
| |
| (b) Changes in internal control over financial reporting: Not applicable |
| |
| Item 12. Disclosures of Securities Lending Activities for Closed-End Investment Companies: |
| |
| Pursuant to the requirements of the Securities Exchange Act of 1934 and the Investment Company Act of 1940, the registrant has duly caused this report to be signed on its behalf by the undersigned, thereunto duly authorized. |
| |
| By (Signature and Title): |
| |
| /s/ Janet C. Smith
Janet C. Smith
Principal Accounting Officer
|
| |
| Pursuant to the requirements of the Securities Exchange Act of 1934 and the Investment Company Act of 1940, this report has been signed below by the following persons on behalf of the registrant and in the capacities and on the dates indicated. |
| |
| By (Signature and Title): |
| |
| /s/ Jonathan S. Horwitz
Jonathan S. Horwitz
Principal Executive Officer
|
| |
| By (Signature and Title): |
| |
| /s/ Janet C. Smith
Janet C. Smith
Principal Financial Officer
|