| | |
| UNITED STATES
SECURITIES AND EXCHANGE COMMISSION |
| | |
| CERTIFIED SHAREHOLDER REPORT OF REGISTERED
MANAGEMENT INVESTMENT COMPANIES
|
| | |
| Investment Company Act file number: | (811-07237) |
| | |
| Exact name of registrant as specified in charter: | Putnam Investment Funds |
| | |
| Address of principal executive offices: | 100 Federal Street, Boston, Massachusetts 02110 |
| | |
| Name and address of agent for service: | Stephen Tate, Vice President
100 Federal Street
Boston, Massachusetts 02110 |
| | |
| Copy to: | Bryan Chegwidden, Esq.
Ropes & Gray LLP
1211 Avenue of the Americas
New York, New York 10036 |
| | |
| Registrant’s telephone number, including area code: | (617) 292-1000 |
| | |
| Date of fiscal year end: | February 28, 2023 |
| | |
| Date of reporting period: | March 1, 2022 – August 31, 2022 |
| | |
|
Item 1. Report to Stockholders: | |
| | |
| The following is a copy of the report transmitted to stockholders pursuant to Rule 30e-1 under the Investment Company Act of 1940: | |
Putnam
Small Cap Value
Fund
Semiannual report
8 | 31 | 22
Message from the Trustees
October 7, 2022
Dear Fellow Shareholder:
Financial markets are reminding us that the journey to long-term returns often involves weathering periods of heightened volatility. This year, stocks and bonds have experienced declines, and U.S. gross domestic product decreased slightly in the first and second quarters. Consumers and businesses have grappled with multidecade-high inflation. In response, the U.S. Federal Reserve has been raising interest rates to contain price pressures, and certain economic indicators have begun to show improvement.
While this challenging environment may test investors’ patience, you can be confident that Putnam portfolio managers are actively working for you. They are assessing risks while researching new and attractive investment opportunities for your fund.
We also would like to announce changes to the Board of Trustees. In July 2022, we welcomed Jennifer Williams Murphy and Marie Pillai as new Trustees. Both have a wealth of investment advisory and executive management experience. We also want to thank our Trustees who retired from the Board on June 30, 2022: Paul Joskow served with us since 1997, and Ravi Akhoury joined the Board in 2009. We wish them well.
Thank you for investing with Putnam.
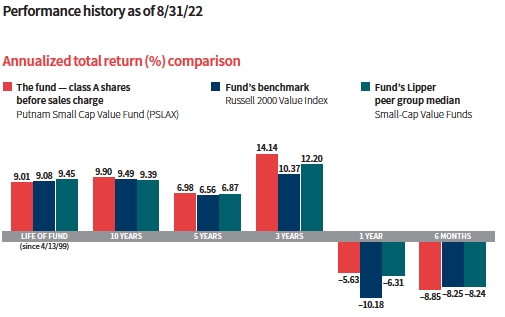
Current performance may be lower or higher than the quoted past performance, which cannot guarantee future results. Share price, principal value, and return will fluctuate, and you may have a gain or a loss when you sell your shares. Performance of class A shares assumes reinvestment of distributions and does not account for taxes. Fund returns in the bar chart do not reflect a sales charge of 5.75%; had they, returns would have been lower. See below and pages 8–9 for additional performance information. For a portion of the periods, the fund had expense limitations, without which returns would have been lower. To obtain the most recent month-end performance, visit putnam.com.
Returns for periods of less than one year are not annualized.
Lipper peer group median is provided by Lipper, a Refinitiv company.
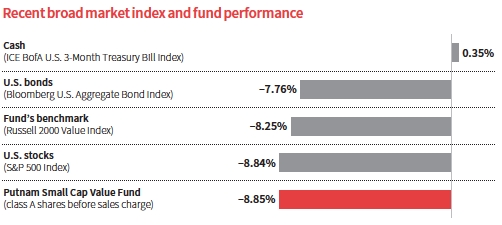
This comparison shows your fund’s performance in the context of broad market indexes for the six months ended 8/31/22. See above and pages 8–9 for additional fund performance information. Index descriptions can be found on pages 13–14.
All Bloomberg indices are provided by Bloomberg Index Services Limited.


How was the market environment for U.S. small-cap stocks during the six months ended August 31, 2022?
Small-cap value stocks, along with the broader equity markets, faced a difficult market environment. The Russia-Ukraine War contributed to geopolitical uncertainty and raised concerns about soaring energy prices and the impact of sanctions on economic growth. Supply chain disruptions, food shortages, a tight labor market, and Covid-19 lockdowns in China intensified inflationary pressures.
To address the persistently high inflation, the Federal Reserve raised its benchmark short-term rate four times during the six-month period, from 0.00%–0.25% to 2.25%–2.50%. Yields on U.S. Treasuries underwent a substantial adjustment due to the Fed’s actions and market expectations. Investors feared the Fed’s aggressive interest-rate tightening might tip the U.S. economy into a recession. Corporate earnings outlooks declined for many companies. The technology sector, along with other growth-oriented companies, were especially hard hit by concerns about the Fed’s interest-rate hikes. As a result, value stocks outperformed growth stocks for the period.
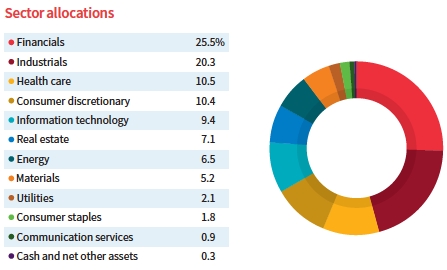
Allocations are shown as a percentage of the fund’s net assets as of 8/31/22. Cash and net other assets, if any, represent the market value weights of cash, derivatives, short-term securities, and other unclassified assets in the portfolio. Summary information may differ from the portfolio schedule included in the financial statements due to the inclusion of derivative securities, any interest accruals, the exclusion of as-of trades, if any, the use of different classifications of securities for presentation purposes, and rounding. Holdings and allocations may vary over time.
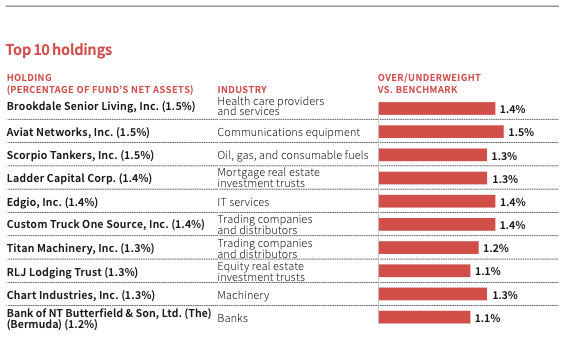
This table shows the fund’s top 10 holdings by percentage of the fund’s net assets as of 8/31/22. Short-term investments and derivatives, if any, are excluded. Holdings may vary over time.
Nine of the eleven sectors comprising the Russell 2000 Value Index [the fund’s benchmark] posted negative results, led by communication services [–26.12%] and consumer discretionary [–17.20%]. Only energy [20.82%] and utilities [2.91%] delivered positive results.
How did the fund perform in this environment?
The fund underperformed its benchmark and the return of the median fund ranked within its Lipper peer group of small-cap value funds. Sector positioning results detracted from relative performance, especially the fund’s underweight positioning in energy and utilities. Following the economic sanctions imposed on Russia, energy prices soared amid a supply shock driven by the drop in exported Russian oil. Utilities saw increased investor interest amid the macroeconomic uncertainty. They tend to exhibit lower volatility during economic downturns and provide a predictable source of income.
Stock selection results were favorable, particularly in the capital goods and transportation sectors.
What individual holdings detracted most from performance during the reporting period?
The fund’s position in a.k.a. Brands Holding Corp., an online retailer of on-trend fashion with an emphasis on sustainability, was the top detractor for the period. As economies reopened, consumers shifted from online shopping to in-person shopping at brick-and-mortar stores. Additionally, the company saw weaker sales in Australia due to the lagging recovery from the pandemic shutdown. As a result, first-quarter 2022 earnings proved disappointing. We remain upbeat in our growth outlook for the company. Management is seeking greater efficiencies by controlling expenses and building brand awareness to improve profit margins.
Aveanna Healthcare, which provides care to high-cost patient populations, also struggled. Despite demand for its services, continued skilled nursing shortages and ongoing inflationary wage pressures weighed on profits. We continue to like Aveanna’s platform, especially its services for pediatric patients, and believe the company will regain its footing once labor headwinds subside.
Argo Group International, an underwriter of specialty insurance products in the U.S. property and casualty market, weighed on performance as well. The company faced significant claims, which hurt its operating results. Management has announced steps to better position the company for continued growth and enhanced shareholder value. We continue to hold the stock.
What holdings made the most significant contributions?
The fund’s top-performing holding was Scorpio Tankers, a company that leases tanker vessels for transporting refined petroleum products. Following Russia’s invasion of Ukraine, we acquired the stock believing a rearrangement of world energy flows would increase tanker ton-miles and lead to improved pricing. Our thesis proved correct, and the stock was one of the fund’s largest holdings at period-end after its strong rally.
Lantheus Holdings, a provider of innovative diagnostic imaging agents, targeted therapeutics, and artificial intelligence [AI] solutions, was another notable contributor. Lantheus announced a collaboration with Novartis to include its Pylarify imaging agent in prostate cancer clinical trials. Pylarify, which was
approved by the FDA in May 2021, is the first commercially available imaging agent for the detection of suspected recurrent or meta-static prostate cancer. Lantheus’s ultrasound enhancing agent for patients with suboptimal echocardiograms has also been well received. The stock was further supported by the company’s announcement that revenue in the second quarter of 2022 increased dramatically from the prior year.
The fund’s position in Super Micro Computer, which makes server and storage systems for data centers and cloud companies, also proved rewarding. While many areas of the tech economy are experiencing slowing growth, data centers have prospered amid the boom in digital activity. The company is an overlooked and undervalued supplier of data center equipment, in our view, and has been gaining market share from larger competitors.
Were there any significant changes in the fund’s strategy during the period?
Broadly speaking, we shifted the portfolio toward a more neutral stance given deteriorating supply chain issues and the more hawkish tone from the Fed. We reduced the fund’s exposure to pure value stocks that had a tilt toward lower valuations compared with other characteristics. At the same time, we increased investments in companies with stronger earnings outlooks. Given the macroeconomic and geopolitical backdrop, we believe taking some defensive steps is prudent.
In June 2022, the fund’s benchmark was rebalanced as part of an annual process to ensure that the index accurately reflects the small-cap market that it represents. As a result of the rebalancing, the fund’s exposure to energy became slightly overweight relative to the benchmark. The benchmark’s exposure to basic materials declined, and we reduced the fund’s exposure further to an underweight positioning. Finally, the benchmark’s exposure to capital goods also declined. However, we maintained the fund’s positioning as an overweight allocation. We believe the sector’s profitability will benefit as price increases enacted earlier [in response to higher input costs] take hold at the same time companies begin to get relief on commodity costs. This should positively affect company profit margins, in our view.
Outside of the benchmark’s repositioning, we looked for opportunities to add positions in biotechnology after a period of strong underperformance. As part of this strategy, we

This table shows the fund’s largest allocation shifts, by percentage, over the past six months. Allocations are shown as a percentage of the fund’s net assets. Current period summary information may differ from the portfolio schedule included in the financial statements due to the inclusion of derivative securities, any interest accruals, the exclusion of as-of trades, if any, the use of different classifications of securities for presentation purposes, and rounding. Holdings and allocations may vary over time.
increased the fund’s exposure to biotechnology companies, with investments in companies such as ImmunoGen.
What is your outlook for the coming months?
We believe the U.S. economy retains enough momentum to avoid a recession in 2022, but we have lower confidence about 2023. Today, consumer balance sheets remain relatively strong, and labor markets are robust, in our view. Growth in 2023 becomes more difficult to assess due to conflicting information from economic indicators and how that data could affect the number and degree of future interest-rate increases from the Fed. If the Fed continues its current expected course, the odds of a recession in 2023 increase significantly, in our view.
Thank you, Mike, for sharing this update about the fund.
The views expressed in this report are exclusively those of Putnam Management and are subject to change. They are not meant as investment advice.
Please note that the holdings discussed in this report may not have been held by the fund for the entire period. Portfolio composition is subject to review in accordance with the fund’s investment strategy and may vary in the future. Current and future portfolio holdings are subject to risk. Statements in the Q&A concerning the fund’s performance or portfolio composition relative to those of the fund’s Lipper peer group may reference information produced by Lipper Inc. or through a third party.
Your fund’s performance
This section shows your fund’s performance, price, and distribution information for periods ended August 31, 2022, the end of the first half of its current fiscal year. In accordance with regulatory requirements for mutual funds, we also include performance information as of the most recent calendar quarter-end and expense information taken from the fund’s current prospectus. Performance should always be considered in light of a fund’s investment strategy. Data represent past performance. Past performance does not guarantee future results. More recent returns may be less or more than those shown. Investment return and principal value will fluctuate, and you may have a gain or a loss when you sell your shares. Performance information does not reflect any deduction for taxes a shareholder may owe on fund distributions or on the redemption of fund shares. For the most recent month-end performance, please visit the Individual Investors section at putnam.com or call Putnam at 1-800-225-1581. Class R, R6, and Y shares are not available to all investors. See the Terms and definitions section in this report for definitions of the share classes offered by your fund.
Annualized fund performance Total return for periods ended 8/31/22
| | | | | | |
| | Life of fund | 10 years | 5 years | 3 years | 1 year | 6 months |
| Class A (4/13/99) | | | | | | |
| Before sales charge | 9.01% | 9.90% | 6.98% | 14.14% | –5.63% | –8.85% |
| After sales charge | 8.74 | 9.25 | 5.73 | 11.91 | –11.06 | –14.09 |
| Class B (5/3/99) | | | | | | |
| Before CDSC | 8.81 | 9.40 | 6.19 | 13.27 | –6.26 | –9.14 |
| After CDSC | 8.81 | 9.40 | 5.97 | 12.49 | –10.94 | –13.68 |
| Class C (7/26/99) | | | | | | |
| Before CDSC | 8.74 | 9.23 | 6.20 | 13.31 | –6.31 | –9.14 |
| After CDSC | 8.74 | 9.23 | 6.20 | 13.31 | –7.25 | –10.05 |
| Class R (3/30/07) | | | | | | |
| Net asset value | 8.75 | 9.62 | 6.73 | 13.89 | –5.81 | –8.92 |
| Class R6 (11/1/13) | | | | | | |
| Net asset value | 9.34 | 10.32 | 7.44 | 14.61 | –5.25 | –8.65 |
| Class Y (1/3/01) | | | | | | |
| Net asset value | 9.27 | 10.16 | 7.26 | 14.42 | –5.33 | –8.68 |
Current performance may be lower or higher than the quoted past performance, which cannot guarantee future results. After-sales-charge returns for class A shares reflect the deduction of the maximum 5.75% sales charge levied at the time of purchase. Class B share returns after contingent deferred sales charge (CDSC) reflect the applicable CDSC, which is 5% in the first year, declining over time to 1% in the sixth year, and is eliminated thereafter. Class C share returns after CDSC reflect a 1% CDSC for the first year that is eliminated thereafter. Class R, R6, and Y shares have no initial sales charge or CDSC. Performance for class B, C, R, and Y shares before their inception is derived from the historical performance of class A shares, adjusted for the applicable sales charge (or CDSC) and the higher operating expenses for such shares, except for class Y shares, for which 12b-1 fees are not applicable. Performance for class R6 shares prior to their inception is derived from the historical performance of class Y shares and has not been adjusted for the lower investor servicing fees applicable to class R6 shares; had it, returns would have been higher.
Returns for periods of less than one year are not annualized.
For a portion of the periods, the fund had expense limitations, without which returns would have been lower.
Class B share performance reflects conversion to class A shares after six years.
Class C share performance reflects conversion to class A shares after eight years.
Comparative annualized index returns For periods ended 8/31/22
| | | | | | |
| | Life of fund | 10 years | 5 years | 3 years | 1 year | 6 months |
| Russell 2000 Value Index | 9.08% | 9.49% | 6.56% | 10.37% | –10.18% | –8.25% |
| Lipper Small-Cap Value | | | | | | |
| Funds category median* | 9.45 | 9.39 | 6.87 | 12.20 | –6.31 | –8.24 |
Returns for periods of less than one year are not annualized.
Index and Lipper results should be compared with fund performance before sales charge, before CDSC, or at net asset value.
Lipper peer group median is provided by Lipper, a Refinitiv company.
* Over the 6-month, 1-year, 3-year, 5-year, 10-year, and life-of-fund periods ended 8/31/22, there were 203, 196, 181, 172, 131, and 36 funds, respectively, in this Lipper category.
Fund price and distribution information For the six-month period ended 8/31/22
| | | | | | | |
| Distributions | Class A | Class B | Class C | Class R | Class R6 | Class Y |
| | Before | After | Net | Net | Net | Net | Net |
| | sales | sales | asset | asset | asset | asset | asset |
| Share value | charge | charge | value | value | value | value | value |
| 2/28/22 | $15.59 | $16.54 | $11.38 | $11.27 | $15.14 | $16.65 | $16.59 |
| 8/31/22 | 14.21 | 15.08 | 10.34 | 10.24 | 13.79 | 15.21 | 15.15 |
The classification of distributions, if any, is an estimate. Before-sales-charge share value and current dividend rate for class A shares, if applicable, do not take into account any sales charge levied at the time of purchase. After-sales-charge share value, current dividend rate, and current 30-day SEC yield, if applicable, are calculated assuming that the maximum sales charge (5.75% for class A shares) was levied at the time of purchase. Final distribution information will appear on your year-end tax forms.
The fund made no distributions during the period.
Annualized fund performance as of most recent calendar quarter
Total return for periods ended 9/30/22
| | | | | | |
| | Life of fund | 10 years | 5 years | 3 years | 1 year | 6 months |
| Class A (4/13/99) | | | | | | |
| Before sales charge | 8.47% | 8.40% | 3.47% | 8.23% | –15.81% | –20.20% |
| After sales charge | 8.20 | 7.76 | 2.25 | 6.11 | –20.65 | –24.79 |
| Class B (5/3/99) | | | | | | |
| Before CDSC | 8.26 | 7.91 | 2.67 | 7.40 | –16.53 | –20.55 |
| After CDSC | 8.26 | 7.91 | 2.45 | 6.53 | –20.70 | –24.52 |
| Class C (7/26/99) | | | | | | |
| Before CDSC | 8.20 | 7.73 | 2.71 | 7.41 | –16.42 | –20.49 |
| After CDSC | 8.20 | 7.73 | 2.71 | 7.41 | –17.26 | –21.28 |
| Class R (3/30/07) | | | | | | |
| Net asset value | 8.20 | 8.13 | 3.22 | 7.96 | –16.00 | –20.28 |
| Class R6 (11/1/13) | | | | | | |
| Net asset value | 8.79 | 8.82 | 3.89 | 8.64 | –15.54 | –20.08 |
| Class Y (1/3/01) | | | | | | |
| Net asset value | 8.72 | 8.66 | 3.72 | 8.49 | –15.58 | –20.09 |
See the discussion following the fund performance table on page 8 for information about the calculation of fund performance.
Returns for periods of less than one year are not annualized.
Your fund’s expenses
As a mutual fund investor, you pay ongoing expenses, such as management fees, distribution fees (12b-1 fees), and other expenses. Using the following information, you can estimate how these expenses affect your investment and compare them with the expenses of other funds. You may also pay one-time transaction expenses, including sales charges (loads) and redemption fees, which are not shown in this section and would have resulted in higher total expenses. For more information, see your fund’s prospectus or talk to your financial representative.
Expense ratios
| | | | | | |
| | Class A | Class B | Class C | Class R | Class R6 | Class Y |
| Total annual operating expenses for the | | | | | | |
| fiscal year ended 2/28/22* | 1.15% | 1.90% | 1.90% | 1.40% | 0.76% | 0.90% |
| Annualized expense ratio for the | | | | | | |
| six-month period ended 8/31/22† | 1.17% | 1.92% | 1.92% | 1.42% | 0.78% | 0.92% |
Fiscal year expense information in this table is taken from the most recent prospectus, is subject to change, and may differ from that shown for the annualized expense ratio and in the financial highlights of this report.
Expenses are shown as a percentage of average net assets.
* Restated to reflect current fees.
† Includes one-time annualized proxy cost of 0.01%.
Expenses per $1,000
The following table shows the expenses you would have paid on a $1,000 investment in each class of the fund from 3/1/22 to 8/31/22. It also shows how much a $1,000 investment would be worth at the close of the period, assuming actual returns and expenses.
| | | | | | |
| | Class A | Class B | Class C | Class R | Class R6 | Class Y |
| Expenses paid per $1,000*† | $5.64 | $9.24 | $9.24 | $6.84 | $3.76 | $4.44 |
| Ending value (after expenses) | $911.50 | $908.60 | $908.60 | $910.80 | $913.50 | $913.20 |
* Expenses for each share class are calculated using the fund’s annualized expense ratio for each class, which represents the ongoing expenses as a percentage of average net assets for the six months ended 8/31/22. The expense ratio may differ for each share class.
† Expenses are calculated by multiplying the expense ratio by the average account value for the period; then multiplying the result by the number of days in the period (184); and then dividing that result by the number of days in the year (365).
Estimate the expenses you paid
To estimate the ongoing expenses you paid for the six months ended 8/31/22, use the following calculation method. To find the value of your investment on 3/1/22, call Putnam at 1-800-225-1581.

Compare expenses using the SEC’s method
The Securities and Exchange Commission (SEC) has established guidelines to help investors assess fund expenses. Per these guidelines, the following table shows your fund’s expenses based on a $1,000 investment, assuming a hypothetical 5% annualized return. You can use this information to compare the ongoing expenses (but not transaction expenses or total costs) of investing in the fund with those of other funds. All mutual fund shareholder reports will provide this information to help you make this comparison. Please note that you cannot use this information to estimate your actual ending account balance and expenses paid during the period.
| | | | | | |
| | Class A | Class B | Class C | Class R | Class R6 | Class Y |
| Expenses paid per $1,000*† | $5.96 | $9.75 | $9.75 | $7.22 | $3.97 | $4.69 |
| Ending value (after expenses) | $1,019.31 | $1,015.53 | $1,015.53 | $1,018.05 | $1,021.27 | $1,020.57 |
* Expenses for each share class are calculated using the fund’s annualized expense ratio for each class, which represents the ongoing expenses as a percentage of average net assets for the six months ended 8/31/22. The expense ratio may differ for each share class.
† Expenses are calculated by multiplying the expense ratio by the average account value for the six-month period; then multiplying the result by the number of days in the six-month period (184); and then dividing that result by the number of days in the year (365).
Consider these risks before investing
Investments in small and/or midsize companies increase the risk of greater price fluctuations. Value stocks may fail to rebound, and the market may not favor value-style investing.
The value of investments in the fund’s portfolio may fall or fail to rise over extended periods of time for a variety of reasons, including general economic, political, or financial market conditions; investor sentiment and market perceptions; government actions; geopolitical events or changes; and factors related to a specific issuer, geography, industry, or sector. These and other factors may lead to increased volatility and reduced liquidity in the fund’s portfolio holdings. These risks are generally greater for small and midsize companies. From time to time, the fund may invest a significant portion of its assets in companies in one or more related industries or sectors, which would make the fund more vulnerable to adverse developments affecting those industries or sectors.
Our investment techniques, analyses, and judgments may not produce the outcome we intend. The investments we select for the fund may not perform as well as other securities that we do not select for the fund. We, or the fund’s other service providers, may experience disruptions or operating errors that could have a negative effect on the fund. You can lose money by investing in the fund.
Terms and definitions
Important terms
Total return shows how the value of the fund’s shares changed over time, assuming you held the shares through the entire period and reinvested all distributions in the fund.
Before sales charge, or net asset value, is the price, or value, of one share of a mutual fund, without a sales charge. Before-sales-charge figures fluctuate with market conditions. They are calculated by dividing the net assets of each class of shares by the number of outstanding shares in the class.
After sales charge is the price of a mutual fund share plus the maximum sales charge levied at the time of purchase. After-sales-charge performance figures shown here assume the 5.75% maximum sales charge for class A shares.
Contingent deferred sales charge (CDSC) is generally a charge applied at the time of the redemption of class B or C shares and assumes redemption at the end of the period. Your fund’s class B CDSC declines over time from a 5% maximum during the first year to 1% during the sixth year. After the sixth year, the CDSC no longer applies. The CDSC for class C shares is 1% for one year after purchase.
Share classes
Class A shares are generally subject to an initial sales charge and no CDSC (except on certain redemptions of shares bought without an initial sales charge).
Class B shares are closed to new investments and are only available by exchange from class B shares of another Putnam fund or through dividend and/or capital gains reinvestment. They are not subject to an initial sales charge and may be subject to a CDSC.
Class C shares are not subject to an initial sales charge and are subject to a CDSC only if the shares are redeemed during the first year.
Class R shares are not subject to an initial sales charge or CDSC and are only available to employer-sponsored retirement plans.
Class R6 shares are not subject to an initial sales charge or CDSC and carry no 12b-1 fee. They are generally only available to employer-sponsored retirement plans, corporate and institutional clients, and clients in other approved programs.
Class Y shares are not subject to an initial sales charge or CDSC and carry no 12b-1 fee. They are generally only available to corporate and institutional clients and clients in other approved programs.
Comparative indexes
Bloomberg U.S. Aggregate Bond Index is an unmanaged index of U.S. investment-grade fixed income securities.
ICE BofA (Intercontinental Exchange Bank of America) U.S. 3-Month Treasury Bill Index is an unmanaged index that seeks to measure the performance of U.S. Treasury bills available in the marketplace.
Russell 2000® Value Index is an unmanaged index of those companies in the small-cap Russell 2000 Index chosen for their value orientation.
S&P 500® Index is an unmanaged index of common stock performance.
Indexes assume reinvestment of all distributions and do not account for fees. Securities and performance of a fund and an index will differ. You cannot invest directly in an index.
BLOOMBERG® is a trademark and service mark of Bloomberg Finance L.P. and its affiliates (collectively “Bloomberg”). Bloomberg or Bloomberg’s licensors own all proprietary rights in the Bloomberg Indices. Neither Bloomberg nor Bloomberg’s licensors approve or endorse this material, or guarantee the accuracy or completeness of any information herein, or make any warranty, express or implied, as to the results to be obtained therefrom, and to the maximum extent allowed
by law, neither shall have any liability or responsibility for injury or damages arising in connection therewith.
Frank Russell Company is the source and owner of the trademarks, service marks, and copyrights related to the Russell Indexes. Russell® is a trademark of Frank Russell Company.
ICE Data Indices, LLC (“ICE BofA”), used with permission. ICE BofA permits use of the ICE BofA indices and related data on an “as is” basis; makes no warranties regarding same; does not guarantee the suitability, quality, accuracy, timeliness, and/or completeness of the ICE BofA indices or any data included in, related to, or derived therefrom; assumes no liability in connection with the use of the foregoing; and does not sponsor, endorse, or recommend Putnam Investments, or any of its products or services.
Lipper, a Refinitiv company, is a third-party industry-ranking entity that ranks mutual funds. Its rankings do not reflect sales charges. Lipper rankings are based on total return at net asset value relative to other funds that have similar current investment styles or objectives as determined by Lipper. Lipper may change a fund’s category assignment at its discretion. Lipper category medians reflect performance trends for funds within a category.
Other information for shareholders
Proxy voting
Putnam is committed to managing our mutual funds in the best interests of our shareholders. The Putnam funds’ proxy voting guidelines and procedures, as well as information regarding how your fund voted proxies relating to portfolio securities during the 12-month period ended June 30, 2022, are available in the Individual Investors section of putnam.com and on the SEC’s website, www.sec.gov. If you have questions about finding forms on the SEC’s website, you may call the SEC at 1-800-SEC-0330. You may also obtain the Putnam funds’ proxy voting guidelines and procedures at no charge by calling Putnam’s Shareholder Services at 1-800-225-1581.
Fund portfolio holdings
The fund will file a complete schedule of its portfolio holdings with the SEC for the first and third quarters of each fiscal year on Form N-PORT within 60 days of the end of such fiscal quarter. Shareholders may obtain the fund’s Form N-PORT on the SEC’s website at www.sec.gov.
Prior to its use of Form N-PORT, the fund filed its complete schedule of its portfolio holdings with the SEC on Form N-Q, which is available online at www.sec.gov.
Trustee and employee fund ownership
Putnam employees and members of the Board of Trustees place their faith, confidence, and, most importantly, investment dollars in Putnam mutual funds. As of August 31, 2022, Putnam employees had approximately $463,000,000 and the Trustees had approximately $63,000,000 invested in Putnam mutual funds. These amounts include investments by the Trustees’ and employees’ immediate family members as well as investments through retirement and deferred compensation plans.
Liquidity risk management program
Putnam, as the administrator of the fund’s liquidity risk management program (appointed by the Board of Trustees), presented the most recent annual report on the program to the Trustees in April 2022. The report covered the structure of the program, including the program documents and related policies and procedures adopted to comply with Rule 22e-4 under the Investment Company Act of 1940, and reviewed the operation of the program from January 2021 through December 2021. The report included a description of the annual liquidity assessment of the fund that Putnam performed in November 2021. The report noted that there were no material compliance exceptions identified under Rule 22e-4 during the period. The report included a review of the governance of the program and the methodology for classification of the fund’s investments. The report also included a discussion of liquidity monitoring during the period, including during the market liquidity challenges caused by the Covid-19 pandemic, and the impact those challenges had on the liquidity of the fund’s investments. Putnam concluded that the program has been operating effectively and adequately to ensure compliance with Rule 22e-4.
Trustee approval of management contract
General conclusions
The Board of Trustees of The Putnam Funds oversees the management of each fund and, as required by law, determines annually whether to approve the continuance of your fund’s management contract with Putnam Investment Management, LLC (“Putnam Management”) and the sub-management contract with respect to your fund between Putnam Management and its affiliate, Putnam Investments Limited (“PIL”). The Board, with the assistance of its Contract Committee, requests and evaluates all information it deems reasonably necessary under the circumstances in connection with its annual contract review. The Contract Committee consists solely of Trustees who are not “interested persons” (as this term is defined in the Investment Company Act of 1940, as amended (the “1940 Act”)) of The Putnam Funds (“Independent Trustees”).
At the outset of the review process, members of the Board’s independent staff and independent legal counsel considered any possible changes to the annual contract review materials furnished to the Contract Committee during the course of the previous year’s review and, as applicable, identified those changes to Putnam Management. Following these discussions and in consultation with the Contract Committee, the Independent Trustees’ independent legal counsel requested that Putnam Management and its affiliates furnish specified information, together with any additional information that Putnam Management considered relevant, to the Contract Committee. Over the course of several months ending in June 2022, the Contract Committee met on a number of occasions with representatives of Putnam Management, and separately in executive session, to consider the information that Putnam Management provided. Throughout this process, the Contract Committee was assisted by the members of the Board’s independent staff and by independent legal counsel for The Putnam Funds and the Independent Trustees.
In May 2022, the Contract Committee met in executive session to discuss and consider its recommendations with respect to the continuance of the contracts. At the Trustees’ June 2022 meeting, the Contract Committee met in executive session with the other Independent Trustees to review a summary of the key financial, performance and other data that the Contract Committee considered in the course of its review. The Contract Committee then presented its written report, which summarized the key factors that the Committee had considered and set forth its recommendations. The Contract Committee recommended, and the Independent Trustees approved, the continuance of your fund’s management contract and the approval of your fund’s amended and restated sub-management contract, effective July 1, 2022. (Because PIL is an affiliate of Putnam Management and Putnam Management remains fully responsible for all services provided by PIL, the Trustees have not attempted to evaluate PIL as a separate entity, and all subsequent references to Putnam Management below should be deemed to include reference to PIL as necessary or appropriate in the context.)
The Independent Trustees’ approval was based on the following conclusions:
• That the fee schedule in effect for your fund represented reasonable compensation in light of the nature and quality of the services being provided to the fund, the fees paid by competitive funds, the costs incurred by Putnam Management in providing services to the fund and the application of certain reductions and waivers noted below; and
• That the fee schedule in effect for your fund represented an appropriate sharing between fund shareholders and Putnam Management of any economies of scale as may exist in the management of the fund at current asset levels.
These conclusions were based on a comprehensive consideration of all information provided to the Trustees and were not the result of any single factor. Some of the factors that figured particularly in the Trustees’ deliberations and how the Trustees considered these factors are described below, although individual Trustees may have evaluated the information presented differently, giving different weights to various factors. It is also important to recognize that the management arrangements for your fund and the other Putnam funds are the result of many years of review and discussion between the Independent Trustees and Putnam Management, that some aspects of the arrangements may receive greater scrutiny in some years than others and that the Trustees’ conclusions may be based, in part, on their consideration of fee arrangements in previous years. For example,
with certain exceptions primarily involving newer or repositioned funds, the current fee arrangements under the vast majority of the funds’ management contracts were first implemented at the beginning of 2010 following extensive review by the Contract Committee and discussions with representatives of Putnam Management, as well as approval by shareholders.
Management fee schedules and total expenses
The Trustees reviewed the management fee schedules in effect for all Putnam funds, including fee levels and breakpoints. Under its management contract, your fund has the benefit of breakpoints in its management fee schedule that provide shareholders with reduced fee levels as assets under management in the Putnam family of funds increase. The Trustees also reviewed the total expenses of each Putnam fund, recognizing that in most cases management fees represented the major, but not the sole, determinant of total costs to fund shareholders. (Two funds have implemented so-called “all-in” management fees covering substantially all routine fund operating costs.) The Trustees considered that the proposed amended and restated sub-management contract would lower the sub-management fees paid by Putnam Management to PIL.
In reviewing fees and expenses, the Trustees generally focus their attention on material changes in circumstances — for example, changes in assets under management, changes in a fund’s investment strategy, changes in Putnam Management’s operating costs or profitability, or changes in competitive practices in the mutual fund industry — that suggest that consideration of fee changes might be warranted. The Trustees concluded that the circumstances did not indicate that changes to the management fee schedule for your fund would be appropriate at this time.
As in the past, the Trustees also focused on the competitiveness of each fund’s total expense ratio. The Trustees and Putnam Management and the funds’ investor servicing agent, Putnam Investor Services, Inc. (“PSERV”), have implemented expense limitations that were in effect during your fund’s fiscal year ending in 2021. These expense limitations were: (i) a contractual expense limitation applicable to specified open-end funds, including your fund, of 25 basis points on investor servicing fees and expenses and (ii) a contractual expense limitation applicable to specified open-end funds, including your fund, of 20 basis points on so-called “other expenses” (i.e., all expenses exclusive of management fees, distribution fees, investor servicing fees, investment-related expenses, interest, taxes, brokerage commissions, acquired fund fees and expenses and extraordinary expenses). These expense limitations attempt to maintain competitive expense levels for the funds. Most funds had sufficiently low expenses that these expense limitations were not operative during their fiscal years ending in 2021. However, in the case of your fund, the first expense limitation applied during its fiscal year ending in 2021. PSERV has agreed to maintain the first expense limitation until at least August 31, 2023 and Putnam Management has agreed to maintain the second expense limitation until at least June 30, 2023. Putnam Management and PSERV’s commitment to these expense limitation arrangements, which were intended to support an effort to have fund expenses meet competitive standards, was an important factor in the Trustees’ decision to approve the continuance of your fund’s management contract and to approve your fund’s amended and restated sub-management contract.
The Trustees reviewed comparative fee and expense information for a custom group of competitive funds selected by Broadridge Financial Solutions, Inc. (“Broadridge”). This comparative information included your fund’s percentile ranking for effective management fees and total expenses (excluding any applicable 12b-1 fees), which provides a general indication of your fund’s relative standing. In the custom peer group, your fund ranked in the first quintile in effective management fees (determined for your fund and the other funds in the custom peer group based on fund asset size and the applicable contractual management fee schedule) and in the third quintile in total expenses (excluding any applicable 12b-1 fees) as of December 31, 2021. The first quintile represents the least expensive funds and the fifth quintile the most expensive funds. The fee and expense data reported by Broadridge as of December 31, 2021 reflected the most recent fiscal year-end data available in Broadridge’s database at that time.
In connection with their review of fund management fees and total expenses, the Trustees also reviewed the costs of the services provided and the profits realized by Putnam Management and its affiliates from their contractual relationships with the funds. This information included trends in revenues, expenses and profitability of Putnam
Management and its affiliates relating to the investment management, investor servicing and distribution services provided to the funds. In this regard, the Trustees also reviewed an analysis of the revenues, expenses and profitability of Putnam Management and its affiliates, allocated on a fund-by-fund basis, with respect to the funds’ management, distribution and investor servicing contracts. For each fund, the analysis presented information about revenues, expenses and profitability for each of the agreements separately and for the agreements taken together on a combined basis. The Trustees concluded that, at current asset levels, the fee schedules in place for the Putnam funds, including the fee schedule for your fund, represented reasonable compensation for the services being provided and represented an appropriate sharing between fund shareholders and Putnam Management of any economies of scale as may exist in the management of the Putnam funds at that time.
The information examined by the Trustees in connection with their annual contract review for the Putnam funds included information regarding services provided and fees charged by Putnam Management and its affiliates to other clients, including collective investment trusts offered in the defined contribution and defined benefit retirement plan markets, sub-advised mutual funds, private funds sponsored by affiliates of Putnam Management, model-only separately managed accounts and Putnam Management’s exchange-traded funds. This information included, in cases where a product’s investment strategy corresponds with a fund’s strategy, comparisons of those fees with fees charged to the Putnam funds, as well as an assessment of the differences in the services provided to these clients as compared to the services provided to the Putnam funds. The Trustees observed that the differences in fee rates between these clients and the Putnam funds are by no means uniform when examined by individual asset sectors, suggesting that differences in the pricing of investment management services to these types of clients may reflect, among other things, historical competitive forces operating in separate marketplaces. The Trustees considered the fact that in many cases fee rates across different asset classes are higher on average for mutual funds than for other clients, and the Trustees also considered the differences between the services that Putnam Management provides to the Putnam funds and those that it provides to its other clients. The Trustees did not rely on these comparisons to any significant extent in concluding that the management fees paid by your fund are reasonable.
Investment performance
The quality of the investment process provided by Putnam Management represented a major factor in the Trustees’ evaluation of the quality of services provided by Putnam Management under your fund’s management contract. The Trustees were assisted in their review of Putnam Management’s investment process and performance by the work of the investment oversight committees of the Trustees and the full Board of Trustees, which meet on a regular basis with individual portfolio managers and with senior management of Putnam Management’s Investment Division throughout the year. The Trustees concluded that Putnam Management generally provides a high-quality investment process — based on the experience and skills of the individuals assigned to the management of fund portfolios, the resources made available to them and in general Putnam Management’s ability to attract and retain high-quality personnel — but also recognized that this does not guarantee favorable investment results for every fund in every time period.
The Trustees considered that, in the aggregate, the Putnam funds’ performance was generally solid in 2021 against a backdrop of strong U.S. economic and financial market growth. The Trustees considered Putnam Management’s observation that, despite an environment of generally strong growth, there had been various headwinds experienced in 2021. For the one-year period ended December 31, 2021, the Trustees noted that the Putnam funds, on an asset-weighted basis, ranked in the 52nd percentile of their peers as determined by Lipper Inc. (“Lipper”) and, on an asset-weighted-basis, delivered a gross return that trailed their benchmarks by 0.1%. Over the longer-term, the Committee noted that, on an asset-weighted basis, the Putnam funds delivered strong aggregate performance relative to their Lipper peers over the three-, five- and ten-year periods ended December 31, 2021, ranking in the 31st, 29th and 21st percentiles, respectively, and that the funds, in the aggregate, outperformed their benchmarks on a gross basis for each of those periods.
In addition to the performance of the individual Putnam funds, the Trustees considered, as they had in prior years, the performance of The Putnam Fund complex versus competitor fund complexes.
In particular, the Trustees considered The Putnam Fund complex’s performance as reported in the Barron’s/Lipper Fund Families survey (the “Survey”), which ranks mutual fund companies based on their performance across a variety of asset types. The Trustees noted that The Putnam Fund complex continued to rank highly in the Survey, especially over the longer-term, with The Putnam Funds ranking as the 6th best performing mutual fund complex out of 45 complexes for the ten-year period and 13th out of 49 complexes for the five-year period. The Trustees noted that 2021 marked the fifth consecutive year that The Putnam Funds have ranked in the top ten fund complexes for the ten-year period. The Trustees also considered that The Putnam Fund complex’s Survey performance over the one-year period was solid, with The Putnam Funds ranking 27th out of 51 complexes. In addition to the Survey, the Trustees also considered the Putnam funds’ ratings assigned by Morningstar Inc., noting that 25 of the funds were four- or five-star rated at the end of 2021 (representing a decrease of one fund year-over-year) and that this included nine funds that had achieved a five-star rating (representing an increase of two funds year-over-year). They also noted, however, the disappointing investment performance of some Putnam funds for periods ended December 31, 2021 and considered information provided by Putnam Management regarding the factors contributing to the underperformance and actions being taken to improve the performance of these particular funds. The Trustees indicated their intention to continue to monitor closely the performance of those funds and evaluate whether additional actions to address areas of underperformance may be warranted.
For purposes of the Trustees’ evaluation of the Putnam funds’ investment performance, the Trustees generally focus on a competitive industry ranking of each fund’s total net return over a one-year, three-year and five-year period. For a number of Putnam funds with relatively unique investment mandates for which Putnam Management informed the Trustees that meaningful competitive performance rankings are not considered to be available, the Trustees evaluated performance based on their total gross and net returns and comparisons of those returns to the returns of selected investment benchmarks. In the case of your fund, the Trustees considered that its class A share cumulative total return performance at net asset value was in the following quartiles of its Lipper peer group (Lipper Small-Cap Value Funds) for the one-year, three-year and five-year periods ended December 31, 2021 (the first quartile representing the best-performing funds and the fourth quartile the worst-performing funds):
| |
| One-year period | 1st |
| Three-year period | 1st |
| Five-year period | 2nd |
Over the one-year, three-year and five-year periods ended December 31, 2021, there were 234, 217 and 198 funds, respectively, in your fund’s Lipper peer group. (When considering performance information, shareholders should be mindful that past performance is not a guarantee of future results.)
The Trustees considered Putnam Management’s continued efforts to support fund performance through certain initiatives, including structuring compensation for portfolio managers to enhance accountability for fund performance, emphasizing accountability in the portfolio management process and affirming its commitment to a fundamental-driven approach to investing. The Trustees noted further that Putnam Management had made selective hires and internal promotions in 2021 to strengthen its investment team.
Brokerage and soft-dollar allocations; investor servicing
The Trustees considered various potential benefits that Putnam Management may receive in connection with the services it provides under the management contract with your fund. These include benefits related to brokerage allocation and the use of soft dollars, whereby a portion of the commissions paid by a fund for brokerage may be used to acquire research services that are expected to be useful to Putnam Management in managing the assets of the fund and of other clients. Subject to policies established by the Trustees, soft dollars generated by these means are used predominantly to acquire brokerage and research services (including third-party research and market data) that enhance Putnam Management’s investment capabilities and supplement Putnam Management’s internal research efforts. The Trustees indicated their continued intent to monitor regulatory and industry developments in this area with the assistance of their Brokerage Committee. In addition, with the assistance of their Brokerage Committee, the Trustees indicated their continued intent to monitor the
allocation of the Putnam funds’ brokerage in order to ensure that the principle of seeking best price and execution remains paramount in the portfolio trading process.
Putnam Management may also receive benefits from payments that the funds make to Putnam Management’s affiliates for investor or distribution services. In conjunction with the annual review of your fund’s management and sub-management contracts, the Trustees reviewed your fund’s investor servicing agreement with PSERV and its distributor’s contract and distribution plans with Putnam Retail Management Limited Partnership (“PRM”), both of which are affiliates of Putnam Management. The Trustees concluded that the fees payable by the funds to PSERV and PRM, as applicable, for such services are fair and reasonable in relation to the nature and quality of such services, the fees paid by competitive funds and the costs incurred by PSERV and PRM, as applicable, in providing such services. Furthermore, the Trustees were of the view that the investor services provided by PSERV were required for the operation of the funds, and that they were of a quality at least equal to those provided by other providers.
Financial statements
These sections of the report, as well as the accompanying Notes, constitute the fund’s financial statements.
The fund’s portfolio lists all the fund’s investments and their values as of the last day of the reporting period. Holdings are organized by asset type and industry sector, country, or state to show areas of concentration and diversification.
Statement of assets and liabilities shows how the fund’s net assets and share price are determined. All investment and non-investment assets are added together. Any unpaid expenses and other liabilities are subtracted from this total. The result is divided by the number of shares to determine the net asset value per share, which is calculated separately for each class of shares. (For funds with preferred shares, the amount subtracted from total assets includes the liquidation preference of preferred shares.)
Statement of operations shows the fund’s net investment gain or loss. This is done by first adding up all the fund’s earnings — from dividends and interest income — and subtracting its operating expenses to determine net investment income (or loss). Then, any net gain or loss the fund realized on the sales of its holdings — as well as any unrealized gains or losses over the period — is added to or subtracted from the net investment result to determine the fund’s net gain or loss for the fiscal period.
Statement of changes in net assets shows how the fund’s net assets were affected by the fund’s net investment gain or loss, by distributions to shareholders, and by changes in the number of the fund’s shares. It lists distributions and their sources (net investment income or realized capital gains) over the current reporting period and the most recent fiscal year-end. The distributions listed here may not match the sources listed in the Statement of operations because the distributions are determined on a tax basis and may be paid in a different period from the one in which they were earned. Dividend sources are estimated at the time of declaration. Actual results may vary. Any non-taxable return of capital cannot be determined until final tax calculations are completed after the end of the fund’s fiscal period.
Financial highlights provide an overview of the fund’s investment results, per-share distributions, expense ratios, net investment income ratios, and portfolio turnover in one summary table, reflecting the five most recent reporting periods. In a semiannual report, the highlights table also includes the current reporting period.
| | |
| The fund’s portfolio 8/31/22 (Unaudited) | | |
|
| | |
| COMMON STOCKS (99.7%)* | Shares | Value |
| Aerospace and defense (2.2%) | | |
| Maxar Technologies, Inc. | 114,900 | $2,738,067 |
| Vectrus, Inc. † | 102,720 | 3,560,275 |
| | 6,298,342 |
| Air freight and logistics (0.9%) | | |
| Radiant Logistics, Inc. † | 369,400 | 2,585,800 |
| | 2,585,800 |
| Airlines (1.0%) | | |
| Sun Country Airlines Holdings, Inc. † S | 142,695 | 2,842,484 |
| | 2,842,484 |
| Banks (19.7%) | | |
| Ameris Bancorp S | 76,900 | 3,589,692 |
| Bancorp, Inc. (The) † | 142,400 | 3,377,728 |
| Bank of NT Butterfield & Son, Ltd. (The) (Bermuda) | 112,000 | 3,653,440 |
| Coastal Financial Corp./WA † | 64,109 | 2,577,182 |
| ConnectOne Bancorp, Inc. | 104,824 | 2,623,745 |
| CrossFirst Bankshares, Inc. † S | 220,500 | 2,906,190 |
| Eastern Bankshares, Inc. | 158,400 | 3,072,960 |
| Equity Bancshares, Inc. Class A | 86,100 | 2,688,903 |
| First Foundation, Inc. | 139,997 | 2,654,343 |
| Five Star Bancorp | 98,742 | 2,511,009 |
| Lakeland Bancorp, Inc. | 189,300 | 3,083,697 |
| Metropolitan Bank Holding Corp. † | 32,156 | 2,302,048 |
| OFG Bancorp (Puerto Rico) | 133,500 | 3,631,200 |
| Origin Bancorp, Inc. | 62,200 | 2,540,870 |
| Preferred Bank/Los Angeles CA | 42,800 | 2,903,552 |
| Premier Financial Corp. | 95,237 | 2,573,304 |
| QCR Holdings, Inc. S | 45,591 | 2,546,257 |
| Southern First Bancshares, Inc. † | 32,146 | 1,385,814 |
| UMB Financial Corp. | 24,300 | 2,174,121 |
| Univest Financial Corp. | 114,900 | 2,849,520 |
| Veritex Holdings, Inc. | 77,200 | 2,324,492 |
| | 57,970,067 |
| Biotechnology (3.4%) | | |
| Arcus Biosciences, Inc. † S | 98,400 | 2,369,472 |
| Forma Therapeutics Holdings, Inc. † | 108,533 | 1,454,342 |
| ImmunoGen, Inc. † | 585,200 | 3,400,012 |
| Veracyte, Inc. † S | 140,300 | 2,862,120 |
| | 10,085,946 |
| Chemicals (0.5%) | | |
| Olin Corp. | 27,400 | 1,497,684 |
| | 1,497,684 |
| Commercial services and supplies (2.8%) | | |
| Aris Water Solution, Inc. Class A | 164,953 | 2,804,201 |
| Deluxe Corp. | 103,700 | 1,995,188 |
| SP Plus Corp. † | 101,500 | 3,363,710 |
| | 8,163,099 |
| | |
| COMMON STOCKS (99.7%)* cont. | Shares | Value |
| Communications equipment (2.2%) | | |
| Aviat Networks, Inc. † | 139,728 | $4,373,486 |
| Ribbon Communications, Inc. † | 606,056 | 2,127,257 |
| | 6,500,743 |
| Construction and engineering (3.0%) | | |
| APi Group Corp. † | 180,700 | 2,809,885 |
| Sterling Construction Co., Inc. † | 138,600 | 3,505,194 |
| WillScot Mobile Mini Holdings Corp. † | 64,348 | 2,582,929 |
| | 8,898,008 |
| Diversified consumer services (1.2%) | | |
| Universal Technical Institute, Inc. † | 531,012 | 3,642,742 |
| | 3,642,742 |
| Electrical equipment (1.7%) | | |
| LSI Industries, Inc. | 383,734 | 2,970,101 |
| nVent Electric PLC (United Kingdom) | 59,400 | 1,957,824 |
| | 4,927,925 |
| Electronic equipment, instruments, and components (1.7%) | | |
| Celestica, Inc. (Canada) † | 261,100 | 2,694,552 |
| Jabil, Inc. | 37,511 | 2,261,913 |
| | 4,956,465 |
| Energy equipment and services (2.4%) | | |
| Liberty Energy, Inc. † | 170,300 | 2,554,500 |
| Newpark Resources, Inc. † | 724,100 | 2,085,408 |
| ProFrac Holding Corp. Class A † | 123,850 | 2,438,607 |
| | 7,078,515 |
| Entertainment (0.9%) | | |
| Lions Gate Entertainment Corp. Class A † | 267,528 | 2,635,151 |
| | 2,635,151 |
| Equity real estate investment trusts (REITs) (7.1%) | | |
| Alpine Income Property Trust, Inc. R | 146,794 | 2,664,311 |
| Apple Hospitality REIT, Inc. R | 213,700 | 3,399,967 |
| Diversified Healthcare Trust R | 1,566,929 | 2,287,716 |
| EPR Properties R | 60,400 | 2,626,796 |
| RLJ Lodging Trust R | 312,200 | 3,765,132 |
| Spirit Realty Capital, Inc. R | 76,701 | 3,133,236 |
| Xenia Hotels & Resorts, Inc. † R | 178,800 | 2,835,768 |
| | 20,712,926 |
| Food and staples retailing (1.0%) | | |
| United Natural Foods, Inc. † | 64,300 | 2,834,344 |
| | 2,834,344 |
| Gas utilities (1.0%) | | |
| ONE Gas, Inc. | 36,900 | 2,888,163 |
| | 2,888,163 |
| Health-care equipment and supplies (0.9%) | | |
| Lantheus Holdings, Inc. † | 33,200 | 2,616,160 |
| | 2,616,160 |
| Health-care providers and services (5.2%) | | |
| Acadia Healthcare Co., Inc. † | 41,287 | 3,382,644 |
| Aveanna Healthcare Holdings, Inc. † S | 841,800 | 1,532,076 |
| Brookdale Senior Living, Inc. † | 1,017,954 | 4,478,999 |
| | |
| COMMON STOCKS (99.7%)* cont. | Shares | Value |
| Health-care providers and services cont. | | |
| Option Care Health, Inc. † | 103,200 | $3,195,072 |
| RadNet, Inc. † | 136,500 | 2,742,285 |
| | 15,331,076 |
| Hotels, restaurants, and leisure (4.1%) | | |
| Chuy’s Holdings, Inc. † | 117,700 | 2,628,241 |
| Dave & Buster’s Entertainment, Inc. † | 78,200 | 3,232,788 |
| Everi Holdings, Inc. † | 185,500 | 3,431,750 |
| Penn Entertainment, Inc. † | 86,900 | 2,713,887 |
| | 12,006,666 |
| Household durables (0.9%) | | |
| Hooker Furniture Corp. | 162,600 | 2,580,462 |
| | 2,580,462 |
| Insurance (0.8%) | | |
| Argo Group International Holdings, Ltd. (Bermuda) | 88,600 | 1,739,218 |
| Heritage Insurance Holdings, Inc. | 200,439 | 529,159 |
| | 2,268,377 |
| Internet and direct marketing retail (1.9%) | | |
| a.k.a. Brands Holding Corp. † S | 871,326 | 1,812,358 |
| RumbleON, Inc. Class B † S | 165,997 | 3,627,034 |
| | 5,439,392 |
| IT Services (4.0%) | | |
| Edgio, Inc. † S | 1,110,000 | 4,084,800 |
| Hackett Group, Inc. (The) | 153,400 | 3,149,302 |
| IBEX, Ltd. † | 174,919 | 2,950,884 |
| Unisys Corp. † S | 175,541 | 1,634,287 |
| | 11,819,273 |
| Machinery (3.3%) | | |
| Chart Industries, Inc. † S | 19,300 | 3,741,498 |
| Crane Holdings Co. | 28,972 | 2,733,798 |
| Federal Signal Corp. | 77,900 | 3,105,873 |
| | 9,581,169 |
| Metals and mining (4.7%) | | |
| Alamos Gold, Inc. Class A (Canada) S | 302,800 | 2,177,132 |
| Commercial Metals Co. | 73,100 | 2,961,281 |
| Haynes International, Inc. | 85,640 | 3,399,052 |
| Major Drilling Group International, Inc. (Canada) † | 364,029 | 2,466,866 |
| Ryerson Holding Corp. | 92,332 | 2,631,462 |
| | 13,635,793 |
| Mortgage real estate investment trusts (REITs) (3.3%) | | |
| Ladder Capital Corp. R | 380,578 | 4,209,193 |
| MFA Financial, Inc. R | 214,700 | 2,346,671 |
| Rithm Capital Corp. R | 324,600 | 3,060,978 |
| | 9,616,842 |
| Multi-utilities (1.1%) | | |
| Unitil Corp. | 60,300 | 3,141,027 |
| | 3,141,027 |
| | |
| COMMON STOCKS (99.7%)* cont. | Shares | Value |
| Oil, gas, and consumable fuels (4.1%) | | |
| Brigham Minerals, Inc. Class A | 106,700 | $3,174,325 |
| CNX Resources Corp. † S | 135,100 | 2,387,217 |
| Magnolia Oil & Gas Corp. Class A S | 85,775 | 2,047,449 |
| Scorpio Tankers, Inc. S | 105,000 | 4,368,000 |
| | 11,976,991 |
| Pharmaceuticals (0.9%) | | |
| Corcept Therapeutics, Inc. † S | 103,937 | 2,683,653 |
| | 2,683,653 |
| Professional services (1.2%) | | |
| ICF International, Inc. | 35,700 | 3,625,692 |
| | 3,625,692 |
| Software (0.8%) | | |
| Verra Mobility Corp. † | 144,862 | 2,309,100 |
| | 2,309,100 |
| Specialty retail (0.7%) | | |
| Brilliant Earth Group, Inc. Class A † | 273,900 | 2,026,860 |
| | 2,026,860 |
| Technology hardware, storage, and peripherals (0.7%) | | |
| Super Micro Computer, Inc. † | 30,016 | 1,953,441 |
| | 1,953,441 |
| Textiles, apparel, and luxury goods (1.6%) | | |
| Carter’s, Inc. | 34,300 | 2,533,055 |
| Unifi, Inc. † | 188,884 | 2,145,722 |
| | 4,678,777 |
| Thrifts and mortgage finance (1.8%) | | |
| Bridgewater Bancshares, Inc. † | 151,600 | 2,604,488 |
| Walker & Dunlop, Inc. | 25,861 | 2,597,996 |
| | 5,202,484 |
| Tobacco (0.8%) | | |
| Turning Point Brands, Inc. S | 102,800 | 2,397,296 |
| | 2,397,296 |
| Trading companies and distributors (4.2%) | | |
| Custom Truck One Source, Inc. † S | 611,900 | 4,026,302 |
| Karat Packaging, Inc. † | 71,687 | 1,282,480 |
| MRC Global, Inc. † | 326,300 | 3,174,899 |
| Titan Machinery, Inc. † | 126,300 | 3,887,514 |
| | 12,371,195 |
| Total common stocks (cost $304,950,748) | $291,780,130 |
|
| | | |
| SHORT-TERM INVESTMENTS (9.5%)* | Principal amount/
shares | Value |
| Putnam Cash Collateral Pool, LLC 2.47% d | Shares | 26,559,173 | $26,559,173 |
| Putnam Short Term Investment Fund Class P 2.33% L | Shares | 1,007,352 | 1,007,352 |
| U.S. Treasury Bills 2.176%, 9/27/22 | | $129,000 | 128,788 |
| Total short-term investments (cost $27,695,326) | $27,695,313 |
|
| |
| TOTAL INVESTMENTS |
| Total investments (cost $332,646,074) | $319,475,443 |
|
| | | |
| Notes to the fund’s portfolio |
| Unless noted otherwise, the notes to the fund’s portfolio are for the close of the fund’s reporting period, which ran from March 1, 2022 through August 31, 2022 (the reporting period). Within the following notes to the portfolio, references to “Putnam Management” represent Putnam Investment Management, LLC, the fund’s manager, an indirect wholly-owned subsidiary of Putnam Investments, LLC and references to “ASC 820” represent Accounting Standards Codification 820 Fair Value Measurements and Disclosures. |
| * | Percentages indicated are based on net assets of $292,569,060. |
| † | This security is non-income-producing. |
| d | Affiliated company. See Notes 1 and 5 to the financial statements regarding securities lending. The rate quoted in the security description is the annualized 7-day yield of the fund at the close of the reporting period. |
| L | Affiliated company (Note 5). The rate quoted in the security description is the annualized 7-day yield of the fund at the close of the reporting period. |
| R | Real Estate Investment Trust. |
| S | Security on loan, in part or in entirety, at the close of the reporting period (Note 1). |
|
| ASC 820 establishes a three-level hierarchy for disclosure of fair value measurements. The valuation hierarchy is based upon the transparency of inputs to the valuation of the fund’s investments. The three levels are defined as follows: |
Level 1: Valuations based on quoted prices for identical securities in active markets.
Level 2: Valuations based on quoted prices in markets that are not active or for which all significant inputs are observable, either directly or indirectly.
Level 3: Valuations based on inputs that are unobservable and significant to the fair value measurement.
| The following is a summary of the inputs used to value the fund’s net assets as of the close of the reporting period: |
|
| | | |
| | Valuation inputs |
| Investments in securities: | Level 1 | Level 2 | Level 3 |
| Common stocks*: | | | |
| Communication services | $2,635,151 | $— | $— |
| Consumer discretionary | 30,374,899 | — | — |
| Consumer staples | 5,231,640 | — | — |
| Energy | 19,055,506 | — | — |
| Financials | 75,057,770 | — | — |
| Health care | 30,716,835 | — | — |
| Industrials | 59,293,714 | — | — |
| Information technology | 27,539,022 | — | — |
| Materials | 15,133,477 | — | — |
| Real estate | 20,712,926 | — | — |
| Utilities | 6,029,190 | — | — |
| Total common stocks | 291,780,130 | — | — |
| Short-term investments | — | 27,695,313 | — |
| Totals by level | $291,780,130 | $27,695,313 | $— |
| * Common stock classifications are presented at the sector level, which may differ from the fund’s portfolio presentation. |
The accompanying notes are an integral part of these financial statements.
Statement of assets and liabilities 8/31/22 (Unaudited)
| |
| ASSETS | |
| Investment in securities, at value, including $25,744,278 of securities on loan (Note 1): | |
| Unaffiliated issuers (identified cost $305,079,549) | $291,908,918 |
| Affiliated issuers (identified cost $27,566,525) (Note 5) | 27,566,525 |
| Cash | 645,611 |
| Dividends, interest and other receivables | 283,129 |
| Receivable for shares of the fund sold | 108,199 |
| Receivable for investments sold | 186,878 |
| Prepaid assets | 66,983 |
| Total assets | 320,766,243 |
| |
| LIABILITIES | |
| Payable for investments purchased | 809,194 |
| Payable for shares of the fund repurchased | 350,434 |
| Payable for compensation of Manager (Note 2) | 159,843 |
| Payable for custodian fees (Note 2) | 13,995 |
| Payable for investor servicing fees (Note 2) | 89,817 |
| Payable for Trustee compensation and expenses (Note 2) | 86,947 |
| Payable for administrative services (Note 2) | 1,219 |
| Payable for distribution fees (Note 2) | 71,635 |
| Collateral on securities loaned, at value (Note 1) | 26,559,173 |
| Other accrued expenses | 54,926 |
| Total liabilities | 28,197,183 |
| | |
| Net assets | $292,569,060 |
| |
| REPRESENTED BY | |
| Paid-in capital (Unlimited shares authorized) (Notes 1 and 4) | $288,027,815 |
| Total distributable earnings (Note 1) | 4,541,245 |
| Total — Representing net assets applicable to capital shares outstanding | $292,569,060 |
| |
| COMPUTATION OF NET ASSET VALUE AND OFFERING PRICE | |
| Net asset value and redemption price per class A share | |
| ($147,303,304 divided by 10,362,792 shares) | $14.21 |
| Offering price per class A share (100/94.25 of $14.21)* | $15.08 |
| Net asset value and offering price per class B share ($431,680 divided by 41,757 shares)** | $10.34 |
| Net asset value and offering price per class C share ($7,973,051 divided by 778,796 shares)** | $10.24 |
| Net asset value, offering price and redemption price per class R share | |
| ($706,495 divided by 51,236 shares) | $13.79 |
| Net asset value, offering price and redemption price per class R6 share | |
| ($23,793,878 divided by 1,564,386 shares) | $15.21 |
| Net asset value, offering price and redemption price per class Y share | |
| ($112,360,652 divided by 7,417,988 shares) | $15.15 |
*On single retail sales of less than $50,000. On sales of $50,000 or more the offering price is reduced.
**Redemption price per share is equal to net asset value less any applicable contingent deferred sales charge.
The accompanying notes are an integral part of these financial statements.
Statement of operations Six months ended 8/31/22 (Unaudited)
| |
| INVESTMENT INCOME | |
| Dividends (net of foreign tax of $6,429) | $2,447,499 |
| Interest (including interest income of $6,741 from investments in affiliated issuers) (Note 5) | 6,926 |
| Securities lending (net of expenses) (Notes 1 and 5) | 82,612 |
| Total investment income | 2,537,037 |
| |
| EXPENSES | |
| Compensation of Manager (Note 2) | 974,724 |
| Investor servicing fees (Note 2) | 278,297 |
| Custodian fees (Note 2) | 12,788 |
| Trustee compensation and expenses (Note 2) | 5,941 |
| Distribution fees (Note 2) | 243,584 |
| Administrative services (Note 2) | 3,916 |
| Other | 163,355 |
| Total expenses | 1,682,605 |
| Expense reduction (Note 2) | (360) |
| Net expenses | 1,682,245 |
| | |
| Net investment income | 854,792 |
| |
| REALIZED AND UNREALIZED GAIN (LOSS) | |
| Net realized gain (loss) on: | |
| Securities from unaffiliated issuers (Notes 1 and 3) | 24,698,028 |
| Foreign currency transactions (Note 1) | (131) |
| Written options (Note 1) | 33,776 |
| Total net realized gain | 24,731,673 |
| Change in net unrealized appreciation (depreciation) on: | |
| Securities from unaffiliated issuers | (55,661,616) |
| Total change in net unrealized depreciation | (55,661,616) |
| | |
| Net loss on investments | (30,929,943) |
| |
| Net decrease in net assets resulting from operations | $(30,075,151) |
The accompanying notes are an integral part of these financial statements.
Statement of changes in net assets
| | |
| INCREASE (DECREASE) IN NET ASSETS | Six months ended 8/31/22* | Year ended 2/28/22 |
| Operations | | |
| Net investment income | $854,792 | $592,756 |
| Net realized gain on investments | | |
| and foreign currency transactions | 24,731,673 | 45,470,515 |
| Change in net unrealized depreciation of investments | (55,661,616) | (8,335,050) |
| Net increase (decrease) in net assets resulting | | |
| from operations | (30,075,151) | 37,728,221 |
| Distributions to shareholders (Note 1): | | |
| From ordinary income | | |
| Net investment income | | |
| Class A | — | (334,067) |
| Class R6 | — | (141,095) |
| Class Y | — | (459,872) |
| Increase (decrease) from capital share transactions (Note 4) | (17,491,926) | 93,675,823 |
| Total increase (decrease) in net assets | (47,567,077) | 130,469,010 |
| |
| NET ASSETS | | |
| Beginning of period | 340,136,137 | 209,667,127 |
| End of period | $292,569,060 | $340,136,137 |
*Unaudited.
The accompanying notes are an integral part of these financial statements.
Financial highlights
(For a common share outstanding throughout the period)
| | | | | | | | | | | | | | |
| | INVESTMENT OPERATIONS | LESS DISTRIBUTIONS | RATIOS AND SUPPLEMENTAL DATA |
| | | | | | | | | | | | | Ratio of | Ratio of net | |
| | Net asset | | Net realized | | | From | | | | | | expenses | investment | |
| | value, | | and unrealized | Total from | From | net realized | From | | Net asset | Total return | Net assets, | to average | income (loss) | Portfolio |
| | beginning | Net investment | gain (loss) on | investment | net investment | gain on | return of | Total | value, end | at net asset | end of period | net assets | to average | turnover |
| Period ended | of period | income (loss)a | investments | operations | income | investments | capital | distributions | of period | value (%)b | (in thousands) | (%)c | net assets (%) | (%) |
| Class A | | | | | | | | | | | | | | |
| August 31, 2022** | $15.59 | .03 | (1.41) | (1.38) | — | — | — | — | $14.21 | (8.85)* | $147,303 | .59*e | .22* | 41* |
| February 28, 2022 | 13.29 | .02 | 2.31 | 2.33 | (.03) | — | — | (.03) | 15.59 | 17.55 | 164,411 | 1.15 | .16 | 60 |
| February 28, 2021 | 9.46 | .07 | 3.86 | 3.93 | (.06) | — | (.04) | (.10) | 13.29 | 41.80 | 136,442 | 1.26 | .73 | 113 |
| February 29, 2020 | 10.63 | .10 | (1.12) | (1.02) | (.14) | — | (.01) | (.15) | 9.46 | (9.77) | 110,135 | 1.23 | .96 | 108 |
| February 28, 2019 | 13.06 | .07 | (.56) | (.49) | (.09) | (1.79) | (.06) | (1.94) | 10.63 | (2.78) | 138,636 | 1.22 | .58 | 534 |
| February 28, 2018 | 17.69 | .03 | .50 | .53 | (.08) | (5.08) | — | (5.16) | 13.06 | 2.85 | 159,252 | 1.21 | .18 | 469 |
| Class B | | | | | | | | | | | | | | |
| August 31, 2022** | $11.38 | (.02) | (1.02) | (1.04) | — | — | — | — | $10.34 | (9.14)* | $432 | .97*e | (.16)* | 41* |
| February 28, 2022 | 9.76 | (.06) | 1.68 | 1.62 | — | — | — | — | 11.38 | 16.60 | 649 | 1.90 | (.57) | 60 |
| February 28, 2021 | 6.97 | —d | 2.84 | 2.84 | (.03) | — | (.02) | (.05) | 9.76 | 40.77 | 879 | 2.01 | .03 | 113 |
| February 29, 2020 | 7.87 | .02 | (.83) | (.81) | (.08) | — | (.01) | (.09) | 6.97 | (10.47) | 977 | 1.98 | .24 | 108 |
| February 28, 2019 | 10.21 | (.01) | (.46) | (.47) | (.05) | (1.79) | (.03) | (1.87) | 7.87 | (3.57) | 1,774 | 1.97 | (.10) | 534 |
| February 28, 2018 | 14.93 | (.08) | .44 | .36 | — | (5.08) | — | (5.08) | 10.21 | 2.21 | 2,594 | 1.96 | (.56) | 469 |
| Class C | | | | | | | | | | | | | | |
| August 31, 2022** | $11.27 | (.02) | (1.01) | (1.03) | — | — | — | — | $10.24 | (9.14)* | $7,973 | .97*e | (.16)* | 41* |
| February 28, 2022 | 9.66 | (.06) | 1.67 | 1.61 | — | — | — | — | 11.27 | 16.67 | 9,036 | 1.90 | (.58) | 60 |
| February 28, 2021 | 6.93 | (.01) | 2.81 | 2.80 | (.04) | — | (.03) | (.07) | 9.66 | 40.70 | 10,969 | 2.01 | (.11) | 113 |
| February 29, 2020 | 7.83 | .02 | (.82) | (.80) | (.09) | — | (.01) | (.10) | 6.93 | (10.43) | 6,905 | 1.98 | .22 | 108 |
| February 28, 2019 | 10.16 | (.01) | (.46) | (.47) | (.04) | (1.79) | (.03) | (1.86) | 7.83 | (3.60) | 9,845 | 1.97 | (.08) | 534 |
| February 28, 2018 | 14.88 | (.08) | .44 | .36 | — | (5.08) | — | (5.08) | 10.16 | 2.21 | 18,306 | 1.96 | (.57) | 469 |
| Class R | | | | | | | | | | | | | | |
| August 31, 2022** | $15.14 | .01 | (1.36) | (1.35) | — | — | — | — | $13.79 | (8.92)* | $706 | .72*e | .09* | 41* |
| February 28, 2022 | 12.91 | (.01) | 2.24 | 2.23 | — | — | — | — | 15.14 | 17.27 | 1,029 | 1.40 | (.08) | 60 |
| February 28, 2021 | 9.19 | .04 | 3.76 | 3.80 | (.05) | — | (.03) | (.08) | 12.91 | 41.50 | 1,015 | 1.51 | .46 | 113 |
| February 29, 2020 | 10.34 | .07 | (1.09) | (1.02) | (.12) | — | (.01) | (.13) | 9.19 | (10.02) | 734 | 1.48 | .72 | 108 |
| February 28, 2019 | 12.76 | .04 | (.55) | (.51) | (.07) | (1.79) | (.05) | (1.91) | 10.34 | (3.07) | 1,050 | 1.47 | .28 | 534 |
| February 28, 2018 | 17.40 | (.02) | .51 | .49 | (.05) | (5.08) | — | (5.13) | 12.76 | 2.64 | 1,146 | 1.46 | (.10) | 469 |
| Class R6 | | | | | | | | | | | | | | |
| August 31, 2022** | $16.65 | .07 | (1.51) | (1.44) | — | — | — | — | $15.21 | (8.65)* | $23,794 | .40*e | .42* | 41* |
| February 28, 2022 | 14.19 | .09 | 2.46 | 2.55 | (.09) | — | — | (.09) | 16.65 | 17.97 | 26,901 | .76 | .55 | 60 |
| February 28, 2021 | 10.08 | .11 | 4.14 | 4.25 | (.08) | — | (.06) | (.14) | 14.19 | 42.51 | 20,843 | .83 | 1.14 | 113 |
| February 29, 2020 | 11.32 | .16 | (1.21) | (1.05) | (.18) | — | (.01) | (.19) | 10.08 | (9.42) | 14,260 | .80 | 1.43 | 108 |
| February 28, 2019 | 13.78 | .14 | (.59) | (.45) | (.13) | (1.79) | (.09) | (2.01) | 11.32 | (2.39) | 36,574 | .79 | 1.07 | 534 |
| February 28, 2018 | 18.39 | .10 | .53 | .63 | (.16) | (5.08) | — | (5.24) | 13.78 | 3.33 | 52,510 | .79 | .59 | 469 |
See notes to financial highlights at the end of this section.
The accompanying notes are an integral part of these financial statements.
| |
| 30 Small Cap Value Fund | Small Cap Value Fund 31 |
Financial highlights cont.
| | | | | | | | | | | | | | |
| | INVESTMENT OPERATIONS | LESS DISTRIBUTIONS | RATIOS AND SUPPLEMENTAL DATA |
| | | | | | | | | | | | | Ratio of | Ratio of net | |
| | Net asset | | Net realized | | | From | | | | | | expenses | investment | |
| | value, | | and unrealized | Total from | From | net realized | From | | Net asset | Total return | Net assets, | to average | income (loss) | Portfolio |
| | beginning | Net investment | gain (loss) on | investment | net investment | gain on | return of | Total | value, end | at net asset | end of period | net assets | to average | turnover |
| Period ended | of period | income (loss)a | investments | operations | income | investments | capital | distributions | of period | value (%) b | (in thousands) | (%)c | net assets (%) | (%) |
| Class Y | | | | | | | | | | | | | | |
| August 31, 2022** | $16.59 | .05 | (1.49) | (1.44) | — | — | — | — | $15.15 | (8.68)* | $112,361 | .46*e | .34* | 41* |
| February 28, 2022 | 14.15 | .06 | 2.46 | 2.52 | (.08) | — | — | (.08) | 16.59 | 17.80 | 138,102 | .90 | .35 | 60 |
| February 28, 2021 | 10.06 | .10 | 4.11 | 4.21 | (.07) | — | (.05) | (.12) | 14.15 | 42.14 | 39,403 | 1.01 | 1.00 | 113 |
| February 29, 2020 | 11.28 | .14 | (1.19) | (1.05) | (.16) | — | (.01) | (.17) | 10.06 | (9.51) | 41,335 | .98 | 1.23 | 108 |
| February 28, 2019 | 13.74 | .12 | (.60) | (.48) | (.11) | (1.79) | (.08) | (1.98) | 11.28 | (2.66) | 79,881 | .97 | .93 | 534 |
| February 28, 2018 | 18.33 | .08 | .53 | .61 | (.12) | (5.08) | — | (5.20) | 13.74 | 3.20 | 126,302 | .96 | .45 | 469 |
* Not annualized.
** Unaudited.
a Per share net investment income (loss) has been determined on the basis of the weighted average number of shares outstanding during the period.
b Total return assumes dividend reinvestment and does not reflect the effect of sales charges.
c Includes amounts paid through expense offset and brokerage/service arrangements, if any (Note 2). Also excludes acquired fund fees, if any.
d Amount represents less than $0.01 per share.
e Includes one-time proxy cost of 0.01%.
The accompanying notes are an integral part of these financial statements.
| |
| 32 Small Cap Value Fund | Small Cap Value Fund 33 |
Notes to financial statements 8/31/22 (Unaudited)
Within the following Notes to financial statements, references to “State Street” represent State Street Bank and Trust Company, references to “the SEC” represent the Securities and Exchange Commission, references to “Putnam Management” represent Putnam Investment Management, LLC, the fund’s manager, an indirect wholly-owned subsidiary of Putnam Investments, LLC and references to “OTC”, if any, represent over-the-counter. Unless otherwise noted, the “reporting period” represents the period from March 1, 2022 through August 31, 2022.
Putnam Small Cap Value Fund (the fund) is a diversified series of Putnam Investment Funds (the Trust), a Massa-chusetts business trust registered under the Investment Company Act of 1940, as amended, as an open-end management investment company. The goal of the fund is to seek capital appreciation. The fund invests mainly in common stocks of small U.S. companies, with a focus on value stocks. Value stocks are issued by companies that Putnam Management believes are currently undervalued by the market. If Putnam Management is correct and other investors ultimately recognize the value of the company, the price of its stock may rise. Under normal circumstances the fund invests at least 80% of its net assets in companies of a size similar to those in the Russell 2000 Value Index. This policy may be changed only after 60 days’ notice to shareholders. As of April 30, 2022, the index was composed of companies having market capitalizations of between approximately $27.4 million and $13.3 billion. Putnam Management may consider, among other factors, a company’s valuation, financial strength, growth potential, competitive position in its industry, projected future earnings, cash flows and dividends when deciding whether to buy or sell investments.
The fund offers the following share classes. The expenses for each class of shares may differ based on the distribution and investor servicing fees of each class, which are identified in Note 2.
| | | |
| Share class | Sales charge | Contingent deferred charges | Conversion feature |
| | | 1.00% on certain redemptions of shares | |
| Class A | Up to 5.75% | bought with no initial sales charge | None |
| | | | Converts to class A shares |
| Class B* | None | 5.00% phased out over six years | after 6 years |
| | | | Converts to class A shares |
| Class C | None | 1.00% eliminated after one year | after 8 years |
| Class R† | None | None | None |
| Class R6† | None | None | None |
| Class Y† | None | None | None |
* Purchases of class B shares are closed to new and existing investors except by exchange from class B shares of another Putnam fund or through dividend and/or capital gains reinvestment.
† Not available to all investors.
Effective July 5, 2022, the fund has terminated its class R5 shares.
In the normal course of business, the fund enters into contracts that may include agreements to indemnify another party under given circumstances. The fund’s maximum exposure under these arrangements is unknown as this would involve future claims that may be, but have not yet been, made against the fund. However, the fund’s management team expects the risk of material loss to be remote.
The fund has entered into contractual arrangements with an investment adviser, administrator, distributor, shareholder servicing agent and custodian, who each provide services to the fund. Unless expressly stated otherwise, shareholders are not parties to, or intended beneficiaries of these contractual arrangements, and these contractual arrangements are not intended to create any shareholder right to enforce them against the service providers or to seek any remedy under them against the service providers, either directly or on behalf of the fund.
Under the fund’s Amended and Restated Agreement and Declaration of Trust, any claims asserted against or on behalf of the Putnam Funds, including claims against Trustees and Officers, must be brought in state and federal courts located within the Commonwealth of Massachusetts.
Note 1: Significant accounting policies
The following is a summary of significant accounting policies consistently followed by the fund in the preparation of its financial statements. The preparation of financial statements is in conformity with accounting principles generally accepted in the United States of America and requires management to make estimates
and assumptions that affect the reported amounts of assets and liabilities in the financial statements and the reported amounts of increases and decreases in net assets from operations. Actual results could differ from those estimates. Subsequent events after the Statement of assets and liabilities date through the date that the financial statements were issued have been evaluated in the preparation of the financial statements.
Investment income, realized and unrealized gains and losses and expenses of the fund are borne pro-rata based on the relative net assets of each class to the total net assets of the fund, except that each class bears expenses unique to that class (including the distribution fees applicable to such classes). Each class votes as a class only with respect to its own distribution plan or other matters on which a class vote is required by law or determined by the Trustees. If the fund were liquidated, shares of each class would receive their pro-rata share of the net assets of the fund. In addition, the Trustees declare separate dividends on each class of shares.
Security valuation Portfolio securities and other investments are valued using policies and procedures adopted by the Board of Trustees. The Trustees have formed a Pricing Committee to oversee the implementation of these procedures and have delegated responsibility for valuing the fund’s assets in accordance with these procedures to Putnam Management. Putnam Management has established an internal Valuation Committee that is responsible for making fair value determinations, evaluating the effectiveness of the pricing policies of the fund and reporting to the Pricing Committee.
Investments for which market quotations are readily available are valued at the last reported sales price on their principal exchange, or official closing price for certain markets, and are classified as Level 1 securities under Accounting Standards Codification 820 Fair Value Measurements and Disclosures (ASC 820). If no sales are reported, as in the case of some securities that are traded OTC, a security is valued at its last reported bid price and is generally categorized as a Level 2 security.
Investments in open-end investment companies (excluding exchange-traded funds), if any, which can be classified as Level 1 or Level 2 securities, are valued based on their net asset value. The net asset value of such investment companies equals the total value of their assets less their liabilities and divided by the number of their outstanding shares.
Market quotations are not considered to be readily available for certain debt obligations (including short-term investments with remaining maturities of 60 days or less) and other investments; such investments are valued on the basis of valuations furnished by an independent pricing service approved by the Trustees or dealers selected by Putnam Management. Such services or dealers determine valuations for normal institutional-size trading units of such securities using methods based on market transactions for comparable securities and various relationships, generally recognized by institutional traders, between securities (which consider such factors as security prices, yields, maturities and ratings). These securities will generally be categorized as Level 2.
Many securities markets and exchanges outside the U.S. close prior to the scheduled close of the New York Stock Exchange and therefore the closing prices for securities in such markets or on such exchanges may not fully reflect events that occur after such close but before the scheduled close of the New York Stock Exchange. Accordingly, on certain days, the fund will fair value certain foreign equity securities taking into account multiple factors including movements in the U.S. securities markets, currency valuations and comparisons to the valuation of American Depository Receipts, exchange-traded funds and futures contracts. The foreign equity securities, which would generally be classified as Level 1 securities, will be transferred to Level 2 of the fair value hierarchy when they are valued at fair value. The number of days on which fair value prices will be used will depend on market activity and it is possible that fair value prices will be used by the fund to a significant extent. Securities quoted in foreign currencies, if any, are translated into U.S. dollars at the current exchange rate.
To the extent a pricing service or dealer is unable to value a security or provides a valuation that Putnam Management does not believe accurately reflects the security’s fair value, the security will be valued at fair value by Putnam Management in accordance with policies and procedures approved by the Trustees. Certain investments, including certain restricted and illiquid securities and derivatives, are also valued at fair value following procedures approved by the Trustees. These valuations consider such factors as significant market or specific security events such as interest rate or credit quality changes, various relationships with other securities, discount rates, U.S. Treasury, U.S. swap and credit yields, index levels, convexity exposures, recovery rates, sales and other multiples and resale restrictions. These securities are classified as Level 2 or as Level 3 depending on the priority of the significant inputs.
To assess the continuing appropriateness of fair valuations, the Valuation Committee reviews and affirms the reasonableness of such valuations on a regular basis after considering all relevant information that is reasonably available. Such valuations and procedures are reviewed periodically by the Trustees. The fair value of securities
is generally determined as the amount that the fund could reasonably expect to realize from an orderly disposition of such securities over a reasonable period of time. By its nature, a fair value price is a good faith estimate of the value of a security in a current sale and does not reflect an actual market price, which may be different by a material amount.
Security transactions and related investment income Security transactions are recorded on the trade date (the date the order to buy or sell is executed). Gains or losses on securities sold are determined on the identified cost basis.
Interest income, net of any applicable withholding taxes, if any, and including amortization and accretion of premiums and discounts on debt securities, is recorded on the accrual basis. Dividend income, net of any applicable withholding taxes, is recognized on the ex-dividend date except that certain dividends from foreign securities, if any, are recognized as soon as the fund is informed of the ex-dividend date. Non-cash dividends, if any, are recorded at the fair value of the securities received. Dividends representing a return of capital or capital gains, if any, are reflected as a reduction of cost and/or as a realized gain.
Foreign currency translation The accounting records of the fund are maintained in U.S. dollars. The fair value of foreign securities, currency holdings, and other assets and liabilities is recorded in the books and records of the fund after translation to U.S. dollars based on the exchange rates on that day. The cost of each security is determined using historical exchange rates. Income and withholding taxes are translated at prevailing exchange rates when earned or incurred. The fund does not isolate that portion of realized or unrealized gains or losses resulting from changes in the foreign exchange rate on investments from fluctuations arising from changes in the market prices of the securities. Such gains and losses are included with the net realized and unrealized gain or loss on investments. Net realized gains and losses on foreign currency transactions represent net realized exchange gains or losses on disposition of foreign currencies, currency gains and losses realized between the trade and settlement dates on securities transactions and the difference between the amount of investment income and foreign withholding taxes recorded on the fund’s books and the U.S. dollar equivalent amounts actually received or paid. Net unrealized appreciation and depreciation of assets and liabilities in foreign currencies arise from changes in the value of assets and liabilities other than investments at the period end, resulting from changes in the exchange rate.
Options contracts The fund uses options contracts to generate additional income for the portfolio.
The potential risk to the fund is that the change in value of options contracts may not correspond to the change in value of the hedged instruments. In addition, losses may arise from changes in the value of the underlying instruments if there is an illiquid secondary market for the contracts, if interest or exchange rates move unexpectedly or if the counterparty to the contract is unable to perform. Realized gains and losses on purchased options are included in realized gains and losses on investment securities. If a written call option is exercised, the premium originally received is recorded as an addition to sales proceeds. If a written put option is exercised, the premium originally received is recorded as a reduction to the cost of investments.
Exchange-traded options are valued at the last sale price or, if no sales are reported, the last bid price for purchased options and the last ask price for written options. OTC traded options are valued using prices supplied by dealers.
Options on swaps are similar to options on securities except that the premium paid or received is to buy or grant the right to enter into a previously agreed upon interest rate or credit default contract. Forward premium swap option contracts include premiums that have extended settlement dates. The delayed settlement of the premiums is factored into the daily valuation of the option contracts. In the case of interest rate cap and floor contracts, in return for a premium, ongoing payments between two parties are based on interest rates exceeding a specified rate, in the case of a cap contract, or falling below a specified rate in the case of a floor contract.
Written option contracts outstanding at period end, if any, are listed after the fund’s portfolio.
Master agreements The fund is a party to ISDA (International Swaps and Derivatives Association, Inc.) Master Agreements (Master Agreements) with certain counterparties that govern OTC derivative and foreign exchange contracts entered into from time to time. The Master Agreements may contain provisions regarding, among other things, the parties’ general obligations, representations, agreements, collateral requirements, events of default and early termination. With respect to certain counterparties, in accordance with the terms of the Master Agreements, collateral pledged to the fund is held in a segregated account by the fund’s custodian and, with respect to those amounts which can be sold or repledged, is presented in the fund’s portfolio.
Collateral pledged by the fund is segregated by the fund’s custodian and identified in the fund’s portfolio. Collateral can be in the form of cash or debt securities issued by the U.S. Government or related agencies or other securities as agreed to by the fund and the applicable counterparty. Collateral requirements are determined based on the fund’s net position with each counterparty.
Termination events applicable to the fund may occur upon a decline in the fund’s net assets below a specified threshold over a certain period of time. Termination events applicable to counterparties may occur upon a decline in the counterparty’s long-term and short-term credit ratings below a specified level. In each case, upon occurrence, the other party may elect to terminate early and cause settlement of all derivative and foreign exchange contracts outstanding, including the payment of any losses and costs resulting from such early termination, as reasonably determined by the terminating party. Any decision by one or more of the fund’s counterparties to elect early termination could impact the fund’s future derivative activity.
At the close of the reporting period, the fund did not have a net liability position on open derivative contracts subject to the Master Agreements.
Securities lending The fund may lend securities, through its agent, to qualified borrowers in order to earn additional income. The loans are collateralized by cash in an amount at least equal to the fair value of the securities loaned. The fair value of securities loaned is determined daily and any additional required collateral is allocated to the fund on the next business day. The remaining maturities of the securities lending transactions are considered overnight and continuous. The risk of borrower default will be borne by the fund’s agent; the fund will bear the risk of loss with respect to the investment of the cash collateral. Income from securities lending, net of expenses, is included in investment income on the Statement of operations. Cash collateral is invested in Putnam Cash Collateral Pool, LLC, a limited liability company managed by an affiliate of Putnam Management. Investments in Putnam Cash Collateral Pool, LLC are valued at its closing net asset value each business day. There are no management fees charged to Putnam Cash Collateral Pool, LLC. At the close of the reporting period, the fund received cash collateral of $26,559,173 and the value of securities loaned amounted to $25,744,278.
Interfund lending The fund, along with other Putnam funds, may participate in an interfund lending program pursuant to an exemptive order issued by the SEC. This program allows the fund to borrow from or lend to other Putnam funds that permit such transactions. Interfund lending transactions are subject to each fund’s investment policies and borrowing and lending limits. Interest earned or paid on the interfund lending transaction will be based on the average of certain current market rates. During the reporting period, the fund did not utilize the program.
Lines of credit The fund participates, along with other Putnam funds, in a $100 million ($317.5 million prior to October 14, 2022) unsecured committed line of credit and a $235.5 million unsecured uncommitted line of credit, both provided by State Street. Borrowings may be made for temporary or emergency purposes, including the funding of shareholder redemption requests and trade settlements. Interest is charged to the fund based on the fund’s borrowing at a rate equal to 1.25% plus the higher of (1) the Federal Funds rate and (2) the Overnight Bank Funding Rate for the committed line of credit and 1.30% plus the higher of (1) the Federal Funds rate and (2) the Overnight Bank Funding Rate for the uncommitted line of credit. A closing fee equal to 0.04% of the committed line of credit and 0.04% of the uncommitted line of credit has been paid by the participating funds. In addition, a commitment fee of 0.21% per annum on any unutilized portion of the committed line of credit is allocated to the participating funds based on their relative net assets and paid quarterly. During the reporting period, the fund had no borrowings against these arrangements.
Federal taxes It is the policy of the fund to distribute all of its taxable income within the prescribed time period and otherwise comply with the provisions of the Internal Revenue Code of 1986, as amended (the Code), applicable to regulated investment companies. It is also the intention of the fund to distribute an amount sufficient to avoid imposition of any excise tax under Section 4982 of the Code.
The fund is subject to the provisions of Accounting Standards Codification 740 Income Taxes (ASC 740). ASC 740 sets forth a minimum threshold for financial statement recognition of the benefit of a tax position taken or expected to be taken in a tax return. The fund did not have a liability to record for any unrecognized tax benefits in the accompanying financial statements. No provision has been made for federal taxes on income, capital gains or unrealized appreciation on securities held nor for excise tax on income and capital gains. Each of the fund’s federal tax returns for the prior three fiscal years remains subject to examination by the Internal Revenue Service.
The fund may also be subject to taxes imposed by governments of countries in which it invests. Such taxes are generally based on either income or gains earned or repatriated. The fund accrues and applies such taxes to net investment income, net realized gains and net unrealized gains as income and/or capital gains are earned. In
some cases, the fund may be entitled to reclaim all or a portion of such taxes, and such reclaim amounts, if any, are reflected as an asset on the fund’s books. In many cases, however, the fund may not receive such amounts for an extended period of time, depending on the country of investment.
Under the Regulated Investment Company Modernization Act of 2010, the fund will be permitted to carry forward capital losses incurred for an unlimited period and the carry forwards will retain their character as either short-term or long-term capital losses. At February 28, 2022, the fund had the following capital loss carryovers available, to the extent allowed by the Code, to offset future net capital gain, if any:
| | |
| | Loss carryover | |
| Short-term | Long-term | Total |
| $3,761,099 | $— | $3,761,099 |
Pursuant to federal income tax regulations applicable to regulated investment companies, the fund has elected to defer $348,266 to its fiscal year ending February 28, 2023 of late year ordinary losses ((i) ordinary losses recognized between January 1, 2022 and February 28, 2022, and (ii) specified ordinary and currency losses recognized between November 1, 2021 and February 28, 2022).
Tax cost of investments includes adjustments to net unrealized appreciation (depreciation) which may not necessarily be final tax cost basis adjustments, but closely approximate the tax basis unrealized gains and losses that may be realized and distributed to shareholders. The aggregate identified cost on a tax basis is $336,411,299, resulting in gross unrealized appreciation and depreciation of $16,966,365 and $33,902,221, respectively, or net unrealized depreciation of $16,935,856.
Distributions to shareholders Distributions to shareholders from net investment income are recorded by the fund on the ex-dividend date. Distributions from capital gains, if any, are recorded on the ex-dividend date and paid at least annually. The amount and character of income and gains to be distributed are determined in accordance with income tax regulations, which may differ from generally accepted accounting principles. Dividend sources are estimated at the time of declaration. Actual results may vary. Any non-taxable return of capital cannot be determined until final tax calculations are completed after the end of the fund’s fiscal year. Reclassifications are made to the fund’s capital accounts to reflect income and gains available for distribution (or available capital loss carryovers) under income tax regulations.
Expenses of the Trust Expenses directly charged or attributable to any fund will be paid from the assets of that fund. Generally, expenses of the Trust will be allocated among and charged to the assets of each fund on a basis that the Trustees deem fair and equitable, which may be based on the relative assets of each fund or the nature of the services performed and relative applicability to each fund.
Note 2: Management fee, administrative services and other transactions
The fund pays Putnam Management a management fee (based on the fund’s average net assets and computed and paid monthly) at annual rates that may vary based on the average of the aggregate net assets of all open-end mutual funds sponsored by Putnam Management (excluding net assets of funds that are invested in, or that are invested in by, other Putnam funds to the extent necessary to avoid “double counting” of those assets). Such annual rates may vary as follows:
| | | | |
| 0.780% | of the first $5 billion, | | 0.580% | of the next $50 billion, |
| 0.730% | of the next $5 billion, | | 0.560% | of the next $50 billion, |
| 0.680% | of the next $10 billion, | | 0.550% | of the next $100 billion and |
| 0.630% | of the next $10 billion, | | 0.545% | of any excess thereafter. |
For the reporting period, the management fee represented an effective rate (excluding the impact from any expense waivers in effect) of 0.311% of the fund’s average net assets.
Putnam Management has contractually agreed, through June 30, 2023, to waive fees and/or reimburse the fund’s expenses to the extent necessary to limit the cumulative expenses of the fund, exclusive of brokerage, interest, taxes, investment-related expenses, extraordinary expenses, acquired fund fees and expenses and payments under the fund’s investor servicing contract, investment management contract and distribution plans, on a fiscal year-to-date basis to an annual rate of 0.20% of the fund’s average net assets over such fiscal year-to-date period. During the reporting period, the fund’s expenses were not reduced as a result of this limit.
Putnam Investments Limited (PIL), an affiliate of Putnam Management, is authorized by the Trustees to manage a separate portion of the assets of the fund as determined by Putnam Management from time to time. PIL did not manage any portion of the assets of the fund during the reporting period. If Putnam Management were to engage the services of PIL, Putnam Management would pay a quarterly sub-management fee to PIL for its services at an annual rate of 0.25% (prior to July 1, 2022, the annual rate was 0.35%) of the average net assets of the portion of the fund managed by PIL.
The fund reimburses Putnam Management an allocated amount for the compensation and related expenses of certain officers of the fund and their staff who provide administrative services to the fund. The aggregate amount of all such reimbursements is determined annually by the Trustees.
Custodial functions for the fund’s assets are provided by State Street. Custody fees are based on the fund’s asset level, the number of its security holdings and transaction volumes.
Putnam Investor Services, Inc., an affiliate of Putnam Management, provides investor servicing agent functions to the fund. Putnam Investor Services, Inc. received fees for investor servicing for class A, class B, class C, class R and class Y shares that included (1) a per account fee for each direct and underlying non-defined contribution account (retail account) of the fund; (2) a specified rate of the fund’s assets attributable to defined contribution plan accounts; and (3) a specified rate based on the average net assets in retail accounts. Putnam Investor Services, Inc. has agreed that the aggregate investor servicing fees for each fund’s retail and defined contribution accounts for these share classes will not exceed an annual rate of 0.25% of the fund’s average assets attributable to such accounts.
Class R5 shares paid a monthly fee based on the average net assets of class R5 shares at an annual rate of 0.15%. Effective July 5, 2022, the fund has terminated its class R5 shares.
Class R6 shares paid a monthly fee based on the average net assets of class R6 shares at an annual rate of 0.05%.
During the reporting period, the expenses for each class of shares related to investor servicing fees were as follows:
| | | | |
| Class A | $147,108 | | Class R5 | 4 |
| Class B | 479 | | Class R6 | 6,348 |
| Class C | 8,025 | | Class Y | 115,448 |
| Class R | 885 | | Total | $278,297 |
The fund has entered into expense offset arrangements with Putnam Investor Services, Inc. and State Street whereby Putnam Investor Services, Inc.’s and State Street’s fees are reduced by credits allowed on cash balances. For the reporting period, the fund’s expenses were reduced by $360 under the expense offset arrangements.
Each Independent Trustee of the fund receives an annual Trustee fee, of which $233, as a quarterly retainer, has been allocated to the fund, and an additional fee for each Trustees meeting attended. Trustees also are reimbursed for expenses they incur relating to their services as Trustees.
The fund has adopted a Trustee Fee Deferral Plan (the Deferral Plan) which allows the Trustees to defer the receipt of all or a portion of Trustees fees payable on or after July 1, 1995. The deferred fees remain invested in certain Putnam funds until distribution in accordance with the Deferral Plan.
The fund has adopted an unfunded noncontributory defined benefit pension plan (the Pension Plan) covering all Trustees of the fund who have served as a Trustee for at least five years and were first elected prior to 2004. Benefits under the Pension Plan are equal to 50% of the Trustee’s average annual attendance and retainer fees for the three years ended December 31, 2005. The retirement benefit is payable during a Trustee’s lifetime, beginning the year following retirement, for the number of years of service through December 31, 2006. Pension expense for the fund is included in Trustee compensation and expenses in the Statement of operations. Accrued pension liability is included in Payable for Trustee compensation and expenses in the Statement of assets and liabilities. The Trustees have terminated the Pension Plan with respect to any Trustee first elected after 2003.
The fund has adopted distribution plans (the Plans) with respect to the following share classes pursuant to Rule 12b–1 under the Investment Company Act of 1940. The purpose of the Plans is to compensate Putnam Retail Management Limited Partnership, an indirect wholly-owned subsidiary of Putnam Investments, LLC, for services provided and expenses incurred in distributing shares of the fund. The Plans provide payments by the fund to Putnam Retail Management Limited Partnership at an annual rate of up to the following amounts (Maximum %) of the average net assets attributable to each class. The Trustees have approved payment by the fund at the
following annual rate (Approved %) of the average net assets attributable to each class. During the reporting period, the class-specific expenses related to distribution fees were as follows:
| | | |
| | Maximum % | Approved % | Amount |
| Class A | 0.35% | 0.25% | $195,940 |
| Class B | 1.00% | 1.00% | 2,559 |
| Class C | 1.00% | 1.00% | 42,729 |
| Class R | 1.00% | 0.50% | 2,356 |
| Total | | | $243,584 |
For the reporting period, Putnam Retail Management Limited Partnership, acting as underwriter, received net commissions of $14,210 from the sale of class A shares and received $79 and $42 in contingent deferred sales charges from redemptions of class B and class C shares, respectively.
A deferred sales charge of up to 1.00% is assessed on certain redemptions of class A shares. For the reporting period, Putnam Retail Management Limited Partnership, acting as underwriter, received no monies on class A redemptions.
Note 3: Purchases and sales of securities
During the reporting period, the cost of purchases and the proceeds from sales, excluding short-term investments, were as follows:
| | |
| | Cost of purchases | Proceeds from sales |
| Investments in securities (Long-term) | $127,698,878 | $142,936,217 |
| U.S. government securities (Long-term) | — | — |
| Total | $127,698,878 | $142,936,217 |
The fund may purchase or sell investments from or to other Putnam funds in the ordinary course of business, which can reduce the fund’s transaction costs, at prices determined in accordance with SEC requirements and policies approved by the Trustees. During the reporting period, purchases or sales of long-term securities from or to other Putnam funds, if any, did not represent more than 5% of the fund’s total cost of purchases and/or total proceeds from sales.
Note 4: Capital shares
At the close of the reporting period, there were an unlimited number of shares of beneficial interest authorized. Transactions, including, if applicable, direct exchanges pursuant to share conversions, in capital shares were as follows:
| | | | |
| | SIX MONTHS ENDED 8/31/22 | YEAR ENDED 2/28/22 |
| Class A | Shares | Amount | Shares | Amount |
| Shares sold | 532,509 | $7,958,788 | 2,015,551 | $30,506,508 |
| Shares issued in connection with | | | | |
| reinvestment of distributions | — | — | 21,330 | 326,781 |
| | 532,509 | 7,958,788 | 2,036,881 | 30,833,289 |
| Shares repurchased | (714,255) | (10,453,088) | (1,758,069) | (26,613,316) |
| Net increase (decrease) | (181,746) | $(2,494,300) | 278,812 | $4,219,973 |
| | | | |
| | SIX MONTHS ENDED 8/31/22 | YEAR ENDED 2/28/22 |
| Class B | Shares | Amount | Shares | Amount |
| Shares sold | 1,597 | $16,187 | 11,124 | $123,555 |
| Shares issued in connection with | | | | |
| reinvestment of distributions | — | — | — | — |
| | 1,597 | 16,187 | 11,124 | 123,555 |
| Shares repurchased | (16,858) | (183,971) | (44,217) | (486,450) |
| Net decrease | (15,261) | $(167,784) | (33,093) | $(362,895) |
| |
| | SIX MONTHS ENDED 8/31/22 | YEAR ENDED 2/28/22 |
| Class C | Shares | Amount | Shares | Amount |
| Shares sold | 131,091 | $1,417,467 | 334,081 | $3,677,406 |
| Shares issued in connection with | | | | |
| reinvestment of distributions | — | — | — | — |
| | 131,091 | 1,417,467 | 334,081 | 3,677,406 |
| Shares repurchased | (153,898) | (1,635,430) | (667,799) | (7,170,900) |
| Net decrease | (22,807) | $(217,963) | (333,718) | $(3,493,494) |
| |
| | SIX MONTHS ENDED 8/31/22 | YEAR ENDED 2/28/22 |
| Class R | Shares | Amount | Shares | Amount |
| Shares sold | 6,856 | $97,100 | 23,855 | $349,121 |
| Shares issued in connection with | | | | |
| reinvestment of distributions | — | — | — | — |
| | 6,856 | 97,100 | 23,855 | 349,121 |
| Shares repurchased | (23,606) | (350,766) | (34,487) | (499,246) |
| Net decrease | (16,750) | $(253,666) | (10,632) | $(150,125) |
| |
| | SIX MONTHS ENDED 8/31/22* | YEAR ENDED 2/28/22 |
| Class R5 | Shares | Amount | Shares | Amount |
| Shares sold | 20 | $342 | 1,063 | $16,827 |
| Shares issued in connection with | | | | |
| reinvestment of distributions | — | — | — | — |
| | 20 | 342 | 1,063 | 16,827 |
| Shares repurchased | (506) | (7,274) | (8,755) | (141,507) |
| Net decrease | (486) | $(6,932) | (7,692) | $(124,680) |
| |
| | SIX MONTHS ENDED 8/31/22 | YEAR ENDED 2/28/22 |
| Class R6 | Shares | Amount | Shares | Amount |
| Shares sold | 154,017 | $2,395,276 | 841,228 | $13,472,499 |
| Shares issued in connection with | | | | |
| reinvestment of distributions | — | — | 8,628 | 141,069 |
| | 154,017 | 2,395,276 | 849,856 | 13,613,568 |
| Shares repurchased | (205,248) | (3,306,261) | (703,553) | (11,390,046) |
| Net increase (decrease) | (51,231) | $(910,985) | 146,303 | $2,223,522 |
| | | | |
| | SIX MONTHS ENDED 8/31/22 | YEAR ENDED 2/28/22 |
| Class Y | Shares | Amount | Shares | Amount |
| Shares sold | 2,434,138 | $38,805,141 | 6,698,604 | $110,046,559 |
| Shares issued in connection with | | | | |
| reinvestment of distributions | — | — | 28,163 | 459,059 |
| | 2,434,138 | 38,805,141 | 6,726,767 | 110,505,618 |
| Shares repurchased | (3,338,592) | (52,245,437) | (1,189,423) | (19,142,096) |
| Net increase (decrease) | (904,454) | $(13,440,296) | 5,537,344 | $91,363,522 |
* Effective July 5, 2022, the fund has terminated its class R5 shares.
Note 5: Affiliated transactions
Transactions during the reporting period with any company which is under common ownership or control were as follows:
| | | | | |
| | | | | | Shares |
| | | | | | outstanding |
| | | | | | and fair |
| | Fair value as | Purchase | Sale | Investment | value as |
| Name of affiliate | of 2/28/22 | cost | proceeds | income | of 8/31/22 |
| Short-term investments | | | | | |
| Putnam Cash Collateral | | | | | |
| Pool, LLC* | $13,226,275 | $120,054,162 | $106,721,264 | $126,666 | $26,559,173 |
| Putnam Short Term | | | | | |
| Investment Fund** | 1,398,518 | 37,993,522 | 38,384,688 | 6,741 | 1,007,352 |
| Total Short-term | | | | | |
| investments | $14,624,793 | $158,047,684 | $145,105,952 | $133,407 | $27,566,525 |
* No management fees are charged to Putnam Cash Collateral Pool, LLC (Note 1).Investment income shown is included in securities lending income on the Statement of operations. There were no realized or unrealized gains or losses during the period.
** Management fees charged to Putnam Short Term Investment Fund have been waived by Putnam Management. There were no realized or unrealized gains or losses during the period.
Note 6: Market, credit and other risks
In the normal course of business, the fund trades financial instruments and enters into financial transactions where risk of potential loss exists due to changes in the market (market risk) or failure of the contracting party to the transaction to perform (credit risk). The fund may be exposed to additional credit risk that an institution or other entity with which the fund has unsettled or open transactions will default. Investments in foreign securities involve certain risks, including those related to economic instability, unfavorable political developments, and currency fluctuations.
Beginning in January 2020, global financial markets have experienced, and may continue to experience, significant volatility resulting from the spread of a virus known as Covid–19. The outbreak of Covid–19 has resulted in travel and border restrictions, quarantines, supply chain disruptions, lower consumer demand, and general market uncertainty. The effects of Covid–19 have adversely affected, and may continue to adversely affect, the global economy, the economies of certain nations, and individual issuers, all of which may negatively impact the fund’s performance.
Note 7: Summary of derivative activity
The volume of activity for the reporting period for any derivative type that was held during the period is listed below and was based on an average of the holdings at the end of each fiscal quarter:
| |
| Written equity option contracts (contract amount) | $—* |
* For the reporting period, there were no holdings at the end of each fiscal quarter and the transactions were considered minimal.
As of the close of the reporting period, the fund did not hold any derivative instruments.
The following is a summary of realized gains or losses of derivative instruments on the Statement of operations for the reporting period (Note 1) (there were no unrealized gains or losses on derivative instruments):
| | |
| Amount of realized gain or (loss) on derivatives recognized in net gain or (loss) on investments | |
| Derivatives not accounted for as | | |
| hedging instruments under ASC 815 | Options | Total |
| Equity contracts | $33,776 | $33,776 |
| Total | $33,776 | $33,776 |
Shareholder meeting results (Unaudited)
June 29, 2022 special meeting
At the meeting, each of the nominees for Trustees was elected, with all funds of the Trust voting together as a single class, as follows:
| | |
| | Votes for | Votes withheld |
| Liaquat Ahamed | 275,864,949 | 11,885,697 |
| Barbara M. Baumann | 276,817,419 | 10,933,227 |
| Katinka Domotorffy | 276,491,274 | 11,259,372 |
| Catharine Bond Hill | 277,377,580 | 10,373,066 |
| Kenneth R. Leibler | 277,519,588 | 10,231,058 |
| Jennifer Williams Murphy | 276,865,779 | 10,884,867 |
| Marie Pillai | 276,342,951 | 11,407,695 |
| George Putnam, III | 282,562,747 | 5,187,899 |
| Robert L. Reynolds | 283,034,080 | 4,716,566 |
| Manoj P. Singh | 276,110,551 | 11,640,095 |
| Mona K. Sutphen | 276,477,167 | 11,273,479 |
All tabulations are rounded to the nearest whole number.
Fund information
Founded over 80 years ago, Putnam Investments was built around the concept that a balance between risk and reward is the hallmark of a well-rounded financial program. We manage funds across income, value, blend, growth, sustainable, asset allocation, absolute return, and global sector categories.
| | |
| Investment Manager | Trustees | Richard T. Kircher |
| Putnam Investment | Kenneth R. Leibler, Chair | Vice President and |
| Management, LLC | Barbara M. Baumann, Vice Chair | BSA Compliance Officer |
| 100 Federal Street | Liaquat Ahamed | |
| Boston, MA 02110 | Katinka Domotorffy | Martin Lemaire |
| | Catharine Bond Hill | Vice President and |
| Investment Sub-Advisor | Jennifer Williams Murphy | Derivatives Risk Manager |
| Putnam Investments Limited | Marie Pillai | |
| 16 St James’s Street | George Putnam, III | Susan G. Malloy |
| London, England SW1A 1ER | Robert L. Reynolds | Vice President and |
| Manoj P. Singh | Assistant Treasurer |
| Marketing Services | Mona K. Sutphen | |
| Putnam Retail Management | | Alan G. McCormack |
| Limited Partnership | Officers | Vice President and |
| 100 Federal Street | Robert L. Reynolds | Derivatives Risk Manager |
| Boston, MA 02110 | President | |
| | | Denere P. Poulack |
| Custodian | James F. Clark | Assistant Vice President, |
| State Street Bank | Vice President, Chief Compliance | Assistant Clerk, and |
| and Trust Company | Officer, and Chief Risk Officer | Assistant Treasurer |
| | | |
| Legal Counsel | Nancy E. Florek | Janet C. Smith |
| Ropes & Gray LLP | Vice President, Director of | Vice President, |
| | Proxy Voting and Corporate | Principal Financial Officer, |
| | Governance, Assistant Clerk, | Principal Accounting Officer, |
| | and Assistant Treasurer | and Assistant Treasurer |
| | | |
| | Michael J. Higgins | Stephen J. Tate |
| | Vice President, Treasurer, | Vice President and |
| | and Clerk | Chief Legal Officer |
| | | |
| | Jonathan S. Horwitz | Mark C. Trenchard |
| | Executive Vice President, | Vice President |
| Principal Executive Officer, | |
| | and Compliance Liaison | |
This report is for the information of shareholders of Putnam Small Cap Value Fund. It may also be used as sales literature when preceded or accompanied by the current prospectus, the most recent copy of Putnam’s Quarterly Performance Summary, and Putnam’s Quarterly Ranking Summary. For more recent performance, please visit putnam.com. Investors should carefully consider the investment objectives, risks, charges, and expenses of a fund, which are described in its prospectus. For this and other information or to request a prospectus or summary prospectus, call 1-800-225-1581 toll free. Please read the prospectus carefully before investing. The fund’s Statement of Additional Information contains additional information about the fund’s Trustees and is available without charge upon request by calling 1-800-225-1581.

| |
| Item 3. Audit Committee Financial Expert: |
| |
| Item 4. Principal Accountant Fees and Services: |
| |
| Item 5. Audit Committee of Listed Registrants |
| |
| Item 6. Schedule of Investments: |
| |
| The registrant’s schedule of investments in unaffiliated issuers is included in the report to shareholders in Item 1 above. |
| |
| Item 7. Disclosure of Proxy Voting Policies and Procedures For Closed-End Management Investment Companies: |
| |
| Item 8. Portfolio Managers of Closed-End Investment Companies |
| |
| Item 9. Purchases of Equity Securities by Closed-End Management Investment Companies and Affiliated Purchasers: |
| |
| Item 10. Submission of Matters to a Vote of Security Holders: |
| |
| Item 11. Controls and Procedures: |
| |
| (a) The registrant’s principal executive officer and principal financial officer have concluded, based on their evaluation of the effectiveness of the design and operation of the registrant’s disclosure controls and procedures as of a date within 90 days of the filing date of this report, that the design and operation of such procedures are generally effective to provide reasonable assurance that information required to be disclosed by the registrant in this report is recorded, processed, summarized and reported within the time periods specified in the Commission’s rules and forms. |
| |
| (b) Changes in internal control over financial reporting: Not applicable |
| |
| Item 12. Disclosures of Securities Lending Activities for Closed-End Investment Companies: |
| |
| Pursuant to the requirements of the Securities Exchange Act of 1934 and the Investment Company Act of 1940, the registrant has duly caused this report to be signed on its behalf by the undersigned, thereunto duly authorized. |
| |
| By (Signature and Title): |
| |
| /s/ Janet C. Smith
Janet C. Smith
Principal Accounting Officer
|
| |
| Pursuant to the requirements of the Securities Exchange Act of 1934 and the Investment Company Act of 1940, this report has been signed below by the following persons on behalf of the registrant and in the capacities and on the dates indicated. |
| |
| By (Signature and Title): |
| |
| /s/ Jonathan S. Horwitz
Jonathan S. Horwitz
Principal Executive Officer
|
| |
| By (Signature and Title): |
| |
| /s/ Janet C. Smith
Janet C. Smith
Principal Financial Officer
|