| | |
| UNITED STATES
SECURITIES AND EXCHANGE COMMISSION |
| | |
| CERTIFIED SHAREHOLDER REPORT OF REGISTERED
MANAGEMENT INVESTMENT COMPANIES
|
| | |
| Investment Company Act file number: | (811-07237) |
| | |
| Exact name of registrant as specified in charter: | Putnam Investment Funds |
| | |
| Address of principal executive offices: | 100 Federal Street, Boston, Massachusetts 02110 |
| | |
| Name and address of agent for service: | Stephen Tate, Vice President
100 Federal Street
Boston, Massachusetts 02110 |
| | |
| Copy to: | Bryan Chegwidden, Esq.
Ropes & Gray LLP
1211 Avenue of the Americas
New York, New York 10036 |
| | |
| Registrant’s telephone number, including area code: | (617) 292-1000 |
| | |
| Date of fiscal year end: | April 30, 2023 |
| | |
| Date of reporting period: | May 1, 2022 – October 31, 2022 |
| | |
|
Item 1. Report to Stockholders: | |
| | |
| The following is a copy of the report transmitted to stockholders pursuant to Rule 30e-1 under the Investment Company Act of 1940: | |
Putnam
Sustainable Future
Fund
Semiannual report
10 | 31 | 22
Message from the Trustees
December 7, 2022
Dear Fellow Shareholder:
Financial markets are reminding us that the journey to long-term returns often involves weathering periods of heightened volatility. This year, stocks and bonds have experienced losses, and U.S. gross domestic product has declined slightly. Persistent inflation has caused the U.S. Federal Reserve to raise interest rates, and it may maintain high interest rates in 2023 until inflation indicators move meaningfully lower.
While this environment is challenging, you can be confident that Putnam portfolio managers are working for you. Our teams are actively researching new and attractive investment opportunities for your fund while assessing risks.
We also would like to announce changes to the Board of Trustees. In July 2022, we welcomed Jennifer Williams Murphy and Marie Pillai as new Trustees. Both have a wealth of investment advisory and executive management experience. We also want to thank our Trustees who retired from the Board on June 30, 2022. Paul Joskow served with us since 1997, and Ravi Akhoury joined the Board in 2009. We wish them well.
Thank you for investing with Putnam.
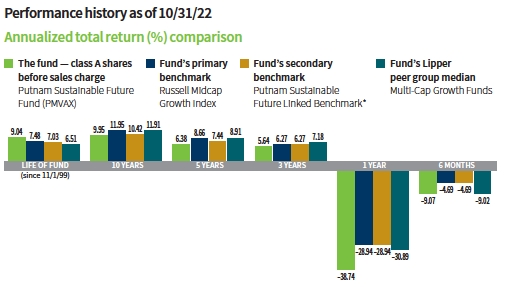
Current performance may be lower or higher than the quoted past performance, which cannot guarantee future results. Share price, principal value, and return will fluctuate, and you may have a gain or a loss when you sell your shares. Performance of class A shares assumes reinvestment of distributions and does not account for taxes. Fund returns in the bar chart do not reflect a sales charge of 5.75%; had they, returns would have been lower. See below and pages 7–9 for additional performance information. For a portion of the periods, the fund had expense limitations, without which returns would have been lower. To obtain the most recent month-end performance, visit putnam.com.
Before March 21, 2018, the fund was managed with a materially different investment strategy and may have achieved materially different performance results under its current investment strategy from that shown for periods before this date.
Returns for periods of less than one year are not annualized.
Lipper peer group median is provided by Lipper, a Refinitiv company.
* The Putnam Sustainable Future Linked Benchmark represents the performance of the Russell 3000 Value Index through March 20, 2018, and the performance of the Russell Midcap Growth Index thereafter.
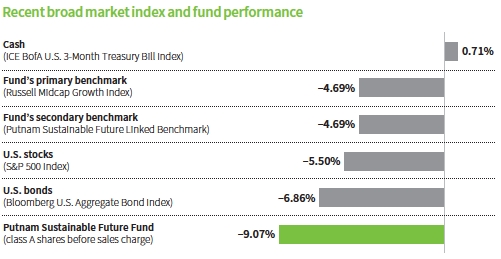
This comparison shows your fund’s performance in the context of broad market indexes for the six months ended 10/31/22. See above and pages 7–9 for additional fund performance information. Index descriptions can be found on pages 12–13.
All Bloomberg indices are provided by Bloomberg Index Services Limited.
|
| 2 Sustainable Future Fund |

How was the investing environment for U.S. stocks during the reporting period?
Conditions continued to be challenging for investors during the six-month period, which included many bouts of market volatility. For example, in the second month of the period — the mid-point of the calendar year — the S&P 500 Index recorded its worst first half since 1970. In contrast, in October, the final month of the period, stocks rallied considerably and the Dow Jones Industrial Average delivered its best monthly performance since 1976. This volatility was due to a range of investor concerns, including high inflation, interest-rate hikes, fears of recession, and challenges related to the ongoing Russia-Ukraine War.
Historically high inflation, and the efforts by central banks to tame it, represented the biggest headwind for investors. Inflation in the U.S. reached 40-year highs, and in March, the U.S. Federal Reserve began raising interest rates. It was the start of its most rapid interval of rate increases since the early 1980s, according to The Wall Street Journal. The Fed’s increase on November 2 brought the federal funds rate to a target range of 3.75%–4.00%.
|
| Sustainable Future Fund 3 |
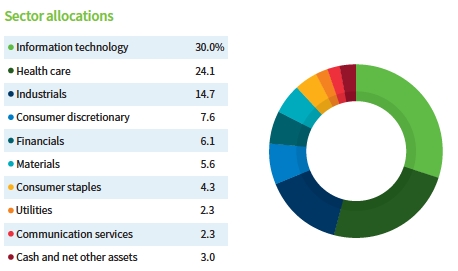
Allocations are shown as a percentage of the fund’s net assets as of 10/31/22. Cash and net other assets, if any, represent the market value weights of cash, derivatives, short-term securities, and other unclassified assets in the portfolio. Summary information may differ from the portfolio schedule included in the financial statements due to the inclusion of derivative securities, any interest accruals, the exclusion of as-of trades, if any, the use of different classifications of securities for presentation purposes, and rounding. Holdings and allocations may vary over time.
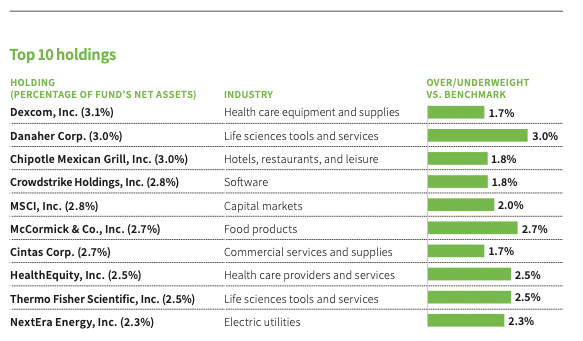
This table shows the fund’s top 10 holdings by percentage of the fund’s net assets as of 10/31/22. Short-term investments and derivatives, if any, are excluded. Holdings may vary over time.
|
| 4 Sustainable Future Fund |
There have been bright spots for investors, including the news in late October that U.S. gross domestic product [GDP] grew at a 2.6% annual rate in the third quarter after declining in the first half of the year. Also in October, many companies delivered better-than-expected earnings reports.
How did the fund perform for the 6-month reporting period?
In this difficult market, the fund returned –9.07%, lagging its primary benchmark, the Russell Midcap Growth Index, which returned –4.69%.
What were some holdings that contributed to relative performance during the period?
The top contributor was HealthEquity, a company that aligns with our Thriving Public and Thriving People themes. HealthEquity offers a digital platform for employee benefits, including tax-advantaged health savings accounts [HSAs], commuter benefits, and dependent care. Its user-friendly platform enables employees to manage bills and obtain transparency into pricing and treatment options, helping them to save for healthcare expenses. The stock has benefited from growth in HSAs, as U.S. employers look to transition to high-deductible healthcare plans. Also helping was the rising interest-rate environment, which benefits HealthEquity’s investments and earnings.
Dexcom, a company aligned with our Thriving People theme, was another notable contributor. Dexcom helps individuals control their Type I or Type II diabetes through continuous glucose monitoring [CGM] systems. CGMs are discreet devices that can be worn under clothing. They continuously monitor blood sugar levels and send alerts when blood sugar levels are too high or too low, often to a smartphone or other device. Continuous monitoring leads to better blood sugar control, which in turn leads to better patient outcomes, including lower rates of heart attacks. We believe Dexcom offers strong growth potential as adoption of CGMs increases among diabetics, and as reimbursement coverage expands for CGMs, especially for Type II diabetes.
Could you discuss some holdings that detracted from the fund’s performance during the period?
The top detractor during the period was Bio-Rad Laboratories, which is aligned with our Thriving People theme. The company is focused on developing, manufacturing, and marketing a broad range of innovative products for the life science research and clinical diagnostic markets, with a focus on quality controls and customer service. The stock has been under pressure as supply chain issues resulted in earnings falling below expectations. In addition, speculation about capital allocation and a potential merger pressured the stock. Our outlook remains positive for the company’s core diagnostics and life science businesses. We also believe Bio-Rad’s balance sheet flexibility remains underappreciated by the market.
McCormick was also a notable detractor during the period. The company is aligned with our Thriving Planet theme and is a global leader in flavor and the sourcing and manufacturing of herbs, spices, and condiments. These ingredients have unusually complex and fragmented supply sources, and McCormick has a deep commitment to sustainable farming practices. The stock came under pressure as rising costs and slowing volumes resulted in margin compression and a lower top-line growth outlook for this fiscal year. Despite the recent underperformance, we believe McCormick continues to offer key competitive advantages, including dominant market share, continued focus on brand spending, and growth in its private-label offerings. Also, the company’s approach to sustainable farming has created
|
| Sustainable Future Fund 5 |
deep relationships with farmers across the globe, which makes for a more resilient and adaptable supply network.
What is your outlook for the months ahead?
We believe that continued stock market volatility is a possibility, and we remain attuned to issues such as rising inflation, increasing labor costs, and supply chain disruptions that may lead to slower growth. While we take the macroeconomic backdrop into consideration, as long-term investors, we are careful to avoid getting caught up in short-term thinking and overreacting to economic news. In many cases, we believe volatility can be beneficial, as it allows us to reevaluate companies at more attractive prices. We can engage with management teams about dynamic conditions, incorporate changing information into our research, and ultimately position our portfolios for potential outperformance.
We continue to believe that the key driver of long-term fund performance should be our stock selection decisions. And, for companies in the portfolio, certain environmental, social, and governance factors are relevant and material to their long-term business fundamentals. We remain excited about the number of businesses that offer compelling sustainability characteristics, strong fundamentals, and reasonable valuations.
Thank you both for your time and insights today.
The views expressed in this report are exclusively those of Putnam Management and are subject to change. They are not meant as investment advice.
Please note that the holdings discussed in this report may not have been held by the fund for the entire period. Portfolio composition is subject to review in accordance with the fund’s investment strategy and may vary in the future. Current and future portfolio holdings are subject to risk.
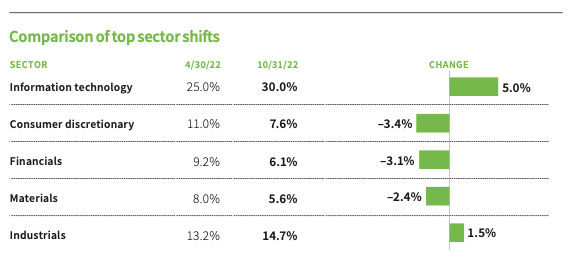
This table shows the fund’s largest allocation shifts, by percentage, over the past six months. Allocations are shown as a percentage of the fund’s net assets. Current period summary information may differ from the portfolio schedule included in the financial statements due to the inclusion of derivative securities, any interest accruals, the exclusion of as-of trades, if any, the use of different classifications of securities for presentation purposes, and rounding. Holdings and allocations may vary over time.
|
| 6 Sustainable Future Fund |
Your fund’s performance
This section shows your fund’s performance, price, and distribution information for periods ended October 31, 2022, the end of the first half of its current fiscal year. In accordance with regulatory requirements for mutual funds, we also include performance information as of the most recent calendar quarter-end and expense information taken from the fund’s current prospectus. Performance should always be considered in light of a fund’s investment strategy. Before March 21, 2018, the fund was managed with a materially different investment strategy and may have achieved materially different performance results under its current investment strategy from that shown for periods before this date. Data represent past performance. Past performance does not guarantee future results. More recent returns may be less or more than those shown. Investment return and principal value will fluctuate, and you may have a gain or a loss when you sell your shares. Performance information does not reflect any deduction for taxes a shareholder may owe on fund distributions or on the redemption of fund shares. For the most recent month-end performance, please visit the Individual Investors section at putnam.com or call Putnam at 1-800-225-1581. Class R, R6, and Y shares are not available to all investors. See the Terms and definitions section in this report for definitions of the share classes offered by your fund.
Annualized fund performance Total return for periods ended 10/31/22
| | | | | | |
| | Life of fund | 10 years | 5 years | 3 years | 1 year | 6 months |
| Class A (11/1/99) | | | | | | |
| Before sales charge | 9.04% | 9.95% | 6.38% | 5.64% | –38.74% | –9.07% |
| After sales charge | 8.76 | 9.30 | 5.13 | 3.57 | –42.26 | –14.30 |
| Class B (1/16/01) | | | | | | |
| Before CDSC | 8.86 | 9.54 | 5.58 | 4.86 | –39.20 | –9.44 |
| After CDSC | 8.86 | 9.54 | 5.36 | 4.09 | –41.74 | –13.96 |
| Class C (1/16/01) | | | | | | |
| Before CDSC | 8.75 | 9.29 | 5.58 | 4.85 | –39.20 | –9.47 |
| After CDSC | 8.75 | 9.29 | 5.58 | 4.85 | –39.71 | –10.38 |
| Class R (4/1/03) | | | | | | |
| Net asset value | 8.77 | 9.68 | 6.13 | 5.39 | –38.89 | –9.20 |
| Class R6 (5/22/18) | | | | | | |
| Net asset value | 9.31 | 10.28 | 6.76 | 6.02 | –38.52 | –8.91 |
| Class Y (4/2/02) | | | | | | |
| Net asset value | 9.28 | 10.23 | 6.65 | 5.91 | –38.58 | –8.96 |
Current performance may be lower or higher than the quoted past performance, which cannot guarantee future results. After-sales-charge returns for class A shares reflect the deduction of the maximum 5.75% sales charge levied at the time of purchase. Class B share returns after contingent deferred sales charge (CDSC) reflect the applicable CDSC, which is 5% in the first year, declining over time to 2% in the fifth year, and is eliminated thereafter. Class C share returns after CDSC reflect a 1% CDSC for the first year that is eliminated thereafter. Class R, R6, and Y shares have no initial sales charge or CDSC. Performance for class B, C, R, and Y shares before their inception is derived from the historical performance of class A shares, adjusted for the applicable sales charge (or CDSC) and the higher operating expenses for such shares, except for class Y shares, for which 12b-1 fees are not applicable. Performance for class R6 shares prior to their inception is derived from the historical performance of class Y shares and has not been adjusted for the lower investor servicing fees applicable to class R6 shares; had it, returns would have been higher.
Returns for periods of less than one year are not annualized.
For a portion of the periods, the fund had expense limitations, without which returns would have been lower.
Class B share performance reflects conversion to class A shares after five years.
Class C share performance reflects conversion to class A shares after eight years.
|
| Sustainable Future Fund 7 |
Comparative annualized index returns For periods ended 10/31/22
| | | | | | |
| | Life of fund | 10 years | 5 years | 3 years | 1 year | 6 months |
| Russell Midcap Growth Index | 7.48% | 11.95% | 8.66% | 6.27% | –28.94% | –4.69% |
| Putnam Sustainable Future | | | | | | |
| Linked Benchmark* | 7.03 | 10.42 | 7.44 | 6.27 | –28.94 | –4.69 |
| Lipper Multi-Cap Growth | | | | | | |
| Funds category median† | 6.51 | 11.91 | 8.91 | 7.18 | –30.89 | –9.02 |
Index and Lipper results should be compared with fund performance before sales charge, before CDSC, or at net asset value.
Returns for periods of less than one year are not annualized.
Lipper peer group median is provided by Lipper, a Refinitiv company.
* The Putnam Sustainable Future Linked Benchmark represents the performance of the Russell 3000 Value Index through March 20, 2018, and the performance of the Russell Midcap Growth Index thereafter.
† Over the 6-month, 1-year, 3-year, 5-year, 10-year, and life-of-fund periods ended 10/31/22, there were 451, 436, 404, 364, 250, and 82 funds, respectively, in this Lipper category.
Fund price and distribution information For the 6-month period ended 10/31/22
| | | | | | | |
| | Class A | Class B | Class C | Class R | Class R6 | Class Y |
| | Before | After | Net | Net | Net | Net | Net |
| | sales | sales | asset | asset | asset | asset | asset |
| Share value | charge | charge | value | value | value | value | value |
| 4/30/22 | $17.08 | $18.12 | $14.20 | $14.15 | $16.20 | $17.39 | $17.30 |
| 10/31/22 | 15.53 | 16.48 | 12.86 | 12.81 | 14.71 | 15.84 | 15.75 |
The classification of distributions, if any, is an estimate. Before-sales-charge share value and current dividend rate for class A shares, if applicable, do not take into account any sales charge levied at the time of purchase. After-sales-charge share value, current dividend rate, and current 30-day SEC yield, if applicable, are calculated assuming that the maximum sales charge (5.75% for class A shares) was levied at the time of purchase. Final distribution information will appear on your year-end tax forms.
The fund made no distributions during the period.
|
| 8 Sustainable Future Fund |
Annualized fund performance as of most recent calendar quarter
Total return for periods ended 9/30/22
| | | | | | |
| | Life of fund | 10 years | 5 years | 3 years | 1 year | 6 months |
| Class A (11/1/99) | | | | | | |
| Before sales charge | 8.84% | 9.35% | 5.38% | 4.49% | –38.09% | –23.85% |
| After sales charge | 8.55 | 8.70 | 4.14 | 2.45 | –41.65 | –28.23 |
| Class B (1/16/01) | | | | | | |
| Before CDSC | 8.66 | 8.94 | 4.59 | 3.71 | –38.54 | –24.10 |
| After CDSC | 8.66 | 8.94 | 4.37 | 2.96 | –41.10 | –27.90 |
| Class C (1/16/01) | | | | | | |
| Before CDSC | 8.55 | 8.70 | 4.59 | 3.72 | –38.54 | –24.13 |
| After CDSC | 8.55 | 8.70 | 4.59 | 3.72 | –39.06 | –24.89 |
| Class R (4/1/03) | | | | | | |
| Net asset value | 8.57 | 9.08 | 5.11 | 4.25 | –38.23 | –23.95 |
| Class R6 (5/22/18) | | | | | | |
| Net asset value | 9.11 | 9.69 | 5.76 | 4.90 | –37.83 | –23.68 |
| Class Y (4/2/02) | | | | | | |
| Net asset value | 9.09 | 9.63 | 5.65 | 4.78 | –37.90 | –23.72 |
See the discussion following the fund performance table on page 7 for information about the calculation of fund performance.
Returns for periods of less than one year are not annualized.
Your fund’s expenses
As a mutual fund investor, you pay ongoing expenses, such as management fees, distribution fees (12b-1 fees), and other expenses. Using the following information, you can estimate how these expenses affect your investment and compare them with the expenses of other funds. You may also pay one-time transaction expenses, including sales charges (loads) and redemption fees, which are not shown in this section and would have resulted in higher total expenses. For more information, see your fund’s prospectus or talk to your financial representative.
Expense ratios
| | | | | | |
| | Class A | Class B | Class C | Class R | Class R6 | Class Y |
| Total annual operating expenses for the | | | | | | |
| fiscal year ended 4/30/22 | 1.00% | 1.75% | 1.75% | 1.25% | 0.65% | 0.75% |
| Annualized expense ratio for the | | | | | | |
| six-month period ended 10/31/22 | 1.06% | 1.81% | 1.81% | 1.31% | 0.68% | 0.81% |
Fiscal year expense information in this table is taken from the most recent prospectus, is subject to change, and may differ from that shown for the annualized expense ratio and in the financial highlights of this report.
Expenses are shown as a percentage of average net assets.
|
| Sustainable Future Fund 9 |
Expenses per $1,000
The following table shows the expenses you would have paid on a $1,000 investment in each class of the fund from 5/1/22 to 10/31/22. It also shows how much a $1,000 investment would be worth at the close of the period, assuming actual returns and expenses.
| | | | | | |
| | Class A | Class B | Class C | Class R | Class R6 | Class Y |
| Expenses paid per $1,000*† | $5.10 | $8.69 | $8.69 | $6.30 | $3.28 | $3.90 |
| Ending value (after expenses) | $909.30 | $905.60 | $905.30 | $908.00 | $910.90 | $910.40 |
* Expenses for each share class are calculated using the fund’s annualized expense ratio for each class, which represents the ongoing expenses as a percentage of average net assets for the six months ended 10/31/22. The expense ratio may differ for each share class.
† Expenses are calculated by multiplying the expense ratio by the average account value for the period; then multiplying the result by the number of days in the period (184); and then dividing that result by the number of days in the year (365).
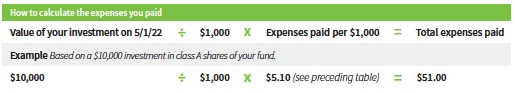
Estimate the expenses you paid
To estimate the ongoing expenses you paid for the six months ended 10/31/22, use the following calculation method. To find the value of your investment on 5/1/22, call Putnam at 1-800-225-1581.
Compare expenses using the SEC’s method
The Securities and Exchange Commission (SEC) has established guidelines to help investors assess fund expenses. Per these guidelines, the following table shows your fund’s expenses based on a $1,000 investment, assuming a hypothetical 5% annualized return. You can use this information to compare the ongoing expenses (but not transaction expenses or total costs) of investing in the fund with those of other funds. All mutual fund shareholder reports will provide this information to help you make this comparison. Please note that you cannot use this information to estimate your actual ending account balance and expenses paid during the period.
| | | | | | |
| | Class A | Class B | Class C | Class R | Class R6 | Class Y |
| Expenses paid per $1,000*† | $5.40 | $9.20 | $9.20 | $6.67 | $3.47 | $4.13 |
| Ending value (after expenses) | $1,019.86 | $1,016.08 | $1,016.08 | $1,018.60 | $1,021.78 | $1,021.12 |
* Expenses for each share class are calculated using the fund’s annualized expense ratio for each class, which represents the ongoing expenses as a percentage of average net assets for the six months ended 10/31/22. The expense ratio may differ for each share class.
† Expenses are calculated by multiplying the expense ratio by the average account value for the six-month period; then multiplying the result by the number of days in the six-month period (184); and then dividing that result by the number of days in the year (365).
|
| 10 Sustainable Future Fund |
Consider these risks before investing
The value of investments in the fund’s portfolio may fall or fail to rise over extended periods of time for a variety of reasons, including general economic, political, or financial market conditions; investor sentiment and market perceptions; government actions; geopolitical events or changes; and factors related to a specific issuer, geography, industry, or sector. These and other factors may lead to increased volatility and reduced liquidity in the fund’s portfolio holdings.
Growth stocks may be more susceptible to earnings disappointments and the market may not favor growth-style investing. Investments in small and midsize companies increase the risk of greater price fluctuations. From time to time, the fund may invest a significant portion of its assets in companies in one or more related industries or sectors, which would make the fund more vulnerable to adverse developments affecting those companies, industries, or sectors. International investing involves currency, economic, and political risks. Emerging market securities have illiquidity and volatility risks.
Investing with a focus on companies whose products and services produce positive environmental, social, and economic development impact may result in the fund investing in certain types of companies, industries, or sectors that underperform the market as a whole. In evaluating an investment opportunity, we may make investment decisions based on information and data that is incomplete or inaccurate. Due to changes in the products or services of the companies in which the fund invests, the fund may temporarily hold securities that are inconsistent with its sustainable investment criteria.
Our investment techniques, analyses, and judgments may not produce the outcome we intend. The investments we select for the fund may not perform as well as other securities that we do not select for the fund. We, or the fund’s other service providers, may experience disruptions or operating errors that could have a negative effect on the fund. You can lose money by investing in the fund.
|
| Sustainable Future Fund 11 |
Terms and definitions
Important terms
Total return shows how the value of the fund’s shares changed over time, assuming you held the shares through the entire period and reinvested all distributions in the fund.
Before sales charge, or net asset value, is the price, or value, of one share of a mutual fund, without a sales charge. Before-sales-charge figures fluctuate with market conditions. They are calculated by dividing the net assets of each class of shares by the number of outstanding shares in the class.
After sales charge is the price of a mutual fund share plus the maximum sales charge levied at the time of purchase. After-sales-charge performance figures shown here assume the 5.75% maximum sales charge for class A shares.
Contingent deferred sales charge (CDSC) is generally a charge applied at the time of the redemption of class B or C shares and assumes redemption at the end of the period. Your fund’s class B CDSC declines over time from a 5% maximum during the first year to 2% during the fifth year. After the fifth year, the CDSC no longer applies. The CDSC for class C shares is 1% for one year after purchase.
Share classes
Class A shares are generally subject to an initial sales charge and no CDSC (except on certain redemptions of shares bought without an initial sales charge).
Class B shares are closed to new investments and are only available by exchange from class B shares of another Putnam fund or through dividend and/or capital gains reinvestment. They are not subject to an initial sales charge and may be subject to a CDSC.
Class C shares are not subject to an initial sales charge and are subject to a CDSC only if the shares are redeemed during the first year.
Class R shares are not subject to an initial sales charge or CDSC and are only available to employer-sponsored retirement plans.
Class R6 shares are not subject to an initial sales charge or CDSC and carry no 12b-1 fee. They are generally only available to employer-sponsored retirement plans, corporate and institutional clients, and clients in other approved programs.
Class Y shares are not subject to an initial sales charge or CDSC and carry no 12b-1 fee. They are generally only available to corporate and institutional clients and clients in other approved programs.
Comparative indexes
Bloomberg U.S. Aggregate Bond Index is an unmanaged index of U.S. investment-grade fixed income securities.
ICE BofA (Intercontinental Exchange Bank of America) U.S. 3-Month Treasury Bill Index is an unmanaged index that seeks to measure the performance of U.S. Treasury bills available in the marketplace.
Russell 3000® Value Index is an unmanaged index of those companies in the Russell 3000 Index chosen for their value orientation.
Russell Midcap® Growth Index is an unmanaged index of those companies in the Russell Midcap Index chosen for their growth orientation.
Putnam Sustainable Future Linked Benchmark represents performance of the Russell 3000® Value Index through March 20, 2018, and performance of the Russell Midcap® Growth Index thereafter.
S&P 500® Index is an unmanaged index of common stock performance.
Indexes assume reinvestment of all distributions and do not account for fees. Securities and performance of a fund and an index will differ. You cannot invest directly in an index.
|
| 12 Sustainable Future Fund |
BLOOMBERG® is a trademark and service mark of Bloomberg Finance L.P. and its affiliates (collectively “Bloomberg”). Bloomberg or Bloomberg’s licensors own all proprietary rights in the Bloomberg Indices. Neither Bloomberg nor Bloomberg’s licensors approve or endorse this material, or guarantee the accuracy or completeness of any information herein, or make any warranty, express or implied, as to the results to be obtained therefrom, and to the maximum extent allowed by law, neither shall have any liability or responsibility for injury or damages arising in connection therewith.
Frank Russell Company is the source and owner of the trademarks, service marks, and copyrights related to the Russell Indexes. Russell® is a trademark of Frank Russell Company.
ICE Data Indices, LLC (“ICE BofA”), used with permission. ICE BofA permits use of the ICE BofA indices and related data on an “as is” basis; makes no warranties regarding same; does not guarantee the suitability, quality, accuracy, timeliness, and/or completeness of the ICE BofA indices or any data included in, related to, or derived therefrom; assumes no liability in connection with the use of the foregoing; and does not sponsor, endorse, or recommend Putnam Investments, or any of its products or services.
Lipper, a Refinitiv company, is a third-party industry-ranking entity that ranks mutual funds. Its rankings do not reflect sales charges. Lipper rankings are based on total return at net asset value relative to other funds that have similar current investment styles or objectives as determined by Lipper. Lipper may change a fund’s category assignment at its discretion. Lipper category medians reflect performance trends for funds within a category.
|
| Sustainable Future Fund 13 |
Other information for shareholders
Important notice regarding delivery of shareholder documents
In accordance with Securities and Exchange Commission (SEC) regulations, Putnam sends a single notice of internet availability, or a single printed copy, of annual and semiannual shareholder reports, prospectuses, and proxy statements to Putnam shareholders who share the same address, unless a shareholder requests otherwise. If you prefer to receive your own copy of these documents, please call Putnam at 1-800-225-1581, and Putnam will begin sending individual copies within 30 days.
Proxy voting
Putnam is committed to managing our mutual funds in the best interests of our shareholders. The Putnam funds’ proxy voting guidelines and procedures, as well as information regarding how your fund voted proxies relating to portfolio securities during the 12-month period ended June 30, 2022, are available in the Individual Investors section of putnam.com and on the SEC’s website, www.sec.gov. If you have questions about finding forms on the SEC’s website, you may call the SEC at 1-800-SEC-0330. You may also obtain the Putnam funds’ proxy voting guidelines and procedures at no charge by calling Putnam’s Shareholder Services at 1-800-225-1581.
Fund portfolio holdings
The fund will file a complete schedule of its portfolio holdings with the SEC for the first and third quarters of each fiscal year on Form N-PORT within 60 days of the end of such fiscal quarter. Shareholders may obtain the fund’s Form N-PORT on the SEC’s website at www.sec.gov.
Prior to its use of Form N-PORT, the fund filed its complete schedule of its portfolio holdings with the SEC on Form N-Q, which is available online at www.sec.gov.
Trustee and employee fund ownership
Putnam employees and members of the Board of Trustees place their faith, confidence, and, most importantly, investment dollars in Putnam mutual funds. As of October 31, 2022, Putnam employees had approximately $449,000,000 and the Trustees had approximately $60,000,000 invested in Putnam mutual funds. These amounts include investments by the Trustees’ and employees’ immediate family members as well as investments through retirement and deferred compensation plans.
|
| 14 Sustainable Future Fund |
Trustee approval of management contract
General conclusions
The Board of Trustees of The Putnam Funds oversees the management of each fund and, as required by law, determines annually whether to approve the continuance of your fund’s management contract with Putnam Investment Management, LLC (“Putnam Management”) and the sub-management contract with respect to your fund between Putnam Management and its affiliate, Putnam Investments Limited (“PIL”). The Board, with the assistance of its Contract Committee, requests and evaluates all information it deems reasonably necessary under the circumstances in connection with its annual contract review. The Contract Committee consists solely of Trustees who are not “interested persons” (as this term is defined in the Investment Company Act of 1940, as amended (the “1940 Act”)) of The Putnam Funds (“Independent Trustees”).
At the outset of the review process, members of the Board’s independent staff and independent legal counsel considered any possible changes to the annual contract review materials furnished to the Contract Committee during the course of the previous year’s review and, as applicable, identified those changes to Putnam Management. Following these discussions and in consultation with the Contract Committee, the Independent Trustees’ independent legal counsel requested that Putnam Management and its affiliates furnish specified information, together with any additional information that Putnam Management considered relevant, to the Contract Committee. Over the course of several months ending in June 2022, the Contract Committee met on a number of occasions with representatives of Putnam Management, and separately in executive session, to consider the information that Putnam Management provided. Throughout this process, the Contract Committee was assisted by the members of the Board’s independent staff and by independent legal counsel for The Putnam Funds and the Independent Trustees.
In May 2022, the Contract Committee met in executive session to discuss and consider its recommendations with respect to the continuance of the contracts. At the Trustees’ June 2022 meeting, the Contract Committee met in executive session with the other Independent Trustees to review a summary of the key financial, performance and other data that the Contract Committee considered in the course of its review. The Contract Committee then presented its written report, which summarized the key factors that the Committee had considered and set forth its recommendations. The Contract Committee recommended, and the Independent Trustees approved, the continuance of your fund’s management contract and the approval of your fund’s amended and restated sub-management contract, effective July 1, 2022. (Because PIL is an affiliate of Putnam Management and Putnam Management remains fully responsible for all services provided by PIL, the Trustees have not attempted to evaluate PIL as a separate entity, and all subsequent references to Putnam Management below should be deemed to include reference to PIL as necessary or appropriate in the context.)
The Independent Trustees’ approval was based on the following conclusions:
• That the fee schedule in effect for your fund represented reasonable compensation in light of the nature and quality of the services being provided to the fund, the fees paid by competitive funds, the costs incurred by Putnam Management in providing services to the fund and the application of certain reductions and waivers noted below; and
• That the fee schedule in effect for your fund represented an appropriate sharing between fund shareholders and Putnam Management of any economies of scale as may exist in the management of the fund at current asset levels.
These conclusions were based on a comprehensive consideration of all information provided to the Trustees and were not the result of any single factor. Some of the factors that figured particularly in the Trustees’ deliberations and how the Trustees considered these factors are described below, although individual Trustees may have evaluated the information presented differently, giving different weights to various factors. It is also important to recognize that the management arrangements for your fund and the other Putnam funds are the result of many years of review and discussion between the Independent Trustees and Putnam Management, that some aspects of the arrangements may receive greater scrutiny in some years than others and that the Trustees’ conclusions may be based, in part, on their consideration of fee arrangements in previous years. For example,
|
| Sustainable Future Fund 15 |
with certain exceptions primarily involving newer or repositioned funds, the current fee arrangements under the vast majority of the funds’ management contracts were first implemented at the beginning of 2010 following extensive review by the Contract Committee and discussions with representatives of Putnam Management, as well as approval by shareholders.
Management fee schedules and total expenses
The Trustees reviewed the management fee schedules in effect for all Putnam funds, including fee levels and breakpoints. Under its management contract, your fund has the benefit of breakpoints in its management fee schedule that provide shareholders with reduced fee levels as assets under management in the Putnam family of funds increase. The Trustees also reviewed the total expenses of each Putnam fund, recognizing that in most cases management fees represented the major, but not the sole, determinant of total costs to fund shareholders. (Two funds have implemented so-called “all-in” management fees covering substantially all routine fund operating costs.) The Trustees considered that the proposed amended and restated sub-management contract would lower the sub-management fees paid by Putnam Management to PIL.
In reviewing fees and expenses, the Trustees generally focus their attention on material changes in circumstances — for example, changes in assets under management, changes in a fund’s investment strategy, changes in Putnam Management’s operating costs or profitability, or changes in competitive practices in the mutual fund industry — that suggest that consideration of fee changes might be warranted. The Trustees concluded that the circumstances did not indicate that changes to the management fee schedule for your fund would be appropriate at this time.
As in the past, the Trustees also focused on the competitiveness of each fund’s total expense ratio. The Trustees and Putnam Management and the funds’ investor servicing agent, Putnam Investor Services, Inc. (“PSERV”), have implemented expense limitations that were in effect during your fund’s fiscal year ending in 2021. These expense limitations were: (i) a contractual expense limitation applicable to specified open-end funds, including your fund, of 25 basis points on investor servicing fees and expenses and (ii) a contractual expense limitation applicable to specified open-end funds, including your fund, of 20 basis points on so-called “other expenses” (i.e., all expenses exclusive of management fees, distribution fees, investor servicing fees, investment-related expenses, interest, taxes, brokerage commissions, acquired fund fees and expenses and extraordinary expenses). These expense limitations attempt to maintain competitive expense levels for the funds. Most funds, including your fund, had sufficiently low expenses that these expense limitations were not operative during their fiscal years ending in 2021. PSERV has agreed to maintain the 25 basis point investor servicing expense limitation until at least August 31, 2023 and Putnam Management has agreed to maintain the 20 basis point “other expenses” limitation until at least August 30, 2023. Putnam Management and PSERV’s commitment to these expense limitation arrangements, which were intended to support an effort to have fund expenses meet competitive standards, was an important factor in the Trustees’ decision to approve the continuance of your fund’s management contract and to approve your fund’s amended and restated sub-management contract.
The Trustees reviewed comparative fee and expense information for a custom group of competitive funds selected by Broadridge Financial Solutions, Inc. (“Broadridge”). This comparative information included your fund’s percentile ranking for effective management fees and total expenses (excluding any applicable 12b-1 fees), which provides a general indication of your fund’s relative standing. In the custom peer group, your fund ranked in the first quintile in effective management fees (determined for your fund and the other funds in the custom peer group based on fund asset size and the applicable contractual management fee schedule) and in the first quintile in total expenses (excluding any applicable 12b-1 fees) as of December 31, 2021. The first quintile represents the least expensive funds and the fifth quintile the most expensive funds. The fee and expense data reported by Broadridge as of December 31, 2021 reflected the most recent fiscal year-end data available in Broadridge’s database at that time.
In connection with their review of fund management fees and total expenses, the Trustees also reviewed the costs of the services provided and the profits realized by Putnam Management and its affiliates from their contractual relationships with the funds. This information included trends in revenues, expenses and profitability of Putnam
|
| 16 Sustainable Future Fund |
Management and its affiliates relating to the investment management, investor servicing and distribution services provided to the funds. In this regard, the Trustees also reviewed an analysis of the revenues, expenses and profitability of Putnam Management and its affiliates, allocated on a fund-by-fund basis, with respect to the funds’ management, distribution and investor servicing contracts. For each fund, the analysis presented information about revenues, expenses and profitability for each of the agreements separately and for the agreements taken together on a combined basis. The Trustees concluded that, at current asset levels, the fee schedules in place for the Putnam funds, including the fee schedule for your fund, represented reasonable compensation for the services being provided and represented an appropriate sharing between fund shareholders and Putnam Management of any economies of scale as may exist in the management of the Putnam funds at that time.
The information examined by the Trustees in connection with their annual contract review for the Putnam funds included information regarding services provided and fees charged by Putnam Management and its affiliates to other clients, including collective investment trusts offered in the defined contribution and defined benefit retirement plan markets, sub-advised mutual funds, private funds sponsored by affiliates of Putnam Management, model-only separately managed accounts and Putnam Management’s exchange-traded funds. This information included, in cases where a product’s investment strategy corresponds with a fund’s strategy, comparisons of those fees with fees charged to the Putnam funds, as well as an assessment of the differences in the services provided to these clients as compared to the services provided to the Putnam funds. The Trustees observed that the differences in fee rates between these clients and the Putnam funds are by no means uniform when examined by individual asset sectors, suggesting that differences in the pricing of investment management services to these types of clients may reflect, among other things, historical competitive forces operating in separate marketplaces. The Trustees considered the fact that in many cases fee rates across different asset classes are higher on average for mutual funds than for other clients, and the Trustees also considered the differences between the services that Putnam Management provides to the Putnam funds and those that it provides to its other clients. The Trustees did not rely on these comparisons to any significant extent in concluding that the management fees paid by your fund are reasonable.
Investment performance
The quality of the investment process provided by Putnam Management represented a major factor in the Trustees’ evaluation of the quality of services provided by Putnam Management under your fund’s management contract. The Trustees were assisted in their review of Putnam Management’s investment process and performance by the work of the investment oversight committees of the Trustees and the full Board of Trustees, which meet on a regular basis with individual portfolio managers and with senior management of Putnam Management’s Investment Division throughout the year. The Trustees concluded that Putnam Management generally provides a high-quality investment process — based on the experience and skills of the individuals assigned to the management of fund portfolios, the resources made available to them and in general Putnam Management’s ability to attract and retain high-quality personnel — but also recognized that this does not guarantee favorable investment results for every fund in every time period.
The Trustees considered that, in the aggregate, the Putnam funds’ performance was generally solid in 2021 against a backdrop of strong U.S. economic and financial market growth. The Trustees considered Putnam Management’s observation that, despite an environment of generally strong growth, there had been various headwinds experienced in 2021. For the one-year period ended December 31, 2021, the Trustees noted that the Putnam funds, on an asset-weighted basis, ranked in the 52nd percentile of their peers as determined by Lipper Inc. (“Lipper”) and, on an asset-weighted-basis, delivered a gross return that trailed their benchmarks by 0.1%. Over the longer-term, the Committee noted that, on an asset-weighted basis, the Putnam funds delivered strong aggregate performance relative to their Lipper peers over the three-, five- and ten-year periods ended December 31, 2021, ranking in the 31st, 29th and 21st percentiles, respectively, and that the funds, in the aggregate, outperformed their benchmarks on a gross basis for each of those periods.
In addition to the performance of the individual Putnam funds, the Trustees considered, as they had in prior years, the performance of The Putnam
|
| Sustainable Future Fund 17 |
Fund complex versus competitor fund complexes. In particular, the Trustees considered The Putnam Fund complex’s performance as reported in the Barron’s/Lipper Fund Families survey (the “Survey”), which ranks mutual fund companies based on their performance across a variety of asset types. The Trustees noted that The Putnam Fund complex continued to rank highly in the Survey, especially over the longer-term, with The Putnam Funds ranking as the 6th best performing mutual fund complex out of 45 complexes for the ten-year period and 13th out of 49 complexes for the five-year period. The Trustees noted that 2021 marked the fifth consecutive year that The Putnam Funds have ranked in the top ten fund complexes for the ten-year period. The Trustees also considered that The Putnam Fund complex’s Survey performance over the one-year period was solid, with The Putnam Funds ranking 27th out of 51 complexes. In addition to the Survey, the Trustees also considered the Putnam funds’ ratings assigned by Morningstar Inc., noting that 25 of the funds were four- or five-star rated at the end of 2021 (representing a decrease of one fund year-over-year) and that this included nine funds that had achieved a five-star rating (representing an increase of two funds year-over-year). They also noted, however, the disappointing investment performance of some Putnam funds for periods ended December 31, 2021 and considered information provided by Putnam Management regarding the factors contributing to the underperformance and actions being taken to improve the performance of these particular funds. The Trustees indicated their intention to continue to monitor closely the performance of those funds and evaluate whether additional actions to address areas of underperformance may be warranted.
For purposes of the Trustees’ evaluation of the Putnam funds’ investment performance, the Trustees generally focus on a competitive industry ranking of each fund’s total net return over a one-year, three-year and five-year period. For a number of Putnam funds with relatively unique investment mandates for which Putnam Management informed the Trustees that meaningful competitive performance rankings are not considered to be available, the Trustees evaluated performance based on their total gross and net returns and comparisons of those returns to the returns of selected investment benchmarks. In the case of your fund, the Trustees considered information about your fund’s total return and its performance relative to its benchmark over the one-year, three-year and five-year periods ended December 31, 2021. Your fund’s class A shares’ return, net of fees and expenses, was positive but trailed the return of its benchmark over the one-year period ended December 31, 2021, and was positive and exceeded the return of its benchmark over the three-year and five-year periods ended December 31, 2021. (When considering performance information, shareholders should be mindful that past performance is not a guarantee of future results.)
The Trustees expressed concern about your fund’s significant underperformance relative to its benchmark over the one-year period ended December 31, 2021 and considered the circumstances that may have contributed to this disappointing performance. The Trustees noted Putnam Management’s observation that stock selection detracted from the fund’s performance during the period. The Trustees considered Putnam Management’s view that sector allocation, including an underweight to the consumer discretionary sector and an overweight to the health care sector, also detracted from the fund’s performance.
The Trustees considered Putnam Management’s observation that style factors, including relative value exposure and underexposure to volatility, contributed positively to the fund’s performance. The Trustees also considered the fund’s strong benchmark-relative and absolute performance over the three-year period ended December 31, 2021 and the fund’s significant excess return as compared to its benchmark in 2020. The Trustees noted that Putnam Management remained confident in the fund’s portfolio managers. The Trustees also considered Putnam Management’s continued efforts to support fund performance through certain initiatives, including structuring compensation for portfolio managers to enhance accountability for fund performance, emphasizing accountability in the portfolio management process and affirming its commitment to a fundamental-driven approach to investing. The Trustees noted further that Putnam Management had made selective hires and internal promotions in 2021 to strengthen its investment team.
As a general matter, the Trustees believe that cooperative efforts between the Trustees and Putnam Management represent the most effective way to address investment performance concerns that may arise from time to time. The
|
| 18 Sustainable Future Fund |
Trustees noted that investors in the Putnam funds have, in effect, placed their trust in the Putnam organization, under the oversight of the funds’ Trustees, to make appropriate decisions regarding the management of the funds. The Trustees also considered that Putnam Management has made changes in light of subpar investment performance when warranted. Based on Putnam Management’s willingness to take appropriate measures to address fund performance issues, the Trustees concluded that it continued to be advisable to seek change within Putnam Management to address performance shortcomings. In the Trustees’ view, the alternative of engaging a new investment adviser for an underperforming fund, with all the attendant risks and disruptions, would not likely provide any greater assurance of improved investment performance.
Brokerage and soft-dollar allocations; investor servicing
The Trustees considered various potential benefits that Putnam Management may receive in connection with the services it provides under the management contract with your fund. These include benefits related to brokerage allocation and the use of soft dollars, whereby a portion of the commissions paid by a fund for brokerage may be used to acquire research services that are expected to be useful to Putnam Management in managing the assets of the fund and of other clients. Subject to policies established by the Trustees, soft dollars generated by these means are used predominantly to acquire brokerage and research services (including third-party research and market data) that enhance Putnam Management’s investment capabilities and supplement Putnam Management’s internal research efforts. The Trustees indicated their continued intent to monitor regulatory and industry developments in this area with the assistance of their Brokerage Committee. In addition, with the assistance of their Brokerage Committee, the Trustees indicated their continued intent to monitor the allocation of the Putnam funds’ brokerage in order to ensure that the principle of seeking best price and execution remains paramount in the portfolio trading process.
Putnam Management may also receive benefits from payments that the funds make to Putnam Management’s affiliates for investor or distribution services. In conjunction with the annual review of your fund’s management and sub-management contracts, the Trustees reviewed your fund’s investor servicing agreement with PSERV and its distributor’s contract and distribution plans with Putnam Retail Management Limited Partnership (“PRM”), both of which are affiliates of Putnam Management. The Trustees concluded that the fees payable by the funds to PSERV and PRM, as applicable, for such services are fair and reasonable in relation to the nature and quality of such services, the fees paid by competitive funds and the costs incurred by PSERV and PRM, as applicable, in providing such services. Furthermore, the Trustees were of the view that the investor services provided by PSERV were required for the operation of the funds, and that they were of a quality at least equal to those provided by other providers.
|
| Sustainable Future Fund 19 |
Financial statements
These sections of the report, as well as the accompanying Notes, constitute the fund’s financial statements.
The fund’s portfolio lists all the fund’s investments and their values as of the last day of the reporting period. Holdings are organized by asset type and industry sector, country, or state to show areas of concentration and diversification.
Statement of assets and liabilities shows how the fund’s net assets and share price are determined. All investment and non-investment assets are added together. Any unpaid expenses and other liabilities are subtracted from this total. The result is divided by the number of shares to determine the net asset value per share, which is calculated separately for each class of shares. (For funds with preferred shares, the amount subtracted from total assets includes the liquidation preference of preferred shares.)
Statement of operations shows the fund’s net investment gain or loss. This is done by first adding up all the fund’s earnings — from dividends and interest income — and subtracting its operating expenses to determine net investment income (or loss). Then, any net gain or loss the fund realized on the sales of its holdings — as well as any unrealized gains or losses over the period — is added to or subtracted from the net investment result to determine the fund’s net gain or loss for the fiscal period.
Statement of changes in net assets shows how the fund’s net assets were affected by the fund’s net investment gain or loss, by distributions to shareholders, and by changes in the number of the fund’s shares. It lists distributions and their sources (net investment income or realized capital gains) over the current reporting period and the most recent fiscal year-end. The distributions listed here may not match the sources listed in the Statement of operations because the distributions are determined on a tax basis and may be paid in a different period from the one in which they were earned. Dividend sources are estimated at the time of declaration. Actual results may vary. Any non-taxable return of capital cannot be determined until final tax calculations are completed after the end of the fund’s fiscal period.
Financial highlights provide an overview of the fund’s investment results, per-share distributions, expense ratios, net investment income ratios, and portfolio turnover in one summary table, reflecting the five most recent reporting periods. In a semiannual report, the highlights table also includes the current reporting period.
|
| 20 Sustainable Future Fund |
| | |
| The fund’s portfolio 10/31/22 (Unaudited) | | |
|
| | |
| COMMON STOCKS (97.1%)* | Shares | Value |
| Banks (0.8%) | | |
| First Republic Bank/CA | 25,619 | $3,076,842 |
| | 3,076,842 |
| Biotechnology (5.3%) | | |
| Ascendis Pharma A/S ADR (Denmark) † | 23,900 | 2,748,500 |
| Compass Pathways PLC ADR (United Kingdom) † | 157,000 | 1,654,780 |
| Exact Sciences Corp. † | 86,600 | 3,011,948 |
| Immunocore Holdings PLC ADR (United Kingdom) † | 30,000 | 1,714,200 |
| Regeneron Pharmaceuticals, Inc. † | 10,900 | 8,161,375 |
| Twist Bioscience Corp. † | 69,325 | 2,275,940 |
| | 19,566,743 |
| Building products (1.7%) | | |
| Advanced Drainage Systems, Inc. | 52,200 | 6,048,936 |
| | 6,048,936 |
| Capital markets (2.8%) | | |
| MSCI, Inc. | 22,200 | 10,408,692 |
| | 10,408,692 |
| Chemicals (5.6%) | | |
| Ecolab, Inc. | 22,200 | 3,486,954 |
| Ginkgo Bioworks Holdings, Inc. † | 560,939 | 1,531,363 |
| Ginkgo Bioworks Holdings, Inc. † | 164,500 | 449,085 |
| Ingevity Corp. † | 68,000 | 4,574,360 |
| Koninklijke DSM NV (Netherlands) | 44,938 | 5,298,109 |
| Novozymes A/S Class B (Denmark) | 96,137 | 5,049,097 |
| | 20,388,968 |
| Commercial services and supplies (4.8%) | | |
| Casella Waste Systems, Inc. Class A † | 94,300 | 7,714,683 |
| Cintas Corp. | 23,500 | 10,047,425 |
| | 17,762,108 |
| Construction and engineering (1.5%) | | |
| Quanta Services, Inc. | 38,400 | 5,454,336 |
| | 5,454,336 |
| Diversified consumer services (0.9%) | | |
| Chegg, Inc. † | 144,900 | 3,125,493 |
| | 3,125,493 |
| Diversified financial services (1.3%) | | |
| Eurazeo SE (France) | 83,507 | 4,769,989 |
| | 4,769,989 |
| Diversified telecommunication services (1.5%) | | |
| Liberty Global PLC Class C (United Kingdom) † | 305,100 | 5,388,066 |
| | 5,388,066 |
| Electric utilities (2.3%) | | |
| NextEra Energy, Inc. | 107,400 | 8,323,500 |
| | 8,323,500 |
| Electrical equipment (1.2%) | | |
| Sunrun, Inc. † | 191,788 | 4,317,148 |
| | 4,317,148 |
| |
Sustainable Future Fund 21 |
| | |
| COMMON STOCKS (97.1%)* cont. | Shares | Value |
| Electronic equipment, instruments, and components (3.2%) | | |
| Trimble Inc. † | 109,300 | $6,575,488 |
| Zebra Technologies Corp. Class A † | 18,700 | 5,296,214 |
| | 11,871,702 |
| Food and staples retailing (1.5%) | | |
| Sprouts Farmers Market, Inc. † | 192,100 | 5,666,950 |
| | 5,666,950 |
| Food products (2.7%) | | |
| McCormick & Co., Inc. (non-voting shares) | 128,100 | 10,073,784 |
| | 10,073,784 |
| Health-care equipment and supplies (5.9%) | | |
| Cooper Cos., Inc. (The) | 19,800 | 5,413,122 |
| Dexcom, Inc. † | 95,600 | 11,546,567 |
| Edwards Lifesciences Corp. † | 63,500 | 4,599,305 |
| | 21,558,994 |
| Health-care providers and services (2.5%) | | |
| HealthEquity, Inc. † | 119,050 | 9,275,186 |
| | 9,275,186 |
| Health-care technology (1.8%) | | |
| Veeva Systems, Inc. Class A † | 40,300 | 6,767,982 |
| | 6,767,982 |
| Hotels, restaurants, and leisure (3.0%) | | |
| Chipotle Mexican Grill, Inc. † | 7,300 | 10,937,809 |
| | 10,937,809 |
| Interactive media and services (0.8%) | | |
| Pinterest, Inc. Class A † | 118,600 | 2,917,560 |
| | 2,917,560 |
| IT Services (3.3%) | | |
| Gartner, Inc. † | 23,800 | 7,185,696 |
| Mastercard, Inc. Class A | 15,200 | 4,988,336 |
| | 12,174,032 |
| Life sciences tools and services (7.3%) | | |
| Bio-Rad Laboratories, Inc. Class A † | 18,200 | 6,401,122 |
| Danaher Corp. | 44,400 | 11,174,148 |
| Thermo Fisher Scientific, Inc. | 17,500 | 8,994,475 |
| | 26,569,745 |
| Machinery (1.5%) | | |
| Federal Signal Corp. | 118,600 | 5,532,690 |
| | 5,532,690 |
| Mortgage real estate investment trusts (REITs) (1.2%) | | |
| Hannon Armstrong Sustainable Infrastructure Capital, Inc. R | 155,200 | 4,218,336 |
| | 4,218,336 |
| Pharmaceuticals (1.3%) | | |
| Zoetis, Inc. | 30,600 | 4,613,868 |
| | 4,613,868 |
| Professional services (2.3%) | | |
| Bureau Veritas SA (France) | 174,577 | 4,325,219 |
| Planet Labs PBC † | 811,500 | 4,260,375 |
| | 8,585,594 |
| |
22 Sustainable Future Fund |
| | |
| COMMON STOCKS (97.1%)* cont. | Shares | Value |
| Semiconductors and semiconductor equipment (4.5%) | | |
| Applied Materials, Inc. | 66,300 | $5,853,627 |
| ASML Holding NV (NY Reg Shares) (Netherlands) | 11,100 | 5,243,862 |
| NVIDIA Corp. | 14,200 | 1,916,574 |
| SolarEdge Technologies, Inc. (Israel) † | 15,200 | 3,496,456 |
| | 16,510,519 |
| Software (19.1%) | | |
| Adobe, Inc. † | 22,900 | 7,293,650 |
| Atlassian Corp. Class A † | 21,500 | 4,358,695 |
| Bill.com Holdings, Inc. † | 29,100 | 3,880,776 |
| Ceridian HCM Holding, Inc. † | 96,200 | 6,367,478 |
| Crowdstrike Holdings, Inc. Class A † | 64,800 | 10,445,760 |
| Dynatrace, Inc. † | 164,527 | 5,797,931 |
| Palo Alto Networks, Inc. † | 47,000 | 8,064,730 |
| Roper Technologies, Inc. | 18,600 | 7,710,444 |
| ServiceNow, Inc. † | 9,700 | 4,081,178 |
| Verra Mobility Corp. † | 349,300 | 5,962,551 |
| Zscaler, Inc. † | 37,600 | 5,794,160 |
| | 69,757,353 |
| Specialty retail (0.6%) | | |
| Brilliant Earth Group, Inc. Class A † | 283,189 | 2,268,344 |
| | 2,268,344 |
| Textiles, apparel, and luxury goods (3.2%) | | |
| Levi Strauss & Co. Class A | 377,100 | 5,641,416 |
| Lululemon Athletica, Inc. (Canada) † | 18,145 | 5,970,431 |
| | 11,611,847 |
| Trading companies and distributors (1.7%) | | |
| Core & Main, Inc. Class A † | 268,500 | 6,331,230 |
| | 6,331,230 |
| Total common stocks (cost $322,663,915) | $355,874,346 |
|
| | | |
| SHORT-TERM INVESTMENTS (3.6%)* | Principal amount/
shares | Value |
| Putnam Short Term Investment Fund Class P 3.21% L | Shares | 12,986,593 | $12,986,593 |
| State Street Institutional U.S. Government Money Market Fund, Premier Class 3.01% P | Shares | 30,000 | 30,000 |
| U.S. Treasury Bills 2.805%, 11/8/22 | | $200,000 | 199,896 |
| U.S. Treasury Bills zero%, 2/23/23 i | | 32,000 | 31,581 |
| Total short-term investments (cost $13,248,067) | $13,248,070 |
|
| |
| TOTAL INVESTMENTS |
| Total investments (cost $335,911,982) | $369,122,416 |
|
| |
| Key to holding’s abbreviations |
| ADR | American Depository Receipts: Represents ownership of foreign securities on deposit with a custodian bank. |
|
| |
Sustainable Future Fund 23 |
| | | |
| Notes to the fund’s portfolio |
| Unless noted otherwise, the notes to the fund’s portfolio are for the close of the fund’s reporting period, which ran from May 1, 2022 through October 31, 2022 (the reporting period). Within the following notes to the portfolio, references to “Putnam Management” represent Putnam Investment Management, LLC, the fund’s manager, an indirect wholly-owned subsidiary of Putnam Investments, LLC and references to “ASC 820” represent Accounting Standards Codification 820 Fair Value Measurements and Disclosures. |
| * | Percentages indicated are based on net assets of $366,576,162. |
| † | This security is non-income-producing. |
| i | This security was pledged, or purchased with cash that was pledged, to the fund for collateral on certain derivative contracts (Note 1). |
| L | Affiliated company (Note 5). The rate quoted in the security description is the annualized 7-day yield of the fund at the close of the reporting period. |
| P | This security was pledged, or purchased with cash that was pledged, to the fund for collateral on certain derivative contracts. The rate quoted in the security description is the annualized 7-day yield of the fund at the close of the reporting period. |
| R | Real Estate Investment Trust. |
| Unless otherwise noted, the rates quoted in Short-term investments security descriptions represent the weighted average yield to maturity. |
| The dates shown on debt obligations are the original maturity dates. |
|
| | | | | | |
| FORWARD CURRENCY CONTRACTS at 10/31/22 (aggregate face value $46,374,375) (Unaudited) |
| Counterparty | Currency | Contract
type* | Delivery
date | Value | Aggregate
face value | Unrealized
appreciation/
(depreciation) |
| Bank of America N.A. |
| Canadian Dollar | Sell | 1/18/23 | $491,143 | $490,043 | $(1,100) |
| Danish Krone | Sell | 12/21/22 | 2,158,801 | 2,221,056 | 62,255 |
| Euro | Sell | 12/21/22 | 5,172,704 | 5,274,986 | 102,282 |
| Barclays Bank PLC |
| British Pound | Sell | 12/21/22 | 1,814,810 | 1,830,996 | 16,186 |
| Citibank, N.A. |
| Israeli Shekel | Sell | 1/18/23 | 1,573,062 | 1,567,090 | (5,972) |
| Goldman Sachs International |
| Israeli Shekel | Buy | 1/18/23 | 605,580 | 599,516 | 6,064 |
| HSBC Bank USA, National Association |
| British Pound | Sell | 12/21/22 | 4,433,637 | 4,473,002 | 39,365 |
| Canadian Dollar | Sell | 1/18/23 | 709,673 | 707,624 | (2,049) |
| Danish Krone | Sell | 12/21/22 | 3,010,065 | 3,097,092 | 87,027 |
| Euro | Sell | 12/21/22 | 9,052,356 | 9,232,920 | 180,564 |
| Israeli Shekel | Sell | 1/18/23 | 1,663,644 | 1,666,743 | 3,099 |
| Swedish Krona | Buy | 12/21/22 | 1,740,425 | 1,831,650 | (91,225) |
| JPMorgan Chase Bank N.A. |
| Euro | Sell | 12/21/22 | 983,160 | 1,002,598 | 19,438 |
| Morgan Stanley & Co. International PLC |
| British Pound | Sell | 12/21/22 | 1,368,058 | 1,380,291 | 12,233 |
| Danish Krone | Sell | 12/21/22 | 2,027,661 | 2,015,828 | (11,833) |
| Euro | Sell | 12/21/22 | 3,216,505 | 3,343,372 | 126,867 |
| |
24 Sustainable Future Fund |
| | | | | | |
| FORWARD CURRENCY CONTRACTS at 10/31/22 (aggregate face value $46,374,375) (Unaudited) cont. |
| Counterparty | Currency | Contract
type* | Delivery
date | Value | Aggregate
face value | Unrealized
appreciation/
(depreciation) |
| State Street Bank and Trust Co. |
| British Pound | Sell | 12/21/22 | $1,092,930 | $1,076,078 | $(16,852) |
| Canadian Dollar | Sell | 1/18/23 | 728,631 | 726,528 | (2,103) |
| Euro | Sell | 12/21/22 | 1,741,666 | 1,738,992 | (2,674) |
| Toronto-Dominion Bank |
| Euro | Buy | 12/21/22 | 1,032,775 | 1,047,752 | (14,977) |
| UBS AG |
| British Pound | Buy | 12/21/22 | 1,130,035 | 1,050,218 | 79,817 |
| Unrealized appreciation | 735,197 |
| Unrealized (depreciation) | (148,785) |
| Total | $586,412 |
| * The exchange currency for all contracts listed is the United States Dollar. |
|
ASC 820 establishes a three-level hierarchy for disclosure of fair value measurements. The valuation hierarchy is based upon the transparency of inputs to the valuation of the fund’s investments. The three levels are defined as follows:
Level 1: Valuations based on quoted prices for identical securities in active markets.
Level 2: Valuations based on quoted prices in markets that are not active or for which all significant inputs are observable, either directly or indirectly.
Level 3: Valuations based on inputs that are unobservable and significant to the fair value measurement.
| The following is a summary of the inputs used to value the fund’s net assets as of the close of the reporting period: |
|
| | | |
| | Valuation inputs |
| Investments in securities: | Level 1 | Level 2 | Level 3 |
| Common stocks*: | | | |
| Communication services | $8,305,626 | $— | $— |
| Consumer discretionary | 27,943,493 | — | — |
| Consumer staples | 15,740,734 | — | — |
| Financials | 22,473,859 | — | — |
| Health care | 88,352,518 | — | — |
| Industrials | 54,032,042 | — | — |
| Information technology | 110,313,606 | — | — |
| Materials | 20,388,968 | — | — |
| Utilities | 8,323,500 | — | — |
| Total common stocks | 355,874,346 | — | — |
| Short-term investments | 30,000 | 13,218,070 | — |
| Totals by level | $355,904,346 | $13,218,070 | $— |
|
| | | |
| | Valuation inputs |
| Other financial instruments: | Level 1 | Level 2 | Level 3 |
| Forward currency contracts | $— | $586,412 | $— |
| Totals by level | $— | $586,412 | $— |
| * Common stock classifications are presented at the sector level, which may differ from the fund’s portfolio presentation. |
The accompanying notes are an integral part of these financial statements.
| |
Sustainable Future Fund 25 |
Statement of assets and liabilities 10/31/22 (Unaudited)
| |
| ASSETS | |
| Investment in securities, at value (Note 1): | |
| Unaffiliated issuers (identified cost $322,925,389) | $356,135,823 |
| Affiliated issuers (identified cost $12,986,593) (Note 5) | 12,986,593 |
| Cash | 252 |
| Foreign currency (cost $236) (Note 1) | 234 |
| Dividends, interest and other receivables | 90,299 |
| Foreign tax reclaim | 121,028 |
| Receivable for shares of the fund sold | 159,596 |
| Receivable for investments sold | 963,097 |
| Unrealized appreciation on forward currency contracts (Note 1) | 735,197 |
| Prepaid assets | 35,921 |
| Total assets | 371,228,040 |
| |
| LIABILITIES | |
| Payable for investments purchased | 3,600,240 |
| Payable for shares of the fund repurchased | 311,906 |
| Payable for compensation of Manager (Note 2) | 167,417 |
| Payable for custodian fees (Note 2) | 8,301 |
| Payable for investor servicing fees (Note 2) | 105,621 |
| Payable for Trustee compensation and expenses (Note 2) | 105,570 |
| Payable for administrative services (Note 2) | 713 |
| Payable for distribution fees (Note 2) | 65,978 |
| Unrealized depreciation on forward currency contracts (Note 1) | 148,785 |
| Collateral on certain derivative contracts, at value (Notes 1 and 8) | 61,581 |
| Other accrued expenses | 75,766 |
| Total liabilities | 4,651,878 |
| | |
| Net assets | $366,576,162 |
| |
| REPRESENTED BY | |
| Paid-in capital (Unlimited shares authorized) (Notes 1 and 4) | $363,402,733 |
| Total distributable earnings (Note 1) | 3,173,429 |
| Total — Representing net assets applicable to capital shares outstanding | $366,576,162 |
(Continued on next page)
|
| 26 Sustainable Future Fund |
Statement of assets and liabilities cont.
| |
| COMPUTATION OF NET ASSET VALUE AND OFFERING PRICE | |
| Net asset value and redemption price per class A share | |
| ($277,443,331 divided by 17,864,630 shares) | $15.53 |
| Offering price per class A share (100/94.25 of $15.53)* | $16.48 |
| Net asset value and offering price per class B share ($142,253 divided by 11,062 shares)** | $12.86 |
| Net asset value and offering price per class C share ($6,842,911 divided by 534,142 shares)** | $12.81 |
| Net asset value, offering price and redemption price per class R share | |
| ($7,079,428 divided by 481,397 shares) | $14.71 |
| Net asset value, offering price and redemption price per class R6 share | |
| ($20,873,257 divided by 1,317,522 shares) | $15.84 |
| Net asset value, offering price and redemption price per class Y share | |
| ($54,194,982 divided by 3,441,977 shares) | $15.75 |
* On single retail sales of less than $50,000. On sales of $50,000 or more the offering price is reduced.
** Redemption price per share is equal to net asset value less any applicable contingent deferred sales charge.
The accompanying notes are an integral part of these financial statements.
|
| Sustainable Future Fund 27 |
Statement of operations Six months ended 10/31/22 (Unaudited)
| |
| INVESTMENT INCOME | |
| Dividends (net of foreign tax of $83,113) | $1,264,144 |
| Interest (including interest income of $90,238 from investments in affiliated issuers) (Note 5) | 92,367 |
| Securities lending (net of expenses) (Notes 1 and 5) | 10,661 |
| Total investment income | 1,367,172 |
| |
| EXPENSES | |
| Compensation of Manager (Note 2) | 1,042,405 |
| Investor servicing fees (Note 2) | 321,960 |
| Custodian fees (Note 2) | 8,205 |
| Trustee compensation and expenses (Note 2) | 8,183 |
| Distribution fees (Note 2) | 426,068 |
| Administrative services (Note 2) | 4,231 |
| Other | 132,003 |
| Total expenses | 1,943,055 |
| Expense reduction (Note 2) | (1,026) |
| Net expenses | 1,942,029 |
| | |
| Net investment loss | (574,857) |
| |
| REALIZED AND UNREALIZED GAIN (LOSS) | |
| Net realized gain (loss) on: | |
| Securities from unaffiliated issuers (Notes 1 and 3) | (27,476,843) |
| Foreign currency transactions (Note 1) | 699 |
| Forward currency contracts (Note 1) | 3,066,551 |
| Total net realized loss | (24,409,593) |
| Change in net unrealized appreciation (depreciation) on: | |
| Securities from unaffiliated issuers | (12,881,542) |
| Assets and liabilities in foreign currencies | (7,067) |
| Forward currency contracts | 54,791 |
| Total change in net unrealized depreciation | (12,833,818) |
| | |
| Net loss on investments | (37,243,411) |
| |
| Net decrease in net assets resulting from operations | $(37,818,268) |
The accompanying notes are an integral part of these financial statements.
|
| 28 Sustainable Future Fund |
Statement of changes in net assets
| | |
| DECREASE IN NET ASSETS | Six months ended 10/31/22* | Year ended 4/30/22 |
| Operations | | |
| Net investment loss | $(574,857) | $(3,499,539) |
| Net realized gain (loss) on investments | | |
| and foreign currency transactions | (24,409,593) | 41,019,558 |
| Change in net unrealized depreciation of investments | | |
| and assets and liabilities in foreign currencies | (12,833,818) | (186,096,851) |
| Net decrease in net assets resulting from operations | (37,818,268) | (148,576,832) |
| Distributions to shareholders (Note 1): | | |
| Net realized short-term gain on investments | | |
| Class A | — | (12,391,715) |
| Class B | — | (9,985) |
| Class C | — | (398,834) |
| Class R | — | (314,958) |
| Class R6 | — | (939,169) |
| Class Y | — | (2,235,518) |
| From net realized long-term gain on investments | | |
| Class A | — | (51,594,910) |
| Class B | — | (41,572) |
| Class C | — | (1,660,609) |
| Class R | — | (1,311,376) |
| Class R6 | — | (3,910,382) |
| Class Y | — | (9,307,939) |
| Increase (decrease) from capital share transactions (Note 4) | (8,800,003) | 24,267,017 |
| Total decrease in net assets | (46,618,271) | (208,426,782) |
| |
| NET ASSETS | | |
| Beginning of period | 413,194,433 | 621,621,215 |
| End of period | $366,576,162 | $413,194,433 |
* Unaudited.
The accompanying notes are an integral part of these financial statements.
|
| Sustainable Future Fund 29 |
Financial highlights
(For a common share outstanding throughout the period)
| | | | | | | | | | | | | |
| | INVESTMENT OPERATIONS | | | LESS DISTRIBUTIONS | | | | | RATIOS AND SUPPLEMENTAL DATA | |
| | | | | | | | | | | | | Ratio of net | |
| | Net asset | | Net realized | | | | | | | | Ratio | investment | |
| | value, | | and unrealized | Total from | From net | From net | | Net asset | Total return | Net assets, | of expenses | income (loss) | Portfolio |
| | beginning | Net investment | gain (loss) | investment | investment | realized gain | Total | value, end | at net asset | end of period | to average | to average | turnover |
| Period ended | of period | income (loss)a | on investments | operations | income | on investments | distributions | of period | value (%)b | (in thousands) | net assets (%)c | net assets (%) | (%) |
| Class A | | | | | | | | | | | | | |
| October 31, 2022** | $17.08 | (.03) | (1.52) | (1.55) | — | — | — | $15.53 | (9.07)* | $277,443 | .53* | (.17)* | 25* |
| April 30, 2022 | 26.82 | (.15) | (5.87) | (6.02) | — | (3.72) | (3.72) | 17.08 | (25.87) | 323,726 | 1.00 | (.63) | 50 |
| April 30, 2021 | 17.52 | (.10) | 11.92 | 11.82 | — | (2.52) | (2.52) | 26.82 | 69.07 | 481,902 | 1.02 | (.43) | 43 |
| April 30, 2020 | 17.45 | (.03) | .59 | .56 | (.01) | (.48) | (.49) | 17.52 | 3.15 | 311,058 | 1.07 | (.18) | 72 |
| April 30, 2019 | 19.58 | .10 | 2.23 | 2.33 | (.23) | (4.23) | (4.46) | 17.45 | 14.92 | 324,312 | 1.09 | .51 | 31 |
| April 30, 2018 | 19.59 | .11 | .77 | .88 | — | (.89) | (.89) | 19.58 | 4.53 | 324,298 | 1.07 | .56 | 116 |
| Class B | | | | | | | | | | | | | |
| October 31, 2022** | $14.20 | (.07) | (1.27) | (1.34) | — | — | — | $12.86 | (9.44)* | $142 | .91* | (.53)* | 25* |
| April 30, 2022 | 23.09 | (.29) | (4.88) | (5.17) | — | (3.72) | (3.72) | 14.20 | (26.41) | 199 | 1.75 | (1.38) | 50 |
| April 30, 2021 | 15.43 | (.25) | 10.43 | 10.18 | — | (2.52) | (2.52) | 23.09 | 67.75 | 358 | 1.77 | (1.19) | 43 |
| April 30, 2020 | 15.53 | (.14) | .52 | .38 | — | (.48) | (.48) | 15.43 | 2.39 | 146 | 1.82 | (.91) | 72 |
| April 30, 2019 | 17.92 | (.04) | 2.00 | 1.96 | (.12) | (4.23) | (4.35) | 15.53 | 14.08 | 216 | 1.84 | (.26) | 31 |
| April 30, 2018 | 18.14 | .07 | .60 | .67 | — | (.89) | (.89) | 17.92 | 3.72 | 91 | 1.82 | .36 | 116 |
| Class C | | | | | | | | | | | | | |
| October 31, 2022** | $14.15 | (.07) | (1.27) | (1.34) | — | — | — | $12.81 | (9.47)* | $6,843 | .91* | (.54)* | 25* |
| April 30, 2022 | 23.02 | (.29) | (4.86) | (5.15) | — | (3.72) | (3.72) | 14.15 | (26.40) | 8,581 | 1.75 | (1.38) | 50 |
| April 30, 2021 | 15.38 | (.24) | 10.40 | 10.16 | — | (2.52) | (2.52) | 23.02 | 67.84 | 14,396 | 1.77 | (1.17) | 43 |
| April 30, 2020 | 15.48 | (.14) | .52 | .38 | — | (.48) | (.48) | 15.38 | 2.40 | 11,503 | 1.82 | (.92) | 72 |
| April 30, 2019 | 17.80 | (.03) | 1.98 | 1.95 | (.04) | (4.23) | (4.27) | 15.48 | 14.04 | 14,027 | 1.84 | (.20) | 31 |
| April 30, 2018 | 18.02 | (.03) | .70 | .67 | — | (.89) | (.89) | 17.80 | 3.74 | 17,538 | 1.82 | (.16) | 116 |
| Class R | | | | | | | | | | | | | |
| October 31, 2022** | $16.20 | (.04) | (1.45) | (1.49) | — | — | — | $14.71 | (9.20)* | $7,079 | .66* | (.30)* | 25* |
| April 30, 2022 | 25.69 | (.21) | (5.56) | (5.77) | — | (3.72) | (3.72) | 16.20 | (26.05) | 7,931 | 1.25 | (.88) | 50 |
| April 30, 2021 | 16.89 | (.16) | 11.48 | 11.32 | — | (2.52) | (2.52) | 25.69 | 68.68 | 11,470 | 1.27 | (.68) | 43 |
| April 30, 2020 | 16.87 | (.07) | .57 | .50 | — | (.48) | (.48) | 16.89 | 2.92 | 8,318 | 1.32 | (.43) | 72 |
| April 30, 2019 | 19.06 | .05 | 2.16 | 2.21 | (.17) | (4.23) | (4.40) | 16.87 | 14.64 | 9,841 | 1.34 | .29 | 31 |
| April 30, 2018 | 19.14 | .06 | .75 | .81 | — | (.89) | (.89) | 19.06 | 4.26 | 10,835 | 1.32 | .32 | 116 |
| Class R6 | | | | | | | | | | | | | |
| October 31, 2022** | $17.39 | —d | (1.55) | (1.55) | — | — | — | $15.84 | (8.91)* | $20,873 | .34* | .02* | 25* |
| April 30, 2022 | 27.15 | (.07) | (5.97) | (6.04) | — | (3.72) | (3.72) | 17.39 | (25.62) | 23,724 | .65 | (.28) | 50 |
| April 30, 2021 | 17.65 | (.02) | 12.04 | 12.02 | — | (2.52) | (2.52) | 27.15 | 69.72 | 30,380 | .66 | (.09) | 43 |
| April 30, 2020 | 17.58 | .03 | .60 | .63 | (.08) | (.48) | (.56) | 17.65 | 3.51 | 15,191 | .68 | .19 | 72 |
| April 30, 2019 # | 20.59 | .14 | 1.35 | 1.49 | (.27) | (4.23) | (4.50) | 17.58 | 10.17* | 13,953 | .66* | .78* | 31 |
See notes to financial highlights at the end of this section.
The accompanying notes are an integral part of these financial statements.
| |
| 30 Sustainable Future Fund | Sustainable Future Fund 31 |
Financial highlights cont.
| | | | | | | | | | | | | |
| | INVESTMENT OPERATIONS | | | LESS DISTRIBUTIONS | | | | | RATIOS AND SUPPLEMENTAL DATA | |
| | | | | | | | | | | | | Ratio of net | |
| | Net asset | | Net realized | | | | | | | | Ratio | investment | |
| | value, | | and unrealized | Total from | From net | From net | | Net asset | Total return | Net assets, | of expenses | income (loss) | Portfolio |
| | beginning | Net investment | gain (loss) | investment | investment | realized gain | Total | value, end | at net asset | end of period | to average | to average | turnover |
| Period ended | of period | income (loss)a | on investments | operations | income | on investments | distributions | of period | value (%)b | (in thousands) | net assets (%)c | net assets (%) | (%) |
| Class Y | | | | | | | | | | | | | |
| October 31, 2022** | $17.30 | (.01) | (1.54) | (1.55) | — | — | — | $15.75 | (8.96)* | $54,195 | .41* | (.05)* | 25* |
| April 30, 2022 | 27.05 | (.10) | (5.93) | (6.03) | — | (3.72) | (3.72) | 17.30 | (25.68) | 49,034 | .75 | (.38) | 50 |
| April 30, 2021 | 17.61 | (.04) | 12.00 | 11.96 | — | (2.52) | (2.52) | 27.05 | 69.53 | 83,115 | .77 | (.17) | 43 |
| April 30, 2020 | 17.54 | .01 | .59 | .60 | (.05) | (.48) | (.53) | 17.61 | 3.38 | 41,056 | .82 | .06 | 72 |
| April 30, 2019 | 19.66 | .15 | 2.24 | 2.39 | (.28) | (4.23) | (4.51) | 17.54 | 15.23 | 32,539 | .84 | .79 | 31 |
| April 30, 2018 | 19.62 | .17 | .76 | .93 | — | (.89) | (.89) | 19.66 | 4.78 | 45,701 | .82 | .83 | 116 |
Before March 21, 2018, the fund was managed with a materially different investment strategy and may have achieved materially different performance results under its current investment strategy from that shown for periods before that date.
* Not annualized.
** Unaudited.
# For the period May 22, 2018 (commencement of operations) to April 30, 2019.
a Per share net investment income (loss) has been determined on the basis of the weighted average number of shares outstanding during the period.
b Total return assumes dividend reinvestment and does not reflect the effect of sales charges.
c Includes amounts paid through expense offset and/or brokerage/service arrangements, if any (Note 2). Also excludes acquired fund fees and expenses, if any.
d Amount represents less than $0.01 per share.
The accompanying notes are an integral part of these financial statements.
| |
| 32 Sustainable Future Fund | Sustainable Future Fund 33 |
Notes to financial statements 10/31/22 (Unaudited)
Within the following Notes to financial statements, references to “State Street” represent State Street Bank and Trust Company, references to “the SEC” represent the Securities and Exchange Commission, references to “Putnam Management” represent Putnam Investment Management, LLC, the fund’s manager, an indirect wholly-owned subsidiary of Putnam Investments, LLC and references to “OTC”, if any, represent over-the-counter. Unless otherwise noted, the “reporting period” represents the period from May 1, 2022 through October 31, 2022.
Putnam Sustainable Future Fund (the fund) is a diversified series of Putnam Investment Funds (the Trust), a Massachusetts business trust registered under the Investment Company Act of 1940, as amended, as an open-end management investment company. The goal of the fund is to seek long-term capital appreciation. The fund invests mainly in common stocks of U.S. companies of any size, with a focus on companies whose products and services Putnam Management believes provide solutions that directly contribute to sustainable social, environmental and economic development (Solutions Companies). Stocks of this type of company are typically, but not always, considered to be growth stocks. Growth stocks are stocks of companies whose revenues, earnings, or cash flows are expected to grow faster than those of similar firms, and whose business growth and other characteristics may lead to an increase in stock price. Putnam Management may consider, among other factors, a company’s impact on sustainable environmental, social and economic development (as described below), valuation, financial strength, growth potential, competitive position in its industry, projected future earnings, cash flows and dividends when deciding whether to buy or sell investments. The fund may also invest in non-U.S. companies.
Putnam Management’s approach to sustainable investing incorporates fundamental research together with consideration of sustainable environmental, social and economic development impact. Putnam Management believes that companies whose products and services produce positive environmental, social and economic development impact also often demonstrate potential for strong financial growth. Under normal circumstances, the fund invests at least 80% of the value of its net assets in securities that meet Putnam Management’s sustainability criteria. These criteria are based on a proprietary sustainability solutions map that links to the United Nations Sustainable Development Goals (SDGs). In applying these criteria, Putnam Management will assign each company a proprietary environmental, social and/or corporate governance (ESG) rating ranging from 1 to 4 (1 indicating the highest (best) ESG rating and 4 indicating the lowest (worst) ESG rating). In order to meet Putnam Management’s sustainability criteria for purposes of this investment policy, a company must be rated 2 or 1 by us. This policy is non-fundamental and may be changed only after 60 days’ notice to shareholders. In selecting each investment, Putnam Management considers the extent to which a company’s products or services may provide solutions to forward-looking sustainability needs, creating positive impact in environmental, social and economic development areas. Environmental impacts may include, for example, reduction of carbon emissions and improved water quality. Social impacts may include, for example, improvements in employee well-being, supplier standards, or access to products, information, or security. Economic development impacts may include, for example, stakeholder analysis and shared value approaches to business practices, access to economic opportunity, or improvements in operational effectiveness or efficiency.
The fund offers the following share classes. The expenses for each class of shares may differ based on the distribution and investor servicing fees of each class, which are identified in Note 2.
| | | |
| Share class | Sales charge | Contingent deferred sales charge | Conversion feature |
| | | 1.00% on certain redemptions of shares | |
| Class A | Up to 5.75% | bought with no initial sales charge | None |
| | | | Converts to class A shares |
| Class B* | None | 5.00% phased out over five years | after 5 years |
| | | | Converts to class A shares |
| Class C | None | 1.00% eliminated after one year | after 8 years |
| Class R† | None | None | None |
| Class R6† | None | None | None |
| Class Y† | None | None | None |
* Purchases of class B shares are closed to new and existing investors except by exchange from class B shares of another Putnam fund or through dividend and/or capital gains reinvestment.
† Not available to all investors.
|
| 34 Sustainable Future Fund |
In the normal course of business, the fund enters into contracts that may include agreements to indemnify another party under given circumstances. The fund’s maximum exposure under these arrangements is unknown as this would involve future claims that may be, but have not yet been, made against the fund. However, the fund’s management team expects the risk of material loss to be remote.
The fund has entered into contractual arrangements with an investment adviser, administrator, distributor, shareholder servicing agent and custodian, who each provide services to the fund. Unless expressly stated otherwise, shareholders are not parties to, or intended beneficiaries of these contractual arrangements, and these contractual arrangements are not intended to create any shareholder right to enforce them against the service providers or to seek any remedy under them against the service providers, either directly or on behalf of the fund.
Under the fund’s Amended and Restated Agreement and Declaration of Trust, any claims asserted against or on behalf of the Putnam Funds, including claims against Trustees and Officers, must be brought in state and federal courts located within the Commonwealth of Massachusetts.
Note 1: Significant accounting policies
The following is a summary of significant accounting policies consistently followed by the fund in the preparation of its financial statements. The preparation of financial statements is in conformity with accounting principles generally accepted in the United States of America and requires management to make estimates and assumptions that affect the reported amounts of assets and liabilities in the financial statements and the reported amounts of increases and decreases in net assets from operations. Actual results could differ from those estimates. Subsequent events after the Statement of assets and liabilities date through the date that the financial statements were issued have been evaluated in the preparation of the financial statements.
Investment income, realized and unrealized gains and losses and expenses of the fund are borne pro-rata based on the relative net assets of each class to the total net assets of the fund, except that each class bears expenses unique to that class (including the distribution fees applicable to such classes). Each class votes as a class only with respect to its own distribution plan or other matters on which a class vote is required by law or determined by the Trustees. If the fund were liquidated, shares of each class would receive their pro-rata share of the net assets of the fund. In addition, the Trustees declare separate dividends on each class of shares.
Security valuation Portfolio securities and other investments are valued using policies and procedures adopted by the Board of Trustees. The Trustees have formed a Pricing Committee to oversee the implementation of these procedures and have delegated responsibility for valuing the fund’s assets in accordance with these procedures to Putnam Management. Putnam Management has established an internal Valuation Committee that is responsible for making fair value determinations, evaluating the effectiveness of the pricing policies of the fund and reporting to the Pricing Committee.
Investments for which market quotations are readily available are valued at the last reported sales price on their principal exchange, or official closing price for certain markets, and are classified as Level 1 securities under Accounting Standards Codification 820 Fair Value Measurements and Disclosures (ASC 820). If no sales are reported, as in the case of some securities that are traded OTC, a security is valued at its last reported bid price and is generally categorized as a Level 2 security.
Investments in open-end investment companies (excluding exchange-traded funds), if any, which can be classified as Level 1 or Level 2 securities, are valued based on their net asset value. The net asset value of such investment companies equals the total value of their assets less their liabilities and divided by the number of their outstanding shares.
Market quotations are not considered to be readily available for certain debt obligations (including short-term investments with remaining maturities of 60 days or less) and other investments; such investments are valued on the basis of valuations furnished by an independent pricing service approved by the Trustees or dealers selected by Putnam Management. Such services or dealers determine valuations for normal institutional-size trading units of such securities using methods based on market transactions for comparable securities and various relationships, generally recognized by institutional traders, between securities (which consider such factors as security prices, yields, maturities and ratings). These securities will generally be categorized as Level 2.
Many securities markets and exchanges outside the U.S. close prior to the scheduled close of the New York Stock Exchange and therefore the closing prices for securities in such markets or on such exchanges may not fully reflect events that occur after such close but before the scheduled close of the New York Stock Exchange. Accordingly, on certain days, the fund will fair value certain foreign equity securities taking into account multiple factors including
|
| Sustainable Future Fund 35 |
movements in the U.S. securities markets, currency valuations and comparisons to the valuation of American Depository Receipts, exchange-traded funds and futures contracts. The foreign equity securities, which would generally be classified as Level 1 securities, will be transferred to Level 2 of the fair value hierarchy when they are valued at fair value. The number of days on which fair value prices will be used will depend on market activity and it is possible that fair value prices will be used by the fund to a significant extent. Securities quoted in foreign currencies, if any, are translated into U.S. dollars at the current exchange rate.
To the extent a pricing service or dealer is unable to value a security or provides a valuation that Putnam Management does not believe accurately reflects the security’s fair value, the security will be valued at fair value by Putnam Management in accordance with policies and procedures approved by the Trustees. Certain investments, including certain restricted and illiquid securities and derivatives, are also valued at fair value following procedures approved by the Trustees. These valuations consider such factors as significant market or specific security events such as interest rate or credit quality changes, various relationships with other securities, discount rates, U.S. Treasury, U.S. swap and credit yields, index levels, convexity exposures, recovery rates, sales and other multiples and resale restrictions. These securities are classified as Level 2 or as Level 3 depending on the priority of the significant inputs.
To assess the continuing appropriateness of fair valuations, the Valuation Committee reviews and affirms the reasonableness of such valuations on a regular basis after considering all relevant information that is reasonably available. Such valuations and procedures are reviewed periodically by the Trustees. The fair value of securities is generally determined as the amount that the fund could reasonably expect to realize from an orderly disposition of such securities over a reasonable period of time. By its nature, a fair value price is a good faith estimate of the value of a security in a current sale and does not reflect an actual market price, which may be different by a material amount.
Security transactions and related investment income Security transactions are recorded on the trade date (the date the order to buy or sell is executed). Gains or losses on securities sold are determined on the identified cost basis.
Interest income, net of any applicable withholding taxes, if any, and including amortization and accretion of premiums and discounts on debt securities, is recorded on the accrual basis. Dividend income, net of any applicable withholding taxes, is recognized on the ex-dividend date except that certain dividends from foreign securities, if any, are recognized as soon as the fund is informed of the ex-dividend date. Non-cash dividends, if any, are recorded at the fair value of the securities received. Dividends representing a return of capital or capital gains, if any, are reflected as a reduction of cost and/or as a realized gain.
Foreign currency translation The accounting records of the fund are maintained in U.S. dollars. The fair value of foreign securities, currency holdings, and other assets and liabilities is recorded in the books and records of the fund after translation to U.S. dollars based on the exchange rates on that day. The cost of each security is determined using historical exchange rates. Income and withholding taxes are translated at prevailing exchange rates when earned or incurred. The fund does not isolate that portion of realized or unrealized gains or losses resulting from changes in the foreign exchange rate on investments from fluctuations arising from changes in the market prices of the securities. Such gains and losses are included with the net realized and unrealized gain or loss on investments. Net realized gains and losses on foreign currency transactions represent net realized exchange gains or losses on disposition of foreign currencies, currency gains and losses realized between the trade and settlement dates on securities transactions and the difference between the amount of investment income and foreign withholding taxes recorded on the fund’s books and the U.S. dollar equivalent amounts actually received or paid. Net unrealized appreciation and depreciation of assets and liabilities in foreign currencies arise from changes in the value of assets and liabilities other than investments at the period end, resulting from changes in the exchange rate.
Forward currency contracts The fund buys and sells forward currency contracts, which are agreements between two parties to buy and sell currencies at a set price on a future date. These contracts are used to hedge foreign exchange risk.
The U.S. dollar value of forward currency contracts is determined using current forward currency exchange rates supplied by a quotation service. The fair value of the contract will fluctuate with changes in currency exchange rates. The contract is marked to market daily and the change in fair value is recorded as an unrealized gain or loss. The fund records a realized gain or loss equal to the difference between the value of the contract at the time it was opened and the value at the time it was closed when the contract matures or by delivery of the currency. The fund could be exposed to risk if the value of the currency changes unfavorably, if the counterparties to the contracts
|
| 36 Sustainable Future Fund |
are unable to meet the terms of their contracts or if the fund is unable to enter into a closing position. Risks may exceed amounts recognized on the Statement of assets and liabilities.
Forward currency contracts outstanding at period end, if any, are listed after the fund’s portfolio.
Master agreements The fund is a party to ISDA (International Swaps and Derivatives Association, Inc.) Master Agreements (Master Agreements) with certain counterparties that govern OTC derivative and foreign exchange contracts entered into from time to time. The Master Agreements may contain provisions regarding, among other things, the parties’ general obligations, representations, agreements, collateral requirements, events of default and early termination. With respect to certain counterparties, in accordance with the terms of the Master Agreements, collateral pledged to the fund is held in a segregated account by the fund’s custodian and, with respect to those amounts which can be sold or repledged, is presented in the fund’s portfolio.
Collateral pledged by the fund is segregated by the fund’s custodian and identified in the fund’s portfolio. Collateral can be in the form of cash or debt securities issued by the U.S. Government or related agencies or other securities as agreed to by the fund and the applicable counterparty. Collateral requirements are determined based on the fund’s net position with each counterparty.
Termination events applicable to the fund may occur upon a decline in the fund’s net assets below a specified threshold over a certain period of time. Termination events applicable to counterparties may occur upon a decline in the counterparty’s long-term and short-term credit ratings below a specified level. In each case, upon occurrence, the other party may elect to terminate early and cause settlement of all derivative and foreign exchange contracts outstanding, including the payment of any losses and costs resulting from such early termination, as reasonably determined by the terminating party. Any decision by one or more of the fund’s counterparties to elect early termination could impact the fund’s future derivative activity.
At the close of the reporting period, the fund had a net liability position of $42,578 on open derivative contracts subject to the Master Agreements. There was no collateral pledged by the fund at period end for these agreements.
Securities lending The fund may lend securities, through its agent, to qualified borrowers in order to earn additional income. The loans are collateralized by cash in an amount at least equal to the fair value of the securities loaned. The fair value of securities loaned is determined daily and any additional required collateral is allocated to the fund on the next business day. The remaining maturities of the securities lending transactions are considered overnight and continuous. The risk of borrower default will be borne by the fund’s agent; the fund will bear the risk of loss with respect to the investment of the cash collateral. Income from securities lending, net of expenses, is included in investment income on the Statement of operations. Cash collateral is invested in Putnam Cash Collateral Pool, LLC, a limited liability company managed by an affiliate of Putnam Management. Investments in Putnam Cash Collateral Pool, LLC are valued at its closing net asset value each business day. There are no management fees charged to Putnam Cash Collateral Pool, LLC. At the close of the reporting period, the fund had no securities out on loan.
Interfund lending The fund, along with other Putnam funds, may participate in an interfund lending program pursuant to an exemptive order issued by the SEC. This program allows the fund to borrow from or lend to other Putnam funds that permit such transactions. Interfund lending transactions are subject to each fund’s investment policies and borrowing and lending limits. Interest earned or paid on the interfund lending transaction will be based on the average of certain current market rates. During the reporting period, the fund did not utilize the program.
Lines of credit The fund participates, along with other Putnam funds, in a $100 million ($317.5 million prior to October 14, 2022) unsecured committed line of credit and a $235.5 million unsecured uncommitted line of credit, both provided by State Street. Borrowings may be made for temporary or emergency purposes, including the funding of shareholder redemption requests and trade settlements. Interest is charged to the fund based on the fund’s borrowing at a rate equal to 1.25% plus the higher of (1) the Federal Funds rate and (2) the Overnight Bank Funding Rate for the committed line of credit and 1.30% plus the higher of (1) the Federal Funds rate and (2) the Overnight Bank Funding Rate for the uncommitted line of credit. A closing fee equal to 0.04% of the committed line of credit and 0.04% of the uncommitted line of credit has been paid by the participating funds. In addition, a commitment fee of 0.21% per annum on any unutilized portion of the committed line of credit is allocated to the participating funds based on their relative net assets and paid quarterly. During the reporting period, the fund had no borrowings against these arrangements.
|
| Sustainable Future Fund 37 |
Federal taxes It is the policy of the fund to distribute all of its taxable income within the prescribed time period and otherwise comply with the provisions of the Internal Revenue Code of 1986, as amended (the Code), applicable to regulated investment companies. It is also the intention of the fund to distribute an amount sufficient to avoid imposition of any excise tax under Section 4982 of the Code.
The fund is subject to the provisions of Accounting Standards Codification 740 Income Taxes (ASC 740). ASC 740 sets forth a minimum threshold for financial statement recognition of the benefit of a tax position taken or expected to be taken in a tax return. The fund did not have a liability to record for any unrecognized tax benefits in the accompanying financial statements. No provision has been made for federal taxes on income, capital gains or unrealized appreciation on securities held nor for excise tax on income and capital gains. Each of the fund’s federal tax returns for the prior three fiscal years remains subject to examination by the Internal Revenue Service.
The fund may also be subject to taxes imposed by governments of countries in which it invests. Such taxes are generally based on either income or gains earned or repatriated. The fund accrues and applies such taxes to net investment income, net realized gains and net unrealized gains as income and/or capital gains are earned. In some cases, the fund may be entitled to reclaim all or a portion of such taxes, and such reclaim amounts, if any, are reflected as an asset on the fund’s books. In many cases, however, the fund may not receive such amounts for an extended period of time, depending on the country of investment.
Tax cost of investments includes adjustments to net unrealized appreciation (depreciation) which may not necessarily be final tax cost basis adjustments, but closely approximate the tax basis unrealized gains and losses that may be realized and distributed to shareholders. The aggregate identified cost on a tax basis is $338,893,680, resulting in gross unrealized appreciation and depreciation of $67,300,976 and $36,485,828, respectively, or net unrealized appreciation of $30,815,148.
Distributions to shareholders Distributions to shareholders from net investment income are recorded by the fund on the ex-dividend date. Distributions from capital gains, if any, are recorded on the ex-dividend date and paid at least annually. The amount and character of income and gains to be distributed are determined in accordance with income tax regulations, which may differ from generally accepted accounting principles. Dividend sources are estimated at the time of declaration. Actual results may vary. Any non-taxable return of capital cannot be determined until final tax calculations are completed after the end of the fund’s fiscal year. Reclassifications are made to the fund’s capital accounts to reflect income and gains available for distribution (or available capital loss carryovers) under income tax regulations.
Expenses of the Trust Expenses directly charged or attributable to any fund will be paid from the assets of that fund. Generally, expenses of the Trust will be allocated among and charged to the assets of each fund on a basis that the Trustees deem fair and equitable, which may be based on the relative assets of each fund or the nature of the services performed and relative applicability to each fund.
Note 2: Management fee, administrative services and other transactions
The fund pays Putnam Management a management fee (based on the fund’s average net assets and computed and paid monthly) at annual rates that may vary based on the average of the aggregate net assets of all open-end mutual funds sponsored by Putnam Management (excluding net assets of funds that are invested in, or that are invested in by, other Putnam funds to the extent necessary to avoid “double counting” of those assets). Such annual rates may vary as follows:
| | | | |
| 0.710% | of the first $5 billion, | | 0.510% | of the next $50 billion, |
| 0.660% | of the next $5 billion, | | 0.490% | of the next $50 billion, |
| 0.610% | of the next $10 billion, | | 0.480% | of the next $100 billion and |
| 0.560% | of the next $10 billion, | | 0.475% | of any excess thereafter. |
For the reporting period, the management fee represented an effective rate (excluding the impact from any expense waivers in effect) of 0.277% of the fund’s average net assets.
Putnam Management has contractually agreed, through August 30, 2023 to waive fees and/or reimburse the fund’s expenses to the extent necessary to limit the cumulative expenses of the fund, exclusive of brokerage, interest, taxes, investment-related expenses, extraordinary expenses, acquired fund fees and expenses and payments under the fund’s investor servicing contract, investment management contract and distribution
|
| 38 Sustainable Future Fund |
plans, on a fiscal year-to-date basis to an annual rate of 0.20% of the fund’s average net assets over such fiscal year-to-date period. During the reporting period, the fund’s expenses were not reduced as a result of this limit.
Putnam Investments Limited (PIL), an affiliate of Putnam Management, is authorized by the Trustees to manage a separate portion of the assets of the fund as determined by Putnam Management from time to time. PIL did not manage any portion of the assets of the fund during the reporting period. If Putnam Management were to engage the services of PIL, Putnam Management would pay a quarterly sub-management fee to PIL for its services at an annual rate of 0.25% (prior to July 1, 2022, the annual rate was 0.35%) of the average net assets of the portion of the fund managed by PIL.
The fund reimburses Putnam Management an allocated amount for the compensation and related expenses of certain officers of the fund and their staff who provide administrative services to the fund. The aggregate amount of all such reimbursements is determined annually by the Trustees.
Custodial functions for the fund’s assets are provided by State Street. Custody fees are based on the fund’s asset level, the number of its security holdings and transaction volumes.
Putnam Investor Services, Inc., an affiliate of Putnam Management, provides investor servicing agent functions to the fund. Putnam Investor Services, Inc. received fees for investor servicing for class A, class B, class C, class R and class Y shares that included (1) a per account fee for each direct and underlying non-defined contribution account (retail account) of the fund; (2) a specified rate of the fund’s assets attributable to defined contribution plan accounts; and (3) a specified rate based on the average net assets in retail accounts. Putnam Investor Services, Inc. has agreed that the aggregate investor servicing fees for each fund’s retail and defined contribution accounts for these share classes will not exceed an annual rate of 0.25% of the fund’s average assets attributable to such accounts.
Class R6 shares paid a monthly fee based on the average net assets of class R6 shares at an annual rate of 0.05%.
During the reporting period, the expenses for each class of shares related to investor servicing fees were as follows:
| | | | |
| Class A | $262,004 | | Class R6 | 5,471 |
| Class B | 147 | | Class Y | 41,120 |
| Class C | 6,634 | | Total | $321,960 |
| Class R | 6,584 | | | |
The fund has entered into expense offset arrangements with Putnam Investor Services, Inc. and State Street whereby Putnam Investor Services, Inc.’s and State Street’s fees are reduced by credits allowed on cash balances. For the reporting period, the fund’s expenses were reduced by $1,026 under the expense offset arrangements.
Each Independent Trustee of the fund receives an annual Trustee fee, of which $312, as a quarterly retainer, has been allocated to the fund, and an additional fee for each Trustees meeting attended. Trustees also are reimbursed for expenses they incur relating to their services as Trustees.
The fund has adopted a Trustee Fee Deferral Plan (the Deferral Plan) which allows the Trustees to defer the receipt of all or a portion of Trustees fees payable on or after July 1, 1995. The deferred fees remain invested in certain Putnam funds until distribution in accordance with the Deferral Plan.
The fund has adopted an unfunded noncontributory defined benefit pension plan (the Pension Plan) covering all Trustees of the fund who have served as a Trustee for at least five years and were first elected prior to 2004. Benefits under the Pension Plan are equal to 50% of the Trustee’s average annual attendance and retainer fees for the three years ended December 31, 2005. The retirement benefit is payable during a Trustee’s lifetime, beginning the year following retirement, for the number of years of service through December 31, 2006. Pension expense for the fund is included in Trustee compensation and expenses in the Statement of operations. Accrued pension liability is included in Payable for Trustee compensation and expenses in the Statement of assets and liabilities. The Trustees have terminated the Pension Plan with respect to any Trustee first elected after 2003.
The fund has adopted distribution plans (the Plans) with respect to the following share classes pursuant to Rule 12b–1 under the Investment Company Act of 1940. The purpose of the Plans is to compensate Putnam Retail Management Limited Partnership, an indirect wholly-owned subsidiary of Putnam Investments, LLC, for services
|
| Sustainable Future Fund 39 |
provided and expenses incurred in distributing shares of the fund. The Plans provide payments by the fund to Putnam Retail Management Limited Partnership at an annual rate of up to the following amounts (Maximum %) of the average net assets attributable to each class. The Trustees have approved payment by the fund at the following annual rate (Approved %) of the average net assets attributable to each class. During the reporting period, the class-specific expenses related to distribution fees were as follows:
| | | |
| | Maximum % | Approved % | Amount |
| Class A | 0.35% | 0.25% | $369,272 |
| Class B | 1.00% | 1.00% | 831 |
| Class C | 1.00% | 1.00% | 37,402 |
| Class R | 1.00% | 0.50% | 18,563 |
| Total | | | $426,068 |
For the reporting period, Putnam Retail Management Limited Partnership, acting as underwriter, received net commissions of $7,885 from the sale of class A shares and received $14 and $90 in contingent deferred sales charges from redemptions of class B and class C shares, respectively.
A deferred sales charge of up to 1.00% is assessed on certain redemptions of class A shares. For the reporting period, Putnam Retail Management Limited Partnership, acting as underwriter, received $19 on class A redemptions.
Note 3: Purchases and sales of securities
During the reporting period, the cost of purchases and the proceeds from sales, excluding short-term investments, were as follows:
| | |
| | Cost of purchases | Proceeds from sales |
| Investments in securities (Long-term) | $92,334,348 | $98,492,805 |
| U.S. government securities (Long-term) | — | — |
| Total | $92,334,348 | $98,492,805 |
The fund may purchase or sell investments from or to other Putnam funds in the ordinary course of business, which can reduce the fund’s transaction costs, at prices determined in accordance with SEC requirements and policies approved by the Trustees. During the reporting period, purchases or sales of long-term securities from or to other Putnam funds, if any, did not represent more than 5% of the fund’s total cost of purchases and/or total proceeds from sales.
Note 4: Capital shares
At the close of the reporting period, there were an unlimited number of shares of beneficial interest authorized. Transactions, including, if applicable, direct exchanges pursuant to share conversions, in capital shares were as follows:
| | | | |
| | SIX MONTHS ENDED 10/31/22 | YEAR ENDED 4/30/22 |
| Class A | Shares | Amount | Shares | Amount |
| Shares sold | 244,205 | $3,914,768 | 820,252 | $20,336,860 |
| Shares issued in connection with | | | | |
| reinvestment of distributions | — | — | 2,749,462 | 62,412,782 |
| | 244,205 | 3,914,768 | 3,569,714 | 82,749,642 |
| Shares repurchased | (1,330,567) | (21,192,661) | (2,584,239) | (62,077,878) |
| Net increase (decrease) | (1,086,362) | $(17,277,893) | 985,475 | $20,671,764 |
|
| 40 Sustainable Future Fund |
| | | | |
| | SIX MONTHS ENDED 10/31/22 | YEAR ENDED 4/30/22 |
| Class B | Shares | Amount | Shares | Amount |
| Shares sold | 289 | $3,620 | 602 | $14,003 |
| Shares issued in connection with | | | | |
| reinvestment of distributions | — | — | 2,724 | 51,557 |
| | 289 | 3,620 | 3,326 | 65,560 |
| Shares repurchased | (3,220) | (43,856) | (4,831) | (94,918) |
| Net decrease | (2,931) | $(40,236) | (1,505) | $(29,358) |
| |
| | SIX MONTHS ENDED 10/31/22 | YEAR ENDED 4/30/22 |
| Class C | Shares | Amount | Shares | Amount |
| Shares sold | 18,781 | $250,265 | 75,932 | $1,572,338 |
| Shares issued in connection with | | | | |
| reinvestment of distributions | — | — | 108,638 | 2,048,916 |
| | 18,781 | 250,265 | 184,570 | 3,621,254 |
| Shares repurchased | (91,285) | (1,233,675) | (203,273) | (4,200,138) |
| Net decrease | (72,504) | $(983,410) | (18,703) | $(578,884) |
| |
| | SIX MONTHS ENDED 10/31/22 | YEAR ENDED 4/30/22 |
| Class R | Shares | Amount | Shares | Amount |
| Shares sold | 30,957 | $458,508 | 63,389 | $1,475,602 |
| Shares issued in connection with | | | | |
| reinvestment of distributions | — | — | 75,217 | 1,620,931 |
| | 30,957 | 458,508 | 138,606 | 3,096,533 |
| Shares repurchased | (39,252) | (588,026) | (95,424) | (2,231,854) |
| Net increase (decrease) | (8,295) | $(129,518) | 43,182 | $864,679 |
| |
| | SIX MONTHS ENDED 10/31/22 | YEAR ENDED 4/30/22 |
| Class R6 | Shares | Amount | Shares | Amount |
| Shares sold | 163,206 | $2,650,972 | 487,425 | $12,490,851 |
| Shares issued in connection with | | | | |
| reinvestment of distributions | — | — | 210,119 | 4,849,551 |
| | 163,206 | 2,650,972 | 697,544 | 17,340,402 |
| Shares repurchased | (209,681) | (3,433,427) | (452,429) | (10,335,781) |
| Net increase (decrease) | (46,475) | $(782,455) | 245,115 | $7,004,621 |
| |
| | SIX MONTHS ENDED 10/31/22 | YEAR ENDED 4/30/22 |
| Class Y | Shares | Amount | Shares | Amount |
| Shares sold | 1,129,854 | $18,831,197 | 944,636 | $23,732,272 |
| Shares issued in connection with | | | | |
| reinvestment of distributions | — | — | 492,281 | 11,307,693 |
| | 1,129,854 | 18,831,197 | 1,436,917 | 35,039,965 |
| Shares repurchased | (522,679) | (8,417,688) | (1,674,807) | (38,705,770) |
| Net increase (decrease) | 607,175 | $10,413,509 | (237,890) | $(3,665,805) |
|
| Sustainable Future Fund 41 |
Note 5: Affiliated transactions
Transactions during the reporting period with any company which is under common ownership or control were as follows:
| | | | | |
| | | | | | Shares |
| | | | | | outstanding |
| | | | | | and fair |
| | Fair value as | Purchase | Sale | Investment | value as |
| Name of affiliate | of 4/30/22 | cost | proceeds | income | of 10/31/22 |
| Short-term investments | | | | | |
| Putnam Cash Collateral | | | | | |
| Pool, LLC* | $22,663,155 | $27,642,730 | $50,305,885 | $35,622 | $— |
| Putnam Short Term | | | | | |
| Investment Fund** | 7,615,020 | 53,108,354 | 47,736,781 | 90,238 | 12,986,593 |
| Total Short-term | | | | | |
| investments | $30,278,175 | $80,751,084 | $98,042,666 | $125,860 | $12,986,593 |
* No management fees are charged to Putnam Cash Collateral Pool, LLC (Note 1). Investment income shown is included in securities lending income on the Statement of operations. There were no realized or unrealized gains or losses during the period.
** Management fees charged to Putnam Short Term Investment Fund have been waived by Putnam Management. There were no realized or unrealized gains or losses during the period.
Note 6: Market, credit and other risks
In the normal course of business, the fund trades financial instruments and enters into financial transactions where risk of potential loss exists due to changes in the market (market risk) or failure of the contracting party to the transaction to perform (credit risk). The fund may be exposed to additional credit risk that an institution or other entity with which the fund has unsettled or open transactions will default. Investments in foreign securities involve certain risks, including those related to economic instability, unfavorable political developments, and currency fluctuations.
Beginning in January 2020, global financial markets have experienced, and may continue to experience, significant volatility resulting from the spread of a virus known as Covid–19. The outbreak of Covid–19 has resulted in travel and border restrictions, quarantines, supply chain disruptions, lower consumer demand, and general market uncertainty. The effects of Covid–19 have adversely affected, and may continue to adversely affect, the global economy, the economies of certain nations, and individual issuers, all of which may negatively impact the fund’s performance.
|
| 42 Sustainable Future Fund |
Note 7: Summary of derivative activity
The volume of activity for the reporting period for any derivative type that was held during the period is listed below and was based on an average of the holdings at the end of each fiscal quarter:
| |
| Forward currency contracts (contract amount) | $50,600,000 |
The following is a summary of the fair value of derivative instruments as of the close of the reporting period:
| | | | |
| Fair value of derivative instruments as of the close of the reporting period | |
| | ASSET DERIVATIVES | LIABILITY DERIVATIVES |
| Derivatives not | | | | |
| accounted for as | Statement of | | Statement of | |
| hedging instruments | assets and | | assets and | |
| under ASC 815 | liabilities location | Fair value | liabilities location | Fair value |
| Foreign exchange | | | | |
| contracts | Receivables | $735,197 | Payables | $148,785 |
| Total | | $735,197 | | $148,785 |
The following is a summary of realized and change in unrealized gains or losses of derivative instruments in the Statement of operations for the reporting period (Note 1):
| | |
| Amount of realized gain or (loss) on derivatives recognized in net gain or (loss) on investments | |
| Derivatives not accounted for as | Forward currency | |
| hedging instruments under ASC 815 | contracts | Total |
| Foreign exchange contracts | $3,066,551 | $3,066,551 |
| Total | $3,066,551 | $3,066,551 |
| | |
| Change in unrealized appreciation or (depreciation) on derivatives recognized in net gain or (loss) | |
| on investments | | |
| Derivatives not accounted for as | Forward currency | |
| hedging instruments under ASC 815 | contracts | Total |
| Foreign exchange contracts | $54,791 | $54,791 |
| Total | $54,791 | $54,791 |
|
| Sustainable Future Fund 43 |
Note 8: Offsetting of financial and derivative assets and liabilities
The following table summarizes any derivatives, repurchase agreements and reverse repurchase agreements, at the end of the reporting period, that are subject to an enforceable master netting agreement or similar agreement. For securities lending transactions or borrowing transactions associated with securities sold short, if any, see Note 1. For financial reporting purposes, the fund does not offset financial assets and financial liabilities that are subject to the master netting agreements in the Statement of assets and liabilities.
| | | | | | | | | | | |
| | Bank of
America N.A. | Barclays Bank
PLC | Citibank, N.A. | Goldman
Sachs
International | HSBC Bank
USA, National
Association | JPMorgan
Chase Bank
N.A. | Morgan
Stanley & Co.
International
PLC | State Street
Bank and
Trust Co. | Toronto-
Dominion
Bank | UBS AG | Total |
| Assets: | | | | | | | | | | | |
| Forward currency contracts# | $164,537 | $16,186 | $— | $6,064 | $310,055 | $19,438 | $139,100 | $— | $— | $79,817 | $735,197 |
| Total Assets | $164,537 | $16,186 | $— | $6,064 | $310,055 | $19,438 | $139,100 | $— | $— | $79,817 | $735,197 |
| Liabilities: | | | | | | | | | | | |
| Forward currency contracts# | 1,100 | — | 5,972 | — | 93,274 | — | 11,833 | 21,629 | 14,977 | — | 148,785 |
| Total Liabilities | $1,100 | $— | $5,972 | $— | $93,274 | $— | $11,833 | $21,629 | $14,977 | $— | $148,785 |
| Total Financial and Derivative Net Assets | $163,437 | $16,186 | $(5,972) | $6,064 | $216,781 | $19,438 | $127,267 | $(21,629) | $(14,977) | $79,817 | $586,412 |
| Total collateral received (pledged)†## | $31,581 | $— | $— | $— | $— | $— | $30,000 | $— | $— | $— | |
| Net amount | $131,856 | $16,186 | $(5,972) | $6,064 | $216,781 | $19,438 | $97,267 | $(21,629) | $(14,977) | $79,817 | |
| Controlled collateral received (including | | | | | | | | | | | |
| TBA commitments)** | $31,581 | $— | $— | $— | $— | $— | $30,000 | $— | $— | $— | $61,581 |
| Uncontrolled collateral received | $— | $— | $— | $— | $— | $— | $— | $— | $— | $— | $— |
| Collateral (pledged) (including TBA commitments)** | $— | $— | $— | $— | $— | $— | $— | $— | $— | $— | $— |
** Included with Investments in securities on the Statement of assets and liabilities.
† Additional collateral may be required from certain brokers based on individual agreements.
# Covered by master netting agreement (Note 1).
## Any over-collateralization of total financial and derivative net assets is not shown. Collateral may include amounts related to unsettled agreements.
| |
| 44 Sustainable Future Fund | Sustainable Future Fund 45 |
Shareholder meeting results (Unaudited)
June 29, 2022 special meeting
At the meeting, each of the nominees for Trustees was elected, with all funds of the Trust voting together as a single class, as follows:
| | |
| | Votes for | Votes withheld |
| Liaquat Ahamed | 275,864,949 | 11,885,697 |
| Barbara M. Baumann | 276,817,419 | 10,933,227 |
| Katinka Domotorffy | 276,491,274 | 11,259,372 |
| Catharine Bond Hill | 277,377,580 | 10,373,066 |
| Kenneth R. Leibler | 277,519,588 | 10,231,058 |
| Jennifer Williams Murphy | 276,865,779 | 10,884,867 |
| Marie Pillai | 276,342,951 | 11,407,695 |
| George Putnam, III | 282,562,747 | 5,187,899 |
| Robert L. Reynolds | 283,034,080 | 4,716,566 |
| Manoj P. Singh | 276,110,551 | 11,640,095 |
| Mona K. Sutphen | 276,477,167 | 11,273,479 |
All tabulations are rounded to the nearest whole number.
|
| 46 Sustainable Future Fund |
Putnam family of funds
The following is a list of Putnam’s open-end mutual funds offered to the public. Investors should carefully consider the investment objective, risks, charges, and expenses of a fund before investing. For a prospectus, or a summary prospectus if available, containing this and other information for any Putnam fund or product, contact your financial advisor or call Putnam Investor Services at 1-800-225-1581. Please read the prospectus carefully before investing.
| |
| Blend | Income |
| Core Equity Fund | Convertible Securities Fund |
| Emerging Markets Equity Fund | Diversified Income Trust |
| Focused Equity Fund | Floating Rate Income Fund |
| Focused International Equity Fund | Global Income Trust |
| International Capital Opportunities Fund | Government Money Market Fund* |
| International Equity Fund | High Yield Fund |
| Research Fund | Income Fund |
| | Money Market Fund† |
| Global Sector | Mortgage Opportunities Fund |
| Global Health Care Fund | Mortgage Securities Fund |
| Global Technology Fund | Short Duration Bond Fund |
| | Ultra Short Duration Income Fund |
| Growth | |
| Growth Opportunities Fund | Tax-free Income |
| Small Cap Growth Fund | Intermediate-Term Municipal Income Fund |
| Sustainable Future Fund | Short-Term Municipal Income Fund |
| Sustainable Leaders Fund | Strategic Intermediate Municipal Fund |
| | Tax Exempt Income Fund |
| Value | Tax-Free High Yield Fund |
| International Value Fund | |
| Large Cap Value Fund | State tax-free income funds:‡ |
| Small Cap Value Fund | California, Massachusetts, Minnesota, |
| | New Jersey, New York, Ohio, and Pennsylvania |
|
| Sustainable Future Fund 47 |
| |
| Absolute Return | Asset Allocation (cont.) |
| Fixed Income Absolute Return Fund | Putnam Retirement Advantage Maturity Fund |
| Multi-Asset Absolute Return Fund | Putnam Retirement Advantage 2065 Fund |
| | Putnam Retirement Advantage 2060 Fund |
| Putnam PanAgora§ | Putnam Retirement Advantage 2055 Fund |
| Putnam PanAgora Risk Parity Fund | Putnam Retirement Advantage 2050 Fund |
| | Putnam Retirement Advantage 2045 Fund |
| Asset Allocation | Putnam Retirement Advantage 2040 Fund |
| Dynamic Risk Allocation Fund | Putnam Retirement Advantage 2035 Fund |
| George Putnam Balanced Fund | Putnam Retirement Advantage 2030 Fund |
| | Putnam Retirement Advantage 2025 Fund |
| Dynamic Asset Allocation Balanced Fund | |
| Dynamic Asset Allocation Conservative Fund | RetirementReady® Maturity Fund |
| Dynamic Asset Allocation Growth Fund | RetirementReady® 2065 Fund |
| | RetirementReady® 2060 Fund |
| | RetirementReady® 2055 Fund |
| | RetirementReady® 2050 Fund |
| | RetirementReady® 2045 Fund |
| | RetirementReady® 2040 Fund |
| | RetirementReady® 2035 Fund |
| | RetirementReady® 2030 Fund |
| | RetirementReady® 2025 Fund |
* You could lose money by investing in the fund. Although the fund seeks to preserve the value of your investment at $1.00 per share, it cannot guarantee it will do so. An investment in the fund is not insured or guaranteed by the Federal Deposit Insurance Corporation or any other government agency. The fund’s sponsor has no legal obligation to provide financial support to the fund, and you should not expect that the sponsor will provide financial support to the fund at any time.
† You could lose money by investing in the fund. Although the fund seeks to preserve the value of your investment at $1.00 per share, it cannot guarantee it will do so. The fund may impose a fee upon sale of your shares or may temporarily suspend your ability to sell shares if the fund’s liquidity falls below required minimums because of market conditions or other factors. An investment in the fund is not insured or guaranteed by the Federal Deposit Insurance Corporation or any other government agency. The fund’s sponsor has no legal obligation to provide financial support to the fund, and you should not expect that the sponsor will provide financial support to the fund at any time.
‡ Not available in all states.
§ Sub-advised by PanAgora Asset Management.
Check your account balances and the most recent month-end performance in the Individual Investors section at putnam.com.
|
| 48 Sustainable Future Fund |
Fund information
Founded over 80 years ago, Putnam Investments was built around the concept that a balance between risk and reward is the hallmark of a well-rounded financial program. We manage funds across income, value, blend, growth, sustainable, asset allocation, absolute return, and global sector categories.
| | |
| Investment Manager | Trustees | Richard T. Kircher |
| Putnam Investment | Kenneth R. Leibler, Chair | Vice President and |
| Management, LLC | Barbara M. Baumann, Vice Chair | BSA Compliance Officer |
| 100 Federal Street | Liaquat Ahamed | |
| Boston, MA 02110 | Katinka Domotorffy | Martin Lemaire |
| | Catharine Bond Hill | Vice President and |
| Investment Sub-Advisor | Jennifer Williams Murphy | Derivatives Risk Manager |
| Putnam Investments Limited | Marie Pillai | |
| 16 St James’s Street | George Putnam, III | Susan G. Malloy |
| London, England SW1A 1ER | Robert L. Reynolds | Vice President and |
| | Manoj P. Singh | Assistant Treasurer |
| Marketing Services | Mona K. Sutphen | |
| Putnam Retail Management | | Alan G. McCormack |
| Limited Partnership | Officers | Vice President and |
| 100 Federal Street | Robert L. Reynolds | Derivatives Risk Manager |
| Boston, MA 02110 | President | |
| | | Denere P. Poulack |
| Custodian | James F. Clark | Assistant Vice President, |
| State Street Bank | Vice President, Chief Compliance | Assistant Clerk, and |
| and Trust Company | Officer, and Chief Risk Officer | Assistant Treasurer |
| | | |
| Legal Counsel | Nancy E. Florek | Janet C. Smith |
| Ropes & Gray LLP | Vice President, Director of | Vice President, |
| | Proxy Voting and Corporate | Principal Financial Officer, |
| | Governance, Assistant Clerk, | Principal Accounting Officer, |
| | and Assistant Treasurer | and Assistant Treasurer |
| | | |
| | Michael J. Higgins | Stephen J. Tate |
| | Vice President, Treasurer, | Vice President and |
| | and Clerk | Chief Legal Officer |
| | | |
| | Jonathan S. Horwitz | Mark C. Trenchard |
| | Executive Vice President, | Vice President |
| Principal Executive Officer, | |
| | and Compliance Liaison | |
This report is for the information of shareholders of Putnam Sustainable Future Fund. It may also be used as sales literature when preceded or accompanied by the current prospectus, the most recent copy of Putnam’s Quarterly Performance Summary, and Putnam’s Quarterly Ranking Summary. For more recent performance, please visit putnam.com. Investors should carefully consider the investment objectives, risks, charges, and expenses of a fund, which are described in its prospectus. For this and other information or to request a prospectus or summary prospectus, call 1-800-225-1581 toll free. Please read the prospectus carefully before investing. The fund’s Statement of Additional Information contains additional information about the fund’s Trustees and is available without charge upon request by calling 1-800-225-1581.

| |
| Item 3. Audit Committee Financial Expert: |
| |
| Item 4. Principal Accountant Fees and Services: |
| |
| Item 5. Audit Committee of Listed Registrants |
| |
| Item 6. Schedule of Investments: |
| |
| The registrant’s schedule of investments in unaffiliated issuers is included in the report to shareholders in Item 1 above. |
| |
| Item 7. Disclosure of Proxy Voting Policies and Procedures For Closed-End Management Investment Companies: |
| |
| Item 8. Portfolio Managers of Closed-End Investment Companies |
| |
| Item 9. Purchases of Equity Securities by Closed-End Management Investment Companies and Affiliated Purchasers: |
| |
| Item 10. Submission of Matters to a Vote of Security Holders: |
| |
| Item 11. Controls and Procedures: |
| |
| (a) The registrant’s principal executive officer and principal financial officer have concluded, based on their evaluation of the effectiveness of the design and operation of the registrant’s disclosure controls and procedures as of a date within 90 days of the filing date of this report, that the design and operation of such procedures are generally effective to provide reasonable assurance that information required to be disclosed by the registrant in this report is recorded, processed, summarized and reported within the time periods specified in the Commission’s rules and forms. |
| |
| (b) Changes in internal control over financial reporting: Not applicable |
| |
| Item 12. Disclosures of Securities Lending Activities for Closed-End Investment Companies: |
| |
| Pursuant to the requirements of the Securities Exchange Act of 1934 and the Investment Company Act of 1940, the registrant has duly caused this report to be signed on its behalf by the undersigned, thereunto duly authorized. |
| |
| By (Signature and Title): |
| |
| /s/ Janet C. Smith
Janet C. Smith
Principal Accounting Officer
|
| |
| Pursuant to the requirements of the Securities Exchange Act of 1934 and the Investment Company Act of 1940, this report has been signed below by the following persons on behalf of the registrant and in the capacities and on the dates indicated. |
| |
| By (Signature and Title): |
| |
| /s/ Jonathan S. Horwitz
Jonathan S. Horwitz
Principal Executive Officer
|
| |
| By (Signature and Title): |
| |
| /s/ Janet C. Smith
Janet C. Smith
Principal Financial Officer
|