UNITED STATES
SECURITIES AND EXCHANGE COMMISSION
Washington, D.C. 20549
FORM N-CSR
CERTIFIED SHAREHOLDER REPORT OF REGISTERED
MANAGEMENT INVESTMENT COMPANIES
Investment Company Act file number: 811-08846
First Focus Funds, Inc.
(Exact name of registrant as specified in charter)
First National Bank
1620 Dodge Street
Omaha, Nebraska 68197
(Address of principal executive offices)
Daniel W. Koors
Jackson Fund Services
225 West Wacker Drive, Suite 1200
Chicago, Illinois 60606
(Name and address of agent for service)
Registrant's telephone number, including area code: (800) 662-4203
Date of Fiscal Year End: March 31
Date of Reporting Period: March 31, 2010
Form N-CSR is to be used by management investment companies to file reports with the Commission not later than 10 days after the transmission to stockholders of any report that is required to be transmitted to stockholders under Rule 30e-1 under the Investment Company Act of 1940 (17 CFR 270.30e-1). The Commission may use the information provided on Form N-CSR in its regulatory, disclosure review, inspection, and policymaking roles.
A registrant is required to disclose the information specified by Form N-CSR, and the Commission will make this information public. A registrant is not required to respond to the collection of information contained in Form N-CSR unless the Form displays a currently valid Office of Management and Budget (“OMB”) control number. Please direct comments concerning the accuracy of the information collection burden estimate and any suggestions for reducing the burden to Secretary, Securities and Exchange Commission, 450 Fifth Street, NW, Washington, DC 20549-0609. The OMB has reviewed this collection of information under the clearance requirements of 44 U.S.C. §3507.
Item 1. Report to Shareholders.

Annual Report
| Short-Intermediate Bond Fund |
| Income Fund |
| Balanced Fund |
| Core Equity Fund |
| Large Cap Growth Fund |
| Growth Opportunities Fund |
| Small Company Fund |
| International Equity Fund |
Value. Stability. Service.
Notice to Investors
Shares of First Focus Funds:
• Are Not FDIC Insured • May Lose Value • Have No Bank Guarantee
Investors should carefully consider the investment objectives, risks, charges and expenses of the First Focus Funds. Mutual funds involve risk including loss of principal. This and other important information about the Funds is contained in the prospectus, which can be obtained by calling 1-800-662-4203. The prospectus should be read carefully before investing. The First Focus Funds are distributed by Northern Lights Distributors, LLC member FINRA/SIPC.

Table of Contents
| Shareholder Letter | 1 |
| Management Discussion and Analysis | 2 |
| Schedules of Portfolio Investments | 18 |
| Statements of Assets & Liabilities | 34 |
| Statements of Operations | 36 |
| Statements of Changes in Net Assets | 38 |
| Financial Highlights | 42 |
| Notes to Financial Statements | 44 |
| Report of Independent Registered Public Accounting Firm | 54 |
| Additional Fund Information | 55 |
| Review and Approval of the Funds’ Advisory and Sub-Advisory Agreements | 58 |
| Directors and Officers | 65 |
Dear Shareholder,
The last 10 years have been one of the most challenging decades of modern times for the investing class. No need to rehash all of the reasons why, we are all painfully aware. However, it is appropriate, now more than ever, to understand where you have your money invested and with whom. Sadly, many investors have been devastated by “trusting” their advisers, only to wake up one morning to learn on the news that this person or entity has not been a great steward of their assets as they once thought.
Your First Focus Funds are affiliated with the largest privately owned bank holding company in North America, First National Nebraska, Inc (“FNNI”). FNNI’s independent roots can be traced back to 1855. The fifth and sixth generations of the founding family continue to be involved in the day-to-day operations of the company. This type of long-term focus not only permeates the philosophy of the holding company, but also that of your First Focus Funds. Our research attempts to differentiate between the volatility associated with following momentum and “hot” trends and the discipline it takes to do a tremendous amount of research before committing our Fund holders’ resources, and then having the courage and patience it takes to stick with this discipline in good times an d bad. We are particularly focused on principal preservation and seek to outperform when things get especially difficult.
Starting in 2000, the First Focus Funds Board of Directors set out a 10 year plan to have competitive offerings in all of it’s the First Focus Funds’ strategies. This involved the replacement of some fund managers, the shedding of certain non-competitive offerings and the addition of certain key asset classes to the complex, for which the Funds have hired independent third party managers. We worked diligently to create a well rounded product offering to meet the needs of our First Focus Fund shareholders.
I’m pleased to report that as of April 1, 2010, of our Funds rated by Morningstar, 42% have an overall rating of 3 stars, 42% are rated 4 star and 14% have achieved the coveted 5 star rating. Of the funds with 10 year ratings, 40% are rated 4 stars and 60% 5 stars!
For the fiscal year ended March 31st, we have also had strong growth in assets. We have seen growth from both the addition of new channels and strong growth in our existing channels. A number of channels that we previously were unable to gain access to, have invited us to be a part of their platforms – largely due to customer requests, growth in our complex size and our performance. By increasing the ways customers can purchase the First Focus Funds we are making investing in our funds more convenient for you!
We are currently in the process of re-calibrating our course for the next 10 years and like what we see. We feel we have built a fundamentally strong fund complex, one with strong overall performance based on solid long-term thinking. In the coming months, we will be working on a strategic plan that, if executed correctly, should allow us to achieve the type of scope and scale critical to our long-term growth. As much as the last 10 years has been about strengthening the offerings and broadening the scope of those offerings, we hope the next 10 years will be about distribution. We hope to have exciting news before we close out 2010, including success in opening new distribution channels for your Funds.

Stephen Frantz
Chief Investment Officer
sfrantz@fnni.com
Comments are provided as a general market overview and should not be considered investment advice or predictive of any future market performance.
Morningstar calculates a Morningstar RatingTM based on a Morningstar Risk-Adjusted Return measure that accounts for variation in a fund’s monthly performance (including the effects of sales charges, loads and redemption fees), placing more emphasis on downward variations and rewarding consistent performance. The top 10% of the funds in each category receive 5 stars, the next 22.5% receive 4 stars, the next 35% receive 3 stars, the next 22.5% receive 2 stars and the bottom 10% receive 1 star.
Investors should carefully consider the investment objectives, risks, charges and expenses of the First Focus Funds. Mutual funds involve risk including possible risk of principal. The First Focus Funds are distributed by Northern Lights Distributors, LLC member FINRA.
0748-NLD-5/26/2010
1
FIRST FOCUS SHORT-INTERMEDIATE BOND FUND
Investment Objective
The First Focus Short-Intermediate Bond Fund seeks to maximize total returns in a manner consistent with generation of current income, preservation of capital and reduce price volatility.
Manager Commentary
A little over a year ago, the financial markets were in disarray and the real economy was in the midst of a terrible recession; the future of our financial system and dynamic economy was very much in doubt. The government attempted various measures to prop up the markets and instill confidence in the system, but with limited success.
As often happens during crises, however, the “animal spirits” of the financial markets became abruptly more positive by the end of March 2009. Perhaps driven by the mandated “stress test” applied to the largest financial institutions, or growing confidence that the U.S. Federal Reserve’s (the “Fed”) myriad actions would finally halt the decline in risky assets, investors slowly began to remove the “systemic collapse” premium that had been priced into almost all financial markets. Over the ensuing months we witnessed a dramatic and swift rally in stock and bond markets (with the lone exception of U.S. Treasuries). The volatility of the past two years is truly amazing; high-yield corporate bonds returned -22% for the year ended March 2009, but followed that with a 62% annual return through March 2010. All non-U.S. Treasury sectors of the bond market posted positive results for the past twelve months, although not as dramatic. Investment-grade corporate bonds returned 25%, agency-guaranteed mortgage-backed securities (“MBS”), 5%, and commercial mortgage-backed securities (“CMBS”), 43%. As noted previously, the only disappointing sector in the bond market was U.S. Treasuries, which returned -1.2% for the year ended March 2010.
On the heels of rapidly improving financial markets, the real economy began to slowly pull out of its downward trajectory. Monthly job losses moderated as the year progressed, and industrial activity picked up sharply as companies began to re-stock depleted inventories. Gross Domestic Product (“GDP”) growth bottomed in Q109, posting a -6.4% annualized drop, but recovered steadily, culminating with an annualized 5.6% increase in the fourth quarter. Despite this macro improvement, the large amount of slack in the labor and physical capital markets (capacity utilization fell to decade lows in Q209) kept the Fed on the sidelines. The Fed maintained its effective zero target on the Fed Funds rate and continued to clearly communicate its intent to maintain this level for the foreseeable future.
Over the past year, the First Focus Short-Intermediate Fund returned 7.18% on a net basis. This compares to a 5.31% return for the Barclays Capital U.S. Government/Credit 1-5 Year Index.
The primary driver of the outperformance was the significant return generated by the non-U.S. Treasury sectors of the Fund. We began the fiscal year with an overweight position in the agency MBS, CMBS and private-label MBS sectors, and notably increased our allocation to corporate bonds during the year. The Fund’s larger allocation to “spread sectors” provided two benefits relative to the index—an increase in principal value as yield spreads fell rapidly, and a substantial coupon (yield) advantage. The Fund also benefited from our shorter duration exposure versus the index, as risk-free yields rose throughout the year.
As of March 31, 2010, the portfolio’s composition was 21% U.S. Treasury securities, 6% U.S. Government agency MBS, 40% corporate bonds, 10% agencies, 18% mortgage related, 1% municipals, and 4% cash equivalents. The overall weighted average maturity of the portfolio was 2.51 years.1
The striking improvement in risk appetite over the past year has driven down yield spreads to levels more in-line with historical norms; indeed some pockets of the corporate bond market carry yields that we believe don’t adequately compensate investors for assumed risk. That said, we expect that corporate and asset-backed securities as a group will continue to outperform risk-free sectors of the market as the Fed remains accommodative and the economy slowly improves. Our long-term focus and rigorous credit and structural analysis should serve our investors well through this more difficult environment in the fixed income market.
1 Disclosures
Portfolio composition is as of March 31, 2010 and is subject to change.
2
FIRST FOCUS SHORT-INTERMEDIATE BOND FUND
Return of a $10,000 Investment as of March 31, 2010

Portfolio Composition as of March 31, 2010
% Based on Total Value of Investments
(Portfolio composition is subject to change)

Portfolio Analysis as of March 31, 2010
(Portfolio composition is subject to change)
Weighted Average Maturity: 2.51 years
| Average Annual Total Return for the Year Ended March 31, 2010* | |||
| 1 Year | 5 Year | 10 Year | |
| First Focus Short- | |||
| Intermediate Bond Fund | 7.18% | 4.24% | 4.66% |
| Barclays Capital U.S. | |||
| Government/Credit | |||
| 1-5 Year Index | 5.31% | 4.90% | 5.35% |
| Prospectus Expense Ratio (Gross/Net)† | 1.20%/0.91% | ||
| Expense Ratio for the Year Ended | |||
| March 31, 2010 (Gross/Net) | 1.17%/0.86% | ||
Past performance does not guarantee future results. The performance data quoted represents past performance and current returns may be lower or higher. Total return figures include change in share price, reinvestment of dividends and capital gains. The investment return and principal value will fluctuate so that an investor’s shares, when redeemed may be worth more or less than the original cost. To obtain performance information current to the most recent month end, please visit our website at www.firstfocusfunds.com.
(†)The above expense ratios are from the Fund’s prospectus dated August 1, 2009. Net expense ratio is net of contractual waivers which are in effect from August 1, 2009 through July 31, 2010.
(*) Returns shown do not reflect the deduction of taxes that a shareholder would pay on Fund distributions or the redemption of Fund shares. The returns for certain periods reflect fee waivers and/or reimbursements in effect for that period; absent fee waivers and reimbursements, performance would have been lower.
The line chart assumes an initial investment of $10,000 made on March 31, 2000. Total return is based on net change in net asset value (“NAV”) assuming reinvestment of distributions. Returns shown include the reinvestment of all dividends and other distributions.
The Barclays Capital U.S. Government/Credit 1-5 Year Index measures the performance of U.S. Treasury and agency securities, and corporate bonds with 1-5 year maturities.
The above referenced index is unmanaged and does not reflect the deduction of fees or taxes associated with a mutual fund, such as investment management and fund accounting fees. Investors cannot invest directly in an index.
3
FIRST FOCUS INCOME FUND
Investment Objective
The First Focus Income Fund seeks to maximize total returns in a manner consistent with generation of current income and the preservation of capital.
Manager Commentary
A little over a year ago, the financial markets were in disarray and the real economy was in the midst of a terrible recession; the future of our financial system and dynamic economy was very much in doubt. The government attempted various measures to prop up the markets and instill confidence in the system, but with limited success.
As often happens during crises, however, the “animal spirits” of the financial markets became abruptly more positive by the end of March 2009. Perhaps driven by the mandated “stress test” applied to the largest financial institutions, or growing confidence that the U.S. Federal Reserve’s (the “Fed”) myriad actions would finally halt the decline in risky assets, investors slowly began to remove the “systemic collapse” premium that had been priced into almost all financial markets. Over the ensuing months we witnessed a dramatic and swift rally in stock and bond markets (with the lone exception of U.S. Treasuries). The volatility of the past two years is truly amazing; high-yield corporate bonds returned -22% for the year ended March 2009, but followed that with a 62% annual return through March 2010. All non-U.S. Treasury sectors of the bond market posted positive results for the past twelve months, although not as dramatic. Investment-grade corporate bonds returned 25%, agency-guaranteed mortgage-backed securities (“MBS”), 5%, and commercial mortgage-backed securities (“CMBS”), 43%. As noted previously, the only disappointing sector in the bond market was U.S. Treasuries, which returned -1.2% for the year ended March 2010.
On the heels of rapidly improving financial markets, the real economy began to slowly pull out of its downward trajectory. Monthly job losses moderated as the year progressed, and industrial activity picked up sharply as companies began to re-stock depleted inventories. Gross Domestic Product (“GDP”) growth bottomed in Q109, posting a -6.4% annualized drop, but recovered steadily, culminating with an annualized 5.6% increase in the fourth quarter. Despite this macro improvement, the large amount of slack in the labor and physical capital markets (capacity utilization fell to decade lows in Q209) kept the Fed on the sidelines. The Fed maintained its effective zero target on the Fed Funds rate and continued to clearly communicate its intent to maintain this level for the foreseeable future.
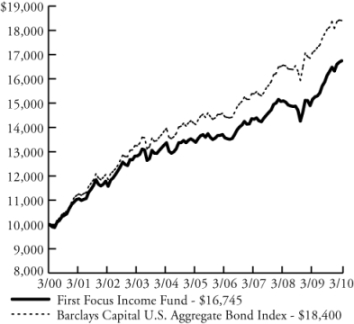
Over the past year, the First Focus Income Fund returned 10.49% on a net basis. This compares to a 7.69% return for the Barclays Capital U.S. Aggregate Bond Index.
The primary driver of the outperformance was the significant return generated by the non-Treasury sectors of the Fund. We began the fiscal year with an overweight position in the CMBS and private-label MBS sectors, and notably increased our allocation to corporate bonds during the year. The Fund’s larger allocation to “spread sectors” provided two benefits relative to the index—an increase in principal value as yield spreads fell rapidly, and a substantial coupon (yield) advantage. We maintained an underweight to agency MBS given the distortion caused by the Fed’s purchase program, which modestly detracted from performance as spreads in that sector continued to compress.
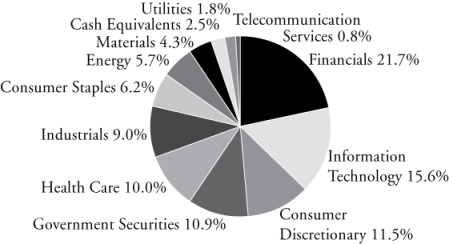
As of March 31, 2010, the portfolio’s composition was 13% U.S. Treasury securities, 25% U.S. government agency mortgage-backed securities, 29% corporate bonds, 2% agencies, 26% mortgage related, 2% municipals, and 3% cash equivalents. The overall weighted average maturity of the portfolio was 6.70 years.1
The striking improvement in risk appetite over the past year has driven down yield spreads to levels more in-line with historical norms; indeed some pockets of the corporate bond market carry yields that we believe don’t adequately compensate investors for assumed risk. That said, we expect that corporate and asset-backed securities as a group will continue to outperform risk-free sectors of the market as the Fed remains accommodative and the economy slowly improves. Our long-term focus and rigorous credit and structural analysis should serve our investors well through this more difficult environment in the fixed income market.
1 Disclosures
Portfolio composition is as of March 31, 2010 and is subject to change.
4
FIRST FOCUS INCOME FUND
Return of a $10,000 Investment as of March 31, 2010
Portfolio Composition as of March 31, 2010
% Based on Total Value of Investments
(Portfolio composition is subject to change)

Portfolio Analysis as of March 31, 2010
(Portfolio composition is subject to change)
Weighted Average Maturity: 6.70 years
| Average Annual Total Return for the Year Ended March 31, 2010* | ||||
| 1 Year | 5 Year | 10 Year | ||
| First Focus Income Fund | 10.49% | 4.58% | 5.29% | |
| Barclays Capital U.S. | ||||
| Aggregate Bond Index | 7.69% | 5.44% | 6.29% | |
| Prospectus Expense Ratio (Gross/Net)† | 1.33%/0.86% | |||
| Expense Ratio for the Year Ended | ||||
| March 31, 2010 (Gross/Net) | 1.27%/0.77% | |||
Past performance does not guarantee future results. The performance data quoted represents past performance and current returns may be lower or higher. Total return figures include change in share price, reinvestment of dividends and capital gains. The investment return and principal value will fluctuate so that an investor’s shares, when redeemed may be worth more or less than the original cost. To obtain performance information current to the most recent month end, please visit our website at www.firstfocusfunds.com.
(†)The above expense ratios are from the Fund’s prospectus dated August 1, 2009. Net expense ratio is net of contractual waivers which are in effect from August 1, 2009 through July 31, 2010.
(*) For periods prior to March 9, 2001, when the Fund began operating, the performance quoted reflects performance of the Adviser’s similarly managed collective investment fund, adjusted to reflect the Fund’s fees and expenses. The collective investment fund was not a registered mutual fund and therefore was not subject to certain investment and tax restrictions, which may have adversely affected performance. Returns shown do not reflect the deduction of taxes that a shareholder would pay on Fund distributions or the redemption of Fund shares. The returns for certain periods reflect fee waivers and/or reimbursements in effect for that period; absent fee waivers and reimbursements, performance would have been lower.
The line chart assumes an initial investment of $10,000 made on March 31, 2000. Total return is based on net change in net asset value (“NAV”) assuming reinvestment of distributions. Returns shown include the reinvestment of all dividends and other distributions.
The Barclays Capital U.S. Aggregate Bond Index is a market value-weighted index which covers the USD-denominated, investment-grade, fixed-rate, taxable bond market of SEC-registered securities. The index includes bonds from the Treasury, Government-Related, Corporate, MSB (agency fixed-rate and hybrid ARM passthroughs), ABS, and CMBS sectors.
The above referenced index is unmanaged and does not reflect the deduction of fees or taxes associated with a mutual fund, such as investment management and fund accounting fees. Investors cannot invest directly in an index.
5
FIRST FOCUS BALANCED FUND
Investment Objective
The First Focus Balanced Fund seeks capital appreciation and current income.
Manager Commentary
A year ago on these pages, as the economy tumbled and the markets collapsed, the case was made that the worst was past and a recovery would come before the end of the year. At the time it was difficult to know how the financial collapse was going to be contained and resolved, but as the year progressed, confidence began to return, and the financial markets began to recuperate. By the end of the year it was becoming clear that the economy was also on the path to recovery, providing the fundamental underpinnings to a sustained market advance.
Asset allocation is the largest factor determining if the First Focus Balanced Fund will perform better or worse than its peer group. An emphasis on stocks and corporate bonds allowed the Fund to consistently outperform the Lipper® Balanced Fund Index through the past year, finishing with a total return of 45.17% versus 31.57% for the Lipper Balanced Fund Index. With regard to the Fund’s benchmark, the segment of the Fund allocated to stocks performed better than the S&P 500 Index’s return of 49.77%, while the segment of the Fund allocated to fixed income performed better than the Barclays Capital U.S. Government/Credit Index’s return of 7.51%. Consistency has been a hallmark of your First Focus Balanced Fund, earning t he Fund a Five Star rating overall and Five Stars for last ten years from Morningstar®.1
As noted above the emphasis on stocks over bonds was the single largest contributor to excess returns this year. Also generating a positive contribution to relative returns was an emphasis on corporate and Build America bonds in the fixed income segment of the Fund. In the equity segment of the Fund an emphasis on economically sensitive areas like manufacturing, industrial and material stocks all contributed to performance. A significant underweighting in financial stocks, particularly banks, which performed strongly during the year, was the most significant drag on returns.1
With each passing month the economy moves further down the path toward self-sustaining economic expansion. While the economy and financial markets still face many vulnerabilities, the year ahead is looking better.
1 Disclosures
Portfolio composition is as of March 31, 2010 and is subject to change.
Lipper® Balanced Fund Index is an unmanaged index of thirty selected balanced funds.
Morningstar Inc. All Rights Reserved. The information, data, analysis and opinions contained herein (1) include the confidential and proprietary information of Morningstar, (2) may not be copied or redistributed, (3) do not constitute investment advice offered by Morningstar, (4) are provided solely for the informational purposes and therefore are not an offer to buy or sell a security, and (5) are not warranted to be correct, complete or accurate. Except as otherwise required by law, Morningstar shall not be responsible for any trading decisions, damages or other losses resulting from, or related to, this information, data, analysis or opinions or their use. For each fund with at least a three-year history, Morningstar calculates a Morningstar RatingTM based on a Mornin gstar Risk-Adjusted Return measure that accounts for variation in a fund’s monthly performance (including the effects of sales charges, loads and redemption fees), placing more emphasis on downward variations and rewarding consistent performance. The top 10% of the funds in each category receive 5 stars, the next 22.5% receive 4 stars, the next 35% receive 3 stars, the next 22.5% receive 2 stars and the bottom 10% receive 1 star. (Each share class is counted as a fraction of one fund within the scale and rated separately, which may cause slight variations in the distribution percentages).
6
FIRST FOCUS BALANCED FUND
Return of a $10,000 Investment as of March 31, 2010

Portfolio Composition as of March 31, 2010
% Based on Total Value of Investments
(Portfolio composition is subject to change)
| Average Annual Total Return for the Year Ended March 31, 2010* | ||||
| 1 Year | 5 Year | 10 Year | ||
| First Focus Balanced Fund | 45.17% | 4.96% | 6.30% | |
| Barclays Capital U.S. | ||||
| Government/Credit Index | 7.51% | 5.17% | 6.22% | |
| S&P 500 Index | 49.77% | 1.92% | -0.65% | |
| Composite Index | 31.57% | 3.54% | 2.40% | |
| Prospectus Expense Ratio (Gross/Net)† | 1.55%/1.40% | |||
| Expense Ratio for the Year Ended | ||||
| March 31, 2010 (Gross/Net) | 1.53%/1.37% | |||
Past performance does not guarantee future results. The performance data quoted represents past performance and current returns may be lower or higher. Total return figures include change in share price, reinvestment of dividends and capital gains. The investment return and principal value will fluctuate so that an investor’s shares, when redeemed may be worth more or less than the original cost. To obtain performance information current to the most recent month end, please visit our website at www.firstfocusfunds.com.
(†)The above expense ratios are from the Fund’s prospectus dated August 1, 2009. Net expense ratio is net of contractual waivers which are in effect from August 1, 2009 through July 31, 2010.
(*) Returns shown do not reflect the deduction of taxes that a shareholder would pay on Fund distributions or the redemption of Fund shares. The returns for certain periods reflect fee waivers and/or reimbursements in effect for that period; absent fee waivers and reimbursements, performance would have been lower.
The line chart assumes an initial investment of $10,000 made on March 31, 2000. Total return is based on net change in net asset value (“NAV”) assuming reinvestment of distributions. Returns shown include the reinvestment of all dividends and other distributions.
The Barclays Capital U.S. Government/Credit Index is the non-securitized component of the U.S. Aggregate Index and includes Treasuries (i.e, public obligations of the U.S. Treasury that have remaining maturities of more than one year), Government-Related issues (i.e, agency, sovereign, supranational, and local authority debt), and USD Corporates.
The S&P 500 Index is an index of 500 selected common stocks most of which are listed on the New York Stock Exchange. The index is heavily weighted toward stocks with large market capitalizations and represents approximately two-thirds of the total market value of all domestic common stocks.
The Composite Index is a combined index of 60% of the S&P 500 Index and 40% of the Barclays Capital U.S. Government/Credit Index. The Composite Index is intended to provide a single benchmark that more accurately reflects the composition of securities held by the Balanced Fund. The individual performance of each index that comprises the Composite Index is detailed in the chart above.
The above referenced indices are unmanaged and do not reflect the deduction of fees or taxes associated with a mutual fund, such as investment management and fund accounting fees. Investors cannot invest directly in an index.
7
FIRST FOCUS CORE EQUITY FUND
Investment Objective
The First Focus Core Equity Fund seeks long-term capital appreciation.
Manager Commentary
For the year ended March 31, 2010, the First Focus Core Equity Fund had a total return of 44.10% compared to a total return of 49.77% for the S&P 500 Index and 53.56% for the Russell 1000® Value Index. We were pleased with the strong absolute return for the Fund during this period, after the challenging market in 2008. However, we were not satisfied with the Fund’s relative performance, which was adversely affected by modest cash holdings and your portfolio managers’ preference for more defensive, high-quality companies. As it turned out, many of the same portfolio strategies that enabled the Fund to significantly outperform during the bear market in 2008, caused it to lag relative to indexes during the past year.
After a tortuous decline during 2008 and the first two months of 2009, the U.S. equity markets rallied from the low on March 9, 2009 and sustained strong positive returns in each of the next four quarters. Investor sentiment shifted 180 degrees from extreme uncertainty at the end of 2008 when many feared that numerous large financial institutions were on the verge of collapse, to euphoria that the crisis had passed. Swift action by the U.S. Federal Reserve (the “Fed”) and the Bush and Obama administrations (along with similar actions taken by other countries) stabilized the credit environment and enabled the economy to begin recovering during the second half on 2009.
However, the recovery has not been evenly distributed. The developing countries such as China, India and Brazil have experienced strong economic growth, while the U.S., Europe, and Japan realized relatively modest growth compared to past economic recoveries.
The strongest S&P 500 Index sectors during the 12-month period ended March 31, 2009 were Financials, Industrials and Consumer Discretionary, which had gains of 82%, 72% and 69%, respectively. The Fund’s largest gains were in the same sectors. The weakest S&P 500 Index sectors during this period were Telecommunications, Utilities and Energy with total returns of 12%, 21% and 30%, respectively. This rally was also led by smaller-capitalization and lower-quality companies (e.g. companies with weaker financial positions, lower returns on equity and more cyclical earnings).1
The difference between your Fund’s return and that of the S&P 500 Index and the Russell 1000 Value Index can be explained primarily by three reasons. First, despite being relatively fully invested with average cash balances of 4.4% of total assets, the holding of cash reduced the Fund’s relative return by over 280 basis points (2.80 percentage points). Second, your portfolio managers underweighted the Fund’s allocation to Consumer Discretionary stocks and chose to hold primarily defensive consumer companies, due to our belief that U.S. consumer spending would recover slowly during 2009. However, despite restrained consumer spending, the more aggressive cyclical consumer stocks performed the best during this period, which caused the Fund to under-perform by over 100 basis points (1.00 percentage point). Finally, our stock se lection in the Technology sector under-performed the S&P 500 Index’s Technology sector by over 125 basis points (1.25 percentage point). On the positive side, our security selections in Health Care, Industrials, Consumer Staples, and Energy outperformed their sector benchmarks and the sector allocation (excluding cash) was a positive contributor.1
The outlook for 2010 and beyond looks better than it did a year ago, but it will be largely influenced by government policies, which makes forecasting very uncertain. The Fed has kept short-term interest rates at near zero and had been a ready purchaser of mortgage-backed securities, which kept mortgage rates at historically low levels. The Fed will need to reverse these policies or risk the encouragement of new speculative bubbles and higher inflation in the future. The U.S. Federal Government has and is spending billions on various stimulus plans including “cash for clunkers” and home purchase tax credits. The federal deficit has ballooned to over $1.4 trillion and there is no clear plan to address future deficits, which will be exacerbated by the demographically-challenged federal health care and social security programs. In addit ion, the Bush tax cuts are set to expire in 2010, which will increase tax rates in the future. Finally, the U.S. consumer is facing more limited access to credit, the need to further delever (household debt as a percent of income is still nearly double the average of the last 20 years), and a significant loss of net worth just as the baby boomers are starting to retire. We think it is a good bet that the U.S. personal savings rate will remain high for the foreseeable future.
The good news is that much of the developing world is in relatively good financial shape. China, India, Brazil and a host of smaller developing countries are experiencing solid economic growth. In 2009, China succeeded the U.S. as the largest car market in the world and the BRIC countries (Brazil, Russia, India and China), in total, imported more goods than the U.S. This trend is not lost on U.S. corporations, which have been steadily expanding into foreign markets over the past ten years. In fact, revenues from foreign sources now represent over 45% of total revenues from the 500 companies in the Standard & Poor’s Index. The Fund owns many of these large global companies, which are well-positioned to succeed in a less U.S.-centric world.
1 Disclosures
Portfolio composition is as of March 31, 2010 and is subject to change.
8
FIRST FOCUS CORE EQUITY FUND
Return of a $10,000 Investment as of March 31, 2010

Portfolio Composition as of March 31, 2010
% Based on Total Value of Investments
(Portfolio composition is subject to change)

| Average Annual Total Return for the Year Ended March 31, 2010* | ||||
| 1 Year | 5 Year | 10 Year | ||
| First Focus Core Equity Fund | 44.10% | 2.89% | 4.01% | |
| S&P 500 Index | 49.77% | 1.92% | -0.65% | |
| Russell 1000 Value Index | 53.56% | 1.05% | 3.10% | |
| Prospectus Expense Ratio (Gross/Net)† | 1.43%/1.28% | |||
| Expense Ratio for the Year Ended | ||||
| March 31, 2010 (Gross/Net) | 1.34%/1.18% | |||
Past performance does not guarantee future results. The performance data quoted represents past performance and current returns may be lower or higher. Total return figures include change in share price, reinvestment of dividends and capital gains. The investment return and principal value will fluctuate so that an investor’s shares, when redeemed may be worth more or less than the original cost. To obtain performance information current to the most recent month end, please visit our website at www.firstfocusfunds.com.
(†)The above expense ratios are from the Fund’s prospectus dated August 1, 2009. Net expense ratio is net of contractual waivers which are in effect from August 1, 2009 through July 31, 2010.
(*) Returns shown do not reflect the deduction of taxes that a shareholder would pay on Fund distributions or the redemption of Fund shares. The returns for certain periods reflect fee waivers and/or reimbursements in effect for that period; absent fee waivers and reimbursements, performance would have been lower.
The line chart assumes an initial investment of $10,000 made on March 31, 2000. Total return is based on net change in net asset value (“NAV”) assuming reinvestment of distributions. Returns shown include the reinvestment of all dividends and other distributions.
The S&P 500 Index is an index of 500 selected common stocks, most of which are listed on the New York Stock Exchange. The index is heavily weighted toward stocks with large market capitalizations and represents approximately two-thirds of the total market value of all domestic common stocks.
The Russell 1000 Value Index measures the performance of the large-cap value segment of the U.S. equity universe. It includes those Russell 1000 companies with lower price-to-book-value ratios and lower expected growth values.
The above referenced indices are unmangaged and do not reflect the deduction of fees or taxes associated with a mutual fund, such as investment management and fund accounting fees. Investors cannot invest directly in an index.
9
FIRST FOCUS LARGE CAP GROWTH FUND
Investment Objective
The First Focus Large Cap Growth Fund seeks long-term capital appreciation.
Manager Commentary
For the year ended March 31, 2010, the First Focus Large Cap Growth Fund returned 46.40% versus the Russell 1000® Growth Index return of 49.75%. As has been the case in recent years, much angst accompanied these positive returns.
March 9, 2009 marked an inflection point whereby major indices rebounded from multi-year lows to advance over 50%. Enormous fiscal and monetary stimuli served to provide investors some short-term confidence that the economy will stabilize. Corporate profits, benefiting from cost reduction measures coupled with modest investor expectations, pleasantly surprised. In the end, this year positively concluded what proved to be an otherwise challenging decade for equity investors.
Generally speaking, those stocks and sectors that struggled most in the year prior performed best in this last year. Companies possessing the greatest amount of economic sensitivity bounced back the most as investors anticipated an economic rebound. Top performing sectors included the Information Technology, Financials and Consumer Discretionary sectors.
Once again, this past year illustrates the perils of allowing emotions to drive investment decisions. Many market participants capitulated in January and February of 2009 by selling their equity holdings as demonstrated by mutual fund outflows. They opted for cash, U.S. Treasuries, and other relatively safe instruments offering little risk of loss. As a result, these investors collectively missed one of the more historic stock market rallies.
Following two remarkable years in the equity markets, the year ahead promises to be equally intriguing. While it is unlikely that we will realize either the depths of the 2008 market or the inspiring returns of 2009, investors are facing a pivotal point in time.
The ability of the markets to climb the proverbial “wall of worry” will likely determine whether our current market rally will sustain. During the year, the markets demonstrated an impressive level of resiliency to shrug off macro worries to post solid advances. While the current backdrop is somewhat favorable for equities, continued resilience will be helpful to continue our current market rally.
Unlike the past several quarters, it is easier today to paint an attractive backdrop for markets. The domestic economy is showing signs of sustenance with respect to growth. Inflation remains tame while growth is returning. The employment picture, while still bleak, is showing early signs of improvement.
Reported corporate profits continued to impress and most expect the strong reports to endure for the remainder of the year. Against the backdrop of heightened investor expectations, we will be looking for companies to report respectable revenue growth in addition to attractive profits.
Corporate balance sheets also demonstrate strength. According to the Wall Street Journal, undistributed corporate profits recently hit an all-time high of $527 billion. This cash will likely be used to increase dividend payouts and for increased merger-and-acquisition activity. Both actions are generally viewed as favorable to the equity markets.
While one can paint an optimistic equity picture, we are not suggesting that potential storm clouds do not exist. Countries, including the U.S. and China, will be gradually removing some of the stimulative measures deployed to combat the 2008 financial crisis. Domestically, the U.S. Federal Reserve has signaled that it will likely end its easing policy and could, depending on economic conditions, ultimately reverse this policy.
Continue to expect further sovereign debt scrutiny. Several European countries, including Greece, Portugal, Spain, and Ireland are in difficult fiscal positions. Many questions remain concerning how long the U.S. can continue to finance massive budget deficits.
Lastly, businesses of all sizes face increased regulation and likely tax increases from Washington D.C. The cost of conducting business in the U.S. will likely rise over the next several years. Several pieces of legislation are already proposed to increase the regulation authority of the federal government. The recently passed health care legislation also promises to increase the cost of doing business.
Regardless of our current opinion on the economic climate, we continue to position the portfolio with companies able to build their earnings power regardless of the economic backdrop. To the greatest extent possible, we invest in companies that are not dependent upon short-term economic vitality to grow their businesses.1
1 Disclosures
Portfolio composition is as of March 31, 2010 and is subject to change.
10
FIRST FOCUS LARGE CAP GROWTH FUND
Return of a $10,000 Investment as of March 31, 2010

Portfolio Composition as of March 31, 2010
% Based on Total Value of Investments
(Portfolio composition is subject to change)
| Average Annual Total Return for the Year Ended March 31, 2010* | ||
| 1 Year | Since Inception† | |
| First Focus Large Cap Growth Fund | 46.40% | -4.48% |
| Russell 1000 Growth Index | 49.75% | -3.87% |
| Prospectus Expense Ratio (Gross/Net)†† | 1.57%/1.37% | |
| Expense Ratio for the Year Ended | ||
| March 31, 2010 (Gross/Net) | 1.53%/1.22% | |
Past performance does not guarantee future results. The performance data quoted represents past performance and current returns may be lower or higher. Total return figures include change in share price, reinvestment of dividends and capital gains. The investment return and principal value will fluctuate so that an investor’s shares, when redeemed may be worth more or less than the original cost. To obtain performance information current to the most recent month end, please visit our website at www.firstfocusfunds.com.
(††)The above expense ratios are from the Fund’s prospectus dated August 1, 2009. Net expense ratio is net of contractual waivers which are in effect from August 1, 2009 through July 31, 2010.
(†) Since July 5, 2007. The First Focus Large Cap Growth Fund was initially offered on July 2, 2007, however, no shareholder activity occurred until July 5, 2007, which is the commencement of operations.
(*) Returns shown do not reflect the deduction of taxes that a shareholder would pay on Fund distributions or the redemption of Fund shares. The returns for certain periods reflect fee waivers and/or reimbursements in effect for that period; absent fee waivers and reimbursements, performance would have been lower.
The line chart assumes an initial investment of $10,000 made on July 5, 2007. Total return is based on net change in net asset value (“NAV”) assuming reinvestment of distributions. Returns shown include the reinvestment of all dividends and other distributions.
The Russell 1000 Growth Index measures the performance of the large-cap growth segment of the U.S. equity universe. It includes those Russell 1000 companies with higher price-to-book-values ratios and higher forecasted growth values.
The above referenced index is unmanaged and does not reflect the deduction of fees or taxes associated with a mutual fund, such as investment management and fund accounting fees. Investors cannot invest directly in an index.
11
FIRST FOCUS GROWTH OPPORTUNITIES FUND
Investment Objective
The First Focus Growth Opportunities Fund seeks long-term capital appreciation.
Manager Commentary
A year ago on these pages, as the economy tumbled and the markets collapsed, the case was made that the worst was past and a recovery would come before the end of the year. At the time it was difficult to know how the financial collapse was going to be contained and resolved, but as the year progressed, confidence began to return, and the markets began to recuperate. By the end of the year it was becoming clear that the economy was also on the path to recovery, providing the fundamental underpinnings to a sustained market advance.
The First Focus Growth Opportunities Fund was positioned too defensively during the first half of the past year, quickly falling behind its benchmark, the Russell Midcap® Growth Index. As our confidence in an economic recovery grew, and we positioned the Fund in a more economically sensitive fashion, performance improved, and the First Focus Growth Opportunities Fund began outperforming the benchmark in the second half of the year. For the year as a whole the Fund had a 56.25% return versus 63.00% for the Russell Midcap Growth Index. The S&P 500 Index returned 49.77% for the year. While the First Focus Growth Opportunities Fund finished near the middle of the pack for the past year, consistently strong relative perf ormance over the years has earned the Fund a Five Star rating from Morningstar® for the last ten years.1
The First Focus Growth Opportunities Fund is managed with a focus on fundamental factors like sales and earnings that can support the current valuation of a company’s stock. We will continue to focus on reasonably valued companies with superior growth characteristics, with sound financial strength.1
With each passing month the economy moves further down the path toward self-sustaining economic expansion. While the economy and financial markets still face many vulnerabilities, the year ahead is looking better.
1 Disclosures
Portfolio composition is as of March 31, 2010 and is subject to change.
Morningstar Inc. All Rights Reserved. The information, data, analysis and opinions contained herein (1) include the confidential and proprietary information of Morningstar, (2) may not be copied or redistributed, (3) do not constitute investment advice offered by Morningstar, (4) are provided solely for the informational purposes and therefore are not an offer to buy or sell a security, and (5) are not warranted to be correct, complete or accurate. Except as otherwise required by law, Morningstar shall not be responsible for any trading decisions, damages or other losses resulting from, or related to, this information, data, analysis or opinions or their use. For each fund with at least a three-year history, Morningstar calculates a Morningstar RatingTM based on a Mornin gstar Risk-Adjusted Return measure that accounts for variation in a fund’s monthly performance (including the effects of sales charges, loads and redemption fees), placing more emphasis on downward variations and rewarding consistent performance. The top 10% of the funds in each category receive 5 stars, the next 22.5% receive 4 stars, the next 35% receive 3 stars, the next 22.5% receive 2 stars and the bottom 10% receive 1 star. (Each share class is counted as a fraction of one fund within the scale and rated separately, which may cause slight variations in the distribution percentages).
12
FIRST FOCUS GROWTH OPPORTUNITIES FUND
Return of a $10,000 Investment as of March 31, 2010

Portfolio Composition as of March 31, 2010
% Based on Total Value of Investments
(Portfolio composition is subject to change)

| Average Annual Total Return for the Year Ended March 31, 2010* | |||
| 1 Year | 5 Year | 10 Year | |
| First Focus Growth | |||
| Growth Opportunities Fund | 56.25% | 4.28% | 5.06% |
| Russell Midcap Growth Index | 63.00% | 4.27% | -1.69% |
| S&P 500 Index | 49.77% | 1.92% | -0.65% |
| Prospectus Expense Ratio (Gross/Net)† | 1.48%/1.33% | ||
| Expense Ratio for the Year Ended | |||
| March 31, 2010 (Gross/Net) | 1.35%/1.18% | ||
Past performance does not guarantee future results. The performance data quoted represents past performance and current returns may be lower or higher. Total return figures include change in share price, reinvestment of dividends and capital gains. The investment return and principal value will fluctuate so that an investor’s shares, when redeemed may be worth more or less than the original cost. To obtain performance information current to the most recent month end, please visit our website at www.firstfocusfunds.com.
(†)The above expense ratios are from the Fund’s prospectus dated August 1, 2009. Net expense ratio is net of contractual waivers which are in effect from August 1, 2009 through July 31, 2010.
(*) Returns shown do not reflect the deduction of taxes that a shareholder would pay on Fund distributions or the redemption of Fund shares. The returns for certain periods reflect fee waivers and/or reimbursements in effect for that period; absent fee waivers and reimbursements, performance would have been lower.
The line chart assumes an initial investment of $10,000 made on March 31, 2000. Total return is based on net change in net asset value (“NAV”) assuming reinvestment of distributions. Returns shown include the reinvestment of all dividends and other distributions.
The Russell Midcap Growth Index measures the performance of the mid-cap growth segment of the U.S. equity universe. It includes those Russell Midcap Index companies with higher price-to-book-value ratios and higher forecasted growth values.
The Fund’s primary index is the Russell Midcap Growth Index, however to provide a broader market comparative we have also listed an additional index.
The S&P 500 Index is an index of 500 selected common stocks, most of which are listed on the New York Stock Exchange. The index is heavily weighted toward stocks with large market capitalizations and represents approximately two-thirds of the total market value of all domestic common stocks.
The above referenced indices are unmanaged and do not reflect the deduction of fees or taxes associated with a mutual fund, such as investment management and fund accounting fees. Investors cannot invest directly in an index.
13
FIRST FOCUS SMALL COMPANY FUND
Investment Objective
The First Focus Small Company Fund seeks long-term capital appreciation.
Manager Commentary
For the year ended March 31, 2010, the First Focus Small Company Fund returned 68.04%, versus 62.76% for the Russell 2000® Index and 65.07% for the Russell 2000® Value Index.
In 2008, investors were concerned about sub-prime loan issues, declining residential real estate prices, a failing banking system, falling corporate earnings and U.S. Government bailouts and rescue plans for financial services companies and the auto industry. The strong returns witnessed over the last year were likely a result of investors assuming that the worst of the financial crisis has passed.
Taking a look at the source of returns over the last year in the small cap market, several trends emerged. Generally, smaller capitalization companies outperformed larger capitalization companies, lower valuations (price-to-earnings ratio and price-to-book ratio) outperformed higher valuations, companies with higher price volatility (beta) outperformed companies with lower price volatility and companies with lower profitability (return on equity and return on assets) outperformed higher profitability companies. The top three performing sectors in the Russell 2000 Index during the trailing twelve months were Consumer Discretionary (+99%), Materials (+97%) and Energy (+89%). The three weakest performing sectors in the Russell 2000 Index during the last twelve months were Utilities (+28%), Financials (+47%) and Cons umer Staples (+49%).
We are very pleased with the Fund’s performance in such a strong market over the last year. Typically, a market favoring higher beta and lower profitability companies would not benefit our investment style. However, we were able to overcome these trends through positive individual stock selection. On an economic sector basis, the Fund outperformed in seven of the ten sectors that we track and our strongest outperformance was from companies in the Financials, Industrials and Energy sectors.1
As of March 31, 2010 the portfolio held shares of 64 companies diversified across the major sectors of the market. Eleven new companies were introduced into the Fund in the past twelve months, eight positions were eliminated and three companies were acquired.1
While many economic statistics in the U.S. continue to look anemic on an absolute basis, their trends have changed for the better. Unemployment, while still high at 9.7% at the end of March 2010, is down from a peak of 10.1% in late 2009. U.S. housing starts appear to have bottomed and are slowly beginning to increase while the S&P/Case-Shiller Home Price Index is showing flat year-over-year home prices versus declines of nearly 20% year-over-year at the beginning of 2009.1
U.S. household net worth has been recovering the last three quarters ended in December 2009 after having bottomed in March 2009. Retail sales have seen positive year-over-year increases beginning in November 2009 through February 2010. Lastly, Gross Domestic Product (“GDP”) in the U.S. had finally broken into positive territory at the end of September 2009 and followed that up with a stronger positive reading in December of 2009. While there certainly has been improvement in some economic indicators, many investors are debating whether the market has moved too far, too fast.
There are still several concerns that could derail the current stock market recovery. Unemployment remains very high in some areas of the country. The U.S. fiscal deficit has risen dramatically as the U.S. Government has propped up the economy via stimulus programs and bailouts. Eventually, this spending will cease and the economy will have to support itself. In addition, all the money being borrowed and/or printed by the U.S. Government has some investors worried about future inflation. Lastly, there is some concern that the next shoe to drop in the U.S. will come from the commercial real estate market as loans in this segment turn sour.
Whatever path the economy takes going forward, we will continue to stay true to our investment philosophy and process. Our approach to investing identifies quality companies that we believe are temporarily priced below their long-term intrinsic value. Purchases are made primarily on the merits of each individual company, maintaining a diversified portfolio across the various economic sectors. Over the long-term, we believe that our philosophy of owning higher quality businesses at reasonable prices will provide Fund shareholders an appropriate rate of return for the level of risk taken.1
1 Disclosures
Portfolio composition is as of March 31, 2010 and is subject to change.
The S&P/Case-Schiller Home Price Indices measures the residential housing market, tracking changes in the value of the residential real estate market in 20 metropolitan regions across the U.S.
14
FIRST FOCUS SMALL COMPANY FUND
Return of a $10,000 Investment as of March 31, 2010

Portfolio Composition as of March 31, 2010
% Based on Total Value of Investments
(Portfolio composition is subject to change)

| Average Annual Total Return for the Year Ended March 31, 2010* | |||
| 1 Year | 5 Year | 10 Year | |
| First Focus | |||
| Small Company Fund | 68.04% | 6.26% | 9.24% |
| Russell 2000 Index | 62.76% | 3.36% | 3.68% |
| Russell 2000 Value Index | 65.07% | 2.75% | 8.90% |
| Prospectus Expense Ratio (Gross/Net)† | 1.62%/1.47% | ||
| Expense Ratio for the Year Ended | |||
| March 31, 2010 (Gross/Net) | 1.50%/1.34% | ||
Past performance does not guarantee future results. The performance data quoted represents past performance and current returns may be lower or higher. Total return figures include change in share price, reinvestment of dividends and capital gains. The investment return and principal value will fluctuate so that an investor’s shares, when redeemed may be worth more or less than the original cost. To obtain performance information current to the most recent month end, please visit our website at www.firstfocusfunds.com.
(†)The above expense ratios are from the Fund’s prospectus dated August 1, 2009. Net expense ratio is net of contractual waivers which are in effect from August 1, 2009 through July 31, 2010.
(*) Returns shown do not reflect the deduction of taxes that a shareholder would pay on Fund distributions or the redemption of Fund shares. The returns for certain periods reflect fee waivers and/or reimbursements in effect for that period; absent fee waivers and reimbursements, performance would have been lower.
The line chart assumes an initial investment of $10,000 made on March 31, 2000. Total return is based on net change in net asset value (“NAV”) assuming reinvestment of distributions. Returns shown include the reinvestment of all dividends and other distributions.
The Russell 2000 Index measures the performance of the small-cap segment of the U.S. equity universe. The Russell 2000 Index is a subset of the Russell 3000® Index representing approximately 10% of the total market capitalization of that index. It includes approximately 2000 of the smallest securities based on a combination of their market cap and current index membership.
The Russell 2000 Value Index measures the performance of small-cap value segment of the U.S. equity universe. It includes those Russell 2000 companies with lower price-to-book-value ratios and lower forecasted growth values.
The above referenced indices are unmanaged and do not reflect the deduction of fees or taxes associated with a mutual fund, such as investment management and fund accounting fees. Investors cannot invest directly in an index.
15
FIRST FOCUS INTERNATIONAL EQUITY FUND
Investment Objective
The First Focus International Equity Fund seeks long-term capital appreciation.
Manager Commentary
For the year ended March 31, 2010, the First Focus International Equity Fund returned 62.63% while the Fund’s benchmark, the MSCI EAFE Index, returned 55.20% (both in US Dollar terms).
International investment markets saw significant gains during the 12 months ended March 2010. Following the bear market lows in March 2009, investor sentiment improved dramatically over the course of the following months, driven at the outset by relief at the avoidance of a global depression. However, as 2009 progressed, the global economy began to emerge from recession and continued its recovery path into the initial months of 2010.
The portfolio was well positioned to take advantage of the recovery benefiting from an allocation to companies active in Emerging Markets, where a lack of indebtedness and better performance during the global financial crisis has filtered through into stronger equity returns. This inevitably boosted the relative return of the Fund against the benchmark MSCI EAFE Index as did the Fund’s underweight position in the Japanese market where performance lagged during 2009 with continued concerns over deflation in the economy setting it apart from the more general global economic recovery.1
In the final months of 2009, we looked to reduce the volatility of the Fund and re-positioned our sector and regional positions versus the MSCI EAFE Index. Our stock picking has firmly shifted towards companies with strong balance sheets, consistent earnings and good dividend growth. Some of the Fund’s current key positions include ENI, GlaxoSmithKline and RSA Insurance Group. All three stocks exhibit strong balance sheet characteristics with sustainable, strong dividend yields and high payout ratios. These are the type of companies we believe will reward investors in the current environment.1
It is our belief that the easy money has now been made and from here markets are likely to grind upwards. The economic recovery appears to be on a sustainable recovery path, with “double-dip” risks relatively minimal. Economic releases in recent months have been consistent with recovery and corporate profits in particular continue to be ahead of expectations. However, as we go through the next number of months, equity markets are likely to be vulnerable to a setback. To date we have been in a “sweet spot” where extremely low interest rates, attractive valuations and a recovery in economic growth and profits have been positive for risk assets. Perhaps paradoxically, the more assured the recovery becomes over the coming months, the higher the probability that central banks will start to tighten interest rates again. Therefo re good or strong economic news may not necessarily translate into good news for the markets.
Nevertheless, we remain comfortable that the economic recovery will continue and expect the gradual move to the “new normal” world that is less exuberant than the world that entered the recession. A subdued, though solid, economic recovery means that interest rates will not be raised aggressively. In such an environment, we expect equity returns to be more moderate and furthermore that investors can expect these more moderate returns from equities to continue for a sustained period of time. The process of normalizing interest rate policy and removing the emergency liquidity measures will pan out over a number of years. In addition, the next few years will see a significant de-leveraging process as the developed world has to cope with too much debt. This in itself wi ll moderate economic growth levels. In our view this has significant implications for the income component of equity returns. When the potential for capital appreciation is constrained and the expected level of equity returns modest, then the contribution that reinvested income makes to the total return achievable is at its highest. This has already fed through into our stock selection process.1
1 Disclosures
Portfolio composition is as of March 31, 2010 and is subject to change.
16
FIRST FOCUS INTERNATIONAL EQUITY FUND
Return of a $10,000 Investment as of March 31, 2010

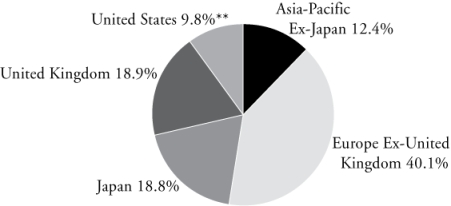
Country Weightings as of March 31, 2010
% Based on Total Value of Investments
(Portfolio composition is subject to change)
| Return of a $10,000 Investment for the Year Ended March 31, 2010* | |||||
| 1 Year | 5 Year | Since Inception† | |||
| First Focus International | |||||
| Equity Fund | 62.63% | 3.82% | 5.01% | ||
| MSCI EAFE Index | 55.20% | 4.23% | 6.97% | ||
| Prospectus Expense Ratio (Gross/Net)†† | 1.90%/1.75% | ||||
| Expense Ratio for Year Ended | |||||
| March 31, 2010 (Gross/Net) | 1.66%/1.45% | ||||
Past performance does not guarantee future results. The performance data quoted represents past performance and current returns may be lower or higher. Total return figures include change in share price, reinvestment of dividends and capital gains. The investment return and principal value will fluctuate so that an investor’s shares, when redeemed may be worth more or less than the original cost. To obtain performance information current to the most recent month end, please visit our website at www.firstfocusfunds.com.
(††)The above expense ratios are from the Fund’s prospectus dated August 1, 2009. Net expense ratio is net of contractual waivers which are in effect from August 1, 2009 through July 31, 2010.
(†) Commencement date is May 30, 2002.
(*) Returns shown do not reflect the deduction of taxes that a shareholder would pay on Fund distributions or the redemption of Fund shares. The returns for certain periods reflect fee waivers and/or reimbursements in effect for that period; absent fee waivers and reimbursements, performance would have been lower.
The line chart assumes an initial investment of $10,000 made on May 30, 2002. Total return is based on net change in net asset value (“NAV”) assuming reinvestment of distributions. Returns shown include the reinvestment of all dividends and other distributions.
The Morgan Stanley Capital International Europe, Australasia and Far East (“MSCI EAFE”) Index is an arithmetic, market value-weighted average of the performance of over 900 securities listed on the stock exchanges of countries in Europe, Australia, and the Far East.
The above referenced index is unmanaged and does not reflect the deduction of fees or taxes associated with a mutual fund, such as investment management and fund accounting fees. Investors cannot invest directly in an index.
(**) 9.5% of this category is comprised of Exchange Traded Funds which provide international equity exposure.
17
SCHEDULES OF PORTFOLIO INVESTMENTS
March 31, 2010
SHORT-INTERMEDIATE BOND FUND
| Principal Amount | Security Description | Value |
| Non-U.S. Government Agency Asset-Backed | ||||
| Securities - 17.8% | ||||
| $ 706,252 | AmeriCredit Automobile Receivables | |||
| Trust (insured by FSA Assurance), | ||||
| 5.64%, 09/06/13 | $ 725,159 | |||
| 600,000 | Banc of America Commercial Mortgage | |||
| Inc., 7.38%, 09/15/32 (a) | 602,268 | |||
| 541,066 | Banc of America Commercial Mortgage | |||
| Inc., 5.00%, 10/10/45 | 544,594 | |||
| 315,000 | Bayview Financial Acquisition Trust, | |||
| 6.21%, 05/28/37 (a) | 296,718 | |||
| 890,000 | Bear Stearns Commercial Mortgage | |||
| Securities, 5.53%, 09/11/41 | 942,467 | |||
| 512,999 | Citimortgage Alternative Loan Trust, | |||
| 5.25%, 03/25/21 | 480,200 | |||
| 523,036 | Countrywide Alternative Loan Trust, | |||
| 6.06%, 08/25/36 (a) | 515,581 | |||
| 858,000 | Countrywide Asset-Backed Certificates, | |||
| 1.50%, 05/25/37 (a) | 42,472 | |||
| 443,991 | Credit Suisse First Boston Mortgage | |||
| Securities Corp., 5.00%, 08/25/20 | 410,869 | |||
| 775,000 | First Union National Bank Commercial | |||
| Mortgage, 7.80%, 10/15/32 (a) (e) | 787,024 | |||
| 580,000 | First Union National Bank Commercial | |||
| Mortgage, 6.67%, 12/12/33 | 584,231 | |||
| 372,062 | Home Equity Asset Trust, | |||
| 0.36%, 07/25/37 (a) | 357,876 | |||
| 671,000 | LB-UBS Commercial Mortgage Trust, | |||
| 6.37%, 12/15/28 | 700,886 | |||
| 850,000 | LB-UBS Commercial Mortgage Trust, | |||
| 6.30%, 11/15/33 | 884,305 | |||
| 678,236 | MASTR Asset Securitization Trust, | |||
| 5.25%, 11/25/35 | 618,778 | |||
| 600,200 | Nationstar Home Equity Loan Trust | |||
| REMIC, 0.31%, 06/25/37 (a) | 582,403 | |||
| 405,088 | Nomura Asset Acceptance Corp., | |||
| 6.00%, 03/25/47 (a) | 242,674 | |||
| 611,308 | Preferred Term Securities XXIV Ltd., | |||
| 0.56%, 03/22/37 (a) (e) (f) | 372,898 | |||
| 533,913 | Residential Accredit Loans Inc., | |||
| 5.50%, 01/25/34 | 524,739 | |||
| 148,296 | Residential Accredit Loans Inc., | |||
| 6.00%, 10/25/34 | 136,756 | |||
| 471,947 | Residential Accredit Loans Inc., | |||
| 5.50%, 02/25/35 | 395,709 | |||
| 758,620 | Residential Asset Mortgage Products Inc. | |||
| (insured by AMBAC Assurance Corp.), | ||||
| 4.02%, 03/25/33 | 590,350 | |||
| 390,821 | Structured Asset Securities Corp., | |||
| 5.50%, 07/25/33 | 390,826 | |||
| 467,927 | Triad Auto Receivables Owner Trust | |||
| (insured by AMBAC Assurance Corp.), | ||||
| 5.31%, 05/13/13 | 486,438 | |||
| 542,000 | Wells Fargo Home Equity Trust, | |||
| 0.39%, 07/25/36 (a) | 479,157 | |||
| Total Non-U.S. Government Agency Asset-Backed | ||||
| Securities (cost $13,445,231) | 12,695,378 | |||
| Corporate Bonds - 39.6% | ||||
| Consumer Discretionary - 1.6% | ||||
| 175,000 | Stanford University, 3.63%, 05/01/14 | 181,818 | ||
| 505,000 | Comcast Corp., 6.50%, 01/15/15 | 568,453 | ||
| 375,000 | Mohawk Industries Inc., | |||
| 6.88%, 01/15/16 | 387,188 | |||
| 1,137,459 | ||||
| Consumer Staples - 3.1% | ||||
| 423,000 | Bottling Group LLC, 4.63%, 11/15/12 | 454,126 | ||
| 448,000 | Kellogg Co., 5.13%, 12/03/12 | 485,190 | ||
| 500,000 | Kimberly-Clark Corp., 5.00%, 08/15/13 | 543,539 | ||
| 335,000 | SUPERVALU Inc., 8.00%, 05/01/16 | 339,187 | ||
| 375,000 | Wal-Mart Stores Inc., 5.00%, 04/05/12 | 402,214 | ||
| 2,224,256 | ||||
| Energy - 3.0% | ||||
| 615,000 | ConocoPhillips, 4.60%, 01/15/15 | 659,580 | ||
| 460,000 | Enterprise Products Operating LLC, | |||
| 9.75%, 01/31/14 | 558,576 | |||
| 579,000 | Occidental Petroleum Corp., | |||
| 7.00%, 11/01/13 | 670,682 | |||
| 220,000 | Transocean Inc., 1.50%, 12/15/37 | 214,774 | ||
| 2,103,612 | ||||
| Financials - 19.4% | ||||
| 540,000 | ACE INA Holdings Inc., 5.60%, 05/15/15 | 589,597 | ||
| 585,000 | American Express Credit Corp., | |||
| 7.30%, 08/20/13 | 656,612 | |||
| 450,000 | American Honda Finance Corp., | |||
| 2.64%, 06/29/11 (a) (e) | 458,803 | |||
| 890,000 | Bank of New York Mellon, | |||
| 6.38%, 04/01/12 | 969,594 | |||
| 600,000 | Berkshire Hathaway Finance Corp., | |||
| 5.00%, 08/15/13 | 655,247 | |||
| 615,000 | Citigroup Inc., 6.50%, 08/19/13 | 662,977 | ||
| 720,000 | General Electric Capital Corp., | |||
| 0.52%, 09/15/14 (a) | 684,336 | |||
| 620,000 | Goldman Sachs Group Inc., | |||
| 6.00%, 05/01/14 | 678,890 | |||
See accompanying notes to financial statements.
18
SCHEDULES OF PORTFOLIO INVESTMENTS
March 31, 2010
SHORT-INTERMEDIATE BOND FUND (CONTINUED)
| Principal Amount | Security Description | Value |
| $ 280,000 | Hartford Financial Services Group Inc., | |||
| 4.00%, 03/30/15 | $ 277,386 | |||
| 610,000 | JPMorgan Chase & Co., | |||
| 5.75%, 01/02/13 | 662,015 | |||
| 525,000 | KeyBank NA, 3.20%, 06/15/12 | 545,228 | ||
| 415,000 | KeyBank NA, 5.80%, 07/01/14 | 424,438 | ||
| 410,000 | Merrill Lynch & Co. Inc., | |||
| 5.45%, 02/05/13 | 433,784 | |||
| 620,000 | Metropolitan Life Global Funding I, | |||
| 5.13%, 04/10/13 (e) | 665,630 | |||
| 655,000 | Morgan Stanley, 4.75%, 04/01/14 | 668,805 | ||
| 250,000 | National City Corp., 4.00%, 02/01/11 | 254,375 | ||
| 650,000 | PNC Funding Corp., 0.45%, 01/31/14 (a) | 624,347 | ||
| 615,000 | Pricoa Global Funding I, | |||
| 5.45%, 06/11/14 (e) | 659,945 | |||
| 950,000 | Regions Bank, 3.25%, 12/09/11 | 985,337 | ||
| 570,000 | Regions Financial Corp., 7.25%, 11/10/14 | 599,720 | ||
| 650,000 | State Street Bank & Trust Co., | |||
| 0.45%, 12/08/15 (a) | 611,286 | |||
| 550,000 | USB Capital IX, 6.19% | |||
| (callable at 100 beginning 04/15/11) (b) | 470,250 | |||
| 650,000 | Wells Fargo Bank NA, 0.46%, 05/16/16 (a) | 593,768 | ||
| 13,832,370 | ||||
| Health Care - 0.8% | ||||
| 580,000 | Medtronic Inc., 1.50%, 04/15/11 | 589,425 | ||
| Industrials - 1.2% | ||||
| 475,000 | Textron Inc., 6.20%, 03/15/15 | 503,103 | ||
| 350,000 | United Technologies Corp., | |||
| 6.10%, 05/15/12 | 382,768 | |||
| 885,871 | ||||
| Information Technology - 3.6% | ||||
| 525,000 | CA Inc., 6.13%,12/01/14 (e) | 572,835 | ||
| 825,000 | Cisco Systems Inc., 5.25%, 02/22/11 | 858,588 | ||
| 300,000 | Hewlett-Packard Co., 2.00%, 02/24/11 (a) | 304,740 | ||
| 250,000 | Hewlett-Packard Co., 2.95%, 08/15/12 | 258,201 | ||
| 520,000 | International Business Machines Corp., | |||
| 6.50%, 10/15/13 | 596,883 | |||
| 2,591,247 | ||||
| Materials - 2.8% | ||||
| 495,000 | Dow Chemical Co., 7.60%, 05/15/14 | 565,088 | ||
| 335,000 | Nalco Co., 8.25%, 05/15/17 (e) | 355,938 | ||
| 480,000 | Praxair Inc., 3.95%, 06/01/13 | 504,877 | ||
| 475,000 | Rio Tinto Finance USA Ltd., | |||
| 8.95%, 05/01/14 | 572,376 | |||
| 1,998,279 | ||||
| Telecommunication Services - 0.9% | ||||
| 595,000 | AT&T Inc., 7.30%, 11/15/11 | 650,384 | ||
| Utilities - 3.2% | ||||
| 400,000 | Dayton Power & Light Co., | |||
| 5.13%, 10/01/13 | 432,356 | |||
| 416,000 | PacifiCorp, 5.45%, 09/15/13 | 456,093 | ||
| 370,000 | Public Service Co. of Colorado, | |||
| 7.88%, 10/01/12 | 423,687 | |||
| 575,000 | South Carolina Electric & Gas Co., | |||
| 6.70%, 02/01/11 | 602,221 | |||
| 380,000 | Wisconsin Energy Corp., 6.50%, 04/01/11 | 400,635 | ||
| 2,314,992 | ||||
| Total Corporate Bonds (cost $27,133,661) | 28,327,895 | |||
| Government And Agency Obligations - 37.9% | ||||
| GOVERNMENT SECURITIES - 31.7% | ||||
| Federal Home Loan Bank - 5.9% | ||||
| 1,700,000 | Federal Home Loan Bank, | |||
| 4.88%, 05/14/10 (g) | 1,709,379 | |||
| 1,600,000 | Federal Home Loan Bank, | |||
| 3.50%, 07/16/10 (g) | 1,615,384 | |||
| 830,000 | Federal Home Loan Bank, | |||
| 4.50%, 09/16/13 (g) | 897,521 | |||
| 4,222,284 | ||||
| Federal Home Loan Mortgage Corp. - 3.7% | ||||
| 1,500,000 | Federal Home Loan Mortgage Corp., | |||
| 6.88%, 09/15/10 (g) | 1,546,227 | |||
| 1,000,000 | Federal Home Loan Mortgage Corp., | |||
| 4.50%, 07/15/13 (g) | 1,081,449 | |||
| 2,627,676 | ||||
| Municipals - 1.3% | ||||
| 205,000 | Lincoln Nebraska Tax Allocation, | |||
| Perot Systems Redevelopment Project, | ||||
| 3.25%, 11/01/12 | 208,237 | |||
| 165,000 | Lincoln Nebraska Tax Allocation, | |||
| Perot Systems Redevelopment Project, | ||||
| 4.25%, 11/01/14 | 166,607 | |||
| 550,000 | Nebraska Public Power District, Revenue, | |||
| Series B, 4.14%, 01/01/13 | 582,005 | |||
| 956,849 | ||||
| Treasury Inflation Index Securities - 2.9% | ||||
| 964,128 | U.S. Treasury Inflation Indexed Note, | |||
| 3.00%, 07/15/12 (d) | 1,038,547 | |||
| 1,021,329 | U.S. Treasury Inflation Indexed Note, | |||
| 1.63%, 01/15/15 (d) | 1,066,970 | |||
| 2,105,517 | ||||
| U.S. Treasury Securities - 17.9% | ||||
| 3,800,000 | U.S. Treasury Bill, 0.14%, 06/24/10 | 3,798,803 | ||
| 7,215,000 | U.S. Treasury Note, 1.75%, 11/15/11 | 7,323,788 | ||
See accompanying notes to financial statements.
19
SCHEDULES OF PORTFOLIO INVESTMENTS
March 31, 2010
SHORT-INTERMEDIATE BOND FUND (CONTINUED)
| Shares or | ||||
| Principal Amount | Security Description | Value |
| $ 1,600,000 | U.S. Treasury Note, 2.75%, 10/31/13 | $ 1,646,374 | ||
| 12,768,965 | ||||
| U.S. GOVERNMENT AGENCY MORTGAGE | ||||
| BACKED SECURITIES - 6.2% | ||||
| Federal Home Loan Mortgage Corp. - 2.2% | ||||
| 1,532,300 | Federal Home Loan Mortgage Corp. | |||
| REMIC, 4.50%, 12/15/17 | 1,593,973 | |||
| Federal National Mortgage Association - 4.0% | ||||
| 1,256,456 | Federal National Mortgage Association | |||
| REMIC, 4.00%, 09/25/10 | 1,266,394 | |||
| 1,515,227 | Federal National Mortgage Association | |||
| REMIC, 5.50%, 11/25/34 | 1,587,419 | |||
| 2,853,813 | ||||
| Total Government and Agency | ||||
| Obligations (cost $26,724,674) | 27,129,077 | |||
| Investment Companies - 3.9% | ||||
| Mutual Funds - 3.9% | ||||
| 88,140 | Federated Institutional High-Yield Bond | |||
| Fund | 854,955 | |||
| 1,942,630 | Goldman Sachs Financial Square Funds, | |||
| Treasury Obligations Fund, 0.04% (c) | 1,942,630 | |||
| Total Investment Companies (cost $2,692,630) | 2,797,585 | |||
| Total Investments - 99.2% (cost $69,996,196) | 70,949,935 | |||
| Other assets in excess of liabilities - 0.8% | 553,153 | |||
| NET ASSETS - 100% | $ 71,503,088 | |||
| (a) | Variable rate security. The rate reflected is the rate in | |||
| effect at March 31, 2010. | ||||
| (b) | Perpetual maturity security. Interest rate is fixed until | |||
| the first call date and variable thereafter. | ||||
| (c) | Dividend yield changes daily to reflect current market | |||
| conditions. Rate was the quoted yield as of | ||||
| March 31, 2010. | ||||
| (d) | U.S. Treasury inflation indexed note, par amount | |||
| adjusted for inflation. | ||||
| (e) | Security is exempt from registration under Rule144A of | |||
| the Securities Act of 1933. The security may be resold | ||||
| in transactions exempt from registration, normally to | ||||
| qualified buyers. This security has been deemed liquid | ||||
| by the Fund’s investment adviser based on procedures | ||||
| approved by the Board of Directors (the “Board”). | ||||
| (f) | Security fair valued in good faith in accordance with | |||
| the procedures established by the Board. Good faith fair | ||||
| valued securities may be classified as Level 2 or Level 3 | ||||
| for Financial Accounting Standards Board (“FASB”) | ||||
| Accounting Standards Codification (“ASC”) Topic 820 | ||||
| “Fair Value Measurements and Disclosures” based on | ||||
| the applicable valuation inputs. See Security Valuation | ||||
| under Significant Accounting Policies in the Notes | ||||
| to the Financial Statements. | ||||
| (g) | This security is a direct debt of the agency and not | |||
| collateralized by mortgages. | ||||
| REMIC | Real Estate Mortgage Investment Conduit | |||
See accompanying notes to financial statements.
20
SCHEDULES OF PORTFOLIO INVESTMENTS
March 31, 2010
INCOME FUND
| Principal Amount | Security Description | Value |
| Non-U.S. Government Agency Asset-Backed | ||||
| Securities - 25.3% | ||||
| $ 1,348,000 | Banc of America Commercial Mortgage | |||
| Inc. REMIC, 5.18%, 09/10/47 (a) | $ 1,403,092 | |||
| 578,650 | Bear Stearns Asset Backed Securities Trust, | |||
| 5.00%, 10/25/33 | 525,001 | |||
| 1,000,000 | Bear Stearns Commercial Mortgage | |||
| Securities, 5.53%, 09/11/41 | 1,058,952 | |||
| 845,489 | Citigroup Mortgage Loan Trust Inc., | |||
| 6.50%, 07/25/34 | 764,111 | |||
| 512,999 | Citimortgage Alternative Loan Trust, | |||
| 5.25%, 03/25/21 | 480,200 | |||
| 523,036 | Countrywide Alternative Loan Trust, | |||
| 6.06%, 08/25/36 (a) | 515,581 | |||
| 1,075,000 | Countrywide Asset-Backed Certificates, | |||
| 1.50%, 05/25/37 (a) | 53,214 | |||
| 443,991 | Credit Suisse First Boston Mortgage | |||
| Securities Corp., 5.00%, 08/25/20 | 410,869 | |||
| 456,172 | Credit Suisse First Boston Mortgage | |||
| Securities Corp., 5.75%, 04/25/33 | 444,268 | |||
| 900,000 | First Union National Bank Commercial | |||
| Mortgage, 7.80%, 10/15/32 (a) (e) | 913,963 | |||
| 635,000 | First Union National Bank Commercial | |||
| Mortgage, 6.67%, 12/12/33 | 639,632 | |||
| 325,867 | Home Equity Asset Trust, | |||
| 0.36%, 07/25/37 (a) | 313,442 | |||
| 925,000 | LB-UBS Commercial Mortgage Trust, | |||
| 6.37%, 12/15/28 | 966,199 | |||
| 1,234,000 | LB-UBS Commercial Mortgage Trust, | |||
| 6.30%, 11/15/33 | 1,283,803 | |||
| 626,064 | MASTR Asset Securitization Trust, | |||
| 5.25%, 11/25/35 | 571,180 | |||
| 438,845 | Nomura Asset Acceptance Corp., | |||
| 6.00%, 03/25/47 (a) | 262,897 | |||
| 957,163 | Preferred Term Securities XXI Ltd., | |||
| 5.71%, 03/22/38 (a) (e) (f) | 67,001 | |||
| 630,562 | Preferred Term Securities XXIV Ltd., | |||
| 0.56%, 03/22/37 (a) (e) (f) | 384,643 | |||
| 558,734 | Residential Accredit Loans Inc., | |||
| 5.50%, 01/25/34 | 549,133 | |||
| 732,326 | Residential Accredit Loans Inc., | |||
| 6.00%, 10/25/34 | 675,342 | |||
| 317,922 | Residential Accredit Loans Inc., | |||
| 5.50%, 02/25/35 | 266,565 | |||
| 974,434 | Residential Asset Mortgage Products Inc. | |||
| (insured by AMBAC Assurance Corp.), | ||||
| 4.02%, 03/25/33 | 758,294 | |||
| 429,473 | Structured Asset Securities Corp., | |||
| 5.50%, 07/25/33 | 429,479 | |||
| 745,390 | Structured Asset Securities Corp., | |||
| (insured by MBIA Assurance Corp.), | ||||
| 5.30%, 09/25/33 | 708,177 | |||
| 467,927 | Triad Auto Receivables Owner Trust | |||
| (insured by AMBAC Assurance Corp.), | ||||
| 5.31%, 05/13/13 | 486,438 | |||
| 325,000 | Wells Fargo Home Equity Trust, | |||
| 0.39%, 07/25/36 (a) | 287,317 | |||
| Total Non-U.S. Government Agency Asset-Backed | ||||
| Securities (cost $16,936,512) | 15,218,793 | |||
| Corporate Bonds - 28.9% | ||||
| Consumer Discretionary - 1.7% | ||||
| 325,000 | Stanford University, 3.63%, 05/01/14 | 337,662 | ||
| 310,000 | Comcast Corp., 6.50%, 01/15/17 | 344,630 | ||
| 325,000 | Mohawk Industries Inc., | |||
| 6.88%, 01/15/16 | 335,563 | |||
| 1,017,855 | ||||
| Consumer Staples - 1.5% | ||||
| 320,000 | Kimberly-Clark Corp., 6.13%, 08/01/17 | 360,551 | ||
| 285,000 | PepsiCo Inc., 7.90%, 11/01/18 | 352,988 | ||
| 165,000 | SUPERVALU Inc., 8.00%, 05/01/16 | 167,062 | ||
| 880,601 | ||||
| Energy - 1.2% | ||||
| 335,000 | Enterprise Products Operating LLC, | |||
| 6.30%, 09/15/17 | 367,992 | |||
| 300,000 | Tosco Corp., 8.13%, 02/15/30 | 377,444 | ||
| 745,436 | ||||
| Financials - 15.4% | ||||
| 605,000 | American Express Co., | |||
| 6.80%, 09/01/66 (a) | 589,875 | |||
| 350,000 | American Honda Finance Corp., | |||
| 2.64%, 06/29/11 (a) (e) | 356,847 | |||
| 325,000 | Chubb Corp., 6.80%, 11/15/31 | 362,140 | ||
| 350,000 | Citigroup Inc., 6.50%, 08/19/13 | 377,304 | ||
| 420,000 | General Electric Capital Corp., | |||
| 0.45%, 01/08/16 (a) | 384,946 | |||
| 335,000 | Goldman Sachs Capital I, 6.35%, 02/15/34 | 309,324 | ||
| 365,000 | Goldman Sachs Group Inc., | |||
| 6.25%, 09/01/17 | 392,524 | |||
| 150,000 | Hartford Financial Services Group Inc., | |||
| 4.00%, 03/30/15 | 148,600 | |||
| 800,000 | John Deere Capital Corp., | |||
| 2.88%, 06/19/12 | 827,750 | |||
| 360,000 | JPMorgan Chase Capital XXV, | |||
| 6.80%, 10/01/37 | 358,353 | |||
| 525,000 | KeyBank NA, 3.20%, 06/15/12 | 545,228 | ||
| 285,000 | KeyBank NA, 5.80%, 07/01/14 | 291,481 | ||
See accompanying notes to financial statements.
21
SCHEDULES OF PORTFOLIO INVESTMENTS
March 31, 2010
INCOME FUND (CONTINUED)
| Principal Amount | Security Description | Value |
| $ 365,000 | Merrill Lynch & Co. Inc., | |||
| 5.00%, 01/15/15 | $ 373,347 | |||
| 425,000 | Metropolitan Life Global Funding I, | |||
| 5.13%, 04/10/13 (e) | 456,279 | |||
| 350,000 | Morgan Stanley, 4.75%, 04/01/14 | 357,377 | ||
| 375,000 | PNC Funding Corp., 0.45%, 01/31/14 (a) | 360,200 | ||
| 330,000 | Prudential Financial Inc., 7.38%, 06/15/19 | 378,440 | ||
| 350,000 | Regions Bank, 3.25%, 12/09/11 | 363,019 | ||
| 300,000 | Regions Financial Corp., 7.25%, 11/10/14 | 315,642 | ||
| 375,000 | State Street Bank & Trust Co., | |||
| 0.45%, 12/08/15 (a) | 352,665 | |||
| 453,000 | UBS Preferred Funding Trust V, 6.24% | |||
| (callable at 100 beginning 05/15/16) (b) | 407,700 | |||
| 675,000 | USB Capital IX, 6.19% | |||
| (callable at 100 beginning 04/15/11) (b) | 577,125 | |||
| 350,000 | Wachovia Bank NA, 6.60%, 01/15/38 | 360,105 | ||
| 9,246,271 | ||||
| Industrials - 1.6% | ||||
| 675,000 | Pitney Bowes Inc., 5.25%, 01/15/37 | 699,099 | ||
| 275,000 | Textron Inc., 6.20%, 03/15/15 | 291,270 | ||
| 990,369 | ||||
| Information Technology - 1.7% | ||||
| 320,000 | CA Inc., 6.13%,12/01/14 (e) | 349,156 | ||
| 300,000 | Electronic Data Systems Corp., | |||
| 6.00%, 08/01/13 | 335,585 | |||
| 300,000 | International Business Machines Corp., | |||
| 7.00%, 10/30/25 | 353,218 | |||
| 1,037,959 | ||||
| Materials - 2.1% | ||||
| 305,000 | Dow Chemical Co., 8.55%, 05/15/19 | 368,971 | ||
| 290,000 | Martin Marietta Materials Inc., | |||
| 6.60%, 04/15/18 | 308,920 | |||
| 165,000 | Nalco Co., 8.25%, 05/15/17 (e) | 175,313 | ||
| 325,000 | Rio Tinto Finance USA Ltd., | |||
| 8.95%, 05/01/14 | 391,626 | |||
| 1,244,830 | ||||
| Telecommunication Services - 0.6% | ||||
| 355,000 | AT&T Inc., 5.50%, 02/01/18 | 376,885 | ||
| Utilities - 3.1% | ||||
| 315,000 | Alabama Power Co., 5.50%, 10/15/17 | 338,387 | ||
| 400,000 | Dayton Power & Light Co., | |||
| 5.13%, 10/01/13 | 432,356 | |||
| 590,000 | Laclede Gas Co., 6.50%, 11/15/10 | 605,870 | ||
| 80,000 | Laclede Gas Co., 6.50%, 10/15/12 | 87,733 | ||
| 350,000 | PacifiCorp, 5.50%, 01/15/19 | 374,254 | ||
| 1,838,600 | ||||
| Total Corporate Bonds (cost $16,755,098) | 17,378,806 | |||
| Government And Agency Obligations - 41.8% | ||||
| GOVERNMENT SECURITIES - 16.3% | ||||
| Federal Home Loan Mortgage Corp. - 0.1% | ||||
| 50,000 | Federal Home Loan Mortgage Corp., | |||
| 1.63%, 04/26/11 (g) | 50,540 | |||
| Federal National Mortgage Association - 1.8% | ||||
| 650,000 | Federal National Mortgage Association, | |||
| 5.00%, 02/16/12 (g) | 696,136 | |||
| 350,000 | Federal National Mortgage Association, | |||
| 5.38%, 06/12/17 (g) | 387,562 | |||
| 1,083,698 | ||||
| Municipals - 1.9% | ||||
| 335,000 | Nebraska Public Power District, Series B, | |||
| RB, 4.85%, 01/01/14 | 353,214 | |||
| 215,000 | State of Connecticut, Public Improvements, | |||
| 4.95%, 12/01/20 | 217,795 | |||
| 215,000 | State of Connecticut, Public Improvements, | |||
| 5.63%, 12/01/29 | 219,741 | |||
| 350,000 | University of Nebraska, Series B, RB, | |||
| 5.70%, 07/01/29 | 338,891 | |||
| 1,129,641 | ||||
| Treasury Inflation Index Securities - 3.1% | ||||
| 1,138,055 | U.S. Treasury Inflation Indexed Note, | |||
| 2.00%, 07/15/14 (d) | 1,210,694 | |||
| 635,834 | U.S. Treasury Inflation Indexed Note, | |||
| 2.13%, 01/15/19 (d) | 669,762 | |||
| 1,880,456 | ||||
| U.S. Treasury Securities - 9.4% | ||||
| 2,725,000 | U.S. Treasury Bond, 4.38%, 11/15/39 | 2,576,828 | ||
| 3,065,000 | U.S. Treasury Note, 2.63%, 12/31/14 | 3,087,031 | ||
| 5,663,859 | ||||
| U.S. GOVERNMENT AGENCY MORTGAGE | ||||
| BACKED SECURITIES - 25.5% | ||||
| Federal Home Loan Mortgage Corp. - 16.6% | ||||
| 890,000 | Federal Home Loan Mortgage Corp., | |||
| 5.50%, 08/15/29 | 926,490 | |||
| 2,160,000 | Federal Home Loan Mortgage Corp. | |||
| REMIC, 4.00%, 01/15/17 | 2,248,871 | |||
| 1,090,000 | Federal Home Loan Mortgage Corp. | |||
| REMIC, 4.50%, 04/15/19 | 1,151,277 | |||
| 1,244,000 | Federal Home Loan Mortgage Corp. | |||
| REMIC, 4.50%, 06/15/21 | 1,278,310 | |||
| 2,040,000 | Federal Home Loan Mortgage Corp. | |||
| REMIC, 5.00%, 04/15/28 | 2,155,638 | |||
| 2,030,000 | Federal Home Loan Mortgage Corp. | |||
| REMIC, 5.00%, 02/15/29 | 2,154,789 | |||
| 9,915,375 | ||||
See accompanying notes to financial statements.
22
SCHEDULES OF PORTFOLIO INVESTMENTS
March 31, 2010
INCOME FUND (CONCLUDED)
| Shares or | ||||
| Principal Amount | Security Description | Value |
| Federal National Mortgage Association - 8.9% | ||||
| $ 575,255 | Federal National Mortgage Association, | |||
| 5.50%, 11/01/16 | $ 619,551 | |||
| 146,380 | Federal National Mortgage Association, | |||
| 4.50%, 12/01/18 | 154,112 | |||
| 969,609 | Federal National Mortgage Association, | |||
| 7.50%, 08/01/22 | 1,098,483 | |||
| 292,168 | Federal National Mortgage Association, | |||
| 5.00%, 08/01/34 | 302,637 | |||
| 433,962 | Federal National Mortgage Association, | |||
| 5.50%, 08/01/37 | 458,107 | |||
| 1,315,000 | Federal National Mortgage Association | |||
| REMIC, 4.00%, 02/25/19 | 1,352,840 | |||
| 654,014 | Federal National Mortgage Association | |||
| REMIC, 5.00%, 07/25/19 | 656,596 | |||
| 703,466 | Federal National Mortgage Association | |||
| REMIC, 5.50%, 12/25/32 | 732,464 | |||
| 5,374,790 | ||||
| Total Government and Agency | ||||
| Obligations (cost $23,899,328) | 25,098,359 | |||
| Investment Companies - 3.3% | ||||
| Mutual Funds - 3.3% | ||||
| 88,140 | Federated Institutional High-Yield Bond | |||
| Fund | 854,955 | |||
| 1,138,899 | Goldman Sachs Financial Square Funds, | |||
| Treasury Obligations Fund, 0.04% (c) | 1,138,899 | |||
| Total Investment Companies (cost $1,888,899) | 1,993,854 | |||
| Total Investments - 99.3% (Cost $59,479,837) | 59,689,812 | |||
| Other assets in excess of liabilities - 0.7% | 408,297 | |||
| NET ASSETS - 100% | $ 60,098,109 | |||
(a) | Variable rate security. The rate reflected is the rate in | |||
| effect at March 31, 2010. | ||||
(b) | Perpetual maturity security. Interest rate is fixed until | |||
| the first call date and variable thereafter. | ||||
| (c) | Dividend yield changes daily to reflect current market | |||
| conditions. Rate was the quoted yield as of | ||||
| March 31, 2010. | ||||
| (d) | U.S. Treasury inflation indexed note, par amount | |||
| adjusted for inflation. | ||||
(e) | Security is exempt from registration under Rule144A of | |||
| the Securities Act of 1933. The security may be resold | ||||
| in transactions exempt from registration, normally to | ||||
| qualified buyers. This security has been deemed liquid | ||||
| by the Fund’s investment adviser based on procedures | ||||
| approved by the Board. | ||||
(f) | Security fair valued in good faith in accordance with | |||
| the procedures established by the Board. Good faith fair | ||||
| valued securities may be classified as Level 2 or Level 3 | ||||
| for FASB ASC Topic 820 “Fair Value | ||||
| Measurements and Disclosures” based on the applicable | ||||
| valuation inputs. See Security Valuation under | ||||
| Significant Accounting Policies in the Notes to the | ||||
| Financial Statements. | ||||
| (g) | This security is a direct debt of the agency and not | |||
| collateralized by mortgages. | ||||
| MBIA | Municipal Bond Investors Assurance | |||
| RB | Revenue Bond | |||
| REMIC | Real Estate Mortgage Investment Conduit | |||
See accompanying notes to financial statements.
23
SCHEDULES OF PORTFOLIO INVESTMENTS
March 31, 2010
BALANCED FUND
| Shares | Security Description | Value |
| Common Stocks - 69.4% | ||||
| Consumer Discretionary - 9.9% | ||||
| 10,000 | Aeropostale Inc. (a) | $ 288,300 | ||
| 5,000 | BorgWarner Inc. (a) | 190,900 | ||
| 20,000 | Chico’s FAS Inc. | 288,400 | ||
| 2,000 | Chipotle Mexican Grill Inc. - Class A (a) | 225,340 | ||
| 17,000 | Comcast Corp. - Class A | 319,940 | ||
| 6,000 | DeVry Inc. | 391,200 | ||
| 7,000 | GameStop Corp. - Class A (a) | 153,370 | ||
| 5,000 | Guess? Inc. | 234,900 | ||
| 4,500 | McDonald’s Corp. | 300,240 | ||
| 3,500 | NetFlix Inc. (a) | 258,090 | ||
| 10,000 | Tempur-Pedic International Inc. (a) | 301,600 | ||
| 2,952,280 | ||||
| Consumer Staples - 6.3% | ||||
| 7,500 | Avon Products Inc. | 254,025 | ||
| 4,000 | Church & Dwight Co. Inc. | 267,800 | ||
| 4,000 | Colgate-Palmolive Co. | 341,040 | ||
| 10,000 | Flowers Foods Inc. | 247,400 | ||
| 6,000 | Herbalife Ltd. | 276,720 | ||
| 7,000 | Kraft Foods Inc. - Class A | 211,680 | ||
| 4,300 | Ralcorp Holdings Inc. (a) | 291,454 | ||
| 1,890,119 | ||||
| Energy - 5.7% | ||||
| 3,000 | Apache Corp. | 304,500 | ||
| 3,500 | Noble Energy Inc. | 255,500 | ||
| 3,600 | Occidental Petroleum Corp. | 304,344 | ||
| 6,000 | Peabody Energy Corp. | 274,200 | ||
| 10,000 | Southern Union Co. | 253,700 | ||
| 14,000 | Williams Cos. Inc. | 323,400 | ||
| 1,715,644 | ||||
| Financials - 6.3% | ||||
| 6,000 | ACE Ltd. | 313,800 | ||
| 3,000 | Affiliated Managers Group Inc. (a) | 237,000 | ||
| 5,000 | AFLAC Inc. | 271,450 | ||
| 6,000 | Credit Acceptance Corp. (a) | 247,440 | ||
| 3,500 | Everest Re Group Ltd. | 283,255 | ||
| 7,000 | HCC Insurance Holdings Inc. | 193,200 | ||
| 6,000 | Stifel Financial Corp. (a) | 322,500 | ||
| 1,868,645 | ||||
| Health Care - 10.1% | ||||
| 6,000 | Abbott Laboratories | 316,080 | ||
| 4,500 | Biogen Idec Inc. (a) | 258,120 | ||
| 5,000 | Catalyst Health Solutions Inc. (a) | 206,900 | ||
| 3,000 | Cerner Corp. (a) | 255,180 | ||
| 4,500 | Hospira Inc. (a) | 254,925 | ||
| 4,000 | Johnson & Johnson | 260,800 | ||
| 3,000 | Medco Health Solutions Inc. (a) | 193,680 | ||
| 12,000 | PSS World Medical Inc. (a) | 282,120 | ||
| 5,000 | Stryker Corp. | 286,100 | ||
| 4,000 | Thermo Fisher Scientific Inc. (a) | 205,760 | ||
| 7,000 | Valeant Pharmaceutical International (a) | 300,370 | ||
| 5,000 | West Pharmaceutical Services Inc. | 209,750 | ||
| 3,029,785 | ||||
| Industrials - 8.3% | ||||
| 3,000 | 3M Co. | 250,710 | ||
| 7,500 | AGCO Corp. (a) | 269,025 | ||
| 4,000 | Alliant Techsystems Inc. (a) | 325,200 | ||
| 6,000 | Joy Global Inc. | 339,600 | ||
| 3,000 | L-3 Communications Holdings Inc. | 274,890 | ||
| 3,000 | Norfolk Southern Corp. | 167,670 | ||
| 8,000 | Pall Corp. | 323,920 | ||
| 15,000 | Quanta Services Inc. (a) | 287,400 | ||
| 4,000 | Roper Industries Inc. | 231,360 | ||
| 2,469,775 | ||||
| Information Technology - 15.8% | ||||
| 8,000 | Adobe Systems Inc. (a) | 282,960 | ||
| 10,000 | Akamai Technologies Inc. (a) | 314,100 | ||
| 10,000 | Cisco Systems Inc. (a) | 260,300 | ||
| 5,000 | Citrix Systems Inc. (a) | 237,350 | ||
| 6,500 | Cognizant Technology Solutions Corp. (a) | 331,370 | ||
| 10,000 | Comtech Telecommunications Corp. (a) | 319,900 | ||
| 10,000 | Diodes Inc. (a) | 224,000 | ||
| 3,000 | Equinix Inc. (a) | 292,020 | ||
| 3,000 | Factset Research Systems Inc. | 220,110 | ||
| 5,000 | Fiserv Inc. (a) | 253,800 | ||
| 5,500 | Hewlett-Packard Co. | 292,325 | ||
| 14,000 | Intel Corp. | 311,640 | ||
| 700 | MasterCard Inc. | 177,800 | ||
| 12,000 | SRA International Inc. - Class A (a) | 249,480 | ||
| 17,000 | Symantec Corp. (a) | 287,640 | ||
| 10,000 | Tessera Technologies Inc. (a) | 202,800 | ||
| 10,000 | Texas Instruments Inc. | 244,700 | ||
| 20,000 | Zoran Corp. (a) | 215,200 | ||
| 4,717,495 | ||||
| Materials - 4.3% | ||||
| 3,000 | Agrium Inc. | 211,890 | ||
| 15,000 | Calgon Carbon Corp. (a) | 256,800 | ||
| 2,000 | Potash Corp. of Saskatchewan Inc. | 238,700 | ||
| 3,200 | Praxair Inc. | 265,600 | ||
| 6,000 | Sigma-Aldrich Corp. | 321,960 | ||
| 1,294,950 | ||||
| Telecommunication Services - 0.8% | ||||
| 11,000 | Partner Communications Co. Ltd. - ADR | 248,490 | ||
| Utilities - 1.9% | ||||
| 15,000 | MDU Resources Group Inc. | 323,700 | ||
See accompanying notes to financial statements.
24
SCHEDULES OF PORTFOLIO INVESTMENTS
March 31, 2010
BALANCED FUND (CONCLUDED)
| Shares or | ||||
| Principal Amount | Security Description | Value |
| 5,400 | PG&E Corp. | $ 229,068 | ||
| 552,768 | ||||
| Total Common Stocks (cost $15,267,738) | 20,739,951 | |||
| Corporate Bonds - 18.4% | ||||
| Consumer Discretionary - 1.8% | ||||
| $ 500,000 | Home Depot Inc., 5.40%, 03/01/16 | 540,299 | ||
| Financials - 15.8% | ||||
| 400,000 | American Express Credit Co., | |||
| 5.88%, 05/02/13 | 433,292 | |||
| 600,000 | American General Finance Corp., | |||
| 6.90%, 12/15/17 | 525,545 | |||
| 500,000 | Bank of America NA, 6.00%, 06/15/16 | 522,594 | ||
| 500,000 | Commonwealth Bank of Australia, | |||
| 5.00%, 04/13/20 (c) | 500,000 | |||
| 500,000 | Harley-Davidson Funding Corp., | |||
| 6.80%, 06/15/18 (c) | 499,220 | |||
| 400,000 | International Lease Finance Corp., | |||
| 6.38%, 03/25/13 | 390,902 | |||
| 500,000 | KeyCorp, 6.50%, 05/14/13 | 533,955 | ||
| 500,000 | Regions Bank, 7.50%, 05/15/18 | 496,068 | ||
| 300,000 | Vornado Realty Trust, 4.25%, 04/01/15 | 297,724 | ||
| 500,000 | Wachovia Corp., 5.25%, 08/01/14 | 525,194 | ||
| 4,724,494 | ||||
| Industrials - 0.8% | ||||
| 250,000 | Masco Corp., 7.13%, 03/15/20 | 252,545 | ||
| Total Corporate Bonds (cost $5,384,525) | 5,517,338 | |||
| Government And Agency Obligations - 11.1% | ||||
| GOVERNMENT SECURITIES - 11.1% | ||||
| Municipals - 11.1% | ||||
| 250,000 | Aurora Illinois, Series A, GO, | |||
| 4.25%, 12/30/17 | 247,948 | |||
| 190,000 | Denver City & County Board of Water | |||
| Commission, Water Revenue Series A, | ||||
| 5.00%, 12/15/19 | 187,357 | |||
| 325,000 | Douglas County School District Nevada, | |||
| Series A, Public School Fund - Guaranteed, | ||||
| 5.09%, 04/01/20 | 323,590 | |||
| 100,000 | Florida State Board of Education, Lottery | |||
| Revenue, 5.19%, 07/01/19 | 101,216 | |||
| 265,000 | Hamden Connecticut, Series B, GO, | |||
| 5.38%, 08/15/22 | 262,008 | |||
| 195,000 | Kansas Development Finance Authority, | |||
| Kansas Project Revenue, Series N, | ||||
| 5.20%, 11/01/19 | 190,915 | |||
| 300,000 | Metro Wastewater Reclamation District, | |||
| Sewer Revenue, Series B, | ||||
| 5.02%, 04/01/20 | 301,596 | |||
| 200,000 | New Orleans, Louisiana, Public | |||
| Improvements, Series A, | ||||
| 7.20%, 12/01/19 | 202,966 | |||
| 205,000 | Northern Illinois Municipal Power Agency, | |||
| Power Project Revenue, 5.69%, 01/01/17 | 206,806 | |||
| 200,000 | Parker Colorado, Series A, COP | |||
| 5.30%, 11/01/18 | 198,976 | |||
| 200,000 | Reeves County Texas, Correctional Facilities, | |||
| 7.40%, 12/01/17 | 196,124 | |||
| 200,000 | Santa Monica Community College District, | |||
| Series A, 5.73%, 08/01/24 | 198,394 | |||
| 350,000 | State of California, University Revenue | |||
| Bonds, 5.45%, 11/01/22 | 346,777 | |||
| 250,000 | State of Colorado, COP, | |||
| 5.42%, 09/15/20 | 247,778 | |||
| 100,000 | Vista Community Development Commission | |||
| California, 7.61%, 09/01/21 | 98,855 | |||
| Total Government and Agency | ||||
| Obligations (cost $3,328,934) | 3,311,306 | |||
| Investment Company - 2.5% | ||||
| Mutual Fund - 2.5% | ||||
| 760,989 | Goldman Sachs Financial Square Funds, | |||
| Treasury Obligations Fund, 0.04% (b) | 760,989 | |||
| Total Investment Company (cost $760,989) | 760,989 | |||
| Total Investments - 101.4% (Cost $24,742,186) | 30,329,584 | |||
| Liabilities in excess of other assets - (1.4%) | (431,463) | |||
| NET ASSETS - 100% | $ 29,898,121 | |||
| (a) | Non-income producing security. | |||
| (b) | Dividend yield changes daily to reflect current market | |||
| conditions. Rate was the quoted yield as of | ||||
| March 31, 2010. | ||||
| (c) | Security is exempt from registration under Rule144A of | |||
| the Securities Act of 1933. The security may be resold | ||||
| in transactions exempt from registration, normally to | ||||
| qualified buyers. This security has been deemed liquid | ||||
| by the Fund’s investment adviser based on procedures | ||||
| approved by the Board. | ||||
| ADR | American Depositary Receipt | |||
| COP | Certificate of Participation | |||
| GO | General Obligation | |||
See accompanying notes to financial statements.
25
SCHEDULES OF PORTFOLIO INVESTMENTS
March 31, 2010
CORE EQUITY FUND
| Shares | Security Description | Value |
| Common Stocks - 94.8% | ||||
| Consumer Discretionary - 6.7% | ||||
| 131,100 | Comcast Corp. - Class A | $ 2,467,302 | ||
| 52,300 | Home Depot Inc. | 1,691,905 | ||
| 50,900 | McGraw-Hill Cos. Inc. | 1,814,585 | ||
| 29,000 | Mohawk Industries Inc. (a) | 1,577,020 | ||
| 7,550,812 | ||||
| Consumer Staples - 12.3% | ||||
| 56,600 | HJ Heinz Co. | 2,581,526 | ||
| 34,800 | Kimberly-Clark Corp. | 2,188,224 | ||
| 52,100 | PepsiCo Inc. | 3,446,936 | ||
| 43,100 | Procter & Gamble Co. | 2,726,937 | ||
| 74,100 | Walgreen Co. | 2,748,369 | ||
| 13,691,992 | ||||
| Energy - 12.3% | ||||
| 31,300 | Anadarko Petroleum Corp. | 2,279,579 | ||
| 15,975 | Apache Corp. | 1,621,463 | ||
| 46,075 | Chevron Corp. | 3,493,867 | ||
| 49,900 | Exxon Mobil Corp. | 3,342,302 | ||
| 27,975 | Peabody Energy Corp. | 1,278,457 | ||
| 19,500 | Transocean Ltd. (a) | 1,684,410 | ||
| 13,700,078 | ||||
| Financials - 15.1% | ||||
| 35,200 | AFLAC Inc. | 1,911,008 | ||
| 44,100 | BB&T Corp. | 1,428,399 | ||
| 28,500 | Chubb Corp. | 1,477,725 | ||
| 10,000 | Goldman Sachs Group Inc. | 1,706,300 | ||
| 66,800 | JPMorgan Chase & Co. | 2,989,300 | ||
| 44,100 | MetLife Inc. | 1,911,294 | ||
| 47,200 | Prudential Financial Inc. | 2,855,600 | ||
| 57,900 | State Street Corp. | 2,613,606 | ||
| 16,893,232 | ||||
| Health Care - 11.8% | ||||
| 82,700 | Abbott Laboratories | 4,356,636 | ||
| 31,900 | Amgen Inc. (a) | 1,906,344 | ||
| 75,600 | Medtronic Inc. | 3,404,268 | ||
| 37,200 | Thermo Fisher Scientific Inc. (a) | 1,913,568 | ||
| 48,800 | UnitedHealth Group Inc. | 1,594,296 | ||
| 13,175,112 | ||||
| Industrials - 11.8% | ||||
| 47,700 | 3M Co. | 3,986,289 | ||
| 76,300 | Emerson Electric Co. | 3,840,942 | ||
| 194,600 | General Electric Co. | 3,541,720 | ||
| 40,000 | Jacobs Engineering Group Inc. (a) | 1,807,600 | ||
| 13,176,551 | ||||
| Information Technology - 19.0% | ||||
| 28,200 | Adobe Systems Inc. (a) | 997,433 | ||
| 128,500 | Applied Materials Inc. | 1,732,180 | ||
| 74,800 | Avnet Inc. (a) | 2,244,000 | ||
| 94,850 | Cisco Systems Inc. (a) | 2,468,946 | ||
| 35,800 | Fiserv Inc. (a) | 1,817,208 | ||
| 41,750 | Hewlett-Packard Co. | 2,219,013 | ||
| 17,825 | International Business Machines Corp. | 2,286,056 | ||
| 107,900 | Microsoft Corp. | 3,158,233 | ||
| 88,550 | Texas Instruments Inc. | 2,166,819 | ||
| 125,700 | Western Union Co. | 2,131,872 | ||
| 21,221,760 | ||||
| Materials - 3.9% | ||||
| 35,500 | Air Products & Chemicals Inc. | 2,625,225 | ||
| 14,500 | Potash Corp. of Saskatchewan Inc. | 1,730,575 | ||
| 4,355,800 | ||||
| Utilities - 1.9% | ||||
| 63,200 | Southern Co. | 2,095,712 | ||
| Total Common Stocks (cost $83,139,206) | 105,861,049 | |||
| Investment Companies - 5.1% | ||||
| Mutual Funds - 5.1% | ||||
| 1,234,309 | Federated Trust U.S. Treasury | |||
| Obligations Fund, 0.00% (b) | 1,234,309 | |||
| 4,493,917 | Goldman Sachs Financial Square Funds, | |||
| Treasury Obligations Fund, 0.04% (b) | 4,493,917 | |||
| Total Investment Companies (cost $5,728,226) | 5,728,226 | |||
| Total Investments - 99.9% (Cost $88,867,432) | 111,589,275 | |||
| Other assets in excess of liabilities - 0.1% | 140,681 | |||
| NET ASSETS - 100% | $111,729,956 | |||
| (a) | Non-income producing security. | |||
| (b) | Dividend yield changes daily to reflect current market | |||
| conditions. Rate was the quoted yield as of | ||||
| March 31, 2010. | ||||
See accompanying notes to financial statements.
26
SCHEDULES OF PORTFOLIO INVESTMENTS
March 31, 2010
LARGE CAP GROWTH FUND
| Shares | Security Description | Value |
| Common Stocks - 97.5% | ||||
| Consumer Discretionary - 13.9% | ||||
| 61,000 | Family Dollar Stores Inc. | $ 2,233,210 | ||
| 106,000 | Staples Inc. | 2,479,340 | ||
| 162,400 | Starbucks Corp. | 3,941,448 | ||
| 50,325 | Target Corp. | 2,647,095 | ||
| 11,301,093 | ||||
| Consumer Staples - 13.6% | ||||
| 23,600 | Colgate-Palmolive Co. | 2,012,136 | ||
| 29,735 | General Mills Inc. | 2,104,941 | ||
| 39,650 | PepsiCo Inc. | 2,623,244 | ||
| 87,900 | Safeway Inc. | 2,185,194 | ||
| 58,100 | Whole Foods Market Inc. (a) | 2,100,315 | ||
| 11,025,830 | ||||
| Energy - 7.9% | ||||
| 42,000 | Kinder Morgan Management LLC (a) | 2,462,040 | ||
| 40,100 | Schlumberger Ltd. | 2,544,746 | ||
| 43,600 | Suncor Energy Inc. | 1,418,744 | ||
| 6,425,530 | ||||
| Financials - 3.0% | ||||
| 129,625 | Charles Schwab Corp. | 2,422,692 | ||
| Health Care - 9.6% | ||||
| 38,575 | Johnson & Johnson | 2,515,090 | ||
| 25,100 | Medtronic Inc. | 1,130,253 | ||
| 57,185 | Roche Holding AG - ADR | 2,317,136 | ||
| 57,185 | UnitedHealth Group Inc. | 1,868,234 | ||
| 7,830,713 | ||||
| Industrials - 10.5% | ||||
| 32,785 | 3M Co. | 2,739,842 | ||
| 21,300 | FedEx Corp. | 1,989,420 | ||
| 49,550 | Illinois Tool Works Inc. | 2,346,688 | ||
| 44,225 | Koninklijke Philips Electronics NV - NYS | 1,416,085 | ||
| 8,492,035 | ||||
| Information Technology - 32.7% | ||||
| 60,225 | Adobe Systems Inc. (a) | 2,130,158 | ||
| 150,200 | Cisco Systems Inc. (a) | 3,909,706 | ||
| 117,420 | Dell Inc. (a) | 1,762,474 | ||
| 47,275 | Fiserv Inc. (a) | 2,399,679 | ||
| 47,725 | Hewlett-Packard Co. | 2,536,584 | ||
| 94,500 | Intel Corp. | 2,103,570 | ||
| 64,800 | Linear Technology Corp. | 1,832,544 | ||
| 117,115 | Microsoft Corp. | 3,427,956 | ||
| 71,670 | Paychex Inc. | 2,200,269 | ||
| 109,035 | Symantec Corp. (a) | 1,844,872 | ||
| 45,750 | VMware Inc. - Class A (a) | 2,438,475 | ||
| 26,586,287 | ||||
| Materials - 6.3% | ||||
| 56,821 | Ecolab Inc. | 2,497,283 | ||
| 32,025 | Praxair Inc. | 2,658,075 | ||
| 5,155,358 | ||||
| Total Common Stocks (cost $66,170,649) | 79,239,538 | |||
| Investment Company - 2.3% | ||||
| Mutual Fund - 2.3% | ||||
| 1,831,494 | Goldman Sachs Financial Square Funds, | |||
| Prime Obligations Fund, 0.07% (b) | 1,831,494 | |||
| Total Investment Company (cost $1,831,494) | 1,831,494 | |||
| Total Investments - 99.8% (Cost $68,002,143) | 81,071,032 | |||
| Other assets in excess of liabilities - 0.2% | 148,575 | |||
| NET ASSETS - 100% | $ 81,219,607 | |||
| (a) | Non-income producing security. | |||
| (b) | Dividend yield changes daily to reflect current market | |||
| conditions. Rate was the quoted yield as of | ||||
| March 31, 2010. | ||||
| ADR | American Depositary Receipt | |||
| NYS | New York Shares | |||
See accompanying notes to financial statements.
27
SCHEDULES OF PORTFOLIO INVESTMENTS
March 31, 2010
GROWTH OPPORTUNITIES FUND
| Shares | Security Description | Value |
| Common Stocks - 98.2% | ||||
| Consumer Discretionary - 16.3% | ||||
| 52,500 | Aeropostale Inc. (a) | $ 1,513,575 | ||
| 25,000 | BorgWarner Inc. (a) | 954,500 | ||
| 70,000 | Chico’s FAS Inc. | 1,009,400 | ||
| 10,000 | Chipotle Mexican Grill Inc. - Class A (a) | 1,126,700 | ||
| 30,000 | Coach Inc. | 1,185,600 | ||
| 20,000 | DeVry Inc. | 1,304,000 | ||
| 40,000 | GameStop Corp. - Class A (a) | 876,400 | ||
| 22,000 | Guess? Inc. | 1,033,560 | ||
| 15,000 | NetFlix Inc. (a) | 1,106,100 | ||
| 34,400 | Tempur-Pedic International Inc. (a) | 1,037,504 | ||
| 11,147,339 | ||||
| Consumer Staples - 9.3% | ||||
| 45,000 | Avon Products Inc. | 1,524,150 | ||
| 15,000 | Church & Dwight Co. Inc. | 1,004,250 | ||
| 46,000 | Flowers Foods Inc. | 1,138,040 | ||
| 29,000 | Herbalife Ltd. | 1,337,480 | ||
| 20,000 | Ralcorp Holdings Inc. (a) | 1,355,600 | ||
| 6,359,520 | ||||
| Energy - 5.9% | ||||
| 10,000 | Noble Energy Inc. | 730,000 | ||
| 20,000 | Peabody Energy Corp. | 914,000 | ||
| 50,000 | Southern Union Co. | 1,268,500 | ||
| 50,000 | Williams Cos. Inc. | 1,155,000 | ||
| 4,067,500 | ||||
| Financials - 8.8% | ||||
| 20,000 | ACE Ltd. | 1,046,000 | ||
| 15,000 | Affiliated Managers Group Inc. (a) | 1,185,000 | ||
| 23,000 | Credit Acceptance Corp. (a) | 948,520 | ||
| 12,000 | Everest Re Group Ltd. | 971,160 | ||
| 30,000 | HCC Insurance Holdings Inc. | 828,000 | ||
| 20,000 | Stifel Financial Corp. (a) | 1,075,000 | ||
| 6,053,680 | ||||
| Health Care - 14.9% | ||||
| 25,000 | Biogen Idec Inc. (a) | 1,434,000 | ||
| 20,000 | Catalyst Health Solutions Inc. (a) | 827,600 | ||
| 20,000 | Cerner Corp. (a) | 1,701,200 | ||
| 20,000 | Hospira Inc. (a) | 1,133,000 | ||
| 60,000 | PSS World Medical Inc. (a) | 1,410,600 | ||
| 24,000 | Thermo Fisher Scientific Inc. (a) | 1,234,560 | ||
| 35,000 | Valeant Pharmaceutical International (a) | 1,501,850 | ||
| 22,000 | West Pharmaceutical Services Inc. | 922,900 | ||
| 10,165,710 | ||||
| Industrials - 11.8% | ||||
| 25,000 | AGCO Corp. (a) | 896,750 | ||
| 12,000 | Alliant Techsystems Inc. (a) | 975,600 | ||
| 28,000 | Joy Global Inc. | 1,584,800 | ||
| 12,000 | L-3 Communications Holdings Inc. | 1,099,560 | ||
| 27,000 | Pall Corp. | 1,093,230 | ||
| 60,000 | Quanta Services Inc. (a) | 1,149,600 | ||
| 22,000 | Roper Industries Inc. | 1,272,480 | ||
| 8,072,020 | ||||
| Information Technology - 22.9% | ||||
| 30,000 | Adobe Systems Inc. (a) | 1,061,100 | ||
| 60,000 | Akamai Technologies Inc. (a) | 1,884,600 | ||
| 30,000 | Citrix Systems Inc. (a) | 1,424,100 | ||
| 32,000 | Cognizant Technology Solutions Corp. (a) | 1,631,360 | ||
| 30,000 | Comtech Telecommunications Corp. (a) | 959,700 | ||
| 50,000 | Diodes Inc. (a) | 1,120,000 | ||
| 10,000 | Equinix Inc. (a) | 973,400 | ||
| 15,000 | Factset Research Systems Inc. | 1,100,550 | ||
| 26,400 | Fiserv Inc. (a) | 1,340,064 | ||
| 75,000 | SRA International Inc. - Class A (a) | 1,559,250 | ||
| 50,000 | Symantec Corp. (a) | 846,000 | ||
| 50,000 | Tessera Technologies Inc. (a) | 1,014,000 | ||
| 70,000 | Zoran Corp. (a) | 753,200 | ||
| 15,667,324 | ||||
| Materials - 4.9% | ||||
| 14,300 | Agrium Inc. | 1,010,009 | ||
| 60,000 | Calgon Carbon Corp. (a) | 1,027,200 | ||
| 25,000 | Sigma-Aldrich Corp. | 1,341,500 | ||
| 3,378,709 | ||||
| Telecommunication Services - 1.7% | ||||
| 50,000 | Partner Communications Co. Ltd. - ADR | 1,129,500 | ||
| Utilities - 1.7% | ||||
| 55,000 | MDU Resources Group Inc. | 1,186,900 | ||
| Total Common Stocks (cost $47,311,174) | 67,228,202 | |||
| Investment Company - 1.8% | ||||
| Mutual Fund - 1.8% | ||||
| 1,194,353 | Goldman Sachs Financial Square Funds, | |||
| Treasury Obligations Fund, 0.04% (b) | 1,194,353 | |||
| Total Investment Company (cost $1,194,353) | 1,194,353 | |||
| Total Investments - 100.0% (Cost $48,505,527) | 68,422,555 | |||
| Other Assets And Liabilities, Net - 0.0% | 4,023 | |||
| Net Assets - 100% | $ 68,426,578 | |||
| (a) | Non-income producing security. | |||
| (b) | Dividend yield changes daily to reflect current market | |||
| conditions. Rate was the quoted yield as of | ||||
| March 31, 2010. | ||||
| ADR | American Depositary Receipt | |||
See accompanying notes to financial statements.
28
SCHEDULES OF PORTFOLIO INVESTMENTS
March 31, 2010
SMALL COMPANY FUND
| Shares | Security Description | Value |
| Common Stocks - 95.7% | ||||
| Consumer Discretionary - 14.0% | ||||
| 63,300 | AnnTaylor Stores Corp. (a) | $ 1,310,310 | ||
| 98,000 | Callaway Golf Co. | 864,360 | ||
| 12,400 | Columbia Sportswear Co. | 651,372 | ||
| 65,700 | Foot Locker Inc. | 988,128 | ||
| 33,300 | Jack in the Box Inc. (a) | 784,215 | ||
| 21,600 | Mohawk Industries Inc. (a) | 1,174,608 | ||
| 40,950 | Rosetta Stone Inc. (a) | 973,791 | ||
| 29,050 | Steiner Leisure Ltd. (a) | 1,287,496 | ||
| 17,800 | Tractor Supply Co. | 1,033,290 | ||
| 9,067,570 | ||||
| Consumer Staples - 4.8% | ||||
| 39,700 | Casey’s General Stores Inc. | 1,246,580 | ||
| 14,200 | Church & Dwight Co. Inc. | 950,690 | ||
| 25,100 | Corn Products International Inc. | 869,965 | ||
| 3,067,235 | ||||
| Energy - 5.0% | ||||
| 28,900 | Dresser-Rand Group Inc. (a) | 908,038 | ||
| 41,900 | St. Mary Land & Exploration Co. | 1,458,539 | ||
| 18,400 | Tidewater Inc. | 869,768 | ||
| 3,236,345 | ||||
| Financials - 19.3% | ||||
| 17,200 | Affiliated Managers Group Inc. (a) | 1,358,800 | ||
| 28,200 | Arthur J Gallagher & Co. | 692,310 | ||
| 34,600 | Assured Guaranty Ltd. | 760,162 | ||
| 35,250 | BancorpSouth Inc. | 738,840 | ||
| 20,500 | Cullen/Frost Bankers Inc. | 1,143,900 | ||
| 13,800 | Home Properties Inc. | 645,840 | ||
| 14,000 | Jones Lang LaSalle Inc. | 1,020,460 | ||
| 17,800 | Mack-Cali Realty Corp. | 627,450 | ||
| 31,300 | MB Financial Inc. | 705,189 | ||
| 110,900 | MFA Financial Inc. | 816,224 | ||
| 11,000 | RLI Corp. | 627,220 | ||
| 36,900 | Selective Insurance Group | 612,540 | ||
| 55,500 | Texas Capital Bancshares Inc. (a) | 1,053,945 | ||
| 29,100 | United Bankshares Inc. | 763,002 | ||
| 53,800 | Wilmington Trust Corp. | 891,466 | ||
| 12,457,348 | ||||
| Health Care - 11.1% | ||||
| 8,100 | Edwards Lifesciences Corp. (a) | 800,928 | ||
| 10,100 | Mettler Toledo International Inc. (a) | 1,102,920 | ||
| 68,900 | Odyssey HealthCare Inc. (a) | 1,247,779 | ||
| 45,100 | PSS World Medical Inc. (a) | 1,060,301 | ||
| 62,800 | VCA Antech Inc. (a) | 1,760,284 | ||
| 29,400 | West Pharmaceutical Services Inc. | 1,233,330 | ||
| 7,205,542 | ||||
| Industrials - 12.7% | ||||
| 57,300 | Barnes Group Inc. | 1,115,058 | ||
| 26,800 | Carlisle Cos. Inc. | 1,021,080 | ||
| 35,700 | CLARCOR Inc. | 1,231,293 | ||
| 19,200 | Hubbell Inc. - Class B | 968,256 | ||
| 34,000 | IDEX Corp. | 1,125,400 | ||
| 79,200 | Insteel Industries Inc. | 846,648 | ||
| 38,700 | Tennant Co. | 1,059,993 | ||
| 37,000 | Werner Enterprises Inc. | 857,290 | ||
| 8,225,018 | ||||
| Information Technology - 17.1% | ||||
| 22,100 | Anixter International Inc. (a) | 1,035,385 | ||
| 21,100 | CACI International Inc. - Class A (a) | 1,030,735 | ||
| 25,300 | Comtech Telecommunications Corp. (a) | 809,347 | ||
| 90,800 | Daktronics Inc. | 691,896 | ||
| 100,900 | Entegris Inc. (a) | 508,536 | ||
| 28,700 | Littelfuse Inc. (a) | 1,090,887 | ||
| 24,900 | Micros Systems Inc. (a) | 818,712 | ||
| 55,300 | Microsemi Corp. (a) | 958,902 | ||
| 20,650 | MTS Systems Corp. | 599,470 | ||
| 30,800 | National Instruments Corp. | 1,027,180 | ||
| 61,800 | Parametric Technology Corp. (a) | 1,115,490 | ||
| 36,100 | Park Electrochemical Corp. | 1,037,514 | ||
| 9,100 | Syntel Inc. | 350,077 | ||
| 11,074,131 | ||||
| Materials - 8.1% | ||||
| 35,000 | Albemarle Corp. | 1,492,050 | ||
| 33,200 | Arch Chemicals Inc. | 1,141,748 | ||
| 34,200 | Intrepid Potash Inc. (a) | 1,037,286 | ||
| 19,800 | Sensient Technologies Corp. | 575,388 | ||
| 59,100 | Worthington Industries Inc. | 1,021,839 | ||
| 5,268,311 | ||||
| Utilities - 3.6% | ||||
| 30,100 | IDACORP Inc. | 1,042,062 | ||
| 58,600 | Westar Energy Inc. | 1,306,780 | ||
| 2,348,842 | ||||
| Total Common Stocks (cost $46,695,071) | 61,950,342 | |||
See accompanying notes to financial statements.
29
SCHEDULES OF PORTFOLIO INVESTMENTS
March 31, 2010
SMALL COMPANY FUND (CONCLUDED)
| Shares | Security Description | Value |
| Investment Company - 4.1% | ||||
| Mutual Fund - 4.1% | ||||
| 2,675,493 | Goldman Sachs Financial Square Funds, | |||
| Treasury Obligations Fund, 0.04% (b) | $ 2,675,493 | |||
| Total Investment Company (cost $2,675,493) | 2,675,493 | |||
| Total Investments - 99.8% (Cost $49,370,564) | 64,625,835 | |||
| Other assets in excess of liabilities - 0.2% | 111,519 | |||
| NET ASSETS - 100% | $ 64,737,354 | |||
| (a) | Non-income producing security. | |||
| (b) | Dividend yield changes daily to reflect current market | |||
| conditions. Rate was the quoted yield as of | ||||
| March 31, 2010. | ||||
See accompanying notes to financial statements.
30
SCHEDULES OF PORTFOLIO INVESTMENTS
March 31, 2010
INTERNATIONAL EQUITY FUND
| Shares | Security Description | Value |
| Foreign Stocks - 88.9% | ||||
| Australia - 10.0% | ||||
| 52,667 | AGL Energy Ltd. | $ 726,198 | ||
| 38,782 | Amcor Ltd. | 227,347 | ||
| 22,241 | ASX Ltd. | 692,506 | ||
| 11,134 | Australia & New Zealand Banking | |||
| Group Ltd. | 259,035 | |||
| 37,912 | BHP Billiton Ltd. | 1,516,077 | ||
| 26,153 | Billabong International Ltd. | 271,117 | ||
| 5,001 | Commonwealth Bank of Australia | 258,253 | ||
| 224,710 | Foster’s Group Ltd. | 1,090,525 | ||
| 3,356 | Leighton Holdings Ltd. | 120,073 | ||
| 68,301 | National Australia Bank Ltd. | 1,724,380 | ||
| 22,828 | Orica Ltd. | 561,046 | ||
| 16,943 | QBE Insurance Group Ltd. | 323,770 | ||
| 84,253 | Toll Holdings Ltd. | 573,518 | ||
| 57,026 | Westpac Banking Corp. | 1,456,464 | ||
| 16,850 | WorleyParsons Ltd. | 393,410 | ||
| 10,193,719 | ||||
| Belgium - 1.4% | ||||
| 36,386 | Belgacom SA | 1,421,102 | ||
| Finland - 1.8% | ||||
| 13,465 | Fortum Oyj | 329,319 | ||
| 4,910 | Kesko Oyj - Class B | 193,225 | ||
| 42,489 | Orion Oyj - Class B | 939,903 | ||
| 11,239 | Rautaruukki Oyj | 242,851 | ||
| 8,167 | Sanoma Oyj (a) | 180,883 | ||
| 1,886,181 | ||||
France - 10.0% | ||||
| 15,820 | Bouygues SA | 795,198 | ||
| 6,327 | Carrefour SA | 304,913 | ||
| 2,815 | Casino Guichard Perrachon SA | 238,173 | ||
| 4,608 | Fonciere Des Regions | 507,492 | ||
| 60,167 | France Telecom SA | 1,439,435 | ||
| 3,250 | Gecina SA | 359,643 | ||
| 2,538 | LVMH Moet Hennessy Louis Vuitton SA | 296,620 | ||
| 4,168 | Neopost SA | 333,059 | ||
| 36,077 | PagesJaunes Groupe SA | 414,232 | ||
| 9,751 | Sanofi-Aventis SA | 726,779 | ||
| 11,813 | Schneider Electric SA | 1,385,392 | ||
| 25,855 | Total SA | 1,500,733 | ||
| 2,585 | Vallourec SA | 521,210 | ||
| 4,431 | Vinci SA | 261,113 | ||
| 41,613 | Vivendi SA | 1,113,565 | ||
| 10,197,557 | ||||
| Germany - 7.0% | ||||
| 58,691 | BASF SE | 3,645,251 | ||
| 8,979 | Deutsche Boerse AG | 665,116 | ||
| 31,850 | RWE AG | 2,828,980 | ||
| 7,139,347 | ||||
Greece - 0.3% | ||||
| 12,444 | OPAP SA | 282,333 | ||
Hong Kong - 1.4% | ||||
| 26,137 | Esprit Holdings Ltd. | 206,194 | ||
| 45,300 | Hang Seng Bank Ltd. | 631,306 | ||
| 309,000 | NWS Holdings Ltd. | 616,886 | ||
| 1,454,386 | ||||
Italy - 2.7% | ||||
| 89,976 | Enel SpA | 503,060 | ||
| 96,079 | ENI SpA | 2,253,828 | ||
| 2,756,888 | ||||
Japan - 18.6% | ||||
| 40,500 | AEON Credit Service Co. Ltd. | 480,957 | ||
| 29,000 | Daicel Chemical Industries Ltd. | 199,497 | ||
| 5,200 | East Japan Railway Co. | 361,613 | ||
| 8,900 | Eisai Co. Ltd. | 317,551 | ||
| 39,300 | Honda Motor Co. Ltd. | 1,387,504 | ||
| 80,000 | ITOCHU Corp. | 700,974 | ||
| 400 | Japan Prime Realty Investment Corp. | 890,553 | ||
| 440 | Japan Retail Fund Investment Corp. | 517,813 | ||
| 11,400 | Kansai Electric Power Co. Inc. | 261,247 | ||
| 35,500 | Konica Minolta Holdings Inc. | 414,363 | ||
| 10,200 | Kyushu Electric Power Co. Inc. | 222,071 | ||
| 12,400 | Lawson Inc. | 529,325 | ||
| 103,000 | Mazda Motor Corp. | 289,815 | ||
| 17,800 | Mitsubishi Corp. | 466,567 | ||
| 47,800 | Mitsubishi UFJ Financial Group Inc. | 250,583 | ||
| 269,100 | Mizuho Financial Group Inc. | 532,615 | ||
| 23,300 | Namco Bandai Holdings Inc. | 227,092 | ||
| 2,800 | Nintendo Co. Ltd. | 937,627 | ||
| 20,500 | Nippon Mining Holdings Inc. (d) | 94,199 | ||
| 46,000 | Nippon Oil Corp. (d) | 227,859 | ||
| 7,800 | Nippon Telegraph & Telephone Corp. | 328,790 | ||
| 27,000 | Nissan Chemical Industries Ltd. | 377,832 | ||
| 167 | Nomura Real Estate Office Fund Inc. | 938,002 | ||
| 245 | NTT DoCoMo Inc. | 373,253 | ||
| 120,000 | Ricoh Co. Ltd. | 1,874,398 | ||
| 9,400 | Sankyo Co. Ltd. | 465,123 | ||
| 15,400 | Shiseido Co. Ltd. | 334,460 | ||
| 618,500 | Sojitz Corp. | 1,197,694 | ||
| 129,000 | Sompo Japan Insurance Inc. (d) | 877,758 | ||
| 28,500 | Stanley Electric Co. Ltd. | 552,803 | ||
| 33,600 | Sumitomo Corp. | 386,434 | ||
| 5,700 | Sumitomo Mitsui Financial Group Inc. | 188,435 | ||
| 75,000 | Taisei Corp. | 165,294 | ||
| 22,500 | Takeda Pharmaceutical Co. Ltd. | 990,558 | ||
| 6,700 | Toyota Motor Corp. | 268,444 | ||
See accompanying notes to financial statements.
31
SCHEDULES OF PORTFOLIO INVESTMENTS
March 31, 2010
INTERNATIONAL EQUITY FUND (CONTINUED)
| Shares | Security Description | Value |
| 12,400 | Yamato Kogyo Co. Ltd. | $ 411,918 | ||
| 19,041,021 | ||||
| Netherlands - 3.2% | ||||
| 10,736 | Koninklijke DSM NV | 478,682 | ||
| 16,700 | Koninklijke Philips Electronics NV | 535,414 | ||
| 56,637 | Royal Dutch Shell Plc - Class B | 1,560,145 | ||
| 23,440 | Unilever NV | 708,926 | ||
| 3,283,167 | ||||
| New Zealand - 0.7% | ||||
| 63,073 | Fletcher Building Ltd. | 373,982 | ||
| 148,264 | SKYCITY Entertainment Group Ltd. | 339,009 | ||
| 712,991 | ||||
Norway - 0.2% | ||||
| 17,400 | DnB NOR ASA (a) | 198,929 | ||
| Portugal - 0.2% | ||||
| 20,434 | Portugal Telecom SGPS SA | 228,440 | ||
Singapore - 0.2% | ||||
| 9,000 | Jardine Cycle & Carriage Ltd. | 189,060 | ||
| Spain - 5.1% | ||||
| 95,798 | Banco de Sabadell SA | 528,884 | ||
| 288,778 | Banco Santander SA | 3,837,530 | ||
| 16,207 | Fomento de Construcciones y Contratas SA | 593,259 | ||
| 11,679 | Gas Natural SDG SA | 215,609 | ||
| 5,175,282 | ||||
| Sweden - 4.1% | ||||
| 35,600 | Atlas Copco AB - Class A | 552,405 | ||
| 3,337 | Electrolux AB - Class B | 76,283 | ||
| 7,700 | Hennes & Mauritz AB - Class B | 500,432 | ||
| 16,957 | Holmen AB - Class B | 456,939 | ||
| 131,179 | Nordea Bank AB | 1,294,906 | ||
| 2,805 | Ratos AB - Class B (a) | 93,074 | ||
| 28,353 | Skanska AB - Class B | 515,373 | ||
| 11,379 | Svenska Cellulosa AB - Class B (a) | 160,487 | ||
| 16,667 | Svenska Handelsbanken AB - Class A | 488,610 | ||
| 4,138,509 | ||||
| Switzerland - 3.2% | ||||
| 3,008 | Credit Suisse Group AG | 155,095 | ||
| 51,786 | Julius Baer Holding AG | 636,210 | ||
| 17,615 | Nestle SA | 902,391 | ||
| 21,095 | Novartis AG | 1,139,702 | ||
| 1,706 | Zurich Financial Services AG | 437,465 | ||
| 3,270,863 | ||||
| United Kingdom - 18.8% | ||||
| 55,171 | Aviva Plc | 322,537 | ||
| 3,067 | BHP Billiton Plc | 105,170 | ||
| 204,655 | BP Plc | 1,935,787 | ||
| 82,346 | Bradford & Bingley Plc (a) (c) (d) | - | ||
| 62,377 | British American Tobacco Plc | 2,149,838 | ||
| 12,937 | British Land Co. Plc | 94,436 | ||
| 36,096 | Diageo Plc | 605,735 | ||
| 207,330 | Firstgroup Plc | 1,129,341 | ||
| 134,510 | GlaxoSmithKline Plc | 2,582,767 | ||
| 124,517 | Home Retail Group Plc | 511,996 | ||
| 172,769 | HSBC Holdings Plc | 1,751,099 | ||
| 286,360 | ICAP Plc | 1,624,127 | ||
| 65,531 | Marks & Spencer Group Plc | 367,989 | ||
| 29,073 | Prudential plc | 241,514 | ||
| 2,535 | Reckitt Benckiser Group Plc | 139,122 | ||
| 1,074,205 | RSA Insurance Group Plc | 2,078,097 | ||
| 50,010 | Segro Plc | 242,511 | ||
| 24,289 | Severn Trent Plc | 440,399 | ||
| 11,153 | Standard Chartered Plc | 304,179 | ||
| 173,575 | Standard Life Plc | 527,517 | ||
| 11,515 | Unilever Plc | 338,075 | ||
| 739,772 | Vodafone Group Plc | 1,706,121 | ||
| 19,198,357 | ||||
| Total Foreign Stocks (cost $87,557,627) | 90,768,132 | |||
Preferred Stock - 0.6% | ||||
| Germany - 0.6% | ||||
| 6,652 | Volkswagen AG, 3.15% | 609,979 | ||
| Total Preferred Stocks (cost $478,596) | 609,979 | |||
| Exchange Traded Funds - 9.4% | ||||
| 170,162 | iShares MSCI Emerging Market | |||
| Index Fund | 7,167,223 | |||
| 43,346 | iShares MSCI EAFE Index Fund | 2,427,376 | ||
| Total Exchange Traded Funds (cost $9,461,626) | 9,594,599 | |||
| Rights - 0.0% | ||||
| Germany - 0.0% | ||||
| 6,652 | Volkswagen AG (a) (c) | 4,132 | ||
| Total Rights (cost $0) | 4,132 | |||
| Warrants - 0.0% | ||||
| France - 0.0% | ||||
| 4,641 | Fonciere Des Regions, 12/31/10 (a) | 5,202 | ||
| Total Warrants (cost $0) | 5,202 | |||
See accompanying notes to financial statements.
32
SCHEDULES OF PORTFOLIO INVESTMENTS
March 31, 2010
INTERNATIONAL EQUITY FUND (CONCLUDED)
| Shares | Security Description | Value |
| Investment Company - 0.3% | ||||
United States - 0.3% | ||||
| 334,498 | Highmark 100% US Treasury Money | |||
| Market Fund, 0.04% (b) | $ 334,498 | |||
| Total Investment Company (cost $334,498) | 334,498 | |||
| Total Investments - 99.2% (cost $97,832,347) | 101,316,542 | |||
| Other assets in excess of liabilities - 0.8% | 847,171 | |||
| Total Net Assets - 100% | $102,163,713 | |||
| (a) | Non-income producing security. | |||
| (b) | Dividend yield changes daily to reflect current market | |||
| conditions. Rate was the quoted yield as of | ||||
| March 31, 2010. | ||||
| (c) | The security is considered illiquid according to the | |||
| policies and procedures approved by the Board. The | ||||
| total value of illiquid securities in the International | ||||
| Equity Fund was 0.01% of net assets. | ||||
| (d) | Security fair valued in good faith in accordance with | |||
| the procedures established by the Board. Good faith fair | ||||
| valued securities may be classified as Level 2 or Level 3 | ||||
| for FASB ASC Topic 820 “Fair Value | ||||
| Measurements and Disclosures” based on the applicable | ||||
| valuation inputs. See Security Valuation under | ||||
| Significant Accounting Policies in the Notes to the | ||||
| Financial Statements. | ||||
| As of March 31, 2010, industry diversification of the Fund was as follows: | ||||
| % of | ||||
| Industries Diversification | Net Assets | |||
| Banks | 13.6% | |||
| Exchange Traded Funds | 9.4% | |||
| Oil & Gas | 7.4% | |||
| Pharmaceuticals | 6.6% | |||
| Telecommunications | 5.4% | |||
| Electric | 4.8% | |||
| Insurance | 4.7% | |||
| Chemicals | 4.6% | |||
| Diversified Financial Services | 4.0% | |||
| Real Estate Investment Trusts | 3.5% | |||
| Distribution/Wholesale | 2.9% | |||
| Engineering & Construction | 2.8% | |||
| Food | 2.6% | |||
| Auto Manufacturers | 2.5% | |||
| Office/Business Equipment | 2.2% | |||
| Mining | 2.1% | |||
| Agriculture | 2.1% | |||
| Retail | 2.1% | |||
| Transportation | 2.0% | |||
| Media | 1.7% | |||
| Beverages | 1.7% | |||
| Electrical Components & Equipment | 1.4% | |||
| Toys/Games/Hobbies | 1.1% | |||
| Holding Companies | 0.9% | |||
| Iron/Steel | 0.6% | |||
| Forest Products & Paper | 0.6% | |||
| Auto Parts & Equipment | 0.5% | |||
| Machinery-Construction & Mining | 0.5% | |||
| Electronics | 0.5% | |||
| Metal Fabricate/Hardware | 0.5% | |||
| Entertainment | 0.5% | |||
| Water | 0.4% | |||
| Miscellaneous Manufacturing | 0.4% | |||
| Building Materials | 0.4% | |||
| Lodging | 0.3% | |||
| Money Market Funds | 0.3% | |||
| Cosmetics/Personal Care | 0.3% | |||
| Gambling | 0.3% | |||
| Apparel | 0.3% | |||
| Packaging & Containers | 0.2% | |||
| Gas | 0.2% | |||
| Household Products/Wares | 0.1% | |||
| Investment Companies | 0.1% | |||
| Home Furnishings | 0.1% | |||
| 99.2% | ||||
See accompanying notes to financial statements.
33
STATEMENTS OF ASSETS AND LIABILITIES
March 31, 2010
| SHORT-INTERMEDIATE | INCOME | ||||
| BOND FUND | FUND | ||||
| Assets: | |||||
| Investments, at cost | $ 69,996,196 | $ 59,479,837 | |||
| Unrealized appreciation (depreciation) of investments | 953,739 | 209,975 | |||
| Total investments, at value | 70,949,935 | 59,689,812 | |||
| Cash | 1 | - | |||
Foreign currency at value (a) | - | - | |||
| Interest and dividends receivable | 638,631 | 496,235 | |||
| Receivable for capital shares issued | 70,315 | 56,053 | |||
| Reclaims receivable | - | - | |||
| Receivable for investments sold | - | 141,903 | |||
| Prepaid expenses | 27,339 | 22,668 | |||
| Total Assets | 71,686,221 | 60,406,671 | |||
| Liabilities: | |||||
| Cash Overdraft | �� - | 323 | |||
| Distributions payable | 113,885 | 146,162 | |||
| Payable for investments purchased | - | 95,607 | |||
| Payable for capital shares redeemed | 3,522 | 14,639 | |||
| Accrued expenses and other payables: | |||||
| Investment advisory fees | 12,704 | 6,526 | |||
| Administration fees payable to non-related parties | 6,076 | 5,201 | |||
| Administration fees payable to related parties | 4,235 | 3,514 | |||
| Shareholder service fees | 15,124 | 12,549 | |||
| Chief compliance officer fees | 1,122 | 937 | |||
| Custodian fees payable to non-related parties | - | - | |||
| Custodian fees to related parties | 907 | 753 | |||
| Other fees | 25,558 | 22,351 | |||
| Total liabilities | 183,133 | 308,562 | |||
| Net assets | $ 71,503,088 | $ 60,098,109 | |||
| Composition of Net Assets: | |||||
| Capital | $ 74,674,214 | $ 61,435,925 | |||
| Accumulated net investment income (loss) | (360,587) | 177,048 | |||
| Accumulated net realized gain (loss) from investments and foreign | |||||
| currency transactions | (3,764,278) | (1,724,839) | |||
| Net unrealized appreciation (depreciation) on investments and | |||||
| translation of assets and liabilities in foreign currencies | 953,739 | 209,975 | |||
| Net Assets | $ 71,503,088 | $ 60,098,109 | |||
| Shares of beneficial interest | 7,522,117 | 6,139,712 | |||
| Net asset value, offering and redemption price per share | $ 9.51 | $ 9.79 | |||
| (a) | Foreign currency at cost | $ - | $ - | ||
See accompanying notes to financial statements.
34
| LARGE CAP | GROWTH | SMALL | ||||||||
| BALANCED | CORE | GROWTH | OPPORTUNITIES | COMPANY | INTERNATIONAL | |||||
| FUND | EQUITY FUND | FUND | FUND | FUND | EQUITY FUND | |||||
| $ 24,742,186 | $ 88,867,432 | $ 68,002,143 | $ 48,505,527 | $ 49,370,564 | $ 97,832,347 | |||||
| 5,587,398 | 22,721,843 | 13,068,889 | 19,917,028 | 15,255,271 | 3,484,195 | |||||
| 30,329,584 | 111,589,275 | 81,071,032 | 68,422,555 | 64,625,835 | 101,316,542 | |||||
| 12 | - | - | 52 | - | - | |||||
| - | - | - | - | - | 67,592 | |||||
| 134,541 | 97,476 | 172,326 | 29,971 | 67,858 | 727,253 | |||||
| 1,573 | 182,191 | 71,420 | 64,238 | 102,933 | 60,638 | |||||
| - | - | - | - | - | 186,444 | |||||
| 322,983 | - | - | - | 257,469 | - | |||||
| 9,670 | 30,169 | 10,776 | 9,926 | 18,469 | 28,048 | |||||
| 30,798,363 | 111,899,111 | 81,325,554 | 68,526,742 | 65,072,564 | 102,386,517 | |||||
| - | 20,368 | - | - | - | - | |||||
| - | - | - | - | - | - | |||||
| 850,000 | - | - | - | 228,119 | - | |||||
| 7,522 | 19,447 | 488 | 17,254 | 23,060 | 86,277 | |||||
| 14,812 | 55,557 | 47,681 | 34,403 | 37,667 | 68,496 | |||||
| 2,333 | 8,056 | 5,913 | 4,978 | 4,665 | 7,467 | |||||
| 1,728 | 6,482 | 4,768 | 4,014 | 3,767 | 5,993 | |||||
| 6,172 | 23,149 | 17,029 | 14,334 | 13,452 | 21,405 | |||||
| 444 | 1,717 | 1,201 | 1,052 | 954 | 1,714 | |||||
| - | - | - | - | - | 25 | |||||
| 370 | 1,389 | 1,022 | 860 | 807 | - | |||||
| 16,861 | 32,990 | 27,845 | 23,269 | 22,719 | 31,427 | |||||
| 900,242 | 169,155 | 105,947 | 100,164 | 335,210 | 222,804 | |||||
| $ 29,898,121 | $ 111,729,956 | $ 81,219,607 | $ 68,426,578 | $ 64,737,354 | $ 102,163,713 | |||||
| $ 26,868,805 | $ 96,822,210 | $ 69,238,773 | $ 56,885,050 | $ 49,272,903 | $ 109,406,079 | |||||
| 12,024 | - | 45,013 | - | 15,593 | 1,514,878 | |||||
| (2,570,106) | (7,814,097) | (1,133,068) | (8,375,500) | 193,587 | (12,248,940) | |||||
| 5,587,398 | 22,721,843 | 13,068,889 | 19,917,028 | 15,255,271 | 3,491,696 | |||||
| $ 29,898,121 | $ 111,729,956 | $ 81,219,607 | $ 68,426,578 | $ 64,737,354 | $ 102,163,713 | |||||
| 2,403,464 | 14,113,548 | 9,299,469 | 5,949,017 | 3,908,265 | 10,200,378 | |||||
| $ 12.44 | $ 7.92 | $ 8.73 | $ 11.50 | $ 16.56 | $ 10.02 | |||||
| $ - | $ - | $ - | $ - | $ - | $ 67,231 |
35
STATEMENTS OF OPERATIONS
For the Year Ended March 31, 2010
| SHORT-INTERMEDIATE | INCOME | ||||
| BOND FUND | FUND | ||||
| Investment Income: | |||||
| Interest | $ 2,557,765 | $ 3,103,814 | |||
| Dividend | 53,416 | 52,397 | |||
| Foreign tax withholding | - | - | |||
| Total Income | 2,611,181 | 3,156,211 | |||
| Expenses: | |||||
| Investment advisory fees | 307,478 | 345,145 | |||
| Administration fees | 96,244 | 90,198 | |||
| Shareholder service fees | 153,739 | 143,810 | |||
| Accounting fees | 10,527 | 11,160 | |||
| Custodian fees | 18,448 | 17,257 | |||
| Chief compliance officer fees | 13,125 | 12,559 | |||
| Director fees | 2,256 | 2,262 | |||
| Transfer agent fees | 29,099 | 28,415 | |||
| Registration and filing fees | 34,067 | 29,315 | |||
| Audit Fees | 24,872 | 21,719 | |||
| Other fees | 26,651 | 29,628 | |||
| Total expenses before waivers | 716,506 | 731,468 | |||
| Expenses reduced by Adviser | (178,337) | (279,558) | |||
| Custodian fees waived | (9,225) | (8,630) | |||
| Total Expenses | 528,944 | 443,280 | |||
| Net Investment Income (Loss) | 2,082,237 | 2,712,931 | |||
| Realized and Unrealized Gains (Losses) On | |||||
Investments and Foreign Currency: | |||||
| Net realized gains (losses) on investments and foreign | |||||
| currency transactions | 1,020,647 | 604,648 | |||
| Change in unrealized appreciation/depreciation on investments | |||||
| and translation of assets and liabilities in foreign currencies | 1,075,151 | 2,437,870 | |||
| Net realized and unrealized gains on investments | |||||
| and foreign currencies | 2,095,798 | 3,042,518 | |||
| Change in net assets resulting from operations | $ 4,178,035 | $ 5,755,449 | |||
See accompanying notes to financial statements.
36
| LARGE CAP | GROWTH | SMALL | ||||||||
| BALANCED | CORE | GROWTH | OPPORTUNITIES | COMPANY | INTERNATIONAL | |||||
| FUND | EQUITY FUND | FUND | FUND | FUND | EQUITY FUND | |||||
| $ 663,697 | $ - | $ - | $ - | $ - | $ - | |||||
| 95,193 | 1,857,405 | 1,032,450 | 634,750 | 928,384 | 3,161,053 | |||||
| (6,766) | (431) | (14,336) | (30,604) | - | (250,952) | |||||
| 752,124 | 1,856,974 | 1,018,114 | 604,146 | 928,384 | 2,910,101 | |||||
| 192,253 | 711,167 | 593,572 | 420,989 | 437,512 | 919,235 | |||||
| 39,635 | 144,512 | 100,537 | 85,534 | 78,460 | 141,077 | |||||
| 64,084 | 237,056 | 164,880 | 140,330 | 128,679 | 229,809 | |||||
| 8,719 | 3,280 | 6,749 | 4,689 | 6,684 | 26,105 | |||||
| 7,690 | 28,446 | 19,785 | 16,839 | 15,441 | 59,750 | |||||
| 5,264 | 19,121 | 13,596 | 10,361 | 10,092 | 17,751 | |||||
| 955 | 3,418 | 2,144 | 1,978 | 1,744 | 3,243 | |||||
| 23,120 | 33,902 | 30,343 | 27,004 | 27,064 | 32,623 | |||||
| 22,566 | 33,482 | 18,455 | 15,157 | 28,004 | 32,750 | |||||
| 10,867 | 25,061 | 26,098 | 14,115 | 16,250 | 25,655 | |||||
| 17,355 | 33,899 | 32,715 | 19,120 | 23,657 | 39,460 | |||||
| 392,508 | 1,273,344 | 1,008,874 | 756,116 | 773,587 | 1,527,458 | |||||
| (38,451) | (142,234) | (194,299) | (84,198) | (77,208) | (196,591) | |||||
| (3,846) | (14,225) | (9,894) | (8,421) | (7,721) | - | |||||
| 350,211 | 1,116,885 | 804,681 | 663,497 | 688,658 | 1,330,867 | |||||
| 401,913 | 740,089 | 213,433 | (59,351) | 239,726 | 1,579,234 | |||||
| (411,410) | (3,139,787) | (320,742) | (2,311,057) | 1,773,183 | 8,267,909 | |||||
| 9,308,735 | 34,785,454 | 22,947,060 | 26,332,035 | 22,510,337 | 28,777,143 | |||||
| 8,897,325 | 31,645,667 | 22,626,318 | 24,020,978 | 24,283,520 | 37,045,052 | |||||
| $ 9,299,238 | $ 32,385,756 | $ 22,839,751 | $ 23,961,627 | $ 24,523,246 | $ 38,624,286 |
37
STATEMENTS OF CHANGES IN NET ASSETS
| SHORT-INTERMEDIATE | INCOME | ||||||||
| BOND FUND | FUND | ||||||||
| For The Year | For The Year | For The Year | For The Year | ||||||
| Ended | Ended | Ended | Ended | ||||||
| March 31, 2010 | March 31, 2009 | March 31, 2010 | March 31, 2009 | ||||||
| Operations: | |||||||||
| Net investment income (loss) | $ 2,082,237 | $ 1,715,206 | $ 2,712,931 | $ 2,416,598 | |||||
| Net realized gains (losses) from investment transactions | 1,020,647 | 507,115 | 604,648 | 585,173 | |||||
| Change in unrealized appreciation/depreciation on | |||||||||
| investments and translations of assets and liabilities | |||||||||
| in foreign currencies | 1,075,151 | (1,304,919) | 2,437,870 | (3,111,706) | |||||
| Change in net assets resulting from operations | 4,178,035 | 917,402 | 5,755,449 | (109,935) | |||||
| Distributions to Shareholders: | |||||||||
| From net investment income | (2,238,042) | (2,026,921) | (2,744,927) | (2,487,517) | |||||
| From net realized gains on investments | - | (241,993) | - | - | |||||
| Change in net assets from distributions to shareholders | (2,238,042) | (2,268,914) | (2,744,927) | (2,487,517) | |||||
| Capital Transactions: | |||||||||
| Proceeds from shares issued | 33,890,007 | 13,374,701 | 20,812,643 | 9,992,612 | |||||
| Proceeds from dividends reinvested | 923,928 | 868,470 | 789,153 | 710,468 | |||||
| Cost of shares redeemed | (14,375,615) | (14,065,868) | (16,478,990) | (15,258,169) | |||||
| Change in net assets from capital transactions | 20,438,320 | 177,303 | 5,122,806 | (4,555,089) | |||||
| Change in net assets | 22,378,313 | (1,174,209) | 8,133,328 | (7,152,541) | |||||
| Net Assets: | |||||||||
| Beginning of year | 49,124,775 | 50,298,984 | 51,964,781 | 59,117,322 | |||||
| End of year | $ 71,503,088 | $ 49,124,775 | $ 60,098,109 | $ 51,964,781 | |||||
| Accumulated net investment income (loss) | $ (360,587) | $ (365,578) | $ 177,048 | $ 273,188 | |||||
| Share Transactions: | |||||||||
| Shares issued | 3,608,043 | 1,450,861 | 2,189,949 | 1,068,580 | |||||
| Shares reinvested | 98,197 | 94,214 | 82,118 | 76,175 | |||||
| Shares redeemed | (1,525,163) | (1,529,162) | (1,727,514) | (1,648,506) | |||||
| Change in shares | 2,181,077 | 15,913 | 544,553 | (503,751) | |||||
See accompanying notes to financial statements.
38
STATEMENTS OF CHANGES IN NET ASSETS
| BALANCED | CORE EQUITY | ||||||||
| FUND | FUND | ||||||||
| For The Year | For The Year | For The Year | For The Year | ||||||
| Ended | Ended | Ended | Ended | ||||||
| March 31, 2010 | March 31, 2009 | March 31, 2010 | March 31, 2009 | ||||||
| Operations: | |||||||||
| Net investment income (loss) | $ 401,913 | $ 614,439 | $ 740,089 | $ 1,113,569 | |||||
| Net realized gains (losses) from investment transactions | (411,410) | (2,158,696) | (3,139,787) | (4,686,798) | |||||
| Change in unrealized appreciation/depreciation on | |||||||||
| investments and translations of assets and liabilities | |||||||||
| in foreign currencies | 9,308,735 | (6,482,982) | 34,785,454 | (30,807,039) | |||||
| Change in net assets resulting from operations | 9,299,238 | (8,027,239) | 32,385,756 | (34,380,269) | |||||
| Distributions to Shareholders: | |||||||||
| From net investment income | (396,549) | (611,234) | (747,149) | (1,071,243) | |||||
| From net realized gains on investments | - | (544,935) | - | (1,366,839) | |||||
| Change in net assets from distributions to shareholders | (396,549) | (1,156,169) | (747,149) | (2,438,082) | |||||
| Capital Transactions: | |||||||||
| Proceeds from shares issued | 6,102,006 | 6,047,694 | 31,396,964 | 20,874,145 | |||||
| Proceeds from dividends reinvested | 394,723 | 1,149,804 | 405,398 | 1,590,746 | |||||
| Cost of shares redeemed | (7,362,082) | (7,529,709) | (21,711,347) | (11,391,848) | |||||
| Change in net assets from capital transactions | (865,353) | (332,211) | 10,091,015 | 11,073,043 | |||||
| Change in net assets | 8,037,336 | (9,515,619) | 41,729,622 | (25,745,307) | |||||
| Net Assets: | |||||||||
| Beginning of year | 21,860,785 | 31,376,404 | 70,000,334 | 95,745,641 | |||||
| End of year | $ 29,898,121 | $ 21,860,785 | $ 111,729,956 | $ 70,000,334 | |||||
| Accumulated net investment income (loss) | $ 12,024 | $ 6,660 | $ - | $ 16,127 | |||||
| Share Transactions: | |||||||||
| Shares issued | 549,022 | 567,398 | 4,481,571 | 3,041,611 | |||||
| Shares reinvested | 35,146 | 119,383 | 57,956 | 255,411 | |||||
| Shares redeemed | (692,376) | (713,262) | (3,059,735) | (1,647,382) | |||||
| Change in shares | (108,208) | (26,481) | 1,479,792 | 1,649,640 | |||||
See accompanying notes to financial statements.
39
STATEMENTS OF CHANGES IN NET ASSETS
| LARGE CAP | GROWTH OPPORTUNITIES | ||||||||
| GROWTH FUND | FUND | ||||||||
| For The Year | For The Year | For The Year | For The Year | ||||||
| Ended | Ended | Ended | Ended | ||||||
| March 31, 2010 | March 31, 2009 | March 31, 2010 | March 31, 2009 | ||||||
| Operations: | |||||||||
| Net investment income (loss) | $ 213,433 | $ 205,144 | $ (59,351) | $ 269,343 | |||||
| Net realized gains (losses) from investment transactions | (320,742) | (791,819) | (2,311,057) | (5,652,568) | |||||
| Change in unrealized appreciation/depreciation on | |||||||||
| investments and translations of assets and liabilities | |||||||||
| in foreign currencies | 22,947,060 | (7,457,020) | 26,332,035 | (16,627,207) | |||||
| Change in net assets resulting from operations | 22,839,751 | (8,043,695) | 23,961,627 | (22,010,432) | |||||
| Distributions to Shareholders: | |||||||||
| From net investment income | (186,642) | (190,366) | - | (101,617) | |||||
| From net realized gains on investments | - | - | - | (6,118,911) | |||||
| Change in net assets from distributions to shareholders | (186,642) | (190,366) | - | (6,753,140) | |||||
| Capital Transactions: | |||||||||
| Proceeds from shares issued | 38,622,721 | 19,235,388 | 16,160,851 | 11,906,316 | |||||
| Proceeds from dividends reinvested | 102,332 | 151,581 | - | 5,776,137 | |||||
| Cost of shares redeemed | (10,929,539) | (3,890,670) | (13,493,380) | (16,256,203) | |||||
| Change in net assets from capital transactions | 27,795,514 | 15,496,299 | 2,667,471 | 1,426,250 | |||||
| Change in net assets | 50,448,623 | 7,262,238 | 26,629,098 | (27,337,322) | |||||
| Net Assets: | |||||||||
| Beginning of year | 30,770,984 | 23,508,746 | 41,797,480 | 69,134,802 | |||||
| End of year | $ 81,219,607 | $ 30,770,984 | $ 68,426,578 | $ 41,797,480 | |||||
| Accumulated net investment income (loss) | $ 45,013 | $ 18,158 | $ - | $ - | |||||
| Share Transactions: | |||||||||
| Shares issued | 5,521,706 | 2,926,428 | 1,622,142 | 1,216,421 | |||||
| Shares reinvested | 13,504 | 23,979 | - | 742,247 | |||||
| Shares redeemed | (1,377,306) | (542,296) | (1,353,150) | (1,531,717) | |||||
| Change in shares | 4,157,904 | 2,408,111 | 268,992 | 426,951 | |||||
See accompanying notes to financial statements.
40
STATEMENTS OF CHANGES IN NET ASSETS
| SMALL COMPANY | INTERNATIONAL EQUITY | ||||||||
| FUND | FUND | ||||||||
| For The Year | For The Year | For The Year | For The Year | ||||||
| Ended | Ended | Ended | Ended | ||||||
| March 31, 2010 | March 31, 2009 | March 31, 2010 | March 31, 2009 | ||||||
| Operations: | |||||||||
| Net investment income (loss) | $ 239,726 | $ 331,323 | $ 1,579,234 | $ 1,515,764 | |||||
| Net realized gains (losses) from investment transactions | 1,773,183 | (1,229,587) | 8,267,909 | (19,771,587) | |||||
| Change in unrealized appreciation/depreciation on | |||||||||
| investments and translations of assets and liabilities | |||||||||
| in foreign currencies | 22,510,337 | (14,232,270) | 28,777,143 | (29,833,813) | |||||
| Change in net assets resulting from operations | 24,523,246 | (15,130,534) | 38,624,286 | (48,089,636) | |||||
| Distributions to Shareholders: | |||||||||
| From net investment income | (229,424) | (331,560) | (306,779) | (1,422,050) | |||||
| From net realized gains on investments | - | (798,170) | - | (1,098,901) | |||||
| Change in net assets from distributions to shareholders | (229,424) | (1,129,730) | (306,779) | (2,520,951) | |||||
| Capital Transactions: | |||||||||
| Proceeds from shares issued | 22,340,482 | 12,617,714 | 28,020,784 | 25,346,390 | |||||
| Proceeds from dividends reinvested | 108,709 | 713,897 | 162,817 | 1,424,122 | |||||
| Cost of shares redeemed | (12,056,762) | (6,696,606) | (20,486,637) | (13,792,841) | |||||
| Change in net assets from capital transactions | 10,392,429 | 6,635,005 | 7,696,964 | 12,977,671 | |||||
| Change in net assets | 34,686,251 | (9,625,259) | 46,014,471 | (37,632,916) | |||||
| Net Assets: | |||||||||
| Beginning of year | 30,051,103 | 39,676,362 | 56,149,242 | 93,782,158 | |||||
| End of year | $ 64,737,354 | $ 30,051,103 | $ 102,163,713 | $ 56,149,242 | |||||
| Accumulated net investment income (loss) | $ 15,593 | $ 1,868 | $ 1,514,878 | $ 96,903 | |||||
| Share Transactions: | |||||||||
| Shares issued | 1,709,606 | 947,567 | 3,271,374 | 3,135,153 | |||||
| Shares reinvested | 8,138 | 63,172 | 16,249 | 206,087 | |||||
| Shares redeemed | (843,643) | (511,744) | (2,178,151) | (1,505,476) | |||||
| Change in shares | 874,101 | 498,995 | 1,109,472 | 1,835,764 | |||||
See accompanying notes to financial statements.
41
FINANCIAL HIGHLIGHTS
For a Share Outstanding
| Distributions to | |||||||||||||||||||||
| Investment Activities | Shareholders from: | Ratios/Supplemental Data | |||||||||||||||||||
| Net Realized | |||||||||||||||||||||
| and | Net | ||||||||||||||||||||
| Unrealized | Net Realized | Investment | |||||||||||||||||||
| Gains | Gains on | Net | Net | Income | |||||||||||||||||
| Net Asset | Net | (Losses) on | Investments | Asset | Assets | Expense | (Loss) to | Expenses | |||||||||||||
| Value, | Investment | Investments | Net | and | Return | Value, | End of | to Average | Average | to Average | |||||||||||
| Beginning | Income | and Foreign | Investment | Foreign | of | End of | Total | Period | Net | Net | Net | Portfolio | |||||||||
| of Period | (Loss) | Currency | Income | Currency | Capital | Period | Return | (000's) | Assets | Assets | Assets* | Turnover | |||||||||
| SHORT-INTERMEDIATE BOND FUND | |||||||||||||||||||||
| For the year ended March 31, | |||||||||||||||||||||
| 2010 | $ 9.20 | $ 0.32 | (f) | $ 0.34 | $(0.35) | $ - | $ - | $ 9.51 | 7.18 | % | $ 71,503 | 0.86 | % | 3.39 | % | 1.17 | % | 62 | % | ||
| 2009 | 9.45 | 0.33 | (0.14) | (0.39) | (0.05) | - | 9.20 | 2.05 | 49,125 | 0.90 | 3.53 | 1.20 | 50 | ||||||||
| 2008 | 9.40 | 0.41 | 0.05 | (0.41) | - | - | 9.45 | 5.01 | (d) | 50,299 | 0.82 | (e) | 4.33 | (e) | 1.17 | 68 | |||||
| 2007 | 9.35 | 0.35 | (f) | 0.11 | (0.41) | - | - | 9.40 | 5.07 | 47,306 | 0.89 | 3.78 | 1.13 | 70 | |||||||
| 2006 | 9.58 | 0.27 | (0.09) | (0.41) | - | - | 9.35 | 1.95 | 60,992 | 0.84 | 3.11 | 0.98 | 41 | ||||||||
| INCOME FUND | |||||||||||||||||||||
| For the year ended March 31, | |||||||||||||||||||||
| 2010 | $ 9.29 | $ 0.45 | (f) | $ 0.51 | $(0.46) | $ - | $ - | $ 9.79 | 10.49 | % | $ 60,098 | 0.77 | % | 4.72 | % | 1.27 | % | 71 | % | ||
| 2009 | 9.69 | 0.42 | (0.39) | (0.43) | - | - | 9.29 | 0.40 | 51,965 | 0.79 | 4.47 | 1.33 | 63 | ||||||||
| 2008 | 9.63 | 0.46 | 0.05 | (0.45) | - | - | 9.69 | 5.27 | (d) | 59,117 | 0.71 | (e) | 4.73 | (e) | 1.29 | 81 | |||||
| 2007 | 9.52 | 0.40 | 0.12 | (0.41) | - | - | 9.63 | 5.66 | 64,946 | 0.98 | 4.21 | 1.19 | 77 | ||||||||
| 2006 | 9.79 | 0.35 | (0.21) | (0.41) | - | - | 9.52 | 1.38 | 54,045 | 1.02 | 3.70 | 1.09 | 85 | ||||||||
| BALANCED FUND | |||||||||||||||||||||
| For the year ended March 31, | |||||||||||||||||||||
| 2010 | $ 8.70 | $ 0.17 | (f) | $ 3.74 | $(0.17) | $ - | $ ��- | $ 12.44 | 45.17 | % | $ 29,898 | 1.37 | % | 1.57 | % | 1.53 | % | 70 | % | ||
| 2009 | 12.36 | 0.24 | (3.44) | (0.24) | (0.22) | - | 8.70 | (26.13) | 21,861 | 1.35 | 2.28 | 1.51 | 60 | ||||||||
| 2008 | 14.69 | 0.18 | (0.17) | (0.18) | (2.16) | - | 12.36 | (0.55) | (d) | 31,376 | 1.30 | (e) | 1.32 | (e) | 1.51 | 83 | |||||
| 2007 | 14.14 | 0.12 | 0.57 | (0.12) | (0.02) | - | 14.69 | 4.83 | 33,659 | 1.33 | 0.84 | 1.45 | 60 | ||||||||
| 2006 | 12.45 | 0.05 | 1.69 | (0.05) | - | - | 14.14 | 13.96 | 33,518 | 1.35 | 0.35 | 1.35 | 44 | ||||||||
| CORE EQUITY FUND | |||||||||||||||||||||
| For the year ended March 31, | |||||||||||||||||||||
| 2010 | $ 5.54 | $ 0.05 | (f) | $ 2.39 | $(0.06) | $ - | $ - | $ 7.92 | 44.10 | % | $ 111,730 | 1.18 | % | 0.78 | % | 1.34 | % | 24 | % | ||
| 2009 | 8.72 | 0.09 | (3.07) | (0.09) | (0.11) | - | 5.54 | (34.36) | 70,000 | 1.24 | 1.34 | 1.40 | 28 | ||||||||
| 2008 | 10.33 | 0.09 | (0.32) | (0.09) | (1.29) | - | 8.72 | (3.25) | (d) | 95,746 | 1.18 | (e) | 0.87 | (e) | 1.39 | 31 | |||||
| 2007 | 10.45 | 0.11 | 1.24 | (0.11) | (1.36) | - | 10.33 | 13.09 | 108,580 | 1.22 | 1.06 | 1.32 | 36 | ||||||||
| 2006 | 10.26 | 0.09 | 1.04 | (0.10) | (0.84) | - | 10.45 | 11.43 | 101,387 | 1.20 | 0.88 | 1.20 | 18 | ||||||||
| LARGE CAP GROWTH FUND | |||||||||||||||||||||
| For the year ended March 31, | |||||||||||||||||||||
| 2010 | $ 5.98 | $ 0.02 | (f) | $ 2.75 | $(0.02) | $ - | $ - | $ 8.73 | 46.40 | % | $ 81,220 | 1.22 | % | 0.32 | % | 1.53 | % | 14 | % | ||
| 2009 | 8.60 | 0.05 | (2.62) | (0.05) | - | - | 5.98 | (29.94) | 30,771 | 0.99 | 0.84 | 1.55 | 18 | ||||||||
| 2008(g) | 10.00 | - | (c) | (1.40) | - | - | - | 8.60 | (14.00) | (a) | 23,509 | 1.95 | (b) | 0.03 | (b) | 2.41 | (b) | 6 | |||
42
FINANCIAL HIGHLIGHTS
For a Share Outstanding
| Distributions to | |||||||||||||||||||||
| Investment Activities | Shareholders from: | Ratios/Supplemental Data | |||||||||||||||||||
| Net Realized | |||||||||||||||||||||
| and | Net | ||||||||||||||||||||
| Unrealized | Net Realized | Investment | |||||||||||||||||||
| Gains | Gains on | Net | Net | Income | |||||||||||||||||
| Net Asset | Net | (Losses) on | Investments | Asset | Assets | Expense | (Loss) to | Expenses | |||||||||||||
| Value, | Investment | Investments | Net | and | Return | Value, | End of | to Average | Average | to Average | |||||||||||
| Beginning | Income | and Foreign | Investment | Foreign | of | End of | Total | Period | Net | Net | Net | Portfolio | |||||||||
| of Period | (Loss) | Currency | Income | Currency | Capital | Period | Return | (000's) | Assets | Assets | Assets* | Turnover | |||||||||
| GROWTH OPPORTUNITIES FUND | |||||||||||||||||||||
| For the year ended March 31, | |||||||||||||||||||||
| 2010 | $ 7.36 | $(0.01) | (f) | $ 4.15 | $ - | $ - | $ - | $ 11.50 | 56.25 | % | $ 68,427 | 1.18 | % | (0.11) | % | 1.35 | % | 54 | % | ||
| 2009 | 13.16 | 0.05 | (4.44) | (0.02) | (1.29) | (0.10) | 7.36 | (33.91) | 41,797 | 1.27 | 0.48 | 1.43 | 64 | ||||||||
| 2008 | 15.21 | (0.02) | (0.69) | (0.05) | (1.29) | - | 13.16 | (5.50) | (d) | 69,135 | 1.20 | (e) | (0.17) | (e) | 1.42 | 73 | |||||
| 2007 | 16.12 | (0.02) | 0.81 | - | (1.70) | - | 15.21 | 5.31 | 70,521 | 1.26 | (0.15) | 1.37 | 51 | ||||||||
| 2006 | 15.00 | (0.09) | 2.95 | - | (1.74) | - | 16.12 | 20.03 | 70,211 | 1.24 | (0.56) | 1.24 | 28 | ||||||||
| SMALL COMPANY FUND | |||||||||||||||||||||
| For the year ended March 31, | |||||||||||||||||||||
| 2010 | $ 9.90 | $ 0.06 | (f) | $ 6.66 | $(0.06) | $ - | $ - | $ 16.56 | 68.04 | % | $ 64,737 | 1.34 | % | 0.47 | % | 1.50 | % | 30 | % | ||
| 2009 | 15.65 | 0.12 | (5.46) | (0.12) | (0.29) | - | 9.90 | (34.47) | 30,051 | 1.43 | 0.88 | 1.59 | 32 | ||||||||
| 2008 | 19.47 | 0.06 | (1.06) | (0.06) | (2.76) | - | 15.65 | (5.87) | (d) | 39,676 | 1.35 | (e) | 0.37 | (e) | 1.56 | 27 | |||||
| 2007 | 20.08 | 0.08 | 1.77 | (0.10) | (2.36) | - | 19.47 | 9.56 | 45,845 | 1.38 | 0.41 | 1.48 | 31 | ||||||||
| 2006 | 17.54 | 0.05 | 3.27 | (0.05) | (0.73) | - | 20.08 | 19.29 | 48,465 | 1.36 | 0.28 | 1.36 | 15 | ||||||||
| INTERNATIONAL EQUITY FUND | |||||||||||||||||||||
| For the year ended March 31, | |||||||||||||||||||||
| 2010 | $ 6.18 | $ 0.16 | (f) | $ 3.71 | $(0.03) | $ - | $ - | $ 10.02 | 62.63 | % | $ 102,164 | 1.45 | % | 1.72 | % | 1.66 | % | 126 | % | ||
| 2009 | 12.93 | 0.19 | (6.62) | (0.18) | (0.14) | - | 6.18 | (50.02) | 56,149 | 1.52 | 2.09 | 1.77 | 64 | ||||||||
| 2008 | 15.21 | 0.16 | (0.78) | (0.15) | (1.51) | - | 12.93 | (5.40) | (d) | 93,782 | 1.41 | (e) | 1.10 | (e) | 1.72 | 68 | |||||
| 2007 | 13.48 | 0.12 | 2.36 | (0.15) | (0.60) | - | 15.21 | 18.70 | 85,896 | 1.44 | 0.97 | 1.65 | 49 | ||||||||
| 2006 | 11.20 | 0.09 | 3.36 | (0.09) | (1.08) | - | 13.48 | 32.12 | 51,495 | 1.51 | 0.85 | 1.61 | 51 | ||||||||
| * Ratios excluding contractual and voluntary waivers. Voluntary waivers may be stopped at any time. |
| (a) Not annualized for periods less than one year. |
| (b) Annualized for periods less than one year. |
| (c) Amount rounds to less than $0.005 per share. |
| (d) During the year ended March 31, 2008, First National reimbursed amounts to certain Funds related to past marketing arrangements. The corresponding impact to |
| the total return was an increase of 0.06%. See Note 7 in notes to financial statements. |
| (e) During the year ended March 31, 2008, First National reimbursed amounts to certain Funds related to past marketing arrangements. The corresponding impact was |
| a decrease to the net expense ratio and an increase to the net income ratio of, 0.06% for Short-Intermediate Bond Fund, 0.06% for Income Fund, 0.06% for Balanced |
| Fund, 0.06% for Core Equity Fund, 0.07% for Growth Opportunities Fund, 0.06% for Small Company Fund and 0.06% for International Equity Fund. See Note 7 |
| in notes to financial statements. |
| (f ) Per share data calculated using average shares method. |
| (g) Commenced operations on July 5, 2007. |
See accompanying notes to financial statements.
43
NOTES TO FINANCIAL STATEMENTS
March 31, 2010
1. Organization
First Focus Funds, Inc. (“First Focus Funds” or the “Company”) was organized in October 1994 as a Nebraska corporation and is registered under the Investment Company Act of 1940, as amended (the “1940 Act”), as a diversified open-end management investment company issuing its shares in series. The Company consists of eight series, the Short-Intermediate Bond Fund, the Income Fund, the Balanced Fund, the Core Equity Fund, the Large Cap Growth Fund, the Growth Opportunities Fund, the Small Company Fund and the International Equity Fund (collectively, the “Funds” and individually, a “Fund”). Each series represents a distinct portfolio with its own investment objectives and policies. All Funds presently offer Institutional Class shares without a sales charge.
Under the Company’s organizational documents, its Officers and Directors are indemnified against certain liabilities arising out of the performance of their duties to the Company. In addition, in the normal course of business, the Company may enter into contracts with its vendors and others that provide general indemnifications. The Company’s maximum exposure under these arrangements is unknown, as this would involve future claims that may be made against the Company. However, based on experience, the Company expects the risk of loss to be remote.
2. Significant Accounting Policies
The following is a summary of significant accounting policies consistently followed by the Company in the preparation of its financial statements. The policies are in conformity with accounting principles generally accepted in the United States of America (“GAAP”). The preparation of financial statements requires management to make estimates and assumptions that affect the reported amounts of assets and liabilities, the disclosure of contingent assets and liabilities at the date of financial statements and the reported amounts of income and expenses for the period. Actual results could differ from those estimates.
Recently Issued Accounting Pronouncements
In January 2010, the Financial Accounting Standards Board (“FASB”) issued Accounting Standards Update (“ASU”) No. 2010-06 "Improving Disclosures about Fair Value Measurements". ASU 2010-06 clarifies existing disclosure and requires additional disclosures regarding fair value measurements. Effective for interim and annual reporting periods beginning after December 15, 2009, entities will be required to disclose significant transfers into and out of Level 1 and 2 measurements in the fair value hierarchy and the reasons for those transfers. Effective for fiscal years beginning after December 15, 2010, and for interim periods within those fiscal years, entities will need to disclose information about purchases, sales, issuances and settlements of Level 3 securities on a gross basis. The addit ional disclosures are incorporated into this annual report.
Security Valuation
The net asset value (“NAV”) per share of each Fund is determined each business day as of the close of the New York Stock Exchange (“NYSE”), which is normally 4 p.m. Eastern Time. Each Fund’s NAV is calculated by adding the value of all securities and other assets of the Fund, subtracting its liabilities and dividing the result by the number of its outstanding shares. In valuing a Fund’s assets for calculating the NAV, securities listed on a securities exchange, market or automated quotation system for which quotations are readily available, including traded over-the-counter securities, are valued at the last quoted sale price on the primary exchange or market (foreign or domestic) on which they traded or, if there is no such reported sale on the valuation date, at the most recent quoted b id price. Investments in mutual funds are valued at the NAV per share determined as of the close of the NYSE.Debt securities (other than short-term investments) are valued at prices furnished by pricing services and generally reflect last reported sales price if the security is actively traded or an evaluated bid price obtained by employing methodologies that utilize actual market transactions; broker supplied valuations; or factors such as yield, maturity, call features, credit ratings or developments relating to specific securities in arriving at the valuation. Prices provided by pricing services are subject to review and determination of the appropriate price whenever a furnished price is significantly different from the previous day’s furnished price. Each Fund’s respective investment adviser, assists the Company’s Board of Directors (the “Board”) which is responsible for this rev iew and determination process. Short-term obligations (maturing within 60 days) may be valued on an amortized cost basis unless such value does not approximate market value. Securities for which quotations are not readily available are valued at fair value as determined in good faith by the Company’s Fair Value Committee pursuant to procedures established by the Board. Factors used in determining fair value include but are not limited to type of security or asset, fundamental analytical data relating to the investment, evaluation of the forces that influence the market in which the security is purchased and sold and information as to any transactions or offers with respect to the security. In the event of an increase or decrease in the value of a designated benchmark index greater than predetermined levels, the International Equity Fund may use an independent statistical fair value pricing service to fair value certain international equity securities.
The Funds use a framework for measuring fair value. Fair value is defined as the price that would be received to sell an asset or paid to transfer a liability in an orderly transaction between market participants (exit price). One component of fair value is a three-tier fair value hierarchy. The basis of the tiers is dependent upon various “inputs” used to determine the value of the Funds’ investments. These inputs are summarized in the three broad levels listed below:
| Level 1 – | includes valuations based on quoted prices of identical securities in active markets including valuations for securities listed on a national or foreign stock exchange or investments in mutual funds whose NAVs are available on the valuation date. |
| Level 2 – | includes valuations for which all significant inputs are observable, either directly or indirectly. Direct observable inputs include broker quotes, closing prices of similar securities in active markets, closing prices for identical or similar securities in non-active markets or corporate action or reorganization entitlement values. Indirect significant observable inputs include factors such as interest rates, yield curves, prepayment speeds or credit ratings. Level 2 includes valuations for fixed income securities priced by pricing services, broker |
44
NOTES TO FINANCIAL STATEMENTS (continued)
March 31, 2010
| quotes in active markets, securities subject to corporate actions, international equity securities priced by an independent statistical fair value pricing service, or ADRs and GDRs for which quoted prices in active markets are not available. |
| Level 3 – | includes valuations based on inputs that are unobservable and significant to the fair value measurement, including the Company’s own assumptions in determining the fair value of the investment. Inputs used to determine the fair value of Level 3 securities include security specific inputs such as: credit quality, issuer news, trading characteristics, or industry specific inputs such as: trading activity of similar markets or securities, changes in the security’s underlying index or comparable securities’ models. Level 3 valuations include securities that are priced based on single source broker quotes, where prices may be unavailable due to halted trading, restricted to resale due to market events, newly issued or for which reliable quotes are not available. |
The inputs or methodology used for valuing investments are not necessarily an indication of the risk associated with investing in those investments.
The following is a summary of the inputs used to value each Fund’s investments as of March 31, 2010, by category :
| LEVEL 2 - | LEVEL 3 - | |||||||||||
| Significant | Significant | |||||||||||
| LEVEL 1 - | Observable | Unobservable | ||||||||||
| Quoted Prices | Inputs | Inputs | Total | |||||||||
| Short-Intermediate Bond Fund | ||||||||||||
| Non-U.S. Government Agency | ||||||||||||
| Asset-Backed Securities | $ | - | $ | 12,322,480 | $ | 372,898 | $ | 12,695,378 | ||||
| Corporate Bonds | - | 28,327,895 | - | 28,327,895 | ||||||||
| Government And Agency | ||||||||||||
| Obligations | - | 27,129,077 | - | 27,129,077 | ||||||||
| Investment Companies | 2,797,585 | - | - | 2,797,585 | ||||||||
| Total | $ | 2,797,585 | $ | 67,779,452 | $ | 372,898 | $ | 70,949,935 | ||||
| Income Fund | ||||||||||||
| Non-U.S. Government Agency | ||||||||||||
| Asset-Backed Securities | $ | - | $ | 14,767,149 | $ | 451,644 | $ | 15,218,793 | ||||
| Corporate Bonds | - | 17,378,806 | - | �� 17,378,806 | ||||||||
| Government And Agency | ||||||||||||
| Obligations | - | 25,098,359 | - | 25,098,359 | ||||||||
| Investment Companies | 1,993,854 | - | - | 1,993,854 | ||||||||
| Total | $ | 1,993,854 | $ | 57,244,314 | $ | 451,644 | $ | 59,689,812 | ||||
| Balanced Fund | ||||||||||||
| Common Stocks | $ | 20,739,951 | $ | - | $ | - | $ | 20,739,951 | ||||
| Corporate Bonds | - | 5,517,338 | - | 5,517,338 | ||||||||
| Government And Agency | ||||||||||||
| Obligations | - | 3,311,306 | - | 3,311,306 | ||||||||
| Investment Companies | 760,989 | - | - | 760,989 | ||||||||
| Total | $ | 21,500,940 | $ | 8,828,644 | $ | - | $ | 30,329,584 | ||||
45
NOTES TO FINANCIAL STATEMENTS (continued)
March 31, 2010
| LEVEL 2 - | LEVEL 3 - | |||||||||||
| Significant | Significant | |||||||||||
| LEVEL 1 - | Observable | Unobservable | ||||||||||
| Quoted Prices | Inputs | Inputs | Total | |||||||||
| Core Equity Fund | ||||||||||||
| Common Stocks | $ | 105,861,049 | $ | - | $ | - | $ | 105,861,049 | ||||
| Investment Companies | 5,728,226 | - | - | 5,728,226 | ||||||||
| Total | $ | 111,589,275 | $ | - | $ | - | $ | 111,589,275 | ||||
| Large Cap Growth Fund | ||||||||||||
| Common Stocks | $ | 79,239,538 | $ | - | $ | - | $ | 79,239,538 | ||||
| Investment Companies | 1,831,494 | - | - | 1,831,494 | ||||||||
| Total | $ | 81,071,032 | $ | - | $ | - | $ | 81,071,032 | ||||
| Growth Opportunities Fund | ||||||||||||
| Common Stocks | $ | 67,228,202 | $ | - | $ | - | $ | 67,228,202 | ||||
| Investment Companies | 1,194,353 | - | - | 1,194,353 | ||||||||
| Total | $ | 68,422,555 | $ | - | $ | - | $ | 68,422,555 | ||||
| Small Company Fund | ||||||||||||
| Common Stocks | $ | 61,950,342 | $ | - | $ | - | $ | 61,950,342 | ||||
| Investment Companies | 2,675,493 | - | - | 2,675,493 | ||||||||
| Total | $ | 64,625,835 | $ | - | $ | - | $ | 64,625,835 | ||||
| International Equity Fund | ||||||||||||
| Foreign Stocks | $ | 89,568,316 | $ | 1,199,816 | $ | - | $ | 90,768,132 | ||||
| Preferred Stocks | 609,979 | - | - | 609,979 | ||||||||
| Exchange Traded Funds | 9,594,599 | - | - | 9,594,599 | ||||||||
| Rights | 4,132 | - | - | 4,132 | ||||||||
| Warrants | 5,202 | - | - | 5,202 | ||||||||
| Investment Companies | 334,498 | - | - | 334,498 | ||||||||
| Total | $ | 100,116,726 | $ | 1,199,816 | $ | - | $ | 101,316,542 | ||||
The only significant transfers in and out of Level 1 and Level 2 during the year ended March 31, 2010, occurred in the International Equity Fund. As previously noted, an independent statistical fair value pricing service is used to value international equity securities when certain conditions exist. Securities which are valued using the independent statistical fair value pricing service are classified as Level 2. Therefore, a significant portion of the International Equity Fund’s investments may be classified as Level 1 or Level 2 on any particular day depending on the existence of such pre-requisite conditions. These securities were valued as Level 2 on March 31, 2009 and valued as Level 1 on March 31, 2010.
The following table is a rollforward of Level 3 investments by category for which significant unobservable inputs were used to determine fair value:
| Transfers | Total | Change in Unrealized | |||||||||
| Transfers | Out of | Realized and | Appreciation during | ||||||||
| Balance at | Into Level | Level 3 | Change in | Balance | the Period for | ||||||
| Beginning | 3 During | During | Unrealized | at End of | Level 3 Investments | ||||||
| of Period | the Period | the Period | Gain/(Loss) | Purchases | (Sales) | Period | Held at End of Period | ||||
| Short-Intermediate Bond Fund | |||||||||||
| Non-U.S. Government Agency | |||||||||||
| Asset-Backed Securities | $ - | $ 231,873 | $ - | $ 146,714 | $ - | $ (5,689) | $372,898 | $ 144,546 | |||
| Income Fund | |||||||||||
| Non-U.S. Government Agency | |||||||||||
| Asset-Backed Securities | $ - | $ 352,224 | $ - | $ 98,691 | $6,597 | $ (5,868) | $451,644 | $ 96,438 | |||
46
NOTES TO FINANCIAL STATEMENTS (continued)
March 31, 2010
Securities Transactions and Investment Income
During the period, securities transactions are accounted for no later than one business day following trade date. For financial reporting purposes, however, security transactions are accounted for on trade date on the last business day of the reporting period. Interest income is recognized on the accrual basis and includes, where applicable, the amortization of premium or accretion of discount. Dividend income is recorded on the ex-dividend date. Gains or losses realized on the sales of securities and on foreign currency transactions are determined by comparing the identified cost of the security lot sold with the net sale proceeds.
Risk Associated with Foreign Securities and Currencies
Investments in securities of foreign issuers carry certain risks not ordinarily associated with investments in securities of domestic issuers. Such risks include adverse future political and economic developments and the possible imposition of exchange controls or other foreign governmental laws and restrictions. In addition, with respect to certain countries, there is the possibility of expropriation of assets, confiscatory taxation, and political or social instability or diplomatic developments, all of which could adversely affect the value of those securities.
Certain countries may also impose substantial restrictions on investments in their capital markets by foreign entities, including restriction on investment in issuers or industries deemed sensitive to the relevant nation’s interests. These factors may limit the investment opportunities available or result in lack of liquidity and high price volatility with respect to securities of issuers from developing countries.
The International Equity Fund invests in securities of foreign issuers in various countries. These investments may involve certain considerations and risks not typically associated with investments in the United States as a result of, among other factors, the possibility of future political and economic developments, lack of liquidity, low market capitalizations, foreign currency fluctuations, and the level of governmental supervision and regulation of securities markets in the respective countries.
Forward Foreign Currency Exchange Contracts
The International Equity Fund may enter into forward foreign currency contracts in connection with a planned purchase or sale of securities or to hedge the U.S. dollar value of securities denominated in a particular currency. A forward foreign currency contract is an agreement between two parties to buy and sell a currency at a set price on a future date. The use of forward foreign currency contracts does not eliminate fluctuations in the underlying prices of a Fund’s portfolio securities, but it does establish a rate of exchange that can be achieved in the future. The value of a forward foreign currency contract fluctuates with changes in foreign currency exchange rates. Forward foreign currency contracts are marked-to-market daily based on the bid exchange rate of the underlying currency and an y gains or losses are recorded by a Fund as unrealized gain or loss and as a receivable or payable from forward foreign currency contracts in the Statement of Assets and Liabilities. Upon delivery or receipt of the currency, a realized gain or loss is recorded in the Statement of Operations which is equal to the difference between the value of the contract at the time it is opened and the value at the time it is closed. The International Equity Fund could be exposed to risks if the counterparties to the contracts are unable to meet the terms of their contracts and from unanticipated movements in the value of a foreign currency relative to the U.S. dollar. Although contracts limit the risk of loss due to a decline in the value of the hedged currency, they also limit any potential gain that might result should the value of the currency increase. During the year ended March 31, 2010, the Fund did not hold any forward foreign currency contracts.
Foreign Currency Translation
The books and records of each Fund are maintained in U.S. dollars. Foreign currency amounts are translated into U.S. dollars on the following basis:
| (i) | Fair value of investment securities, other assets and liabilities at the current bid rate of exchange |
| (ii) | Purchases and sales of investment securities, income, and expenses at the relevant rates of exchange prevailing on the respective dates of such transactions |
The Funds do not isolate the portion of gains and losses on investments in securities that is due to changes in the foreign exchange rates from that which is due to changes in the market prices of such securities. The Funds report gains and losses on foreign currency related transactions as realized and unrealized gains and losses for financial reporting purposes, whereas such gains and losses are treated as ordinary income or loss for U.S. Federal income tax purposes.
Dividends and interest from non-U.S. sources received by a Fund are generally subject to non-U.S. net withholding taxes at rates ranging up to 25%. Such withholding taxes may be reduced or eliminated under the terms of applicable U.S. income tax treaties, and each Fund intends to undertake any procedural steps required to claim the benefits of such treaties. If the value of more than 50% of a Fund’s total assets at the close of any taxable year consists of stock or securities of non-U.S. corporations, that the International Equity Fund is permitted and may elect to treat any non-U.S. taxes paid by it as paid by its shareholders.
Loans of Portfolio Securities
All Funds may lend their securities pursuant to securities lending agreements (“Lending Agreements”) with Union Bank of California N.A. (“UBOC”). Each Fund will limit its securities lending activity to 33 1/3% of its total assets. Security loans made pursuant to the Lending Agreements must maintain loan collateral with UBOC at all times in the amount equal to no less than 100% of the current fair value of the loaned securities based on the prior day’s closing price in the form of cash or U.S. government obligations to secure the return of the loaned securities. The initial value of
47
NOTES TO FINANCIAL STATEMENTS (continued)
March 31, 2010
loan collateral must be no less than 102% for all Funds other than the International Equity Fund, which must have an initial value of loan collateral no less than 105%, of the fair value of the loaned securities plus the accrued interest on debt securities. UBOC must, in accordance with UBOC’s reasonable and customary practices, mark loaned securities and collateral to their fair value each business day based upon the fair value of the collateral and the loaned securities at the close of business employing the most recently available pricing information and receive and deliver collateral in order to maintain the value of the collateral at no less than 100% of the fair value of the loaned securities. Cash collateral received is invested by UBOC pursuant to the terms of the Lending Agreements.
There was no securities lending activity during the year ended March 31, 2010. While the Funds have executed the Lending Agreements for securities lending, in light of current market conditions, the Funds have not yet determined when or if they will commence securities lending transactions under the Lending Agreements.
Restricted Securities
A restricted security is a security which has been purchased through a private offering and cannot be resold to the general public without registering the transaction under the Securities Act of 1933 (the “1933 Act”) or pursuant to the resale limitations provided by Rule 144 under the 1933 Act, or an exemption from the registration requirements of the 1933 Act. Whether a restricted security is illiquid or not is determined pursuant to guidelines established by the Board. Not all restricted securities are considered illiquid. At of March 31, 2010, the Funds did not hold any restricted securities or Rule 144A securities that have not been deemed liquid.
Allocation of Expenses
Expenses directly attributable to a Fund are charged directly to that Fund, while expenses which are attributable to more than one Fund are allocated among the respective Funds based upon relative net assets or another appropriate basis.
Distributions to Shareholders
During the year ended March 31, 2010, dividends from net investment income were declared daily and paid monthly for the Short-Intermediate Bond and Income Funds. Dividends from the Core Equity, Small Company and Large Cap Growth Funds were declared and paid monthly. The Balanced Fund declared and paid dividends quarterly and the Growth Opportunities and International Equity Funds declared and paid dividends, if any, annually. Distributions of net realized capital gains, if any, were declared and distributed at least annually for all the Funds only to the extent they exceeded available capital loss carryovers. Distributions from net income may differ significantly from book income due to certain tax elections made by the Funds.
3. Related Party Transactions and Fees and Agreements
The Funds have agreements with their respective investment advisers, FNB Fund Advisors (“FNB”), a separately identifiable department of First National Bank of Omaha (“FNBO”), or Tributary Capital Management, LLC (“Tributary”), a subsidiary of First National Nebraska, Inc., to furnish investment advisory services to the Funds. Under the terms of these agreements, each Fund pays a monthly fee at the annual rate of the following percentages of each Fund’s average daily net assets: to FNB, 0.50% for the Short-Intermediate Bond Fund, 0.60% for the Income Fund, 0.75% for the Core Equity Fund, 0.90% for the Large Cap Growth Fund, 0.85% for the Small Company Fund and 1.00% for the International Equity Fund; to Tributary, 0.75% for each of the Balanced Fund and the Growth Opportunities Fund.
FNB has contractually agreed to waive certain of its fees until July 31, 2010, at the annual rate of the following percentages of each Fund’s average daily net assets: 0.29% for the Short-Intermediate Bond Fund, 0.47% for the Income Fund, 0.15% for the Core Equity Fund, 0.10% for the Large Cap Growth Fund, 0.15% for the Small Company Fund and 0.15% for the International Equity Fund. Tributary has contractually agreed to waive certain of its fees until July 31, 2010 at the annual rate of the following percentages of each Fund’s average daily net assets: 0.15% for each of the Balanced Fund and the Growth Opportunities Fund. None of the waived fees can be recaptured in subsequent periods.
Prior to August 1, 2009, FNB contractually agreed to waive certain fees at the annual rate of the following percentages of each Fund’s average daily net assets: 0.52% for the Income Fund, 0.30% for the Large Cap Growth Fund and 0.25% for the International Equity Fund. None of the waived fees can be recaptured in subsequent periods.
Riverbridge Partners, LLC (“Riverbridge”) serves as the investment sub-adviser to the Large Cap Growth Fund. Under the terms of an agreement between FNB and Riverbridge, FNB pays Riverbridge a monthly fee at the annual rate of 0.45% of the average daily net assets of the Large Cap Growth Fund. Riverbridge has contractually agreed to waive certain of its fees until July 31, 2010 at the annual rate of 0.10% of the Fund’s average daily net assets. None of the waived fees can be recaptured in subsequent periods.
KBC Asset Management International Ltd. (“KBCAM”), a subsidiary of KBCAM Limited, serves as the investment sub-adviser to the International Equity Fund. Under the terms of an agreement between FNB and KBCAM, FNB pays KBCAM a monthly fee at the annual rate of 0.50% of the average daily net assets of the International Equity Fund.
Please refer to Note 8. Subsequent Events, for further discussion of related party changes effective May 3, 2010.
48
NOTES TO FINANCIAL STATEMENTS (continued)
March 31, 2010
FNBO also serves as custodian for each of the Funds, with the exception of the International Equity Fund, for which UBOC serves as custodian. FNBO, as custodian, receives compensation from each of the Funds for its services in an amount equal to a fee, computed daily and payable monthly, at an annual rate of 0.03% of each Fund’s average daily net assets.
UBOC receives as compensation from the International Equity Fund a fee, computed daily and paid quarterly, at an annual rate of 0.065% of the Fund’s average daily net assets, subject to a minimum fee of $10,000 annually plus certain out-of-pocket expenses.
DST Systems, Inc. serves as transfer agent for the Funds, whose functions include disbursing dividends and other distributions. FNBO serves as a Co-Administrator of the Funds. Prior to December 19, 2009, Citi Fund Services Ohio, Inc. (“Citi”) served as a Co-Administrator of the Funds. Effective December 19, 2009, Jackson Fund Services (“JFS”) serves as a Co-Administrator of the Funds. As compensation for its administrative services, each Co-Administrator is entitled to a fee, calculated daily and paid monthly based on the Funds’ average daily net assets. FNBO receives 0.07% of the Funds’ average daily net assets. Prior to October 1, 2009, Citi received a fee based on an annual rate of 0.08% of the Funds’ first $600 million of average daily net assets, 0.04% of the Funds&# 8217; average daily net assets between $600 million and $800 million and 0.03% of the Funds’ average daily net assets over $800 million, subject to a minimum annual Company complex fee of $240,000. Effective October 1, 2009 through December 18, 2009, Citi as a Co-Administrator received a fee based on an annual rate of 0.088% of the Funds’ first $600 million of average daily net assets, 0.044% of the Funds’ average daily net assets between $600 million and $800 million and 0.033% of the Funds’ average daily net assets over $800 million, subject to a minimum annual Company complex fee of $264,000. Citi also served as fund accountant and, as such, was entitled to certain out-of-pocket expenses. Effective December 19, 2009, JFS receives a fee based on an annual rate of 0.085% of the Funds’ first $500 million of average daily net assets, 0.050% of the Funds’ average daily net assets between $500 million and $1 billion and 0.040% of the Funds’ average daily net assets over $1 billion.
Prior to December 19, 2009, under a Compliance Services Agreement between the Funds and Citi (the “Compliance Agreement”), Citi made an employee available to serve as the Funds’ AML Compliance Officer and Chief Compliance Officer (the “CCO”). Under the Compliance Agreement, Citi also provided infrastructure and support in implementing the written policies and procedures comprising the Funds’ compliance program, including support services to the CCO. For the services provided under the Compliance Agreement, the Funds paid Citi $75,959 for the period ended December 18, 2009, including certain out-of-pocket expenses. Citi paid the salary and other compensation earned by any such individuals as employees of Citi. Effective December 21, 2009, Beacon Hill Fund Services, Inc. (&# 8220;Beacon Hill”) began providing the Funds’ AML Compliance Officer and CCO services. For the services provided under a new Fund Compliance Services Agreement, the Funds paid Beacon Hill $25,910 for the period December 21, 2009 through March 31, 2010, including certain out-of-pocket expenses.
The advisers, sub-advisers, custodian and the Co-Administrators may periodically volunteer to reduce all or a portion of their fees with respect to one or more of the Funds. These voluntary waivers may be terminated at any time. The reduction of such fees will cause the yield and total return of any Fund to be higher than it would be in the absence of such reductions. These waivers are not subject to recoupment in subsequent fiscal periods. Fees voluntarily waived during the year ended March 31, 2010 were as follows:
| Advisory | Custodian | |
| Fees Waived | Fees Waived | |
| Short-Intermediate Bond Fund | $ - | $ 9,225 |
| Income Fund | - | 8,630 |
| Balanced Fund | - | 3,846 |
| Core Equity Fund | - | 14,225 |
| Large Cap Growth Fund | 44,568 | 9,894 |
| Growth Opportunities Fund | - | 8,421 |
| Small Company Fund | - | 7,721 |
| International Equity Fund | 32,220 | - |
Northern Lights Distributors, LLC acts as distributor for each of the Funds pursuant to an Underwriting Agreement with the Company. Fees paid to Northern Lights Distributors, LLC under the agreement are included in Other Fees in the Statements of Operations.
The Company has adopted an Administrative Services Plan, which allows the Funds to charge a shareholder services fee, pursuant to which each Fund is authorized to pay compensation to banks and other financial institutions, that may include the advisers, their correspondent and affiliated banks and FNBO (each a “Service Organization”). Under the Administrative Services Plan, the Funds may enter into a Servicing Agreement with a Service Organization whereby such Service Organization agrees to provide certain record keeping and/or administrative support services for their customers or account holders who are the beneficial or record owner of the shares of a Fund. The Funds’ maintain Servicing Agreements, one of which with FNBO provides that the FNBO receives an annual fee at the rate of 0.25% of the average aggregate net asse t value of the Funds held during the period by customers for whom FNBO provided services under the Servicing Agreement. The amounts charged to the Funds and paid to FNBO for shareholder service fees are reported within the Statements of Operations.
49
NOTES TO FINANCIAL STATEMENTS (continued)
March 31, 2010
4. Investment Transactions
The aggregate purchases and sales of securities, excluding U.S. government securities and short-term investments (maturing less than one year from acquisition), for the year ended March 31, 2010 were as follows:
| Purchases | Sales | Purchases | Sales | |||
| Short-Intermediate Bond Fund | $ 34,959,857 | $ 11,750,428 | Large Cap Growth Fund | $ 36,769,552 | $ 9,087,202 | |
| Income Fund | 16,120,429 | 10,670,739 | Growth Opportunities Fund | 33,025,765 | 28,427,588 | |
| Balanced Fund | 13,483,629 | 15,705,070 | Small Company Fund | 23,714,170 | 14,533,881 | |
| Core Equity Fund | 30,982,071 | 21,368,838 | International Equity Fund | 122,347,018 | 112,821,740 |
The aggregate purchases and sales of long-term U.S. Government securities for the year ended March 31, 2010 were as follows:
| Purchases | Sales | |
| Short-Intermediate Bond Fund | $ 17,562,630 | $ 24,120,344 |
| Income Fund | 28,052,975 | 29,254,404 |
| Balanced Fund | 3,673,105 | 1,790,292 |
5. Capital Share Transactions
The Company is authorized to issue a total of 1,000,000,000 shares of common stock, 999,999,990 of which may be issued in series with a par value of $0.00001 per share. The Board is empowered to allocate such shares among different series of the Company’s shares without shareholder approval.
6. Federal Income Taxes
It is each Fund’s policy to continue to comply with the requirements of Subchapter M of the Internal Revenue Code, applicable to regulated investment companies, and to distribute all of its taxable income, including any net realized gains on investments, to its shareholders sufficient to relieve it from all, or substantially all, Federal income taxes. Therefore, no provision is made for Federal income taxes.
Withholding taxes on foreign dividends have been paid or provided for in accordance with each applicable country’s tax rules and rates.
At March 31, 2010, the cost basis, gross unrealized appreciation, gross unrealized depreciation, net unrealized appreciation/depreciation, undistributed net ordinary income and undistributed net long-term capital gain for federal income tax purposes were as follows:
| Tax | Gross | Gross | Net Unrealized | Undistributed | Undistributed | |
| Cost of | Unrealized | Unrealized | Appreciation/ | Net Ordinary | Net Long-Term | |
| Investments | Appreciation | Depreciation | (Depreciation) | Income* | Capital Gain | |
| Short-Intermediate Bond Fund | $69,659,713 | $ 2,464,485 | $ (1,174,263) | $ 1,290,222 | $ 89,782 | $ - |
| Income Fund | 59,601,814 | 2,623,416 | (2,535,418) | 87,998 | 204,115 | - |
| Balanced Fund | 24,770,596 | 5,777,285 | (218,297) | 5,558,988 | 12,024 | - |
| Core Equity Fund | 89,263,424 | 25,992,898 | (3,667,047) | 22,325,851 | - | - |
| Large Cap Growth Fund | 68,737,835 | 14,943,839 | (2,610,642) | 12,333,197 | 45,013 | - |
| Growth Opportunities Fund | 48,619,165 | 20,451,831 | (648,441) | 19,803,390 | - | - |
| Small Company Fund | 49,735,745 | 16,641,185 | (1,751,095) | 14,890,090 | 418,618 | 155,744 |
| International Equity Fund | 98,522,261 | 7,144,200 | (4,349,919) | 2,794,281 | 1,720,126 | - |
*Undistributed net ordinary income includes any undistributed net short-term capital gains.
The difference between book-basis and tax-basis amounts are attributable primarily to tax deferral of losses on wash sales, mark to market on investments in passive foreign investment companies and tax amortization/accretion methods for premium and market discount.
50
NOTES TO FINANCIAL STATEMENTS (continued)
March 31, 2010
The tax character of dividends and distributions paid during the years ended March 31, 2010 and 2009 were as follows:
| Distributions Paid From | ||||||||
| Ordinary Income | Net Long Term Capital Gains | Return of Capital | Total Distributions Paid* | |||||
| 2010 | 2009 | 2010 | 2009 | 2010 | 2009 | 2010 | 2009 | |
| Short-Intermediate Bond Fund | $ 2,238,116 | $ 2,255,880 | $ - | $ - | $ - | $ - | $ 2,238,116 | $ 2,255,880 |
| Income Fund | 2,755,094 | 2,462,735 | - | - | - | - | 2,755,094 | 2,462,735 |
| Balanced Fund | 396,549 | 611,234 | - | 544,935 | - | - | 396,549 | 1,156,169 |
| Core Equity Fund | 742,032 | 1,071,243 | - | 1,366,839 | 5,117 | - | 747,149 | 2,438,082 |
| Large Cap Growth Fund | 186,642 | 190,366 | - | - | - | - | 186,642 | 190,366 |
| Growth Opportunities Fund | - | 269,343 | - | 5,951,185 | - | 532,612 | - | 6,753,140 |
| Small Company Fund | 229,424 | 475,656 | - | 654,074 | - | - | 229,424 | 1,129,730 |
| International Equity Fund | 306,779 | 1,501,267 | - | 1,019,684 | - | - | 306,779 | 2,520,951 |
* Total distributions paid may differ from the Statements of Changes in Net Assets because distributions are recognized when actually paid for tax purposes.
To the extent there are differences between the amounts recognized for financial statements and federal income tax purposes that are permanent in nature, such amounts are reclassified within the capital accounts based on their federal income tax treatment as indicated below; temporary differences do not require reclassification. Permanent differences may include but are not limited to the following: Treasury Inflation-Protected Securities, foreign currency reclassifications, market discount, premium and/or paydown reclassifications, reclassifications on the sale of PFIC or REIT securities, net operating losses and distribution adjustments. These reclassifications for the year ended March 31, 2010 have no impact on net assets.
| Net Increase (Decrease) | |||
| Undistributed | Accumulated | ||
| Net Investment | Net Realized | Paid-in | |
| Income | Gain (Loss) | Capital | |
| Short-Intermediate Bond Fund | $ 160,796 | $ (160,796) | $ - |
| Income Fund | (64,144) | 64,144 | - |
| Core Equity Fund | (9,067) | 14,184 | (5,117) |
| Large Cap Growth Fund | 64 | (64) | - |
| Growth Opportunities Fund | 59,351 | - | (59,351) |
| Small Company Fund | 3,423 | (3,423) | - |
| International Equity Fund | 145,520 | (145,520) | - |
Under current tax law, certain capital losses realized after October 31 and within the taxable year may be deferred and treated as occurring on the first business day of the following fiscal year. For the year ended March 31, 2010, the following Funds deferred to April 1, 2010 post–October capital losses and post-October currency losses of:
| Post-October | |
| Losses | |
| Core Equity Fund | $ 234,193 |
| Large Cap Growth Fund | 156,659 |
| International Equity Fund | 5,894,589 |
51
NOTES TO FINANCIAL STATEMENTS (continued)
March 31, 2010
As of March 31, 2010, the following Funds had net capital loss carryforwards, which are available to offset future net realized capital gains, if any, to the extent provided by the Treasury regulations. To the extent that these carryforwards are used to offset future capital gains, it is probable that the gains that are offset will not be distributed to shareholders.
| 2011 | 2012 | 2013 | 2014 | 2015 | 2016 | 2017 | 2018 | Total | |
| Short-Intermediate Bond Fund | $ - | $ - | $ - | $ 730,864 | $ 1,593,824 | $ 852,078 | $ 577,072 | $ - | $ 3,753,838 |
| Income Fund | - | - | - | 559,914 | 894,865 | 267,178 | - | - | 1,721,957 |
| Balanced Fund | - | - | - | - | - | - | 24,286 | 2,517,410 | 2,541,696 |
| Core Equity Fund | - | - | - | - | - | - | 3,602,240 | 3,581,672 | 7,183,912 |
| Large Cap Growth Fund | - | - | - | - | - | 6,051 | 61,409 | 173,257 | 240,717 |
| Growth Opportunities Fund | - | - | - | - | - | - | - | 8,261,861 | 8,261,861 |
| International Equity Fund | - | - | - | - | - | - | 5,869,614 | - | 5,869,614 |
The Funds comply with FASB ASC Topic 740, “Income Taxes”. FASB ASC Topic 740 provides guidance for how uncertain tax positions should be recognized, measured, presented and disclosed in the financial statements. FASB ASC Topic 740 requires the affirmative evaluation of tax positions taken or expected to be taken in the course of preparing each Fund’s tax return to determine whether it is more-likely-than-not (i.e., greater than 50-percent) that each tax position will be sustained upon examination by a taxing authority based on the technical merits of the position. A tax position that meets the more-likely-than-not recognition threshold is measured to determine the amount of benefit to recognize in the financial statements. Differences between tax p ositions taken in a tax return and amounts recognized in the financial statements will generally result in an increase in a liability for taxes payable (or a reduction of a tax refund receivable), including the recognition of any related interest and penalties as an operating expense. FASB ASC Topic 740 includes a review of tax positions taken in tax years that remain subject to examination by all major tax jurisdictions, including federal and the State of Nebraska (e.g., the last four tax year ends and the interim tax period since then). Management believes that there is no tax liability resulting from unrecognized tax benefits related to uncertain tax positions taken.
7. Regulatory Matters
As disclosed in the 2006 Annual Report, the U.S. Securities and Exchange Commission conducted an examination of FNB related to past payments of certain marketing and other expenses. Subsequently, FNB agreed to pay the Funds $313,681, which was paid in December 2007. This amount was allocated to each Fund based on the average net assets of the Fund on the date of the distribution. The impact to the total return, net expense ratio and net income ratio are disclosed in the Financial Highlights.
8. Subsequent Events
Management has evaluated subsequent events for the Funds through the date the financial statements are available to be issued and has concluded there are no events that require adjustments to the financial statements.
At a special shareholder meeting held on May 3, 2010, the shareholders approved the following proposals effective May 3, 2010:
| (1) | A new investment advisory agreement (the “New Investment Advisory Agreement”) between the Company, on behalf of each Fund, and Tributary Capital Management, LLC which is a reorganization of Tributary and FNB (“New Tributary”); |
| (2) | A new sub-advisory agreement (the “New First National Sub-Advisory Agreement”) between New Tributary and First National Fund Advisors (“FNFA”), a newly-formed division of First National Bank in Fort Collins, Colorado (“FNBFC”), with respect to the Balanced Fund; |
| (3) | A new sub-advisory agreement (the “New KBCAM Sub-Advisory Agreement”) between New Tributary and KBCAM, with respect to the International Equity Fund; |
| (4) | A new sub-advisory agreement (the “New Riverbridge Sub-Advisory Agreement”) between New Tributary and Riverbridge, with respect to the Large Cap Growth Fund; and |
| (5) | The Board’s ability to change the name of the Company and the Funds effective August 1, 2010, as follows: |
| Existing Name | New Name | |
| First Focus Funds, Inc. | Tributary Funds, Inc. | |
| First Focus Short-Intermediate Bond Fund | Tributary Short-Intermediate Bond Fund | |
| First Focus Income Fund | Tributary Income Fund | |
| First Focus Balanced Fund | Tributary Balanced Fund | |
| First Focus Core Equity Fund | Tributary Core Equity Fund | |
| First Focus Large Cap Growth Fund | Tributary Large Cap Growth Fund | |
| First Focus Growth Opportunities Fund | Tributary Growth Opportunities Fund |
52
NOTES TO FINANCIAL STATEMENTS (concluded)
March 31, 2010
| Existing Name | New Name | |
| First Focus Small Company Fund | Tributary Small Company Fund | |
First Focus International Equity Fund | Tributary International Equity Fund |
Under the New Investment Advisory Agreement, the advisory fee rates paid by each of the Funds to New Tributary, the new investment adviser, are the same investment adviser fees effective at March 31, 2010. Under the New Riverbridge Sub-Advisory Agreement, the annual sub-advisory fees paid by New Tributary to the sub-adviser, are 0.45% of the Balanced Fund’s average daily net assets. Under the New KBCAM Sub-Advisory Agreement, the sub-advisory fees paid by New Tributary to the sub-adviser for the International Equity Fund are the same fees FNB paid KBCAM effective at March 31, 2010. Under the New First National Sub-Advisory Agreement, the sub advisory fees paid by New Tributary to the sub-adviser for the Large Cap Growth Fund are the same fees FNB paid Riverbridge effective at March 31, 2010. The new adviser and sub-advisers contractually agreed to waive the same fees effective at March 31, 2010. Refer to Note 3, “Related Party Transactions and Fees and Agreements”, for fees and waivers effective at March 31, 2010.
At its meeting on May 19, 2010, the Board adopted a resolution changing the dividend policy such that income distributions for the Core Equity Fund, Large Cap Growth Fund and Small Company Fund will be declared and paid on an annual basis instead of a monthly basis.
53
Report of Independent Registered Public Accounting Firm
The Board of Directors and Shareholders of
First Focus Funds, Inc.:
We have audited the accompanying statements of assets and liabilities of First Focus Funds, Inc. – Short-Intermediate Bond Fund, Income Fund, Balanced Fund, Core Equity Fund, Large Cap Growth Fund, Growth Opportunities Fund, Small Company Fund, and International Equity Fund (the Funds), including the schedules of portfolio investments, as of March 31, 2010, and the related statements of operations for the year then ended, the statements of changes in net assets for each year in the two-year period then ended, and the financial highlights for each period in the five-year period then ended. These financial statements and financial highlights are the responsibility of the Funds’ management. Our responsibility is to express an opinion on these financial statements and financial highlights based on our audits.
We conducted our audits in accordance with the standards of the Public Company Accounting Oversight Board (United States). Those standards require that we plan and perform the audit to obtain reasonable assurance about whether the financial statements and financial highlights are free of material misstatement. An audit includes examining, on a test basis, evidence supporting the amounts and disclosures in the financial statements. Our procedures included confirmation of securities owned as of March 31, 2010, by correspondence with custodians and brokers; where replies were not received from brokers, we performed other audit procedures. An audit also includes assessing the accounting principles used and significant estimates made by management, as well as evaluating the overall financial statement presentation. We believe that our audits provide a reasonable basis for our opinion.
In our opinion, the financial statements and financial highlights referred to above present fairly, in all material respects, the financial position of the Funds as of March 31, 2010, the results of their operations for the year then ended, the changes in its net assets for each year in the two-year period then ended, and the financial highlights for each period in the five-year period then ended, in conformity with U.S. generally accepted accounting principles.
KPMG LLP
Columbus, Ohio
May 24, 2010
54
ADDITIONAL FUND INFORMATION (UNAUDITED)
March 31, 2010
Proxy Voting Policy
Information regarding the policies and procedures that the Funds use to determine how to vote proxies relating to portfolio securities is available without charge, upon request, by calling 1-800-662-4203. The information also is included in the Company’s Statement of Additional Information, which is available on the Fund’s website at www.firstfocusfunds.com and on the Securities and Exchange Commission’s website at www.sec.gov.
Information relating to how each fund voted proxies relating to portfolio securities held during the most recent twelve months ended June 30 is available by writing to the Company at P.O. Box 219022, Kansas City, Missouri, 64141-6002, by calling 1-800-662-4203 and on the Securities and Exchange Commission’s website at www.sec.gov.
Quarterly Holdings
The Company files a complete list of its portfolio holdings with the Securities and Exchange Commission for the first and third quarters of each fiscal year on Form N-Q. Forms N-Q are available free of charge on the Securities and Exchange Commission’s website at http://www.sec.gov or may be reviewed and copied at the Commission’s Public Reference Room in Washington, D.C. Information on the operation of the Public Reference Room may be obtained by calling 1-800-SEC-0330.
Other Federal Income Tax Information
For the year ended March 31, 2010, the Funds had no long-term capital gain distributions.
For the year ended March 31, 2010, certain dividends paid by the Funds may be subject to a maximum tax rate of 15% as provided for by the Jobs and Growth Tax Relief Reconciliation Act of 2003. The Funds intend to designate the maximum amount allowable as taxed at a maximum rate of 15%. Complete information will be reported in conjunction with your 2010 Form 1099-DIV.
For the year ended March 31, 2010, the following percentages of the total ordinary income distributions paid by the following Funds during the year represent qualified dividend income:
| Qualified | ||
| Dividend Income | ||
| Balanced Fund | 62.82 | % |
| Core Equity Fund | 100.00 | % |
| Large Cap Growth Fund | 100.00 | % |
| Small Company Fund | 100.00 | % |
| International Equity Fund | 100.00 | % |
The International Equity Fund intends to elect to pass through to shareholders the taxes paid to foreign countries. Foreign source income and foreign tax per outstanding share on March 31, 2010 are as follows:
| Foreign | Foreign | |
| Source Income | Tax Expense | |
| International Equity Fund | $ 0.03 | $ 0.02 |
The pass-through of the foreign taxes paid will only affect those persons who are shareholders on the dividend record date in December 2010. These shareholders will receive more detailed information along with their 2010 Form 1099-DIV.
55
ADDITIONAL FUND INFORMATION (UNAUDITED) (continued)
March 31, 2010
The following Funds designates the following percentage of distributions eligible for the dividends received deduction for corporations:
| Dividends | ||
| Received | ||
| Deduction | ||
| Balanced Fund | 53.14 | % |
| Core Equity Fund | 100.00 | % |
| Large Cap Growth Fund | 100.00 | % |
| Small Company Fund | 100.00 | % |
Table of Shareholder Expenses
As a shareholder of the Funds, you incur ongoing costs, including management fees, distribution fees and other Fund expenses. This example is intended to help you understand your ongoing costs (in dollars) of investing in the Funds and to compare these costs with the ongoing costs of investing in other mutual funds.
The example is based on an investment of $1,000 invested at the beginning of the period and held for the entire period from October 1, 2009 through March 31, 2010.
Actual Expenses
The table below provides information about actual account values and actual expenses. You may use the information below, together with the amount you invested, to estimate the expenses that you paid over the period. Simply divide your account value by $1,000 (for example, an $8,600 account value divided by $1,000 = 8.6), then multiply the result by the number in the table under the heading entitled “Expenses Paid During Period” to estimate the expenses you paid on your account during this period.
| Beginning | Ending | Expense Paid | Expense Ratio | |||||
Account Value Account Value | During Period* | During Period** | ||||||
| 10/1/09 | 3/31/10 | 10/1/09 - 3/31/10 | 10/1/09 - 3/31/10 | |||||
| Short-Intermediate Bond Fund | $1,000.00 | $1,027.00 | $4.40 | 0.87 | % | |||
| Income Fund | 1,000.00 | 1,037.20 | 4.01 | 0.79 | ||||
| Balanced Fund | 1,000.00 | 1,126.70 | 7.26 | 1.37 | ||||
| Core Equity Fund | 1,000.00 | 1,100.50 | 6.13 | 1.17 | ||||
| Large Cap Growth Fund | 1,000.00 | 1,106.10 | 6.93 | 1.32 | ||||
| Growth Opportunities Fund | 1,000.00 | 1,162.80 | 6.31 | 1.17 | ||||
| Small Company Fund | 1,000.00 | 1,149.30 | 7.13 | 1.33 | ||||
| International Equity Fund | 1,000.00 | 1,036.20 | 7.36 | 1.45 | ||||
* Expenses are equal to the average account value times the Fund’s annualized expense ratio multiplied by the number of days in the most
recent fiscal half-year divided by the number of days in the fiscal year.
**Annualized.
Hypothetical Example for Comparison Purposes
The table below provides information about hypothetical account values and hypothetical expenses based on each of the First Focus Fund’s actual expense ratio and an assumed rate of return of 5% per year before expenses, which is not the Fund’s actual return. The hypothetical account values and expenses may not be used to estimate the actual ending account balance or expenses you paid for the period. You may use this information to compare this 5% hypothetical example with the 5% hypothetical examples that appear in the shareholder reports of other funds.
56
ADDITIONAL FUND INFORMATION (UNAUDITED) (concluded)
March 31, 2010
Please note that the expenses shown in the table are meant to highlight your ongoing costs only and will not help you determine the relative total costs of owning different funds.
| Beginning | Ending | Expense Paid | Expense Ratio | |||||
Account Value Account Value | During Period* | During Period** | ||||||
| 10/1/09 | 3/31/10 | 10/1/09 - 3/31/10 | 10/1/09 - 3/31/10 | |||||
| Short-Intermediate Bond Fund | $1,000.00 | $1,020.59 | $4.38 | 0.87 | % | |||
| Income Fund | 1,000.00 | 1,020.98 | 3.98 | 0.79 | ||||
| Balanced Fund | 1,000.00 | 1,018.11 | 6.89 | 1.37 | ||||
| Core Equity Fund | 1,000.00 | 1,019.10 | 5.89 | 1.17 | ||||
| Large Cap Growth Fund | 1,000.00 | 1,018.35 | 6.64 | 1.32 | ||||
| Growth Opportunities Fund | 1,000.00 | 1,019.11 | 5.89 | 1.17 | ||||
| Small Company Fund | 1,000.00 | 1,018.29 | 6.69 | 1.33 | ||||
| International Equity Fund | 1,000.00 | 1,017.68 | 7.29 | 1.45 | ||||
* Expenses are equal to the average account value times the Fund’s annualized expense ratio multiplied by the number of days in the most recent fiscal half-year divided by the number of days in the fiscal year.
**Annualized.
57
Advisory and Sub-Advisory Agreement Approval (UNAUDITED)
March 31, 2010
On February 24, 2010, the Board of the Company, including all of the Directors who are not parties to any of the investment advisory or sub-advisory agreements for the Company or “interested persons,” as that term is defined in the Investment Company Act of 1940, as amended (the “1940 Act”) of any party to such agreements (the “Independent Directors”) approved (i) an Investment Advisory Agreement dated May 3, 2010, between the Funds and Tributary Capital Management, LLC (“Tributary”), the investment adviser of the Funds; (ii) an Investment Sub-Advisory Agreement dated May 3, 2010, between Tributary and KBC Asset Management International Limited (“KBC”), the investment sub-adviser of the International Equity Fund; (iii) an Investment Sub-Advisory Agreement dated May 3, 2010, between Trib utary and Riverbridge Partners, LLC (“Riverbridge”), the investment sub-adviser for the Large Cap Growth Fund; and (iv) an Investment Sub-Advisory Agreement dated May 3, 2010, between Tributary and First National Bank (Fort Collins), doing business as First National Fund Advisers (“FNFA”), the investment sub-adviser of the Balanced Fund. When considering the agreements noted above, the Board also considered the internal reorganization at First National of Nebraska, Inc. (“FNNI”), the parent company to the Funds’ existing advisers (the “Reorganization”). The investment advisory and sub-advisory contracts considered and approved by the Board were submitted to and approved by a majority of the outstanding voting securities (as that term is defined in the 1940 Act) of each Fund at the Special Meeting of Shareholders of the Funds held on May 3, 2010.
Tributary Capital Management, LLC
In its deliberations, the Board did not identify any single piece of information that was controlling or determinative for its decision respecting the investment advisory agreement with Tributary. However, the following are the Board’s conclusions respecting the material factors the Board considered when approving the investment advisory agreement with Tributary.
Nature, Extent and Quality of Services to be Provided by the Investment Adviser. The Board received and considered a variety of information pertaining to the nature, extent, and quality of services to be provided by the reorganized Tributary following the Reorganization (“New Tributary”). The Board recognized that New Tributary would remain the investment adviser to the existing Tributary-advised Funds, and that KBC and Riverbridge would (subject to approval later on at the meeting) continue to sub-advise the First Focus International Equity Fund and the First Focus Large Cap Growth Fund, respectively. Accordingly, the Board paid particular attention to the impact that the Reorganization would have on the management of the First Focus Short-Inte rmediate Bond Fund, the First Focus Income Fund, the First Focus Core Equity Fund, the First Focus Large Cap Growth Fund, the First Focus Small Company Fund, and the First Focus International Equity Fund (the Funds not previously advised by Tributary). Representatives of Tributary and FNB Advisers discussed with the Board the philosophy of management, performance expectations, and methods of operation of FNB Advisers insofar as they related to the Company and indicated their belief that, as a consequence of the Reorganization, the resources of New Tributary would enhance the operations and service capabilities of New Tributary. In its review of the nature, extent, and quality of services to be provided by New Tributary to the Funds, the Board also considered the following:
| · | The professional qualifications and experience of the portfolio management teams for each of the Funds are expected to remain in place following the closing of the Reorganization. |
| · | The overall high quality of the personnel, operations, financial condition, investment management capabilities, methodologies, and performance of New Tributary should benefit the Funds following the closing of the Reorganization. |
| · | New Tributary’s organization, resources, and research capabilities will be substantially identical with those of FNB Advisers. |
| · | There is an apparent absence of potential conflicts of interest in having New Tributary serve as the sole investment adviser to the Funds. |
| · | New Tributary will not be bound by any capital limitations of its former direct parent company, which the Board believes could allow New Tributary to offer additional advisory services to benefit the Company and the Funds. |
| · | The Board found no material compliance, regulatory, or litigation concerns, and the Board reviewed New Tributary’s compliance strategies and found them in line with those of FNB Advisers and Tributary. The Board confirmed that New Tributary has adopted and maintained written procedures, which are in accordance with the Investment Advisers Act of 1940, as amended (“Advisers Act”), and consistent with the standards set forth in the 1940 Act. |
| · | New Tributary’s portfolio transaction execution and soft dollar policies and practices are consistent with those currently followed by FNB Advisers and Tributary. |
| · | New Tributary’s operations and facilities would include the current operations and facilities of FNB Advisers. |
| · | New Tributary’s policies and procedures for allocating transactions among accounts would remain consistent with those currently followed by FNB Advisers and Tributary. |
58
Advisory and Sub-Advisory Agreement Approval (UNAUDITED) (continued)
March 31, 2010
| · | The range of New Tributary’s service offerings, including investment analysis, investment management, trading of portfolio securities, proxy voting, valuation of portfolio securities, administering the Funds’ business affairs, and providing accounting, legal, compliance, record-keeping, and related services, would remain consistent with those currently provided by FNB Advisers and Tributary. |
After reviewing this information and discussing it with representatives of Tributary and FNB Advisers, the Board concluded that it was satisfied with the nature, extent, and quality of the services to be provided by New Tributary. In particular, the Board determined that the FNB- Advised Funds would benefit from having New Tributary serve as their investment adviser, as a result of the greater depth of the portfolio management team and greater distribution opportunities.
Investment Performance. The Board received information regarding the performance of Funds currently managed by Tributary and FNB Advisers. Because of the combination of personnel and resources at the closing of the Reorganization, the Board determined that the investment experience of New Tributary would be sufficient to sustain, and even improve, the investment performance of the Funds currently managed by FNB Advisers and Tributary separately. The Board noted that the investment objective and principal investment strategies of each Fund are expected to continue substantially unchanged. The Board also noted that the investment performance of each Fund for the three months and year ended December 31, 2009, had been comparable to, and in some case s exceeded, fund indices for the same periods.
Cost of Services Provided and Profitability. The Board considered projected assets under management of New Tributary and determined that, based on the limited size of assets under management, fee breakpoints were not justified. The Directors reviewed and considered the advisory fee that would be payable by each Fund to New Tributary in light of the nature, extent, and quality of the management services expected to be provided by New Tributary, including any fee waivers and/or expense reimbursement arrangements currently in place and expected to continue following the closing of the Reorganization. The Board noted that all current advisory fees, which the Board had previously determined to be fair and reasonable, were expected to continue at their existing r ates. The Board also noted that all current fee waivers were also expected to continue following the closing of the Reorganization. Additionally, the Directors received and considered information comparing each Fund’s advisory fees and overall expenses with those of comparable funds. The Board considered that other investment advisers managing certain other mutual funds with similar investment objectives or principal investment strategies as the Funds may charge lower management fees than those proposed by New Tributary. The Board also considered New Tributary’s projected and historical revenues, costs, assets, liabilities, and profitability in relation to the fees payable to New Tributary following the closing of the Reorganization. The Board noted that New Tributary, not the Funds or the Company, would pay the sub-advisory fees to KBC, Riverbridge and FNFA.
The Board also evaluated New Tributary’s proposed method for determining compensation for each portfolio manager. It was determined that following the Reorganization, New Tributary will pay portfolio managers a fixed salary based upon experience and market norms. Further, it was determined that participation in the parent organization’s defined contribution (401k) plan is voluntary and each portfolio manager is eligible to receive a bonus, which is paid annually and calculated as a percentage of base salary and is dependent upon Fund pre-tax performance versus Fund benchmarks.
Based on the foregoing information, the Board concluded that the proposed advisory fees and total expenses to be borne by the Funds under the investment advisory agreement with Tributary are reasonable in relation to the services to be provided, and that the investment adviser’s level of profitability from its proposed investment advisory agreement with Tributary with the Funds also was reasonable. Additionally, given the nature and quality of New Tributary’s expected services, the benefits expected to be received by the Funds, and the nature and extent of expected non-advisory services offered by New Tributary, the Board found New Tributary’s proposed fee acceptable.
Economies of Scale. The Board considered a variety of other benefits to be realized by New Tributary as a result of New Tributary’s relationship with the Funds, including fees for administrative services provided for the benefit of certain Funds. The Board has reviewed New Tributary’s portfolio trading practices and evaluated them in light of the current practices of the Current Advisers. The Board took these ancillary benefits into account in evaluating the reasonableness of the advisory fees paid to New Tributary. The Board also noted that New Tributary may realize modest economies of scale based on the Reorganization and synergies of operations, but noted that the small number of investment professionals and limited amount of asset s under management would allow for very few economies of scale from the Reorganization.
Adviser Financial Information. The Board reviewed information regarding New Tributary’s projected costs of providing services to the Funds, including personnel, systems, and the resources of investment, compliance, trading, accounting, and other administrative operations. It considered New Tributary’s projected costs and willingness to invest in technology, infrastructure, and staff to maintain and expand services and capabilities, respond to industry and regulatory developments, and attract and retain qualified personnel. It noted information received regarding the compensation structure for New Tributary’s investment professionals. The Board noted the competitiveness and cyclicality of both the mutual fund industry and the capital market s, and the importance to the Funds in that environment of New Tributary’s long-term profitability for maintaining its independence, company culture, and management continuity. The Board concluded that the Funds’ advisory fee structures under the investment advisory agreement with Tributary reflected a reasonable sharing of benefits between New Tributary and the Funds’ shareholders. The Board also considered the financial capabilities and balance sheet of, New Tributary's respective direct and indirect owners. Based on that information and the
59
Advisory and Sub-Advisory Agreement Approval (UNAUDITED) (continued)
March 31, 2010
historical financial stability of New Tributary parent company as it relates to the previous operations of FNB Advisers and Tributary, the Board concluded that New Tributary would be sufficiently capitalized to satisfy its obligations to the Funds.
Employment Arrangements. The Board also considered the consistency of the portfolio managers following the Reorganization. It was determined that as a result of the Reorganization, personnel of FNB Advisers who currently manage FNB-Advised Funds are expected to continue managing these Funds as personnel of New Tributary. Further, the Board considered that New Tributary does not intend to make any material changes to Tributary’s or FNB Advisers’ human or other resources that would adversely impact New Tributary’s ability to provide the same quality of advisory services that it has provided in the past. Finally, the Board considered its familiarity and relationships with the existing portfolio managers of the Funds and its satisfa ction with the experience and qualifications of such portfolio managers.
Legal Considerations. Based on information provided by Tributary and its independent counsel, the Board believes applicable federal and state legal requirements will continue to be satisfied after the Reorganization. The Board conducted a review of New Tributary and its affiliates’ history of regulatory compliance and found the results to be satisfactory. The Board also considered Tributary’s prior ability to satisfy compliance obligations. Additionally, the Board reviewed Tributary’s current Code of Ethics and found no material discrepancies between it and FNB’s existing Code of Ethics. The Board is not aware of any pending or anticipated legal proceedings or investigations involving Tributary or its affiliates .
Other Considerations. Because the Board noted the current investment advisory agreements and the investment advisory agreement with Tributary are substantially identical, the Board also considered the information that had been received, the factors that had been identified, and the conclusions that had been reached by the Board in connection with its most recent approval or continuance of each Fund’s current investment advisory agreement. The Board also identified and considered the benefits that are anticipated to accrue to Tributary because of its relationship with the Funds. It was determined that such benefits include greater assets under management, resulting in recruiting high quality staff, supporting research services, more favorable commissio n rates, and enhanced marketing.
Based on the Board’s deliberations and its evaluation of the information described above, the Board, including its Independent Directors, concluded that the terms of the investment advisory agreement with Tributary are fair and reasonable and concluded that the fees to be charged by Tributary under its agreement are reasonable in light of the services that Tributary provides to the Funds it advises.
KBC Asset Management International Limited
In its deliberations, the Board did not identify any single piece of information that was controlling or determinative for its decision respecting the investment sub-advisory agreement with KBC. However, the following are the Board’s conclusions respecting the material factors the Board considered when approving the investment sub-advisory agreement with KBC.
Nature, Extent, and Quality of Services to be Provided by KBC. The Board received and considered a variety of information pertaining to the nature, extent, and quality of services to be provided by KBC under the investment sub-advisory agreement with KBC. The Board reviewed biographical information for each portfolio manager employed by KBC who would be providing services under the investment sub-advisory agreement with KBC and noted the breadth and depth of experience presented. The Board evaluated the nature, quality, and extent of KBC’s services, including its reputation, expertise, and resources in international financial markets. The Board noted the apparent absence of potential conflicts of interest. The Board also evaluate d KBC’s organization, resources, and research capabilities, which the Board noted would not change under the investment sub-advisory agreement with KBC. The Board also reviewed KBC’s portfolio transaction execution and soft dollar policies and practices, which the Board found consistent with those currently followed by KBC. The Board found KBC’s policies and procedures for allocating transactions among accounts to be consistent with those currently followed by KBC.
Investment Performance. The Board was provided with a comparison of the International Equity Fund’s performance with that of a Lipper peer group identified by KBC of substantially similar mutual funds and concluded that the Fund’s performance was in line with its peer group for the one-year, five-year and ten-year periods. In addition, the Board determined that the Fund performed in line with its stated benchmark, the MSCI EAFE Index.
Cost of Services Provided and Profitability. The Board reviewed the rate of KBC’s sub-advisory fee in relation to the nature, extent, and quality of services to be provided by KBC, based on the financial information provided by KBC. The Board compared the International Equity Fund’s advisory fees and total expense ratios to those of a peer group of substantially similar mutual funds. The Board noted that KBC did not employ breakpoints in their fee arrangements, which would benefit shareholders as the International Equity Fund grew. However, KBC had voluntarily waived a portion of its fee in order to keep total expenses down, and the Board expected this fee waiver to continue following the closing of the Reorganization. Base d on the information provided to the Board, the Board determined that the sub-advisory fee payable to KBC is fair and reasonable in light of the services to be provided, the profitability of KBC’s relationship with the International Equity Fund, and the comparability of the proposed fee to fees paid by similar mutual funds. The Board also noted that KBC’s sub-advisory fee under the investment sub-advisory agreement with KBC did not increase current sub-advisory fees or overall operating expenses of the International Equity Fund over historical fee and expense levels.
60
Advisory and Sub-Advisory Agreement Approval (UNAUDITED) (continued)
March 31, 2010
Economies of Scale. The Board noted that KBC’s total assets under management, and current economies of scale, will not change as a result of the Reorganization and the investment sub-advisory agreement with KBC. Accordingly, the Board determined that utilizing a breakpoint system in the Fund’s fee structure to account for economies of scale would not be appropriate at this time.
Employment Arrangements. The Board considered KBC’s current personnel, as well as its plans for attracting and retaining high quality investment professionals and concluded that KBC was successful in recruiting high-quality investment professionals given their location, culture and compensation structure.
Legal Consideration. The Board reviewed KBC’s compliance program, including the procedures adopted and maintained by KBC. The Board noted that these procedures were in accordance with the Advisers Act, and that the compliance program was generally consistent with the standard set forth under the 1940 Act. The Board also reviewed KBC’s Code of Ethics, which the Board found generally in line with the Code of Ethics of other investment advisers, including that of New Tributary.
Other Considerations. The Board noted that there are no other tangible benefits to KBC in providing investment sub-advisory services to the International Equity Fund, other than the fee to be earned under the investment sub-advisory agreement with KBC. There may be certain intangible benefits gained to the extent that serving the Fund could enhance KBC’s reputation in the marketplace, and, therefore, would enable it to attract additional client relationships.
Based on the Board’s deliberations and its evaluation of the information described above, the Board, including its Independent Directors, concluded that the terms of the investment sub-advisory agreement with KBC are fair and reasonable and concluded that the fees to be charged by KBC under its agreement are reasonable in light of the services that KBC provides to the International Equity Fund.
Riverbridge Partners, LLC
In its deliberations, the Board did not identify any single piece of information that was controlling or determinative for its decision respecting the investment sub-advisory agreement with Riverbridge. However, the following are the Board’s conclusions respecting the material factors the Board considered when approving the investment sub-advisory agreement with Riverbridge.
Nature, Extent, and Quality of Services to be Provided by Riverbridge. The Board received and considered a variety of information pertaining to the nature, extent, and quality of services to be provided by Riverbridge under the investment sub-advisory agreement with Riverbridge. The Board reviewed biographical information for each portfolio manager employed by Riverbridge who would be providing services under the investment sub-advisory agreement with Riverbridge and noted the breadth and depth of experience presented. The Board evaluated the nature, quality, and extent of Riverbridge’s services, including its reputation, expertise, and resources in domestic financial markets. The Board noted the apparent absence of potential conflicts of i nterest. The Board also evaluated Riverbridge’s organization, resources, and research capabilities, which the Board noted would not change with the adoption of the investment sub-advisory agreement with Riverbridge. The Board also reviewed Riverbridge’s portfolio transaction execution and soft dollar policies and practices, which the Board found would not change. The Board found Riverbridge’s policies and procedures for allocating transactions among accounts to be consistent with those currently followed by Riverbridge.
Investment Performance. The Board was provided with a comparison of the Large Cap Growth Fund’s performance with that of a Lipper peer group of substantially similar investment companies identified by Riverbridge, and concluded that the Fund performed in the top quartile of its peer group for the one-year period. It was determined that the Fund has not reached the three-year anniversary, so the Board could not evaluate that performance timeframe.
Cost of Services Provided and Profitability. The Board reviewed the rate of Riverbridge’s sub-advisory fee in relation to the nature, extent, and quality of services to be provided by Riverbridge, based on the financial information provided by Riverbridge. The Board evaluated the Large Cap Growth Fund’s advisory fees and total expense ratios to those of a peer group of substantially similar investment companies. The Board noted that Riverbridge had voluntarily waived a portion of its fee, which brought it below the Lipper peer group average. Riverbridge’s fee waiver is expected to continue following the closing of the Reorganization. Based on the information provided to the Board, the Board determined that the sub-adv isory fee payable to Riverbridge is fair and reasonable in light of the services to be provided, the profitability of Riverbridge’s relationship with the Large Cap Growth Fund, and the comparability of the proposed fee to fees paid by similar investment companies. The Board also noted that Riverbridge’s sub-advisory fee under the investment sub-advisory agreement with Riverbridge did not increase current sub-advisory fees or overall operating expenses of the Large Cap Growth Fund over historical fee and expense levels.
Economies of Scale. The Board noted that Riverbridge’s total assets under management, and current economies of scale, will not change as a result of the Reorganization and the investment sub-advisory agreement with Riverbridge. Accordingly, the Board determined that utilizing a break point system in the Fund’s fee structure to account for economies of scale would not be appropriate at this time.
61
Advisory and Sub-Advisory Agreement Approval (UNAUDITED) (continued)
March 31, 2010
Employment Arrangements. The Board considered Riverbridge’s current personnel, as well as its plans for attracting and retaining high quality investment professionals, and concluded since all members of the investment team are owners of the company, that Riverbridge therefore has a firm commitment to the longevity of the organization.
Legal Consideration. The Board reviewed Riverbridge’s compliance program, including the procedures adopted and maintained by Riverbridge. The Board noted that these procedures were in accordance with the Advisers Act, and that the compliance program was generally consistent with the standard set forth under the 1940 Act. The Board also reviewed Riverbridge’s Code of Ethics, which the Board found generally in line with the Code of Ethics of other investment advisers to the Funds, including that of New Tributary.
Other Considerations. The Board noted that there are no other tangible benefits to Riverbridge in providing investment sub-advisory services to the Large Cap Growth Fund, other than the fee to be earned under the investment sub-advisory agreement with Riverbridge. Further, the Board noted that there may be certain intangible benefits gained to the extent that serving the Fund could enhance Riverbridge’s reputation in the marketplace, and, therefore, would enable it to attract additional client relationships.
Based on the Board’s deliberations and its evaluation of the information described above, the Board, including its Independent Directors, concluded that the terms of the investment sub-advisory agreement with Riverbridge are fair and reasonable and concluded that the fees to be charged by Riverbridge under its agreement are reasonable in light of the services that Riverbridge provides to the Large Cap Growth Fund.
First National Fund Advisers
In its deliberations, the Board did not identify any single piece of information that was controlling or determinative for its decision respecting the investment sub-advisory agreement with FNFA. However, the following are the Board’s conclusions respecting the material factors the Board considered when approving the investment sub-advisory agreement with FNFA.
Nature, Extent, and Quality of Services to be Provided by FNFA. The Board received and considered a variety of information pertaining to the nature, extent, and quality of services to be provided by FNFA under the investment sub-advisory agreement with FNFA. The Board reviewed biographical information for each portfolio manager to be employed by FNFA following the closing of the Reorganization who would be providing services under the investment sub-advisory agreement with FNFA and noted the breadth and depth of experience presented. The Board evaluated the nature, quality, and extent of FNFA’s services, including its expertise, and resources in domestic financial markets. The Board noted the apparent absence of potential conflicts of inter est. The Board also evaluated FNFA’s organization, resources, and research capabilities, which the Board noted were consistent with those of Tributary. Because FNFA is a newly formed entity, the Board requested and evaluated FNFA’ organizational documents, including its proposed registration with the U.S. Securities and Exchange Commission, which it found acceptable. The Board also reviewed FNFA’s portfolio transaction execution and soft dollar policies and practices, which the Board found consistent with those followed by Tributary. The Board found FNFA’s policies and procedures for allocating transactions among accounts to be consistent with those currently followed by Tributary. The Board reviewed the profit and loss statement of FNFA and determined it is financially sound and capable of fulfilling its obligations under the investment sub-advisory agreement with FNFA. It was noted that Kurt Spieler has been Managing Director of current Tributary and will continue to manage FNFA providing no change in management.
Investment Performance. The Board noted that all of FNFA’s investment strategies will be team managed and noted FNFA’s focus on using data, technology, and sophisticated analytical methods to evaluate and project expected returns. The Board recognized that the investment objective and principal investment strategies of the Balanced Fund are expected to continue substantially unchanged under the investment sub-advisory agreement with FNFA. The Board believes clarifying the responsibility for the Balanced Fund’s investment performance will produce greater accountability to the Balanced Fund’s shareholders. The Board also reviewed the Lipper “peer group” identified by FNFA as an appropriate benchmark for evaluatin g the performance to be achieved by FNFA for the Balanced Fund. The Board concluded that the Balanced Fund ranked highly in its peer group for the one-year, three-year, five-year and ten-year periods, ranking first in the group for the ten-year period ended December 31, 2009.
Cost of Services Provided and Profitability. The Board reviewed the rate of FNFA’s sub-advisory fee in relation to the nature, extent, and quality of services to be provided by FNFA, based on the financial projections provided by FNFA. The Board noted the consistency of the proposed sub-advisory fees with current sub-advisory fees charged by similar sub-advisers for comparable funds with comparable objectives. It was determined that New Tributary, not the Balanced Fund or the Company, will pay the sub-advisory fee to FNFA.
The Board also considered FNFA’s method for determining the compensation of each portfolio manager. The Board noted that the compensation program is a combination of base salary and a performance bonus. Further, the Board noted that the percentage of each piece of the compensation program varies by investment professional. It was determined that in terms of the base salary and performance bonus, approximately 70% of the compensation is salary with the remaining 30% based on relative investment performance. It was also determined that the investment performance portion is based on a rolling one-year (50%) and three-year (50%) relative performance versus the respective peer group. Further, the Board noted for the Balanced Fund, the peer group is the Morningstar Moderate Allocation Category. The Board determined that the performance bonus payout is based on a sliding scale with 0% for average performance and a maximum payout at top twentieth percentile performance. The Board noted that
62
Advisory and Sub-Advisory Agreement Approval (UNAUDITED) (concluded)
March 31, 2010
the compensation program is not based on the value of the assets in the Fund. The Board found this method to be consistent with methodologies used by current investment advisers to the Funds.
Economies of Scale. The Board noted that FNFA is not projected to achieve economies of scale in connection with, or immediately following, the Reorganization. Accordingly, the Board determined that utilizing a break point system in the Balanced Fund’s fee structure to account for economies of scale would not be appropriate at this time.
Employment Arrangements. The Board considered FNFA’s current personnel, as well as its plans for attracting and retaining high quality investment professionals. The Board discussed the plan for the day-to-day management of the Balanced Fund and the co-managers responsible for the Balanced Fund and their respective roles.
Legal Consideration. The Board reviewed FNFA’s compliance program, including the procedures to be adopted and maintained by FNFA. The Board noted that these procedures were in accordance with the Advisers Act and that the compliance program was generally consistent with the standard set forth under the 1940 Act. The Board also reviewed FNFA’s Code of Ethics, which the Board found consistent with the Code of Ethics of other investment advisers, including that of New Tributary. The Board also considered the internal controls that FNFA intends to establish, which include compliance policies and procedures, on-going training, and an on-site Chief Compliance Officer, Celeste Blackburn, CFA. The Board is not aware of any pending or anticipated legal proceedings or investigations involving FNFA.
Other Considerations. The Board noted that there are no other tangible benefits to FNFA in providing investment advisory services to the Balanced Fund, other than the fee to be earned under the investment sub-advisory agreement with FNFA. Further, the Board noted that there may be certain intangible benefits gained to the extent that serving the Fund could enhance FNFA’s reputation in the marketplace, and, therefore, would enable it to attract additional client relationships.
Based on the Board’s deliberations and its evaluation of the information described above, the Board, including its Independent Directors, concluded that the terms of the investment sub-advisory agreement with FNFA are fair and reasonable and concluded that the fees to be charged by FNFA under its agreement are reasonable in light of the services that FNFA provides to the Balanced Fund.
63
[THIS PAGE INTENTIONALLY LEFT BLANK]
64
DIRECTORS AND OFFICERS
March 31, 2010
Overall, responsibility for management of the Company rests with its Board, which is elected by the shareholders of the Company. The Company is managed by the Directors in accordance with the laws governing corporations in Nebraska. The Board oversees all of the Funds. Directors serve until their respective successors have been elected and qualified or until their earlier death, resignation or removal. The Directors elect the officers of the Company to supervise its day-to-day operations.
Information about the Directors and officers of the Company is set forth below. The Funds’ Statement of Additional Information includes additional information about the Directors and is available, without charge, upon request, by calling 1-800-662-4203.
Name, Address1, Age, and Position(s) Held with Funds | Term of Office and Length of Time Served | Principal Occupation(s) During Past 5 Years | Number of Portfolios in Fund Complex Overseen by Director | Other Directorships Held by Director | ||
| Independent Directors | ||||||
Robert A. Reed Age 70 Director | Indefinite; Since 1994. | President and Chief Executive Officer, Physicians Mutual Insurance Company and Physicians Life Insurance Company (1974 – present). | 8 | None. | ||
Gary D. Parker Age 65 Director | Indefinite; Since 2004. | Retired. Chief Executive Officer and Chairman, Lindsay Manufacturing Co., a publicly owned Manufacturer of farm irrigation systems, for more than Five years. No other directorships. | 8 | None. | ||
John J. McCartney2 Age 66 Director | Indefinite; Since May 2010. | Retired. Executive Vice President and Chief Financial Officer, Zurich Insurance Group North America (August 2002 – June 2007); President and Chief Executive Officer, Empire Fire and Marine Insurance Companies (October 1993 – August 2002). | 8 | None. | ||
| Interested Director | ||||||
Michael Summers3 Age 45 Director/President | Indefinite; Since 2007. | Chief Financial Officer of First National Nebraska, Inc. (“FNNI”), (November 2006 – present); Chief Financial Officer, Transgenomic, Inc. (August 2004 – November 2006); General Manager of C&A Industries (February 2003 – August 2004). | 8 | None. | ||
| Officers | ||||||
Daniel W. Koors4 Age: 39 Treasurer | Indefinite; Since December 2009. | Senior Vice President of Jackson National Asset Management (“JNAM”) and Jackson Fund Services (“JFS”), a division of JNAM, (2009 – present); Chief Financial Officer of JNAM and JFS (2007 – present); Vice President, Treasurer and Chief Financial Officer of investment companies advised by JNAM (2006 – present). Formerly, Assistant Vice President – Fund Administration of Jackson National Life Insurance Company (“Jackson”) (2006 – 2009); Vice President of JNAM and JFS (2007 – 2008); Assistant Treasurer of investment companies advised by JNAM (2006); Partner of Deloitte & Touche LLP (2003 – 2006). | N/A | N/A | ||
65
DIRECTORS AND OFFICERS (concluded)
March 31, 2010
Name, Address1, Age, and Position(s) Held with Funds | Term of Office and Length of Time Served | Principal Occupation(s) During Past 5 Years | Number of Portfolios in Fund Complex Overseen by Director | Other Directorships Held by Director |
Rodney L. Ruehle5 Age: 41 Chief Compliance Officer and Anti-Money Laundering Officer | Indefinite; Since December 2009. | Director, Beacon Hill Fund Services, Inc. (2008 – present). Formerly, Vice President, CCO Services, Citi Fund Services, Inc. (2004 – 2008); Director, Fund Administration, Citi Fund Services, Inc. (1995 – 2004). | N/A | N/A |
Toni M. Bugni4 Age: 36 Secretary | Indefinite; Since December 2009. | Director of Compliance of JNAM and JFS (2008 – present). Formerly, Compliance Manager of JNAM and JFS (2006 – 2008); Legal Assistant, MetLife Advisers, LLC (2004 – 2006); Regulatory Administration Senior Specialist, PFPC Inc. (2003 – 2004). | N/A | N/A |
Danielle A. Hernandez4 Age: 29 Assistant Secretary | Indefinite; Since December 2009. | Senior Compliance Analyst of JNAM and JFS (2009 – present); Anti-Money Laundering Officer of investment companies advised by JNAM (2007 – present). Formerly, Compliance Analyst of JNAM and JFS (2006 – 2009); Administrative Assistant of JNAM and JFS (2005 – 2006); Executive Assistant at the U.S. House of Representatives (2002 – 2005). | N/A | N/A |
1 The address for all Directors is 1620 Dodge Street, Stop 1075, Omaha, Nebraska 68197.
2 Mr. McCartney was elected to the Board by a vote of shareholders on May 3, 2010.
3 As defined in the 1940 Act, Mr. Summers is an “interested” director because he is an officer of FNNI, which is the parent company of the investment adviser for the Funds.
4 The address for Mr. Koors, Ms. Bugni, and Ms. Hernandez is 225 West Wacker Drive, Suite 1200, Chicago, Illinois 60606.
5 The address for Mr. Ruehle is 4041 North High Street, Suite 402, Columbus, Ohio 43214.
66
Investment Advisers
FNB Fund Advisers
First National Bank of Omaha
1620 Dodge Street, Stop 1075
Omaha, Nebraska 68197
Tributary Capital Management, LLC
First National Nebraska Inc.
P.O. Box 555
Fort Collins, Colorado 80522
Investment Sub-Advisers
(Large Cap Growth Fund only)
Riverbridge Partners, LLC
Midwest Plaza West
801 Nicollet Mall, Suite 600
Minneapolis, Minnesota 55402
(International Equity Fund only)
KBC Asset Management International Ltd. Joshua Dawson House
Dawson Street
Dublin 2, Ireland
Custodians
First National Bank of Omaha
1620 Dodge Street, Stop 1060
Omaha, Nebraska 68197
(International Equity Fund only)
Union Bank of California N.A.
350 California Street, Suite 600
San Francisco, California 94104
Co-Administrators
Jackson Fund Services
255 West Wacker Drive, Suite 1200
Chicago, IL 60606
First National Bank of Omaha
1620 Dodge Street, Stop 1075
Omaha, Nebraska 68197
Distributor
Northern Lights Distributors, LLC
4020 South 147th Street
Omaha, Nebraska 68137
Legal Counsel
Husch Blackwell Sanders LLP
1620 Dodge Street, Suite 2100
Omaha, Nebraska 68102
Independent Registered Public Accounting Firm
KPMG LLP
191 W. Nationwide Blvd., Suite 500
Columbus, Ohio 43215
Compliance Services
Beacon Hill Fund Services, Inc.
4041 N. High Street, Suite 402
Columbus, Ohio 43214
This report has been prepared for the general information of First Focus Funds’ shareholders. It is not authorized for distribution to prospective investors unless accompanied or preceded by an effective First Focus Funds’ prospectus. The prospectus contains more complete information about First Focus Funds’ investment objectives, management fees and expenses, risks and operating policies. Please read the prospectus carefully before investing or sending money.
For more information
call 1-800-662-4203
or write to:
First Focus Funds Service Center
P.O. Box 219022
Kansas City, Missouri 64121-9022
or go to:
www.firstfocusfunds.com
Value. Stability. Service.
FFF-SAR-0310
05/10
Item 2. Code of Ethics.
The registrant has adopted a code of ethics that applies to the registrant’s principal executive officer, principal financial officer, principal accounting officer or controller, or persons performing similar functions. This code of ethics is included as Exhibit 12(a)(1). There were no substantive amendments or waivers to this code of ethics during the period covered by this report.
Item 3. Audit Committee Financial Expert.
The registrant’s Board of Directors has determined that the registrant does not have an “audit committee financial expert” (as such term is defined in the instructions to Item 3 of Form N-CSR) serving on its Audit Committee. The registrant’s Board believes that, notwithstanding the absence of any one person meeting all required elements of the definition of “audit committee financial expert,” the registrant’s Audit Committee collectively possesses the knowledge and experience necessary to execute all of the Audit Committee’s functions, duties and powers. All members of the registrant’s Audit Committee are “independent” (as such term is defined in Item 3 of Form N-CSR).
Item 4. Principal Accountant Fees and Services.
(a) – (d)
KPMG LLP (“KPMG”) was appointed by the Board of Directors as the independent registered public accounting firm of the registrant for the fiscal years ended March 31, 2009 and March 31, 2010.
The following table sets forth the amount of fees that were billed by the principal accountant for the respective period to the registrant.
Fees for Services Rendered to the Registrant by the Principal Accountant
| Fiscal Year | Audit Fees | Audit-Related Fees | Tax Fees | All Other Fees |
| 2009 | $ 102,220 | $ 32,550 | $ 33,000 | $ 0 |
| 2010 | $ 102,220 | $ 32,550 | $ 28,350 | $ 0 |
Nature of services regarding Audit-Related Fees:
2010: Consent on N-1A and 17f-2 count
2009: Consent on N-1A and 17f-2 count
Nature of services regarding Tax Fees:
| 2010: | Federal income and Nebraska Corporate Tax Return reviews and distribution calculation and federal excise tax return review. |
| 2009: | Federal income and Nebraska Corporate Tax Return reviews and distribution calculation and federal excise tax return review. |
During the fiscal years ended March 31, 2009 and March 31, 2010, KPMG did not provide any services to the registrant’s investment advisers, and any entity controlling, controlled by, or under common control with the investment advisers that provided ongoing services to the registrant (“Adviser Entities”) that were directly related to the registrant’s operations and financial reporting.
| (e)(1) | The Audit Committee shall review, consider, and pre-approve the engagement of all auditors to certify the registrant’s financial statements (an “Audit Engagement”). The Audit Committee must report to the Board of Directors of the registrant regarding its approval of all Audit Engagements. |
Management of the registrant may request pre-approval of, and the Audit Committee, or a member of the Audit Committee designated by the Audit Committee (a “Designated Member”), may pre-approve permissible non-audit services (e.g. tax, valuation, and general accounting services) to the registrant and/or to the Adviser Entities, on a project-by-project basis. The Audit Committee must, however, pre-approve any engagement of the auditor to provide non-audit services to any Adviser Entity during the period of such auditor’s audit engagement. Any action by the Designated Member in approving requested non-audit service shall be presented for ratification by the Audit Committee no later than at the Audit Committee’s next scheduled meeting.
| (e)(2) | None of the services summarized in (a)-(d) above, were approved by the Audit Committee pursuant to Rule 2-01(c)(7)(i)(C) of Regulation S-X. |
(f) Not applicable.
| (g) | The aggregate amount of non-audit fees billed by the principal accountant to the registrant and Adviser Entities was $79,000 for the fiscal year ended March 31, 2009 and was $29,350 for the fiscal year ended March 31, 2010. |
| (h) | The registrant’s Audit Committee of the Board of Directors has considered whether the provision of non-audit services that were rendered to the Adviser Entities (not including and sub-adviser whose role is primarily portfolio management and is subcontracted with or overseen by another investment adviser) that were not pre-approved pursuant to paragraph (c)(7)(ii) of Rule 2-01 of Regulation S-X and concluded that such services were compatible with maintaining the principal accountant’s independence. |
Item 5. Audit Committee of Listed Registrants.
Not applicable.
Item 6. Schedule of Investments.
(a) Included as a part of the report to shareholders filed under Item 1.
(b) Not applicable.
Item 7. Disclosure of Proxy Voting Policies and Procedures for Closed-End Management Investment Companies.
Not applicable.
Item 8. Portfolio Managers of Closed-End Management Investment Companies.
Not applicable.
Item 9. Purchases of Equity Securities by Closed-End Management Investment Company and Affiliated Purchasers.
Not applicable.
Item 10. Submission of Matters to a Vote of Security Holders.
There have been no material changes to the procedures by which shareholders may recommend nominees to the registrant’s Board of Directors since the registrant last disclosed such procedures.
Item 11. Controls and Procedures.
| (a) | The registrant’s principal executive officer and principal financial officer have concluded, based on their evaluation of the registrant’s disclosure controls and procedures as conducted within 90 days of the filing date of this report, that these disclosure controls and procedures are adequately designed and are operating effectively to ensure that information required to be disclosed by the registrant on Form N-CSR is recorded, processed, summarized and reported within the time periods specified in the Securities and Exchange Commission’s rules and forms. |
| (b) | There were no changes in the registrant's internal control over financial reporting (as defined in Rule 30a-3(d) under the Act (17 CFR 270.30a-3(d)) that occurred during the registrant's second fiscal quarter of the period covered by this report that have materially affected, or are reasonably likely to materially affect, the registrant's internal control over financial reporting. |
Item 12. Exhibits
| (a)(1) | The code of ethics that is the subject of the disclosure required by Item 2 is attached hereto. |
| (a)(2) | Certifications pursuant to Rule 30a-2(a) are attached hereto. |
| (a)(3) | Not applicable. |
| (b) | Certifications pursuant to Rule 30a-2(b) are furnished herewith. |
SIGNATURES
Pursuant to the requirements of the Securities Exchange Act of 1934 and the Investment Company Act of 1940, the registrant has duly caused this report to be signed on its behalf by the undersigned, thereunto duly authorized.
| First Focus Funds, Inc. | |
| By: | /s/ Daniel W. Koors |
| Name: | Daniel W. Koors |
| Title: | Treasurer |
| Date: | June 4, 2010 |
Pursuant to the requirements of the Securities Exchange Act of 1934 and the Investment Company Act of 1940, this report has been signed below by the following persons on behalf of the registrant and in the capacities and on the dates indicated.
| By: | /s/ Michael A. Summers |
| Name: | Michael A. Summers |
| Title: | President |
| Date: | June 4, 2010 |
| By: | /s/ Daniel W. Koors |
| Name: | Daniel W. Koors |
| Title: | Treasurer |
| Date: | June 4, 2010 |
EXHIBIT LIST
| Exhibit 12(a)(1) | Code of Ethics (as defined in Item 2(b) of Form N-CSR). |
| Exhibit 12(a)(2)(a) | Certification of the Principal Executive Officer required by Rule 30a-2(a) under the Act. |
| Exhibit 12(a)(2)(b) | Certification of the Principal Financial Officer required by Rule 30a-2(a) under the Act. |
| Exhibit 12(b) | Certification required by Rule 30a-2(b) under the Act. |