Table of Contents
UNITED STATES
SECURITIES AND EXCHANGE COMMISSION
Washington, D.C. 20549
FORM N-CSR
CERTIFIED SHAREHOLDER REPORT OF REGISTERED
MANAGEMENT INVESTMENT COMPANIES
Investment Company Act File Number: 811-08846
Tributary Funds, Inc.
(Exact name of registrant as specified in charter)
Tributary Capital Management, LLC
1620 Dodge Street
Omaha, Nebraska 68197
(Address of principal executive offices)
Daniel W. Koors
Jackson Fund Services
225 West Wacker Drive, Suite 1200
Chicago, Illinois 60606
(Name and address of agent for service)
Registrant’s telephone number, including area code: (800) 662-4203
Date of Fiscal Year End: March 31
Date of Reporting Period: March 31, 2011
Form N-CSR is to be used by management investment companies to file reports with the Commission not later than 10 days after the transmission to stockholders of any report that is required to be transmitted to stockholders under Rule 30e-1 under the Investment Company Act of 1940 (17 CFR 270.30e-1). The Commission may use the information provided on Form N-CSR in its regulatory, disclosure review, inspection, and policymaking roles.
A registrant is required to disclose the information specified by Form N-CSR, and the Commission will make this information public. A registrant is not required to respond to the collection of information contained in Form N-CSR unless the Form displays a currently valid Office of Management and Budget (“OMB”) control number. Please direct comments concerning the accuracy of the information collection burden estimate and any suggestions for reducing the burden to Secretary, Securities and Exchange Commission, 450 Fifth Street, NW, Washington, DC 20549-0609. The OMB has reviewed this collection of information under the clearance requirements of 44 U.S.C. §3507.
Table of Contents
Item 1. Report to Shareholders.
Table of Contents
Table of Contents
ANNUAL REPORT 2011

| 1 | ||||
| 2 | ||||
| 18 | ||||
| 38 | ||||
| 40 | ||||
| 42 | ||||
| 46 | ||||
| 49 | ||||
| 61 | ||||
| 62 | ||||
| 65 | ||||
Table of Contents
ANNUAL REPORT 2011
Much has been accomplished over the last 12 months. In the 2010 annual report, we wrote, “We are currently in the process of re-calibrating our course for the next 10 years and like what we see. We feel we have built a fundamentally strong fund complex, one with strong overall performance based on solid long-term thinking. In the coming months, we will be working on a strategic plan that, if executed correctly, should allow us to achieve the type of scope and scale critical to our long-term growth. As much as the last 10 years has been about strengthening the offerings and broadening the scope of those offerings, we hope the next 10 years will be about distribution. We hope to have exciting news before we close out 2010, including success in opening new distribution channels for your Funds.”
In May 2010, driven by a desire to take the strong performance of the Funds on a more regional and national level, the two registered investment advisers owned by First National Nebraska, Inc. (“FNNI”) were spun out from the bank and merged to create Tributary Capital Management, LLC. Once Tributary Capital Management, LLC was formed and approved as adviser to the First Focus Funds, we rebranded the Fund Complex and in August 2010, the First Focus Funds were rebranded the Tributary Funds.
I’m pleased to report another strong year for fund flows. At March 31, 2011, the Funds held $891 million in assets, an increase of 51% over March 31, 2010. Of this $301 million increase, $226 million resulted from new fund flows, and $75 million from market action. Since March 31, 2009, assets have increased $539 million, or 153%. In particular, we are pleased that the majority of the flows in the last year came from new sources, reflective of the strong performance put in by many of the Funds.
Recently, the performance of our funds has been recognized by U.S. News and World Report1, with the Small Company Fund, the Growth Opportunities Fund and the Balanced Fund all singled out as “Best Funds to own for the Long-Term.” More recently, the Growth Opportunities Fund was recognized by the Wall Street Journal as a Category King for its 1 year performance2.
Although the last two years have been encouraging for investors, there still remains much to be concerned about. It appears that 2011 will offer further economic recovery, though somewhat muted based on the continued struggle with unemployment. The U.S. Federal Reserve continues to be very accommodative in policy, but driven by fears of inflation, the drumbeat of a less accommodative policy becomes louder each day. Developed countries around the world are challenged by significant fiscal structural deficit issues; perhaps the greatest economic and political issue facing governments of developed countries in the last 50 years.
In such a challenging environment, we appreciate the trust our shareholders put in us as stewards of their assets. We take this responsibility very seriously, and work very hard everyday to understand and manage these issues. The Tributary Funds are affiliated with the largest privately owned bank holding company in North America, FNNI, with independent roots tracing back to 1855. The fifth and sixth generations of the founding family continue to be involved in the day-to-day operations of the company. This type of long-term focus not only permeates the philosophy of our parent company, but also that of the Tributary Funds.
We look forward to managing money for our shareholders for many years to come. Thank you for placing your trust in Tributary Funds.
Best Regards,

Stephen R. Frantz
President
sfrantz@tributarycapital.com
Comments are provided as a general market overview and should not be considered investment advice or predictive of any future market performance.
1 US News & World Report, Summer 2010. The US News Mutual Fund Score is produced using an equal weighting of the overall ratings of five data sources. Rating systems are normalized to a 10-point scale to produce the final score. The universe of more than 4,500 funds includes only those ranked by all five sources, the Tributary Small Company Fund was ranked out of 562 Small Blend Funds.
2 The Wall Street Journal, “Category Kings in 22 Realms,” April 4, 2011. The ranking looked at top-performing funds in each category, ranked by one-year total returns as of March 31. The Tributary Growth Opportunities Fund was listed second on the list out of 371 funds in the category.
1
Table of Contents
ANNUAL REPORT 2011
Investment Objective
The Tributary Short-Intermediate Bond Fund seeks to maximize total return in a manner consistent with the generation of current income, preservation of capital and reduced price volatility.
Manager Commentary
As we wrote this report a year ago, interest rates were beginning to decline as government stimulus programs wound down, the inventory rebuilding cycle ended and worries grew that European sovereign debt problems would stifle economic growth. In response, the U.S. Federal Reserve (the “Fed”) eventually implemented its second asset purchase program in an attempt to drive long interest rates even lower through the purchase of U.S. Treasury securities. The decelerating economy combined with the prospect of further monetary accommodation from the Fed caused rates on the intermediate part of the yield curve to move rapidly lower. The 10-year U.S. Treasury rate dropped from just under 4.00% in early April 2010 to a low of 2.41% in October 2010. During the last calendar quarter of 2010, however, the economy shifted higher again as employment slowly increased, consumer spending picked up, manufacturing activity improved and corporate earnings remained strong. Commodity price pressures also began to build in the last half of the year, and this, combined with concerns over the record deficit spending on the part of the U.S. federal government, stoked fears of higher inflation. In response to the improving economy and the potential for higher inflation, interest rates changed course again and moved rapidly higher. By the beginning of February 2011, the 10-year rate for U.S. Treasury notes reached 3.75% and settled back to 3.47% on March 31, 2011.
While some market participants and even some of the more hawkish members of the Fed have fretted publicly over the rise in top-line inflation, Fed Chairman, Benjamin Bernanke, and the Federal Open Market Committee (“FOMC”) as a whole have continued to convey their belief that current commodity induced inflation pressures are transient in nature. Due to the slack that still exists in the economy, and in particular the unacceptably high level of unemployment, the Fed was biased toward aggressively facilitating economic growth rather than fighting what it viewed as an improbable long-term increase in inflation. With the Fed anchoring short rates, the yield curve remains steep by historical standards and will likely not flatten significantly until it becomes clear the FOMC is moving to a more restrictive policy stance.
Over the last twelve months, risk assets in the fixed income universe outperformed U.S. Treasury securities, continuing the trend of steady spread tightening that began in 2009. Lower quality issues generally outperformed their higher-rated counterparts. In similar fashion, non-agency residential and commercial mortgage-backed securities (“MBS”) significantly outperformed government-backed MBS. Investors were increasingly willing to take additional risk in the search for increased yield and potential returns. Absent a major shock to the economic system, risk premiums in the fixed income market should continue to compress.
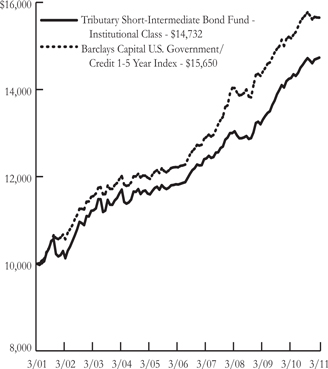
For the year ended March 31, 2011, the Tributary Short-Intermediate Bond Fund returned 3.27% compared to 3.12% for the Barclays Capital U.S. Government/Credit 1-5 Year Index.
Similar to the prior year, the primary driver of the Fund’s outperformance was an overweight position in non-Treasury sectors of the fixed income universe. Specifically, an overweight position in financial corporate bonds (KeyBank NA and Regions Financial Corp. both posted double-digits returns) and non-agency MBS were large contributors to the Fund’s return for the year. A related benefit to performance was the Fund’s sizable yield advantage over its benchmark, a characteristic which we believe will become increasingly important going forward. Detracting from performance for the year ended March 31, 2011 was the Fund’s lower average duration versus the index, as interest rates were lower across the yield curve.
Over the course of the year the Fund increased its allocation to the private-label MBS, agency-guaranteed MBS and credit sectors, while maintaining an overweight position in commercial mortgage-backed securities (“CMBS”). Within credit, notable changes included purchases of three taxable Build America Bonds (“BABs”) as well as an increase in the Fund’s allocation to below-investment grade debt. Most of the non-agency additions to the Fund were front-pay, sequential structures, which we believe continue to offer value even in weaker housing market environments. Given the ongoing distortion caused by the Fed’s ownership of agency MBS and the growing uncertainty of how their holdings will eventually be unwound, we prefer to be cautious and will look for a better entry point to increase the Fund’s position in that sector.
Despite two consecutive years of considerable outperformance by the “risk-spread” sectors of the bond market, we continue to find greater expected returns from the private-label securitized sector and lower-quality corporate bonds. Strong balance sheets and corporate profitability provide a tailwind for the credit sector, while much-improved liquidity and attractive risk-adjusted yields in the private-label securitized market reinforce our expectation for positive excess returns. On the other hand, large budget deficits, refunding needs and uncertainty regarding the Fed’s balance sheet unwind are clearly headwinds to any potential outperformance from the government sector. That being said, we are quite cognizant of the fact that the margin of safety available in credit-sensitive sectors has declined, highlighting the importance of security selection. Apart from our allocation decision, we expect to maintain a shorter duration position relative to the Fund’s benchmark, while also taking advantage of the currently steep yield curve in order to position the Fund for an eventual increase in short-term interest rates.
We remain confident that our long-term focus and rigorous credit and structural analysis will serve our investors well over the coming year.
2 |
Table of Contents
ANNUAL REPORT 2011
SHORT-INTERMEDIATE BOND FUND
Return of a $10,000 Investment as of March 31, 2011
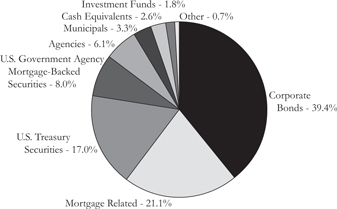
Portfolio Composition as of March 31, 2011
Percentage Based on Total Value of Investments
(Portfolio composition is subject to change)
Portfolio Analysis as of March 31, 2011
(Portfolio composition is subject to change)
Weighted Average Maturity: | 3.3 years |
Average Annual Total Return for the Year Ended March 31, 2011*
1 Year | 5 Year | 10 Year | ||||||||
Tributary Short Intermediate Bond Fund - Institutional Class | 3.27% | 4.50% | 3.95% | |||||||
Barclays Capital U.S. Government/ Credit 1-5 Year Index | 3.12% | 5.08% | 4.58% | |||||||
| ||||||||||
| Prospectus Expense Ratio (Gross/ Net)† | 1.19%/0.95% | |||||||||
Expense Ratio for the Year Ended March 31, 2011 (Gross/Net) | 1.08%/0.82% | |||||||||
Past performance does not guarantee future results. The performance data quoted represents past performance and current returns may be lower or higher. Total return figures include change in share price, reinvestment of dividends and capital gains. The investment return and principal value will fluctuate so that an investor’s shares, when redeemed may be worth more or less than the original cost. To obtain performance information current to the most recent month end, please visit our website at www.tributaryfunds.com.
(†)The above expense ratios are from the Fund’s prospectus dated August 1, 2010. Net expense ratio is net of contractual waivers which are in effect from August 1, 2010 through July 31, 2011.
(*) Returns shown do not reflect the deduction of taxes that a shareholder would pay on Fund distributions or the redemption of Fund shares. The returns for certain periods reflect fee waivers and/or reimbursements in effect for that period; absent fee waivers and reimbursements, performance would have been lower.
The line chart assumes an initial investment of $10,000 made on March 31, 2001. Total return is based on net change in net asset value (“NAV”) assuming reinvestment of distributions. Returns shown include the reinvestment of all dividends and other distributions.
The Barclays Capital U.S. Government/Credit 1-5 Year Index measures the performance of U.S. Treasury and agency securities, and corporate bonds with 1-5 year maturities.
The above referenced index is unmanaged and does not reflect the deduction of fees or taxes associated with a mutual fund, such as investment management and fund accounting fees. Investors cannot invest directly in the index.
| 3 |
Table of Contents
ANNUAL REPORT 2011
INCOME FUND
Investment Objective
The Tributary Income Fund seeks the generation of current income in a manner consistent with preserving capital and maximizing total return.
Manager Commentary
As we wrote this report a year ago, interest rates were beginning to decline as government stimulus programs wound down, the inventory rebuilding cycle ended and worries grew that European sovereign debt problems would stifle economic growth. In response, the U.S. Federal Reserve (the “Fed”) eventually implemented its second asset purchase program (“QEII”) in an attempt to drive long interest rates even lower through the purchase of U.S. Treasury securities. The decelerating economy combined with the prospect of further monetary accommodation from the Fed caused rates on the intermediate part of the yield curve to move rapidly lower. The 10-year U.S. Treasury rate dropped from just under 4.00% in early April 2010 to a low of 2.41% in October 2010. During the last calendar quarter of 2010, however, the economy shifted higher again as employment slowly increased, consumer spending picked up, manufacturing activity improved and corporate earnings remained strong. Commodity price pressures also began to build in the last half of the year, and this, combined with concerns over the record deficit spending on the part of the U.S. federal government, stoked fears of higher inflation. In response to the improving economy and the potential for higher inflation, interest rates changed course again and moved rapidly higher. By the beginning of February 2011, the 10-year rate for U.S. Treasury notes reached 3.75% and settled back to 3.47% on March 31, 2011.
While some market participants and even some of the more hawkish members of the Fed have fretted publicly over the rise in top-line inflation, Fed Chairman, Benjamin Bernanke, and the Federal Open Market Committee (“FOMC”) as a whole have continued to convey their belief that current commodity induced inflation pressures are transient in nature. Due to the slack that still exists in the economy, and in particular the unacceptably high level of unemployment, the Fed was biased toward aggressively facilitating economic growth rather than fighting what it viewed as an improbable long-term increase in inflation. With the Fed anchoring short rates, the yield curve remains steep by historical standards and will likely not flatten significantly until it becomes clear the FOMC is moving to a more restrictive policy stance.
Over the last twelve months, risk assets in the fixed income universe outperformed U.S. Treasury securities, continuing the trend of steady spread tightening that began in 2009. Lower quality issues generally outperformed their higher-rated counterparts. In similar fashion, non-agency residential and commercial mortgage-backed securities (“MBS”) significantly
outperformed government-backed MBS. Investors were increasingly willing to take additional risk in the search for increased yield and potential returns. Absent a major shock to the economic system, risk premiums in the fixed income market should continue to compress. For the year ended March 31, 2011, the Tributary Income Fund
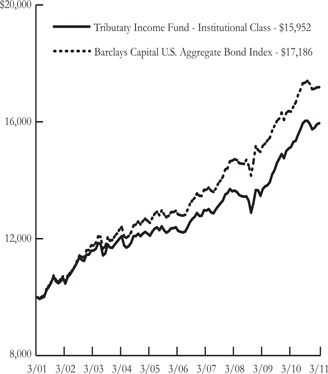
returned 5.37% compared to 5.12% for the Barclays Capital U.S. Aggregate Bond Index.
Similar to the prior year, the primary driver of the Fund’s outperformance was the overweight position in non-Treasury sectors of the fixed income universe. Specifically, the overweight position in financial corporate bonds and non-agency MBS were large contributors to the Fund’s return for the year. A related benefit to performance was the Fund’s sizable yield advantage over its benchmark, a characteristic which we believe will become increasingly important going forward. Detracting from performance for the year ended March 31, 2011 was the Fund’s lower average duration versus the index, as interest rates were lower across the yield curve.
Over the course of the year the Fund increased its allocation to the private label MBS, agency guaranteed MBS and credit sectors, while maintaining an overweight position in commercial mortgage-backed securities (“CMBS”). Within credit, notable changes included an increase in the Fund’s exposure to the taxable Build America Bond (“BAB”) market as well as an increase in the Fund’s allocation to below investment grade debt. Despite Fund purchases this past year, the Fund remains underweight relative to the index in the agency MBS sector, with a majority of the Fund’s duration contribution coming from well-structured, seasoned collateralized mortgage obligations (“CMO”). Given the ongoing distortion caused by the Fed’s ownership of agency MBS and the growing uncertainty of how their holdings will eventually be unwound, we prefer to be cautious and look for a better entry point to increase the Fund’s position in that sector.
Despite two consecutive years of considerable outperformance by the “risk-spread” sectors of the bond market, we continue to find greater expected returns from the private label securitized sector and lower quality corporate bonds. Strong balance sheets and corporate profitability provide a tailwind for the credit sector, while much improved liquidity and attractive risk-adjusted yields in the private label securitized market reinforce our expectation for positive excess returns. On the other hand, large budget deficits, refunding needs and uncertainty regarding the Fed’s balance sheet unwind are clearly headwinds to any potential outperformance from the government sector. That being said, we are quite cognizant of the fact that the margin of safety available in credit sensitive sectors has declined, highlighting the importance of security selection. Apart from our allocation decision, we expect to maintain a shorter duration position relative to the Fund’s benchmark, while also taking advantage of the currently steep yield curve in order to position the Fund for an eventual increase in short-term interest rates.
We remain confident that our long-term focus and rigorous credit and structural analysis will serve our investors well over the coming year.
| 4 |
Table of Contents
ANNUAL REPORT 2011
INCOME FUND
Return of a $10,000 Investment as of March 31, 2011
Portfolio Composition as of March 31, 2011
Percentage Based on Total Value of Investments
(Portfolio composition is subject to change)
Portfolio Analysis as of March 31, 2011
(Portfolio composition is subject to change)
Weighted Average Maturity: | 7.7 years |
Average Annual Total Return for the Year Ended March 31, 2011*
1 Year | 5 Year | 10 Year | ||||||||
Tributary Income Fund - | 5.37% | 5.39% | 4.78% | |||||||
| Barclays Capital U.S. Aggregate Bond Index | 5.12% | 6.03% | 5.56% | |||||||
| ||||||||||
| Prospectus Expense Ratio (Gross/ Net)† | 1.28%/1.00% | |||||||||
| Expense Ratio for the Year Ended March 31, 2011 (Gross/Net) | 1.18%/0.83% | |||||||||
Past performance does not guarantee future results. The performance data quoted represents past performance and current returns may be lower or higher. Total return figures include change in share price, reinvestment of dividends and capital gains. The investment return and principal value will fluctuate so that an investor’s shares, when redeemed may be worth more or less than the original cost. To obtain performance information current to the most recent month end, please visit our website at www.tributaryfunds.com.
(†)The above expense ratios are from the Fund’s prospectus dated August 1, 2010. Net expense ratio is net of contractual waivers which are in effect from August 1, 2010 through July 31, 2011.
The line chart assumes an initial investment of $10,000 made on March 31, 2001. Total return is based on net change in net asset value (“NAV”) assuming reinvestment of distributions. Returns shown include the reinvestment of all dividends and other distributions.
The Barclays Capital U.S. Aggregate Bond Index is a market value-weighted index which covers the USD-denominated, investment-grade, fixed-rate, taxable bond market of SEC-registered securities. The index includes bonds from the Treasury, Goverment-Related, Corporate, MSB (agency fixed-rate and hybrid ARM passthroughs), ABS, and CMBS sectors.
The above referenced index is unmanaged and does not reflect the deduction of fees or taxes associated with a mutual fund, such as investment management and fund accounting fees. Investors cannot invest directly in the index.
| 5 |
Table of Contents
ANNUAL REPORT 2011
BALANCED FUND
Investment Objective
The Tributary Balanced Fund seeks capital appreciation and current income.
Manager Commentary
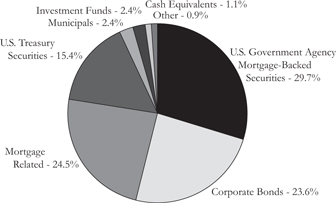
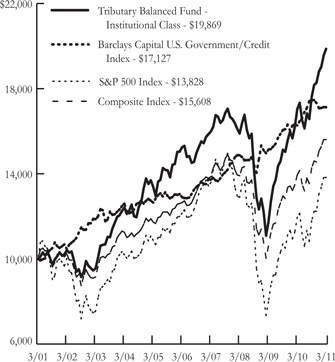
For the year ended March 31, 2011, the Tributary Balanced Fund returned 16.56% compared to 11.87% for the Composite Index. The Composite Index consists of 60% of the S&P 500 Index and 40% of the Barclays Capital U.S. Government/Credit Index. Relative to its peer group, the Morningstar Moderate Allocation Category, the Fund’s performance ranked in the 3rd percentile over the last year. Consistent strong relative performance has earned the Fund an overall 5-Star rating from Morningstar1.
Three factors contributed to the positive absolute and relative returns: asset allocation, stock selection and bond selection. The Fund’s prospectus allows a range of 25% to 75% investment in equities and a minimum of 25% investment in fixed income. With this asset class flexibility, asset allocation is a primary determinant of returns. Over the last year, the Fund had an average stock allocation of 64%. As equities outperformed bonds and cash, the high equity allocation contributed to overall returns. The largest contributor to the strong returns versus the peer group, however, was stock selection. Equities in the Fund returned 23.2%, well above the S&P 500 Index return of 15.65%. In particular, companies in the consumer discretionary and health care industry significantly outperformed the S&P 500 Index. Fixed income selection was also a positive contributor as bonds in the Fund returned 7.0% versus 5.26% for the Barclays Capital U.S. Government/Credit Index. Our emphasis on credit, specifically investment grade corporate bonds and taxable municipal bonds, added to performance as credit outperformed government securities.
The Fund’s outlook is positive with the U.S. economy continuing to report economic growth and increasing private employment. Based on modest economic growth, companies in the S&P 500 Index are expected to grow earnings in 2011 by 14% with the Price to Forward Earnings (“P/E”) ratio of 13.6x, a discount to historical averages. Stock market returns have also benefited from the increase in mergers and acquisition activity, share buybacks and higher dividends. Due to the improving profit outlook and relative attractiveness of equities compared with bonds, we are maintaining a high stock allocation.
In equities, the Fund utilizes a multi-cap strategy. Our experienced investment team researches small, mid and large-cap companies and makes investment decisions based on the fundamentals of each company, not its size. The Fund endeavors to invest in companies with a more favorable earnings outlook compared to industry peers. Lastly, we apply valuation measures to ensure we are paying the right price for a company. This multi-cap core growth strategy is key to our goal of providing above average returns at reduced risk levels. Over the last year, the Fund’s exposure to small and mid-cap companies contributed to returns as those sectors outperformed their larger peers. Based on the
difference in performance, large-caps now trade at a valuation discount to smaller companies. Over the last few quarters, we have opportunistically increased the Fund’s exposure to large companies.
In fixed income, the Fund utilizes a high quality, intermediate-term maturity approach and endeavors to provide stable income with minimum levels of risk. We conduct extensive yield comparisons across sectors and maturities. Weightings are determined by analyzing the return/risk potential of various securities. With a positive corporate profit outlook and solid balance sheets, we favor corporate bonds in the Fund. As we expect interest rates to gradually increase, we have shortened the average length to maturity of the fixed income portfolio.
Although we expect modest economic growth to continue, we are increasingly concerned about the negative economic impact of higher commodity prices, especially oil. If our economic outlook changes as a result of this or other economic issues, we will alter our strategy.
1 Disclosures
Morningstar Inc. All Rights Reserved. The information, data, analysis and opinions contained herein (1) include the confidential and proprietary information of Morningstar, (2) may not be copied or redistributed, (3) do not constitute investment advice offered by Morningstar, (4) are provided solely for the informational purposes and therefore are not an offer to buy or sell a security, and (5) are not warranted to be correct, complete or accurate. Except as otherwise required by law, Morningstar shall not be responsible for any trading decisions, damages or other losses resulting from, or related to, this information, data, analysis or opinions or their use. For each fund with at least a three-year history, Morningstar calculates a Morningstar RatingTM based on a Morningstar Risk-Adjusted Return measure that accounts for variation in a fund’s monthly performance (including the effects of sales charges, loads and redemption fees), placing more emphasis on downward variations and rewarding consistent performance. The top 10% of the funds in each category receive 5 stars, the next 22.5% receive 4 stars, the next 35% receive 3 stars, the next 22.5% receive 2 stars and the bottom 10% receive 1 star. (Each share class is counted as a fraction of one fund within the scale and rated separately, which may cause slight variations in the distribution percentages).
| 6 |
Table of Contents
ANNUAL REPORT 2011
BALANCED FUND
Return of a $10,000 Investment as of March 31, 2011
Portfolio Composition as of March 31, 2011
Percentage Based on Total Value of Investments
(Portfolio composition is subject to change)
Average Annual Total Return for the Year Ended March 31, 2011*
| 1 Year | 5 Year | 10 Year | ||||||||||
Tributary Balanced Fund -Institutional Class | 16.56% | 5.44% | 7.11% | |||||||||
| Barclays Capital U.S. Government/Credit Index | 5.26% | 5.83% | 5.53% | |||||||||
| S&P 500 Index | 15.65% | 2.62% | 3.29% | |||||||||
| Composite Index | 11.87% | 4.30% | 4.55% | |||||||||
| ||||||||||||
| Prospectus Expense Ratio (Gross/ Net)† | 1.54%/1.40% | |||||||||||
| Expense Ratio for the Year Ended March 31, 2011 (Gross/Net) | 1.37%/1.22% | |||||||||||
Past performance does not guarantee future results. The performance data quoted represents past performance and current returns may be lower or higher. Total return figures include change in share price, reinvestment of dividends and capital gains. The investment return and principal value will fluctuate so that an investor’s shares, when redeemed may be worth more or less than the original cost. To obtain performance information current to the most recent month end, please visit our website at www.tributaryfunds.com.
(†)The above expense ratios are from the Fund’s prospectus dated August 1, 2010. Net expense ratio is net of contractual waivers which are in effect from August 1, 2010 through July 31, 2011.
(*) Returns shown do not reflect the deduction of taxes that a shareholder would pay on Fund distributions or the redemption of Fund shares. The returns for certain periods reflect fee waivers and/or reimbursements in effect for that period; absent fee waivers and reimbursements, performance would have been lower.
The line chart assumes an initial investment of $10,000 made on March 31, 2001. Total return is based on net change in net asset value (“NAV”) assuming reinvestment of distributions. Returns shown include the reinvestment of all dividends and other distributions.
The Barclays Capital U.S. Government/Credit Index is the non-securitized component of the U.S. Aggregate Index and includes Treasuries (i.e, public obligations of the U.S. Treasury that have remaining maturities of more than one year), Government-Related issues (i.e, agency, sovereign, supranational, and local authority debt), and USD Corporates.
The S&P 500 Index is an index of 500 selected common stocks most of which are listed on the New York Stock Exchange. The index is heavily weighted toward stocks with large market capitalizations and represents approximately two-thirds of the total market value of all domestic common stocks.
The Composite Index is a combined index of 60% of the S&P 500 Index and 40% of the Barclays Capital U.S. Government/Credit Index. The Composite Index is intended to provide a single benchmark that more accurately reflects the composition of securities held by the Balanced Fund. The individual performance of each index that comprises the Composite Index is detailed in the chart above.
The above referenced indices are unmanaged and do not reflect the deduction of fees or taxes associated with a mutual fund, such as investment management and fund accounting fees. Investors cannot invest directly in the indices.
| 7 |
Table of Contents
ANNUAL REPORT 2011
CORE EQUITY FUND
Investment Objective
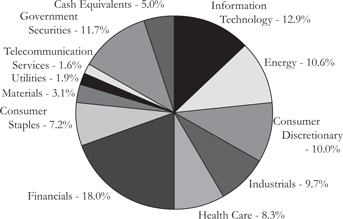
The Tributary Core Equity Fund seeks long-term capital appreciation.
Manager Commentary
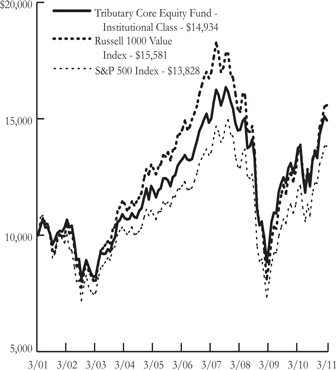
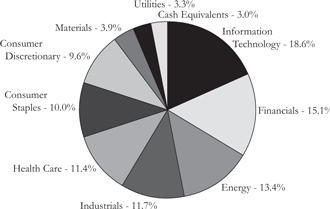
For the year ended March 31, 2011, the Tributary Core Equity Fund returned 8.69% compared to 15.65% for the S&P 500 Index and 15.15% for the Russell 1000 Value Index. In a year when investors increased their appetite for risk, the large capitalization, high quality Fund was clearly swimming against the current. The Fund’s strategy typically lags the returns of the S&P 500 Index in strong rising markets, which tend to favor smaller, lower quality securities. Conversely, the Fund’s strategy typically outperforms, as it did in 2008, in declining or flat markets, when investors are seeking safer investments. Thus, we weren’t surprised that our strategy would lag behind the S&P 500 Index in fiscal years 2010 and 2011. However, what did surprise us was the historically large divergences in returns between large-cap and small-cap stocks (e.g. the Russell 2000 Index had a return of 25.79%, nearly double that of the S&P 500 Index) and high quality and low quality stocks (e.g. the returns on S&P ranked B and C stocks were much higher than the returns on S&P ranked A stocks). The good news is that, at the time of this publication, the valuations of the multi-national, high quality stocks that dominate our portfolio historically sell at a wide discount to the S&P 500 Index. We believe we are long overdue for a reversion to the mean.
The past twelve months were filled with a host of macroeconomic events, which appeared to drive the behaviors of both retail and institutional investors. These events included: the threatened insolvency of the weaker European countries (Portugal, Ireland, Italy, Greece and Spain), the Gulf of Mexico oil spill, the 2010 U.S. mid-term elections, the popular rebellions in several North African and Middle Eastern countries and the earthquake, tsunami and nuclear disaster in Japan. In addition, investors enjoyed a wave of monetary expansion and historically low short-term interest rates, courtesy of the U.S. Federal Reserve (the “Fed”). Thus, it appeared that during most of the year, there was either a “risk-on” or “risk-off” macro mentality that drove considerable volatility in all stock prices. This made for a tough environment for the Fund’s bottom-up stock selection approach, which depends on more performance differentiation based on individual company fundamentals. In addition, some of the Fund’s holdings were directly adversely affected by events such as the oil spill in the Gulf (Anadarko Petroleum Corp. and Transocean), the natural gas explosion in San Bruno, California (PG&E Corp.) and the Japanese tragedy (AFLAC Inc. and MetLife Inc.).
Looking forward, we are enthusiastic regarding the securities that we currently hold in the Fund. Most are large multi-national companies that dominate their markets and have significant revenues being generated in the faster growing developing countries such as China, India and Brazil. While investors focused on the rapid recovery of companies that were dependent on U.S. consumers in the early stages of this recovery (in which the
Fund is under-weighted), we believe they will rotate to companies that are exposed to the faster growing developing countries as U.S. growth matures. In addition to offering better growth, many of the multi-nationals currently offer below-market valuations and cash dividend yields of 2% to 3%, which are competitive with interest rates on fixed-income securities.
The outlook for 2011 has improved, although long-term structural economic problems still remain. In the U.S., the economic momentum and fiscal and monetary stimulus should provide an environment for modest economic growth and eventually, a gradual improvement in employment. It appears that the housing market has stabilized at low levels, but the remaining inventory of unsold homes (including pending foreclosures) may require an extended period of time before it returns to a normal level. Europe’s stronger economies such as Germany, England and France appear to be improving, but austerity programs in the weaker countries will continue to be a drag on economic growth in that region. In addition, the European Union still hasn’t addressed the long-term issue of how to support the weaker economies and their banks when they are at risk of default. It appears the developing countries, led by China, India and Brazil, should continue to experience strong economic growth due to strong exports and the rising affluence of their populations. However, accelerating inflation, especially in commodity and food costs, has led to a series of monetary tightening actions aimed at cooling the rate of growth. Hopefully, future monetary tightening will be successful without stalling economic growth. Of course, the uprisings in many North African and Middle Eastern countries are a wild card, which could cause global growth to stall due to rising oil prices. Finally, the U.S. will face serious economic consequences in the future if it doesn’t get its economic house in order. Bipartisan plans need to be developed to address dangerously high future budget deficits and financially unsustainable programs such as Social Security, Medicare and Medicaid. The recent experiences of Greece, Ireland and Portugal should serve as a reminder that a failure to do so can result in high interest rates and austerity programs that can lead to economic contraction. Hopefully, our political leaders understand the dangers and will act accordingly while there is still time to avoid a catastrophe.
| 8 |
Table of Contents
ANNUAL REPORT 2011
CORE EQUITY FUND
Return of a $10,000 Investment as of March 31, 2011
Portfolio Composition as of March 31, 2011
Percentage Based on Total Value of Investments
(Portfolio composition is subject to change)
Average Annual Total Return for the Year Ended March 31, 2011*
| 1 Year | 5 Year | 10 Year | ||||||||||
Tributary Core Equity Fund - Institutional Class | 8.69 | % | 2.38 | % | 4.09 | % | ||||||
Russell 1000 Value Index | 15.15 | % | 1.38 | % | 4.53 | % | ||||||
S&P 500 Index | 15.65 | % | 2.62 | % | 3.29 | % | ||||||
Prospectus Expense Ratio (Gross/Net)† | 1.35%/1.22% | |||
Expense Ratio for the Year Ended March 31, 2011 (Gross/Net) | 1.29%/1.15% | |||
|
Since Inception†† |
| ||
Tributary Core Equity Fund - | 5.14% | |||
| ||||
Prospectus Expense Ratio (Gross/Net)† | 1.10%/0.93% | |||
| Expense Ratio for the Period Ended March 31, 2011 (Gross/Net) | 1.01%/0.85% |
Past performance does not guarantee future results. The performance data quoted represents past performance and current returns may be lower or higher. Total return figures include change in share price, reinvestment of dividends and capital gains. The investment return and principal value will fluctuate so that an investor’s shares, when redeemed may be worth more or less than the original cost. To obtain performance information current to the most recent month end, please visit our website at www.tributaryfunds.com.
(†)The above expense ratios are from the Fund’s prospectus dated August 1, 2010. Net expense ratios are net of contractual waivers which are in effect from August 1, 2010 through July 31, 2011.
(††) Commencement date for the Institutional Plus Class was December 17, 2010.
(*) Returns shown do not reflect the deduction of taxes that a shareholder would pay on Fund distributions or the redemption of Fund shares. The returns for certain periods reflect fee waivers and/or reimbursements in effect for that period; absent fee waivers and reimbursements, performance would have been lower.
The line chart assumes an initial investment of $10,000 made on March 31, 2001. Total return is based on net change in net asset value (“NAV”) assuming reinvestment of distributions. Returns shown include the reinvestment of all dividends and other distributions.
The performance of Institutional Plus Class will be different than Institutional Class based on differences in fees borne by each class.
The S&P 500 Index is an index of 500 selected common stocks, most of which are listed on the New York Stock Exchange. The index is heavily weighted toward stocks with large market capitalizations and represents approximately two-thirds of the total market value of all domestic common stocks.
The Russell 1000 Value Index measures the performance of the large-cap value segment of the U.S. equity universe. It includes those Russell 1000 companies with lower price-to-book-value ratios and lower expected growth values.
The above referenced indices are unmangaged and do not reflect the deduction of fees or taxes associated with a mutual fund, such as investment management and fund accounting fees. Investors cannot invest directly in the indices.
9 |
Table of Contents
ANNUAL REPORT 2011
LARGE CAP GROWTH FUND
Investment Objective
The Tributary Large Cap Growth Fund seeks long-term capital appreciation.
Manager Commentary
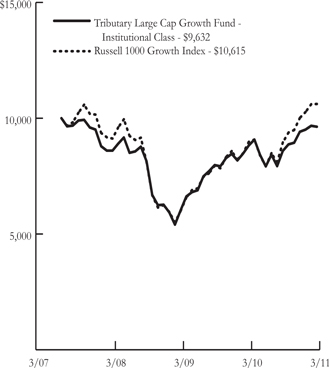
For the year ended March 31, 2011, the Tributary Large Cap Growth Fund returned 9.19% compared to 18.25% for the Russell 1000 Growth Index. Gains were generated by nearly all of the market indices over the past year. Generally speaking, small-cap companies outperformed their large-cap counterparts. Commodities and other economically sensitive instruments performed well. The fixed income markets also chalked up gains. The magnitude or even the breadth of these gains is not remarkable. What is noteworthy however, are the obstacles that were overcome to achieve these returns.
For most of the past year, economic growth was anemic. Attempts to stimulate the domestic economy were proving ineffective. Moreover, concern was growing over the record debt levels being created by these stimulus attempts. The housing markets were weak and consumer credit tight. The unemployment rate remained stubbornly high. Sovereign debt issues emerged to the forefront as Greece and Ireland were the recipients of emergency aid and were forced to implement sweeping austerity measures. A “flash crash”, occurring in May 2010, whereby the markets dropped precipitously only to recover much of that loss. Of recent, increased levels of tumult has reigned in the Middle East and North Africa, featuring regime change and other geopolitical reverberations. To go further, add in a massive natural disaster in Japan leading to an alarming nuclear crisis that has severely hindered the world’s third largest economy.
The above is hardly the typical backdrop for an enduring bull market. Many attribute the year’s success of the markets to the massive monetary easing policy implemented by the U.S. Federal Reserve (the “Fed”) in an effort to boost the economy and ultimately create jobs. Much of this liquidity found its way into the equity markets and served to propel demand and prices upward. The Fed implemented another round of quantitative easing designed to keep bond yields low and to encourage investors to accept greater investment risk in the form of corporate bonds or equities.
Domestic economic news, while not great, showed some promise. In particular, investors appear to be gaining confidence that the domestic economy may be self-sustaining. Fueling this confidence are corporate profits that have generally exceeded expectations. Investor confidence will be bolstered further should the economy prove adroit at navigating growth with $100 per barrel crude oil prices.
In general, the stocks in the index that performed best were those most exposed to the emerging recovery in the U.S. economy. Energy, benefitting from rising crude oil prices, was the best performing market sector. Other rising commodities led to strong advances by economically sensitive stocks in the industrial sector. The information technology sector struggled as
some of its notable bellwether companies reported challenging quarters.
To the extent that the Fund was exposed to the best performing sectors in these time periods, our holdings were confined to companies with consistent, as opposed to cyclical, growth. As is our discipline, we refrained from holding the more economically sensitive companies that investors have favored this year.
Investors will likely fixate on many familiar issues for the remainder of 2011: the economic resiliency of the U.S., the European debt crisis and crude oil prices, to name a few. Unclear is whether the markets will be able to continue to thrive in the face of this uncertainty as they did in the first quarter. Working in the market’s favor should be a continued strong corporate profit environment.
It is far easier to discuss obstacles confronting the markets today than highlighting its tailwinds. The domestic economy certainly needs to top the list of concerns. Once the Fed ends its highly accommodative monetary policy in June, the economy will need to prove that it can sustain its tepid, but steady advance. Congress must also prove that they are taking the debt problems of Europe seriously and that they are taking steps to avoid such a crisis domestically. Crude oil prices exceeding $100 per barrel provide an economic headwind not only domestically, but threaten global growth rates. Other issues paramount for sustained global economic growth are the nuclear containment efforts of Japan and their ability to rebuild the world’s third largest economy following the horrific natural disaster.
Many of these factors are already factored into the market. In fact, should some of these concerns be not as dire as predicted, the market will likely rally. Most are expecting continued softening of the housing market. Even modest signs of strength will likely be a catalyst for building investor confidence. Should any signs of stability emerge from the Middle East or radiation containment in Japan, investor confidence should also build.
As the past year illustrates, it is difficult to accurately forecast macro events and even more difficult to predict the market’s reaction to such events. While Riverbridge Partners LLC (“Riverbridge”) remains keenly aware of short-term, macroeconomic factors, we focus on companies that are building their earnings power over long periods of time, typically greater than five years. Riverbridge is partial to companies possessing the ability to build their long-term earnings power in all market environments.
| 10 |
Table of Contents
ANNUAL REPORT 2011
LARGE CAP GROWTH FUND
Return of a $10,000 Investment as of March 31, 2011
Portfolio Composition as of March 31, 2011
Percentage Based on Total Value of Investments
(Portfolio composition is subject to change)
Average Annual Total Return for the Year Ended March 31, 2011*
| 1 Year | Since Inception†† | |||||||
| Tributary Large Cap Growth Fund - Institutional Class | 9.19% | -1.00% | ||||||
Russell 1000 Growth Index | 18.25% | 1.81% | ||||||
| ||||||||
Prospectus Expense Ratio (Gross/Net)† |
| 1.53%/1.36% | ||||||
Expense Ratio for the Year Ended March 31, 2011 (Gross/Net) | 1.44%/1.26% | |||||||
Past performance does not guarantee future results. The performance data quoted represents past performance and current returns may be lower or higher. Total return figures include change in share price, reinvestment of dividends and capital gains. The investment return and principal value will fluctuate so that an investor’s shares, when redeemed may be worth more or less than the original cost. To obtain performance information current to the most recent month end, please visit our website at www.tributaryfunds.com.
(†)The above expense ratios are from the Fund’s prospectus dated August 1, 2010. Net expense ratio is net of contractual waivers which are in effect from August 1, 2010 through July 31, 2011.
(††) Since July 5, 2007. The Tributary Large Cap Growth Fund was initially offered on July 2, 2007, however, no shareholder activity occurred until July 5, 2007, which is the commencement of operations.
(*) Returns shown do not reflect the deduction of taxes that a shareholder would pay on Fund distributions or the redemption of Fund shares. The returns for certain periods reflect fee waivers and/or reimbursements in effect for that period; absent fee waivers and reimbursements, performance would have been lower.
The line chart assumes an initial investment of $10,000 made on July 5, 2007. Total return is based on net change in net asset value (“NAV”) assuming reinvestment of distributions. Returns shown include the reinvestment of all dividends and other distributions.
The Russell 1000 Growth Index measures the performance of the large-cap growth segment of the U.S. equity universe. It includes those Russell 1000 companies with higher price-to-book-values ratios and higher forecasted growth values.
The above referenced index is unmanaged and does not reflect the deduction of fees or taxes associated with a mutual fund, such as investment management and fund accounting fees. Investors cannot invest directly in the index.
11 |
Table of Contents
ANNUAL REPORT 2011
GROWTH OPPORTUNITIES FUND
Investment Objective
The Tributary Growth Opportunities Fund seeks long-term capital appreciation.
Manager Commentary
During the twelve months ended March 31, 2011, the U.S. economy transitioned from recovery to expansion. Real Gross Domestic Product (“GDP”) grew to a level that surpassed the peak levels achieved prior to the severe downturn suffered from late 2007 to early 2009. Corporate earnings, excluding financials, have now exceeded their previous best levels. While the initial recovery was somewhat disappointing, given the severity of the downturn, the pace of economic growth picked up as the year progressed. As the year came to a close, new job creation had risen to a level more consistent with sustained economic growth, adequate to absorb new entrants into the labor force as well as a slow reduction in the number of unemployed seeking work. These newly employed, and their paychecks, should provide solid support to rising consumer spending. Real estate, both residential and commercial, remains the most significant drag on the current expansion. A considerable overhang of excess, and distressed properties will remain an impediment to a recovery in the construction industry and will also act as an anchor on the value of an important asset on consumer and business balance sheets. One item on corporate balance sheets that has been growing steadily is cash. U.S. companies are in very good shape to begin returning cash to shareholders through dividends and share repurchases, or through mergers and acquisitions. As companies begin to put their cash to work, share prices should see continued strong demand. Another source of demand for stock is a growing reallocation away from bonds and into equity. This shift is likely to accelerate if interest rates continue to rise and bonds lose value. The rise in interest rates could become more substantial this year as the core consumer price index begins to rise at a rate above the U.S. Federal Reserve’s (the “Fed”) target range of 1% to 2%. Stock valuations are attractive for this point in the cycle. Share prices have risen less than earnings during the early part of this cycle, and stock prices remain well below the levels at the peak in 2007, while earnings are now climbing well above the levels achieved in 2007.
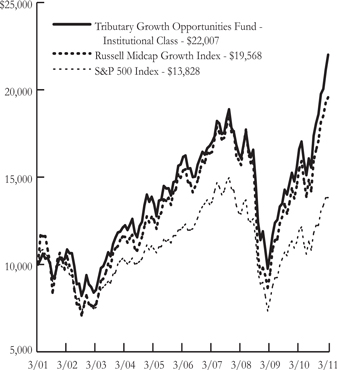
After the stock market bottomed in March of 2009, we saw a very strong rebound in share prices through March 2010. Then, during the first three months of the fiscal year beginning on April 1, 2010, stock prices corrected by more than 10%. Our growth at a reasonable price approach positioned the Fund well for this type of pullback, and the Fund outperformed the Russell Midcap Growth Index by 2.47% during this correction. The downturn in stock prices during this period gave us an opportunity to add positions in more cyclical sectors, given our belief that the U.S. was still early in an economic expansion that would last for a number of years, and carry sales and earnings well above previous peaks. As stock prices resumed their advance in July, the Fund fully participated in a very steady advance over the next nine months, finishing the fiscal year ended March
31, 2011 with a return of 32.54% compared to 26.60% for the Russell Midcap Growth Index and 15.65% for the S&P 500 Index.
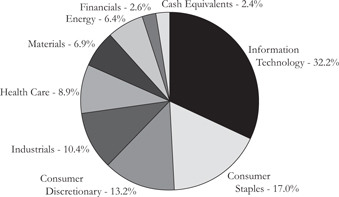
The strongest sectors of the mid-cap market the last year were all cyclical industries: energy (31.9%), consumer discretionary (30.2%), industrials (29.4%), technology (28.9%) and materials (28.0%). The weakest, or perhaps less strong, sectors of the mid-cap market were the more defensive sectors: telecommunication services (14.9%), utilities (17.3%) and health care (18.9%). The Fund generated excess returns over its benchmarks primarily through strong security selection, focusing on those companies with superior growth prospects, but selling at reasonable valuations. Security selection for the Fund was particularly strong in health care, consumer discretionary, financials and energy. A small holding of cash was the most significant drag on relative performance, given the very low returns on cash and the high returns on stocks in the past year. Security selection in the telecommunication services and consumer staples industries trailed the benchmarks slightly.
Individual companies making a large contribution to relative performance included: Valeant Pharmaceuticals International Inc., NetFlix Inc., Chipotle Mexican Grill Inc., Cognizant Technology Solutions Corp. and Herbalife Ltd. Companies held in the Fund that imposed the greatest cost on relative returns included: Comtech Telecommunications Corp., Zoran Corp, Aeropostale Inc., Capella Education Co. and DeVry Inc.
The Fund is managed with a disciplined focus on the fundamental factors of sales, earnings and valuation, striving to achieve long-term growth while limiting the volatility of those returns. We will remain disciplined in the year ahead, seeking reasonably priced companies with superior growth characteristics and sound financial strength.
| 12 |
Table of Contents
ANNUAL REPORT 2011
GROWTH OPPORTUNITIES FUND
Return of a $10,000 Investment as of March 31, 2011
Portfolio Composition as of March 31, 2011
Percentage Based on Total Value of Investments
(Portfolio composition is subject to change)
Average Annual Total Return for the Year Ended March 31, 2011*
| 1 Year | 5 Year | 10 Year | ||||||||||
Tributary Growth Opportunities Fund - Institutional Class | 32.54 | % | 6.37 | % | 8.21 | % | ||||||
Russell Midcap Growth Index | 26.60 | % | 4.93 | % | 6.94 | % | ||||||
S&P 500 Index | 15.65 | % | 2.62 | % | 3.29 | % | ||||||
| ||||||||||||
Prospectus Expense Ratio (Gross/Net)† |
|
| 1.36%/1.22% |
| ||||||||
| Expense Ratio for the Year Ended March 31, 2011 (Gross/Net) |
| 1.30%/1.16% |
| |||||||||
Past performance does not guarantee future results. The performance data quoted represents past performance and current returns may be lower or higher. Total return figures include change in share price, reinvestment of dividends and capital gains. The investment return and principal value will fluctuate so that an investor’s shares, when redeemed may be worth more or less than the original cost. To obtain performance information current to the most recent month end, please visit our website at www.tributaryfunds.com.
(†)The above expense ratios are from the Fund’s prospectus dated August 1, 2010. Net expense ratio is net of contractual waivers which are in effect from August 1, 2010 through July 31, 2011.
(*) Returns shown do not reflect the deduction of taxes that a shareholder would pay on Fund distributions or the redemption of Fund shares. The returns for certain periods reflect fee waivers and/or reimbursements in effect for that period; absent fee waivers and reimbursements, performance would have been lower.
The line chart assumes an initial investment of $10,000 made on March 31, 2001. Total return is based on net change in net asset value (“NAV”) assuming reinvestment of distributions. Returns shown include the reinvestment of all dividends and other distributions.
The Russell Midcap Growth Index measures the performance of the mid-cap growth segment of the U.S. equity universe. It includes those Russell Midcap Index companies with higher price-to-book-value ratios and higher forecasted growth values.
The Fund’s primary index is the Russell Midcap Growth Index, however to provide a broader market comparative we have also listed an additional index.
The S&P 500 Index is an index of 500 selected common stocks, most of which are listed on the New York Stock Exchange. The index is heavily weighted toward stocks with large market capitalizations and represents approximately two-thirds of the total market value of all domestic common stocks.
The above referenced indices are unmanaged and do not reflect the deduction of fees or taxes associated with a mutual fund, such as investment management and fund accounting fees. Investors cannot invest directly in the indices.
13 |
Table of Contents
ANNUAL REPORT 2011
SMALL COMPANY FUND
Investment Objective
The Tributary Small Company Fund seeks long-term capital appreciation.
Manager Commentary
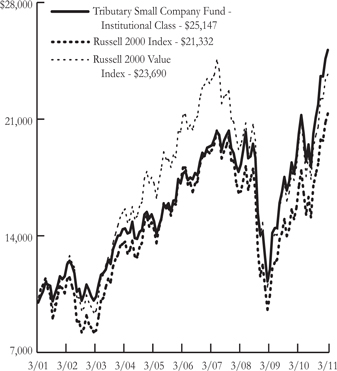
For the year ended March 31, 2011 the Tributary Small Company Fund returned 24.83%, compared to 25.79% for the Russell 2000 Index and 20.63% for the Russell 2000 Value Index. The absolute returns are impressive, considering they followed a year (ended March 31, 2010) in which returns for the small-cap market were 62.76% as measured by the Russell 2000 Index.
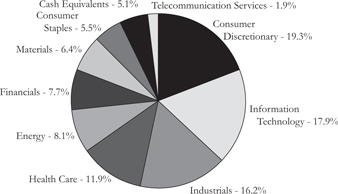
Several themes driving small-cap market returns were evident over the last year. Within the small-cap market, larger capitalization companies outperformed smaller capitalization companies, higher valuations (price-to-earnings ratio, price-to-book ratio and price-to-sales ratio) outperformed lower valuations, companies with higher price volatility (beta) outperformed companies with lower price volatility, companies with higher profitability (return on equity and return on assets) outperformed lower profitability companies and companies with lower dividend yields outperformed. The top three performing sectors in the Russell 2000 Index during the trailing twelve months were energy (61%), information technology (44%) and materials (40%). The three weakest performing sectors in the Russell 2000 Index during the last twelve months were financials (13%), consumer discretionary (15%) and health care (18%).
On an economic sector basis, over the last twelve months the Fund’s strongest relative performance came from companies in the health care, consumer staples and consumer discretionary. The weakest sectors for the Fund were materials, information technology and financials. While it is our policy to keep cash in the Fund at low levels, the small amount held was a drag on performance relative to the Russell 2000 Index in a strong market.
As of March 31, 2011, the Fund held shares of sixty companies diversified across the major sectors of the market. Ten new companies were introduced into the Fund in the past twelve months and fourteen positions were eliminated.
Based on returns in the market over the last year, it would appear that investors no longer believe that the U.S. economy will relapse into a recessionary environment. Many economic indicators have improved, providing evidence that activity in the economy is picking up. For example, the unemployment rate has fallen from 9.7% on March 31, 2010 to 8.8% on March 31, 2011, capacity utilization has increased from just under 72.8% to approximately 77.4%, monthly industrial production was up between 4.5% and 7.8% on a year-over-year basis over the last year, U.S. Gross Domestic Product growth has been in the 1.7% to 3.7% range and consumer confidence has rebounded leading to strong retail sales growth over the last year.
However, other economic measures indicate possible issues on the horizon that will have to be dealt with. Unemployment, while trending down, still remains at a high level. The housing market remains depressed in many areas of the country and
housing starts and building permits remain at low levels. The usage of “quantitative easing” programs by the U.S. Government has likely provided some short-term stimulus for the markets and helped to soften the effects of the recession. Removal or expiration of such programs could result in weaker economic activity and a pull back in the markets. Some argue that the downside to “quantitative easing” is that all the money being borrowed and/or printed could lead to future inflation. Related to inflation, commodity prices have been on the rise. The prices for oil, copper, corn, soybeans, wheat, cocoa, coffee and cotton all have had significant runs over the last year. Ultimately, the prices of the products we buy could be going up as manufacturers pass on the rising cost of these basic materials.
Since we cannot know for certain what lies ahead for the U.S. economy and the markets in the future, we focus on what we do have control and influence over: the Fund’s investment portfolio. We will continue to stick to a philosophy of identifying quality firms that we believe are temporarily priced below their long-term intrinsic value. We will purchase these businesses primarily on individual merit, maintaining a diversified portfolio across economic sectors. Over the long-term, we believe that owning higher quality businesses at reasonable prices will provide Fund shareholders an appropriate rate of return for the level of risk assumed.
| 14 |
Table of Contents
ANNUAL REPORT 2011
SMALL COMPANY FUND
Return of a $10.000 Investment as of March 31. 2011
Portfolio Composition as of March 31, 2011
Percentage Based on Total Value of Investments
(Portfolio composition is subject to change)
Average Annual Total Return for the Year Ended March 31, 2011*
| 1 Year | 5 Year | 10 Year | ||||
Tributary Small Company Fund | 24.83% | 7.23% | 9.66% | |||
Russell 2000 Index | 25.79% | 3.35% | 7.87% | |||
Russell 2000 Value Index | 20.63% | 2.23% | 9.01% |
| ||||||||||
Prospectus Expense Ratio (Gross/Net)† | 1.51%/1.37% | |||||||||
Expense Ratio for the Year Ended March 31, 2011 (Gross/Net) | 1.41%/1.26% | |||||||||
| Since Inception†† | ||||||||||
Tributary Small Company Fund | 7.13% | |||||||||
| ||||||||||
Prospectus Expense Ratio (Gross/Net)† | 1.26%/1.08% | |||||||||
| Expense Ratio for the Period Ended March 31, 2011 (Gross/Net) | 1.10%/0.93% |
| ||||||||
Past performance does not guarantee future results. The performance data quoted represents past performance and current returns may be lower or higher. Total return figures include change in share price, reinvestment of dividends and capital gains. The investment return and principal value will fluctuate so that an investor’s shares, when redeemed may be worth more or less than the original cost. To obtain performance information current to the most recent month end, please visit our website at www.tributaryfunds.com.
(†)The above expense ratios are from the Fund’s prospectus dated August 1, 2010. Net expense ratios are net of contractual waivers which are in effect from August 1, 2010 through July 31, 2011.
(††) Commencement date for the Institutional Plus Class was December 17, 2010.
(*) Returns shown do not reflect the deduction of taxes that a shareholder would pay on Fund distributions or the redemption of Fund shares. The returns for certain periods reflect fee waivers and/or reimbursements in effect for that period; absent fee waivers and reimbursements, performance would have been lower.
The line chart assumes an initial investment of $10,000 made on March 31, 2001. Total return is based on net change in net asset value (“NAV”) assuming reinvestment of distributions. Returns shown include the reinvestment of all dividends and other distributions.
The performance of Institutional Plus Class will be different than Institutional Class based on differences in fees borne by the different classes.
The Russell 2000 Index measures the performance of the small-cap segment of the U.S. equity universe. The Russell 2000 Index is a subset of the Russell 3000® Index representing approximately 10% of the total market capitalization of that index. It includes approximately 2000 of the smallest securities based on a combination of their market cap and current index membership.
The Russell 2000 Value Index measures the performance of small-cap value segment of the U.S. equity universe. It includes those Russell 2000 companies with lower price-to-book-value ratios and lower forecasted growth values.
The above referenced indices are unmanaged and do not reflect the deduction of fees or taxes associated with a mutual fund, such as investment management and fund accounting fees. Investors cannot invest directly in the indices.
15 |
Table of Contents
ANNUAL REPORT 2011
INTERNATIONAL EQUITY FUND
Investment Objective
The Tributary International Equity Fund seeks long-term capital appreciation.
Manager Commentary
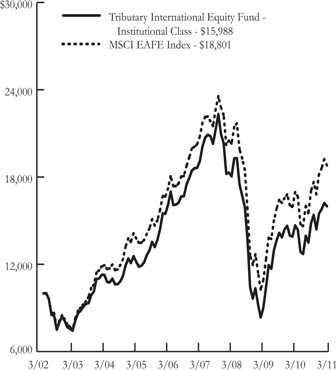
For the year ended March 31, 2011, the Tributary International Equity Fund returned 8.97% compared to 10.90% for the Morgan Stanley Capital International (“MSCI”) Europe, Australasia and Far East (“EAFE”) Index.
The twelve month period ended March 2011 has been reassuring from a fundamental perspective with a solid economic performance around the globe, excellent growth in corporate profits and increasing signs of confidence in the corporate sector. Against this positive backdrop volatility has persisted however, driven primarily by the sovereign debt crisis in Europe but more recently from the political eruptions in the Middle East and North Africa (“MENA”), the resultant spike in the price of oil, as well as the powerful earthquake and deadly tsunami in Japan.
For the last fiscal year, international markets posted strong gains with the MSCI EAFE Index up 10.90%. Emerging markets posted double-digit gains (as measured by the MSCI Emerging Market Index) and outperformed their developed market counterparts. This is a trend that we believe will persist going forward and hence we continue to be comfortable with the Fund’s off-benchmark allocation to emerging markets. In addition, the double digit returns seen from the Eurozone (MSCI EMU Index, 11.41%, gross) and UK (MSCI UK, 13.59%, gross) markets is something we believe investors should not get comfortable with in the developed world as the government and consumer debt overhang are likely to moderate economic growth and corporate earnings for the foreseeable future. Despite a similar return pattern to Japan’s developed market up to the end of December 2010, the recent woes in Japan ensured that by the end of March its twelve month return was reduced (MSCI Japan, 1.60%, gross).
The Fund’s return lagged the benchmark by 1.93% for the period. Despite consistent performance throughout the year, the U.S. Federal Reserve’s (the “Fed”) second round of quantitative easing (“QEII”) announcement in November 2010 initiated a sharp low quality rally in markets, driven predominantly by higher beta and higher volatility names. It was during this period that the Fund’s performance struggled due to the lower beta nature of the portfolio and its commitment to high quality companies. Throughout the period however, the Fund has continued to deliver on our expectations in terms of delivering above average profit surprises, increased dividend payments and dividend growth as well as more aggressive use of corporate balance sheets particularly through mergers and acquisitions activity and buyback programs.
We remain constructive on equity markets and believe there is the potential for further upside over coming months. The key factors underpinning this view are as follows: the global growth background remains supportive; developed economies have
gained economic traction and emerging markets remain very healthy; earnings growth remains very strong and reassuring; companies are willing to spend; despite gains to date, market valuations remain undemanding; while governments and consumers remain cash strapped, company cash levels are at record highs; and the greatest takeover boom in history could be ahead of us in coming quarters!
The key tactical challenge to the positive factors will be the rhetoric and expected actions of global central banks. From a global markets perspective it is the Fed in the U.S. that matters most as its actions dictate the short term market direction. As an example, look at the very strong markets that we saw during and after September 2010 when the Fed poured fuel on the fire with their new QEII.
To date the Fed remains concerned about solving the last downturn and some argue risking inflation or “bubbles” for the future. The Fed in its statements remains pragmatic and cites, for example, the debt deleveraging overhang on the economy, elevated levels of unemployment and the weak housing market. It generally dismisses concerns about inflation. Thus the Fed keeps rates low, its rhetoric is soothing and that, combined with excellent micro company fundamentals, has been a positive cocktail for the markets. These actions are in direct contrast to those of the European Central Bank (“ECB”) in Eurozone which seems intent on tackling the next downturn at an early stage before finding solutions to the fiscal crisis of a number of its member countries. In its April 2011 meeting, the ECB has raised rates and seems intent on further increases during the year. The key danger for global markets lies not so much in what the ECB does, but more so what the Fed does. It remains likely that the Fed won’t raise rates at all in 2011, but that’s not to say that they won’t start rowing back their QEII program and start talking about raising rates. That is likely to be a tricky phase for global equities during the second half of the year.
We remain actively focused on these and the many other issues that are driving markets and market volatility. Our central scenario remains constructive to risk assets clearly, but not blindingly so. Markets remain extremely volatile and we expect such volatility to remain, not least induced by surprise events such as the political unrest in the MENA region and the tragic events in Japan. In such a scenario, we remain convinced that themes such as focusing on corporate strength, strong cash flows and positive earnings momentum remain winning strategies. As earnings growth momentum fades we continue to emphasize dividends and dividend growth. We believe that dividends will constitute an increasing percentage of total return over coming quarters. We continue to believe that away from banks, central banks and governments, the corporate sector will compete for media headlines with their various actions geared at shareholder return, not least through mergers and acquisitions.
| 16 |
Table of Contents
ANNUAL REPORT 2011
INTERNATIONAL EQUITY FUND
Return of a $10,000 Investment as of March 31, 2011
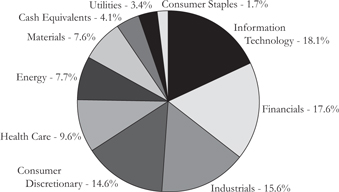
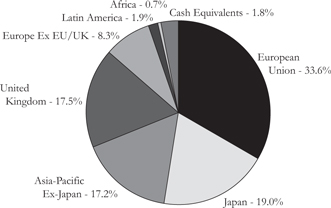
Country Weightings as of March 31, 2011
Percentage Based on Total Value of Investments
(Portfolio composition is subject to change)
Average Annual Total Return for the Year Ended March 31, 2011*
| 1 Year | 5 Year | Since Inception†† | ||||||||||
Tributary International | 8.97% | -0.11% | 5.45% | |||||||||
MSCI EAFE Index | 10.90% | 1.78% | 7.40% | |||||||||
| ||||||||||||
Prospectus Expense Ratio (Gross/Net)† |
| 1.74%/1.54% | ||||||||||
| Expense Ratio for the Year Ended March 31, 2011 (Gross/Net) | 1.60%/1.40% | |||||||||||
Past performance does not guarantee future results. The performance data quoted represents past performance and current returns may be lower or higher. Total return figures include change in share price, reinvestment of dividends and capital gains. The investment return and principal value will fluctuate so that an investor’s shares, when redeemed may be worth more or less than the original cost. To obtain performance information current to the most recent month end, please visit our website at www.tributaryfunds.com.
(†)The above expense ratios are from the Fund’s prospectus dated August 1, 2010. Net expense ratio is net of contractual waivers which are in effect from August 1, 2010 through July 31, 2011.
(††)Commencement date is May 30, 2002.
(*) Returns shown do not reflect the deduction of taxes that a shareholder would pay on Fund distributions or the redemption of Fund shares. The returns for certain periods reflect fee waivers and/or reimbursements in effect for that period; absent fee waivers and reimbursements, performance would have been lower.
The line chart assumes an initial investment of $10,000 made on May 30, 2002. Total return is based on net change in net asset value (“NAV”) assuming reinvestment of distributions. Returns shown include the reinvestment of all dividends and other distributions.
The Morgan Stanley Capital International Europe, Australasia and Far East (“MSCI EAFE”) Index is an arithmetic, market value-weighted average of the performance of over 900 securities listed on the stock exchanges of countries in Europe, Australia, and the Far East.
The above referenced index is unmanaged and does not reflect the deduction of fees or taxes associated with a mutual fund, such as investment management and fund accounting fees. Investors cannot invest directly in the index.
17 |
Table of Contents
ANNUAL REPORT 2011
SCHEDULES OF PORTFOLIO INVESTMENTS
March 31, 2011
SHORT-INTERMEDIATE BOND FUND
Principal | Security Description | Value | ||||
Non-U.S. Government Agency Asset-Backed Securities - 21.5% | ||||||
| $ 331,491 | AmeriCredit Automobile Receivables Trust (insured by FSA Assurance), 5.64%, 09/06/13 | $ | 331,720 | |||
| 76,074 | Banc of America Commercial Mortgage Inc. REMIC, 5.00%, 10/10/45 | 76,559 | ||||
| 315,000 | Bayview Financial Acquisition Trust REMIC, 6.21%, | 312,088 | ||||
| 890,000 | Bear Stearns Commercial Mortgage Securities Inc. REMIC, 5.53%, 09/11/41 | 935,707 | ||||
| 348,010 | Bear Stearns Commercial Mortgage Securities Inc. REMIC, 4.32%, 02/13/46 | 350,030 | ||||
| 535,288 | Chase Funding Mortgage Loan Asset-Backed Certificates REMIC, 4.60%, 01/25/15 | 539,014 | ||||
| 388,535 | Citimortgage Alternative Loan Trust REMIC, 5.25%, 03/25/21 | 383,616 | ||||
| 323,962 | Countrywide Alternative Loan Trust REMIC, 5.80%, | 325,737 | ||||
| 616,069 | Countrywide Asset-Backed Certificates REMIC, 0.33%, 10/25/28 (a) | 606,664 | ||||
| 507,912 | Countrywide Asset-Backed Certificates REMIC, 0.49%, 06/25/34 (a) | 474,147 | ||||
| 714,497 | Countrywide Asset-Backed Certificates REMIC, 0.43%, 07/25/36 (a) | 620,206 | ||||
| 858,000 | Countrywide Asset-Backed Certificates REMIC, 1.50%, 05/25/37 (a) | 38,156 | ||||
| 315,268 | Credit Suisse First Boston Mortgage Securities Corp. REMIC, 5.00%, 08/25/20 | 311,469 | ||||
| 580,000 | First Union National Bank Commercial Mortgage REMIC, 6.67%, 12/12/33 | 593,754 | ||||
| 800,000 | GS Mortgage Securities Corp., 3.65%, 03/31/20 (b) | 803,697 | ||||
| 240,768 | Home Equity Asset Trust REMIC, 0.36%, 07/25/37 (a) | 234,775 | ||||
| 399,477 | LB-UBS Commercial Mortgage Trust REMIC, 6.37%, 12/15/28 | 400,514 | ||||
| 850,000 | LB-UBS Commercial Mortgage Trust REMIC, 6.30%, 11/15/33 | 867,839 | ||||
| 437,372 | MASTR Asset Securitization Trust REMIC, 5.25%, 11/25/35 | 430,125 | ||||
| 326,881 | Nationstar Home Equity Loan Trust REMIC, 0.31%, | 321,741 | ||||
| 307,902 | Nomura Asset Acceptance Corp. REMIC, 6.00%, 03/25/47 (a) | 172,227 | ||||
| 436,657 | Popular ABS Mortgage Pass-Through Trust REMIC, 4.61%, 05/25/35 (a) | 444,144 | ||||
Principal | Security Description | Value | ||||
| $ 147,423 | Popular ABS Mortgage Pass-Through Trust REMIC, 4.62%, | $ | 150,132 | |||
| 600,809 | Preferred Term Securities XXIV Ltd., 0.61%, 03/22/37 (a) (b) (c) | 378,510 | ||||
| 736,051 | Renaissance Home Equity Loan Trust REMIC, 4.50%, 08/25/35 | 733,931 | ||||
| 447,894 | Residential Accredit Loans Inc. REMIC, 5.50%, 01/25/34 | 451,546 | ||||
| 131,388 | Residential Accredit Loans Inc. REMIC, 6.00%, 10/25/34 | 132,709 | ||||
| 385,983 | Residential Accredit Loans Inc. REMIC, 5.50%, 02/25/35 | 361,174 | ||||
| 532,527 | Residential Asset Mortgage Products Inc. (insured by AMBAC Assurance Corp.) REMIC, 4.02%, 03/25/33 | 485,323 | ||||
| 622,102 | Residential Asset Securities Corp. REMIC, 5.96%, 09/25/31 | 599,137 | ||||
| 246,807 | Residential Asset Securities Corp. REMIC, 0.35%, 12/25/31 (a) | 245,250 | ||||
| 395,894 | Residential Asset Securities Corp. REMIC, 3.87%, 05/25/33 | 386,359 | ||||
| 454,251 | Residential Asset Securities Corp. REMIC, 0.44%, 03/25/35 (a) | 438,420 | ||||
| 149,497 | Structured Asset Securities Corp. REMIC, 5.50%, 07/25/33 | 149,445 | ||||
| 231,324 | Triad Auto Receivables Owner Trust (insured by AMBAC Assurance Corp.), 5.31%, 05/13/13 | 232,517 | ||||
| 445,823 | Wells Fargo Home Equity Trust REMIC, 0.39%, 07/25/36 (a) | 402,782 | ||||
Total Non-U.S. Government Agency Asset-Backed Securities | 14,721,164 | |||||
Corporate Bonds - 43.0% |
| |||||
Consumer Discretionary - 2.8% |
| |||||
| 505,000 | Comcast Corp., 6.50%, 01/15/15 | 571,494 | ||||
| 300,000 | Hanesbrands Inc., 8.00%, 12/15/16 | 325,125 | ||||
| 375,000 | Mohawk Industries Inc., 6.88%, 01/15/16 | 402,188 | ||||
| 585,000 | Newell Rubbermaid Inc., 5.50%, 04/15/13 | 627,688 | ||||
| 1,926,495 | ||||||
Consumer Staples - 3.4% |
| |||||
| 423,000 | Bottling Group LLC, 4.63%, 11/15/12 | 448,075 | ||||
| 585,000 | Church & Dwight Co. Inc., 3.35%, 12/15/15 | 586,497 | ||||
| 548,000 | Kellogg Co., 5.13%, 12/03/12 | 584,610 | ||||
| 335,000 | SUPERVALU Inc., 8.00%, 05/01/16 | 335,000 | ||||
| 375,000 | Wal-Mart Stores Inc., 5.00%, 04/05/12 | 390,650 | ||||
| 2,344,832 | ||||||
See accompanying notes to financial statements.
18 |
Table of Contents
ANNUAL REPORT 2011
SCHEDULES OF PORTFOLIO INVESTMENTS
March 31, 2011
SHORT-INTERMEDIATE BOND FUND
Principal | Security Description | Value | ||||
Energy - 1.8% | ||||||
| $ 615,000 | ConocoPhillips, 4.60%, 01/15/15 | $ | 670,248 | |||
| 460,000 | Enterprise Products Operating LLC, 9.75%, 01/31/14 | 551,198 | ||||
| 1,221,446 | ||||||
Financials - 23.2% | ||||||
| 540,000 | ACE INA Holdings Inc., 5.60%, 05/15/15 | 591,771 | ||||
| 585,000 | American Express Credit Corp., 7.30%, 08/20/13 | 654,126 | ||||
| 450,000 | American Honda Finance Corp., 2.66%, | 452,316 | ||||
| 890,000 | Bank of New York Mellon, 6.38%, 04/01/12 | 937,231 | ||||
| 650,000 | BB&T Corp., 6.50%, 08/01/11 | 662,313 | ||||
| 600,000 | Berkshire Hathaway Finance Corp., 5.00%, 08/15/13 | 649,243 | ||||
| 615,000 | Citigroup Inc., 6.50%, 08/19/13 | 672,413 | ||||
| 300,000 | Citigroup Inc., 4.75%, 05/19/15 | 314,461 | ||||
| 720,000 | General Electric Capital Corp., 0.57%, 09/15/14 (a) | 710,726 | ||||
| 620,000 | Goldman Sachs Group Inc., 6.00%, 05/01/14 | 680,816 | ||||
| 280,000 | Hartford Financial Services Group Inc., 4.00%, 03/30/15 | 284,249 | ||||
| 560,000 | JPMorgan Chase & Co., 5.15%, 10/01/15 | 599,875 | ||||
| 415,000 | KeyBank NA, 5.80%, 07/01/14 | 453,229 | ||||
| 1,525,000 | KeyBank NA (guaranteed by FDIC), 3.20%, 06/15/12 | 1,574,930 | ||||
| 410,000 | Merrill Lynch & Co. Inc., 5.45%, 02/05/13 | 434,623 | ||||
| 650,000 | Metropolitan Life Global Funding I, 5.13%, | 704,464 | ||||
| 655,000 | Morgan Stanley, 4.75%, 04/01/14 | 682,521 | ||||
| 650,000 | PNC Funding Corp., 0.50%, 01/31/14 (a) | 645,007 | ||||
| 615,000 | Pricoa Global Funding I, 5.45%, 06/11/14 (b) | 667,151 | ||||
| 1,420,000 | Regions Bank (guaranteed by FDIC), 3.25%, 12/09/11 | 1,449,066 | ||||
| 495,000 | Regions Financial Corp., 7.75%, 11/10/14 | 534,600 | ||||
| 650,000 | State Street Bank & Trust Co., 0.51%, 12/08/15 (a) | 630,504 | ||||
| 285,000 | State Street Capital Trust III, 5.30% (callable at 100 beginning 03/15/13) (d) | 285,371 | ||||
| 650,000 | Wells Fargo Bank NA, 0.52%, 05/16/16 (a) | 620,032 | ||||
| 15,891,038 | ||||||
Principal Amount | Security Description | Value | ||||
Health Care - 0.8% |
| |||||
| $ 580,000 | Medtronic Inc., 1.50%, 04/15/11 | $ | 580,000 | |||
Industrials - 1.3% | ||||||
| 475,000 | Textron Inc., 6.20%, 03/15/15 | 518,415 | ||||
| 325,000 | Union Pacific Corp., 4.88%, 01/15/15 | 352,028 | ||||
| 870,443 | ||||||
Information Technology - 2.1% | ||||||
| 525,000 | CA Inc., 6.13%, 12/01/14 | 581,761 | ||||
| 250,000 | Hewlett-Packard Co., 2.95%, 08/15/12 | 256,912 | ||||
| 520,000 | International Business Machines Corp., 6.50%, 10/15/13 | 585,473 | ||||
| 1,424,146 | ||||||
Materials - 3.8% | ||||||
| 495,000 | Dow Chemical Co., 7.60%, 05/15/14 | 572,034 | ||||
| 515,000 | Mosaic Co., 7.63%, 12/01/16 (b) | 556,200 | ||||
| 335,000 | Nalco Co., 8.25%, 05/15/17 | 365,988 | ||||
| 480,000 | Praxair Inc., 3.95%, 06/01/13 | 508,138 | ||||
| 475,000 | Rio Tinto Finance USA Ltd., 8.95%, 05/01/14 | 571,445 | ||||
| 2,573,805 | ||||||
Telecommunication Services - 1.0% | ||||||
| 630,000 | AT&T Inc., 5.10%, 09/15/14 | 688,940 | ||||
Utilities - 2.8% | ||||||
| 400,000 | Dayton Power & Light Co., 5.13%, 10/01/13 | 435,755 | ||||
| 416,000 | PacifiCorp, 5.45%, 09/15/13 | 454,712 | ||||
| 595,000 | Public Service Co. of Colorado, 7.88%, 10/01/12 | 653,853 | ||||
| 380,000 | Wisconsin Energy Corp., 6.50%, 04/01/11 | 380,000 | ||||
| 1,924,320 | ||||||
Total Corporate Bonds (cost $28,257,415) | 29,445,465 | |||||
Government and Agency Obligations - 29.5% |
| |||||
GOVERNMENT SECURITIES - 21.6% |
| |||||
Federal Home Loan Mortgage |
| |||||
| 1,000,000 | Federal Home Loan Mortgage Corp., 4.50%, 07/15/13 (e) | 1,079,310 | ||||
Municipals - 3.2% | ||||||
| 380,000 | City of Omaha, Nebraska, 2.40%, 12/01/16 | 362,159 | ||||
| 205,000 | Lincoln Nebraska Tax Allocation, Perot Systems Redevelopment Project, 3.25%, 11/01/12 | 208,754 | ||||
| 165,000 | Lincoln Nebraska Tax Allocation, Perot Systems Redevelopment Project, 4.25%, 11/01/14 | 170,013 | ||||
See accompanying notes to financial statements.
19 |
Table of Contents
ANNUAL REPORT 2011
SCHEDULES OF PORTFOLIO INVESTMENTS
March 31, 2011
SHORT-INTERMEDIATE BOND FUND
Shares or | Security Description | Value | ||||
| $ 550,000 | Nebraska Public Power District, Revenue, Series B, 4.14%, 01/01/13 | $ | 571,494 | |||
| 600,000 | New York City Transitional Finance Authority, 3.02%, 02/01/16 | 599,922 | ||||
| 325,000 | State of Mississippi, 2.63%, 11/01/16 | 323,667 | ||||
| 2,236,009 | ||||||
Treasury Inflation Index Securities - 1.0% |
| |||||
| 655,449 | U.S. Treasury Inflation Indexed Note, 0.50%, 04/15/15 (f) | 680,336 | ||||
U.S. Treasury Securities - 15.8% | ||||||
| 3,000,000 | U.S. Treasury Note, 1.75%, 11/15/11 | 3,028,593 | ||||
| 1,800,000 | U.S. Treasury Note, 2.75%, 10/31/13 | 1,878,046 | ||||
| 5,360,000 | U.S. Treasury Note, 2.63%, 12/31/14 | 5,549,272 | ||||
| 365,000 | U.S. Treasury Note, 2.38%, 03/31/16 | 367,538 | ||||
| 10,823,449 | ||||||
U.S. GOVERNMENT MORTGAGE-BACKED SECURITIES - 7.9% | ||||||
Federal Home Loan Mortgage Corp. - 3.0% |
| |||||
| 845,031 | Federal Home Loan Mortgage Corp. REMIC, 4.50%, 12/15/17 | 867,579 | ||||
| 1,177,106 | Federal Home Loan Mortgage Corp. REMIC, 4.00%, 03/15/20 | 1,216,993 | ||||
| 2,084,572 | ||||||
Federal National Mortgage Association - 4.9% |
| |||||
| 829,461 | Federal National Mortgage Association REMIC, 4.50%, 11/25/23 | 871,286 | ||||
| 1,292,815 | Federal National Mortgage Association REMIC, 4.00%, 02/25/26 | 1,349,133 | ||||
| 880,595 | Federal National Mortgage Association REMIC, 5.50%, 11/25/34 | 922,063 | ||||
| 1,357,685 | Federal National Mortgage Association, Interest Only REMIC, 5.00%, 03/25/39 | 195,718 | ||||
| 3,338,200 | ||||||
Total Government and Agency Obligations (cost $20,098,517) | 20,241,876 | |||||
Preferred Stocks - 0.7% | ||||||
| 550 | US Bancorp, Series A (callable at 1,000 beginning on | 467,505 | ||||
Total Preferred Stocks (cost $564,328) | 467,505 | |||||
Exchange Traded Funds - 0.4% | ||||||
| 3,383 | iShares iBoxx High Yield Corporate Bond Fund | 311,101 | ||||
Total Exchange Traded Funds | 311,101 | |||||
Shares | Security Description | Value | ||||
Investment Company - 1.3% | ||||||
| 88,140 | Federated Institutional High-Yield Bond Fund | $ | 887,567 | |||
Total Investment Company (cost $750,000) | 887,567 | |||||
Short Term Investments - 2.6% | ||||||
Investment Company - 2.6% | ||||||
| 1,782,866 | Goldman Sachs Financial Square Funds, Treasury Obligations Fund, | 1,782,866 | ||||
Total Short Term Investments | 1,782,866 | |||||
Total Investments - 99.0% | 67,857,544 | |||||
Other assets in excess of liabilities - 1.0% | 692,349 | |||||
NET ASSETS - 100% | $ | 68,549,893 | ||||
(a) | Variable rate security. The rate reflected is the rate in effect at March 31, 2011. | |||
(b) | Security is exempt from registration under Rule 144A of the Securities Act of 1933, as amended. The security may be resold in transactions exempt from registration, normally to qualified buyers. This security has been deemed liquid by the Fund’s investment adviser based on procedures approved by the Tributary Funds’ Board of Directors. | |||
(c) | Security fair valued in good faith in accordance with the procedures established by the Tributary Funds’ Board of Directors. Good faith fair valued securities may be classified as Level 2 or Level 3 for Financial Accounting Standards Board (“FASB”) Accounting Standards Codification (“ASC”) Topic 820 “Fair Value Measurements and Disclosures” based on the applicable valuation inputs. See Security Valuation in the Notes to Financial Statements. | |||
(d) | Perpetual maturity security. Interest rate is fixed until the first call date and variable thereafter. | |||
(e) | This security is a direct debt of the agency and not collateralized by mortgages. | |||
(f) | U.S. Treasury inflation indexed note, par amount is adjusted for inflation. | |||
(g) | Dividend yield changes daily to reflect current market conditions. Rate was the quoted yield as of March 31, 2011. | |||
AMBAC | AMBAC Indemnity Corp. | |||
FDIC | Federal Deposit Insurance Corporation | |||
FSA | Financial Security Assurance Inc. | |||
REMIC | Real Estate Mortgage Investment Conduit | |||
See accompanying notes to financial statements.
20 |
Table of Contents
ANNUAL REPORT 2011
SCHEDULES OF PORTFOLIO INVESTMENTS
March 31, 2011
INCOME FUND
Principal | Security Description | Value | ||||
Non-U.S. Government Agency Asset-Backed Securities - 24.4% | ||||||
| $ 1,348,000 | Banc of America Commercial Mortgage Inc. REMIC, 5.37%, 09/10/47 (a) | $ | 1,453,865 | |||
| 476,779 | Bear Stearns Asset Backed Securities Trust REMIC, 5.00%, 10/25/33 | 472,303 | ||||
| 1,000,000 | Bear Stearns Commercial Mortgage Securities Inc. REMIC, 5.53%, 09/11/41 | 1,051,357 | ||||
| 758,791 | Citigroup Mortgage Loan Trust Inc. REMIC, 6.50%, 07/25/34 | 763,108 | ||||
| 388,535 | Citimortgage Alternative Loan Trust REMIC, 5.25%, 03/25/21 | 383,616 | ||||
| 323,962 | Countrywide Alternative Loan Trust REMIC, 5.80%, 08/25/36 (a) | 325,737 | ||||
| 273,652 | Countrywide Asset-Backed Certificates REMIC, 0.49%, 06/25/34 (a) | 255,460 | ||||
| 448,074 | Countrywide Asset-Backed Certificates REMIC, 0.43%, 07/25/36 (a) | 388,943 | ||||
| 1,075,000 | Countrywide Asset-Backed Certificates REMIC, 1.50%, 05/25/37 (a) | 47,806 | ||||
| 315,268 | Credit Suisse First Boston Mortgage Securities Corp. REMIC, 5.00%, 08/25/20 | 311,469 | ||||
| 331,835 | Credit Suisse First Boston Mortgage Securities Corp. REMIC, 5.75%, 04/25/33 | 341,973 | ||||
| 635,000 | First Union National Bank Commercial Mortgage REMIC, 6.67%, 12/12/33 | 650,058 | ||||
| 575,000 | GS Mortgage Securities Corp., 3.65%, 03/31/20 (b) | 577,657 | ||||
| 210,874 | Home Equity Asset Trust REMIC, 0.36%, | 205,625 | ||||
| 550,695 | LB-UBS Commercial Mortgage Trust REMIC, 6.37%, 12/15/28 | 552,125 | ||||
| 1,234,000 | LB-UBS Commercial Mortgage Trust REMIC, 6.30%, 11/15/33 | 1,259,898 | ||||
| 403,728 | MASTR Asset Securitization Trust REMIC, 5.25%, 11/25/35 | 397,038 | ||||
| 333,561 | Nomura Asset Acceptance Corp. REMIC, 6.00%, 03/25/47 (a) | 186,580 | ||||
| 1,013,018 | Preferred Term Securities XXI Ltd., 0.96%, | 126,627 | ||||
| 619,732 | Preferred Term Securities XXIV Ltd., 0.61%, 03/22/37 (a) (b) (c) | 390,431 | ||||
| 468,715 | Residential Accredit Loans Inc. REMIC, 5.50%, 01/25/34 | 472,537 | ||||
| 648,830 | Residential Accredit Loans Inc. REMIC, 6.00%, 10/25/34 | 655,354 | ||||
| 260,014 | Residential Accredit Loans Inc. REMIC, 5.50%, 02/25/35 | 243,301 | ||||
Principal | Security Description | Value | ||||
| $ 684,021 | Residential Asset Mortgage Products Inc. (insured by AMBAC Assurance Corp.) REMIC, 4.02%, 03/25/33 | $ | 623,389 | |||
| 522,566 | Residential Asset Securities Corp. REMIC, 5.96%, 09/25/31 | 503,275 | ||||
| 164,282 | Structured Asset Securities Corp. REMIC, 5.50%, 07/25/33 | 164,225 | ||||
| 499,101 | Structured Asset Securities Corp. (insured by MBIA Assurance Corp.) REMIC, 5.30%, 09/25/33 | 496,973 | ||||
| 231,324 | Triad Auto Receivables Owner Trust (insured by AMBAC Assurance Corp.), 5.31%, 05/13/13 | 232,517 | ||||
| 267,329 | Wells Fargo Home Equity Trust REMIC, 0.39%, 07/25/36 (a) | 241,521 | ||||
Total Non-U.S. Government Agency Asset-Backed Securities | 13,774,768 | |||||
Corporate Bonds - 23.4% | ||||||
Consumer Discretionary - 2.1% | ||||||
| 310,000 | Comcast Corp., 6.50%, 01/15/17 | 353,014 | ||||
| 200,000 | Hanesbrands Inc., 8.00%, 12/15/16 | 216,750 | ||||
| 325,000 | Mohawk Industries Inc., 6.88%, 01/15/16 | 348,563 | ||||
| 295,000 | Newell Rubbermaid Inc., 4.70%, 08/15/20 | 291,138 | ||||
| 1,209,465 | ||||||
Consumer Staples - 1.3% | ||||||
| 245,000 | Church & Dwight Co. Inc., 3.35%, 12/15/15 | 245,627 | ||||
| 285,000 | PepsiCo Inc., 7.90%, 11/01/18 | 361,740 | ||||
| 165,000 | SUPERVALU Inc., 8.00%, 05/01/16 | 165,000 | ||||
| 772,367 | ||||||
Energy - 1.3% | ||||||
| 335,000 | Enterprise Products Operating LLC, 6.30%, 09/15/17 | 377,697 | ||||
| 270,000 | Tosco Corp., 8.13%, 02/15/30 | 345,042 | ||||
| 722,739 | ||||||
Financials - 11.3% |
| |||||
| 340,000 | American Express Co., 6.80%, 09/01/66 (a) | 346,800 | ||||
| 325,000 | Chubb Corp., 6.80%, 11/15/31 | 364,182 | ||||
| 300,000 | Citigroup Inc., 6.50%, 08/19/13 | 328,006 | ||||
| 185,000 | Citigroup Inc., 8.50%, 05/22/19 | 228,267 | ||||
| 390,000 | General Electric Capital Corp., 0.49%, | 375,111 | ||||
| 335,000 | Goldman Sachs Capital I, 6.35%, 02/15/34 | 321,906 | ||||
| 335,000 | Goldman Sachs Group Inc., 6.25%, 09/01/17 | 366,800 | ||||
See accompanying notes to financial statements.
21 |
Table of Contents
ANNUAL REPORT 2011
SCHEDULES OF PORTFOLIO INVESTMENTS
March 31, 2011
INCOME FUND
Principal | Security Description | Value | ||||
| $ 150,000 | Hartford Financial Services Group Inc., 4.00%, 03/30/15 | $ | 152,276 | |||
| 325,000 | JPMorgan Chase Capital XXV, 6.80%, 10/01/37 | 326,669 | ||||
| 285,000 | KeyBank NA, 5.80%, 07/01/14 | 311,254 | ||||
| 320,000 | Merrill Lynch & Co. Inc., 5.00%, 01/15/15 | 338,545 | ||||
| 310,000 | Metropolitan Life Global Funding I, | 335,975 | ||||
| 350,000 | Morgan Stanley, 4.75%, 04/01/14 | 364,706 | ||||
| 375,000 | PNC Funding Corp., 0.50%, 01/31/14 (a) | 372,120 | ||||
| 285,000 | Prudential Financial Inc., 7.38%, 06/15/19 | 334,623 | ||||
| 250,000 | Regions Financial Corp., 7.75%, 11/10/14 | 270,000 | ||||
| 375,000 | State Street Bank & Trust Co., 0.51%, 12/08/15 (a) | 363,752 | ||||
| 185,000 | State Street Capital Trust III, 5.30% (callable at 100 beginning 03/15/13) (e) | 185,240 | ||||
| 353,000 | UBS Preferred Funding Trust V, 6.24% (callable at 100 beginning 05/15/16) (e) | 348,587 | ||||
| 305,000 | Wachovia Bank NA, 6.60%, 01/15/38 | 342,617 | ||||
| 6,377,436 | ||||||
Industrials - 1.7% | ||||||
| 400,000 | Pitney Bowes Inc., 5.25%, 01/15/37 | 407,009 | ||||
| 275,000 | Textron Inc., 6.20%, 03/15/15 | 300,135 | ||||
| 220,000 | Union Pacific Corp., 5.70%, 08/15/18 | 246,323 | ||||
| 953,467 | ||||||
Information Technology - 1.3% | ||||||
| 320,000 | CA Inc., 6.13%, 12/01/14 | 354,597 | ||||
| 300,000 | International Business Machines Corp., 7.00%, 10/30/25 | 369,665 | ||||
| 724,262 | ||||||
Materials - 2.0% | ||||||
| 290,000 | Martin Marietta Materials Inc., 6.60%, 04/15/18 | 317,948 | ||||
| 270,000 | Mosaic Co., 7.63%, 12/01/16 (b) | 291,600 | ||||
| 165,000 | Nalco Co., 8.25%, 05/15/17 | 180,262 | ||||
295,000 | Rio Tinto Finance USA Ltd., 8.95%, 05/01/14 | 354,898 | ||||
| 1,144,708 | ||||||
Telecommunication Services - 0.6% | ||||||
| 320,000 | AT&T Inc., 5.50%, 02/01/18 | 349,310 | ||||
Utilities - 1.8% | ||||||
| 315,000 | Alabama Power Co., 5.50%, 10/15/17 | 351,848 | ||||
| 300,000 | Dayton Power & Light Co., 5.13%, 10/01/13 | 326,816 | ||||
Principal | Security Description | Value | ||||
| $ 300,000 | PacifiCorp, 6.25%, 10/15/37 | $ | 331,742 | |||
| 1,010,406 | ||||||
Total Corporate Bonds (cost $12,541,587) | 13,264,160 | |||||
Government and Agency Obligations - 47.2% |
| |||||
GOVERNMENT SECURITIES - 17.7% |
| |||||
Municipals - 2.4% | ||||||
| 335,000 | Nebraska Public Power District, RB, Series B, 4.85%, 01/01/14 | 357,907 | ||||
| 225,000 | New York City, New York, Water Finance Authority & Sewer Revenue, 5.72%, 06/15/42 | 222,622 | ||||
| 215,000 | State of Connecticut, Public Improvements, 4.95%, 12/01/20 | 229,579 | ||||
| 215,000 | State of Connecticut, Public Improvements, 5.63%, 12/01/29 | 214,579 | ||||
| 350,000 | University of Nebraska, RB, Series B, 5.70%, 07/01/29 | 344,158 | ||||
| 1,368,845 | ||||||
Treasury Inflation Index Securities - 1.7% |
| |||||
| 381,075 | U.S. Treasury Inflation Indexed Note, 0.50%, 04/15/15 (f) | 395,544 | ||||
| 256,432 | U.S. Treasury Inflation Indexed Note, 2.13%, 01/15/19 (f) | 286,143 | ||||
| 290,384 | U.S. Treasury Inflation Indexed Note, 2.13%, 02/15/40 (f) | 307,058 | ||||
| 988,745 | ||||||
U.S. Treasury Securities - 13.6% |
| |||||
| 2,750,000 | U.S. Treasury Bond, 4.38%, 11/15/39 | 2,690,273 | ||||
| 1,450,000 | U.S. Treasury Note, 3.50%, 02/15/18 | 1,509,473 | ||||
| 3,425,000 | U.S. Treasury Note, 3.63%, 02/15/21 | 3,473,700 | ||||
| 7,673,446 | ||||||
U.S. GOVERNMENT MORTGAGE-BACKED SECURITIES - 29.5% |
| |||||
Federal Home Loan Mortgage Corp. - 12.8% |
| |||||
| 1,090,000 | Federal Home Loan Mortgage Corp. REMIC, 4.50%, 04/15/19 | 1,164,562 | ||||
| 1,244,000 | Federal Home Loan Mortgage Corp. REMIC, 4.50%, 06/15/21 | 1,302,154 | ||||
| 2,030,000 | Federal Home Loan Mortgage Corp. REMIC, 5.00%, 02/15/29 | 2,087,260 | ||||
| 541,308 | Federal Home Loan Mortgage Corp. REMIC, 5.50%, 08/15/29 | 550,183 | ||||
| 2,045,153 | Federal Home Loan Mortgage Corp., 4.50%, 11/01/30 | 2,113,915 | ||||
| 7,218,074 | ||||||
Federal National Mortgage Association - 16.7% |
| |||||
| 401,430 | Federal National Mortgage Association, 5.50%, 11/01/16 | 435,403 | ||||
See accompanying notes to financial statements.
22 |
Table of Contents
ANNUAL REPORT 2011
SCHEDULES OF PORTFOLIO INVESTMENTS
March 31, 2011
INCOME FUND
Shares or | Security Description | Value | ||||
| $ 101,564 | Federal National Mortgage Association, 4.50%, 12/01/18 | $ | 107,543 | |||
| 1,315,000 | Federal National Mortgage Association REMIC, 4.00%, 02/25/19 | 1,377,195 | ||||
| 272,545 | Federal National Mortgage Association REMIC, 5.00%, 07/25/19 | 277,338 | ||||
| 879,296 | Federal National Mortgage Association, 7.50%, 08/01/22 | 1,020,398 | ||||
| 1,334,928 | Federal National Mortgage Association, 4.00%, 06/01/24 | 1,374,142 | ||||
| 332,857 | Federal National Mortgage Association REMIC, 5.50%, 12/25/32 | 343,383 | ||||
| 212,995 | Federal National Mortgage Association, 5.00%, 08/01/34 | 224,600 | ||||
| 1,370,000 | Federal National Mortgage Association REMIC, 5.50%, 08/25/34 | 1,495,359 | ||||
| 295,613 | Federal National Mortgage Association, 5.50%, 08/01/37 | 317,952 | ||||
| 1,015,167 | Federal National Mortgage Association, 6.00%, 09/01/38 | 1,110,863 | ||||
| 1,133,444 | Federal National Mortgage Association, 4.50%, 01/01/40 | 1,161,103 | ||||
| 2,041,439 | Federal National Mortgage Association, Interest Only REMIC, 4.50%, 03/25/38 | 223,082 | ||||
| 9,468,361 | ||||||
Total Government and Agency Obligations (cost $26,223,300) | 26,717,471 | |||||
Preferred Stocks - 0.9% | ||||||
580 |
US Bancorp, Series A (callable at 1,000 beginning on 04/15/11) (e) | 493,006 | ||||
Total Preferred Stocks (cost $595,666) | 493,006 | |||||
Exchange Traded Funds - 0.8% | ||||||
| 5,047 | iShares iBoxx High Yield Corporate Bond Fund | 464,122 | ||||
Total Exchange Traded Funds | 464,122 | |||||
Investment Company - 1.6% | ||||||
| 88,140 | Federated Institutional High-Yield Bond Fund | 887,567 | ||||
Total Investment Company (cost $750,000) | 887,567 | |||||
Shares | Security Description | Value | ||||
Short Term Investments - 1.1% | ||||||
Investment Company - 1.1% | ||||||
| 620,244 | Goldman Sachs Financial Square Funds, Treasury | $ | 620,244 | |||
Total Short Term Investments | 620,244 | |||||
Total Investments - 99.4% | 56,221,338 | |||||
Other assets in excess of liabilities - 0.6% | 320,473 | |||||
NET ASSETS - 100% | $ | 56,541,811 | ||||
(a) | Variable rate security. The rate reflected is the rate in effect at March 31, 2011. | |||
(b) | Security is exempt from registration under Rule 144A of the Securities Act of 1933, as amended. The security may be resold in transactions exempt from registration, normally to qualified buyers. This security has been deemed liquid by the Fund’s investment adviser based on procedures approved by the Tributary Funds’ Board of Directors. | |||
(c) | Security fair valued in good faith in accordance with the procedures established by the Tributary Funds’ Board of Directors. Good faith fair valued securities may be classified as Level 2 or Level 3 for Financial Accounting Standards Board (“FASB”) Accounting Standards Codification (“ASC”) Topic 820 “Fair Value Measurements and Disclosures” based on the applicable valuation inputs. See Security Valuation in the Notes to Financial Statements. | |||
(d) | Non-income producing security. | |||
(e) | Perpetual maturity security. Interest rate is fixed until the first call date and variable thereafter. | |||
(f) | U.S. Treasury inflation indexed note, par amount is adjusted for inflation. | |||
(g) | Dividend yield changes daily to reflect current market conditions. Rate was the quoted yield as of March 31, 2011. | |||
AMBAC | AMBAC Indemnity Corp. | |||
MBIA | Municipal Bond Investors Assurance | |||
RB | Revenue Bond | |||
REMIC | Real Estate Mortgage Investment Conduit | |||
See accompanying notes to financial statements.
23 |
Table of Contents
ANNUAL REPORT 2011
SCHEDULES OF PORTFOLIO INVESTMENTS
March 31, 2011
BALANCED FUND
Shares | Security Description | Value | ||||
Common Stocks - 66.7% |
| |||||
Consumer Discretionary - 8.6% |
| |||||
| 5,200 | BorgWarner Inc. (a) | $ | 414,388 | |||
| 1,550 | Chipotle Mexican | 422,174 | ||||
| 17,600 | Comcast Corp. - Class A | 435,072 | ||||
| 6,400 | Guess? Inc. | 251,840 | ||||
| 4,500 | McDonald’s Corp. | 342,405 | ||||
| 1,300 | NetFlix Inc. (a) | 308,529 | ||||
| 7,200 | Nordstrom Inc. | 323,136 | ||||
| 6,700 | Tempur-Pedic International Inc. (a) | 339,422 | ||||
| 5,900 | Ulta Salon Cosmetics & Fragrance Inc. (a) | 283,967 | ||||
| 1,500 | Wynn Resorts Ltd. | 190,875 | ||||
| 3,311,808 | ||||||
Consumer Staples - 6.4% | ||||||
| 5,600 | Church & Dwight Co. Inc. | 444,304 | ||||
| 5,100 | Colgate-Palmolive Co. | 411,876 | ||||
| 6,000 | Herbalife Ltd. | 488,160 | ||||
| 10,500 | Kraft Foods Inc. - Class A | 329,280 | ||||
| 4,500 | PepsiCo Inc. | 289,845 | ||||
| 6,000 | PriceSmart Inc. | 219,840 | ||||
| 4,300 | Ralcorp Holdings Inc. (a) | 294,249 | ||||
| 2,477,554 | ||||||
Energy - 9.0% | ||||||
| 3,800 | Apache Corp. | 497,496 | ||||
| 1,900 | CARBO Ceramics Inc. | 268,128 | ||||
| 6,400 | Exxon Mobil Corp. | 538,432 | ||||
| 4,600 | Helmerich & Payne Inc. | 315,974 | ||||
| 4,100 | Noble Energy Inc. | 396,265 | ||||
| 5,600 | Occidental Petroleum Corp. | 585,144 | ||||
| 6,000 | Peabody Energy Corp. | 431,760 | ||||
| 4,800 | Schlumberger Ltd. | 447,648 | ||||
| 3,480,847 | ||||||
Financials - 8.1% | ||||||
| 5,800 | ACE Ltd. | 375,260 | ||||
| 3,900 | Affiliated Managers Group Inc. (a) | 426,543 | ||||
| 6,200 | AFLAC Inc. | 327,236 | ||||
| 1,800 | BlackRock Inc. | 361,818 | ||||
| 4,800 | Credit Acceptance Corp. (a) | 340,608 | ||||
| 7,000 | HCC Insurance Holdings Inc. | 219,170 | ||||
| 9,900 | JPMorgan Chase & Co. | 456,390 | ||||
| 6,000 | State Street Corp. | 269,640 | ||||
| 12,900 | U.S. Bancorp | 340,947 | ||||
| 3,117,612 | ||||||
Health Care - 8.3% | ||||||
| 6,000 | Abbott Laboratories | 294,300 | ||||
| 5,000 | Biogen Idec Inc. (a) | 366,950 | ||||
| 5,500 | Catalyst Health Solutions Inc. (a) | 307,615 | ||||
| 3,800 | Cerner Corp. (a) | 422,560 | ||||
| 3,900 | Medco Health Solutions Inc. (a) | 219,024 | ||||
Shares | Security Description | Value | ||||
| 5,900 | Medidata Solutions Inc. (a) | $ | 150,863 | |||
| 11,100 | PSS World Medical Inc. (a) | 301,365 | ||||
| 3,200 | Stryker Corp. | 194,560 | ||||
| 6,200 | Thermo Fisher Scientific Inc. (a) | 344,410 | ||||
| 11,966 | Valeant Pharmaceuticals International Inc. | 596,026 | ||||
| 3,197,673 | ||||||
Industrials - 8.3% | ||||||
| 3,900 | 3M Co. | 364,650 | ||||
| 6,000 | AGCO Corp. (a) | 329,820 | ||||
| 6,500 | Emerson Electric Co. | 379,795 | ||||
| 14,300 | General Electric Co. | 286,715 | ||||
| 3,700 | Joy Global Inc. | 365,597 | ||||
| 4,600 | Norfolk Southern Corp. | 318,642 | ||||
| 6,900 | Pall Corp. | 397,509 | ||||
| 4,000 | Parker Hannifin Corp. | 378,720 | ||||
| 4,500 | Roper Industries Inc. | 389,070 | ||||
| 3,210,518 | ||||||
Information Technology - 12.9% | ||||||
| 10,500 | Adobe Systems Inc. (a) | 348,180 | ||||
| 4,500 | Akamai Technologies Inc. (a) | 171,000 | ||||
| 1,600 | Apple Inc. (a) | 557,520 | ||||
| 5,600 | Citrix Systems Inc. (a) | 411,376 | ||||
| 6,500 | Cognizant Technology Solutions Corp. - Class A (a) | 529,100 | ||||
| 2,500 | Equinix Inc. (a) | 227,750 | ||||
| 3,000 | Factset Research Systems Inc. | 314,190 | ||||
| 8,100 | Hewlett-Packard Co. | 331,857 | ||||
| 15,000 | Intel Corp. | 302,550 | ||||
| 1,000 | MasterCard Inc. - Class A | 251,720 | ||||
| 13,000 | Mentor Graphics Corp. (a) | 190,190 | ||||
| 10,800 | Microsoft Corp. | 273,888 | ||||
| 15,000 | Oracle Corp. | 500,550 | ||||
| 9,000 | SRA International | 255,240 | ||||
| 9,300 | Texas Instruments Inc. | 321,408 | ||||
| 4,986,519 | ||||||
Materials - 3.1% | ||||||
| 3,200 | Agrium Inc. | 295,232 | ||||
| 2,600 | Cliffs Natural Resources Inc. | 255,528 | ||||
| 3,400 | Praxair Inc. | 345,440 | ||||
| 4,600 | Sigma-Aldrich Corp. | 292,744 | ||||
| 1,188,944 | ||||||
Telecommunication Services - 0.8% | ||||||
| 15,000 | Partner Communications | 285,150 | ||||
Utilities - 1.2% | ||||||
| 4,200 | NextEra Energy Inc. | 231,504 | ||||
See accompanying notes to financial statements.
24 |
Table of Contents
ANNUAL REPORT 2011
SCHEDULES OF PORTFOLIO INVESTMENTS
March 31, 2011
BALANCED FUND
Shares or | Security Description | Value | ||||
| 5,400 | PG&E Corp. | $ | 238,572 | |||
| 470,076 | ||||||
Total Common Stocks (cost $17,002,110) | 25,726,701 | |||||
Corporate Bonds - 16.7% | ||||||
Consumer Discretionary - 1.4% | ||||||
| $500,000 | Home Depot Inc., 5.40%, 03/01/16 | 552,905 | ||||
Consumer Staples - 0.8% | ||||||
| 300,000 | WM Wrigley Jr. Co., 2.45%, 06/28/12 (b) | 301,019 | ||||
Energy - 1.6% | ||||||
| 300,000 | BP Capital Markets Plc, 3.63%, 05/08/14 | 311,582 | ||||
| 300,000 | Shell International Finance BV, 3.25%, 09/22/15 | 309,690 | ||||
| 621,272 | ||||||
Financials - 9.9% | ||||||
| 400,000 | American Express Credit Co., 5.88%, 05/02/13 | 431,882 | ||||
| 500,000 | Bank of America NA, 6.00%, 06/15/16 | 528,076 | ||||
| 500,000 | Commonwealth Bank of Australia, | 485,156 | ||||
| 300,000 | General Electric Capital Corp., 5.63%, 09/15/17 | 325,538 | ||||
| 400,000 | Goldman Sachs Group Inc., 3.63%, 08/01/12 | 412,504 | ||||
| 500,000 | KeyCorp, 6.50%, 05/14/13 | 544,970 | ||||
| 250,000 | Regions Bank, 7.50%, 05/15/18 | 264,263 | ||||
| 300,000 | Vornado Realty Trust, 4.25%, 04/01/15 | 307,184 | ||||
| 500,000 | Wachovia Corp., 5.25%, 08/01/14 | 534,735 | ||||
| 3,834,308 | ||||||
Industrials - 1.4% | ||||||
| 500,000 | Harley-Davidson Funding Corp., 6.80%, 06/15/18 (b) | 548,902 | ||||
Telecommunication Services - 0.9% | ||||||
| 300,000 | Verizon Communications Inc., 4.90%, 09/15/15 | 327,056 | ||||
Utilities - 0.7% | ||||||
| 250,000 | Exelon Generation Co. LLC, 5.20%, 10/01/19 | 253,354 | ||||
Total Corporate Bonds (cost $6,131,823) | 6,438,816 | |||||
Principal | Security Description | Value | ||||
Government and Agency Obligations - 11.6% |
| |||||
GOVERNMENT SECURITIES - 11.6% | ||||||
Municipals - 9.6% | ||||||
| $ 250,000 | Aurora Illinois, GO, Series A, 4.25%, 12/30/17 | $ | 256,070 | |||
| 250,000 | City of Industry California, Sales Tax Revenue, 7.00%, 01/01/21 | 258,635 | ||||
| 300,000 | County of St. Charles Missouri (Insured by MBIA Insurance Corp), Sales Tax Revenue, 5.16%, 10/01/20 | 305,904 | ||||
| 190,000 | Denver City & County Board of Water Commission, Water Revenue, Series A, 5.00%, 12/15/19 | 193,420 | ||||
| 100,000 | Florida State Board of Education, Lottery Revenue, 5.19%, 07/01/19 | 104,117 | ||||
| 265,000 | Hamden Connecticut, GO, | 273,019 | ||||
| 195,000 | Kansas Development Finance Authority, Kansas Project Revenue, Series N, 5.20%, 11/01/19 | 209,732 | ||||
| 300,000 | Metro Wastewater Reclamation District, Sewer Revenue, Series B, 5.02%, 04/01/20 | 310,437 | ||||
| 200,000 | New Orleans, Louisiana, Public Improvements, Series A, 7.20%, 12/01/19 | 208,530 | ||||
| 205,000 | Northern Illinois Municipal Power Agency, Power Project Revenue, 5.69%, 01/01/17 | 212,153 | ||||
| 200,000 | Parker Colorado, Series A, 5.30%, 11/01/18 | 204,930 | ||||
| 200,000 | Reeves County Texas, Correctional Facilities, 7.40%, 12/01/17 | 206,340 | ||||
| 200,000 | Santa Monica Community College District, Series A, 5.73%, 08/01/24 | 204,686 | ||||
| 350,000 | State of California, University Revenue Bonds, 5.45%, 11/01/22 | 361,452 | ||||
| 280,000 | Tulsa Airports Improvement Trust, Airport & Marina Revenue, Series B, 6.50%, 06/01/21 | 287,862 | ||||
| 100,000 | Vista Community Development Commission California, 7.61%, 09/01/21 | 102,191 | ||||
| 3,699,478 | ||||||
Treasury Inflation Index Securities - 2.0% | ||||||
| 317,780 | U.S. Treasury Inflation Indexed Note, 2.38%, 01/15/17 (e) | 358,124 | ||||
See accompanying notes to financial statements.
25 |
Table of Contents
ANNUAL REPORT 2011
SCHEDULES OF PORTFOLIO INVESTMENTS
March 31, 2011
BALANCED FUND
Shares or | Security Description | Value | ||||
| 417,540 | U.S. Treasury Inflation Indexed Note, 1.38%, 01/15/20 (e) | $ | 437,797 | |||
| 795,921 | ||||||
Total Government and Agency Obligations (cost $4,358,349) | 4,495,399 | |||||
Short Term Investments - 5.0% | ||||||
Investment Company - 5.0% | ||||||
| 1,929,483 | Goldman Sachs Financial Square Funds, Treasury Obligations Fund, 0.01% (f) | 1,929,483 | ||||
Total Short Term Investments | 1,929,483 | |||||
Total Investments - 100.0% | 38,590,399 | |||||
Other assets in excess of liabilities - 0.0% | 1,084 | |||||
NET ASSETS - 100% | $ | 38,591,483 | ||||
(a) | Non-income producing security. | |||
(b) | Security is exempt from registration under Rule 144A of the Securities Act of 1933, as amended. The security may be resold in transactions exempt from registration, normally to qualified buyers. This security has been deemed liquid by the Fund’s investment adviser based on procedures approved by the Tributary Funds’ Board of Directors. | |||
(c) | Security is exempt from registration under Rule 144A of the Securities Act of 1933, as amended. The security may be resold in transactions exempt from registration, normally to qualified buyers. The security is considered illiquid according to the policies and procedures approved by the Tributary Funds’ Board of Directors. The total value of illiquid securities in the Fund was 1.3% of net assets. | |||
(d) | Variable rate security. The rate reflected is the rate in effect at March 31, 2011. | |||
(e) | U.S. Treasury inflation indexed note, par amount is adjusted for inflation. | |||
(f) | Dividend yield changes daily to reflect current market conditions. Rate was the quoted yield as of March 31, 2011.
| |||
ADR | American Depositary Receipt | |||
GO | General Obligation | |||
MBIA | Municipal Bond Investors Assurance | |||
See accompanying notes to financial statements. 26 |
Table of Contents
ANNUAL REPORT 2011
SCHEDULES OF PORTFOLIO INVESTMENTS
March 31, 2011
CORE EQUITY FUND
Shares | Security Description | Value | ||||
Common Stocks - 96.5% | ||||||
Consumer Discretionary - 9.5% | ||||||
| 126,600 | Best Buy Co. Inc. | $ | 3,635,952 | |||
| 313,900 | Comcast Corp. - Class A | 7,759,608 | ||||
| 114,050 | Home Depot Inc. | 4,226,693 | ||||
| 222,050 | International Game Technology | 3,603,872 | ||||
| 79,425 | Kohl’s Corp. | 4,212,702 | ||||
| 59,450 | Mohawk Industries Inc. (a) | 3,635,367 | ||||
| 27,074,194 | ||||||
Consumer Staples - 10.0% |
| |||||
| 114,825 | HJ Heinz Co. | 5,605,756 | ||||
| 60,800 | Kimberly-Clark Corp. | 3,968,416 | ||||
| 129,800 | PepsiCo Inc. | 8,360,418 | ||||
| 62,000 | Philip Morris International Inc. | 4,069,060 | ||||
| 103,200 | Procter & Gamble Co. | 6,357,120 | ||||
| 28,360,770 | ||||||
Energy - 13.4% |
| |||||
| 40,875 | Apache Corp. | 5,351,355 | ||||
| 125,175 | Chevron Corp. | 13,447,550 | ||||
| 118,100 | Exxon Mobil Corp. | 9,935,753 | ||||
| 51,900 | Peabody Energy Corp. | 3,734,724 | ||||
| 58,875 | Schlumberger Ltd. | 5,490,683 | ||||
| 37,960,065 | ||||||
Financials - 15.0% |
| |||||
| 84,200 | AFLAC Inc. | 4,444,076 | ||||
| 325,400 | Bank of America Corp. | 4,337,582 | ||||
| 105,700 | BB&T Corp. | 2,901,465 | ||||
| 27,400 | BlackRock Inc. | 5,507,674 | ||||
| 32,600 | Goldman Sachs Group Inc. | 5,166,122 | ||||
| 159,900 | JPMorgan Chase & Co. | 7,371,390 | ||||
| 152,100 | MetLife Inc. | 6,803,433 | ||||
| 138,600 | State Street Corp. | 6,228,684 | ||||
| 42,760,426 | ||||||
Health Care - 11.3% |
| |||||
| 163,400 | Abbott Laboratories | 8,014,770 | ||||
| 76,400 | Amgen Inc. (a) | 4,083,580 | ||||
| 181,000 | Medtronic Inc. | 7,122,350 | ||||
| 135,900 | Novartis AG - ADR | 7,386,165 | ||||
| 96,600 | Quest Diagnostics Inc. | 5,575,752 | ||||
| 32,182,617 | ||||||
Industrials - 11.6% |
| |||||
| 82,900 | 3M Co. | 7,751,150 | ||||
| 109,400 | Emerson Electric Co. | 6,392,242 | ||||
| 35,400 | Flowserve Corp. | 4,559,520 | ||||
| 465,800 | General Electric Co. | 9,339,290 | ||||
| 95,800 | Jacobs Engineering Group Inc. (a) | 4,926,994 | ||||
| 32,969,196 | ||||||
Information Technology - 18.6% |
| |||||
| 67,400 | Adobe Systems Inc. (a) | 2,234,984 | ||||
| 307,600 | Applied Materials Inc. | 4,804,712 | ||||
Shares | Security Description | Value | ||||
| 160,425 | Avnet Inc. (a) | $ | 5,468,888 | |||
| 225,400 | Cisco Systems Inc. | 3,865,610 | ||||
| 170,300 | Hewlett-Packard Co. | 6,977,191 | ||||
| 35,100 | International Business Machines Corp. | 5,723,757 | ||||
| 256,900 | Microsoft Corp. | 6,514,984 | ||||
| 184,700 | Oracle Corp. | 6,163,439 | ||||
| 132,600 | Texas Instruments Inc. | 4,582,656 | ||||
| 308,500 | Western Union Co. | 6,407,545 | ||||
| 52,743,766 | ||||||
Materials - 3.9% |
| |||||
| 84,900 | Air Products & Chemicals Inc. | 7,656,282 | ||||
| 50,400 | Allegheny Technologies Inc. | 3,413,088 | ||||
| 11,069,370 | ||||||
Utilities - 3.2% |
| |||||
| 222,150 | AES Corp. (a) | 2,887,950 | ||||
| 68,600 | PG&E Corp. | 3,030,748 | ||||
| 86,400 | Southern Co. | 3,292,704 | ||||
| 9,211,402 | ||||||
Total Common Stocks (cost $240,718,989) |
|
274,331,806 |
| |||
Short Term Investments - 3.0% |
| |||||
Investment Company - 3.0% |
| |||||
| 8,354,134 | Goldman Sachs Financial Square Funds, Treasury Obligations Fund, 0.01% (b) | 8,354,134 | ||||
Total Short Term Investments | 8,354,134 | |||||
Total Investments - 99.5% | 282,685,940 | |||||
Other assets in excess of liabilities - 0.5% | 1,539,310 | |||||
NET ASSETS - 100% | $ | 284,225,250 | ||||
| (a) | Non-income producing security. | |||
| (b) | Dividend yield changes daily to reflect current market conditions. Rate was the quoted yield as of March 31, 2011. | |||
| ADR | American Depositary Receipt | |||
See accompanying notes to financial statements.
27 |
Table of Contents
ANNUAL REPORT 2011
SCHEDULES OF PORTFOLIO INVESTMENTS
March 31, 2011
LARGE CAP GROWTH FUND
Shares | Security Description | Value | ||||
Common Stocks - 97.5% |
| |||||
Consumer Discretionary - 13.2% |
| |||||
| 67,685 | Johnson Controls Inc. | $ | 2,813,665 | |||
| 106,900 | Staples Inc. | 2,075,998 | ||||
| 118,600 | Starbucks Corp. | 4,382,270 | ||||
| 50,700 | Target Corp. | 2,535,507 | ||||
| 11,807,440 | ||||||
Consumer Staples - 17.0% |
| |||||
| 23,800 | Colgate-Palmolive Co. | 1,922,088 | ||||
| 53,050 | PepsiCo Inc. | 3,416,950 | ||||
| 31,500 | Procter & Gamble Co. | 1,940,400 | ||||
| 88,400 | Safeway Inc. | 2,080,936 | ||||
| 38,495 | Wal-Mart Stores Inc. | 2,003,665 | ||||
| 58,510 | Whole Foods Market Inc. | 3,855,809 | ||||
| 15,219,848 | ||||||
Energy - 6.4% |
| |||||
| 40,450 | Schlumberger Ltd. | 3,772,367 | ||||
| 43,800 | Suncor Energy Inc. | 1,963,992 | ||||
| 5,736,359 | ||||||
Financials - 2.6% |
| |||||
| 130,875 | Charles Schwab Corp. | 2,359,676 | ||||
Health Care - 8.9% |
| |||||
| 38,900 | Johnson & Johnson | 2,304,825 | ||||
| 25,405 | Medtronic Inc. | 999,687 | ||||
| 57,700 | Roche Holding AG - ADR | 2,074,315 | ||||
| 57,700 | UnitedHealth Group Inc. | 2,608,040 | ||||
| 7,986,867 | ||||||
Industrials - 10.3% |
| |||||
| 33,050 | 3M Co. | 3,090,175 | ||||
| 21,500 | FedEx Corp. | 2,011,325 | ||||
| 49,995 | Illinois Tool Works Inc. | 2,685,731 | ||||
| 45,700 | Koninklijke Philips Electronics NV - NYS | 1,470,169 | ||||
| 9,257,400 | ||||||
Information Technology - 32.2% |
| |||||
| 60,700 | Adobe Systems Inc. (a) | 2,012,812 | ||||
| 151,660 | Cisco Systems Inc. | 2,600,969 | ||||
| 118,400 | Dell Inc. (a) | 1,717,984 | ||||
| 47,730 | Fiserv Inc. (a) | 2,993,626 | ||||
| 4,000 | Google Inc. - Class A (a) | 2,344,840 | ||||
| 80,000 | Hewlett-Packard Co. | 3,277,600 | ||||
| 95,155 | Intel Corp. | 1,919,276 | ||||
| 65,300 | Linear Technology Corp. | 2,196,039 | ||||
| 118,075 | Microsoft Corp. | 2,994,382 | ||||
| 72,300 | Paychex Inc. | 2,267,328 | ||||
| 110,090 | Symantec Corp. (a) | 2,041,069 | ||||
| 30,180 | VMware Inc. - Class A (a) | 2,460,877 | ||||
| 28,826,802 | ||||||
Shares | Security Description | Value | ||||
Materials - 6.9% |
| |||||
| 57,380 | Ecolab Inc. | $ | 2,927,528 | |||
| 32,275 | Praxair Inc. | 3,279,140 | ||||
| 6,206,668 | ||||||
Total Common Stocks (cost $69,838,176) | 87,401,060 | |||||
Short Term Investments - 2.4% |
| |||||
Investment Company - 2.4% |
| |||||
| 2,140,441 | Goldman Sachs Financial Square Funds, Prime Obligations Fund, 0.18% (b) | 2,140,441 | ||||
Total Short Term Investments | 2,140,441 | |||||
Total Investments - 99.9% | 89,541,501 | |||||
Other assets in excess of liabilities - 0.1% | 105,924 | |||||
NET ASSETS - 100% | $ | 89,647,425 | ||||
| (a) | Non-income producing security. | |||
| (b) | Dividend yield changes daily to reflect current market conditions. Rate was the quoted yield as of March 31, 2011. | |||
| ADR | American Depositary Receipt | |||
| NYS | New York Shares | |||
See accompanying notes to financial statements.
28 |
Table of Contents
ANNUAL REPORT 2011
SCHEDULES OF PORTFOLIO INVESTMENTS
March 31, 2011
GROWTH OPPORTUNITIES FUND
Shares | Security Description | Value | ||||
Common Stocks - 94.8% | ||||||
Consumer Discretionary - 19.3% | ||||||
| 26,000 | BorgWarner Inc. (a) | $ | 2,071,940 | |||
| 15,000 | Capella Education Co. (a) | 746,850 | ||||
| 90,000 | Chico’s FAS Inc. | 1,341,000 | ||||
| 5,000 | Chipotle Mexican Grill Inc. - Class A (a) | 1,361,850 | ||||
| 30,000 | Coach Inc. | 1,561,200 | ||||
| 21,000 | DeVry Inc. | 1,156,470 | ||||
| 43,000 | GameStop Corp. - Class A (a) | 968,360 | ||||
| 30,400 | Guess? Inc. | 1,196,240 | ||||
| 34,000 | HanesBrands Inc. (a) | 919,360 | ||||
| 5,000 | NetFlix Inc. (a) | 1,186,650 | ||||
| 30,000 | Nordstrom Inc. | 1,346,400 | ||||
| 9,000 | Panera Bread Co. - Class A (a) | 1,143,000 | ||||
| 21,000 | Sotheby’s | 1,104,600 | ||||
| 34,400 | Tempur-Pedic International Inc. (a) | 1,742,704 | ||||
| 12,000 | Tenneco Inc. (a) | 509,400 | ||||
| 12,000 | Ulta Salon Cosmetics & Fragrance | 577,560 | ||||
| 25,000 | Wolverine World Wide Inc. | 932,000 | ||||
| 6,000 | Wynn Resorts Ltd. | 763,500 | ||||
| 20,629,084 | ||||||
Consumer Staples - 5.5% | ||||||
| 15,000 | Church & Dwight Co. Inc. | 1,190,100 | ||||
| 40,000 | Flowers Foods Inc. | 1,089,200 | ||||
| 20,000 | Herbalife Ltd. | 1,627,200 | ||||
| 22,400 | PriceSmart Inc. | 820,736 | ||||
| 16,500 | Ralcorp Holdings Inc. (a) | 1,129,095 | ||||
| 5,856,331 | ||||||
Energy - 8.1% | ||||||
| 5,000 | CARBO Ceramics Inc. | 705,600 | ||||
| 30,000 | GeoResources Inc. (a) | 938,100 | ||||
| 12,800 | Noble Energy Inc. | 1,237,120 | ||||
| 30,000 | Peabody Energy Corp. | 2,158,800 | ||||
| 40,000 | Southern Union Co. | 1,144,800 | ||||
| 50,000 | Williams Cos. Inc. | 1,559,000 | ||||
| 24,000 | World Fuel Services Corp. | 974,640 | ||||
| 8,718,060 | ||||||
Financials - 7.6% | ||||||
| 20,000 | Affiliated Managers Group Inc. (a) | 2,187,400 | ||||
| 23,000 | Credit Acceptance Corp. (a) | 1,632,080 | ||||
| 14,000 | Portfolio Recovery Associates Inc. (a) | 1,191,820 | ||||
| 18,000 | Signature Bank (a) | 1,015,200 | ||||
| 30,000 | Stifel Financial Corp. (a) | 2,153,700 | ||||
| 8,180,200 | ||||||
Health Care - 11.9% | ||||||
| 25,000 | Biogen Idec Inc. (a) | 1,834,750 | ||||
| 31,200 | Catalyst Health Solutions Inc. (a) | 1,745,016 | ||||
| 15,000 | Cerner Corp. (a) | 1,668,000 | ||||
| 27,500 | Hospira Inc. (a) | 1,518,000 | ||||
Shares | Security Description | Value | ||||
| 20,000 | Immucor Inc. (a) | $ | 395,600 | |||
| 37,000 | Impax Laboratories Inc. (a) | 941,650 | ||||
| 30,200 | Medidata Solutions Inc. (a) | 772,214 | ||||
| 60,000 | PSS World Medical Inc. (a) | 1,629,000 | ||||
| 44,522 | Valeant Pharmaceuticals International Inc. | 2,217,641 | ||||
| 12,721,871 | ||||||
Industrials - 16.2% | ||||||
| 25,000 | AGCO Corp. (a) | 1,374,250 | ||||
| 17,000 | Alliant Techsystems Inc. | 1,201,390 | ||||
| 30,000 | Applied Industrial Technologies Inc. | 997,800 | ||||
| 6,500 | Atlas Air Worldwide Holdings Inc. (a) | 453,180 | ||||
| 7,500 | Dover Corp. | 493,050 | ||||
| 9,000 | Genesee & Wyoming Inc. - Class A (a) | 523,800 | ||||
| 19,000 | HUB Group Inc. - Class A (a) | 687,610 | ||||
| 34,000 | Insituform Technologies Inc. - Class A (a) | 909,500 | ||||
| 20,000 | Joy Global Inc. | 1,976,200 | ||||
| 17,000 | L-3 Communications Holdings Inc. | 1,331,270 | ||||
| 17,000 | Landstar System Inc. | 776,560 | ||||
| 9,700 | Lincoln Electric Holdings Inc. | 736,424 | ||||
| 27,000 | Pall Corp. | 1,555,470 | ||||
| 48,000 | Quanta Services Inc. (a) | 1,076,640 | ||||
| 22,000 | Roper Industries Inc. | 1,902,120 | ||||
| 30,000 | Tetra Tech Inc. (a) | 740,700 | ||||
| 18,000 | Woodward Governor Co. | 622,080 | ||||
| 17,358,044 | ||||||
Information Technology - 17.9% | ||||||
| 40,000 | Adobe Systems Inc. (a) | 1,326,400 | ||||
| 37,000 | Akamai Technologies Inc. (a) | 1,406,000 | ||||
| 18,000 | CA Inc. | 435,240 | ||||
| 41,400 | Cadence Design Systems Inc. (a) | 403,650 | ||||
| 20,000 | Citrix Systems Inc. (a) | 1,469,200 | ||||
| 23,000 | Cognizant Technology Solutions Corp. - Class A (a) | 1,872,200 | ||||
| 70,000 | Diodes Inc. (a) | 2,384,200 | ||||
| 12,000 | Equinix Inc. (a) | 1,093,200 | ||||
| 15,000 | Factset Research Systems Inc. | 1,570,950 | ||||
| 77,000 | Harmonic Inc. (a) | 722,260 | ||||
| 25,000 | Itron Inc. (a) | 1,411,000 | ||||
| 75,000 | Lawson Software Inc. (a) | 907,500 | ||||
| 70,000 | Mentor Graphics Corp. (a) | 1,024,100 | ||||
| 182,000 | Power-One Inc. (a) | 1,592,500 | ||||
| 56,600 | SRA International Inc. - Class A (a) | 1,605,176 | ||||
| 19,223,576 | ||||||
Materials - 6.4% | ||||||
| 23,000 | Agrium Inc. | 2,121,980 | ||||
| 65,000 | Calgon Carbon Corp. (a) | 1,032,200 | ||||
| 21,000 | Cliffs Natural Resources Inc. | 2,063,880 | ||||
| 25,000 | Sigma-Aldrich Corp. | 1,591,000 | ||||
| 6,809,060 | ||||||
See accompanying notes to financial statements.
29 |
Table of Contents
ANNUAL REPORT 2011
SCHEDULES OF PORTFOLIO INVESTMENTS
March 31, 2011
GROWTH OPPORTUNITIES FUND
Shares | Security Description | Value | ||||
Telecommunication Services - 1.9% | ||||||
| 50,000 | Neutral Tandem Inc. (a) | $ | 737,500 | |||
| 67,500 | Partner Communications Co. Ltd. - ADR | 1,283,175 | ||||
| 2,020,675 | ||||||
Total Common Stocks (cost $62,477,146) | 101,516,901 | |||||
Short Term Investments - 5.1% | ||||||
Investment Company - 5.1% | ||||||
| 5,467,887 | Goldman Sachs Financial Square Funds, Treasury Obligations Fund, 0.01% (b) | 5,467,887 | ||||
Total Short Term Investments | 5,467,887 | |||||
Total Investments - 99.9% | 106,984,788 | |||||
Other assets in excess of liabilities - 0.1% | 104,006 | |||||
NET ASSETS - 100% | $ | 107,088,794 | ||||
(a) | Non-income producing security. | |||
(b) | Dividend yield changes daily to reflect current market conditions. Rate was the quoted yield as of March 31, 2011. | |||
ADR | American Depositary Receipt | |||
See accompanying notes to financial statements.
30 |
Table of Contents
ANNUAL REPORT 2011
SCHEDULES OF PORTFOLIO INVESTMENTS
March 31, 2011
SMALL COMPANY FUND
Shares | Security Description | Value | ||||
Common Stocks - 96.2% |
| |||||
Consumer Discretionary - 14.7% |
| |||||
| 114,200 | ANN Inc. (a) | $ | 3,324,362 | |||
| 45,500 | Buckle Inc. | 1,838,200 | ||||
| 244,675 | Callaway Golf Co. | 1,668,683 | ||||
| 130,200 | Foot Locker Inc. | 2,567,544 | ||||
| 61,000 | International Speedway Corp. - | 1,817,800 | ||||
| 60,100 | Jack in the Box Inc. (a) | 1,363,068 | ||||
| 38,900 | Mohawk Industries Inc. (a) | 2,378,735 | ||||
| 68,256 | Steiner Leisure Ltd. (a) | 3,157,523 | ||||
| 44,900 | Tractor Supply Co. | 2,687,714 | ||||
| 20,803,629 | ||||||
Consumer Staples - 1.7% | ||||||
| 25,700 | Church & Dwight Co. Inc. | 2,039,038 | ||||
| 41,525 | Cott Corp. (a) | 348,810 | ||||
| 2,387,848 | ||||||
Energy - 7.7% | ||||||
| 62,525 | Bill Barrett Corp. (a) | 2,495,373 | ||||
| 52,000 | Dresser-Rand Group Inc. (a) | 2,788,240 | ||||
| 43,400 | SM Energy Co. | 3,219,846 | ||||
| 40,200 | Tidewater Inc. | 2,405,970 | ||||
| 10,909,429 | ||||||
Financials - 17.6% | ||||||
| 31,000 | Affiliated Managers Group Inc. (a) | 3,390,470 | ||||
| 50,900 | Arthur J Gallagher & Co. | 1,547,869 | ||||
| 37,000 | Cullen/Frost Bankers Inc. | 2,183,740 | ||||
| 58,000 | Delphi Financial Group Inc. - | 1,781,180 | ||||
| 26,900 | Home Properties Inc. | 1,585,755 | ||||
| 25,200 | Jones Lang LaSalle Inc. | 2,513,448 | ||||
| 46,250 | Mack-Cali Realty Corp. | 1,567,875 | ||||
| 78,100 | MB Financial Inc. | 1,636,976 | ||||
| 204,950 | MFA Financial Inc. | 1,680,590 | ||||
| 28,450 | RLI Corp. | 1,640,143 | ||||
| 83,400 | Selective Insurance Group | 1,442,820 | ||||
| 100,100 | Texas Capital Bancshares Inc. (a) | 2,601,599 | ||||
| 52,400 | United Bankshares Inc. | 1,389,648 | ||||
| 24,962,113 | ||||||
Health Care - 9.7% | ||||||
| 81,900 | Genomic Health Inc. (a) | 2,014,740 | ||||
| 10,900 | Mettler Toledo International Inc. (a) | 1,874,800 | ||||
| 109,100 | PSS World Medical Inc. (a) | 2,962,065 | ||||
| 133,700 | VCA Antech Inc. (a) | 3,366,566 | ||||
| 77,600 | West Pharmaceutical Services Inc. | 3,474,152 | ||||
| 13,692,323 | ||||||
Industrials - 15.6% | ||||||
| 119,300 | Barnes Group Inc. | 2,490,984 | ||||
| 65,800 | Carlisle Cos. Inc. | 2,931,390 | ||||
| 56,700 | CLARCOR Inc. | 2,547,531 | ||||
| 41,700 | Hubbell Inc. - Class B | 2,961,951 | ||||
| 71,000 | IDEX Corp. | 3,099,150 | ||||
Shares | Security Description | Value | ||||
| 141,652 | Insteel Industries Inc. | $ | 2,002,959 | |||
| 109,950 | John Bean Technologies Corp. | 2,114,339 | ||||
| 52,800 | Tennant Co. | 2,219,712 | ||||
| 66,700 | Werner Enterprises Inc. | 1,765,549 | ||||
| 22,133,565 | ||||||
Information Technology - 18.1% | ||||||
| 39,800 | Anixter International Inc. | 2,781,622 | ||||
| 44,900 | CACI International Inc. - Class A (a) | 2,753,268 | ||||
| 163,800 | Daktronics Inc. | 1,760,850 | ||||
| 243,800 | Entegris Inc. (a) | 2,138,126 | ||||
| 47,000 | Littelfuse Inc. | 2,683,700 | ||||
| 99,700 | Microsemi Corp. (a) | 2,064,787 | ||||
| 48,300 | MTS Systems Corp. | 2,200,065 | ||||
| 83,400 | National Instruments Corp. | 2,733,018 | ||||
| 111,400 | Parametric Technology Corp. (a) | 2,505,386 | ||||
| 73,150 | Park Electrochemical Corp. | 2,359,087 | ||||
| 33,400 | Syntel Inc. | 1,744,482 | ||||
| 25,724,391 | ||||||
Materials - 7.7% | ||||||
| 27,800 | Albemarle Corp. | 1,661,606 | ||||
| 41,700 | Arch Chemicals Inc. | 1,734,303 | ||||
| 71,400 | Intrepid Potash Inc. (a) | 2,486,148 | ||||
| 62,400 | Sensient Technologies Corp. | 2,236,416 | ||||
| 131,500 | Worthington Industries Inc. | 2,750,980 | ||||
| 10,869,453 | ||||||
Utilities - 3.4% | ||||||
| 54,300 | IDACORP Inc. | 2,068,830 | ||||
| 105,600 | Westar Energy Inc. | 2,789,952 | ||||
| 4,858,782 | ||||||
Total Common Stocks | 136,341,533 | |||||
Short Term Investments - 4.1% | ||||||
Investment Company - 4.1% | ||||||
| 5,885,850 | Goldman Sachs Financial Square Funds, Treasury Obligations Fund, 0.01% (b) | 5,885,850 | ||||
Total Short Term Investments | 5,885,850 | |||||
Total Investments - 100.3% | 142,227,383 | |||||
Liabilities in excess of other assets - (0.3%) | (475,994 | ) | ||||
NET ASSETS - 100% | $ | 141,751,389 | ||||
(a) | Non-income producing security. | |||
(b) | Dividend yield changes daily to reflect current market conditions. Rate was the quoted yield as of March 31, 2011. |
See accompanying notes to financial statements.
31 |
Table of Contents
ANNUAL REPORT 2011
SCHEDULES OF PORTFOLIO INVESTMENTS
March 31, 2011
INTERNATIONAL EQUITY FUND
Shares | Security Description | Value | ||||
Foreign Stocks - 94.8% |
| |||||
Australia - 10.2% |
| |||||
| 35,285 | AGL Energy Ltd. | $ | 522,149 | |||
| 40,939 | Amcor Ltd. | 298,887 | ||||
| 14,105 | ASX Ltd. | 502,052 | ||||
| 18,070 | Australia & New Zealand Banking Group Ltd. | 444,920 | ||||
| 33,828 | BHP Billiton Ltd. | 1,628,748 | ||||
| 9,348 | Commonwealth Bank of Australia | 506,541 | ||||
| 261,215 | Goodman Fielder Ltd. | 332,252 | ||||
| 81,812 | GPT Group | 265,651 | ||||
| 11,170 | Leighton Holdings Ltd. | 340,637 | ||||
| 66,133 | National Australia Bank Ltd. | 1,767,841 | ||||
| 16,286 | Orica Ltd. | 444,108 | ||||
| 43,204 | QBE Insurance Group Ltd. | 789,451 | ||||
| 61,124 | Toll Holdings Ltd. | 374,827 | ||||
| 49,415 | Westfield Group | 477,277 | ||||
| 23,137 | Westpac Banking Corp. | 582,122 | ||||
| 29,140 | Woolworths Ltd. | 809,997 | ||||
| 17,406 | WorleyParsons Ltd. | 557,628 | ||||
| 10,645,088 | ||||||
Belgium - 1.7% | ||||||
| 46,319 | Belgacom SA | 1,794,097 | ||||
Brazil - 0.5% | ||||||
| 15,600 | BM&F Bovespa SA | 113,279 | ||||
| 6,900 | Brookfield Incorporacoes SA | 35,686 | ||||
| 6,200 | Cielo SA | 52,658 | ||||
| 4,000 | EDP - Energias do Brasil SA | 96,820 | ||||
| 1,800 | Lojas Renner SA | 58,614 | ||||
| 5,200 | MRV Engenharia e Participacoes SA | 41,615 | ||||
| 2,000 | Natura Cosmeticos SA | 56,364 | ||||
| 4,400 | Rossi Residencial SA | 36,992 | ||||
| 492,028 | ||||||
China - 1.1% | ||||||
| 228,000 | Bank of China Ltd. | 126,922 | ||||
| 66,000 | Bank of Communications Co. Ltd. | 72,633 | ||||
| 80,000 | China Petroleum & Chemical Corp. | 80,223 | ||||
| 66,400 | China Zhongwang Holdings Ltd. | 31,244 | ||||
| 79,000 | CNOOC Ltd. | 199,067 | ||||
| 30,400 | Guangzhou R&F Properties Co. Ltd. | 45,258 | ||||
| 96,000 | Huaneng Power International Inc. | 56,156 | ||||
| 218,000 | Industrial & Commercial Bank of China | 181,052 | ||||
| 40,000 | Jiangsu Expressway Co. Ltd. | 44,843 | ||||
| 122,000 | PetroChina Co. Ltd. | 184,765 | ||||
| 312,000 | Renhe Commercial Holdings Co. Ltd. | 58,162 | ||||
| 68,000 | Shanghai Electric Group Co. Ltd. (a) | 34,007 | ||||
| 65,500 | Shui On Land Ltd. | 30,147 | ||||
| 27,000 | Soho China Ltd. | 23,153 | ||||
| 11,000 | Want Want China Holdings Ltd. | 8,641 | ||||
Shares | Security Description | Value | ||||
| 34,000 | Zhejiang Expressway Co. Ltd. | $ | 30,948 | |||
| 1,207,221 | ||||||
Czech Republic - 0.4% | ||||||
| 5,000 | CEZ AS | 255,775 | ||||
| 500 | Komercni Banka AS | 126,297 | ||||
| 382,072 | ||||||
Finland - 2.5% | ||||||
| 55,789 | Nokia Oyj | 477,082 | ||||
| 51,225 | Orion Oyj | 1,242,663 | ||||
| 65,602 | Pohjola Bank Plc | 894,252 | ||||
| 2,613,997 | ||||||
France - 9.7% | ||||||
| 15,808 | BNP Paribas SA | 1,156,055 | ||||
| 18,532 | Bouygues SA | 889,810 | ||||
| 5,839 | Casino Guichard Perrachon SA | 552,608 | ||||
| 14,091 | Eiffage SA | 846,394 | ||||
| 59,834 | France Telecom SA | 1,340,440 | ||||
| 2,995 | Gecina SA | 413,016 | ||||
| 2,931 | LVMH Moet Hennessy Louis Vuitton SA | 463,913 | ||||
| 5,598 | Neopost SA | 490,297 | ||||
| 33,912 | PagesJaunes Groupe SA | 339,591 | ||||
| 15,747 | Sanofi-Aventis SA | 1,103,955 | ||||
| 27,809 | Total SA | 1,692,648 | ||||
| 31,470 | Vivendi SA | 898,544 | ||||
| 10,187,271 | ||||||
Germany - 3.8% | ||||||
| 38,002 | BASF SE | 3,291,762 | ||||
| 12,338 | Celesio AG | 302,628 | ||||
| 6,197 | RWE AG | 396,774 | ||||
| 3,991,164 | ||||||
Greece - 1.3% | ||||||
| 17,177 | OPAP SA | 367,772 | ||||
| 55,402 | Public Power Corp. SA | 962,462 | ||||
| 1,330,234 | ||||||
Hong Kong - 1.2% | ||||||
| 102,000 | Fushan International Energy Group Ltd. | 73,435 | ||||
| 290,000 | Hopewell Holdings Ltd. | 870,563 | ||||
| 189,000 | NWS Holdings Ltd. | 289,151 | ||||
| 66,000 | Skyworth Digital Holdings Ltd. | 37,419 | ||||
| 1,270,568 | ||||||
Indonesia - 0.3% | ||||||
| 3,500 | Astra Agro Lestari Tbk PT | 9,127 | ||||
| 263,000 | International Nickel Indonesia Tbk PT | 144,265 | ||||
| 23,000 | Perusahaan Gas Negara PT | 10,305 | ||||
| 15,500 | PT Astra International Tbk | 101,493 | ||||
| 5,000 | PT Tambang Batubara Bukit Asam Tbk | 12,062 | ||||
| 30,500 | Semen Gresik Persero Tbk PT | 31,884 | ||||
| 309,136 | ||||||
See accompanying notes to financial statements.
32 |
Table of Contents
ANNUAL REPORT 2011
SCHEDULES OF PORTFOLIO INVESTMENTS
March 31, 2011
INTERNATIONAL EQUITY FUND
Shares | Security Description | Value | ||||
Italy - 3.0% |
| |||||
| 84,291 | Enel SpA | $ | 531,268 | |||
| 91,538 | ENI SpA | 2,247,851 | ||||
| 36,964 | Pirelli & C. SpA | 324,742 | ||||
| 3,103,861 | ||||||
Japan - 18.8% | ||||||
| 45,700 | AEON Credit Service Co. Ltd. | 629,227 | ||||
| 34,000 | Asahi Glass Co. Ltd. | 427,658 | ||||
| 38,000 | China Bank Ltd. | 212,939 | ||||
| 13,300 | Chubu Electric Power Co. Inc. | 295,875 | ||||
| 9,000 | Daito Trust Construction Co. Ltd. | 620,130 | ||||
| 76,000 | Denki Kagaku Kogyo K K | 374,699 | ||||
| 21,100 | Eisai Co. Ltd. | 757,124 | ||||
| 68,000 | Furukawa Electric Co. Ltd. | 274,747 | ||||
| 27,600 | Honda Motor Co. Ltd. | 1,037,157 | ||||
| 7,500 | Itochu Techno-Solutions Corp. | 242,875 | ||||
| 85 | Japan Prime Realty Investment Corp. | 229,570 | ||||
| 104,000 | Joyo Bank Ltd. | 408,947 | ||||
| 321,000 | Kajima Corp. | 899,387 | ||||
| 17,200 | Kansai Electric Power Co. Inc. | 374,570 | ||||
| 11,800 | Kyushu Electric Power Co. Inc. | 230,580 | ||||
| 10,400 | Lawson Inc. | 501,491 | ||||
| 53,500 | Mitsubishi Chemical Holdings Corp. | 336,466 | ||||
| 51,600 | Mitsubishi UFJ Financial Group Inc. | 238,268 | ||||
| 29,400 | Mitsui & Co. Ltd. | 527,121 | ||||
| 380,700 | Mizuho Financial Group Inc. | 631,753 | ||||
| 20,000 | MS&AD Insurance Group Holdings | 455,507 | ||||
| 18,000 | NGK Spark Plug Co. Ltd. | 245,887 | ||||
| 257,000 | Nippon Express Co. Ltd. | 985,847 | ||||
| 19,500 | Nippon Paper Group Inc. | 415,512 | ||||
| 11,400 | Nippon Telegraph & Telephone Corp. | 512,013 | ||||
| 17,500 | Nissan Chemical Industries Ltd. | 180,976 | ||||
| 12,600 | Nissin Foods Holdings Co. Ltd. | 444,242 | ||||
| 211 | NTT DoCoMo Inc. | 370,950 | ||||
| 147,000 | Ricoh Co. Ltd. | 1,725,253 | ||||
| 21,600 | Sankyo Co. Ltd. | 1,107,792 | ||||
| 7,400 | Secom Co. Ltd. | 343,927 | ||||
| 15,800 | Shiseido Co. Ltd. | 273,593 | ||||
| 49,000 | Sumitomo Chemical Co. Ltd. | 244,529 | ||||
| 61,700 | Sumitomo Corp. | 882,171 | ||||
| 92,200 | Sumitomo Rubber Industries Inc. | 942,400 | ||||
| 7,800 | Takeda Pharmaceutical Co. Ltd. | 363,925 | ||||
| 49,000 | TonenGeneral Sekiyu KK | 605,135 | ||||
| 4,060 | USS Co. Ltd. | 315,875 | ||||
| 19,666,118 | ||||||
Malaysia - 0.3% | ||||||
| 50,600 | Lafarge Malayan Cement Bhd | 123,700 | ||||
| 45,300 | Malayan Banking Bhd | 134,089 | ||||
| 8,900 | UMW Holdings Bhd | 21,640 | ||||
| 279,429 | ||||||
Shares | Security Description | Value | ||||
Mexico - 0.5% | ||||||
| 7,900 | Alfa SAB de CV | $ | 102,281 | |||
| 12,500 | Grupo Financiero Inbursa SA | 57,565 | ||||
| 7,800 | Grupo Modelo SAB de CV | 46,893 | ||||
| 12,400 | Kimberly-Clark de Mexico SAB de CV | 77,143 | ||||
| 130,000 | Telefonos de Mexico SAB de CV | 119,363 | ||||
| 24,500 | Wal-Mart de Mexico SAB de CV | 73,543 | ||||
| 476,788 | ||||||
Netherlands - 2.6% | ||||||
| 11,573 | Koninklijke DSM NV | 710,973 | ||||
| 13,695 | Koninklijke KPN NV | 233,257 | ||||
| 38,231 | Royal Dutch Shell Plc | 1,385,892 | ||||
| 13,957 | Unilever NV | 437,565 | ||||
| 2,767,687 | ||||||
New Zealand - 0.5% | ||||||
| 184,473 | SKYCITY Entertainment Group Ltd. | 475,558 | ||||
Norway - 2.7% | ||||||
| 44,003 | SeaDrill Ltd. | 1,592,091 | ||||
| 26,742 | StatoilHydro ASA | 741,637 | ||||
| 9,621 | Yara International ASA | 487,690 | ||||
| 2,821,418 | ||||||
Philippines - 0.0% | ||||||
| 530 | Philippine Long Distance Telephone Co. | 28,387 | ||||
Poland - 0.1% | ||||||
| 1,014 | KGHM Polska Miedz SA | 64,384 | ||||
| 6,125 | Powszechna Kasa Oszczednosci Bank Polski SA | 94,314 | ||||
| 158,698 | ||||||
Portugal - 0.8% | ||||||
| 210,663 | Energias de Portugal SA | 820,300 | ||||
Russia - 0.2% | ||||||
| 800 | Lukloil OAO - ADR | 57,112 | ||||
| 398 | MMC Norilsk Nickel - ADR | 10,523 | ||||
| 18,200 | Surgutneftegaz - ADR | 196,742 | ||||
| 264,377 | ||||||
South Africa - 0.7% | ||||||
| 8,629 | African Bank Investments Ltd. | 48,363 | ||||
| 3,817 | FirstRand Ltd. | 11,358 | ||||
| 724 | Impala Platinum Holdings Ltd. | 20,979 | ||||
| 2,808 | Kumba Iron Ore Ltd. | 198,701 | ||||
| 32,835 | MMI Holdings Ltd. | 80,933 | ||||
| 13,858 | Pretoria Portland Cement Co. Ltd. | 49,236 | ||||
| 1,203 | Reunert Ltd. | 10,433 | ||||
| 8,859 | Sanlam Ltd. | 36,197 | ||||
| 2,437 | Sasol Ltd. | 141,238 | ||||
| 7,392 | Standard Bank Group Ltd. | 113,807 | ||||
| 711,245 | ||||||
See accompanying notes to financial statements.
33 |
Table of Contents
ANNUAL REPORT 2011
SCHEDULES OF PORTFOLIO INVESTMENTS
March 31, 2011
INTERNATIONAL EQUITY FUND
Shares | Security Description | Value | ||||
South Korea - 0.8% |
| |||||
| 1,830 | Dongbu Insurance Co. Ltd. | $ | 83,599 | |||
| 990 | Hana Financial Group Inc. | 42,833 | ||||
| 427 | Hyundai Mipo Dockyard Co. Ltd. | 72,808 | ||||
| 4,750 | Hyundai Securities Co. Ltd. | 57,172 | ||||
| 8,270 | Korea Exchange Bank | 72,920 | ||||
| 2,190 | KT Corp. | 77,679 | ||||
| 1,068 | KT&G Corp. | 55,606 | ||||
| 10,930 | LG Telecom Ltd. | 61,691 | ||||
| 596 | S1 Corp. | 30,596 | ||||
| 193 | Samsung Fire & Marine Insurance Co. Ltd. | 42,676 | ||||
| 2,340 | Samsung Heavy Industries Co. Ltd. | 85,134 | ||||
| 369 | SK Holdings Co. Ltd. | 55,517 | ||||
| 768 | SK Telecom Co. Ltd. | 114,496 | ||||
| 852,727 | ||||||
Spain - 4.3% |
| |||||
| 83,735 | Banco Bilbao Vizcaya Argentaria SA | 1,015,779 | ||||
| 108,436 | Banco de Sabadell SA | 474,327 | ||||
| 75,743 | Banco Popular Espanol SA | 445,193 | ||||
| 131,345 | Banco Santander SA | 1,524,653 | ||||
| 29,402 | Enagas SA | 663,266 | ||||
| 16,420 | Indra Sistemas SA | 329,228 | ||||
| 4,452,446 | ||||||
Sweden - 3.7% |
| |||||
| 25,955 | Boliden AB | 559,464 | ||||
| 115,747 | Nordea Bank AB | 1,267,651 | ||||
| 75,821 | Skanska AB | 1,597,079 | ||||
| 15,015 | Svenska Handelsbanken | 492,615 | ||||
| 3,916,809 | ||||||
Switzerland - 5.5% |
| |||||
| 30,395 | Credit Suisse Group AG | 1,292,003 | ||||
| 22,316 | Nestle SA | 1,279,609 | ||||
| 29,408 | Novartis AG | 1,595,629 | ||||
| 2,114 | Roche Holding AG | 302,066 | ||||
| 2,222 | Syngenta AG | 722,356 | ||||
| 1,902 | Zurich Financial Services AG | 532,568 | ||||
| 5,724,231 | ||||||
Taiwan - 1.2% |
| |||||
| 12,000 | Acer Inc. | 24,494 | ||||
| 8,000 | Advantech Co. Ltd. | 24,766 | ||||
| 3,250 | Cheng Shin Rubber Industry Co. Ltd. | 7,540 | ||||
| 4,150 | Chicony Electronics Co. Ltd. | 7,440 | ||||
| 47,000 | China Development Financial Holding Corp. | 18,947 | ||||
| 43,453 | Compal Electronics Inc. | 43,165 | ||||
| 18,000 | Coretronic Corp. | 29,087 | ||||
| 11,000 | Delta Electronics Inc. | 43,596 | ||||
| 18,000 | Eternal Chemical Co. Ltd. | 21,249 | ||||
| 14,000 | Farglory Land Development Co. Ltd. | 29,862 | ||||
Shares | Security Description | Value | ||||
| 7,000 | Formosa Plastics Corp. | $ | 24,647 | |||
| 2,200 | HTC Corp. | 86,069 | ||||
| 20,000 | Inventec Co. Ltd. | 10,206 | ||||
| 4,000 | Kinsus Interconnect Technology Corp. | 12,369 | ||||
| 25,079 | Lite-On Technology Corp. | 30,885 | ||||
| 109,000 | Macronix International Co., Ltd. | 72,308 | ||||
| 10,000 | MediaTek Inc. | 114,986 | ||||
| 66,000 | Mega Financial Holdings Co. Ltd. | 51,978 | ||||
| 22,000 | Novatek Microelectronics Corp. | 64,814 | ||||
| 5,000 | Pixart Imaging Inc. | 20,582 | ||||
| 7,000 | Powertech Technology Inc. | 21,932 | ||||
| 5,000 | Quanta Computer Inc. | 9,440 | ||||
| 4,050 | Richtek Technology Corp. | 28,038 | ||||
| 20,000 | Taiwan Cement Corp. | 24,154 | ||||
| 82,000 | Taiwan Semiconductor Manufacturing Co. Ltd. | 196,945 | ||||
| 6,000 | TSRC Corp. | 15,411 | ||||
| 60,000 | U-Ming Marine Transport Corp. | 127,777 | ||||
| 47,000 | United Microelectronics Corp. | 24,463 | ||||
| 16,503 | Wistron Corp. | 26,162 | ||||
| 5,000 | WPG Holdings Co. Ltd. | 8,420 | ||||
| 1,000 | Young Fast Optoelectronics Co. Ltd. | 7,348 | ||||
| 1,229,080 | ||||||
Thailand - 0.1% |
| |||||
| 2,200 | Bangkok Bank Public Co. Ltd. | 12,627 | ||||
| 13,400 | Charoen Pokphand Foods PCL | 11,414 | ||||
| 2,500 | Kasikornbank Public Co. Ltd. | 10,875 | ||||
| 17,800 | Krung Thai Bank PCL | 10,834 | ||||
| 21,800 | PTT Aromatics & Refining PCL | 26,862 | ||||
| 2,100 | PTT PCL | 24,592 | ||||
| 10,400 | Siam Commercial Bank PCL | 37,155 | ||||
| 5,700 | Thai Oil PCL | 15,697 | ||||
| 150,056 | ||||||
Turkey - 0.3% |
| |||||
| 4,471 | Tupras Turkiye Petrol Rafine | 131,509 | ||||
| 37,062 | Turk Telekomunikasyon AS | 186,330 | ||||
| 317,839 | ||||||
United Kingdom - 16.0% |
| |||||
| 20,897 | AstraZeneca Plc | 959,645 | ||||
| 56,999 | Aviva Plc | 395,694 | ||||
| 8,537 | BHP Billiton Plc | 336,857 | ||||
| 82,346 | Bradford & Bingley Plc (a) (b) (c) | — | ||||
| 50,081 | British American Tobacco Plc | 2,009,859 | ||||
| 69,538 | British Land Co. Plc | 616,254 | ||||
| 18,505 | Diageo Plc | 351,733 | ||||
| 143,182 | Firstgroup Plc | 749,395 | ||||
| 48,652 | GlaxoSmithKline Plc | 928,262 | ||||
| 315,311 | Home Retail Group Plc | 976,622 | ||||
| 66,711 | HSBC Holdings Plc | 685,900 | ||||
| 134,809 | ICAP Plc | 1,141,716 | ||||
| 9,855 | Imperial Tobacco Group Plc | 304,610 | ||||
See accompanying notes to financial statements.
34 |
Table of Contents
ANNUAL REPORT 2011
SCHEDULES OF PORTFOLIO INVESTMENTS
March 31, 2011
INTERNATIONAL EQUITY FUND
Shares | Security Description | Value | ||||
| 38,977 | J Sainsbury Plc | $ | 209,627 | |||
| 434,936 | Legal & General Group Plc | 803,680 | ||||
| 43,514 | Marks & Spencer Group Plc | 235,005 | ||||
| 86,600 | National Grid Plc | 825,106 | ||||
| 10,438 | Reckitt Benckiser Group Plc | 536,098 | ||||
| 639,815 | RSA Insurance Group Plc | 1,349,539 | ||||
| 176,387 | Standard Life Plc | 585,090 | ||||
| 190,176 | TUI Travel Plc | 692,448 | ||||
| 18,378 | Unilever Plc | 560,089 | ||||
| 522,639 | Vodafone Group Plc | 1,479,626 | ||||
| 16,732,855 | ||||||
Total Foreign Stocks (cost $88,627,830) | 99,172,785 | |||||
Preferred Stocks - 1.4% | ||||||
Brazil - 0.8% | ||||||
| 2,400 | Banco Bradesco SA | 49,062 | ||||
| 6,100 | Banco do Estado do Rio Grande do Sul | 76,142 | ||||
| 8,500 | Cia de Bebidas das Americas | 236,629 | ||||
| 13,300 | Gerdau SA | 164,549 | ||||
| 8,600 | Metalurgica Gerdau SA | 128,112 | ||||
| 20,500 | TIM Participacoes SA | 87,934 | ||||
| 3,600 | Ultrapar Participacoes SA | 59,673 | ||||
| 300 | Vivo Participacoes SA | 11,931 | ||||
| 814,032 | ||||||
Germany - 0.6% | ||||||
| 3,585 | Volkswagen AG, 3.15% | 582,159 | ||||
South Korea - 0.0% | ||||||
| 194 | Hyundai Motor Co. Ltd. (Non-cumulative) | 11,675 | ||||
Total Preferred Stocks (cost $1,036,258) | 1,407,866 | |||||
Exchange Traded Funds - 0.8% | ||||||
Colombia - 0.1% | ||||||
| 1,681 | Global X/InterBolsa FTSE Colombia 20 ETF | 68,081 | ||||
United States - 0.7% | ||||||
| 8,940 | iPath MSCI India Index Exchange-Traded Note (a) | 648,329 | ||||
| 1,921 | iShares MSCI Chile Investable Market Index Fund | 138,004 | ||||
| 786,333 | ||||||
Total Exchange Traded Funds | 854,414 | |||||
Shares | Security Description | Value | ||||
Short Term Investments -1.7% | ||||||
Investment Company - 1.7% | ||||||
| 1,811,604 | Highmark 100% U.S. Treasury Money Market Fund, | $ | 1,811,604 | |||
Total Short Term Investments | 1,811,604 | |||||
Total Investments - 98.7% | 103,246,669 | |||||
Other assets in excess of liabilities - 1.3% | 1,373,109 | |||||
Total Net Assets - 100% | $ | 104,619,778 | ||||
(a) | Non-income producing security. | |||
(b) | Security fair valued in good faith in accordance with the procedures established by the Tributary Funds’ Board of Directors. Good faith fair valued securities may be classified as Level 2 or Level 3 for Financial Accounting Standards Board (“FASB”) Accounting Standards Codification (“ASC”) Topic 820 “Fair Value Measurements and Disclosures” based on the applicable valuation inputs. See Security Valuation in the Notes to Financial Statements. | |||
(c) | The security is considered illiquid according to the policies and procedures approved by the Tributary Funds’ Board of Directors. The total value of illiquid securities in the Fund was 0.0% of net assets. | |||
(d) | Dividend yield changes daily to reflect current market conditions. Rate was the quoted yield as of March 31, 2011. | |||
ADR | American Depositary Receipt | |||
ETF | Exchange-Traded Fund | |||
FTSE | Financial Times and the London Stock Exchange | |||
See accompanying notes to financial statements.
35 |
Table of Contents
ANNUAL REPORT 2011
SCHEDULE OF PORTFOLIO INVESTMENTS
March 31, 2011
INTERNATIONAL EQUITY FUND
As of March 31, 2011, industry diversification of the Fund was as follows:
| Industry Diversification | Percentage of Net Assets | |||
Banks | 12.9% | |||
Materials | 10.6% | |||
Energy | 9.4% | |||
Pharmaceuticals Biotechnology & Life Sciences | 7.2% | |||
Capital Goods | 6.9% | |||
Telecommunication Services | 6.2% | |||
Utilities | 5.9% | |||
Food Beverage & Tobacco | 5.5% | |||
Diversified Financials | 5.2% | |||
Insurance | 4.9% | |||
Automobiles & Components | 3.1% | |||
Technology Hardware & Equipment | 3.1% | |||
Real Estate | 2.9% | |||
Food & Staples Retailing | 2.1% | |||
Transportation | 2.1% | |||
Investment Companies | 1.7% | |||
Consumer Services | 1.6% | |||
Consumer Durables & Apparel | 1.5% | |||
Retailing | 1.5% | |||
Media | 1.2% | |||
Household & Personal Products | 1.0% | |||
Exchange Traded Funds | 0.8% | |||
Semiconductors & Semiconductor Equipment | 0.5% | |||
Software & Services | 0.5% | |||
Commercial & Professional Services | 0.4% | |||
| 98.7% | ||||
See accompanying notes to financial statements.
36 |
Table of Contents
[THIS PAGE INTENTIONALLY LEFT BANK]
37
Table of Contents
ANNUAL REPORT 2011
STATEMENTS OF ASSETS AND LIABILITIES
March 31, 2011
| SHORT- INTERMEDIATE BOND FUND | INCOME FUND | |||||||
Assets: | ||||||||
Investments, at cost | $ | 67,021,636 | $ | 56,155,110 | ||||
Unrealized appreciation of investments | 835,908 | 66,228 | ||||||
Total investments, at value | 67,857,544 | 56,221,338 | ||||||
Cash | 101,189 | – | ||||||
Foreign currency at value (a) | – | – | ||||||
Interest and dividends receivable | 626,616 | 442,126 | ||||||
Receivable for capital shares issued | 115,744 | 134,823 | ||||||
Receivable for investments sold | – | – | ||||||
Prepaid expenses | 28,762 | 26,861 | ||||||
Total Assets | 68,729,855 | 56,825,148 | ||||||
Liabilities: | ||||||||
Cash Overdraft | – | – | ||||||
Distributions payable | 100,631 | 198,613 | ||||||
Payable for investments purchased | – | – | ||||||
Payable for capital shares redeemed | 17,104 | 28,162 | ||||||
Accrued expenses and other payables: | ||||||||
Investment advisory fees | 16,216 | 15,884 | ||||||
Administration fees payable to non-related parties | 4,763 | 4,077 | ||||||
Administration fees payable to related parties | 4,054 | 3,369 | ||||||
Shareholder service fees | 14,479 | 12,034 | ||||||
Director fees | 217 | 191 | ||||||
Other fees | 22,498 | 21,007 | ||||||
Total liabilities | 179,962 | 283,337 | ||||||
Net assets | $ | 68,549,893 | $ | 56,541,811 | ||||
Composition of Net Assets: | ||||||||
Capital | $ | 71,663,975 | $ | 57,170,915 | ||||
Accumulated (excess of distributions over) net investment income | (182,147 | ) | 317,165 | |||||
Accumulated net realized gain (loss) from investments and foreign currency transactions | (3,767,843 | ) | (1,012,497 | ) | ||||
Net unrealized appreciation on investments and translation of assets and liabilities in foreign currencies | 835,908 | 66,228 | ||||||
Net Assets | $ | 68,549,893 | $ | 56,541,811 | ||||
Institutional Class: | ||||||||
Net assets | $ | 68,549,893 | $ | 56,541,811 | ||||
Shares of beneficial interest | 7,204,500 | 5,706,411 | ||||||
Net asset value, offering and redemption price per share | $ | 9.51 | $ | 9.91 | ||||
Institutional Plus Class: | ||||||||
Net assets | n/a | n/a | ||||||
Shares of beneficial interest | n/a | n/a | ||||||
Net asset value, offering and redemption price per share | n/a | n/a | ||||||
(a) Foreign currency at cost | $ | – | $ | – | ||||
See accompanying notes to financial statements.
38 |
Table of Contents
ANNUAL REPORT 2011
STATEMENTS OF ASSETS AND LIABILITIES
March 31, 2011
BALANCED FUND | CORE EQUITY FUND | LARGE CAP GROWTH FUND | GROWTH OPPORTUNITIES FUND | SMALL COMPANY FUND | INTERNATIONAL EQUITY FUND | |||||||||||||||||
| $ | 29,421,765 | $ | 249,073,123 | $ | 71,978,617 | $ | 67,945,033 | $ | 111,380,071 | $ | 92,250,469 | |||||||||||
| 9,168,634 | 33,612,817 | 17,562,884 | 39,039,755 | 30,847,312 | 10,996,200 | |||||||||||||||||
| 38,590,399 | 282,685,940 | 89,541,501 | 106,984,788 | 142,227,383 | 103,246,669 | |||||||||||||||||
| – | – | – | – | – | – | |||||||||||||||||
| – | – | – | – | – | 566,749 | |||||||||||||||||
| 173,326 | 702,330 | 182,590 | 51,567 | 102,687 | 916,770 | |||||||||||||||||
| 10,612 | 1,137,888 | 43,745 | 192,870 | 74,444 | 21,401 | |||||||||||||||||
| 282,407 | – | – | – | 1,385,943 | – | |||||||||||||||||
| 12,755 | 32,246 | 12,089 | 16,055 | 14,536 | 30,941 | |||||||||||||||||
| 39,069,499 | 284,558,404 | 89,779,925 | 107,245,280 | 143,804,993 | 104,782,530 | |||||||||||||||||
| 50,708 | – | – | – | – | – | |||||||||||||||||
| – | – | – | – | – | – | |||||||||||||||||
| 368,320 | – | – | – | 1,392,465 | – | |||||||||||||||||
| 9,817 | 54,326 | 20,777 | 41,209 | 513,257 | 26,714 | |||||||||||||||||
| 19,970 | 149,735 | 56,414 | 54,323 | 83,859 | 70,930 | |||||||||||||||||
| 2,419 | 16,021 | 5,070 | 5,804 | 7,846 | 6,882 | |||||||||||||||||
| 2,237 | 11,725 | 5,265 | 6,036 | 6,300 | 6,206 | |||||||||||||||||
| 7,988 | 24,330 | 18,804 | 21,557 | 15,883 | 22,166 | |||||||||||||||||
| 44 | 655 | 69 | 296 | 476 | 106 | |||||||||||||||||
| 16,513 | 76,362 | 26,101 | 27,261 | 33,518 | 29,748 | |||||||||||||||||
| 478,016 | 333,154 | 132,500 | 156,486 | 2,053,604 | 162,752 | |||||||||||||||||
| $ | 38,591,483 | $ | 284,225,250 | $ | 89,647,425 | $ | 107,088,794 | $ | 141,751,389 | $ | 104,619,778 | |||||||||||
| $ | 30,957,696 | $ | 252,136,046 | $ | 71,763,952 | $ | 71,118,055 | $ | 111,071,170 | $ | 104,648,019 | |||||||||||
| 17,881 | 1,342,468 | 151,117 | – | 202,232 | 1,875,064 | |||||||||||||||||
| (1,552,728) | (2,866,081 | ) | 169,472 | (3,069,016 | ) | (369,325 | ) | (12,928,810 | ) | |||||||||||||
|
9,168,634 |
| 33,612,817 | 17,562,884 | 39,039,755 | 30,847,312 | 11,025,505 | |||||||||||||||
| $ | 38,591,483 | $ | 284,225,250 | $ | 89,647,425 | $ | 107,088,794 | $ | 141,751,389 | $ | 104,619,778 | |||||||||||
| $ | 38,591,483 | $ | 115,918,850 | $ | 89,647,425 | $ | 107,088,794 | $ | 77,746,585 | $ | 104,619,778 | |||||||||||
| 2,704,390 | 13,496,822 | 9,572,824 | 7,048,278 | 4,013,075 | 9,780,923 | |||||||||||||||||
| $14.27 | $ | 8.59 | $ | 9.36 | $ | 15.19 | $ | 19.37 | $ | 10.70 | ||||||||||||
| n/a | $ | 168,306,400 | n/a | n/a | $ | 64,004,804 | n/a | |||||||||||||||
| n/a | 19,591,218 | n/a | n/a | 3,302,889 | n/a | |||||||||||||||||
| n/a | $ | 8.59 | n/a | n/a | $ | 19.38 | n/a | |||||||||||||||
| $ | – | $ | – | $ | – | $ | – | $ | – | $ | 560,814 | |||||||||||
See accompanying notes to financial statements.
39 |
Table of Contents
ANNUAL REPORT 2011
For The Year Ended March 31, 2011
| SHORT- INTERMEDIATE BOND FUND | INCOME FUND | |||||||
Investment Income: | ||||||||
Interest | $ | 2,470,562 | $ | 2,920,100 | ||||
Dividend | 124,581 | 140,336 | ||||||
Foreign tax withholding | – | – | ||||||
Total Income | 2,595,143 | 3,060,436 | ||||||
Expenses: | ||||||||
Investment advisory fees | 345,645 | 360,874 | ||||||
Administration fees | 111,334 | 98,392 | ||||||
Shareholder service fees - Institutional Class | 172,822 | 150,364 | ||||||
Custodian fees | 19,175 | 16,823 | ||||||
Chief compliance officer fees | 9,416 | 8,298 | ||||||
Director fees | 2,836 | 2,137 | ||||||
Transfer agent fees | 30,156 | 28,893 | ||||||
Registration and filing fees | 30,246 | 25,413 | ||||||
Other fees | 21,910 | 18,791 | ||||||
Total expenses before waivers | 743,540 | 709,985 | ||||||
Expenses waived by Adviser | (168,410 | ) | (202,756 | ) | ||||
Custodian fees waived | (9,336 | ) | (8,159 | ) | ||||
Co-administration fees waived - Institutional Plus Class (a) | – | – | ||||||
Total Expenses | 565,794 | 499,070 | ||||||
Net Investment Income | 2,029,349 | 2,561,366 | ||||||
Realized and Unrealized Gain (Loss) On | ||||||||
Net realized gain on investments and foreign currency transactions | 367,775 | 726,569 | ||||||
Change in unrealized appreciation (depreciation) on investments and translation of assets and liabilities in foreign currencies | (117,831 | ) | (143,747 | ) | ||||
Net realized and unrealized gain on investments and foreign currencies | 249,944 | 582,822 | ||||||
Net increase in net assets from operations | $ | 2,279,293 | $ | 3,144,188 | ||||
| (a) | Institutional Plus Class shares of the Core Equity Fund and the Small Company Fund commenced operations on December 17, 2010. |
See accompanying notes to financial statements.
40 |
Table of Contents
ANNUAL REPORT 2011
STATEMENTS OF OPERATIONS
For The Year Ended March 31, 2011
BALANCED FUND | CORE EQUITY FUND | LARGE CAP GROWTH FUND | GROWTH OPPORTUNITIES FUND | SMALL COMPANY FUND | INTERNATIONAL EQUITY FUND | |||||||||||||||||
| $ | 536,069 | $ | – | $ | – | $ | – | $ | – | $ | – | |||||||||||
| 405,721 | 3,242,715 | 1,348,606 | 1,101,881 | 1,474,287 | 4,225,962 | |||||||||||||||||
| (10,952 | ) | (48,653 | ) | (18,555 | ) | (47,540 | ) | – | (443,918 | ) | ||||||||||||
| 930,838 | 3,194,062 | 1,330,051 | 1,054,341 | 1,474,287 | 3,782,044 | |||||||||||||||||
| 241,858 | 1,162,308 | 739,152 | 591,494 | 719,941 | 1,024,758 | |||||||||||||||||
| 50,316 | 223,509 | 120,045 | 114,917 | 122,607 | 168,114 | |||||||||||||||||
| 80,619 | 269,468 | 205,320 | 197,164 | 167,682 | 256,189 | |||||||||||||||||
| 9,039 | 38,469 | 22,453 | 21,089 | 21,747 | 66,608 | |||||||||||||||||
| 4,285 | 17,246 | 11,119 | 10,223 | 9,965 | 13,827 | |||||||||||||||||
| 957 | 5,524 | 2,534 | 2,554 | 3,309 | 3,665 | |||||||||||||||||
| 24,928 | 42,629 | 31,743 | 31,188 | 32,215 | 34,374 | |||||||||||||||||
| 21,377 | 48,600 | 20,903 | 30,963 | 32,398 | 36,224 | |||||||||||||||||
| 6,863 | 64,506 | 28,396 | 26,947 | 26,590 | 33,664 | |||||||||||||||||
| 440,242 | 1,872,259 | 1,181,665 | 1,026,539 | 1,136,454 | 1,637,423 | |||||||||||||||||
| (42,788 | ) | (196,501 | ) | (136,495 | ) | (101,392 | ) | (114,428 | ) | (204,954 | ) | |||||||||||
| (4,267 | ) | (18,983 | ) | (10,975 | ) | (10,292 | ) | (10,622 | ) | – | ||||||||||||
| – | (16,516 | ) | – | – | (6,169 | ) | – | |||||||||||||||
| 393,187 | 1,640,259 | 1,034,195 | 914,855 | 1,005,235 | 1,432,469 | |||||||||||||||||
| 537,651 | 1,553,803 | 295,856 | 139,486 | 469,052 | 2,349,575 | |||||||||||||||||
| 1,017,378 | 4,948,016 | 2,637,205 | 5,306,484 | 3,629,994 | (525,109 | ) | ||||||||||||||||
|
3,581,236 |
| 10,890,974 | 4,493,995 | 19,122,727 | 15,592,041 | 7,533,809 | |||||||||||||||
|
4,598,614 |
| 15,838,990 | 7,131,200 | 24,429,211 | 19,222,035 | 7,008,700 | |||||||||||||||
| $ | 5,136,265 | $ | 17,392,793 | $ | 7,427,056 | $ | 24,568,697 | $ | 19,691,087 | $ | 9,358,275 | |||||||||||
See accompanying notes to financial statements.
41 |
Table of Contents
ANNUAL REPORT 2011
STATEMENTS OF CHANGES IN NET ASSETS
| SHORT-INTERMEDIATE BOND FUND | INCOME FUND | |||||||||||||||
| For The Year Ended March 31, 2011 | For The Year Ended March 31, 2010 | For The Year Ended March 31, 2011 | For The Year Ended March 31, 2010 | |||||||||||||
Operations: | ||||||||||||||||
Net investment income (loss) | $ | 2,029,349 | $ | 2,082,237 | $ | 2,561,366 | $ | 2,712,931 | ||||||||
Net realized gain (loss) from investment transactions | 367,775 | 1,020,647 | 726,569 | 604,648 | ||||||||||||
Change in unrealized appreciation (depreciation) on investments and translations of assets and liabilities in foreign currencies | (117,831 | ) | 1,075,151 | (143,747 | ) | 2,437,870 | ||||||||||
Net increase in net assets from operations | 2,279,293 | 4,178,035 | 3,144,188 | 5,755,449 | ||||||||||||
Distributions to Shareholders: | ||||||||||||||||
From net investment income Institutional Class | (2,222,249 | ) | (2,238,042 | ) | (2,435,476 | ) | (2,744,927 | ) | ||||||||
From net realized gains on investments Institutional Class | – | – | – | – | ||||||||||||
From return of capital Institutional Class | – | – | – | – | ||||||||||||
Change in net assets from distributions to shareholders | (2,222,249 | ) | (2,238,042 | ) | (2,435,476 | ) | (2,744,927 | ) | ||||||||
Capital Transactions: | ||||||||||||||||
Proceeds from shares issued Institutional Class | 16,113,084 | 33,890,007 | 8,485,007 | 20,812,643 | ||||||||||||
Institutional Plus Class (a) | – | – | – | – | ||||||||||||
Proceeds from dividends reinvested Institutional Class | 954,225 | 923,928 | 729,321 | 789,153 | ||||||||||||
Cost of shares redeemed Institutional Class | (20,077,548 | ) | (14,375,615 | ) | (13,479,338 | ) | (16,478,990 | ) | ||||||||
Institutional Plus Class (a) | – | – | – | – | ||||||||||||
Change in net assets from capital transactions | (3,010,239 | ) | 20,438,320 | (4,265,010 | ) | 5,122,806 | ||||||||||
Change in net assets | (2,953,195 | ) | 22,378,313 | (3,556,298 | ) | 8,133,328 | ||||||||||
Net Assets: | ||||||||||||||||
Beginning of year | 71,503,088 | 49,124,775 | 60,098,109 | 51,964,781 | ||||||||||||
End of year | $ | 68,549,893 | $ | 71,503,088 | $ | 56,541,811 | $ | 60,098,109 | ||||||||
Accumulated (excess distributions over) net investment income (loss) | $ | (182,147 | ) | $ | (360,587 | ) | $ | 317,165 | $ | 177,048 | ||||||
Share Transactions Institutional Class: | ||||||||||||||||
Shares issued | 1,687,963 | 3,608,043 | 851,118 | 2,189,949 | ||||||||||||
Shares reinvested | 99,964 | 98,197 | 73,086 | 82,118 | ||||||||||||
Shares redeemed | (2,105,544 | ) | (1,525,163 | ) | (1,357,505 | ) | (1,727,514 | ) | ||||||||
Change in shares | (317,617 | ) | 2,181,077 | (433,301 | ) | 544,553 | ||||||||||
Share Transactions Institutional Plus Class: (a) | ||||||||||||||||
Shares issued | – | – | – | – | ||||||||||||
Shares redeemed | – | – | – | – | ||||||||||||
Change in shares | – | – | – | – | ||||||||||||
| (a) | Institutional Plus Class shares of the Core Equity Fund and the Small Company Fund commenced operations on December 17, 2010. |
See accompanying notes to financial statements.
42 |
Table of Contents
ANNUAL REPORT 2011
STATEMENTS OF CHANGES IN NET ASSETS
| BALANCED FUND | CORE EQUITY FUND | LARGE CAP GROWTH FUND | ||||||||||||||||||||
| For The Year Ended March 31, 2011 | For The Year Ended March 31, 2010 | For The Year Ended March 31, 2011 | For The Year Ended March 31, 2010 | For The Year Ended March 31, 2011 | For The Year Ended March 31, 2010 | |||||||||||||||||
| $ | 537,651 | $ | 401,913 | $ | 1,553,803 | $ | 740,089 | $ | 295,856 | $ | 213,433 | |||||||||||
|
1,017,378 |
| (411,410 | ) | 4,948,016 | (3,139,787 | ) | 2,637,205 | (320,742 | ) | ||||||||||||
|
3,581,236 |
| 9,308,735 | 10,890,974 | 34,785,454 | 4,493,995 | 22,947,060 | |||||||||||||||
| 5,136,265 | 9,299,238 | 17,392,793 | 32,385,756 | 7,427,056 | 22,839,751 | |||||||||||||||||
| (531,794 | ) | (396,549 | ) | (211,335 | ) | (747,149 | ) | (189,954 | ) | (186,642 | ) | |||||||||||
|
– |
| – | – | – | (1,334,463 | ) | – | ||||||||||||||
| – | – | – | – | – | – | |||||||||||||||||
|
(531,794 |
) | (396,549 | ) | (211,335 | ) | (747,149 | ) | (1,524,417 | ) | (186,642 | ) | ||||||||||
| 10,449,668 | 6,102,006 | 19,187,089 | 31,396,964 | 16,154,741 | 38,622,721 | |||||||||||||||||
| – | – | 164,771,606 | – | – | – | |||||||||||||||||
|
529,892 |
| 394,723 | 113,657 | 405,398 | 1,192,449 | 102,332 | |||||||||||||||
| (6,890,669 | ) | (7,362,082 | ) | (24,016,033 | ) | (21,711,347 | ) | (14,822,011 | ) | (10,929,539 | ) | |||||||||||
| – | – | (4,742,483 | ) | – | – | – | ||||||||||||||||
| 4,088,891 | (865,353 | ) | 155,313,836 | 10,091,015 | 2,525,179 | 27,795,514 | ||||||||||||||||
| 8,693,362 | 8,037,336 | 172,495,294 | 41,729,622 | 8,427,818 | 50,448,623 | |||||||||||||||||
| 29,898,121 | 21,860,785 | 111,729,956 | 70,000,334 | 81,219,607 | 30,770,984 | |||||||||||||||||
| $ | 38,591,483 | $ | 29,898,121 | $ | 284,225,250 | $ | 111,729,956 | $ | 89,647,425 | $ | 81,219,607 | |||||||||||
$ |
17,881 |
| $ | 12,024 | $ | 1,342,468 | $ | – | $ | 151,117 | $ | 45,013 | ||||||||||
| 793,572 | 549,022 | 2,447,869 | 4,481,571 | 1,831,719 | 5,521,706 | |||||||||||||||||
| 40,307 | 35,146 | 15,808 | 57,956 | 132,482 | 13,504 | |||||||||||||||||
| (532,953 | ) | (692,376 | ) | (3,080,403 | ) | (3,059,735 | ) | (1,690,846 | ) | (1,377,306 | ) | |||||||||||
| 300,926 | (108,208 | ) | (616,726 | ) | 1,479,792 | 273,355 | 4,157,904 | |||||||||||||||
| – | – | 20,151,807 | – | – | – | |||||||||||||||||
| – | – | (560,589 | ) | – | – | – | ||||||||||||||||
| – | – | 19,591,218 | – | – | – | |||||||||||||||||
See accompanying notes to financial statements.
43 |
Table of Contents
ANNUAL REPORT 2011
STATEMENTS OF CHANGES IN NET ASSETS
| GROWTH OPPORTUNITIES FUND | SMALL COMPANY FUND | |||||||||||||||
| For The Year Ended March 31, 2011 | For The Year Ended March 31, 2010 | For The Year Ended March 31, 2011 | For The Year Ended March 31, 2010 | |||||||||||||
Operations: | ||||||||||||||||
Net investment income (loss) | $ | 139,486 | $ | (59,351 | ) | $ | 469,052 | $ | 239,726 | |||||||
Net realized gain (loss) from investment | 5,306,484 | (2,311,057 | ) | 3,629,994 | 1,773,183 | |||||||||||
Change in unrealized appreciation (depreciation) | 19,122,727 | 26,332,035 | 15,592,041 | 22,510,337 | ||||||||||||
Net increase in net assets from operations | 24,568,697 | 23,961,627 | 19,691,087 | 24,523,246 | ||||||||||||
Distributions to Shareholders: | ||||||||||||||||
From net investment income Institutional Class | (139,486 | ) | – | (44,697 | ) | (229,424 | ) | |||||||||
From net realized gains on investments Institutional Class | – | – | (4,430,622 | ) | – | |||||||||||
From return of capital Institutional Class | (171,098 | ) | – | – | – | |||||||||||
Change in net assets from distributions to shareholders | (310,584 | ) | – | (4,475,319 | ) | (229,424 | ) | |||||||||
Capital Transactions: | ||||||||||||||||
Proceeds from shares issued Institutional Class | 31,436,195 | 16,160,851 | 21,836,642 | 22,340,482 | ||||||||||||
Institutional Plus Class (a) | – | – | 62,950,344 | – | ||||||||||||
Proceeds from dividends reinvested Institutional Class | 237,873 | – | 3,050,804 | 108,709 | ||||||||||||
Cost of shares redeemed | (17,269,965 | ) | (13,493,380 | ) | (22,763,828 | ) | (12,056,762 | ) | ||||||||
Institutional Plus Class (a) | – | – | (3,275,695 | ) | – | |||||||||||
Change in net assets from capital transactions | 14,404,103 | 2,667,471 | 61,798,267 | 10,392,429 | ||||||||||||
Change in net assets | 38,662,216 | 26,629,098 | 77,014,035 | 34,686,251 | ||||||||||||
Net Assets: | ||||||||||||||||
Beginning of year | 68,426,578 | 41,797,480 | 64,737,354 | 30,051,103 | ||||||||||||
End of year | $ | 107,088,794 | $ | 68,426,578 | $ | 141,751,389 | $ | 64,737,354 | ||||||||
Accumulated (excess distributions over) net investment income (loss) | $ | – | $ | – | $ | 202,232 | $ | 15,593 | ||||||||
Share Transactions Institutional Class: | ||||||||||||||||
Shares issued | 2,466,458 | 1,622,142 | 1,253,142 | 1,709,606 | ||||||||||||
Shares reinvested | 17,388 | – | 172,210 | 8,138 | ||||||||||||
Shares redeemed | (1,384,585 | ) | (1,353,150 | ) | (1,320,542 | ) | (843,643 | ) | ||||||||
Change in shares | 1,099,261 | 268,992 | 104,810 | 874,101 | ||||||||||||
Share Transactions Institutional Plus Class: (a) | ||||||||||||||||
Shares issued | – | – | 3,477,936 | – | ||||||||||||
Shares redeemed | – | – | (175,047 | ) | – | |||||||||||
Change in shares | – | – | 3,302,889 | – | ||||||||||||
| (a) | Institutional Plus Class shares of the Core Equity Fund and the Small Company Fund commenced operations on December 17, 2010. |
See accompanying notes to financial statements.
44 |
Table of Contents
ANNUAL REPORT 2011
STATEMENTS OF CHANGES IN NET ASSETS
| INTERNATIONAL EQUITY FUND | ||||||
| For The Year Ended March 31, 2011 | For The Year Ended March 31, 2010 | |||||
| $ | 2,349,575 | $ | 1,579,234 | |||
|
(525,109 |
) | 8,267,909 | |||
|
7,533,809 |
| 28,777,143 | |||
| 9,358,275 | 38,624,286 | |||||
| (2,144,150 | ) | (306,779 | ) | |||
|
– |
| – | |||
| – | – | |||||
|
(2,144,150 |
) | (306,779 | ) | ||
| 20,742,983 | 28,020,784 | |||||
| – | – | |||||
|
1,055,702 |
| 162,817 | |||
| (26,556,745) | (20,486,637 | ) | ||||
| – | – | |||||
| (4,758,060) | 7,696,964 | |||||
| 2,456,065 | 46,014,471 | |||||
| 102,163,713 | 56,149,242 | |||||
| $ | 104,619,778 | $ | 102,163,713 | |||
$ |
1,875,064 |
| $ | 1,514,878 | ||
| 2,114,615 | 3,271,374 | |||||
| 102,695 | 16,249 | |||||
| (2,636,765 | ) | (2,178,151 | ) | |||
| (419,455 | ) | 1,109,472 | ||||
| – | – | |||||
| – | – | |||||
| – | – | |||||
45 |
Table of Contents
ANNUAL REPORT 2011
For a Share Outstanding
| Investment Activities | Distributions to Shareholders from: | Ratios/Supplemental Data | ||||||||||||||||||||||||||||||||||||||||||||||||||
Period Ended | Net Asset Value, Beginning of Period | Net Investment Income (Loss) | Net Realized and Unrealized Gains (Losses) on and Foreign | Total from Investment Operations | Net Investment Income | Net Realized Foreign | Net Asset Value, End of Period | Total Return(a) | Net Assets, End of Period (000’s) | Expense to Average Net Assets(b) | Net Investment Income (Loss) to Average Net Assets(b) | Expense to Average Net Assets*(b) | Portfolio Turnover(a) | |||||||||||||||||||||||||||||||||||||||
SHORT-INTERMEDIATE BOND FUND |
| |||||||||||||||||||||||||||||||||||||||||||||||||||
Institutional Class |
| |||||||||||||||||||||||||||||||||||||||||||||||||||
03/31/11 | $ | 9.51 | $ | 0.28 | (c) | $ | 0.03 | $ | 0.31 | $ | (0.31 | ) | $ | – | $ | 9.51 | 3.27 | % | $ | 68,550 | 0.82 | % | 2.94 | % | 1.08 | % | 45 | % | ||||||||||||||||||||||||
03/31/10 | 9.20 | 0.32 | (c) | 0.34 | 0.66 | (0.35 | ) | – | 9.51 | 7.18 | 71,503 | 0.86 | 3.39 | 1.17 | 62 | |||||||||||||||||||||||||||||||||||||
03/31/09 | 9.45 | 0.33 | (0.14 | ) | 0.19 | (0.39 | ) | (0.05 | ) | 9.20 | 2.05 | 49,125 | 0.90 | 3.53 | 1.20 | 50 | ||||||||||||||||||||||||||||||||||||
03/31/08 | 9.40 | 0.41 | 0.05 | 0.46 | (0.41 | ) | – | 9.45 | 5.01 | (d) | 50,299 | 0.82 | (e) | 4.33 | (e) | 1.17 | 68 | |||||||||||||||||||||||||||||||||||
03/31/07 | 9.35 | 0.35 | (c) | 0.11 | 0.46 | (0.41 | ) | – | 9.40 | 5.07 | 47,306 | 0.89 | 3.78 | 1.13 | 70 | |||||||||||||||||||||||||||||||||||||
INCOME FUND |
| |||||||||||||||||||||||||||||||||||||||||||||||||||
Institutional Class |
| |||||||||||||||||||||||||||||||||||||||||||||||||||
03/31/11 | 9.79 | 0.42 | (c) | 0.10 | 0.52 | (0.40 | ) | – | 9.91 | 5.37 | 56,542 | 0.83 | 4.26 | 1.18 | 68 | |||||||||||||||||||||||||||||||||||||
03/31/10 | 9.29 | 0.45 | (c) | 0.51 | 0.96 | (0.46 | ) | – | 9.79 | 10.49 | 60,098 | 0.77 | 4.72 | 1.27 | 71 | |||||||||||||||||||||||||||||||||||||
03/31/09 | 9.69 | 0.42 | (0.39 | ) | 0.03 | (0.43 | ) | – | 9.29 | 0.40 | 51,965 | 0.79 | 4.47 | 1.33 | 63 | |||||||||||||||||||||||||||||||||||||
03/31/08 | 9.63 | 0.46 | 0.05 | 0.51 | (0.45 | ) | – | 9.69 | 5.27 | (d) | 59,117 | 0.71 | (e) | 4.73 | (e) | 1.29 | 81 | |||||||||||||||||||||||||||||||||||
03/31/07 | 9.52 | 0.40 | 0.12 | 0.52 | (0.41 | ) | – | 9.63 | 5.66 | 64,946 | 0.98 | 4.21 | 1.19 | 77 | ||||||||||||||||||||||||||||||||||||||
BALANCED FUND |
| |||||||||||||||||||||||||||||||||||||||||||||||||||
Institutional Class |
| |||||||||||||||||||||||||||||||||||||||||||||||||||
03/31/11 | 12.44 | 0.22 | (c) | 1.82 | 2.04 | (0.21 | ) | – | 14.27 | 16.56 | 38,591 | 1.22 | 1.67 | 1.37 | 34 | |||||||||||||||||||||||||||||||||||||
03/31/10 | 8.70 | 0.17 | (c) | 3.74 | 3.91 | (0.17 | ) | – | 12.44 | 45.17 | 29,898 | 1.37 | 1.57 | 1.53 | 70 | |||||||||||||||||||||||||||||||||||||
03/31/09 | 12.36 | 0.24 | (3.44 | ) | (3.20 | ) | (0.24 | ) | (0.22 | ) | 8.70 | (26.13 | ) | 21,861 | 1.35 | 2.28 | 1.51 | 60 | ||||||||||||||||||||||||||||||||||
03/31/08 | 14.69 | 0.18 | (0.17 | ) | 0.01 | (0.18 | ) | (2.16 | ) | 12.36 | (0.55 | ) (d) | 31,376 | 1.30 | (e) | 1.32 | (e) | 1.51 | 83 | |||||||||||||||||||||||||||||||||
03/31/07 | 14.14 | 0.12 | 0.57 | 0.69 | (0.12 | ) | (0.02 | ) | 14.69 | 4.83 | 33,659 | 1.33 | 0.84 | 1.45 | 60 | |||||||||||||||||||||||||||||||||||||
See accompanying notes to financial statements.
46 |
Table of Contents
ANNUAL REPORT 2011
FINANCIAL HIGHLIGHTS
For a Share Outstanding
| Investment Activities | Distributions to Shareholders from: | Ratios/Supplemental Data | ||||||||||||||||||||||||||||||||||||||||||||||||||
| Period Ended | Net Asset Value, Beginning of Period | Net Investment Income (Loss) | Net Realized and Unrealized Gains (Losses) on Investments and Foreign Currency | Total from Investment Operations | Net Investment Income | Net Realized Foreign | Net Asset Value, End of Period | Total Return(a) | Net Assets, End of Period (000’s) | Expense to Average | Net Investment Income (Loss) to Average Net Assets(b) | Expense to Average Net Assets*(b) | Portfolio Turnover(a) | |||||||||||||||||||||||||||||||||||||||
CORE EQUITY FUND |
| |||||||||||||||||||||||||||||||||||||||||||||||||||
Institutional Class |
| |||||||||||||||||||||||||||||||||||||||||||||||||||
03/31/11 | $ | 7.92 | $ | 0.06 | (c) | $ | 0.63 | $ | 0.69 | $ | (0.02 | ) | $ | – | $ | 8.59 | 8.69 | % | $ | 115,919 | 1.15 | % | 0.82 | % | 1.29 | % | 32 | % | ||||||||||||||||||||||||
03/31/10 | 5.54 | 0.05 | (c) | 2.39 | 2.44 | (0.06 | ) | – | 7.92 | 44.10 | 111,730 | 1.18 | 0.78 | 1.34 | 24 | |||||||||||||||||||||||||||||||||||||
03/31/09 | 8.72 | 0.09 | (3.07 | ) | (2.98 | ) | (0.09 | ) | (0.11 | ) | 5.54 | (34.36 | ) | 70,000 | 1.24 | 1.34 | 1.40 | 28 | ||||||||||||||||||||||||||||||||||
03/31/08 | 10.33 | 0.09 | (0.32 | ) | (0.23 | ) | (0.09 | ) | (1.29 | ) | 8.72 | (3.25 | ) (d) | 95,746 | 1.18 | (e) | 0.87 | (e) | 1.39 | 31 | ||||||||||||||||||||||||||||||||
03/31/07 | 10.45 | 0.11 | 1.24 | 1.35 | (0.11 | ) | (1.36 | ) | 10.33 | 13.09 | 108,580 | 1.22 | 1.06 | 1.32 | 36 | |||||||||||||||||||||||||||||||||||||
Institutional Plus Class |
| |||||||||||||||||||||||||||||||||||||||||||||||||||
03/31/11(f) | 8.17 | 0.03 | (c) | 0.39 | 0.42 | – | – | 8.59 | 5.14 | 168,306 | 0.85 | 1.43 | 1.01 | 32 | ||||||||||||||||||||||||||||||||||||||
LARGE CAP GROWTH FUND |
| |||||||||||||||||||||||||||||||||||||||||||||||||||
Institutional Class |
| |||||||||||||||||||||||||||||||||||||||||||||||||||
03/31/11 | 8.73 | 0.03 | (c) | 0.77 | 0.80 | (0.02 | ) | (0.15 | ) | 9.36 | 9.19 | 89,647 | 1.26 | 0.36 | 1.44 | 18 | ||||||||||||||||||||||||||||||||||||
03/31/10 | 5.98 | 0.02 | (c) | 2.75 | 2.77 | (0.02 | ) | – | 8.73 | 46.40 | 81,220 | 1.22 | 0.32 | 1.53 | 14 | |||||||||||||||||||||||||||||||||||||
03/31/09 | 8.60 | 0.05 | (2.62 | ) | (2.57 | ) | (0.05 | ) | – | 5.98 | (29.94 | ) | 30,771 | 0.99 | 0.84 | 1.55 | 18 | |||||||||||||||||||||||||||||||||||
03/31/08(g) | 10.00 | 0.00 | (h) | (1.40 | ) | (1.40 | ) | – | – | 8.60 | (14.00 | ) | 23,509 | 1.95 | 0.03 | 2.41 | 6 | |||||||||||||||||||||||||||||||||||
GROWTH OPPORTUNITIES FUND |
| |||||||||||||||||||||||||||||||||||||||||||||||||||
Institutional Class |
| |||||||||||||||||||||||||||||||||||||||||||||||||||
03/31/11 | 11.50 | 0.02 | (c) | 3.72 | 3.74 | (0.05 | ) (i) | – | 15.19 | 32.54 | 107,089 | 1.16 | 0.18 | 1.30 | 45 | |||||||||||||||||||||||||||||||||||||
03/31/10 | 7.36 | (0.01 | ) (c) | 4.15 | 4.14 | – | – | 11.50 | 56.25 | 68,427 | 1.18 | (0.11 | ) | 1.35 | 54 | |||||||||||||||||||||||||||||||||||||
03/31/09 | 13.16 | 0.05 | (4.44 | ) | (4.39 | ) | (0.02 | ) | (1.39 | ) (i) | 7.36 | (33.91 | ) | 41,797 | 1.27 | 0.48 | 1.43 | 64 | ||||||||||||||||||||||||||||||||||
03/31/08 | 15.21 | (0.02 | ) | (0.69 | ) | (0.71 | ) | (0.05 | ) | (1.29 | ) | 13.16 | (5.50 | ) (d) | 69,135 | 1.20 | (e) | (0.17 | ) (e) | 1.42 | 73 | |||||||||||||||||||||||||||||||
03/31/07 | 16.12 | (0.02 | ) | 0.81 | 0.79 | – | (1.70 | ) | 15.21 | 5.31 | 70,521 | 1.26 | (0.15 | ) | 1.37 | 51 | ||||||||||||||||||||||||||||||||||||
See accompanying notes to financial statements.
47 |
Table of Contents
ANNUAL REPORT 2011
FINANCIAL STATEMENTS
For a Share Outstanding
| Investment Activities | Distributions to Shareholders from: | Ratios/Supplemental Data | ||||||||||||||||||||||||||||||||||||||||||||||||||
| Period Ended | Net Asset Value, Beginning of Period | Net Investment Income (Loss) | Net Realized and Unrealized Gains (Losses) on Investments and Foreign Currency | Total from Investment Operations | Net Investment Income | Net Realized Foreign | Net Asset Value, End of Period | Total Return(a) | Net Assets, End of Period (000’s) | Expense to Average Net Assets(b) | Net Investment Income (Loss) to Average Net Assets(b) | Expense to Average Net Assets*(b) | Portfolio Turnover(a) | |||||||||||||||||||||||||||||||||||||||
SMALL COMPANY FUND |
| |||||||||||||||||||||||||||||||||||||||||||||||||||
Institutional Class |
| |||||||||||||||||||||||||||||||||||||||||||||||||||
03/31/11 | $ | 16.56 | $ | 0.11 | (c) | $ | 3.89 | $ | 4.00 | $ | (0.01 | ) | $ | (1.18 | ) | $ | 19.37 | 24.83 | % | $ | 77,747 | 1.26 | % | 0.64 | % | 1.41 | % | 28 | % | |||||||||||||||||||||||
03/31/10 | 9.90 | 0.06 | (c) | 6.66 | 6.72 | (0.06 | ) | – | 16.56 | 68.04 | 64,737 | 1.34 | 0.47 | 1.50 | 30 | |||||||||||||||||||||||||||||||||||||
03/31/09 | 15.65 | 0.12 | (5.46 | ) | (5.34 | ) | (0.12 | ) | (0.29 | ) | 9.90 | (34.47 | ) | 30,051 | 1.43 | 0.88 | 1.59 | 32 | ||||||||||||||||||||||||||||||||||
03/31/08 | 19.47 | 0.06 | (1.06 | ) | (1.00 | ) | (0.06 | ) | (2.76 | ) | 15.65 | (5.87 | ) (d) | 39,676 | 1.35 | (e) | 0.37 | (e) | 1.56 | 27 | ||||||||||||||||||||||||||||||||
03/31/07 | 20.08 | 0.08 | 1.77 | 1.85 | (0.10 | ) | (2.36 | ) | 19.47 | 9.56 | 45,845 | 1.38 | 0.41 | 1.48 | 31 | |||||||||||||||||||||||||||||||||||||
Institutional Plus Class |
| |||||||||||||||||||||||||||||||||||||||||||||||||||
03/31/11(f) | 18.09 | 0.01 | (c) | 1.28 | 1.29 | – | – | 19.38 | 7.13 | 64,005 | 0.93 | 0.22 | 1.10 | 28 | ||||||||||||||||||||||||||||||||||||||
INTERNATIONAL EQUITY FUND |
| |||||||||||||||||||||||||||||||||||||||||||||||||||
Institutional Class |
| |||||||||||||||||||||||||||||||||||||||||||||||||||
03/31/11 | 10.02 | 0.23 | (c) | 0.66 | 0.89 | (0.21 | ) | – | 10.70 | 8.97 | 104,620 | 1.40 | 2.29 | 1.60 | 93 | |||||||||||||||||||||||||||||||||||||
03/31/10 | 6.18 | 0.16 | (c) | 3.71 | 3.87 | (0.03 | ) | – | 10.02 | 62.63 | 102,164 | 1.45 | 1.72 | 1.66 | 126 | |||||||||||||||||||||||||||||||||||||
03/31/09 | 12.93 | 0.19 | (6.62 | ) | (6.43 | ) | (0.18 | ) | (0.14 | ) | 6.18 | (50.02 | ) | 56,149 | 1.52 | 2.09 | 1.77 | 64 | ||||||||||||||||||||||||||||||||||
03/31/08 | 15.21 | 0.16 | (0.78 | ) | (0.52 | ) | (0.15 | ) | (1.51 | ) | 12.93 | (5.40 | ) (d) | 93,782 | 1.41 | (e) | 1.10 | (e) | 1.72 | 68 | ||||||||||||||||||||||||||||||||
03/31/07 | 13.48 | 0.12 | 2.36 | 2.48 | (0.15 | ) | (0.60 | ) | 15.21 | 18.70 | 85,896 | 1.44 | 0.97 | 1.65 | 49 | |||||||||||||||||||||||||||||||||||||
| * | ||||||||||||||||||||||||||||||||||||||||||||||||||||
| * | Ratios excluding contractual and voluntary waivers. Voluntary waivers may be stopped at any time. |
| (a) | Not annualized for periods less than one year. |
| (b) | Annualized for periods less than one year. |
| (c) | Per share data calculated using average shares method. |
| (d) | During the year ended March 31, 2008, First National reimbursed amounts to certain Funds related to past marketing arrangements. The corresponding impact to the total return was an increase of 0.06%. See Note 7 in notes to financial statements. |
| (e) | During the year ended March 31, 2008, First National reimbursed amounts to certain Funds related to past marketing arrangements. The corresponding impact was a decrease to the net expense ratio and an increase to the net income ratio of, 0.06% for Short-Intermediate Bond Fund, 0.06% for Income Fund, 0.06% for Balanced Fund, 0.06% for Core Equity Fund, 0.07% for Growth Opportunities Fund, 0.06% for Small Company Fund and 0.06% for International Equity Fund. See Note 7 in notes to financial statements. |
| (f) | Commenced operations on December 17, 2010. |
| (g) | Commenced operations on July 5, 2007. |
| (h) | Amount rounds to less than $0.005 per share. |
| (i) | Distribution amount for the Growth Opportunities Fund includes a return of capital distribution of $0.10 and $0.03 per share for the years ended March 31, 2009 and March 31, 2011, respectively. |
See accompanying notes to financial statements.
48 |
Table of Contents
ANNUAL REPORT 2011
March 31, 2011
1. Organization
Tributary Funds, Inc. (the “Company”) was organized in October 1994 as a Nebraska corporation and is registered under the Investment Company Act of 1940, as amended (the “1940 Act”), as a diversified open-end management investment company issuing its shares in series. The Company consists of eight series, the Short-Intermediate Bond Fund, the Income Fund, the Balanced Fund, the Core Equity Fund, the Large Cap Growth Fund, the Growth Opportunities Fund, the Small Company Fund and the International Equity Fund (collectively, the “Funds” and individually, a “Fund”). Each series represents a distinct portfolio with its own investment objectives and policies.
All Funds presently offer Institutional Class shares without a sales charge. Effective August 1, 2010, each Fund established Institutional Plus Class shares. The two classes differ principally in applicable minimum investment, shareholder servicing fees and co-administration fee waivers. Shareholders bear the common expenses of each Fund and earn income and realized gains/losses from each Fund pro rata based on the average daily net assets of each class, without discrimination between share classes. Each share class also has different voting rights on matters affecting a single class. No class has preferential dividend rights. The Core Equity Fund and Small Company Fund presently offer Institutional Plus Class shares.
Also effective August 1, 2010, the Company and the Funds changed their names. The name changes were as follows:
| Name prior to August 1, 2010 | Name Effective August 1, 2010 | |
First Focus Funds, Inc. | Tributary Funds, Inc. | |
First Focus Short-Intermediate Bond Fund | Tributary Short-Intermediate Bond Fund | |
First Focus Income Fund | Tributary Income Fund | |
First Focus Balanced Fund | Tributary Balanced Fund | |
First Focus Core Equity Fund | Tributary Core Equity Fund | |
First Focus Large Cap Growth Fund | Tributary Large Cap Growth Fund | |
First Focus Growth Opportunities Fund | Tributary Growth Opportunities Fund | |
First Focus Small Company Fund | Tributary Small Company Fund | |
First Focus International Equity Fund | Tributary International Equity Fund |
Under the Company’s organizational documents, the Company shall indemnify its Officers and Directors against certain liabilities arising out of the performance of their duties to the Company. In addition, in the normal course of business, the Company may enter into contracts with its vendors and others that provide general indemnifications. The Company’s maximum exposure under these arrangements is unknown, as this would involve future claims that may be made against the Company. However, based on experience, the Company expects the risk of loss to be remote.
2. Significant Accounting Policies
The following is a summary of significant accounting policies consistently followed by the Company in the preparation of its financial statements. The policies are in conformity with accounting principles generally accepted in the United States of America (“GAAP”). The preparation of financial statements requires management to make estimates and assumptions that affect the reported amounts of assets and liabilities, the disclosure of contingent assets and liabilities at the date of financial statements and the reported amounts of income and expenses for the period. Actual results could differ from those estimates.
Security Valuation
The net asset value (“NAV”) per share of each Fund is determined each business day as of the close of the New York Stock Exchange (“NYSE”), which is normally 4 p.m. Eastern Time. Each Fund’s NAV is calculated by adding the value of all securities and other assets of the Fund, subtracting its liabilities and dividing the result by the number of its outstanding shares. In valuing a Fund’s assets for calculating the NAV, securities listed on a securities exchange, market or automated quotation system for which quotations are readily available, including traded over-the-counter securities, are valued at the last quoted sale price on the primary exchange or market (foreign or domestic) on which they traded or, if there is no such
| 49 |
Table of Contents
ANNUAL REPORT 2011
NOTES TO FINANCIAL STATEMENTS
March 31, 2011
reported sale on the valuation date, at the most recent quoted bid price. Investments in mutual funds are valued at the NAV per share determined as of the close of the NYSE. Short-term debt obligations (maturing within 60 days) may be valued on an amortized cost basis, unless such value does not approximate market value. Debt securities (other than short-term investments) are valued at prices furnished by pricing services and generally reflect last reported sales price if the security is actively traded or an evaluated bid price obtained by employing methodologies that utilize actual market transactions; broker supplied valuations; or factors such as yield, maturity, call features, credit ratings or developments relating to specific securities in arriving at the valuation. Prices provided by pricing services are subject to review and determination of the appropriate price whenever a furnished price is significantly different from the previous day’s furnished price. The Funds’ investment adviser and sub-advisers, as applicable, assist the Company’s Board of Directors (the “Board”), which is responsible for this review and determination process.
Securities for which quotations are not readily available are valued at fair value as determined in good faith by the Company’s Fair Value Committee pursuant to procedures established by the Board. Situations that may require an investment to be fair valued include instances where a security is thinly traded, halted or restricted as to resale. In addition, investments may be fair valued based on the occurrence of a significant event. Significant events may be specific to a particular issuer, such as mergers, restructurings or defaults. Alternatively, significant events may affect an entire market, such as natural disasters, government actions and significant changes in the value of U.S. securities markets. Securities are fair valued based on observable and unobservable inputs, including the Company’s Fair Value Committee’s own assumptions in determining fair value. Factors used in determining fair value include, but are not limited to, type of security or asset, fundamental analytical data relating to the investment, evaluation of the forces that influence the market in which the security is purchased and sold and information as to any transactions or offers with respect to the security. In the event of an increase or decrease in the value of a designated benchmark index greater than predetermined levels, the International Equity Fund may use an independent statistical fair value pricing service to fair value certain international equity securities.
The Financial Accounting Standards Board (“FASB”) has issued Accounting Standards Update (“ASU”) No. 2010-06 “Improving Disclosures about Fair Value Measurements”. ASU No. 2010-06 clarifies existing disclosure requirements and mandates additional disclosures regarding fair value measurements. Effective for interim and annual reporting periods beginning after December 15, 2009, entities are required to disclose significant transfers into and out of Level 1 and 2 measurements in the fair value hierarchy and the reasons for those transfers. Effective for fiscal years beginning after December 15, 2010, and for interim periods within those fiscal years, entities will need to disclose information about purchases, sales, issuances and settlements of Level 3 securities on a gross basis, rather than as a net number. The additional disclosures are incorporated into this report.
The Funds use a framework for measuring fair value. Fair value is defined as the price that would be received to sell an asset or paid to transfer a liability in an orderly transaction between market participants (exit price). One component of fair value is a three-tier fair value hierarchy. The basis of the tiers is dependent upon various “inputs” used to determine the value of the Funds’ investments. These inputs are summarized in the three broad levels listed below:
Level 1 – | includes valuations based on quoted prices of identical securities in active markets including valuations for securities listed on a national or foreign stock exchange or investments in mutual funds. | |
Level 2 – | includes valuations for which all significant inputs are observable, either directly or indirectly. Direct observable inputs include broker quotes, closing prices of similar securities in active markets, closing prices for identical or similar securities in non-active markets or corporate action or reorganization entitlement values. Indirect significant observable inputs include factors such as interest rates, yield curves, prepayment speeds or credit ratings. Level 2 includes valuations for fixed income securities priced by pricing services, broker quotes in active markets, securities subject to corporate actions, international equity securities priced by an independent statistical fair value pricing service or ADRs and GDRs for which quoted prices in active markets are not available. | |
Level 3 – | includes valuations based on inputs that are unobservable and significant to the fair value measurement, including the Company’s own assumptions in determining the fair value of the investment. Inputs used to determine the fair |
| 50 |
Table of Contents
ANNUAL REPORT 2011
NOTES TO FINANCIAL STATEMENTS
March 31, 2011
value of Level 3 securities include security specific inputs such as: credit quality, issuer news, trading characteristics, or industry specific inputs such as: trading activity of similar markets or securities, changes in the security’s underlying index or comparable securities’ models. Level 3 valuations include securities that are priced based on single source broker quotes, where prices may be unavailable due to halted trading, restricted to resale due to market events, newly issued or for which reliable quotes are not available.
The inputs or methodology used for valuing investments are not necessarily an indication of the risk associated with investing in those investments.
The following is a summary of the inputs used to value each Fund’s investments as of March 31, 2011, by category:
| LEVEL 1 - Quoted Prices | LEVEL 2 - Significant Observable Inputs | LEVEL 3 - Significant Unobservable Inputs | Total | |||||||||||||
Short-Intermediate Bond Fund | ||||||||||||||||
Non-U.S. Government Agency Asset-Backed Securities | $ | — | $ | 14,342,654 | $ | 378,510 | $ | 14,721,164 | ||||||||
Corporate Bonds | — | 29,445,465 | — | 29,445,465 | ||||||||||||
Government and Agency Obligations | — | 20,241,876 | — | 20,241,876 | ||||||||||||
Preferred Stocks | 467,505 | — | — | 467,505 | ||||||||||||
Exchange Traded Funds | 311,101 | — | — | 311,101 | ||||||||||||
Investment Company | 887,567 | — | — | 887,567 | ||||||||||||
Short Term Investments | 1,782,866 | — | — | 1,782,866 | ||||||||||||
Total | $ | 3,449,039 | $ | 64,029,995 | $ | 378,510 | $ | 67,857,544 | ||||||||
Income Fund | ||||||||||||||||
Non-U.S. Government Agency Asset-Backed Securities | $ | — | $ | 13,257,710 | $ | 517,058 | $ | 13,774,768 | ||||||||
Corporate Bonds | — | 13,264,160 | — | 13,264,160 | ||||||||||||
Government and Agency Obligations | — | 26,717,471 | — | 26,717,471 | ||||||||||||
Preferred Stocks | 493,006 | — | — | 493,006 | ||||||||||||
Exchange Traded Funds | 464,122 | — | — | 464,122 | ||||||||||||
Investment Company | 887,567 | — | — | 887,567 | ||||||||||||
Short Term Investments | 620,244 | — | — | 620,244 | ||||||||||||
Total | $ | 2,464,939 | $ | 53,239,341 | $ | 517,058 | $ | 56,221,338 | ||||||||
Balanced Fund | ||||||||||||||||
Common Stocks | $ | 25,726,701 | $ | — | $ | — | $ | 25,726,701 | ||||||||
Corporate Bonds | — | 6,438,816 | — | 6,438,816 | ||||||||||||
Government and Agency Obligations | — | 4,495,399 | — | 4,495,399 | ||||||||||||
Short Term Investments | 1,929,483 | — | — | 1,929,483 | ||||||||||||
Total | $ | 27,656,184 | $ | 10,934,215 | $ | — | $ | 38,590,399 | ||||||||
Core Equity Fund | ||||||||||||||||
Common Stocks | $ | 274,331,806 | $ | — | $ | — | $ | 274,331,806 | ||||||||
Short Term Investments | 8,354,134 | — | — | 8,354,134 | ||||||||||||
Total | $ | 282,685,940 | $ | — | $ | — | $ | 282,685,940 | ||||||||
Large Cap Growth Fund | ||||||||||||||||
Common Stocks | $ | 87,401,060 | $ | — | $ | — | $ | 87,401,060 | ||||||||
Short Term Investments | 2,140,441 | — | — | 2,140,441 | ||||||||||||
Total | $ | 89,541,501 | $ | — | $ | — | $ | 89,541,501 | ||||||||
51 |
Table of Contents
ANNUAL REPORT 2011
NOTES TO FINANCIAL STATEMENTS
March 31, 2011
| LEVEL 1 - Quoted Prices | LEVEL 2 - Significant Observable Inputs | LEVEL 3 - Significant Unobservable Inputs | Total | |||||||||||||
Growth Opportunities Fund | ||||||||||||||||
Common Stocks | $ | 101,516,901 | $ | — | $ | — | $ | 101,516,901 | ||||||||
Short Term Investments | 5,467,887 | — | — | 5,467,887 | ||||||||||||
Total | $ | 106,984,788 | $ | — | $ | — | $ | 106,984,788 | ||||||||
Small Company Fund | ||||||||||||||||
Common Stocks | $ | 136,341,533 | $ | — | $ | — | $ | 136,341,533 | ||||||||
Short Term Investments | 5,885,850 | — | — | 5,885,850 | ||||||||||||
Total | $ | 142,227,383 | $ | — | $ | — | $ | 142,227,383 | ||||||||
International Equity Fund | ||||||||||||||||
Foreign Stocks | $ | 99,172,785 | $ | — | $ | — | $ | 99,172,785 | ||||||||
Preferred Stocks | 1,407,866 | — | — | 1,407,866 | ||||||||||||
Exchange Traded Funds | 854,414 | — | — | 854,414 | ||||||||||||
Short Term Investments | 1,811,604 | — | — | 1,811,604 | ||||||||||||
Total | $ | 103,246,669 | $ | — | $ | — | $ | 103,246,669 | ||||||||
The only significant transfers in and out of Level 1 and Level 2 during the year ended March 31, 2011 occurred in the International Equity Fund. As previously noted, an independent statistical fair value pricing service is used to value international equity securities where criteria constituting a significant event exists. In instances where criteria constituting a significant event exists and foreign investments are valued using an independent statistical fair value pricing service, they are considered Level 2 valuations. In the absence of the existence of such criteria, the same foreign investments are generally valued using market prices from the applicable exchange and are considered Level 1 valuations. Significant event criteria did not exist as of March 31, 2010 or March 31, 2011, and therefore, foreign investments were generally valued as Level 1 on March 31, 2010 and March 31, 2011. There were no significant transfers into or out of Level 3 during the year.
The following table is a rollforward of Level 3 investments by category for which significant unobservable inputs were used to determine fair value during the year ended March 31, 2011:
| Balance at Beginning of Period | Transfers Into Level 3 | Transfers Out of Level 3 | Total Realized and Change in Unrealized Gain/ (Loss) | Purchases | (Sales) | Balance at End of Period | Change in Unrealized Appreciation/ (Depreciation) for Level 3 Investments Held at End of Period | |||||||||||||||||||||||||
Short-Intermediate Bond Fund | ||||||||||||||||||||||||||||||||
Non-U.S. Government Agency Asset- Backed Securities | $ | 372,898 | $ | - | $ | - | $ | 12,017 | $ | - | $ | (6,405 | ) | $ | 378,510 | $ | 10,583 | |||||||||||||||
Income Fund | ||||||||||||||||||||||||||||||||
Non-U.S. Government Agency Asset- Backed Securities | $ | 451,644 | $ | - | $ | - | $ | 68,110 | $ | 3,910 | $ | (6,606 | ) | $ | 517,058 | $ | 66,632 | |||||||||||||||
52 |
Table of Contents
ANNUAL REPORT 2011
NOTES TO FINANCIAL STATEMENTS
March 31, 2011
Securities Transactions and Investment Income
Securities transactions are accounted for no later than one business day following trade date. For financial reporting purposes, however, security transactions are accounted for on trade date on the last business day of the reporting period. Interest income is recognized on the accrual basis and includes, where applicable, the amortization of premium or accretion of discount. Dividend income is recorded on the ex-dividend date. Gains or losses realized on the sales of securities and on foreign currency transactions are determined by comparing the identified cost of the security lot sold with the net sale proceeds.
Risk Associated with Foreign Securities and Currencies
The International Equity Fund invests in securities of foreign issuers in various countries. These investments may involve certain considerations and risks not typically associated with investments in the United States as a result of, among other factors, the possibility of adverse future political and economic developments, lack of liquidity, low market capitalizations, foreign currency fluctuations, and the level of governmental supervision and regulation of securities markets in the respective countries. In addition, with respect to certain countries, there is the possibility of expropriation of assets, confiscatory taxation, and political or social instability or diplomatic developments, all of which could adversely affect the value of those securities.
Certain countries may also impose substantial restrictions on investments on their capital markets by foreign entities, including restriction on investment in issuers or industries deemed sensitive to the relevant nation’s interests. These factors may limit the investment opportunities available or result in lack of liquidity and high price volatility with respect to securities of issuers from developing countries.
Forward Foreign Currency Exchange Contracts
The International Equity Fund may enter into forward foreign currency contracts in connection with a planned purchase or sale of securities or to hedge the U.S. dollar value of securities denominated in a particular currency. A forward foreign currency contract is an agreement between two parties to buy and sell a currency at a set price on a future date. The use of forward foreign currency contracts does not eliminate fluctuations in the underlying prices of the International Equity Fund’s portfolio securities, but it does establish a rate of exchange that can be achieved in the future. The value of a forward foreign currency contract fluctuates with changes in foreign currency exchange rates. Forward foreign currency contracts are marked-to-market daily based on the bid exchange rate of the underlying currency and any gains or losses are recorded by the International Equity Fund as an unrealized gain or loss and as a receivable or payable from forward foreign currency contracts. Upon delivery or receipt of the currency, a realized gain or loss is recorded which is equal to the difference between the value of the contract at the time it is opened and the value at the time it is closed. The International Equity Fund could be exposed to risks if the counterparties to the contracts are unable to meet the terms of their contracts and from unanticipated movements in the value of a foreign currency relative to the U.S. dollar. Although contracts limit the risk of loss due to a decline in the value of the hedged currency, they also limit any potential gain that might result should the value of the currency increase. During the year ended March 31, 2011, the International Equity Fund did not hold any forward foreign currency contracts.
Foreign Currency Translation
The books and records of each Fund are maintained in U.S. dollars. Foreign currency amounts are translated into U.S. dollars on the following basis:
| (i) | Fair value of investment securities, other assets and liabilities at the current bid rate of exchange |
| (ii) | Purchases and sales of investment securities, income and expenses at the relevant rates of exchange prevailing on the respective dates of such transactions |
The Funds do not isolate the portion of gains and losses on investments in securities that is due to changes in the foreign exchange rates from that which is due to changes in the market prices of such securities. The Funds report gains and losses
| 53 |
Table of Contents
ANNUAL REPORT 2011
NOTES TO FINANCIAL STATEMENTS
March 31, 2011
on foreign currency related transactions as realized and unrealized gains and losses for financial reporting purposes, whereas such gains and losses are treated as ordinary income or loss for U.S. federal income tax purposes.
Dividends and interest from non-U.S. sources received by a Fund are generally subject to non-U.S. net withholding taxes. Such withholding taxes may be reduced or eliminated under the terms of applicable U.S. income tax treaties, and each Fund intends to undertake any procedural steps required to claim the benefits of such treaties. If the value of more than 50% of the Fund’s total assets at the close of any taxable year consists of stock or securities of non-U.S. corporations, the International Equity Fund is permitted and may elect to treat any non-U.S. taxes paid by it as paid by its shareholders.
Loans of Portfolio Securities
All Funds may lend their securities pursuant to securities lending agreements (“Lending Agreements”) with Union Bank, N.A. (formerly known as Union Bank of California N.A.) (“Union Bank”).
There was no securities lending activity during the year ended March 31, 2011. While the Funds have executed the Lending Agreements for securities lending, the Company has not determined when or if they will commence securities lending transactions under the Lending Agreements.
Restricted Securities
A restricted security is a security which has been purchased through a private offering and cannot be resold to the general public without registering the transaction under the Securities Act of 1933, as amended (the “1933 Act”), or pursuant to the resale limitations provided by Rule 144 under the 1933 Act, or an exemption from the registration requirements of the 1933 Act. Whether a restricted security is illiquid or not is determined pursuant to guidelines established by the Board. Not all restricted securities are considered illiquid. As of March 31, 2011, the Balanced Fund held the following Rule 144A security that was not deemed liquid:
Security | Acquisition Date | Acquisition Cost | Market Value | Percentage of Net Assets | ||||||||||||
Commonwealth Bank of Australia, 5.00%, 04/13/20 | 3/31/10 | $ | 500,000 | $ | 485,156 | 1.3% | ||||||||||
Allocation of Expenses
Expenses directly attributable to a Fund are charged directly to that Fund, while expenses which are attributable to more than one Fund are allocated among the respective Funds based upon relative net assets or another appropriate basis. Expenses directly attributable to a class are charged directly to that class, while expenses attributable to both classes are allocated to each class of shares based upon the ratio of net assets for each class as a percentage of total net assets.
Distributions to Shareholders
Dividends from net investment income are declared daily and paid monthly for the Short-Intermediate Bond Fund and Income Fund. The Balanced Fund declares and pays dividends from net investment income quarterly. The Growth Opportunities Fund and International Equity Fund declare and pay dividends from net investment income, if any, annually. Prior to August 1, 2010, the Core Equity Fund, Large Cap Growth Fund and Small Company Fund declared and paid dividends from net investment income monthly. Effective August 1, 2010, the Core Equity Fund, Large Cap Growth Fund and Small Company Fund declare and pay dividends from net investment income, if any, annually. Distributions of net realized capital gains, if any, are declared and distributed at least annually for all the Funds only to the extent they exceeded available capital loss carryovers. The amount and timing of distributions are determined in accordance with federal income tax regulations which may differ from GAAP.
3. Related Party Transactions and Fees and Agreements
Prior to May 3, 2010, the Funds had agreements with their respective investment advisers, FNB Fund Advisors (“FNB”), a separately identifiable department of First National Bank of Omaha (“FNBO”), or Tributary Capital Management, LLC (“Tributary”), a subsidiary of First National Nebraska, Inc. (“FNNI”), to furnish investment advisory services to the Funds.
| 54 |
Table of Contents
ANNUAL REPORT 2011
NOTES TO FINANCIAL STATEMENTS
March 31, 2011
Under the terms of these agreements, each Fund paid a monthly fee at the annual rate of the following percentages of each Fund’s average daily net assets: to FNB, 0.50% for the Short-Intermediate Bond Fund, 0.60% for the Income Fund, 0.75% for the Core Equity Fund, 0.90% for the Large Cap Growth Fund, 0.85% for the Small Company Fund and 1.00% for the International Equity Fund; to Tributary, 0.75% for each of the Balanced Fund and the Growth Opportunities Fund. Effective May 3, 2010, FNNI engaged in an internal reorganization of its subsidiaries, including FNB and Tributary, whereby all existing FNB and Tributary personnel became employees of the newly organized Tributary Capital Management, LLC (“New Tributary”). As a result of this advisory reorganization, effective May 3, 2010, the Company, on behalf of each Fund, entered into a new investment advisory agreement (the “New Investment Advisory Agreement”) with New Tributary. Under the New Investment Advisory Agreement, the advisory fee rates paid by each of the Funds to New Tributary are the same as those in effect prior to May 3, 2010.
Prior to May 3, 2010, FNB had contractually agreed to waive certain of its fees until July 31, 2010, at the annual rate of the following percentages of each Fund’s average daily net assets: 0.29% for the Short-Intermediate Bond Fund, 0.47% for the Income Fund, 0.15% for the Core Equity Fund, 0.10% for the Large Cap Growth Fund, 0.15% for the Small Company Fund and 0.15% for the International Equity Fund. Tributary had contractually agreed to waive certain of its fees until July 31, 2010 at the annual rate of the following percentages of each Fund’s average daily net assets: 0.15% for each of the Balanced Fund and the Growth Opportunities Fund. Following the execution of the New Investment Advisory Agreement, the fees waived by New Tributary were the same as those that were in effect prior to May 3, 2010. Effective August 1, 2010, New Tributary contractually agreed to waive certain of its fees until July 31, 2011 at the annual rate of the following percentages of each Fund’s average daily net assets: 0.22% for the Short-Intermediate Bond Fund, 0.27% for the Income Fund, 0.125% for the Balanced Fund, 0.12% for the Core Equity Fund, 0.15% for the Large Cap Growth Fund, 0.12% for the Growth Opportunities Fund, 0.13% for the Small Company Fund and 0.20% for the International Equity Fund. None of the waived fees can be recaptured in subsequent periods.
Prior to October 11, 2010, KBC Asset Management International Ltd. (“KBCAM”), a subsidiary of KBCAM Limited, served as the investment sub-adviser to the International Equity Fund. For the period prior to July 1, 2010, KBCAM voluntarily agreed to waive certain of its fees at the annual rate of 0.05% of the Fund’s average daily net assets. This sub-adviser waiver agreement was between the adviser and the sub-adviser, not with the Fund. Therefore, it did not directly impact the net advisory fees paid by the Fund. However, the adviser volutarily agreed to waiver additional advisory fees equal to the amount of the sub-adviser’s waiver. None of the waived fees can be recaptured in subsequent periods. Effective October 11, 2010, KBCAM and its parent company were purchased by Kleinwort Benson Group Ltd., a part of RHJ International S.A., a large European financial services group. Following the transition, KBCAM was rebranded as Kleinwort Benson Investors International Ltd. (“KBI”). As a result of the change in ownership of KBCAM, the investment sub-advisory agreement (the “KBCAM Sub-Advisory Agreement”) between New Tributary, the investment adviser to the International Equity Fund, and KBCAM was terminated on October 11, 2010. On October 8, 2010, the Board of the Funds approved an interim investment sub-advisory agreement between the Adviser and KBI effective as of October 11, 2010. The Board and the shareholders of the Fund approved a new definitive investment sub-advisory agreement between New Tributary and KBI (the “KBI Sub-Advisory Agreement”) with respect to the Fund at a meeting of the Board held on January 17, 2011 and a special meeting of the shareholders held on March 7, 2011. The KBI Sub-Advisory Agreement was effective as of March 7, 2011. The sub-advisory fees to be received by KBI from the New Tributary under the KBI Sub-Advisory Agreement are identical to the sub-advisory fees received by KBCAM from New Tributary under the KBCAM Sub-Advisory Agreement. Additionally, the personnel responsible for the day-to-day investment management decisions for the Fund remained the same.
Riverbridge Partners, LLC (“Riverbridge”) serves as the investment sub-adviser to the Large Cap Growth Fund. For the period prior to July 1, 2010, Riverbridge contractually agreed to waive certain of its fees at the annual rate of 0.10% of the Fund’s average daily net assets. This sub-adviser waiver agreement was between the adviser and sub-adviser, not with the Fund. Therefore, it did not directly impact the net advisory fees paid by the Fund. However, the adviser voluntarily agreed to waive additional advisory fees equal to the amount of the sub-adviser’s waiver. None of the waived fees can be recaptured
| 55 |
Table of Contents
ANNUAL REPORT 2011
NOTES TO FINANCIAL STATEMENTS
March 31, 2011
in subsequent periods. Effective May 3, 2010, New Tributary and First National Fund Advisors (“FNFA”), a newly-formed division of First National Bank in Fort Collins, Colorado, entered into a sub-advisory agreement for the Balanced Fund.
Prior to February 21, 2011, FNBO also served as custodian for each of the Funds, with the exception of the International Equity Fund, for which Union Bank serves as custodian. FNBO, as custodian, received compensation from each of the Funds for its services in an amount equal to a fee, computed daily and payable monthly, at an annual rate of 0.03% of each Fund’s average daily net assets. FNBO had contractually agreed to waive custodian fees at an annual rate of 0.015% for each of the Fund’s average daily net assets until July 31, 2011. Effective February 21, 2011, JPMorgan Chase Bank, N.A, (“JPM Chase”) serves as the custodian for each of the Funds, with the exception of the International Equity Fund, for which Union Bank serves as custodian.
DST Systems, Inc. serves as transfer agent for the Funds, whose functions include disbursing dividends and other distributions. New Tributary and Jackson Fund Services (“JFS”) serve as co-administrators of the Funds. As compensation for its administrative services, each co-administrator is entitled to a fee, calculated daily and paid monthly based on the Funds’ average daily net assets. New Tributary receives 0.07% of the Funds’ average daily net assets. New Tributary has contractually agreed to waive co-administrator fees at an annual rate of 0.035% for each Fund’s Institutional Plus Class average daily net assets until July 31, 2011.
Beacon Hill Fund Services, Inc. (“Beacon Hill”) provides the Funds’ Anti-Money Laundering Compliance Officer and Chief Compliance Officer services.
The adviser and custodians may periodically volunteer to reduce all or a portion of their fees with respect to one or more of the Funds. These voluntary waivers may be terminated at any time. The reduction of such fees will cause the yield and total return of any Fund to be higher than it would be in the absence of such reductions. These waivers are not subject to recoupment in subsequent fiscal periods. The custody waiver with FNBO was terminated on February 21, 2011 when the custodian was changed from FNBO to JPM Chase. Fees voluntarily waived during the year ended March 31, 2011 were as follows:
| Advisory Fees Waived | Custodian Fees Waived | |||||||||||
Short-Intermediate Bond Fund | $ | - | $ | 9,336 | ||||||||
Income Fund | - | 8,159 | ||||||||||
Balanced Fund | - | 4,267 | ||||||||||
Core Equity Fund | - | 18,983 | ||||||||||
Large Cap Growth Fund | 26,607 | 10,975 | ||||||||||
Growth Opportunities Fund | - | 10,292 | ||||||||||
Small Company Fund | - | 10,622 | ||||||||||
International Equity Fund | 15,989 | - | ||||||||||
The Company has adopted an Administrative Services Plan, which allows the Funds’ Institutional Class shares to charge a shareholder services fee, pursuant to which each Fund is authorized to pay compensation to banks and other financial institutions, that may include the advisers, their correspondent and affiliated banks and FNBO (each a “Service Organization”). Under the Administrative Services Plan, the Funds may enter into a Servicing Agreement with a Service Organization whereby such Service Organization agrees to provide certain record keeping and/or administrative support services for their customers or account holders who are the beneficial or record owner of the shares of a Fund. The Funds’ maintain Servicing Agreements, one of which with FNBO which provides that FNBO receives an annual fee at the rate of 0.25% of the average aggregate net asset value of the Funds held during the period by customers for whom FNBO provided
| 56 |
Table of Contents
ANNUAL REPORT 2011
NOTES TO FINANCIAL STATEMENTS
March 31, 2011
services under the Servicing Agreement. The amounts charged to the Funds, waived and paid to FNBO for shareholder service fees are reported within the Statements of Operations.
4. Investment Transactions
The aggregate purchases and sales of securities, excluding U.S. Government securities and short-term investments (maturing less than one year from acquisition), for the year ended March 31, 2011 were as follows:
| Purchases | Sales | |||||||
Short-Intermediate Bond Fund | $ | 17,669,680 | $ | 12,984,965 | ||||
Income Fund | 6,435,251 | 12,064,998 | ||||||
Balanced Fund | 11,983,038 | 10,260,767 | ||||||
Core Equity Fund | 201,733,559 | 49,102,505 | ||||||
Large Cap Growth Fund | 15,568,069 | 14,581,687 | ||||||
Growth Opportunities Fund | 44,228,075 | 34,359,498 | ||||||
Small Company Fund | 78,622,134 | 23,452,979 | ||||||
International Equity Fund | 92,568,099 | 99,139,313 | ||||||
The aggregate purchases and sales of long-term U.S. Government securities for the year ended March 31, 2011 were as follows:
| Purchases | Sales | |||||||
Short-Intermediate Bond Fund | $ | 14,188,896 | $ | 18,570,032 | ||||
Income Fund | 33,827,580 | 32,436,992 | ||||||
Balanced Fund | 959,685 | 198,795 | ||||||
5. Capital Share Transactions
The Company is authorized to issue a total of 1,000,000,000 shares of common stock, 999,999,990 of which may be issued in series with a par value of $0.00001 per share. The Board is empowered to allocate such shares among different series of the Company’s shares without shareholder approval.
6. Federal Income Taxes
The following information is presented on an income tax basis. It is each Fund’s policy to continue to comply with the requirements of Subchapter M of the Internal Revenue Code of 1986, as amended, applicable to regulated investment companies, and to distribute all of its taxable income, including any net realized gains on investments, to its shareholders sufficient to relieve it from all, or substantially all, federal income taxes. Therefore, no provision is made for federal income taxes. Withholding taxes on foreign dividends have been paid or provided for in accordance with each applicable country’s tax rules and rates.
Differences between amounts reported for financial statements and federal income tax purposes are attributable primarily to deferral of losses on wash sales, mark-to-market adjustments on investments in passive foreign investment companies and amortization/accretion adjustments for premium and market discount on debt securities.
| 57 |
Table of Contents
ANNUAL REPORT 2011
NOTES TO FINANCIAL STATEMENTS
March 31, 2011
To the extent there are differences between the amounts recognized for financial statements and federal income tax purposes that are permanent in nature, such amounts are reclassified within the capital accounts based on their federal income tax treatment as indicated below; temporary differences do not require reclassification. Permanent differences may include but are not limited to the following: reclassifications related to Treasury Inflation-Protected Securities, foreign currency, market discount, premium and/or paydown securities, reclassifications on the sale of PFIC or REIT securities, net operating losses, expired capital loss carryforwards and distribution adjustments. These reclassifications have no impact on net assets.
| Net Increase (Decrease) | ||||||||||||
| Undistributed Net Investment Income | Accumulated Net Realized Gain (Loss) | Paid-in Capital | ||||||||||
Short-Intermediate Bond Fund | $ | 371,340 | $ | (371,340) | $ | – | ||||||
Income Fund | 14,227 | (14,227) | – | |||||||||
Large Cap Growth Fund | 202 | (202) | – | |||||||||
Growth Opportunities Fund | 171,098 | – | (171,098) | |||||||||
Small Company Fund | (237,716) | 237,716 | – | |||||||||
International Equity Fund | 154,761 | (154,761) | – | |||||||||
At March 31, 2011, the cost basis, gross unrealized appreciation, gross unrealized depreciation, net unrealized appreciation/(depreciation), undistributed net ordinary income and undistributed net long-term capital gain, if any, were as follows:
| Tax Cost of Investments | Gross Unrealized Appreciation | Gross Unrealized Depreciation | Net Unrealized Appreciation/ (Depreciation) | Undistributed Net Ordinary Income* | Undistributed Net Long-Term Capital Gain | |||||||||||||||||||
Short-Intermediate Bond Fund | $ | 67,281,847 | $ | 1,724,992 | $ | (1,149,295 | ) | $ | 575,697 | $ | 160,391 | $ | – | |||||||||||
Income Fund | 56,101,434 | 2,541,024 | (2,421,120 | ) | 119,904 | 347,661 | – | |||||||||||||||||
Balanced Fund | 29,421,765 | 9,251,934 | (83,300 | ) | 9,168,634 | 17,881 | – | |||||||||||||||||
Core Equity Fund | 249,746,412 | 39,418,191 | (6,478,663 | ) | 32,939,528 | 1,342,468 | – | |||||||||||||||||
Large Cap Growth Fund | 73,026,095 | 19,469,475 | (2,954,069 | ) | 16,515,406 | 298,089 | 1,069,977 | |||||||||||||||||
Growth Opportunities Fund | 67,945,033 | 39,361,321 | (321,566 | ) | 39,039,755 | – | – | |||||||||||||||||
Small Company Fund | 111,699,322 | 32,116,126 | (1,588,065 | ) | 30,528,061 | 152,159 | – | |||||||||||||||||
International Equity Fund | 93,126,346 | 13,272,916 | (3,152,593 | ) | 10,120,323 | 2,090,175 | – | |||||||||||||||||
*Undistributed net ordinary income includes any undistributed net short-term capital gains.
| 58 |
Table of Contents
ANNUAL REPORT 2011
NOTES TO FINANCIAL STATEMENTS
March 31, 2011
The tax character of dividends and distributions paid during the fiscal years ended March 31, 2011 and 2010 were as follows:
| Distributions Paid From | ||||||||||||||||||||||||||||||||
| Net Ordinary Income* | Net Long Term Capital Gains | Return of Capital | Total Distributions Paid*** | |||||||||||||||||||||||||||||
| 2011 | 2010 | 2011** | 2010 | 2011 | 2010 | 2011 | 2010 | |||||||||||||||||||||||||
Short-Intermediate Bond Fund | $ | 2,235,503 | $ | 2,238,116 | $ | – | $ | – | $ | – | $ | – | $ | 2,235,503 | $ | 2,238,116 | ||||||||||||||||
Income Fund | 2,446,727 | 2,755,094 | – | – | – | – | 2,446,727 | 2,755,094 | ||||||||||||||||||||||||
Balanced Fund | 531,794 | 396,549 | – | – | – | – | 531,794 | 396,549 | ||||||||||||||||||||||||
Core Equity Fund | 211,335 | 742,032 | – | – | – | 5,117 | 211,335 | 747,149 | ||||||||||||||||||||||||
Large Cap Growth Fund | 189,954 | 186,642 | 1,334,463 | – | – | – | 1,524,417 | 186,642 | ||||||||||||||||||||||||
Growth Opportunities Fund | 139,486 | – | – | – | 171,098 | – | 310,584 | – | ||||||||||||||||||||||||
Small Company Fund | 1,185,578 | 229,424 | 3,289,741 | – | – | – | 4,475,319 | 229,424 | ||||||||||||||||||||||||
International Equity Fund | 2,144,150 | 306,779 | – | – | – | – | 2,144,150 | 306,779 | ||||||||||||||||||||||||
* Net ordinary income consists of net taxable income derived from dividends, interest, and net short-term capital gains, if any.
** The Funds designated as a long-term capital gain dividend, pursuant to the Internal Revenue code section 852(b)(3), the amount necessary to reduce earnings and profits of the Funds related to net capital gains to zero for the fiscal year ended March 31, 2011.
*** Total distributions paid may differ from the Statement of Changes in Net Assets because distributions are recognized when actually paid for tax purposes.
Under current tax law, certain capital losses realized after October 31 but before the end of the fiscal year (“Post-October losses”) may be deferred and treated as occurring on the first business day of the following fiscal year. For the year ended March 31, 2011, the following Funds deferred to April 1, 2011 Post-October capital losses and Post-October currency losses as follows:
| Post- October Losses | ||||
International Equity Fund | $ | 454,990 | ||
As of March 31, 2011, the following Funds had net capital loss carryforwards, which are available to offset future net realized capital gains, if any, to the extent provided by the Treasury regulations. To the extent that these carryforwards are used to offset future capital gains, the gains that are offset will not be distributed to shareholders. If not used, the capital loss carryforwards will expire as follows:
| 2012 | 2013 | 2014 | 2015 | 2016 | 2017 | 2018 | 2019 | Total | ||||||||||||||||||||||||||||
Short-Intermediate Bond Fund | $ | – | $ | – | $ | 726,566 | $ | 1,593,824 | $ | 852,078 | $ | 577,072 | $ | – | $ | – | $ | 3,749,540 | ||||||||||||||||||
Income Fund | – | – | – | 694,575 | 267,178 | – | – | – | 961,753 | |||||||||||||||||||||||||||
Balanced Fund | – | – | – | – | – | – | 1,552,728 | – | 1,552,728 | |||||||||||||||||||||||||||
Core Equity Fund | – | – | – | – | – | – | 2,192,793 | – | 2,192,793 | |||||||||||||||||||||||||||
Growth Opportunities Fund | – | – | – | – | – | – | 3,069,015 | – | 3,069,015 | |||||||||||||||||||||||||||
International Equity Fund | – | – | – | – | – | 5,869,614 | – | 5,937,507 | 11,807,121 | |||||||||||||||||||||||||||
The Regulated Investment Company Modernization Act of 2010 (“Act”) was enacted on December 22, 2010. In general, the provisions of the Act will be effective for the Funds’ fiscal year ending March 31, 2012. Under the Act, a Fund will be permitted to carry forward capital losses for an unlimited period. However, any losses incurred during those future taxable years will be required to be utilized prior to the losses incurred in pre-enactment taxable years. As a result of this ordering rule, pre-enactment capital loss carry forwards may be more likely to expire unused. Additionally, post-enactment capital losses that are carried forward will retain their character as either short-term or long-term capital losses, and will not be considered exclusively short-term as under previous law. Relevant information regarding the impact of the Act on the Funds
| 59 |
Table of Contents
ANNUAL REPORT 2011
NOTES TO FINANCIAL STATEMENTS
March 31, 2011
will be contained within the Federal Income Taxes section of the financial statement notes in the Funds’ Annual Report for the fiscal year ending March 31, 2012.
The Funds comply with FASB Accounting Standards Codification (“ASC”) Topic 740, “Income Taxes”. FASB ASC Topic 740 provides guidance for how uncertain tax positions should be recognized, measured, presented and disclosed in the financial statements. FASB ASC Topic 740 requires the affirmative evaluation of tax positions taken or expected to be taken in the course of preparing each Fund’s tax return to determine whether it is more-likely-than-not (i.e., greater than 50 percent) that each tax position will be sustained upon examination by a taxing authority based on the technical merits of the position. Tax positions not deemed to meet the “more-likely-than-not” threshold would be recorded as a tax expense in the current year. FASB ASC Topic 740 requires that management evaluate the tax position taken in returns that remain subject to examination by all major tax jurisdictions, including federal and the State of Nebraska (e.g., the last four tax year ends). Management believes that there is no tax liability resulting from unrecognized tax benefits related to uncertain tax positions taken for the year ended March 31, 2011.
7. Regulatory Matters
As disclosed in the 2006 Annual Report, the U.S. Securities and Exchange Commission (the “SEC”) conducted an examination of FNB related to past payments of certain marketing and other expenses. Subsequently, FNB agreed to pay the Funds $313,681, which was paid in December 2007. This amount was allocated to each Fund based on the average net assets of the Fund on the date of the distribution. The impact to the total return, net expense ratio and net income ratio are disclosed in the Financial Highlights.
8. Subsequent Events
Management has evaluated subsequent events for the Funds through the date the financial statements are issued and has concluded there are no events that require adjustments to the financial statements.
On May 17, 2011, the Board approved an Agreement and Plan of Reorganization between Federated World Investment Series, Inc., on behalf of its series, Federated International Leaders Fund (the “Federated Fund”), and the Company, on behalf of the International Equity Fund, whereby all of the assets of the International Equity Fund will be transferred to the Federated Fund, the Federated Fund will assume the liabilities of the International Equity Fund, and the Federated Fund will issue Institutional shares of the Federated Fund to shareholders of the International Equity Fund (the “Reorganization”). The Reorganization is subject to approval by the shareholders of the International Equity Fund.
The Board, including all of the Directors who were not parties to any of the existing or proposed investment advisory or sub-advisory agreements of the Company or “interested persons,” as that term is defined in the 1940 Act, of any party to such agreements, also approved (i) a new investment sub-advisory agreement between Tributary and First National Asset Management, a separately identifiable department of FNBO, with respect to the Short-Intermediate Bond Fund and the Income Fund; and (ii) the termination of the sub-advisory agreement between Tributary and Riverbridge, with respect to the Large Cap Growth Fund.
| 60 |
Table of Contents
Report of Independent Registered Public Accounting Firm
The Shareholders and Board of Directors of Tributary Funds, Inc.:
We have audited the accompanying statements of assets and liabilities, including the schedules of portfolio investments, of each series within Tributary Funds, Inc. (the “Funds”) as listed in Note 1 of the financial statements as of March 31, 2011, and the related statements of operations for the year then ended, the statements of changes in net assets for each of the years in the two-year period then ended, and the financial highlights for each of the years or periods in the five-year periods indicated herein. These financial statements and financial highlights are the responsibility of the Funds’ management. Our responsibility is to express an opinion on these financial statements and financial highlights based on our audits.
We conducted our audits in accordance with the standards of the Public Company Accounting Oversight Board (United States). Those standards require that we plan and perform the audit to obtain reasonable assurance about whether the financial statements and financial highlights are free of material misstatement. An audit includes examining, on a test basis, evidence supporting the amounts and disclosures in the financial statements. Our procedures included confirmation of securities owned as of March 31, 2011, by correspondence with the custodian and brokers or other appropriate auditing procedures. An audit also includes assessing the accounting principles used and significant estimates made by management, as well as evaluating the overall financial statement presentation. We believe that our audits provide a reasonable basis for our opinion.
In our opinion, the financial statements and financial highlights referred to above present fairly, in all material respects, the financial position of the Funds as of March 31, 2011, the results of their operations, changes in their net assets and the financial highlights for each of the years or periods indicated herein, in conformity with U.S. generally accepted accounting principles.
/s/ KPMG LLP
Chicago, Illinois
May 23, 2011
61
Table of Contents
ANNUAL REPORT 2011
March 31, 2011 (Unaudited)
Proxy Voting Policy
Information regarding the policies and procedures that the Funds use to determine how to vote proxies relating to portfolio securities is available without charge, upon request, by calling 1-800-662-4203. The information also is included in the Company’s Statement of Additional Information, which is available on the Fund’s website at www.tributaryfunds.com and on the Securities and Exchange Commission’s website at www.sec.gov.
Information relating to how each Fund voted proxies relating to portfolio securities held during the most recent twelve months ended June 30 is available by writing to the Company at P.O. Box 219022, Kansas City, Missouri, 64141-6002, by calling 1-800-662-4203 and on the Securities and Exchange Commission’s website at www.sec.gov.
Quarterly Holdings
The Company files a complete list of its portfolio holdings with the SEC for the first and third quarters of each fiscal year on Form N-Q. Forms N-Q are available free of charge on the SEC’s website at www.sec.gov or may be reviewed and copied at the SEC’s Public Reference Room in Washington, D.C. Information on the operation of the Public Reference Room may be obtained by calling 1-800-SEC-0330.
Special Shareholder Meeting
A special meeting of the shareholders of the International Equity Fund (the “Shareholders”) was held on March 7, 2011 at the offices of the Company, located at 1620 Dodge Street, 16th Floor, Omaha, Nebraska. At the meeting, the following matter was voted upon and approved by the shareholders:
| Number of Votes | ||||||||||||
| For | Against | Abstained | Broker Non-Votes | |||||||||
Proposal: To approve a new sub-advisory agreement between New Tributary and KBI, with respect to the International Equity Fund. | 7,636,707 | 0 | 0 | 0 | ||||||||
Other Federal Income Tax Information
The information reported below is for the period ended March 31, 2011. Foreign tax and qualified dividend information for the calendar year 2011 will be provided on your 2011 Form 1099-DIV.
For the year ended March 31, 2011, certain dividends paid by the Funds may be subject to a maximum tax rate of 15% as provided for by the Tax Relief, Unemployment Insurance Reauthorization, and Job Creation Act of 2010. The Funds intend to designate the maximum amount allowable as taxed at a maximum rate of 15%. Complete information will be reported in conjunction with your 2011 Form 1099-DIV.
For the year ended March 31, 2011, the following Funds hereby designate the following percentages, or the maximum amount allowable under the Internal Revenue Code (“Code”), as qualified dividends:
| Qualified Dividend Income | ||||
Short-Intermediate Bond Fund | 1.50% | |||
Income Fund | 1.44% | |||
Balanced Fund | 75.11% | |||
Core Equity Fund | 100.00% | |||
Large Cap Growth Fund | 100.00% | |||
Growth Opportunities Fund | 100.00% | |||
Small Company Fund | 100.00% | |||
International Equity Fund | 100.00% | |||
| 62 |
Table of Contents
ANNUAL REPORT 2011
ADDITIONAL FUND INFORMATION
March 31, 2011 (Unaudited)
The International Equity Fund intends to elect to pass through to shareholders the taxes paid to foreign countries. The pass-through of the foreign taxes paid will only affect those persons who are shareholders on the dividend record date in December 2011. These shareholders will receive more detailed information along with their 2011 Form 1099-DIV. Foreign source income and foreign tax per outstanding share on March 31, 2011 are as follows:
| Foreign Source Income | Foreign Tax Expense | |||||||
International Equity Fund | $ | 0.20 | $ | 0.04 | ||||
For the year ended March 31, 2011, the following Funds hereby designate the following percentages, or the maximum amount allowable under the Code, as distributions eligible for the dividends received deduction for corporations:
| Dividends Received Deduction | ||||
Short-Intermediate Bond Fund | 1.50% | |||
Income Fund | 1.44% | |||
Balanced Fund | 64.59% | |||
Core Equity Fund | 100.00% | |||
Large Cap Growth Fund | 100.00% | |||
Growth Opportunities Fund | 100.00% | |||
Small Company Fund | 100.00% | |||
| 63 |
Table of Contents
ANNUAL REPORT 2011
ADDITIONAL FUND INFORMATION
March 31, 2011 (Unaudited)
Table of Shareholder Expenses
As a shareholder of the Funds, you incur ongoing costs, including management fees, shareholder servicing fees and other Fund expenses. This example is intended to help you understand your ongoing costs (in dollars) of investing in the Funds and to compare these costs with the ongoing costs of investing in other mutual funds. The example is based on an investment of $1,000 invested at the beginning of the period and held for the entire period.
Actual Expenses
The table below provides information about actual account values and actual expenses. You may use the information below, together with the amount you invested, to estimate the expenses that you paid over the period. Simply divide your account value by $1,000 (for example, an $8,600 account value divided by $1,000 = 8.6), then multiply the result by the number in the table under the heading entitled “Expense Paid During Period” to estimate the expenses you paid on your account during this period.
Hypothetical Example for Comparison Purposes
The table below provides information about hypothetical account values and hypothetical expenses based on each Fund’s actual expense ratio and an assumed rate of return of 5% per year before expenses, which is not the Fund’s actual return. The hypothetical account values and expenses may not be used to estimate the actual ending account balance or expenses you paid for the period. You may use this information to compare this 5% hypothetical example with the 5% hypothetical examples that appear in the shareholder reports of other funds. Please note that the expenses shown in the table are meant to highlight your ongoing costs only and will not help you determine the relative total costs of owning different funds.
| Expenses Using Actual Fund Return | Expenses Using Hypothetical 5% Return | |||||||||||||||||||||||||||||||
| Beginning Account Value 10/01/10 | Ending Account Value 3/31/11 | Expense Paid During Period* | Expense Ratio During Period** | Beginning Account Value 10/01/10 | Ending Account Value 3/31/11 | Expense Paid During Period* | Expense Ratio During Period** | |||||||||||||||||||||||||
Short-Intermediate Bond Fund | ||||||||||||||||||||||||||||||||
Institutional Class | $ | 1,000.00 | $ | 1,005.50 | $ | 4.20 | 0.84 | % | $ | 1,000.00 | $ | 1,020.70 | $ | 4.23 | 0.84 | % | ||||||||||||||||
Income Fund | ||||||||||||||||||||||||||||||||
Institutional Class | 1,000.00 | 995.10 | 4.38 | 0.88 | 1,000.00 | 1,020.50 | 4.43 | 0.88 | ||||||||||||||||||||||||
Balanced Fund | ||||||||||||||||||||||||||||||||
Institutional Class | 1,000.00 | 1,127.80 | 6.58 | 1.24 | 1,000.00 | 1,018.70 | 6.24 | 1.24 | ||||||||||||||||||||||||
Core Equity Fund | ||||||||||||||||||||||||||||||||
Institutional Class | 1,000.00 | 1,133.20 | 6.17 | 1.16 | 1,000.00 | 1,019.10 | 5.84 | 1.16 | ||||||||||||||||||||||||
Institutional Plus Class*** | 1,000.00 | 1,051.40 | 2.48 | 0.85 | 1,000.00 | 1,011.80 | 2.44 | 0.85 | ||||||||||||||||||||||||
Large Cap Growth Fund | ||||||||||||||||||||||||||||||||
Institutional Class | 1,000.00 | 1,121.60 | 6.66 | 1.26 | 1,000.00 | 1,018.60 | 6.34 | 1.26 | ||||||||||||||||||||||||
Growth Opportunities Fund | ||||||||||||||||||||||||||||||||
Institutional Class | 1,000.00 | 1,267.00 | 6.56 | 1.16 | 1,000.00 | 1,019.10 | 5.84 | 1.16 | ||||||||||||||||||||||||
Small Company Fund | ||||||||||||||||||||||||||||||||
Institutional Class | 1,000.00 | 1,249.70 | 7.01 | 1.25 | 1,000.00 | 1,018.70 | 6.29 | 1.25 | ||||||||||||||||||||||||
Institutional Plus Class*** | 1,000.00 | 1,071.30 | 2.74 | 0.93 | 1,000.00 | 1,011.60 | 2.65 | 0.93 | ||||||||||||||||||||||||
International Equity Fund | ||||||||||||||||||||||||||||||||
Institutional Class | 1,000.00 | 1,079.00 | 7.15 | 1.38 | 1,000.00 | 1,018.10 | 6.94 | 1.38 | ||||||||||||||||||||||||
* Expenses are equal to the Fund’s annualized expense ratio, multiplied by the average account value over the period, multiplied by 182/365 (to reflect the one-half year period).
** Annualized.
*** The Institutional Plus Class has less than 6 months of operating history.
64 |
Table of Contents
ANNUAL REPORT 2011
March 31, 2011
Overall, responsibility for management of the Company rests with its Board, which is elected by the shareholders of the Company. The Company is managed by the Directors in accordance with the laws governing corporations in Nebraska. The Board oversees all of the Funds. Directors serve until their respective successors have been elected and qualified or until their earlier death, resignation or removal. The Directors elect the officers of the Company to supervise its day-to-day operations.
Information about the Directors and officers of the Company is set forth below. The Funds’ Statement of Additional Information includes additional information about the Directors and is available, without charge, upon request, by calling 1-800-662-4203.
Name, Address1, Age, and Position(s) Held with Funds | Term of Office and Length of Time Served | Principal Occupation(s) During Past 5 Years | Number of Overseen by Director | Other Directorships Held by Director | ||||||||
INDEPENDENT DIRECTORS | ||||||||||||
Robert A. Reed Age 71
Director | Indefinite; Since 1994. | President and Chief Executive Officer, Physicians Mutual Insurance Company and Physicians Life Insurance Company (1974 – present). | 8 | None. | ||||||||
Gary D. Parker Age 66
Director | Indefinite; Since 2005. | Retired. | 8 | None. | ||||||||
John J. McCartney Age 67
Director | Indefinite; Since 2010. | Retired. Executive Vice President and Chief Financial Officer, Zurich Insurance Group North America (August 2002 – June 2007); President and Chief Executive Officer, Empire Fire and Marine Insurance Companies (October 1993 – August 2002). | 8 | None. | ||||||||
INTERESTED DIRECTOR | ||||||||||||
Stephen R. Frantz2 Age 52
Director/President | Indefinite; Since 2010. | President, Tributary Capital Management, LLC (May 2010 – present); Chief Investment Officer, First Investment Group (January 2005 – May 2010); Chief Investment Officer, FNBO Fund Advisers (January 2005 – May 2010). | 8 | None. | ||||||||
| 65 |
Table of Contents
ANNUAL REPORT 2011
DIRECTORS AND OFFICERS
March 31, 2011
| Name, Address, Age, and Position(s) Held with Funds | Term of Office and Length of Time Served2 | Principal Occupation(s) During Past 5 Years | Number of in Fund Overseen by Director | Other Directorships Held by Director | ||||||||
OFFICERS | ||||||||||||
Daniel W. Koors3 Age: 40
Treasurer | Indefinite; Since December 2009. | Senior Vice President of Jackson National Asset Management (“JNAM”) and Jackson Fund Services (“JFS”), a division of JNAM, (2009 – present); Chief Operating Officer of JNAM and JFS (2011 – present); Vice President, Treasurer and Chief Financial Officer of investment companies advised by JNAM (2006 – present). Formerly, Chief Financial Officer of JNAM and JFS (2007 – 2011); Assistant Vice President – Fund Administration of Jackson National Life Insurance Company (“Jackson”) (2006 – 2009); Vice President of JNAM and JFS (2007 – 2008); Assistant Treasurer of investment companies advised by JNAM (2006); Partner of Deloitte & Touche LLP (2003 – 2006). | N/A | N/A | ||||||||
Rodney L. Ruehle4 Age: 42
Chief Compliance Officer and Anti-Money Laundering Officer | Indefinite; Since December 2009. | Director, Beacon Hill Fund Services, Inc. (2008 – present). Formerly, Vice President, CCO Services, Citi Fund Services, Inc. (2004 – 2008); Director, Fund Administration, Citi Fund Services, Inc. (1995 – 2004). | N/A | N/A | ||||||||
Evan C. Williams3 Age: 28
Secretary | Indefinite; Since January 2011. | Compliance Manager of JNAM and JFS (2010 – present). Formerly, Attorney, Lee & Stone LLP (2009 – 2010); Associate Attorney, Akin Gump Strauss Hauer & Feld LLP (2007 – 2009). | N/A | N/A | ||||||||
Danielle A. Bergandine3 Age: 30
Assistant Secretary | Indefinite; Since December 2009. | Senior Compliance Analyst of JNAM and JFS (2009 – present); Anti-Money Laundering Officer of investment companies advised by JNAM (2007 – present). Formerly, Compliance Analyst of JNAM and JFS (2006 – 2009); Administrative Assistant of JNAM and JFS (2005 – 2006). | N/A | N/A | ||||||||
1 The address for all Directors is 1620 Dodge Street, Stop 1089, Omaha, Nebraska 68197.
2 As defined in the 1940 Act, Mr. Frantz is an “interested” director because he is an officer of Tributary Capital Management, LLC, which is the investment adviser of the Funds.
3 The address for Mr. Koors, Mr. Williams, and Ms. Bergandine is 225 West Wacker Drive, Suite 1200, Chicago, Illinois 60606.
4 The address for Mr. Ruehle is 4041 North High Street, Suite 402, Columbus, Ohio 43214.
| 66 |
Table of Contents

Table of Contents
Item 2. Code of Ethics.
The registrant has adopted a code of ethics that applies to the registrant’s principal executive officer, principal financial officer, principal accounting officer or controller, or persons performing similar functions. This code of ethics is included as Exhibit 12(a)(1) on this Form N-CSR. There were no substantive amendments or waivers to this code of ethics during the period covered by this report.
Item 3. Audit Committee Financial Expert.
The registrant’s Board of Directors has determined that the registrant has at least one audit committee financial expert serving on its audit committee. An “audit committee financial expert” is not an “expert” for any purpose, including for purposes of Section 11 of the Securities Act of 1933, as amended, as a result of being designated as an “audit committee financial expert.” Further, the designation of a person as an “audit committee financial expert” does not mean that the person has any greater duties, obligations, or liability than those imposed on the person without the “audit committee financial expert” designation. Similarly, the designation of a person as an “audit committee financial expert” does not affect the duties, obligations, or liability of any other member of the Audit Committee or Board of Directors.
The audit committee financial expert is John J. McCartney who is “independent” for purposes of this Item 3 of Form N-CSR.
Item 4. Principal Accountant Fees and Services.
(a) – (d)
KPMG LLP (“KPMG”) was appointed by the Board of Directors as the independent registered public accounting firm of the registrant for the fiscal years ended March 31, 2010 and March 31, 2011.
The following table sets forth the amount of fees that were billed by the principal accountant for the respective period to the registrant.
Fees for Services Rendered to the Registrant by the Principal Accountant
| Fiscal Year | Audit Fees | Audit-Related Fees | Tax Fees | All Other Fees | ||||
2010 | $102,220 | $32,550 | $25,000 | $0 | ||||
2011 | $106,000 | $12,274 | $30,000 | $0 |
Nature of services regarding Audit-Related Fees:
2011: Consent on N-1A and out of pocket expenses
2010: Consent on N-1A and 17f-2 count
The above Tax Fees for 2010 and 2011 are the aggregate fees billed for professional services by KPMG to the registrant for Federal income and Nebraska Corporate Tax Return reviews and distribution calculation and federal excise tax return review.
The following table sets forth the amount of fees that were billed by the principal accountant for the respective period to any entity controlling, controlled by, or under common control with the investment adviser that provided ongoing services to the registrant (“Adviser Entities”) that were directly related to the registrant’s operations and financial reporting.
Table of Contents
Fees for Services Rendered to the Adviser Entities by the Principal Accountant
| Fiscal Year | Audit-Related Fees | Tax Fees | All Other Fees | |||
2010 | $0 | $0 | $0 | |||
2011 | $0 | $0 | $0 |
The aggregate amount of fees billed by billed the principal accountant to the Adviser Entities that were not directly related to the registrant’s operations and financial reporting was $1,000 for the fiscal year ended March 31, 2010 and $50,000 for the fiscal year ended March 31, 2011.
| (e)(1) | The Audit Committee shall review, consider, and pre-approve the engagement of all auditors to certify the registrant’s financial statements (an “Audit Engagement”). The Audit Committee must report to the Board of Directors of the registrant regarding its approval of all Audit Engagements. |
Management of the registrant may request pre-approval of, and the Audit Committee, or a member of the Audit Committee designated by the Audit Committee (a “Designated Member”), may pre-approve permissible non-audit services (e.g. tax, valuation, and general accounting services) to the registrant and/or to the Adviser Entities, on a project-by-project basis. The Audit Committee must, however, pre-approve any engagement of the auditor to provide non-audit services to any Adviser Entity during the period of such auditor’s audit engagement. Any action by the Designated Member in approving requested non-audit service shall be presented for ratification by the Audit Committee no later than at the Audit Committee’s next scheduled meeting.
| (e)(2) | 0%. |
| (f) | Not applicable. |
| (g) | The aggregate amount of non-audit fees billed by the principal accountant to the registrant and Adviser Entities was $58,550 for the fiscal year ended March 31, 2010 and was $92,274 for the fiscal year ended March 31, 2011. |
| (h) | The registrant’s Audit Committee of the Board of Directors has considered whether the provision of non-audit services that were rendered to the Adviser Entities (not including any sub-adviser whose role is primarily portfolio management and is subcontracted with or overseen by another investment adviser) that were not pre-approved pursuant to paragraph (c)(7)(ii) of Rule 2-01 of Regulation S-X and concluded that such services were compatible with maintaining the principal accountant’s independence. |
Item 5. Audit Committee of Listed Registrants.
Not applicable.
Item 6. Investments.
| (a) | Included as a part of the report to shareholders filed under Item 1. |
| (b) | Not applicable. |
Item 7. Disclosure of Proxy Voting Policies and Procedures for Closed-End Management Investment Companies.
Table of Contents
Not applicable.
Item 8. Portfolio Managers of Closed-End Management Investment Companies.
Not applicable.
Item 9. Purchases of Equity Securities by Closed-End Management Investment Company and Affiliated Purchasers.
Not applicable.
Item 10. Submission of Matters to a Vote of Security Holders.
There have been no material changes to the procedures by which shareholders may recommend nominees to the registrant’s Board of Directors since the registrant last disclosed such procedures.
Item 11. Controls and Procedures.
| (a) | The registrant’s principal executive officer and principal financial officer have concluded, based on their evaluation of the registrant’s disclosure controls and procedures as conducted within 90 days of the filing date of this report, that these disclosure controls and procedures are adequately designed and are operating effectively to ensure that information required to be disclosed by the registrant on Form N-CSR is recorded, processed, summarized and reported within the time periods specified in the Securities and Exchange Commission’s rules and forms. |
| (b) | There were no changes in the registrant’s internal control over financial reporting (as defined in Rule 30a-3(d) under the Investment Company Act of 1940, as amended (the “Act”) (17 CFR 270.30a-3(d)) that occurred during the registrant’s second fiscal quarter of the period covered by this report that have materially affected, or are reasonably likely to materially affect, the registrant’s internal control over financial reporting. |
Item 12. Exhibits
| (a)(1) | The code of ethics that is the subject of the disclosure required by Item 2 is attached hereto. |
| (a)(2) | Certifications pursuant to Rule 30a-2(a) under the Act are attached hereto. |
| (a)(3) | Not applicable. |
| (b) | Certifications pursuant to Rule 30a-2(b) under the Act are attached hereto. |
Table of Contents
SIGNATURES
Pursuant to the requirements of the Securities Exchange Act of 1934 and the Investment Company Act of 1940, the registrant has duly caused this report to be signed on its behalf by the undersigned, thereunto duly authorized.
Tributary Funds, Inc. | ||
By: | /s/ Daniel W. Koors | |
Name: | Daniel W. Koors | |
Title: | Treasurer | |
Date: | May 26, 2011 | |
Pursuant to the requirements of the Securities Exchange Act of 1934 and the Investment Company Act of 1940, this report has been signed below by the following persons on behalf of the registrant and in the capacities and on the dates indicated.
By: | /s/ Stephen R. Frantz | |
Name: | Stephen R. Frantz | |
Title: | President | |
Date: | May 26, 2011 |
By: | /s/ Daniel W. Koors | |
Name: | Daniel W. Koors | |
Title: | Treasurer | |
Date: | May 26, 2011 |
Table of Contents
EXHIBIT LIST
Exhibit 12(a)(1) | Code of Ethics (as defined in Item 2(b) of Form N-CSR). | |
Exhibit 12(a)(2)(a) | Certification of the Principal Executive Officer required by Rule 30a-2(a) under the Act. | |
Exhibit 12(a)(2)(b) | Certification of the Principal Financial Officer required by Rule 30a-2(a) under the Act. | |
Exhibit 12(b) | Certification required by Rule 30a-2(b) under the Act. | |