UNITED STATES
SECURITIES AND EXCHANGE COMMISSION
Washington, D.C. 20549
FORM N-CSR
CERTIFIED SHAREHOLDER REPORT OF REGISTERED
MANAGEMENT INVESTMENT COMPANIES
Investment Company Act file number | 811-08846 | |||||||
| ||||||||
Tributary Funds, Inc. | ||||||||
(Exact name of registrant as specified in charter) | ||||||||
| ||||||||
Tributary Capital Management, LLC 1620 Dodge Street Omaha, Nebraska |
| 68197 | ||||||
(Address of principal executive offices) |
| (Zip code) | ||||||
| ||||||||
Daniel W. Koors Jackson Fund Services 225 West Wacker Drive, Suite 1200 Chicago, Illinois 60606 | ||||||||
(Name and address of agent for service) | ||||||||
| ||||||||
Registrant’s telephone number, including area code: | (800) 662-4203 |
| ||||||
| ||||||||
Date of fiscal year end: | March 31 |
| ||||||
| ||||||||
Date of reporting period: | March 31, 2014 |
| ||||||
Form N-CSR is to be used by management investment companies to file reports with the Commission not later than 10 days after the transmission to stockholders of any report that is required to be transmitted to stockholders under Rule 30e-1 under the Investment Company Act of 1940 (17 CFR 270.30e-1). The Commission may use the information provided on Form N-CSR in its regulatory, disclosure review, inspection, and policymaking roles.
A registrant is required to disclose the information specified by Form N-CSR, and the Commission will make this information public. A registrant is not required to respond to the collection of information contained in Form N-CSR unless the Form displays a currently valid Office of Management and Budget (“OMB”) control number. Please direct comments concerning the accuracy of the information collection burden estimate and any suggestions for reducing the burden to Secretary, Securities and Exchange Commission, 450 Fifth Street, NW, Washington, DC 20549-0609. The OMB has reviewed this collection of information under the clearance requirements of 44 U.S.C. §3507.
Item 1. Report to Shareholders.
![]()
Tributary Funds®
Annual Report
March 31, 2014
Tributary Short-Intermediate Bond Fund
Institutional Class: FOSIX
Institutional Plus Class: FOSPX
Tributary Income Fund
Institutional Class: FOINX
Institutional Plus Class: FOIPX
Tributary Balanced Fund
Institutional Class: FOBAX
Institutional Plus Class: FOBPX
Tributary Growth Opportunities Fund
Institutional Class: FOGRX
Institutional Plus Class: FOGPX
Tributary Small Company Fund
Institutional Class: FOSCX
Institutional Plus Class: FOSBX
Notice to Investors
Shares of Tributary Funds:
· ARE NOT FDIC INSURED · MAY LOSE VALUE · HAVE NO BANK GUARANTEE
Investors should carefully consider the investment objectives, risks, charges and expenses of the Tributary Funds. Mutual funds involve risk including loss of principal. This and other important information about the Tributary Funds is contained in the prospectus, which can be obtained by calling 1-800-662-4203 or by visiting www.tributaryfunds.com. The prospectus should be read carefully before investing. The Tributary Funds are distributed by Northern Lights Distributors, LLC member FINRA. Northern Lights and the Tributary Funds’ investment adviser are not affiliated.
Dear Shareholder:
According to DictionaryFocus.com, the term recentism is defined as “a focus on recent events to the exclusion of history”. This phenomenon exists in all walks of life, and in this day and age of the 24 hour news cycle, Twitter, Facebook and other forms of social media, the danger of recentism becomes even greater. It is easy to take a relatively short-term phenomenon and build some type of fancy algorithm to extrapolate these trends far into the future. Sure, it is exciting to make dire predications about the next great stock market crash, what the planet is going to look like in 100 years or the effects that a certain governmental policy will have 50 years from now based on current trends. It sells books. It makes great news bites for Cable TV talk shows. It grabs your attention. I get it. The problem is that these long term projections very rarely turn out to be factual (at least in my experience), and their authors have usually cashed their checks and are long gone by the time we find out if their predictions actually pan out.
I have either been blessed or cursed, depending on your age and viewpoint, to be in my 30th year in this business. I have seen many of these new age products come to the marketplace, embraced by the chatter class as revolutionary and game changing only to fail miserably. In the middle to late 1980’s, computer based algorithms built on relatively short historical data points were used to create program trading and portfolio insurance. One popular explanation for the 1987 crash was indiscriminate selling by program traders. As computer technology became more readily available, the use of program trading grew dramatically. After the great crash of 1987, many blamed program trading strategies for blindly selling stocks as markets fell, exacerbating the decline, which was exactly the opposite of what these programs had been designed to do.
Flash forward about a decade to the late 1990’s. Recent history had proven that if you took all of your money, risky or not, and just invested it in high flying technology and internet stocks, you could become rich almost overnight. And this theory, based on data points from 1995-1999, worked phenomenally well, until it didn’t. The crash in the NASDAQ, an exchange that at the time was dominated by tech stocks, literally wiped out many investors overnight.
After the great bear markets of 2000, 2001 and 2007-2008, people had become fatigued with the volatility of equities and began searching for “alternatives”. According to the pundits, traditional buy and hold investing was dead, and the great marketers of Wall Street needed to concoct new and creative ways to deliver product to the masses based on these recent data points. Hedge funds, real estate funds, esoteric trading funds, commodity funds and a whole host of other products that were sold as alternatives to traditional stocks and bonds proliferated in the first decade of the new millennium. These products were sold as “non-correlated” options to stocks and bonds, which simply stated means they should offer some stability to your portfolio in times when things are difficult in traditional arenas. The first real test of these new products came with the great market upheaval of 2007-2008, and in my analysis they failed miserably. Turns out these products built by the best minds from Academia and Wall Street were much more highly correlated to the economy and traditional stocks and bonds than advertised, and suffered the same fate, falling sharply for their investors during this period, at the same time earning their creators and underwriters considerable fees. And since bottoming in early March 2009, stocks have been on an incredible upswing, with unfortunately very little participation from the average investor, who based their decision to abandon equities after six or seven years of very negative data points—the theory of recentism.
One recent trend that I find quite encouraging coming out of the last ten years of volatility has a couple of names; institutional investors call it Liability Based Investing and individual investors call it Outcome Based Investing. It is a relatively simple concept, but one that is based in discipline and vision, two qualities that when applied effectively almost always have positive results. Simply put, start first by understanding your liabilities, or desired end game or outcome, and then figure out what types of products or tools will be required to help you achieve those goals. There are literally thousands of different tools available today to help you achieve your long-term financial objectives. There are active funds, index funds, exchange traded funds, alternative funds; the list goes on and on. They are all built a little differently, and all will react differently based on the scenario. Without a well thought out vision of your financial goals and aspirations, and some understanding of your personal tolerance for risk along the way, trying to sort out all of these tools available can become an exercise in futility. What the market does over the next 10-20 years is irrelevant to you, what your personal portfolio does versus your desired outcome is what matters in the end.
So how does this all relate to the Tributary Funds? As an investor, it is important for you to understand our value proposition as a set of tools that you will use in creating the type of financial outcome you are striving to achieve. First of all, our strategies are based on principals that have stood the test of time, so as to counter-act the tendencies people have towards recentism. All of the Funds are managed by teams whose leaders have between 10 to 15 years of experience at the helm. We believe the long-run returns will be driven by the ability of underlying securities in each portfolio to deliver strong results to their shareholders and bond holders. This is known as a fundamental approach to investing. Again, if you follow the law of recentism, fundamental investing has been somewhat challenging. As the U.S. Federal Reserve has been attempting to reignite the U.S. economy from the worst recession since the Great Depression, they have been printing money at an unprecedented pace, flooding the financial system with almost free money. In this type of environment, companies with less than stellar management and financial characteristics are “propped up” by the availability of free money, as investors don’t seem to care much about doing the hard work necessary to differentiate between these companies and their more well run competition. However, if you look at history, and take an extended view, stocks clearly follow a pattern of being valued by their ability to deliver results to their shareholders.
As a valued shareholder of Tributary Funds, I would encourage you to look at our long-term demonstrated track record of value creation, and decide for yourself if this indeed aligns with your financial goals.
Wishing you continued health and prosperity….
Best regards,

Stephen R. Frantz
President
sfrantz@tributarycapital.com
Comments are provided as a general market overview and should not be considered investment advice or predictive of any future market performance.
ANNUAL REPORT 2014

SHORT-INTERMEDIATE BOND FUND (Unaudited)
Investment Objective
The Tributary Short-Intermediate Bond Fund seeks to maximize total return in a manner consistent with the generation of current income, preservation of capital and reduced price volatility.
Manager Commentary
For the year ended March 31, 2014, Tributary Short-Intermediate Bond Fund returned 0.40% (Institutional Class at NAV) and 0.77% (Institutional Plus Class at NAV) compared to a 0.42% return for the Barclay's Capital U.S. Government/Credit 1-5 Year Index. The outperformance after expenses of the Institutional Plus class, which has a lower expense ratio than the Institutional Class, was due to lower duration exposure relative to the benchmark, the overweight allocation to non-agency mortgage backed securities ("MBS") and corporate bonds, as well as the Fund's modest down-in-quality bias. U.S. Treasury yields rose dramatically during the year as the U.S. Federal Reserve ("Fed") signaled an end to the era of quantitative easing ("QE"), with the 5-year yield rising by 95 basis points ("bps") and the 30-year yield by 46 bps (for perspective, a 100 bps rise in the 30-year yield is roughly equivalent to an 18% decrease in price). Credit-sensitive sectors performed very well over the trailing 12 months. Relative to similar-maturity U.S. Treasuries for example, corporate bonds generated an excess return of nearly 3.50%. The non-agency MBS and asset backed securities ("ABS") sectors were also strong performers over the past year. The broad private-label securitized space continued to benefit from relatively attractive yield profiles and fundamental improvement in underlying collateral values, whether residential or commercial properties or credit card receivables.
Without question the primary event of the last year was the change in Fed policy expectations, which led to what many market pundits have labeled the "taper tantrum." When Fed Chairman Bernanke indicated in May 2013 that the Fed could begin reducing (or tapering) its purchases of U.S. Treasuries and Agency MBS, the market quickly re-priced and drove bond yields significantly higher. The government shutdown in October and growing unrest and uncertainty in emerging economies subsequently caused some flight-to-quality in the Treasury market in the Fall of 2013 and into early 2014. However, economic data was generally at or above expectations for most of the year, which further helped to lift bond yields and compress corporate and other credit-sensitive yield spreads.
Over the last year the Fund increased duration exposure to the non-agency MBS and ABS sectors given relatively attractive yield and return profiles. Our corporate bond exposure ended the year lower as we found fewer favorable opportunities, while the agency MBS allocation increased modestly in duration terms. Our allocation to the U.S. Government
sector was essentially unchanged over the year. The Fund continues to maintain a AA- weighted average credit rating.
As the investor optimism on display during late 2013 faded during the most recent quarter, market participants were forced to re-evaluate their forecasts for the remainder of the year. Estimates for first quarter growth were revised lower as the economic statistics disappointed, to varying degrees due to bad weather. The uncertainty created by the tension in the Ukraine and weaker Chinese growth was another shock to confidence, leaving longer-term interest rates below the highs reached during 2013.
For our part, we continue to believe that interest rates could drift higher over the coming year. As the negative economic impact of the harsh winter recedes, growth should return. Furthermore, the Fed is determined to continue tapering its current QE program and will likely be finished by the end of 2014. We are therefore maintaining a shorter duration position in the portfolio, relative to the benchmark. Nonetheless, we do not expect dramatically higher rates as significant headwinds exist in the form of a soft labor market, a lack of meaningful real wage growth, low inflation and tepid real trend growth.
With respect to spread sectors of the bond market, we are becoming increasingly cautious as robust investor confidence has driven spreads significantly narrower. Corporate bonds are for the most part fully valued and we are moving to a more neutral weighting in corporate credit. We remain overweight in the housing-sensitive non-agency MBS sector, the private-label ABS and commercial mortgage backed securities ("CMBS") sectors, and continue to keep a modest exposure to the agency MBS sector. We remain underweight to the traditional U.S. Government bond sector.
As always, we remain committed to seeking prudent, value-enhancing investment opportunities consistent with our disciplined approach of managing for the long-term.
ANNUAL REPORT 2014

SHORT-INTERMEDIATE BOND FUND (Unaudited)
Return of a $10,000 Investment as of March 31, 2014

Portfolio Composition as of March 31, 2014
Percentage Based on Total Value of Investments
(Portfolio composition is subject to change)
U.S. Treasury Securities | 35.3 | % | |||||
Mortgage Related | 26.9 | % | |||||
Corporate Bonds | 24.5 | % | |||||
U.S. Government Mortgage-Backed Securities | 5.4 | % | |||||
Municipals | 4.0 | % | |||||
Short Term Investments | 3.5 | % | |||||
Other | 0.4 | % | |||||
100.0 | % | ||||||
Portfolio Analysis as of March 31, 2014
(Portfolio composition is subject to change)
Weighted Average Maturity: | 3.4 years | ||||||
Average Annual Total Returns for the Year Ended March 31, 2014*
1 Year | 5 Year | 10 Year | |||||||||||||
| Tributary Short-Intermediate Bond Fund - Institutional Class | 0.40 | % | 3.48 | % | 3.04 | % | |||||||||
| Barclays Capital U.S. Government/Credit 1-5 Year Index | 0.42 | % | 2.83 | % | 3.27 | % | |||||||||
Prospectus Expense Ratio (Gross/Net)† | 1.05%/0.83% | ||||||||||||||
| Expense Ratio for the Year Ended March 31, 2014 (Gross/Net) | 1.01%/0.79% | ||||||||||||||
1 Year | Since Inception†† | ||||||||||
| Tributary Short-Intermediate Bond Fund - Institutional Plus Class | 0.77 | % | 3.04 | % | |||||||
Prospectus Expense Ratio (Gross/Net)† | 0.80%/0.58% | ||||||||||
| Expense Ratio for the Year Ended March 31, 2014 (Gross/Net) | 0.80%/0.58% | ||||||||||
Past performance does not guarantee future results. The performance data quoted represents past performance and current returns may be lower or higher. Total returns include change in share price, reinvestment of dividends and capital gains. The investment return and principal value will fluctuate so that an investor's shares, when redeemed may be worth more or less than the original cost. To obtain performance information current to the most recent month end, please visit our website at www.tributaryfunds.com.
(†)The expense ratios are from the Fund's prospectus dated July 26, 2013. Net expense ratio is net of contractual waivers which are in effect from August 1, 2013 through July 31, 2014.
(††)Commencement date for the Institutional Plus Class was October 14, 2011.
(*) Returns shown do not reflect the deduction of taxes that a shareholder would pay on Fund distributions or the redemption of Fund shares. Investment performance reflects contractual fee waivers in effect for certain periods. Without these fee waivers, the performance would have been lower.
The line chart assumes an initial investment of $10,000 made on March 31, 2004. Total return is based on net change in net asset value ("NAV") assuming reinvestment of all dividends and other distributions.
The performance of Institutional Plus Class will be different than Institutional Class based on differences in fees borne by each class.
Barclays Capital U.S. Government/Credit 1-5 Year Index is an unmanaged index which measures the performance of U.S. Treasury and agency securities, and corporate bonds with 1-5 year maturities. The index is unmanaged and does not reflect the deduction of fees or taxes associated with a mutual fund, such as investment management, administration and other operational fees. Investors cannot invest directly in the index.
ANNUAL REPORT 2014

INCOME FUND (Unaudited)
Investment Objective
The Tributary Income Fund seeks the generation of current income in a manner consistent with preserving capital and maximizing total return.
Manager Commentary
For the year ended March 31, 2014, Tributary Income Fund returned 0.72% (Institutional Class at NAV) and 0.79% (Institutional Plus Class at NAV) compared to a -0.10% return for the Barclay's Capital U.S. Aggregate Bond Index. The outperformance was due to lower duration exposure relative to the benchmark, the overweight allocation to non-agency mortgage backed securities ("MBS") and corporate bonds, as well as the Fund's modest down-in-quality bias. U.S. Treasury yields rose dramatically during the year as the U.S. Federal Reserve ("Fed") signaled an end to the era of quantitative easing ("QE"), with the 5-year yield rising by 95 basis points ("bps") and the 30-year yield by 46 bps (for perspective, a 100 bps rise in the 30-year yield is roughly equivalent to an 18% decrease in price). Credit-sensitive sectors performed very well over the trailing 12 months. Relative to similar-maturity U.S. Treasuries for example, corporate bonds generated an excess return of nearly 3.50%. The non-agency MBS and asset backed securities ("ABS") sectors were also strong performers over the past year. The broad private-label securitized space continued to benefit from relatively attractive yield profiles and fundamental improvement in underlying collateral values, whether residential or commercial properties or credit card receivables.
Without question the primary event of the last year was the change in Fed policy expectations, which led to what many market pundits have labeled the "taper tantrum." When Fed Chairman Bernanke indicated in May 2013 that the Fed could begin reducing (or tapering) its purchases of U.S. Treasuries and agency MBS, the market quickly re-priced and drove bond yields significantly higher. The government shutdown in October and growing unrest and uncertainty in emerging economies subsequently caused some flight-to-quality in the Treasury market in the Fall of 2013 and into early 2014. However, economic data was generally at or above expectations for most of the year, which further helped to lift bond yields and compress corporate and other credit-sensitive yield spreads.
Over the last year the Fund increased duration exposure to the non-agency MBS and ABS sectors given relatively attractive yield and return profiles. We also added to the U.S. Treasury sector, primarily due to significant net inflows into the Fund over the past 3 months. Our corporate bond exposure ended the year slightly lower, while the agency MBS allocation increased modestly in duration terms. The Fund continues to maintain a AA- weighted average credit rating.
As the investor optimism on display during late 2013 faded during the most recent quarter, market participants were
forced to re-evaluate their forecasts for the remainder of the year. Estimates for first quarter growth were revised lower as the economic statistics disappointed, to varying degrees due to bad weather. The uncertainty created by the tension in the Ukraine and weaker Chinese growth was another shock to confidence, leaving longer-term interest rates below the highs reached during 2013.
For our part, we continue to believe that interest rates could drift higher over the coming year. As the negative economic impact of the harsh winter recedes, growth should return. Furthermore, the Fed is determined to continue tapering its current QE program and will likely be finished by the end of 2014. We are therefore maintaining a shorter duration position in the portfolio, relative to the benchmark. Nonetheless, we do not expect dramatically higher rates as significant headwinds exist in the form of a soft labor market, a lack of meaningful real wage growth, low inflation and tepid real trend growth.
With respect to spread sectors of the bond market, we are becoming increasingly cautious as robust investor confidence has driven spreads significantly narrower. Corporate bonds are for the most part fully valued and we are moving to a more neutral weighting in corporate credit. We remain overweight in the housing-sensitive non-agency MBS sector, the private-label ABS and commercial mortgage backed securities ("CMBS") sectors. We continue to maintain an underweight to the richly-valued agency MBS sector as well as the traditional U.S. government bond sector.
As always, we remain committed to seeking prudent, value-enhancing investment opportunities consistent with our disciplined approach of managing for the long-term.
ANNUAL REPORT 2014

INCOME FUND (Unaudited)
Return of a $10,000 Investment as of March 31, 2014

Portfolio Composition as of March 31, 2014
Percentage Based on Total Value of Investments
(Portfolio composition is subject to change)
U.S. Treasury Securities | 26.2 | % | |||||
Mortgage Related | 26.0 | % | |||||
Corporate Bonds | 21.8 | % | |||||
U.S. Government Mortgage-Backed Securities | 18.9 | % | |||||
Short Term Investments | 3.1 | % | |||||
Municipals | 1.9 | % | |||||
Investment Companies | 1.2 | % | |||||
Exchange Traded Funds | 0.5 | % | |||||
Other | 0.4 | % | |||||
100.0 | % | ||||||
Portfolio Analysis as of March 31, 2014
(Portfolio composition is subject to change)
Weighted Average Maturity: | 7.4 years | ||||||
Average Annual Total Returns for the Year Ended March 31, 2014*
1 Year | 5 Year | 10 Year | |||||||||||||
| Tributary Income Fund - Institutional Class | 0.72 | % | 5.75 | % | 4.13 | % | |||||||||
| Barclays Capital U.S. Aggregate Bond Index | -0.10 | % | 4.80 | % | 4.46 | % | |||||||||
Prospectus Expense Ratio (Gross/Net)† | 1.17%/0.90% | ||||||||||||||
| Expense Ratio for the Year Ended March 31, 2014 (Gross/Net) | 1.08%/0.81% | ||||||||||||||
1 Year | Since Inception†† | ||||||||||
| Tributary Income Fund - Institutional Plus Class | 0.79 | % | 3.68 | % | |||||||
Prospectus Expense Ratio (Gross/Net)† | 0.92%/0.65% | ||||||||||
| Expense Ratio for the Year Ended March 31, 2014 (Gross/Net) | 0.91%/0.64% | ||||||||||
Past performance does not guarantee future results. The performance data quoted represents past performance and current returns may be lower or higher. Total returns include change in share price, reinvestment of dividends and capital gains. The investment return and principal value will fluctuate so that an investor's shares, when redeemed may be worth more or less than the original cost. To obtain performance information current to the most recent month end, please visit our website at www.tributaryfunds.com.
(†)The expense ratios are from the Fund's prospectus dated July 26, 2013. Net expense ratio is net of contractual waivers which are in effect from August 1, 2013 through July 31, 2014.
(††)Commencement date for the Institutional Plus Class was October 28, 2011.
(*) Returns shown do not reflect the deduction of taxes that a shareholder would pay on Fund distributions or the redemption of Fund shares. Investment performance reflects contractual fee waivers in effect for certain periods. Without these fee waivers, the performance would have been lower.
The line chart assumes an initial investment of $10,000 made on March 31, 2004. Total return is based on net change in net asset value ("NAV") assuming reinvestment of all dividends and other distributions.
The performance of Institutional Plus Class will be different than Institutional Class based on differences in fees borne by each class.
Barclays Capital U.S. Aggregate Bond Index is an unmanaged index and covers the USD-denominated, investment-grade, fixed-rate, taxable bond market of SEC-registered securities. The index includes bonds from the Treasury, Government Related, Corporate, MBS (agency fixed-rate and hybrid ARM passthroughs), ABS and CMBS sectors. The index is unmanaged and does not reflect the deduction of fees or taxes associated with a mutual fund, such as investment management, administration and other operational fees. Investors cannot invest directly in the index.
ANNUAL REPORT 2014

BALANCED FUND (Unaudited)
Investment Objective
The Tributary Balanced Fund seeks capital appreciation and current income.
Manager Commentary
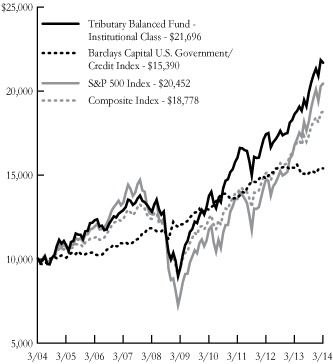
For the year ended March 31, 2014, Tributary Balanced fund returned 16.46% (Institutional Class at NAV) and 16.65% (Institutional Plus Class at NAV) compared to 21.86% for the S&P 500 Index, -0.26% for the Barclay's Capital U.S. Government/Credit Index and 12.65% for the Composite Index which consists of 60% S&P 500 Index and 40% Barclay's Capital U.S. Government/Credit Index.
In the latest fiscal year U.S. stock prices advanced strongly, while bond prices declined moderately as interest rates rose. The advance in stock prices was supported by moderate economic growth and corporate earnings, and an expansion in price to earnings multiples. As the economic recovery matured into an economic expansion, and the U.S. Federal Reserve ("Fed") began to contemplate the end of their efforts to keep interest rates artificially low, interest rates inched higher over the course of the year.
We underweighted the bond segment of the Fund throughout the year and overweighted the allocation to stocks. The bond segment of the Fund matched the return of the Barclay's Capital Intermediate Bond Index for the year, down by about one quarter percent. In addition to reducing the allocation to bonds, we also shortened the average maturity to reduce the risk of losses if interest rates should continue to rise.
The stock segment of the Fund provided the juice for the better relative returns, rising by 27.9% compared to the 21.9% return of the S&P 500 Index. Within the equity segment healthcare stocks were the biggest contributor to excess returns, with our healthcare stocks rising by 42% compared to the 29% return of healthcare stocks in the S&P 500 Index. Medidata Solutions Inc. (up 127%), Biogen Idec Inc. (up 79%), Valeant Pharmaceuticals International Inc. (up 76%) and Thermo Fisher Scientific Inc.(up 59%) all contributed to the very strong returns in this sector.
Consumer discretionary stocks also contributed to excess returns, with a sector return of 34% compared to 24% for this sector in the S&P 500 Index. Priceline Group Inc. (up 69%), Wynn Resorts Ltd. (up 85%) and BorgWarner Inc. (up 60%) were the big contributors in the consumer discretionary sector.
Energy stocks held by the Fund also performed well, returning 25% versus a 15% return for energy stocks in the S&P 500 Index. EOG Resources Inc. (up 43%), Occidental Petroleum Corp. (up 25%) and Schlumberger Ltd. (up 29%) were the big contributors in this sector.
Other individual stocks held by the Fund that did well included Google Inc. (up 47%), IAC/Interactive Corp. (up 63%) and MasterCard Inc. (up 53%) helping the information technology sector of the Fund deliver a strong 33% return compared to 25% for information technology stocks in the S&P 500 Index.
We believe U.S. economic growth should accelerate as we progress through 2014, which should support valuations of U.S. focused companies, as sales and earnings begin another leg higher. Interest rates are likely to trend higher as the Fed removes some of the support they have provided to keep interest rates artificially low. We have positioned the Fund to take advantage of these two trends by underweighting bonds and overweighting stocks.
ANNUAL REPORT 2014

BALANCED FUND (Unaudited)
Return of a $10,000 Investment as of March 31, 2014
Past performance does not guarantee future results. The performance data quoted represents past performance and current returns may be lower or higher. Total returns include change in share price, reinvestment of dividends and capital gains. The investment return and principal value will fluctuate so that an investor's shares, when redeemed may be worth more or less than the original cost. To obtain performance information current to the most recent month end, please visit our website at www.tributaryfunds.com.
Portfolio Composition as of March 31, 2014
Percentage Based on Total Value of Investments
(Portfolio composition is subject to change)
Industrials | 14.3 | % | |||||
Financials | 13.1 | % | |||||
Health Care | 11.7 | % | |||||
Consumer Discretionary | 10.8 | % | |||||
Government Securities | 10.3 | % | |||||
Information Technology | 9.4 | % | |||||
Short Term Investments | 8.5 | % | |||||
Energy | 7.3 | % | |||||
Consumer Staples | 5.8 | % | |||||
Materials | 5.4 | % | |||||
Utilities | 2.1 | % | |||||
Telecommunication Services | 1.0 | % | |||||
U.S. Government Mortgage-Backed Securities | 0.3 | % | |||||
100.0 | % | ||||||
Average Annual Total Returns for the Year Ended March 31, 2014*
1 Year | 5 Year | 10 Year | |||||||||||||
| Tributary Balanced Fund - Institutional Class | 16.46 | % | 18.05 | % | 8.05 | % | |||||||||
| Barclays Capital U.S. Government/Credit Index | -0.26 | % | 5.07 | % | 4.41 | % | |||||||||
S&P 500 Index | 21.86 | % | 21.16 | % | 7.42 | % | |||||||||
Composite Index | 12.65 | % | 14.78 | % | 6.50 | % | |||||||||
Prospectus Expense Ratio (Gross/Net)† | 1.36%/1.23% | ||||||||||||||
| Expense Ratio for the Year Ended March 31, 2014 (Gross/Net) | 1.29%/1.16% | ||||||||||||||
1 Year | Since Inception†† | ||||||||||
| Tributary Balanced Fund - Institutional Plus Class | 16.65 | % | 14.28 | % | |||||||
Prospectus Expense Ratio (Gross/Net)† | 1.11%/0.98% | ||||||||||
| Expense Ratio for the Year Ended March 31, 2014 (Gross/Net) | 1.08%/0.95% | ||||||||||
(†)The expense ratios are from the Fund's prospectus dated July 26, 2013. Net expense ratio is net of contractual waivers which are in effect from August 1, 2013 through July 31, 2014.
(††)Commencement date for the Institutional Plus Class was October 14, 2011.
(*) Returns shown do not reflect the deduction of taxes that a shareholder would pay on Fund distributions or the redemption of Fund shares. Investment performance reflects contractual fee waivers in effect for certain periods. Without these fee waivers, the performance would have been lower.
The line chart assumes an initial investment of $10,000 made on March 31, 2004. Total return is based on net change in net asset value ("NAV") assuming reinvestment of all dividends and other distributions.
The performance of Institutional Plus Class will be different than Institutional Class based on differences in fees borne by each class.
The S&P 500 Index is a broad based index of 500 selected common stocks, most of which are listed on the New York Stock Exchange, that measures the U.S. stock market as a whole. The index is heavily weighted toward stocks with large market capitalizations and represents approximately two-thirds of the total market value of all domestic common stocks. Barclays Capital U.S. Government/Credit Index is an unmanaged non-securitized component of the Barclays U.S. Aggregate Index. The U.S. Government/Credit Index includes Treasuries (i.e., public obligations of the U.S. Treasury that have remaining maturities of more than one year), Government-Related issues (i.e., agency, sovereign, supranational and local authority debt) and USD Corporates. The Composite Index is intended to provide a single benchmark that more accurately reflects the composition of securities held by the Tributary Balanced Fund. Sixty percent of the Composite Index is comprised of the S&P 500 Index and forty percent of the Composite index is comprised of the Barclays Capital U.S. Government/Credit Index. The indices are unmanaged and do not reflect the deduction of fees or taxes associated with a mutual fund, such as investment management, administration and other operational fees. Investors cannot invest directly in the indices.
ANNUAL REPORT 2014

GROWTH OPPORTUNITIES FUND (Unaudited)
Investment Objective
The Tributary Growth Opportunities Fund seeks long-term capital appreciation.
Manager Commentary
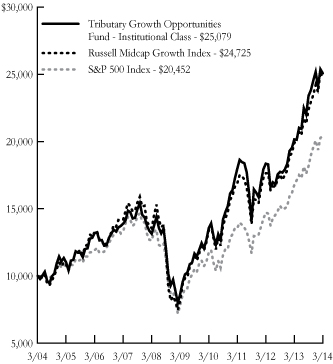
For the year ended March 31, 2014, Tributary Growth Opportunities Fund returned 24.36% (Institutional Class at NAV) and 24.65% (Institutional Class Plus at NAV) compared to 24.22% for the Russell Midcap Growth Index and 21.86% for the S&P 500 Index.
Market conditions were, quite obviously, very good for U.S. stocks, and the Fund participated in the advance. The advance in stock prices was supported by moderate economic growth and corporate earnings, and an expansion in price to earnings multiples.
Financial stocks held by the Fund were the biggest positive contributor to returns relative to the averages. Our financial stocks returned 43% during the year compared to the 14% return for financials in the Russell Midcap Growth Index, adding 234 basis points ("bps") of excess relative return. Among the financials, Home Bancshares Inc. led the charge (up 85%), followed by Portfolio Recovery Associates Inc. (up 37%), Stifel Financial Corp. (up 44%) and Signature Bank (up 59%).
Our energy stock holdings also did well, returning 33% compared to the 13% return for the energy sector in the Russell Midcap Growth Index. Kodiak Oil & Gas Corp. (up 34%), Lufkin Industries (up 23%) and Concho Resources Inc. (up 26%) all contributed to the sector's strong performance.
Our industrial related holdings did not keep up with the benchmark, returning "only" 18% compared to the 24% return for industrial stocks in the Russell Midcap Growth Index. Consumer discretionary stocks were another weak area for us, with our stocks up "only" 24% compared to a 29% advance for consumer discretionary stocks in the Russell Midcap Growth Index. The underperformance of these two sectors cost the Fund 117 bps of relative performance. Conversant Inc. (-31%), NueStar Inc. (-30%) and Tetra Tech Inc. (-23%) were the worst individual performers last year.
We believe valuations in the domestic mid-cap growth sector remain reasonable based on the fundamental trends in business and the current level of interest rates in spite of the rather large rise in prices and multiples during the past year. U.S. economic growth should accelerate as we progress through 2014, which should benefit in particular medium sized U.S. focused companies.
ANNUAL REPORT 2014

GROWTH OPPORTUNITIES FUND (Unaudited)
Return of a $10,000 Investment as of March 31, 2014
Portfolio Composition as of March 31, 2014
Percentage Based on Total Value of Investments
(Portfolio composition is subject to change)
Industrials | 18.1 | % | |||||
Information Technology | 17.8 | % | |||||
Consumer Discretionary | 16.4 | % | |||||
Health Care | 13.6 | % | |||||
Financials | 9.6 | % | |||||
Materials | 8.3 | % | |||||
Energy | 7.6 | % | |||||
Consumer Staples | 5.6 | % | |||||
Short Term Investments | 3.0 | % | |||||
100.0 | % | ||||||
Average Annual Total Returns for the Year Ended March 31, 2014*
| �� | 1 Year | 5 Year | 10 Year | ||||||||||||
| Tributary Growth Opportunities Fund - Institutional Class | 24.36 | % | 23.64 | % | 9.63 | % | |||||||||
Russell Midcap Growth Index | 24.22 | % | 24.73 | % | 9.47 | % | |||||||||
S&P 500 Index | 21.86 | % | 21.16 | % | 7.42 | % | |||||||||
Prospectus Expense Ratio (Gross/Net)† | 1.28%/1.16% | ||||||||||||||
| Expense Ratio for the Year Ended March 31, 2014 (Gross/Net) | 1.20%/1.08% | ||||||||||||||
1 Year | Since Inception†† | ||||||||||
| Tributary Growth Opportunities Fund - Institutional Plus Class | 24.65 | % | 21.04 | % | |||||||
Prospectus Expense Ratio (Gross/Net)† | 1.03%/0.91% | ||||||||||
| Expense Ratio for the Year Ended March 31, 2014 (Gross/Net) | 1.01%/0.89% | ||||||||||
Past performance does not guarantee future results. The performance data quoted represents past performance and current returns may be lower or higher. Total returns include change in share price, reinvestment of dividends and capital gains. The investment return and principal value will fluctuate so that an investor's shares, when redeemed may be worth more or less than the original cost. To obtain performance information current to the most recent month end, please visit our website at www.tributaryfunds.com.
(†)The expense ratios are from the Fund's prospectus dated July 26, 2013. Net expense ratio is net of contractual waivers which are in effect from August 1, 2013 through July 31, 2014.
(††)Commencement date for the Institutional Plus Class was October 14, 2011.
(*) Returns shown do not reflect the deduction of taxes that a shareholder would pay on Fund distributions or the redemption of Fund shares. Investment performance reflects contractual fee waivers in effect for certain periods. Without these fee waivers, the performance would have been lower.
The line chart assumes an initial investment of $10,000 made on March 31, 2004. Total return is based on net change in net asset value ("NAV") assuming reinvestment of all dividends and other distributions.
The performance of Institutional Plus Class will be different than Institutional Class based on differences in fees borne by each class.
The Russell Midcap Growth Index measures the performance of the mid-cap growth segment of the U.S. equity universe. It includes those Russell Midcap Index companies with higher price-to-book ratios and higher forecasted growth values. The Fund's primary index is the Russell Midcap Growth Index, however to provide a boarder market comparative, the S&P 500 Index is a secondary benchmark. The S&P 500 Index is a broad based index of 500 selected common stocks, most of which are listed on the New York Stock Exchange, that measures the U.S. stock market as a whole. The index is heavily weighted toward stocks with large market capitalizations and represents approximately two-thirds of the total market value of all domestic common stocks. The indices are unmanaged and do not reflect the deduction of fees or taxes associated with a mutual fund, such as investment management, administration and other operational fees. Investors cannot invest directly in the indices.
ANNUAL REPORT 2014

SMALL COMPANY FUND (Unaudited)
Investment Objective
The Tributary Small Company Fund seeks long-term capital appreciation.
Manager Commentary
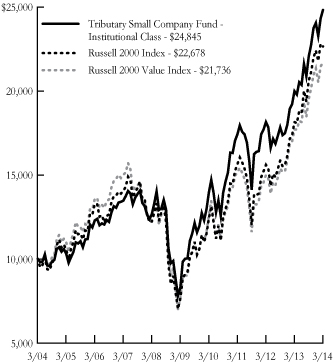
For the year ended March 31, 2014, Tributary Small Company Fund returned 24.26% (Institutional Class at NAV) and 24.53% (Institutional Plus Class at NAV) compared to 24.90% for the Russell 2000 Index and 22.65% for the Russell 2000 Value Index.
Small cap stocks continued to be in rally mode over the trailing 12 months ending March 31, 2014 as represented by the Fund's benchmark returns. Style-wise, "growth" outperformed "value" with the Russell 2000 Growth Index returning 27.19%. U.S. Federal Reserve ("Fed") policies continue to have a significant influence on the stock market. A consistently low Fed Funds rate and the bond repurchase program instituted by the Fed have helped to drive equity prices upward. However, when Fed Chairman Bernanke mentioned the word "taper" in May of 2013, the market cringed. The mere mention of tapering bond purchases at some point in the future ignited a negative reaction in the stock market. The Fed immediately began to backpedal. They made it clear that tapering would not happen until the economy was strong enough to support it and that short term rates would remain low. The market appears to be addicted to easy money, but this cannot last. The Fed has begun to taper bond purchases and it is expected to be out of the bond buying business by the end of 2014. Theoretically, the Fed is doing this because they see evidence that the economy is improved and does not need the excess liquidity — liquidity that has helped inflate financial assets. In particular, lower quality stocks (negative earnings, higher levered, low/no dividend) seemingly have been a significant beneficiary of these actions. When bond purchases end, we believe the focus will switch to business fundamentals, favoring higher quality companies.
The Fund's weakest relative performance came from portfolio holdings in the industrials and healthcare economic sectors. In industrials, Tetra Tech Inc. ("Tetra Tech") had two negative announcements in 2013 regarding its Eastern Canadian business unit that was experiencing reduced activity from government customers. Ultimately, the company decided to right-size these operations and incurred severance and related charges. In addition, Tetra Tech's mining end markets experienced weakness for part of 2013. Werner Enterprises Inc. was impacted by soft demand over the 12 month period and battled poor winter weather conditions.
In healthcare, biotechnology stocks were up over 40% and pharmaceutical stocks returned over 56% in the 12 month period. Typically, we have few holdings in the biotech and pharmaceutical areas due to the propensity of those companies to be low- or non-earners, exposed to unknown results of developmental pharmaceuticals, or overly dependent on
one or two products. In short, these businesses are typically less predictable and have limited visibility. The combination of strong returns and our underweight position in those industries led to the performance drag within healthcare over the last year.
Lastly, the Fund's average cash position of approximately 2.0% over the 12 month period negatively impacted performance. In strong markets, any amount of cash will be detrimental to relative performance, and while it is our desire to be fully invested in the market, that small amount of cash still was a hindrance.
On the positive side, there were some notable successes within the portfolio in the 12 month period. In the financial sector, Stifel Financial Corp. ("Stifel") and GAMCO Investors Inc. ("GAMCO") had strong years. The Global Wealth Management and Institutional segments at Stifel have been performing well and the company has made several acquisitions that should boost growth in revenues and earnings longer-term. GAMCO results have been buoyed by strong asset inflows and market appreciation, combining to drive assets under management and revenue expectations higher. Additionally, the Real Estate Investment Trusts ("REITs") industry as a whole was a poor relative performer within the financial sector. REITs continue to be richly valued in our opinion and we remain underweight this area. This underweight position contributed to positive relative performance.
In the consumer discretionary sector, Jack In the Box Inc.'s trailing year total return of 70% was a result of improvement in same-store-sales, better margins from its refranchising efforts of the Jack in the Box stores, a restructuring of Qdoba and significant share repurchases. ANN Inc.'s ("ANN") stock reacted positively to its most recent earnings results followed by an announcement that Golden Gate Capital had taken a 9.5% ownership stake in ANN with the intention of helping the company create value for shareholders.
As of March 31, 2014, the portfolio held 63 companies diversified across the major sectors of the market. Twelve new companies were purchased into the Fund in the 12 month period, 7 positions were eliminated and 1 company was acquired.
ANNUAL REPORT 2014

SMALL COMPANY FUND (Unaudited)
Return of a $10,000 Investment as of March 31, 2014
Portfolio Composition as of March 31, 2014
Percentage Based on Total Value of Investments
(Portfolio composition is subject to change)
Financials | 21.0 | % | |||||
Information Technology | 19.3 | % | |||||
Industrials | 15.7 | % | |||||
Consumer Discretionary | 13.3 | % | |||||
Health Care | 9.4 | % | |||||
Energy | 6.6 | % | |||||
Materials | 4.6 | % | |||||
Utilities | 3.7 | % | |||||
Short Term Investments | 3.2 | % | |||||
Consumer Staples | 3.2 | % | |||||
100.0 | % | ||||||
Average Annual Total Returns for the Year Ended March 31, 2014*
1 Year | 5 Year | 10 Year | |||||||||||||
| Tributary Small Company Fund - Institutional Class | 24.26 | % | 24.51 | % | 9.53 | % | |||||||||
Russell 2000 Index | 24.90 | % | 24.31 | % | 8.53 | % | |||||||||
Russell 2000 Value Index | 22.65 | % | 23.33 | % | 8.07 | % | |||||||||
Prospectus Expense Ratio (Gross/Net)† | 1.36%/1.23% | ||||||||||||||
| Expense Ratio for the Year Ended March 31, 2014 (Gross/Net) | 1.32%/1.19% | ||||||||||||||
1 Year | Since Inception†† | ||||||||||
| Tributary Small Company Fund - Institutional Plus Class | 24.53 | % | 14.04 | % | |||||||
Prospectus Expense Ratio (Gross/Net)† | 1.11%/0.98% | ||||||||||
| Expense Ratio for the Year Ended March 31, 2014 (Gross/Net) | 1.09%/0.96% | ||||||||||
Past performance does not guarantee future results. The performance data quoted represents past performance and current returns may be lower or higher. Total returns include change in share price, reinvestment of dividends and capital gains. The investment return and principal value will fluctuate so that an investor's shares, when redeemed may be worth more or less than the original cost. To obtain performance information current to the most recent month end, please visit our website at www.tributaryfunds.com.
(†)The expense ratios are from the Fund's prospectus dated July 26, 2013. Net expense ratios are net of contractual waivers which are in effect from August 1, 2013 through July 31, 2014.
(††) Commencement date for the Institutional Plus Class was December 17, 2010.
(*) Returns shown do not reflect the deduction of taxes that a shareholder would pay on Fund distributions or the redemption of Fund shares. Investment performance reflects contractual fee waivers in effect for certain periods. Without these fee waivers, the performance would have been lower.
The line chart assumes an initial investment of $10,000 made on March 31, 2004. Total return is based on net change in net asset value ("NAV") assuming reinvestment of all dividends and other distributions.
The performance of Institutional Plus Class will be different than Institutional Class based on differences in fees borne by the different classes.
The Russell 2000 Index measures the performance of the small-cap segment of the U.S. equity universe. The Russell 2000 Index is a subset of the Russell 3000® Index representing approximately 10% of the total market capitalization of that index. It includes approximately 2000 of the smallest securities based on a combination of their market cap and current index membership. The Russell 2000 Value Index measures the performance of small-cap value segment of the U.S. equity universe. It includes those Russell 2000 companies with lower price-to-book ratios and lower forecasted growth values. The indices are unmanaged and do not reflect the deduction of fees or taxes associated with a mutual fund, such as investment management, administration and other operational fees. Investors cannot invest directly in the indices.
SCHEDULES OF PORTFOLIO INVESTMENTS
March 31, 2014
SHORT-INTERMEDIATE BOND FUND
Principal |
| Security |
| Value |
| ||
Non-U.S. Government Agency Asset-Backed Securities - 26.8% |
|
|
| ||||
$ | 190,977 |
| Bayview Financial Acquisition Trust REMIC, 6.21%, 05/28/37 (a) |
| $ | 203,499 |
|
23,744 |
| Bear Stearns Asset Backed Securities I Trust REMIC, 0.55%, 10/25/34 (a) |
| 23,706 |
| ||
11,916 |
| Bear Stearns Asset Backed Securities I Trust REMIC, 0.37%, 12/25/35 (a) |
| 11,899 |
| ||
47,455 |
| Bear Stearns Asset Backed Securities I Trust REMIC, 0.37%, 02/25/36 (a) |
| 47,409 |
| ||
128,828 |
| Bear Stearns Commercial Mortgage Securities Trust REMIC, 5.53%, 09/11/41 |
| 128,748 |
| ||
975,000 |
| Cabela’s Master Credit Card Trust, 2.17%, 08/16/21 (b) |
| 977,995 |
| ||
27,967 |
| Chase Funding Trust REMIC, 4.40%, 02/25/30 |
| 27,912 |
| ||
965,000 |
| Chase Issuance Trust, 1.15%, 01/15/19 |
| 965,177 |
| ||
109,643 |
| Chase Mortgage Finance Trust REMIC, 5.50%, 05/25/35 |
| 112,810 |
| ||
814,000 |
| Citibank Credit Card Issuance Trust, 5.65%, 09/20/19 |
| 927,771 |
| ||
779,929 |
| Citigroup Mortgage Loan Trust Inc. REMIC, 0.30%, 08/25/36 (a) |
| 758,156 |
| ||
183,758 |
| Citigroup Mortgage Loan Trust Inc. REMIC, 0.30%, 10/25/36 (a) |
| 182,527 |
| ||
135,108 |
| Citimortgage Alternative Loan Trust REMIC, 5.25%, 03/25/21 |
| 137,116 |
| ||
271,807 |
| CNL Commercial Mortgage Loan Trust (insured by AMBAC Assurance Corp.) REMIC, 0.59%, 10/25/30 (a) (b) |
| 232,376 |
| ||
416,328 |
| Countrywide Asset-Backed Certificates REMIC, 4.46%, 10/25/35 (a) |
| 417,243 |
| ||
398,694 |
| Countrywide Asset-Backed Certificates REMIC, 0.33%, 07/25/36 (a) |
| 387,742 |
| ||
76,702 |
| Credit Suisse First Boston Mortgage Securities Corp. REMIC, 5.00%, 08/25/20 |
| 76,675 |
| ||
210,420 |
| Credit Suisse First Boston Mortgage Securities Corp. REMIC, 3.35%, 02/25/33 (a) |
| 210,459 |
| ||
282,136 |
| Credit-Based Asset Servicing and Securitization LLC REMIC, 1.28%, 02/25/33 (a) |
| 260,562 |
| ||
950,000 |
| Credit-Based Asset Servicing and Securitization LLC REMIC, 6.02%, 12/25/37 (a) |
| 1,010,573 |
| ||
915,000 |
| Ford Credit Floorplan Master Owner Trust, 3.50%, 01/15/19 |
| 962,209 |
| ||
654,354 |
| Fremont Home Loan Trust REMIC, 1.02%, 11/25/34 (a) |
| 608,716 |
| ||
650,000 |
| Goldman Sachs Alternative Mortgage Products Trust REMIC, 0.80%, 03/25/34 (a) |
| 647,061 |
| ||
850,000 |
| GS Mortgage Securities Trust REMIC, 3.65%, 03/10/44 (b) |
| 890,259 |
| ||
335,250 |
| GSAMP Trust REMIC, 0.36%, 01/25/36 (a) |
| 325,427 |
| ||
311,804 |
| Irwin Whole Loan Home Equity Trust REMIC, 1.25%, 11/25/28 (a) |
| 310,666 |
| ||
409,290 |
| Irwin Whole Loan Home Equity Trust REMIC, 0.62%, 12/25/29 (a) |
| 392,446 |
| ||
760,000 |
| JPMorgan Chase Commercial Mortgage Securities Trust REMIC, 2.67%, 01/15/46 |
| 775,632 |
| ||
840,000 |
| JPMorgan Mortgage Acquisition Trust REMIC, 0.38%, 07/25/36 (a) |
| 738,920 |
| ||
895,000 |
| Long Beach Mortgage Loan Trust REMIC, 1.05%, 10/25/34 (a) |
| 841,735 |
| ||
562,647 |
| Long Beach Mortgage Loan Trust REMIC, 0.89%, 04/25/35 (a) |
| 561,060 |
| ||
11,652 |
| MASTR Asset Securitization Trust REMIC, 5.25%, 11/25/35 |
| 11,662 |
| ||
494,198 |
| Morgan Stanley Capital I Trust REMIC, 3.22%, 07/15/49 |
| 515,714 |
| ||
450,896 |
| Morgan Stanley Home Equity Loan Trust REMIC, 0.86%, 12/25/34 (a) |
| 449,372 |
| ||
932,000 |
| Newcastle Investment Trust, 6.00%, 07/10/35 |
| 960,511 |
| ||
339,110 |
| Nomura Asset Acceptance Corp. Alternative Loan Trust REMIC, 0.83%, 06/25/35 (a) |
| 332,608 |
| ||
222,448 |
| Nomura Asset Acceptance Corp. Alternative Loan Trust REMIC, 6.00%, 03/25/47 (a) |
| 168,712 |
| ||
385,960 |
| Option One Mortgage Loan Trust Asset-Backed Certificates REMIC, 0.36%, 12/25/35 (a) |
| 380,002 |
| ||
346,503 |
| Origen Manufactured Housing Contract Trust, 5.22%, 05/15/32 |
| 346,957 |
| ||
34,650 |
| Origen Manufactured Housing Contract Trust, 7.17%, 05/15/32 |
| 34,879 |
| ||
407,360 |
| Origen Manufactured Housing Contract Trust, 5.91%, 01/15/35 |
| 432,335 |
| ||
660,000 |
| Park Place Securities Inc. Asset-Backed Pass-Through Certificates REMIC, 1.13%, 10/25/34 (a) |
| 632,540 |
| ||
308,856 |
| Popular ABS Mortgage Pass-Through Trust REMIC, 4.61%, 05/25/35 (a) |
| 311,169 |
| ||
2,101 |
| Popular ABS Mortgage Pass-Through Trust REMIC, 4.62%, 05/25/35 (a) |
| 2,101 |
| ||
746,316 |
| Preferred Term Securities XII Ltd., 0.93%, 12/24/33 (a) (b) |
| 617,577 |
| ||
See accompanying Notes to Financial Statements.
Principal |
| Security |
| Value |
| ||
$ | 760,467 |
| Preferred Term Securities XIV Ltd., 0.71%, 06/24/34 (a) (b) |
| $ | 612,176 |
|
505,995 |
| Preferred Term Securities XXIV Ltd., 0.53%, 03/22/37 (a) (b) |
| 394,676 |
| ||
872,799 |
| Renaissance Home Equity Loan Trust REMIC, 4.50%, 08/25/35 |
| 879,622 |
| ||
158,146 |
| Residential Accredit Loans Inc. Trust REMIC, 5.50%, 01/25/34 |
| 161,543 |
| ||
83,178 |
| Residential Accredit Loans Inc. Trust REMIC, 6.00%, 10/25/34 |
| 86,942 |
| ||
199,610 |
| Residential Accredit Loans Inc. Trust REMIC, 5.50%, 02/25/35 |
| 197,951 |
| ||
850,000 |
| Residential Asset Mortgage Products Inc. Trust REMIC, 0.66%, 06/25/35 (a) |
| 783,504 |
| ||
112,357 |
| Residential Asset Mortgage Products Inc. Trust (insured by AMBAC Assurance Corp.) REMIC, 4.02%, 03/25/33 |
| 112,614 |
| ||
307,754 |
| Residential Asset Securities Corp. Trust REMIC, 5.96%, 09/25/31 |
| 314,796 |
| ||
214,194 |
| Residential Asset Securities Corp. Trust REMIC, 3.77%, 01/25/32 (a) |
| 214,956 |
| ||
271,228 |
| Residential Asset Securities Corp. Trust REMIC, 4.47%, 03/25/32 |
| 276,746 |
| ||
473,089 |
| Residential Asset Securities Corp. Trust REMIC, 3.87%, 05/25/33 |
| 482,803 |
| ||
139,168 |
| Residential Asset Securities Corp. Trust REMIC, 4.54%, 12/25/33 |
| 143,442 |
| ||
49,331 |
| Residential Asset Securities Corp. Trust REMIC, 0.34%, 03/25/36 (a) |
| 49,219 |
| ||
177,638 |
| SACO I Trust REMIC, 0.71%, 11/25/35 (a) |
| 176,397 |
| ||
255,059 |
| Springleaf Mortgage Loan Trust REMIC, 4.05%, 01/25/58 (a) (b) |
| 266,949 |
| ||
451,969 |
| Terwin Mortgage Trust REMIC, 3.08%, 11/25/35 (a) |
| 450,461 |
| ||
351,863 |
| Vanderbilt Acquisition Loan Trust REMIC, 7.33%, 05/07/32 |
| 381,612 |
| ||
454,988 |
| Vanderbilt Mortgage Finance REMIC, 6.57%, 08/07/24 |
| 463,699 |
| ||
560,504 |
| Vanderbilt Mortgage Finance, 5.84%, 02/07/26 |
| 570,871 |
| ||
905,000 |
| Vanderbilt Mortgage Finance, 6.96%, 09/07/31 |
| 931,839 |
| ||
698,700 |
| Wachovia Bank Commercial Mortgage Trust REMIC, 5.08%, 03/15/42 (a) |
| 715,888 |
| ||
402,000 |
| Wells Fargo Commercial Mortgage Trust REMIC, 2.53%, 10/15/45 |
| 395,609 |
| ||
205,743 |
| Wells Fargo Home Equity Asset-Backed Securities Trust REMIC, 0.53%, 12/25/35 (a) |
| 202,440 |
| ||
153,945 |
| Wells Fargo Home Equity Asset-Backed Securities Trust REMIC, 0.29%, 07/25/36 (a) |
| 152,489 |
| ||
|
|
|
|
|
| ||
Total Non-U.S. Government Agency Asset-Backed Securities (cost $28,260,336) |
| 28,769,869 |
| ||||
|
|
|
|
|
| ||
Corporate Bonds - 24.4% |
|
|
| ||||
Consumer Discretionary - 3.2% |
|
|
| ||||
880,000 |
| DIRECTV Holdings LLC, 2.40%, 03/15/17 |
| 899,346 |
| ||
360,000 |
| Goodyear Tire & Rubber Co., 6.50%, 03/01/21 |
| 392,400 |
| ||
285,000 |
| Hanesbrands Inc., 6.38%, 12/15/20 |
| 311,362 |
| ||
520,000 |
| Maytag Corp., 5.00%, 05/15/15 |
| 541,395 |
| ||
375,000 |
| Mohawk Industries Inc., 6.13%, 01/15/16 (c) |
| 405,000 |
| ||
860,000 |
| Newell Rubbermaid Inc., 2.05%, 12/01/17 |
| 862,607 |
| ||
|
|
|
| 3,412,110 |
| ||
Consumer Staples - 1.9% |
|
|
| ||||
825,000 |
| Cargill Inc., 1.90%, 03/01/17 (b) |
| 835,459 |
| ||
835,000 |
| Church & Dwight Co. Inc., 3.35%, 12/15/15 |
| 867,610 |
| ||
395,000 |
| Land O’Lakes Capital Trust I, 7.45%, 03/15/28 (b) |
| 385,125 |
| ||
|
|
|
| 2,088,194 |
| ||
Energy - 1.1% |
|
|
| ||||
615,000 |
| ConocoPhillips, 4.60%, 01/15/15 |
| 634,901 |
| ||
500,000 |
| Occidental Petroleum Corp., 1.75%, 02/15/17 |
| 506,683 |
| ||
|
|
|
| 1,141,584 |
| ||
Financials - 14.6% |
|
|
| ||||
735,000 |
| ACE INA Holdings Inc., 5.60%, 05/15/15 |
| 775,612 |
| ||
910,000 |
| American Express Bank FSB, 0.46%, 06/12/17 (a) |
| 903,691 |
| ||
900,000 |
| American Honda Finance Corp., 1.60%, 02/16/18 (b) |
| 890,799 |
| ||
860,000 |
| Bank of America Corp., 5.65%, 05/01/18 |
| 972,408 |
| ||
650,000 |
| Berkshire Hathaway Inc., 1.90%, 01/31/17 |
| 665,272 |
| ||
565,000 |
| Caterpillar Financial Services Corp., 1.63%, 06/01/17 |
| 569,728 |
| ||
905,000 |
| Citigroup Inc., 4.45%, 01/10/17 |
| 977,563 |
| ||
935,000 |
| CME Group Index Services LLC, 4.40%, 03/15/18 (b) |
| 1,012,591 |
| ||
290,000 |
| General Electric Capital Corp., 0.51%, 08/07/18 (a) |
| 286,597 |
| ||
340,000 |
| General Electric Capital Corp., 6.38%, 11/15/67 (a) |
| 374,000 |
| ||
See accompanying Notes to Financial Statements.
Principal |
| Security |
| Value |
| ||
$ | 440,000 |
| Genworth Financial Inc., 7.63%, 09/24/21 |
| $ | 542,089 |
|
725,000 |
| Hartford Financial Services Group Inc., 5.50%, 03/30/20 |
| 821,387 |
| ||
785,000 |
| JPMorgan Chase & Co., 7.90% (callable at 100 beginning 04/30/18) (d) |
| 887,050 |
| ||
510,000 |
| KeyBank NA, 4.95%, 09/15/15 |
| 538,346 |
| ||
680,000 |
| Metropolitan Life Global Funding I, 1.70%, 06/29/15 (b) |
| 688,996 |
| ||
800,000 |
| Morgan Stanley, 4.75%, 03/22/17 |
| 873,194 |
| ||
900,000 |
| Murray Street Investment Trust I, 4.65%, 03/09/17 |
| 972,264 |
| ||
670,000 |
| Pricoa Global Funding I, 0.44%, 06/24/16 (a) (b) |
| 665,794 |
| ||
140,000 |
| Regions Financial Corp., 7.75%, 11/10/14 |
| 145,891 |
| ||
585,000 |
| Regions Financial Corp., 2.00%, 05/15/18 |
| 573,507 |
| ||
650,000 |
| State Street Bank & Trust Co., 0.44%, 12/08/15 (a) |
| 649,319 |
| ||
780,000 |
| Wells Fargo & Co., 7.98% (callable at 100 beginning 03/15/18) (d) |
| 886,275 |
| ||
|
|
|
| 15,672,373 |
| ||
Industrials - 1.3% |
|
|
| ||||
745,000 |
| Textron Inc., 6.20%, 03/15/15 |
| 782,072 |
| ||
495,000 |
| Union Pacific Corp., 5.70%, 08/15/18 |
| 566,854 |
| ||
|
|
|
| 1,348,926 |
| ||
Information Technology - 0.6% |
|
|
| ||||
625,000 |
| CA Inc., 6.13%, 12/01/14 |
| 646,994 |
| ||
|
|
|
|
|
| ||
Materials - 0.4% |
|
|
| ||||
475,000 |
| Rio Tinto Finance USA Ltd., 8.95%, 05/01/14 (c) |
| 478,181 |
| ||
|
|
|
|
|
| ||
Telecommunication Services - 0.8% |
|
|
| ||||
350,000 |
| Crown Castle International Corp., 7.13%, 11/01/19 |
| 372,313 |
| ||
410,000 |
| Verizon Communications Inc., 3.65%, 09/14/18 |
| 436,576 |
| ||
|
|
|
| 808,889 |
| ||
Utilities - 0.5% |
|
|
| ||||
565,000 |
| Georgia Power Co., 3.00%, 04/15/16 |
| 589,947 |
| ||
|
|
|
|
|
| ||
Total Corporate Bonds (cost $25,742,609) |
| 26,187,198 |
| ||||
|
|
|
| ||||
Government and Agency Obligations - 44.5% |
|
|
| ||||
GOVERNMENT SECURITIES - 39.1% |
|
|
| ||||
Municipals - 4.0% |
|
|
| ||||
455,000 |
| City of Indianapolis, Indiana, 0.63%, 07/01/14 |
| 455,096 |
| ||
165,000 |
| City of Lincoln, Nebraska, 4.25%, 11/01/14 |
| 167,409 |
| ||
380,000 |
| City of Omaha, Nebraska, RB, 2.40%, 12/01/16 |
| 389,515 |
| ||
250,000 |
| Lincoln Airport Authority, 1.33%, 07/01/16 |
| 249,508 |
| ||
730,000 |
| Montana Board of Housing, 1.60%, 06/01/16 |
| 735,584 |
| ||
530,000 |
| Nebraska Investment Finance Authority, 0.90%, 03/01/15 |
| 532,602 |
| ||
600,000 |
| New York City Transitional Finance Authority, 3.02%, 02/01/16 |
| 624,702 |
| ||
325,000 |
| State of Mississippi, 2.63%, 11/01/16 |
| 339,635 |
| ||
760,000 |
| Tennessee Housing Development Agency, 0.50%, 07/01/14 |
| 760,479 |
| ||
|
|
|
| 4,254,530 |
| ||
Treasury Inflation Index Securities - 0.7% |
|
|
| ||||
715,325 |
| U.S. Treasury Inflation Indexed Note, 0.13%, 04/15/16 (e) |
| 734,716 |
| ||
|
|
|
|
|
| ||
U.S. Treasury Securities - 34.4% |
|
|
| ||||
14,525,000 |
| U.S. Treasury Note, 0.25%, 12/15/15 |
| 14,510,242 |
| ||
6,835,000 |
| U.S. Treasury Note, 1.75%, 05/31/16 |
| 7,017,091 |
| ||
13,560,000 |
| U.S. Treasury Note, 0.63%, 09/30/17 |
| 13,309,981 |
| ||
2,160,000 |
| U.S. Treasury Note, 1.25%, 01/31/19 |
| 2,116,800 |
| ||
|
|
|
| 36,954,114 |
| ||
U.S. GOVERNMENT MORTGAGE-BACKED SECURITIES - 5.4% |
|
|
| ||||
Federal Home Loan Mortgage Corp. - 0.8% |
|
|
| ||||
366,576 |
| Federal Home Loan Mortgage Corp. REMIC, 4.00%, 03/15/20 |
| 386,665 |
| ||
450,000 |
| Federal Home Loan Mortgage Corp. REMIC, 4.00%, 02/15/27 |
| 462,090 |
| ||
|
|
|
| 848,755 |
| ||
Federal National Mortgage Association - 4.6% |
|
|
| ||||
192,185 |
| Federal National Mortgage Association REMIC, 4.00%, 07/25/21 |
| 203,331 |
| ||
602,909 |
| Federal National Mortgage Association REMIC, 4.50%, 08/25/21 |
| 620,180 |
| ||
118,082 |
| Federal National Mortgage Association REMIC, 4.50%, 11/25/23 |
| 121,346 |
| ||
390,095 |
| Federal National Mortgage Association REMIC, 4.00%, 02/25/26 |
| 413,519 |
| ||
1,321,428 |
| Federal National Mortgage Association, 3.00%, 10/01/26 |
| 1,358,288 |
| ||
567,714 |
| Federal National Mortgage Association REMIC, 3.00%, 04/25/37 |
| 583,293 |
| ||
660,000 |
| Federal National Mortgage Association REMIC, 2.50%, 09/25/39 |
| 664,941 |
| ||
See accompanying Notes to Financial Statements.
Shares or |
| Security |
| Value |
| ||
$ | 869,412 |
| Federal National Mortgage Association REMIC, 3.50%, 05/25/41 |
| $ | 905,058 |
|
320,832 |
| Federal National Mortgage Association, Interest Only REMIC, 5.00%, 03/25/39 |
| 26,785 |
| ||
|
|
|
| 4,896,741 |
| ||
Total Government and Agency Obligations (cost $47,755,858) |
| 47,688,856 |
| ||||
|
|
|
| ||||
Preferred Stocks - 0.4% |
|
|
| ||||
550 |
| U.S. Bancorp, Series A, 3.50% (callable at 1,000 beginning on 05/05/14) (d) |
| 445,357 |
| ||
|
|
|
|
|
| ||
Total Preferred Stocks (cost $564,328) |
| 445,357 |
| ||||
|
|
|
| ||||
Short Term Investments - 3.5% |
|
|
| ||||
Investment Company - 3.5% |
|
|
| ||||
3,714,552 |
| Goldman Sachs Financial Square Funds, Treasury Obligations Fund, 0.01% (f) |
| 3,714,552 |
| ||
|
|
|
|
|
| ||
Total Short Term Investments (cost $3,714,552) |
| 3,714,552 |
| ||||
|
|
|
|
|
| ||
Total Investments - 99.6% (cost $106,037,683) |
| 106,805,832 |
| ||||
Other assets in excess of liabilities - 0.4% |
| 465,785 |
| ||||
NET ASSETS - 100% |
| $ | 107,271,617 |
| |||
(a) | Variable rate security. The rate reflected is the rate in effect at March 31, 2014. |
(b) | Rule 144A, Section 4(2) of the Securities Act of 1933 or other security which is restricted to resale to institutional investors. The Fund’s investment adviser has deemed these securities to be liquid based on procedures approved by Tributary Funds’ Board of Directors. |
(c) | The interest rate for this security is inversely affected by upgrades or downgrades to the credit rating of the issuer. |
(d) | Perpetual maturity security. |
(e) | U.S. Treasury inflation indexed note, par amount is adjusted for inflation. |
(f) | Dividend yield changes daily to reflect current market conditions. Rate was the quoted yield as of March 31, 2014. |
|
|
ABS | Asset Backed Security |
AMBAC | AMBAC Indemnity Corp. |
RB | Revenue Bond |
REMIC | Real Estate Mortgage Investment Conduit |
See accompanying Notes to Financial Statements.
SCHEDULES OF PORTFOLIO INVESTMENTS
March 31, 2014
INCOME FUND
Principal |
| Security |
| Value |
| ||
Non-U.S. Government Agency Asset-Backed Securities - 26.2% |
|
|
| ||||
$ | 1,348,000 |
| Banc of America Commercial Mortgage Inc. REMIC, 5.18%, 09/10/47 (a) |
| $ | 1,422,819 |
|
1,030,130 |
| Bayview Financial Mortgage Pass-Through Trust REMIC, 5.70%, 02/28/41 (a) |
| 1,061,068 |
| ||
144,751 |
| Bear Stearns Commercial Mortgage Securities Trust REMIC, 5.53%, 09/11/41 |
| 144,660 |
| ||
685,000 |
| Cabela’s Master Credit Card Trust, 2.71%, 02/17/26 (b) |
| 652,100 |
| ||
740,000 |
| Chase Issuance Trust, 1.15%, 01/15/19 |
| 740,135 |
| ||
124,262 |
| Chase Mortgage Finance Trust REMIC, 5.50%, 05/25/35 |
| 127,851 |
| ||
320,000 |
| Citibank Credit Card Issuance Trust, 5.65%, 09/20/19 |
| 364,726 |
| ||
539,564 |
| Citigroup Mortgage Loan Trust Inc. REMIC, 6.50%, 07/25/34 |
| 578,536 |
| ||
990,436 |
| Citigroup Mortgage Loan Trust Inc. REMIC, 4.00%, 01/25/35 (a) |
| 1,028,773 |
| ||
820,978 |
| Citigroup Mortgage Loan Trust Inc. REMIC, 0.30%, 08/25/36 (a) |
| 798,059 |
| ||
146,064 |
| Citigroup Mortgage Loan Trust Inc. REMIC, 0.30%, 10/25/36 (a) |
| 145,085 |
| ||
135,108 |
| Citimortgage Alternative Loan Trust REMIC, 5.25%, 03/25/21 |
| 137,116 |
| ||
225,542 |
| CNL Commercial Mortgage Loan Trust (insured by AMBAC Assurance Corp.) REMIC, 0.59%, 10/25/30 (a) (b) |
| 192,823 |
| ||
319,973 |
| Countrywide Asset-Backed Certificates REMIC, 4.46%, 10/25/35 (a) |
| 320,676 |
| ||
250,029 |
| Countrywide Asset-Backed Certificates REMIC, 0.33%, 07/25/36 (a) |
| 243,160 |
| ||
76,703 |
| Credit Suisse First Boston Mortgage Securities Corp. REMIC, 5.00%, 08/25/20 |
| 76,675 |
| ||
107,655 |
| Credit Suisse First Boston Mortgage Securities Corp. REMIC, 5.75%, 04/25/33 |
| 114,994 |
| ||
282,136 |
| Credit-Based Asset Servicing and Securitization LLC REMIC, 1.28%, 02/25/33 (a) |
| 260,562 |
| ||
231,252 |
| Credit-Based Asset Servicing and Securitization LLC REMIC, 5.75%, 12/25/37 (a) |
| 231,298 |
| ||
850,000 |
| Credit-Based Asset Servicing and Securitization LLC REMIC, 6.02%, 12/25/37 (a) |
| 904,197 |
| ||
455,000 |
| Ford Credit Floorplan Master Owner Trust, 3.50%, 01/15/19 |
| 478,475 |
| ||
500,000 |
| Goldman Sachs Alternative Mortgage Products Trust REMIC, 0.80%, 03/25/34 (a) |
| 497,740 |
| ||
575,000 |
| GS Mortgage Securities Trust REMIC, 3.65%, 03/10/44 (b) |
| 602,234 |
| ||
309,461 |
| GSAMP Trust REMIC, 0.36%, 01/25/36 (a) |
| 300,394 |
| ||
324,531 |
| Irwin Whole Loan Home Equity Trust REMIC, 1.25%, 11/25/28 (a) |
| 323,347 |
| ||
798,614 |
| Irwin Whole Loan Home Equity Trust REMIC, 0.62%, 12/25/29 (a) |
| 765,749 |
| ||
480,000 |
| JPMorgan Chase Commercial Mortgage Securities Trust REMIC, 2.67%, 01/15/46 |
| 489,873 |
| ||
860,000 |
| JPMorgan Mortgage Acquisition Trust REMIC, 0.38%, 07/25/36 (a) |
| 756,514 |
| ||
10,756 |
| MASTR Asset Securitization Trust REMIC, 5.25%, 11/25/35 |
| 10,765 |
| ||
784,064 |
| Morgan Stanley Capital I Trust REMIC, 3.22%, 07/15/49 |
| 818,200 |
| ||
339,162 |
| Nomura Asset Acceptance Corp. Alternative Loan Trust REMIC, 0.83%, 06/25/35 (a) |
| 332,659 |
| ||
240,986 |
| Nomura Asset Acceptance Corp. Alternative Loan Trust REMIC, 6.00%, 03/25/47 (a) |
| 182,772 |
| ||
300,000 |
| NovaStar Mortgage Funding Trust REMIC, 1.80%, 03/25/35 (a) |
| 295,215 |
| ||
421,047 |
| Option One Mortgage Loan Trust Asset-Backed Certificates REMIC, 0.36%, 12/25/35 (a) |
| 414,548 |
| ||
497,885 |
| Origen Manufactured Housing Contract Trust, 5.91%, 01/15/35 |
| 528,410 |
| ||
86,098 |
| Park Place Securities Inc. Asset-Backed Pass-Through Certificates REMIC, 1.08%, 10/25/34 (a) |
| 86,078 |
| ||
793,164 |
| Preferred Term Securities XII Ltd., 0.93%, 12/24/33 (a) (b) |
| 656,343 |
| ||
760,467 |
| Preferred Term Securities XIV Ltd., 0.71%, 06/24/34 (a) (b) |
| 612,176 |
| ||
973,929 |
| Preferred Term Securities XXI Ltd., 0.88%, 03/22/38 (a) (b) (c) |
| 465,051 |
| ||
494,667 |
| Preferred Term Securities XXIV Ltd., 0.53%, 03/22/37 (a) (b) |
| 385,840 |
| ||
647,279 |
| Renaissance Home Equity Loan Trust REMIC, 4.50%, 08/25/35 |
| 652,339 |
| ||
165,498 |
| Residential Accredit Loans Inc. Trust REMIC, 5.50%, 01/25/34 |
| 169,053 |
| ||
410,756 |
| Residential Accredit Loans Inc. Trust REMIC, 6.00%, 10/25/34 |
| 429,342 |
| ||
134,465 |
| Residential Accredit Loans Inc. Trust REMIC, 5.50%, 02/25/35 |
| 133,348 |
| ||
See accompanying Notes to Financial Statements.
Principal |
| Security |
| Value |
| ||
$ | 467,602 |
| Residential Asset Mortgage Products Inc. Trust REMIC, 5.63%, 01/25/34 |
| $ | 497,163 |
|
870,000 |
| Residential Asset Mortgage Products Inc. Trust REMIC, 0.66%, 06/25/35 (a) |
| 801,939 |
| ||
163,858 |
| Residential Asset Mortgage Products Inc. Trust (insured by AMBAC Assurance Corp.) REMIC, 4.02%, 03/25/33 |
| 164,233 |
| ||
258,514 |
| Residential Asset Securities Corp. Trust REMIC, 5.96%, 09/25/31 |
| 264,429 |
| ||
252,305 |
| Residential Asset Securities Corp. Trust REMIC, 4.47%, 03/25/32 |
| 257,438 |
| ||
139,168 |
| Residential Asset Securities Corp. Trust REMIC, 4.54%, 12/25/33 |
| 143,442 |
| ||
203,955 |
| SACO I Trust REMIC, 0.71%, 11/25/35 (a) |
| 202,530 |
| ||
304,324 |
| Structured Asset Securities Corp. REMIC, 1.20%, 11/25/34 (a) |
| 284,932 |
| ||
56,319 |
| Structured Asset Securities Corp. (insured by MBIA Assurance Corp.) REMIC, 5.80%, 09/25/33 (a) |
| 57,895 |
| ||
940,396 |
| Vanderbilt Acquisition Loan Trust REMIC, 7.33%, 05/07/32 |
| 1,019,904 |
| ||
256,048 |
| Vanderbilt Mortgage Finance, 5.84%, 02/07/26 |
| 260,784 |
| ||
675,000 |
| Vanderbilt Mortgage Finance, 6.96%, 09/07/31 |
| 695,018 |
| ||
795,000 |
| Wells Fargo Commercial Mortgage Trust REMIC, 2.53%, 10/15/45 |
| 782,361 |
| ||
388,154 |
| Wells Fargo Home Equity Asset-Backed Securities Trust REMIC, 0.53%, 12/25/35 (a) |
| 381,923 |
| ||
92,310 |
| Wells Fargo Home Equity Asset-Backed Securities Trust REMIC, 0.29%, 07/25/36 (a) |
| 91,437 |
| ||
174,666 |
| Wells Fargo Mortgage Backed Securities Trust REMIC, 5.00%, 11/25/36 |
| 180,408 |
| ||
625,000 |
| Wells Fargo-RBS Commercial Mortgage Trust REMIC, 2.63%, 03/15/45 |
| 612,906 |
| ||
485,000 |
| Wells Fargo-RBS Commercial Mortgage Trust REMIC, 2.19%, 04/15/45 |
| 495,919 |
| ||
Total Non-U.S. Government Agency Asset-Backed Securities (cost $27,066,828) |
| 27,126,439 |
| ||||
Corporate Bonds - 22.0% |
|
|
| ||||
Consumer Discretionary - 2.3% |
|
|
| ||||
525,000 |
| DIRECTV Holdings LLC, 3.80%, 03/15/22 |
| 519,572 |
| ||
300,000 |
| Goodyear Tire & Rubber Co., 6.50%, 03/01/21 |
| 327,000 |
| ||
290,000 |
| Hanesbrands Inc., 6.38%, 12/15/20 |
| 316,825 |
| ||
325,000 |
| Mohawk Industries Inc., 6.13%, 01/15/16 (d) |
| 351,000 |
| ||
375,000 |
| Newell Rubbermaid Inc., 4.70%, 08/15/20 |
| 399,919 |
| ||
410,000 |
| Whirlpool Corp., 4.85%, 06/15/21 |
| 447,595 |
| ||
|
|
|
| 2,361,911 |
| ||
Consumer Staples - 2.2% |
|
|
| ||||
370,000 |
| Cargill Inc., 3.25%, 11/15/21 (b) |
| 369,432 |
| ||
445,000 |
| Church & Dwight Co. Inc., 3.35%, 12/15/15 |
| 462,379 |
| ||
405,000 |
| Land O’Lakes Capital Trust I, 7.45%, 03/15/28 (b) |
| 394,875 |
| ||
450,000 |
| PepsiCo Inc., 4.88%, 11/01/40 |
| 475,556 |
| ||
480,000 |
| Wal-Mart Stores Inc., 5.63%, 04/15/41 |
| 569,350 |
| ||
|
|
|
| 2,271,592 |
| ||
Energy - 0.7% |
|
|
| ||||
335,000 |
| Enterprise Products Operating LLC, 6.30%, 09/15/17 |
| 386,499 |
| ||
270,000 |
| Tosco Corp., 8.13%, 02/15/30 |
| 390,786 |
| ||
|
|
|
| 777,285 |
| ||
Financials - 9.2% |
|
|
| ||||
355,000 |
| ACE INA Holdings Inc., 5.90%, 06/15/19 |
| 415,482 |
| ||
480,000 |
| American Express Co., 6.80%, 09/01/66 (a) |
| 525,936 |
| ||
590,000 |
| American Honda Finance Corp., 1.60%, 02/16/18 (b) |
| 583,968 |
| ||
525,000 |
| Bank of America Corp., 5.65%, 05/01/18 |
| 593,621 |
| ||
285,000 |
| Chubb Corp., 6.80%, 11/15/31 |
| 366,743 |
| ||
560,000 |
| Citigroup Inc., 4.45%, 01/10/17 |
| 604,901 |
| ||
515,000 |
| General Electric Capital Corp., 6.38%, 11/15/67 (a) |
| 566,500 |
| ||
400,000 |
| Genworth Financial Inc., 7.63%, 09/24/21 |
| 492,808 |
| ||
580,000 |
| Goldman Sachs Capital I, 6.35%, 02/15/34 |
| 600,524 |
| ||
480,000 |
| Hartford Financial Services Group Inc., 5.50%, 03/30/20 |
| 543,815 |
| ||
500,000 |
| JPMorgan Chase & Co., 7.90% (callable at 100 beginning 04/30/18) (e) |
| 565,000 |
| ||
311,000 |
| KeyBank NA, 4.95%, 09/15/15 |
| 328,286 |
| ||
405,000 |
| Metropolitan Life Global Funding I, 1.70%, 06/29/15 (b) |
| 410,358 |
| ||
560,000 |
| Morgan Stanley, 4.75%, 03/22/17 |
| 611,236 |
| ||
465,000 |
| Prudential Financial Inc., 7.38%, 06/15/19 |
| 569,908 |
| ||
88,000 |
| Regions Financial Corp., 7.75%, 11/10/14 |
| 91,703 |
| ||
380,000 |
| Regions Financial Corp., 2.00%, 05/15/18 |
| 372,535 |
| ||
375,000 |
| State Street Bank & Trust Co., 0.44%, 12/08/15 (a) |
| 374,607 |
| ||
See accompanying Notes to Financial Statements.
Principal |
| Security |
| Value |
| ||
$ | 363,000 |
| UBS Preferred Funding Trust V, 6.24% (callable at 100 beginning 05/15/16) (e) |
| $ | 387,502 |
|
475,000 |
| Wells Fargo & Co., Series A, 7.98% (callable at 100 beginning 03/15/18) (e) |
| 539,719 |
| ||
|
|
|
| 9,545,152 |
| ||
Health Care - 0.2% |
|
|
| ||||
160,000 |
| Pfizer Inc., 6.20%, 03/15/19 |
| 189,488 |
| ||
Industrials - 2.1% |
|
|
| ||||
475,000 |
| Burlington Northern Santa Fe LLC, 3.75%, 04/01/24 |
| 476,443 |
| ||
370,000 |
| Textron Inc., 6.20%, 03/15/15 |
| 388,412 |
| ||
290,000 |
| Textron Inc., 3.65%, 03/01/21 |
| 291,168 |
| ||
335,000 |
| Union Pacific Corp., 5.70%, 08/15/18 |
| 383,629 |
| ||
479,000 |
| United Technologies Corp., 6.13%, 07/15/38 |
| 604,326 |
| ||
|
|
|
| 2,143,978 |
| ||
Information Technology - 2.0% |
|
|
| ||||
445,000 |
| CA Inc., 6.13%, 12/01/14 |
| 460,659 |
| ||
605,000 |
| Intel Corp., 2.70%, 12/15/22 |
| 577,612 |
| ||
465,000 |
| International Business Machines Corp., 5.60%, 11/30/39 |
| 543,444 |
| ||
525,000 |
| Motorola Solutions Inc., 3.75%, 05/15/22 |
| 518,378 |
| ||
|
|
|
| 2,100,093 |
| ||
Materials - 1.7% |
|
|
| ||||
488,000 |
| Dow Chemical Co., 4.25%, 11/15/20 |
| 516,384 |
| ||
405,000 |
| Martin Marietta Materials Inc., 6.60%, 04/15/18 |
| 460,242 |
| ||
493,000 |
| Mosaic Co., 3.75%, 11/15/21 |
| 495,501 |
| ||
295,000 |
| Rio Tinto Finance USA Ltd., 8.95%, 05/01/14 (d) |
| 296,976 |
| ||
|
|
|
| 1,769,103 |
| ||
Telecommunication Services - 0.7% |
|
|
| ||||
315,000 |
| Crown Castle International Corp., 7.13%, 11/01/19 |
| 335,081 |
| ||
310,000 |
| Verizon Communications Inc., 5.15%, 09/15/23 |
| 339,286 |
| ||
|
|
|
| 674,367 |
| ||
Utilities - 0.9% |
|
|
| ||||
315,000 |
| Alabama Power Co., 5.50%, 10/15/17 |
| 356,533 |
| ||
455,000 |
| PacifiCorp, 6.25%, 10/15/37 |
| 574,790 |
| ||
|
|
|
| 931,323 |
| ||
Total Corporate Bonds (cost $22,187,197) |
| 22,764,292 |
| ||||
Government and Agency Obligations - 47.3% |
|
|
| ||||
GOVERNMENT SECURITIES - 28.2% |
|
|
| ||||
Municipals - 1.9% |
|
|
| ||||
450,000 |
| Montana Board of Housing, 2.38%, 06/01/20 |
| 446,544 |
| ||
340,000 |
| New York City Municipal Water Finance Authority, 5.72%, 06/15/42 |
| 404,522 |
| ||
225,000 |
| State of Connecticut, 4.95%, 12/01/20 |
| 251,836 |
| ||
225,000 |
| State of Connecticut, 5.63%, 12/01/29 |
| 251,593 |
| ||
240,000 |
| University of Michigan, 6.01%, 04/01/25 |
| 268,958 |
| ||
350,000 |
| University of Nebraska, RB, Series B, 5.70%, 07/01/29 |
| 363,660 |
| ||
|
|
|
| 1,987,113 |
| ||
Treasury Inflation Index Securities - 0.9% |
|
|
| ||||
981,825 |
| U.S. Treasury Inflation Indexed Note, 0.13%, 01/15/22 (f) |
| 961,959 |
| ||
|
|
|
|
|
| ||
U.S. Treasury Securities - 25.4% |
|
|
| ||||
2,555,000 |
| U.S. Treasury Bond, 5.38%, 02/15/31 |
| 3,266,409 |
| ||
3,800,000 |
| U.S. Treasury Bond, 3.63%, 08/15/43 |
| 3,846,314 |
| ||
5,840,000 |
| U.S. Treasury Note, 0.63%, 09/30/17 |
| 5,732,322 |
| ||
5,790,000 |
| U.S. Treasury Note, 3.38%, 11/15/19 |
| 6,244,608 |
| ||
7,825,000 |
| U.S. Treasury Note, 1.63%, 11/15/22 |
| 7,242,405 |
| ||
|
|
|
| 26,332,058 |
| ||
U.S. GOVERNMENT MORTGAGE-BACKED SECURITIES - 19.1% |
|
|
| ||||
Federal Home Loan Mortgage Corp. - 5.4% |
|
|
| ||||
729,082 |
| Federal Home Loan Mortgage Corp. REMIC, 4.50%, 04/15/19 |
| 767,232 |
| ||
1,244,000 |
| Federal Home Loan Mortgage Corp. REMIC, 4.50%, 06/15/21 |
| 1,351,192 |
| ||
120,529 |
| Federal Home Loan Mortgage Corp., 3.50%, 12/01/26 |
| 126,100 |
| ||
700,000 |
| Federal Home Loan Mortgage Corp. REMIC, 4.00%, 02/15/27 |
| 718,806 |
| ||
1,386,727 |
| Federal Home Loan Mortgage Corp., 4.50%, 11/01/30 |
| 1,503,736 |
| ||
1,069,326 |
| Federal Home Loan Mortgage Corp. REMIC, 4.00%, 02/15/39 |
| 1,152,195 |
| ||
|
|
|
| 5,619,261 |
| ||
Federal National Mortgage Association - 11.6% |
|
|
| ||||
87,239 |
| Federal National Mortgage Association, 5.50%, 11/01/16 |
| 92,831 |
| ||
40,049 |
| Federal National Mortgage Association, 4.50%, 12/01/18 |
| 42,443 |
| ||
695,284 |
| Federal National Mortgage Association REMIC, 4.00%, 02/25/19 |
| 728,961 |
| ||
535,563 |
| Federal National Mortgage Association, 7.50%, 08/01/22 |
| 584,230 |
| ||
See accompanying Notes to Financial Statements.
Shares or |
| Security |
| Value |
| ||
$ | 121,436 |
| Federal National Mortgage Association, 4.00%, 06/01/24 |
| $ | 128,657 |
|
52,418 |
| Federal National Mortgage Association, 4.00%, 10/01/24 |
| 55,535 |
| ||
721,422 |
| Federal National Mortgage Association REMIC, 5.00%, 02/25/32 |
| 791,438 |
| ||
1,075,364 |
| Federal National Mortgage Association REMIC, 4.00%, 01/25/33 |
| 1,158,667 |
| ||
637,931 |
| Federal National Mortgage Association, 5.00%, 08/01/34 |
| 696,813 |
| ||
974,363 |
| Federal National Mortgage Association REMIC, 5.50%, 08/25/34 |
| 1,026,612 |
| ||
1,130,993 |
| Federal National Mortgage Association REMIC, 3.00%, 04/25/37 |
| 1,162,029 |
| ||
78,792 |
| Federal National Mortgage Association, 5.50%, 08/01/37 |
| 87,169 |
| ||
245,201 |
| Federal National Mortgage Association, 6.00%, 09/01/38 |
| 273,691 |
| ||
388,439 |
| Federal National Mortgage Association, 4.50%, 06/01/39 |
| 417,087 |
| ||
1,350,000 |
| Federal National Mortgage Association REMIC, 2.50%, 09/25/39 |
| 1,360,107 |
| ||
640,990 |
| Federal National Mortgage Association, 4.50%, 01/01/40 |
| 690,662 |
| ||
1,386,040 |
| Federal National Mortgage Association, 4.00%, 04/01/41 |
| 1,443,583 |
| ||
786,093 |
| Federal National Mortgage Association REMIC, 3.50%, 05/25/41 |
| 818,323 |
| ||
448,884 |
| Federal National Mortgage Association, 4.00%, 02/01/42 |
| 468,174 |
| ||
|
|
|
| 12,027,012 |
| ||
Government National Mortgage Association - 2.1% |
|
|
| ||||
1,679,468 |
| Government National Mortgage Association, 3.00%, 03/20/43 |
| 1,656,088 |
| ||
422,628 |
| Government National Mortgage Association, 4.72%, 06/20/61 |
| 461,108 |
| ||
|
|
|
| 2,117,196 |
| ||
Total Government and Agency Obligations (cost $48,774,217) |
| 49,044,599 |
| ||||
Preferred Stock - 0.4% |
|
|
| ||||
580 |
| U.S. Bancorp, Series A, 3.50% (callable at 1,000 beginning on 05/05/14) (e) |
| 469,649 |
| ||
Total Preferred Stocks (cost $595,666) |
| 469,649 |
| ||||
Shares |
|
|
|
|
| |
Exchange Traded Funds - 0.5% |
|
|
| |||
5,047 |
| iShares iBoxx High Yield Corporate Bond Fund |
| 476,386 |
| |
Total Exchange Traded Funds (cost $436,132) |
| 476,386 |
| |||
Investment Company - 1.2% |
|
|
| |||
119,441 |
| Federated Institutional High-Yield Bond Fund |
| 1,237,409 |
| |
Total Investment Company (cost $1,073,566) |
| 1,237,409 |
| |||
Short Term Investments - 3.1% |
|
|
| |||
Investment Company - 3.1% |
|
|
| |||
3,213,121 |
| Goldman Sachs Financial Square Funds, Treasury Obligations Fund, 0.01% (g) |
| 3,213,121 |
| |
Total Short Term Investments (cost $3,213,121) |
| 3,213,121 |
| |||
Total Investments - 100.7% (cost $103,346,727) |
| 104,331,895 |
| |||
Liabilities in excess of other assets - (0.7%) |
| (737,358 | ) | |||
NET ASSETS - 100% |
| $ | 103,594,537 |
| ||
(a) |
| Variable rate security. The rate reflected is the rate in effect at March 31, 2014. |
(b) |
| Rule 144A, Section 4(2) of the Securities Act of 1933 or other security which is restricted to resale to institutional investors. The Fund’s investment adviser has deemed these securities to be liquid based on procedures approved by Tributary Funds’ Board of Directors. |
(c) |
| Pay-in-kind security. The coupon interest earned by the security may be paid in cash or additional par. |
(d) |
| The interest rate for this security is inversely affected by upgrades or downgrades to the credit rating of the issuer. |
(e) |
| Perpetual maturity security. |
(f) |
| U.S. Treasury inflation indexed note, par amount is adjusted for inflation. |
(g) |
| Dividend yield changes daily to reflect current market conditions. Rate was the quoted yield as of March 31, 2014. |
|
|
|
AMBAC |
| AMBAC Indemnity Corp. |
MBIA |
| Municipal Bond Investors Assurance |
RB |
| Revenue Bond |
REMIC |
| Real Estate Mortgage Investment Conduit |
See accompanying Notes to Financial Statements.
SCHEDULES OF PORTFOLIO INVESTMENTS
March 31, 2014
BALANCED FUND
Shares |
| Security |
| Value |
| |
Common Stocks - 65.5% |
|
|
| |||
Consumer Discretionary - 9.3% |
|
|
| |||
10,000 |
| Bally Technologies Inc. (a) |
| $ | 662,700 |
|
13,400 |
| BorgWarner Inc. |
| 823,698 |
| |
9,800 |
| Cabela’s Inc. (a) |
| 641,998 |
| |
8,200 |
| Discovery Communications Inc. - Class C (a) |
| 631,892 |
| |
8,000 |
| Foot Locker Inc. |
| 375,840 |
| |
8,400 |
| HanesBrands Inc. |
| 642,432 |
| |
4,000 |
| Polaris Industries Inc. |
| 558,840 |
| |
50,000 |
| PulteGroup Inc. |
| 959,500 |
| |
75,000 |
| Standard Pacific Corp. (a) |
| 623,250 |
| |
10,000 |
| Sturm Ruger & Co. Inc. |
| 598,000 |
| |
14,000 |
| Tenneco Inc. (a) |
| 812,980 |
| |
5,450 |
| Ulta Salon Cosmetics & Fragrance Inc. (a) |
| 531,266 |
| |
2,200 |
| Wynn Resorts Ltd. |
| 488,730 |
| |
|
|
|
| 8,351,126 |
| |
Consumer Staples - 4.7% |
|
|
| |||
8,000 |
| Church & Dwight Co. Inc. |
| 552,560 |
| |
24,000 |
| Herbalife Ltd. |
| 1,374,480 |
| |
5,000 |
| Keurig Green Mountain Inc. |
| 527,950 |
| |
6,400 |
| PriceSmart Inc. |
| 645,952 |
| |
25,000 |
| Snyders-Lance Inc. |
| 704,750 |
| |
15,000 |
| WhiteWave Foods Co. - Class A (a) |
| 428,100 |
| |
|
|
|
| 4,233,792 |
| |
Energy - 6.1% |
|
|
| |||
10,000 |
| Bristow Group Inc. |
| 755,200 |
| |
8,000 |
| Concho Resources Inc. (a) |
| 980,000 |
| |
3,750 |
| EOG Resources Inc. |
| 735,637 |
| |
50,000 |
| Kodiak Oil & Gas Corp. (a) |
| 607,000 |
| |
12,800 |
| Noble Energy Inc. |
| 909,312 |
| |
49,800 |
| Northern Oil and Gas Inc. (a) |
| 728,076 |
| |
10,000 |
| Oceaneering International Inc. |
| 718,600 |
| |
|
|
|
| 5,433,825 |
| |
Financials - 7.7% |
|
|
| |||
4,650 |
| Affiliated Managers Group Inc. (a) |
| 930,232 |
| |
10,000 |
| Credit Acceptance Corp. (a) |
| 1,421,500 |
| |
30,200 |
| Home Bancshares Inc. |
| 1,039,484 |
| |
21,700 |
| Portfolio Recovery Associates Inc. (a) |
| 1,255,562 |
| |
4,950 |
| Signature Bank (a) |
| 621,671 |
| |
15,000 |
| Stifel Financial Corp. (a) |
| 746,400 |
| |
10,000 |
| T. Rowe Price Group Inc. |
| 823,500 |
| |
|
|
|
| 6,838,349 |
| |
Health Care - 10.4% |
|
|
| |||
20,000 |
| Catamaran Corp. (a) |
| 895,200 |
| |
4,350 |
| Celgene Corp. (a) |
| 607,260 |
| |
10,000 |
| Centene Corp. (a) |
| 622,500 |
| |
12,700 |
| Cerner Corp. (a) |
| 714,375 |
| |
5,550 |
| Cooper Cos. Inc. |
| 762,348 |
| |
100,000 |
| PDL BioPharma Inc. |
| 831,000 |
| |
15,000 |
| PerkinElmer Inc. |
| 675,900 |
| |
15,400 |
| Questcor Pharmaceuticals Inc. |
| 999,922 |
| |
7,400 |
| Teleflex Inc. |
| 793,576 |
| |
6,000 |
| United Therapeutics Corp. (a) |
| 564,180 |
| |
8,000 |
| Valeant Pharmaceuticals International Inc. (a) |
| 1,054,640 |
| |
27,000 |
| Zoetis Inc. - Class A |
| 781,380 |
| |
|
|
|
| 9,302,281 |
| |
Industrials - 12.6% |
|
|
| |||
6,000 |
| Cummins Inc. |
| 893,940 |
| |
15,000 |
| Dover Corp. |
| 1,226,250 |
| |
6,700 |
| FedEx Corp. |
| 888,152 |
| |
14,850 |
| Fortune Brands Home & Security Inc. |
| 624,888 |
| |
8,000 |
| Genesee & Wyoming Inc. - Class A (a) |
| 778,560 |
| |
16,200 |
| Jacobs Engineering Group Inc. (a) |
| 1,028,700 |
| |
7,900 |
| Lincoln Electric Holdings Inc. |
| 568,879 |
| |
1,975 |
| Middleby Corp. (a) |
| 521,815 |
| |
6,600 |
| Pall Corp. |
| 590,502 |
| |
5,300 |
| Roper Industries Inc. |
| 707,603 |
| |
40,000 |
| Southwest Airlines Co. |
| 944,400 |
| |
5,100 |
| Union Pacific Corp. |
| 957,066 |
| |
10,000 |
| United Rentals Inc. (a) |
| 949,400 |
| |
15,000 |
| Woodward Inc. |
| 622,950 |
| |
|
|
|
| 11,303,105 |
| |
Information Technology - 9.4% |
|
|
| |||
13,000 |
| Adobe Systems Inc. (a) |
| 854,620 |
| |
11,400 |
| Akamai Technologies Inc. (a) |
| 663,594 |
| |
25,000 |
| Broadridge Financial Solutions Inc. |
| 928,500 |
| |
55,000 |
| Cadence Design Systems Inc. (a) |
| 854,700 |
| |
5,050 |
| Citrix Systems Inc. (a) |
| 290,021 |
| |
9,000 |
| Cognizant Technology Solutions Corp. - Class A (a) |
| 455,490 |
| |
3,600 |
| FactSet Research Systems Inc. |
| 388,116 |
| |
14,800 |
| Fiserv Inc. (a) |
| 839,012 |
| |
15,000 |
| IAC/InterActiveCorp. |
| 1,070,850 |
| |
10,000 |
| Jack Henry & Associates Inc. |
| 557,600 |
| |
3,750 |
| Knowles Corp. |
| 118,388 |
| |
39,400 |
| Mentor Graphics Corp. |
| 867,588 |
| |
8,500 |
| OSI Systems Inc. (a) |
| 508,810 |
| |
|
|
|
| 8,397,289 |
| |
Materials - 5.3% |
|
|
| |||
15,400 |
| Caesarstone Sdot-Yam Ltd. |
| 837,452 |
| |
10,000 |
| Eastman Chemical Co. |
| 862,100 |
| |
10,000 |
| FMC Corp. |
| 765,600 |
| |
28,000 |
| HB Fuller Co. |
| 1,351,840 |
| |
35,000 |
| PH Glatfelter Co. |
| 952,700 |
| |
|
|
|
| 4,769,692 |
| |
Total Common Stocks (cost $46,156,115) |
| 58,629,459 |
| |||
See accompanying Notes to Financial Statements.
Principal |
| Security |
| Value |
| ||
Corporate Bonds - 14.9% |
|
|
| ||||
Consumer Discretionary - 1.4% |
|
|
| ||||
$ | 500,000 |
| Comcast Corp., 5.70%, 05/15/18 |
| $ | 574,349 |
|
300,000 |
| McGraw-Hill Cos. Inc., 5.90%, 11/15/17 |
| 332,834 |
| ||
300,000 |
| Viacom Inc., 6.25%, 04/30/16 |
| 332,418 |
| ||
|
|
|
| 1,239,601 |
| ||
Consumer Staples - 1.0% |
|
|
| ||||
500,000 |
| Anheuser-Busch Cos. Inc., 5.00%, 03/01/19 |
| 557,546 |
| ||
300,000 |
| ConAgra Foods Inc., 7.00%, 04/15/19 |
| 358,690 |
| ||
|
|
|
| 916,236 |
| ||
Energy - 1.2% |
|
|
| ||||
300,000 |
| BP Capital Markets Plc, 3.63%, 05/08/14 |
| 300,956 |
| ||
200,000 |
| ONEOK Partners LP, 6.15%, 10/01/16 |
| 223,595 |
| ||
500,000 |
| Shell International Finance BV, 3.25%, 09/22/15 |
| 522,330 |
| ||
|
|
|
| 1,046,881 |
| ||
Financials - 5.4% |
|
|
| ||||
500,000 |
| American Express Co., 5.50%, 09/12/16 |
| 553,672 |
| ||
500,000 |
| Commonwealth Bank of Australia, 2.92%, 04/13/20 (b) (c) |
| 485,300 |
| ||
500,000 |
| General Electric Capital Corp., 5.63%, 09/15/17 |
| 567,401 |
| ||
500,000 |
| Health Care REIT Inc., 6.20%, 06/01/16 |
| 553,550 |
| ||
500,000 |
| JPMorgan Chase & Co., 6.40%, 10/02/17 |
| 577,186 |
| ||
500,000 |
| Morgan Stanley, 0.72%, 10/15/15 (b) |
| 500,237 |
| ||
250,000 |
| Regions Bank, 7.50%, 05/15/18 |
| 295,048 |
| ||
300,000 |
| Simon Property Group LP, 2.80%, 01/30/17 |
| 312,731 |
| ||
494,000 |
| Vornado Realty Trust, 4.25%, 04/01/15 |
| 507,115 |
| ||
500,000 |
| Wachovia Corp., 5.25%, 08/01/14 |
| 507,942 |
| ||
|
|
|
| 4,860,182 |
| ||
Health Care - 1.2% |
|
|
| ||||
500,000 |
| Novartis Securities Investment Ltd., 5.13%, 02/10/19 |
| 567,817 |
| ||
500,000 |
| Teva Pharmaceutical Finance II BV, 3.00%, 06/15/15 |
| 513,678 |
| ||
|
|
|
| 1,081,495 |
| ||
Industrials - 1.6% |
|
|
| ||||
400,000 |
| Caterpillar Inc., 7.90%, 12/15/18 |
| 499,736 |
| ||
500,000 |
| Harley-Davidson Funding Corp., 6.80%, 06/15/18 (d) |
| 585,737 |
| ||
300,000 |
| Honeywell International Inc., 5.30%, 03/01/18 |
| 341,000 |
| ||
|
|
|
| 1,426,473 |
| ||
Telecommunication Services - 1.0% |
|
|
| ||||
500,000 |
| AT&T Inc., 4.45%, 05/15/21 |
| 540,389 |
| ||
300,000 |
| Verizon Communications Inc., 4.90%, 09/15/15 |
| 318,072 |
| ||
|
|
|
| 858,461 |
| ||
Utilities - 2.1% |
|
|
| ||||
400,000 |
| Commonwealth Edison Co., 4.00%, 08/01/20 |
| 427,048 |
| ||
400,000 |
| Consolidated Edison Co. of New York Inc., 5.30%, 12/01/16 |
| 442,937 |
| ||
450,000 |
| Exelon Generation Co. LLC, 5.20%, 10/01/19 |
| 492,054 |
| ||
500,000 |
| Sempra Energy, 6.50%, 06/01/16 |
| 556,628 |
| ||
|
|
|
| 1,918,667 |
| ||
Total Corporate Bonds (cost $12,961,816) |
| 13,347,996 |
| ||||
Government and Agency Obligations - 10.6% |
|
|
| ||||
GOVERNMENT SECURITIES - 10.3% |
|
|
| ||||
Municipals - 3.9% |
|
|
| ||||
350,000 |
| California State University, RB, 5.45%, 11/01/22 |
| 382,697 |
| ||
250,000 |
| City of Aurora, Illinois, GO, Series A, 4.25%, 12/30/17 |
| 271,023 |
| ||
250,000 |
| City of Industry, California, RB, 7.00%, 01/01/21 |
| 289,218 |
| ||
150,000 |
| County of St. Charles, Missouri, RB, 5.16%, 10/01/20 |
| 167,133 |
| ||
190,000 |
| Denver City & County Board of Water Commission, RB, Series A, 5.00%, 12/15/19 |
| 217,527 |
| ||
100,000 |
| Denver Regional Transportation District, RB, 2.21%, 11/01/21 |
| 93,510 |
| ||
195,000 |
| Kansas Development Finance Authority, RB, Series N, 5.20%, 11/01/19 |
| 221,972 |
| ||
300,000 |
| Metro Wastewater Reclamation District, Sewer Revenue, Series B, 5.02%, 04/01/20 |
| 332,616 |
| ||
205,000 |
| Northern Illinois Municipal Power Agency, Power Project Revenue, 5.69%, 01/01/17 |
| 220,976 |
| ||
200,000 |
| Reeves County, Texas, Correctional Facilities, 7.40%, 12/01/17 |
| 211,968 |
| ||
200,000 |
| Santa Monica Community College District, Series A, 5.73%, 08/01/24 |
| 220,174 |
| ||
100,000 |
| State of Florida Lottery, RB, 5.19%, 07/01/19 |
| 112,209 |
| ||
265,000 |
| Town of Hamden, Connecticut, GO, Series B, 5.38%, 08/15/22 |
| 294,195 |
| ||
200,000 |
| Town of Parker, Colorado, Series A, 5.30%, 11/01/18 |
| 218,282 |
| ||
See accompanying Notes to Financial Statements.
Shares or |
| Security |
| Value |
| ||
$ | 155,000 |
| Upper St. Clair Township School District, 2.86%, 07/15/21 |
| $ | 147,388 |
|
100,000 |
| Vista Community Development Commission California, 7.61%, 09/01/21 |
| 110,681 |
| ||
|
|
|
| 3,511,569 |
| ||
Treasury Inflation Index Securities - 0.7% |
|
|
| ||||
281,245 |
| U.S. Treasury Inflation Indexed Note, 1.38%, 01/15/20 (e) |
| 303,986 |
| ||
248,190 |
| U.S. Treasury Inflation Indexed Note, 2.38%, 01/15/25 (e) |
| 292,224 |
| ||
|
|
|
| 596,210 |
| ||
U.S. Treasury Securities - 5.7% |
|
|
| ||||
2,725,000 |
| U.S. Treasury Bond, 9.25%, 02/15/16 |
| 3,174,731 |
| ||
1,875,000 |
| U.S. Treasury Note, 1.75%, 05/31/16 |
| 1,924,952 |
| ||
|
|
|
| 5,099,683 |
| ||
U.S. GOVERNMENT MORTGAGE-BACKED SECURITIES - 0.3% |
|
|
| ||||
Federal National Mortgage Association - 0.3% |
|
|
| ||||
230,372 |
| Federal National Mortgage Association, 3.50%, 12/01/26 |
| 241,598 |
| ||
Total Government and Agency Obligations (cost $9,147,983) |
| 9,449,060 |
| ||||
Short Term Investments - 8.4% |
|
|
| ||||
Investment Company - 8.4% |
|
|
| ||||
7,563,230 |
| Goldman Sachs Financial Square Funds, Treasury Obligations Fund, 0.01% (f) |
| 7,563,230 |
| ||
Total Short Term Investments (cost $7,563,230) |
| 7,563,230 |
| ||||
Total Investments - 99.4% (cost $75,829,144) |
| 88,989,745 |
| ||||
Other assets in excess of liabilities - 0.6% |
| 526,028 |
| ||||
NET ASSETS - 100% |
| $ | 89,515,773 |
| |||
(a) |
| Non-income producing security. |
|
(b) |
| Variable rate security. The rate reflected is the rate in effect at March 31, 2014. |
|
(c) |
| Rule 144A of the Securities Act of 1933 security which is restricted to resale to institutional investors. The Fund’s investment adviser has not deemed this security to be liquid based on procedures approved by Tributary Funds’ Board of Directors. See Restricted Securities in the Notes to Financial Statements. |
|
(d) |
| Rule 144A of the Securities Act of 1933 security which is restricted to resale to institutional investors. The Fund’s investment adviser has deemed this security to be liquid based on procedures approved by Tributary Funds’ Board of Directors. |
|
(e) |
| U.S. Treasury inflation indexed note, par amount is adjusted for inflation. |
|
(f) |
| Dividend yield changes daily to reflect current market conditions. Rate was the quoted yield as of March 31, 2014. |
|
|
|
|
|
GO |
| General Obligation |
|
RB |
| Revenue Bond |
|
See accompanying Notes to Financial Statements.
SCHEDULES OF PORTFOLIO INVESTMENTS
March 31, 2014
GROWTH OPPORTUNITIES FUND
Shares |
| Security |
| Value |
| |
Common Stocks - 96.7% |
|
|
| |||
Consumer Discretionary - 16.3% |
|
|
| |||
2,804 |
| AutoZone Inc. (a) |
| $ | 1,506,028 |
|
23,841 |
| Bally Technologies Inc. (a) |
| 1,579,943 |
| |
45,894 |
| BorgWarner Inc. |
| 2,821,104 |
| |
41,722 |
| Cabela’s Inc. (a) |
| 2,733,208 |
| |
29,801 |
| Discovery Communications Inc. — Class C (a) |
| 2,296,465 |
| |
19,819 |
| Foot Locker Inc. |
| 931,097 |
| |
16,926 |
| HanesBrands Inc. |
| 1,294,501 |
| |
12,914 |
| Polaris Industries Inc. |
| 1,804,215 |
| |
99,337 |
| PulteGroup Inc. |
| 1,906,277 |
| |
301,488 |
| Standard Pacific Corp. (a) |
| 2,505,365 |
| |
42,000 |
| Sturm Ruger & Co. Inc. |
| 2,511,600 |
| |
59,602 |
| Tenneco Inc. (a) |
| 3,461,088 |
| |
11,920 |
| Ulta Salon Cosmetics & Fragrance Inc. (a) |
| 1,161,962 |
| |
10,232 |
| Wynn Resorts Ltd. |
| 2,273,039 |
| |
|
|
|
| 28,785,892 |
| |
Consumer Staples - 5.6% |
|
|
| |||
10,000 |
| Church & Dwight Co. Inc. |
| 690,700 |
| |
51,682 |
| Herbalife Ltd. |
| 2,959,828 |
| |
14,600 |
| Keurig Green Mountain Inc. |
| 1,541,614 |
| |
22,251 |
| PriceSmart Inc. |
| 2,245,793 |
| |
57,019 |
| Snyders-Lance Inc. |
| 1,607,366 |
| |
29,000 |
| WhiteWave Foods Co. - Class A (a) |
| 827,660 |
| |
|
|
|
| 9,872,961 |
| |
Energy - 7.6% |
|
|
| |||
16,000 |
| Bristow Group Inc. |
| 1,208,320 |
| |
25,033 |
| Concho Resources Inc. (a) |
| 3,066,542 |
| |
231,356 |
| Kodiak Oil & Gas Corp. (a) |
| 2,808,662 |
| |
35,761 |
| Noble Energy Inc. |
| 2,540,461 |
| |
131,125 |
| Northern Oil and Gas Inc. (a) |
| 1,917,048 |
| |
25,000 |
| Oceaneering International Inc. |
| 1,796,500 |
| |
|
|
|
| 13,337,533 |
| |
Financials - 9.6% |
|
|
| |||
13,410 |
| Affiliated Managers Group Inc. (a) |
| 2,682,670 |
| |
20,998 |
| Credit Acceptance Corp. (a) |
| 2,984,866 |
| |
49,668 |
| Home Bancshares Inc. |
| 1,709,573 |
| |
59,602 |
| Portfolio Recovery Associates Inc. (a) |
| 3,448,572 |
| |
12,914 |
| Signature Bank (a) |
| 1,621,869 |
| |
57,748 |
| Stifel Financial Corp. (a) |
| 2,873,540 |
| |
20,000 |
| T. Rowe Price Group Inc. |
| 1,647,000 |
| |
|
|
|
| 16,968,090 |
| |
Health Care - 13.6% |
|
|
| |||
68,455 |
| Catamaran Corp. (a) |
| 3,064,046 |
| |
21,500 |
| Centene Corp. (a) |
| 1,338,375 |
| |
41,324 |
| Cerner Corp. (a) |
| 2,324,475 |
| |
18,000 |
| Cooper Cos. Inc. |
| 2,472,480 |
| |
273,177 |
| PDL BioPharma Inc. |
| 2,270,101 |
| |
30,500 |
| PerkinElmer Inc. |
|
| 1,374,330 |
|
50,000 |
| Questcor Pharmaceuticals Inc. |
| 3,246,500 |
| |
23,841 |
| Teleflex Inc. |
| 2,556,709 |
| |
31,291 |
| United Therapeutics Corp. (a) |
| 2,942,292 |
| |
80,000 |
| Zoetis Inc. - Class A |
| 2,315,200 |
| |
|
|
|
| 23,904,508 |
| |
Industrials - 18.0% |
|
|
| |||
18,500 |
| Cummins Inc. |
| 2,756,315 |
| |
32,494 |
| Dover Corp. |
| 2,656,384 |
| |
40,800 |
| Fortune Brands Home & Security Inc. |
| 1,716,864 |
| |
19,867 |
| Genesee & Wyoming Inc. - Class A (a) |
| 1,933,456 |
| |
43,708 |
| HUB Group Inc. - Class A (a) |
| 1,747,883 |
| |
33,000 |
| Jacobs Engineering Group Inc. (a) |
| 2,095,500 |
| |
32,682 |
| Lincoln Electric Holdings Inc. |
| 2,353,431 |
| |
10,689 |
| Middleby Corp. (a) |
| 2,824,141 |
| |
30,794 |
| Pall Corp. |
| 2,755,139 |
| |
12,616 |
| Roper Industries Inc. |
| 1,684,362 |
| |
147,377 |
| Southwest Airlines Co. |
| 3,479,571 |
| |
23,841 |
| Triumph Group Inc. |
| 1,539,652 |
| |
20,000 |
| United Rentals Inc. (a) |
| 1,898,800 |
| |
56,622 |
| Woodward Inc. |
| 2,351,512 |
| |
|
|
|
| 31,793,010 |
| |
Information Technology - 17.7% |
|
|
| |||
52,649 |
| Adobe Systems Inc. (a) |
| 3,461,145 |
| |
29,801 |
| Akamai Technologies Inc. (a) |
| 1,734,716 |
| |
78,843 |
| Broadridge Financial Solutions Inc. |
| 2,928,229 |
| |
160,330 |
| Cadence Design Systems Inc. (a) |
| 2,491,528 |
| |
19,867 |
| Citrix Systems Inc. (a) |
| 1,140,962 |
| |
85,430 |
| Cognizant Technology Solutions Corp. - Class A (a) |
| 4,323,612 |
| |
9,934 |
| FactSet Research Systems Inc. |
| 1,070,985 |
| |
56,622 |
| Fiserv Inc. (a) |
| 3,209,901 |
| |
50,620 |
| IAC/InterActiveCorp. |
| 3,613,762 |
| |
27,417 |
| Jack Henry & Associates Inc. |
| 1,528,772 |
| |
15,397 |
| Knowles Corp. |
| 486,083 |
| |
99,337 |
| Mentor Graphics Corp. |
| 2,187,401 |
| |
46,662 |
| NeuStar Inc. - Class A (a) |
| 1,516,982 |
| |
26,821 |
| OSI Systems Inc. (a) |
| 1,605,505 |
| |
|
|
|
| 31,299,583 |
| |
Materials - 8.3% |
|
|
| |||
42,000 |
| Caesarstone Sdot-Yam Ltd. |
| 2,283,960 |
| |
30,794 |
| Eastman Chemical Co. |
| 2,654,751 |
| |
31,788 |
| FMC Corp. |
| 2,433,689 |
| |
75,496 |
| HB Fuller Co. |
| 3,644,947 |
| |
100,000 |
| PH Glatfelter Co. |
| 2,722,000 |
| |
9,934 |
| Sigma-Aldrich Corp. |
| 927,637 |
| |
|
|
|
| 14,666,984 |
| |
Total Common Stocks (cost $110,374,642) |
| 170,628,561 |
| |||
See accompanying Notes to Financial Statements.
Shares |
| Security |
| Value |
| |
Short Term Investments - 3.0% |
|
|
| |||
Investment Company - 3.0% |
|
|
| |||
5,327,268 |
| Goldman Sachs Financial Square Funds, Treasury Obligations Fund, 0.01% (b) |
| $ | 5,327,268 |
|
Total Short Term Investments (cost $5,327,268) |
| 5,327,268 |
| |||
Total Investments - 99.7% (cost $115,701,910) |
| 175,955,829 |
| |||
Other assets in excess of liabilities - 0.3% |
| 512,364 |
| |||
NET ASSETS - 100% |
| $ | 176,468,193 |
| ||
(a) |
| Non-income producing security. |
(b) |
| Dividend yield changes daily to reflect current market conditions. Rate was the quoted yield as of March 31, 2014. |
See accompanying Notes to Financial Statements.
SCHEDULES OF PORTFOLIO INVESTMENTS
March 31, 2014
SMALL COMPANY FUND
Shares |
| Security |
| Value |
| |
Common Stocks - 96.8% |
|
|
| |||
Consumer Discretionary - 13.3% |
|
|
| |||
134,800 |
| Ann Inc. (a) |
| $ | 5,591,504 |
|
65,500 |
| Buckle Inc. |
| 2,999,900 |
| |
296,400 |
| Callaway Golf Co. |
| 3,029,208 |
| |
96,900 |
| Iconix Brand Group Inc. (a) |
| 3,805,263 |
| |
54,300 |
| International Speedway Corp. - Class A |
| 1,845,657 |
| |
66,100 |
| Jack in the Box Inc. (a) |
| 3,895,934 |
| |
69,900 |
| Steiner Leisure Ltd. (a) |
| 3,232,875 |
| |
64,100 |
| Vitamin Shoppe Inc. (a) |
| 3,046,032 |
| |
|
|
|
| 27,446,373 |
| |
Consumer Staples - 3.2% |
|
|
| |||
65,000 |
| Calavo Growers Inc. |
| 2,312,700 |
| |
21,000 |
| Lancaster Colony Corp. |
| 2,087,820 |
| |
27,600 |
| WD-40 Co. |
| 2,140,932 |
| |
|
|
|
| 6,541,452 |
| |
Energy - 6.6% |
|
|
| |||
49,400 |
| Dresser-Rand Group Inc. (a) |
| 2,885,454 |
| |
75,900 |
| Matrix Service Co. (a) |
| 2,563,902 |
| |
50,000 |
| PDC Energy Inc. (a) |
| 3,113,000 |
| |
23,700 |
| SM Energy Co. |
| 1,689,573 |
| |
69,400 |
| Tidewater Inc. |
| 3,374,228 |
| |
|
|
|
| 13,626,157 |
| |
Financials - 21.0% |
|
|
| |||
233,700 |
| Cardinal Financial Corp. |
| 4,166,871 |
| |
40,700 |
| Cullen/Frost Bankers Inc. |
| 3,155,471 |
| |
35,400 |
| Home Properties Inc. |
| 2,128,248 |
| |
30,300 |
| Jones Lang LaSalle Inc. |
| 3,590,550 |
| |
93,400 |
| LTC Properties Inc. |
| 3,514,642 |
| |
92,600 |
| Mack-Cali Realty Corp. |
| 1,925,154 |
| |
115,200 |
| MB Financial Inc. |
| 3,566,592 |
| |
213,600 |
| Old National Bancorp |
| 3,184,776 |
| |
129,900 |
| Selective Insurance Group |
| 3,029,268 |
| |
110,900 |
| Southside Bancshares Inc. |
| 3,480,042 |
| |
60,900 |
| Stifel Financial Corp. (a) |
| 3,030,384 |
| |
53,800 |
| UMB Financial Corp. |
| 3,480,860 |
| |
102,100 |
| United Bankshares Inc. |
| 3,126,302 |
| |
10,900 |
| Virtus Investment Partners Inc. (a) |
| 1,887,553 |
| |
|
|
|
| 43,266,713 |
| |
Health Care - 9.4% |
|
|
| |||
179,600 |
| AMN Healthcare Services Inc. (a) |
| 2,467,704 |
| |
81,800 |
| CONMED Corp. |
| 3,554,210 |
| |
49,100 |
| Greatbatch Inc. (a) |
| 2,254,672 |
| |
102,000 |
| Team Health Holdings Inc. (a) |
| 4,564,500 |
| |
101,800 |
| VCA Antech Inc. (a) |
| 3,281,014 |
| |
74,700 |
| West Pharmaceutical Services Inc. |
| 3,290,535 |
| |
|
|
|
| 19,412,635 |
| |
Industrials - 15.7% |
|
|
| |||
98,600 |
| Actuant Corp. - Class A |
| 3,367,190 |
| |
112,700 |
| Barnes Group Inc. |
| 4,335,569 |
| |
40,200 |
| Carlisle Cos. Inc. |
| 3,189,468 |
| |
54,400 |
| CLARCOR Inc. |
| 3,119,840 |
| |
66,600 |
| Forward Air Corp. |
| 3,070,926 |
| |
84,100 |
| Granite Construction Inc. |
| 3,358,113 |
| |
232,963 |
| Navigant Consulting Inc. (a) |
| 4,347,090 |
| |
177,500 |
| Tetra Tech Inc. (a) |
| 5,252,225 |
| |
96,400 |
| Werner Enterprises Inc. |
| 2,459,164 |
| |
|
|
|
| 32,499,585 |
| |
Information Technology - 19.3% |
|
|
| |||
39,100 |
| Anixter International Inc. |
| 3,969,432 |
| |
31,900 |
| CACI International Inc. - Class A (a) |
| 2,354,220 |
| |
43,100 |
| Littelfuse Inc. |
| 4,035,884 |
| |
277,700 |
| Micrel Inc. |
| 3,076,916 |
| |
117,700 |
| Microsemi Corp. (a) |
| 2,946,031 |
| |
45,600 |
| MTS Systems Corp. |
| 3,123,144 |
| |
73,400 |
| National Instruments Corp. |
| 2,105,846 |
| |
62,000 |
| NetGear Inc. (a) |
| 2,091,260 |
| |
66,300 |
| NetScout Systems Inc. (a) |
| 2,491,554 |
| |
100,600 |
| Park Electrochemical Corp. |
| 3,004,922 |
| |
114,600 |
| PTC INC (a) |
| 4,060,278 |
| |
27,200 |
| Syntel Inc. (a) |
| 2,445,280 |
| |
59,600 |
| Zebra Technologies Corp. - Class A (a) |
| 4,136,836 |
| |
|
|
|
| 39,841,603 |
| |
Materials - 4.6% |
|
|
| |||
48,700 |
| Carpenter Technology Corp. |
| 3,216,148 |
| |
65,800 |
| Materion Corp. |
| 2,232,594 |
| |
71,200 |
| Sensient Technologies Corp. |
| 4,016,392 |
| |
|
|
|
| 9,465,134 |
| |
Utilities - 3.7% |
|
|
| |||
60,400 |
| IDACORP Inc. |
| 3,350,388 |
| |
121,100 |
| Westar Energy Inc. |
| 4,257,876 |
| |
|
|
|
| 7,608,264 |
| |
Total Common Stocks (cost $134,039,499) |
| 199,707,916 |
| |||
Short Term Investments - 3.2% |
|
|
| |||
Investment Company - 3.2% |
|
|
| |||
6,606,596 |
| Goldman Sachs Financial Square Funds, Treasury Obligations Fund, 0.01% (b) |
| 6,606,596 |
| |
Total Short Term Investments (cost $6,606,596) |
| 6,606,596 |
| |||
Total Investments - 100.0% (cost $140,646,095) |
| 206,314,512 |
| |||
Other assets in excess of liabilities - 0.0% |
| 21,840 |
| |||
NET ASSETS - 100% |
| $ | 206,336,352 |
| ||
(a) |
| Non-income producing security. |
(b) |
| Dividend yield changes daily to reflect current market conditions. Rate was the quoted yield as of March 31, 2014. |
See accompanying Notes to Financial Statements.
STATEMENTS OF ASSETS AND LIABILITIES
March 31, 2014
|
| SHORT- |
| INCOME FUND |
| ||
Assets: |
|
|
|
|
| ||
Investments, at cost |
| $ | 106,037,683 |
| $ | 103,346,727 |
|
Unrealized appreciation of investments |
| 768,149 |
| 985,168 |
| ||
Total investments, at value |
| 106,805,832 |
| 104,331,895 |
| ||
Cash |
| — |
| 18,925 |
| ||
Interest and dividends receivable |
| 379,464 |
| 593,087 |
| ||
Receivable for capital shares issued |
| 359,109 |
| 304,531 |
| ||
Receivable for investments sold |
| — |
| — |
| ||
Prepaid expenses |
| 21,436 |
| 18,695 |
| ||
Other receivable |
| 743 |
| — |
| ||
Total Assets |
| 107,566,584 |
| 105,267,133 |
| ||
Liabilities: |
|
|
|
|
| ||
Distributions payable |
| 104,642 |
| 171,547 |
| ||
Payable for investments purchased |
| 105,744 |
| 1,416,116 |
| ||
Payable for capital shares redeemed |
| 9,487 |
| 10,503 |
| ||
Accrued expenses and other payables: |
|
|
|
|
| ||
Investment advisory fees |
| 25,262 |
| 28,584 |
| ||
Administration fees payable to non-related parties |
| 7,936 |
| 7,747 |
| ||
Administration fees payable to related parties |
| 6,316 |
| 6,063 |
| ||
Shareholder service fees - Institutional Class |
| 3,740 |
| 2,706 |
| ||
Other fees |
| 31,840 |
| 29,330 |
| ||
Total liabilities |
| 294,967 |
| 1,672,596 |
| ||
Net assets |
| $ | 107,271,617 |
| $ | 103,594,537 |
|
Composition of Net Assets: |
|
|
|
|
| ||
Capital |
| $ | 109,922,705 |
| $ | 102,609,499 |
|
Accumulated (excess of distributions over) net investment income (loss) |
| (105,782 | ) | 238,651 |
| ||
Accumulated net realized gain (loss) from investments |
| (3,313,455 | ) | (238,781 | ) | ||
Net unrealized appreciation on investments |
| 768,149 |
| 985,168 |
| ||
Net Assets |
| $ | 107,271,617 |
| $ | 103,594,537 |
|
Institutional Class: |
|
|
|
|
| ||
Net assets |
| $ | 13,122,592 |
| $ | 10,784,373 |
|
Shares of beneficial interest |
| 1,383,779 |
| 1,052,184 |
| ||
Net asset value, offering and redemption price per share |
| $ | 9.48 |
| $ | 10.25 |
|
Institutional Plus Class: |
|
|
|
|
| ||
Net assets |
| $ | 94,149,025 |
| $ | 92,810,164 |
|
Shares of beneficial interest |
| 9,897,015 |
| 9,047,044 |
| ||
Net asset value, offering and redemption price per share |
| $ | 9.51 |
| $ | 10.26 |
|
See accompanying Notes to Financial Statements.
BALANCED FUND |
| GROWTH |
| SMALL COMPANY |
| |||
|
|
|
|
|
| |||
$ | 75,829,144 |
| $ | 115,701,910 |
| $ | 140,646,095 |
|
13,160,601 |
| 60,253,919 |
| 65,668,417 |
| |||
88,989,745 |
| 175,955,829 |
| 206,314,512 |
| |||
— |
| — |
| — |
| |||
294,022 |
| 38,473 |
| 114,489 |
| |||
93,915 |
| 293,236 |
| 176,675 |
| |||
314,575 |
| 2,925,099 |
| 491,357 |
| |||
13,426 |
| 14,352 |
| 17,985 |
| |||
— |
| — |
| — |
| |||
89,705,683 |
| 179,226,989 |
| 207,115,018 |
| |||
|
|
|
|
|
| |||
— |
| — |
| — |
| |||
— |
| 2,547,998 |
| — |
| |||
81,887 |
| 23,485 |
| 564,199 |
| |||
|
|
|
|
|
| |||
47,024 |
| 94,995 |
| 125,501 |
| |||
6,165 |
| 11,669 |
| 13,489 |
| |||
5,267 |
| 10,555 |
| 12,201 |
| |||
21,161 |
| 25,180 |
| 16,220 |
| |||
28,406 |
| 44,914 |
| 47,056 |
| |||
189,910 |
| 2,758,796 |
| 778,666 |
| |||
$ | 89,515,773 |
| $ | 176,468,193 |
| $ | 206,336,352 |
|
|
|
|
|
|
| |||
$ | 68,668,652 |
| $ | 108,059,173 |
| $ | 131,419,901 |
|
— |
| — |
| 345,266 |
| |||
7,686,520 |
| 8,155,101 |
| 8,902,768 |
| |||
13,160,601 |
| 60,253,919 |
| 65,668,417 |
| |||
$ | 89,515,773 |
| $ | 176,468,193 |
| $ | 206,336,352 |
|
|
|
|
|
|
| |||
$ | 69,070,113 |
| $ | 59,248,798 |
| $ | 42,855,211 |
|
3,923,286 |
| 3,092,472 |
| 1,756,782 |
| |||
$ | 17.61 |
| $ | 19.16 |
| $ | 24.39 |
|
|
|
|
|
|
| |||
$ | 20,445,660 |
| $ | 117,219,395 |
| $ | 163,481,141 |
|
1,167,157 |
| 6,083,782 |
| 6,692,229 |
| |||
$ | 17.52 |
| $ | 19.27 |
| $ | 24.43 |
|
See accompanying Notes to Financial Statements.
STATEMENTS OF OPERATIONS
For the Year Ended March 31, 2014
|
| SHORT- |
| INCOME FUND |
| ||
Investment Income: |
|
|
|
|
| ||
Interest |
| $ | 2,152,662 |
| $ | 2,817,733 |
|
Dividend |
| 19,675 |
| 135,440 |
| ||
Foreign tax withholding |
| — |
| — |
| ||
Total Income |
| 2,172,337 |
| 2,953,173 |
| ||
Expenses: |
|
|
|
|
| ||
Investment advisory fees |
| 456,707 |
| 500,740 |
| ||
Administration fees |
| 145,981 |
| 135,276 |
| ||
Shareholder service fees - Institutional Class |
| 42,534 |
| 32,892 |
| ||
Custodian fees |
| 6,115 |
| 6,250 |
| ||
Chief compliance officer fees |
| 12,855 |
| 11,660 |
| ||
Director fees |
| 4,017 |
| 3,680 |
| ||
Transfer agent fees |
| 38,161 |
| 34,708 |
| ||
Registration and filing fees |
| 25,257 |
| 27,558 |
| ||
Other fees |
| 37,071 |
| 33,240 |
| ||
Total expenses before waivers |
| 768,698 |
| 786,004 |
| ||
Expenses waived by Adviser |
| (200,951 | ) | (225,334 | ) | ||
Total Expenses |
| 567,747 |
| 560,670 |
| ||
Net Investment Income (Loss) |
| 1,604,590 |
| 2,392,503 |
| ||
Realized and Unrealized Gain (Loss) On Investments: |
|
|
|
|
| ||
Net realized gain (loss) on investment transactions (a) |
| 26,041 |
| (17,025 | ) | ||
Change in unrealized appreciation (depreciation) on investments |
| (857,570 | ) | (1,749,029 | ) | ||
Net realized and unrealized gain (loss) on investments |
| (831,529 | ) | (1,766,054 | ) | ||
Net increase in net assets from operations |
| $ | 773,061 |
| $ | 626,449 |
|
(a) For the Growth Opportunities Fund, the amount includes $473,165 net realized gain from a redemption-in-kind.
See accompanying Notes to Financial Statements.
BALANCED FUND |
| GROWTH |
| SMALL COMPANY |
| |||
|
|
|
|
|
| |||
$ | 607,473 |
| $ | — |
| $ | — |
|
689,285 |
| 1,272,106 |
| 2,491,278 |
| |||
(1,805 | ) | (7,746 | ) | — |
| |||
1,294,953 |
| 1,264,360 |
| 2,491,278 |
| |||
|
|
|
|
|
| |||
575,480 |
| 1,181,393 |
| 1,570,846 |
| |||
116,882 |
| 229,144 |
| 268,711 |
| |||
125,015 |
| 126,915 |
| 113,752 |
| |||
5,571 |
| 5,873 |
| 5,495 |
| |||
10,776 |
| 22,189 |
| 25,918 |
| |||
3,382 |
| 6,925 |
| 8,195 |
| |||
54,525 |
| 54,823 |
| 54,022 |
| |||
25,426 |
| 29,518 |
| 25,511 |
| |||
38,934 |
| 60,086 |
| 63,974 |
| |||
955,991 |
| 1,716,866 |
| 2,136,424 |
| |||
(95,915 | ) | (189,025 | ) | (240,244 | ) | |||
860,076 |
| 1,527,841 |
| 1,896,180 |
| |||
434,877 |
| (263,481 | ) | 595,098 |
| |||
|
|
|
|
|
| |||
12,082,625 |
| 19,503,536 |
| 11,527,628 |
| |||
(910,935 | ) | 14,782,333 |
| 28,721,899 |
| |||
11,171,690 |
| 34,285,869 |
| 40,249,527 |
| |||
$ | 11,606,567 |
| $ | 34,022,388 |
| $ | 40,844,625 |
|
See accompanying Notes to Financial Statements.
STATEMENTS OF CHANGES IN NET ASSETS
|
| SHORT-INTERMEDIATE BOND |
| INCOME FUND |
| ||||||||
|
| For the Year |
| For the Year |
| For the Year |
| For the Year |
| ||||
Operations: |
|
|
|
|
|
|
|
|
| ||||
Net investment income (loss) |
| $ | 1,604,590 |
| $ | 1,623,751 |
| $ | 2,392,503 |
| $ | 2,133,674 |
|
Net realized gain (loss) on investment transactions |
| 26,041 |
| 411,324 |
| (17,025 | ) | 1,093,966 |
| ||||
Change in unrealized appreciation (depreciation) on investments |
| (857,570 | ) | 547,176 |
| (1,749,029 | ) | 489,886 |
| ||||
Net increase in net assets from operations |
| 773,061 |
| 2,582,251 |
| 626,449 |
| 3,717,526 |
| ||||
Distributions to Shareholders: |
|
|
|
|
|
|
|
|
| ||||
From net investment income |
|
|
|
|
|
|
|
|
| ||||
Institutional Class |
| (298,174 | ) | (1,213,176 | ) | (490,002 | ) | (1,686,448 | ) | ||||
Institutional Plus Class |
| (1,278,083 | ) | (471,591 | ) | (1,907,202 | ) | (443,173 | ) | ||||
From net realized gains on investments |
|
|
|
|
|
|
|
|
| ||||
Institutional Class |
| (4,943 | ) | (31,965 | ) | — |
| — |
| ||||
Institutional Plus Class |
| (33,677 | ) | (12,507 | ) | — |
| — |
| ||||
Change in net assets from distributions to shareholders |
| (1,614,877 | ) | (1,729,239 | ) | (2,397,204 | ) | (2,129,621 | ) | ||||
Capital Transactions: |
|
|
|
|
|
|
|
|
| ||||
Proceeds from shares issued |
|
|
|
|
|
|
|
|
| ||||
Institutional Class |
| 11,256,485 |
| 9,394,778 |
| 5,776,478 |
| 10,890,154 |
| ||||
Institutional Plus Class |
| 82,266,049 |
| 16,521,355 |
| 88,730,241 |
| 14,212,123 |
| ||||
Proceeds from dividends reinvested |
|
|
|
|
|
|
|
|
| ||||
Institutional Class |
| 159,741 |
| 177,432 |
| 248,675 |
| 210,664 |
| ||||
Institutional Plus Class |
| 344,164 |
| 467,274 |
| 450,640 |
| 423,417 |
| ||||
Cost of shares redeemed |
|
|
|
|
|
|
|
|
| ||||
Institutional Class |
| (46,559,183 | ) | (11,517,411 | ) | (49,510,273 | ) | (12,066,877 | ) | ||||
Institutional Plus Class (a) |
| (18,238,002 | ) | (2,796,544 | ) | (20,319,770 | ) | (1,601,929 | ) | ||||
Change in net assets from capital transactions |
| 29,229,254 |
| 12,246,884 |
| 25,375,991 |
| 12,067,552 |
| ||||
Change in net assets |
| 28,387,438 |
| 13,099,896 |
| 23,605,236 |
| 13,655,457 |
| ||||
Net Assets: |
|
|
|
|
|
|
|
|
| ||||
Beginning of year |
| 78,884,179 |
| 65,784,283 |
| 79,989,301 |
| 66,333,844 |
| ||||
End of year |
| $ | 107,271,617 |
| $ | 78,884,179 |
| $ | 103,594,537 |
| $ | 79,989,301 |
|
Accumulated (excess of distributions over) net investment income (loss) |
| $ | (105,782 | ) | $ | (78,664 | ) | $ | 238,651 |
| $ | 320,177 |
|
Share Transactions Institutional Class: |
|
|
|
|
|
|
|
|
| ||||
Shares issued |
| 1,183,318 |
| 982,936 |
| 560,878 |
| 1,042,006 |
| ||||
Shares reinvested |
| 16,827 |
| 18,591 |
| 24,304 |
| 20,155 |
| ||||
Shares redeemed |
| (4,872,773 | ) | (1,204,694 | ) | (4,758,790 | ) | (1,153,860 | ) | ||||
Change in shares |
| (3,672,628 | ) | (203,167 | ) | (4,173,608 | ) | (91,699 | ) | ||||
Share Transactions Institutional Plus Class: |
|
|
|
|
|
|
|
|
| ||||
Shares issued |
| 8,620,068 |
| 1,721,166 |
| 8,582,860 |
| 1,357,896 |
| ||||
Shares reinvested |
| 36,141 |
| 48,880 |
| 43,963 |
| 40,461 |
| ||||
Shares redeemed |
| (1,916,795 | ) | (292,302 | ) | (1,990,672 | ) | (153,204 | ) | ||||
Change in shares |
| 6,739,414 |
| 1,477,744 |
| 6,636,151 |
| 1,245,153 |
| ||||
(a) For the Growth Opportunities Fund, the amount includes $1,092,420 from a redemption-in-kind for the year ended March 31, 2014.
See accompanying notes to financial statements.
BALANCED FUND |
| GROWTH OPPORTUNITIES FUND |
| SMALL COMPANY FUND |
| ||||||||||||
For the Year |
| For the Year |
| For the Year |
| For the Year |
| For the Year |
| For the Year |
| ||||||
|
|
|
|
|
|
|
|
|
|
|
| ||||||
$ | 434,877 |
| $ | 668,205 |
| $ | (263,481 | ) | $ | (280,044 | ) | $ | 595,098 |
| $ | 1,625,974 |
|
12,082,625 |
| 1,535,060 |
| 19,503,536 |
| 3,028,545 |
| 11,527,628 |
| 4,549,876 |
| ||||||
|
|
|
|
|
|
|
|
|
|
|
| ||||||
(910,935 | ) | 1,897,771 |
| 14,782,333 |
| 8,662,913 |
| 28,721,899 |
| 9,613,635 |
| ||||||
11,606,567 |
| 4,101,036 |
| 34,022,388 |
| 11,411,414 |
| 40,844,625 |
| 15,789,485 |
| ||||||
|
|
|
|
|
|
|
|
|
|
|
| ||||||
(354,251 | ) | (485,126 | ) | — |
| — |
| (201,831 | ) | (315,746 | ) | ||||||
(122,160 | ) | (177,759 | ) | — |
| — |
| (1,216,530 | ) | (618,009 | ) | ||||||
|
|
|
|
|
|
|
|
|
|
|
| ||||||
(4,368,037 | ) | — |
| (4,687,214 | ) | (1,794,020 | ) | (600,088 | ) | (2,889,668 | ) | ||||||
(1,176,200 | ) | — |
| (8,009,258 | ) | (973,297 | ) | (2,008,931 | ) | (3,725,444 | ) | ||||||
(6,020,648 | ) | (662,885 | ) | (12,696,472 | ) | (2,767,317 | ) | (4,027,380 | ) | (7,548,867 | ) | ||||||
|
|
|
|
|
|
|
|
|
|
|
| ||||||
22,143,826 |
| 24,142,222 |
| 18,745,345 |
| 20,000,797 |
| 12,627,697 |
| 26,280,682 |
| ||||||
9,269,431 |
| 1,742,280 |
| 75,255,184 |
| 8,618,695 |
| 66,693,239 |
| 12,814,067 |
| ||||||
|
|
|
|
|
|
|
|
|
|
|
| ||||||
4,428,599 |
| 461,386 |
| 4,089,227 |
| 978,077 |
| 663,199 |
| 1,112,264 |
| ||||||
1,225,096 |
| 177,759 |
| 4,237,793 |
| 973,297 |
| 2,170,460 |
| 4,343,453 |
| ||||||
|
|
|
|
|
|
|
|
|
|
|
| ||||||
(17,490,726 | ) | (24,194,724 | ) | (60,137,948 | ) | (20,796,241 | ) | (57,759,533 | ) | (13,000,394 | ) | ||||||
(3,573,544 | ) | (2,811,738 | ) | (20,765,882 | ) | (8,435,145 | ) | (24,192,012 | ) | (15,818,261 | ) | ||||||
16,002,682 |
| (482,815 | ) | 21,423,719 |
| 1,339,480 |
| 203,050 |
| 15,731,811 |
| ||||||
21,588,601 |
| 2,955,336 |
| 42,749,635 |
| 9,983,577 |
| 37,020,295 |
| 23,972,429 |
| ||||||
|
|
|
|
|
|
|
|
|
|
|
| ||||||
67,927,172 |
| 64,971,836 |
| 133,718,558 |
| 123,734,981 |
| 169,316,057 |
| 145,343,628 |
| ||||||
$ | 89,515,773 |
| $ | 67,927,172 |
| $ | 176,468,193 |
| $ | 133,718,558 |
| $ | 206,336,352 |
| $ | 169,316,057 |
|
$ | �� |
| $ | 17,977 |
| $ | — |
| $ | (124,361 | ) | $ | 345,266 |
| $ | 1,168,529 |
|
|
|
|
|
|
|
|
|
|
|
|
| ||||||
1,286,428 |
| 1,573,937 |
| 1,039,883 |
| 1,296,306 |
| 585,830 |
| 1,413,301 |
| ||||||
256,579 |
| 29,918 |
| 213,425 |
| 65,643 |
| 28,125 |
| 62,557 |
| ||||||
(1,015,415 | ) | (1,598,826 | ) | (3,369,594 | ) | (1,370,840 | ) | (2,795,136 | ) | (697,421 | ) | ||||||
527,592 |
| 5,029 |
| (2,116,286 | ) | (8,891 | ) | (2,181,181 | ) | 778,437 |
| ||||||
|
|
|
|
|
|
|
|
|
|
|
| ||||||
529,911 |
| 112,868 |
| 4,137,044 |
| 560,013 |
| 3,167,785 |
| 693,133 |
| ||||||
71,309 |
| 11,496 |
| 220,145 |
| 65,147 |
| 91,969 |
| 243,740 |
| ||||||
(208,526 | ) | (181,281 | ) | (1,098,100 | ) | (554,956 | ) | (1,090,721 | ) | (849,036 | ) | ||||||
392,694 |
| (56,917 | ) | 3,259,089 |
| 70,204 |
| 2,169,033 |
| 87,837 |
| ||||||
See accompanying notes to financial statements.
FINANCIAL HIGHLIGHTS
For a Share Outstanding
|
|
|
| Investment Activities |
| Distributions to |
|
|
|
|
|
|
| Ratios/Supplemental Data |
| ||||||||||||||||||||
Period |
| Net Asset |
| Net |
| Net Realized |
| Total from |
| Net |
| Net Realized |
| Net |
| Total |
| Net |
| Expense |
| Net |
| Expense |
| Portfolio |
| ||||||||
SHORT-INTERMEDIATE BOND FUND |
|
|
|
|
|
|
|
|
|
|
|
|
|
|
|
|
|
|
|
|
|
|
|
|
|
|
| ||||||||
Institutional Class |
|
|
|
|
|
|
|
|
|
|
|
|
|
|
|
|
|
|
|
|
|
|
|
|
|
|
| ||||||||
03/31/14 |
| $ | 9.60 |
| $ | 0.15 |
| $ | (0.12 | ) | $ | 0.03 |
| $ | (0.15 | ) | $ | (0.00 | )(d) | $ | 9.48 |
| 0.40 | % | $ | 13,123 |
| 0.79 | % | 1.62 | % | 1.01 | % | 48 | % |
03/31/13 |
| 9.48 |
| 0.23 |
| 0.13 |
| 0.36 |
| (0.23 | ) | (0.01 | ) | 9.60 |
| 3.85 |
| 48,543 |
| 0.83 |
| 2.36 |
| 1.05 |
| 50 |
| ||||||||
03/31/12 |
| 9.51 |
| 0.25 |
| 0.01 |
| 0.26 |
| (0.27 | ) | (0.02 | ) | 9.48 |
| 2.80 |
| 49,848 |
| 0.84 |
| 2.66 |
| 1.06 |
| 42 |
| ||||||||
03/31/11 |
| 9.51 |
| 0.28 |
| 0.03 |
| 0.31 |
| (0.31 | ) | — |
| 9.51 |
| 3.27 |
| 68,550 |
| 0.82 |
| 2.94 |
| 1.08 |
| 45 |
| ||||||||
03/31/10 |
| 9.20 |
| 0.32 |
| 0.34 |
| 0.66 |
| (0.35 | ) | — |
| 9.51 |
| 7.18 |
| 71,503 |
| 0.86 |
| 3.39 |
| 1.17 |
| 62 |
| ||||||||
Institutional Plus Class |
|
|
|
|
|
|
|
|
|
|
|
|
|
|
|
|
|
|
|
|
|
|
|
|
|
|
| ||||||||
03/31/14 |
| 9.61 |
| 0.17 |
| (0.10 | ) | 0.07 |
| (0.17 | ) | (0.00 | )(d) | 9.51 |
| 0.77 |
| 94,149 |
| 0.58 |
| 1.79 |
| 0.80 |
| 48 |
| ||||||||
03/31/13 |
| 9.49 |
| 0.25 |
| 0.14 |
| 0.39 |
| (0.26 | ) | (0.01 | ) | 9.61 |
| 4.11 |
| 30,342 |
| 0.58 |
| 2.59 |
| 0.80 |
| 50 |
| ||||||||
03/31/12(e) |
| 9.40 |
| 0.13 |
| 0.12 |
| 0.25 |
| (0.14 | ) | (0.02 | ) | 9.49 |
| 2.62 |
| 15,936 |
| 0.61 |
| 2.98 |
| 0.83 |
| 42 |
| ||||||||
|
|
|
|
|
|
|
|
|
|
|
|
|
|
|
|
|
|
|
|
|
|
|
|
|
|
|
| ||||||||
INCOME FUND |
|
|
|
|
|
|
|
|
|
|
|
|
|
|
|
|
|
|
|
|
|
|
|
|
|
|
| ||||||||
Institutional Class |
|
|
|
|
|
|
|
|
|
|
|
|
|
|
|
|
|
|
|
|
|
|
|
|
|
|
| ||||||||
03/31/14 |
| 10.47 |
| 0.28 |
| (0.21 | ) | 0.07 |
| (0.29 | ) | — |
| 10.25 |
| 0.72 |
| 10,784 |
| 0.81 |
| 2.71 |
| 1.08 |
| 55 |
| ||||||||
03/31/13 |
| 10.23 |
| 0.31 |
| 0.24 |
| 0.55 |
| (0.31 | ) | — |
| 10.47 |
| 5.46 |
| 54,724 |
| 0.88 |
| 3.01 |
| 1.15 |
| 42 |
| ||||||||
03/31/12 |
| 9.91 |
| 0.36 |
| 0.32 |
| 0.68 |
| (0.36 | ) | — |
| 10.23 |
| 6.93 |
| 54,401 |
| 0.91 |
| 3.56 |
| 1.18 |
| 38 |
| ||||||||
03/31/11 |
| 9.79 |
| 0.42 |
| 0.10 |
| 0.52 |
| (0.40 | ) | — |
| 9.91 |
| 5.37 |
| 56,542 |
| 0.83 |
| 4.26 |
| 1.18 |
| 68 |
| ||||||||
03/31/10 |
| 9.29 |
| 0.45 |
| 0.51 |
| 0.96 |
| (0.46 | ) | — |
| 9.79 |
| 10.49 |
| 60,098 |
| 0.77 |
| 4.72 |
| 1.27 |
| 71 |
| ||||||||
Institutional Plus Class |
|
|
|
|
|
|
|
|
|
|
|
|
|
|
|
|
|
|
|
|
|
|
|
|
|
|
| ||||||||
03/31/14 |
| 10.48 |
| 0.30 |
| (0.22 | ) | 0.08 |
| (0.30 | ) | — |
| 10.26 |
| 0.79 |
| 92,810 |
| 0.64 |
| 2.91 |
| 0.91 |
| 55 |
| ||||||||
03/31/13 |
| 10.24 |
| 0.34 |
| 0.24 |
| 0.58 |
| (0.34 | ) | — |
| 10.48 |
| 5.70 |
| 25,266 |
| 0.63 |
| 3.24 |
| 0.90 |
| 42 |
| ||||||||
03/31/12(e) |
| 10.14 |
| 0.15 |
| 0.10 |
| 0.25 |
| (0.15 | ) | — |
| 10.24 |
| 2.47 |
| 11,933 |
| 0.66 |
| 3.45 |
| 0.93 |
| 38 |
| ||||||||
|
|
|
|
|
|
|
|
|
|
|
|
|
|
|
|
|
|
|
|
|
|
|
|
|
|
|
| ||||||||
BALANCED FUND |
|
|
|
|
|
|
|
|
|
|
|
|
|
|
|
|
|
|
|
|
|
|
|
|
|
|
| ||||||||
Institutional Class |
|
|
|
|
|
|
|
|
|
|
|
|
|
|
|
|
|
|
|
|
|
|
|
|
|
|
| ||||||||
03/31/14 |
| 16.30 |
| 0.09 |
| 2.56 |
| 2.65 |
| (0.10 | ) | (1.24 | ) | 17.61 |
| 16.46 |
| 69,070 |
| 1.16 |
| 0.53 |
| 1.29 |
| 91 |
| ||||||||
03/31/13 |
| 15.39 |
| 0.15 |
| 0.90 |
| 1.05 |
| (0.14 | ) | — |
| 16.30 |
| 6.89 |
| 55,358 |
| 1.22 |
| 0.98 |
| 1.35 |
| 27 |
| ||||||||
03/31/12 |
| 14.27 |
| 0.13 |
| 1.12 |
| 1.25 |
| (0.13 | ) | — |
| 15.39 |
| 8.82 |
| 52,199 |
| 1.25 |
| 0.93 |
| 1.38 |
| 25 |
| ||||||||
03/31/11 |
| 12.44 |
| 0.22 |
| 1.82 |
| 2.04 |
| (0.21 | ) | — |
| 14.27 |
| 16.56 |
| 38,591 |
| 1.22 |
| 1.67 |
| 1.37 |
| 34 |
| ||||||||
03/31/10 |
| 8.70 |
| 0.17 |
| 3.74 |
| 3.91 |
| (0.17 | ) | — |
| 12.44 |
| 45.17 |
| 29,898 |
| 1.37 |
| 1.57 |
| 1.53 |
| 70 |
| ||||||||
Institutional Plus Class |
|
|
|
|
|
|
|
|
|
|
|
|
|
|
|
|
|
|
|
|
|
|
|
|
|
|
| ||||||||
03/31/14 |
| 16.23 |
| 0.12 |
| 2.54 |
| 2.66 |
| (0.13 | ) | (1.24 | ) | 17.52 |
| 16.65 |
| 20,446 |
| 0.95 |
| 0.72 |
| 1.08 |
| 91 |
| ||||||||
03/31/13 |
| 15.36 |
| 0.19 |
| 0.90 |
| 1.09 |
| (0.22 | ) | — |
| 16.23 |
| 7.17 |
| 12,569 |
| 0.97 |
| 1.24 |
| 1.10 |
| 27 |
| ||||||||
03/31/12(e) |
| 13.90 |
| 0.07 |
| 1.47 |
| 1.54 |
| (0.08 | ) | — |
| 15.36 |
| 11.13 |
| 12,773 |
| 1.02 |
| 1.06 |
| 1.15 |
| 25 |
| ||||||||
See accompanying Notes to Financial Statements.
|
|
|
| Investment Activities |
| Distributions to |
|
|
|
|
|
|
| Ratios/Supplemental Data |
| ||||||||||||||||||||
Period |
| Net Asset |
| Net |
| Net Realized |
| Total from |
| Net |
| Net Realized |
| Net |
| Total |
| Net |
| Expense |
| Net |
| Expense |
| Portfolio |
| ||||||||
GROWTH OPPORTUNITIES FUND |
|
|
|
|
|
|
|
|
|
|
|
|
|
|
|
|
|
|
|
|
|
|
|
|
|
|
| ||||||||
Institutional Class |
|
|
|
|
|
|
|
|
|
|
|
|
|
|
|
|
|
|
|
|
|
|
|
|
|
|
| ||||||||
03/31/14 |
| $ | 16.63 |
| $ | (0.05 | ) | $ | 4.10 |
| $ | 4.05 |
| $ | — |
| $ | (1.52 | ) | $ | 19.16 |
| 24.36 | % | $ | 59,249 |
| 1.08 | % | (0.28 | )% | 1.20 | % | 56 | % |
03/31/13 |
| 15.52 |
| (0.05 | ) | 1.53 |
| 1.48 |
| — |
| (0.37 | ) | 16.63 |
| 9.79 |
| 86,600 |
| 1.15 |
| (0.33 | ) | 1.27 |
| 55 |
| ||||||||
03/31/12 |
| 15.19 |
| (0.08 | ) | 0.41 |
| 0.33 |
| — |
| — |
| 15.52 |
| 2.17 |
| 80,961 |
| 1.16 |
| (0.55 | ) | 1.28 |
| 72 |
| ||||||||
03/31/11 |
| 11.50 |
| 0.02 |
| 3.72 |
| 3.74 |
| (0.05 | )(f) | — |
| 15.19 |
| 32.54 |
| 107,089 |
| 1.16 |
| 0.18 |
| 1.30 |
| 45 |
| ||||||||
03/31/10 |
| 7.36 |
| (0.01 | ) | 4.15 |
| 4.14 |
| — |
| — |
| 11.50 |
| 56.25 |
| 68,427 |
| 1.18 |
| (0.11 | ) | 1.35 |
| 54 |
| ||||||||
Institutional Plus Class |
|
|
|
|
|
|
|
|
|
|
|
|
|
|
|
|
|
|
|
|
|
|
|
|
|
|
| ||||||||
03/31/14 |
| 16.68 |
| (0.02 | ) | 4.13 |
| 4.11 |
| — |
| (1.52 | ) | 19.27 |
| 24.65 |
| 117,219 |
| 0.89 |
| (0.08 | ) | 1.01 |
| 56 |
| ||||||||
03/31/13 |
| 15.53 |
| (0.01 | ) | 1.53 |
| 1.52 |
| — |
| (0.37 | ) | 16.68 |
| 10.05 |
| 47,119 |
| 0.90 |
| (0.07 | ) | 1.02 |
| 55 |
| ||||||||
03/31/12(e) |
| 13.31 |
| (0.01 | ) | 2.23 |
| 2.22 |
| — |
| — |
| 15.53 |
| 16.68 |
| 42,774 |
| 0.93 |
| (0.13 | ) | 1.05 |
| 72 |
| ||||||||
|
|
|
|
|
|
|
|
|
|
|
|
|
|
|
|
|
|
|
|
|
|
|
|
|
|
|
| ||||||||
SMALL COMPANY FUND |
|
|
|
|
|
|
|
|
|
|
|
|
|
|
|
|
|
|
|
|
|
|
|
|
|
|
| ||||||||
Institutional Class |
|
|
|
|
|
|
|
|
|
|
|
|
|
|
|
|
|
|
|
|
|
|
|
|
|
|
| ||||||||
03/31/14 |
| 19.98 |
| 0.03 |
| 4.81 |
| 4.84 |
| (0.11 | ) | (0.32 | ) | 24.39 |
| 24.26 |
| 42,855 |
| 1.19 |
| 0.13 |
| 1.32 |
| 21 |
| ||||||||
03/31/13 |
| 19.11 |
| 0.18 |
| 1.63 |
| 1.81 |
| (0.09 | ) | (0.85 | ) | 19.98 |
| 10.11 |
| 78,688 |
| 1.22 |
| 0.97 |
| 1.35 |
| 19 |
| ||||||||
03/31/12 |
| 19.37 |
| 0.09 |
| 0.59 |
| 0.68 |
| (0.07 | ) | (0.87 | ) | 19.11 |
| 4.25 |
| 60,370 |
| 1.22 |
| 0.47 |
| 1.35 |
| 30 |
| ||||||||
03/31/11 |
| 16.56 |
| 0.11 |
| 3.89 |
| 4.00 |
| (0.01 | ) | (1.18 | ) | 19.37 |
| 24.83 |
| 77,747 |
| 1.26 |
| 0.64 |
| 1.41 |
| 28 |
| ||||||||
03/31/10 |
| 9.90 |
| 0.06 |
| 6.66 |
| 6.72 |
| (0.06 | ) | — |
| 16.56 |
| 68.04 |
| 64,737 |
| 1.34 |
| 0.47 |
| 1.50 |
| 30 |
| ||||||||
Institutional Plus Class |
|
|
|
|
|
|
|
|
|
|
|
|
|
|
|
|
|
|
|
|
|
|
|
|
|
|
| ||||||||
03/31/14 |
| 20.04 |
| 0.09 |
| 4.81 |
| 4.90 |
| (0.19 | ) | (0.32 | ) | 24.43 |
| 24.53 |
| 163,481 |
| 0.96 |
| 0.39 |
| 1.09 |
| 21 |
| ||||||||
03/31/13 |
| 19.16 |
| 0.23 |
| 1.64 |
| 1.87 |
| (0.14 | ) | (0.85 | ) | 20.04 |
| 10.43 |
| 90,628 |
| 0.97 |
| 1.23 |
| 1.10 |
| 19 |
| ||||||||
03/31/12 |
| 19.38 |
| 0.13 |
| 0.60 |
| 0.73 |
| (0.08 | ) | (0.87 | ) | 19.16 |
| 4.51 |
| 84,974 |
| 0.96 |
| 0.74 |
| 1.10 |
| 30 |
| ||||||||
03/31/11(e) |
| 18.09 |
| 0.01 |
| 1.28 |
| 1.29 |
| — |
| — |
| 19.38 |
| 7.13 |
| 64,005 |
| 0.93 |
| 0.22 |
| 1.10 |
| 28 |
| ||||||||
* Ratios excluding contractual and voluntary waivers.
(a) Per share data calculated using average shares method.
(b) Not annualized for periods less than one year.
(c) Annualized for periods less than one year.
(d) Amount represents less than $0.005.
(e) Commencement of Operations of Institutional Plus Class shares was as follows: Small Company Fund — December 17, 2010; Short-Intermediate Bond Fund, Balanced Fund and Growth Opportunities Fund — October 14, 2011; Income Fund — October 28, 2011.
(f) Distribution amount for the Growth Opportunities Fund includes a return of capital distribution of $0.03 per share for the year ended March 31, 2011.
See accompanying Notes to Financial Statements.
NOTES TO FINANCIAL STATEMENTS
March 31, 2014
1. Organization
Tributary Funds, Inc. (the “Company”) was organized in October 1994 as a Nebraska corporation and is registered under the Investment Company Act of 1940, as amended (the “1940 Act”), as a diversified open-end management investment company issuing its shares in series. The Company consists of five series, the Short-Intermediate Bond Fund, the Income Fund, the Balanced Fund, the Growth Opportunities Fund and the Small Company Fund (collectively, the “Funds” and individually, a “Fund”). Each series represents a distinct portfolio with its own investment objectives and policies. Effective July 26, 2013 and January 29, 2014, the Core Equity Fund and the Large Cap Growth Fund, respectively, were liquidated and removed as series of the Company.
All Funds offer Institutional Class and Institutional Plus Class shares without a sales charge. The two classes differ principally in applicable minimum investment and shareholder servicing fees. Shareholders bear the common expenses of each Fund and earn income and realized gains/losses from each Fund pro rata based on the average daily net assets of each class, without discrimination between share classes. Each share class also has different voting rights on matters affecting a single class. No class has preferential dividend rights.
2. Significant Accounting Policies
The Funds are investment companies and follow accounting and reporting guidance under Financial Accounting Standards Board (“FASB”) Accounting Standards Codification (“ASC”) Topic 946, “Financial Services-Investment Companies”. The following is a summary of significant accounting policies consistently followed by the Company in the preparation of its financial statements. The policies are in conformity with accounting principles generally accepted in the United States of America (“GAAP”). The preparation of financial statements requires management to make estimates and assumptions that affect the reported amounts of assets and liabilities, the disclosure of contingent assets and liabilities at the date of financial statements and the reported amounts of income and expenses for the period. Actual results could differ from those estimates.
Security Valuation
The net asset value (“NAV”) per share of each Fund is determined each business day as of the close of the New York Stock Exchange (“NYSE”), which is normally 4 p.m. Eastern Time. In valuing a Fund’s assets for calculating the NAV, securities listed on a securities exchange, market or automated quotation system for which quotations are readily available, including traded over the counter securities, are valued at the official closing price on the primary exchange or market (foreign or domestic) on which they traded or, if there is no such reported price on the valuation date, at the most recent quoted sale price or bid price. Investments in mutual funds are valued at the NAV per share determined as of the close of the NYSE. Short-term debt investments (maturing within 60 days) may be valued on an amortized cost basis, unless such value does not approximate market value. Debt securities (other than short-term investments) are valued at prices furnished by pricing services and generally reflect last reported sales price if the security is actively traded or an evaluated bid price obtained by employing methodologies that utilize actual market transactions; broker supplied valuations; or factors such as yield, maturity, call features, credit ratings, or developments relating to specific securities in arriving at the valuation. Prices provided by pricing services are subject to review and determination of the appropriate price whenever a furnished price is significantly different from the previous day’s furnished price.
Securities for which quotations are not readily available are valued at fair value as determined in good faith by the Company’s Fair Value Committee (“Fair Value Committee”) pursuant to procedures established by the Company’s Board of Directors (“Board”). Situations that may require an investment to be fair valued include instances where a security is thinly traded, halted, or restricted as to resale. In addition, investments may be fair valued based on the occurrence of a significant event. Significant events may be specific to a particular issuer, such as mergers, restructurings, or defaults. Alternatively, significant events may affect an entire market, such as natural disasters, government actions, and significant changes in the value of U.S. securities markets. Securities are fair valued based on observable and unobservable inputs, including the Fair Value Committee’s own assumptions in determining fair value. Factors used in determining fair value include, but are not limited to: type of security or asset, trading activity of similar markets or securities, fundamental analytical data relating to the investment, evaluation of the forces that influence the market in which the security is purchased and sold, and information as to any transactions or offers with respect to the security.
NOTES TO FINANCIAL STATEMENTS
March 31, 2014
Under the Company’s pricing and valuation procedures, the Board has delegated the daily operational oversight of the securities valuation function to the Fair Value Committee, which consists of representatives from the Funds’ adviser, sub-adviser and Treasurer, who serves on the committee as a non-voting member. The Fair Value Committee is responsible for determining fair valuations for any security for which market quotations are not readily available. For those securities fair valued under procedures adopted by the Board, the Fair Value Committee reviews and affirms the reasonableness of the fair valuation determinations after considering all relevant information that is reasonably available. The Fair Valuation Committee’s determinations are subject to review by the Funds’ Board at its next regularly scheduled meeting covering the calendar quarter in which the fair valuation was determined.
The Funds use a framework for measuring fair value. Fair value is defined as the price that would be received to sell an asset or paid to transfer a liability in an orderly transaction between market participants (exit price). One component of fair value is a three-tier fair value hierarchy. The basis of the tiers is dependent upon various “inputs” used to determine the value of the Funds’ investments. These inputs are summarized in the three broad levels listed below:
Level 1 — includes valuations based on quoted prices of identical securities in active markets including valuations for securities listed on a national or foreign stock exchange or investments in mutual funds.
Level 2 — includes valuations for which all significant inputs are observable, either directly or indirectly. Direct observable inputs include broker quotes in active markets, closing prices of similar securities in active markets, closing prices for identical or similar securities in non-active markets, or corporate action or reorganization entitlement values. Indirect significant observable inputs include factors such as interest rates, yield curves, prepayment speeds or credit ratings. Level 2 includes valuations for fixed income securities priced by pricing services, broker quotes in active markets, securities subject to corporate actions, or ADRs and GDRs for which quoted prices in active markets are not available.
Level 3 — includes valuations based on inputs that are unobservable and significant to the fair value measurement, including the Fair Value Committee’s own assumptions in determining the fair value of the investment. Inputs used to determine the fair value of Level 3 securities include security specific inputs such as: credit quality, issuer news, trading characteristics, or industry specific inputs such as: trading activity of similar markets or securities, changes in the security’s underlying index, or comparable securities’ models. Level 3 valuations include securities that are priced based on single source broker quotes, where prices may be unavailable due to halted trading, restricted to resale due to market events, newly issued or investments for which reliable quotes are not available.
To assess the continuing appropriateness of security valuations, the Co-Administrator regularly compares current day prices with prior day prices, transaction prices, and alternative vendor prices. When the comparison results exceed pre-defined thresholds, the Co-Administrator challenges the prices exceeding tolerance levels with the pricing service or broker. To substantiate Level 3 unobservable inputs, the Adviser and Co-Administrator use a variety of techniques as appropriate, including, transaction back-testing or disposition analysis and review of related market activity.
The inputs or methodology used for valuing investments are not necessarily an indication of the risk associated with investing in those investments.
NOTES TO FINANCIAL STATEMENTS
March 31, 2014
The following is a summary of the inputs used to value each Fund’s investments as of March 31, 2014, by category:
|
| LEVEL 1 - |
| LEVEL 2 - |
| LEVEL 3 - |
| Total |
| ||||
Short-Intermediate Bond Fund |
|
|
|
|
|
|
|
|
| ||||
Non-U.S. Government Agency Asset- Backed Securities |
| $ | — |
| $ | 28,769,869 |
| $ | — |
| $ | 28,769,869 |
|
Corporate Bonds |
| — |
| 26,187,198 |
| — |
| 26,187,198 |
| ||||
Government and Agency Obligations |
| — |
| 47,688,856 |
| — |
| 47,688,856 |
| ||||
Preferred Stocks |
| 445,357 |
| — |
| — |
| 445,357 |
| ||||
Short Term Investments |
| 3,714,552 |
| — |
| — |
| 3,714,552 |
| ||||
Total |
| $ | 4,159,909 |
| $ | 102,645,923 |
| $ | — |
| $ | 106,805,832 |
|
Income Fund |
|
|
|
|
|
|
|
|
| ||||
Non-U.S. Government Agency Asset-Backed Securities |
| $ | — |
| $ | 27,126,439 |
| $ | — |
| $ | 27,126,439 |
|
Corporate Bonds |
| — |
| 22,764,292 |
| — |
| 22,764,292 |
| ||||
Government and Agency Obligations |
| — |
| 49,044,599 |
| — |
| 49,044,599 |
| ||||
Preferred Stock |
| 469,649 |
| — |
| — |
| 469,649 |
| ||||
Exchange Traded Funds |
| 476,386 |
| — |
| — |
| 476,386 |
| ||||
Investment Company |
| 1,237,409 |
| — |
| — |
| 1,237,409 |
| ||||
Short Term Investments |
| 3,213,121 |
| — |
| — |
| 3,213,121 |
| ||||
Total |
| $ | 5,396,565 |
| $ | 98,935,330 |
| $ | — |
| $ | 104,331,895 |
|
Balanced Fund |
|
|
|
|
|
|
|
|
| ||||
Common Stocks |
| $ | 58,629,459 |
| $ | — |
| $ | — |
| $ | 58,629,459 |
|
Corporate Bonds |
| — |
| 13,347,996 |
| — |
| 13,347,996 |
| ||||
Government and Agency Obligations |
| — |
| 9,449,060 |
| — |
| 9,449,060 |
| ||||
Short Term Investments |
| 7,563,230 |
| — |
| — |
| 7,563,230 |
| ||||
Total |
| $ | 66,192,689 |
| $ | 22,797,056 |
| $ | — |
| $ | 88,989,745 |
|
Growth Opportunities Fund |
|
|
|
|
|
|
|
|
| ||||
Common Stocks |
| $ | 170,628,561 |
| $ | — |
| $ | — |
| $ | 170,628,561 |
|
Short Term Investments |
| 5,327,268 |
| — |
| — |
| 5,327,268 |
| ||||
Total |
| $ | 175,955,829 |
| $ | — |
| $ | — |
| $ | 175,955,829 |
|
Small Company Fund |
|
|
|
|
|
|
|
|
| ||||
Common Stocks |
| $ | 199,707,916 |
| $ | — |
| $ | — |
| $ | 199,707,916 |
|
Short Term Investments |
| 6,606,596 |
| — |
| — |
| 6,606,596 |
| ||||
Total |
| $ | 206,314,512 |
| $ | — |
| $ | — |
| $ | 206,314,512 |
|
The Funds recognize transfers between levels as of the beginning of the year. There were no significant transfers into or out of Level 1, 2 or 3 during the year ended March 31, 2014. There were no significant Level 3 valuations for which unobservable valuation inputs were developed at March 31, 2014.
Guarantees and Indemnifications
In the normal course of business, the Company may enter into contracts that contain a variety of representations which provide general indemnifications for certain liabilities. Each Fund’s maximum exposure under these arrangements is unknown. However, since their commencement of operations, the Funds have not had claims or losses pursuant to these contracts and expect the risk of loss to be remote.
Under the Company’s organizational documents, its officers and Directors are indemnified against certain liabilities arising out of the performance of their duties to the Funds. In addition, certain of the Company’s contracts with service providers contain
NOTES TO FINANCIAL STATEMENTS
March 31, 2014
general indemnification clauses. The Funds’ maximum exposure under these arrangements is unknown since the amount of any future claims that may be made against the Funds cannot be determined and the Funds have no historical basis for predicting the likelihood of any such claims.
Securities Transactions, Investment Income and Foreign Taxes
Securities transactions are accounted for no later than one business day following trade date. For financial reporting purposes, however, on the last business day of the reporting period, security transactions are accounted for on trade date. Interest income is recognized on the accrual basis and includes, where applicable, the amortization of premium or accretion of discount. Dividend income is recorded on the ex-dividend date. Dividends and interest from non-U.S. sources received by a Fund are generally subject to non-U.S. net withholding taxes. Such withholding taxes may be reduced or eliminated under the terms of applicable U.S. income tax treaties, and each Fund intends to undertake any procedural steps required to claim the benefits of such treaties. Gains or losses realized on the sales of securities are determined by comparing the identified cost of the security lot sold with the net sales proceeds.
Restricted Securities
A restricted security is a security which has been purchased through a private offering and cannot be resold to the general public without registering the transaction under the Securities Act of 1933, as amended (the “1933 Act”), or pursuant to the resale limitations provided by Rule 144A under the 1933 Act, or an exemption from the registration requirements of the 1933 Act. Whether a restricted security is illiquid or not is determined pursuant to procedures established by the Board. Not all restricted securities are considered illiquid. As of March 31, 2014, the Balanced Fund held the following Rule 144A security that was not deemed liquid:
Security |
| Acquisition |
| Acquisition |
| Market |
| Percentage of |
| ||
Commonwealth Bank of Australia, 2.92%, 04/13/20 |
| 3/31/10 |
| $ | 500,000 |
| $ | 485,300 |
| 0.5 | % |
Allocation of Expenses
Expenses directly attributable to a Fund are charged directly to that Fund, while expenses which are attributable to more than one Fund are allocated among the respective Funds based upon relative net assets or another appropriate basis. Expenses directly attributable to a class are charged directly to that class, while expenses attributable to both classes are allocated to each class based upon the ratio of net assets for each class as a percentage of total net assets.
Distributions to Shareholders
Dividends from net investment income are declared daily and paid monthly for the Short-Intermediate Bond and Income Funds. The Balanced Fund declares and pays dividends from net investment income quarterly. The Growth Opportunities Fund and Small Company Fund declare and pay dividends from net investment income, if any, annually. Distributions of net realized capital gains, if any, are declared and distributed at least annually for all the Funds only to the extent they exceeded available capital loss carryovers. The amount and timing of distributions are determined in accordance with federal income tax regulations which may differ from GAAP.
3. Related Party Transactions and Fees and Agreements
Tributary Capital Management, LLC (“Tributary”), a subsidiary of First National Bank of Omaha (“FNBO”), which is a subsidiary of First National Bank of Nebraska, Inc., serves as the investment adviser to the Funds. Each Fund pays a monthly fee at an annual rate of the following percentages of each Fund’s average daily net assets: 0.50% for the Short-Intermediate Bond Fund, 0.60% for the Income Fund, 0.75% for each of the Balanced Fund and Growth Opportunities Fund, and 0.85% for the Small Company Fund. First National Fund Advisers (“FNFA”), a division of FNBO, serves as the investment sub-adviser for the Short-Intermediate Bond Fund and Income Fund. Prior to July 26, 2013, FNFA served as investment sub-adviser for the Balanced Fund. Effective July 26, 2013, the FNFA Sub-Advisory contract was terminated for the Balanced Fund and Tributary, as investment adviser, assumed portfolio management responsibilities of the Fund.
Tributary has contractually agreed to waive certain of its fees until July 31, 2014 at the annual rate of the following percentages of each Fund’s average daily net assets: 0.22% for the Short-Intermediate Bond Fund, 0.27% for the Income Fund, 0.125% for the
NOTES TO FINANCIAL STATEMENTS
March 31, 2014
Balanced Fund, 0.12% for the Growth Opportunities Fund and 0.13% for the Small Company Fund. None of the waived fees can be recaptured in subsequent periods. The amounts waived for each Fund are recorded as expenses waived by adviser in each Fund’s Statement of Operations.
JPMorgan Chase Bank, N.A. serves as the custodian for each of the Funds. DST Systems, Inc. serves as transfer agent for the Funds, whose functions include disbursing dividends and other distributions. Tributary and Jackson Fund Services serve as co-administrators of the Funds. As compensation for its administrative services, each co-administrator is entitled to a fee, calculated daily and paid monthly based on each Fund’s average daily net assets. Tributary receives 0.07% of each Fund’s average daily net assets. Beacon Hill Fund Services, Inc. provides the Funds’ Anti-Money Laundering Compliance Officer and Chief Compliance Officer services.
The Company has adopted an Administrative Services Plan, which allows the Funds’ Institutional Class shares to charge a shareholder services fee, pursuant to which each Fund is authorized to pay compensation at an annual rate of up to 0.25% of the average daily net assets to banks and other financial institutions, that may include the advisers, their correspondent and affiliated banks, including FNBO (each a “Service Organization”). Under the Administrative Services Plan, the Funds may enter into a Servicing Agreement with a Service Organization whereby such Service Organization agrees to provide certain record keeping and/or administrative support services for their customers or account holders who are the beneficial or record owner of the shares of a Fund. The Funds maintain Servicing Agreements, one of which is with FNBO. For the year ended March 31, 2014, the Funds paid FNBO as follows: Short Intermediate Bond Fund — $22,029; Income Fund — $24,697; Balanced Fund — $1,679; Growth Opportunities Fund — $29,658; Small Company Fund — $30,778. The amounts charged to the Funds and paid to FNBO for shareholder service fees are reported within the Statements of Operations.
4. Investment Transactions
The aggregate cost of purchases and proceeds from sales of securities, excluding U.S. Government securities and short-term investments (maturing less than one year from acquisition), for the year ended March 31, 2014 were as follows:
|
| Purchases |
| Sales |
| ||
Short-Intermediate Bond Fund |
| $ | 71,299,960 |
| $ | 42,934,756 |
|
Income Fund |
| 70,932,517 |
| 45,582,853 |
| ||
Balanced Fund |
| 71,591,260 |
| 65,414,214 |
| ||
Growth Opportunities Fund |
| 93,899,882 |
| 84,956,708 |
| ||
Small Company Fund |
| 37,593,100 |
| 42,065,416 |
| ||
The aggregate cost of purchases and proceeds from sales of long-term U.S. Government securities for the year ended March 31, 2014 were as follows:
|
| Purchases |
| Sales |
| ||
Short-Intermediate Bond Fund |
| $ | 38,375,940 |
| $ | 23,180,481 |
|
Income Fund |
| 48,436,982 |
| 34,437,627 |
| ||
Balanced Fund |
| 5,954,360 |
| 1,704,315 |
| ||
5. Capital Share Transactions
The Company is authorized to issue a total of 1,000,000,000 shares of common stock, 999,999,990 of which may be issued in series with a par value of $0.00001 per share. The Board is empowered to allocate such shares among different series of the Company’s shares without shareholder approval.
6. Federal Income Taxes
The following information is presented on an income tax basis. It is each Fund’s policy to continue to comply with the requirements of Subchapter M of the Internal Revenue Code of 1986, as amended, applicable to regulated investment companies, and to distribute all of its net taxable income, including any net realized gains on investments, to its shareholders sufficient to relieve it from all, or substantially all, federal income and excise taxes. Therefore, no provision is made for federal income or excise taxes. Withholding taxes on foreign dividends have been paid or provided for in accordance with each applicable country’s tax rules and rates.
NOTES TO FINANCIAL STATEMENTS
March 31, 2014
Differences between amounts reported for financial statements and federal income tax purposes are primarily due to timing and character difference in recognizing gains and losses on investment transactions.
To the extent the differences between the amounts recognized for financial statements and federal income tax purposes are permanent in nature, such amounts are reclassified within the capital accounts based on their federal income tax treatment; temporary differences do not require reclassification. Permanent differences may include but are not limited to the following: reclassifications related to Treasury Inflation-Protected Securities, market discount, premium and/or paydown securities, REIT securities, net operating losses, expired capital loss carryforwards and distribution adjustments. These reclassifications have no impact on net assets.
|
| Net Increase (Decrease) |
| |||||||
|
| Undistributed |
| Accumulated |
| Paid-in Capital |
| |||
Short-Intermediate Bond Fund |
| $ | (55,451 | ) | $ | 783,503 |
| $ | (728,052 | ) |
Income Fund |
| (76,825 | ) | 76,825 |
| — |
| |||
Balanced Fund |
| 23,557 |
| (23,557 | ) | — |
| |||
Growth Opportunities Fund |
| 387,842 |
| (861,007 | ) | 473,165 |
| |||
Small Company Fund |
| — |
| — |
| — |
| |||
As of March 31, 2014, the cost of investments and the components of net unrealized appreciation/(depreciation) were as follows:
|
| Tax Cost of |
| Gross |
| Gross |
| Net Unrealized |
| ||||
Short-Intermediate Bond Fund |
| $ | 106,433,031 |
| $ | 970,511 |
| $ | (597,710 | ) | $ | 372,801 |
|
Income Fund |
| 103,622,333 |
| 2,343,150 |
| (1,633,588 | ) | 709,562 |
| ||||
Balanced Fund |
| 75,863,679 |
| 13,607,448 |
| (481,382 | ) | 13,126,066 |
| ||||
Growth Opportunities Fund |
| 115,701,910 |
| 61,281,606 |
| (1,027,687 | ) | 60,253,919 |
| ||||
Small Company Fund |
| 140,872,708 |
| 66,493,838 |
| (1,052,034 | ) | 65,441,804 |
| ||||
As of March 31, 2014, the components of distributable taxable earnings for U.S. federal income tax purposes were as follows:
|
| Undistributed |
| Undistributed |
| Distributions |
| Unrealized |
| Capital Loss |
| |||||
Short-Intermediate Bond Fund |
| $ | 249,590 |
| $ | — |
| $ | (104,642 | ) | $ | 372,801 |
| $ | (3,168,837 | ) |
Income Fund |
| 564,743 |
| — |
| (171,547 | ) | 709,562 |
| (117,720 | ) | |||||
Balanced Fund |
| — |
| 7,721,055 |
| — |
| 13,126,066 |
| — |
| |||||
Growth Opportunities Fund |
| 1,913,083 |
| 6,242,018 |
| — |
| 60,253,919 |
| — |
| |||||
Small Company Fund |
| 1,197,040 |
| 8,277,607 |
| — |
| 65,441,804 |
| — |
| |||||
*Undistributed net ordinary income includes any undistributed net short-term capital gains, if any.
**Unrealized gains (losses) are adjusted for open wash sale loss deferrals and return of capital paid by REIT securities.
***Capital loss carry forward includes deferred post October loss.
NOTES TO FINANCIAL STATEMENTS
March 31, 2014
The tax character of dividends and distributions paid during the Funds’ fiscal years ended March 31, 2014 and 2013 were as follows:
|
| Net |
| Net Long Term |
| Total Distributions Paid*** |
| ||||||||||||
|
| 2014 |
| 2013 |
| 2014** |
| 2013 |
| 2014 |
| 2013 |
| ||||||
Short-Intermediate Bond Fund |
| $ | 1,594,489 |
| $ | 1,733,364 |
| $ | — |
| $ | — |
| $ | 1,594,489 |
| $ | 1,733,364 |
|
Income Fund |
| 2,352,303 |
| 2,121,357 |
| — |
| — |
| 2,352,303 |
| 2,121,357 |
| ||||||
Balanced Fund |
| 457,078 |
| 662,885 |
| 5,563,570 |
| — |
| 6,020,648 |
| 662,885 |
| ||||||
Growth Opportunities Fund |
| 2,606,313 |
| — |
| 10,090,159 |
| 2,767,317 |
| 12,696,472 |
| 2,767,317 |
| ||||||
Small Company Fund |
| 2,542,258 |
| 1,338,646 |
| 1,485,122 |
| 6,210,221 |
| 4,027,380 |
| 7,548,867 |
| ||||||
* Net ordinary income consists of net taxable income derived from dividends, interest, and net short-term capital gains, if any.
** The Funds designated as long-term capital gain dividend, pursuant to the Internal Revenue code section 852(b)(3), the amount necessary to reduce earnings and profits of the Funds related to net capital gains to zero for the fiscal year ended March 31, 2014.
*** Total distributions paid may differ from the Statement of Changes in Net Assets because distributions are recognized when actually paid for tax purposes.
At March 31, 2014, the following Funds had net capital loss carryforwards available for U.S. Federal income tax purposes to offset future net realized capital gains. Details of the capital loss carryforwards are listed in the table below. Capital loss carryforwards with no expiration, if any, must be utilized prior to those with expiration dates.
|
| Expiring Capital Loss |
| No Expiration |
|
|
| ||||||||
|
| Year(s) of |
| Amount |
| Short Term |
| Long Term |
| Total |
| ||||
Short-Intermediate Bond Fund |
| 2015-2017 |
| $ | 3,022,974 |
| $ | — |
| $ | 131,752 |
| $ | 3,154,726 |
|
Income Fund |
| 2016 |
| 62,765 |
| — |
| — |
| 62,765 |
| ||||
Under current tax law, certain capital losses realized after October 31, and certain ordinary losses realized after December 31 but before the end of the fiscal year (“Post-October losses” and “Late Year Losses”, respectively) may be deferred and treated as occurring on the first business day of the following fiscal year. For the year ended March 31, 2014, the Funds deferred losses to April 1, 2014 as follows:
|
| Post-October Capital Losses |
| Late Year Ordinary Losses |
| ||
Short-Intermediate Bond Fund |
| $ | 14,111 |
| $ | — |
|
Income Fund |
| 54,955 |
| — |
| ||
The Funds comply with FASB Accounting Standards Codification (“ASC”) Topic 740, “Income Taxes.” FASB ASC Topic 740 provides guidance for how uncertain tax positions should be recognized, measured, presented and disclosed in the financial statements. FASB ASC Topic 740 requires the affirmative evaluation of tax positions taken or expected to be taken in the course of preparing each Fund’s tax return to determine whether it is more-likely-than-not (i.e., greater than 50 percent) that each tax position will be sustained upon examination by a taxing authority based on the technical merits of the position. Funds with tax positions not deemed to meet the “more-likely-than-not” threshold would be required to record a tax expense in the current year. FASB ASC Topic 740 requires that management evaluate the tax position taken in returns for the tax years ended March 31, 2011 through March 31, 2014, which remain subject to examination by all major tax jurisdictions, including federal and the State of Nebraska. Management completed an evaluation of the Funds’ tax positions and based on that evaluation, determined that no tax liability resulted from unrecognized tax benefits related to uncertain tax positions and therefore no provision for federal income tax was required in the Funds’ financial statements for the year ended March 31, 2014.
7. Subsequent Events
Management has evaluated subsequent events for the Funds through the date the financial statements are issued, and has concluded there are no events that require adjustments to the financial statements or disclosure in the notes.
Report of Independent Registered Public Accounting Firm
The Shareholders and Board of Directors
Tributary Funds, Inc.:
We have audited the accompanying statements of assets and liabilities, including the schedules of portfolio investments, for the Tributary Short-Intermediate Bond Fund, Tributary Income Fund, Tributary Balanced Fund, Tributary Growth Opportunities Fund and Tributary Small Company Fund, each a series of Tributary Funds, Inc. (the Funds) as of March 31, 2014, and the related statements of operations for the year then ended, the statements of changes in net assets for each of the years in the two-year period then ended, and the financial highlights for each of the years or periods in the five-year period then ended. These financial statements and financial highlights are the responsibility of the Funds’ management. Our responsibility is to express an opinion on these financial statements and financial highlights based on our audits.
We conducted our audits in accordance with the standards of the Public Company Accounting Oversight Board (United States). Those standards require that we plan and perform the audit to obtain reasonable assurance about whether the financial statements and financial highlights are free of material misstatement. An audit includes examining, on a test basis, evidence supporting the amounts and disclosures in the financial statements. Our procedures included confirmation of securities owned as of March 31, 2014, by correspondence with the custodian and brokers or other appropriate auditing procedures. An audit also includes assessing the accounting principles used and significant estimates made by management, as well as evaluating the overall financial statement presentation. We believe that our audits provide a reasonable basis for our opinion.
In our opinion, the financial statements and financial highlights referred to above present fairly, in all material respects, the financial position of the Funds as of March 31, 2014, the results of their operations for the year then ended, the changes in their net assets for each of the years in the two-year period then ended, and the financial highlights for each of the years or periods in the five-year period then ended, in conformity with U.S. generally accepted accounting principles.
/s/ KPMG LLP |
|
|
|
Chicago, Illinois |
|
May 29, 2014 |
|
ADDITIONAL FUND INFORMATION
March 31, 2014 (Unaudited)
Proxy Voting Policy
Information regarding the policies and procedures that the Funds use to determine how to vote proxies relating to portfolio securities is available without charge, upon request, by calling 1-800-662-4203. The information also is included in the Company’s Statement of Additional Information, which is available on the Funds’ website at www.tributaryfunds.com and on the Securities and Exchange Commission’s (the “SEC”) website at www.sec.gov.
Information relating to how each Fund voted proxies relating to portfolio securities held during the most recent twelve months ended June 30 is available by writing to the Company at P.O. Box 219022, Kansas City, Missouri, 64141-6002, by calling 1-800-662-4203 and on the Securities and Exchange Commission’s website at www.sec.gov.
Quarterly Holdings
The Company files a complete list of its portfolio holdings with the SEC for the first and third quarters of each fiscal year on Form N-Q. Forms N-Q are available free of charge on the SEC’s website at www.sec.gov or may be reviewed and copied at the SEC’s Public Reference Room in Washington, D.C. Information on the operation of the Public Reference Room may be obtained by calling 1-800-SEC-0330.
Other Federal Income Tax Information
The information reported below is for the year ended March 31, 2014. Foreign tax and qualified dividend information for the calendar year 2014 will be provided on your 2014 Form 1099-DIV.
For the year ended March 31, 2014, certain dividends paid by the Funds may be subject to a maximum tax rate of 20% as provided for by the American Taxpayer Relief Act of 2012. Complete information for calendar year 2014 will be reported in conjunction with your 2014 Form 1099-DIV.
For the year ended March 31, 2014, the following Funds hereby designate the following percentages, or the maximum amount allowable under the Internal Revenue Code (“Code”), as qualified dividends:
|
| Qualified Dividend |
|
Short-Intermediate Bond Fund |
| 2.00 | % |
Income Fund |
| 2.00 | % |
Balanced Fund |
| 100.00 | % |
Growth Opportunities Fund |
| 35.00 | % |
Small Company Fund |
| 100.00 | % |
For the year ended March 31, 2014, the following Funds hereby designate the following percentages, or the maximum amount allowable under the Code, as distributions eligible for the dividends received deduction for corporations:
|
| Dividends Received |
|
Short-Intermediate Bond Fund |
| 2.00 | % |
Income Fund |
| 2.00 | % |
Balanced Fund |
| 100.00 | % |
Growth Opportunities Fund |
| 35.00 | % |
Small Company Fund |
| 100.00 | % |
Table of Shareholder Expenses
As a shareholder of the Funds, you incur ongoing costs, including management fees, shareholder servicing fees and other Fund expenses. This example is intended to help you understand your ongoing costs (in dollars) of investing in the Funds and to compare these costs with the ongoing costs of investing in other mutual funds. The example is based on an investment of $1,000 invested at the beginning of the period and held for the entire period.
Actual Expenses
The table below provides information about actual account values and actual expenses. You may use the information below, together with the amount you invested, to estimate the expenses that you paid over the period. Simply divide your account value by $1,000 (for example, an $8,600 account value divided by $1,000 = 8.6), then multiply the result by the number in the table under the heading entitled “Expense Paid During Period” to estimate the expenses you paid on your account during this period.
Hypothetical Example for Comparison Purposes
The table below provides information about hypothetical account values and hypothetical expenses based on each Fund’s actual expense ratio and an assumed rate of return of 5% per year before expenses, which is not the Fund’s actual return. The hypothetical account values and expenses may not be used to estimate the actual ending account balance or expenses you paid for the period. You may use this information to compare this 5% hypothetical example with the 5% hypothetical examples that appear in the shareholder reports of other funds. Please note that the expenses shown in the table are meant to highlight your ongoing costs only and will not help you determine the relative total costs of owning different funds.
|
| Expenses Using Actual Fund Return |
| Expenses Using Hypothetical 5% Return |
| ||||||||||||||||||
|
| Beginning |
| Ending |
| Expense |
| Expense |
| Beginning |
| Ending |
| Expense |
| Expense |
| ||||||
Short-Intermediate Bond Fund |
|
|
|
|
|
|
|
|
|
|
|
|
|
|
|
|
| ||||||
Institutional Class |
| $ | 1,000.00 |
| $ | 1,009.30 |
| $ | 3.96 |
| 0.79 | % | $ | 1,000.00 |
| $ | 1,020.99 |
| $ | 3.98 |
| 0.79 | % |
Institutional Plus Class |
| 1,000.00 |
| 1,011.50 |
| 2.81 |
| 0.56 |
| 1,000.00 |
| 1,022.14 |
| 2.82 |
| 0.56 |
| ||||||
Income Fund |
|
|
|
|
|
|
|
|
|
|
|
|
|
|
|
|
| ||||||
Institutional Class |
| 1,000.00 |
| 1,022.50 |
| 4.13 |
| 0.82 |
| 1,000.00 |
| 1,020.84 |
| 4.13 |
| 0.82 |
| ||||||
Institutional Plus Class |
| 1,000.00 |
| 1,023.50 |
| 3.18 |
| 0.63 |
| 1,000.00 |
| 1,021.81 |
| 3.16 |
| 0.63 |
| ||||||
Balanced Fund |
|
|
|
|
|
|
|
|
|
|
|
|
|
|
|
|
| ||||||
Institutional Class |
| 1,000.00 |
| 1,089.20 |
| 6.15 |
| 1.18 |
| 1,000.00 |
| 1,019.05 |
| 5.94 |
| 1.18 |
| ||||||
Institutional Plus Class |
| 1,000.00 |
| 1,090.90 |
| 4.90 |
| 0.94 |
| 1,000.00 |
| 1,020.22 |
| 4.76 |
| 0.94 |
| ||||||
Growth Opportunities Fund |
|
|
|
|
|
|
|
|
|
|
|
|
|
|
|
|
| ||||||
Institutional Class |
| 1,000.00 |
| 1,071.00 |
| 5.68 |
| 1.10 |
| 1,000.00 |
| 1,019.45 |
| 5.54 |
| 1.10 |
| ||||||
Institutional Plus Class |
| 1,000.00 |
| 1,072.90 |
| 4.60 |
| 0.89 |
| 1,000.00 |
| 1,020.52 |
| 4.46 |
| 0.89 |
| ||||||
Small Company Fund |
|
|
|
|
|
|
|
|
|
|
|
|
|
|
|
|
| ||||||
Institutional Class |
| 1,000.00 |
| 1,125.40 |
| 6.31 |
| 1.19 |
| 1,000.00 |
| 1,019.00 |
| 5.99 |
| 1.19 |
| ||||||
Institutional Plus Class |
| 1,000.00 |
| 1,127.20 |
| 5.09 |
| 0.96 |
| 1,000.00 |
| 1,020.16 |
| 4.82 |
| 0.96 |
| ||||||
*Expenses paid during the period are equal to the annualized net expense ratio, multiplied by the average account value over the period, then multiplied by 182/365 (to reflect the most recent 6-month period).
**Annualized.
DIRECTORS AND OFFICERS (Unaudited)
March 31, 2014
Overall, responsibility for management of the Company rests with its Board, which is elected by the shareholders of the Company. The Company is managed by the Directors in accordance with the laws governing corporations in Nebraska. The Board oversees all of the Funds. Directors serve until their respective successors have been elected and qualified or until their earlier death, resignation or removal. The Directors elect the officers of the Company to supervise its day-to-day operations.
Information about the Directors and officers of the Company is set forth below. The Funds’ Statement of Additional Information includes additional information about the Directors and is available, without charge, upon request, by calling 1-800-662-4203 or on the Fund’s website www.tributaryfunds.com.
Name, Address(1), Age, |
| Term of Office |
| Principal Occupation(s) |
| Number of |
| Other |
|
|
|
|
|
|
|
|
|
Independent Directors |
|
|
|
|
|
|
|
|
|
|
|
|
|
|
|
|
|
Robert A. Reed Age 74
Director |
| Indefinite; Since 1994. |
| President and Chief Executive Officer, Physicians Mutual Insurance Company and Physicians Life Insurance Company (1974 — present). |
| 5 |
| None. |
|
|
|
|
|
|
|
|
|
Gary D. Parker Age 69
Director |
| Indefinite; Since 2005. |
| Retired. |
| 5 |
| None. |
|
|
|
|
|
|
|
|
|
John J. McCartney Age 70
Director |
| Indefinite; Since 2010. |
| Retired. |
| 5 |
| None. |
|
|
|
|
|
|
|
|
|
Interested Director |
|
|
|
|
|
|
|
|
|
|
|
|
|
|
|
|
|
Stephen R. Frantz(2) Age 56
Director/President |
| Indefinite; Since 2010. |
| Managing Partner, Tributary Capital Management, LLC (May 2010 — present); Chief Investment Officer, First Investment Group (January 2005 — May 2010); Chief Investment Officer, FNBO Fund Advisers (January 2005 — May 2010). |
| 5 |
| None. |
Name, Address, Age, |
| Term of Office |
| Principal Occupation(s) |
| Number of |
| Other |
|
|
|
|
|
|
|
|
|
Officers |
|
|
|
|
|
|
|
|
|
|
|
|
|
|
|
|
|
Daniel W. Koors(3) Age: 44
Treasurer |
| Indefinite; Since December 2009. |
| Chief Operating Officer of Jackson National Asset Management, LLC (“JNAM”) and Jackson Fund Services (“JFS”), a division of JNAM (2011 — present); Treasurer and Chief Financial Officer of investment companies advised by Curian Capital, LLC (2010 — present); Senior Vice President of JNAM and JFS (2009 — present); Vice President of investment companies advised by JNAM (2006 — present). Formerly, Chief Financial Officer of JNAM and JFS (2007 — 2011); Treasurer and Chief Financial Officer of investment companies advised by JNAM (2006 — 2011); Assistant Vice President — Fund Administration of Jackson National Life Insurance Company (2006 — 2009). |
| N/A |
| N/A |
|
|
|
|
|
|
|
|
|
Rodney L. Ruehle(4) Age: 46
Chief Compliance Officer and Anti-Money Laundering Officer |
| Indefinite; Since December 2009. |
| Director, Beacon Hill Fund Services, Inc. (2008 — present). |
| N/A |
| N/A |
|
|
|
|
|
|
|
|
|
Emily J. Bennett(3) Age: 31
Secretary |
| Indefinite; Since January 2013. |
| Senior Attorney of JNAM and JFS (2013 — present); Attorney of JNAM and JFS (2011 — 2013). Formerly, Departmental Specialist, Michigan Public Health Institute (2010 — 2011); Legal Assistant, Guyselman & Ehnis-Clark (2009 — 2010). |
| N/A |
| N/A |
|
|
|
|
|
|
|
|
|
Karen J. Buiter(3) Age: 49
Assistant Treasurer |
| Indefinite; Since November 2013. |
| Vice President — Financial Reporting of JNAM (2010 — present); Assistant Vice President — Financial Reporting of JNAM (2008 — 2010); Assistant Treasurer of other investment companies advised by JNAM (2008 —present); Assistant Treasurer of investment companies advised by Curian Capital, LLC (2010 — present). |
| N/A |
| N/A |
(1) The address for all Directors is 1620 Dodge Street, Omaha, Nebraska 68102.
(2) As defined in the 1940 Act, Mr. Frantz is an “interested” director because he is an officer of Tributary Capital Management, LLC, which is the investment adviser for the Funds.
(3) The address for Mr. Koors, Ms. Bennett, and Ms. Buiter is 225 West Wacker Drive, Suite 1200, Chicago, Illinois 60606.
(4) The address for Mr. Ruehle is 4041 North High Street, Suite 402, Columbus, Ohio 43214.
![]()
Investment Adviser
Tributary Capital Management, LLC
1620 Dodge Street, Stop 1089
Omaha, Nebraska 68197
Investment Sub-Adviser
(Short-Intermediate Bond Fund and
Income Fund only)
First National Fund Advisers
215 West Oak Street, 4th Floor
Fort Collins, Colorado 80521
Custodian
JPMorgan Chase
4 New York Plaza, 12th Floor
New York, New York 10004
Co-Administrators
Jackson Fund Services
225 West Wacker Drive, Suite 1200
Chicago, Illinois 60606
Tributary Capital Management, LLC
1620 Dodge Street, Stop 1089
Omaha, Nebraska 68197
Distributor
Northern Lights Distributors, LLC
17605 Wright Street
Omaha, Nebraska 68130
Legal Counsel
Husch Blackwell LLP
13330 California Street, Suite 200
Omaha, Nebraska 68154
Compliance Services
Beacon Hill Fund Services, Inc.
4041 North High Street, Suite 402
Columbus, Ohio 43214
Auditor
KPMG LLP
200 East Randolph Street, Suite 5500
Chicago, Illinois 60601
This report has been prepared for the general information of Tributary Funds’ shareholders. It is not authorized for distribution to prospective investors unless accompanied or preceded by an effective Tributary Funds’ prospectus. The prospectus contains more complete information about Tributary Funds’ investment objectives, management fees and expenses, risks and operating policies. Please read the prospectus carefully before investing or sending money.
For more information
call 1-800-662-4203
or write to:
Tributary Funds Service Center
P.O. Box 219022
Kansas City, Missouri 64121-9022
or go to:
www.tributaryfunds.com
or email:
TributaryFunds@tributarycapital.com
1107-NLD-5/22/2014
TF-AR-0314
Item 2. Code of Ethics.
The registrant has adopted a code of ethics that applies to the registrant’s principal executive officer, principal financial officer, principal accounting officer or controller, or persons performing similar functions. This code of ethics is included as Exhibit 12(a)(1) on this Form N-CSR. There were no substantive amendments or waivers to this code of ethics during the period covered by this report.
Item 3. Audit Committee Financial Expert.
The registrant’s Board of Directors has determined that the registrant has at least one audit committee financial expert serving on its audit committee. An “audit committee financial expert” is not an “expert” for any purpose, including for purposes of Section 11 of the Securities Act of 1933, as amended, as a result of being designated as an “audit committee financial expert.” Further, the designation of a person as an “audit committee financial expert” does not mean that the person has any greater duties, obligations, or liability than those imposed on the person without the “audit committee financial expert” designation. Similarly, the designation of a person as an “audit committee financial expert” does not affect the duties, obligations, or liability of any other member of the Audit Committee or Board of Directors.
The audit committee financial expert is John J. McCartney who is “independent” for purposes of this Item 3 of Form N-CSR.
Item 4. Principal Accountant Fees and Services.
(a) – (d)
KPMG LLP (“KPMG”) was appointed by the Board of Directors as the independent registered public accounting firm of the registrant for the fiscal years ended March 31, 2013 and March 31, 2014.
The following table sets forth the amount of fees that were billed by the principal accountant for the respective period to the registrant.
Fees for Services Rendered to the Registrant by the Principal Accountant
Fiscal Year |
| Audit Fees |
| Audit-Related Fees |
| Tax Fees |
| All Other Fees |
| ||||
2013 |
| $ | 101,000 |
| $ | 6,374 |
| $ | 28,350 |
| $ | 0 |
|
2014 |
| $ | 85,000 |
| $ | 6,811 |
| $ | 29,625 |
| $ | 0 |
|
Nature of services regarding Audit-Related Fees:
2014: Consent on N-1A and out of pocket expenses
2013: Consent on N-1A and out of pocket expenses
The above Tax Fees for 2013 and 2014 are the aggregate fees billed for professional services by KPMG to the registrant for Federal income and Nebraska Corporate Tax Return reviews and distribution calculation and federal excise tax return review.
The following table sets forth the amount of fees that were billed by the principal accountant for the respective period to any entity controlling, controlled by, or under common control with the investment adviser that provided ongoing services to the registrant (“Adviser Entities”) that were directly related to the registrant’s operations and financial reporting.
Fees for Services Rendered to the Adviser Entities by the Principal Accountant
Fiscal Year |
| Audit-Related Fees |
| Tax Fees |
| All Other Fees |
| |||
2013 |
| $ | 0 |
| $ | 0 |
| $ | 0 |
|
2014 |
| $ | 0 |
| $ | 0 |
| $ | 0 |
|
The aggregate amount of fees billed by billed the principal accountant to the Adviser Entities that were not directly related to the registrant’s operations and financial reporting was $0 for the fiscal year ended March 31, 2013 and $0 for the fiscal year ended March 31, 2014.
(e)(1) The Audit Committee shall review, consider, and pre-approve the engagement of all auditors to certify the registrant’s financial statements (an “Audit Engagement”). The Audit Committee must report to the Board of Directors of the registrant regarding its approval of all Audit Engagements.
Management of the registrant may request pre-approval of, and the Audit Committee, or a member of the Audit Committee designated by the Audit Committee (a “Designated Member”), may pre-approve permissible non-audit services (e.g. tax, valuation, and general accounting services) to the registrant and/or to the Adviser Entities, on a project-by-project basis. The Audit Committee must, however, pre-approve any engagement of the auditor to provide non-audit services to any Adviser Entity during the period of such auditor’s audit engagement. Any action by the Designated Member in approving requested non-audit service shall be presented for ratification by the Audit Committee no later than at the Audit Committee’s next scheduled meeting.
(e)(2) 0%.
(f) Not applicable.
(g) The aggregate amount of non-audit fees billed by the principal accountant to the registrant and Adviser Entities was $34,724 for the fiscal year ended March 31, 2013 and $36,436 for the fiscal year ended March 31, 2014.
(h) The registrant’s Audit Committee of the Board of Directors has considered whether the provision of non-audit services that were rendered to the Adviser Entities (not including any sub-adviser whose role is primarily portfolio management and is subcontracted with or overseen by another investment adviser) that were not pre-approved pursuant to paragraph (c)(7)(ii) of Rule 2-01 of Regulation S-X and concluded that such services were compatible with maintaining the principal accountant’s independence.
Item 5. Audit Committee of Listed Registrants.
Not applicable.
Item 6. Investments.
(a) Included as a part of the report to shareholders filed under Item 1.
(b) Not applicable.
Item 7. Disclosure of Proxy Voting Policies and Procedures for Closed-End Management Investment Companies.
Not applicable.
Item 8. Portfolio Managers of Closed-End Management Investment Companies.
Not applicable.
Item 9. Purchases of Equity Securities by Closed-End Management Investment Company and Affiliated Purchasers.
Not applicable.
Item 10. Submission of Matters to a Vote of Security Holders.
There have been no material changes to the procedures by which shareholders may recommend nominees to the registrant’s Board of Directors since the registrant last disclosed such procedures.
Item 11. Controls and Procedures.
(a) The registrant’s principal executive officer and principal financial officer have concluded, based on their evaluation of the registrant’s disclosure controls and procedures as conducted within 90 days of the filing date of this report, that these disclosure controls and procedures are adequately designed and are operating effectively to ensure that information required to be disclosed by the registrant on Form N-CSR is recorded, processed, summarized and reported within the time periods specified in the Securities and Exchange Commission’s rules and forms.
(b) There were no changes in the registrant’s internal control over financial reporting (as defined in Rule 30a-3(d) under the Investment Company Act of 1940, as amended (the “Act”) (17 CFR 270.30a-3(d)) that occurred during the registrant’s second fiscal quarter of the period covered by this report that have materially affected, or are reasonably likely to materially affect, the registrant’s internal control over financial reporting.
Item 12. Exhibits
(a)(1) | The code of ethics that is the subject of the disclosure required by Item 2 is attached hereto. |
(a)(2) | Certifications pursuant to Rule 30a-2(a) under the Act are attached hereto. |
(a)(3) | Not applicable. |
|
|
(b) | Certifications pursuant to Rule 30a-2(b) under the Act are attached hereto. |
SIGNATURES
Pursuant to the requirements of the Securities Exchange Act of 1934 and the Investment Company Act of 1940, the registrant has duly caused this report to be signed on its behalf by the undersigned, thereunto duly authorized.
| Tributary Funds, Inc. |
|
|
|
|
|
|
|
By: | /s/ Daniel W. Koors |
|
Name: | Daniel W. Koors |
|
Title: | Treasurer |
|
Date: | June 5, 2014 |
|
Pursuant to the requirements of the Securities Exchange Act of 1934 and the Investment Company Act of 1940, this report has been signed below by the following persons on behalf of the registrant and in the capacities and on the dates indicated.
By: | /s/ Stephen R. Frantz |
|
Name: | Stephen R. Frantz |
|
Title: | President |
|
Date: | June 5, 2014 |
|
|
|
|
|
|
|
By: | /s/ Daniel W. Koors |
|
Name: | Daniel W. Koors |
|
Title: | Treasurer |
|
Date: | June 5, 2014 |
|
EXHIBIT LIST
Exhibit 12(a)(1) | Code of Ethics (as defined in Item 2(b) of Form N-CSR). |
|
|
Exhibit 12(a)(2)(a) | Certification of the Principal Executive Officer required by Rule 30a-2(a) under the Act. |
|
|
Exhibit 12(a)(2)(b) | Certification of the Principal Financial Officer required by Rule 30a-2(a) under the Act. |
|
|
Exhibit 12(b) | Certification required by Rule 30a-2(b) under the Act. |