As filed with the Securities and Exchange Commission on June 3, 2016
UNITED STATES
SECURITIES AND EXCHANGE COMMISSION
WASHINGTON, D.C. 20549
FORM N-CSR
CERTIFIED SHAREHOLDER REPORT OF REGISTERED MANAGEMENT
INVESTMENT COMPANIES
Investment Company Act file number 811-08846
Tributary Funds, Inc.
Tributary Capital Management, LLC
1620 Dodge Street
Omaha, Nebraska 68197
Karen Shaw
Atlantic Fund Services, LLC
Three Canal Plaza, Suite 600
Portland, ME 04101
Registrant's telephone number, including area code: (800) 662-4203
Date of fiscal year end: March 31
Date of reporting period: April 1, 2015 – March 31, 2016


| Table of Contents | ||
Shareholder Letter | 1 | |
Management Discussion and Analysis | 3 | |
Schedules of Portfolio Investments | 15 | |
Statements of Assets and Liabilities | 36 | |
Statements of Operations | 38 | |
Statements of Changes in Net Assets | 40 | |
Financial Highlights | 42 | |
Notes to Financial Statements | 44 | |
Additional Fund Information | 53 | |
Directors and Officers | 55 | |
Investment Advisory Agreement Approval | 57 | |
Dear Shareholder:
As of March 31, 2016, our fiscal year end, Tributary Funds' net assets stood at $902 million, an increase of 12.1%, or just under $100 million year over year. This growth was achieved against a backdrop of challenging equity markets, with the bellwether benchmark S&P 500 Index up a modest 1.77% for the same period. We continued in 2015 to see a positive trend the Funds have seen over the last several years, with net inflows into the complex of over $81 million. We are pushing our distribution opportunities out on a national basis, the most recent wins with UBS and Wells Fargo, two powerful and significant national and international distribution channels. We recently were chosen by Charles Schwab to participate in their "Select List" with our Small Company Fund. This designation is the highest stamp of approval within the Schwab mutual fund system, and has been delivering steady flows to the complex over the last quarter. As of the writing of this letter, of our 5 funds ranked by Morningstar, the Small Company Fund is ranked 5 stars, out of 643 Small Blend funds. The Growth Opportunities, Income and Balanced Funds received 4 stars, out of 640 Mid-Cap Growth, 951 Intermediate-Term Bond and 856 Moderate Allocation Bond funds respectively. Our Short Intermediate Fund received a 3 star rating out of 490 Short-Term Bond funds. (Morningstar proprietary ratings reflect risk-adjusted performance through March 31, 2016.) This reflects commitment of our portfolio managers in each of these strategies to deliver strong risk adjusted returns on behalf of our valued clients. Finally, consistent with our niche oriented boutique funds distribution strategy, we added a new fund at the end of 2015, the Nebraska Tax Free Fund, whose target market will be residents of Nebraska looking for the dual benefit of income free of taxes at both the Federal and State levels.
Our Mutual Fund family began operations as the First Omaha Funds in 1992, whose sole purpose was to support the investment management function of the trust department of the First National Bank of Omaha. With the advent of stronger technology through internet based operational platforms in the mid to late 1990s, it became possible for most investment management organizations to access funds from almost any provider. First National Bank decided to embrace this industry best practice in 1999, which shifted our fund strategy away from one local source of distribution to a more nationally oriented distribution strategy by necessity. However, to compete on a national level, fund offerings needed to be strong in both performance and process. In 2001, the name of the complex was changed from First Omaha to First Focus, to allow us a brand not tied to a specific geography.
Over the ensuing nine year period, the complex battled the necessary exodus from the parent company of assets driven by this new technology driven open architecture concept. At the same time, we struggled to attract assets from the outside. At the end of 2001, the complex stood at $762 million in assets. Nine years later, at the end of 2010, the assets stood at $853 million. Although an increase of 12%, we were suffering negative inflows, simply put a lack of organic growth.
Understanding the necessity of external national distribution for the long-term viability of the complex, the Board of Director's embarked on a new and fresh four-point strategy in 2010.
| · | Rebrand the complex to reflect a brand not tied to any one particular organization |
| · | Rationalize critically each individual offering and close those without a strong value proposition |
| · | Take the best of these funds and work on a national level to secure distribution agreements |
| · | Stabilize the assets from the First National Organization through better product offerings |
I am pleased to report that we have executed on all four points of this plan. The complex was rebranded Tributary in 2010. The name was chosen in part to show recognition that we owe our very existence to our much larger parent, First National Bank. We are a "tributary" if you will of this incredible institution, whose efforts have created many other small bodies of water, or tributaries, over their 150 plus year history. And in part, the name reflects our approach to investing, letting the rough and sometimes rapidly moving rivers of the Wall Street world roar by as we stay in the much calmer and more stable tributary waters.
Secondly, we have closed three funds over the last five years. These funds value propositions were no longer embraced by the marketplace, and the decision was made to focus on the five Funds in which we had been able to demonstrate strong competency and in which we felt offered a strong value proposition for our clients.
As to point three of the plan, we've signed over 50 selling agreements with fund distributors around the country, including industry power houses Wells Fargo, Charles Schwab, Fidelity, Merrill Lynch, UBS and JP Morgan.
And finally, with this more narrowly focused boutique styled approach, we've been able to stabilize and grow the remaining funds within the distribution channel of our parent company, First National Bank.
As we approach the magical $1 billion dollar mark, I look fondly back upon these challenges, as they have made our complex and distribution strategies much more competitive and durable over the long haul. We are currently working on a new strategy, focused on
1 |
maximizing the opportunities that we have with the 50+ selling agreements we have in place, as well as building the Tributary Brand in the market place. More to come.
Recent market performance has been much less exciting than the growth momentum we have seen at Tributary. Expectations around returns for both equities and bonds going forward seem to be stuck somewhere in the low to mid-single digits. The U.S. economic growth picture, although very anemic at 2% - 2.5%, still seems to be the bright spot of the developed world. Financial assets in the U.S. have been reflecting this scenario for some time now, and seems to offer limited upside without a boost to economic output, or put another way, we need to get our economy growing at a 3.5% - 5% rate to really get investors back off the sidelines and excited about owning stocks again. There does appear to be a movement back towards investing in international markets, both developed and emerging, not necessarily based on economic strength in these countries, but rather valuation levels that look attractive vs. the U.S.
The general mood of the investing class seems to be resigned to low returns for an extended period of time. But as we all know, it is more often than not prudent to take a contrarian position to conventional wisdom to make money over time. There are record low interest rates and commodity prices throughout the world. There also is an unprecedented and available level of cash sitting on corporate balance sheets waiting to be deployed. I would like to make the case that if our policy makers could craft a tax policy more conducive to capital investment and loosen the punitive mindset of regulators around business in general, that the ingredients exist for our economy to grow at a much higher level, creating many new jobs and revenue for our government to be able to distribute to help those that truly are in need of help in our country.
Thank you for your continued support of the Tributary Family of Funds.
Best regards,

Stephen R. Frantz
President
sfrantz@tributarycapital.com
© 2016 Morningstar, Inc. All Rights Reserved. The information, data, analyses and opinions contained herein (1) include the confidential and proprietary information of Morningstar, (2) may not be copied or redistributed, (3) do not constitute investment advice offered by Morningstar, (4) are provided solely for informational purposes and therefore are not an offer to buy or sell a security, and (5) are not warranted to be correct, complete or accurate. Except as otherwise required by law, Morningstar shall not be responsible for any trading decisions, damages or other losses resulting from, or related to, this information, data, analysis or opinions or their use.
For each fund with at least a three-year history, Morningstar calculates a Morningstar Rating™ based on a Morningstar Risk- Adjusted Return measure that accounts for variation in a fund's monthly performance (including the effects of sales charges, loads, and redemption fees), placing more emphasis on downward variations and rewarding consistent performance. For the period ended March 31, 2016, the Tributary Balanced Fund received 4, 4 and 4 stars out of 854, 744 and 504 Moderate Allocation funds for the three-, five- and ten-year periods, respectively; The Tributary Small Company Fund received 5, 4 and 5 stars out of 643, 562 and 370 Small Blend funds, respectively; The Tributary Growth Opportunities Fund received 3, 3 and 4 stars out of 640, 574 and 428 Mid-Cap Growth funds, respectively. The Short-Intermediate Bond Fund received 3, 4 and 3 stars out of 490, 404 and 280 Short-Term Bond funds, respectively. The Income Fund received 4, 4 and 3 stars out of 951, 827 and 602 Intermediate-Term Bond funds, respectively.
Morningstar proprietary ratings reflect one-year risk-adjusted performance through 03/31/2016. The ratings are subject to change every month. Morningstar ratings are calculated from the funds' 3, 5 and 10-year returns (as applicable), with fee adjustments in excess of 90-day Treasury bill returns, and a risk factor that reflects fund performance below 90-day T-Bill returns. The top 10% of the funds in a rating universe receive 5-stars, the next 22.5% receive 4 stars, the next 35% receive 3 stars, the next 22.5% receive 2 stars and the bottom 10% receive 1 star.
For performance to the most recent month end, please visit www.tributaryfunds.com or call (800) 662-4203.
Comments are provided as a general market overview and should not be considered investment advice or predictive of any future market performance.
2 |
SHORT-INTERMEDIATE BOND FUND (Unaudited)
SHORT-INTERMEDIATE BOND FUND (Unaudited)
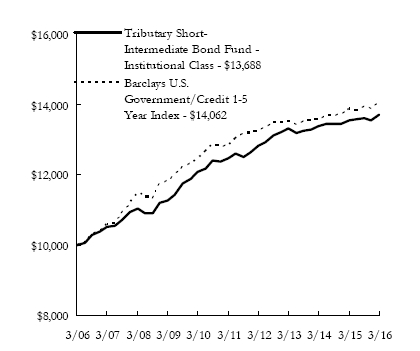
Return of a $10,000 Investment as of March 31, 2016
| Portfolio Composition as of March 31, 2016 | ||
| Percentage Based on Total Value of Investments | ||
| (Portfolio composition is subject to change) | ||
| Corporate Bonds | 27.8 | % |
| U.S. Treasury Securities | 22.4 | % |
| Non-Agency Residential Mortgage Backed Securities | 15.3 | % |
| Asset Backed Securities | 13.3 | % |
| Non-Agency Commercial Mortgage Backed Securities | 11.7 | % |
| Short-Term Investments | 4.1 | % |
| U.S. Government Mortage Backed Securities | 3.5 | % |
| Municipals | 1.5 | % |
| Preferred Stocks | 0.4 | % |
| 100.0 | % | |
| Portfolio Analysis as of March 31, 2016 | ||||
| (Portfolio composition is subject to change) | ||||
| Weighted Average to Maturity: | 4.9 | years | ||
| Average Annual Total Returns for the Year Ended March 31, 2016* | |||||
| 1 Year | 5 Year | 10 Year | |||
| Tributary Short-Intermediate Bond Fund — Institutional Class | 1.11 | % | 1.89 | % | 3.19 | % | ||
| Barclays U.S. Government/Credit 1-5 Year Index | 1.62 | % | 1.88 | % | 3.47 | % |
Prospectus Expense Ratio (Gross/Net)† | 1.04 | % | 0.78 | % | ||
Expense Ratio for the Year Ended March 31, 2016 (Gross/Net) | 1.11 | % | 0.76 | % |
| 1 Year | Since Inception†† |
| Tributary Short-Intermediate Bond Fund — Institutional Plus Class | 1.32 | % | 2.32 | % |
Prospectus Expense Ratio (Gross/Net)† | 0.80 | % | 0.54 | % | ||
Expense Ratio for the Year Ended March 31, 2016 (Gross/Net) | 0.77 | % | 0.54 | % |
Past performance does not guarantee future results. The performance data quoted represents past performance and current returns may be lower to higher. Total returns include change in share price, reinvestment of dividends and capital gains. The investment return and principal value will fluctuate so that an investor's shares, when redeemed may be worth more or less than the original cost. To obtain performance information current to the most recent month end, please visit our website at www.tributaryfunds.com.
(†) The expense ratios are from the Fund's prospectus dated August 1, 2015. Net expense ratios are net of contractual waivers which are in effect from August 1, 2015 through July 31, 2016.
(††) Commencement date for the Institutional Plus Class was October 14, 2011.
(*) Returns shown do not reflect the deduction of taxes that a shareholder would pay on Fund distributions or the redemption of Fund shares. Investment performance reflects contractual fee waivers in effect for certain periods. Without these fee waivers, the performance would have been lower.
The line chart assumes an initial investment of $10,000 made on March 31, 2006. Total return is based on net change in net asset value ("NAV") assuming reinvestment of all dividends and other distributions.
The performance of Institutional Plus Class will be different than Institutional Class based on differences in fees borne by each class.
Barclays U.S. Government/Credit 1-5 Year Index is an unmanaged index which measures the performance of U.S. Treasury and agency securities, and corporate bonds with 1-5 year maturities. The index is unmanaged and does not reflect the deduction of fees or taxes associated with a mutual fund, such as investment management, administration and other operational fees. Investors cannot directly invest in the index.
4 |
INCOME FUND (Unaudited)
Investment Objective
The Tributary Income Fund seeks the generation of current income in a manner consistent with preserving capital and maximizing total return.
Manager Commentary
The Tributary Income Fund returned 1.81% (net, Institutional Plus) for the year ended March 31, 2016 compared to a 1.96% return for the Barclay's U.S. Aggregate Bond Index. The U.S. Treasury yield curve shifted somewhat oddly over the trailing 12 months, as the U.S. Federal Reserve ("Fed") finally raised its target for the overnight funds rate. Short-term yields were higher as expected, while intermediate term yields fell 15-20 basis points (bps) and the 30-year yield actually rose slightly. The steepening in the yield curve from the 5-30 year segment was the primary driver of the Fund's underperformance for the trailing 12-month period, as our lower duration exposure in the belly of the curve hurt relative performance. The Fund's underweight in government sectors versus the benchmark also hindered performance as credit spreads on non-government securities widened significantly over the year. Lower-quality corporate bonds were the worst performing asset class in fixed income (the Barclays High Yield index posted a -3.69% return), driven by the precipitous decline in crude oil and other commodities which severely pressured the credit profiles of many issuers. Investment grade corporates fared better, but still underperformed with a -1.77% excess return vs. similar maturity Treasuries. Commercial mortgage backed securities ("MBS") and asset backed securities ("ABS") performed in-line with Treasuries, while agency MBS slightly outperformed given their carry and liquidity advantages.
Not unlike prior years, global concerns and Federal Reserve policy dictated the performance of the bond market over the past year. The weakening Chinese economy and volatile behavior from the government with respect to currency policy drove investors away from emerging markets and intensified the decline in commodity prices for much of the year. Domestically, the market was focused intently on the Federal Reserve's approach to policy normalization. After hinting in the early summer that policy change was coming, the Fed reversed course in the fall due to the global uncertainty emanating from China. From a fundamental standpoint the Fed had evidence to remove accommodation, as economic reports from the labor and consumer markets were mostly positive and core inflation appeared to be moving higher, but "international developments" ruled the day. The Fed eventually did raise its overnight target Fed Funds rate by 0.25% in December after seven years at the zero-lower bound, presumably due to the improved outlook and stability in Chinese and emerging economy financial markets. The final few months of the fiscal year were just as choppy, as the New Year began with Chinese equity markets once again in a tailspin and crude oil plummeting to new lows, which caused a sharp risk-off trade in credit markets. Global monetary authorities reacted swiftly and strongly to prop up the markets and counter the tightening financial conditions, as the PBOC, BoJ and ECB enacted new stimulus programs and the Fed took a decidedly dovish stance in its communications. The bond market ended the period with an upbeat tone, with credit spreads tighter and absolute yields still low.
During the year the Fund's overall sector allocation shifted slightly toward government securities and away from the non-agency structured product space. Specifically, we increased exposure mostly to U.S. Treasuries but also to industrial corporate bonds as spreads widened during the year. We also performed bond swaps by extending maturities in a few names to capture value in what we found to be a steep credit curve. Our agency MBS allocation was essentially unchanged during the year, while our exposure to non-agency product declined due to legacy paydowns and continued lack of new-issue supply. In terms of credit quality there was no significant change during the year, as the Fund maintained a AA- weighted average credit rating.
At the risk of sounding stale, we remain agnostic on the direction of interest rates. While the Fed has officially embarked on a tightening cycle, they have recently acknowledged that global headwinds are a great concern, and as a result, any further rate hikes will be (more) moderate and (more) gradual. We would agree that the global economy is a restraining factor for domestic growth and inflation, and will thus act as a governor on rising interest rates. Nonetheless, as we look at the extremely dovish expectations currently priced into the market, we view the downside risks of higher rates as being greater than the potential upside rewards of further declines in U.S. interest rates. We are therefore maintaining a slightly short duration position relative to our benchmark. As for the Fund's sector allocation, we remain underweight the traditional U.S. government sectors, in addition to an underweight in the agency MBS market given our opinion that the margin of safety in the asset class is low relative to other sectors in the structured securities space. We therefore remain overweight in the non-agency residential mortgage backed securities ("RMBS") and commercial mortgage backed securities ("CMBS") sectors, as well as the traditional ABS space. In the corporate market, spreads have tightened in such swift fashion that we strongly believe individual security selection will be the primary driver of future performance, leading us to a roughly neutral position versus our benchmark.
As always, we remain committed to seeking prudent, value-enhancing investment opportunities consistent with our disciplined approach of managing for the long-term.
INCOME FUND (Unaudited)
Return of a $10,000 Investment as of March 31, 2016

NEBRASKA TAX-FREE FUND (Unaudited)
Investment Objective
The Tributary Nebraska Tax-Free Fund seeks as high a level of current income exempt from both federal and Nebraska income tax as is consistent with the preservation of capital.
Manager Commentary
The Fund returned 1.35% (net, Institutional Plus) for the quarter compared to a gross return of 1.46% for the Barclay's 1-15 Year Municipal Blend Index and 1.67% for the Barclay's Municipal Index.
The first quarter of 2016 was a tale of two halves, as the New Year began with volatility and a large downdraft in asset prices, but closed at levels that were essentially unchanged from year-end. Investors initially focused on global concerns, primarily the Chinese equity market's dramatic freefall which caused a halt in trading on two separate occasions within the first week of the year. At the same time, Europe remained mired in a low-growth, low-inflation environment and emerging markets struggled as the dollar remained strong. A negative feedback loop developed, as dollar strength contributed to further declines in the commodities complex, and the U.S. equity market, reacting to weaker energy prices and softer domestic economic data, sold off as well. The risk-off sentiment was broad based among asset classes, with fixed income yield spreads widening in unison with falling equities. Global monetary authorities reacted strongly to prop up the markets and counter tightening financial conditions. The People's Bank of China, the Bank of Japan, and the European Central Bank all took various steps to ease lending conditions and/or increase asset purchases. For its part, the Federal Reserve moderated its somewhat hawkish tone, indicating that due to global developments, it would likely raise the fed funds rate at an even slower pace than it had previously indicated. This global monetary response, combined with stronger domestic employment and economic data in the final weeks of the quarter, led to a swift reemergence of the risk-on trade. During the last half of the quarter, the U.S. equity market largely recovered its earlier losses, while the fixed income market similarly recouped any lost performance. Given the positive impact of central bank policies, U.S Treasuries posted strong returns during the quarter (+3.2%) as yields fell roughly 40-50 basis points across the curve. Municipal bond yields largely followed suit, leading to positive returns in the tax-exempt market as well.
The Nebraska economy continued to perform well for the 12-months ended March 31, 2016. Unemployment rates remain well below the national average (2.9% vs. 5%, respectively), even as state GDP grew modestly less than the national figures (1.1% vs. 2.1%, respectively) for the most updated 4-quarter period ended in September 2015. The state continues to receive solid credit ratings and has largely avoided the pension and post-retirement obligation problems of many peer states and municipalities. One potential area of concern is the impact from the weakening ag sector, given the sharp decline in commodity prices over the past few years and the subsequent drop in land values. Nonetheless, debt levels for most municipalities are very manageable which has provided a cushion against valuation pressures.
On a net basis the Fund underperformed its benchmark for the quarter. The primary detractor from relative performance this quarter was our lower duration exposure versus the benchmark, which led to less price appreciation as interest rates fell.
As indicated in prior communications, we are currently agnostic on the direction of interest rates. While the Fed has officially embarked on a tightening cycle, they have recently acknowledged that global headwinds are a great concern, and as a result, any further rate hikes will be (more) moderate and (more) gradual. We would agree that the global economy is a restraining factor for domestic growth and inflation, and will thus act as a governor on rising interest rates. Nonetheless, as we look at the extremely dovish expectations currently priced into the market, we view the downside risks of higher rates as being greater than the potential upside rewards of further declines in U.S. interest rates. We are therefore maintaining a slightly short duration position relative to our benchmark.
NEBRASKA TAX-FREE FUND (Unaudited)
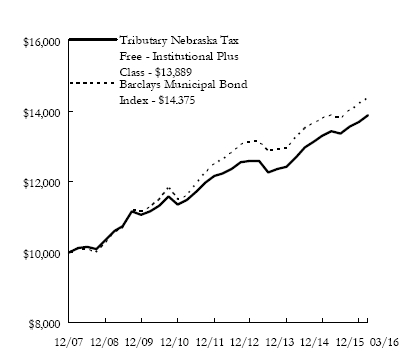
Return of a $10,000 Investment as of March 31, 2016
| Portfolio Composition as of March 31, 2016 | ||
| Percentage Based on Total Value of Investments | ||
| (Portfolio composition is subject to change) | ||
| Municipals | 96.1 | % |
| Short-Term Investments | 3.9 | % |
| 100.0 | % | |
| Average Annual Total Returns for the Year Ended March 31, 2016* | |||||
| 1 Year | 5 Year | Since Inception | |||
Tributary Nebraska Tax-Free Fund — Institutional Plus Class † | 3.39 | % | 3.86 | % | 4.06 | % | ||
| Barclays Municipal Bond Index | 3.98 | % | 5.59 | % | 4.93 | % |
Prospectus Expense Ratio (Gross/Net)†† | 0.78 | % | 0.45 | % | ||
Expense Ratio for the Year Ended March 31, 2016 (Gross/Net) | 0.85 | % | 0.45 | % |
Past performance does not guarantee future results. The performance data quoted represents past performance and current returns may be lower to higher. Total returns include change in share price, reinvestment of dividends and capital gains. The investment return and principal value will fluctuate so that an investor's shares, when redeemed may be worth more or less than the original cost. To obtain performance information current to the most recent month end, please visit our website at www.tributaryfunds.com.
(†) The Fund's Institutional Plus Class performance for periods prior to the commencement of operations (1/1/16) is that of a common trust fund managed by First National Bank of Omaha. The common trust fund commenced operations on December 31, 2007.
(††) The expense ratios are from the Fund's prospectus dated December 31, 2015. Net expense ratios are net of contractual waivers which are in effect from January 1, 2016 through December 31, 2016.
(*) Returns shown do not reflect the deduction of taxes that a shareholder would pay on Fund distributions or the redemption of Fund shares. Investment performance reflects contractual fee waivers in effect for certain periods. Without these fee waivers, the performance would have been lower.
The line chart assumes an initial investment of $10,000 made on December 31, 2007. Total return is based on net change in net asset value ("NAV") assuming reinvestment of all dividends and other distributions.
The Barclays Municipal Bond Index is a broad-based benchmark that measures the investment grade, US dollar-denominated, fixed tax exempt bond market. The index includes state and local general obligation, revenue, insured, and pre-refunded bonds. The Barclays Municipal Index was incepted in January 1980. The index does not reflect the fees and expenses associated with a mutual fund, such as investment management, administration and other operational fees. Investors cannot invest directly in the index.
BALANCED FUND (Unaudited)
BALANCED FUND (Unaudited)
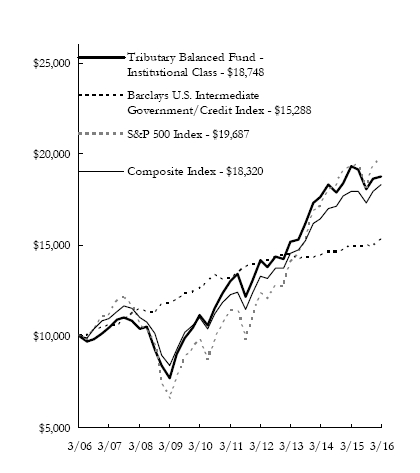
Return of a $10,000 Investment as of March 31, 2016
| Portfolio Composition as of March 31, 2016 | ||
| Percentage Based on Total Value of Investments | ||
| (Portfolio composition is subject to change) | ||
| Government Securities | 18.5 | % |
| Information Technology | 16.3 | % |
| Financials | 12.3 | % |
| Consumer Discretionary | 10.7 | % |
| Industrials | 8.6 | % |
| Health Care | 8.5 | % |
| Consumer Staples | 6.9 | % |
| Energy | 4.1 | % |
| Short-Term Investments | 2.7 | % |
| Non-Agency Commercial Mortgage Backed Securities | 2.6 | % |
| Asset Backed Securities | 1.9 | % |
| Telecommunication Services | 1.8 | % |
| Non-Agency Residential Mortgage Backed Securities | 1.7 | % |
| Utilities | 1.6 | % |
| Materials | 1.2 | % |
| U.S. Government Mortage Backed Securities | 0.6 | % |
| 100.0 | % | |
| Average Annual Total Returns for the Year Ended March 31, 2016* | |||||
| 1 Year | 5 Year | 10 Year | |||
| Tributary Balanced Fund — Institutional Class | -2.93 | % | 7.54 | % | 6.49 | % | ||
| Barclays U.S. Intermediate Government/Credit Index | 2.06 | % | 3.01 | % | 4.34 | % | ||
| S&P 500 Index | 1.78 | % | 11.58 | % | 7.01 | % | ||
| Composite Index | 2.14 | % | 8.27 | % | 6.24 | % |
Prospectus Expense Ratio (Gross/Net)† | 1.28 | % | 1.21 | % | ||
Expense Ratio for the Year Ended March 31, 2016 (Gross/Net) | 1.26 | % | 1.19 | % |
| 1 Year | Since Inception†† |
| Tributary Balanced Fund — Institutional Plus Class | -2.78 | % | 9.20 | % |
Prospectus Expense Ratio (Gross/Net)† | 1.08 | % | 1.01 | % | ||
Expense Ratio for the Year Ended March 31, 2016 (Gross/Net) | 1.01 | % | 0.99 | % |
Past performance does not guarantee future results. The performance data quoted represents past performance and current returns may be lower to higher. Total returns include change in share price, reinvestment of dividends and capital gains. The investment return and principal value will fluctuate so that an investor's shares, when redeemed may be worth more or less than the original cost. To obtain performance information current to the most recent month end, please visit our website at www.tributaryfunds.com.
(†) The expense ratios are from the Fund's prospectus dated August 1, 2015. Net expense ratios are net of contractual waivers which are in effect from August 1, 2015 through July 31, 2016.
(††) Commencement date for the Institutional Plus Class was October 14, 2011.
(*) Returns shown do not reflect the deduction of taxes that a shareholder would pay on Fund distributions or the redemption of Fund shares. Investment performance reflects contractual fee waivers in effect for certain periods. Without these fee waivers, the performance would have been lower.
The line chart assumes an initial investment of $10,000 made on March 31, 2006. Total return is based on net change in net asset value ("NAV") assuming reinvestment of all dividends and other distributions.
The performance of Institutional Plus Class will be different than Institutional Class based on differences in fees borne by each class.
The S&P 500 Index is a broad based index of 500 selected common stocks, most of which are listed on the New York Stock Exchange, that measures the U.S. stock market as a whole. The index is heavily weighted towards stocks with large market capitalizations and represents approximately two-thirds of the total market value of all domestic common stocks. The Barclays U.S. Intermediate Government/Credit Index is a market value weighted performance benchmark for government and corporate fixed-rate debt issues (rated Baa/BBB or higher) with maturities between one and ten years. The Composite Index is intended to provide a single benchmark that more accurately reflects the composition of securities held by the Tributary Balanced Fund. Sixty percent of the Composite Index is comprised of the S&P 500 Index and forty percent of the Composite Index is comprised of the Barclays U.S. Intermediate Government/Credit Index. The indices are unmanaged and do not reflect the deduction of fees or taxes associated with a mutual fund, such as investment management, administration and other operational fees. Investors cannot directly invest in the indices.
GROWTH OPPORTUNITIES FUND (Unaudited)
GROWTH OPPORTUNITIES FUND (Unaudited)
Return of a $10,000 Investment as of March 31, 2016

| Portfolio Composition as of March 31, 2016 | ||
| Percentage Based on Total Value of Investments | ||
| (Portfolio composition is subject to change) | ||
| Consumer Discretionary | 23.2 | % |
| Information Technology | 18.9 | % |
| Health Care | 17.3 | % |
| Financials | 12.2 | % |
| Industrials | 11.9 | % |
| Consumer Staples | 11.1 | % |
| Materials | 1.6 | % |
| Utilities | 1.2 | % |
| Energy | 0.4 | % |
| Short-Term Investments | 2.2 | % |
| 100.0 | % | |
| Average Annual Total Returns for the Year Ended March 31, 2016* | |||||
| 1 Year | 5 Year | 10 Year | |||
Tributary Growth Opportunities Fund — Institutional Class | -9.78 | % | 7.29 | % | 6.83 | % | ||
| Russell Midcap Growth Index | -4.74 | % | 9.99 | % | 7.43 | % | ||
| S&P 500 Index | 1.78 | % | 11.58 | % | 7.01 | % |
Prospectus Expense Ratio (Gross/Net)† | 1.23 | % | 1.16 | % | ||
Expense Ratio for the Year Ended March 31, 2016 (Gross/Net) | 1.27 | % | 1.16 | % |
| 1 Year | Since Inception†† |
| Tributary Growth Opportunities Fund — Institutional Plus Class | -9.63 | % | 11.68 | % |
Prospectus Expense Ratio (Gross/Net)† | 1.01 | % | 0.94 | % | ||
Expense Ratio for the Year Ended March 31, 2016 (Gross/Net) | 0.99 | % | 0.94 | % |
Past performance does not guarantee future results. The performance data quoted represents past performance and current returns may be lower to higher. Total returns include change in share price, reinvestment of dividends and capital gains. The investment return and principal value will fluctuate so that an investor's shares, when redeemed may be worth more or less than the original cost. To obtain performance information current to the most recent month end, please visit our website at www.tributaryfunds.com.
(†) The expense ratios are from the Fund's prospectus dated August 1, 2015. Net expense ratios are net of contractual waivers which are in effect from August 1, 2015 through July 31, 2016.
(††) Commencement date for the Institutional Plus Class was October 14, 2011.
(*) Returns shown do not reflect the deduction of taxes that a shareholder would pay on Fund distributions or the redemption of Fund shares. Investment performance reflects contractual fee waivers in effect for certain periods. Without these fee waivers, the performance would have been lower.
The line chart assumes an initial investment of $10,000 made on March 31, 2006. Total return is based on net change in net asset value ("NAV") assuming reinvestment of all dividends and other distributions.
The performance of Institutional Plus Class will be different than Institutional Class based on differences in fees borne by each class.
The Russell Midcap Growth Index measures the performance of the mid-cap growth segment of the U.S. equity universe. It includes those Russell Midcap Index companies with higher price-to-book ratios and higher forecasted growth values. The Fund's primary index is the Russell Midcap Growth Index, however to provide a broader market comparative, the S&P 500 Index is a secondary benchmark. The S&P 500 Index is a broad based index of 500 selected common stocks, most of which are listed on the New York Stock Exchange, that measures the U.S. stock market as a whole. The index is heavily weighted towards stocks with large market capitalizations and represents approximately two-thirds of the total market value of all domestic common stocks. The indices are unmanaged and do not reflect the deduction of fees or taxes associated with a mutual fund, such as investment management, administration and other operational fees. Investors cannot directly invest in the indices.
SMALL COMPANY FUND (Unaudited)
The best performing sectors in the small cap market over the last 12 months were Utilities (+9%), Telecommunications Services (+6%) and Consumer Staples (0%). The relative safety of the Utilities sector in a down market, combined with investors' appetite for higher yielding securities, helped propel this sector to a nice positive return over the last 12 months. The Telecommunications Services sector represents less than 1% of the Russell 2000 Index and therefore does not typically have a significant impact on overall Russell 2000 Index performance. However, several stocks posted very good returns, which drove overall sector performance in the last 12 months. Consumer Staples stocks managed a flat return in the past year as that sector tends to hold up well in less robust macroeconomic environments. The weakest performing sectors in the small cap market over the last 12 months were Energy (-44%), Healthcare (-20%) and Materials (-19%). For the second consecutive year, the Energy sector lost more than 40% over the trailing 12 months due to lower oil prices. WTI Crude began the year at just under $48/barrel, moved up to just over $61/barrel in mid-June 2015 before falling to just over $26/barrel in February 2016. Prices did manage to rally back near $37/barrel by March, 31, 2016. In a significant reversal from last year's report ending in March of 2015, the Healthcare sector was negatively impacted by biotech and pharmaceutical stocks that were down nearly 34% and 29% respectively over the last year. In the Materials sector, concerns regarding slow global economic growth helped to push stocks lower.
The Tributary Small Company Fund's strongest relative performance came from the Healthcare and Energy economic sectors. In the Healthcare sector, the Fund's one year return was approximately +3% over the last year compared to a return for the Russell 2000 Healthcare sector of approximately -20%. As mentioned previously, stocks within the biotech and pharmaceutical industries were significant underperformers. The Fund's underweight position in those two industries within Healthcare was a large part of the success we had in that sector over the past year. Additionally, several of our Healthcare holdings generated strong returns due to company specific results. For example, AMN Healthcare Services returned nearly +46% in the last year as the company experienced robust demand for their nursing and physician staffing services and their expectations were for orders to continue to strengthen. In the Energy sector, the Fund managed to generate a small, positive return of just under +1% in the prior 12 months versus a return for energy stocks within the Russell 2000 of nearly -44%. Weak and volatile energy prices were wreaking havoc on earnings, cash flows and balance sheets for companies in the Energy industry. Changes made to the Fund's holdings within this sector dating back to December 2013 proved beneficial as we emphasized owning companies that were well positioned strategically and financially to weather the volatility in energy prices.
The Tributary Small Company Fund's weakest relative performance came from the Telecommunications Services and Financials economic sectors. Relatively speaking, the underperformance in these two sectors was very small. The Fund does not hold any companies within the Telecommunications Services sector which was up 6% in the Russell 2000 in the last 12 months, resulting in the relative underperformance. In the Financial sector, the Fund's trailing 12-month return of approximately -1.7% was just slightly behind the Russell 2000 Financial sector return of -1.6%.
The Fund's average cash position of approximately 3.9% over the last 12 months had a small, positive impact on performance. In a year when the market return was down nearly 10%, any level of cash will be additive.
It is likely that equity market returns will continue to be influenced by interest rate policymakers from around the globe. The increase in interest rates by the U.S. Federal Reserve ("Fed") back in December of 2015 was thought to be the first of several increases to come as the economy strengthens. However, recent comments out of the Fed appear to remain cautious about the improvement in economic activity. Estimates for real gross domestic product ("GDP") growth are being ratcheted back. In 2016, the U.S. economy is expected to grow 2.1% according to economists surveyed by Bloomberg as of April 4, 2016. This is down from the 2.5% estimate from just three months ago. Declines in GDP growth expectations are being seen in other parts of the world as well. China, in particular, has been a focus for investors. Small cap, U.S.-based companies should be more insulated from some of the macroeconomic pressures. However, they are not immune. Supply and demand fundamentals, as well as political posturing by energy producing nations, will likely result in volatile energy markets. Even with having less foreign revenue exposure than larger companies, small caps can still feel the negative impact that a strong U.S. Dollar can have on their ability to compete on the world stage and on translating overseas revenues back to the United States. While small cap valuations are above longer-term averages, they are not at extreme levels. In addition, small cap valuations continue to look more attractive than large cap valuation. Over the last year, the valuation gap between small cap and large cap stocks has actually widened a bit, resulting in a potentially more favorable outlook for stronger relative performance in smaller companies over the next year.
SMALL COMPANY FUND (Unaudited)
| Portfolio Composition as of March 31, 2016 | ||
| Percentage Based on Total Value of Investments | ||
| (Portfolio composition is subject to change) | ||
| Information Technology | 19.6 | % |
| Financials | 19.5 | % |
| Health Care | 14.8 | % |
| Industrials | 13.9 | % |
| Consumer Discretionary | 12.1 | % |
| Materials | 5.7 | % |
| Energy | 4.2 | % |
| Consumer Staples | 3.7 | % |
| Utilities | 3.4 | % |
| Short-Term Investments | 3.1 | % |
| 100.0 | % | |
| Average Annual Total Returns for the Year Ended March 31, 2016* | ||||||
| 1 Year | 5 Year | 10 Year | ||||
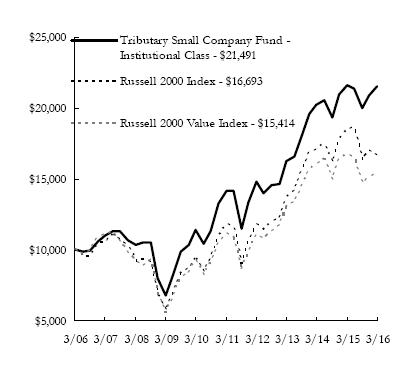
| Tributary Small Company Fund — Institutional Class | -0.65 | % | 8.68 | % | 7.95 | % | ||
| Russell 2000 Index | -9.76 | % | 7.20 | % | 5.26 | % | ||
| Russell 2000 Value Index | -7.72 | % | 6.67 | % | 4.42 | % |
Prospectus Expense Ratio (Gross/Net)† | 1.32 | % | 1.22 | % | ||
Expense Ratio for the Year Ended March 31, 2016 (Gross/Net) | 1.34 | % | 1.18 | % |
| 1 Year | Since Inception†† |
| Tributary Small Company Fund — Institutional Plus Class | -0.48 | % | 9.84 | % |
Prospectus Expense Ratio (Gross/Net)† | 1.10 | % | 1.00 | % | ||
Expense Ratio for the Year Ended March 31, 2016 (Gross/Net) | 1.07 | % | 0.99 | % |
Past performance does not guarantee future results. The performance data quoted represents past performance and current returns may be lower to higher. Total returns include change in share price, reinvestment of dividends and capital gains. The investment return and principal value will fluctuate so that an investor's shares, when redeemed may be worth more or less than the original cost. To obtain performance information current to the most recent month end, please visit our website at www.tributaryfunds.com.
(†) The expense ratios are from the Fund's prospectus dated August 1, 2015. Net expense ratios are net of contractual waivers which are in effect from August 1, 2015 through July 31, 2016.
(††) Commencement date for the Institutional Plus Class was December 17, 2010.
(*) Returns shown do not reflect the deduction of taxes that a shareholder would pay on Fund distributions or the redemption of Fund shares. Investment performance reflects contractual fee waivers in effect for certain periods. Without these fee waivers, the performance would have been lower.
The line chart assumes an initial investment of $10,000 made on March 31, 2006. Total return is based on net change in net asset value ("NAV") assuming reinvestment of all dividends and other distributions.
The performance of Institutional Plus Class will be different than Institutional Class based on differences in fees borne by each class.
The Russell 2000 Index measures the performance of the small-cap segment of the U.S. equity universe. The Russell 2000 Index is a subset of the Russell 3000®Index representing approximately 10% of the total market capitalization of that index. It includes approximately 2000 of the smallest securities based on a combination of their market cap and current index membership. The Russell 2000 Value Index measures the performance of small-cap value segment of the U.S. equities universe. It includes those Russell 2000 companies with lower price-to-book ratios and lower forecasted growth values. The indices are unmanaged and do not reflect the deduction of fees or taxes associated with a mutual fund, such as investment management, administration and other operational fees. Investors cannot directly invest in the indices.
SCHEDULES OF PORTFOLIO INVESTMENTS
March 31, 2016
SHORT-INTERMEDIATE BOND FUND
 | Principal Amount | Security Description | Value |
| Non-U.S. Government Agency Asset-Backed Securities - 40.0% | ||||||
| Asset Backed Securities - 13.2% | ||||||
| $ | 725,000 | Ally Auto Receivables Trust, 1.53%, 04/15/19 | $ | 727,108 | ||
| 865,000 | American Express Credit Account Master Trust, 0.81%, 12/15/21 (a) | 863,379 | ||||
| 1,035,000 | Ascentium Equipment Receivables, LLC, 1.61%, 10/13/20 (b) | 1,031,916 | ||||
| 1,185,000 | BA Credit Card Trust, 1.36%, 09/15/20 | 1,189,029 | ||||
| 720,000 | Cabela's Credit Card Master Note Trust, 1.45%, 06/15/20 (b) | 721,060 | ||||
| 975,000 | Cabela's Credit Card Master Note Trust, 2.17%, 08/16/21 (b) | 991,938 | ||||
| 510,000 | Capital One Multi-Asset Execution Trust, 1.48%, 07/15/20 | 512,734 | ||||
| 580,000 | Capital One Multi-Asset Execution Trust, 1.60%, 05/17/21 | 584,088 | ||||
| 965,000 | Chase Issuance Trust, 1.15%, 01/15/19 | 966,653 | ||||
| 1,124,000 | Citibank Credit Card Issuance Trust, 5.65%, 09/20/19 | 1,195,730 | ||||
| 168,045 | CNL Commercial Mortgage Loan Trust REMIC, 0.87%, 10/25/30 (a)(b) | 145,685 | ||||
| 1,105,000 | Crown Castle Towers, LLC, 4.17%, 08/15/17 (b) | 1,133,837 | ||||
| 585,000 | Eaton Vance CLO, Ltd., 2.07%, 07/15/26 (a)(b) | 578,419 | ||||
| 1,165,000 | Ford Credit Auto Owner Trust, 1.27%, 12/15/17 | 1,164,751 | ||||
| 1,095,000 | Ford Credit Floorplan Master Owner Trust, 3.50%, 01/15/19 | 1,109,181 | ||||
| 700,000 | Honda Auto Receivables Owner Trust, 1.18%, 05/18/20 | 700,198 | ||||
| 600,000 | Magnetite IX CLO, Ltd., 2.04%, 07/25/26 (a)(b) | 595,525 | ||||
| 190,000 | OneMain Financial Issuance Trust, 2.43%, 06/18/24 (b) | 189,523 | ||||
| 686,629 | Preferred Term Securities XII, Ltd./Preferred Term Securities XII, Inc., 1.34%, 12/24/33 (a)(b) | 563,035 | ||||
| 657,564 | Preferred Term Securities XIV, Ltd. / Preferred Term Securities XIV, Inc., 1.12%, 06/24/34 (a)(b) | 496,461 | ||||
| 658,051 | Preferred Term Securities XXIV, Ltd./Preferred Term Securities XXIV, Inc., 0.93%, 03/22/37 (a)(b) | 445,830 | ||||
| 585,000 | Voya CLO, Ltd., 2.07%, 01/18/26 (a)(b) | 579,273 | ||||
| 16,485,353 | ||||||
| Principal Amount | Security Description | Value | |||
| Non-Agency Commercial Mortgage Backed Securities - 11.6% | ||||||
| $ | 286,069 | 7 WTC Depositor LLC Trust REMIC, 4.08%, 03/13/31 (b) | $ | 289,479 | ||
| 335,000 | Banc of America Large Loan Trust REMIC, 8.70%, 01/25/42 (a)(b) | 343,673 | ||||
| 789,412 | Bayview Commercial Asset Trust REMIC, 1.30%, 12/25/33 (a)(b) | 757,183 | ||||
| 1,152,198 | Bear Stearns Commercial Mortgage Securities Trust, 5.69%, 06/11/50 (a) | 1,195,918 | ||||
| 2,634,350 | Citigroup Commercial Mortgage Trust REMIC, 2.16%, 09/10/45 (a)(b) | 201,511 | ||||
| 1,122,046 | Citigroup Commercial Mortgage Trust REMIC, 5.74%, 06/14/50 (a)(b) | 1,136,519 | ||||
| 1,836,924 | COMM Mortgage Trust Interest Only REMIC, 1.49%, 03/10/46 (a) | 88,164 | ||||
| 148,251 | DBUBS Mortgage Trust Interest Only REMIC, 1.30%, 08/10/44 (a)(b) | 968 | ||||
| 540,000 | FREMF Mortgage Trust REMIC, 4.16%, 09/25/44 (a)(b) | 555,664 | ||||
| 735,000 | FREMF Mortgage Trust REMIC, 2.64%, 03/25/45 (a)(b) | 736,278 | ||||
| 6,713,237 | GS Mortgage Securities Trust REMIC, 1.62%, 08/10/44 (a)(b) | 269,069 | ||||
| 1,135,000 | JP Morgan Chase Commercial Mortgage Securities Trust REMIC, 1.69%, 01/15/32 (a)(b) | 1,117,899 | ||||
| 980,000 | JP Morgan Chase Commercial Mortgage Securities Trust REMIC, 2.67%, 01/15/46 | 1,001,295 | ||||
| 560,000 | JP Morgan Chase Commercial Mortgage Securities Trust REMIC, 4.11%, 07/15/46 (b) | 584,701 | ||||
| 1,060,000 | JPMBB Commercial Mortgage Securities Trust REMIC, 2.42%, 07/15/45 | 1,076,193 | ||||
| 471,723 | JPMBB Commercial Mortgage Securities Trust REMIC, 1.25%, 02/15/47 | 469,077 | ||||
| 1,415,536 | Morgan Stanley Bank of America Merrill Lynch Trust Interest Only REMIC, 1.27%, 12/15/48 (a) | 77,108 | ||||
| 659,095 | Morgan Stanley Capital I Trust REMIC, 3.22%, 07/15/49 | 660,812 | ||||
| 467,000 | Wells Fargo Commercial Mortgage Trust REMIC, 2.53%, 10/15/45 | 477,147 | ||||
| 1,010,000 | Wells Fargo Commercial Mortgage Trust REMIC, 2.97%, 12/15/47 | 1,049,239 | ||||
| 162,579 | Wells Fargo-RBS Commercial Mortgage Trust Interest Only REMIC, 0.81%, 02/15/44 (a)(b) | 5,188 | ||||
SCHEDULES OF PORTFOLIO INVESTMENTS
March 31, 2016
SHORT-INTERMEDIATE BOND FUND
| Principal Amount | Security Description | Value | |||
| $ | 725,000 | Wells Fargo-RBS Commercial Mortgage Trust REMIC, 4.00%, 03/15/44 (b) | $ | 758,355 | ||
| 735,000 | Wells Fargo-RBS Commercial Mortgage Trust REMIC, 4.39%, 06/15/44 (b) | 775,015 | ||||
| 825,000 | Wells Fargo-RBS Commercial Mortgage Trust REMIC, 2.19%, 04/15/45 | 826,997 | ||||
| 14,453,452 | ||||||
| Non-Agency Residential Mortgage Backed Securities - 15.2% | ||||||
| 128,037 | Bayview Financial Acquisition Trust REMIC, 6.21%, 05/28/37 (c) | 133,750 | ||||
| 181,068 | Citicorp Residential Mortgage Trust REMIC, 5.63%, 07/25/36 (c) | 186,186 | ||||
| 681,679 | Citicorp Residential Mortgage Trust REMIC, 5.63%, 07/25/36 (c) | 699,041 | ||||
| 796,219 | Citicorp Residential Mortgage Trust REMIC, 5.78%, 09/25/36 (c) | 823,091 | ||||
| 264,651 | Citigroup Global Markets Mortgage Securities VII, Inc. REMIC, 6.93%, 08/25/28 | 269,791 | ||||
| 381,755 | Citigroup Mortgage Loan Trust REMIC, 4.00%, 01/25/35 (a)(b) | 391,629 | ||||
| 484,597 | Citigroup Mortgage Loan Trust REMIC, 0.58%, 08/25/36 (a) | 462,526 | ||||
| 66,733 | CitiMortgage Alternative Loan Trust REMIC, 5.25%, 03/25/21 | 67,207 | ||||
| 525,459 | Conseco Financial Corp., 7.30%, 09/15/26 (a) | 546,060 | ||||
| 265,653 | Countrywide Asset-Backed Certificates REMIC, 0.80%, 11/25/35 (a)(b) | 262,566 | ||||
| 219,365 | Countrywide Asset-Backed Certificates REMIC, 0.61%, 07/25/36 (a) | 215,184 | ||||
| 31,580 | Credit Suisse First Boston Mortgage Securities Corp. REMIC, 5.00%, 08/25/20 | 31,289 | ||||
| 211,564 | Credit-Based Asset Servicing and Securitization, LLC REMIC, 1.56%, 02/25/33 (a) | 195,900 | ||||
| 733,552 | Credit-Based Asset Servicing and Securitization, LLC REMIC, 6.02%, 12/25/37 (b)(c) | 764,751 | ||||
| 630,559 | First NLC Trust REMIC, 0.70%, 02/25/36 (a) | 619,850 | ||||
| 654,354 | Fremont Home Loan Trust REMIC, 1.30%, 11/25/34 (a) | 550,562 | ||||
| 322,454 | Goldman Sachs Alternative Mortgage Products Trust REMIC, 1.08%, 03/25/34 (a) | 322,454 | ||||
| 79,005 | Goldman Sachs Alternative Mortgage Products Trust REMIC, 0.64%, 01/25/36 (a) | 78,443 | ||||
| Principal Amount | Security Description | Value |
| $ | 1,200,000 | Goldman Sachs Alternative Mortgage Products Trust REMIC, 0.93%, 05/25/36 (a)(b) | $ | 1,116,453 | ||
| 1,126,276 | HSBC Home Equity Loan Trust USA, 1.93%, 11/20/36 (a) | 1,126,906 | ||||
| 155,549 | Irwin Home Equity Loan Trust, 1.78%, 02/25/29 (a) | 150,255 | ||||
| 167,524 | Irwin Whole Loan Home Equity Trust REMIC, 1.53%, 11/25/28 (a) | 163,499 | ||||
| 228,202 | Irwin Whole Loan Home Equity Trust REMIC, 0.90%, 12/25/29 (a) | 222,675 | ||||
| 1,046,446 | Irwin Whole Loan Home Equity Trust REMIC, 1.78%, 06/25/34 (a) | 992,882 | ||||
| 840,000 | JP Morgan Mortgage Acquisition Trust REMIC, 0.66%, 07/25/36 (a) | 795,260 | ||||
| 321,197 | Lehman ABS Manufactured Housing Contract Trust REMIC, 4.35%, 04/15/40 | 325,778 | ||||
| 895,000 | Long Beach Mortgage Loan Trust REMIC, 1.33%, 10/25/34 (a) | 800,748 | ||||
| 86,271 | Morgan Stanley Home Equity Loan Trust REMIC, 1.14%, 12/25/34 (a) | 86,239 | ||||
| 340,627 | New Residential Mortgage Loan Trust REMIC, 3.75%, 05/28/52 (a)(b) | 352,114 | ||||
| 159,583 | New Residential Mortgage Loan Trust REMIC, 3.75%, 11/25/54 (a)(b) | 164,635 | ||||
| 436,636 | New Residential Mortgage Loan Trust REMIC, 3.75%, 08/25/55 (a) | 450,913 | ||||
| 173,693 | Nomura Asset Acceptance Corp. Alternative Loan Trust REMIC, 6.00%, 03/25/47 (c) | 124,148 | ||||
| 210,000 | NovaStar Mortgage Funding Trust REMIC, 2.16%, 03/25/35 (a) | 202,554 | ||||
| 837,470 | Oakwood Mortgage Investors, Inc. REMIC, 0.38%, 03/15/18 (a)(b) | 797,370 | ||||
| 535,242 | Park Place Securities, Inc. Asset-Backed Pass-Through Certificates REMIC, 1.41%, 10/25/34 (a) | 528,599 | ||||
| 193,939 | Popular ABS Mortgage Pass-Through Trust REMIC, 4.42%, 11/25/35 (c) | 193,419 | ||||
| 158,463 | Renaissance Home Equity Loan Trust REMIC, 4.88%, 02/25/35 (c) | 159,227 | ||||
| 391,390 | Renaissance Home Equity Loan Trust REMIC, 4.50%, 08/25/35 (c) | 391,371 | ||||
| 265,427 | Residential Accredit Loans, Inc. Trust REMIC, 13.96%, 03/25/18 (a) | 277,956 | ||||
| 58,012 | Residential Accredit Loans, Inc. Trust REMIC, 6.00%, 10/25/34 | 59,975 | ||||
| 124,477 | Residential Accredit Loans, Inc. Trust REMIC, 5.50%, 02/25/35 | 123,045 | ||||
| 36,636 | Residential Asset Mortgage Products, Inc. Trust REMIC, 4.02%, 03/25/33 (a) | 36,710 |
SCHEDULES OF PORTFOLIO INVESTMENTS
March 31, 2016
SHORT-INTERMEDIATE BOND FUND
| Principal Amount | Security Description | Value | |||
| $ | 850,000 | Residential Asset Mortgage Products, Inc. Trust REMIC, 0.94%, 06/25/35 (a) | $ | 830,992 | ||
| 135,439 | Residential Asset Securities Corp. Trust REMIC, 5.96%, 09/25/31 (a) | 138,281 | ||||
| 63,541 | Residential Asset Securities Corp. Trust REMIC, 4.47%, 03/25/32 (a) | 63,603 | ||||
| 121,651 | Residential Asset Securities Corp. Trust REMIC, 3.87%, 05/25/33 (a) | 123,635 | ||||
| 118,960 | Residential Asset Securities Corp. Trust REMIC, 4.54%, 12/25/33 (a) | 121,947 | ||||
| 117,165 | Residential Asset Securitization Trust REMIC, 3.75%, 10/25/18 | 117,006 | ||||
| 211,474 | Structured Asset Securities Corp. Mortgage Loan Trust REMIC, 5.73%, 06/25/35 (c) | 213,166 | ||||
| 123,828 | Structured Asset Securities Corp. Mortgage Pass-Through Certificates REMIC, 2.08%, 11/25/34 (a) | 120,644 | ||||
| 586,000 | Towd Point Mortgage Trust REMIC, 3.50%, 02/25/55 (a)(b) | 596,530 | ||||
| 244,101 | Vanderbilt Acquisition Loan Trust REMIC, 7.33%, 05/07/32 (a) | 260,309 | ||||
| 40,866 | Wells Fargo Home Equity Asset-Backed Securities Trust REMIC, 0.81%, 12/25/35 (a) | 40,697 | ||||
| 6,147 | Wells Fargo Home Equity Asset-Backed Securities Trust REMIC, 0.57%, 07/25/36 (a) | 6,145 | ||||
| 18,895,966 | ||||||
| Total Non-U.S. Government Agency Asset-Backed Securities (Cost $49,967,881) | 49,834,771 |
| Corporate Bonds - 27.6% | ||||||
| Consumer Discretionary - 3.9% | ||||||
| 440,000 | AMC Networks, Inc., 4.75%, 12/15/22 | 441,100 | ||||
| 405,000 | Hanesbrands, Inc., 6.38%, 12/15/20 | 419,175 | ||||
| 320,000 | Hilton Worldwide Finance, LLC / Hilton Worldwide Finance Corp., 5.63%, 10/15/21 | 331,584 | ||||
| 1,045,000 | Newell Rubbermaid, Inc., 2.05%, 12/01/17 | 1,048,251 | ||||
| 720,000 | Newell Rubbermaid, Inc., 3.15%, 04/01/21 | 739,928 | ||||
| 445,000 | PVH Corp., 4.50%, 12/15/22 | 456,125 | ||||
| 405,000 | The Goodyear Tire & Rubber Co., 6.50%, 03/01/21 | 426,263 | ||||
| 970,000 | Whirlpool Corp., 1.65%, 11/01/17 | 972,193 | ||||
| 4,834,619 | ||||||
| Consumer Staples - 2.8% | ||||||
| 562,000 | Bottling Group, LLC, 5.13%, 01/15/19 | 621,446 | ||||
| 975,000 | Cargill, Inc., 1.90%, 03/01/17 (b) | 983,036 | ||||
| 550,000 | Church & Dwight Co., Inc., 2.45%, 12/15/19 | 556,721 | ||||
| Principal Amount | Security Description | Value |
| $ | 346,000 | Church & Dwight Co., Inc., 2.88%, 10/01/22 | $ | 350,136 | ||
| 119,000 | Kraft Heinz Foods Co., 4.88%, 02/15/25 (b) | 131,145 | ||||
| 395,000 | Land O'Lakes Capital Trust I, 7.45%, 03/15/28 (b) | 414,750 | ||||
| 475,000 | PepsiCo., Inc., 1.50%, 02/22/19 | 480,982 | ||||
| 3,538,216 | ||||||
| Energy - 1.2% | ||||||
| 900,000 | Anadarko Petroleum Corp., 6.38%, 09/15/17 | 942,497 | ||||
| 500,000 | Occidental Petroleum Corp., 1.75%, 02/15/17 | 501,027 | ||||
| 1,443,524 | ||||||
| Financials - 12.5% | ||||||
| 910,000 | American Express Bank FSB, 0.74%, 06/12/17 (a) | 904,540 | ||||
| 1,280,000 | American Honda Finance Corp., 1.60%, 02/16/18 (b) | 1,287,877 | ||||
| 1,060,000 | Bank of America Corp., MTN, 5.65%, 05/01/18 | 1,138,018 | ||||
| 1,090,000 | Chubb INA Holdings, Inc., 2.30%, 11/03/20 | 1,108,615 | ||||
| 1,150,000 | Citigroup, Inc., 2.55%, 04/08/19 | 1,167,411 | ||||
| 510,000 | Genworth Holdings, Inc., 4.80%, 02/15/24 | 373,575 | ||||
| 1,135,000 | JPMorgan Chase & Co., 7.90% (callable at 100 beginning 04/30/18) (a)(d) | 1,135,000 | ||||
| 1,020,000 | KeyCorp, MTN, 2.90%, 09/15/20 | 1,037,142 | ||||
| 1,140,000 | Metropolitan Life Global Funding I, 2.30%, 04/10/19 (b) | 1,159,994 | ||||
| 1,100,000 | Morgan Stanley, 4.75%, 03/22/17 | 1,136,153 | ||||
| 1,086,000 | Murray Street Investment Trust I, 4.65%, 03/09/17 (c) | 1,116,568 | ||||
| 670,000 | Pricoa Global Funding I, MTN, 0.84%, 06/24/16 (a)(b) | 670,082 | ||||
| 1,030,000 | Regions Financial Corp., 2.00%, 05/15/18 | 1,023,589 | ||||
| 1,060,000 | The Hartford Financial Services Group, Inc., 5.50%, 03/30/20 | 1,176,719 | ||||
| 1,130,000 | Wells Fargo & Co., Series K, 7.98% (callable at 100 beginning 03/15/18) (a)(d) | 1,169,437 | ||||
| 15,604,720 | ||||||
| Industrials - 2.4% | ||||||
| 1,077,000 | Burlington Northern Santa Fe, LLC, 5.75%, 03/15/18 | 1,171,365 | ||||
| 290,000 | General Electric Capital Corp., MTN, 0.89%, 08/07/18 (a) | 285,750 | ||||
| 310,000 | Huntington Ingalls Industries, Inc., 5.00%, 11/15/25 (b) | 324,725 | ||||
| 1,185,000 | Textron, Inc., 3.65%, 03/01/21 | 1,221,532 | ||||
| 3,003,372 | ||||||
SCHEDULES OF PORTFOLIO INVESTMENTS
March 31, 2016
SHORT-INTERMEDIATE BOND FUND
| Principal Amount | Security Description | Value | |||
| Information Technology - 2.1% | ||||||
| $ | 250,000 | Apple, Inc., 1.70%, 02/22/19 | $ | 253,861 | ||
| 1,050,000 | Oracle Corp., 2.25%, 10/08/19 | 1,083,604 | ||||
| 1,197,000 | QUALCOMM, Inc., 2.25%, 05/20/20 | 1,227,523 | ||||
| 2,564,988 | ||||||
| Telecommunication Services - 2.0% | ||||||
| 449,000 | AT&T, Inc., 2.40%, 03/15/17 | 454,261 | ||||
| 715,000 | AT&T, Inc., 3.80%, 03/15/22 | 753,853 | ||||
| 1,194,000 | Verizon Communications, Inc., 2.63%, 02/21/20 | 1,228,656 | ||||
| 2,436,770 | ||||||
| Utilities - 0.7% | ||||||
| 850,000 | PacifiCorp, 5.50%, 01/15/19 | 936,597 | ||||
| Total Corporate Bonds (Cost $34,279,626) | 34,362,806 |
| Government & Agency Obligations - 27.1% | |||||||
| GOVERNMENT SECURITIES - 23.7% | |||||||
| Municipals - 1.5% | |||||||
| 380,000 | City of Omaha, NE Sewer Revenue, Nebraska RB, 2.40%, 12/01/16 | 384,074 | |||||
| 250,000 | Lincoln Airport Authority, Nebraska RB, 1.33%, 07/01/16 | 250,077 | |||||
| 585,000 | Montana Board of Housing, Montana RB, 1.60%, 06/01/16 | 585,322 | |||||
| 245,000 | North Carolina Housing Finance Agency, North Carolina RB, 2.34%, 01/01/19 | 249,018 | |||||
| 325,000 | State of Mississippi, GO Bond, 2.63%, 11/01/16 | 328,500 | |||||
| 1,796,991 | |||||||
| U.S. Treasury Securities - 22.2% | |||||||
| 4,200,000 | U.S. Treasury Note, 0.63%, 09/30/17 | 4,194,750 | |||||
| 20,760,000 | U.S. Treasury Note, 1.25%, 01/31/19 | 20,995,169 | |||||
| 2,400,000 | U.S. Treasury Note, 2.00%, 02/28/21 | 2,488,032 | |||||
| 27,677,951 | |||||||
| U.S. GOVERNMENT MORTAGE BACKED-SECURITIES - 3.4% | |||||||
| Federal Home Loan Mortgage Corp. - 0.1% | |||||||
| 3,033,652 | Federal Home Loan Mortgage Corp. Multifamily Structured Pass Through Certificates Interest Only REMIC, 1.55%, 08/25/16 (a) | 6,347 | |||||
| 177,889 | Federal Home Loan Mortgage Corp. REMIC, 4.00%, 03/15/20 | 184,122 | |||||
| 190,469 | |||||||
| Federal National Mortgage Association - 2.2% | ||||||
| 883,244 | Federal National Mortgage Association Pool #AJ4087, 3.00%, 10/01/26 | 924,742 | ||||
| 85,250 | Federal National Mortgage Association REMIC, 4.00%, 07/25/21 | 88,442 | ||||
| 214,636 | Federal National Mortgage Association REMIC, 4.00%, 02/25/26 | 227,424 | ||||
| 316,435 | Federal National Mortgage Association REMIC, 3.00%, 04/25/37 | 323,655 | ||||
| Shares or Principal Amount | Security Description | Value |
| $ | 112,018 | Federal National Mortgage Association REMIC, 5.00%, 03/25/39 | $ | 3,187 | |||
| 530,071 | Federal National Mortgage Association REMIC, 2.50%, 09/25/39 | 541,271 | |||||
| 630,369 | Federal National Mortgage Association REMIC, 3.50%, 05/25/41 | 669,994 | |||||
| 2,778,715 | |||||||
| Government National Mortgage Association - 1.1% | |||||||
| 369,646 | Government National Mortgage Association II Pool #751404, 4.72%, 06/20/61 | 387,021 | |||||
| 937,998 | Government National Mortgage Association REMIC, 2.67%, 02/16/44 | 954,168 | |||||
| 1,341,189 | |||||||
Total Government & Agency Obligations (Cost $33,454,482) | 33,785,315 |
| Preferred Stocks - 0.4% | |||||||
| Financials - 0.4% | |||||||
| 550 | U.S. Bancorp., Series A, 3.50% (callable at 1,000 beginning on 05/02/16) (a)(d) | 438,075 | |||||
| Total Preferred Stocks (Cost $564,327) | 438,075 |
| Short-Term Investments - 4.1% | |||||||
| Investment Company - 4.1% | |||||||
| 5,123,220 | BlackRock Liquidity Funds T-Fund Portfolio, 0.18% (e) | 5,123,220 | |||||
| Total Short-Term Investments (Cost $5,123,220) | 5,123,220 |
| Total Investments - 99.2% (Cost $123,389,536) | 123,544,187 |
| Other assets in excess of liabilities – 0.8% | 965,753 | ||
| NET ASSETS – 100.0% | $ | 124,509,940 |
| (a) | Variable rate security. Rate presented is as of March 31, 2016. |
| (b) | The Sub-Adviser has deemed this security which is exempt from registration under the Securities Act of 1933 to be liquid based on procedures approved by Tributary Funds' Board of Directors. As of March 31, 2016, the aggregate value of these liquid securities was $24,421,661 which represented 19.6% of net assets. |
| (c) | Debt obligation initially issued at one coupon rate which converts to higher coupon rate at a specified date. Rate presented is as of March 31, 2016. |
| (d) | Perpetual maturity security. |
| (e) | Dividend yield changes to reflect current market conditions. Rate was the quoted yield as of March 31, 2016. |
| ABS | Asset Backed Security |
| CLO | Collateralized Loan Obligation |
| GO | General Obligation |
| LLC | Limited Liability Company |
| MTN | Medium Term Note |
| RB | Revenue Bond |
| REMIC | Real Estate Mortgage Investment Conduit |
SCHEDULES OF PORTFOLIO INVESTMENTS
March 31, 2016
INCOME FUND
| Principal Amount | Security Description | Value |
| Non-U.S. Government Agency Asset-Backed Securities - 31.9% | ||||||
| Asset Backed Securities - 8.9% | ||||||
| $ | 800,000 | Ally Auto Receivables Trust, 1.53%, 04/15/19 | $ | 802,327 | ||
| 735,000 | Ascentium Equipment Receivables, LLC, 1.57%, 12/11/17 (a) | 736,135 | ||||
| 1,220,000 | Ascentium Equipment Receivables, LLC, 1.61%, 10/13/20 (a) | 1,216,364 | ||||
| 1,000,000 | BA Credit Card Trust, 1.36%, 09/15/20 | 1,003,400 | ||||
| 855,000 | Cabela's Credit Card Master Note Trust, 1.63%, 02/18/20 (a) | 856,749 | ||||
| 1,085,000 | Cabela's Credit Card Master Note Trust, 2.71%, 02/17/26 (a) | 1,103,625 | ||||
| 1,000,000 | Capital One Multi-Asset Execution Trust, 1.48%, 07/15/20 | 1,005,361 | ||||
| 785,000 | Chase Issuance Trust, 1.15%, 01/15/19 | 786,345 | ||||
| 1,440,000 | Citibank Credit Card Issuance Trust, 5.65%, 09/20/19 | 1,531,896 | ||||
| 152,671 | CNL Commercial Mortgage Loan Trust (insured by AMBAC Assurance Corp.) REMIC, 0.87%, 10/25/30 (a)(b) | 132,356 | ||||
| 630,000 | Eaton Vance CLO, Ltd., 2.07%, 07/15/26 (a)(b) | 622,912 | ||||
| 1,226,000 | Ford Credit Auto Owner Trust, 1.27%, 12/15/17 | 1,225,738 | ||||
| 925,000 | Ford Credit Floorplan Master Owner Trust, 3.50%, 01/15/19 | 936,980 | ||||
| 1,040,000 | Magnetite IX CLO, Ltd., 2.04%, 07/25/26 (a)(b) | 1,032,244 | ||||
| 990,000 | OneMain Financial Issuance Trust, 2.43%, 06/18/24 (a) | 987,513 | ||||
| 1,605,029 | Preferred Term Securities XII, Ltd. / Preferred Term Securities XII, Inc., 1.34%, 12/24/33 (a)(b) | 1,316,124 | ||||
| 657,564 | Preferred Term Securities XIV, Ltd. / Preferred Term Securities XIV, Inc., 1.12%, 06/24/34 (a)(b) | 496,461 | ||||
| 896,396 | Preferred Term Securities XXI, Ltd. / Preferred Term Securities XXI, Inc., 1.28%, 03/22/38 (a)(b) | 416,824 | ||||
| 707,160 | Preferred Term Securities XXIV, Ltd. / Preferred Term Securities XXIV, Inc., 0.93%, 03/22/37 (a)(b) | 479,101 | ||||
| 650,000 | Voya CLO, Ltd., 2.07%, 01/18/26 (a)(b) | 643,637 | ||||
| 17,332,092 | ||||||
| Non-Agency Commercial Mortgage Backed Securities - 9.5% | ||||||
| 597,111 | 7 WTC Depositor, LLC Trust, 4.08%, 03/13/31 (a) | 604,229 | ||||
| 1,200,000 | American Tower Trust I, 3.07%, 03/15/23 (a) | 1,200,021 | ||||
| Principal Amount | Security Description | Value | |||
| $ | 934,369 | Bayview Commercial Asset Trust REMIC, 1.30%, 12/25/33 (a)(b) | $ | 896,222 | ||
| 787,335 | Bear Stearns Commercial Mortgage Securities Trust REMIC, 5.69%, 06/11/50 (b) | 817,211 | ||||
| 3,998,905 | Citigroup Commercial Mortgage Trust REMIC, 2.16%, 09/10/45 (a)(b) | 305,891 | ||||
| 1,683,069 | Citigroup Commercial Mortgage Trust REMIC, 5.74%, 06/14/50 (a)(b) | 1,704,778 | ||||
| 1,836,924 | COMM Mortgage Trust Interest Only REMIC, 1.49%, 03/10/46 (b) | 88,164 | ||||
| 900,000 | Credit Suisse First Boston Mortgage Securities Corp. REMIC, 5.74%, 05/15/36 (a)(b) | 944,748 | ||||
| 148,251 | DBUBS Mortgage Trust Interest Only REMIC, 1.30%, 08/10/44 (a)(b) | 968 | ||||
| 735,000 | FREMF Mortgage Trust REMIC, 4.16%, 09/25/44 (a)(b) | 756,321 | ||||
| 1,030,000 | FREMF Mortgage Trust REMIC, 2.64%, 03/25/45 (a)(b) | 1,031,791 | ||||
| 1,623,714 | FRESB Mortgage Trust REMIC, 3.22%, 08/25/35 (b) | 1,658,462 | ||||
| 10,168,387 | GS Mortgage Securities Trust REMIC, 1.62%, 08/10/44 (a)(b) | 407,553 | ||||
| 840,000 | JP Morgan Chase Commercial Mortgage Securities Trust REMIC, 1.69%, 01/15/32 (a)(b) | 827,343 | ||||
| 1,055,000 | JP Morgan Chase Commercial Mortgage Securities Trust REMIC, 2.67%, 01/15/46 | 1,077,924 | ||||
| 800,000 | JP Morgan Chase Commercial Mortgage Securities Trust REMIC, 4.11%, 07/15/46 (a) | 835,288 | ||||
| 1,200,000 | JPMBB Commercial Mortgage Securities Trust REMIC, 2.42%, 07/15/45 | 1,218,332 | ||||
| 899,326 | Morgan Stanley Capital I Trust REMIC, 3.22%, 07/15/49 | 901,668 | ||||
| 1,131,711 | Wells Fargo Commercial Mortgage Trust Interest Only REMIC, 2.05%, 10/15/45 (a)(b) | 95,312 | ||||
| 890,000 | Wells Fargo Commercial Mortgage Trust REMIC, 2.53%, 10/15/45 | 909,338 | ||||
| 995,000 | Wells Fargo-RBS Commercial Mortgage Trust REMIC, 2.63%, 03/15/45 | 1,017,083 | ||||
| 1,045,000 | Wells Fargo-RBS Commercial Mortgage Trust REMIC, 2.19%, 04/15/45 | 1,047,529 | ||||
| 695,019 | Wells Fargo-RBS Commercial Mortgage Trust REMIC, 2.16%, 11/15/45 (a)(b) | 60,549 | ||||
| 18,406,725 | ||||||
SCHEDULES OF PORTFOLIO INVESTMENTS
March 31, 2016
INCOME FUND
| Principal Amount | Security Description | Value |
| Non-Agency Residential Mortgage Backed Securities - 13.5% | ||||||
| $ | 215,291 | Bayview Financial Mortgage Pass-Through Trust REMIC, 5.70%, 02/28/41 (c) | $ | 244,393 | ||
| 217,002 | Citicorp Residential Mortgage Trust REMIC, 5.63%, 07/25/36 (c) | 223,135 | ||||
| 739,871 | Citicorp Residential Mortgage Trust REMIC, 5.63%, 07/25/36 (c) | 758,716 | ||||
| 1,064,824 | Citicorp Residential Mortgage Trust REMIC, 5.78%, 09/25/36 (c) | 1,100,760 | ||||
| 891,238 | Citigroup Global Markets Mortgage Securities VII, Inc. REMIC, 6.93%, 08/25/28 | 908,549 | ||||
| 1,149,920 | Citigroup Mortgage Loan Trust REMIC, 4.00%, 01/25/35 (a)(b) | 1,179,662 | ||||
| 510,102 | Citigroup Mortgage Loan Trust REMIC, 0.58%, 08/25/36 (b) | 486,869 | ||||
| 366,103 | Citigroup Mortgage Loan Trust, Inc. REMIC, 6.50%, 07/25/34 | 380,752 | ||||
| 98,510 | CitiMortgage Alternative Loan Trust REMIC, 5.25%, 03/25/21 | 99,210 | ||||
| 822,457 | Conseco Financial Corp., 7.30%, 09/15/26 (b) | 854,703 | ||||
| 277,532 | Countrywide Asset-Backed Certificates REMIC, 0.80%, 11/25/35 (a)(b) | 274,306 | ||||
| 137,568 | Countrywide Asset-Backed Certificates REMIC, 0.61%, 07/25/36 (b) | 134,946 | ||||
| 31,580 | Credit Suisse First Boston Mortgage Securities Corp. REMIC, 5.00%, 08/25/20 | 31,289 | ||||
| 62,686 | Credit Suisse First Boston Mortgage Securities Corp. REMIC, 5.75%, 04/25/33 | 64,419 | ||||
| 211,564 | Credit-Based Asset Servicing and Securitization, LLC REMIC, 1.56%, 02/25/33 (b) | 195,900 | ||||
| 656,336 | Credit-Based Asset Servicing and Securitization, LLC REMIC, 6.02%, 12/25/37 (a)(c) | 684,251 | ||||
| 809,864 | First NLC Trust REMIC, 0.70%, 02/25/36 (b) | 796,111 | ||||
| 463,501 | Fremont Home Loan Trust, 1.30%, 11/25/34 (b) | 389,982 | ||||
| 223,237 | Goldman Sachs Alternative Mortgage Products Trust REMIC, 1.08%, 03/25/34 (b) | 223,237 | ||||
| 72,928 | Goldman Sachs Alternative Mortgage Products Trust REMIC, 0.64%, 01/25/36 (b) | 72,409 | ||||
| 865,000 | Goldman Sachs Alternative Mortgage Products Trust REMIC, 0.93%, 05/25/36 (a)(b) | 804,777 | ||||
| Principal Amount | Security Description | Value | |||
| $ | 540,615 | Greenpoint Manufactured Housing, 7.27%, 06/15/29 | $ | 532,540 | ||
| 993,366 | HSBC Home Equity Loan Trust USA, 1.93%, 11/20/36 (b) | 993,923 | ||||
| 155,549 | Irwin Home Equity Loan Trust, 1.78%, 02/25/29 (b) | 150,254 | ||||
| 174,362 | Irwin Whole Loan Home Equity Trust REMIC, 1.53%, 11/25/28 (b) | 170,172 | ||||
| 385,694 | Irwin Whole Loan Home Equity Trust REMIC, 0.90%, 12/25/29 (b) | 376,351 | ||||
| 1,232,508 | Irwin Whole Loan Home Equity Trust REMIC, 1.78%, 06/25/34 (b) | 1,169,420 | ||||
| 860,000 | JP Morgan Mortgage Acquisition Trust REMIC, 0.66%, 07/25/36 (b) | 814,195 | ||||
| 469,982 | Lehman ABS Manufactured Housing Contract Trust REMIC, 4.35%, 04/15/40 | 476,686 | ||||
| 867,050 | New Residential Mortgage Loan Trust REMIC, 3.75%, 05/28/52 (a)(b) | 896,291 | ||||
| 880,186 | New Residential Mortgage Loan Trust REMIC, 3.75%, 11/25/54 (a)(b) | 908,047 | ||||
| 1,556,096 | New Residential Mortgage Loan Trust REMIC, 3.75%, 08/25/55 (b) | 1,606,978 | ||||
| 188,167 | Nomura Asset Acceptance Corp. Alternative Loan Trust REMIC, 6.00%, 03/25/47 (c) | 134,494 | ||||
| 249,000 | NovaStar Mortgage Funding Trust REMIC, 2.16%, 03/25/35 (b) | 240,171 | ||||
| 363,812 | NovaStar Mortgage Funding Trust REMIC, 2.08%, 03/25/35 (b) | 359,418 | ||||
| 264,105 | Renaissance Home Equity Loan Trust REMIC, 4.88%, 02/25/35 (c) | 265,378 | ||||
| 620,741 | Renaissance Home Equity Loan Trust REMIC, 4.50%, 08/25/35 (c) | 620,711 | ||||
| 311,623 | Residential Accredit Loans, Inc. Trust REMIC, 13.96%, 03/25/18 (b) | 326,332 | ||||
| 286,476 | Residential Accredit Loans, Inc. Trust REMIC, 6.00%, 10/25/34 | 296,171 | ||||
| �� | 83,853 | Residential Accredit Loans, Inc. Trust REMIC, 5.50%, 02/25/35 | 82,888 | |||
| 53,429 | Residential Asset Mortgage Products, Inc. Trust (insured by AMBAC Assurance Corp.) REMIC, 4.02%, 03/25/33 (b) | 53,537 | ||||
| 870,000 | Residential Asset Mortgage Products, Inc. Trust REMIC, 0.94%, 06/25/35 (b) | 850,545 | ||||
| 113,769 | Residential Asset Securities Corp. Trust REMIC, 5.96%, 09/25/31 (b) | 116,156 | ||||
| 40,344 | Residential Asset Securities Corp. Trust REMIC, 4.47%, 03/25/32 (b) | 40,383 | ||||
| 150,631 | Residential Asset Securities Corp. Trust REMIC, 4.54%, 12/25/33 (b) | 154,413 | ||||
| 1,574,949 | Sequoia Mortgage Trust REMIC, 3.00%, 11/25/30 (a)(b) | 1,603,898 |
SCHEDULES OF PORTFOLIO INVESTMENTS
March 31, 2016
INCOME FUND
| Principal Amount | Security Description | Value | |||
| $ | 211,474 | Structured Asset Securities Corp. Mortgage Loan Trust REMIC, 5.73%, 06/25/35 (c) | $ | 213,166 | ||
| 17,309 | Structured Asset Securities Corp. Mortgage Pass-Through Certificates REMIC, 5.80%, 09/25/33 (c) | 17,446 | ||||
| 134,147 | Structured Asset Securities Corp. Mortgage Pass-Through Certificates REMIC, 2.08%, 11/25/34 (b) | 130,698 | ||||
| 181,812 | Structured Asset Securities Corp. Mortgage Pass-Through Certificates REMIC, 1.48%, 11/25/34 (b) | 173,861 | ||||
| 1,825,000 | Towd Point Mortgage Trust REMIC, 3.50%, 02/25/55 (a)(b) | 1,857,793 | ||||
| 652,390 | Vanderbilt Acquisition Loan Trust REMIC, 7.33%, 05/07/32 (b) | 695,707 | ||||
| 77,098 | Wells Fargo Home Equity Asset-Backed Securities Trust REMIC, 0.81%, 12/25/35 (b) | 76,779 | ||||
| 3,686 | Wells Fargo Home Equity Asset-Backed Securities Trust REMIC, 0.57%, 07/25/36 (b) | 3,685 | ||||
| 26,316,863 | ||||||
| Total Non-U.S. Government Agency Asset-Backed Securities (Cost $62,544,273) | 62,055,680 |
| Corporate Bonds - 23.9% | ||||||
| Consumer Discretionary - 3.3% | ||||||
| 729,000 | AMC Networks, Inc., 4.75%, 12/15/22 | 730,822 | ||||
| 959,000 | Dollar General Corp., 3.25%, 04/15/23 | 968,218 | ||||
| 460,000 | Hanesbrands, Inc., 6.38%, 12/15/20 | 476,100 | ||||
| 490,000 | Hilton Worldwide Finance, LLC / Hilton Worldwide Finance Corp., 5.63%, 10/15/21 | 507,738 | ||||
| 615,000 | Newell Rubbermaid, Inc., 4.00%, 06/15/22 | 633,695 | ||||
| 320,000 | Newell Rubbermaid, Inc., 4.00%, 12/01/24 | 326,764 | ||||
| 300,000 | Newell Rubbermaid, Inc., 4.20%, 04/01/26 | 313,770 | ||||
| 760,000 | PVH Corp., 4.50%, 12/15/22 | 779,000 | ||||
| 665,000 | The Goodyear Tire & Rubber Co., 6.50%, 03/01/21 | 699,912 | ||||
| 925,000 | Whirlpool Corp., 4.70%, 06/01/22 | 1,017,047 | ||||
| 6,453,066 | ||||||
| Consumer Staples - 2.5% | ||||||
| 534,000 | Cargill, Inc., 4.10%, 11/01/42 (a) | 512,640 | ||||
| 1,165,000 | Church & Dwight Co., Inc. 2.88%, 11/01/22 | 1,178,926 | ||||
| 165,000 | Kraft Heinz Foods Co., 4.88%, 02/15/25 (a) | 181,840 | ||||
| 455,000 | Land O'Lakes Capital Trust I, 7.45%, 03/15/28 (a) | 477,750 | ||||
| 1,012,000 | PepsiCo, Inc., 4.88%, 11/01/40 | 1,139,352 | ||||
| 155,000 | PepsiCo., Inc., 2.85%, 02/24/26 | 159,184 | ||||
| Principal Amount | Security Description | Value | |||
| $ | 895,000 | Wal-Mart Stores, Inc., 5.63%, 04/15/41 | $ | 1,157,613 | ||
| 4,807,305 | ||||||
| Energy - 1.1% | ||||||
| 905,000 | Anadarko Petroleum Corp., 3.45%, 07/15/24 | 806,245 | ||||
| 515,000 | EOG Resources, Inc., 4.15%, 01/15/26 | 534,021 | ||||
| 645,000 | Tosco Corp., 8.13%, 02/15/30 | 794,646 | ||||
| 2,134,912 | ||||||
| Financials - 9.8% | ||||||
| 485,153 | Altitude Investments 16, LLC, 2.49%, 03/14/26 | 498,691 | ||||
| 1,120,000 | American Honda Finance Corp., 1.60%, 02/16/18 (a) | 1,126,892 | ||||
| 1,139,000 | Bank of America Corp., MTN, 4.13%, 01/22/24 | 1,206,983 | ||||
| 550,000 | Berkshire Hathaway, Inc., 2.20%, 03/15/21 | 561,440 | ||||
| 355,000 | Chubb INA Holdings, Inc., 5.90%, 06/15/19 | 399,949 | ||||
| 1,125,000 | Citigroup, Inc., 2.55%, 04/08/19 | 1,142,033 | ||||
| 1,140,000 | CME Group, Inc./IL, 3.00%, 03/15/25 | 1,155,845 | ||||
| 494,000 | Crown Castle International Corp., 4.88%, 04/15/22 | 528,679 | ||||
| 880,000 | Genworth Holdings, Inc., 4.80%, 02/15/24 | 644,600 | ||||
| 1,150,000 | JPMorgan Chase & Co., Series 1, 7.90% (callable at 100 beginning 04/30/18) (b)(d) | 1,150,000 | ||||
| 1,050,000 | KeyCorp, MTN, 2.90%, 09/15/20 | 1,067,646 | ||||
| 1,071,000 | Metropolitan Life Global Funding I, 2.30%, 04/10/19 (a) | 1,089,784 | ||||
| 1,155,000 | Morgan Stanley, 3.75%, 02/25/23 | 1,203,820 | ||||
| 865,000 | Prudential Financial, Inc., MTN, 7.38%, 06/15/19 | 1,004,005 | ||||
| 1,020,000 | Regions Financial Corp., 2.00%, 05/15/18 | 1,013,652 | ||||
| 520,000 | The Bank of New York Mellon Corp., MTN, 2.30%, 09/11/19 | 533,061 | ||||
| 707,000 | The Chubb Corp., 6.80%, 11/15/31 | 948,235 | ||||
| 974,000 | The Goldman Sachs Group, Inc., 6.45%, 05/01/36 | 1,129,565 | ||||
| 939,000 | The Hartford Financial Services Group, Inc., 5.50%, 03/30/20 | 1,042,395 | ||||
| 363,000 | UBS Preferred Funding Trust V, Series 1, 6.24% (callable at 100 beginning 05/15/16) (b)(d) | 363,000 | ||||
| 1,145,000 | Wells Fargo & Co., Series K, 7.98% (callable at 100 beginning 03/15/18) (b)(d) | 1,184,961 | ||||
| 18,995,236 | ||||||
| Health Care - 0.6% | ||||||
| $ | 1,010,000 | Becton Dickinson and Co., 3.73%, 12/15/24 | $ | 1,075,695 | ||
SCHEDULES OF PORTFOLIO INVESTMENTS
March 31, 2016
INCOME FUND
| Principal Amount | Security Description | Value | |||
| $ | 160,000 | Pfizer, Inc., 6.20%, 03/15/19 | $ | 182,066 | ||
| 1,257,761 | ||||||
| Industrials - 2.1% | ||||||
| 1,125,000 | Burlington Northern Santa Fe, LLC, 4.55%, 09/01/44 | 1,219,431 | ||||
| 700,000 | Huntington Ingalls Industries, Inc., 5.00%, 11/15/25 (a) | 733,250 | ||||
| 1,108,000 | Textron, Inc., 3.65%, 03/01/21 | 1,142,159 | ||||
| 739,000 | United Technologies Corp., 6.13%, 07/15/38 | 954,801 | ||||
| 4,049,641 | ||||||
| Information Technology - 1.2% | ||||||
| 880,000 | Oracle Corp., 6.13%, 07/08/39 | 1,135,653 | ||||
| 1,235,000 | QUALCOMM, Inc., 4.80%, 05/20/45 | 1,223,720 | ||||
| 2,359,373 | ||||||
| Materials - 1.4% | ||||||
| 405,000 | Martin Marietta Materials, Inc., 6.60%, 04/15/18 | 432,671 | ||||
| 1,123,000 | The Dow Chemical Co., 3.00%, 11/15/22 | 1,148,900 | ||||
| 1,185,000 | The Mosaic Co., 5.45%, 11/15/33 | 1,218,586 | ||||
| 2,800,157 | ||||||
| Telecommunication Services - 1.1% | ||||||
| 845,000 | AT&T, Inc., 5.15%, 03/15/42 | 851,940 | ||||
| 1,229,000 | Verizon Communications, Inc., 4.27%, 01/15/36 | 1,223,139 | ||||
| 2,075,079 | ||||||
| Utilities - 0.8% | ||||||
| 315,000 | Alabama Power Co., Series Q, 5.50%, 10/15/17 | 333,347 | ||||
| 864,000 | PacifiCorp, 6.25%, 10/15/37 | 1,128,708 | ||||
| 1,462,055 | ||||||
| Total Corporate Bonds (Cost $45,857,142) | 46,394,585 |
| Government & Agency Obligations - 38.1% |
| GOVERNMENT SECURITIES - 19.0% |
| Municipals - 1.9% | ||||||
| 591,752 | Florida Housing Finance Corp., Florida RB, 3.00%, 01/01/36 | 606,824 | ||||
| 380,000 | Montana Board of Housing, Montana RB, 2.38%, 06/01/20 | 386,107 | ||||
| 375,000 | New York City Transitional Finance Authority Future Tax Secured Revenue, New York RB, 5.77%, 08/01/36 | 471,817 | ||||
| 340,000 | New York City Water & Sewer System, New York RB, 5.72%, 06/15/42 | 448,929 | ||||
| 225,000 | State of Connecticut, Connecticut GO, 4.95%, 12/01/20 | 252,963 | ||||
| 225,000 | State of Connecticut, Connecticut GO, 5.63%, 12/01/29 | 268,652 | ||||
| 240,000 | University of Michigan, Michigan RB, 6.01%, 04/01/25 | 270,734 | ||||
| Principal Amount | Security Description | Value | |||
| $ | 350,000 | University of Nebraska, Nebraska RB, Series B, 5.70%, 07/01/29 | $ | 368,428 | ||
| 410,000 | West Haymarket Joint Public Agency, Nebraska GO, 6.00%, 12/15/39 | 529,236 | ||||
| 3,603,690 | ||||||
| Treasury Inflation Index Securities - 1.4% | ||||||
| 855,627 | U.S. Treasury Inflation Indexed Bond, 1.75%, 01/15/28 (e) | 977,066 | ||||
| 1,747,322 | U.S. Treasury Inflation Indexed Note, 0.13%, 01/15/22 (e) | 1,774,430 | ||||
| 2,751,496 | ||||||
| U.S. Treasury Securities - 15.7% | ||||||
| 4,010,000 | U.S. Treasury Bond, 5.38%, 02/15/31 | 5,752,000 | ||||
| 2,890,000 | U.S. Treasury Bond, 4.75%, 02/15/37 | 4,090,818 | ||||
| 7,460,000 | U.S. Treasury Bond, 3.63%, 08/15/43 | 9,065,355 | ||||
| 2,120,000 | U.S. Treasury Note, 1.25%, 01/31/19 | 2,144,015 | ||||
| 3,770,000 | U.S. Treasury Note, 2.00%, 02/28/21 | 3,908,284 | ||||
| 5,550,000 | U.S. Treasury Note, 1.63%, 11/15/22 | 5,593,140 | ||||
| 30,553,612 | ||||||
| U.S. GOVERNMENT MORTAGE BACKED-SECURITIES - 19.1% | ||||||
| Federal Home Loan Mortgage Corp. - 8.1% | ||||||
| 78,455 | Federal Home Loan Mortgage Corp., 3.50%, 12/01/26 | 82,995 | ||||
| 876,214 | Federal Home Loan Mortgage Corp., 4.50%, 11/01/30 | 958,712 | ||||
| 2,934,896 | Federal Home Loan Mortgage Corp., 4.00%, 12/01/45 | 3,169,644 | ||||
| 1,698,945 | Federal Home Loan Mortgage Corp., 4.00%, 10/01/44 | 1,824,891 | ||||
| 3,192,010 | Federal Home Loan Mortgage Corp. Multifamily Structured Pass Through Certificates Interest Only, 1.55%, 08/25/16 (b) | 6,678 | ||||
| 2,941,282 | Federal Home Loan Mortgage Corp. Multifamily Structured Pass Through Certificates Interest Only, 1.96%, 08/25/18 (b) | 113,785 | ||||
| 471,838 | Federal Home Loan Mortgage Corp. REMIC, 4.50%, 04/15/19 | 483,520 | ||||
| 1,580,486 | Federal Home Loan Mortgage Corp. REMIC, 4.50%, 06/15/21 | 1,642,906 | ||||
| 595,000 | Federal Home Loan Mortgage Corp. REMIC, 4.00%, 06/15/37 | 640,808 | ||||
| 765,643 | Federal Home Loan Mortgage Corp. REMIC, 4.00%, 02/15/39 | 813,413 | ||||
| 1,998,759 | Federal Home Loan Mortgage Corp. REMIC, 4.00%, 03/15/40 | 2,131,615 | ||||
| 896,746 | Federal Home Loan Mortgage Corp. REMIC, 4.00%, 04/15/41 | 961,047 | ||||
| 2,198,726 | Federal Home Loan Mortgage Corp. REMIC, 3.50%, 07/15/42 | 2,317,196 | ||||
SCHEDULES OF PORTFOLIO INVESTMENTS
March 31, 2016
INCOME FUND
| Principal Amount | Security Description | Value | |||
| $ | 574,896 | Federal Home Loan Mortgage Corp. REMIC, 3.50%, 11/15/42 | $ | 607,327 | ||
| 15,754,537 | ||||||
| Federal National Mortgage Association - 9.7% | ||||||
| $ | 6,470 | Federal National Mortgage Association, 5.50%, 11/01/16 | $ | 6,507 | ||
| 15,015 | Federal National Mortgage Association, 4.50%, 12/01/18 | 15,533 | ||||
| 749,405 | Federal National Mortgage Association, 4.16%, 08/01/21 | 822,385 | ||||
| 242,462 | Federal National Mortgage Association, 7.50%, 08/01/22 | 257,718 | ||||
| 71,296 | Federal National Mortgage Association, 4.00%, 06/01/24 | 75,086 | ||||
| 149,990 | Federal National Mortgage Association, 4.00%, 10/01/24 | 159,518 | ||||
| 1,899,165 | Federal National Mortgage Association, 3.31%, 01/01/33 | 2,005,700 | ||||
| 1,159,897 | Federal National Mortgage Association, 5.80%, 12/01/33 | 1,350,832 | ||||
| 390,282 | Federal National Mortgage Association, 5.00%, 08/01/34 | 433,569 | ||||
| 30,565 | Federal National Mortgage Association, 5.50%, 08/01/37 | 34,305 | ||||
| 133,734 | Federal National Mortgage Association, 6.00%, 09/01/38 | 152,583 | ||||
| 245,538 | Federal National Mortgage Association, 4.50%, 06/01/39 | 270,166 | ||||
| 485,365 | Federal National Mortgage Association, 4.50%, 01/01/40 | 536,370 | ||||
| 368,897 | Federal National Mortgage Association, 4.50%, 12/01/40 | 402,527 | ||||
| 1,146,017 | Federal National Mortgage Association, 4.00%, 04/01/41 | 1,239,374 | ||||
| 349,797 | Federal National Mortgage Association, 4.00%, 02/01/42 | 380,300 | ||||
| 1,654,461 | Federal National Mortgage Association, 4.50%, 08/01/44 | 1,832,586 | ||||
| 368,250 | Federal National Mortgage Association REMIC, 4.00%, 02/25/19 | 377,648 | ||||
| 503,695 | Federal National Mortgage Association REMIC, 5.00%, 02/25/32 | 567,818 | ||||
| 827,863 | Federal National Mortgage Association REMIC, 4.00%, 01/25/33 | 903,916 | ||||
| 380,381 | Federal National Mortgage Association REMIC, 5.50%, 08/25/34 | 395,828 | ||||
| 630,398 | Federal National Mortgage Association REMIC, 3.00%, 04/25/37 | 644,782 | ||||
| 2,110,238 | Federal National Mortgage Association REMIC, 4.00%, 07/25/39 | 2,195,370 | ||||
| 1,084,237 | Federal National Mortgage Association REMIC, 2.50%, 09/25/39 | 1,107,146 | ||||
| 2,185,656 | Federal National Mortgage Association REMIC, 1.50%, 01/25/40 | 2,150,933 | ||||
| Shares or Principal Amount | Security Description | Value | |||
| $ | 569,959 | Federal National Mortgage Association REMIC, 3.50%, 05/25/41 | $ | 605,786 | ||
| 18,924,286 | ||||||
| Government National Mortgage Association - 1.2% | ||||||
| 1,386,303 | Government National Mortgage Association, 3.00%, 03/20/43 | 1,442,750 | ||||
| 739,291 | Government National Mortgage Association REMIC, 4.72%, 06/20/61 | 774,042 | ||||
| 2,216,792 | ||||||
| Small Business Administration Participation Certificates - 0.1% | ||||||
| 199,332 | Small Business Administration Participation Certificates, 2.88%, 09/10/21 | 208,372 | ||||
Total Government & Agency Obligations (Cost $70,671,557) | 74,012,785 |
| Preferred Stocks - 0.2% | |||||||
| Financials - 0.2% | |||||||
| 580 | US Bancorp., Series A, 3.50% (callable at 1,000 beginning 05/02/16) (b)(d) | 461,970 | |||||
| Total Preferred Stocks (Cost $595,666) | 461,970 |
| Exchange Traded Fund - 0.3% | |||||||
| 7,447 | iShares iBoxx $ High Yield Corporate Bond Fund | 608,345 | |||||
| Total Exchange Traded Fund (Cost $643,763) | 608,345 |
| Investment Company - 0.6% | |||||||
| 133,029 | Federated Institutional High-Yield Bond Fund | 1,233,179 | |||||
| Total Investment Company (Cost $1,209,314) | 1,233,179 |
| Short-Term Investments - 3.9% | |||||||
| Investment Company - 3.9% | |||||||
| 7,477,089 | BlackRock Liquidity Funds T-Fund Portfolio, 0.18% (f) | 7,477,089 | |||||
| Total Short-Term Investments (Cost $7,477,089) | 7,477,089 |
| Total Investments - 98.9% (Cost $188,998,804) | 192,243,633 |
| Other assets in excess of liabilities – 1.1% | 2,055,753 | ||
| NET ASSETS – 100.0% | $ | 194,299,386 |
SCHEDULES OF PORTFOLIO INVESTMENTS
March 31, 2016
INCOME FUND
| (a) | The Sub-Adviser has deemed this security which is exempt from registration under the Securities Act of 1933 to be liquid based on procedures approved by Tributary Funds' Board of Directors. As of March 31, 2016, the aggregate value of these liquid securities were $32,042,240 or 16.5% of net assets. |
| (b) | Variable rate security. Rate presented is as of March 31, 2016. |
| (c) | Debt obligation initially issued at one coupon rate which converts to higher coupon rate at a specified date. Rate presented is as of March 31, 2016. |
| (d) | Perpetual maturity security. |
| (e) | U.S. Treasury inflation indexed security, par amount is adjusted for inflation. |
| (f) | Dividend yield changes daily to reflect current market conditions. Rate was the quoted yield as of March 31, 2016. |
| ABS | Asset Backed Security |
| AMBAC | AMBAC Indemnity Corp. |
| CLO | Collateralized Loan Obligation |
| GO | General Obligation |
| LLC | Limited Liability Company |
| MTN | Medium Term Note |
| RB | Revenue Bond |
| REMIC | Real Estate Mortgage Investment Conduit |
SCHEDULES OF PORTFOLIO INVESTMENTS
March 31, 2016
NEBRASKA TAX-FREE FUND
| Principal Amount | Security Description | Value |
| Government & Agency Obligations - 95.4% |
| GOVERNMENT SECURITIES - 95.4% |
| Municipals - 95.4% |
| $ | 100,000 | Cass County Sanitary & Improvement District No. 1, Nebraska GO, 3.40%, 03/15/18 | $ | 100,144 | ||
| 125,000 | City of Bellevue NE, Nebraska GO, 3.95%, 06/01/21 | 125,293 | ||||
| 345,000 | City of Fremont NE, Nebraska RB, 3.00%, 10/15/25 | 360,822 | ||||
| 65,000 | City of Grand Island NE Electric System Revenue, Nebraska RB, 5.00%, 08/15/27 | 77,988 | ||||
| 275,000 | City of Hastings NE Combined Utility Revenue, Nebraska RB, 4.50%, 10/15/21 | 275,753 | ||||
| 300,000 | City of Hastings NE Combined Utility Revenue, Nebraska RB, 4.50%, 10/15/26 | 300,711 | ||||
| 235,000 | City of La Vista NE, Series A, Nebraska GO, 3.50%, 12/15/22 | 236,669 | ||||
| 525,000 | City of La Vista NE, Series B, Nebraska GO, 3.50%, 12/15/22 | 528,727 | ||||
| 165,000 | City of Lincoln NE Electric System Revenue, Nebraska RB, 5.00%, 09/01/28 | 197,800 | ||||
| 250,000 | City of Lincoln NE Electric System Revenue, Nebraska RB, 3.13%, 09/01/30 | 253,263 | ||||
| 130,000 | City of Lincoln NE, Nebraska Certificate of Participation, 2.00%, 09/15/17 | 130,946 | ||||
| 125,000 | City of Lincoln NE, Nebraska GO, 4.13%, 05/15/26 | 127,459 | ||||
| 370,000 | City of Lincoln NE, Nebraska RB, 1.75%, 04/01/16 | 370,000 | ||||
| 105,000 | City of Lincoln NE, Nebraska RB, 2.00%, 04/01/17 | 106,218 | ||||
| 210,000 | City of Lincoln NE, Nebraska RB, 2.00%, 04/01/18 | 212,379 | ||||
| 515,000 | City of Lincoln NE, Nebraska RB, 2.50%, 04/01/20 | 529,817 | ||||
| 700,000 | City of Lincoln NE, Nebraska RB, 4.50%, 08/15/22 | 792,813 | ||||
| 480,000 | City of Lincoln NE, Nebraska RB, 4.00%, 08/15/26 | 530,717 | ||||
| 500,000 | City of Lincoln NE, Nebraska RB, 3.55%, 04/01/27 | 512,485 | ||||
| 116,000 | City of Ogallala NE, Nebraska Certificate of Participation, 1.15%, 10/15/19 | 116,558 | ||||
| 575,000 | City of Omaha NE, Nebraska GO, 5.25%, 04/01/20 | 666,166 | ||||
| Principal Amount | Security Description | Value | |||
| $ | 275,000 | City of Omaha NE, Nebraska GO, 4.38%, 06/01/22 | $ | 296,037 | ||
| 800,000 | City of Omaha NE, Nebraska GO, 5.75%, 10/15/28 | 898,256 | ||||
| 190,000 | City of Omaha NE, Nebraska RB, 5.00%, 02/01/26 | 224,496 | ||||
| 500,000 | City of Omaha NE, Series A, Nebraska GO, 6.50%, 12/01/30 | 741,075 | ||||
| 200,000 | City of Omaha NE, Series A, Nebraska GO, 5.00%, 05/01/33 | 241,620 | ||||
| 185,000 | County of Adams NE, Nebraska GO, 2.35%, 12/15/16 | 185,252 | ||||
| 100,000 | County of Adams NE, Nebraska GO, 3.55%, 12/15/20 | 100,229 | ||||
| 550,000 | County of Douglas NE, Nebraska RB, 5.60%, 07/01/25 | 642,510 | ||||
| 120,000 | County of Douglas NE, Nebraska RB, 3.60%, 10/01/27 | 120,607 | ||||
| 250,000 | County of Sarpy NE, Nebraska Certificate of Participation, 2.80%, 12/15/20 | 265,995 | ||||
| 280,000 | Crete Public Schools, Nebraska GO, 3.00%, 12/15/18 | 296,078 | ||||
| 195,000 | Douglas County Hospital Authority No. 1, Nebraska RB, 5.25%, 09/01/21 | 224,704 | ||||
| 495,000 | Douglas County Hospital Authority No. 2, Nebraska RB, 5.13%, 08/15/18 | 523,086 | ||||
| 1,500,000 | Douglas County Hospital Authority No. 2, Nebraska RB, 4.75%, 09/01/28 | 1,622,160 | ||||
| 500,000 | Douglas County Hospital Authority No. 2, Nebraska RB, 5.50%, 01/01/30 | 567,365 | ||||
| 100,000 | Douglas County Hospital Authority No. 2, Nebraska RB, 5.75%, 11/01/48 | 111,760 | ||||
| 690,000 | Douglas County Hospital Authority No. 3, Nebraska RB, 5.75%, 11/01/48 | 773,959 | ||||
| 110,000 | Douglas County Sanitary & Improvement District No. 281, Nebraska GO, 1.70%, 02/15/20 | 110,300 | ||||
| 40,000 | Douglas County Sanitary & Improvement District No. 412, Nebraska GO, 1.85%, 08/15/17 | 40,279 | ||||
| 50,000 | Douglas County Sanitary & Improvement District No. 412, Nebraska GO, 2.10%, 08/15/18 | 50,275 | ||||
| 55,000 | Douglas County Sanitary & Improvement District No. 412, Nebraska GO, 2.35%, 08/15/19 | 55,442 |
SCHEDULES OF PORTFOLIO INVESTMENTS
March 31, 2016
NEBRASKA TAX-FREE FUND
| Principal Amount | Security Description | Value |
| $ | 55,000 | Douglas County Sanitary & Improvement District No. 412, Nebraska GO, 2.65%, 08/15/20 | $ | 55,611 | ||
| 65,000 | Douglas County Sanitary & Improvement District No. 412, Nebraska GO, 2.85%, 08/15/21 | 65,939 | ||||
| 65,000 | Douglas County Sanitary & Improvement District No. 412, Nebraska GO, 3.00%, 08/15/22 | 65,982 | ||||
| 100,000 | Douglas County Sanitary & Improvement District No. 412, Nebraska GO, 3.35%, 08/15/24 | 101,613 | ||||
| 100,000 | Douglas County Sanitary & Improvement District No. 412, Nebraska GO, 3.50%, 08/15/25 | 101,597 | ||||
| 105,000 | Douglas County Sanitary & Improvement District No. 412, Nebraska GO, 3.60%, 08/15/26 | 106,070 | ||||
| 110,000 | Douglas County Sanitary & Improvement District No. 412, Nebraska GO, 3.70%, 08/15/27 | 111,119 | ||||
| 155,000 | Douglas County Sanitary & Improvement District No. 412, Nebraska GO, 4.05%, 08/15/32 | 156,192 | ||||
| 300,000 | Douglas County Sanitary & Improvement District No. 427, Nebraska GO, 3.50%, 10/15/21 | 303,540 | ||||
| 85,000 | Douglas County Sanitary & Improvement District No. 453, Nebraska GO, 4.15%, 06/01/20 | 85,205 | ||||
| 585,000 | Douglas County Sanitary & Improvement District No. 464, Nebraska GO, 3.65%, 03/15/33 | 589,586 | ||||
| 65,000 | Douglas County Sanitary & Improvement District No. 485, Nebraska GO, 2.65%, 10/01/20 | 65,789 | ||||
| 170,000 | Douglas County Sanitary & Improvement District No. 497, Nebraska GO, 2.75%, 11/15/25 | 171,200 | ||||
| 165,000 | Douglas County Sanitary & Improvement District No. 497, Nebraska GO, 3.65%, 11/15/32 | 167,061 | ||||
| 100,000 | Douglas County Sanitary & Improvement District No. 503, Nebraska GO, 1.90%, 08/15/17 | 101,650 | ||||
| 105,000 | Douglas County Sanitary & Improvement District No. 509, Nebraska GO, 3.85%, 03/15/33 | 104,351 | ||||
| 295,000 | Douglas County Sanitary & Improvement District No. 509, Nebraska GO, 3.90%, 03/15/34 | 293,112 | ||||
| 210,000 | Douglas County Sanitary & Improvement District No. 509, Nebraska GO, 3.95%, 03/15/35 | 208,610 | ||||
| Principal Amount | Security Description | Value | |||
| $ | 190,000 | Douglas County Sanitary & Improvement District No. 509, Nebraska GO, 4.00%, 03/15/36 | $ | 188,704 | ||
| 255,000 | Douglas County Sanitary & Improvement District No. 515, Nebraska GO, 3.75%, 12/15/32 | 257,371 | ||||
| 115,000 | Douglas County Sanitary & Improvement District No. 541, Nebraska GO, 2.95%, 07/15/24 | 118,643 | ||||
| 750,000 | Douglas County School District No. 59, Nebraska GO, 3.00%, 12/15/35 | 736,807 | ||||
| 105,000 | Elkhorn Rural Public Power District, Nebraska RB, 2.60%, 09/01/21 | 105,592 | ||||
| 700,000 | Elkhorn School District, Nebraska GO, 5.00%, 01/15/30 | 814,702 | ||||
| 665,000 | Elkhorn School District, Nebraska GO, 4.00%, 12/15/34 | 722,310 | ||||
| 1,430,000 | Elkhorn School District, Nebraska GO, 4.00%, 12/15/35 | 1,545,501 | ||||
| 250,000 | Elkhorn School District, Series B, Nebraska GO, 4.00%, 01/15/32 | 268,560 | ||||
| 30,000 | Elm Creek Rural Fire Protection District No. 7, Nebraska GO, 0.65%, 10/15/17 | 29,973 | ||||
| 68,000 | Elm Creek Rural Fire Protection District No. 7, Nebraska GO, 1.40%, 10/15/20 | 68,377 | ||||
| 185,000 | Grand Island Public Schools No. 2, Nebraska GO, 4.00%, 12/15/24 | 206,982 | ||||
| 500,000 | Hospital Authority No. 1 of Lancaster County, Series A, Nebraska RB, 5.00%, 06/01/17 | 524,280 | ||||
| 1,300,000 | Lancaster County Correctional Facility Joint Public Agency, Nebraska GO, 5.00%, 12/01/21 | 1,449,032 | ||||
| 140,000 | Lancaster County Correctional Facility Joint Public Agency, Nebraska GO, 5.00%, 12/01/22 | 156,050 | ||||
| 750,000 | Lancaster County School District No. 1, Nebraska GO, 4.00%, 01/15/26 | 884,070 | ||||
| 145,000 | Lancaster County School District No. 1, Nebraska GO, 5.00%, 01/15/27 | 146,828 | ||||
| 200,000 | Lincoln County Hospital Authority No. 1, Nebraska RB, 5.00%, 11/01/25 | 232,172 | ||||
| 500,000 | Lincoln-Lancaster County Public Building Commission, Nebraska RB, 3.00%, 12/01/26 | 546,220 | ||||
| 1,500,000 | Metropolitan Utilities District of Omaha, Series A, Nebraska RB, 4.25%, 12/01/21 | 1,536,360 | ||||
| 300,000 | Metropolitan Utilities District of Omaha, Series A, Nebraska RB, 4.38%, 12/01/25 | 307,518 |
SCHEDULES OF PORTFOLIO INVESTMENTS
March 31, 2016
NEBRASKA TAX-FREE FUND
| Principal Amount | Security Description | Value | |||
| $ | 100,000 | Metropolitan Utilities District of Omaha, Series B, Nebraska RB, 5.00%, 06/01/28 | $ | 105,011 | ||
| 210,000 | Municipal Energy Agency of Nebraska, Series A, Nebraska RB, 5.00%, 04/01/25 | 248,945 | ||||
| 200,000 | Municipal Energy Agency of Nebraska, Series A, Nebraska RB, 5.00%, 04/01/26 | 234,940 | ||||
| 540,000 | Municipal Energy Agency of Nebraska, Series A, Nebraska RB, 5.00%, 04/01/27 | 632,005 | ||||
| 1,475,000 | Municipal Energy Agency of Nebraska, Series A, Nebraska RB, 5.00%, 04/01/30 | 1,709,141 | ||||
| 140,000 | Municipal Energy Agency of Nebraska, Series A, Nebraska RB, 5.00%, 04/01/31 | 161,713 | ||||
| 175,000 | Nebraska Investment Finance Authority, Series A, Nebraska RB, 2.35%, 09/01/24 | 176,855 | ||||
| 150,000 | Nebraska Public Power District, Series A, Nebraska RB, 5.00%, 01/01/26 | 178,853 | ||||
| 200,000 | Nebraska Public Power District, Series A, Nebraska RB, 5.00%, 01/01/27 | 236,658 | ||||
| 600,000 | Nebraska Public Power District, Series A, Nebraska RB, 5.00%, 01/01/29 | 704,226 | ||||
| 1,050,000 | Nebraska Public Power District, Series A, Nebraska RB, 5.00%, 01/01/32 | 1,218,714 | ||||
| 540,000 | Nebraska Public Power District, Series A, Nebraska RB, 5.00%, 01/01/34 | 622,971 | ||||
| 1,995,000 | Nebraska Public Power District, Series C, Nebraska RB, 5.00%, 01/01/31 | 2,274,918 | ||||
| 315,000 | Nebraska State Colleges, Series A, Nebraska RB, 3.00%, 07/01/25 | 315,983 | ||||
| 535,000 | Omaha Airport Authority, Nebraska RB, 3.75%, 01/01/19 | 574,194 | ||||
| 200,000 | Omaha Convention Hotel Corp., Nebraska RB, 5.00%, 02/01/17 | 206,970 | ||||
| 100,000 | Omaha Convention Hotel Corp., Nebraska RB, 5.00%, 02/01/26 | 103,266 | ||||
| 805,000 | Omaha Public Facilities Corp., Nebraska RB, 5.00%, 06/01/26 | 902,896 | ||||
| 100,000 | Omaha Public Power District, Nebraska City Station Unit 2, Series A, Nebraska RB, 5.30%, 02/01/26 | 108,237 | ||||
| 305,000 | Omaha Public Power District, Nebraska City Station Unit 2, Series A, Nebraska RB, 4.20%, 02/01/26 | 313,991 | ||||
| 500,000 | Omaha Public Power District, Nebraska City Station Unit 2, Series A, Nebraska RB, 5.35%, 02/01/27 | 541,640 | ||||
| 45,000 | Omaha Public Power District, Nebraska City Station Unit 2, Series A, Nebraska RB, 4.35%, 02/01/36 | 46,382 | ||||
| Principal Amount | Security Description | Value | |||
| $ | 50,000 | Omaha Public Power District, Nebraska City Station Unit 2, Series A, Nebraska RB, 5.00%, 02/01/42 | $ | 51,802 | ||
| 190,000 | Omaha Public Power District, Series A, Nebraska RB, 4.65%, 02/01/28 | 207,966 | ||||
| 205,000 | Omaha Public Power District, Series A, Nebraska RB, 4.00%, 02/01/31 | 221,443 | ||||
| 200,000 | Omaha Public Power District, Series A, Nebraska RB, 4.00%, 02/01/34 | 212,916 | ||||
| 500,000 | Omaha Public Power District, Series B, Nebraska RB, 5.00%, 02/01/29 | 580,095 | ||||
| 500,000 | Omaha Public Power District, Series C, Nebraska RB, 5.00%, 02/01/29 | 580,095 | ||||
| 1,435,000 | Omaha Public Power District, Series C, Nebraska RB, 5.00%, 02/01/30 | 1,661,974 | ||||
| 650,000 | Omaha School District No. 1, Nebraska GO, 4.00%, 12/15/22 | 720,921 | ||||
| 620,000 | Omaha School District No. 1, Nebraska GO, 3.13%, 12/15/33 | 641,743 | ||||
| 590,000 | Omaha-Douglas Public Building Commission, Nebraska GO, 4.50%, 05/01/22 | 637,631 | ||||
| 245,000 | Omaha-Douglas Public Building Commission, Nebraska GO, 4.50%, 05/01/23 | 264,512 | ||||
| 235,000 | Papillion-La Vista School District, Nebraska GO, 5.00%, 12/01/23 | 261,146 | ||||
| 150,000 | Papio-Missouri River Natural Resource District, Nebraska GO, 4.00%, 12/15/16 | 153,507 | ||||
| 200,000 | Papio-Missouri River Natural Resource District, Nebraska GO, 4.00%, 12/15/24 | 210,168 | ||||
| 125,000 | Platte County School District No. 1, Columbus Public Schools, Nebraska GO, 5.00%, 12/15/26 | 155,023 | ||||
| 500,000 | Plattsmouth Facilities Corp., Nebraska RB, 4.20%, 11/15/32 | 506,165 | ||||
| 125,000 | Public Power Generation Agency, Nebraska RB, 5.00%, 01/01/17 | 128,801 | ||||
| 200,000 | Public Power Generation Agency, Nebraska RB, 5.00%, 01/01/20 | 206,446 | ||||
| 710,000 | Public Power Generation Agency, Nebraska RB, 5.00%, 01/01/24 | 732,883 | ||||
| 150,000 | Public Power Generation Agency, Nebraska RB, 5.00%, 01/01/25 | 154,835 | ||||
| 10,000 | Public Power Generation Agency, Nebraska RB, 5.00%, 01/01/32 | 10,287 | ||||
| 40,000 | Public Power Generation Agency, Nebraska RB, 5.00%, 01/01/32 | 41,304 | ||||
| 85,000 | Sarpy County Sanitary & Improvement District No. 191, Nebraska GO, 2.45%, 10/15/22 | 85,739 |
SCHEDULES OF PORTFOLIO INVESTMENTS
March 31, 2016
NEBRASKA TAX-FREE FUND
| Principal Amount | Security Description | Value |
| $ | 160,000 | Sarpy County Sanitary & Improvement District No. 191, Nebraska GO, 3.55%, 10/15/32 | $ | 161,590 | ||
| 265,000 | Sarpy County Sanitary & Improvement District No. 213, Nebraska GO, 3.20%, 11/15/29 | 266,569 | ||||
| 55,000 | Sarpy County Sanitary & Improvement District No. 234, Nebraska GO, 2.00%, 06/15/18 | 55,200 | ||||
| 55,000 | Sarpy County Sanitary & Improvement District No. 234, Nebraska GO, 2.45%, 06/15/20 | 55,407 | ||||
| 60,000 | Sarpy County Sanitary & Improvement District No. 234, Nebraska GO, 2.75%, 06/15/21 | 60,691 | ||||
| 60,000 | Sarpy County Sanitary & Improvement District No. 234, Nebraska GO, 3.00%, 06/15/22 | 60,796 | ||||
| 65,000 | Sarpy County Sanitary & Improvement District No. 234, Nebraska GO, 3.15%, 06/15/23 | 65,892 | ||||
| 65,000 | Sarpy County Sanitary & Improvement District No. 234, Nebraska GO, 3.30%, 06/15/24 | 65,883 | ||||
| 65,000 | Sarpy County Sanitary & Improvement District No. 234, Nebraska GO, 3.40%, 06/15/25 | 65,836 | ||||
| 70,000 | Sarpy County Sanitary & Improvement District No. 234, Nebraska GO, 3.55%, 06/15/26 | 70,586 | ||||
| 75,000 | Sarpy County Sanitary & Improvement District No. 234, Nebraska GO, 3.70%, 06/15/27 | 75,565 | ||||
| 110,000 | Sarpy County Sanitary & Improvement District No. 242, Nebraska GO, 3.00%, 03/15/27 | 113,512 | ||||
| 490,000 | Sarpy County Sanitary & Improvement District No. 257, Nebraska GO, 3.75%, 04/15/31 | 490,946 | ||||
| 245,000 | Sarpy County Sanitary & Improvement District No. 261, Nebraska GO, 3.35%, 04/15/26 | 247,203 | ||||
| 475,000 | Sarpy County Sanitary & Improvement District No. 261, Nebraska GO, 3.80%, 04/15/33 | 477,023 | ||||
| 120,000 | Sarpy County Sanitary & Improvement District No. 279, Nebraska GO, 3.95%, 02/15/32 | 124,369 | ||||
| 110,000 | Sarpy County Sanitary & Improvement District No. 279, Nebraska GO, 5.15%, 02/15/34 | 116,776 | ||||
| 110,000 | Sarpy County Sanitary & Improvement District No. 67, Nebraska GO, 2.60%, 11/01/16 | 110,124 |
| Shares or Principal Amount | Security Description | Value |
| $ | 225,000 | Sarpy County Sanitary & Improvement District No. 68, Nebraska GO, 2.75%, 12/15/23 | $ | 225,207 | ||
| 60,000 | Sarpy County Sanitary & Improvement District No. 97, Nebraska GO, 2.35%, 02/15/18 | 60,352 | ||||
| 600,000 | Southern Public Power District, Nebraska RB, 5.00%, 12/15/22 | 666,012 | ||||
| 160,000 | University of Nebraska, Nebraska RB, 3.00%, 05/15/18 | 167,181 | ||||
| 50,000 | University of Nebraska, Series A, Nebraska RB, 4.25%, 07/01/21 | 54,393 | ||||
| 85,000 | University of Nebraska, Series A, Nebraska RB, 5.00%, 07/01/22 | 94,358 | ||||
| 525,000 | University of Nebraska, Series A, Nebraska RB, 5.00%, 07/01/22 | 573,211 | ||||
| 400,000 | University of Nebraska, Series A, Nebraska RB, 5.00%, 07/01/23 | 443,920 | ||||
| 650,000 | University of Nebraska, Series A, Nebraska RB, 4.50%, 07/01/28 | 697,385 | ||||
| 200,000 | West Haymarket Joint Public Agency, Nebraska GO, 5.00%, 12/15/26 | 239,972 | ||||
| 105,000 | West Haymarket Joint Public Agency, Nebraska GO, 4.00%, 12/15/28 | 115,618 | ||||
| 54,411,980 | ||||||
Total Government & Agency Obligations (Cost $52,973,089) | 54,411,980 |
| Short-Term Investments - 3.9% | |||||||
| Investment Company - 3.9% | |||||||
| 2,190,995 | BlackRock Liquidity Funds T-Fund Portfolio, 0.18% (a) | 2,190,995 | |||||
| Total Short-Term Investments (Cost $2,190,995) | 2,190,995 |
| Total Investments - 99.3% (Cost $55,164,084) | 56,602,975 |
| Other Assets & Liabilities, Net – 0.7% | 426,282 | ||
| NET ASSETS – 100.0% | $ | 57,029,257 |
| (a) | Dividend yield changes daily to reflect current market conditions. Rate was the quoted yield as of March 31, 2016. |
| GO | General Obligation |
| RB | Revenue Bond |
SCHEDULES OF PORTFOLIO INVESTMENTS
March 31, 2016
BALANCED FUND
| Shares | Security Description | Value |
| Common Stocks - 58.9% |
| Consumer Discretionary - 9.5% | ||||||
| 900 | AutoZone, Inc. (a) | $ | 717,021 | |||
| 3,000 | Buffalo Wild Wings, Inc. (a) | 444,360 | ||||
| 15,500 | Comcast Corp. - Class A | 946,740 | ||||
| 8,500 | D.R. Horton, Inc. | 256,955 | ||||
| 7,400 | Foot Locker, Inc. | 477,300 | ||||
| 15,900 | Hanesbrands, Inc. | 450,606 | ||||
| 15,200 | NIKE, Inc. - Class B | 934,344 | ||||
| 1,970 | O'Reilly Automotive, Inc. (a) | 539,110 | ||||
| 4,300 | Royal Caribbean Cruises, Ltd. | 353,245 | ||||
| 19,000 | Skechers U.S.A., Inc. - Class A (a) | 578,550 | ||||
| 19,100 | Starbucks Corp. | 1,140,270 | ||||
| 10,700 | The Home Depot, Inc. | 1,427,701 | ||||
| 600 | The Priceline Group, Inc. (a) | 773,376 | ||||
| 5,450 | Ulta Salon Cosmetics & Fragrance, Inc. (a) | 1,055,883 | ||||
| 10,095,461 | ||||||
| Consumer Staples - 5.5% | ||||||
| 11,500 | Church & Dwight Co., Inc. | 1,060,070 | ||||
| 7,200 | Constellation Brands, Inc. - Class A | 1,087,848 | ||||
| 7,000 | Costco Wholesale Corp. | 1,103,060 | ||||
| 12,000 | CVS Health Corp. | 1,244,760 | ||||
| 25,000 | Rite Aid Corp. (a) | 203,750 | ||||
| 7,100 | The JM Smucker Co. | 921,864 | ||||
| 7,200 | The WhiteWave Foods Co. (a) | 292,608 | ||||
| 5,913,960 | ||||||
| Energy - 3.6% | ||||||
| 833 | California Resources Corp. | 858 | ||||
| 3,300 | Concho Resources, Inc. (a) | 333,432 | ||||
| 7,500 | EOG Resources, Inc. | 544,350 | ||||
| 13,500 | Exxon Mobil Corp. | 1,128,465 | ||||
| 8,900 | Occidental Petroleum Corp. | 609,027 | ||||
| 6,000 | Phillips 66 | 519,540 | ||||
| 9,500 | Schlumberger, Ltd. | 700,625 | ||||
| 3,836,297 | ||||||
| Financials - 7.8% | ||||||
| 12,000 | American Tower Corp. REIT | 1,228,440 | ||||
| 14,900 | BankUnited, Inc. | 513,156 | ||||
| 2,200 | BlackRock, Inc. | 749,254 | ||||
| 9,000 | Capital One Financial Corp. | 623,790 | ||||
| 5,800 | Chubb, Ltd. | 691,070 | ||||
| 3,600 | FactSet Research Systems, Inc. | 545,508 | ||||
| 18,900 | Home BancShares, Inc. | 773,955 | ||||
| 12,000 | JPMorgan Chase & Co. | 710,640 | ||||
| 12,100 | Northern Trust Corp. | 788,557 | ||||
| 6,450 | Signature Bank (a) | 877,974 | ||||
| 20,500 | U.S. Bancorp, Series A | 832,095 | ||||
| 8,334,439 | ||||||
| Health Care - 8.2% | ||||||
| 3,810 | Allergan PLC (a) | 1,021,195 | ||||
| 2,000 | Biogen, Inc. (a) | 520,640 | ||||
| 6,800 | Celgene Corp. (a) | 680,612 | ||||
| Shares | Security Description | Value | |||
| 12,300 | Centene Corp. (a) | $ | 757,311 | |||
| 12,700 | Cerner Corp. (a) | 672,592 | ||||
| 8,000 | Edwards Lifesciences Corp. (a) | 705,680 | ||||
| 9,000 | Eli Lilly & Co. | 648,090 | ||||
| 9,000 | Gilead Sciences, Inc. | 826,740 | ||||
| 9,600 | PAREXEL International Corp. (a) | 602,208 | ||||
| 7,000 | PerkinElmer, Inc. | 346,220 | ||||
| 5,600 | Teleflex, Inc. | 879,256 | ||||
| 2,000 | United Therapeutics Corp. (a) | 222,860 | ||||
| 18,800 | Zoetis, Inc. | 833,404 | ||||
| 8,716,808 | ||||||
| Industrials - 6.5% | ||||||
| 5,200 | FedEx Corp. | 846,144 | ||||
| 14,550 | Fortune Brands Home & Security, Inc. | 815,382 | ||||
| 33,000 | General Electric Co. | 1,049,070 | ||||
| 24,500 | HD Supply Holdings, Inc. (a) | 810,215 | ||||
| 22,700 | KAR Auction Services, Inc. | 865,778 | ||||
| 5,300 | Roper Technologies, Inc. | 968,681 | ||||
| 21,800 | Southwest Airlines Co. | 976,640 | ||||
| 6,200 | The Middleby Corp. (a) | 661,974 | ||||
| 6,993,884 | ||||||
| Information Technology - 15.3% | ||||||
| 11,300 | Adobe Systems, Inc. (a) | 1,059,940 | ||||
| 2,698 | Alphabet, Inc., Class C (a) | 2,009,875 | ||||
| 18,300 | Apple, Inc. | 1,994,517 | ||||
| 7,000 | ARRIS International PLC (a) | 160,440 | ||||
| 5,000 | Broadcom, Ltd. | 772,500 | ||||
| 15,000 | Broadridge Financial Solutions, Inc. | 889,650 | ||||
| 12,000 | Cadence Design Systems, Inc. (a) | 282,960 | ||||
| 19,300 | CDW Corp. | 800,950 | ||||
| 29,000 | Cisco Systems, Inc. | 825,630 | ||||
| 9,000 | Cognizant Technology Solutions Corp. - Class A (a) | 564,300 | ||||
| 16,000 | Facebook, Inc. - Class A (a) | 1,825,600 | ||||
| 9,800 | Fiserv, Inc. (a) | 1,005,284 | ||||
| 4,600 | FleetCor Technologies, Inc. (a) | 684,250 | ||||
| 6,100 | Jack Henry & Associates, Inc. | 515,877 | ||||
| 12,000 | MasterCard, Inc. - Class A | 1,134,000 | ||||
| 18,000 | Microsoft Corp. | 994,140 | ||||
| 14,000 | Paychex, Inc. | 756,140 | ||||
| 16,276,053 | ||||||
| Materials - 0.5% | ||||||
| 6,800 | Eastman Chemical Co. | 491,164 | ||||
| Telecommunication Services - 0.8% | |||||||
| 15,800 | Verizon Communications, Inc. | 854,464 | |||||
| Utilities - 1.2% | |||||||
| 8,800 | NextEra Energy, Inc. | 1,041,392 | |||||
| 4,000 | Southwest Gas Corp. | 263,400 | |||||
| 1,304,792 | |||||||
| Total Common Stocks (Cost $50,512,112) | 62,817,322 |
SCHEDULES OF PORTFOLIO INVESTMENTS
March 31, 2016
BALANCED FUND
| Principal Amount | Security Description | Value |
| Non-U.S. Government Agency Asset-Backed Securities - 6.0% | ||||||
| Asset Backed Securities - 1.9% | ||||||
| $ | 365,000 | BA Credit Card Trust, 1.36%, 09/15/20 | $ | 366,241 | ||
| 330,000 | Cabela's Credit Card Master Note Trust, 2.71%, 02/17/26 (b) | 335,665 | ||||
| 300,000 | Capital One Multi-Asset Execution Trust, 1.48%, 07/15/20 | 301,608 | ||||
| 241,000 | Citibank Credit Card Issuance Trust, 5.65%, 09/20/19 | 256,380 | ||||
| 145,000 | Eaton Vance CLO, Ltd., 2.07%, 07/15/26 (b)(c) | 143,369 | ||||
| 355,000 | Ford Credit Auto Owner Trust, 1.27%, 12/15/17 | 354,924 | ||||
| 296,131 | Preferred Term Securities XII, Ltd./Preferred Term Securities XII, Inc., 1.34%, 12/24/33 (b)(c) | 242,827 | ||||
| 2,001,014 | ||||||
| Non-Agency Commercial Mortgage Backed Securities - 2.5% | ||||||
| 375,000 | American Tower Trust I, 3.07%, 03/15/23 (b) | 375,007 | ||||
| 222,020 | Bayview Commercial Asset Trust REMIC, 1.30%, 12/25/33 (b)(c) | 212,956 | ||||
| 384,066 | Bear Stearns Commercial Mortgage Securities Trust REMIC, 5.69%, 06/11/50 (c) | 398,639 | ||||
| 388,401 | Citigroup Commercial Mortgage Trust REMIC, 5.74%, 06/14/50 (b)(c) | 393,410 | ||||
| 265,000 | FREMF Mortgage Trust REMIC, 4.16%, 09/25/44 (b)(c) | 272,687 | ||||
| 310,000 | FREMF Mortgage Trust REMIC, 2.64%, 03/25/45 (b)(c) | 310,539 | ||||
| 500,000 | JP Morgan Chase Commercial Mortgage Securities Trust REMIC, 4.11%, 07/15/46 (b) | 522,055 | ||||
| 143,091 | Wells Fargo-RBS Commercial Mortgage Trust REMIC, 1.19%, 03/15/47 | 142,592 | ||||
| 2,627,885 | ||||||
| Non-Agency Residential Mortgage Backed Securities - 1.6% | ||||||
| 182,890 | Citicorp Residential Mortgage Trust REMIC, 5.63%, 07/25/36 (d) | 187,548 | ||||
| 251,017 | Citicorp Residential Mortgage Trust REMIC, 5.78%, 09/25/36 (d) | 259,488 | ||||
| 118,716 | Citigroup Mortgage Loan Trust REMIC, 4.00%, 01/25/35 (b)(c) | 121,787 | ||||
| 190,764 | Conseco Financial Corp., 7.30%, 09/15/26 (c) | 198,244 | ||||
| 375,000 | GSAMP Trust REMIC, 0.93%, 05/25/36 (b)(c) | 348,892 | ||||
| 138,087 | HSBC Home Equity Loan Trust USA, 1.93%, 11/20/36 (c) | 138,165 | ||||
| Principal Amount | Security Description | Value |
| $ | 176,402 | Lehman ABS Manufactured Housing Contract Trust REMIC, 4.35%, 04/15/40 | $ | 178,918 | ||
| 153,287 | New Residential Mortgage Loan Trust, 3.75%, 08/25/55 (c) | 158,299 | ||||
| 175,000 | Towd Point Mortgage Trust REMIC, 3.50%, 02/25/55 (b)(c) | 178,145 | ||||
| 1,769,486 | ||||||
| Total Non-U.S. Government Agency Asset-Backed Securities (Cost $6,441,173) | 6,398,385 |
| Corporate Bonds - 12.9% | ||||||
| Consumer Discretionary - 1.2% | ||||||
| 300,000 | McGraw Hill Financial, Inc., 5.90%, 11/15/17 | 320,008 | ||||
| 275,000 | Newell Rubbermaid, Inc., 4.00%, 06/15/22 | 283,360 | ||||
| 210,000 | Newell Rubbermaid, Inc., 4.20%, 04/01/26 | 219,639 | ||||
| 119,000 | Viacom, Inc., 6.25%, 04/30/16 | 119,453 | ||||
| 315,000 | Whirlpool Corp., 4.70%, 06/01/22 | 346,346 | ||||
| 1,288,806 | ||||||
| Consumer Staples - 1.3% | ||||||
| 450,000 | Church & Dwight Co., Inc., 2.88%, 10/01/22 | 455,379 | ||||
| 61,000 | ConAgra Foods, Inc., 7.00%, 04/15/19 | 69,273 | ||||
| 410,000 | PepsiCo., Inc., 2.85%, 02/24/26 | 421,068 | ||||
| 450,000 | Wal-Mart Stores, Inc., 3.30%, 04/22/24 | 485,489 | ||||
| 1,431,209 | ||||||
| Energy - 0.5% | ||||||
| 210,000 | Anadarko Petroleum Corp., 3.45%, 07/15/24 | 187,085 | ||||
| 155,000 | ConocoPhillips Co., 2.88%, 11/15/21 | 152,106 | ||||
| 205,000 | EOG Resources, Inc., 4.15%, 01/15/26 | 212,571 | ||||
| 551,762 | ||||||
| Financials - 4.5% | ||||||
| 450,000 | American Honda Finance Corp., 1.60%, 02/16/18 (b) | 452,769 | ||||
| 380,000 | Bank of America Corp., MTN, 4.13%, 01/22/24 | 402,681 | ||||
| 360,000 | Citigroup, Inc., 2.55%, 04/08/19 | 365,450 | ||||
| 350,000 | CME Group, Inc./IL, 3.00%, 09/15/22 | 363,067 | ||||
| 140,000 | CME Group, Inc./IL, 3.00%, 03/15/25 | 141,946 | ||||
| 400,000 | JPMorgan Chase & Co., 7.90% (callable at 100 beginning 04/30/18) (c)(e) | 400,000 | ||||
| 325,000 | Metropolitan Life Global Funding I, 2.30%, 04/10/19 (b) | 330,700 | ||||
| 360,000 | Morgan Stanley, 3.75%, 02/25/23 | 375,216 | ||||
SCHEDULES OF PORTFOLIO INVESTMENTS
March 31, 2016
BALANCED FUND
| Principal Amount | Security Description | Value |
| $ | 290,000 | Prudential Financial, Inc., MTN, 7.38%, 06/15/19 | $ | 336,603 | ||
| 250,000 | Regions Bank/Birmingham AL, 7.50%, 05/15/18 | 275,525 | ||||
| 370,000 | The Hartford Financial Services Group, Inc., 5.50%, 03/30/20 | 410,741 | ||||
| 410,000 | Wells Fargo & Co., Series K, 7.98% (callable at 100 beginning 03/15/18) (c)(e) | 424,309 | ||||
| 500,000 | Welltower, Inc. REIT, 6.20%, 06/01/16 | 503,929 | ||||
| 4,782,936 | ||||||
| Health Care - 0.3% | ||||||
| 285,000 | Becton Dickinson and Co., 3.73%, 12/15/24 | 303,538 | ||||
| Industrials - 2.0% | |||||||
| 450,000 | Burlington Northern Santa Fe, LLC, 3.75%, 04/01/24 | 485,877 | |||||
| 250,000 | Caterpillar, Inc., 7.90%, 12/15/18 | 291,090 | |||||
| 500,000 | Harley-Davidson Funding Corp., 6.80%, 06/15/18 (b) | 552,332 | |||||
| 415,000 | Textron, Inc., 3.65%, 03/01/21 | 427,794 | |||||
| 390,000 | United Technologies Corp., 3.10%, 06/01/22 | 413,069 | |||||
| 2,170,162 | |||||||
| Information Technology - 1.0% | |||||||
| 425,000 | Oracle Corp., 3.40%, 07/08/24 | 452,286 | |||||
| 555,000 | QUALCOMM, Inc., 3.45%, 05/20/25 | 574,665 | |||||
| 1,026,951 | |||||||
| Materials - 0.7% | |||||||
| 340,000 | The Dow Chemical Co., 3.00%, 11/15/22 | 347,841 | |||||
| 401,000 | The Mosaic Co., 4.25%, 11/15/23 | 419,043 | |||||
| 766,884 | |||||||
| Telecommunication Services - 1.0% | |||||||
| 330,000 | AT&T, Inc., 3.80%, 03/15/22 | 347,932 | |||||
| 210,000 | AT&T, Inc., 3.95%, 01/15/25 | 218,349 | |||||
| 425,000 | Verizon Communications, Inc., 5.15%, 09/15/23 | 490,716 | |||||
| 1,056,997 | |||||||
| Utilities - 0.4% | |||||||
| 400,000 | Commonwealth Edison Co., 4.00%, 08/01/20 | 433,312 | |||||
| Total Corporate Bonds (Cost $13,535,901) | 13,812,557 |
| Government & Agency Obligations - 19.2% | |||||||
| GOVERNMENT SECURITIES - 18.5% | |||||||
| Municipals - 2.7% | |||||||
| 350,000 | California State University, California RB, 5.45%, 11/01/22 | 411,481 | |||||
| 250,000 | City of Aurora IL, Illinois GO, Series A, 4.25%, 12/30/17 | 261,990 | |||||
| Principal Amount | Security Description | Value | ||||
| $ | 250,000 | City of Industry CA, California RB, 7.00%, 01/01/21 | $ | 289,802 | |||
| 150,000 | County of St. Charles MO, Missouri RB, Series C, 5.16%, 10/01/20 | 168,687 | |||||
| 195,000 | Kansas Development Finance Authority, Kansas RB, 5.20%, 11/01/19 | 216,265 | |||||
| 300,000 | Metro Wastewater Reclamation District, Colorado RB, Series B, 5.02%, 04/01/20 | 330,744 | |||||
| 205,000 | Northern Illinois Municipal Power Agency, Illinois RB, Series C, 5.69%, 01/01/17 | 211,017 | |||||
| 100,000 | Regional Transportation District, Colorado RB, Series A, 2.21%, 11/01/21 | 102,799 | |||||
| 200,000 | Santa Monica Community College District, California GO, Series A1-B, 5.73%, 08/01/24 | 230,636 | |||||
| 100,000 | State of Florida Lottery Revenue, Florida RB, 5.19%, 07/01/19 | 112,334 | |||||
| 190,000 | The Board of Water Commissioners City & County of Denver CO, Colorado RB, Series A, 5.00%, 12/15/19 | 214,398 | |||||
| 200,000 | Town of Parker CO, Colorado Certificate of Participation, Series A, 5.30%, 11/01/18 | 219,492 | |||||
| 100,000 | Vista Community Development Commission, California Tax Allocation Bond, 7.61%, 09/01/21 | 120,170 | |||||
| 2,889,815 | |||||||
| Treasury Inflation Index Securities - 0.7% | ||||||
| 637,903 | U.S. Treasury Inflation Indexed Note, 0.13%, 01/15/22 (f) | 648,145 | ||||
| U.S. Treasury Securities - 15.1% | |||||||
| 710,000 | U.S. Treasury Note, 0.63%, 09/30/17 | 709,112 | |||||
| 6,000,000 | U.S. Treasury Note, 1.25%, 01/31/19 | 6,067,968 | |||||
| 5,560,000 | U.S. Treasury Note, 2.00%, 02/28/21 | 5,763,941 | |||||
| 3,585,000 | U.S. Treasury Note, 1.63%, 11/15/22 | 3,612,866 | |||||
| 16,153,887 | |||||||
| Total Government Securities (Cost $19,005,634) | 19,691,847 |
| U.S. GOVERNMENT MORTAGE BACKED-SECURITIES – 0.7% | |||||||
| Federal Home Loan Mortgage Corp. - 0.3% | |||||||
| 322,555 | Federal Home Loan Mortgage Corp. REMIC, 4.00%, 03/15/40 | 343,995 | |||||
| Federal National Mortgage Association - 0.4% | ||||||
| 66,503 | Federal National Mortgage Association, 2.59%, 02/25/22 | 68,817 | ||||
| 150,561 | Federal National Mortgage Association, 3.50%, 12/01/26 | 159,235 | ||||
SCHEDULES OF PORTFOLIO INVESTMENTS
March 31, 2016
BALANCED FUND
| Shares or Principal Amount | Security Description | Value | |||
| $ | 164,643 | Federal National Mortgage Association REMIC, 2.50%, 09/25/39 | $ | 168,122 | ||
| 396,174 | ||||||
Total U.S. Government Mortage Backed-Securities (Cost $735,461) | 740,169 |
Total Government & Agency Obligations (Cost $19,741,095) | 20,432,016 |
| Short-Term Investments - 2.7% | |||||||
| Investment Company - 2.7% | |||||||
| 2,874,385 | BlackRock Liquidity Funds T-Fund Portfolio, 0.18% (g) | 2,874,385 | |||||
| Total Short-Term Investments (Cost $2,874,385) | 2,874,385 |
| Total Investments - 99.7% (Cost $93,104,666) | 106,334,665 |
| Other assets in excess of liabilities – 0.3% | 347,706 | ||
| NET ASSETS – 100.0% | $ | 106,682,371 |
| (a) | Non-income producing security. |
| (b) | The Sub-Adviser has deemed this security which is exempt from registration under the Securities Act of 1933 to be liquid based on procedures approved by Tributary Funds' Board of Directors. As of March 31, 2016, the aggregate vale of these liquid securities was $4,793,140 which represented 4.5% of net assets. |
| (c) | Variable rate security. Rate presented is as of March 31, 2016. |
| (d) | Debt obligation initially issued at one coupon rate which converts to higher coupon rate at a specified date. Rate presented is as of March 31, 2016. |
| (e) | Perpetual maturity security. |
| (f) | U.S. Treasury inflation indexed note, par amount is adjusted for inflation. |
| (g) | Dividend yield changes daily to reflect current market conditions. Rate was the quoted yield as of March 31, 2016. |
| ABS | Asset Backed Security |
| CLO | Collateralized Loan Obligation |
| GO | General Obligation |
| LLC | Limited Liability Company |
| MTN | Medium Term Note |
| PLC | Public Limited Company |
| RB | Revenue Bond |
| REIT | Real Estate Investment Trust |
| REMIC | Real Estate Investment Conduit |
SCHEDULES OF PORTFOLIO INVESTMENTS
March 31, 2016
GROWTH OPPORTUNITIES FUND
| Shares | Security Description | Value |
| Common Stocks - 97.8% |
| Consumer Discretionary - 23.2% |
| 4,000 | AutoZone, Inc. (a) | $ | 3,186,760 | |||
| 42,900 | Big Lots, Inc. | 1,942,941 | ||||
| 14,000 | Brinker International, Inc. | 643,300 | ||||
| 24,300 | Carter's, Inc. | 2,560,734 | ||||
| 38,040 | Dick's Sporting Goods, Inc. | 1,778,370 | ||||
| 64,100 | Discovery Communications, Inc. - Class C (a) | 1,730,700 | ||||
| 20,900 | DR Horton, Inc. | 631,807 | ||||
| 70,500 | Five Below, Inc. (a) | 2,914,470 | ||||
| 30,870 | Foot Locker, Inc. | 1,991,115 | ||||
| 51,200 | Grand Canyon Education, Inc. (a) | 2,188,288 | ||||
| 25,200 | Hanesbrands, Inc. | 714,168 | ||||
| 38,600 | Michael Kors Holdings, Ltd. (a) | 2,198,656 | ||||
| 12,800 | O'Reilly Automotive, Inc. (a) | 3,502,848 | ||||
| 76,820 | Restaurant Brands International, Inc. | 2,982,921 | ||||
| 25,300 | Skechers U.S.A., Inc. - Class A (a) | 770,385 | ||||
| 12,236 | The Madison Square Garden Co. - Class A (a) | 2,035,581 | ||||
| 11,800 | Ulta Salon Cosmetics & Fragrance, Inc. (a) | 2,286,132 | ||||
| 34,059,176 | ||||||
| Consumer Staples - 11.1% | ||||||
| 23,600 | Church & Dwight Co., Inc. | 2,175,448 | ||||
| 16,700 | Constellation Brands, Inc. - Class A | 2,523,203 | ||||
| 31,900 | Post Holdings, Inc. (a) | 2,193,763 | ||||
| 88,000 | Rite Aid Corp. (a) | 717,200 | ||||
| 21,900 | Spectrum Brands Holdings, Inc. | 2,393,232 | ||||
| 88,300 | Sprouts Farmers Market, Inc. (a) | 2,564,232 | ||||
| 7,800 | The Hain Celestial Group, Inc. (a) | 319,098 | ||||
| 16,600 | The JM Smucker Co. | 2,155,344 | ||||
| 29,000 | The WhiteWave Foods Co. (a) | 1,178,560 | ||||
| 16,220,080 | ||||||
| Energy - 0.4% | ||||||
| 3,800 | Concho Resources, Inc. (a) | 383,952 | ||||
| 6,900 | Oceaneering International, Inc. | 229,356 | ||||
| 613,308 | ||||||
| Financials - 12.2% | ||||||
| 153,000 | American Homes 4 Rent - Class A REIT | 2,432,700 | ||||
| 7,100 | Credit Acceptance Corp. (a) | 1,289,005 | ||||
| 57,700 | DuPont Fabros Technology, Inc. REIT | 2,338,581 | ||||
| 9,300 | FactSet Research Systems, Inc. | 1,409,229 | ||||
| 61,000 | Home BancShares, Inc. | 2,497,950 | ||||
| 32,420 | Northern Trust Corp. | 2,112,811 | ||||
| 100,000 | Physicians Realty Trust REIT | 1,858,000 | ||||
| 17,900 | Signature Bank (a) | 2,436,548 | ||||
| 21,500 | T. Rowe Price Group, Inc. | 1,579,390 | ||||
| 17,954,214 | ||||||
| Health Care - 17.3% | ||||||
| 211,680 | Allscripts Healthcare Solutions, Inc. (a) | 2,796,293 | ||||
| 25,000 | Bio-Techne Corp. | 2,363,000 | ||||
| 134,730 | Boston Scientific Corp. (a) | 2,534,271 | ||||
| Shares | Security Description | Value | |||
| 24,800 | Centene Corp. (a) | $ | 1,526,936 | |||
| 6,200 | Cerner Corp. (a) | 328,352 | ||||
| 19,800 | Edwards Lifesciences Corp. (a) | 1,746,558 | ||||
| 51,640 | Insulet Corp. (a) | 1,712,382 | ||||
| 23,570 | Mallinckrodt Plc (a) | 1,444,370 | ||||
| 35,600 | PerkinElmer, Inc. | 1,760,776 | ||||
| 53,700 | Seattle Genetics, Inc. (a) | 1,884,333 | ||||
| 18,800 | Teleflex, Inc. | 2,951,788 | ||||
| 6,700 | The Cooper Cos., Inc. | 1,031,599 | ||||
| 5,400 | United Therapeutics Corp. (a) | 601,722 | ||||
| 61,200 | Zoetis, Inc. | 2,712,996 | ||||
| 25,395,376 | ||||||
| Industrials - 11.9% | ||||||
| 14,594 | Dover Corp. | 938,832 | ||||
| 17,700 | Fortune Brands Home & Security, Inc. | 991,908 | ||||
| 4,900 | Genesee & Wyoming, Inc. - Class A (a) | 307,230 | ||||
| 32,900 | HD Supply Holdings, Inc. (a) | 1,088,003 | ||||
| 51,800 | KAR Auction Services, Inc. | 1,975,652 | ||||
| 83,360 | MasTec, Inc. (a) | 1,687,206 | ||||
| 24,500 | Old Dominion Freight Line, Inc. (a) | 1,705,690 | ||||
| 22,900 | Orbital ATK, Inc. | 1,990,926 | ||||
| 12,800 | Roper Industries, Inc. | 2,339,456 | ||||
| 46,000 | Southwest Airlines Co. | 2,060,800 | ||||
| 16,000 | The Middleby Corp. (a) | 1,708,320 | ||||
| 4,700 | United Rentals, Inc. (a) | 292,293 | ||||
| 11,600 | XPO Logistics, Inc. (a) | 356,120 | ||||
| 17,442,436 | ||||||
| Information Technology - 18.9% | ||||||
| 7,100 | Akamai Technologies, Inc. (a) | 394,547 | ||||
| 59,200 | ARRIS International PLC (a) | 1,356,864 | ||||
| 36,600 | Broadridge Financial Solutions, Inc. | 2,170,746 | ||||
| 32,980 | Cadence Design Systems, Inc. (a) | 777,669 | ||||
| 72,300 | CDW Corp. | 3,000,450 | ||||
| 39,950 | Citrix Systems, Inc. (a) | 3,139,271 | ||||
| 26,800 | Fiserv, Inc. (a) | 2,749,144 | ||||
| 20,400 | FleetCor Technologies, Inc. (a) | 3,034,500 | ||||
| 30,180 | IAC/InterActiveCorp. | 1,420,874 | ||||
| 21,100 | Jack Henry & Associates, Inc. | 1,784,427 | ||||
| 143,100 | Knowles Corp. (a) | 1,886,058 | ||||
| 9,000 | Lam Research Corp. | 743,400 | ||||
| 39,900 | Microchip Technology, Inc. | 1,923,180 | ||||
| 56,800 | Paychex, Inc. | 3,067,768 | ||||
| 11,700 | Qlik Technologies, Inc. (a) | 338,364 | ||||
| 27,787,262 | ||||||
| Materials - 1.6% | ||||||
| 16,400 | Eastman Chemical Co. | 1,184,572 | ||||
| 27,500 | FMC Corp. | 1,110,175 | ||||
| 2,294,747 | ||||||
| Utilities - 1.2% | ||||||
| 26,300 | Southwest Gas Corp. | 1,731,855 | ||||
| Total Common Stocks (Cost $114,925,993) | 143,498,454 |
SCHEDULES OF PORTFOLIO INVESTMENTS
March 31, 2016
GROWTH OPPORTUNITIES FUND
| Shares | Security Description | Value |
| Short-Term Investments - 2.1% | ||||||||
| Investment Company – 2.1% | ||||||||
| 3,151,459 | BlackRock Liquidity Funds T-Fund Portfolio, 0.18% (b) | $ | 3,151,459 | |||||
| Total Short-Term Investments (Cost $3,151,459) | 3,151,459 |
| Total Investments - 99.9% (Cost $118,077,452) | 146,649,913 |
| Other assets in excess of liabilities – 0.1% | 147,237 | ||
| NET ASSETS – 100.0% | $ | 146,797,150 |
| PLC | Public Limited Company |
| REIT | Real Estate Investment Trust |
| (a) | Non-income producing security. |
| (b) | Dividend yield changes daily to reflect current market conditions. Rate was the quoted yield as of March 31, 2016. |
SCHEDULES OF PORTFOLIO INVESTMENTS
March 31, 2016
SMALL COMPANY FUND
| Shares | Security Description | Value |
| Common Stocks - 97.7% | |||||||
| Consumer Discretionary - 12.2% | |||||||
| 363,200 | Callaway Golf Co. | $ | 3,312,384 | ||||
| 177,500 | Del Frisco's Restaurant Group, Inc. (a) | 2,942,950 | |||||
| 342,800 | Francesca's Holdings Corp. (a) | 6,568,048 | |||||
| 274,700 | Interval Leisure Group, Inc. | 3,966,668 | |||||
| 36,300 | Jack in the Box, Inc. | 2,318,481 | |||||
| 186,300 | La Quinta Holdings, Inc. (a) | 2,328,750 | |||||
| 81,200 | Nexstar Broadcasting Group, Inc. - Class A | 3,594,724 | |||||
| 108,100 | The Buckle, Inc. | 3,661,347 | |||||
| 168,600 | Tumi Holdings, Inc. (a) | 4,521,852 | |||||
| 33,215,204 | |||||||
| Consumer Staples - 3.7% | |||||||
| 49,400 | Calavo Growers, Inc. | 2,818,764 | |||||
| 107,500 | Inter Parfums, Inc. | 3,321,750 | |||||
| 36,800 | Lancaster Colony Corp. | 4,068,976 | |||||
| 10,209,490 | |||||||
| Energy - 4.2% | |||||||
| 337,200 | Callon Petroleum Co. (a) | 2,984,220 | |||||
| 173,400 | Matador Resources Co. (a) | 3,287,664 | |||||
| 137,700 | Matrix Service Co. (a) | 2,437,290 | |||||
| 48,000 | PDC Energy, Inc. (a) | 2,853,600 | |||||
| 11,562,774 | |||||||
| Financials - 19.7% | |||||||
| 305,400 | Cardinal Financial Corp. | 6,214,890 | |||||
| 35,500 | Cullen/Frost Bankers, Inc. | 1,956,405 | |||||
| 101,600 | Education Realty Trust, Inc. REIT | 4,226,560 | |||||
| 83,600 | LTC Properties, Inc. REIT | 3,782,064 | |||||
| 163,500 | MB Financial, Inc. | 5,305,575 | |||||
| 461,000 | Old National Bancorp | 5,619,590 | |||||
| 97,300 | Opus Bank | 3,308,200 | |||||
| 185,000 | Selective Insurance Group, Inc. | 6,772,850 | |||||
| 170,200 | Southside Bancshares, Inc. | 4,437,114 | |||||
| 135,000 | Stifel Financial Corp. (a) | 3,996,000 | |||||
| 76,100 | UMB Financial Corp. | 3,929,043 | |||||
| 112,700 | United Bankshares, Inc. | 4,136,090 | |||||
| 53,684,381 | |||||||
| Health Care - 14.9% | |||||||
| 148,800 | AMN Healthcare Services, Inc. (a) | 5,001,168 | |||||
| 61,800 | Analogic Corp. | 4,882,818 | |||||
| 98,900 | Diplomat Pharmacy, Inc. (a) | 2,709,860 | |||||
| 114,800 | Genomic Health, Inc. (a) | 2,843,596 | |||||
| 79,600 | Greatbatch, Inc. (a) | 2,836,944 | |||||
| 79,600 | Integra LifeSciences Holdings Corp. (a) | 5,361,856 | |||||
| 82,800 | Masimo Corp. (a) | 3,464,352 | |||||
| 71,800 | Team Health Holdings, Inc. (a) | 3,001,958 | |||||
| 71,000 | VCA, Inc. (a) | 4,095,990 | |||||
| 92,000 | West Pharmaceutical Services, Inc. | 6,377,440 | |||||
| 40,575,982 | |||||||
| Industrials - 14.0% | |||||||
| 103,500 | Barnes Group, Inc. | 3,625,605 | |||||
| 101,900 | CLARCOR, Inc. | 5,888,801 | |||||
| Shares | Security Description | Value | ||||
| 95,400 | Forward Air Corp. | $ | 4,323,528 | ||||
| 127,700 | Franklin Electric Co., Inc. | 4,108,109 | |||||
| 124,200 | Granite Construction, Inc. | 5,936,760 | |||||
| 92,600 | Multi-Color Corp. | 4,940,210 | |||||
| 305,400 | Navigant Consulting, Inc. (a) | 4,828,374 | |||||
| 148,700 | Tetra Tech, Inc. | 4,434,234 | |||||
| 38,085,621 | |||||||
| Information Technology - 19.7% | |||||||
| 79,100 | Anixter International, Inc. (a) | 4,121,901 | |||||
| 49,500 | CACI International, Inc. - Class A (a) | 5,281,650 | |||||
| 188,000 | CalAmp Corp. (a) | 3,370,840 | |||||
| 54,600 | Coherent, Inc. (a) | 5,017,740 | |||||
| 72,300 | ExlService Holdings, Inc. (a) | 3,745,140 | |||||
| 48,400 | Littelfuse, Inc. | 5,958,524 | |||||
| 112,700 | Methode Electronics, Inc. | 3,295,348 | |||||
| 133,900 | Microsemi Corp. (a) | 5,129,709 | |||||
| 71,000 | MTS Systems Corp. | 4,320,350 | |||||
| 96,800 | National Instruments Corp. | 2,914,648 | |||||
| 121,500 | PTC, Inc. (a) | 4,028,940 | |||||
| 73,000 | Silicon Motion Technology Corp., ADR | 2,833,130 | |||||
| 74,400 | Syntel, Inc. (a) | 3,714,792 | |||||
| 53,732,712 | |||||||
| Materials - 5.8% | |||||||
| 169,900 | A Schulman, Inc. | 4,624,678 | |||||
| 65,300 | Balchem Corp. | 4,049,906 | |||||
| 79,300 | Carpenter Technology Corp. | 2,714,439 | |||||
| 68,600 | Sensient Technologies Corp. | 4,353,356 | |||||
| 15,742,379 | |||||||
| Utilities - 3.5% | |||||||
| 74,200 | IDACORP, Inc. | 5,534,578 | |||||
| 78,800 | Westar Energy, Inc. | 3,909,268 | |||||
| 9,443,846 | |||||||
| Total Common Stocks (Cost $214,035,355) | 266,252,389 |
| Short-Term Investments - 3.1% | |||||||
Investment Company - 3.1% | |||||||
| 8,388,415 | BlackRock Liquidity Funds T-Fund Portfolio, 0.18% (b) | 8,388,415 | |||||
| Total Short-Term Investments (Cost $8,388,415) | 8,388,415 |
| Total Investments - 100.8% (Cost $222,423,770) | 274,640,804 |
| Other liabilities in excess of other assets – (0.8)% | (2,133,920 | ) | |
| NET ASSETS – 100.0% | $ | 272,506,884 |
| ADR | American Depositary Receipt |
| REIT | Real Estate Investment Trust |
| (a) | Non-income producing security. |
| (b) | Dividend yield changes daily to reflect current market conditions. Rate was the quoted yield as of March 31, 2016. |
STATEMENTS OF ASSETS AND LIABILITIES
March 31, 2016
| SHORT-INTERMEDIATE BOND FUND | INCOME FUND | |||||||||
| Assets: | ||||||||||
| Investments, at cost | $ | 123,389,536 | $ | 188,998,804 | ||||||
| Unrealized appreciation of investments | 154,651 | 3,244,829 | ||||||||
| Investments, at value | 123,544,187 | 192,243,633 | ||||||||
| Receivable for capital shares issued | 1,116,831 | 1,988,156 | ||||||||
| Interest and dividends receivable | 442,315 | 999,938 | ||||||||
| Prepaid expenses | 25,898 | 30,859 | ||||||||
| Total Assets | 125,129,231 | 195,262,586 | ||||||||
| Liabilities: | ||||||||||
| Distributions payable | 167,298 | 319,802 | ||||||||
| Payable for investments purchased | 270,223 | 408,277 | ||||||||
| Payable for capital shares redeemed | �� | 106,191 | 121,795 | |||||||
| Accrued expenses and other payables: | ||||||||||
| Investment advisory fees | 26,371 | 54,722 | ||||||||
| Administration fees payable to non-related parties | 4,473 | 6,882 | ||||||||
| Administration fees payable to related parties | 6,966 | 10,716 | ||||||||
| Shareholder service fees - Institutional Class | 4,261 | 2,596 | ||||||||
| Other fees | 33,508 | 38,410 | ||||||||
| Total Liabilities | 619,291 | 963,200 | ||||||||
| Net Assets | $ | 124,509,940 | $ | 194,299,386 | ||||||
| Composition of Net Assets: | ||||||||||
| Paid-in capital | $ | 125,917,369 | $ | 191,438,693 | ||||||
| Accumulated (excess of distributions over) net investment income | (152,384 | ) | 76,360 | |||||||
| Accumulated net realized gain (loss) from investments | (1,409,696 | ) | (460,496 | ) | ||||||
| Net unrealized appreciation on investments | 154,651 | 3,244,829 | ||||||||
| Net Assets | $ | 124,509,940 | $ | 194,299,386 | ||||||
| Institutional Class: | ||||||||||
| Net assets | $ | 12,202,090 | $ | 6,809,430 | ||||||
| Shares of beneficial interest (see Note 5) | 1,300,860 | 654,042 | ||||||||
| Net asset value, offering and redemption price per share | $ | 9.38 | $ | 10.41 | ||||||
| Institutional Plus Class: | ||||||||||
| Net assets | $ | 112,307,850 | $ | 187,489,956 | ||||||
| Shares of beneficial interest (see Note 5) | 11,936,238 | 18,009,728 | ||||||||
| Net asset value, offering and redemption price per share | $ | 9.41 | $ | 10.41 | ||||||
STATEMENTS OF ASSETS AND LIABILITIES
March 31, 2016
| NEBRASKA TAX-FREE FUND | BALANCED FUND | GROWTH OPPORTUNITIES FUND | SMALL COMPANY FUND | ||||||||||||
| $ | 55,164,084 | $ | 93,104,666 | $ | 118,077,452 | $ | 222,423,770 | ||||||||
| 1,438,891 | 13,229,999 | 28,572,461 | 52,217,034 | ||||||||||||
| 56,602,975 | 106,334,665 | 146,649,913 | 274,640,804 | ||||||||||||
| 182,104 | 215,294 | 258,268 | 481,514 | ||||||||||||
| 611,956 | 313,536 | 120,785 | 139,701 | ||||||||||||
| 383 | 16,095 | 20,723 | 27,048 | ||||||||||||
| 57,397,418 | 106,879,590 | 147,049,689 | 275,289,067 | ||||||||||||
| 160,458 | - | - | - | ||||||||||||
| 175,000 | - | - | - | ||||||||||||
| - | 77,633 | 102,367 | 2,534,020 | ||||||||||||
| 364 | 63,144 | 85,295 | 170,044 | ||||||||||||
| 2,139 | 4,012 | 5,509 | 10,091 | ||||||||||||
| 3,331 | 6,248 | 8,579 | 15,714 | ||||||||||||
| - | 15,495 | 21,206 | 15,088 | ||||||||||||
| 26,869 | 30,687 | 29,583 | 37,226 | ||||||||||||
| 368,161 | 197,219 | 252,539 | 2,782,183 | ||||||||||||
| $ | 57,029,257 | $ | 106,682,371 | $ | 146,797,150 | $ | 272,506,884 | ||||||||
| $ | 55,807,899 | $ | 91,849,463 | $ | 115,947,684 | $ | 219,181,295 | ||||||||
| (64,470 | ) | 7,779 | (29,120 | ) | 141,630 | ||||||||||
| (153,063 | ) | 1,595,130 | 2,306,125 | 966,925 | |||||||||||
| 1,438,891 | 13,229,999 | 28,572,461 | 52,217,034 | ||||||||||||
| $ | 57,029,257 | $ | 106,682,371 | $ | 146,797,150 | $ | 272,506,884 | ||||||||
| $ | - | $ | 71,090,221 | $ | 43,260,470 | $ | 51,527,340 | ||||||||
| - | 4,255,538 | 2,919,670 | 2,224,114 | ||||||||||||
| $ | - | $ | 16.71 | $ | 14.82 | $ | 23.17 | ||||||||
| $ | 57,029,257 | $ | 35,592,150 | $ | 103,536,680 | $ | 220,979,544 | ||||||||
| 5,676,356 | 2,143,453 | 6,900,348 | 9,524,151 | ||||||||||||
| $ | 10.05 | $ | 16.61 | $ | 15.00 | $ | 23.20 |
STATEMENTS OF OPERATIONS
For the Year or Period Ended March 31, 2016
| SHORT-INTERMEDIATE BOND FUND | INCOME FUND | ||||||||||
| Investment Income: | |||||||||||
| Interest | . | $ | 2,544,933 | $ | 4,973,092 | ||||||
| Dividend | 20,262 | 129,111 | |||||||||
| Foreign tax witholding | - | - | |||||||||
| Total Income | 2,565,195 | 5,102,203 | |||||||||
| Expenses: | |||||||||||
| Investment advisory fees | 565,741 | 1,003,792 | |||||||||
| Administration fees | 149,898 | 221,175 | |||||||||
| Shareholder service fees - Institutional Class | 37,011 | 23,528 | |||||||||
| Custodian fees | 8,434 | 11,147 | |||||||||
| Professional fees | - | - | |||||||||
| Chief compliance officer fees | 12,134 | 18,023 | |||||||||
| Director fees | 5,562 | 7,998 | |||||||||
| Registration and filing fees | 15,520 | 17,486 | |||||||||
| Transfer agent fees | 57,422 | 62,203 | |||||||||
| Pricing fees | - | - | |||||||||
| Other fees | 77,807 | 92,454 | |||||||||
| Total expenses before waivers | 929,529 | 1,457,806 | |||||||||
| Expenses waived and reimbursed | (282,185 | ) | (365,040 | ) | |||||||
| Total Expenses | 647,344 | 1,092,766 | |||||||||
| Net Investment Income (Loss) | 1,917,851 | 4,009,437 | |||||||||
| Realized and Unrealized Gain (Loss) On Investments: | |||||||||||
| Net realized gain (loss) on investment transactions | 99,565 | 63,467 | |||||||||
| Change in unrealized appreciation (depreciation) on investments | (570,544 | ) | (538,360 | ) | |||||||
| Net realized and unrealized gain (loss) on investments | (470,979 | ) | (474,893 | ) | |||||||
| Net increase (decrease) in net assets from operations | $ | 1,446,872 | $ | 3,534,544 | |||||||
| * | Commencement of operations was January 1, 2016. | ||||||||||
STATEMENTS OF OPERATIONS
For the Year or Period Ended March 31, 2016
| NEBRASKA TAX-FREE FUND * | BALANCED FUND | GROWTH OPPORTUNITIES FUND | SMALL COMPANY FUND | ||||||||||||||
| $ | 462,178 | $ | 944,742 | $ | - | $ | - | ||||||||||
| 909 | 696,714 | 1,361,670 | 3,364,763 | ||||||||||||||
| - | - | (5,308 | ) | (2,374 | ) | ||||||||||||
| 463,087 | 1,641,456 | 1,356,362 | 3,362,389 | ||||||||||||||
| 54,796 | 821,614 | 1,217,243 | 2,220,418 | ||||||||||||||
| 17,513 | 145,235 | 215,701 | 346,332 | ||||||||||||||
| - | 147,352 | 108,438 | 87,796 | ||||||||||||||
| 1,210 | 7,506 | 9,425 | 12,271 | ||||||||||||||
| 17,000 | - | - | - | ||||||||||||||
| 1,411 | 11,482 | 16,751 | 27,438 | ||||||||||||||
| 648 | 5,361 | 8,010 | 12,672 | ||||||||||||||
| 1,726 | 23,164 | 23,927 | 22,696 | ||||||||||||||
| 4,291 | 66,807 | 70,841 | 88,759 | ||||||||||||||
| 7,885 | - | - | - | ||||||||||||||
| 8,832 | 62,619 | 63,701 | 82,473 | ||||||||||||||
| 115,312 | 1,291,140 | 1,734,037 | 2,900,855 | ||||||||||||||
| (53,666 | ) | (60,558 | ) | (103,068 | ) | (232,653 | ) | ||||||||||
| 61,646 | 1,230,582 | 1,630,969 | 2,668,202 | ||||||||||||||
| 401,441 | 410,874 | (274,607 | ) | 694,187 | |||||||||||||
| (152,491 | ) | 2,908,302 | 11,410,112 | 7,034,705 | |||||||||||||
| 456,440 | (6,856,646 | ) | (28,588,703 | ) | (8,024,631 | ) | |||||||||||
| 303,949 | (3,948,344 | ) | (17,178,591 | ) | (989,926 | ) | |||||||||||
| $ | 705,390 | $ | (3,537,470 | ) | $ | (17,453,198 | ) | $ | (295,739 | ) | |||||||
STATEMENTS OF CHANGES IN NET ASSETS
| SHORT-INTERMEDIATE BOND FUND | INCOME FUND | NEBRASKA TAX-FREE FUND | |||||||||||||||||||||||||||||||
For the Year Ended March 31, 2016 | For the Year Ended March 31, 2015 | For the Year Ended March 31, 2016 | For the Year Ended March 31, 2015 | January 1, 2016* Through March 31, 2016 | |||||||||||||||||||||||||||||
| Operations: | |||||||||||||||||||||||||||||||||
| Net investment income (loss) | $ | 1,917,851 | $ | 1,602,060 | $ | 4,009,437 | $ | 3,056,404 | $ | 401,441 | |||||||||||||||||||||||
| Net realized gain (loss) on investment transactions | 99,565 | 129,622 | 63,467 | 598,571 | (152,491 | ) | |||||||||||||||||||||||||||
| Net change in unrealized appreciation (depreciation) on investments | (570,544 | ) | (42,954 | ) | (538,360 | ) | 2,798,021 | 456,440 | |||||||||||||||||||||||||
| Net increase (decrease) in net assets from operations | 1,446,872 | 1,688,728 | 3,534,544 | 6,452,996 | 705,390 | ||||||||||||||||||||||||||||
| Distributions to Shareholders: | |||||||||||||||||||||||||||||||||
| From net investment income | |||||||||||||||||||||||||||||||||
| Institutional Class | (286,555 | ) | (291,929 | ) | (350,580 | ) | (412,416 | ) | - | ||||||||||||||||||||||||
| Institutional Plus Class | (1,892,402 | ) | (1,617,218 | ) | (4,267,580 | ) | (2,884,748 | ) | (466,483 | ) | |||||||||||||||||||||||
| From net realized gains on investments | |||||||||||||||||||||||||||||||||
| Institutional Class | (11,772 | ) | (26,650 | ) | (4,936 | ) | (9,917 | ) | - | ||||||||||||||||||||||||
| Institutional Plus Class | (99,052 | ) | (113,010 | ) | (121,294 | ) | (60,414 | ) | - | ||||||||||||||||||||||||
| Change in net assets from distributions to shareholders | (2,289,781 | ) | (2,048,807 | ) | (4,744,390 | ) | (3,367,495 | ) | (466,483 | ) | |||||||||||||||||||||||
| Capital Transactions: | |||||||||||||||||||||||||||||||||
| Proceeds from shares issued | |||||||||||||||||||||||||||||||||
| Institutional Class | 5,134,909 | 15,251,366 | 7,841,907 | 12,117,966 | - | ||||||||||||||||||||||||||||
| Institutional Plus Class | 47,979,860 | 25,587,718 | 91,949,778 | 39,354,660 | 57,795,180 | ** | |||||||||||||||||||||||||||
| Proceeds from dividends reinvested | |||||||||||||||||||||||||||||||||
| Institutional Class | 196,937 | 244,100 | 315,772 | 386,732 | - | ||||||||||||||||||||||||||||
| Institutional Plus Class | 385,256 | 193,358 | 1,049,992 | 534,417 | 1,625 | ||||||||||||||||||||||||||||
| Cost of shares redeemed | |||||||||||||||||||||||||||||||||
| 4 | Institutional Class | (15,978,700 | ) | (5,546,677 | ) | (20,686,461 | ) | (3,990,065 | ) | - | |||||||||||||||||||||||
| 5 | Institutional Plus Class | (27,152,535 | ) | (27,854,281 | ) | (25,079,952 | ) | (14,965,552 | ) | (1,006,455 | ) | ||||||||||||||||||||||
| Change in net assets from capital transactions | 10,565,727 | 7,875,584 | 55,391,036 | 33,438,158 | 56,790,350 | ||||||||||||||||||||||||||||
| Change in net assets | 9,722,818 | 7,515,505 | 54,181,190 | 36,523,659 | 57,029,257 | ||||||||||||||||||||||||||||
| Net Assets: | |||||||||||||||||||||||||||||||||
| Beginning of year | 114,787,122 | 107,271,617 | 140,118,196 | 103,594,537 | - | ||||||||||||||||||||||||||||
| End of year | $ | 124,509,940 | $ | 114,787,122 | $ | 194,299,386 | $ | 140,118,196 | $ | 57,029,257 | |||||||||||||||||||||||
| Accumulated (excess of distributions over) net investment income (loss) | $ | (152,384 | ) | $ | (223,440 | ) | $ | 76,360 | $ | 355,676 | $ | (64,470 | ) | ||||||||||||||||||||
| Share Transactions Institutional Class: | |||||||||||||||||||||||||||||||||
| Shares issued | 545,967 | 1,609,543 | 757,834 | 1,167,496 | - | ||||||||||||||||||||||||||||
| Shares reinvested | 20,949 | 25,798 | 30,541 | 37,132 | - | ||||||||||||||||||||||||||||
| Shares redeemed | (1,698,950 | ) | (586,226 | ) | (2,007,699 | ) | (383,446 | ) | - | ||||||||||||||||||||||||
| Change in shares | (1,132,034 | ) | 1,049,115 | (1,219,324 | ) | 821,182 | - | ||||||||||||||||||||||||||
| Share Transactions Institutional Plus Class: | |||||||||||||||||||||||||||||||||
| Shares issued | 5,095,938 | 2,692,813 | 8,892,333 | 3,783,503 | 5,776,423 | ** | |||||||||||||||||||||||||||
| Shares reinvested | 40,955 | 20,363 | 101,717 | 51,288 | 162 | ||||||||||||||||||||||||||||
| Shares redeemed | (2,879,134 | ) | (2,931,712 | ) | (2,430,088 | ) | (1,436,069 | ) | (100,229 | ) | |||||||||||||||||||||||
| Change in shares | 2,257,759 | (218,536 | ) | 6,563,962 | 2,398,722 | 5,676,356 | |||||||||||||||||||||||||||
| * | Commencement of operations. | ||||||||||||||||||||||||||||||||
| ** | See Note 1. | ||||||||||||||||||||||||||||||||
STATEMENTS OF CHANGES IN NET ASSETS
BALANCED FUND | GROWTH OPPORTUNITIES FUND | SMALL COMPANY FUND | ||||||||||||||||||||||||
For the Year Ended March 31, 2016 | For the Year Ended March 31, 2015 | For the Year Ended March 31, 2016 | For the Year Ended March 31, 2015 | For the Year Ended March 31, 2016 | For the Year Ended March 31, 2015 | |||||||||||||||||||||
| $ | 410,874 | $ | 120,104 | $ | (274,607 | ) | $ | (540,325 | ) | $ | 694,187 | $ | 686,875 | |||||||||||||
| 2,908,302 | 2,063,206 | 11,410,112 | 24,270,588 | 7,034,705 | 27,212,398 | |||||||||||||||||||||
| (6,856,646 | ) | 6,926,044 | (28,588,703 | ) | (3,092,755 | ) | (8,024,631 | ) | (5,426,752 | ) | ||||||||||||||||
| (3,537,470 | ) | 9,109,354 | (17,453,198 | ) | 20,637,508 | (295,739 | ) | 22,472,521 | ||||||||||||||||||
| (239,199 | ) | (27,341 | ) | - | - | (67,293 | ) | (13,323 | ) | |||||||||||||||||
| (197,197 | ) | (76,522 | ) | - | - | (1,031,768 | ) | (345,372 | ) | |||||||||||||||||
| (1,640,833 | ) | (6,357,484 | ) | (5,855,217 | ) | (6,722,523 | ) | (1,160,025 | ) | (3,981,666 | ) | |||||||||||||||
| (773,100 | ) | (2,274,421 | ) | (15,533,094 | ) | (13,427,577 | ) | (6,458,336 | ) | (18,431,393 | ) | |||||||||||||||
| (2,850,329 | ) | (8,735,768 | ) | (21,388,311 | ) | (20,150,100 | ) | (8,717,422 | ) | (22,771,754 | ) | |||||||||||||||
| 27,567,997 | 26,807,679 | 12,021,998 | 9,954,681 | 28,070,064 | 19,871,107 | |||||||||||||||||||||
| 5,821,878 | 17,771,053 | 27,132,124 | 23,647,450 | 42,476,909 | 105,445,428 | |||||||||||||||||||||
| 1,585,443 | 5,679,964 | 5,574,556 | 6,342,624 | 1,050,991 | 3,572,725 | |||||||||||||||||||||
| 872,511 | 2,043,920 | 6,955,862 | 5,862,598 | 3,604,744 | 8,446,277 | |||||||||||||||||||||
| (24,242,253 | ) | (30,967,092 | ) | (19,018,481 | ) | (19,668,891 | ) | (27,600,255 | ) | (14,130,500 | ) | |||||||||||||||
| (4,750,283 | ) | (5,010,006 | ) | (21,919,196 | ) | (28,202,267 | ) | (34,669,199 | ) | (60,655,365 | ) | |||||||||||||||
| 6,855,293 | 16,325,518 | 10,746,863 | (2,063,805 | ) | 12,933,254 | 62,549,672 | ||||||||||||||||||||
| 467,494 | 16,699,104 | (28,094,646 | ) | (1,576,397 | ) | 3,920,093 | 62,250,439 | |||||||||||||||||||
| 106,214,877 | 89,515,773 | 174,891,796 | 176,468,193 | 268,586,791 | 206,336,352 | |||||||||||||||||||||
| $ | 106,682,371 | $ | 106,214,877 | $ | 146,797,150 | $ | 174,891,796 | $ | 272,506,884 | $ | 268,586,791 | |||||||||||||||
| $ | 7,779 | $ | 21,117 | $ | (29,120 | ) | $ | (161,586 | ) | $ | 141,630 | $ | 673,446 | |||||||||||||
| 1,588,504 | 1,516,391 | 690,020 | 516,220 | 1,239,171 | 817,715 | |||||||||||||||||||||
| 95,185 | 335,399 | 381,036 | 354,337 | 46,649 | 151,194 | |||||||||||||||||||||
| (1,426,151 | ) | (1,777,076 | ) | (1,089,841 | ) | (1,024,574 | ) | (1,193,568 | ) | (593,829 | ) | |||||||||||||||
| 257,538 | 74,714 | (18,785 | ) | (154,017 | ) | 92,252 | 375,080 | |||||||||||||||||||
| 344,198 | 1,026,044 | 1,589,463 | 1,257,346 | 1,883,286 | 4,492,438 | |||||||||||||||||||||
| 52,660 | 121,038 | 469,991 | 324,798 | 159,856 | 356,684 | |||||||||||||||||||||
| (280,122 | ) | (287,522 | ) | (1,361,162 | ) | (1,463,870 | ) | (1,526,934 | ) | (2,533,408 | ) | |||||||||||||||
| 116,736 | 859,560 | 698,292 | 118,274 | 516,208 | 2,315,714 | |||||||||||||||||||||
FINANCIAL HIGHLIGHTS
For a Share Outstanding
| Investment Activities | Distributions to Shareholders from: | Ratios/Supplemental Data | |||||||||||||||||||||||||||||||||||||
| Period Ended | Net Asset Value, Beginning of Period | Net Investment Income (Loss)(a) | Net Realized and Unrealized Gains (Losses) on Investments | Total from Investment Operations | Net Investment Income | Net Realized Gains on Investments | Net Asset Value, End of Period | Total Return(b) | Net Assets, End of Period (000's) | Expense to Average Net Assets(c) | Net Investment Income (Loss) to Average Net Assets(c) | Expense to Average Net Assets(*)(c) | Portfolio Turnover(b) | ||||||||||||||||||||||||||
| SHORT-INTERMEDIATE BOND FUND | |||||||||||||||||||||||||||||||||||||||
| Institutional Class | |||||||||||||||||||||||||||||||||||||||
| 03/31/16 | $9.45 | $0.14 | $(0.04 | ) | $0.10 | $(0.16 | ) | $(0.01 | ) | $9.38 | 1.11 | % | $12,202 | 0.76 | % | 1.50 | % | 1.11 | % | 40 | % | ||||||||||||||||||
| 03/31/15 | 9.48 | 0.12 | 0.00 | 0.12 | (0.14 | ) | (0.01 | ) | 9.45 | 1.33 | 23,000 | 0.79 | 1.24 | 1.04 | 51 | ||||||||||||||||||||||||
| 03/31/14 | 9.60 | 0.15 | (0.12 | ) | 0.03 | (0.15 | ) | (0.00 | (d) | 9.48 | 0.40 | 13,123 | 0.79 | 1.62 | 1.01 | 48 | |||||||||||||||||||||||
| 03/31/13 | 9.48 | 0.23 | 0.13 | 0.36 | (0.23 | ) | (0.01 | ) | 9.60 | 3.85 | 48,543 | 0.83 | 2.36 | 1.05 | 50 | ||||||||||||||||||||||||
| 03/31/12 | 9.51 | 0.25 | 0.01 | 0.26 | (0.27 | ) | (0.02 | ) | 9.48 | 2.80 | 49,848 | 0.84 | 2.66 | 1.06 | 42 | ||||||||||||||||||||||||
| Institutional Plus Class | |||||||||||||||||||||||||||||||||||||||
| 03/31/16 | 9.48 | 0.16 | (0.04 | ) | 0.12 | (0.18 | ) | (0.01 | ) | 9.41 | 1.32 | 112,308 | 0.54 | 1.73 | 0.77 | 40 | |||||||||||||||||||||||
| 03/31/15 | 9.51 | 0.14 | 0.01 | 0.15 | (0.17 | ) | (0.01 | ) | 9.48 | 1.57 | 91,787 | 0.55 | 1.48 | 0.80 | 51 | ||||||||||||||||||||||||
| 03/31/14 | 9.61 | 0.17 | (0.10 | ) | 0.07 | (0.17 | ) | (0.00 | )(d) | 9.51 | 0.77 | 94,149 | 0.58 | 1.79 | 0.80 | 48 | |||||||||||||||||||||||
| 03/31/13 | 9.49 | 0.25 | 0.14 | 0.39 | (0.26 | ) | (0.01 | ) | 9.61 | 4.11 | 30,342 | 0.58 | 2.59 | 0.80 | 50 | ||||||||||||||||||||||||
03/31/12(e) | 9.40 | 0.13 | 0.12 | 0.25 | (0.14 | ) | (0.02 | ) | 9.49 | 2.62 | 15,936 | 0.61 | 2.98 | 0.83 | 42 | ||||||||||||||||||||||||
| INCOME FUND | |||||||||||||||||||||||||||||||||||||||
| Institutional Class | |||||||||||||||||||||||||||||||||||||||
| 03/31/16 | $10.51 | $0.24 | $(0.05 | ) | $0.19 | $(0.28 | ) | $(0.01 | ) | $10.41 | 1.77 | % | $6,809 | 0.81 | % | 2.29 | % | 1.19 | % | 24 | % | ||||||||||||||||||
| 03/31/15 | 10.25 | 0.24 | 0.29 | 0.53 | (0.26 | ) | (0.01 | ) | 10.51 | 5.18 | 19,693 | 0.85 | 2.30 | 1.11 | 52 | ||||||||||||||||||||||||
| 03/31/14 | 10.47 | 0.28 | (0.21 | ) | 0.07 | (0.29 | ) | — | 10.25 | 0.72 | 10,784 | 0.81 | 2.71 | 1.08 | 55 | ||||||||||||||||||||||||
| 03/31/13 | 10.23 | 0.31 | 0.24 | 0.55 | (0.31 | ) | — | 10.47 | 5.46 | 54,724 | 0.88 | 3.01 | 1.15 | 42 | |||||||||||||||||||||||||
| 03/31/12 | 9.91 | 0.36 | 0.32 | 0.68 | (0.36 | ) | — | 10.23 | 6.93 | 54,401 | 0.91 | 3.56 | 1.18 | 38 | |||||||||||||||||||||||||
| Institutional Plus Class | |||||||||||||||||||||||||||||||||||||||
| 03/31/16 | 10.52 | 0.25 | (0.07 | ) | 0.18 | (0.28 | ) | (0.01 | ) | 10.41 | 1.81 | 187,490 | 0.64 | 2.41 | 0.85 | 24 | |||||||||||||||||||||||
| 03/31/15 | 10.26 | 0.26 | 0.29 | 0.55 | (0.28 | ) | (0.01 | ) | 10.52 | 5.40 | 120,425 | 0.63 | 2.52 | 0.89 | 52 | ||||||||||||||||||||||||
| 03/31/14 | 10.48 | 0.30 | (0.22 | ) | 0.08 | (0.30 | ) | — | 10.26 | 0.79 | 92,810 | 0.64 | 2.91 | 0.91 | 55 | ||||||||||||||||||||||||
| 03/31/13 | 10.24 | 0.34 | 0.24 | 0.58 | (0.34 | ) | — | 10.48 | 5.70 | 25,266 | 0.63 | 3.24 | 0.90 | 42 | |||||||||||||||||||||||||
03/31/12(e) | 10.14 | 0.15 | 0.10 | 0.25 | (0.15 | ) | — | 10.24 | 2.47 | 11,933 | 0.66 | 3.45 | 0.93 | 38 | |||||||||||||||||||||||||
| NEBRASKA TAX-FREE FUND | |||||||||||||||||||||||||||||||||||||||
| Institutional Plus Class | |||||||||||||||||||||||||||||||||||||||
03/31/16(e) | $10.00 | $0.07 | $0.07 | $0.14 | $(0.09 | ) | $— | $10.05 | 1.35 | % | $57,029 | 0.45 | % | 2.96 | % | 0.85 | % | 5 | % | ||||||||||||||||||||
| BALANCED FUND | |||||||||||||||||||||||||||||||||||||||
| Institutional Class | |||||||||||||||||||||||||||||||||||||||
| 03/31/16 | $17.66 | $0.05 | $(0.57 | ) | $(0.52 | ) | $(0.06 | ) | $(0.37 | ) | $16.71 | (2.93 | )% | $71,090 | 1.19 | % | 0.31 | % | 1.26 | % | 42 | % | |||||||||||||||||
| 03/31/15 | 17.61 | 0.01 | 1.58 | 1.59 | (0.01 | ) | (1.53 | ) | 17.66 | 9.40 | 70,615 | 1.17 | 0.06 | 1.26 | 69 | ||||||||||||||||||||||||
| 03/31/14 | 16.30 | 0.09 | 2.56 | 2.65 | (0.10 | ) | (1.24 | ) | 17.61 | 16.46 | 69,070 | 1.16 | 0.53 | 1.29 | 91 | ||||||||||||||||||||||||
| 03/31/13 | 15.39 | 0.15 | 0.90 | 1.05 | (0.14 | ) | — | 16.30 | 6.89 | 55,358 | 1.22 | 0.98 | 1.35 | 27 | |||||||||||||||||||||||||
| 03/31/12 | 14.27 | 0.13 | 1.12 | 1.25 | (0.13 | ) | — | 15.39 | 8.82 | 52,199 | 1.25 | 0.93 | 1.38 | 25 | |||||||||||||||||||||||||
| Institutional Plus Class | |||||||||||||||||||||||||||||||||||||||
| 03/31/16 | 17.57 | 0.09 | (0.59 | ) | (0.50 | ) | (0.09 | ) | (0.37 | ) | 16.61 | (2.78 | ) | 35,592 | 0.99 | 0.51 | 1.01 | 42 | |||||||||||||||||||||
| 03/31/15 | 17.52 | 0.05 | 1.57 | 1.62 | (0.04 | ) | (1.53 | ) | 17.57 | 9.67 | 35,600 | 0.97 | 0.30 | 1.06 | 69 | ||||||||||||||||||||||||
| 03/31/14 | 16.23 | 0.12 | 2.54 | 2.66 | (0.13 | ) | (1.24 | ) | 17.52 | 16.65 | 20,446 | 0.95 | 0.72 | 1.08 | 91 | ||||||||||||||||||||||||
| 03/31/13 | 15.36 | 0.19 | 0.90 | 1.09 | (0.22 | ) | — | 16.23 | 7.17 | 12,569 | 0.97 | 1.24 | 1.10 | 27 | |||||||||||||||||||||||||
03/31/12(e) | 13.90 | 0.07 | 1.47 | 1.54 | (0.08 | ) | — | 15.36 | 11.13 | 12,773 | 1.02 | 1.06 | 1.15 | 25 | |||||||||||||||||||||||||
FINANCIAL HIGHLIGHTS
For a Share Outstanding
| Investment Activities | Distributions to Shareholders from: | Ratios/Supplemental Data | ||||||||||||||||||||||||||||||||||||||
| Period Ended | Net Asset Value, Beginning of Period | Net Investment Income (Loss)(a) | Net Realized and Unrealized Gains (Losses) on Investments | Total from Investment Operations | Net Investment Income | Net Realized Gains on Investments | Net Asset Value, End of Period | Total Return(b) | Net Assets, End of Period (000's) | Expense to Average Net Assets(c) | Net Investment Income (Loss) to Average Net Assets(c) | Expense to Average Net Assets(*)(c) | Portfolio Turnover(b) | |||||||||||||||||||||||||||
| GROWTH OPPORTUNITIES FUND | ||||||||||||||||||||||||||||||||||||||||
| Institutional Class | ||||||||||||||||||||||||||||||||||||||||
| 03/31/16 | $19.02 | $(0.06 | ) | $(1.83 | ) | $(1.89 | ) | — | $(2.31 | ) | $14.82 | (9.78 | )% | $43,260 | 1.16 | % | (0.34 | )% | 1.27 | % | 57 | % | ||||||||||||||||||
| 03/31/15 | 19.16 | (0.09 | ) | 2.41 | 2.32 | — | (2.46 | ) | 19.02 | 12.93 | 55,888 | 1.14 | (0.47 | ) | 1.23 | 50 | ||||||||||||||||||||||||
| 03/31/14 | 16.63 | (0.05 | ) | 4.10 | 4.05 | — | (1.52 | ) | 19.16 | 24.36 | 59,249 | 1.08 | (0.28 | ) | 1.20 | 56 | ||||||||||||||||||||||||
| 03/31/13 | 15.52 | (0.05 | ) | 1.53 | 1.48 | — | (0.37 | ) | 16.63 | 9.79 | 86,600 | 1.15 | (0.33 | ) | 1.27 | 55 | ||||||||||||||||||||||||
| 03/31/12 | 15.19 | (0.08 | ) | 0.41 | 0.33 | — | — | 15.52 | 2.17 | 80,961 | 1.16 | (0.55 | ) | 1.28 | 72 | |||||||||||||||||||||||||
| Institutional Plus Class | ||||||||||||||||||||||||||||||||||||||||
| 03/31/16 | 19.19 | (0.02 | ) | (1.86 | ) | (1.88 | ) | — | (2.31 | ) | 15.00 | (9.63 | ) | 103,537 | 0.94 | (0.10 | ) | 0.99 | 57 | |||||||||||||||||||||
| 03/31/15 | 19.27 | (0.05 | ) | 2.43 | 2.38 | — | (2.46 | ) | 19.19 | 13.18 | 119,004 | 0.92 | (0.25 | ) | 1.01 | 50 | ||||||||||||||||||||||||
| 03/31/14 | 16.68 | (0.02 | ) | 4.13 | 4.11 | — | (1.52 | ) | 19.27 | 24.65 | 117,219 | 0.89 | (0.08 | ) | 1.01 | 56 | ||||||||||||||||||||||||
| 03/31/13 | 15.53 | (0.01 | ) | 1.53 | 1.52 | — | (0.37 | ) | 16.68 | 10.05 | 47,119 | 0.90 | (0.07 | ) | 1.02 | 55 | ||||||||||||||||||||||||
03/31/12(e) | 13.31 | (0.01 | ) | 2.23 | 2.22 | — | — | 15.53 | 16.68 | 42,774 | 0.93 | (0.13 | ) | 1.05 | 72 | |||||||||||||||||||||||||
| SMALL COMPANY FUND | ||||||||||||||||||||||||||||||||||||||||
| Institutional Class | ||||||||||||||||||||||||||||||||||||||||
| 03/31/16 | $24.06 | $0.02 | $(0.20 | ) | $(0.18 | ) | $(0.04 | ) | $(0.67 | ) | $23.17 | (0.65 | )% | $51,527 | 1.18 | % | 0.10 | % | 1.34 | % | 32 | % | ||||||||||||||||||
| 03/31/15 | 24.39 | 0.02 | 1.65 | 1.67 | (0.01 | ) | (1.99 | ) | 24.06 | 6.97 | 51,296 | 1.20 | 0.09 | 1.31 | 29 | |||||||||||||||||||||||||
| 03/31/14 | 19.98 | 0.03 | 4.81 | 4.84 | (0.11 | ) | (0.32 | ) | 24.39 | 24.26 | 42,855 | 1.19 | 0.13 | 1.32 | 21 | |||||||||||||||||||||||||
| 03/31/13 | 19.11 | 0.18 | 1.63 | 1.81 | (0.09 | ) | (0.85 | ) | 19.98 | 10.11 | 78,688 | 1.22 | 0.97 | 1.35 | 19 | |||||||||||||||||||||||||
| 03/31/12 | 19.37 | 0.09 | 0.59 | 0.68 | (0.07 | ) | (0.87 | ) | 19.11 | 4.25 | 60,370 | 1.22 | 0.47 | 1.35 | 30 | |||||||||||||||||||||||||
| Institutional Plus Class | ||||||||||||||||||||||||||||||||||||||||
| 03/31/16 | 24.12 | 0.07 | (0.21 | ) | (0.14 | ) | (0.11 | ) | (0.67 | ) | 23.20 | (0.48 | ) | 220,980 | 0.99 | 0.30 | 1.07 | 32 | ||||||||||||||||||||||
| 03/31/15 | 24.43 | 0.08 | 1.64 | 1.72 | (0.04 | ) | (1.99 | ) | 24.12 | 7.17 | 217,291 | 0.98 | 0.34 | 1.09 | 29 | |||||||||||||||||||||||||
| 03/31/14 | 20.04 | 0.09 | 4.81 | 4.90 | (0.19 | ) | (0.32 | ) | 24.43 | 24.53 | 163,481 | 0.96 | 0.39 | 1.09 | 21 | |||||||||||||||||||||||||
| 03/31/13 | 19.16 | 0.23 | 1.64 | 1.87 | (0.14 | ) | (0.85 | ) | 20.04 | 10.43 | 90,628 | 0.97 | 1.23 | 1.10 | 19 | |||||||||||||||||||||||||
| 03/31/12 | 19.38 | 0.13 | 0.60 | 0.73 | (0.08 | ) | (0.87 | ) | 19.16 | 4.51 | 84,974 | 0.96 | 0.74 | 1.10 | 30 | |||||||||||||||||||||||||
| * | Ratios excluding contractual and voluntary waivers. | |||||||||||||||||||||||||||||||||||||||
| (a) | Per share data calculated using average share method. | |||||||||||||||||||||||||||||||||||||||
| (b) | Not annualized for periods less than one year. | |||||||||||||||||||||||||||||||||||||||
| (c) | Annualized for periods less than one year. | |||||||||||||||||||||||||||||||||||||||
| (d) | Amount represents less than $0.005. | |||||||||||||||||||||||||||||||||||||||
| (e) | Commencement of operations of Institutional Plus Class shares was as follows: Short-Intermediate Bond Fund, Balanced Fund and Growth Opportunities Fund – October 14, 2011; Income Fund – October 28, 2011; Nebraska Tax-Free Fund – January 1, 2016. | |||||||||||||||||||||||||||||||||||||||
NOTES TO FINANCIAL STATEMENTS
March 31, 2016
1. Organization
Tributary Funds, Inc. (the "Company") was organized in October 1994 as a Nebraska corporation and is registered under the Investment Company Act of 1940, as amended (the "1940 Act"), as an open-end management investment company issuing its shares in series. The Company consists of six series, the Short-Intermediate Bond Fund, the Income Fund, the Nebraska Tax-Free Fund, the Balanced Fund, the Growth Opportunities Fund and the Small Company Fund (collectively, the "Funds" and individually, a "Fund"). The Short-Intermediate Bond Fund, the Income Fund, the Balanced Fund, the Growth Opportunities Fund and the Small Company Fund are all diversified series. The Nebraska Tax-Free Fund is a non-diversified series. Each series represents a distinct portfolio with its own investment objectives and policies. Refer to the Management Discussion and Analysis beginning on page 3 for each Fund's investment objective.
All Funds offer Institutional Plus Class shares without a sales charge and Short-Intermediate Bond Fund, Income Fund, Balanced Fund, Growth Opportunities Fund and Small Company Fund also offer Institutional Class shares. The two classes differ principally in applicable minimum investment and shareholder servicing fees. Shareholders bear the common expenses of each Fund and earn income and realized gains/losses from each Fund pro rata based on the average daily net assets of each class, without discrimination between share classes. Each share class also has different voting rights on matters affecting a single class. No class has preferential dividend rights.
On January 1, 2016, the Nebraska Tax-Free Fund commenced operations through a reorganization of the Nebraska Tax-Free Common Trust Fund ("CTF"). The CTF was previously managed by First National Bank of Omaha. It was determined to be beneficial to both the shareholders of the CTF and the Company to reorganize the CTF into a newly created series of the Company. This CTF was organized and commenced operations on December 31, 2007. The CTF had an investment objective and strategies that were, in all material respects, identical to those of the Nebraska Tax-Free Fund. The net assets and unrealized gain received by the Nebraska Tax-Free Fund from this tax-free reorganization were as follows:
| Date of Contribution | Net Assets Institutional Plus Class | Shares Issued Institutional Plus Class | Original Cost of Investments | Unrealized Gain on Investments | Exchange Ratio | |||||
| January 1, 2016 | $51,935,874 | 5,193,587 | $50,327,997 | $982,451 | 1.0014019 |
In addition to the securities transferred in, as noted above, $625,426 of cash and other receivables were also transferred in as part of the reorganization.
2. Significant Accounting Policies
The Funds are investment companies and follow accounting and reporting guidance under Financial Accounting Standards Board ("FASB") Accounting Standards Codification ("ASC") Topic 946, "Financial Services-Investment Companies". The following is a summary of significant accounting policies consistently followed by the Company in the preparation of its financial statements. The policies are in conformity with accounting principles generally accepted in the United States of America ("GAAP"). The preparation of financial statements requires management to make estimates and assumptions that affect the reported amounts of assets and liabilities, the disclosure of contingent assets and liabilities at the date of financial statements and the reported amounts of income and expenses for the period. Actual results could differ from those estimates.
Security Valuation
The net asset value ("NAV") per share of each Fund is determined each business day as of the close of the New York Stock Exchange ("NYSE"), which is normally 4 p.m. Eastern Time. In valuing a Fund's assets for calculating the NAV, securities listed on a securities exchange, market or automated quotation system for which quotations are readily available, including traded over the counter securities, are valued at the official closing price on the primary exchange or market on which they traded or, if there is no such reported price on the valuation date, at the most recent quoted sale price or bid price. Investments in mutual funds are valued at the NAV per share determined as of the close of the NYSE. Short-term debt investments (maturing within 60 days) may be valued on an amortized cost basis, unless such value does not approximate fair value. Debt securities (other than short-term investments) are valued at prices furnished by pricing services and generally reflect last reported sales price if the security is actively traded or an evaluated bid price obtained by employing methodologies that utilize actual market transactions; broker supplied valuations; or factors such as yield, maturity, call features, credit
NOTES TO FINANCIAL STATEMENTS
March 31, 2016
ratings, or developments relating to specific securities in arriving at the valuation. Prices provided by pricing services are subject to review and determination of the appropriate price whenever a furnished price is significantly different from the previous day's furnished price.
Securities for which quotations are not readily available are valued at fair value as determined in good faith by the Company's Fair Value Committee ("Fair Value Committee") pursuant to procedures established by the Company's Board of Directors ("Board"). Situations that may require an investment to be fair valued include instances where a security is thinly traded, halted, or restricted as to resale. In addition, investments may be fair valued based on the occurrence of a significant event. Significant events may be specific to a particular issuer, such as mergers, restructurings, or defaults. Alternatively, significant events may affect an entire market, such as natural disasters, government actions, and significant changes in the value of U.S. securities markets. Securities are fair valued based on observable and unobservable inputs, including the Fair Value Committee's own assumptions in determining fair value. Factors used in determining fair value include, but are not limited to: type of security or asset, trading activity of similar markets or securities, fundamental analytical data relating to the investment, evaluation of the forces that influence the market in which the security is purchased and sold, and information as to any transactions or offers with respect to the security.
Under the Company's pricing and valuation procedures, the Board has delegated the daily operational oversight of the securities valuation function to the Fair Value Committee, which consists of representatives from the Funds' Adviser, Sub-Adviser and Treasurer, who serve on the committee as non-voting members. The Fair Value Committee is responsible for determining fair valuations for any security for which market quotations are not readily available. For those securities fair valued under procedures considering all relevant information that is reasonably available. The Fair Valuation Committee's determinations are subject to review by the Funds' Board at its next regularly scheduled meeting covering the calendar quarter in which the fair valuation was determined.
The Funds use a framework for measuring fair value. Fair value is defined as the price that would be received to sell an asset or paid to transfer a liability in an orderly transaction between market participants (exit price). One component of fair value is a three-tier fair value hierarchy. The basis of the tiers is dependent upon various "inputs" used to determine the value of the Funds' investments. These inputs are summarized in the three broad levels listed below:
Level 1 – includes valuations based on quoted prices of identical securities in active markets including valuations for
securities listed on a securities exchange or investments in mutual funds.
Level 2 – includes valuations for which all significant inputs are observable, either directly or indirectly. Direct observable inputs include broker quotes in active markets, closing prices of similar securities in active markets, closing prices for identical or similar securities in non-active markets, or corporate action or reorganization entitlement values. Indirect significant observable inputs include factors such as interest rates, yield curves, prepayment speeds or credit ratings. Level 2 includes valuations for fixed income securities priced by pricing services, broker quotes in active markets, securities subject to corporate actions, or ADRs and GDRs for which quoted prices in active markets are not available.
Level 3 – includes valuations based on inputs that are unobservable and significant to the fair value measurement, including the Fair Value Committee's own assumptions in determining the fair value of the investment. Inputs used to determine the fair value of Level 3 securities include security specific inputs such as: credit quality, issuer news, trading characteristics, or industry specific inputs such as: trading activity of similar markets or securities, changes in the security's underlying index, or comparable securities' models. Level 3 valuations include securities that are priced based on single source broker quotes, where prices may be unavailable due to halted trading, restricted to resale due to market events, newly issued or investments for which reliable quotes are not available.
To assess the continuing appropriateness of security valuations, the co-administrator regularly compares current day prices with prior day prices, transaction prices, and alternative vendor prices. When the comparison results exceed pre-defined thresholds, the co-administrator challenges the prices exceeding tolerance levels with the pricing service or broker. To substantiate Level 3 unobservable inputs, the adviser and co-administrator use a variety of techniques as appropriate, including, transaction backtesting or disposition analysis and review of related market activity.
The inputs or methodology used for valuing investments are not necessarily an indication of the risk associated with investing in those investments.
NOTES TO FINANCIAL STATEMENTS
March 31, 2016
The following is a summary of the inputs used to value each Fund's investments as of March 31, 2016, by category:
LEVEL 1 – Quoted Prices | LEVEL 2 – Significant Observable Inputs | LEVEL 3 – Significant Unobservable Inputs | Total | |||||
| Short-Intermediate Bond Fund | ||||||||
| Non-U.S. Government Agency Asset-Backed Securities | $ | - | $ | 49,834,771 | $ | - | $ | 49,834,771 |
| Corporate Bonds | - | 34,362,806 | - | 34,362,806 | ||||
| Government & Agency Obligations | - | 33,785,315 | - | 33,785,315 | ||||
| Preferred Stocks | 438,075 | - | - | 438,075 | ||||
| Short-Term Investments | 5,123,220 | - | - | 5,123,220 | ||||
| Total | $ | 5,561,295 | $ | 117,982,892 | $ | - | $ | 123,544,187 |
| Income Fund | ||||||||
| Non-U.S. Government Agency Asset-Backed Securities | $ | - | $ | 62,055,680 | $ | - | $ | 62,055,680 |
| Corporate Bonds | - | 46,394,585 | - | 46,394,585 | ||||
| Government & Agency Obligations | - | 74,012,785 | - | 74,012,785 | ||||
| Preferred Stocks | 461,970 | - | - | 461,970 | ||||
| Exchange Traded Fund | 608,345 | - | - | 608,345 | ||||
| Investment Company | 1,233,179 | - | - | 1,233,179 | ||||
| Short-Term Investments | 7,477,089 | - | - | 7,477,089 | ||||
| Total | $ | 9,780,583 | $ | 182,463,050 | $ | - | $ | 192,243,633 |
| Nebraska Tax-Free Fund | ||||||||
| Government & Agency Obligations | $ | - | $ | 54,411,980 | $ | - | $ | 54,411,980 |
| Short-Term Investments | 2,190,995 | - | - | 2,190,995 | ||||
| Total | $ | 2,190,995 | $ | 54,411,980 | $ | - | $ | 56,602,975 |
| Balanced Fund | ||||||||
| Common Stocks | $ | 62,817,322 | $ | - | $ | - | $ | 62,817,322 |
| Non-U.S. Government Agency Asset-Backed Securities | - | 6,398,385 | - | 6,398,385 | ||||
| Corporate Bonds | - | 13,812,557 | - | 13,812,557 | ||||
| Government & Agency Obligations | - | 20,432,016 | - | 20,432,016 | ||||
| Short-Term Investments | 2,874,385 | - | - | 2,874,385 | ||||
| Total | $ | 65,691,707 | $ | 40,642,958 | $ | - | $ | 106,334,665 |
| Growth Opportunities Fund | ||||||||
| Common Stocks | $ | 143,498,454 | $ | - | $ | 143,498,454 | ||
| Short-Term Investments | 3,151,459 | - | - | 3,151,459 | ||||
| Total | $ | 146,649,913 | $ | - | $ | - | $ | 146,649,913 |
| Small Company Fund | ||||||||
| Common Stocks | $ | 266,252,389 | $ | - | $ | - | $ | 266,252,389 |
| Short-Term Investments | 8,388,415 | - | - | 8,388,415 | ||||
| Total | $ | 274,640,804 | $ | - | $ | - | $ | 274,640,804 |
The Funds recognize transfers between levels as of the beginning of the year. There were no transfers into or out of Level 1, 2 or 3 during the year or period ended March 31, 2016.
Guarantees and Indemnifications
In the normal course of business, the Company may enter into contracts that contain a variety of representations which provide general indemnifications for certain liabilities. Each Fund's maximum exposure under these arrangements is unknown. However, since their commencement of operations, the Funds have not had claims or losses pursuant to these contracts and expect the risk of loss to be remote.
Under the Company's organizational documents, its Officers and Directors are indemnified against certain liabilities arising out of the performance of their duties to the Funds. In addition, certain of the Company's contracts with service providers contain general
NOTES TO FINANCIAL STATEMENTS
March 31, 2016
indemnification clauses. The Funds' maximum exposure under these arrangements is unknown since the amount of any future claims that may be made against the Funds cannot be determined and the Funds have no historical basis for predicting the likelihood of any such claims.
Security Transactions, Investment Income and Foreign Taxes
Securities transactions are accounted for no later than one business day following trade date. For financial reporting purposes, however, on the last business day of the reporting period, security transactions are accounted for on trade date. Interest income is recognized on the accrual basis and includes, where applicable, the amortization of premium or accretion of discount. Dividend income is recorded on the ex-dividend date. Dividends and interest from non-U.S. sources received by a Fund are generally subject to non-U.S. net withholding taxes. Such withholding taxes may be reduced or eliminated under the terms of applicable U.S. income tax treaties, and each Fund intends to undertake any procedural steps required to claim the benefits of such treaties. Gains or losses realized on the sales of securities are determined by comparing the identified cost of the security lot sold with the net sales proceeds.
Allocation of Expenses
Expenses directly attributable to a Fund are charged directly to that Fund, while expenses which are attributable to more than one Fund are allocated among the respective Funds based upon relative net assets or another appropriate basis. Expenses directly attributable to a class are charged directly to that class, while expenses attributable to both classes are allocated to each class based upon the ratio of net assets for each class as a percentage of total net assets.
Distributions to Shareholders
Dividends from net investment income are declared daily and paid monthly for the Short-Intermediate Bond, Income, and Nebraska Tax-Free Funds. The Balanced Fund declares and pays dividends from net investment income, if any, quarterly. The Growth Opportunities Fund and Small Company Fund declare and pay dividends from net investment income, if any, annually. Distributions of net realized capital gains, if any, are declared and distributed at least annually for all the Funds only to the extent they exceed available capital loss carryovers. The amount and timing of distributions are determined in accordance with federal income tax regulations which may differ from GAAP.
3. Related Party Transactions and Fees and Agreements
Tributary Capital Management, LLC ("Tributary" or "Adviser"), a subsidiary of First National Bank of Omaha ("FNBO"), which is a subsidiary of First National Bank of Nebraska, Inc., serves as the investment adviser to the Funds. Each Fund pays a monthly fee at an annual rate of the following percentages of each Fund's average daily net assets: 0.50% for the Short-Intermediate Bond Fund, 0.60% for the Income Fund, 0.40% for the Nebraska Tax-Free Fund, 0.75% for each of the Balanced Fund and Growth Opportunities Fund, and 0.85% for the Small Company Fund. First National Fund Advisers ("FNFA" or "Sub-Adviser"), a division of FNBO, serves as the investment sub-adviser for the Short-Intermediate Bond Fund, Income Fund, Nebraska Tax-Free Fund, Balanced Fund and Growth Opportunities Fund. Sub-advisory fees paid to FNFA are paid by Tributary.
Tributary has contractually agreed to waive advisory fees and reduce the administration fee payable to the Adviser and/or reimburse other expenses of each Fund to the extent necessary to limit the total operating expenses of each Fund, exclusive of shareholder servicing fees (Institutional Class only), brokerage costs, interest, taxes and dividend and extraordinary expenses, to an annual rate of the percentage of each Fund's average daily net assets as follows.
| Expense Caps | |||
| Short-Intermediate Bond Fund | 0.54% | ||
| Income Fund | 0.64 | ||
| Nebraska Tax-Free Fund | 0.45 | ||
| Balanced Fund | 0.99 | ||
| Growth Opportunities Fund | 0.94 | ||
| Small Company Fund | 0.99 |
NOTES TO FINANCIAL STATEMENTS
March 31, 2016
The amounts waived for each Fund are recorded as expenses waived in each Fund's Statement of Operations. Other Fund service providers have also contractually agreed to waive a portion of their fees. For the fiscal year or period ended March 31, 2016, fees waived were as follows:
| Investment Adviser Fees Waived | Other Waivers | Total Fees Waived | |||
| Short-Intermediate Bond Fund | $ 272,725 | $ 9,460 | $ 282,185 | ||
| Income Fund | 350,610 | 14,430 | 365,040 | ||
| Nebraska Tax-Free Fund | 51,958 | 1,708 | 53,666 | ||
| Balanced Fund | 51,492 | 9,066 | 60,558 | ||
| Growth Opportunities Fund | 90,141 | 12,927 | 103,068 | ||
| Small Company Fund | 211,065 | 21,588 | 232,653 |
Tributary may recover fees waived or expenses reimbursed after August 1, 2014, for a period up to three years from the end of the fiscal year in which fees were waived or a reimbursement took place. At March 31, 2016, the amount of potentially recoverable expenses are as follows:
Period Ended | Recoverable Amount | Expiration date to Recover Fees Waived and/or Expenses Reimbursed | |||
| Short-Intermediate Bond Fund | March 31, 2015 | $ | 196,209 | March 31, 2018 | |
| March 31, 2016 | 272,725 | March 31, 2019 | |||
| Income Fund | March 31, 2015 | $ | 208,811 | March 31, 2018 | |
| March 31, 2016 | 350,610 | March 31, 2019 | |||
| Nebraska Tax-Free Fund | March 31, 2016 | $ | 51,958 | March 31, 2019 | |
| Balanced Fund | March 31, 2015 | $ | 49,264 | March 31, 2018 | |
| March 31, 2016 | 51,492 | March 31, 2019 | |||
| Growth Opportunities Fund | March 31, 2015 | $ | 77,261 | March 31, 2018 | |
| March 31, 2016 | 90,141 | March 31, 2019 | |||
| Small Company Fund | March 31, 2015 | $ | 156,283 | March 31, 2018 | |
| March 31, 2016 | 211,065 | March 31, 2019 |
MUFG Union Bank, N.A. serves as the custodian for each of the Funds. Prior to October 21, 2015, JPMorgan Chase Bank, N.A. served as custodian of the Funds. DST Systems, Inc. serves as transfer agent for the Funds, whose functions include disbursing dividends and other distributions. Tributary and Atlantic Fund Services, LLC ("Co- Administrators") serve as co-administrators of the Funds. Prior to August 3, 2015, Jackson Fund Services served as co-administrator of the Funds. Certain officers of the Funds are also officers or employees of the above named service providers, and during their terms of office received no compensation from the Funds. As compensation for its administrative services, each co-administrator is entitled to a fee, calculated daily and paid monthly based on each Fund's average daily net assets. Tributary receives 0.07% of each Fund's average daily net assets. For the period April 1, 2015 through August 2, 2015, the co-administration fee paid to Jackson Fund Services was $199,172 for the Funds. The co-administration fee paid to Atlantic Fund Services, LLC for the period August 3, 2015 through March 31, 2016 is also included in the Administration Fees on the Statements of Operations. Beacon Hill Fund Services, Inc. provides the Funds' Anti-Money Laundering Compliance Officer and Chief Compliance Officer services.
The Company has adopted an Administrative Services Plan, which allows the Funds' Institutional Class shares to charge a shareholder services fee, pursuant to which each Fund is authorized to pay compensation at an annual rate of up to 0.25% of the average daily net assets to banks and other financial institutions, that may include the advisers, their correspondent and affiliated banks, including FNBO (each a "Service Organization"). Under the Administrative Services Plan, the Funds may enter into a Servicing Agreement with a Service Organization whereby such Service Organization agrees to provide certain record keeping and/or administrative support services for their customers or account holders who are the beneficial or record owner of the shares of a Fund. One of the Servicing Agreements the Funds maintain is with FNBO. For the year ended March 31, 2016, the Funds paid FNBO as follows: Short-Intermediate Bond Fund – $2,523; Income Fund – $3,939; Balanced Fund – $1,178; Growth Opportunities Fund – $211; Small Company Fund – $2,041. The amounts accrued for shareholder service fees are included under Shareholder service fees – Institutional Class within the Statements of Operations.
NOTES TO FINANCIAL STATEMENTS
March 31, 2016
4. Investment Transactions
The aggregate cost of purchases and proceeds from sales of securities, excluding U.S. Government securities and short-term investments (maturing less than one year from acquisition), for the year or period ended March 31, 2016, were as follows:
| Purchases | Sales | ||||
| Short-Intermediate Bond Fund | $ | 27,721,440 | $ | 20,555,717 | |
| Income Fund | 49,676,669 | 23,970,930 | |||
| Nebraska Tax-Free Fund | 5,302,289 | 2,440,000 | |||
| Balanced Fund | 39,173,082 | 32,886,503 | |||
| Growth Opportunities Fund | 89,642,296 | 99,253,623 | |||
| Small Company Fund | 89,205,225 | 79,760,136 |
The aggregate cost of purchases and proceeds from sales of long-term U.S. Government securities for the year or period ended March 31, 2016, were as follows:
| Purchases | Sales | ||||
| Short-Intermediate Bond Fund | $ | 23,625,137 | $ | 23,710,679 | |
| Income Fund | 38,503,653 | 15,445,184 | |||
| Balanced Fund | 11,252,108 | 10,738,434 |
5. Capital Share Transactions
The Company is authorized to issue a total of 1,000,000,000 shares of common stock, 999,999,990 of which may be issued in series with a par value of $0.00001 per share. The Board is empowered to allocate such shares among different series of the Company's shares without shareholder approval.
6. Federal Income Taxes
The following information is presented on an income tax basis. It is each Fund's policy to continue to comply with the requirements of Subchapter M of the Internal Revenue Code of 1986, as amended, applicable to regulated investment companies, and to distribute all of its net taxable income, including any net realized gains on investments, to its shareholders sufficient to relieve it from all, or substantially all, federal income and excise taxes. Therefore, no provision is made for federal income or excise taxes. Withholding taxes on foreign dividends have been paid or provided for in accordance with each applicable country's tax rules and rates.
Differences between amounts reported for financial statements and federal income tax purposes are primarily due to timing and character difference in recognizing gains and losses on investment transactions.
To the extent the differences between the amounts recognized for financial statements and federal income tax purposes are permanent in nature, such amounts are reclassified within the capital accounts based on their federal income tax treatment; temporary differences do not require reclassification. Permanent differences may include but are not limited to the following: reclassifications related to Treasury Inflation-Protected Securities, market discount, premium and/or paydown securities, REIT securities, net operating losses, expired capital loss carryforwards and distribution adjustments. These reclassifications have no impact on net assets.
| Net Increase (Decrease) | ||||||
| Accumulated Net Investment Income | Accumulated Net Realized Gain (Loss) | Paid-in Capital | ||||
| Short-Intermediate Bond Fund | $ | 332,162 | $ | 520,661 | $ | (852,823) |
| Income Fund | 329,407 | (329,407) | - | |||
| Nebraska Tax-Free Fund | 572 | (572) | - | |||
| Balanced Fund | 12,184 | (12,184) | - | |||
| Growth Opportunities Fund | 407,073 | 8,735 | (415,808) | |||
| Small Company Fund | (126,942) | 126,946 | (4) | |||
NOTES TO FINANCIAL STATEMENTS
March 31, 2016
As of March 31, 2016, the cost of investments and the components of net unrealized appreciation/(depreciation) were as follows:
Tax Cost of Investments | Gross Unrealized Appreciation | Gross Unrealized Depreciation | Net Unrealized Appreciation/ (Depreciation) | |||||
| Short-Intermediate Bond Fund | $ | 123,702,792 | $ | 871,256 | $ | (1,029,861) | $ | (158,605) |
| Income Fund | 189,482,786 | 4,787,103 | (2,026,256) | 2,760,847 | ||||
| Nebraska Tax-Free Fund | 55,228,251 | 1,543,455 | (168,731) | 1,374,724 | ||||
| Balanced Fund | 93,139,385 | 14,671,750 | (1,476,470) | 13,195,280 | ||||
| Growth Opportunities Fund | 118,145,255 | 31,594,695 | (3,090,037) | 28,504,658 | ||||
| Small Company Fund | 222,627,854 | 62,405,680 | (10,392,730) | 52,012,950 | ||||
At March 31, 2016, the components of distributable taxable earnings for U.S. federal income tax purposes were as follows:
Undistributed Net Investment Income* | Undistributed Tax Exempt Income | Undistributed Net Long Term Capital Gains | Other Temporary Differences | Unrealized Gain (Loss)** | Capital Loss Carry Forward*** | |||||||
| Short-Intermediate Bond Fund | $ | 262,960 | $ | - | $ | - | $ | (167,298) | $ | (158,605) | $ | (1,344,486) |
| Income Fund | 781,051 | - | - | (319,802) | 2,760,847 | (361,403) | ||||||
| Nebraska Tax-Free Fund | 275 | 159,880 | - | (160,458) | 1,374,724 | (153,063) | ||||||
| Balanced Fund | 7,779 | - | 1,629,849 | - | 13,195,280 | - | ||||||
| Growth Opportunities Fund | - | - | 2,373,928 | - | 28,504,658 | (29,120) | ||||||
| Small Company Fund | 149,242 | - | 1,163,397 | - | 52,012,950 | - | ||||||
*Undistributed net investment income includes any undistributed net short-term capital gains, if any.
**Unrealized gains (loss) are adjusted for open wash sale loss deferrals, market discount/premium amortization and return of capital paid by REIT securities.
***Capital loss carry forward includes deferred post October loss and late year losses.
The tax character of dividends and distributions paid during the Funds' fiscal year or period ended March 31, 2016, were as follows:
Net Ordinary Income* | Tax Exempt Income | Net Long Term Capital Gains** | Total Distributions Paid *** | |||||
| 2016 | 2015 | 2016 | 2015 | 2016 | 2015 | 2016 | 2015 | |
| Short-Intermediate Bond Fund | $ | 2,260,844 | $ | 2,014,344 | $ | - | $ | - | $ | - | $ | - | $ | 2,260,844 | $ | 2,014,344 |
| Income Fund | 4,660,519 | 3,303,111 | - | - | - | - | 4,660,519 | 3,303,111 | ||||||||
| Nebraska Tax-Free Fund | 528 | - | 305,497 | - | - | - | 306,025 | - | ||||||||
| Balanced Fund | 436,396 | 103,863 | - | - | 2,413,933 | 8,631,905 | 2,850,329 | 8,735,768 | ||||||||
| Growth Opportunities Fund | - | 1,913,084 | - | - | 21,388,311 | 18,237,016 | 21,388,311 | 20,150,100 | ||||||||
| Small Company Fund | 2,031,949 | 2,657,990 | - | - | 6,685,473 | 20,113,762 | 8,717,422 | 22,771,752 |
*Net ordinary income consists of net taxable income derived from dividends, interest, and net short-term capital gains, if any.
**The Funds designated as long-term dividend, pursuant to the Internal Revenue code section 852(b)(3), the amount necessary to reduce earnings and profits of the Funds related to net capital gains to zero for the fiscal year or period ended March 31, 2016.
***Total distributions paid may differ from the Statements of Changes in Net Assets because distributions are recognized when actually paid for tax purposes.
At March 31, 2016, the following Funds had net capital loss carryforwards available for U.S. federal income tax purposes to offset future net realized capital gains. Details of the capital loss carryforwards are listed in the table below. Capital loss carryforwards with no expiration, if any, must be utilized prior to those with expiration date:
Expiring Capital Loss Carryforwards | No Expiration | |||||||||
| Year(s) of Expiration | Amount | Short Term | Long Term | Total | ||||||
| Short-Intermediate Bond Fund | 2017 | $ | 577,072 | $ | 183,979 | $ | 583,435 | $ | 1,344,486 | |
| Income Fund | - | - | 163,149 | 198,254 | 361,403 | |||||
| Nebraska Tax-Free Fund | - | - | - | 153,063 | 153,063 | |||||
Under current tax law, certain capital losses realized after October 31, and certain ordinary losses realized after December 31 but before the end of the fiscal year ("Post-October losses" and "Late Year Losses", respectively) may be deferred and treated as occurring
NOTES TO FINANCIAL STATEMENTS
March 31, 2016
on the first business day of the following fiscal year. For the year ended March 31, 2016, the Funds deferred losses to April 1, 2016 as follows:
| Late Year Ordinary Losses | ||
| Growth Opportunities Fund | $ | 29,120 |
The Funds comply with FASB ASC Topic 740, "Income Taxes." FASB ASC Topic 740 provides guidance for how uncertain tax positions should be recognized, measured, presented and disclosed in the financial statements. FASB ASC Topic 740 requires the affirmative evaluation of tax positions taken or expected to be taken in the course of preparing each Fund's tax return to determine whether it is more-likely-than-not (i.e., greater than 50 percent) that each tax position will be sustained upon examination by a taxing authority based on the technical merits of the position. Funds with tax positions not deemed to meet the "more-likely-than-not" threshold would be required to record a tax expense in the current year. FASB ASC Topic 740 requires that management evaluate the tax position taken in returns for the tax years ended March 31, 2013 through March 31, 2016, which remain subject to examination by all major tax jurisdictions, including federal and the State of Nebraska. Management completed an evaluation of the Funds' tax positions and based on that evaluation, determined that no tax liability resulted from unrecognized tax benefits related to uncertain tax positions and therefore no provision for federal income tax was required in the Funds' financial statements for the year or period ended March 31, 2016.
7. Subsequent Events
Management has evaluated subsequent events for the Funds through the date the financial statements are issued, and has concluded there were no events that require adjustments to the financial statements or disclosure in the notes.
REPORT OF INDEPENDENT REGISTERED PUBLIC ACCOUNTING FIRM
To the Shareholders and Board of Directors of
Tributary Funds, Inc.
We have audited the accompanying statements of assets and liabilities, including the schedules of portfolio investments, of Tributary Funds, Inc., comprising Tributary Short-Intermediate Bond Fund, Tributary Income Fund, Tributary Nebraska Tax-Free Fund, Tributary Balanced Fund, Tributary Growth Opportunities Fund and Tributary Small Company Fund (the "Funds") as of March 31, 2016, and the related statements of operations and changes in net assets and the financial highlights for the period January 1, 2016 (commencement of operations) to March 31, 2016 for Tributary Nebraska Tax-Free Fund, and the related statements of operations and changes in net assets and financial highlights for the year then ended for the remainder of the Funds. These financial statements and financial highlights are the responsibility of the Funds' management. Our responsibility is to express an opinion on these financial statements and financial highlights based on our audits. The Funds' financial statements and financial highlights for the periods ended on or prior to March 31, 2015 were audited by other auditors whose report dated May 27, 2015, expressed an unqualified opinion on those financial statements and financial highlights.
We conducted our audit in accordance with the standards of the Public Company Accounting Oversight Board (United States). Those standards require that we plan and perform the audit to obtain reasonable assurance about whether the financial statements and financial highlights are free of material misstatement. An audit includes examining, on a test basis, evidence supporting the amounts and disclosures in the financial statements. Our procedures included confirmation of securities owned as of March 31, 2016, by correspondence with the custodian and brokers or by other appropriate auditing procedures where replies from brokers were not received. An audit also includes assessing the accounting principles used and significant estimates made by management, as well as evaluating the overall financial statement presentation. We believe that our audit provides a reasonable basis for our opinion.
In our opinion, the financial statements and financial highlights referred to above present fairly, in all material respects, the financial position of Tributary Short-Intermediate Bond Fund, Tributary Income Fund, Tributary Nebraska Tax-Free Fund, Tributary Balanced Fund, Tributary Growth Opportunities Fund and Tributary Small Company Fund as of March 31, 2016, and the results of their operations, the changes in their net assets, and the financial highlights for the periods indicated above, in conformity with accounting principles generally accepted in the United States of America.

COHEN FUND AUDIT SERVICES, LTD.
Cleveland, Ohio
May 27, 2016
ADDITIONAL FUND INFORMATION
March 31, 2016 (Unaudited)
Proxy Voting Policy
Information regarding the policies and procedures that the Funds use to determine how to vote proxies relating to portfolio securities is available without charge, upon request, by calling 1-800-662-4203. The information also is included in the Company's Statement of Additional Information, which is available on the Funds' website at www.tributaryfunds.com and on the Securities and Exchange Commission's (the "SEC") website at www.sec.gov.
Information relating to how each Fund voted proxies relating to portfolio securities held during the most recent twelve months ended June 30 is available without charge, upon request, by writing to the Company at P.O. Box 219022, Kansas City, Missouri, 64141-6002, by calling 1-800-662-4203 and on the SEC's website at www.sec.gov.
Quarterly Holdings
The Company files a complete list of its portfolio holdings with the SEC for the first and third quarters of each fiscal year on Form N-Q. Forms N-Q are available free of charge on the SEC's website at www.sec.gov or may be reviewed and copied at the SEC's Public Reference Room in Washington, D.C. Information on the operation of the Public Reference Room may be obtained by calling 1-800-SEC-0330.
Other Federal Income Tax Information
The information reported below is for the year or period ended March 31, 2016. Foreign tax and qualified dividend information for the calendar year 2016 will be provided on your 2016 Form 1099-DIV.
For the year or period ended March 31, 2016, certain dividends paid by the Funds may be subject to a maximum tax rate of 20% as provided for by the American Taxpayer Relief Act of 2012. Complete information for calendar year 2016 will be reported in conjunction with your 2016 Form 1099-DIV.
For the year ended March 31, 2016, the following Funds hereby designate the following percentages, or the maximum amount allowable under the Internal Revenue Code ("Code"), as qualified dividends:
| Qualified Dividend Income | |
| Short-Intermediate Bond Fund | 0.92% |
| Income Fund | 0.69% |
| Balanced Fund | 100.00% |
| Small Company Fund | 100.00% |
For the year ended March 31, 2016, the following Funds hereby designate the following percentages, or the maximum amount allowable under the Code, as distributions eligible for the dividends received deduction for corporations:
| Dividends Received Deduction | |
| Short-Intermediate Bond Fund | 0.92% |
| Income Fund | 0.69% |
| Balanced Fund | 100.00% |
| Small Company Fund | 100.00% |
For the year ended March 31, 2016, the following Funds hereby designate the following percentages, or the maximum amount allowable under the Code, as qualified interest income exempt from U.S. tax for foreign shareholders:
| Qualified Interest Income | |
| Short-Intermediate Bond Fund | 81.05% |
| Income Fund | 82.02% |
| Balanced Fund | 47.69% |
For the year or period ended March 31, 2016, Small Company Fund designates 45.91% of its income distributions as short-term capital gain dividends exempt from U.S. tax for foreign shareholders and Nebraska Tax-Free Fund designates 99.83% of its income dividend distributed as tax-exempt dividends.
ADDITIONAL FUND INFORMATION
March 31, 2016 (Unaudited)
Table of Shareholder Expenses
As a shareholder of the Funds, you incur ongoing costs, including management fees, shareholder servicing fees and other Fund expenses. This example is intended to help you understand your ongoing costs (in dollars) of investing in the Funds and to compare these costs with the ongoing costs of investing in other mutual funds.
The example is based on an investment of $1,000 invested at the beginning of the period and held for the entire period from October 1, 2015, through March 31, 2016.
Actual Expenses – The first line under each Fund of the table below provides information about actual account values and actual expenses. You may use the information in this line, together with the amount you invested, to estimate the expenses that you paid over the period. Simply divide your account value by $1,000 (for example, an $8,600 account value divided by $1,000 = 8.6), then multiply the result by the number in the first line under the heading entitled "Expenses Paid During Period" to estimate the expenses you paid on your account during the period.
Hypothetical Example for Comparison Purposes – The second line under each Fund of the table below provides information about hypothetical account values and hypothetical expenses based on each Fund's actual expense ratio and an assumed rate of return of 5% per year before expenses, which is not each Fund's actual return. The hypothetical account values and expenses may not be used to estimate the actual ending account balance or expenses you paid for the period. You may use this information to compare the ongoing costs of investing in each Fund and other funds. To do so, compare this 5% hypothetical example with the 5% hypothetical examples that appear in the shareholder reports of other funds.
Please note that the expenses shown in the table are meant to highlight your ongoing costs only. Therefore, the second line of the table is useful in comparing ongoing costs only, and will not help you determine the relative total costs of owning different funds.
| Expenses Using Actual Fund Return | Expenses Using Hypothetical 5% Return | ||||||||||||||||||||||
| Beginning | Ending | Expenses | Expense | Beginning | Ending | Expenses | Expense | ||||||||||||||||
| Account | Account | Paid | Ratio | Account | Account | Paid | Ratio | ||||||||||||||||
| Value | Value | During | During | Value | Value | During | During | ||||||||||||||||
| 10/1/15 | 3/31/16 | Period* | Period* | 10/1/15 | 3/31/16 | Period* | Period* | ||||||||||||||||
| Short-Intermediate Bond Fund | |||||||||||||||||||||||
| Institutional Class | $ | 1,000.00 | $ | 1,006.90 | $ | 3.61 | 0.72 | % | $ | 1,000.00 | $ | 1,021.40 | $ | 3.64 | 0.72 | % | |||||||
| Institutional Plus Class | 1,000.00 | 1,008.90 | 2.71 | 0.54 | 1,000.00 | 1,022.30 | 2.73 | 0.54 | |||||||||||||||
| Income Fund | |||||||||||||||||||||||
| Institutional Class | $ | 1,000.00 | $ | 1,020.29 | $ | 3.64 | 0.72 | % | $ | 1,000.00 | $ | 1,021.40 | $ | 3.64 | 0.72 | % | |||||||
| Institutional Plus Class | 1,000.00 | 1,020.69 | 3.23 | 0.64 | 1,000.00 | 1,021.80 | 3.23 | 0.64 | |||||||||||||||
| Nebraska Tax-Free Fund | |||||||||||||||||||||||
| Institutional Plus Class | $ | 1,000.00 | $ | 1,013.50 | $ | 1.11 | 0.45 | % | $ | 1,000.00 | $ | 1,011.20 | $ | 1.11 | 0.45 | % | |||||||
| Balanced Fund | |||||||||||||||||||||||
| Institutional Class | $ | 1,000.00 | $ | 1,036.49 | $ | 6.06 | 1.19 | % | $ | 1,000.00 | $ | 1,019.05 | $ | 6.01 | 1.19 | % | |||||||
| Institutional Plus Class | 1,000.00 | 1,037.48 | 5.04 | 0.99 | 1,000.00 | 1,020.05 | 5.00 | 0.99 | |||||||||||||||
| Growth Opportunities Fund | |||||||||||||||||||||||
| Institutional Class | $ | 1,000.00 | $ | 1,034.38 | $ | 5.95 | 1.17 | % | $ | 1,000.00 | $ | 1,019.15 | $ | 5.91 | 1.17 | % | |||||||
| Institutional Plus Class | 1,000.00 | 1,034.72 | 4.78 | 0.94 | 1,000.00 | 1,020.30 | 4.75 | 0.94 | |||||||||||||||
| Small Company Fund | |||||||||||||||||||||||
| Institutional Class | $ | 1,000.00 | $ | 1,075.81 | $ | 6.02 | 1.16 | % | $ | 1,000.00 | $ | 1,019.20 | $ | 5.86 | 1.16 | % | |||||||
| Institutional Plus Class | 1,000.00 | 1,076.46 | 5.14 | 0.99 | 1,000.00 | 1,020.05 | 5.00 | 0.99 | |||||||||||||||
| * | Expenses are equal to each Fund's annualized expense ratio multiplied by the average account value over the period, multiplied by the number of days in the most recent fiscal half-year divided by 366 to reflect the half-year period (except that the average account values reflect the Nebraska Tax-Free Fund's actual return information for the 90-day period between January 1, 2016, the commencement date of Fund operations, through March 31, 2016). |
DIRECTORS AND OFFICERS
March 31, 2016 (Unaudited)
Overall, responsibility for management of the Company rests with its Board, which is elected by the shareholders of the Company, The Company is managed by the Directors in accordance with the laws governing corporations in Nebraska. The Board oversees all of the Funds. Directors serve until their respective successors have been elected and qualified or until their ealier death, resignation or removal. The Directors elect the officers of the Company to supervise its day-to-day operations.
Information about the Directors and officers of the Company is set forth below. The Funds' Statement of Additional Information includes additional information about the Directors and is available, without charge, upon request, by calling 1-800-662-4203 or on the Fund's website www.tributaryfunds.com.
Name, Address1, Age and Position(s) Held with Funds | Term of Office and Length of Time Served | Principal Occupation(s) During Past 5 Years | Number of Portfolios in Fund Complex Overseen by Director | Other Directorships Held by Director during Past 5 Years |
| Interested Directors | ||||
Stephen R. Frantz2 Age: 57 Director/President | Indefinite; Since 2010. | Managing Partner, Tributary Capital Management, LLC (May 2010 to present) Chief Investment Officer, First Investment Group (January 2005 to May 2010); Chief Investment Officer, FNBO Fund Advisers (January 2005 to May 2010). | 6 | None. |
| Independent Directors | ||||
Robert A. Reed Age: 76 Director; Corporate Governance and Nominations Committee Chair | Indefinite; Since 1994. | Retired. President and Chief Executive Officer, Physicians Mutual Insurance Company and Physicians Life Insurance Company (1974 to December 2014). | 6 | None. |
Gary D. Parker Age: 70 Director; Audit Committee Chair | Indefinite; Since 2005. | Retired. | 6 | None. |
John J. McCartney Age: 72 Lead Independent Director | Indefinite; Since 2010. | Retired. | 6 | None. |
1 The address for all Directors is 1620 Dodge Street, Omaha, Nebraska 68102.
2 As defined in the 1940 Act, Mr. Frantz is an "interested" director because he is an officer of Tributary, the Funds' investment adviser.
ADDITIONAL FUND INFORMATION
March 31, 2016 (Unaudited)
| Name, Address, Age and Position(s) Held with Funds | Term of Office and Length of Time Served | Principal Occupation(s) During Past 5 Years |
| Officers | ||
Karen Shaw3 Age: 43 Treasurer; Principal Financial Officer | Indefinite; Since August 2015. | Senior Vice President, Atlantic Fund Services (2008-present). |
Rodney L. Ruehle4 Age: 47 Chief Compliance and Anti-Money Laundering Officer | Indefinite; Since August 2009. | Compliance Officer of Penn Series Funds, Inc. (2012 –present); Chief Compliance Officer of Advisers Investment Trust (2011 – present); Chief Compliance Officer of Asset Management Fund (2009 –present); Chief Compliance Officer of Tributary Funds, Inc. (2009 – present); Director, Beacon Hill Fund Services, Inc. (2008 – present). |
Marc Parsons3 Age: 46 Secretary | Indefinite; Since October 2015. | Senior Counsel, Atlantic (2015 – present); Senior Legal Counsel, Fidelity Investments. (2006 – 2014). |
3 The address for Ms. Shaw and Mr. Parsons is Three Canal Plaza, Suite 600, Portland, ME 04101.
4 The address for Mr Ruehle is 325 John H. McConnell Blvd., Suite 150, Columbus, OH 43215.
INVESTMENT ADVISORY AGREEMENT APPROVAL
March 31, 2016 (Unaudited)
Review and Approval of the Funds' Advisory and Sub-Advisory Agreements
On November 17, 2015, the Board of Directors (the "Board") of Tributary Funds, Inc. (the "Funds"), including all of the Directors who are not parties to any of the investment advisory or sub-advisory agreements for the Company or "interested persons," as that term is defined in the Investment Company Act of 1940, as amended (the "1940 Act"), of any party to such agreements (the "Independent Directors") voted to approve (i) the Investment Advisory Agreement dated December 31, 2015 ("Tributary Agreement"), between the Nebraska Tax-Free Fund ("New Fund") and Tributary Capital Management, LLC ("Tributary"), the investment adviser to the Funds, and (ii) the Investment Sub-Advisory Agreement dated December 31, 2015 ("FNFA Agreement"), between Tributary and FNFA with respect to the Nebraska Tax-Free Fund.
Tributary Capital Management, LLC
In its deliberations, the Board did not identify any single piece of information that was controlling or determinative for its decision respecting the investment advisory agreement with Tributary. However, the following are the Board's conclusions respecting the material factors the Board considered when approving the continuance of the investment advisory agreement with Tributary.
Nature, Extent, and Quality of Services to be Provided.
The Board received and considered a variety of information pertaining to the nature, extent, and quality of services to be provided by Tributary under the Investment Advisory Agreement between the Company and Tributary (the "Tributary Agreement"). The Board noted that portfolio managers who would be providing services to the New Fund are employed by FNFA. The Board carefully evaluated the nature, quality, and extent of Tributary's advisory services. The Board noted the apparent absence of potential conflicts of interest. The Board also evaluated Tributary's organization, resources, and research capabilities. The Board requested and evaluated Tributary's organizational documents, including its registration with the SEC. Based on the historical financial stability of First National and its parent company as it relates to the operations of Tributary, the Board concluded that Tributary would be sufficiently capitalized to satisfy its obligations to the New Fund. After reviewing the foregoing information and further information in Tributary's responses (e.g., descriptions of Tributary's business, its compliance programs, and its Form ADV), the Board concluded that, in light of all the facts and circumstances, the quality, extent, and nature of the services to be provided by Tributary were satisfactory and adequate for the New Fund.
Investment Performance.
The Board recognized that the investment objective and principal investment strategies of the New Fund are expected to continue substantially unchanged under the Tributary Agreement as currently in place with the Nebraska Tax Free Common Trust Fund ("CTF"). Additionally, the Board noted that the performance data for the CTF will be next discussed during the review of FNFA, the sub-adviser to the New Fund.
After reviewing and discussing the performance of the CTF further, FNFA's portfolio managers' experience managing the CTF, and Tributary's historical investment performance, and other relevant factors, the Board concluded, in light of all the facts and circumstances, that the investment performance of the CTF and Tributary was satisfactory.
Cost of Services Provided and Profitability.
The Board reviewed Tributary's proposed advisory fee in relation to the nature, extent, and quality of services to be provided by Tributary. The Board noted that the advisory fee was consistent with current advisory fees charged by similar advisers for comparable funds with comparable objectives. The Board also noted that the New Fund's expense ratio was consistent with expense ratios of funds within its peer group. The Board considered that the New Fund's advisory fees and total expense ratio are lower than the respective peer group averages. The Expense Cap Agreement, further discussed below, as proposed, was reviewed; this Agreement allows for overall expenses for New Fund shareholders to be competitive. Based on the foregoing, the Board concluded that the fees to be paid to Tributary, the costs of the services to be provided, and the profits that may be realized by Tributary, in light of all the facts and circumstances, were fair and reasonable in relation to the nature and quality of the services provided by Tributary and that they reflected charges within a range of what could have been negotiated at arm's length.
Economies of Scale.
The Board also noted that Tributary could realize economies of scale and synergies of operations as it manages the New Fund but that the small number of investment professionals and limited amount of assets under management could limit such economies of scale.
INVESTMENT ADVISORY AGREEMENT APPROVAL
March 31, 2016 (Unaudited)
Employment Arrangements.
The Board considered Tributary's personnel, as well as its plans for attracting and retaining high quality investment professionals. The Board reviewed each of these individual's biographies. The Board noted that each portfolio manager providing services to the New Fund is employed by FNFA and that the employment arrangements of FNFA would be discussed later.
Legal Consideration.
The Board noted that it was not aware of any pending or anticipated legal proceedings or investigations involving Tributary.
Other Considerations.
The Board also identified and considered benefits that could be anticipated to accrue to Tributary because of its relationship with the New Fund, including enhanced marketing.
Based on the Board's deliberations and its evaluation of the information described above, the Board unanimously, including all of its Independent Directors concluded (a) that the terms of the Tributary Agreement are fair and reasonable; and (b) that Tributary fees under the Tributary Agreement are reasonable in light of the services that Tributary will provide to the New Fund.
First National Fund Advisers
In its deliberations, the Board did not identify any single piece of information that was controlling or determinative for its decision respecting the investment advisory agreement with FNFA. However, the following are the Board's conclusions respecting the material factors the Board considered when approving the continuance of the investment advisory agreement with FNFA.
Nature, Extent, and Quality of Services to be Provided.
The Board received and considered a variety of information pertaining to the nature, extent, and quality of services to be provided by FNFA under the FNFA Agreement. The Board reviewed biographical information for each portfolio manager employed by FNFA who would be providing services under the FNFA Agreement and noted the breadth and depth of experience presented (including that of the personnel servicing the New Fund). The Board carefully evaluated the nature, quality, and extent of FNFA's advisory services, including its services as sub-adviser to Tributary on behalf of the New Funds. The Board noted the apparent absence of potential conflicts of interest. The Board also evaluated FNFA's organization, resources, and research capabilities, which the Board noted were consistent with those of Tributary. The Board requested and evaluated FNFA's organizational documents, including its registration with the SEC. Based on the historical financial stability of First National and its parent company as it relates to the operations of FNFA, the Board concluded that FNFA (through Tributary) would be sufficiently capitalized to satisfy its obligations to the New Fund. After reviewing the foregoing information and further information in FNFA's responses (e.g., descriptions of FNFA's business, its compliance programs, and its Form ADV), the Board concluded that, in light of all the facts and circumstances, the quality, extent, and nature of the services to be provided by FNFA were satisfactory and adequate for the New Fund.
Investment Performance.
The Board recognized that the investment objective and principal investment strategies of the New Funds are expected to continue substantially unchanged under the FNFA Agreement as is currently in place for the CTF. The Board reviewed the Lipper "peer groups" as an appropriate benchmark for evaluating the performance to be achieved by FNFA for the New Fund. The Board noted that the CTF's performance outperformed some comparable funds and underperformed others. The Board noted that the CTF outperformed its Lipper peer group averages and for the one-year and three-year periods After reviewing and discussing the performance of the CTF further, FNFA's portfolio managers' experience managing the FNFA Funds, FNFA's historical investment performance, and other relevant factors, the Board concluded, in light of all the facts and circumstances, that the investment performance of the CTF and FNFA was satisfactory.
Cost of Services Provided and Profitability.
The Board reviewed the rate of FNFA's sub-advisory fee in relation to the nature, extent, and quality of services to be provided by FNFA. The Board noted the consistency of the proposed sub-advisory fee with current sub-advisory fees charged by similar sub-advisers for comparable funds with comparable objectives. The Board noted that Tributary – not the FNFA Funds – would pay the proposed sub-advisory fee to FNFA. The Board also noted that the New Fund's expense ratio was in line with expense ratios of funds within their peer
INVESTMENT ADVISORY AGREEMENT APPROVAL
March 31, 2016 (Unaudited)
group. The Expense Cap Agreement, further discussed below, was reviewed; this Agreement allows for overall expenses for New Fund shareholders to remain competitive.
The Board considered that the New Fund's advisory fee and total expense ratio are lower than its respective peer group averages. Based on the foregoing, the Board concluded that the fee to be paid to FNFA, the costs of the services to be provided, and the profits that may be realized by FNFA, in light of all the facts and circumstances, were fair and reasonable in relation to the nature and quality of the services provided by FNFA and that they reflected charges within a range of what could have been negotiated at arm's length.
Economies of Scale.
The Board also noted that FNFA could realize economies of scale and synergies of operations as it manages the FNFA Funds but that the small number of investment professionals and small amount of assets under management could limit such economies of scale.
Employment Arrangements.
The Board considered FNFA's personnel as well as its plans for attracting and retaining high quality investment professionals. The Board reviewed each of these individuals' biographies. The Board also considered FNFA's method for determining the compensation of each of the portfolio managers. It was noted that FNFA offers a competitive compensation package that includes incentive bonus payments, firm contributions to 401K plans and continuing education. Finally, it was noted that FNFA provides a workplace environment that is conducive to attracting and retaining high quality investment professionals. The Board found this method to be consistent with methodologies used by Tributary.
Legal Consideration.
The Board noted that it was not aware of any pending or anticipated legal proceedings or investigations involving FNFA.
Other Considerations.
The Board also identified and considered benefits that could be anticipated to accrue to FNFA because of its relationship with the FNFA Funds, including enhanced marketing.
Based on the Board's deliberations and its evaluation of the information described above, the Board unanimously, including all of its Independent Directors concluded (a) that the terms of the FNFA Agreement are fair and reasonable; and (b) that FNFA's fee under the FNFA Agreement is reasonable in light of the services that FNFA provided to the New Fund.

ITEM 2. CODE OF ETHICS.
The registrant has adopted a code of ethics that applies to the registrant's principal executive officer, principal financial officer, principal accounting officer or controller, or persons performing similar functions. This code of ethics is included as Exhibit 12(a)(1) on this Form N-CSR. There were no substantive amendments or waivers to this code of ethics during the period covered by this report.
ITEM 3. AUDIT COMMITTEE FINANCIAL EXPERT.
The registrant's Board of Directors has determined that the registrant has at least one audit committee financial expert serving on its audit committee. An "audit committee financial expert" is not an "expert" for any purpose, including for purposes of Section 11 of the Securities Act of 1933, as amended, as a result of being designated as an "audit committee financial expert." Further, the designation of a person as an "audit committee financial expert" does not mean that the person has any greater duties, obligations, or liability than those imposed on the person without the "audit committee financial expert" designation. Similarly, the designation of a person as an "audit committee financial expert" does not affect the duties, obligations, or liability of any other member of the Audit Committee or Board of Directors.
The audit committee financial expert is John J. McCartney who is "independent" for purposes of this Item 3 of Form N-CSR.
ITEM 4. PRINCIPAL ACCOUNTANT FEES AND SERVICES.
(a) Audit Fees - The aggregate fees billed for each of the last two fiscal years (the "Reporting Periods") for professional services rendered by the Registrant's principal accountant for the audit of the Registrant's annual financial statements, or services that are normally provided by the principal accountant in connection with the statutory and regulatory filings or engagements for the Reporting Periods, were $89,000 in 2015 and $84,000 in 2016.
(b) Audit-Related Fees – The aggregate fees billed in the Reporting Periods for assurance and related services rendered by the principal accountant that were reasonably related to the performance of the audit of the Registrant's financial statements and are not reported under paragraph (a) of this Item 4 were $6,808 in 2015 and $0 in 2016.
(c) Tax Fees - The aggregate fees billed in the Reporting Periods for professional services rendered by the principal accountant to the Registrant for tax compliance, tax advice and tax planning were $23,625 in 2015 and $18,000 in 2016. These services consisted of review or preparation of U.S. federal, state, local and excise tax returns.
(d) All Other Fees - The aggregate fees billed in the Reporting Periods for products and services provided by the principal accountant to the Registrant, other than the services reported in paragraphs (a) through (c) of this Item, were $0 in 2015 and $0 in 2016.
(e) (1) Audit Committee Pre-Approval Policies and Procedures: The registrant's Audit Committee has not adopted pre-approval policies and procedures. Instead, the Audit Committee approves each audit and non-audit service before the accountant is engaged to provide such service.
(e) (2) No services included in (b) - (d) above were approved pursuant to paragraph (c)(7)(i)(C) of Rule 2-01 of Regulation S-X.
(f) Not applicable
(g) The aggregate non-audit fees billed by the principal accountant for services rendered to the Registrant for the Reporting Periods were $0 in 2015 and $0 in 2016. There were no fees billed in either of the Reporting Periods for non-audit services rendered by the principal accountant to the Registrant's investment adviser or any Affiliate.
(h) Not applicable.
ITEM 5. AUDIT COMMITTEE OF LISTED REGISTRANTS.
Not applicable.
ITEM 6. INVESTMENTS.
| (a) | Included as part of the report to shareholders under Item 1. |
| (b) | Not applicable. |
ITEM 7. DISCLOSURE OF PROXY VOTING POLICIES AND PROCEDURES FOR CLOSED-END
MANAGEMENT INVESTMENT COMPANIES.
Not applicable.
ITEM 8. PORTFOLIO MANAGERS OF CLOSED-END MANAGEMENT INVESTMENT COMPANIES.
Not applicable.
ITEM 9. PURCHASES OF EQUITY SECURITIES BY CLOSED-END MANAGEMENT INVESTMENT COMPANY AND AFFILIATED PURCHASERS.
Not applicable.
ITEM 10. SUBMISSION OF MATTERS TO A VOTE OF SECURITY HOLDERS
There have been no material changes to the procedures by which shareholders may recommend nominees to the registrant's Board of Directors since the registrant last disclosed such procedures.
ITEM 11. CONTROLS AND PROCEDURES
(a) The Registrant's Principal Executive Officer and Principal Financial Officer have concluded that the Registrant's disclosure controls and procedures (as defined in Rule 30a-3(c) under the Investment Company Act of 1940 (the "Act")) are effective, based on their evaluation of the controls and procedures required by Rule 30a-3(b) under the Act and Rules 13a-15(b) or 15d-15(b) under the Securities Exchange Act of 1934, as of a date within 90 days of the filing date of this report.
(b) There were no changes in the Registrant's internal control over financial reporting (as defined in
Rule 30a-3(d) under the Act) that occurred during the second fiscal quarter of the period covered by this report that have materially affected, or are reasonably likely to materially affect, the Registrant's internal control over financial reporting.
ITEM 12. EXHIBITS.
(a)(1)The Code of Ethics (Exhibit filed herewith).
(a)(2) Certifications pursuant to Rule 30a-2(a) of the Act, and Section 302 of the Sarbanes-Oxley Act of 2002 (Exhibits filed herewith).
(a)(3) Not applicable.
(b) Certifications pursuant to Rule 30a-2(b) of the Act, and Section 906 of the Sarbanes-Oxley Act of 2002 (Exhibit filed herewith).
SIGNATURES
Pursuant to the requirements of the Securities Exchange Act of 1934 and the Investment Company Act of 1940, the Registrant has duly caused this report to be signed on its behalf by the undersigned, thereunto duly authorized.
Registrant Tributary Funds, Inc.
By /s/ Karen Shaw
Karen Shaw
Treasurer
Date May 26, 2016
Pursuant to the requirements of the Securities Exchange Act of 1934 and the Investment Company Act of 1940, this report has been signed below by the following persons on behalf of the Registrant and in the capacities and on the dates indicated.
By /s/ Stephen R. Frantz
Stephen R. Frantz
President
Date May 26, 2016
By /s/ Karen Shaw
Karen Shaw
Treasurer
Date May 26, 2016