UNITED STATES
SECURITIES AND EXCHANGE COMMISSION
Washington, D.C. 20549
FORM N-CSR
CERTIFIED SHAREHOLDER REPORT OF REGISTERED
MANAGEMENT INVESTMENT COMPANIES
Investment Company Act file number | 811-08846 | |||||||
| ||||||||
Tributary Funds, Inc. | ||||||||
(Exact name of registrant as specified in charter) | ||||||||
| ||||||||
Tributary Capital Management, LLC 1620 Dodge Street Omaha, Nebraska |
| 68197 | ||||||
(Address of principal executive offices) |
| (Zip code) | ||||||
| ||||||||
Daniel W. Koors Jackson Fund Services 225 West Wacker Drive, Suite 1200 Chicago, Illinois 60606 | ||||||||
(Name and address of agent for service) | ||||||||
| ||||||||
Registrant’s telephone number, including area code: | (800) 662-4203 |
| ||||||
| ||||||||
Date of fiscal year end: | March 31 |
| ||||||
| ||||||||
Date of reporting period: | March 31, 2013 |
| ||||||
Form N-CSR is to be used by management investment companies to file reports with the Commission not later than 10 days after the transmission to stockholders of any report that is required to be transmitted to stockholders under Rule 30e-1 under the Investment Company Act of 1940 (17 CFR 270.30e-1). The Commission may use the information provided on Form N-CSR in its regulatory, disclosure review, inspection, and policymaking roles.
A registrant is required to disclose the information specified by Form N-CSR, and the Commission will make this information public. A registrant is not required to respond to the collection of information contained in Form N-CSR unless the Form displays a currently valid Office of Management and Budget (“OMB”) control number. Please direct comments concerning the accuracy of the information collection burden estimate and any suggestions for reducing the burden to Secretary, Securities and Exchange Commission, 450 Fifth Street, NW, Washington, DC 20549-0609. The OMB has reviewed this collection of information under the clearance requirements of 44 U.S.C. §3507.
Item 1. Report to Shareholders.

Tributary Funds®
Annual Report
March 31, 2013
Tributary Short-Intermediate Bond Fund
Institutional Class: FOSIX
Institutional Plus Class: FOSPX
Tributary Income Fund
Institutional Class: FOINX
Institutional Plus Class: FOIPX
Tributary Balanced Fund
Institutional Class: FOBAX
Institutional Plus Class: FOBPX
Tributary Core Equity Fund
Institutional Class: FOEQX
Institutional Plus Class: FOEPX
Tributary Large Cap Growth Fund
Institutional Class: FOLCX
Insitutional Plus Class: FOLPX
Tributary Growth Opportunities Fund
Institutional Class: FOGRX
Institutional Plus Class: FOGPX
Tributary Small Company Fund
Institutional Class: FOSCX
Institutional Plus Class: FOSBX
Notice to Investors
Shares of Tributary Funds:
· ARE NOT FDIC INSURED | · MAY LOSE VALUE | · HAVE NO BANK GUARANTEE |
Investors should carefully consider the investment objectives, risks, charges and expenses of the Tributary Funds. Mutual funds involve risk including loss of principal. This and other important information about the Tributary Funds is contained in the prospectus, which can be obtained by calling 1-800-662-4203 or by visiting www.tributaryfunds.com. The prospectus should be read carefully before investing. The Tributary Funds are distributed by Northern Lights Distributors, LLC member FINRA. Northern Lights and the Tributary Funds’ investment adviser are not affiliated.
Dear Shareholder:
As of December 31, 2012, the assets in the Tributary Family of Mutual Funds stood at $695 million, a $19 million decrease from the same period in 2011. Although the markets did help, we experienced approximately $81 million in net outflows for the year. However, since the end of 2008, we have seen the fund assets grow by $341 million, a compounded annual rate of over 18%, with approximately $251 million of that growth coming from net inflows. In doing so, we have been able to reduce the weighted average expense ratio to our shareholders from 1.19% to 0.99%, a 17% decrease. These accomplishments over the last 4 years are even more impressive when contrasted against an industry back drop that has seen net outflows, away from equities and into bonds and alternative asset classes such as hedge funds and private equity, as well as very specialized asset classes attempting to deliver returns non-correlated to stocks.
The majority of the outflows for calendar year 2012 occurred in the Core Equity Fund, who’s strong, fundamental focus in this world of easy money and macro oriented investment themes has caused the performance to lag its benchmark and peer group. These outflows are also exacerbated by what appears to be a long-term secular trend, where investments in the largest capitalization companies, particularly here in the U.S., are more frequently being allocated to exchange traded funds (“ETFs”) and index funds.
In our last annual report, I wrote about the changing dynamic of wealth management, dominated by open architecture platforms and a hyper-sensitivity to fiduciary issues. These issues have become even more pronounced over the last year and continue to challenge all fund complexes and their distribution strategies. We continue to press hard to distribute our Funds outside of our parent company’s footprint, and saw net growth in these channels in 2012. This is the correct strategy for both the parent company and Tributary Funds, but none-the-less will make the next year or two challenging for growth in assets as we work hard to find that point of equilibrium.
For those of you familiar with my economic views over the last couple of years, you know that I have been quite concerned about the insatiable appetite the U.S. Federal Reserve (“Federal Reserve”) has had for printing money. Policy error remains the most significant long-term risk I see to the global economies, as even the Japanese have joined the money printing party. The world is flush with liquidity and that liquidity certainly has helped re-inflate stock prices. If you take the S&P 500 Index as a proxy for the U.S. stock market, the annualized return from March 9, 2009 (the bottom of the market after the financial crisis of 2007-2008) through March 31, 2013 is close to 20%, approximately double the long-term average for the stock market. Unfortunately, many investors have not participated in this run up after being burned in the meltdown in 2008 and 2009, and are just now re-entering the market. For those fortunate enough to have remained fully invested over the last four years, the rewards have been good. For those on a fixed income, looking for yield has been an exercise in futility over that same period, as the Federal Reserve has tried to push investors to riskier assets to help reignite growth. Growth has been stubbornly difficult to come by and remains a challenge, as does the long-term employment rate. In order for us to get unemployment down from its current 7.5% rate to something approaching full employment (5%), we need to find a way to grow our economy at a 4-5% clip for several years.
Now one might question my sanity at expressing concerns after the market experienced almost 20% annualized returns for the last 4+ years. As investors who are focused on the underlying business fundamentals of the companies we own versus Federal Reserve policy, asset flows or other issues that we do not believe offer great predictability for investors over the long-term, it has not been a particularly easy environment in which to outperform. Easy monetary policy and liquidity over the short-run can mask the individual merits of owning strong businesses over weak ones, as money flows indiscriminately into stocks based on the promise that the Federal Reserve will do anything in its power regardless of the long-term
consequences to keep the economy and the market rally chugging along. This easy money policy has also created a conundrum in the bond markets, with investors reaching dangerously out on the credit quality curve to pick up yield, against a back drop of record low CD, savings and treasury yields forced on savers by Federal Reserve policy. It is very difficult to ascertain true market based values for various asset classes in this type of environment, and though I have been concerned about it for some time now, we are starting to hear some dissenting views come out of the Federal Reserve about the long-term unintended consequences of their policies.
As a point of reference, I have held this view for several years, and so far have been proven incorrect. Here’s what I said in my last annual report: “The market recovery over the last several years seems to have been primarily driven by a hyper-accommodative policy by the U.S. Federal Reserve. Where up until several weeks ago many pundits had predicted another round of quantitative easing or “QE3”, the talk out of Washington more recently seems to indicate we are getting close to the point where the U.S. Federal Reserve at a minimum will take to the sidelines and withdraw further support absent any further systemic shock to our economy, and may even begin a slow but none-the-less deliberate withdrawal of this accommodative policy.”
In summary, we continue to look for new distribution opportunities for the Tributary Funds, reflecting an industry trend that no longer explicitly supports direct relationships between product manufacturing (investment management) and distribution. Our focus has become national in scope, as we look to capitalize on national platforms where our products have been approved. Although the markets, both equity and fixed income, have been supportive of asset growth over the last several years, I remain somewhat concerned about the non-intended consequences of very accommodative Federal Reserve policy, and the ability of the Federal Reserve to disengage from this policy at the correct time without doing significant damage to the economy. The actively managed mutual fund industry continues to be challenged by the proliferation of ETFs and index funds, particularly in an environment of easy money that makes active management, or the willingness to take positions different than the index challenging. Decisions tend to be made indiscriminately and based on money flows, versus buying company and credit specific fundamentals.
As with all cycles, the investment environment will at some point change and once again favor active management, at least in my view. It does appear that the distribution challenges in the mutual fund business are secular in nature, and necessitate a change in strategy, which we have been working on for several years, and will continue to refine going forward.
We look forward to serving your investment needs for many years to come!
Best regards,

Stephen R. Frantz
President
sfrantz@tributarycapital.com
Comments are provided as a general market overview and should not be considered investment advice or predictive of any future market performance.
ANNUAL REPORT 2013

SHORT-INTERMEDIATE BOND FUND
Investment Objective
The Tributary Short-Intermediate Bond Fund seeks to maximize total return in a manner consistent with the generation of current income, preservation of capital, and reduced price volatility.
Manager Commentary
The 12-month period ended March 31, 2013 was a period in which the markets were preoccupied with fiscal and monetary policies, both here in the U.S. and globally. The year was also marked by a continuation of the slow growth economy in the U.S. and a slowdown in growth globally.
While Europe was generally calmer than in 2011, it still has major unresolved structural issues that periodically captured the attention of the markets in 2012. The Greeks rattled markets by holding elections to determine whether they would maintain or reject the European Union ("EU") mandated austerity programs. Concerns also surfaced regarding the capital adequacy of Spanish banks. As the period ended, a long awaited banking crisis came to a head in Cyprus, and the bizarre EU response, which required bank depositors to take losses, rattled peripheral European markets once again. As the structural problems of the EU remain unresolved, Europe will remain in the headlines and will continue to be a drag on global growth for some time to come.
In the U.S., markets were preoccupied with the "fiscal cliff" which consisted of the expiring "Bush tax cuts," the automatic sequestration spending cuts, and the need to raise the debt ceiling once again. This fiscal uncertainty caused markets to stall and interest rates to trade within a 30 basis points ("bps") range for most of the last half of 2012. Interest rates and equity markets both traded higher in the first quarter of 2013 as Congress extended and made most of the tax cuts permanent.
In this environment of global and domestic fiscal headwinds, U.S. economic growth was anemic. While housing showed steady improvement, the labor market remained weak with only marginal growth in employment over the period. The U.S. consumer remained cautious and businesses were reluctant to make major investments in the face of fiscal uncertainty. The year over year improvement in the stock market and tightening of fixed income credit spreads can be largely attributed to a very accommodative U.S. Federal Reserve ("Federal Reserve"). Faced with global geopolitical uncertainty and a slow economy in the U.S., the Federal Reserve implemented another round of quantitative easing that includes the monthly purchase of $85 billion in agency mortgage backed securities ("MBS") and longer maturity U.S. Treasuries to drive rates even lower. The 10-year U.S. treasury rate declined from 2.21% at the beginning of the period and fell to 1.85% at March 31, 2013. We expect the low rate, slow growth environment to persist for most of the current year.
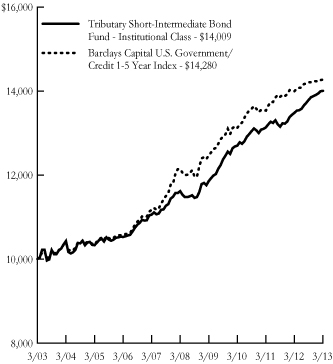
For the year ended March 31, 2013, Tributary Short-Intermediate Bond Fund returned 3.85% (Institutional Class at NAV) compared to a 1.96% return for the Barclays Capital U.S. Government/Credit 1-5 Year Index. The outperformance for the trailing 12 months was due to the Fund's overweight allocation to non-agency MBS securities and financial corporate bonds. Relative to similar maturity, U.S. Treasuries for example, the financials sub index gained over 6.6% in value during the period. The non-agency MBS sector was also a stellar performer over the past year, with many bonds seeing 10%+ returns. The sector has benefitted from attractive yield profiles and fundamental improvement as home values have stabilized and delinquencies have declined. The Fund's shorter average duration relative to the benchmark detracted slightly from performance as interest rates fell across the yield curve. Over the year, the 10-year yield dropped 36 bps to close at 1.85%, while the 5-year yield fell 27 bps to close at 0.77%.
If the last 12 months were chronicled in a documentary, it might well be called "The Central Banks Strike Back." The Federal Reserve, the European Central Bank, the Bank of England and the Bank of Japan all announced or expanded unconventional programs to help stimulate economic growth and reduce risk premiums in the financial markets. Monetary measures were the order of the day, given the uncertainty caused by the European debt crisis and the U.S. "fiscal cliff" drama.
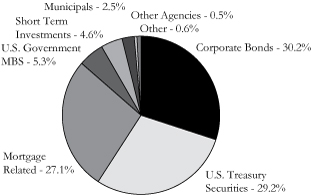
There were no significant changes in the Fund's sector allocation over the past year. We slightly increased our exposure to the non-agency MBS sector, given its still attractive yield profile, while also adding to the U.S. treasury sector. Our corporate bond exposure was unchanged, and we did add to our position in taxable municipal bonds. In terms of credit quality, the Fund has maintained an A+ weighted average rating for the portfolio.
In our view, the world remains mired in an environment of relatively weak economic growth, despite the actions of monetary and fiscal authorities. Over the near to medium term, this likely results in low but range-bound treasury yields, a position we have held for some time. With respect to the spread sectors of the bond market, we are finding far fewer compelling values, but have yet to reach the point where we foresee a broad based, secular widening of credit spreads. Pockets of opportunity still exist — in select financial corporate bonds and private label MBS, for example — so we remain overweight in those sectors, but are increasingly patient. Rounding out the Fund's allocation, we continue to maintain a small exposure to the agency MBS sector for yield enhancement, while having a larger underweight to the traditional U.S. government bond sector. As always, we remain committed to seeking prudent, value enhancing investment opportunities consistent with our disciplined approach of managing for the long term.
ANNUAL REPORT 2013

SHORT-INTERMEDIATE BOND FUND
Return of a $10,000 Investment as of March 31, 2013
Portfolio Composition as of March 31, 2013
Percentage Based on Total Value of Investments
(Portfolio composition is subject to change)
Portfolio Analysis as of March 31, 2013
(Portfolio composition is subject to change)
Weighted Average Maturity: | 3.7 years | ||||||
Average Annual Total Return for the Year Ended March 31, 2013*
1 Year | 5 Year | 10 Year | |||||||||||||
| Tributary Short-Intermediate Bond Fund - Institutional Class | 3.85 | % | 3.82 | % | 3.43 | % | |||||||||
| Barclays Capital U.S Government/Credit 1-5 Year Index | 1.96 | % | 3.30 | % | 3.63 | % | |||||||||
Prospectus Expense Ratio (Gross/Net)† | 1.07%/0.85% | ||||||||||||||
| Expense Ratio for the Year Ended March 31, 2013 (Gross/Net) | 1.05%/0.83% | ||||||||||||||
1 Year | Since Inception†† | ||||||||||
| Tributary Short-Intermediate Bond Fund - Institutional Plus Class | 4.11 | % | 4.62 | % | |||||||
Prospectus Expense Ratio (Gross/Net)† | 0.84%/0.62% | ||||||||||
| Expense Ratio for the Year Ended March 31, 2013 (Gross/Net) | 0.80%/0.58% | ||||||||||
Past performance does not guarantee future results. The performance data quoted represents past performance and current returns may be lower or higher. Total return figures include change in share price, reinvestment of dividends and capital gains. The investment return and principal value will fluctuate so that an investor's shares, when redeemed may be worth more or less than the original cost. To obtain performance information current to the most recent month end, please visit our website at www.tributaryfunds.com.
(†)The above expense ratios are from the Fund's prospectus dated August 1, 2012. Net expense ratio is net of contractual waivers which are in effect from August 1, 2012 through July 31, 2013.
(††)Commencement date for the Institutional Plus Class was October 14, 2011.
(*) Returns shown do not reflect the deduction of taxes that a shareholder would pay on Fund distributions or the redemption of Fund shares. The returns for certain periods reflect fee waivers and/or reimbursements in effect for that period; absent fee waivers and reimbursements, performance would have been lower.
The line chart assumes an initial investment of $10,000 made on March 31, 2003. Total return is based on net change in net asset value ("NAV") assuming reinvestment of distributions. Returns shown include the reinvestment of all dividends and other distributions.
The performance of Institutional Plus Class will be different than Institutional Class based on differences in fees borne by each class.
The Barclays Capital U.S. Government/Credit 1-5 Year Index measures the performance of U.S. Treasury and agency securities, and corporate bonds with 1-5 year maturities.
The above referenced index is unmanaged and does not reflect the deduction of fees or taxes associated with a mutual fund, such as investment management and fund accounting fees. Investors cannot invest directly in the index.
ANNUAL REPORT 2013

INCOME FUND
Investment Objective
The Tributary Income Fund seeks the generation of current income in a manner consistent with preserving capital and maximizing total return.
Manager Commentary
The 12-month period ended March 31, 2013 was a period in which the markets were preoccupied with fiscal and monetary policies, both here in the U.S. and globally. The year was also marked by a continuation of the slow growth economy in the U.S. and a slowdown in growth globally.
While Europe was generally calmer than in 2011, it still has major unresolved structural issues that periodically captured the attention of the markets in 2012. The Greeks rattled markets by holding elections to determine whether they would maintain or reject the European Union ("EU") mandated austerity programs. Concerns also surfaced regarding the capital adequacy of Spanish banks. As the period ended, a long awaited banking crisis came to a head in Cyprus, and the bizarre EU response which required bank depositors to take losses rattled peripheral European markets once again. As the structural problems of the EU remain unresolved, Europe will remain in the headlines and will continue to be a drag on global growth for some time to come.
In the U.S., markets were preoccupied with the "fiscal cliff" which consisted of the expiring "Bush tax cuts," the automatic sequestration spending cuts, and the need to raise the debt ceiling once again. This fiscal uncertainty caused markets to stall and interest rates to trade within a 30 basis points ("bps") range for most of the last half of 2012. Interest rates and equity markets both traded higher in the first quarter of 2013 as Congress extended and made most of the tax cuts permanent.
In this environment of global and domestic fiscal headwinds, U.S. economic growth was anemic. While housing showed steady improvement, the labor market remained weak with only marginal growth in employment over the period. The U.S. consumer remained cautious and businesses were reluctant to make major investments in the face of fiscal uncertainty. The year over year improvement in the stock market and tightening of fixed income credit spreads can be largely attributed to a very accommodative U.S. Federal Reserve ("Federal Reserve"). Faced with global geopolitical uncertainty and a slow economy in the U.S., the Federal Reserve implemented another round of quantitative easing that includes the monthly purchase of $85 billion in agency mortgage backed securities ("MBS") and longer maturity U.S. Treasuries to drive rates even lower. The ten year U.S. Treasury rate declined from 2.21% at the beginning of the period and fell to 1.85% at March 31, 2013. We expect the low rate, slow growth environment to persist for most of the current year.
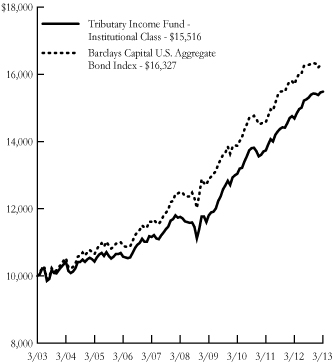
For the year ended March 31, 2013, Tributary Income Fund returned 5.46% (Institutional Class at NAV) compared to a 3.77% return for the Barclays Capital U.S. Aggregate Bond Index. The outperformance for the trailing 12 months was due to the Fund's overweight allocation to non-agency MBS securities and financial corporate bonds. Relative to similar maturity U.S. treasuries for example, the financials sub index gained over 6.6% in value during the period. The non-agency MBS sector was also a stellar performer over the past year, with many bonds seeing 10%+ returns. The sector has benefitted from attractive yield profiles and fundamental improvement as home values have stabilized and delinquencies have declined. The Fund's shorter average duration relative to the benchmark detracted slightly from performance as interest rates fell across the yield curve. Over the year, the 30-year yield fell 24 bps and the 10-year yield dropped 36 bps to close at 1.85% (for perspective, a 100 bps decline in the 30-year yield is roughly equivalent to an 18% increase in price).
If the last 12 months were chronicled in a documentary, it might well be called "The Central Banks Strike Back." The Federal Reserve, the European Central Bank, the Bank of England and the Bank of Japan all announced or expanded unconventional programs to help stimulate economic growth and reduce risk premiums in the financial markets. Monetary measures were the order of the day, given the uncertainty caused by the European debt crisis and the U.S. "fiscal cliff" drama.
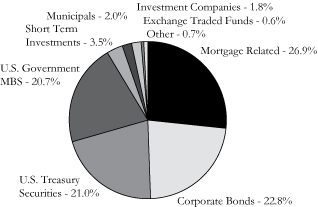
There were no significant changes in the Fund's sector allocation over the past year. We modestly increased our exposure to the non-agency MBS sector, given its still attractive yield profile, while also adding to the U.S. treasury sector. Our corporate bond exposure was unchanged, although we did increase our duration position within the space, while the agency MBS allocation was allowed to fall naturally via prepayments. In terms of credit quality, the Fund has maintained an A+ weighted average rating for the portfolio.
In our view, the world remains mired in an environment of relatively weak economic growth, despite the actions of monetary and fiscal authorities. Over the near to medium term this likely results in low but range bound treasury yields, a position we have held for some time. With respect to the spread sectors of the bond market, we are finding far fewer compelling values, but have yet to reach the point where we foresee a broad based, secular widening of credit spreads. Pockets of opportunity still exist — in select financial corporate bonds and private label MBS, for example — so we remain overweight in those sectors, but are increasingly patient. Rounding out the Fund's allocation, we continue to be underweight the agency MBS sector on a duration basis, with a larger underweight to the traditional U.S. government bond sector. As always, we remain committed to seeking prudent, value enhancing investment opportunities consistent with our disciplined approach of managing for the long term.
ANNUAL REPORT 2013

INCOME FUND
Return of a $10,000 Investment as of March 31, 2013
Portfolio Composition as of March 31, 2013
Percentage Based on Total Value of Investments
(Portfolio composition is subject to change)
Portfolio Analysis as of March 31, 2013
(Portfolio composition is subject to change)
Weighted Average Maturity: | 7.3 years | ||||||
Average Annual Total Return for the Year Ended March 31, 2013*
1 Year | 5 Year | 10 Year | |||||||||||||
| Tributary Income Fund - Institutional Class | 5.46 | % | 5.68 | % | 4.49 | % | |||||||||
| Barclays Capital U.S. Aggregate Bond Index | 3.77 | % | 5.47 | % | 5.02 | % | |||||||||
Prospectus Expense Ratio (Gross/Net)† | 1.19%/0.92% | ||||||||||||||
| Expense Ratio for the Year Ended March 31, 2013 (Gross/Net) | 1.15%/0.88% | ||||||||||||||
1 Year | Since Inception†† | ||||||||||
| Tributary Income Fund - Institutional Plus Class | 5.70 | % | 5.77 | % | |||||||
Prospectus Expense Ratio (Gross/Net)† | 0.95%/0.68% | ||||||||||
| Expense Ratio for the Year Ended March 31, 2013 (Gross/Net) | 0.90%/0.63% | ||||||||||
Past performance does not guarantee future results. The performance data quoted represents past performance and current returns may be lower or higher. Total return figures include change in share price, reinvestment of dividends and capital gains. The investment return and principal value will fluctuate so that an investor's shares, when redeemed may be worth more or less than the original cost. To obtain performance information current to the most recent month end, please visit our website at www.tributaryfunds.com.
(†)The above expense ratios are from the Fund's prospectus dated August 1, 2012. Net expense ratio is net of contractual waivers which are in effect from August 1, 2012 through July 31, 2013.
(††)Commencement date for the Institutional Plus Class was October 28, 2011.
(*) Returns shown do not reflect the deduction of taxes that a shareholder would pay on Fund distributions or the redemption of Fund shares. The returns for certain periods reflect fee waivers and/or reimbursements in effect for that period; absent fee waivers and reimbursements, performance would have been lower.
The line chart assumes an initial investment of $10,000 made on March 31, 2003. Total return is based on net change in net asset value ("NAV") assuming reinvestment of distributions. Returns shown include the reinvestment of all dividends and other distributions.
The performance of Institutional Plus Class will be different than Institutional Class based on differences in fees borne by each class.
The Barclays Capital U.S. Aggregate Bond Index is a market value-weighted index which covers the USD-denominated, investment-grade, fixed-rate, taxable bond market of SEC-registered securities. The index includes bonds from the Treasury, Government-Related, Corporate, MSB (agency fixed-rate and hybrid ARM passthroughs), ABS, and CMBS sectors.
The above referenced index is unmanaged and does not reflect the deduction of fees or taxes associated with a mutual fund, such as investment management and fund accounting fees. Investors cannot invest directly in the index.
ANNUAL REPORT 2013

BALANCED FUND
Investment Objective
The Tributary Balanced Fund seeks capital appreciation and current income.
Manager Commentary
Modest economic growth and company earnings growth of 6.07% led to solid returns in the stock market. For the 12-month period ended March 31, 2013, the S&P 500 Index had a total return of 13.96%. U.S. equity returns were broad based with small and mid cap returns outperforming large caps for the year. In terms of style, value stocks performed well with the S&P 500 Value Index up 16.64%, well above the 11.61% return of the S&P 500 Growth Index. In April and May 2012, the stock market corrected on global economic growth concerns. Post the correction, U.S. equities rebounded with particularly strong performance so far in 2013. In addition to positive company fundamentals, global central banks have continued their accommodative monetary policies. The U.S. Federal Reserve implemented quantitative easing ("QE3") in an effort to support economic growth and encourage investment in the real estate market.
For the 12-month period ended March 31, 2013, the Barclays Capital U.S. Government/Credit Index had a total return of 4.56%. Corporate bonds continued to outperform with the Barclays U.S. Credit Index up 7.00%. This compares to the 3.01% return of the Barclays U.S. Government Index. The strong performance in credit is a result of strong company fundamentals, both in balance sheet strength and the high level of profitability. As a result, default rates are below historical averages for both investment grade and below investment grade corporate bonds. For several years, investors have expected an increase in interest rates. Due to slow global economic growth and subdued inflation, interest rates remained in a fairly tight trading range. The 10-year treasury yield actually decreased from a yield of 2.21% a year ago to 1.85% as of March 31, 2013.
For the year ended March 31, 2013, Tributary Balanced Fund returned 6.89% (Institutional Class at NAV) compared to 10.30% for the Composite Index. The Composite Index consists of 60% S&P 500 Index and 40% Barclays Capital U.S. Government/Credit Index. Over the last year, Tributary Balanced Fund maintained a slight overweight stock allocation relative to the benchmark with an average weighting of 62%. This resulted in a small positive contribution.
Stock selection detracted from performance as equity returns in the Fund (+9.89%) lagged the S&P 500 Index return of 13.96%. The lower relative return reflects the growth bias inherent in our multi cap strategy and the fact that the stock market rewarded value stocks. Positions in health care (Medidata Solutions Inc., Celgene Corp.) and industrials
(Fortune Brands Home & Security Inc., Roper Industries Inc.) contributed to returns. Consumer discretionary holdings (Tempur-Pedic International Inc., Chipotle Mexican Grill Inc.) and energy (Occidental Petroleum Corp., Apache Corp.) negatively impacted performance. The Fund is well diversified with exposure to economically sensitive and defensive industries and 72 company positions. Our stock focus has broadened to include small, mid and large caps with a weighted average market capitalization of $70 billion.
In fixed income, the 5.81% bond return outperformed the Barclays Capital U.S. Government/Credit Index return of 4.56%. Our emphasis on corporate and municipal bonds positively impacted returns. The strategy is based on the average level of credit spreads relative to history and low default rates. The sector breakdown: Corporate (+72%), municipal (+18%), agencies and agency-backed mortgages (+4%), treasuries (+3%), and TIPS (+3%). The average credit rating remains high at "A". We have started to reduce the interest rate risk in the Fund with the current duration of 4.5 short relative to the stated benchmark duration of 5.8.
As of March 31, 2013 the Fund had a 62% allocation to equities, 32% to fixed income and 6% to cash. This allocation is based on the economic and profit outlook and relative valuations of asset classes. Equities remain attractively valued relative to its history and opportunities in the fixed income market. We continue to closely monitor the global economy to determine if a change in asset allocation is warranted.
ANNUAL REPORT 2013

BALANCED FUND
Return of a $10,000 Investment as of March 31, 2013

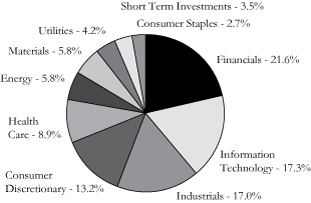
Portfolio Composition as of March 31, 2013
Percentage Based on Total Value of Investments
(Portfolio composition is subject to change)

Average Annual Total Return for the Year Ended March 31, 2013*
1 Year | 5 Year | 10 Year | |||||||||||||
| Tributary Balanced Fund - Institutional Class | 6.89 | % | 7.77 | % | 9.23 | % | |||||||||
| Barclays Capital U.S. Government/Credit Index | 4.56 | % | 5.50 | % | 5.06 | % | |||||||||
S&P 500 Index | 13.96 | % | 5.81 | % | 8.53 | % | |||||||||
Composite Index | 10.30 | % | 6.16 | % | 7.44 | % | |||||||||
Prospectus Expense Ratio (Gross/Net)† | 1.39%/1.26% | ||||||||||||||
| Expense Ratio for the Year Ended March 31, 2013 (Gross/Net) | 1.35%/1.22% | ||||||||||||||
1 Year | Since Inception†† | ||||||||||
| Tributary Balanced Fund - Institutional Plus Class | 7.17 | % | 12.69 | % | |||||||
Prospectus Expense Ratio (Gross/Net)† | 1.18%/1.05% | ||||||||||
| Expense Ratio for the Year Ended March 31, 2013 (Gross/Net) | 1.10%/0.97% | ||||||||||
Past performance does not guarantee future results. The performance data quoted represents past performance and current returns may be lower or higher. Total return figures include change in share price, reinvestment of dividends and capital gains. The investment return and principal value will fluctuate so that an investor's shares, when redeemed may be worth more or less than the original cost. To obtain performance information current to the most recent month end, please visit our website at www.tributaryfunds.com.
(†)The above expense ratios are from the Fund's prospectus dated August 1, 2012. Net expense ratio is net of contractual waivers which are in effect from August 1, 2012 through July 31, 2013.
(††)Commencement date for the Institutional Plus Class was October 14, 2011.
(*) Returns shown do not reflect the deduction of taxes that a shareholder would pay on Fund distributions or the redemption of Fund shares. The returns for certain periods reflect fee waivers and/or reimbursements in effect for that period; absent fee waivers and reimbursements, performance would have been lower.
The line chart assumes an initial investment of $10,000 made on March 31, 2003. Total return is based on net change in net asset value ("NAV") assuming reinvestment of distributions. Returns shown include the reinvestment of all dividends and other distributions. The performance of Institutional Plus Class will be different than Institutional Class based on differences in fees borne by each class.
The Barclays Capital U.S. Government/Credit Index is the non-securitized component of the U.S. Aggregate Index and includes Treasuries (i.e, public obligations of the U.S. Treasury that have remaining maturities of more than one year), Government-Related issues (i.e., agency, sovereign, supranational, and local authority debt), and USD Corporates.
The S&P 500 Index is an index of 500 selected common stocks most of which are listed on the New York Stock Exchange. The index is heavily weighted toward stocks with large market capitalizations and represents approximately two-thirds of the total market value of all domestic common stocks.
The Composite Index is a combined index of 60% of the S&P 500 Index and 40% of the Barclays Capital U.S. Government/Credit Index. The Composite Index is intended to provide a single benchmark that more accurately reflects the composition of securities held by the Balanced Fund. The individual performance of each index that comprises the Composite Index is detailed in the chart above.
The above referenced indices are unmanaged and do not reflect the deduction of fees or taxes associated with a mutual fund, such as investment management and fund accounting fees. Investors cannot invest directly in the indices.
ANNUAL REPORT 2013

CORE EQUITY FUND
Investment Objective
The Tributary Core Equity Fund seeks long-term capital appreciation.
Manager Commentary
Equities posted a nicely positive year, as the S&P 500 Index finished the last 12 months with a 14% gain. Market sentiment has improved vastly since a year ago at this time, as stock markets closed in on 2007 market highs by the end of March. In the Spring of 2012, broad growth concerns were percolating into the market and caused shares to pull back into the summer. European economic issues were daily headline makers, Asian growth appeared to be decelerating and the domestic economy wavered. Global activity indeed slowed during the summer, causing another round of stimulative actions to be taken by central banks around the world. Actions to increase liquidity and spur economic growth became prevalent in the second half of 2012 and have continued through the first few months of 2013. It has now become accepted that central banks will consider any actions necessary to help economic growth and labor market improvement meet objectives. The slow, but still positive, economic backdrop has proven increasingly challenging for companies to generate anything above muted profit growth. Despite cautious company management comments, equities have climbed a 'wall of worry'. Economic data has had a generally positive bias, of late, bolstering expectations for continued improvement. Interest rates are extremely low and equity valuations look attractive on a relative basis, and still do not appear rich from a historic perspective, either. Even though stock markets have recovered strongly off the 2009 bottom, equities are still under owned, and may continue to benefit from asset reallocation for some time.
For the year ended March 31, 2013, Tributary Core Equity Fund returned 10.72% (Institutional Class at NAV) compared to 13.96% for the S&P 500 Index. The Fund's annual underperformance was mainly accumulated during the first two quarters, as relative performance improved over the final six months of the Fund's fiscal year. During the second half of the year, the Fund generated an 11.11% return, just above the S&P 500 Index's 10.19% gain.
There were a number of portfolio changes during 2012 that dialed back risk and enhanced the quality of the portfolio. With an improved portfolio composition and a backdrop where value stocks performed significantly better than growth stocks, second half relative performance was much improved.
Portfolio holdings generated positive relative performance in the industrial and consumer staples sectors during the year.
Flowserve Corp. was a major contributor to Industrial gains, as its exposure to very strong oil and gas and chemical end markets boosted equipment orders. Shareholder friendly changes to take advantage of the company's under levered balance sheet also caused investor interest in Flowserve Corp. shares. H.J. Heinz Co.'s agreement to be acquired by Berkshire Hathaway Inc. and Brazilian investors significantly boosted the Fund's consumer staples returns. Kimberly-Clark Corp. had a solid start to the year, also contributing to consumer staples gains. After Kimberly-Clark Corp. shares reached our valuation target, the position was sold and proceeds were placed into a new addition to the portfolio, General Mills Inc. General Mills Inc., in turn, also performed well since purchase as commodity cost concerns eased.
Other notable contributors to performance were consumer discretionary holdings Mohawk Industries Inc. and Comcast Corp. Mohawk Industries Inc. advanced 70% during the Fund's fiscal year, benefiting from investor interest in housing related industries. Cable operations are doing well at Comcast Corp., and the company is returning significant amounts of cash to shareholders. Two new financial services holdings enhanced that sector's returns, too. IntercontinentalExchange Inc. rose 30% after being added to the Fund in May, and AON Plc. posted a 36% gain since initial purchase in June. Travelers Cos. Inc. led the Fund's financial holdings with a 46% return. Financial services was one of the strongest market sectors during the second half of the Fund year, as general systemic concerns abated. In healthcare, Novartis AG's five year outlook remains among the best in the pharmaceutical space, and its shares rose 33% for the year.
Information technology and materials were the most significant sector detractors from relative performance. Technology was the only sector in the S&P 500 Index that had a negative return for the year. Fund holdings EMC Corp. and Intel Corp. were both down roughly 20% on the year. EMC Corp.'s end markets slowed, and Intel Corp.'s exposure to lackluster personal computing ("PC") trends weighed on its shares. Though Apple Inc. shares declined 25% on the year, the Fund's underweight position was additive to relative performance. Materials holdings Allegheny Technologies Inc. and Potash Corporation of Saskatchewan generated negative returns on the year. Allegheny Technologies Inc.'s exposure to extremely weak steel markets weighed on its shares. The near and intermediate term potash industry outlook has become murky, so the Potash Corporation of Saskatchewan position was exited in February.
The Fund's high quality, mega cap exposure still looks attractively valued on a relative basis, and should also offer below average risk. The Fund finished the year with 50 holdings.
ANNUAL REPORT 2013

CORE EQUITY FUND
Return of a $10,000 Investment as of March 31, 2013

Portfolio Composition as of March 31, 2013
Percentage Based on Total Value of Investments
(Portfolio composition is subject to change)

Average Annual Total Return for the Year Ended March 31, 2013*
1 Year | 5 Year | 10 Year | |||||||||||||
| Tributary Core Equity Fund - Institutional Class | 10.72 | % | 2.85 | % | 7.32 | % | |||||||||
Russell 1000 Value Index | 18.77 | % | 4.85 | % | 9.18 | % | |||||||||
S&P 500 Index | 13.96 | % | 5.81 | % | 8.53 | % | |||||||||
Prospectus Expense Ratio (Gross/Net)† | 1.24%/1.12% | ||||||||||||||
| Expense Ratio for the Year Ended March 31, 2013 (Gross/Net) | 1.23%/1.11% | ||||||||||||||
1 Year | Since Inception†† | ||||||||||
| Tributary Core Equity Fund - Institutional Plus Class | 10.85 | % | 7.65 | % | |||||||
Prospectus Expense Ratio (Gross/Net)† | 0.98%/0.86% | ||||||||||
| Expense Ratio for the Year Ended March 31, 2013 (Gross/Net) | 0.98%/0.86% | ||||||||||
Past performance does not guarantee future results. The performance data quoted represents past performance and current returns may be lower or higher. Total return figures include change in share price, reinvestment of dividends and capital gains. The investment return and principal value will fluctuate so that an investor's shares, when redeemed may be worth more or less than the original cost. To obtain performance information current to the most recent month end, please visit our website at www.tributaryfunds.com.
(†)The above expense ratios are from the Fund's prospectus dated August 1, 2012. Net expense ratios are net of contractual waivers which are in effect from August 1, 2012 through July 31, 2013.
(††) Commencement date for the Institutional Plus Class was December 17, 2010.
(*) Returns shown do not reflect the deduction of taxes that a shareholder would pay on Fund distributions or the redemption of Fund shares. The returns for certain periods reflect fee waivers and/or reimbursements in effect for that period; absent fee waivers and reimbursements, performance would have been lower.
The line chart assumes an initial investment of $10,000 made on March 31, 2003. Total return is based on net change in net asset value ("NAV") assuming reinvestment of distributions. Returns shown include the reinvestment of all dividends and other distributions.
The performance of Institutional Plus Class will be different than Institutional Class based on differences in fees borne by each class.
The S&P 500 Index is an index of 500 selected common stocks, most of which are listed on the New York Stock Exchange. The index is heavily weighted toward stocks with large market capitalizations and represents approximately two-thirds of the total market value of all domestic common stocks.
The Russell 1000 Value Index measures the performance of the large-cap value segment of the U.S. equity universe. It includes those Russell 1000 companies with lower price-to-book-value ratios and lower expected growth values.
The above referenced indices are unmanaged and do not reflect the deduction of fees or taxes associated with a mutual fund, such as investment management and fund accounting fees. Investors cannot invest directly in the indices.
ANNUAL REPORT 2013

LARGE CAP GROWTH FUND
Investment Objective
The Tributary Large Cap Growth Fund seeks long-term capital appreciation.
Manager Commentary
In the year just ended, the economy and the financial markets were buffeted by uncertainty emanating from Washington during the Presidential Election year, with a fiscal cliff of large federal tax increases and spending cuts scheduled to take effect at the end of the calendar year. While the election was settled and the tax increases were reduced, the spending cuts did take effect after a three month postponement. This uncertainty combined with very low interest rates drove investors to market sectors with high dividend yields and relative stable business prospects and stock prices, like utilities and telecommunication services. More cyclical and volatile sectors, like information technology ("IT"), suffered in this environment and posted a negative return for the year. Economic growth is expected to continue, but at a tortoise like pace. Fiscal restraint in the form of much higher tax collections, and restraint on the rate of growth in Federal spending, is a headwind for the private sector to overcome, and thus far the private sector remains cautious in their hiring and spending plans. The economy continues to operate below potential. In this environment, we expect companies with reasonable valuations that deliver higher than average earnings growth to do some catching up with those sectors of the market that had exceptionally strong stock performance recently.
For the year ended March 31, 2013, Tributary Large Cap Growth Fund returned 8.00% (Institutional Class at NAV) compared to 10.09% for the Russell 1000 Growth Index. During the past year, the outstanding sector returns in the large cap growth universe were utilities up 27%, healthcare up 26% and telecommunication services up 24%. In the case of utilities and telecommunication services, performance was driven largely by the ample dividend returns these stocks provide, and the quest for investment income in a world of zero interest rate policy. The Large Cap Growth Fund did not own any telecommunications services or utility stocks during the past year, which cost the Fund approximately 0.21% return relative to the Russell 1000 Growth Index, since the large cap growth index has low weightings in these mature, slow growing industries. Healthcare stocks held in the Fund did even better than the index, generating returns of 30.03%, benefitting the Fund by 0.90%. The energy sector generated the next highest returns last year, 19.25%, followed by the financial sector, up 18.32%. The IT sector generated disappointing returns for the year, down 3.66%, but the IT stocks held in the Fund did substantially better, generating a positive 5.49% return and benefitting the Fund relative to the Index by 3.33%. The two sectors that hurt returns for the Fund the
most this year were materials and industrials. Our materials stocks were down 9.30% while materials stocks in the index had a 12.09% return. This cost the Fund 1.29% in relative return. Our industrials stocks returned 3.92%, while the sector returns were 13.84%, costing the Fund 1.50% in relative return.
Individual stocks that helped performance included: Celgene Corp., (+49%), Biogen Idec. Inc. (+52%), Discovery Communications Inc. (+48%), Comcast Corp. (+42%), and Valeant Pharmaceuticals International Inc. (+39%). On the downside: Cliffs Natural Resources Inc. (-42%), Joy Global Inc. (-34%), VMWare Inc. (-29%), Coach Inc. (-8%), Apache Corp. (-26%), Apple Inc. (-25%) and Intel Corp. (-23%).
We have attempted to position the Fund to benefit from our expectations that the U.S. economy will continue to grow at a modest pace, the domestic energy sector will benefit from new technology and manufacturing will experience a renaissance based on stable labor costs and falling energy costs.
ANNUAL REPORT 2013

LARGE CAP GROWTH FUND
Return of a $10,000 Investment as of March 31, 2013

Portfolio Composition as of March 31, 2013
Percentage Based on Total Value of Investments
(Portfolio composition is subject to change)

Average Annual Total Return for the Year Ended March 31, 2013*
1 Year | 5 Year | Since Inception†† | |||||||||||||
| Tributary Large Cap Growth Fund - Institutional Class | 8.00 | % | 4.89 | % | 1.54 | % | |||||||||
Russell 1000 Growth Index | 10.09 | % | 7.30 | % | 10.77 | % | |||||||||
Prospectus Expense Ratio (Gross/Net)† | 1.43%/1.13% | ||||||||||||||
| Expense Ratio for the Year Ended March 31, 2013 (Gross/Net) | 1.44%/1.14% | ||||||||||||||
1 Year | Since Inception†† | ||||||||||
| Tributary Large Cap Growth Fund - Institutional Plus Class | 8.25 | % | 16.07 | % | |||||||
Prospectus Expense Ratio (Gross/Net)† | 1.19%/0.89% | ||||||||||
| Expense Ratio for the Year Ended March 31, 2013 (Gross/Net) | 1.19%/0.89% | ||||||||||
Past performance does not guarantee future results. The performance data quoted represents past performance and current returns may be lower or higher. Total return figures include change in share price, reinvestment of dividends and capital gains. The investment return and principal value will fluctuate so that an investor's shares, when redeemed may be worth more or less than the original cost. To obtain performance information current to the most recent month end, please visit our website at www.tributaryfunds.com.
(†)The above expense ratios are from the Fund's prospectus dated August 1, 2012. Net expense ratio is net of contractual waivers which are in effect from August 1, 2012 through July 31, 2013.
(††) Since July 5, 2007. The Tributary Large Cap Growth Fund was initially offered on July 2, 2007, however, no shareholder activity occurred until July 5, 2007, which is the commencement of operations. Commencement date for the Institutional Plus Class was October 14, 2011.
(*) Returns shown do not reflect the deduction of taxes that a shareholder would pay on Fund distributions or the redemption of Fund shares. The returns for certain periods reflect fee waivers and/or reimbursements in effect for that period; absent fee waivers and reimbursements, performance would have been lower.
The line chart assumes an initial investment of $10,000 made on July 5, 2007. Total return is based on net change in net asset value ("NAV") assuming reinvestment of distributions. Returns shown include the reinvestment of all dividends and other distributions.
The performance of Institutional Plus Class will be different than Institutional Class based on differences in fees borne by each class.
The Russell 1000 Growth Index measures the performance of the large-cap growth segment of the U.S. equity universe. It includes those Russell 1000 companies with higher price-to-book-values ratios and higher forecasted growth values.
The above referenced index is unmanaged and does not reflect the deduction of fees or taxes associated with a mutual fund, such as investment management and fund accounting fees. Investors cannot invest directly in the index.
ANNUAL REPORT 2013

GROWTH OPPORTUNITIES FUND
Investment Objective
The Tributary Growth Opportunities Fund seeks long-term capital appreciation.
Manager Commentary
In the year just ended, the economy and the financial markets were buffeted by uncertainty emanating from Washington during the Presidential Election year, with a fiscal cliff of large federal tax increases and spending cuts scheduled to take effect at the end of the calendar year. While the election was settled and the tax increases were reduced, the spending cuts did take effect after a three month postponement. This uncertainty combined with very low interest rates drove investors to market sectors with high dividend yields and relative stable business prospects and stock prices, like utilities and telecommunications. More cyclical and volatile sectors like information technology ("IT") suffered in this environment and posted a negative return for the year. Economic growth is expected to continue, but at a tortoise like pace. Fiscal restraint in the form of much higher tax collections, and restraint on the rate of growth in Federal spending, is a headwind for the private sector to overcome, and thus far the private sector remains cautious in their hiring and spending plans. The economy continues to operate below potential. In this environment we expect companies with reasonable valuations that deliver higher than average earnings growth to do some catching up with those sectors of the market that had an exceptionally strong first quarter.
For the year ended March 31, 2013, Tributary Growth Opportunities Fund returned 9.79% ( Institutional Class at NAV) compared to 12.76% for the Russell Midcap Growth Index and 13.96% for the S&P 500 Index. During the past year, the outstanding sector returns in the mid cap universe were telecommunication services and utilities, each generating more than 27% returns. No other sector came close. Both of these sectors are mature and slow growing. Performance was driven largely by the ample dividend returns these stocks provide, and the quest for investment income in a world of zero interest rate policy. Tributary Growth Opportunities Fund did not own any telecommunications services or utility stocks during the past year, which cost the Fund approximately 0.60% return relative to the Russell Midcap Growth Index. The financial sector generated the next highest returns last year, 19.75%. The financial stocks held by the Fund did even better, returning more than 31.00%. This outstanding performance benefited returns relative to the benchmark by 0.84%. The IT sector generated disappointing returns for the year, down 0.64%, but the IT stocks held in the Fund did substantially better, generating a positive 15.26% return and benefitting the Fund relative to the index by 2.92%. The two sectors that hurt returns for the Fund the most this year were
materials and cash. Our materials stocks were down 2.45% while materials stocks in the index had a 17% return. This cost the Fund 1.53% in relative return. An average allocation during the year of 4.9% to cash cost the Fund 1.11% in return relative to the benchmark because cash returns were almost nil while the market was up more than 11%.
Individual stocks that helped performance included Portfolio Recovery Associates Inc. (+76%), Genesee & Wyoming Inc. (+70%), HanesBrands Inc. (+54%), Middleby Corp. (+51%), and ValueClick Inc. (+49%). Individual stocks that hindered performance included: Tempur-Pedic International Inc. (-72%), Herbalife Ltd. (-45%), Cliffs Natural Resources Inc. (-43%), Coach Inc. (-35%), and Northern Oil & Gas Inc. (-30%).
The Fund was overweight technology and industrials and underweight consumer discretionary and consumer staples at the end of the period.
ANNUAL REPORT 2013

GROWTH OPPORTUNITIES FUND
Return of a $10,000 Investment as of March 31, 2013

Portfolio Composition as of March 31, 2013
Percentage Based on Total Value of Investments
(Portfolio composition is subject to change)

Average Annual Total Return for the Year Ended March 31, 2013*
1 Year | 5 Year | 10 Year | |||||||||||||
| Tributary Growth Opportunities Fund - Institutional Class | 9.79 | % | 8.95 | % | 11.18 | % | |||||||||
Russell Midcap Growth Index | 12.76 | % | 7.98 | % | 11.53 | % | |||||||||
S&P 500 Index | 13.96 | % | 5.81 | % | 8.53 | % | |||||||||
Prospectus Expense Ratio (Gross/Net)† | 1.28%/1.16% | ||||||||||||||
| Expense Ratio for the Year Ended March 31, 2013 (Gross/Net) | 1.27%/1.15% | ||||||||||||||
1 Year | Since Inception†† | ||||||||||
| Tributary Growth Opportunities Fund - Institutional Plus Class | 10.05 | % | 18.63 | % | |||||||
Prospectus Expense Ratio (Gross/Net)† | 1.06%/0.94% | ||||||||||
| Expense Ratio for the Year Ended March 31, 2013 (Gross/Net) | 1.02%/0.90% | ||||||||||
Past performance does not guarantee future results. The performance data quoted represents past performance and current returns may be lower or higher. Total return figures include change in share price, reinvestment of dividends and capital gains. The investment return and principal value will fluctuate so that an investor's shares, when redeemed may be worth more or less than the original cost. To obtain performance information current to the most recent month end, please visit our website at www.tributaryfunds.com.
(†)The above expense ratios are from the Fund's prospectus dated August 1, 2012. Net expense ratio is net of contractual waivers which are in effect from August 1, 2012 through July 31, 2013.
(††)Commencement date for the Institutional Plus Class was October 14, 2011.
(*) Returns shown do not reflect the deduction of taxes that a shareholder would pay on Fund distributions or the redemption of Fund shares. The returns for certain periods reflect fee waivers and/or reimbursements in effect for that period; absent fee waivers and reimbursements, performance would have been lower.
The line chart assumes an initial investment of $10,000 made on March 31, 2003. Total return is based on net change in net asset value ("NAV") assuming reinvestment of distributions. Returns shown include the reinvestment of all dividends and other distributions.
The performance of Institutional Plus Class will be different than Institutional Class based on differences in fees borne by each class.
The Russell Midcap Growth Index measures the performance of the mid-cap growth segment of the U.S. equity universe. It includes those Russell Midcap Index companies with higher price-to-book-value ratios and higher forecasted growth values.
The Fund's primary index is the Russell Midcap Growth Index, however to provide a broader market comparative we have also listed an additional index.
The S&P 500 Index is an index of 500 selected common stocks, most of which are listed on the New York Stock Exchange. The index is heavily weighted toward stocks with large market capitalizations and represents approximately two-thirds of the total market value of all domestic common stocks.
The above referenced indices are unmanaged and do not reflect the deduction of fees or taxes associated with a mutual fund, such as investment management and fund accounting fees. Investors cannot invest directly in the indices.
ANNUAL REPORT 2013

SMALL COMPANY FUND
Investment Objective
The Tributary Small Company Fund seeks long-term capital appreciation.
Manager Commentary
Small cap stocks have staged an impressive recovery since bottoming out in March of 2009. At of the end of the Tributary Small Company Fund's most recent fiscal year, March 31, 2013, the Russell 2000 Index had reached an all time high level, eclipsing the previous high back in May of 2011. The last 12 months contributed nicely to reaching that new high. The small cap market, represented by the Russell 2000 Index, returned just over 16.30% for the trailing 12 months. Style wise, "value" outperformed "growth" as the Russell 2000 Value Index outperformed the Russell 2000 Growth Index, returning approximately 18.09% and 14.50%, respectively.
It appears that investors prefer to focus on slow, but improving economic statistics in the U.S. economy, versus being concerned about the fiscal and budgetary issues the U.S. Government faces, as well as the lack of economic growth and banking turmoil that still continues to plague Europe. In addition, the markets may be receiving added fuel from the U.S. Federal Reserve's easy monetary policy of buying bonds and keeping interest rates low, thereby helping to drive equity prices higher. Both of these factors contributed to an environment where investors seemingly felt comfortable with assuming higher levels of risk, hence domestic equity markets have performed well.
For the year ended March 31, 2013, Tributary Small Company Fund returned 10.11% (Institutional Class at NAV) compared to 16.30% for the Russell 2000 Index and 18.09% for the Russell 2000 Value Index. The Fund's underperformance relative to the Russell 2000 is due to macro factors that worked against our investment approach and company specific poor performance.
The Fund's weakest relative performance came from portfolio holdings in the financials, energy and materials economic sectors. The financial sector was responsible for approximately half of the underperformance. In the commercial banking industry, the market appeared to favor lower quality banks — those with more problematic loans — over higher quality banks. Our preference is to hold banks in strong geographies, with solid underwriting and relatively high fee income revenue sources. Over the long term, banks with those characteristics will outperform and lower our risk. Real Estate Investment Trusts ("REITs") continued to be an area that investors gravitated to in search of high yields. The REIT sector, as a whole, is richly priced and we remain underweight in that industry group. Lastly, the stock of Meadowbrook Insurance Group Inc. suffered throughout the last year as the
company reassessed some of its book of business and had to add to its reserves several times. As of March 31, 2013, we believe the company has experienced the worst of any adjustments that need to be made and the valuation on Meadowbrook has overly discounted the long term outlook for this business.
In the energy sector, our exploration and production companies underperformed. Due to higher valuations on oil focused companies, we decided to purchase companies with natural gas exposure, but with opportunities to grow their oil production over time. Our thesis was that this gas-to-oil transition would drive a higher valuation for those companies. However, a warm winter in early 2012 and an oversupply negatively impacted natural gas prices lowered revenues, earnings and cash flows at those businesses. In addition, management turnover at both Forest Oil and Bill Barrett led us to sell these companies during the year.
The Fund's underperformance in the materials sector is not surprising. Quantitative easing programs being pursued domestically and internationally have given rise to inflation fears. This has helped to drive up the shares of commodity oriented businesses. Companies held within the Fund typically have very little pure commodity exposure and are more value added manufacturers, which makes their businesses less volatile. Unfortunately, this quarter, our companies were a drag on performance.
Lastly, the Fund's average cash position of approximately 3.5% over the last 12 months negatively impacted performance. In strong markets, any amount of cash will be detrimental to relative performance, and while it is our desire to be fully invested in the market, that small amount of cash still was a hindrance.
On the positive side, there were some notable successes within the portfolio in the last 12 months that are worth mentioning. In the healthcare sector, West Pharmaceuticals Services Inc. and Team Health Holdings Inc. both saw returns in excess of 50% over the last year as fundamentals at both businesses met or exceeded expectations. In the consumer staples sector, Lancaster Colony Corp. and WD-40 Co., two companies with strong brand names in niche markets, considerably outperformed the average consumer staple stock in the Russell 2000 Index. Lastly, Westar Energy Inc. and IDACORP Inc., two conservatively managed utilities, provided total returns in excess of 20% in the last 12 months, beating both the sector return and overall return for the Russell 2000 Index.
As of March 31, 2013, the portfolio held 60 companies diversified across the major sectors of the market. Eight new companies were purchased into the Fund in the past 12 months and 11 positions were eliminated.
ANNUAL REPORT 2013

SMALL COMPANY FUND
Return of a $10,000 Investment as of March 31, 2013

Portfolio Composition as of March 31, 2013
Percentage Based on Total Value of Investments
(Portfolio composition is subject to change)
Average Annual Total Return for the Year Ended March 31, 2013*
1 Year | 5 Year | 10 Year | |||||||||||||
| Tributary Small Company Fund - Institutional Class | 10.11 | % | 9.55 | % | 10.80 | % | |||||||||
Russell 2000 Index | 16.30 | % | 8.24 | % | 11.52 | % | |||||||||
Russell 2000 Value Index | 18.09 | % | 7.29 | % | 11.29 | % | |||||||||
Prospectus Expense Ratio (Gross/Net)† | 1.35%/1.22% | ||||||||||||||
| Expense Ratio for the Year Ended March 31, 2013 (Gross/Net) | 1.35%/1.22% | ||||||||||||||
1 Year | Since Inception†† | ||||||||||
| Tributary Small Company Fund - Institutional Plus Class | 10.43 | % | 9.73 | % | |||||||
Prospectus Expense Ratio (Gross/Net)† | 1.09%/0.96% | ||||||||||
| Expense Ratio for the Year Ended March 31, 2013 (Gross/Net) | 1.10%/0.97% | ||||||||||
Past performance does not guarantee future results. The performance data quoted represents past performance and current returns may be lower or higher. Total return figures include change in share price, reinvestment of dividends and capital gains. The investment return and principal value will fluctuate so that an investor's shares, when redeemed may be worth more or less than the original cost. To obtain performance information current to the most recent month end, please visit our website at www.tributaryfunds.com.
(†)The above expense ratios are from the Fund's prospectus dated August 1, 2012. Net expense ratios are net of contractual waivers which are in effect from August 1, 2012 through July 31, 2013.
(††) Commencement date for the Institutional Plus Class was December 17, 2010.
(*) Returns shown do not reflect the deduction of taxes that a shareholder would pay on Fund distributions or the redemption of Fund shares. The returns for certain periods reflect fee waivers and/or reimbursements in effect for that period; absent fee waivers and reimbursements, performance would have been lower.
The line chart assumes an initial investment of $10,000 made on March 31, 2003. Total return is based on net change in net asset value ("NAV") assuming reinvestment of distributions. Returns shown include the reinvestment of all dividends and other distributions.
The performance of Institutional Plus Class will be different than Institutional Class based on differences in fees borne by the different classes.
The Russell 2000 Index measures the performance of the small-cap segment of the U.S. equity universe. The Russell 2000 Index is a subset of the Russell 3000® Index representing approximately 10% of the total market capitalization of that index. It includes approximately 2000 of the smallest securities based on a combination of their market cap and current index membership.
The Russell 2000 Value Index measures the performance of small-cap value segment of the U.S. equity universe. It includes those Russell 2000 companies with lower price-to-book-value ratios and lower forecasted growth values.
The above referenced indices are unmanaged and do not reflect the deduction of fees or taxes associated with a mutual fund, such as investment management and fund accounting fees. Investors cannot invest directly in the indices.
SCHEDULES OF PORTFOLIO INVESTMENTS
March 31, 2013
SHORT-INTERMEDIATE BOND FUND
Principal |
| Security |
| Value |
| ||
Non-U.S. Government Agency Asset-Backed Securities - 27.2% |
|
|
| ||||
$ | 251,233 |
| Bayview Financial Acquisition Trust REMIC, 6.21%, 05/28/37 (a) |
| $ | 256,041 |
|
295,183 |
| Bear Stearns Asset Backed Securities I Trust REMIC, 0.60%, 10/25/34 (a) |
| 291,360 |
| ||
264,182 |
| Bear Stearns Asset Backed Securities I Trust REMIC, 0.42%, 03/25/35 (a) |
| 260,824 |
| ||
117,447 |
| Bear Stearns Asset Backed Securities I Trust REMIC, 0.42%, 04/25/35 (a) |
| 116,619 |
| ||
570,744 |
| Bear Stearns Commercial Mortgage Securities Trust REMIC, 5.53%, 09/11/41 |
| 595,731 |
| ||
176,517 |
| Chase Funding Mortgage Loan Asset-Backed Certificates REMIC, 4.60%, 01/25/15 |
| 177,859 |
| ||
326,837 |
| Chase Funding Mortgage Loan Asset-Backed Certificates REMIC, 4.27%, 06/25/15 |
| 331,089 |
| ||
338,177 |
| Chase Funding Mortgage Loan Asset-Backed Certificates REMIC, 4.40%, 02/25/30 |
| 338,896 |
| ||
283,300 |
| Chase Mortgage Finance Trust REMIC, 5.50%, 05/25/35 |
| 290,284 |
| ||
184,510 |
| Citicorp Mortgage Securities Pass-Through Certificates Trust REMIC, 5.50%, 04/25/35 |
| 186,029 |
| ||
146,890 |
| Citicorp Mortgage Securities Pass-Through Certificates Trust REMIC, 5.50%, 11/25/35 |
| 147,512 |
| ||
901,531 |
| Citigroup Mortgage Loan Trust Inc. REMIC, 0.35%, 08/25/36 (a) |
| 877,822 |
| ||
388,687 |
| Citigroup Mortgage Loan Trust Inc. REMIC, 0.35%, 10/25/36 (a) |
| 384,453 |
| ||
207,052 |
| Citimortgage Alternative Loan Trust REMIC, 5.25%, 03/25/21 |
| 211,554 |
| ||
341,676 |
| CNL Commercial Mortgage Loan Trust REMIC, 0.64%, 10/25/30 (a) (b) |
| 304,091 |
| ||
66,797 |
| Countrywide Alternative Loan Trust REMIC, 5.29%, 08/25/36 (a) |
| 67,388 |
| ||
136,403 |
| Countrywide Asset-Backed Certificates REMIC, 0.55%, 05/25/29 (a) |
| 135,412 |
| ||
548,663 |
| Countrywide Asset-Backed Certificates REMIC, 4.46%, 09/25/32 (a) |
| 550,808 |
| ||
155,730 |
| Countrywide Asset-Backed Certificates REMIC, 0.44%, 06/25/34 (a) |
| 154,529 |
| ||
468,983 |
| Countrywide Asset-Backed Certificates REMIC, 0.38%, 12/25/34 (a) |
| 455,877 |
| ||
131,853 |
| Credit Suisse First Boston Mortgage Securities Corp. REMIC, 5.00%, 08/25/20 |
| 134,309 |
| ||
307,709 |
| Credit-Based Asset Servicing and Securitization LLC REMIC, 1.33%, 08/25/32 (a) |
| 278,621 |
| ||
4,203 |
| FBR Securitization Trust REMIC, 0.45%, 11/25/35 (a) |
| 4,201 |
| ||
654,354 |
| Fremont Home Loan Trust REMIC, 1.07%, 11/25/34 (a) |
| 607,210 |
| ||
650,000 |
| Goldman Sachs Alternative Mortgage Products Trust REMIC, 0.85%, 03/25/34 (a) |
| 642,765 |
| ||
800,000 |
| GS Mortgage Securities Corp. II REMIC, 3.65%, 03/11/44 (b) |
| 856,870 |
| ||
33,405 |
| Home Equity Asset Trust REMIC, 0.31%, 07/25/37 (a) |
| 33,158 |
| ||
392,525 |
| Irwin Whole Loan Home Equity Trust REMIC, 1.30%, 11/25/28 (a) |
| 392,431 |
| ||
895,000 |
| Long Beach Mortgage Loan Trust REMIC, 1.10%, 10/25/34 (a) |
| 822,181 |
| ||
450,000 |
| Long Beach Mortgage Loan Trust REMIC, 0.94%, 04/25/35 (a) |
| 444,383 |
| ||
113,227 |
| MASTR Asset Securitization Trust REMIC, 5.25%, 11/25/35 |
| 114,845 |
| ||
300,000 |
| Morgan Stanley Capital I Trust REMIC, 3.22%, 07/16/49 |
| 320,954 |
| ||
566,670 |
| Morgan Stanley Home Equity Loan Trust REMIC, 0.91%, 12/25/34 (a) |
| 556,011 |
| ||
243,854 |
| Nomura Asset Acceptance Corp. Alternative Loan Trust REMIC, 6.00%, 03/25/47 (a) |
| 175,816 |
| ||
493,711 |
| Option One Mortgage Loan Trust Asset-Backed Certificates REMIC, 0.41%, 12/25/35 (a) |
| 485,697 |
| ||
475,454 |
| Origen Manufactured Housing Contract Trust, 5.91%, 01/15/35 |
| 511,256 |
| ||
437,458 |
| Popular ABS Mortgage Pass-Through Trust REMIC, 4.61%, 05/25/35 (a) |
| 446,033 |
| ||
56,882 |
| Popular ABS Mortgage Pass-Through Trust REMIC, 4.62%, 05/25/35 (a) |
| 57,192 |
| ||
539,787 |
| Preferred Term Securities XXIV Inc., 0.58%, 03/22/37 (a) (b) (c) |
| 345,463 |
| ||
417,364 |
| RAAC Trust REMIC, 0.37%, 08/25/36 (a) |
| 412,653 |
| ||
403,184 |
| Renaissance Home Equity Loan Trust REMIC, 4.50%, 08/25/35 |
| 404,509 |
| ||
260,319 |
| Residential Accredit Loans Inc. Trust REMIC, 5.50%, 01/25/34 |
| 266,745 |
| ||
455,172 |
| Residential Accredit Loans Inc. Trust REMIC, 5.50%, 05/25/34 |
| 463,673 |
| ||
98,952 |
| Residential Accredit Loans Inc. Trust REMIC, 6.00%, 10/25/34 |
| 105,399 |
| ||
256,733 |
| Residential Accredit Loans Inc. Trust REMIC, 5.50%, 02/25/35 |
| 254,118 |
| ||
See accompanying Notes to Financial Statements.
Principal |
| Security |
| Value |
| ||
$ | 850,000 |
| Residential Asset Mortgage Products Inc. Trust REMIC, 0.71%, 06/25/35 (a) |
| $ | 769,463 |
|
206,613 |
| Residential Asset Mortgage Products Inc. Trust (insured by AMBAC Assurance Corp.) REMIC, 4.02%, 03/25/33 |
| 200,044 |
| ||
404,655 |
| Residential Asset Securities Corp. Trust REMIC, 5.96%, 09/25/31 |
| 416,623 |
| ||
363,031 |
| Residential Asset Securities Corp. Trust REMIC, 3.77%, 01/25/32 (a) |
| 366,119 |
| ||
387,826 |
| Residential Asset Securities Corp. Trust REMIC, 4.47%, 03/25/32 |
| 400,769 |
| ||
235,459 |
| Residential Asset Securities Corp. Trust REMIC, 3.87%, 06/25/33 |
| 229,988 |
| ||
231,299 |
| Residential Asset Securities Corp. Trust REMIC, 4.54%, 12/25/33 |
| 240,552 |
| ||
175,674 |
| Residential Asset Securities Corp. Trust REMIC, 0.39%, 03/25/35 (a) |
| 174,560 |
| ||
469,352 |
| SACO I Trust REMIC, 0.76%, 11/25/35 (a) |
| 463,067 |
| ||
364,995 |
| Springleaf Mortgage Loan Trust REMIC, 4.05%, 01/25/58 (a) (b) |
| 377,974 |
| ||
75,777 |
| Structured Asset Securities Corp. Mortgage Loan Trust REMIC, 4.79%, 03/25/35 |
| 75,668 |
| ||
422,781 |
| Terwin Mortgage Trust REMIC, 3.13%, 11/25/35 (a) |
| 422,746 |
| ||
145,765 |
| Vanderbilt Mortgage & Finance REMIC, 6.57%, 08/07/24 |
| 151,799 |
| ||
710,934 |
| Wachovia Bank Commercial Mortgage Trust REMIC, 5.08%, 03/15/42 (a) |
| 760,380 |
| ||
280,000 |
| Wells Fargo Commercial Mortgage Trust REMIC, 2.53%, 10/17/45 |
| 285,572 |
| ||
280,559 |
| Wells Fargo Home Equity Asset-Backed Securities Trust REMIC, 0.58%, 12/25/35 (a) |
| 276,093 |
| ||
235,584 |
| Wells Fargo Home Equity Asset-Backed Securities Trust REMIC, 0.34%, 07/25/36 (a) |
| 232,864 |
| ||
330,406 |
| Wells Fargo Mortgage Backed Securities Trust REMIC, 5.00%, 02/25/19 |
| 337,399 |
| ||
|
|
|
|
|
| ||
Total Non-U.S. Government Agency Asset-Backed Securities (cost $20,776,646) |
| 21,452,351 |
| ||||
|
|
|
|
|
| ||
Corporate Bonds - 30.3% |
|
|
| ||||
Consumer Discretionary - 3.0% |
|
|
| ||||
670,000 |
| DIRECTV Holdings LLC, 2.40%, 03/15/17 |
| 687,194 |
| ||
300,000 |
| Goodyear Tire & Rubber Co., 6.50%, 03/01/21 |
| 309,375 |
| ||
285,000 |
| Hanesbrands Inc., 6.38%, 12/15/20 |
| 310,294 |
| ||
520,000 |
| Maytag Corp., 5.00%, 05/15/15 |
| 549,429 |
| ||
375,000 |
| Mohawk Industries Inc., 6.38%, 01/15/16 (d) |
| 418,594 |
| ||
125,000 |
| Newell Rubbermaid Inc., 2.05%, 12/01/17 |
| 125,692 |
| ||
|
|
|
| 2,400,578 |
| ||
Consumer Staples - 1.3% |
|
|
| ||||
585,000 |
| Church & Dwight Co. Inc., 3.35%, 12/15/15 |
| 618,053 |
| ||
395,000 |
| Land O’Lakes Capital Trust I, 7.45%, 03/15/28 (b) |
| 393,025 |
| ||
|
|
|
| 1,011,078 |
| ||
Energy - 2.1% |
|
|
| ||||
615,000 |
| ConocoPhillips, 4.60%, 01/15/15 |
| 658,839 |
| ||
460,000 |
| Enterprise Products Operating LLC, 9.75%, 01/31/14 |
| 494,234 |
| ||
500,000 |
| Occidental Petroleum Corp., 1.75%, 02/15/17 |
| 514,090 |
| ||
|
|
|
| 1,667,163 |
| ||
Financials - 16.2% |
|
|
| ||||
580,000 |
| ACE INA Holdings Inc., 5.60%, 05/15/15 |
| 639,009 |
| ||
710,000 |
| American Express Bank FSB, 0.50%, 06/12/17 (a) |
| 704,140 |
| ||
525,000 |
| American Honda Finance Corp., 1.50%, 09/11/17 (b) |
| 529,400 |
| ||
665,000 |
| Bank of America Corp., 3.75%, 07/12/16 |
| 707,271 |
| ||
650,000 |
| Berkshire Hathaway Inc., 1.90%, 01/31/17 |
| 670,534 |
| ||
565,000 |
| Caterpillar Financial Services Corp., 1.63%, 06/01/17 |
| 575,062 |
| ||
710,000 |
| Citigroup Inc., 4.45%, 01/10/17 |
| 781,665 |
| ||
320,000 |
| General Electric Capital Corp., 0.54%, 09/15/14 (a) |
| 320,164 |
| ||
290,000 |
| General Electric Capital Corp., 0.57%, 08/07/18 (a) |
| 284,907 |
| ||
270,000 |
| Genworth Financial Inc., 7.63%, 09/24/21 |
| 325,206 |
| ||
520,000 |
| Hartford Financial Services Group Inc., 4.00%, 10/15/17 |
| 575,923 |
| ||
605,000 |
| JPMorgan Chase & Co., 7.90% (callable at 100 beginning 04/30/18) (e) |
| 695,042 |
| ||
510,000 |
| KeyBank NA, 4.95%, 09/15/15 |
| 555,439 |
| ||
660,000 |
| Metropolitan Life Global Funding I, 1.70%, 06/29/15 (b) |
| 673,952 |
| ||
730,000 |
| Morgan Stanley, 3.80%, 04/29/16 |
| 774,475 |
| ||
640,000 |
| Murray Street Investment Trust I, 4.65%, 03/09/17 |
| 699,839 |
| ||
650,000 |
| PNC Funding Corp., 0.50%, 01/31/14 (a) |
| 650,547 |
| ||
See accompanying Notes to Financial Statements.
Principal |
| Security |
| Value |
| ||
$ | 670,000 |
| Pricoa Global Funding I, 0.49%, 06/24/16 (a) (b) |
| $ | 659,163 |
|
495,000 |
| Regions Financial Corp., 7.75%, 11/10/14 |
| 545,728 |
| ||
650,000 |
| State Street Bank & Trust Co., 0.48%, 12/08/15 (a) |
| 644,848 |
| ||
655,000 |
| Wells Fargo & Co., 7.98% (callable at 100 beginning 03/15/18) (e) |
| 755,706 |
| ||
|
|
|
| 12,768,020 |
| ||
Industrials - 2.3% |
|
|
| ||||
495,000 |
| Textron Inc., 6.20%, 03/15/15 |
| 539,180 |
| ||
495,000 |
| Union Pacific Corp., 5.70%, 08/15/18 |
| 597,405 |
| ||
590,000 |
| United Technologies Corp., 5.38%, 12/15/17 |
| 699,705 |
| ||
|
|
|
| 1,836,290 |
| ||
Information Technology - 2.3% |
|
|
| ||||
525,000 |
| CA Inc., 6.13%, 12/01/14 |
| 568,333 |
| ||
590,000 |
| Intel Corp., 1.35%, 12/15/17 |
| 592,009 |
| ||
600,000 |
| International Business Machines Corp., 2.00%, 01/05/16 |
| 622,016 |
| ||
|
|
|
| 1,782,358 |
| ||
Materials - 1.3% |
|
|
| ||||
480,000 |
| Praxair Inc., 3.95%, 06/01/13 |
| 482,766 |
| ||
475,000 |
| Rio Tinto Finance USA Ltd., 8.95%, 05/01/14 (d) |
| 516,749 |
| ||
|
|
|
| 999,515 |
| ||
Utilities - 1.8% |
|
|
| ||||
400,000 |
| Dayton Power & Light Co., 5.13%, 10/01/13 |
| 408,806 |
| ||
565,000 |
| Georgia Power Co., 3.00%, 04/15/16 |
| 602,106 |
| ||
416,000 |
| PacifiCorp, 5.45%, 09/15/13 |
| 425,354 |
| ||
|
|
|
| 1,436,266 |
| ||
Total Corporate Bonds (cost $22,978,145) |
| 23,901,268 |
| ||||
|
|
|
| ||||
Government and Agency Obligations - 37.6% |
|
|
| ||||
GOVERNMENT SECURITIES - 32.3% |
|
|
| ||||
Federal Home Loan Mortgage Corp. - 0.5% |
|
|
| ||||
350,000 |
| Federal Home Loan Mortgage Corp., 4.50%, 07/15/13 (f) |
| 354,543 |
| ||
|
|
|
|
|
| ||
Municipals - 2.5% |
|
|
| ||||
455,000 |
| City of Indianapolis, Indiana, 0.63%, 07/01/14 |
| 455,118 |
| ||
165,000 |
| City of Lincoln, Nebraska, 4.25%, 11/01/14 |
| 171,626 |
| ||
380,000 |
| City of Omaha, Nebraska, RB, 2.40%, 12/01/16 |
| 396,462 |
| ||
600,000 |
| New York City Transitional Finance Authority, 3.02%, 02/01/16 |
| 632,670 |
| ||
|
|
|
|
|
| ||
Shares or |
|
|
|
|
| ||
$ | 325,000 |
| State of Mississippi, 2.63%, 11/01/16 |
| 346,174 |
| |
|
|
|
| 2,002,050 |
| ||
Treasury Inflation Index Securities - 0.9% |
|
|
| ||||
704,207 |
| U.S. Treasury Inflation Indexed Note, 0.13%, 04/15/16 (g) |
| 748,110 |
| ||
|
|
|
|
|
| ||
U.S. Treasury Securities - 28.4% |
|
|
| ||||
5,200,000 |
| U.S. Treasury Note, 0.25%, 09/30/14 |
| 5,202,642 |
| ||
5,600,000 |
| U.S. Treasury Note, 0.25%, 12/15/15 |
| 5,588,189 |
| ||
2,540,000 |
| U.S. Treasury Note, 1.75%, 05/31/16 |
| 2,647,950 |
| ||
8,950,000 |
| U.S. Treasury Note, 0.63%, 09/30/17 |
| 8,932,521 |
| ||
|
|
|
| 22,371,302 |
| ||
U.S. GOVERNMENT MORTGAGE-BACKED SECURITIES - 5.3% |
|
|
| ||||
Federal Home Loan Mortgage Corp. - 1.3% |
|
|
| ||||
546,300 |
| Federal Home Loan Mortgage Corp. REMIC, 4.00%, 03/15/20 |
| 577,750 |
| ||
450,000 |
| Federal Home Loan Mortgage Corp. REMIC, 4.00%, 02/15/27 |
| 464,057 |
| ||
|
|
|
| 1,041,807 |
| ||
Federal National Mortgage Association - 4.0% |
|
|
| ||||
588,063 |
| Federal National Mortgage Association REMIC, 4.50%, 08/25/21 |
| 611,889 |
| ||
265,202 |
| Federal National Mortgage Association REMIC, 4.50%, 11/25/23 |
| 274,404 |
| ||
584,526 |
| Federal National Mortgage Association REMIC, 4.00%, 02/25/26 |
| 622,079 |
| ||
929,231 |
| Federal National Mortgage Association, 3.00%, 10/01/26 |
| 977,957 |
| ||
607,016 |
| Federal National Mortgage Association REMIC, 3.00%, 04/25/37 |
| 627,715 |
| ||
594,850 |
| Federal National Mortgage Association, Interest Only REMIC, 5.00%, 03/25/39 |
| 47,786 |
| ||
|
|
|
| 3,161,830 |
| ||
Total Government and Agency Obligations (cost $29,593,323) |
| 29,679,642 |
| ||||
|
|
|
|
|
| ||
Preferred Stocks - 0.7% |
|
|
| ||||
550 |
| U.S. Bancorp, Series A, 3.50% (callable at 1,000 beginning on 05/06/13) (e) |
| 504,900 |
| ||
|
|
|
|
|
| ||
Total Preferred Stocks (cost $564,328) |
| 504,900 |
| ||||
See accompanying Notes to Financial Statements.
Shares |
| Security |
| Value |
| |
Short Term Investments - 4.6% |
|
|
| |||
Investment Company - 4.6% |
|
|
| |||
3,647,569 |
| Goldman Sachs Financial Square Funds, Treasury Obligations Fund, 0.01% (h) |
| $ | 3,647,569 |
|
|
|
|
|
|
| |
Total Short Term Investments (cost $3,647,569) |
| 3,647,569 |
| |||
Total Investments - 100.4% (cost $77,560,011) |
| 79,185,730 |
| |||
Liabilities in excess of other assets - (0.4%) |
| (301,551 | ) | |||
Net Assets - 100% |
| $ | 78,884,179 |
| ||
(a) |
| Variable rate security. The rate reflected is the rate in effect at March 31, 2013. |
(b) |
| Rule 144A, Section 4(2) of the Securities Act of 1933 or other security which is restricted to resale to institutional investors. The Fund’s investment adviser has deemed these securities to be liquid based on procedures approved by Tributary Funds’ Board of Directors. |
(c) |
| Security fair valued in good faith in accordance with the procedures established by the Tributary Funds’ Board of Directors. Good faith fair valued securities may be classified as Level 2 or Level 3 for Financial Accounting Standards Board (“FASB”) Accounting Standards Codification (“ASC”) Topic 820 “Fair Value Measurements and Disclosures” based on the applicable valuation inputs. See Security Valuation in the Notes to Financial Statements. |
(d) |
| The interest rate for this security is inversely affected by upgrades or downgrades to the credit rating of the issuer. |
(e) |
| Perpetual maturity security. |
(f) |
| This security is a direct debt of the agency and not collateralized by mortgages. |
(g) |
| U.S. Treasury inflation indexed note, par amount is adjusted for inflation. |
(h) |
| Dividend yield changes daily to reflect current market conditions. Rate was the quoted yield as of March 31, 2013. |
|
|
|
AMBAC |
| AMBAC Indemnity Corp. |
RB |
| Revenue Bond |
REMIC |
| Real Estate Mortgage Investment Conduit |
See accompanying Notes to Financial Statements.
SCHEDULES OF PORTFOLIO INVESTMENTS
March 31, 2013
INCOME FUND
Principal |
| Security |
| Value |
| ||
Non-U.S. Government Agency Asset-Backed Securities - 27.0% |
|
|
| ||||
$ | 1,348,000 |
| Banc of America Commercial Mortgage Inc. REMIC, 5.19%, 09/10/47 (a) |
| $ | 1,479,984 |
|
349,446 |
| Bear Stearns Asset Backed Securities Trust REMIC, 5.50%, 10/25/33 (a) |
| 365,267 |
| ||
641,286 |
| Bear Stearns Commercial Mortgage Securities Trust REMIC, 5.53%, 09/11/41 |
| 669,361 |
| ||
685,000 |
| Cabela’s Master Credit Card Trust, 2.71%, 02/17/26 (b) |
| 684,957 |
| ||
321,073 |
| Chase Mortgage Finance Trust REMIC, 5.50%, 05/25/35 |
| 328,988 |
| ||
146,890 |
| Citicorp Mortgage Securities Pass-Through Certificates Trust REMIC, 5.50%, 11/25/35 |
| 147,512 |
| ||
619,359 |
| Citigroup Mortgage Loan Trust Inc. REMIC, 6.50%, 07/25/34 |
| 648,744 |
| ||
948,980 |
| Citigroup Mortgage Loan Trust Inc. REMIC, 0.35%, 08/25/36 (a) |
| 924,023 |
| ||
308,956 |
| Citigroup Mortgage Loan Trust Inc. REMIC, 0.35%, 10/25/36 (a) |
| 305,591 |
| ||
207,052 |
| Citimortgage Alternative Loan Trust REMIC, 5.25%, 03/25/21 |
| 211,554 |
| ||
347,015 |
| CNL Commercial Mortgage Loan Trust REMIC, 0.64%, 10/25/30 (a) (b) |
| 308,843 |
| ||
66,797 |
| Countrywide Alternative Loan Trust REMIC, 5.29%, 08/25/36 (a) |
| 67,388 |
| ||
421,680 |
| Countrywide Asset-Backed Certificates REMIC, 4.46%, 09/25/32 (a) |
| 423,328 |
| ||
83,904 |
| Countrywide Asset-Backed Certificates REMIC, 0.44%, 06/25/34 (a) |
| 83,257 |
| ||
294,108 |
| Countrywide Asset-Backed Certificates REMIC, 0.38%, 12/25/34 (a) |
| 285,889 |
| ||
131,853 |
| Credit Suisse First Boston Mortgage Securities Corp. REMIC, 5.00%, 08/25/20 |
| 134,309 |
| ||
184,562 |
| Credit Suisse First Boston Mortgage Securities Corp. REMIC, 5.75%, 04/25/33 |
| 194,356 |
| ||
307,709 |
| Credit-Based Asset Servicing and Securitization LLC REMIC, 1.33%, 08/25/32 (a) |
| 278,621 |
| ||
408,476 |
| Credit-Based Asset Servicing and Securitization LLC REMIC, 5.75%, 12/25/37 (a) |
| 413,051 |
| ||
17,530 |
| FBR Securitization Trust REMIC, 0.45%, 11/25/35 (a) |
| 17,520 |
| ||
500,000 |
| Goldman Sachs Alternative Mortgage Products Trust REMIC, 0.85%, 03/25/34 (a) |
| 494,434 |
| ||
575,000 |
| GS Mortgage Securities Corp. II REMIC, 3.65%, 03/11/44 (b) |
| 615,876 |
| ||
29,257 |
| Home Equity Asset Trust REMIC, 0.31%, 07/25/37 (a) |
| 29,041 |
| ||
408,547 |
| Irwin Whole Loan Home Equity Trust REMIC, 1.30%, 11/25/28 (a) |
| 408,449 |
| ||
104,517 |
| MASTR Asset Securitization Trust REMIC, 5.25%, 11/25/35 |
| 106,011 |
| ||
825,000 |
| Morgan Stanley Capital I Trust REMIC, 3.22%, 07/15/49 |
| 882,623 |
| ||
264,175 |
| Nomura Asset Acceptance Corp. Alternative Loan Trust REMIC, 6.00%, 03/25/47 (a) |
| 190,467 |
| ||
300,000 |
| Novastar Home Equity Loan REMIC, 1.85%, 03/25/35 (a) |
| 289,510 |
| ||
538,594 |
| Option One Mortgage Loan Trust Asset-Backed Certificates REMIC, 0.41%, 12/25/35 (a) |
| 529,851 |
| ||
581,110 |
| Origen Manufactured Housing Contract Trust, 5.91%, 01/15/35 |
| 624,869 |
| ||
106,970 |
| Park Place Securities Inc. REMIC, 0.82%, 10/25/34 (a) |
| 106,796 |
| ||
1,046,858 |
| Preferred Term Securities XXI Inc., 0.93%, 03/22/38 (a) (b) (c) (d) |
| 235,543 |
| ||
527,702 |
| Preferred Term Securities XXIV Inc., 0.58%, 03/22/37 (a) (b) (c) |
| 337,729 |
| ||
523,519 |
| RAAC Trust REMIC, 0.37%, 08/25/36 (a) |
| 517,611 |
| ||
272,420 |
| Residential Accredit Loans Inc. Trust REMIC, 5.50%, 01/25/34 |
| 279,145 |
| ||
273,103 |
| Residential Accredit Loans Inc. Trust REMIC, 5.50%, 05/25/34 |
| 278,204 |
| ||
488,653 |
| Residential Accredit Loans Inc. Trust REMIC, 6.00%, 10/25/34 |
| 520,490 |
| ||
172,946 |
| Residential Accredit Loans Inc. Trust REMIC, 5.50%, 02/25/35 |
| 171,184 |
| ||
518,019 |
| Residential Asset Mortgage Products Inc. Trust REMIC, 5.63%, 01/25/34 |
| 546,387 |
| ||
870,000 |
| Residential Asset Mortgage Products Inc. Trust REMIC, 0.71%, 06/25/35 (a) |
| 787,567 |
| ||
253,795 |
| Residential Asset Mortgage Products Inc. Trust (insured by AMBAC Assurance Corp.) REMIC, 4.02%, 03/25/33 |
| 245,726 |
| ||
339,910 |
| Residential Asset Securities Corp. Trust REMIC, 5.96%, 09/25/31 |
| 349,963 |
| ||
360,768 |
| Residential Asset Securities Corp. Trust REMIC, 4.47%, 03/25/32 |
| 372,808 |
| ||
231,299 |
| Residential Asset Securities Corp. Trust REMIC, 4.54%, 12/25/33 |
| 240,552 |
| ||
469,353 |
| SACO I Trust REMIC, 0.76%, 11/25/35 (a) |
| 463,067 |
| ||
See accompanying Notes to Financial Statements.
Principal |
| Security |
| Value |
| ||
$ | 366,580 |
| Structured Asset Securities Corp. REMIC, 1.25%, 11/25/34 (a) |
| $ | 339,421 |
|
132,437 |
| Structured Asset Securities Corp. (insured by MBIA Assurance Corp.) REMIC, 5.30%, 09/25/33 (a) |
| 134,077 |
| ||
353,773 |
| Vanderbilt Mortgage & Finance Inc., 5.84%, 02/07/26 |
| 364,380 |
| ||
630,000 |
| Wells Fargo Commercial Mortgage Trust REMIC, 2.53%, 10/17/45 |
| 642,537 |
| ||
529,302 |
| Wells Fargo Home Equity Asset-Backed Securities Trust REMIC, 0.58%, 12/25/35 (a) |
| 520,877 |
| ||
141,263 |
| Wells Fargo Home Equity Asset-Backed Securities Trust REMIC, 0.34%, 07/25/36 (a) |
| 139,633 |
| ||
421,268 |
| Wells Fargo Mortgage Backed Securities Trust REMIC, 5.00%, 02/25/19 |
| 430,183 |
| ||
316,147 |
| Wells Fargo Mortgage Backed Securities Trust REMIC, 5.00%, 11/25/36 |
| 325,884 |
| ||
625,000 |
| Wells Fargo-RBS Commercial Mortgage Trust REMIC, 2.63%, 03/17/45 |
| 637,699 |
| ||
430,000 |
| Wells Fargo-RBS Commercial Mortgage Trust REMIC, 2.19%, 04/15/45 |
| 445,597 |
| ||
|
|
|
|
|
| ||
Total Non-U.S. Government Agency Asset-Backed Securities (cost $21,435,806) |
| 21,576,734 |
| ||||
|
|
|
|
|
| ||
Corporate Bonds - 22.9% |
|
|
| ||||
Consumer Discretionary - 2.8% |
|
|
| ||||
430,000 |
| DIRECTV Holdings LLC, 3.80%, 03/15/22 |
| 439,534 |
| ||
300,000 |
| Goodyear Tire & Rubber Co., 6.50%, 03/01/21 |
| 309,375 |
| ||
290,000 |
| Hanesbrands Inc., 6.38%, 12/15/20 |
| 315,737 |
| ||
325,000 |
| Mohawk Industries Inc., 6.38%, 01/15/16 (e) |
| 362,781 |
| ||
360,000 |
| Newell Rubbermaid Inc., 4.70%, 08/15/20 |
| 399,441 |
| ||
355,000 |
| Whirlpool Corp., 4.85%, 06/15/21 |
| 390,776 |
| ||
|
|
|
| 2,217,644 |
| ||
Consumer Staples - 1.9% |
|
|
| ||||
255,000 |
| Church & Dwight Co. Inc., 3.35%, 12/15/15 |
| 269,408 |
| ||
405,000 |
| Land O’Lakes Capital Trust I, 7.45%, 03/15/28 (b) |
| 402,975 |
| ||
395,000 |
| PepsiCo Inc., 4.88%, 11/01/40 |
| 443,162 |
| ||
340,000 |
| Wal-Mart Stores Inc., 5.63%, 04/15/41 |
| 425,260 |
| ||
|
|
|
| 1,540,805 |
| ||
Energy - 1.0% |
|
|
| ||||
335,000 |
| Enterprise Products Operating LLC, 6.30%, 09/15/17 |
| 402,605 |
| ||
270,000 |
| Tosco Corp., 8.13%, 02/15/30 |
| 395,041 |
| ||
|
|
|
| 797,646 |
| ||
Financials - 10.2% |
|
|
| ||||
325,000 |
| ACE INA Holdings Inc., 5.90%, 06/15/19 |
| 403,370 |
| ||
390,000 |
| American Express Co., 6.80%, 09/01/66 (a) |
| 420,225 |
| ||
395,000 |
| American Honda Finance Corp., 1.50%, 09/11/17 (b) |
| 398,311 |
| ||
405,000 |
| Bank of America Corp., 5.65%, 05/01/18 |
| 468,507 |
| ||
285,000 |
| Chubb Corp., 6.80%, 11/15/31 |
| 378,704 |
| ||
435,000 |
| Citigroup Inc., 4.45%, 01/10/17 |
| 478,907 |
| ||
415,000 |
| General Electric Capital Corp., 6.38%, 11/15/67 (a) |
| 439,900 |
| ||
285,000 |
| Genworth Financial Inc., 7.63%, 09/24/21 |
| 343,273 |
| ||
435,000 |
| Goldman Sachs Capital I, 6.35%, 02/15/34 |
| 453,217 |
| ||
395,000 |
| Hartford Financial Services Group Inc., 4.00%, 10/15/17 |
| 437,480 |
| ||
395,000 |
| JPMorgan Chase & Co., 7.90% (callable at 100 beginning 04/30/18) (f) |
| 453,787 |
| ||
311,000 |
| KeyBank NA, 4.95%, 09/15/15 |
| 338,709 |
| ||
405,000 |
| Metropolitan Life Global Funding I, 1.70%, 06/29/15 (b) |
| 413,561 |
| ||
445,000 |
| Morgan Stanley, 3.80%, 04/29/16 |
| 472,111 |
| ||
375,000 |
| PNC Funding Corp., 0.50%, 01/31/14 (a) |
| 375,316 |
| ||
285,000 |
| Prudential Financial Inc., 7.38%, 06/15/19 |
| 365,930 |
| ||
310,000 |
| Regions Financial Corp., 7.75%, 11/10/14 |
| 341,769 |
| ||
375,000 |
| State Street Bank & Trust Co., 0.48%, 12/08/15 (a) |
| 372,028 |
| ||
353,000 |
| UBS Preferred Funding Trust V, 6.24% (callable at 100 beginning 05/15/16) (f) |
| 364,914 |
| ||
410,000 |
| Wells Fargo & Co., Series A, 7.98% (callable at 100 beginning 03/15/18) (f) |
| 473,037 |
| ||
|
|
|
| 8,193,056 |
| ||
Health Care - 0.3% |
|
|
| ||||
160,000 |
| Pfizer Inc., 6.20%, 03/15/19 |
| 200,837 |
| ||
|
|
|
|
|
| ||
Industrials - 1.4% |
|
|
| ||||
345,000 |
| Textron Inc., 6.20%, 03/15/15 |
| 375,792 |
| ||
335,000 |
| Union Pacific Corp., 5.70%, 08/15/18 |
| 404,305 |
| ||
285,000 |
| United Technologies Corp., 6.13%, 07/15/38 |
| 370,996 |
| ||
|
|
|
| 1,151,093 |
| ||
See accompanying Notes to Financial Statements.
Principal |
| Security |
| Value |
| ||
Information Technology - 2.1% |
|
|
| ||||
$ | 345,000 |
| CA Inc., 6.13%, 12/01/14 |
| $ | 373,476 |
|
415,000 |
| Intel Corp., 2.70%, 12/15/22 |
| 411,172 |
| ||
360,000 |
| International Business Machines Corp., 5.60%, 11/30/39 |
| 448,400 |
| ||
420,000 |
| Motorola Solutions Inc., 3.75%, 05/15/22 |
| 430,136 |
| ||
|
|
|
| 1,663,184 |
| ||
Materials - 1.8% |
|
|
| ||||
405,000 |
| Dow Chemical Co., 4.25%, 11/15/20 |
| 444,757 |
| ||
305,000 |
| Martin Marietta Materials Inc., 6.60%, 04/15/18 |
| 346,175 |
| ||
343,000 |
| Mosaic Co., 3.75%, 11/15/21 |
| 361,091 |
| ||
295,000 |
| Rio Tinto Finance USA Ltd., 8.95%, 05/01/14 (e) |
| 320,928 |
| ||
|
|
|
| 1,472,951 |
| ||
Utilities - 1.4% |
|
|
| ||||
315,000 |
| Alabama Power Co., 5.50%, 10/15/17 |
| 372,982 |
| ||
300,000 |
| Dayton Power & Light Co., 5.13%, 10/01/13 |
| 306,604 |
| ||
300,000 |
| PacifiCorp, 6.25%, 10/15/37 |
| 400,317 |
| ||
|
|
|
| 1,079,903 |
| ||
Total Corporate Bonds (cost $17,298,682) |
| 18,317,119 |
| ||||
|
|
|
|
|
| ||
Government and Agency Obligations - 44.0% |
|
|
| ||||
GOVERNMENT SECURITIES - 23.2% |
|
|
| ||||
Municipals - 2.0% |
|
|
| ||||
325,000 |
| New York City Municipal Water Finance Authority, 5.72%, 06/15/42 |
| 419,321 |
| ||
215,000 |
| State of Connecticut, 4.95%, 12/01/20 |
| 257,933 |
| ||
215,000 |
| State of Connecticut, 5.63%, 12/01/29 |
| 269,208 |
| ||
240,000 |
| University of Michigan, 6.01%, 04/01/25 |
| 285,142 |
| ||
350,000 |
| University of Nebraska, RB, Series B, 5.70%, 07/01/29 |
| 381,612 |
| ||
|
|
|
| 1,613,216 |
| ||
Treasury Inflation Index Securities - 0.5% |
|
|
| ||||
351,013 |
| U.S. Treasury Inflation Indexed Note, 0.13%, 01/15/22 (g) |
| 381,919 |
| ||
|
|
|
|
|
| ||
U.S. Treasury Securities - 20.7% |
|
|
| ||||
755,000 |
| U.S. Treasury Bond, 5.38%, 02/15/31 |
| 1,050,276 |
| ||
1,835,000 |
| U.S. Treasury Bond, 4.38%, 11/15/39 |
| 2,299,484 |
| ||
1,800,000 |
| U.S. Treasury Note, 0.25%, 09/30/14 |
| 1,800,915 |
| ||
2,900,000 |
| U.S. Treasury Note, 3.38%, 11/15/19 |
| 3,319,595 |
| ||
8,200,000 |
| U.S. Treasury Note, 1.63%, 11/15/22 |
| 8,054,581 |
| ||
|
|
|
| 16,524,851 |
| ||
U.S. GOVERNMENT MORTGAGE-BACKED SECURITIES - 20.8% |
|
|
| ||||
Federal Home Loan Mortgage Corp. - 7.5% |
|
|
| ||||
1,089,129 |
| Federal Home Loan Mortgage Corp. REMIC, 4.50%, 04/15/19 |
| 1,156,976 |
| ||
1,244,000 |
| Federal Home Loan Mortgage Corp. REMIC, 4.50%, 06/15/21 |
| 1,394,891 |
| ||
700,000 |
| Federal Home Loan Mortgage Corp. REMIC, 4.00%, 02/15/27 |
| 721,866 |
| ||
1,378,119 |
| Federal Home Loan Mortgage Corp., 4.50%, 11/01/30 |
| 1,481,635 |
| ||
1,177,937 |
| Federal Home Loan Mortgage Corp. REMIC, 4.00%, 02/15/39 |
| 1,279,738 |
| ||
|
|
|
| 6,035,106 |
| ||
Federal National Mortgage Association - 12.7% |
|
|
| ||||
165,006 |
| Federal National Mortgage Association, 5.50%, 11/01/16 |
| 176,864 |
| ||
58,146 |
| Federal National Mortgage Association, 4.50%, 12/01/18 |
| 62,705 |
| ||
1,073,266 |
| Federal National Mortgage Association REMIC, 4.00%, 02/25/19 |
| 1,134,543 |
| ||
626,693 |
| Federal National Mortgage Association, 7.50%, 08/01/22 |
| 698,936 |
| ||
218,176 |
| Federal National Mortgage Association, 4.00%, 06/01/24 |
| 233,573 |
| ||
78,282 |
| Federal National Mortgage Association, 4.00%, 10/01/24 |
| 83,806 |
| ||
880,542 |
| Federal National Mortgage Association REMIC, 5.00%, 02/25/32 |
| 954,893 |
| ||
1,146,694 |
| Federal National Mortgage Association REMIC, 4.00%, 01/25/33 |
| 1,282,295 |
| ||
95,918 |
| Federal National Mortgage Association, 5.00%, 08/01/34 |
| 104,248 |
| ||
1,370,000 |
| Federal National Mortgage Association REMIC, 5.50%, 08/25/34 |
| 1,455,980 |
| ||
1,209,290 |
| Federal National Mortgage Association REMIC, 3.00%, 04/25/37 |
| 1,250,526 |
| ||
116,936 |
| Federal National Mortgage Association, 5.50%, 08/01/37 |
| 128,180 |
| ||
426,934 |
| Federal National Mortgage Association, 6.00%, 09/01/38 |
| 469,390 |
| ||
782,720 |
| Federal National Mortgage Association, 4.50%, 01/01/40 |
| 878,171 |
| ||
1,111,796 |
| Federal National Mortgage Association, 4.00%, 04/01/41 |
| 1,213,456 |
| ||
|
|
|
| 10,127,566 |
| ||
See accompanying Notes to Financial Statements.
Shares or |
| Security |
| Value |
| ||
Government National Mortgage Association - 0.6% |
|
|
| ||||
$ | 447,369 |
| Government National Mortgage Association, 4.72%, 06/20/61 |
| $ | 503,832 |
|
|
|
|
|
|
| ||
Total Government and Agency Obligations (cost $33,754,949) |
| 35,186,490 |
| ||||
|
|
|
|
|
| ||
Preferred Stock - 0.7% |
|
|
| ||||
580 |
| U.S. Bancorp, Series A, 3.50% (callable at 1,000 beginning on 05/06/13) (f) |
| 532,440 |
| ||
|
|
|
|
|
| ||
Total Preferred Stocks (cost $595,666) |
| 532,440 |
| ||||
|
|
|
|
|
| ||
Exchange Traded Funds - 0.6% |
|
|
| ||||
5,047 |
| iShares iBoxx High Yield Corporate Bond Fund |
| 476,185 |
| ||
|
|
|
|
|
| ||
Total Exchange Traded Funds (cost $436,131) |
| 476,185 |
| ||||
|
|
|
|
|
| ||
Investment Company - 1.8% |
|
|
| ||||
140,523 |
| Federated Institutional High-Yield Bond Fund |
| 1,448,798 |
| ||
|
|
|
|
|
| ||
Total Investment Company (cost $1,282,335) |
| 1,448,798 |
| ||||
|
|
|
|
|
| ||
Short Term Investments - 3.5% |
|
|
| ||||
Investment Company - 3.5% |
|
|
| ||||
2,836,311 |
| Goldman Sachs Financial Square Funds, Treasury Obligations Fund, 0.01% (h) |
| 2,836,311 |
| ||
|
|
|
|
|
| ||
Total Short Term Investments (cost $2,836,311) |
| 2,836,311 |
| ||||
|
|
|
| ||||
Total Investments - 100.5% (cost $77,639,880) |
| 80,374,077 |
| ||||
Liabilities in excess of other assets - (0.5%) |
| (384,776 | ) | ||||
NET ASSETS - 100% |
| $ | 79,989,301 |
| |||
(a) | Variable rate security. The rate reflected is the rate in effect at March 31, 2013. |
(b) | Rule 144A, Section 4(2) of the Securities Act of 1933 or other security which is restricted to resale to institutional investors. The Fund’s investment adviser has deemed these securities to be liquid based on procedures approved by Tributary Funds’ Board of Directors. |
(c) | Security fair valued in good faith in accordance with the procedures established by the Tributary Funds’ Board of Directors. Good faith fair valued securities may be classified as Level 2 or Level 3 for Financial Accounting Standards Board (“FASB”) Accounting Standards Codification (“ASC”) Topic 820 “Fair Value Measurements and Disclosures” based on the applicable valuation inputs. See Security Valuation in the Notes to Financial Statements. |
(d) | The security has been placed on non-accrual. |
(e) | The interest rate for this security is inversely affected by upgrades or downgrades to the credit rating of the issuer. |
(f) | Perpetual maturity security. |
(g) | U.S. Treasury inflation indexed note, par amount is adjusted for inflation. |
(h) | Dividend yield changes daily to reflect current market conditions. Rate was the quoted yield as of March 31, 2013. |
|
|
AMBAC | AMBAC Indemnity Corp. |
MBIA | Municipal Bond Investors Assurance |
RB | Revenue Bond |
REMIC | Real Estate Mortgage Investment Conduit |
See accompanying Notes to Financial Statements.
SCHEDULES OF PORTFOLIO INVESTMENTS
March 31, 2013
BALANCED FUND
Shares |
| Security |
| Value |
| |
Common Stocks - 61.6% |
|
|
| |||
Consumer Discretionary - 7.5% |
|
|
| |||
6,700 |
| BorgWarner Inc. (a) |
| $ | 518,178 |
|
1,250 |
| Chipotle Mexican Grill Inc. (a) |
| 407,338 |
| |
17,900 |
| Comcast Corp. - Class A |
| 751,979 |
| |
8,200 |
| Discovery Communications Inc. - Class C (a) |
| 570,228 |
| |
2,600 |
| McDonald’s Corp. |
| 259,194 |
| |
9,800 |
| Nordstrom Inc. |
| 541,254 |
| |
420 |
| NVR Inc. (a) |
| 453,646 |
| |
935 |
| Priceline.com Inc. (a) |
| 643,215 |
| |
5,150 |
| Ulta Salon Cosmetics & Fragrance Inc. |
| 418,025 |
| |
4,200 |
| Wynn Resorts Ltd. |
| 525,672 |
| |
|
|
|
| 5,088,729 |
| |
Consumer Staples - 6.4% |
|
|
| |||
9,900 |
| Church & Dwight Co. Inc. |
| 639,837 |
| |
6,750 |
| Colgate-Palmolive Co. |
| 796,702 |
| |
8,100 |
| Hershey Co. |
| 708,993 |
| |
6,066 |
| Kraft Foods Group Inc. |
| 312,581 |
| |
7,150 |
| Mead Johnson Nutrition Co. |
| 553,768 |
| |
6,400 |
| PriceSmart Inc. |
| 498,112 |
| |
5,700 |
| United Natural Foods Inc. (a) |
| 280,440 |
| |
6,200 |
| Whole Foods Market Inc. |
| 537,850 |
| |
|
|
|
| 4,328,283 |
| |
Energy - 5.8% |
|
|
| |||
4,950 |
| Chevron Corp. |
| 588,159 |
| |
10,100 |
| Exxon Mobil Corp. |
| 910,111 |
| |
5,300 |
| Helmerich & Payne Inc. |
| 321,710 |
| |
6,100 |
| Noble Energy Inc. |
| 705,526 |
| |
9,350 |
| Occidental Petroleum Corp. |
| 732,759 |
| |
9,400 |
| Schlumberger Ltd. |
| 703,966 |
| |
|
|
|
| 3,962,231 |
| |
Financials - 10.0% |
|
|
| |||
8,800 |
| ACE Ltd. |
| 782,936 |
| |
4,650 |
| Affiliated Managers Group Inc. (a) |
| 714,101 |
| |
22,400 |
| BB&T Corp. |
| 703,136 |
| |
19,100 |
| BioMed Realty Trust Inc. |
| 412,560 |
| |
3,400 |
| BlackRock Inc. |
| 873,392 |
| |
4,400 |
| Credit Acceptance Corp. (a) |
| 537,416 |
| |
17,875 |
| JPMorgan Chase & Co. |
| 848,347 |
| |
4,300 |
| M&T Bank Corp. |
| 443,588 |
| |
16,500 |
| MetLife Inc. |
| 627,330 |
| |
25,100 |
| U.S. Bancorp |
| 851,643 |
| |
|
|
|
| 6,794,449 |
| |
Health Care - 8.2% |
|
|
| |||
3,200 |
| Biogen Idec Inc. (a) |
| 617,312 |
| |
8,050 |
| Celgene Corp. (a) |
| 933,075 |
| |
7,150 |
| Cerner Corp. (a) |
| 677,463 |
| |
10,675 |
| Covidien Plc |
| 724,192 |
| |
920 |
| Intuitive Surgical Inc. (a) |
| 451,895 |
| |
8,450 |
| Medidata Solutions Inc. (a) |
| 489,931 |
| |
11,600 |
| Thermo Fisher Scientific Inc. |
| 887,284 |
| |
10,166 |
| Valeant Pharmaceuticals International Inc. (a) |
| 762,653 |
| |
|
|
|
| 5,543,805 |
| |
Industrials - 6.6% |
|
|
| |||
7,200 |
| Dover Corp. |
| 524,736 |
| |
14,850 |
| Fortune Brands Home & Security Inc. (a) |
| 555,835 |
| |
26,700 |
| General Electric Co. |
| 617,304 |
| |
8,200 |
| Jacobs Engineering Group Inc. (a) |
| 461,168 |
| |
4,400 |
| Parker Hannifin Corp. |
| 402,952 |
| |
5,300 |
| Roper Industries Inc. |
| 674,743 |
| |
4,500 |
| Union Pacific Corp. |
| 640,845 |
| |
7,300 |
| United Parcel Service Inc. - Class B |
| 627,070 |
| |
|
|
|
| 4,504,653 |
| |
Information Technology - 11.6% |
|
|
| |||
12,300 |
| Adobe Systems Inc. (a) |
| 535,173 |
| |
2,585 |
| Apple Inc. |
| 1,144,198 |
| |
4,750 |
| Citrix Systems Inc. (a) |
| 342,760 |
| |
7,000 |
| Cognizant Technology Solutions Corp. - Class A (a) |
| 536,270 |
| |
3,600 |
| FactSet Research Systems Inc. |
| 333,360 |
| |
1,330 |
| Google Inc. - Class A (a) |
| 1,056,060 |
| |
7,600 |
| IAC/InterActiveCorp. |
| 339,568 |
| |
13,700 |
| Intel Corp. |
| 299,345 |
| |
1,020 |
| MasterCard Inc. - Class A |
| 551,953 |
| |
23,300 |
| Mentor Graphics Corp. |
| 420,565 |
| |
24,100 |
| Microsoft Corp. |
| 689,501 |
| |
23,000 |
| Oracle Corp. |
| 743,820 |
| |
13,000 |
| QUALCOMM Inc. |
| 870,350 |
| |
|
|
|
| 7,862,923 |
| |
Materials - 2.5% |
|
|
| |||
3,600 |
| Agrium Inc. |
| 351,000 |
| |
4,900 |
| Eastman Chemical Co. |
| 342,363 |
| |
5,400 |
| Monsanto Co. |
| 570,402 |
| |
3,800 |
| Praxair Inc. |
| 423,852 |
| |
|
|
|
| 1,687,617 |
| |
Telecommunication Services - 1.0% |
|
|
| |||
14,050 |
| Verizon Communications Inc. |
| 690,558 |
| |
|
|
|
|
|
| |
Utilities - 2.0% |
|
|
| |||
37,700 |
| AES Corp. |
| 473,889 |
| |
6,400 |
| NextEra Energy Inc. |
| 497,152 |
| |
8,300 |
| Southern Co. |
| 389,436 |
| |
|
|
|
| 1,360,477 |
| |
Total Common Stocks (cost $29,014,362) |
| 41,823,725 |
| |||
See accompanying Notes to Financial Statements.
Principal |
| Security |
| Value |
| ||
Corporate Bonds - 23.5% |
|
|
| ||||
Consumer Discretionary - 1.9% |
|
|
| ||||
$ | 500,000 |
| Comcast Corp., 5.70%, 05/15/18 |
| $ | 601,273 |
|
300,000 |
| McGraw-Hill Cos. Inc., 5.90%, 11/15/17 |
| 338,562 |
| ||
300,000 |
| Viacom Inc., 6.25%, 04/30/16 |
| 344,578 |
| ||
|
|
|
| 1,284,413 |
| ||
Consumer Staples - 1.9% |
|
|
| ||||
500,000 |
| Anheuser-Busch Cos. Inc., 5.00%, 03/01/19 |
| 585,506 |
| ||
300,000 |
| Coca-Cola Enterprises Inc., 4.50%, 09/01/21 |
| 338,961 |
| ||
300,000 |
| ConAgra Foods Inc., 7.00%, 04/15/19 |
| 375,453 |
| ||
|
|
|
| 1,299,920 |
| ||
Energy - 1.3% |
|
|
| ||||
300,000 |
| BP Capital Markets Plc, 3.63%, 05/08/14 |
| 309,922 |
| ||
200,000 |
| ONEOK Partners LP, 6.15%, 10/01/16 |
| 231,147 |
| ||
300,000 |
| Shell International Finance BV, 3.25%, 09/22/15 |
| 320,176 |
| ||
|
|
|
| 861,245 |
| ||
Financials - 7.7% |
|
|
| ||||
400,000 |
| American Express Credit Corp., 5.88%, 05/02/13 |
| 401,742 |
| ||
500,000 |
| Commonwealth Bank of Australia, 2.95%, 04/13/20 (b) (c) |
| 529,405 |
| ||
500,000 |
| General Electric Capital Corp., 5.63%, 09/15/17 |
| 585,988 |
| ||
300,000 |
| Goldman Sachs Group Inc., 5.25%, 10/15/13 |
| 307,352 |
| ||
280,000 |
| Health Care REIT Inc., 6.20%, 06/01/16 |
| 319,038 |
| ||
500,000 |
| JPMorgan Chase & Co., 6.40%, 10/02/17 |
| 596,904 |
| ||
500,000 |
| KeyCorp, 6.50%, 05/14/13 |
| 503,437 |
| ||
500,000 |
| Morgan Stanley, 0.78%, 10/15/15 (b) |
| 491,705 |
| ||
250,000 |
| Regions Bank, 7.50%, 05/15/18 |
| 306,875 |
| ||
300,000 |
| Simon Property Group LP, 2.80%, 01/30/17 |
| 316,155 |
| ||
494,000 |
| Vornado Realty Trust, 4.25%, 04/01/15 |
| 522,137 |
| ||
300,000 |
| Wachovia Corp., 5.25%, 08/01/14 |
| 317,404 |
| ||
|
|
|
| 5,198,142 |
| ||
Health Care - 1.6% |
|
|
| ||||
500,000 |
| Novartis Securities Investment Ltd., 5.13%, 02/10/19 |
| 597,009 |
| ||
500,000 |
| Teva Pharmaceutical Finance II BV, 3.00%, 06/15/15 |
| 524,543 |
| ||
|
|
|
| 1,121,552 |
| ||
Industrials - 1.9% |
|
|
| ||||
500,000 |
| Harley-Davidson Funding Corp., 6.80%, 06/15/18 (d) |
| 614,202 |
| ||
300,000 |
| Honeywell International Inc., 5.30%, 03/01/18 |
| 356,830 |
| ||
300,000 |
| Union Pacific Corp., 4.16%, 07/15/22 |
| 337,816 |
| ||
|
|
|
| 1,308,848 |
| ||
Information Technology - 0.5% |
|
|
| ||||
300,000 |
| Oracle Corp., 3.88%, 07/15/20 |
| 336,019 |
| ||
|
|
|
|
|
| ||
Materials - 1.1% |
|
|
| ||||
350,000 |
| Mosaic Co., 3.75%, 11/15/21 |
| 368,460 |
| ||
400,000 |
| Vale Overseas Ltd., 4.38%, 01/11/22 |
| 410,419 |
| ||
|
|
|
| 778,879 |
| ||
Telecommunication Services - 1.8% |
|
|
| ||||
500,000 |
| AT&T Inc., 4.45%, 05/15/21 |
| 562,645 |
| ||
300,000 |
| Cellco Partnership, 5.55%, 02/01/14 |
| 311,806 |
| ||
300,000 |
| Verizon Communications Inc., 4.90%, 09/15/15 |
| 329,427 |
| ||
|
|
|
| 1,203,878 |
| ||
Utilities - 3.8% |
|
|
| ||||
400,000 |
| Alabama Power Co., 5.88%, 12/01/22 |
| 499,279 |
| ||
400,000 |
| Commonwealth Edison Co., 4.00%, 08/01/20 |
| 449,942 |
| ||
400,000 |
| Consolidated Edison Co. of New York Inc., 5.30%, 12/01/16 |
| 461,613 |
| ||
250,000 |
| Exelon Generation Co. LLC, 5.20%, 10/01/19 |
| 282,945 |
| ||
300,000 |
| ONEOK Inc., 4.25%, 02/01/22 |
| 318,612 |
| ||
500,000 |
| Sempra Energy, 6.50%, 06/01/16 |
| 582,729 |
| ||
|
|
|
| 2,595,120 |
| ||
Total Corporate Bonds (cost $15,301,723) |
| 15,988,016 |
| ||||
|
|
|
|
|
| ||
Government and Agency Obligations - 9.0% |
|
|
| ||||
GOVERNMENT SECURITIES - 8.5% |
|
|
| ||||
Federal Home Loan Bank - 0.7% |
|
|
| ||||
300,000 |
| Federal Home Loan Bank, 1.00%, 10/15/27 (e) (f) |
| 300,075 |
| ||
200,000 |
| Federal Home Loan Bank, 1.50%, 01/25/28 (e) (f) |
| 200,178 |
| ||
|
|
|
| 500,253 |
| ||
Municipals - 5.7% |
|
|
| ||||
350,000 |
| California State University, RB, 5.45%, 11/01/22 |
| 409,094 |
| ||
250,000 |
| City of Aurora, Illinois, GO, Series A, 4.25%, 12/30/17 |
| 281,465 |
| ||
250,000 |
| City of Industry, California, RB, 7.00%, 01/01/21 |
| 267,922 |
| ||
See accompanying Notes to Financial Statements.
Principal |
| Security |
| Value |
| ||
$ | 150,000 |
| County of St. Charles Missouri, RB, 5.16%, 10/01/20 |
| $ | 177,929 |
|
190,000 |
| Denver City & County Board of Water Commission, RB, Series A, 5.00%, 12/15/19 |
| 227,620 |
| ||
100,000 |
| Denver Regional Transportation District, RB, 2.21%, 11/01/21 |
| 99,667 |
| ||
300,000 |
| District of Columbia, RB, 4.99%, 12/01/23 |
| 360,888 |
| ||
195,000 |
| Kansas Development Finance Authority, RB, Series N, 5.20%, 11/01/19 |
| 236,026 |
| ||
300,000 |
| Metro Wastewater Reclamation District, Sewer Revenue, Series B, 5.02%, 04/01/20 |
| 352,647 |
| ||
205,000 |
| Northern Illinois Municipal Power Agency, Power Project Revenue, 5.69%, 01/01/17 |
| 226,589 |
| ||
200,000 |
| Reeves County Texas, Correctional Facilities, 7.40%, 12/01/17 |
| 215,886 |
| ||
200,000 |
| Santa Monica Community College District, Series A, 5.73%, 08/01/24 |
| 239,664 |
| ||
100,000 |
| State of Florida Lottery, RB, 5.19%, 07/01/19 |
| 117,004 |
| ||
265,000 |
| Town of Hamden Connecticut, GO, Series B, 5.38%, 08/15/22 |
| 314,833 |
| ||
200,000 |
| Town of Parker Colorado, Series A, 5.30%, 11/01/18 |
| 228,894 |
| ||
100,000 |
| Vista Community Development Commission California, 7.61%, 09/01/21 |
| 114,704 |
| ||
|
|
|
| 3,870,832 |
| ||
Treasury Inflation Index Securities - 1.0% |
|
|
| ||||
276,874 |
| U.S. Treasury Inflation Indexed Note, 1.38%, 01/15/20 (g) |
| 329,804 |
| ||
244,334 |
| U.S. Treasury Inflation Indexed Note, 2.38%, 01/15/25 (g) |
| 327,904 |
| ||
|
|
|
| 657,708 |
| ||
U.S. Treasury Securities - 1.1% |
|
|
| ||||
200,000 |
| U.S. Treasury Note, 3.25%, 12/31/16 |
| 220,359 |
| ||
300,000 |
| U.S. Treasury Note, 3.75%, 11/15/18 |
| 347,250 |
| ||
150,000 |
| U.S. Treasury Note, 3.63%, 08/15/19 |
| 173,719 |
| ||
|
|
|
| 741,328 |
| ||
U.S. GOVERNMENT MORTGAGE-BACKED SECURITIES - 0.5% |
|
|
| ||||
Federal National Mortgage Association - 0.5% |
|
|
| ||||
294,431 |
| Federal National Mortgage Association, 3.50%, 12/01/26 |
| 312,323 |
| ||
|
|
|
|
|
| ||
Total Government and Agency Obligations (cost $5,534,745) |
| 6,082,444 |
| ||||
|
|
|
|
|
| ||
Shares |
|
|
|
|
| ||
Exchange Traded Funds - 0.8% |
|
|
| ||||
Investment Company - 0.8% |
|
|
| ||||
31,600 |
| Alerian MLP ETF |
| 559,952 |
| ||
|
|
|
|
|
| ||
Total Exchange Traded Funds (cost $531,771) |
| 559,952 |
| ||||
|
|
|
|
|
| ||
Short Term Investments - 5.5% |
|
|
| ||||
Investment Company - 5.5% |
|
|
| ||||
3,757,526 |
| Goldman Sachs Financial Square Funds, Treasury Obligations Fund, 0.01% (h) |
| 3,757,526 |
| ||
|
|
|
|
|
| ||
Total Short Term Investments (cost $3,757,526) |
| 3,757,526 |
| ||||
|
|
|
| ||||
Total Investments - 100.4% (cost $54,140,127) |
| 68,211,663 |
| ||||
Liabilities in excess of other assets - (0.4%) |
| (284,491 | ) | ||||
NET ASSETS - 100% |
| $ | 67,927,172 |
| |||
(a) | Non-income producing security. |
(b) | Variable rate security. The rate reflected is the rate in effect at March 31, 2013. |
(c) | Rule 144A, Section 4(2) of the Securities Act of 1933 or other security which is restricted to resale to institutional investors. The Fund’s investment adviser has deemed these securities to be illiquid based on procedures approved by Tributary Funds’ Board of Directors. See Restricted Securities in the Notes to Financial Statements. |
(d) | Rule 144A, Section 4(2) of the Securities Act of 1933 or other security which is restricted to resale to institutional investors. The Fund’s investment adviser has deemed these securities to be liquid based on procedures approved by Tributary Funds’ Board of Directors. |
(e) | Security is a “step-up” bond where the coupon may increase or step up at a future date. Rate stated was the coupon as of March 31, 2013. |
(f) | This security is a direct debt of the agency and not collateralized by mortgages. |
(g) | U.S. Treasury inflation indexed note, par amount is adjusted for inflation. |
(h) | Dividend yield changes daily to reflect current market conditions. Rate was the quoted yield as of March 31, 2013. |
|
|
ETF | Exchange-Traded Fund |
GO | General Obligation |
MLP | Master Limited Partnership |
RB | Revenue Bond |
See accompanying Notes to Financial Statements.
SCHEDULES OF PORTFOLIO INVESTMENTS
March 31, 2013
CORE EQUITY FUND
Shares |
| Security |
| Value |
| |
Common Stocks - 96.4% |
|
|
| |||
Consumer Discretionary - 11.0% |
|
|
| |||
103,700 |
| Comcast Corp. - Class A |
| $ | 4,356,437 |
|
48,000 |
| Kohl’s Corp. |
| 2,214,240 |
| |
54,100 |
| Lear Corp. |
| 2,968,467 |
| |
25,200 |
| Mohawk Industries Inc. (a) |
| 2,850,624 |
| |
59,200 |
| Nike Inc. - Class B |
| 3,493,392 |
| |
68,600 |
| Omnicom Group Inc. |
| 4,040,540 |
| |
|
|
|
| 19,923,700 |
| |
Consumer Staples - 10.2% |
|
|
| |||
83,200 |
| General Mills Inc. |
| 4,102,592 |
| |
77,600 |
| PepsiCo Inc. |
| 6,138,936 |
| |
37,300 |
| Philip Morris International Inc. |
| 3,458,083 |
| |
62,200 |
| Procter & Gamble Co. |
| 4,793,132 |
| |
|
|
|
| 18,492,743 |
| |
Energy - 10.8% |
|
|
| |||
51,500 |
| Chevron Corp. |
| 6,119,230 |
| |
63,000 |
| Ensco Plc - Class A |
| 3,780,000 |
| |
71,100 |
| Exxon Mobil Corp. |
| 6,406,821 |
| |
43,500 |
| Schlumberger Ltd. |
| 3,257,715 |
| |
|
|
|
| 19,563,766 |
| |
Financials - 17.1% |
|
|
| |||
59,600 |
| AFLAC Inc. |
| 3,100,392 |
| |
55,000 |
| Aon Plc - Class A |
| 3,382,500 |
| |
103,800 |
| BB&T Corp. |
| 3,258,282 |
| |
9,600 |
| BlackRock Inc. |
| 2,466,048 |
| |
59,300 |
| Citigroup Inc. |
| 2,623,432 |
| |
12,900 |
| IntercontinentalExchange Inc. (a) |
| 2,103,603 |
| |
96,300 |
| JPMorgan Chase & Co. |
| 4,570,398 |
| |
96,200 |
| MetLife Inc. |
| 3,657,524 |
| |
33,900 |
| Travelers Cos. Inc. |
| 2,854,041 |
| |
89,000 |
| U.S. Bancorp |
| 3,019,770 |
| |
|
|
|
| 31,035,990 |
| |
Health Care - 12.1% |
|
|
| |||
71,700 |
| Dentsply International Inc. |
| 3,041,514 |
| |
26,000 |
| McKesson Corp. |
| 2,806,960 |
| |
99,500 |
| Medtronic Inc. |
| 4,672,520 |
| |
81,800 |
| Novartis AG - ADR |
| 5,827,432 |
| |
59,200 |
| Teva Pharmaceutical Industries Ltd. - ADR |
| 2,349,056 |
| |
46,200 |
| Varian Medical Systems Inc. (a) |
| 3,326,400 |
| |
|
|
|
| 22,023,882 |
| |
Industrials - 11.5% |
|
|
| |||
43,800 |
| 3M Co. |
| 4,656,378 |
| |
26,200 |
| Flowserve Corp. |
| 4,394,002 |
| |
185,100 |
| General Electric Co. |
| 4,279,512 |
| |
71,200 |
| Jacobs Engineering Group Inc. (a) |
| 4,004,288 |
| |
50,800 |
| Towers Watson & Co. - Class A |
| 3,521,456 |
| |
|
|
|
| 20,855,636 |
| |
Information Technology - 18.0% |
|
|
| |||
7,800 |
| Apple Inc. |
| 3,452,514 |
| |
72,300 |
| Avnet Inc. (a) |
| 2,617,260 |
| |
135,700 |
| Cisco Systems Inc. |
| 2,837,487 |
| |
129,300 |
| EMC Corp. (a) |
| 3,088,977 |
| |
124,700 |
| Intel Corp. |
| 2,724,695 |
| |
14,600 |
| International Business Machines Corp. |
| 3,114,180 |
| |
123,600 |
| Microsoft Corp. |
| 3,536,196 |
| |
133,000 |
| Oracle Corp. |
| 4,301,220 |
| |
55,800 |
| QUALCOMM Inc. |
| 3,735,810 |
| |
92,200 |
| Texas Instruments Inc. |
| 3,271,256 |
| |
|
|
|
| 32,679,595 |
| |
Materials - 3.0% |
|
|
| |||
31,000 |
| Air Products & Chemicals Inc. |
| 2,700,720 |
| |
86,200 |
| Allegheny Technologies Inc. |
| 2,733,402 |
| |
|
|
|
| 5,434,122 |
| |
Utilities - 2.7% |
|
|
| |||
197,100 |
| AES Corp. |
| 2,477,547 |
| |
52,000 |
| Southern Co. |
| 2,439,840 |
| |
|
|
|
| 4,917,387 |
| |
Total Common Stocks (cost $129,382,313) |
| 174,926,821 |
| |||
|
|
|
|
|
| |
Short Term Investments - 2.1% |
|
|
| |||
Investment Company - 2.1% |
|
|
| |||
3,785,899 |
| Goldman Sachs Financial Square Funds, Treasury Obligations Fund, 0.01% (b) |
| 3,785,899 |
| |
|
|
|
|
|
| |
Total Short Term Investments (cost $3,785,899) |
| 3,785,899 |
| |||
|
|
|
|
|
| |
Total Investments - 98.5% (cost $133,168,212) |
| 178,712,720 |
| |||
Other assets in excess of liabilities - 1.5% |
| 2,647,652 |
| |||
NET ASSETS - 100% |
| $ | 181,360,372 |
| ||
(a) | Non-income producing security. |
(b) | Dividend yield changes daily to reflect current market conditions. Rate was the quoted yield as of March 31, 2013. |
|
|
ADR | American Depositary Receipt |
See accompanying Notes to Financial Statements.
SCHEDULES OF PORTFOLIO INVESTMENTS
March 31, 2013
LARGE CAP GROWTH FUND
Shares |
| Security |
| Value |
| |
Common Stocks - 98.0% |
|
|
| |||
Consumer Discretionary - 15.4% |
|
|
| |||
12,500 |
| BorgWarner Inc. (a) |
| $ | 966,750 |
|
9,000 |
| Coach Inc. |
| 449,910 |
| |
41,000 |
| Comcast Corp. - Class A |
| 1,722,410 |
| |
20,000 |
| Discovery Communications Inc. - Class C (a) |
| 1,390,800 |
| |
15,000 |
| Nordstrom Inc. |
| 828,450 |
| |
1,800 |
| Priceline.com Inc. (a) |
| 1,238,274 |
| |
20,000 |
| Starbucks Corp. |
| 1,139,200 |
| |
8,100 |
| Wynn Resorts Ltd. |
| 1,013,796 |
| |
|
|
|
| 8,749,590 |
| |
Consumer Staples - 2.9% |
|
|
| |||
25,000 |
| Mondelez International Inc. - Class A |
| 765,250 |
| |
10,000 |
| Whole Foods Market Inc. |
| 867,500 |
| |
|
|
|
| 1,632,750 |
| |
Energy - 7.3% |
|
|
| |||
10,000 |
| Apache Corp. |
| 771,600 |
| |
6,100 |
| Concho Resources Inc. (a) |
| 594,323 |
| |
6,000 |
| Noble Energy Inc. |
| 693,960 |
| |
5,000 |
| Occidental Petroleum Corp. |
| 391,850 |
| |
12,000 |
| Schlumberger Ltd. |
| 898,680 |
| |
22,000 |
| Williams Cos. Inc. |
| 824,120 |
| |
|
|
|
| 4,174,533 |
| |
Financials - 8.5% |
|
|
| |||
7,000 |
| Affiliated Managers Group Inc. (a) |
| 1,074,990 |
| |
20,000 |
| JPMorgan Chase & Co. |
| 949,200 |
| |
7,500 |
| T. Rowe Price Group Inc. |
| 561,525 |
| |
28,600 |
| U.S. Bancorp |
| 970,398 |
| |
34,000 |
| Wells Fargo & Co. |
| 1,257,660 |
| |
|
|
|
| 4,813,773 |
| |
Health Care - 16.5% |
|
|
| |||
4,125 |
| Biogen Idec Inc. (a) |
| 795,753 |
| |
21,100 |
| Catamaran Corp. (a) |
| 1,118,933 |
| |
12,000 |
| Celgene Corp. (a) |
| 1,390,920 |
| |
10,000 |
| Cerner Corp. (a) |
| 947,500 |
| |
25,250 |
| Stryker Corp. |
| 1,647,310 |
| |
18,000 |
| Thermo Fisher Scientific Inc. |
| 1,376,820 |
| |
15,000 |
| UnitedHealth Group Inc. |
| 858,150 |
| |
17,000 |
| Valeant Pharmaceuticals International Inc. (a) |
| 1,275,340 |
| |
|
|
|
| 9,410,726 |
| |
Industrials - 16.4% |
|
|
| |||
21,000 |
| AGCO Corp. |
| 1,094,520 |
| |
9,980 |
| Cummins Inc. |
| 1,155,784 |
| |
18,000 |
| Dover Corp. |
| 1,311,840 |
| |
14,000 |
| FedEx Corp. |
| 1,374,800 |
| |
25,000 |
| Illinois Tool Works Inc. |
| 1,523,500 |
| |
11,500 |
| Joy Global Inc. |
| 684,480 |
| |
7,600 |
| Roper Industries Inc. |
| 967,556 |
| |
8,800 |
| Union Pacific Corp. |
| 1,253,208 |
| |
|
|
|
| 9,365,688 |
| |
Information Technology - 26.2% |
|
|
| |||
20,000 |
| Accenture Plc - Class A |
| 1,519,400 |
| |
30,000 |
| Adobe Systems Inc. (a) |
| 1,305,300 |
| |
1,400 |
| Apple Inc. |
| 619,682 |
| |
44,000 |
| CA Inc. |
| 1,107,480 |
| |
17,300 |
| Citrix Systems Inc. (a) |
| 1,248,368 |
| |
20,000 |
| Cognizant Technology Solutions Corp. - Class A (a) |
| 1,532,200 |
| |
4,200 |
| Equinix Inc. (a) |
| 908,502 |
| |
16,000 |
| Fiserv Inc. (a) |
| 1,405,280 |
| |
2,000 |
| Google Inc. - Class A (a) |
| 1,588,060 |
| |
2,330 |
| MasterCard Inc. - Class A |
| 1,260,833 |
| |
43,000 |
| Oracle Corp. |
| 1,390,620 |
| |
13,000 |
| VMware Inc. - Class A (a) |
| 1,025,440 |
| |
|
|
|
| 14,911,165 |
| |
Materials - 4.8% |
|
|
| |||
14,000 |
| Agrium Inc. |
| 1,365,000 |
| |
12,500 |
| Praxair Inc. |
| 1,394,250 |
| |
|
|
|
| 2,759,250 |
| |
Total Common Stocks (cost $38,671,110) |
| 55,817,475 |
| |||
|
|
|
|
|
| |
Short Term Investments - 1.5% |
|
|
| |||
Investment Company - 1.5% |
|
|
| |||
866,445 |
| Goldman Sachs Financial Square Funds, Treasury Obligations Fund, 0.01% (b) |
| 866,445 |
| |
|
|
|
|
|
| |
Total Short Term Investments (cost $866,445) |
| 866,445 |
| |||
|
|
|
|
|
| |
Total Investments - 99.5% (cost $39,537,555) |
| 56,683,920 |
| |||
Other assets in excess of liabilities - 0.5% |
| 265,512 |
| |||
NET ASSETS - 100% |
| $ | 56,949,432 |
| ||
(a) | Non-income producing security. |
(b) | Dividend yield changes daily to reflect current market conditions. Rate was the quoted yield as of March 31, 2013. |
See accompanying Notes to Financial Statements.
SCHEDULES OF PORTFOLIO INVESTMENTS
March 31, 2013
GROWTH OPPORTUNITIES FUND
Shares |
| Security |
| Value |
| |
Common Stocks - 96.1% |
|
|
| |||
Consumer Discretionary - 22.4% |
|
|
| |||
23,100 |
| BorgWarner Inc. (a) |
| $ | 1,786,554 |
|
42,000 |
| Cabela’s Inc. (a) |
| 2,552,760 |
| |
81,953 |
| Chico’s FAS Inc. |
| 1,376,810 |
| |
24,000 |
| Churchill Downs Inc. |
| 1,680,960 |
| |
10,000 |
| Coach Inc. |
| 499,900 |
| |
37,500 |
| Discovery Communications Inc. - Class C (a) |
| 2,607,750 |
| |
33,000 |
| Foot Locker Inc. |
| 1,129,920 |
| |
54,000 |
| HanesBrands Inc. (a) |
| 2,460,240 |
| |
30,000 |
| Nordstrom Inc. |
| 1,656,900 |
| |
4,500 |
| Panera Bread Co. - Class A (a) |
| 743,580 |
| |
91,000 |
| Pier 1 Imports Inc. |
| 2,093,000 |
| |
13,000 |
| Polaris Industries Inc. |
| 1,202,370 |
| |
100,000 |
| PulteGroup Inc. (a) |
| 2,024,000 |
| |
60,000 |
| Tenneco Inc. (a) |
| 2,358,600 |
| |
12,000 |
| Ulta Salon Cosmetics & Fragrance Inc. |
| 974,040 |
| |
70,000 |
| Vera Bradley Inc. (a) |
| 1,654,100 |
| |
26,800 |
| Vitamin Shoppe Inc. (a) |
| 1,309,180 |
| |
15,000 |
| Wynn Resorts Ltd. |
| 1,877,400 |
| |
|
|
|
| 29,988,064 |
| |
Consumer Staples - 3.2% |
|
|
| |||
12,500 |
| Church & Dwight Co. Inc. |
| 807,875 |
| |
44,000 |
| Herbalife Ltd. |
| 1,647,800 |
| |
22,400 |
| PriceSmart Inc. |
| 1,743,392 |
| |
|
|
|
| 4,199,067 |
| |
Energy - 6.8% |
|
|
| |||
9,000 |
| Concho Resources Inc. (a) |
| 876,870 |
| |
272,000 |
| Kodiak Oil & Gas Corp. (a) |
| 2,472,480 |
| |
36,000 |
| Lufkin Industries Inc. |
| 2,390,040 |
| |
12,300 |
| Noble Energy Inc. |
| 1,422,618 |
| |
80,000 |
| Northern Oil and Gas Inc. (a) |
| 1,150,400 |
| |
21,000 |
| World Fuel Services Corp. |
| 834,120 |
| |
|
|
|
| 9,146,528 |
| |
Financials - 8.6% |
|
|
| |||
12,500 |
| Affiliated Managers Group Inc. (a) |
| 1,919,625 |
| |
14,550 |
| Credit Acceptance Corp. (a) |
| 1,777,137 |
| |
49,000 |
| Home Bancshares Inc. |
| 1,845,830 |
| |
22,300 |
| Portfolio Recovery Associates Inc. (a) |
| 2,830,316 |
| |
25,000 |
| Signature Bank (a) |
| 1,969,000 |
| |
32,400 |
| Stifel Financial Corp. (a) |
| 1,123,308 |
| |
|
|
|
| 11,465,216 |
| |
Health Care - 11.6% |
|
|
| |||
41,220 |
| Catamaran Corp. (a) |
| 2,185,897 |
| |
20,800 |
| Cerner Corp. (a) |
| 1,970,800 |
| |
100,000 |
| MedAssets Inc. (a) |
| 1,925,000 |
| |
100,000 |
| PDL BioPharma Inc. |
| 731,000 |
| |
80,000 |
| Questcor Pharmaceuticals Inc. |
| 2,603,200 |
| |
24,000 |
| Teleflex Inc. |
| 2,028,240 |
| |
22,000 |
| United Therapeutics Corp. (a) |
| 1,339,140 |
| |
36,500 |
| Valeant Pharmaceuticals International Inc. (a) |
| 2,738,230 |
| |
|
|
|
| 15,521,507 |
| |
Industrials - 19.3% |
|
|
| |||
32,100 |
| AGCO Corp. |
| 1,673,052 |
| |
46,300 |
| Applied Industrial Technologies Inc. |
| 2,083,500 |
| |
31,000 |
| Atlas Air Worldwide Holdings Inc. (a) |
| 1,263,560 |
| |
28,000 |
| Dover Corp. |
| 2,040,640 |
| |
18,000 |
| Genesee & Wyoming Inc. - Class A (a) |
| 1,675,980 |
| |
44,000 |
| HUB Group Inc. - Class A (a) |
| 1,692,240 |
| |
26,000 |
| Joy Global Inc. |
| 1,547,520 |
| |
27,700 |
| Landstar System Inc. |
| 1,581,393 |
| |
39,700 |
| Lincoln Electric Holdings Inc. |
| 2,150,946 |
| |
15,200 |
| Middleby Corp. (a) |
| 2,312,680 |
| |
17,000 |
| Pall Corp. |
| 1,162,290 |
| |
12,700 |
| Roper Industries Inc. |
| 1,616,837 |
| |
70,000 |
| Tetra Tech Inc. (a) |
| 2,134,300 |
| |
24,000 |
| Triumph Group Inc. |
| 1,884,000 |
| |
24,000 |
| Woodward Inc. |
| 954,240 |
| |
|
|
|
| 25,773,178 |
| |
Information Technology - 20.0% |
|
|
| |||
53,000 |
| Adobe Systems Inc. (a) |
| 2,306,030 |
| |
30,000 |
| Akamai Technologies Inc. (a) |
| 1,058,700 |
| |
90,000 |
| CA Inc. |
| 2,265,300 |
| |
151,400 |
| Cadence Design Systems Inc. (a) |
| 2,109,002 |
| |
20,000 |
| Citrix Systems Inc. (a) |
| 1,443,200 |
| |
23,000 |
| Cognizant Technology Solutions Corp. - Class A (a) |
| 1,762,030 |
| |
8,000 |
| Equinix Inc. (a) |
| 1,730,480 |
| |
10,000 |
| FactSet Research Systems Inc. |
| 926,000 |
| |
17,500 |
| Fiserv Inc. (a) |
| 1,537,025 |
| |
39,000 |
| IAC/InterActiveCorp. |
| 1,742,520 |
| |
27,600 |
| Jack Henry & Associates Inc. |
| 1,275,396 |
| |
100,000 |
| Mentor Graphics Corp. |
| 1,805,000 |
| |
47,000 |
| NeuStar Inc. - Class A (a) |
| 2,186,910 |
| |
27,000 |
| OSI Systems Inc. (a) |
| 1,681,830 |
| |
100,000 |
| ValueClick Inc. (a) |
| 2,955,000 |
| |
|
|
|
| 26,784,423 |
| |
Materials - 4.2% |
|
|
| |||
24,500 |
| Agrium Inc. |
| 2,388,750 |
| |
52,000 |
| HB Fuller Co. |
| 2,032,160 |
| |
15,000 |
| Sigma-Aldrich Corp. |
| 1,165,200 |
| |
|
|
|
| 5,586,110 |
| |
Total Common Stocks (cost $82,992,507) |
| 128,464,093 |
| |||
See accompanying Notes to Financial Statements.
Shares |
| Security |
| Value |
| |
Short Term Investments - 5.5% |
|
|
| |||
Investment Company - 5.5% |
|
|
| |||
7,342,800 |
| Goldman Sachs Financial Square Funds, Treasury Obligations Fund, 0.01% (b) |
| $ | 7,342,800 |
|
|
|
|
|
|
| |
Total Short Term Investments (cost $7,342,800) |
| 7,342,800 |
| |||
|
|
|
|
|
| |
Total Investments - 101.6% (cost $90,335,307) |
| 135,806,893 |
| |||
Liabilities in excess of other assets - (1.6%) |
| (2,088,335 | ) | |||
NET ASSETS - 100% |
| $ | 133,718,558 |
| ||
(a) | Non-income producing security. |
(b) | Dividend yield changes daily to reflect current market conditions. Rate was the quoted yield as of March 31, 2013. |
See accompanying Notes to Financial Statements.
SCHEDULES OF PORTFOLIO INVESTMENTS
March 31, 2013
SMALL COMPANY FUND
Shares |
| Security |
| Value |
| |
Common Stocks - 97.0% |
|
|
| |||
Consumer Discretionary - 13.3% |
|
|
| |||
136,400 |
| Ann Inc. (a) |
| $ | 3,958,328 |
|
66,100 |
| Buckle Inc. |
| 3,083,565 |
| |
299,700 |
| Callaway Golf Co. |
| 1,984,014 |
| |
97,800 |
| Iconix Brand Group Inc. (a) |
| 2,530,086 |
| |
89,400 |
| International Speedway Corp. - Class A |
| 2,921,592 |
| |
83,800 |
| Jack in the Box Inc. (a) |
| 2,898,642 |
| |
98,900 |
| Maidenform Brands Inc. (a) |
| 1,733,717 |
| |
70,800 |
| Steiner Leisure Ltd. (a) |
| 3,423,888 |
| |
|
|
|
| 22,533,832 |
| |
Consumer Staples - 2.7% |
|
|
| |||
29,500 |
| Lancaster Colony Corp. |
| 2,271,500 |
| |
41,000 |
| WD-40 Co. |
| 2,245,570 |
| |
|
|
|
| 4,517,070 |
| |
Energy - 5.8% |
|
|
| |||
49,700 |
| Dresser-Rand Group Inc. (a) |
| 3,064,502 |
| |
55,700 |
| SM Energy Co. |
| 3,298,554 |
| |
70,100 |
| Tidewater Inc. |
| 3,540,050 |
| |
|
|
|
| 9,903,106 |
| |
Financials - 21.7% |
|
|
| |||
52,800 |
| Arthur J. Gallagher & Co. |
| 2,181,168 |
| |
40,800 |
| Cullen/Frost Bankers Inc. |
| 2,551,224 |
| |
31,700 |
| GAMCO Investors Inc. |
| 1,683,587 |
| |
35,500 |
| Home Properties Inc. |
| 2,251,410 |
| |
30,400 |
| Jones Lang LaSalle Inc. |
| 3,022,064 |
| |
66,800 |
| LTC Properties Inc. |
| 2,720,764 |
| |
84,300 |
| Mack-Cali Realty Corp. |
| 2,411,823 |
| |
116,200 |
| MB Financial Inc. |
| 2,808,554 |
| |
295,700 |
| Meadowbrook Insurance Group Inc. |
| 2,084,685 |
| |
181,000 |
| Old National Bancorp |
| 2,488,750 |
| |
131,300 |
| Selective Insurance Group |
| 3,152,513 |
| |
79,700 |
| Southside Bancshares Inc. |
| 1,674,497 |
| |
69,000 |
| Stifel Financial Corp. (a) |
| 2,392,230 |
| |
54,300 |
| UMB Financial Corp. |
| 2,664,501 |
| |
100,000 |
| United Bankshares Inc. |
| 2,661,000 |
| |
|
|
|
| 36,748,770 |
| |
Health Care - 8.9% |
|
|
| |||
64,300 |
| Greatbatch Inc. (a) |
| 1,920,641 |
| |
24,000 |
| Magellan Health Services Inc. (a) |
| 1,141,680 |
| |
103,100 |
| Team Health Holdings Inc. (a) |
| 3,750,778 |
| |
159,000 |
| VCA Antech Inc. (a) |
| 3,734,910 |
| |
70,500 |
| West Pharmaceutical Services Inc. |
| 4,578,270 |
| |
|
|
|
| 15,126,279 |
| |
Industrials - 17.1% |
|
|
| |||
99,800 |
| Actuant Corp. - Class A |
| 3,055,876 |
| |
113,600 |
| Barnes Group Inc. |
| 3,286,448 |
| |
55,700 |
| Carlisle Cos. Inc. |
| 3,775,903 |
| |
54,800 |
| CLARCOR Inc. |
| 2,870,424 |
| |
38,800 |
| Hubbell Inc. - Class B |
| 3,767,868 |
| |
56,100 |
| IDEX Corp. |
| 2,996,862 |
| |
247,600 |
| Navigant Consulting Inc. (a) |
| 3,253,464 |
| |
116,000 |
| Tetra Tech Inc. (a) |
| 3,536,840 |
| |
97,400 |
| Werner Enterprises Inc. |
| 2,351,236 |
| |
|
|
|
| 28,894,921 |
| |
Information Technology - 17.4% |
|
|
| |||
39,300 |
| Anixter International Inc. |
| 2,747,856 |
| |
45,300 |
| CACI International Inc. - Class A (a) |
| 2,621,511 |
| |
56,300 |
| Littelfuse Inc. |
| 3,819,955 |
| |
258,400 |
| Micrel Inc. |
| 2,715,784 |
| |
118,900 |
| Microsemi Corp. (a) |
| 2,754,913 |
| |
36,800 |
| MTS Systems Corp. |
| 2,139,920 |
| |
74,100 |
| National Instruments Corp. |
| 2,426,775 |
| |
97,200 |
| Park Electrochemical Corp. |
| 2,463,048 |
| |
115,600 |
| PTC INC (a) |
| 2,946,644 |
| |
34,600 |
| Syntel Inc. |
| 2,336,192 |
| |
52,800 |
| Zebra Technologies Corp. - Class A (a) |
| 2,488,464 |
| |
|
|
|
| 29,461,062 |
| |
Materials - 5.8% |
|
|
| |||
49,000 |
| Carpenter Technology Corp. |
| 2,415,210 |
| |
95,600 |
| Intrepid Potash Inc. |
| 1,793,456 |
| |
98,900 |
| Materion Corp. |
| 2,818,650 |
| |
71,900 |
| Sensient Technologies Corp. |
| 2,810,571 |
| |
|
|
|
| 9,837,887 |
| |
Utilities - 4.3% |
|
|
| |||
74,100 |
| IDACORP Inc. |
| 3,576,807 |
| |
109,600 |
| Westar Energy Inc. |
| 3,636,528 |
| |
|
|
|
| 7,213,335 |
| |
Total Common Stocks (cost $127,289,744) |
| 164,236,262 |
| |||
Short Term Investments - 3.5% |
|
|
| |||
Investment Company - 3.5% |
|
|
| |||
5,962,325 |
| Goldman Sachs Financial Square Funds, Treasury Obligations Fund, 0.01% (b) |
| 5,962,325 |
| |
|
|
|
|
|
| |
Total Short Term Investments (cost $5,962,325) |
| 5,962,325 |
| |||
|
|
|
| |||
Total Investments - 100.5% (cost $133,252,069) |
| 170,198,587 |
| |||
Liabilities in excess of other assets - (0.5%) |
| (882,530 | ) | |||
NET ASSETS - 100% |
| $ | 169,316,057 |
| ||
(a) | Non-income producing security. |
(b) | Dividend yield changes daily to reflect current market conditions. Rate was the quoted yield as of March 31, 2013. |
See accompanying Notes to Financial Statements.
STATEMENTS OF ASSETS AND LIABILITIES
March 31, 2013
|
| SHORT- |
| INCOME FUND |
| ||
Assets: |
|
|
|
|
| ||
Investments, at cost |
| $ | 77,560,011 |
| $ | 77,639,880 |
|
Unrealized appreciation of investments |
| 1,625,719 |
| 2,734,197 |
| ||
Total investments, at value |
| 79,185,730 |
| 80,374,077 |
| ||
Cash |
| 34,469 |
| 2,250 |
| ||
Interest and dividends receivable |
| 320,417 |
| 497,301 |
| ||
Receivable for capital shares issued |
| 222,108 |
| 173,999 |
| ||
Receivable for investments sold |
| — |
| — |
| ||
Prepaid expenses |
| 20,075 |
| 19,325 |
| ||
Total Assets |
| 79,782,799 |
| 81,066,952 |
| ||
Liabilities: |
|
|
|
|
| ||
Distributions payable |
| 84,255 |
| 126,646 |
| ||
Payable for investments purchased |
| 720,133 |
| 769,638 |
| ||
Payable for capital shares redeemed |
| 22,154 |
| 98,948 |
| ||
Accrued expenses and other payables: |
|
|
|
|
| ||
Investment advisory fees |
| 17,893 |
| 21,555 |
| ||
Administration fees payable to non-related parties |
| 5,805 |
| 5,975 |
| ||
Administration fees payable to related parties |
| 4,473 |
| 4,572 |
| ||
Shareholder service fees |
| 22,280 |
| 28,241 |
| ||
Other fees |
| 21,627 |
| 22,076 |
| ||
Total liabilities |
| 898,620 |
| 1,077,651 |
| ||
Net assets |
| $ | 78,884,179 |
| $ | 79,989,301 |
|
Composition of Net Assets: |
|
|
|
|
| ||
Capital |
| $ | 81,421,503 |
| $ | 77,233,508 |
|
Accumulated (excess of distributions over) net investment income (loss) |
| (78,664 | ) | 320,177 |
| ||
Accumulated net realized gain (loss) from investments |
| (4,084,379 | ) | (298,581 | ) | ||
Net unrealized appreciation on investments |
| 1,625,719 |
| 2,734,197 |
| ||
Net Assets |
| $ | 78,884,179 |
| $ | 79,989,301 |
|
Institutional Class: |
|
|
|
|
| ||
Net assets |
| $ | 48,542,594 |
| $ | 54,723,529 |
|
Shares of beneficial interest |
| 5,056,407 |
| 5,225,792 |
| ||
Net asset value, offering and redemption price per share |
| $ | 9.60 |
| $ | 10.47 |
|
Institutional Plus Class: |
|
|
|
|
| ||
Net assets |
| $ | 30,341,585 |
| $ | 25,265,772 |
|
Shares of beneficial interest |
| 3,157,601 |
| 2,410,893 |
| ||
Net asset value, offering and redemption price per share |
| $ | 9.61 |
| $ | 10.48 |
|
See accompanying Notes to Financial Statements.
|
| BALANCED FUND |
| CORE EQUITY FUND |
| LARGE CAP GROWTH |
| GROWTH |
| SMALL COMPANY |
| |||||
Assets: |
|
|
|
|
|
|
|
|
|
|
| |||||
Investments, at cost |
| $ | 54,140,127 |
| $ | 133,168,212 |
| $ | 39,537,555 |
| $ | 90,335,307 |
| $ | 133,252,069 |
|
Unrealized appreciation of investments |
| 14,071,536 |
| 45,544,508 |
| 17,146,365 |
| 45,471,586 |
| 36,946,518 |
| |||||
Total investments, at value |
| 68,211,663 |
| 178,712,720 |
| 56,683,920 |
| 135,806,893 |
| 170,198,587 |
| |||||
Cash |
| 3,010 |
| 59,561 |
| — |
| — |
| 22,616 |
| |||||
Interest and dividends receivable |
| 308,017 |
| 364,792 |
| 51,353 |
| 31,204 |
| 96,119 |
| |||||
Receivable for capital shares issued |
| 60,825 |
| 4,600 |
| 7,703 |
| 128,890 |
| 149,838 |
| |||||
Receivable for investments sold |
| — |
| 3,158,040 |
| 306,475 |
| — |
| — |
| |||||
Prepaid expenses |
| 14,729 |
| 28,635 |
| 9,411 |
| 13,795 |
| 15,648 |
| |||||
Total Assets |
| 68,598,244 |
| 182,328,348 |
| 57,058,862 |
| 135,980,782 |
| 170,482,808 |
| |||||
Liabilities: |
|
|
|
|
|
|
|
|
|
|
| |||||
Distributions payable |
| — |
| — |
| — |
| — |
| — |
| |||||
Payable for investments purchased |
| 562,150 |
| — |
| — |
| 2,020,130 |
| — |
| |||||
Payable for capital shares redeemed |
| 5,397 |
| 756,062 |
| 39,027 |
| 69,067 |
| 966,726 |
| |||||
Accrued expenses and other payables: |
|
|
|
|
|
|
|
|
|
|
| |||||
Investment advisory fees |
| 35,737 |
| 97,836 |
| 29,092 |
| 70,574 |
| 102,277 |
| |||||
Administration fees payable to non-related parties |
| 4,804 |
| 11,605 |
| 3,623 |
| 8,361 |
| 10,604 |
| |||||
Administration fees payable to related parties |
| 4,002 |
| 10,871 |
| 3,394 |
| 7,842 |
| 9,944 |
| |||||
Shareholder service fees |
| 36,262 |
| 42,029 |
| 13,634 |
| 53,901 |
| 39,662 |
| |||||
Other fees |
| 22,720 |
| 49,573 |
| 20,660 |
| 32,349 |
| 37,538 |
| |||||
Total liabilities |
| 671,072 |
| 967,976 |
| 109,430 |
| 2,262,224 |
| 1,166,751 |
| |||||
Net assets |
| $ | 67,927,172 |
| $ | 181,360,372 |
| $ | 56,949,432 |
| $ | 133,718,558 |
| $ | 169,316,057 |
|
Composition of Net Assets: |
|
|
|
|
|
|
|
|
|
|
| |||||
Capital |
| $ | 52,665,970 |
| $ | 137,311,375 |
| $ | 37,518,826 |
| $ | 86,162,289 |
| $ | 131,216,851 |
|
Accumulated (excess of distributions over) net investment income (loss) |
| 17,977 |
| 2,019,657 |
| 243,163 |
| (124,361 | ) | 1,168,529 |
| |||||
Accumulated net realized gain (loss) from investments |
| 1,171,689 |
| (3,515,168 | ) | 2,041,078 |
| 2,209,044 |
| (15,841 | ) | |||||
Net unrealized appreciation on investments |
| 14,071,536 |
| 45,544,508 |
| 17,146,365 |
| 45,471,586 |
| 36,946,518 |
| |||||
Net Assets |
| $ | 67,927,172 |
| $ | 181,360,372 |
| $ | 56,949,432 |
| $ | 133,718,558 |
| $ | 169,316,057 |
|
Institutional Class: |
|
|
|
|
|
|
|
|
|
|
| |||||
Net assets |
| $ | 55,358,396 |
| $ | 42,225,639 |
| $ | 30,262,877 |
| $ | 86,599,580 |
| $ | 78,688,477 |
|
Shares of beneficial interest |
| 3,395,694 |
| 4,484,610 |
| 3,132,093 |
| 5,208,758 |
| 3,937,963 |
| |||||
Net asset value, offering and redemption price per share |
| $ | 16.30 |
| $ | 9.42 |
| $ | 9.66 |
| $ | 16.63 |
| $ | 19.98 |
|
Institutional Plus Class: |
|
|
|
|
|
|
|
|
|
|
| |||||
Net assets |
| $ | 12,568,776 |
| $ | 139,134,733 |
| $ | 26,686,555 |
| $ | 47,118,978 |
| $ | 90,627,580 |
|
Shares of beneficial interest |
| 774,463 | �� | 14,769,795 |
| 2,747,210 |
| 2,824,693 |
| 4,523,196 |
| |||||
Net asset value, offering and redemption price per share |
| $ | 16.23 |
| $ | 9.42 |
| $ | 9.71 |
| $ | 16.68 |
| $ | 20.04 |
|
See accompanying Notes to Financial Statements.
STATEMENTS OF OPERATIONS
For the Year Ended March 31, 2013
|
| SHORT- |
| INCOME FUND |
| ||
Investment Income: |
|
|
|
|
| ||
Interest |
| $ | 2,116,942 |
| $ | 2,560,595 |
|
Dividend |
| 19,517 |
| 154,957 |
| ||
Foreign tax withholding |
| — |
| — |
| ||
Total Income |
| 2,136,459 |
| 2,715,552 |
| ||
Expenses: |
|
|
|
|
| ||
Investment advisory fees |
| 334,454 |
| 418,632 |
| ||
Administration fees |
| 104,103 |
| 109,176 |
| ||
Shareholder service fees - Institutional Class |
| 123,132 |
| 140,084 |
| ||
Custodian fees |
| 5,160 |
| 5,113 |
| ||
Chief compliance officer fees |
| 8,973 |
| 9,360 |
| ||
Director fees |
| 2,587 |
| 2,697 |
| ||
Transfer agent fees |
| 31,650 |
| 31,847 |
| ||
Registration and filing fees |
| 16,770 |
| 20,692 |
| ||
Other fees |
| 33,039 |
| 32,663 |
| ||
Total expenses before waivers |
| 659,868 |
| 770,264 |
| ||
Expenses waived by Adviser |
| (147,160 | ) | (188,386 | ) | ||
Total Expenses |
| 512,708 |
| 581,878 |
| ||
Net Investment Income (Loss) |
| 1,623,751 |
| 2,133,674 |
| ||
Realized and Unrealized Gain (Loss) On Investments: |
|
|
|
|
| ||
Net realized gain on investment transactions |
| 411,324 |
| 1,093,966 |
| ||
Change in unrealized appreciation (depreciation) on investments |
| 547,176 |
| 489,886 |
| ||
Net realized and unrealized gain (loss) on investments |
| 958,500 |
| 1,583,852 |
| ||
Net increase in net assets from operations |
| $ | 2,582,251 |
| $ | 3,717,526 |
|
See accompanying Notes to Financial Statements.
|
| BALANCED FUND |
| CORE EQUITY FUND |
| LARGE CAP GROWTH |
| GROWTH |
| SMALL COMPANY |
| |||||
Investment Income: |
|
|
|
|
|
|
|
|
|
|
| |||||
Interest |
| $ | 730,419 |
| $ | — |
| $ | — |
| $ | — |
| $ | — |
|
Dividend |
| 695,021 |
| 4,463,086 |
| 880,485 |
| 975,867 |
| 3,186,924 |
| |||||
Foreign tax withholding |
| (1,742 | ) | (51,682 | ) | (5,428 | ) | (6,038 | ) | — |
| |||||
Total Income |
| 1,423,698 |
| 4,411,404 |
| 875,057 |
| 969,829 |
| 3,186,924 |
| |||||
Expenses: |
|
|
|
|
|
|
|
|
|
|
| |||||
Investment advisory fees |
| 483,398 |
| 1,537,109 |
| 545,825 |
| 883,451 |
| 1,232,752 |
| |||||
Administration fees |
| 95,959 |
| 276,279 |
| 82,772 |
| 161,859 |
| 199,306 |
| |||||
Shareholder service fees - Institutional Class |
| 129,688 |
| 140,287 |
| 93,427 |
| 191,502 |
| 156,115 |
| |||||
Custodian fees |
| 5,582 |
| 5,295 |
| 5,740 |
| 5,191 |
| 5,204 |
| |||||
Chief compliance officer fees |
| 8,654 |
| 27,569 |
| 8,145 |
| 15,800 |
| 19,496 |
| |||||
Director fees |
| 2,510 |
| 8,239 |
| 2,422 |
| 4,603 |
| 5,630 |
| |||||
Transfer agent fees |
| 64,936 |
| 54,788 |
| 30,031 |
| 52,412 |
| 47,330 |
| |||||
Registration and filing fees |
| 14,878 |
| 10,073 |
| 15,458 |
| 26,420 |
| 29,551 |
| |||||
Other fees |
| 30,455 |
| 87,657 |
| 30,024 |
| 49,988 |
| 54,104 |
| |||||
Total expenses before waivers |
| 836,060 |
| 2,147,296 |
| 813,844 |
| 1,391,226 |
| 1,749,488 |
| |||||
Expenses waived by Adviser |
| (80,567 | ) | (245,939 | ) | (181,941 | ) | (141,353 | ) | (188,538 | ) | |||||
Total Expenses |
| 755,493 |
| 1,901,357 |
| 631,903 |
| 1,249,873 |
| 1,560,950 |
| |||||
Net Investment Income (Loss) |
| 668,205 |
| 2,510,047 |
| 243,154 |
| (280,044 | ) | 1,625,974 |
| |||||
Realized and Unrealized Gain (Loss) On Investments: |
|
|
|
|
|
|
|
|
|
|
| |||||
Net realized gain on investment transactions |
| 1,535,060 |
| 10,930,318 |
| 2,120,765 |
| 3,028,545 |
| 4,549,876 |
| |||||
Change in unrealized appreciation (depreciation) on investments |
| 1,897,771 |
| 1,937,975 |
| 1,521,088 |
| 8,662,913 |
| 9,613,635 |
| |||||
Net realized and unrealized gain (loss) on investments |
| 3,432,831 |
| 12,868,293 |
| 3,641,853 |
| 11,691,458 |
| 14,163,511 |
| |||||
Net increase in net assets from operations |
| $ | 4,101,036 |
| $ | 15,378,340 |
| $ | 3,885,007 |
| $ | 11,411,414 |
| $ | 15,789,485 |
|
See accompanying Notes to Financial Statements.
STATEMENTS OF CHANGES IN NET ASSETS
|
| SHORT-INTERMEDIATE BOND |
| INCOME FUND |
| ||||||||
|
| For the Year |
| For the Year |
| For the Year |
| For the Year |
| ||||
Operations: |
|
|
|
|
|
|
|
|
| ||||
Net investment income |
| $ | 1,623,751 |
| $ | 1,836,534 |
| $ | 2,133,674 |
| $ | 2,066,661 |
|
Net realized gain (loss) from investment transactions |
| 411,324 |
| (242,017 | ) | 1,093,966 |
| (385,662 | ) | ||||
Change in unrealized appreciation (depreciation) on investments |
| 547,176 |
| 242,635 |
| 489,886 |
| 2,178,083 |
| ||||
Net increase in net assets from operations |
| 2,582,251 |
| 1,837,152 |
| 3,717,526 |
| 3,859,082 |
| ||||
Distributions to Shareholders: |
|
|
|
|
|
|
|
|
| ||||
From net investment income |
|
|
|
|
|
|
|
|
| ||||
Institutional Class |
| (1,213,176 | ) | (1,769,552 | ) | (1,686,448 | ) | (1,898,264 | ) | ||||
Institutional Plus Class |
| (471,591 | ) | (219,522 | ) | (443,173 | ) | (163,826 | ) | ||||
From net realized gains on investments |
|
|
|
|
|
|
|
|
| ||||
Institutional Class |
| (31,965 | ) | (96,000 | ) | — |
| — |
| ||||
Institutional Plus Class |
| (12,507 | ) | (29,322 | ) | — |
| — |
| ||||
Change in net assets from distributions to shareholders |
| (1,729,239 | ) | (2,114,396 | ) | (2,129,621 | ) | (2,062,090 | ) | ||||
Capital Transactions: |
|
|
|
|
|
|
|
|
| ||||
Proceeds from shares issued |
|
|
|
|
|
|
|
|
| ||||
Institutional Class |
| 9,394,778 |
| 10,853,153 |
| 10,890,154 |
| 15,368,729 |
| ||||
Institutional Plus Class |
| 16,521,355 |
| 19,060,890 |
| 14,212,123 |
| 12,344,646 |
| ||||
Proceeds from dividends reinvested |
|
|
|
|
|
|
|
|
| ||||
Institutional Class |
| 177,432 |
| 707,038 |
| 210,664 |
| 524,776 |
| ||||
Institutional Plus Class |
| 467,274 |
| 248,844 |
| 423,417 |
| 163,789 |
| ||||
Cost of shares redeemed |
|
|
|
|
|
|
|
|
| ||||
Institutional Class |
| (11,517,411 | ) | (29,842,775 | ) | (12,066,877 | ) | (19,729,917 | ) | ||||
Institutional Plus Class |
| (2,796,544 | ) | (3,515,516 | ) | (1,601,929 | ) | (676,982 | ) | ||||
Change in net assets from capital transactions |
| 12,246,884 |
| (2,488,366 | ) | 12,067,552 |
| 7,995,041 |
| ||||
Change in net assets |
| 13,099,896 |
| (2,765,610 | ) | 13,655,457 |
| 9,792,033 |
| ||||
Net Assets: |
|
|
|
|
|
|
|
|
| ||||
Beginning of year |
| 65,784,283 |
| 68,549,893 |
| 66,333,844 |
| 56,541,811 |
| ||||
End of year |
| $ | 78,884,179 |
| $ | 65,784,283 |
| $ | 79,989,301 |
| $ | 66,333,844 |
|
Accumulated (excess of distributions over) net investment income (loss) |
| $ | (78,664 | ) | $ | (302,378 | ) | $ | 320,177 |
| $ | 287,187 |
|
Share Transactions Institutional Class: |
|
|
|
|
|
|
|
|
| ||||
Shares issued |
| 982,936 |
| 1,144,027 |
| 1,042,006 |
| 1,505,324 |
| ||||
Shares reinvested |
| 18,591 |
| 74,583 |
| 20,155 |
| 51,822 |
| ||||
Shares redeemed |
| (1,204,694 | ) | (3,163,536 | ) | (1,153,860 | ) | (1,946,066 | ) | ||||
Change in shares |
| (203,167 | ) | (1,944,926 | ) | (91,699 | ) | (388,920 | ) | ||||
Share Transactions Institutional Plus Class: |
|
|
|
|
|
|
|
|
| ||||
Shares issued |
| 1,721,166 |
| 2,026,623 |
| 1,357,896 |
| 1,216,006 |
| ||||
Shares reinvested |
| 48,880 |
| 26,355 |
| 40,461 |
| 15,993 |
| ||||
Shares redeemed |
| (292,302 | ) | (373,121 | ) | (153,204 | ) | (66,259 | ) | ||||
Change in shares |
| 1,477,744 |
| 1,679,857 |
| 1,245,153 |
| 1,165,740 |
| ||||
(a) Institutional Plus Class shares of the Short-Intermediate Bond Fund, Balanced Fund, Large Cap Growth Fund and Growth Opportunities Fund commenced operations on October 14, 2011.
(b) Institutional Plus Class shares of the Income Fund commenced operations on October 28, 2011.
See accompanying Notes to Financial Statements.
|
| BALANCED FUND |
| CORE EQUITY FUND |
| LARGE CAP GROWTH FUND |
| ||||||||||||
|
| For the Year |
| For the Year |
| For the Year |
| For the Year |
| For the Year |
| For the Year |
| ||||||
Operations: |
|
|
|
|
|
|
|
|
|
|
|
|
| ||||||
Net investment income |
| $ | 668,205 |
| $ | 424,976 |
| $ | 2,510,047 |
| $ | 3,075,478 |
| $ | 243,154 |
| $ | 228,727 |
|
Net realized gain (loss) from investment transactions |
| 1,535,060 |
| 1,191,539 |
| 10,930,318 |
| (11,579,405 | ) | 2,120,765 |
| 4,939,583 |
| ||||||
Change in unrealized appreciation (depreciation) on investments |
| 1,897,771 |
| 3,005,131 |
| 1,937,975 |
| 9,993,716 |
| 1,521,088 |
| (1,937,607 | ) | ||||||
Net increase in net assets from operations |
| 4,101,036 |
| 4,621,646 |
| 15,378,340 |
| 1,489,789 |
| 3,885,007 |
| 3,230,703 |
| ||||||
Distributions to Shareholders: |
|
|
|
|
|
|
|
|
|
|
|
|
| ||||||
From net investment income |
|
|
|
|
|
|
|
|
|
|
|
|
| ||||||
Institutional Class |
| (485,126 | ) | (363,642 | ) | (623,028 | ) | (547,085 | ) | (25,987 | ) | (162,348 | ) | ||||||
Institutional Plus Class |
| (177,759 | ) | (68,740 | ) | (2,295,881 | ) | (1,442,342 | ) | (104,524 | ) | (85,774 | ) | ||||||
From net realized gains on investments |
|
|
|
|
|
|
|
|
|
|
|
|
| ||||||
Institutional Class |
| — |
| — |
| — |
| — |
| (1,213,339 | ) | (2,220,954 | ) | ||||||
Institutional Plus Class |
| — |
| — |
| — |
| — |
| (832,930 | ) | (922,721 | ) | ||||||
Change in net assets from distributions to shareholders |
| (662,885 | ) | (432,382 | ) | (2,918,909 | ) | (1,989,427 | ) | (2,176,780 | ) | (3,391,797 | ) | ||||||
Capital Transactions: |
|
|
|
|
|
|
|
|
|
|
|
|
| ||||||
Proceeds from shares issued |
|
|
|
|
|
|
|
|
|
|
|
|
| ||||||
Institutional Class |
| 24,142,222 |
| 39,119,497 |
| 3,185,203 |
| 10,046,144 |
| 2,673,898 |
| 9,078,952 |
| ||||||
Institutional Plus Class |
| 1,742,280 |
| 12,126,381 |
| 11,847,481 |
| 45,596,446 |
| 4,512,014 |
| 27,424,829 |
| ||||||
Proceeds from dividends reinvested |
|
|
|
|
|
|
|
|
|
|
|
|
| ||||||
Institutional Class |
| 461,386 |
| 356,763 |
| 195,245 |
| 192,636 |
| 54,013 |
| 1,456,164 |
| ||||||
Institutional Plus Class |
| 177,759 |
| 68,740 |
| 2,295,881 |
| 1,442,342 |
| 937,454 |
| 1,008,495 |
| ||||||
Cost of shares redeemed |
|
|
|
|
|
|
|
|
|
|
|
|
| ||||||
Institutional Class |
| (24,194,724 | ) | (28,888,454 | ) | (38,288,695 | ) | (48,801,560 | ) | (20,200,170 | ) | (51,135,213 | ) | ||||||
Institutional Plus Class |
| (2,811,738 | ) | (591,838 | ) | (75,771,658 | ) | (26,764,136 | ) | (3,377,271 | ) | (6,678,291 | ) | ||||||
Change in net assets from capital transactions |
| (482,815 | ) | 22,191,089 |
| (96,536,543 | ) | (18,288,128 | ) | (15,400,062 | ) | (18,845,064 | ) | ||||||
Change in net assets |
| 2,955,336 |
| 26,380,353 |
| (84,077,112 | ) | (18,787,766 | ) | (13,691,835 | ) | (19,006,158 | ) | ||||||
Net Assets: |
|
|
|
|
|
|
|
|
|
|
|
|
| ||||||
Beginning of year |
| 64,971,836 |
| 38,591,483 |
| 265,437,484 |
| 284,225,250 |
| 70,641,267 |
| 89,647,425 |
| ||||||
End of year |
| $ | 67,927,172 |
| $ | 64,971,836 |
| $ | 181,360,372 |
| $ | 265,437,484 |
| $ | 56,949,432 |
| $ | 70,641,267 |
|
Accumulated (excess of distributions over) net investment income (loss) |
| $ | 17,977 |
| $ | 10,475 |
| $ | 2,019,657 |
| $ | 2,428,519 |
| $ | 243,163 |
| $ | 130,451 |
|
Share Transactions Institutional Class: |
|
|
|
|
|
|
|
|
|
|
|
|
| ||||||
Shares issued |
| 1,573,937 |
| 2,719,666 |
| 377,892 |
| 1,258,822 |
| 297,979 |
| 1,027,445 |
| ||||||
Shares reinvested |
| 29,918 |
| 24,953 |
| 23,024 |
| 24,760 |
| 6,166 |
| 181,756 |
| ||||||
Shares redeemed |
| (1,598,826 | ) | (2,058,344 | ) | (4,444,703 | ) | (6,252,007 | ) | (2,235,572 | ) | (5,718,505 | ) | ||||||
Change in shares |
| 5,029 |
| 686,275 |
| (4,043,787 | ) | (4,968,425 | ) | (1,931,427 | ) | (4,509,304 | ) | ||||||
Share Transactions Institutional Plus Class: |
|
|
|
|
|
|
|
|
|
|
|
|
| ||||||
Shares issued |
| 112,868 |
| 867,045 |
| 1,413,155 |
| 5,805,974 |
| 490,742 |
| 3,179,407 |
| ||||||
Shares reinvested |
| 11,496 |
| 4,608 |
| 270,741 |
| 184,916 |
| 106,529 |
| 124,954 |
| ||||||
Shares redeemed |
| (181,281 | ) | (40,273 | ) | (9,111,780 | ) | (3,384,429 | ) | (371,188 | ) | (783,234 | ) | ||||||
Change in shares |
| (56,917 | ) | 831,380 |
| (7,427,884 | ) | 2,606,461 |
| 226,083 |
| 2,521,127 |
| ||||||
See accompanying Notes to Financial Statements.
|
| GROWTH OPPORTUNITIES FUND |
| SMALL COMPANY FUND |
| ||||||||
|
| For the Year |
| For the Year |
| For the Year |
| For the Year |
| ||||
Operations: |
|
|
|
|
|
|
|
|
| ||||
Net investment income (loss) |
| $ | (280,044 | ) | $ | (529,164 | ) | $ | 1,625,974 |
| $ | 811,313 |
|
Net realized gain from investment transactions |
| 3,028,545 |
| 5,016,832 |
| 4,549,876 |
| 8,628,619 |
| ||||
Change in unrealized appreciation (depreciation) on investments |
| 8,662,913 |
| (2,231,082 | ) | 9,613,635 |
| (3,514,429 | ) | ||||
Net increase in net assets from operations |
| 11,411,414 |
| 2,256,586 |
| 15,789,485 |
| 5,925,503 |
| ||||
Distributions to Shareholders: |
|
|
|
|
|
|
|
|
| ||||
From net investment income |
|
|
|
|
|
|
|
|
| ||||
Institutional Class |
| — |
| — |
| (315,746 | ) | (199,305 | ) | ||||
Institutional Plus Class |
| — |
| — |
| (618,009 | ) | (333,873 | ) | ||||
From net realized gains on investments |
|
|
|
|
|
|
|
|
| ||||
Institutional Class |
| (1,794,020 | ) | — |
| (2,889,668 | ) | (2,610,404 | ) | ||||
Institutional Plus Class |
| (973,297 | ) | — |
| (3,725,444 | ) | (3,603,552 | ) | ||||
Change in net assets from distributions to shareholders |
| (2,767,317 | ) | — |
| (7,548,867 | ) | (6,747,134 | ) | ||||
Capital Transactions: |
|
|
|
|
|
|
|
|
| ||||
Proceeds from shares issued |
|
|
|
|
|
|
|
|
| ||||
Institutional Class |
| 20,000,797 |
| 40,849,519 |
| 26,280,682 |
| 16,712,037 |
| ||||
Institutional Plus Class |
| 8,618,695 |
| 40,601,632 |
| 12,814,067 |
| 28,986,456 |
| ||||
Proceeds from dividends reinvested |
|
|
|
|
|
|
|
|
| ||||
Institutional Class |
| 978,077 |
| — |
| 1,112,264 |
| 1,669,577 |
| ||||
Institutional Plus Class |
| 973,297 |
| — |
| 4,343,453 |
| 3,937,425 |
| ||||
Cost of shares redeemed |
|
|
|
|
|
|
|
|
| ||||
Institutional Class |
| (20,796,241 | ) | (63,198,326 | ) | (13,000,394 | ) | (33,223,424 | ) | ||||
Institutional Plus Class |
| (8,435,145 | ) | (3,863,224 | ) | (15,818,261 | ) | (13,668,201 | ) | ||||
Change in net assets from capital transactions |
| 1,339,480 |
| 14,389,601 |
| 15,731,811 |
| 4,413,870 |
| ||||
Change in net assets |
| 9,983,577 |
| 16,646,187 |
| 23,972,429 |
| 3,592,239 |
| ||||
Net Assets: |
|
|
|
|
|
|
|
|
| ||||
Beginning of year |
| 123,734,981 |
| 107,088,794 |
| 145,343,628 |
| 141,751,389 |
| ||||
End of year |
| $ | 133,718,558 |
| $ | 123,734,981 |
| $ | 169,316,057 |
| $ | 145,343,628 |
|
Accumulated (excess of distributions over) net investment income (loss) |
| $ | (124,361 | ) | $ | — |
| $ | 1,168,529 |
| $ | 479,305 |
|
Share Transactions Institutional Class: |
|
|
|
|
|
|
|
|
| ||||
Shares issued |
| 1,296,306 |
| 2,815,646 |
| 1,413,301 |
| 914,067 |
| ||||
Shares reinvested |
| 65,643 |
| — |
| 62,557 |
| 100,983 |
| ||||
Shares redeemed |
| (1,370,840 | ) | (4,646,275 | ) | (697,421 | ) | (1,868,599 | ) | ||||
Change in shares |
| (8,891 | ) | (1,830,629 | ) | 778,437 |
| (853,549 | ) | ||||
Share Transactions Institutional Plus Class: |
|
|
|
|
|
|
|
|
| ||||
Shares issued |
| 560,013 |
| 3,027,300 |
| 693,133 |
| 1,645,778 |
| ||||
Shares reinvested |
| 65,147 |
| — |
| 243,740 |
| 237,258 |
| ||||
Shares redeemed |
| (554,956 | ) | (272,811 | ) | (849,036 | ) | (750,566 | ) | ||||
Change in shares |
| 70,204 |
| 2,754,489 |
| 87,837 |
| 1,132,470 |
| ||||
(a) Institutional Plus Class shares of the Short-Intermediate Bond Fund, Balanced Fund, Large Cap Growth Fund and Growth Opportunities Fund commenced operations on October 14, 2011.
See accompanying Notes to Financial Statements.
FINANCIAL HIGHLIGHTS
For a Share Outstanding
|
|
|
| Investment Activities |
| Distributions to |
|
|
|
|
|
|
| Ratios/Supplemental Data |
| ||||||||||||||||||||
Period |
| Net Asset |
| Net |
| Net Realized |
| Total from |
| Net |
| Net Realized |
| Net |
| Total |
| Net |
| Expense |
| Net |
| Expense |
| Portfolio |
| ||||||||
SHORT-INTERMEDIATE BOND FUND |
|
|
|
|
|
|
|
|
|
|
|
|
|
|
|
|
|
|
|
|
|
|
|
|
|
|
| ||||||||
Institutional Class |
|
|
|
|
|
|
|
|
|
|
|
|
|
|
|
|
|
|
|
|
|
|
|
|
|
|
| ||||||||
03/31/13 |
| $ | 9.48 |
| $ | 0.23 | (c) | $ | 0.13 |
| $ | 0.36 |
| $ | (0.23 | ) | $ | (0.01 | ) | $ | 9.60 |
| 3.85 | % | $ | 48,543 |
| 0.83 | % | 2.36 | % | 1.05 | % | 50 | % |
03/31/12 |
| 9.51 |
| 0.25 | (c) | 0.01 |
| 0.26 |
| (0.27 | ) | (0.02 | ) | 9.48 |
| 2.80 |
| 49,848 |
| 0.84 |
| 2.66 |
| 1.06 |
| 42 |
| ||||||||
03/31/11 |
| 9.51 |
| 0.28 | (c) | 0.03 |
| 0.31 |
| (0.31 | ) | — |
| 9.51 |
| 3.27 |
| 68,550 |
| 0.82 |
| 2.94 |
| 1.08 |
| 45 |
| ||||||||
03/31/10 |
| 9.20 |
| 0.32 | (c) | 0.34 |
| 0.66 |
| (0.35 | ) | — |
| 9.51 |
| 7.18 |
| 71,503 |
| 0.86 |
| 3.39 |
| 1.17 |
| 62 |
| ||||||||
03/31/09 |
| 9.45 |
| 0.33 |
| (0.14 | ) | 0.19 |
| (0.39 | ) | (0.05 | ) | 9.20 |
| 2.05 |
| 49,125 |
| 0.90 |
| 3.53 |
| 1.20 |
| 50 |
| ||||||||
Institutional Plus Class |
|
|
|
|
|
|
|
|
|
|
|
|
|
|
|
|
|
|
|
|
|
|
|
|
|
|
| ||||||||
03/31/13 |
| 9.49 |
| 0.25 | (c) | 0.14 |
| 0.39 |
| (0.26 | ) | (0.01 | ) | 9.61 |
| 4.11 |
| 30,342 |
| 0.58 |
| 2.59 |
| 0.80 |
| 50 |
| ||||||||
03/31/12(d) |
| 9.40 |
| 0.13 | (c) | 0.12 |
| 0.25 |
| (0.14 | ) | (0.02 | ) | 9.49 |
| 2.62 |
| 15,936 |
| 0.61 |
| 2.98 |
| 0.83 |
| 42 |
| ||||||||
|
|
|
|
|
|
|
|
|
|
|
|
|
|
|
|
|
|
|
|
|
|
|
|
|
|
|
| ||||||||
INCOME FUND |
|
|
|
|
|
|
|
|
|
|
|
|
|
|
|
|
|
|
|
|
|
|
|
|
|
|
| ||||||||
Institutional Class |
|
|
|
|
|
|
|
|
|
|
|
|
|
|
|
|
|
|
|
|
|
|
|
|
|
|
| ||||||||
03/31/13 |
| 10.23 |
| 0.31 | (c) | 0.24 |
| 0.55 |
| (0.31 | ) | — |
| 10.47 |
| 5.46 |
| 54,724 |
| 0.88 |
| 3.01 |
| 1.15 |
| 42 |
| ||||||||
03/31/12 |
| 9.91 |
| 0.36 | (c) | 0.32 |
| 0.68 |
| (0.36 | ) | — |
| 10.23 |
| 6.93 |
| 54,401 |
| 0.91 |
| 3.56 |
| 1.18 |
| 38 |
| ||||||||
03/31/11 |
| 9.79 |
| 0.42 | (c) | 0.10 |
| 0.52 |
| (0.40 | ) | — |
| 9.91 |
| 5.37 |
| 56,542 |
| 0.83 |
| 4.26 |
| 1.18 |
| 68 |
| ||||||||
03/31/10 |
| 9.29 |
| 0.45 | (c) | 0.51 |
| 0.96 |
| (0.46 | ) | — |
| 9.79 |
| 10.49 |
| 60,098 |
| 0.77 |
| 4.72 |
| 1.27 |
| 71 |
| ||||||||
03/31/09 |
| 9.69 |
| 0.42 |
| (0.39 | ) | 0.03 |
| (0.43 | ) | — |
| 9.29 |
| 0.40 |
| 51,965 |
| 0.79 |
| 4.47 |
| 1.33 |
| 63 |
| ||||||||
Institutional Plus Class |
|
|
|
|
|
|
|
|
|
|
|
|
|
|
|
|
|
|
|
|
|
|
|
|
|
|
| ||||||||
03/31/13 |
| 10.24 |
| 0.34 | (c) | 0.24 |
| 0.58 |
| (0.34 | ) | — |
| 10.48 |
| 5.70 |
| 25,266 |
| 0.63 |
| 3.24 |
| 0.90 |
| 42 |
| ||||||||
03/31/12(d) |
| 10.14 |
| 0.15 | (c) | 0.10 |
| 0.25 |
| (0.15 | ) | — |
| 10.24 |
| 2.47 |
| 11,933 |
| 0.66 |
| 3.45 |
| 0.93 |
| 38 |
| ||||||||
|
|
|
|
|
|
|
|
|
|
|
|
|
|
|
|
|
|
|
|
|
|
|
|
|
|
|
| ||||||||
BALANCED FUND |
|
|
|
|
|
|
|
|
|
|
|
|
|
|
|
|
|
|
|
|
|
|
|
|
|
|
| ||||||||
Institutional Class |
|
|
|
|
|
|
|
|
|
|
|
|
|
|
|
|
|
|
|
|
|
|
|
|
|
|
| ||||||||
03/31/13 |
| 15.39 |
| 0.15 | (c) | 0.90 |
| 1.05 |
| (0.14 | ) | — |
| 16.30 |
| 6.89 |
| 55,358 |
| 1.22 |
| 0.98 |
| 1.35 |
| 27 |
| ||||||||
03/31/12 |
| 14.27 |
| 0.13 | (c) | 1.12 |
| 1.25 |
| (0.13 | ) | — |
| 15.39 |
| 8.82 |
| 52,199 |
| 1.25 |
| 0.93 |
| 1.38 |
| 25 |
| ||||||||
03/31/11 |
| 12.44 |
| 0.22 | (c) | 1.82 |
| 2.04 |
| (0.21 | ) | — |
| 14.27 |
| 16.56 |
| 38,591 |
| 1.22 |
| 1.67 |
| 1.37 |
| 34 |
| ||||||||
03/31/10 |
| 8.70 |
| 0.17 | (c) | 3.74 |
| 3.91 |
| (0.17 | ) | — |
| 12.44 |
| 45.17 |
| 29,898 |
| 1.37 |
| 1.57 |
| 1.53 |
| 70 |
| ||||||||
03/31/09 |
| 12.36 |
| 0.24 |
| (3.44 | ) | (3.20 | ) | (0.24 | ) | (0.22 | ) | 8.70 |
| (26.13 | ) | 21,861 |
| 1.35 |
| 2.28 |
| 1.51 |
| 60 |
| ||||||||
Institutional Plus Class |
|
|
|
|
|
|
|
|
|
|
|
|
|
|
|
|
|
|
|
|
|
|
|
|
|
|
| ||||||||
03/31/13 |
| 15.36 |
| 0.19 | (c) | 0.90 |
| 1.09 |
| (0.22 | ) | — |
| 16.23 |
| 7.17 |
| 12,569 |
| 0.97 |
| 1.24 |
| 1.10 |
| 27 |
| ||||||||
03/31/12(d) |
| 13.90 |
| 0.07 | (c) | 1.47 |
| 1.54 |
| (0.08 | ) | — |
| 15.36 |
| 11.13 |
| 12,773 |
| 1.02 |
| 1.06 |
| 1.15 |
| 25 |
| ||||||||
See accompanying Notes to Financial Statements.
|
|
|
| Investment Activities |
| Distributions to |
|
|
|
|
|
|
| Ratios/Supplemental Data |
| ||||||||||||||||||||
Period |
| Net Asset |
| Net |
| Net Realized |
| Total from |
| Net |
| Net Realized |
| Net |
| Total |
| Net |
| Expense |
| Net |
| Expense |
| Portfolio |
| ||||||||
CORE EQUITY FUND |
|
|
|
|
|
|
|
|
|
|
|
|
|
|
|
|
|
|
|
|
|
|
|
|
|
|
| ||||||||
Institutional Class |
|
|
|
|
|
|
|
|
|
|
|
|
|
|
|
|
|
|
|
|
|
|
|
|
|
|
| ||||||||
03/31/13 |
| $ | 8.62 |
| $ | 0.09 | (c) | $ | 0.82 |
| $ | 0.91 |
| $ | (0.11 | ) | $ | — |
| $ | 9.42 |
| 10.72 | % | $ | 42,226 |
| 1.11 | % | 1.03 | % | 1.23 | % | 20 | % |
03/31/12 |
| 8.59 |
| 0.08 | (c) | 0.01 |
| 0.09 |
| (0.06 | ) | — |
| 8.62 |
| 1.13 |
| 73,538 |
| 1.11 |
| 0.98 |
| 1.23 |
| 29 |
| ||||||||
03/31/11 |
| 7.92 |
| 0.06 | (c) | 0.63 |
| 0.69 |
| (0.02 | ) | — |
| 8.59 |
| 8.69 |
| 115,919 |
| 1.15 |
| 0.82 |
| 1.29 |
| 32 |
| ||||||||
03/31/10 |
| 5.54 |
| 0.05 | (c) | 2.39 |
| 2.44 |
| (0.06 | ) | — |
| 7.92 |
| 44.10 |
| 111,730 |
| 1.18 |
| 0.78 |
| 1.34 |
| 24 |
| ||||||||
03/31/09 |
| 8.72 |
| 0.09 |
| (3.07 | ) | (2.98 | ) | (0.09 | ) | (0.11 | ) | 5.54 |
| (34.36 | ) | 70,000 |
| 1.24 |
| 1.34 |
| 1.40 |
| 28 |
| ||||||||
Institutional Plus Class |
|
|
|
|
|
|
|
|
|
|
|
|
|
|
|
|
|
|
|
|
|
|
|
|
|
|
| ||||||||
03/31/13 |
| 8.65 |
| 0.11 | (c) | 0.81 |
| 0.92 |
| (0.15 | ) | — |
| 9.42 |
| 10.85 |
| 139,135 |
| 0.86 |
| 1.29 |
| 0.98 |
| 20 |
| ||||||||
03/31/12 |
| 8.59 |
| 0.10 | (c) | 0.02 |
| 0.12 |
| (0.06 | ) | — |
| 8.65 |
| 1.53 |
| 191,900 |
| 0.84 |
| 1.30 |
| 0.98 |
| 29 |
| ||||||||
03/31/11(d) |
| 8.17 |
| 0.03 | (c) | 0.39 |
| 0.42 |
| — |
| — |
| 8.59 |
| 5.14 |
| 168,306 |
| 0.85 |
| 1.43 |
| 1.01 |
| 32 |
| ||||||||
|
|
|
|
|
|
|
|
|
|
|
|
|
|
|
|
|
|
|
|
|
|
|
|
|
|
|
| ||||||||
LARGE CAP GROWTH FUND |
|
|
|
|
|
|
|
|
|
|
|
|
|
|
|
|
|
|
|
|
|
|
|
|
|
|
| ||||||||
Institutional Class |
|
|
|
|
|
|
|
|
|
|
|
|
|
|
|
|
|
|
|
|
|
|
|
|
|
|
| ||||||||
03/31/13 |
| 9.29 |
| 0.03 | (c) | 0.68 |
| 0.71 |
| (0.01 | ) | (0.33 | ) | 9.66 |
| 8.00 |
| 30,263 |
| 1.14 |
| 0.30 |
| 1.44 |
| 45 |
| ||||||||
03/31/12 |
| 9.36 |
| 0.03 | (c) | 0.36 |
| 0.39 |
| (0.03 | ) | (0.43 | ) | 9.29 |
| 4.97 |
| 47,059 |
| 1.20 |
| 0.29 |
| 1.43 |
| 131 |
| ||||||||
03/31/11 |
| 8.73 |
| 0.03 | (c) | 0.77 |
| 0.80 |
| (0.02 | ) | (0.15 | ) | 9.36 |
| 9.19 |
| 89,647 |
| 1.26 |
| 0.36 |
| 1.44 |
| 18 |
| ||||||||
03/31/10 |
| 5.98 |
| 0.02 | (c) | 2.75 |
| 2.77 |
| (0.02 | ) | — |
| 8.73 |
| 46.40 |
| 81,220 |
| 1.22 |
| 0.32 |
| 1.53 |
| 14 |
| ||||||||
03/31/09 |
| 8.60 |
| 0.05 |
| (2.62 | ) | (2.57 | ) | (0.05 | ) | — |
| 5.98 |
| (29.94 | ) | 30,771 |
| 0.99 |
| 0.84 |
| 1.55 |
| 18 |
| ||||||||
Institutional Plus Class |
|
|
|
|
|
|
|
|
|
|
|
|
|
|
|
|
|
|
|
|
|
|
|
|
|
|
| ||||||||
03/31/13 |
| 9.35 |
| 0.05 | (c) | 0.68 |
| 0.73 |
| (0.04 | ) | (0.33 | ) | 9.71 |
| 8.25 |
| 26,687 |
| 0.89 |
| 0.56 |
| 1.19 |
| 45 |
| ||||||||
03/31/12(d) |
| 8.61 |
| 0.02 | (c) | 1.19 |
| 1.21 |
| (0.04 | ) | (0.43 | ) | 9.35 |
| 14.88 |
| 23,583 |
| 0.88 |
| 0.47 |
| 1.18 |
| 131 |
| ||||||||
|
|
|
|
|
|
|
|
|
|
|
|
|
|
|
|
|
|
|
|
|
|
|
|
|
|
|
| ||||||||
GROWTH OPPORTUNITIES FUND |
|
|
|
|
|
|
|
|
|
|
|
|
|
|
|
|
|
|
|
|
|
|
|
|
|
|
| ||||||||
Institutional Class |
|
|
|
|
|
|
|
|
|
|
|
|
|
|
|
|
|
|
|
|
|
|
|
|
|
|
| ||||||||
03/31/13 |
| 15.52 |
| (0.05 | )(c) | 1.53 |
| 1.48 |
| — |
| (0.37 | ) | 16.63 |
| 9.79 |
| 86,600 |
| 1.15 |
| (0.33 | ) | 1.27 |
| 55 |
| ||||||||
03/31/12 |
| 15.19 |
| (0.08 | )(c) | 0.41 |
| 0.33 |
| — |
| — |
| 15.52 |
| 2.17 |
| 80,961 |
| 1.16 |
| (0.55 | ) | 1.28 |
| 72 |
| ||||||||
03/31/11 |
| 11.50 |
| 0.02 | (c) | 3.72 |
| 3.74 |
| (0.05 | )(e) | — |
| 15.19 |
| 32.54 |
| 107,089 |
| 1.16 |
| 0.18 |
| 1.30 |
| 45 |
| ||||||||
03/31/10 |
| 7.36 |
| (0.01 | )(c) | 4.15 |
| 4.14 |
| — |
| — |
| 11.50 |
| 56.25 |
| 68,427 |
| 1.18 |
| (0.11 | ) | 1.35 |
| 54 |
| ||||||||
03/31/09 |
| 13.16 |
| 0.05 |
| (4.44 | ) | (4.39 | ) | (0.02 | ) | (1.39 | )(e) | 7.36 |
| (33.91 | ) | 41,797 |
| 1.27 |
| 0.48 |
| 1.43 |
| 64 |
| ||||||||
Institutional Plus Class |
|
|
|
|
|
|
|
|
|
|
|
|
|
|
|
|
|
|
|
|
|
|
|
|
|
|
| ||||||||
03/31/13 |
| 15.53 |
| (0.01 | )(c) | 1.53 |
| 1.52 |
| — |
| (0.37 | ) | 16.68 |
| 10.05 |
| 47,119 |
| 0.90 |
| (0.07 | ) | 1.02 |
| 55 |
| ||||||||
03/31/12(d) |
| 13.31 |
| (0.01 | )(c) | 2.23 |
| 2.22 |
| — |
| — |
| 15.53 |
| 16.68 |
| 42,774 |
| 0.93 |
| (0.13 | ) | 1.05 |
| 72 |
| ||||||||
See accompanying Notes to Financial Statements.
|
|
|
| Investment Activities |
| Distributions to |
|
|
|
|
|
|
| Ratios/Supplemental Data |
| ||||||||||||||||||||
Period |
| Net Asset |
| Net |
| Net Realized |
| Total from |
| Net |
| Net Realized |
| Net |
| Total |
| Net |
| Expense |
| Net |
| Expense |
| Portfolio |
| ||||||||
SMALL COMPANY FUND |
|
|
|
|
|
|
|
|
|
|
|
|
|
|
|
|
|
|
|
|
|
|
|
|
|
|
| ||||||||
Institutional Class |
|
|
|
|
|
|
|
|
|
|
|
|
|
|
|
|
|
|
|
|
|
|
|
|
|
|
| ||||||||
03/31/13 |
| $ | 19.11 |
| $ | 0.18 | (c) | $ | 1.63 |
| $ | 1.81 |
| $ | (0.09 | ) | $ | (0.85 | ) | $ | 19.98 |
| 10.11 | % | $ | 78,688 |
| 1.22 | % | 0.97 | % | 1.35 | % | 19 | % |
03/31/12 |
| 19.37 |
| 0.09 | (c) | 0.59 |
| 0.68 |
| (0.07 | ) | (0.87 | ) | 19.11 |
| 4.25 |
| 60,370 |
| 1.22 |
| 0.47 |
| 1.35 |
| 30 |
| ||||||||
03/31/11 |
| 16.56 |
| 0.11 | (c) | 3.89 |
| 4.00 |
| (0.01 | ) | (1.18 | ) | 19.37 |
| 24.83 |
| 77,747 |
| 1.26 |
| 0.64 |
| 1.41 |
| 28 |
| ||||||||
03/31/10 |
| 9.90 |
| 0.06 | (c) | 6.66 |
| 6.72 |
| (0.06 | ) | — |
| 16.56 |
| 68.04 |
| 64,737 |
| 1.34 |
| 0.47 |
| 1.50 |
| 30 |
| ||||||||
03/31/09 |
| 15.65 |
| 0.12 |
| (5.46 | ) | (5.34 | ) | (0.12 | ) | (0.29 | ) | 9.90 |
| (34.47 | ) | 30,051 |
| 1.43 |
| 0.88 |
| 1.59 |
| 32 |
| ||||||||
Institutional Plus Class |
|
|
|
|
|
|
|
|
|
|
|
|
|
|
|
|
|
|
|
|
|
|
|
|
|
|
| ||||||||
03/31/13 |
| 19.16 |
| 0.23 | (c) | 1.64 |
| 1.87 |
| (0.14 | ) | (0.85 | ) | 20.04 |
| 10.43 |
| 90,628 |
| 0.97 |
| 1.23 |
| 1.10 |
| 19 |
| ||||||||
03/31/12 |
| 19.38 |
| 0.13 | (c) | 0.60 |
| 0.73 |
| (0.08 | ) | (0.87 | ) | 19.16 |
| 4.51 |
| 84,974 |
| 0.96 |
| 0.74 |
| 1.10 |
| 30 |
| ||||||||
03/31/11(d) |
| 18.09 |
| 0.01 | (c) | 1.28 |
| 1.29 |
| — |
| — |
| 19.38 |
| 7.13 |
| 64,005 |
| 0.93 |
| 0.22 |
| 1.10 |
| 28 |
| ||||||||
* | Ratios excluding contractual and voluntary waivers. |
(a) | Not annualized for periods less than one year. |
(b) | Annualized for periods less than one year. |
(c) | Per share data calculated using average shares method. |
(d) | Commencement of Operations of Institutional Plus Class shares was as follows: Core Equity Fund and Small Company Fund — December 17, 2010; Short-Intermediate Bond Fund, Balanced Fund, Large Cap Growth Fund and Growth Opportunities Fund — October 14, 2011; Income Fund — October 28, 2011. |
(e) | Distribution amount for the Growth Opportunities Fund includes a return of capital distribution of $0.10 and $0.03 per share for the years ended March 31, 2009 and March 31, 2011, respectively. |
See accompanying Notes to Financial Statements.
NOTES TO FINANCIAL STATEMENTS
March 31, 2013
1. Organization
Tributary Funds, Inc. (the “Company”) was organized in October 1994 as a Nebraska corporation and is registered under the Investment Company Act of 1940, as amended (the “1940 Act”), as a diversified open-end management investment company issuing its shares in series. The Company consists of seven series, the Short-Intermediate Bond Fund, the Income Fund, the Balanced Fund, the Core Equity Fund, the Large Cap Growth Fund, the Growth Opportunities Fund and the Small Company Fund (collectively, the “Funds” and individually, a “Fund”). Each series represents a distinct portfolio with its own investment objectives and policies.
All Funds offer Institutional Class and Institutional Plus Class shares without a sales charge. The two classes differ principally in applicable minimum investment and shareholder servicing fees. Shareholders bear the common expenses of each Fund and earn income and realized gains/losses from each Fund pro rata based on the average daily net assets of each class, without discrimination between share classes. Each share class also has different voting rights on matters affecting a single class. No class has preferential dividend rights.
Under the Company’s organizational documents, the Company shall indemnify its Officers and Directors against certain liabilities arising out of the performance of their duties to the Company. In addition, in the normal course of business, the Company may enter into contracts with its vendors and others that provide general indemnifications. The Company’s maximum exposure under these arrangements is unknown, as this would involve future claims that may be made against the Company. However, based on experience, the Company expects the risk of loss to be remote.
2. Significant Accounting Policies
The following is a summary of significant accounting policies consistently followed by the Company in the preparation of its financial statements. The policies are in conformity with accounting principles generally accepted in the United States of America (“GAAP”). The preparation of financial statements requires management to make estimates and assumptions that affect the reported amounts of assets and liabilities, the disclosure of contingent assets and liabilities at the date of financial statements and the reported amounts of income and expenses for the period. Actual results could differ from those estimates.
Security Valuation
The net asset value (“NAV”) per share of each Fund is determined each business day as of the close of the New York Stock Exchange (“NYSE”), which is normally 4 p.m. Eastern Time. In valuing a Fund’s assets for calculating the NAV, securities listed on a securities exchange, market or automated quotation system for which quotations are readily available, including traded over the counter securities, are valued at the official closing price on the primary exchange or market (foreign or domestic) on which they traded or, if there is no such reported price on the valuation date, at the most recent quoted sale price or bid price. Investments in mutual funds are valued at the NAV per share determined as of the close of the NYSE. Short-term debt investments (maturing within 60 days) may be valued on an amortized cost basis, unless such value does not approximate market value. Debt securities (other than short-term investments) are valued at prices furnished by pricing services and generally reflect last reported sales price if the security is actively traded or an evaluated bid price obtained by employing methodologies that utilize actual market transactions; broker supplied valuations; or factors such as yield, maturity, call features, credit ratings, or developments relating to specific securities in arriving at the valuation. Prices provided by pricing services are subject to review and determination of the appropriate price whenever a furnished price is significantly different from the previous day’s furnished price.
Securities for which quotations are not readily available are valued at fair value as determined in good faith by the Company’s Fair Value Committee (“Fair Value Committee”) pursuant to procedures established by the Company’s Board of Directors (“Board”). Situations that may require an investment to be fair valued include instances where a security is thinly traded, halted, or restricted as to resale. In addition, investments may be fair valued based on the occurrence of a significant event. Significant events may be specific to a particular issuer, such as mergers, restructurings, or defaults. Alternatively, significant events may affect an entire market, such as natural disasters, government actions, and significant changes in the value of U.S. securities markets. Securities are fair valued based on observable and unobservable inputs, including the Fair Value Committee’s own assumptions in determining fair value. Factors used in determining fair value include, but are not limited to: type of security or asset, trading activity of similar markets or securities, fundamental analytical data relating to the investment, evaluation of the forces that
NOTES TO FINANCIAL STATEMENTS
March 31, 2013
influence the market in which the security is purchased and sold, and information as to any transactions or offers with respect to the security.
Under the Company’s pricing and valuation procedures, the Board has delegated the daily operational oversight of the securities valuation function to the Fair Value Committee, which consists of representatives from the Funds’ adviser, sub-adviser and Treasurer, who serves on the committee as a non-voting member. The Fair Value Committee is responsible for determining fair valuations for any security for which market quotations are not readily available. For those securities fair valued under procedures adopted by the Board, the Fair Value Committee reviews and affirms the reasonableness of the fair valuation determinations after considering all relevant information that is reasonably available. The Fair Valuation Committee’s determinations are subject to review by the Funds’ Board at its next regularly scheduled meeting covering the calendar quarter in which the fair valuation was determined.
The Funds use a framework for measuring fair value. Fair value is defined as the price that would be received to sell an asset or paid to transfer a liability in an orderly transaction between market participants (exit price). One component of fair value is a three-tier fair value hierarchy. The basis of the tiers is dependent upon various “inputs” used to determine the value of the Funds’ investments. These inputs are summarized in the three broad levels listed below:
Level 1 — includes valuations based on quoted prices of identical securities in active markets including valuations for securities listed on a national or foreign stock exchange or investments in mutual funds.
Level 2 — includes valuations for which all significant inputs are observable, either directly or indirectly. Direct observable inputs include broker quotes, closing prices of similar securities in active markets, closing prices for identical or similar securities in non-active markets, or corporate action or reorganization entitlement values. Indirect significant observable inputs include factors such as interest rates, yield curves, prepayment speeds or credit ratings. Level 2 includes valuations for fixed income securities priced by pricing services, broker quotes in active markets, securities subject to corporate actions or ADRs and GDRs for which quoted prices in active markets are not available.
Level 3 — includes valuations based on inputs that are unobservable and significant to the fair value measurement, including the Fair Value Committee’s own assumptions in determining the fair value of the investment. Inputs used to determine the fair value of Level 3 securities include security specific inputs such as: credit quality, issuer news, trading characteristics, or industry specific inputs such as: trading activity of similar markets or securities, changes in the security’s underlying index, or comparable securities’ models. Level 3 valuations include securities that are priced based on single source broker quotes, where prices may be unavailable due to halted trading, restricted to resale due to market events, newly issued or investments for which reliable quotes are not available.
To assess the continuing appropriateness of security valuations, the Co-Administrator regularly compares current day prices with prior day prices, transaction prices and alternative vendor prices. When the comparison results exceed pre-defined thresholds, the Co-Administrator challenges the prices exceeding tolerance levels with the pricing service or broker. To substantiate Level 3 unobservable inputs, the Adviser and Co-Administrator use a variety of techniques as appropriate, including, transaction back-testing or disposition analysis and review of related market activity.
The inputs or methodology used for valuing investments are not necessarily an indication of the risk associated with investing in those investments.
NOTES TO FINANCIAL STATEMENTS
March 31, 2013
The following is a summary of the inputs used to value each Fund’s investments as of March 31, 2013, by category:
|
| LEVEL 1 - |
| LEVEL 2 - |
| LEVEL 3 - |
| Total |
| ||||
Short-Intermediate Bond Fund |
|
|
|
|
|
|
|
|
| ||||
Non-U.S. Government Agency Asset-Backed Securities |
| $ | — |
| $ | 21,106,888 |
| $ | 345,463 |
| $ | 21,452,351 |
|
Corporate Bonds |
| — |
| 23,901,268 |
| — |
| 23,901,268 |
| ||||
Government and Agency Obligations |
| — |
| 29,679,642 |
| — |
| 29,679,642 |
| ||||
Preferred Stocks |
| — |
| 504,900 |
| — |
| 504,900 |
| ||||
Short Term Investments |
| 3,647,569 |
| — |
| — |
| 3,647,569 |
| ||||
Total |
| $ | 3,647,569 |
| $ | 75,192,698 |
| $ | 345,463 |
| $ | 79,185,730 |
|
Income Fund |
|
|
|
|
|
|
|
|
| ||||
Non-U.S. Government Agency Asset-Backed Securities |
| $ | — |
| $ | 21,003,462 |
| $ | 573,272 |
| $ | 21,576,734 |
|
Corporate Bonds |
| — |
| 18,317,119 |
| — |
| 18,317,119 |
| ||||
Government and Agency Obligations |
| — |
| 35,186,490 |
| — |
| 35,186,490 |
| ||||
Preferred Stock |
| — |
| 532,440 |
| — |
| 532,440 |
| ||||
Exchange Traded Funds |
| 476,185 |
| — |
| — |
| 476,185 |
| ||||
Investment Company |
| 1,448,798 |
| — |
| — |
| 1,448,798 |
| ||||
Short Term Investments |
| 2,836,311 |
| — |
| — |
| 2,836,311 |
| ||||
Total |
| $ | 4,761,294 |
| $ | 75,039,511 |
| $ | 573,272 |
| $ | 80,374,077 |
|
Balanced Fund |
|
|
|
|
|
|
|
|
| ||||
Common Stocks |
| $ | 41,823,725 |
| $ | — |
| $ | — |
| $ | 41,823,725 |
|
Corporate Bonds |
| — |
| 15,988,016 |
| — |
| 15,988,016 |
| ||||
Government and Agency Obligations |
| — |
| 6,082,444 |
| — |
| 6,082,444 |
| ||||
Exchange Traded Funds |
| 559,952 |
| — |
| — |
| 559,952 |
| ||||
Short Term Investments |
| 3,757,526 |
| — |
| — |
| 3,757,526 |
| ||||
Total |
| $ | 46,141,203 |
| $ | 22,070,460 |
| $ | — |
| $ | 68,211,663 |
|
Core Equity Fund |
|
|
|
|
|
|
|
|
| ||||
Common Stocks |
| $ | 174,926,821 |
| $ | — |
| $ | — |
| $ | 174,926,821 |
|
Short Term Investments |
| 3,785,899 |
| — |
| — |
| 3,785,899 |
| ||||
Total |
| $ | 178,712,720 |
| $ | — |
| $ | — |
| $ | 178,712,720 |
|
Large Cap Growth Fund |
|
|
|
|
|
|
|
|
| ||||
Common Stocks |
| $ | 55,817,475 |
| $ | — |
| $ | — |
| $ | 55,817,475 |
|
Short Term Investments |
| 866,445 |
| — |
| — |
| 866,445 |
| ||||
Total |
| $ | 56,683,920 |
| $ | — |
| $ | — |
| $ | 56,683,920 |
|
Growth Opportunities Fund |
|
|
|
|
|
|
|
|
| ||||
Common Stocks |
| $ | 128,464,093 |
| $ | — |
| $ | — |
| $ | 128,464,093 |
|
Short Term Investments |
| 7,342,800 |
| — |
| — |
| 7,342,800 |
| ||||
Total |
| $ | 135,806,893 |
| $ | — |
| $ | — |
| $ | 135,806,893 |
|
Small Company Fund |
|
|
|
|
|
|
|
|
| ||||
Common Stocks |
| $ | 164,236,262 |
| $ | — |
| $ | — |
| $ | 164,236,262 |
|
Short Term Investments |
| 5,962,325 |
| — |
| — |
| 5,962,325 |
| ||||
Total |
| $ | 170,198,587 |
| $ | — |
| $ | — |
| $ | 170,198,587 |
|
The Funds recognize transfers between levels as of the beginning of the year. There were no significant transfers into or out of Level 1, 2 or 3 during the year ended March 31, 2013. There were no significant Level 3 valuations for which unobservable valuation inputs were developed at March 31, 2013.
NOTES TO FINANCIAL STATEMENTS
March 31, 2013
Guarantees and Indemnifications
In the normal course of business, the Company may enter into contracts that contain a variety of representations which provide general indemnifications for certain liabilities. Each Fund’s maximum exposure under these arrangements is unknown. However, since their commencement of operations, the Funds have not had claims or losses pursuant to these contracts and expect the risk of loss to be remote.
Under the Company’s organizational documents, its officers and Directors are indemnified against certain liabilities arising out of the performance of their duties to the Funds. In addition, certain of the Company’s contracts with service providers contain general indemnification clauses. The Funds’ maximum exposure under these arrangements is unknown since the amount of any future claims that may be made against the Funds cannot be determined and the Funds have no historical basis for predicting the likelihood of any such claims.
Securities Transactions, Investment Income and Foreign Taxes
Securities transactions are accounted for no later than one business day following trade date. For financial reporting purposes, however, on the last business day of the reporting period, security transactions are accounted for on trade date. Interest income is recognized on the accrual basis and includes, where applicable, the amortization of premium or accretion of discount. Dividend income is recorded on the ex-dividend date. Dividends and interest from non-U.S. sources received by a Fund are generally subject to non-U.S. net withholding taxes. Such withholding taxes may be reduced or eliminated under the terms of applicable U.S. income tax treaties, and each Fund intends to undertake any procedural steps required to claim the benefits of such treaties. Gains or losses realized on the sales of securities are determined by comparing the identified cost of the security lot sold with the net sales proceeds.
Restricted Securities
A restricted security is a security which has been purchased through a private offering and cannot be resold to the general public without registering the transaction under the Securities Act of 1933, as amended (the “1933 Act”), or pursuant to the resale limitations provided by Rule 144A under the 1933 Act, or an exemption from the registration requirements of the 1933 Act. Whether a restricted security is illiquid or not is determined pursuant to procedures established by the Board. Not all restricted securities are considered illiquid. As of March 31, 2013, the Balanced Fund held the following Rule 144A security that was deemed illiquid:
Security |
| Acquisition |
| Acquisition |
| Market |
| Percentage of |
| ||
Commonwealth Bank of Australia, 2.95%, 04/13/20 |
| 3/31/10 |
| $ | 500,000 |
| $ | 529,405 |
| 0.8 | % |
Allocation of Expenses
Expenses directly attributable to a Fund are charged directly to that Fund, while expenses which are attributable to more than one Fund are allocated among the respective Funds based upon relative net assets or another appropriate basis. Expenses directly attributable to a class are charged directly to that class, while expenses attributable to both classes are allocated to each class based upon the ratio of net assets for each class as a percentage of total net assets.
Distributions to Shareholders
Dividends from net investment income are declared daily and paid monthly for the Short-Intermediate Bond and Income Funds. The Balanced Fund declares and pays dividends from net investment income quarterly. The Core Equity Fund, Large Cap Growth Fund, Growth Opportunities Fund and Small Company Fund declare and pay dividends from net investment income, if any, annually. Distributions of net realized capital gains, if any, are declared and distributed at least annually for all the Funds only to the extent they exceeded available capital loss carryovers. The amount and timing of distributions are determined in accordance with federal income tax regulations which may differ from GAAP.
3. Related Party Transactions and Fees and Agreements
Tributary Capital Management, LLC (“Tributary”), a subsidiary of First National Bank of Omaha (“FNBO”), which is a subsidiary of First National Bank of Nebraska, Inc., serves as the investment adviser to the Funds. Each Fund pays a monthly fee
NOTES TO FINANCIAL STATEMENTS
March 31, 2013
at an annual rate of the following percentages of each Fund’s average daily net assets: 0.50% for the Short-Intermediate Bond Fund, 0.60% for the Income Fund, 0.75% for each of the Balanced Fund, Core Equity Fund and Growth Opportunities Fund, 0.90% for the Large Cap Growth Fund and 0.85% for the Small Company Fund. First National Fund Advisers (“FNFA”), a division of FNBO, serves as the investment sub-adviser for the Balanced Fund, Short-Intermediate Bond Fund and Income Fund.
Tributary has contractually agreed to waive certain of its fees until July 31, 2013 at the annual rate of the following percentages of each Fund’s average daily net assets: 0.22% for the Short-Intermediate Bond Fund, 0.27% for the Income Fund, 0.125% for the Balanced Fund, 0.12% for the Core Equity Fund, 0.30% for the Large Cap Growth Fund, 0.12% for the Growth Opportunities Fund and 0.13% for the Small Company Fund. None of the waived fees can be recaptured in subsequent periods. The amounts waived for each Fund are recorded as expenses waived by adviser in each Fund’s Statement of Operations.
JPMorgan Chase Bank, N.A. serves as the custodian for each of the Funds. DST Systems, Inc. serves as transfer agent for the Funds, whose functions include disbursing dividends and other distributions. Tributary and JFS serve as co-administrators of the Funds. As compensation for its administrative services, each co-administrator is entitled to a fee, calculated daily and paid monthly based on each Fund’s average daily net assets. Tributary receives 0.07% of each Fund’s average daily net assets. Beacon Hill Fund Services, Inc. provides the Funds’ Anti-Money Laundering Compliance Officer and Chief Compliance Officer services.
The Company has adopted an Administrative Services Plan, which allows the Funds’ Institutional Class shares to charge a shareholder services fee, pursuant to which each Fund is authorized to pay compensation to banks and other financial institutions, that may include the advisers, their correspondent and affiliated banks, including FNBO (each a “Service Organization”). Under the Administrative Services Plan, the Funds may enter into a Servicing Agreement with a Service Organization whereby such Service Organization agrees to provide certain record keeping and/or administrative support services for their customers or account holders who are the beneficial or record owner of the shares of a Fund. The Funds maintain Servicing Agreements, one of which is with FNBO. FNBO receives an annual fee at the rate of 0.25% of the average aggregate net asset value of the Funds held during the period by customers for whom they provided services under the Servicing Agreement. The amounts charged to the Funds and paid to FNBO for shareholder service fees are reported within the Statements of Operations.
4. Investment Transactions
The aggregate cost of purchases and proceeds from sales of securities, excluding U.S. Government securities and short-term investments (maturing less than one year from acquisition), for the year ended March 31, 2013 were as follows:
|
| Purchases |
| Sales |
| ||
Short-Intermediate Bond Fund |
| $ | 19,025,971 |
| $ | 20,949,884 |
|
Income Fund |
| 18,800,092 |
| 11,161,002 |
| ||
Balanced Fund |
| 16,769,018 |
| 14,429,500 |
| ||
Core Equity Fund |
| 39,556,413 |
| 131,507,990 |
| ||
Large Cap Growth Fund |
| 26,829,603 |
| 44,375,096 |
| ||
Growth Opportunities Fund |
| 62,551,977 |
| 64,757,218 |
| ||
Small Company Fund |
| 36,234,150 |
| 26,520,174 |
| ||
The aggregate cost of purchases and proceeds from sales of long-term U.S. Government securities for the year ended March 31, 2013 were as follows:
|
| Purchases |
| Sales |
| ||
Short-Intermediate Bond Fund |
| $ | 24,567,926 |
| $ | 12,923,907 |
|
Income Fund |
| 24,078,785 |
| 20,432,087 |
| ||
Balanced Fund |
| 548,694 |
| 2,351,612 |
| ||
NOTES TO FINANCIAL STATEMENTS
March 31, 2013
5. Capital Share Transactions
The Company is authorized to issue a total of 1,000,000,000 shares of common stock, 999,999,990 of which may be issued in series with a par value of $0.00001 per share. The Board is empowered to allocate such shares among different series of the Company’s shares without shareholder approval.
6. Federal Income Taxes
The following information is presented on an income tax basis. It is each Fund’s policy to continue to comply with the requirements of Subchapter M of the Internal Revenue Code of 1986, as amended, applicable to regulated investment companies, and to distribute all of its taxable income, including any net realized gains on investments, to its shareholders sufficient to relieve it from all, or substantially all, federal income and excise taxes. Therefore, no provision is made for federal income or excise taxes. Withholding taxes on foreign dividends have been paid or provided for in accordance with each applicable country’s tax rules and rates.
Differences between amounts reported for financial statements and federal income tax purposes are primarily due to timing and character difference in recognizing gains and losses on investment transactions.
To the extent the differences between the amounts recognized for financial statements and federal income tax purposes are permanent in nature, such amounts are reclassified within the capital accounts based on their federal income tax treatment; temporary differences do not require reclassification. Permanent differences may include but are not limited to the following: reclassifications related to Treasury Inflation-Protected Securities, market discount, premium and/or paydown securities, REIT securities, net operating losses, expired capital loss carryforwards and distribution adjustments. These reclassifications have no impact on net assets.
|
| Net Increase (Decrease) |
| |||||||
|
| Undistributed Net |
| Accumulated Net |
| Paid-in Capital |
| |||
Short-Intermediate Bond Fund |
| $ | 284,730 |
| $ | (283,740 | ) | $ | (990 | ) |
Income Fund |
| 28,937 |
| (28,937 | ) | — |
| |||
Balanced Fund |
| 2,182 |
| (2,182 | ) | — |
| |||
Large Cap Growth Fund |
| 69 |
| (69 | ) | — |
| |||
Growth Opportunities Fund |
| 155,683 |
| — |
| (155,683 | ) | |||
Small Company Fund |
| (2,995 | ) | 2,995 |
| — |
| |||
As of March 31, 2013, the cost of investments and the components of net unrealized appreciation were as follows:
|
| Tax Cost of |
| Gross |
| Gross |
| Net Unrealized |
| ||||
Short-Intermediate Bond Fund |
| $ | 77,691,971 |
| $ | 1,848,797 |
| $ | (355,038 | ) | $ | 1,493,759 |
|
Income Fund |
| 77,624,144 |
| 3,871,118 |
| (1,121,185 | ) | 2,749,933 |
| ||||
Balanced Fund |
| 54,271,125 |
| 14,171,540 |
| (231,002 | ) | 13,940,538 |
| ||||
Core Equity Fund |
| 133,712,676 |
| 48,022,393 |
| (3,022,349 | ) | 45,000,044 |
| ||||
Large Cap Growth Fund |
| 39,568,132 |
| 17,232,126 |
| (116,338 | ) | 17,115,788 |
| ||||
Growth Opportunities Fund |
| 90,407,851 |
| 45,670,204 |
| (271,162 | ) | 45,399,042 |
| ||||
Small Company Fund |
| 133,314,236 |
| 39,898,437 |
| (3,014,086 | ) | 36,884,351 |
| ||||
As of March 31, 2013, the components of distributable taxable earnings for U.S. federal income tax purposes were as follows:
|
| Undistributed |
| Undistributed |
| Distributions |
| Unrealized |
| Capital Loss Carry |
| |||||
Short-Intermediate Bond Fund |
| $ | 135,945 |
| $ | — |
| $ | (84,255 | ) | $ | 1,493,759 |
| $ | (4,082,773 | ) |
Income Fund |
| 423,896 |
| — |
| (126,646 | ) | 2,749,933 |
| (291,390 | ) | |||||
NOTES TO FINANCIAL STATEMENTS
March 31, 2013
|
| Undistributed |
| Undistributed |
| Distributions |
| Unrealized |
| Capital Loss Carry |
| |||||
Balanced Fund |
| $ | 17,980 |
| $ | 1,339,274 |
| $ | — |
| $ | 13,940,538 |
| $ | (36,590 | ) |
Core Equity Fund |
| 2,019,657 |
| — |
| — |
| 45,000,044 |
| (2,970,704 | ) | |||||
Large Cap Growth Fund |
| 243,164 |
| 2,332,766 |
| — |
| 17,115,788 |
| (261,112 | ) | |||||
Growth Opportunities Fund |
| — |
| 2,281,588 |
| — |
| 45,399,042 |
| (124,361 | ) | |||||
Small Company Fund |
| 1,040,626 |
| 174,229 |
| — |
| 36,884,351 |
| — |
| |||||
*Undistributed net ordinary income includes any undistributed net short-term capital gains, if any.
**Unrealized gains (losses) are adjusted for open wash sale loss deferrals and accelerated recognition of unrealized gain/loss on forward contracts.
***Capital loss carry forward includes deferred post October loss and late year losses.
The tax character of dividends and distributions paid during the Funds’ fiscal years ended March 31, 2013 and 2012 were as follows:
|
| Net |
| Net Long Term |
| Total Distributions Paid*** |
| ||||||||||||
|
| 2013 |
| 2012 |
| 2013** |
| 2012 |
| 2013 |
| 2012 |
| ||||||
Short-Intermediate Bond Fund |
| $ | 1,733,364 |
| $ | 2,126,646 |
| $ | — |
| $ | — |
| $ | 1,733,364 |
| $ | 2,126,646 |
|
Income Fund |
| 2,121,357 |
| 2,078,619 |
| — |
| — |
| 2,121,357 |
| 2,078,619 |
| ||||||
Balanced Fund |
| 662,885 |
| 432,382 |
| — |
| — |
| 662,885 |
| 432,382 |
| ||||||
Core Equity Fund |
| 2,918,909 |
| 1,989,427 |
| — |
| — |
| 2,918,909 |
| 1,989,427 |
| ||||||
Large Cap Growth Fund |
| 130,511 |
| 395,094 |
| 2,046,269 |
| 2,996,703 |
| 2,176,780 |
| 3,391,797 |
| ||||||
Growth Opportunities Fund |
| — |
| — |
| 2,767,317 |
| — |
| 2,767,317 |
| — |
| ||||||
Small Company Fund |
| 1,338,646 |
| 1,741,493 |
| 6,210,221 |
| 5,005,642 |
| 7,548,867 |
| 6,747,135 |
| ||||||
* Net ordinary income consists of net taxable income derived from dividends, interest, and net short-term capital gains, if any.
** The Funds designated as long-term capital gain dividend, pursuant to the Internal Revenue code section 852(b)(3), the amount necessary to reduce earnings and profits of the Funds related to net capital gains to zero for the fiscal year ended March 31, 2013.
*** Total distributions paid may differ from the Statement of Changes in Net Assets because distributions are recognized when actually paid for tax purposes.
Under the Regulated Investment Company Modernization Act of 2010 (“Act”), a Fund is permitted to carry forward capital losses for an unlimited period. However, any losses incurred during post-enactment taxable years are required to be utilized prior to the losses incurred in pre-enactment taxable years. As a result of this ordering rule, pre-enactment capital loss carry forwards may be more likely to expire unused. Additionally, post-enactment capital losses that are carried forward will retain their character as either short-term or long-term capital losses, and will not be considered exclusively short-term as under previous law.
At March 31, 2013, the following Funds had pre-enactment unused capital loss carryovers for U.S. federal income tax purposes, which may be used to offset future net realized capital gains. If not used, the capital loss carryovers will expire as follows:
|
| 2014 |
| 2015 |
| 2016 |
| 2017 |
| 2018 |
| Total |
| ||||||
Short-Intermediate Bond Fund |
| $ | 726,566 |
| $ | 1,593,824 |
| $ | 852,078 |
| $ | 577,072 |
| $ | — |
| $ | 3,749,540 |
|
Income Fund |
| — |
| 24,212 |
| 267,178 |
| — |
| — |
| 291,390 |
| ||||||
Core Equity Fund |
| — |
| — |
| — |
| — |
| 2,192,793 |
| 2,192,793 |
| ||||||
NOTES TO FINANCIAL STATEMENTS
March 31, 2013
At March 31, 2013, the following Funds had post-enactment unused capital loss carryovers for U.S. federal income tax purposes, which may be used to offset future net realized capital gains and will be carried forward indefinitely and retain their character as follows:
|
| Short Term |
| Long Term |
| ||
Short-Intermediate Bond Fund |
| $ | — |
| $ | 333,233 |
|
Core Equity Fund |
| 681,900 |
| — |
| ||
Under current tax law, certain capital losses realized after October 31, and certain ordinary losses realized after December 31 but before the end of the fiscal year (“Post-October losses” and “Late Year Losses”, respectively) may be deferred and treated as occurring on the first business day of the following fiscal year. For the year ended March 31, 2013, the following Funds deferred to April 1, 2013 these losses of:
|
| Post-October Capital Losses |
| Late Year Ordinary Losses |
| ||
Balanced Fund |
| $ | 36,590 |
| $ | — |
|
Core Equity Fund |
| 96,011 |
| — |
| ||
Large Cap Growth Fund |
| 261,112 |
| — |
| ||
Growth Opportunities Fund |
| — |
| 124,361 |
| ||
The Funds comply with FASB Accounting Standards Codification (“ASC”) Topic 740, “Income Taxes.” FASB ASC Topic 740 provides guidance for how uncertain tax positions should be recognized, measured, presented and disclosed in the financial statements. FASB ASC Topic 740 requires the affirmative evaluation of tax positions taken or expected to be taken in the course of preparing each Fund’s tax return to determine whether it is more-likely-than-not (i.e., greater than 50 percent) that each tax position will be sustained upon examination by a taxing authority based on the technical merits of the position. Funds with tax positions not deemed to meet the “more-likely-than-not” threshold would be required to record a tax expense in the current year. FASB ASC Topic 740 requires that management evaluate the tax position taken in returns for the tax years ended March 31, 2010 through March 31, 2013, which remain subject to examination by all major tax jurisdictions, including federal and the State of Nebraska. Management completed an evaluation of the Funds’ tax positions and based on that evaluation, determined that no tax liability resulted from unrecognized tax benefits related to uncertain tax positions and therefore no provision for federal income tax was required in the Funds’ financial statements for the year ended March 31, 2013.
7. Subsequent Events
Management has evaluated subsequent events for the Funds through the date the financial statements are issued and has concluded there are no events that require adjustments to the financial statements or disclosure in the footnotes.
Report of Independent Registered Public Accounting Firm
The Shareholders and Board of Directors
Tributary Funds, Inc.:
We have audited the accompanying statements of assets and liabilities, including the schedules of portfolio investments, for the Tributary Short-Intermediate Bond Fund, Tributary Income Fund, Tributary Balanced Fund, Tributary Core Equity Fund, Tributary Large Cap Growth Fund, Tributary Growth Opportunities Fund and Tributary Small Company Fund, each a series of Tributary Funds, Inc. (the “Funds”) as of March 31, 2013, and the related statements of operations for the year then ended, the statements of changes in net assets for each of the years in the two-year period then ended, and the financial highlights for each of the years or periods in the five-year period then ended. These financial statements and financial highlights are the responsibility of the Funds’ management. Our responsibility is to express an opinion on these financial statements and financial highlights based on our audits.
We conducted our audits in accordance with the standards of the Public Company Accounting Oversight Board (United States). Those standards require that we plan and perform the audit to obtain reasonable assurance about whether the financial statements and financial highlights are free of material misstatement. An audit includes examining, on a test basis, evidence supporting the amounts and disclosures in the financial statements. Our procedures included confirmation of securities owned as of March 31, 2013, by correspondence with the custodian and brokers or other appropriate auditing procedures. An audit also includes assessing the accounting principles used and significant estimates made by management, as well as evaluating the overall financial statement presentation. We believe that our audits provide a reasonable basis for our opinion.
In our opinion, the financial statements and financial highlights referred to above present fairly, in all material respects, the financial position of the Funds as of March 31, 2013, the results of their operations for the year then ended, the changes in their net assets for each of the years in the two-year period then ended, and the financial highlights for each of the years or periods in the five-year period then ended, in conformity with U.S. generally accepted accounting principles.
/s/ KPMG LLP
Chicago, Illinois
May 23, 2013
ADDITIONAL FUND INFORMATION
March 31, 2013 (Unaudited)
Proxy Voting Policy
Information regarding the policies and procedures that the Funds use to determine how to vote proxies relating to portfolio securities is available without charge, upon request, by calling 1-800-662-4203. The information also is included in the Company’s Statement of Additional Information, which is available on the Funds’ website at www.tributaryfunds.com and on the Securities and Exchange Commission’s (the “SEC”) website at www.sec.gov.
Information relating to how each Fund voted proxies relating to portfolio securities held during the most recent twelve months ended June 30 is available by writing to the Company at P.O. Box 219022, Kansas City, Missouri, 64141-6002, by calling 1-800-662-4203 and on the Securities and Exchange Commission’s website at www.sec.gov.
Quarterly Holdings
The Company files a complete list of its portfolio holdings with the SEC for the first and third quarters of each fiscal year on Form N-Q. Forms N-Q are available free of charge on the SEC’s website at www.sec.gov or may be reviewed and copied at the SEC’s Public Reference Room in Washington, D.C. Information on the operation of the Public Reference Room may be obtained by calling 1-800-SEC-0330.
Other Federal Income Tax Information
The information reported below is for the year ended March 31, 2013. Foreign tax and qualified dividend information for the calendar year 2013 will be provided on your 2013 Form 1099-DIV.
For the year ended March 31, 2013, certain dividends paid by the Funds may be subject to a maximum tax rate of 15% as provided for by the Tax Relief, Unemployment Insurance Reauthorization, and Job Creation Act of 2010. Beginning in 2013, under the American Taxpayer Relief Act of 2012, that maximum rate may increase to 20% depending on the taxpayer’s gross income. Complete information for calendar year 2013 will be reported in conjunction with your 2013 Form 1099-DIV.
For the year ended March 31, 2013, the following Funds hereby designate the following percentages, or the maximum amount allowable under the Internal Revenue Code (“Code”), as qualified dividends:
|
| Qualified Dividend |
|
Short-Intermediate Bond Fund |
| 1.13 | % |
Income Fund |
| 0.97 | % |
Balanced Fund |
| 100.00 | % |
Core Equity Fund |
| 100.00 | % |
Large Cap Growth Fund |
| 100.00 | % |
Growth Opportunities Fund |
| 0.00 | % |
Small Company Fund |
| 67.83 | % |
For the year ended March 31, 2013, the following Funds hereby designate the following percentages, or the maximum amount allowable under the Code, as distributions eligible for the dividends received deduction for corporations:
|
| Dividends |
|
Short-Intermediate Bond Fund |
| 1.13 | % |
Income Fund |
| 0.97 | % |
Balanced Fund |
| 98.48 | % |
Core Equity Fund |
| 100.00 | % |
Large Cap Growth Fund |
| 100.00 | % |
Growth Opportunities Fund |
| 0.00 | % |
Small Company Fund |
| 67.83 | % |
Table of Shareholder Expenses
As a shareholder of the Funds, you incur ongoing costs, including management fees, shareholder servicing fees and other Fund expenses. This example is intended to help you understand your ongoing costs (in dollars) of investing in the Funds and to compare these costs with the ongoing costs of investing in other mutual funds. The example is based on an investment of $1,000 invested at the beginning of the period and held for the entire period.
Actual Expenses
The table below provides information about actual account values and actual expenses. You may use the information below, together with the amount you invested, to estimate the expenses that you paid over the period. Simply divide your account value by $1,000 (for example, an $8,600 account value divided by $1,000 = 8.6), then multiply the result by the number in the table under the heading entitled “Expense Paid During Period” to estimate the expenses you paid on your account during this period.
Hypothetical Example for Comparison Purposes
The table below provides information about hypothetical account values and hypothetical expenses based on each Fund’s actual expense ratio and an assumed rate of return of 5% per year before expenses, which is not the Fund’s actual return. The hypothetical account values and expenses may not be used to estimate the actual ending account balance or expenses you paid for the period. You may use this information to compare this 5% hypothetical example with the 5% hypothetical examples that appear in the shareholder reports of other funds. Please note that the expenses shown in the table are meant to highlight your ongoing costs only and will not help you determine the relative total costs of owning different funds.
|
| Expenses Using Actual Fund Return |
| Expenses Using Hypothetical 5% Return |
| ||||||||||||||||||
|
| Beginning |
| Ending |
| Expense |
| Expense |
| Beginning |
| Ending |
| Expense |
| Expense |
| ||||||
Short-Intermediate Bond Fund |
|
|
|
|
|
|
|
|
|
|
|
|
|
|
|
|
| ||||||
Institutional Class |
| $ | 1,000.00 |
| $ | 1,015.30 |
| $ | 4.12 |
| 0.82 | % | $ | 1,000.00 |
| $ | 1,020.84 |
| $ | 4.13 |
| 0.82 | % |
Institutional Plus Class |
| 1,000.00 |
| 1,016.60 |
| 2.82 |
| 0.56 |
| 1,000.00 |
| 1,022.14 |
| 2.82 |
| 0.56 |
| ||||||
Income Fund |
|
|
|
|
|
|
|
|
|
|
|
|
|
|
|
|
| ||||||
Institutional Class |
| 1,000.00 |
| 1,011.70 |
| 4.41 |
| 0.88 |
| 1,000.00 |
| 1,020.54 |
| 4.43 |
| 0.88 |
| ||||||
Institutional Plus Class |
| 1,000.00 |
| 1,012.90 |
| 3.21 |
| 0.64 |
| 1,000.00 |
| 1,021.76 |
| 3.21 |
| 0.64 |
| ||||||
Balanced Fund |
|
|
|
|
|
|
|
|
|
|
|
|
|
|
|
|
| ||||||
Institutional Class |
| 1,000.00 |
| 1,056.80 |
| 6.26 |
| 1.22 |
| 1,000.00 |
| 1,018.85 |
| 6.14 |
| 1.22 |
| ||||||
Institutional Plus Class |
| 1,000.00 |
| 1,058.20 |
| 4.98 |
| 0.97 |
| 1,000.00 |
| 1,020.11 |
| 4.88 |
| 0.97 |
| ||||||
Core Equity Fund |
|
|
|
|
|
|
|
|
|
|
|
|
|
|
|
|
| ||||||
Institutional Class |
| 1,000.00 |
| 1,111.10 |
| 5.79 |
| 1.10 |
| 1,000.00 |
| 1,019.45 |
| 5.54 |
| 1.10 |
| ||||||
Institutional Plus Class |
| 1,000.00 |
| 1,112.40 |
| 4.48 |
| 0.85 |
| 1,000.00 |
| 1,020.71 |
| 4.26 |
| 0.85 |
| ||||||
Large Cap Growth Fund |
|
|
|
|
|
|
|
|
|
|
|
|
|
|
|
|
| ||||||
Institutional Class |
| 1,000.00 |
| 1,098.90 |
| 6.02 |
| 1.15 |
| 1,000.00 |
| 1,019.20 |
| 5.79 |
| 1.15 |
| ||||||
Institutional Plus Class |
| 1,000.00 |
| 1,100.20 |
| 4.71 |
| 0.90 |
| 1,000.00 |
| 1,020.46 |
| 4.51 |
| 0.90 |
| ||||||
Growth Opportunities Fund |
|
|
|
|
|
|
|
|
|
|
|
|
|
|
|
|
| ||||||
Institutional Class |
| 1,000.00 |
| 1,136.80 |
| 6.07 |
| 1.14 |
| 1,000.00 |
| 1,019.25 |
| 5.74 |
| 1.14 |
| ||||||
Institutional Plus Class |
| 1,000.00 |
| 1,137.80 |
| 4.74 |
| 0.89 |
| 1,000.00 |
| 1,020.51 |
| 4.46 |
| 0.89 |
| ||||||
Small Company Fund |
|
|
|
|
|
|
|
|
|
|
|
|
|
|
|
|
| ||||||
Institutional Class |
| 1,000.00 |
| 1,119.90 |
| 6.40 |
| 1.21 |
| 1,000.00 |
| 1,018.90 |
| 6.09 |
| 1.21 |
| ||||||
Institutional Plus Class |
| 1,000.00 |
| 1,121.30 |
| 5.08 |
| 0.96 |
| 1,000.00 |
| 1,020.15 |
| 4.83 |
| 0.96 |
| ||||||
*Expenses paid during the period are equal to the annualized net expense ratio, multiplied by the average account value over the period, multiplied by the number of days in the period, then multiplied by 182/365 (to reflect the most recent 6-month period).
DIRECTORS AND OFFICERS
March 31, 2013
Overall, responsibility for management of the Company rests with its Board, which is elected by the shareholders of the Company. The Company is managed by the Directors in accordance with the laws governing corporations in Nebraska. The Board oversees all of the Funds. Directors serve until their respective successors have been elected and qualified or until their earlier death, resignation or removal. The Directors elect the officers of the Company to supervise its day-to-day operations.
Information about the Directors and officers of the Company is set forth below. The Funds’ Statement of Additional Information includes additional information about the Directors and is available, without charge, upon request, by calling 1-800-662-4203 or on the Fund’s website www.tributaryfunds.com.
Name, Address(1), Age, |
| Term of Office |
| Principal Occupation(s) |
| Number of |
| Other |
|
|
|
|
|
|
|
|
|
Independent Directors |
|
|
|
|
|
|
|
|
|
|
|
|
|
|
|
|
|
Robert A. Reed Age 73
Director |
| Indefinite; Since 1994. |
| President and Chief Executive Officer, Physicians Mutual Insurance Company and Physicians Life Insurance Company (1974 — present). |
| 7 |
| None. |
|
|
|
|
|
|
|
|
|
Gary D. Parker Age 68
Director |
| Indefinite; Since 2005. |
| Retired. |
| 7 |
| None. |
|
|
|
|
|
|
|
|
|
John J. McCartney Age 69
Director |
| Indefinite; Since 2010. |
| Retired. Executive Vice President and Chief Financial Officer, Zurich Insurance Group North America (August 2002 — June 2007). |
| 7 |
| None. |
|
|
|
|
|
|
|
|
|
Interested Director |
|
|
|
|
|
|
|
|
|
|
|
|
|
|
|
|
|
Stephen R. Frantz(2) Age 54
Managing Partner |
| Indefinite; Since 2010. |
| Managing Partner, Tributary Capital Management, LLC (May 2010 — present); Chief Investment Officer, First Investment Group (January 2005 — May 2010); Chief Investment Officer, FNBO Fund Advisers (January 2005 — May 2010). |
| 7 |
| None. |
Name, Address, Age, |
| Term of Office |
| Principal Occupation(s) |
| Number of |
| Other |
|
|
|
|
|
|
|
|
|
Officers |
|
|
|
|
|
|
|
|
|
|
|
|
|
|
|
|
|
Daniel W. Koors(3) Age: 42
Treasurer |
| Indefinite; Since December 2009. |
| Chief Operating Officer of Jackson National Asset Management, LLC (“JNAM”) and Jackson Fund Services (“JFS”), a division of JNAM (2011 — present); Treasurer and Chief Financial Officer of investment companies advised by Curian Capital, LLC (2010 — present); Senior Vice President of JNAM and JFS (2009 — present); Vice President of investment companies advised by JNAM (2006 — present). Formerly, Chief Financial Officer of JNAM and JFS (2007 — 2011); Treasurer and Chief Financial Officer of investment companies advised by JNAM (2006 — 2011); Assistant Vice President — Fund Administration of Jackson (2006 — 2009); Vice President of JNAM and JFS (2007 — 2008). |
| N/A
|
| N/A |
|
|
|
|
|
|
|
|
|
Rodney L. Ruehle(4) Age: 44
Chief Compliance Officer and Anti-Money Laundering Officer |
| Indefinite; Since December 2009. |
| Director, Beacon Hill Fund Services, Inc. (2008 — present). Formerly, Vice President, CCO Services, Citi Fund Services, Inc. (2004 — 2008). |
| N/A |
| N/A |
|
|
|
|
|
|
|
|
|
Emily J. Eibergen(3) Age: 29
Secretary |
| Indefinite; Since January 2013. |
| Attorney of JNAM and JFS (2011 — present). Formerly, Departmental Specialist, Michigan Public Health Institute (2010 — 2011); Legal Assistant, Guyselman & Ehnis-Clark (2009-2010). |
| N/A |
| N/A |
(1) The address for all Directors is 1620 Dodge Street, Omaha, Nebraska 68197.
(2) As defined in the 1940 Act, Mr. Frantz is an “interested” director because he is an officer of Tributary Capital Management, LLC, which is the investment adviser for the Funds.
(3) The address for Mr. Koors and Ms. Eibergen is 225 West Wacker Drive, Suite 1200, Chicago, Illinois 60606.
(4) The address for Mr. Ruehle is 4041 North High Street, Suite 402, Columbus, Ohio 43214.
TRIBUTARY FUNDS, INC.
Supplement dated February 15, 2013
to the Prospectus dated August 1, 2012
as Amended September 12, 2012
THIS SUPPLEMENT PROVIDES NEW AND ADDITIONAL INFORMATION
BEYOND THAT CONTAINED IN THE PROSPECTUS
AND SHOULD BE READ IN CONJUNCTION WITH THE PROSPECTUS.
Effective February 15, 2013, Randall Greer will be retiring from Tributary Capital Management and therefore is no longer serving as a Portfolio Manager on the Tributary Core Equity Fund. Christopher Sullivan will also no longer be the named Portfolio Manager on the Fund; however will continue to serve as a Senior Analyst on the Strategy. Replacing Mr. Greer and Mr. Sullivan as Portfolio Manager will be Donald Radtke, who has been actively working along side Mr. Greer for months in preparation for this transition.
Your Prospectus is hereby amended as follows:
The section entitled “Portfolio Managers” on page 19 of the Prospectus is amended to remove the reference to Randall Greer and Christopher Sullivan and will be replaced with:
Donald Radtke, Portfolio Manager, has managed the fund since February 2013.
The section entitled “Tributary Core Equity Fund and Tributary Small Company Fund (Value Equities Team)” on page 48 is amended to remove the paragraphs on Randall Greer and Christopher Sullivan and replaced with:
Donald Radtke, Portfolio Manager. Don serves as a Portfolio Manager for Tributary Capital Management and is responsible for covering the energy and industrials sectors for the firm. Don started in the industry in 1988 and joined Tributary Capital Management’s predecessor in September 2007. Prior to joining Tributary Capital Management, Don spent over seven years as an Equity and Fixed Income Analyst and fund Co-Manager for WB Capital Management in Des Moines, Iowa and was an Analyst at Bank of America Capital Management in St. Louis, Missouri, and Piper Jaffray and Craig-Hallum in Minneapolis, Minnesota. He received his Bachelor of Arts degree in Economics from the University of Wisconsin-Milwaukee in 1989 and Masters of Business Administration from the University of Minnesota in 1998. Don is a member of the CFA Society of Nebraska and the CFA Institute.
Please retain this supplement for future reference.
![]()
Investment Adviser
Tributary Capital Management, LLC
1620 Dodge Street, Stop 1089
Omaha, Nebraska 68197
Investment Sub-Adviser
(Short-Intermediate Bond Fund,
Income Fund and Balanced Fund only)
First National Fund Advisers
215 West Oak Street, 4th Floor
Fort Collins, Colorado 80521
Custodian
JPMorgan Chase
4 New York Plaza, 12th Floor
New York, NY 10004
Co-Administrators
Jackson Fund Services
225 West Wacker Drive, Suite 1200
Chicago, Illinois 60606
Tributary Capital Management, LLC
1620 Dodge Street, Stop 1089
Omaha, Nebraska 68197
Distributor
Northern Lights Distributors, LLC
17605 Wright Street
Omaha, Nebraska 68130
Legal Counsel
Husch Blackwell LLP
1620 Dodge Street, Suite 2100
Omaha, Nebraska 68102
Compliance Services
Beacon Hill Fund Services, Inc.
4041 N. High Street, Suite 402
Columbus, Ohio 43214
This report has been prepared for the general information of Tributary Funds’ shareholders. It is not authorized for distribution to prospective investors unless accompanied or preceded by an effective Tributary Funds’ prospectus. The prospectus contains more complete information about Tributary Funds’ investment objectives, management fees and expenses, risks and operating policies. Please read the prospectus carefully before investing or sending money.
For more information
call 1-800-662-4203
or write to:
Tributary Funds Service Center
P.O. Box 219022
Kansas City, Missouri 64121-9022
or go to:
www.tributaryfunds.com
or email:
TributaryFunds@tributarycapital.com
Forward Motion. Momentum. Success.
1144-NLD-5/7/2013
TF-AR-0313
Item 2. Code of Ethics.
The registrant has adopted a code of ethics that applies to the registrant’s principal executive officer, principal financial officer, principal accounting officer or controller, or persons performing similar functions. This code of ethics is included as Exhibit 12(a)(1) on this Form N-CSR. There were no substantive amendments or waivers to this code of ethics during the period covered by this report.
Item 3. Audit Committee Financial Expert.
The registrant’s Board of Directors has determined that the registrant has at least one audit committee financial expert serving on its audit committee. An “audit committee financial expert” is not an “expert” for any purpose, including for purposes of Section 11 of the Securities Act of 1933, as amended, as a result of being designated as an “audit committee financial expert.” Further, the designation of a person as an “audit committee financial expert” does not mean that the person has any greater duties, obligations, or liability than those imposed on the person without the “audit committee financial expert” designation. Similarly, the designation of a person as an “audit committee financial expert” does not affect the duties, obligations, or liability of any other member of the Audit Committee or Board of Directors.
The audit committee financial expert is John J. McCartney who is “independent” for purposes of this Item 3 of Form N-CSR.
Item 4. Principal Accountant Fees and Services.
(a) – (d)
KPMG LLP (“KPMG”) was appointed by the Board of Directors as the independent registered public accounting firm of the registrant for the fiscal years ended March 31, 2012 and March 31, 2013.
The following table sets forth the amount of fees that were billed by the principal accountant for the respective period to the registrant.
Fees for Services Rendered to the Registrant by the Principal Accountant
Fiscal Year |
| Audit Fees |
| Audit-Related Fees |
| Tax Fees |
| All Other Fees |
| ||||
2012 |
| $ | 96,000 |
| $ | 5,700 |
| $ | 31,600 |
| $ | 0 |
|
2013 |
| $ | 101,000 |
| $ | 6,374 |
| $ | 28,350 |
| $ | 0 |
|
Nature of services regarding Audit-Related Fees:
2013: Consent on N-1A and out of pocket expenses
2012: Consent on N-1A
The above Tax Fees for 2012 and 2013 are the aggregate fees billed for professional services by KPMG to the registrant for Federal income and Nebraska Corporate Tax Return reviews and distribution calculation and federal excise tax return review.
The following table sets forth the amount of fees that were billed by the principal accountant for the respective period to any entity controlling, controlled by, or under common control with the investment adviser that provided ongoing services to the registrant (“Adviser Entities”) that were directly related to the registrant’s operations and financial reporting.
Fees for Services Rendered to the Adviser Entities by the Principal Accountant
Fiscal Year |
| Audit-Related Fees |
| Tax Fees |
| All Other Fees |
| |||
2012 |
| $ | 0 |
| $ | 0 |
| $ | 0 |
|
2013 |
| $ | 0 |
| $ | 0 |
| $ | 0 |
|
The aggregate amount of fees billed by billed the principal accountant to the Adviser Entities that were not directly related to the registrant’s operations and financial reporting was $0 for the fiscal year ended March 31, 2012 and $ 0 for the fiscal year ended March 31, 2013.
(e)(1) The Audit Committee shall review, consider, and pre-approve the engagement of all auditors to certify the registrant’s financial statements (an “Audit Engagement”). The Audit Committee must report to the Board of Directors of the registrant regarding its approval of all Audit Engagements.
Management of the registrant may request pre-approval of, and the Audit Committee, or a member of the Audit Committee designated by the Audit Committee (a “Designated Member”), may pre-approve permissible non-audit services (e.g. tax, valuation, and general accounting services) to the registrant and/or to the Adviser Entities, on a project-by-project basis. The Audit Committee must, however, pre-approve any engagement of the auditor to provide non-audit services to any Adviser Entity during the period of such auditor’s audit engagement. Any action by the Designated Member in approving requested non-audit service shall be presented for ratification by the Audit Committee no later than at the Audit Committee’s next scheduled meeting.
(e)(2) 0%.
(f) Not applicable.
(g) The aggregate amount of non-audit fees billed by the principal accountant to the registrant and Adviser Entities was $37,300 for the fiscal year ended March 31, 2012 and was $34,724 for the fiscal year ended March 31, 2013.
(h) The registrant’s Audit Committee of the Board of Directors has considered whether the provision of non-audit services that were rendered to the Adviser Entities (not including any sub-adviser whose role is primarily portfolio management and is subcontracted with or overseen by another investment adviser) that were not pre-approved pursuant to paragraph (c)(7)(ii) of Rule 2-01 of Regulation S-X and concluded that such services were compatible with maintaining the principal accountant’s independence.
Item 5. Audit Committee of Listed Registrants.
Not applicable.
Item 6. Investments.
(a) Included as a part of the report to shareholders filed under Item 1.
(b) Not applicable.
Item 7. Disclosure of Proxy Voting Policies and Procedures for Closed-End Management Investment Companies.
Not applicable.
Item 8. Portfolio Managers of Closed-End Management Investment Companies.
Not applicable.
Item 9. Purchases of Equity Securities by Closed-End Management Investment Company and Affiliated Purchasers.
Not applicable.
Item 10. Submission of Matters to a Vote of Security Holders.
There have been no material changes to the procedures by which shareholders may recommend nominees to the registrant’s Board of Directors since the registrant last disclosed such procedures.
Item 11. Controls and Procedures.
(a) The registrant’s principal executive officer and principal financial officer have concluded, based on their evaluation of the registrant’s disclosure controls and procedures as conducted within 90 days of the filing date of this report, that these disclosure controls and procedures are adequately designed and are operating effectively to ensure that information required to be disclosed by the registrant on Form N-CSR is recorded, processed, summarized and reported within the time periods specified in the Securities and Exchange Commission’s rules and forms.
(b) There were no changes in the registrant’s internal control over financial reporting (as defined in Rule 30a-3(d) under the Investment Company Act of 1940, as amended (the “Act”) (17 CFR 270.30a-3(d)) that occurred during the registrant’s second fiscal quarter of the period covered by this report that have materially affected, or are reasonably likely to materially affect, the registrant’s internal control over financial reporting.
Item 12. Exhibits
(a)(1) | The code of ethics that is the subject of the disclosure required by Item 2 is attached hereto. |
(a)(2) | Certifications pursuant to Rule 30a-2(a) under the Act are attached hereto. |
(a)(3) | Not applicable. |
|
|
(b) | Certifications pursuant to Rule 30a-2(b) under the Act are attached hereto. |
SIGNATURES
Pursuant to the requirements of the Securities Exchange Act of 1934 and the Investment Company Act of 1940, the registrant has duly caused this report to be signed on its behalf by the undersigned, thereunto duly authorized.
| Tributary Funds, Inc. |
|
|
|
|
|
|
|
By: | /s/ Daniel W. Koors |
|
Name: | Daniel W. Koors |
|
Title: | Treasurer |
|
Date: | June 6, 2013 |
|
Pursuant to the requirements of the Securities Exchange Act of 1934 and the Investment Company Act of 1940, this report has been signed below by the following persons on behalf of the registrant and in the capacities and on the dates indicated.
By: | /s/ Stephen R. Frantz |
|
Name: | Stephen R. Frantz |
|
Title: | President |
|
Date: | June 6, 2013 |
|
|
|
|
|
|
|
By: | /s/ Daniel W. Koors |
|
Name: | Daniel W. Koors |
|
Title: | Treasurer |
|
Date: | June 6, 2013 |
|
EXHIBIT LIST
Exhibit 12(a)(1) | Code of Ethics (as defined in Item 2(b) of Form N-CSR). |
|
|
Exhibit 12(a)(2)(a) | Certification of the Principal Executive Officer required by Rule 30a-2(a) under the Act. |
|
|
Exhibit 12(a)(2)(b) | Certification of the Principal Financial Officer required by Rule 30a-2(a) under the Act. |
|
|
Exhibit 12(b) | Certification required by Rule 30a-2(b) under the Act. |