Exhibit 99.E


© South African Reserve Bank
All rights reserved. No part of this publication may be reproduced, stored in a retrieval system, or transmitted in any form or by any means, electronic, mechanical, photocopying, recording or otherwise, without fully acknowledging the Quarterly Bulletin of the South African Reserve Bank as the source. The contents of this publication are intended for general information only and are not intended to serve as financial or other advice. While every precaution is taken to ensure the accuracy of information, the South African Reserve Bank shall not be liable to any person for inaccurate information or opinions contained in this publication.
| | | | |
Enquiries relating to this Bulletin should be addressed to: | | | | |
Head: Research Department | | | | |
South African Reserve Bank | | | | |
P O Box 427 | | | | |
Pretoria 0001 | | | | |
Tel. +27 12 313-3668/3676 | | | | |
http://www.reservebank.co.za | | | ISSN 0038-2620 | |
| | |
 | | Quarterly Bulletin June 2013 |
Contents
Quarterly Economic Review
| | | | |
Introduction | | | 1 | |
Domestic economic developments | | | 4 | |
Domestic output | | | 4 | |
Real gross domestic expenditure | | | 8 | |
Factor income | | | 13 | |
Gross saving | | | 14 | |
Employment | | | 14 | |
Labour cost and productivity | | | 19 | |
Prices | | | 20 | |
Foreign trade and payments | | | 27 | |
International economic developments | | | 27 | |
Current account | | | 30 | |
Financial account | | | 35 | |
Foreign debt | | | 37 | |
International reserves and liquidity | | | 38 | |
Exchange rates | | | 39 | |
Monetary developments, interest rates and financial markets | | | 41 | |
Money supply | | | 41 | |
Credit extension | | | 43 | |
Interest rates and yields | | | 45 | |
Money market | | | 49 | |
Bond market | | | 51 | |
Share market | | | 52 | |
Market for exchange-traded derivatives | | | 54 | |
Real-estate market | | | 54 | |
Non-bank financial intermediaries | | | 55 | |
Public finance | | | 57 | |
Non-financial public-sector borrowing requirement | | | 57 | |
Budget comparable analysis of national government finance | | | 61 | |
| |
Statements issued by Gill Marcus, Governor of the South African Reserve Bank | | | | |
| |
Statement of the Monetary Policy Committee 20 March 2013 | | | 67 | |
| |
Statement of the Monetary Policy Committee 23 May 2013 | | | 72 | |
| |
Note | | | | |
| |
Note on the flow of funds in South Africa’s national financial account for the year 2012 | | | 76 | |
| |
Notes to tables | | | 90 | |
| |
Statistical tables | | | | |
| |
Contents | | | S–0 | |
Statistical tables | | | S–2 | |
Key information | | | S–144 | |
| | |
| Quarterly Bulletin June 2013 | | |


Quarterly Economic Review
Introduction
During the first quarter of 2013 the hesitant global recovery continued at a somewhat firmer pace, as a slackening in the rate of expansion in the developing economies was more than fully countered by improved real growth in the advanced economies, particularly in the United States (US) and Japan. Economic activity in the euro area contracted further over the period, with already fragile confidence being undermined towards the end of the quarter by developments in Cyprus. Among the developing countries China experienced lower-than-expected growth in the first quarter, although still expanding at more than twice the pace of overall global output. While the outlook for economic activity in sub-Saharan Africa remained positive, a number of setbacks detracted from the region’s growth momentum in the early part of the year.
Global inflation remained fairly well contained in the first four months of 2013, although inflation outcomes in emerging-market and developing countries exceeded those in the advanced economies. The pedestrian pace of expansion in global activity and slowdown in China’s resource-intensive growth contributed to a moderation in the international prices of oil and a range of other commodities, particularly from mid-February 2013. Under these circumstances most countries maintained an expansionary monetary policy stance, particularly the advanced economies.
In South Africa economic activity lost traction in the first quarter of 2013 as real growth decelerated to an annualised rate of 0,9 per cent – less than the concurrent pace of population growth. The marked loss of growth momentum was largely due to a contraction in manufacturing output, as steel production was affected by a fire at a large steel mill and petroleum refineries were shut down for maintenance. Simultaneously, agricultural output declined as a dry mid-season spell resulted in a downward revision in crop estimates. The production of electricity also contracted further over the period, reflecting the impact of supply constraints and higher real prices. By contrast, real value added in mining increased as platinum output recovered from the strike-related production stoppages that affected the platinum industry in the second half of 2012, while gold output rose somewhat despite an underground fire at one of the major gold mines. In the construction industry activity in the residential and non-residential building sectors picked up somewhat in the first quarter of 2013.
In the services sector real output continued expanding at a reasonably firm pace, buoyed by activity in the finance, retail trade and communication subsectors. With employment gains in government slowing in the first quarter of 2013, growth in the general government’s real value added moderated somewhat over the period.
Growth in real gross domestic expenditure accelerated in the first quarter of 2013 as real final consumption by government and inventory investment rebounded, having registered declines in the previous quarter. The most significant increases in real inventory holdings in the first quarter were recorded in the manufacturing and mining sectors, replenishing low stock levels carried over from the previous period. Government simultaneously stepped up real spending on non-wage goods and services, alongside a slower pace of increase in real compensation of government employees.
Growth in real disposable income of households and the pace of increase in real final consumption expenditure by households both moderated somewhat in the first quarter of 2013. The pace of increase in spending on durable goods continued to lose momentum, especially in the area of purchases of new motor vehicles albeit off a high base. Expenditure on semi-durable goods remained firm, supported by resilient spending on clothing and footwear, whereas the pace of increase in households’ purchases of non-durable goods also decelerated significantly over the period. Real spending by households on services registered a moderate acceleration in the first quarter of 2013 as expenditure on rent, household and medical services increased. Households continued to incur further debt over the period but at a fairly modest pace which was closely aligned with the growth in disposable income, resulting in a broadly sideways movement of the household debt-to-income ratio.
| | |
| Quarterly Bulletin June 2013 | | |


Growth in real gross fixed capital formation slowed further in the first quarter of 2013. Of the main three institutional sectors, only general government registered an acceleration as provincial and central government departments increased their capital spending on housing and construction works. Fixed capital outlays by both private business enterprises and public corporations registered slower growth. The deceleration in investment activity by private business enterprises was widespread and consistent with the generally more subdued economic conditions, with only the agricultural sector, building contractors and business services firms stepping up their expenditure on capital goods. Albeit off a high base, the pace of increase in real capital spending by public corporations slowed considerably in the first quarter, reflecting a weakening of capital investment by the electricity sector as industrial action interrupted progress with the construction of a new power plant. This negative impact was partly offset by firm capital expenditure by public corporations related to the expansion of freight rail, port terminal and road capacity.
The subdued growth trajectory in South Africa was mirrored in lustreless job creation, with total employment rising by only 1,5 per cent over the year to the first quarter of 2013 and a quarter of the workforce remaining unemployed. Job creation continued to be skewed towards the public sector rather than the private sector. Average wage settlements rose marginally in the first quarter of 2013 when compared with 2012, but allowing for productivity improvements, unit labour cost increases remained fairly aligned with the upper limit of the 3 to 6 per cent inflation target range. Consumer price inflation accelerated in the course of the past year, driven by the prices of petrol, food, transport, education, health services and health insurance, and levelled off just below the upper limit of the target range in the early part of 2013. The depreciation in the exchange value of the rand over the past year was an important indirect contributor to the inflation process.
In the first quarter of 2013 the deficit on the current account of the balance of payments narrowed to 5,8 per cent of gross domestic product. The trade account benefited from an increase in external demand, especially from emerging-market economies, firm international prices for South African export commodities, an improvement in the terms of trade and a more competitive exchange value of the rand. Although imports also rose significantly as domestic expenditure expanded, this fell short of the increase in export proceeds. Simultaneously the deficit on the services and current transfer account narrowed, reflecting improved travel and dividend receipts from the rest of the world.
The deficit on the current account was fully financed by a further sizeable inflow of foreign capital in the first quarter of 2013, registered against the backdrop of nominal interest rate differentials that continued to favour South Africa. A net inflow of direct investment capital was recorded as foreign parent companies extended long-term loans to their domestic subsidiaries. Other investment flows also registered an inflow of capital on a net basis, while portfolio investment (including new issues and redemptions of portfolio investment assets) switched to a net outflow of capital over the period.
The exchange value of the rand depreciated in the first five months of 2013 driven by apprehension about a range of factors including South Africa’s comparatively large current-account deficit, loss of international competitiveness, electricity-supply constraints, labour unrest, the possibility of weaker global demand for commodities, and concerns about further sovereign debt downgrades. During May severe industrial action and violent unrest highlighted the risk of further mining-supply disruptions, exacerbating the depreciation of the exchange rate.
Overall bank lending to the domestic private sector remained hesitant in the first four months of 2013 despite the low levels at which benchmark interest rates had been maintained since mid-2012. Growth in general loans to the household sector started to lose some of its earlier buoyant momentum, probably reflecting greater caution among lenders and borrowers alike. However, instalment sale credit continued to expand briskly over the period, consistent with fairly high levels of purchases of durable goods. Mortgage lending remained very slow, although a number of indicators of housing activity and prices started improving.
| | |
| | | Quarterly Bulletin June 2013 |
Share prices on the JSE Limited (JSE) reached further record highs in the first part of 2013 and bond yields also trended lower to levels previously observed more than four decades ago. However, in May and early June the depreciation of the exchange value of the rand and associated expectations of higher inflation resulted in a significant firming of bond yields, while rates on forward rate agreements also rose notably.
The finances of the broad public sector had a decidedly more expansionary thrust in the past fiscal year. While the general government continued to render support to the economic recovery by incurring a somewhat larger deficit, the financial shortfall of the non-financial public enterprises and corporations more than doubled over the period as these institutions stepped up their infrastructure investment drive. At the same time the ratio of government debt to gross domestic product continued on an upward trajectory, although remaining well contained when compared with debt ratios in other economies.
| | |
| Quarterly Bulletin June 2013 | | |


Domestic economic developments
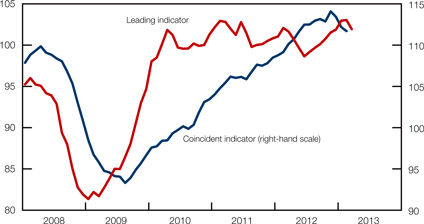
Following eight consecutive monthly increases, the composite leading business cycle indicator decreased in March 2013. The leading indicator has trended broadly sideways since mid-2010, suggesting a continuation of the sluggish economic growth rates observed in recent quarters. The composite coincident business cycle indicator decreased for a third consecutive month in February 2013, reflecting the recent loss of momentum in output growth in the domestic economy.
Composite business cycle indicators
Indices: 2010 = 100
Domestic output1
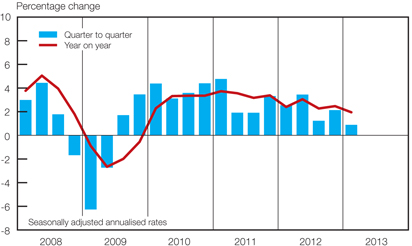
Activity in the domestic economy lost some momentum in the first quarter of 2013. Growth in real gross domestic production slowed from an annualised rate of 2,1 per cent in the final quarter of 2012 to 0,9 per cent in the first quarter of 2013. The slower pace of increase primarily reflected a contraction in the real output of the secondary sector. Growth in the real value added by the primary sector rebounded, while activity in the tertiary sector remained lively.
Real gross domestic product
| | |
| | | Quarterly Bulletin June 2013 |
Excluding the contribution of the more volatile primary sector, growth in real gross domestic product plunged from 2,7 per cent in the fourth quarter of 2012 to only 0,2 per cent in the first quarter of 2013.
Subsequent to a decline of 3,7 per cent in the fourth quarter of 2012, the real value added by the primary sector expanded at a firm pace in the first quarter of 2013, rising at an annualised rate of 8,1 per cent. Real output of the mining sector improved following the low production base in the final quarter of 2012 brought about by protracted labour-related shutdowns of operations and technical problems experienced at some mines. Agricultural output growth, however, turned negative in the first quarter of 2013.
Real gross domestic product
Percentage change at seasonally adjusted annualised rates
| | | | | | | | | | | | | | | | | | | | | | | | |
| | | 2012 | | | 2013 | |
Sector | | 1st qr | | | 2nd qr | | | 3rd qr | | | 4th qr | | | Year | | | 1st qr | |
Primary sector | | | -9,5 | | | | 24,0 | | | | -7,1 | | | | -3,7 | | | | -2,2 | | | | 8,1 | |
Agriculture | | | 4,8 | | | | 9,3 | | | | 7,4 | | | | 10,0 | | | | 2,3 | | | | -4,9 | |
Mining | | | -15,1 | | | | 30,9 | | | | -12,7 | | | | -9,3 | | | | -4,0 | | | | 14,6 | |
Secondary sector | | | 5,5 | | | | -0,5 | | | | 1,5 | | | | 3,6 | | | | 2,1 | | | | -6,2 | |
Manufacturing | | | 6,4 | | | | -0,8 | | | | 1,2 | | | | 5,0 | | | | 2,4 | | | | -7,9 | |
Tertiary sector | | | 3,1 | | | | 2,3 | | | | 1,9 | | | | 2,4 | | | | 3,0 | | | | 2,4 | |
Non-primary sector | | | 3,7 | | | | 1,6 | | | | 1,8 | | | | 2,7 | | | | 2,8 | | | | 0,2 | |
Total | | | 2,5 | | | | 3,4 | | | | 1,2 | | | | 2,1 | | | | 2,5 | | | | 0,9 | |
| | | | | | | | | | | | | | | | | | | | | | | | |
Lower field crop production brought about by a dry mid-season spell was reflected in the real value added by the agricultural sector declining at a rate of 4,9 per cent in the first quarter of 2013. Livestock and horticultural production, by contrast, held up fairly well over the period. Early indications are that field crop production for the 2012/13 production season is likely to be lower than in the previous production season.
Commercial maize crop estimates
| | | | | | | | |
| | | Crop | | | Area planted | |
| Period | | (Million tons) | | | (Million hectares) | |
2011/12: Final | | | 12,1 | | | | 2,7 | |
2012/13: Fourth production forecast | | | 11,4 | | | | 2,8 | |
Source: Crop Estimate Committee
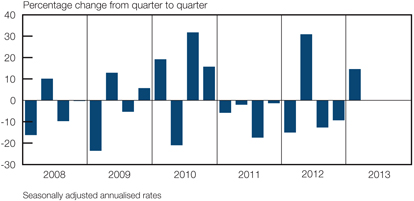
Following declines in the second half of 2012, the real value added by the mining sector rebounded, rising at an annualised rate of 14,6 per cent in the first quarter of 2013. The recovery in mining output could mainly be attributed to increases in the production of gold and platinum over the period. Mining production contributed 0,7 of a percentage point to growth in real gross domestic product in the first quarter of 2013 after having subtracted 0,5 of a percentage point in the final quarter of 2012.
The gold-mining sector benefited from increased production following strike activity in the second half of 2012. Production losses due to an underground fire at one of South Africa’s major gold mines in the early months of 2013, together with the power outage and production ramp-up at another gold mine, however, partly restrained the growth in gold output over the period. Platinum production continued to recover from the strike-related production stoppages
| | |
| Quarterly Bulletin June 2013 | | |


that affected the platinum industry in the second half of 2012. Coal production receded in the first quarter of 2013 due to excessive rainfall that affected most coal mines and ongoing strike action that halted production at several coal operations. Contingency measures, however, assured the supply of coal to power stations during the period. Diamond production contracted markedly during the quarter as excessive rainfall disrupted production at the country’s biggest diamond mine. A deterioration in the grades and quality of diamonds further contributed to lower production volumes at certain mines over the period. More generally, rapidly rising input costs, productivity impediments and illegal strike action, combined with a falling demand for some mineral products, continued to affect mining operations adversely in South Africa.
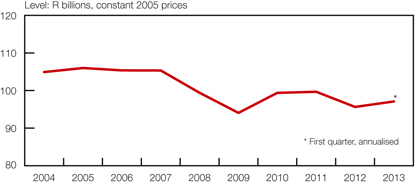
Real gross domestic product of the mining sector
Having increased at an annualised rate of 3,6 per cent in the fourth quarter of 2012, the real value added by the secondary sector contracted at a rate of 6,2 per cent in the first quarter of 2013. Production in the manufacturing and electricity, gas and water sectors receded, while growth in the real value added by the construction sector was broadly maintained over the period.
The real value added by the manufacturing sector switched from a moderate increase of 5 per cent in the fourth quarter of 2012 to an annualised rate of decline of 7,9 per cent in the first quarter of 2013 – reducing output to levels recorded roughly a year earlier. This decline reflected lower production volumes in the manufacturing of wood and wood products; petroleum and chemicals; glass and non-metallic mineral products; basic iron and steel, non-ferrous metal products and machinery; radio, television and communication apparatus and professional equipment; and furniture and other manufacturing products. Conversely, production increased in the subsectors for food and beverages; textiles, clothing, leather and footwear; electrical machinery; and motor vehicles, parts and accessories and other transport equipment. The contraction in manufacturing production caused the contribution of manufacturing to growth in real gross domestic product to change from adding 0,8 of a percentage point in the fourth quarter of 2012 to subtracting 1,2 percentage points in the first quarter of 2013.
| | |
| | | Quarterly Bulletin June 2013 |
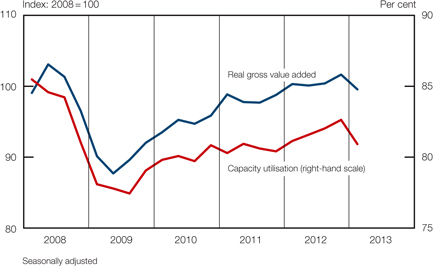
The weaker performance of the manufacturing sector could be attributed to subdued business confidence levels, sluggish domestic demand, rising inflation, disrupting industrial action, concerns about sustainable electricity supply, and poor trading conditions in many of the country’s leading trading-partner countries. With a fire at a steel mill and refinery maintenance also dragging production down, the utilisation of production capacity in the manufacturing sector declined from 82,6 per cent in the fourth quarter of 2012 to 80,9 per cent in the first quarter of 2013, well below its recent peak of 86,6 per cent registered in the first quarter of 2007.
Manufacturing: Real gross value added and capacity utilisation
In the sector supplying electricity, gas and water, the real value added contracted further at an annualised rate of 3 per cent in the first quarter of 2013, following a decline of 2,2 per cent in the fourth quarter of 2012. This was the fourth quarterly decline in the real value added by the sector in five consecutive quarters, and could partly be attributed to unscheduled maintenance at a production unit due to an electrical fault. Year-on-year growth in electricity consumption plunged to its lowest rate since the second quarter of 2012, reflecting, inter alia, the outcome of Eskom’s ongoing buy-back agreements with some large-scale industrial users to save electricity, and the impact of higher electricity prices on consumption.
Growth in real output of the construction sector accelerated marginally from an annualised rate of 0,2 per cent in the fourth quarter of 2012 to 0,9 per cent in the first quarter of 2013. Construction activity in the residential and non-residential building sectors picked up somewhat, while civil construction activity slowed over the period.
In the services sector real output growth was maintained at a rate of 2,4 per cent in both the fourth quarter of 2012 and the first quarter of 2013. The real value added by the finance, insurance, real-estate and business services, and by the trade and transport sectors increased over the period, while activity in the general government sector lost momentum.
After recording progressively slower quarter-to-quarter growth throughout 2012, the real value added by the trade sector bounced back and rose at an annualised rate of 1,9 per cent in the first quarter of 2013. This increase could mainly be attributed to the improved performance of the retail subsector which continued to benefit from the relatively low interest rate environment. Over the same period, the real value added by the wholesale sector increased marginally, while growth in the real value added by the motor trade subsector slowed somewhat. Besides the slower growth in demand for new passenger vehicles by the household sector and weaker
| | |
| Quarterly Bulletin June 2013 | | |


demand from the car rental industry, growth in light commercial vehicle (LCV) sales and the exports of passenger vehicles also moderated. Measured over one year, the growth in real value added by the trade sector slowed from 2,9 per cent in the fourth quarter of 2012 to 2,1 per cent in the first quarter of 2013.
The real value added by the transport, storage and communication sector increased mildly from an annualised rate of 1,9 per cent in the fourth quarter of 2012 to 2,2 per cent in the first quarter of 2013. Land transport volumes increased slightly in a more normalised trading environment following widespread disruptive labour disputes in the second half of 2012. Activity in the communication sector maintained its steady upward momentum in the opening months of 2013.
Growth in the real output originating in the finance, insurance, real-estate and business services sector accelerated from an annualised rate of 2,9 per cent in the fourth quarter of 2012 to 3,3 per cent in the first quarter of 2013. This acceleration largely reflected increased trading activity in the domestic securities market while the real value added by the banking sector decreased. According to the Ernst & Young Financial Sector Confidence Index, banking confidence was marginally softer in the first quarter of 2013.
The real value added by general government slowed from an annualised growth rate of 2,6 per cent in the fourth quarter of 2012 to 1,9 per cent in the first quarter of 2013 as employment gains in general government moderated over the period.
Real gross domestic expenditure
Real gross domestic expenditure increased at an annualised rate of 3,5 per cent in the first quarter of 2013, having declined by 0,9 per cent in the fourth quarter of 2012. Following a contraction previously, both real final consumption expenditure by general government and real inventory holdings increased in the first quarter. Although growth in real final consumption expenditure by households and gross fixed capital formation lost some momentum in the first quarter of 2013, real gross domestic final demand still increased at an annualised rate of 2,5 per cent over the period.
Components of real gross domestic final demand

| | |
| | | Quarterly Bulletin June 2013 |
Real gross domestic expenditure
Percentage change at seasonally adjusted annualised rates
| | | | | | | | | | | | | | | | | | | | | | | | |
| | | 2012 | | | 2013 | |
| Component | | 1st qr | | | 2nd qr | | | 3rd qr | | | 4th qr | | | Year | | | 1st qr | |
Final consumption expenditure | | | | | | | | | | | | | | | | | | | | | | | | |
Households | | | 4,0 | | | | 3,2 | | | | 2,7 | | | | 2,4 | | | | 3,5 | | | | 2,3 | |
General government | | | 1,9 | | | | 3,7 | | | | 8,3 | | | | -0,7 | | | | 4,2 | | | | 3,0 | |
Gross fixed capital formation | | | 4,6 | | | | 5,4 | | | | 5,6 | | | | 4,3 | | | | 5,7 | | | | 2,5 | |
Domestic final demand | | | 3,7 | | | | 3,7 | | | | 4,3 | | | | 2,1 | | | | 4,0 | | | | 2,5 | |
Change in inventories (R billions)* | | | 5,9 | | | | 6,3 | | | | 5,1 | | | | -4,1 | | | | 3,3 | | | | 4,0 | |
Gross domestic expenditure | | | 4,4 | | | | 4,4 | | | | 4,1 | | | | -0,9 | | | | 4,1 | | | | 3,5 | |
Growth in real final consumption expenditure by households slowed marginally from 2,4 per cent in the fourth quarter of 2012 to 2,3 per cent in the first quarter of 2013 amid dwindling consumer confidence levels. Real spending on both durable and non-durable goods slowed, while consumers sustained their strong appetite for semi-durable goods. Spending on services continued to increase at a slow pace during this period.
Real final consumption expenditure by households
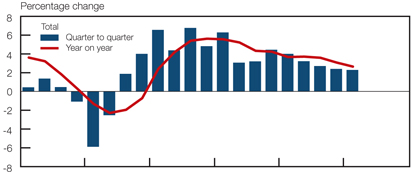

Growth in real spending on durable goods slowed from an annualised rate of 6,1 per cent in the fourth quarter of 2012 to 5,4 per cent in the first quarter of 2013 – the lowest rate of increase in almost four years. This slower growth could probably be attributed to the moderation in real
| | |
| Quarterly Bulletin June 2013 | | |


disposable income growth and in unsecured lending extended to households as banks appear to be tightening their lending practices in view of a deterioration in the risk profile of consumers. The slower spending mainly occurred in the personal transport equipment category, especially new motor vehicle sales, where the replacement cycle may have started to mature. Over the same period, real spending on furniture and household appliances increased further, albeit at a more moderate pace than in the preceding quarter.
Growth in nominal household expenditure on durable goods and unsecured lending
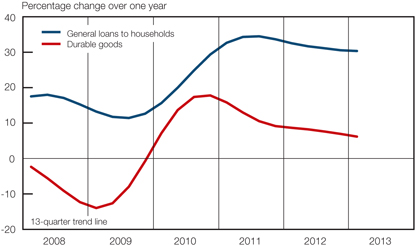
Spending on durable goods has gradually lost momentum since the fourth quarter of 2011 as the household sector increasingly experienced higher levels of financial stress, exacerbated by rising inflation and slower growth in real disposable income. More recently, outlays on durable goods have probably also been hampered by the faster pace of increase in the relative prices of imported goods due to the depreciation in the exchange value of the rand.
Real final consumption expenditure by households
Percentage change at seasonally adjusted annualised rates
| | | | | | | | | | | | | | | | | | | | | | | | |
| | | 2012 | | | 2013 | |
| Component | | 1st qr | | | 2nd qr | | | 3rd qr | | | 4th qr | | | Year | | | 1st qr | |
Durable goods | | | 8,1 | | | | 8,9 | | | | 7,8 | | | | 6,1 | | | | 11,0 | | | | 5,4 | |
Semi-durable goods | | | 6,1 | | | | 6,8 | | | | 6,2 | | | | 5,1 | | | | 6,2 | | | | 6,2 | |
Non-durable goods | | | 2,5 | | | | 2,2 | | | | 1,7 | | | | 2,3 | | | | 2,5 | | | | 1,4 | |
Services | | | 3,6 | | | | 1,7 | | | | 1,3 | | | | 0,8 | | | | 1,8 | | | | 1,1 | |
Total | | | 4,0 | | | | 3,2 | | | | 2,7 | | | | 2,4 | | | | 3,5 | | | | 2,3 | |
After increasing at a slightly slower pace in the fourth quarter of 2012, spending on semi-durable goods increased at a somewhat faster pace in the first quarter of 2013. Spending on clothing and footwear – the largest category of semi-durable goods – remained firm, partly due to the prices of these products being well contained. Moreover, spending on household textiles, furniture, and recreational and entertainment goods also picked up, whereas spending on motor vehicle parts and accessories and miscellaneous goods remained lacklustre over the period.
Subsequent to an annualised increase of 2,3 per cent in the fourth quarter of 2012, growth in real spending on non-durable goods decelerated to 1,4 per cent in the first quarter of 2013. Higher spending on food – the category with the largest weight in the non-durable goods
| | |
| | | Quarterly Bulletin June 2013 |
basket – was neutralised by slower growth in spending on beverages and tobacco in the first quarter of 2013. In addition, real spending on petroleum products declined, probably due to sharp increases in the price of petrol over the period. Concurrently, expenditure on transport services also contracted. However, spending on household fuel, medical products, and recreational and entertainment goods increased over the period.
Real spending by households on services – the largest component of household expenditure – increased at a rate of 1,1 per cent in the first quarter of 2013, slightly higher than the pace of increase attained in the final quarter of 2012. Higher spending on rent, household and medical services was partly offset by a decline in expenditure on transport and communication services. The increase in spending on miscellaneous services was partly neutralised by a slower pace of increase in net travel receipts from abroad.
Box 1: Revision of the household debt-service cost ratio
The interest rates that apply to various types of loans differ significantly. A structural shift in credit extension in favour of non-mortgage lending, together with an extension of the range of interest rates reported to the South African Reserve Bank covering various types of credit extended to households, mandated a re-look at the methodology used to estimate the debt-service cost of the household sector in the national accounts statistics. As a percentage of total household debt, the non-mortgage debt of the household sector rose from 39 per cent in 2007 to 46 per cent in 2012 as so-called unsecured lending expanded briskly.
As shown in the accompanying graph, the revised debt-service cost as a percentage of disposable income has exceeded previously calculated ratios since the first quarter of 2008. The broad trends, however, remain roughly unchanged. The increasing gap between the two ratios mainly reflects the growing share of non-mortgage lending in total lending to the household sector, and the fact that the interest rates applicable to non-mortgage loans are generally significantly higher than typical mortgage interest rates.
Debt-service cost as a percentage of disposable income
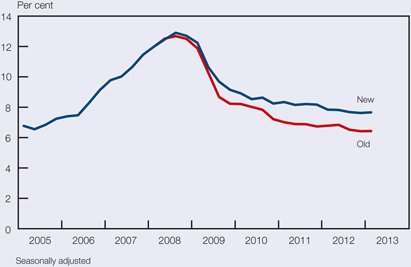
Although still work in progress, the preliminary revised debt-service cost ratio is published as part of key national accounts statistics on page S–152 of this Quarterly Bulletin. The secondary impact of this revision on other national accounts aggregates will be made available at a later stage.
| | |
| Quarterly Bulletin June 2013 | | |


Following an increase of 2,4 per cent in the fourth quarter of 2012, growth in real disposable income of households moderated somewhat to 2,2 per cent in the first quarter of 2013. The slower pace of increase in the disposable income of consumers could largely be attributed to slower growth in compensation of employees over the period. Even though the rate of increase in household debt slowed, the ratio of debt to disposable income remained at 75,4 per cent in the first quarter of 2013.
Against the backdrop of relatively low and steady interest rates in South Africa, the debt-service cost ratio of households edged higher from a revised 7,6 per cent in the fourth quarter of 2012 to 7,7 per cent in the first quarter of 2013. Owing to nominal disposable income increasing at a slower pace than household wealth, the ratio of household net wealth to disposable income advanced from 314 per cent in the fourth quarter of 2012 to 321 per cent in the first quarter of 2013.
Following a decline of 0,7 per cent in the fourth quarter of 2012, real final consumption expenditure by general government grew at an annualised rate of 3 per cent in the first quarter of 2013. The faster pace of spending was largely due to increased outlays on non-wage goods and services, which outweighed a slower pace of increase in compensation of employees. Outlays on non-wage goods and services reflected, inter alia, government’s intention to enhance the quality of education and healthcare, including the provision of antiretroviral medicines. Real final consumption expenditure by general government as a ratio of gross domestic product increased at broadly the same rate as recorded in the fourth quarter of 2012. However, growth in real spending by government, excluding armaments, tapered off from 3,6 per cent in the fourth quarter of 2012 to 3 per cent in the first quarter of 2013.
Growth in aggregate real gross fixed capital formation continued to slow in the first quarter of 2013. The annualised rate of increase in real capital spending moderated from 4,3 per cent in the fourth quarter of 2012 to 2,5 per cent in the first quarter of 2013. This deceleration, notwithstanding relatively low interest rates and the high priority assigned to government’s infrastructural development programme, could be ascribed to slower growth in real fixed capital outlays by both private business enterprises and public corporations.
Real gross fixed capital formation
Percentage change at seasonally adjusted annualised rates
| | | | | | | | | | | | | | | | | | | | | | | | |
| | | 2012 | | | 2013 | |
| Sector | | 1st qr | | | 2nd qr | | | 3rd qr | | | 4th qr | | | Year | | | 1st qr | |
Private business enterprises | | | 2,5 | | | | 2,7 | | | | 2,8 | | | | 3,8 | | | | 3,9 | | | | 2,8 | |
Public corporations | | | 11,0 | | | | 9,8 | | | | 10,6 | | | | 7,2 | | | | 9,1 | | | | 1,5 | |
General government | | | 4,9 | | | | 10,9 | | | | 10,3 | | | | 2,1 | | | | 8,5 | | | | 3,2 | |
Total | | | 4,6 | | | | 5,4 | | | | 5,6 | | | | 4,3 | | | | 5,7 | | | | 2,5 | |
Having accelerated for four consecutive quarters, annualised growth in real fixed capital expenditure by private business enterprises slowed to 2,8 per cent in the first quarter of 2013. Subdued outlays by all sectors, with the exception of the agriculture, construction and finance sectors, contributed to the slower investment activity by private business enterprises.
If the slower pace of capital spending were to continue, it could reduce the long-term growth potential of the economy and cause capacity constraints to develop and inflationary pressures to escalate. Both the mining and manufacturing sectors continued to face large-scale uncertainties, globally as well as domestically, which caused them to lower their capital spending on machinery and equipment significantly in the first quarter of 2013. The mining sector, more especially the gold and platinum mining industry, was negatively impacted by the volatility in the exchange value of the rand. By contrast, building contractors raised their capital spending, consistent with the improvement in market sentiment following renewed activity in high-density residential and non-residential building projects. In addition, business services increased their spending on computer and information technology equipment and computer software.
| | |
| | | Quarterly Bulletin June 2013 |
Real gross fixed capital formation
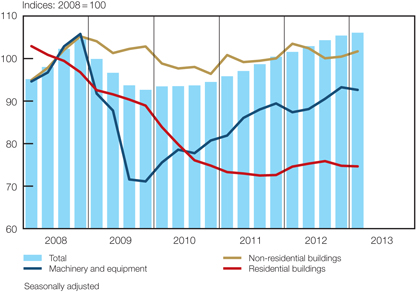
The pace of increase in real spending by public corporations slowed from 7,2 per cent in the final quarter of 2012 to 1,5 per cent in the first quarter of 2013, mainly due to a deceleration in capital investment by the electricity sector. The slower growth in capital spending by the electricity sector resulted primarily from several weeks of continued industrial action at the Medupi power plant. However, meaningful capital spending on ongoing projects by Transnet, in particular the freight rail expansion project and the port terminals capacity expansion project, helped to counter the slower growth. In addition, the South African National Roads Agency (SANRAL) continued with its capital spending on roads, with the bulk of the spending taking place on non-toll roads.
Growth in capital expenditure by general government accelerated from an annualised rate of 2,1 per cent in the fourth quarter of 2012 to 3,2 per cent in the first quarter of 2013. Provincial and central government departments increased their capital spending in the areas of housing and construction works. These social and economic infrastructure spending programmes have been the key contributor throughout 2012 and have continued into the first quarter of 2013.
Subsequent to a decline of R4,1 billion in the level of real inventories in the fourth quarter of 2012, stocks increased by R4 billion in the first quarter of 2013. This accumulation of real inventory holdings boosted growth in real gross domestic expenditure by 1,5 percentage points in the first quarter of 2013, following a subtraction of 1,7 percentage points in the preceding quarter. The most significant increases in real inventory holdings in the first quarter of 2013 were recorded in the manufacturing and mining sectors.
Inventories were accumulated in the manufacturing sector due to increased imports of crude oil to replenish the low stock levels brought about by planned maintenance shutdowns conducted at some major refineries during the fourth quarter of 2012. In the mining sector levels of platinum and coal inventories increased in the first quarter of 2013.
Factor income
Growth over four quarters in total nominal factor income slowed from 7,6 per cent in the fourth quarter of 2012 to 6,9 per cent in the first quarter of 2013. This resulted from a decrease in the momentum of growth in remuneration of employees, while gross operating surpluses of business enterprises increased over the period.
| | |
| Quarterly Bulletin June 2013 | | |


Measured over one year, growth of 7,4 per cent was recorded in total compensation of employees in the first quarter of 2013, lower than the rate of 9,2 per cent registered in the fourth quarter of 2012. Although a moderation in growth in compensation was recorded in most sectors of the economy, it was most prominent in the general government sector. Government’s salary and wage bill returned to normal in the first quarter of 2013, after sizeable bonuses were paid out in the fourth quarter of 2012. The moderation in compensation of employees was also broadly consistent with the relatively stable employment conditions in the formal economy over the period. Accordingly, the ratio of remuneration of employees to total factor income decreased from 51,9 per cent in the fourth quarter of 2012 to 51,8 per cent in the first quarter of 2013.
The year-on-year growth in the total gross operating surplus of business enterprises accelerated from 5,8 per cent in the fourth quarter of 2012 to 6,4 per cent in the first quarter of 2013. Increased growth mainly occurred in the agricultural and mining sectors. Mining operations expanded in the first quarter of 2013, following supply constraints at a major platinum mine and safety stoppages curbing operations during the preceding quarter. Accordingly, the share of the gross operating surplus in total factor income increased from 48,1 per cent in the final quarter of 2012 to 48,2 per cent in the first quarter of 2013.
Gross saving
The national saving ratio measured as gross saving as a percentage of gross domestic product increased from 12,8 per cent in the fourth quarter of 2012 to 14 per cent in the first quarter of 2013. Gross saving by the corporate sector and by general government increased, while the household saving ratio remained unchanged. The overall level of gross saving increased by an annualised R42,7 billion, thereby lowering South Africa’s dependency on foreign capital to finance gross capital formation from 33,7 per cent in the fourth quarter of 2012 to 29,3 per cent in the first quarter of 2013.
Gross saving by the corporate sector as a percentage of gross domestic product increased slightly from 13,8 per cent in the fourth quarter of 2012 to 14,2 per cent in the first quarter of 2013. The higher value of the gross operating surplus of business enterprises and lower dividend declarations contributed to this outcome.
Gross dissaving by general government as a ratio of gross domestic product moderated from a rate of 2,7 per cent in the fourth quarter of 2012 to 1,9 per cent in the first quarter of 2013. Rising tax collections alongside a slight moderation in government expenditure on certain items such as transfers to households and social benefit payments had a positive effect on the level of saving.
Gross saving by the household sector as a percentage of gross domestic product remained at 1,7 per cent for the fifth consecutive quarter in the first quarter of 2013. Although expenditure by households lost some momentum, the simultaneously slower pace of increase in disposable income resulted in the saving ratio being sustained over the period.
Employment
Alongside sluggish output growth in the domestic economy, employment in the formal non-agricultural sector of the economy decreased marginally in the fourth quarter of 2012. According to the Quarterly Employment Statistics (QES) survey by Statistics South Africa (Stats SA), employment decreased by 0,7 per cent on a seasonally adjusted and annualised basis in the fourth quarter of 2012, as both the public and private sector shed jobs during the period. Employment decreased by an estimated 14 200 jobs on a seasonally adjusted and annualised basis in the fourth quarter of 2012, bringing the level of total formal non-agricultural employment to an estimated 8,43 million at the end of December 2012.2 Employment growth in the South African economy slowed notably over the past year, with the annual average growth in total formal non-agricultural employment moderating from 2,2 per cent in 2011 to 1,2 per cent in 2012.
| | |
| | | Quarterly Bulletin June 2013 |
Change in enterprise-surveyed formal non-agricultural employment by sector*
| | | | | | | | | | | | | | | | | | | | | | | | |
| | | Change in
4th qr 2012 | | | Change over four
quarters to
4th qr 2012 | | | Cumulative job
losses(-) gains(+) | |
| Sector | | Number | | | Per
cent | | | Number | | | Per
cent | | | 4th qr 2008
to 1st qr
2010 | | | 2nd qr 2010
to 4th qr
2012 | |
Finance, insurance, real-estate and business services | | | -600 | | | | -0,1 | | | | 10 000 | | | | 0,5 | | | | -163 400 | | | | 75 300 | |
Manufacturing | | | 2 600 | | | | 0,9 | | | | -2 400 | | | | -0,2 | | | | -118 300 | | | | -29 700 | |
Trade, catering and accommodation services | | | -17 200 | | | | -4,0 | | | | 9 200 | | | | 0,6 | | | | -75 700 | | | | 37 600 | |
Construction | | | 2 000 | | | | 1,9 | | | | 2 700 | | | | 0,6 | | | | -52 100 | | | | 16 900 | |
Total mining | | | 5 500 | | | | 4,3 | | | | 1 200 | | | | 0,2 | | | | -35 900 | | | | 27 500 | |
Gold mining | | | -1 000 | | | | -2,7 | | | | -2 500 | | | | -1,8 | | | | -8 900 | | | | -19 200 | |
Other mining | | | 6 500 | | | | 7,1 | | | | 3 700 | | | | 1,0 | | | | -27 000 | | | | 46 700 | |
Electricity | | | -600 | | | | -3,8 | | | | 2 600 | | | | 4,3 | | | | -3 300 | | | | 6 200 | |
Private transport, storage and communication services | | | 1 600 | | | | 2,5 | | | | -2 800 | | | | -1,0 | | | | -2 000 | | | | 4 700 | |
Community, social and personal services | | | -100 | | | | -0,1 | | | | 6 500 | | | | 1,6 | | | | 13 400 | | | | 11 200 | |
Private sector | | | -6 800 | | | | -0,4 | | | | 27 000 | | | | 0,4 | | | | -437 300 | | | | 149 600 | |
Provinces | | | -9 800 | | | | -3,5 | | | | 12 600 | | | | 1,2 | | | | 51 600 | | | | 80 700 | |
Local governments | | | 8 600 | | | | 13,8 | | | | 14 700 | | | | 5,8 | | | | 15 000 | | | | 29 400 | |
National departments | | | -12 300 | | | | -10,3 | | | | 1 700 | | | | 0,4 | | | | -800 | | | | 35 600 | |
Other public-sector enterprises | | | -3 300 | | | | -9,0 | | | | 1 600 | | | | 1,2 | | | | -7 800 | | | | 8 800 | |
Public transport, storage and communication services | | | 9 200 | | | | 36,8 | | | | 16 600 | | | | 15,6 | | | | -4 900 | | | | 19 200 | |
Total public sector | | | -7 500 | | | | -1,4 | | | | 47 200 | | | | 2,3 | | | | 53 100 | | | | 173 700 | |
Grand total | | | -14 200 | | | | -0,7 | | | | 74 200 | | | | 0,9 | | | | -384 200 | | | | 323 300 | |
| * | Seasonally adjusted. Components may not add to totals due to rounding |
Following two quarters of notable employment gains, the public sector shed 7 500 jobs in the fourth quarter of 2012, representing an annualised rate of decrease of 1,4 per cent. Labour paring was most pronounced at national departments, followed by provincial governments. Conversely, local governments and public-sector enterprises expanded their employment numbers further in the fourth quarter of 2012.
In the wake of the fairly pervasive and disruptive industrial action that occurred in the second half of 2012, private-sector employment contracted further in the fourth quarter of 2012, albeit at a much slower pace than in the third quarter. Job shedding was fairly pervasive throughout the private sector, with employment losses occurring in the trade, catering and accommodation services sector (at an annualised rate of 4,0 per cent); the electricity sector (3,8 per cent); the gold-mining sector (2,7 per cent); the finance, insurance, real-estate and business services sector (0,1 per cent) and the private community, social and personal services sector (0,1 per cent). These decreases were partly countered by employment gains in the non-gold mining sector (7,1 per cent); the private transport, storage and communication sector (2,5 per cent); the construction sector (1,9 per cent) and the manufacturing sector (0,9 per cent).
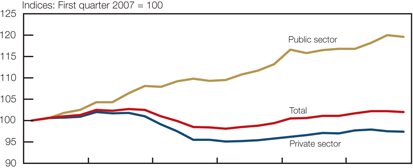
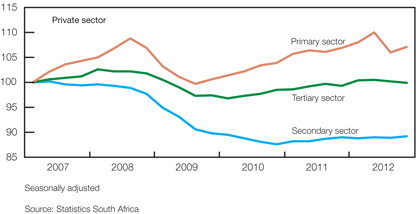
Following the decrease in employment in the third and fourth quarters of 2012, the private sector added only about 27 000 job opportunities in the year to the fourth quarter of 2012, representing a disappointing increase of only 0,4 per cent. The accompanying graph illustrates the loss of momentum in private-sector employment growth over the past two years; the private
| | |
| Quarterly Bulletin June 2013 | | |


sector added 36 800 employment opportunities in the second half of 2010, only 20 300 in the second half of 2011, before shedding 37 600 in the same period of 2012. Although the decline in private-sector employment in the second half of 2012 was exacerbated by the labour unrest that occurred in various sectors of the economy over this period, the loss of underlying momentum was nevertheless evident, particularly in tertiary-sector employment. Despite the industrial action occurring predominantly in the primary sector of the economy, private tertiary-sector employment – representing about 65 per cent of total formal non-agricultural private-sector employment –decreased for two consecutive quarters up to the fourth quarter of 2012, shedding some 27 300 jobs over this period. The slowdown in private-sector employment growth is indicative of the difficulty facing the South African economy in addressing the high level of domestic unemployment, particularly in the current challenging global economic environment.
Formal non-agricultural employment
Following the loss of around 19 500 mining-sector jobs in the third quarter of 2012 largely due to the unprotected strike activity that pervaded the sector, employment in the mining sector increased by 5 500 in the fourth quarter of 2012, as some of the miners who were dismissed during the wildcat strikes were later re-hired. The non-gold mining sector in particular shed roughly 18 700 jobs in the third quarter of 2012, of which only about 6 500 were recovered in the fourth quarter. Conversely, employment levels in the gold-mining sector have contracted uninterruptedly since the first quarter of 2010, with the pace of job shedding accelerating for four consecutive quarters to an annualised rate of 2,7 per cent in the fourth quarter of 2012. Despite the acceleration in labour paring in the gold-mining sector over the short term, the sector lost only 2 500 employment opportunities in 2012, compared to a loss of 9 100 in 2011. The mining sector continues to face significant headwinds including, among others, slowing global demand for mining commodities, marked declines in a range of commodity prices, as well as rapidly rising input costs. In addition, amid this challenging domestic and global economic environment, a number of mining subsectors will conduct collective wage negotiations within a tense labour market milieu during the current round of negotiations.
| | |
| | | Quarterly Bulletin June 2013 |
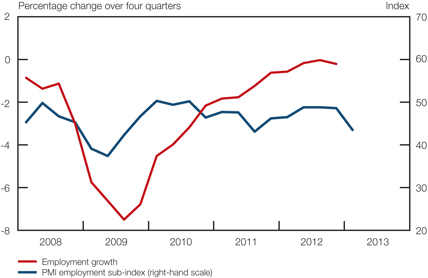
Alongside an acceleration in manufacturing output growth, employment increased at an annualised rate of 0,9 per cent in the fourth quarter of 2012, following three consecutive quarterly declines. Despite the pick-up in employment in the fourth quarter of 2012, the number of people employed in the manufacturing sector nevertheless continued to decrease compared with the same period in the preceding year. Recent outcomes of sentiment indicators are not supportive of employment creation in the manufacturing sector over the short term. After settling marginally below the neutral 50 index-level for three consecutive quarters, the Kagiso Purchasing Managers’ Index (PMI) employment sub-index decreased notably to 43,5 index points in the first quarter of 2013. In addition, according to the Bureau for Economic Research (BER) Manufacturing Survey for the first quarter of 2013, manufacturers expect general business conditions in the next twelve months to worsen.
Manufacturing employment growth and the Kagiso PMI employment sub-index
Employment levels in the manufacturing sector have been in a structural decline since the mid-1990s, largely due to a gradual loss of international competitiveness and increased mechanisation. In an attempt to enhance the competitiveness of the domestic manufacturing sector and to increase employment in the sector, the Department of Trade and Industry recently unveiled the new Industrial Policy Action Plan (IPAP) 2013/2014. The IPAP 2013/2014 aims to extend existing support programmes in the automotive, metals, agro-processing, clothing and textiles, as well as leather and footwear industries. In addition, it includes action plans in support of green industries, renewable energy efficiency and advanced manufacturing and materials, it sets standards and a strategic tariff regime to clamp down on illegal and substandard imports, and introduces a strategic focus on minerals and resources beneficiation.
Despite declining in the fourth quarter of 2012, employment in the electricity-generation sector nevertheless increased by 4,3 per cent from the fourth quarter of 2011 to the fourth quarter of 2012. Subsequent to the wave of labour unrest that occurred in certain sectors of the economy in the second half of 2012, Eskom has also been troubled by continuous industrial action and work stoppages in the opening months of 2013, threatening to delay its critical infrastructure expansion programme. Further setbacks, such as sharply reduced electricity imports from Mozambique due to flood-related damage to the transmission line from Cahorra Bassa, have also forced Eskom to continue its maintenance into the winter months when demand for electricity will peak.
| | |
| Quarterly Bulletin June 2013 | | |


Following a decrease in the third quarter of 2012, employment levels in the construction sector increased at a rate of 1,9 per cent in the fourth quarter, resulting in a slight acceleration in year-on-year employment growth in the sector to a rate of 0,6 per cent in that quarter. Encouragingly, employment prospects in the construction sector appear to be improving. This is reflected in the second consecutive quarterly increase in the FNB/BER Civil Construction Confidence Index, which improved by 15 index points to a four-year high of 51 in the first quarter of 2013. Civil construction confidence improved largely as a result of increased profitability, even though growth in construction activity slowed somewhat. While government remains committed to increase infrastructure spending, capital expenditure in the mining sector could be inhibited by lower international commodity prices, labour market disruptions and a measure of policy uncertainty. Furthermore, the gradual recovery in the building industry appears to remain on track, as evidenced by the ongoing increase in the real value of building plans passed, as well as a second successive quarterly improvement in the FNB/BER Building Confidence Index to a level of 37 index points in the first quarter of 2013 – its highest level since the fourth quarter of 2010.
Indicative of the slowdown in tertiary-sector employment growth, employment in the finance, insurance, real-estate and business services sector decreased for three successive quarters up to the fourth quarter of 2012, at rates of 1,0 per cent, 1,7 per cent and 0,1 per cent, respectively. Despite these decreases, employment in this sector increased by about 10 000 job opportunities in the year to the fourth quarter of 2012.
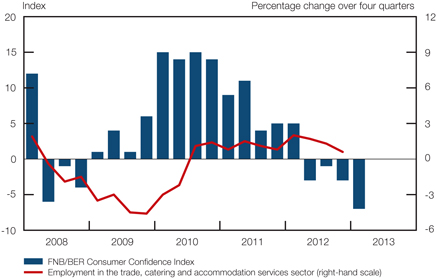
Together with the continued slowdown in output growth in the trade, catering and accommodation services sector, employment in this sector decreased by around 17 200 job opportunities in the fourth quarter of 2012. As a result, year-on-year growth in employment in the sector slowed to a modest rate of 0,6 per cent in the fourth quarter of 2012. Disappointingly, the FNB/BER Consumer Confidence Index declined further by four index points to a nine-year low of—7 index points in the first quarter of 2013. This index is currently at its lowest level since the first quarter of 2004 and at an even more depressed level than at its most recent low point of—6 registered during the global financial crisis in the second quarter of 2008. The BER noted in its Retail Trade Survey for the first quarter of 2013 that retail sales growth is set to slow further, dimming the prospects for meaningful employment creation in the trade, catering and accommodation services sector in the short term.
Employment in the trade, catering and accommodation services sector and the FNB/BER Consumer Confidence Index
| | |
| | | Quarterly Bulletin June 2013 |
According to the Quarterly Labour Force Survey (QLFS) conducted by Stats SA, there were approximately 13,6 million persons employed in South Africa in the first quarter of 2013, representing an increase of 199 000 people compared with the same period in 2012. Total employment decreased by 44 000 job opportunities from the fourth quarter of 2012 to the first quarter of 2013 on a non-seasonally adjusted basis. Disappointingly, the number of unemployed persons increased by an estimated 75 000 in the year to the first quarter of 2013, partially explained by an expanding labour force and probably more people actively looking for a job as evidenced by the decrease of 5 000 in the number of discouraged work-seekers over the same period. The official unemployment rate in the South African economy consequently came to 25,2 per cent in the first quarter of 2013, the same rate as in the first quarter of 2012.
Labour market statistics
| | | | | | | | | | | | | | | | | | | | |
| | | 2012 | | | 2013 | |
| | | Mar | | | Jun | | | Sep | | | Dec | | | Mar | |
| | | (000’s) | | | (000’s) | | | (000’s) | | | (000’s) | | | (000’s) | |
a. Total employment | | | 13 422 | | | | 13 447 | | | | 13 645 | | | | 13 577 | | | | 13 621 | |
b. Total unemployment (official definition) | | | 4 526 | | | | 4 470 | | | | 4 667 | | | | 4 501 | | | | 4 601 | |
c. Total economically active (= a + b) | | | 17 948 | | | | 17 916 | | | | 18 313 | | | | 18 078 | | | | 18 222 | |
d. Total not economically active | | | 14 838 | | | | 14 987 | | | | 14 705 | | | | 15 050 | | | | 15 017 | |
e. Total aged 15–64 years (= c + d) | | | 32 786 | | | | 32 903 | | | | 33 018 | | | | 33 128 | | | | 33 240 | |
f. Official unemployment rate (= b*100/c) | | | 25,2 | % | | | 24,9 | % | | | 25,5 | % | | | 24,9 | % | | | 25,2 | % |
Source: Statistics South Africa, Quarterly Labour Force Survey
Labour cost and productivity
The year-on-year pace of increase in nominal remuneration per worker in the formal non-agricultural sector of the economy moderated notably from 8,9 per cent in the third quarter of 2012 to 7,0 per cent in the fourth quarter. Although nominal wage growth decelerated in both the public and private sectors of the economy, the moderation was most pronounced in the public sector, where wage growth slowed from 10,9 per cent in the third quarter of 2012 to 6,2 per cent in the fourth quarter. Nonetheless, the real take-home pay of those gainfully employed in the formal non-agricultural sector accelerated marginally from an annual average rate of 1,7 per cent in 2011 to 2,0 per cent in 2012.
The deceleration in nominal remuneration growth per worker in the public sector in the fourth quarter of 2012 could be ascribed to a moderation in the year-on-year pace of increase in the wages per worker paid by provinces and local governments to 5,3 per cent and 0,4 per cent respectively. Furthermore, the nominal remuneration per worker in the public transport, storage and communication sector decreased by 7,2 per cent in the year to the fourth quarter of 2012. By contrast, wage growth for employees of national departments accelerated further to a year-on-year rate of 14,8 per cent in the fourth quarter of 2012.
Private-sector wage growth remained marginally above 7,0 per cent, on average, in 2011 and 2012, moderating from a year-on-year rate of 7,7 per cent in the third quarter of 2012 to 7,1 per cent in the fourth quarter. Despite the slight moderation, year-on-year increases in nominal remuneration per worker remained above the inflation target range in all subsectors, with the exception of the mining sector. Remuneration per worker increased at the fastest pace in the electricity sector (14,5 per cent), followed by the trade, catering and accommodation services sector (10,6 per cent); the private transport, storage and communication sector (9,4 per cent); the manufacturing sector (8,7 per cent); the private community, social and personal services sector (8,1 per cent); and the construction sector (7,9 per cent). By contrast, nominal remuneration growth in the mining sector decreased by 3,2 per cent in the fourth quarter of 2012, as wage growth slowed notably to 3,2 per cent in the gold-mining sector, while wages
| | |
| Quarterly Bulletin June 2013 | | |


per worker actually decreased by 5,1 per cent in the non-gold mining sector. The decrease in wages per worker in the non-gold mining sector largely resulted from the high base created in the fourth quarter of 2011, due to extraordinary bonus payments at the time.
The average wage settlement rate in collective bargaining agreements accelerated from 7,6 per cent in 2012 to 7,9 per cent in the first quarter of 2013, according to Andrew Levy Employment Publications. The number of working days lost due to strike action rose to 875 000 in the first quarter of 2013, compared with 700 000 for the corresponding period in 2012. Strike activity in a number of sectors resulted from a spillover of events in 2012. The disruptive labour unrest that occurred during the second half of 2012 suggests that some contestation may continue to characterise the labour market in coming quarters, as a number of multi-year wage agreements are due to be negotiated in the second and third quarters of 2013.
Year-on-year growth in employment in the formal non-agricultural sector of the economy moderated at a slightly slower pace than that of output in the fourth quarter of 2012, resulting in labour productivity growth decelerating marginally from 1,4 per cent in the third quarter of 2012 to 1,2 per cent in the fourth quarter. However, productivity growth in the manufacturing sector accelerated to 3,2 per cent in the year to the fourth quarter of 2012, as output increased alongside a further decline in the level of employment. Remuneration growth in the formal non-agricultural sector of the economy moderated more than output growth, resulting in year-on-year growth in nominal unit labour cost decelerating from 7,4 per cent in the third quarter of 2012 to 5,7 per cent in the fourth quarter. Similarly, the year-on-year pace of increase in unit labour cost in the manufacturing sector decelerated from 7,0 per cent in the third quarter of 2012 to 5,3 per cent in the fourth quarter, as remuneration growth slowed while output growth gathered pace. However, when assessing unit labour cost developments by applying the broader national accounts measure of compensation of employees per unit of output (i.e., also including the agricultural sector and the informal sector), year-on-year growth in unit labour cost accelerated from 5,5 per cent in the third quarter of 2012 to 6,8 per cent in the fourth quarter.
Real wages, productivity and nominal unit labour cost

Prices
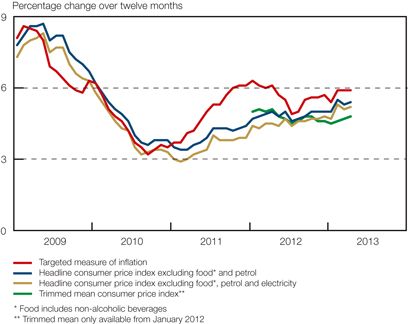
Within an environment of slowing economic growth and moderating inflation in most advanced economies, domestic headline consumer price inflation nevertheless continued to accelerate up to the opening months of 2013. However, having accelerated gradually from a recent low of 4,9 per cent in July 2012 to 5,9 per cent in February 2013, twelve-month headline consumer
| | |
| | | Quarterly Bulletin June 2013 |
price inflation then levelled off at 5,9 per cent in March and April 2013, thereby remaining within the inflation target range of 3 to 6 per cent for twelve consecutive months since May 2012.3 The acceleration in consumer price inflation could initially be attributed largely to a quickening in price inflation of consumer goods; notably that of petrol and food. However, consumer services price inflation also accelerated somewhat in recent months. Renewed wage cost pressure amid an unsettled labour market environment, as well as the possible lagged pass-through effect of the depreciation in the exchange rate of the rand, continue to pose a significant further upside risk to the domestic inflation outlook.
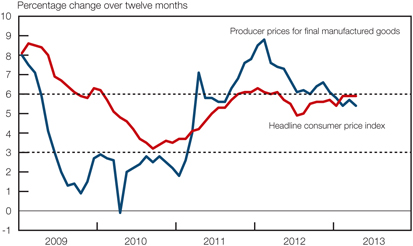
Encouragingly, domestic producer price inflation moderated throughout 2012 and in the opening months of 2013. From February 2013 Stats SA applied a new methodology to calculate the producer price index (PPI). This implied that the headline PPI for domestic output was discontinued and replaced with five industry-specific PPIs which reflect the stages of domestic production, namely a final manufactured goods PPI; an intermediate manufactured goods PPI; an electricity and water PPI; a mining PPI; and an agriculture, forestry and fishing PPI. Producer price inflation for final manufactured goods – the new headline PPI, since it best represents the effects of price changes through the stages of production – decelerated from a recent high of 8,8 per cent in February 2012 to 5,4 per cent in April 2013. The moderation in final manufactured producer price inflation in the opening months of 2013 resulted largely from a deceleration in price inflation of beverages, non-metallic mineral products, as well as petroleum and chemicals. Producer price inflation for electricity and water has decelerated steadily since the middle of 2011, amounting to a still-high rate of 11,4 per cent in March 2013, before quickening again to 12,9 per cent in April. Conversely, producer price inflation for mining accelerated notably in recent months to a rate of 8,6 per cent in March 2013, as price inflation in coal and gas, gold and other metal ores, as well as non-ferrous metal ores picked up pace. Producer price inflation for mining then decelerated notably to 4,5 per cent in April 2013, as price inflation moderated in all the mining sub-categories in the month.
Producer and consumer prices
Aiding the moderation in producer price inflation, inflation in imported commodity prices slowed notably from a recent high of 9,4 per cent in September 2012 to 3,3 per cent in January 2013, as international crude oil prices softened in the closing months of 2012. However, the notable increase in crude oil prices in January and February 2013, coupled with the depreciation in the exchange rate of the rand, resulted in a renewed acceleration in imported producer price inflation to 4,7 per cent in March 2013. Imported producer price inflation subsequently moderated to 4,1 per cent in April 2013, largely due to a deceleration in imported mining producer price inflation and a decrease in international crude oil prices.
| | |
| Quarterly Bulletin June 2013 | | |


Consumer goods price inflation moderated somewhat from a twelve-month rate of 5,3 per cent in November 2012 to 4,8 per cent in January 2013, before accelerating again to 5,1 per cent in April. The recent acceleration in consumer goods price inflation resulted largely from an acceleration in price inflation in semi-durable goods from 2,4 per cent in December 2012 to 3,2 per cent in April 2013. Non-durable goods price inflation decelerated marginally from 7,3 per cent in January and February 2013 to 7,2 per cent in April, while durable goods prices declined at a faster pace, with the twelve-month rate of decline picking up pace from 0,2 per cent in December 2012 to 0,5 per cent in April 2013. The slight acceleration in consumer goods price inflation in the opening months of 2013 resulted from a pick-up in price inflation in the transport goods category from 2,8 per cent in January 2013 to 6,2 per cent in March, as well as in the recreation and culture goods category from 2,2 per cent to 3,7 per cent over the same period. Price inflation in these two consumer goods categories then moderated somewhat in April 2013. Within the consumer goods basket, the housing and utilities category, the food and non-alcoholic beverages category and the alcoholic beverages and tobacco category registered rates of increase in excess of the upper limit of the inflation target range of 6 per cent in April 2013.
Consumer services price inflation remained very stable near the upper end of the inflation target range throughout 2012, before accelerating to 6,6 per cent in April 2013. The quickening in services price inflation resulted largely from an acceleration in price inflation in the miscellaneous services component from 5,2 per cent in January 2013 to 8,2 per cent in April, and to a lesser extent in recreation and culture services from 3,6 per cent in December 2012 to 5,4 per cent in April 2013. Within the miscellaneous services category, the cost of insurance services accelerated notably, with the cost of health insurance in particular increasing briskly at a rate of 10,2 per cent in April 2013. Apart from miscellaneous services prices, the prices of transport, education and health services increased at rates in excess of the upper limit of the inflation target range in April 2013. Conversely, despite accelerating somewhat in recent months, communication services prices increased at a modest rate of only 1,4 per cent in April 2013.
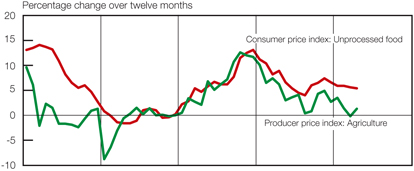
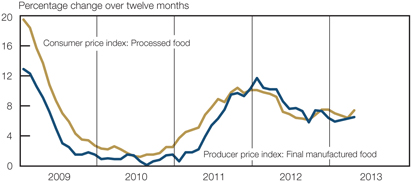
Although in the wake of drastically lower US grain crops food price increases have been one of the chief contributors to the acceleration in headline consumer price inflation in the second half of 2012, recent indications are that inflationary pressures emanating from food prices have eased somewhat. Manufactured producer food price inflation decelerated from a recent peak of 11,7 per cent in January 2012 to 5,9 per cent in January 2013, before accelerating somewhat to 6,5 per cent in April. Similarly, agricultural producer price inflation – almost exclusively comprising agricultural food products – moderated from a recent high of 4,9 per cent in November 2012 to -0,2 per cent March 2013, before accelerating again to 1,3 per cent in April.
The deceleration in producer food price inflation assisted in moderating food price inflation at the consumer level from a recent high of 7,5 per cent in November 2012 to 5,9 per cent in March 2013, before accelerating to 6,3 per cent in April. The slowdown in consumer food price inflation resulted largely from moderations in bread, cereals and meat price inflation – together accounting for 57 per cent of the consumer food price basket. In addition, year-on-year price inflation decelerated in six of the nine consumer food price categories from February 2013 to March. Despite the general moderation in food price inflation, price increases in five of the nine categories in the consumer food price basket nevertheless exceeded the upper limit of 6 per cent of the inflation target range in April 2013, the overshooting categories being fish; milk, eggs and cheese; vegetables; sugar, sweets and desserts; and other food products. Encouragingly, global agricultural commodity prices have declined on average by almost 20 per cent since their recent peak in the opening months of 2012 and, barring adverse weather conditions, are expected to moderate further.
| | |
| | | Quarterly Bulletin June 2013 |
Food prices
When the impact of the more volatile food, non-alcoholic beverages and petrol prices is omitted from the calculation of targeted headline consumer price inflation, underlying inflation accelerated gradually from 4,6 per cent in July 2012 to 5,5 per cent in February 2013, before moderating to 5,4 per cent in April. Similarly, when also excluding the impact of electricity prices from the calculation, consumer price inflation accelerated steadily throughout 2012 and amounted to 5,3 per cent in February 2013, before slowing to 5,2 per cent in April.
Underlying measures of consumer price inflation
| | |
| Quarterly Bulletin June 2013 | | |


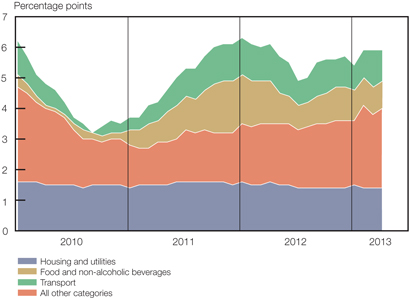
An additional measure of underlying inflation, namely the trimmed mean consumer price inflation, accelerated marginally from 4,5 per cent in January 2013 to 4,8 per cent in April. Although remaining fairly muted, the pick-up in underlying inflation seems to suggest that inflationary pressures have become slightly more broad-based in recent months. This is supported by the accompanying graph, depicting the contributions of selected categories to the annual percentage change in the headline consumer price index. The contribution of the “other” remaining categories – apart from housing and utilities, food and non-alcoholic beverages and transport – to the acceleration in headline consumer price inflation in recent months has been increasing steadily, suggesting a broadening of inflationary pressure.
Contribution of selected categories to the annual percentage change in the consumer price index
An analysis of price changes based on the classification of individual consumption by purpose (COICOP) categories also reveals a slight broadening of inflationary pressure in the economy. The year-on-year rates of increase in seven of the twelve categories did not exceed the upper limit of the inflation target range in April 2012, with six categories recording price increases which fluctuated between 3 to 6 per cent, while the remaining category increased at a rate below 3 per cent. The five categories that increased at rates in excess of 6 per cent in April 2013 – together accounting for 55 per cent of the total consumer price basket – were food and non-alcoholic beverages, alcoholic beverages and tobacco, transport, education and miscellaneous goods and services. In addition, the twelve-month rates of increase in five categories decelerated in April 2013, while two categories recorded the same rate of increase and the rates of increase in the remaining five categories accelerated when compared to March 2013.
Administered price inflation moderated somewhat from 9,8 per cent in September 2012 to 8,5 per cent in January 2013. Thereafter, it accelerated once again to 10,6 per cent in March 2013, before moderating to 8,9 per cent in April. The recent movements in administered price inflation can largely be ascribed to changes in domestic petrol prices; petrol price inflation decelerated from 17,6 per cent in September 2012 to 11,6 per cent in January 2013, quickened again to 16,4 per cent in March and moderated to 10,4 per cent in April. The inland price of petrol increased by a cumulative R1,34 per litre from January 2013 to April, reflecting higher
| | |
| | | Quarterly Bulletin June 2013 |
international crude oil prices in the opening months of 2013. Encouragingly, the inland price of petrol decreased by 73 cents per litre in May 2013, as crude oil prices subsequently softened due to renewed fears of a slowdown in the global economic recovery.
Headline CPI inflation in COICOP categories
Percentage changes over twelve months
| | | | | | | | | | | | | | | | |
| | | 2013 | |
| | | Weights | | | Feb | | | Mar | | | Apr | |
Food and non-alcoholic beverages | | | 15,41 | | | | 6,1 | | | | 5,7 | | | | 6,2 | |
Alcoholic beverages and tobacco | | | 5,43 | | | | 7,9 | | | | 5,8 | | | | 6,5 | |
Clothing and footwear | | | 4,07 | | | | 3,2 | | | | 2,9 | | | | 3,1 | |
Housing and utilities | | | 24,52 | | | | 5,9 | | | | 5,9 | | | | 5,8 | |
Household content, maintenance and equipment | | | 4,79 | | | | 3,2 | | | | 3,2 | | | | 3,2 | |
Health | | | 1,46 | | | | 4,4 | | | | 4,0 | | | | 4,8 | |
Transport | | | 16,43 | | | | 5,5 | | | | 7,5 | | | | 6,2 | |
Communication | | | 2,63 | | | | 0,1 | | | | 1,0 | | | | 0,8 | |
Recreation and culture | | | 4,09 | | | | 3,6 | | | | 4,5 | | | | 4,0 | |
Education | | | 2,95 | | | | 8,9 | | | | 9,0 | | | | 9,0 | |
Restaurants and hotels | | | 3,50 | | | | 7,2 | | | | 6,0 | | | | 5,9 | |
Miscellaneous goods and services | | | 14,72 | | | | 7,5 | | | | 7,4 | | | | 7,5 | |
All items headline CPI | | | 100,00 | | | | 5,9 | | | | 5,9 | | | | 5,9 | |
When excluding the effect of petrol prices from the calculation of administered prices, this rate of increase accelerated from 7,1 per cent in July 2012 to 7,8 per cent in April 2013. Similarly, when also excluding electricity prices from the above-mentioned calculation, administered price inflation accelerated from 6,6 per cent in September 2012 to 8,2 per cent in April 2013. The sharp depreciation in the exchange value of the rand in May 2013 could exert further upward pressure on administered price inflation in the months ahead.
Administered price inflation categories
Percentage change over twelve months
| | | | | | | | | | | | | | | | |
| | | 2013 | |
| | | Weights | | | Feb | | | Mar | | | Apr | |
Housing and utilities | | | 7,03 | | | | 9,5 | | | | 9,5 | | | | 9,4 | |
Transport | | | 6,08 | | | | 11,7 | | | | 15,8 | | | | 10,0 | |
Communication | | | 2,30 | | | | 0,6 | | | | 1,8 | | | | 1,6 | |
Recreation and culture | | | 0,06 | | | | 0,0 | | | | 0,0 | | | | 0,0 | |
Education | | | 2,95 | | | | 9,0 | | | | 9,0 | | | | 9,0 | |
Restaurants and hotels | | | 0,06 | | | | 9,6 | | | | 9,6 | | | | 9,6 | |
Total administered prices | | | 18,48 | | | | 8,9 | | | | 10,6 | | | | 8,9 | |
Average inflation expectations for 2013, as reflected by the Inflation Expectations Survey conducted by the BER in the first quarter of 2013, were almost unchanged from the previous quarter and remained anchored around the upper limit of the inflation target range of 3 to 6 per cent. Inflation is expected to average 6,0 per cent in 2013 and 2014, before ticking up marginally to 6,1 per cent in 2015. Whereas the inflation expectations of financial analysts have risen, business executives and trade unions adjusted their expectations for 2013 downwards. Regarding 2014, financial analysts see inflation at 5,5 per cent, trade unions anticipate a rate of
| | |
| Quarterly Bulletin June 2013 | | |


5,9 per cent and business executives expect a much higher inflation rate of 6,5 per cent. In the fourth quarter of 2012, households raised their inflation expectations for the next twelve months by a significant 0,8 percentage points to 7,2 per cent – their highest expected rate in two years. However, in the first quarter of 2013 households’ inflation expectations moderated to a rate of 6,8 per cent.
Headline consumer price inflation expectations
Per cent, as surveyed in the first quarter of 2013
| | | | | | | | | | | | | | | | |
| Average inflation expected for: | | Financial
analysts | | | Business
representatives | | | Trade union
representatives | | | All surveyed
participants | |
2013 | | | 5,8 | | | | 6,3 | | | | 5,9 | | | | 6,0 | |
2014 | | | 5,5 | | | | 6,5 | | | | 5,9 | | | | 6,0 | |
2015 | | | 5,6 | | | | 6,6 | | | | 6,2 | | | | 6,1 | |
Source: Bureau for Economic Research, Stellenbosch University
| | |
| | | Quarterly Bulletin June 2013 |
Foreign trade and payments
International economic developments
Global economic growth improved marginally to an annualised rate of 2,7 per cent in the first quarter of 2013 compared with a rate of 2,6 per cent in the fourth quarter of 2012. This was underpinned by stronger growth in advanced economies, particularly in the US and Japan, which contributed 0,8 percentage points to global growth in the first quarter of 2013. Real output in advanced economies as a group contracted marginally in the preceding quarter. The contribution of emerging-market economies to global growth, however, decreased in the first quarter of 2013 due to lower-than-expected growth in China.
Global growth and contributions from advanced economies and other emerging-market economies
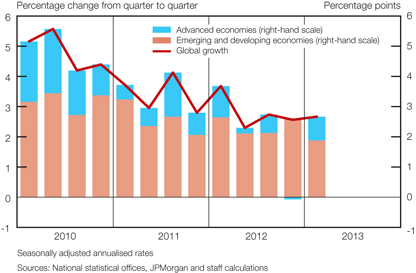
The International Monetary Fund (IMF) indicated in its April 2013 World Economic Outlook (WEO) that global growth was expected to increase marginally in 2013 as factors underlying weak activity subsided. The economic recovery in advanced economies, however, remained fragile as households continued to deleverage, governments consolidated expenditure and competitiveness problems in the euro area made structural adjustment challenging. Global output was expected to increase by 3,3 per cent in 2013 and 4,0 per cent in 2014.
Economic growth in sub-Saharan Africa was projected to accelerate notably in 2013 to 5,6 per cent, from 4,8 per cent in the previous year, as robust domestic demand supported growth in resource-rich and lower-income economies. Expected growth in 2013 was revised downwards for the region in the April 2013 WEO due to labour stoppages in South Africa, floods in Nigeria and geopolitical shocks in South Sudan and Mali.
Economic activity in advanced economies increased in the first quarter of 2013 due to better economic outcomes in the US, Japan and Germany. Growth in real economic activity in the US accelerated to 2,4 per cent during the first quarter of 2013, driven by robust domestic demand. This was nonetheless slower than expected owing to the negative impact of tax increases implemented at the beginning of 2013. The continued improvement in the housing market and possible turning point in deleveraging by households could support growth in the near future. Japan grew at an annualised rate of 4,1 per cent in the first quarter compared with 1,2 per cent in the previous quarter. Growth was supported by higher exports, domestic consumption and aggressive policy reforms. The Japanese yen has depreciated significantly since the election of a new prime minister, with a strong growth agenda and the announcement of a radical easing of monetary policy.
| | |
| Quarterly Bulletin June 2013 | | |


Economic activity in the euro area contracted further in the first quarter of 2013, although at a slower pace compared with the previous quarter as major member countries such as France and Italy struggled to return to growth. Germany, by contrast, grew at a moderate rate of 0,3 per cent in the first quarter after weak exports and fixed investment contributed to a contraction of 2,7 per cent in the fourth quarter of 2012. However, a number of hurdles continue to prevent the successful resolution of the current fiscal crisis in the euro area, including political resistance in several countries, the high social cost of youth unemployment and austerity fatigue. Further challenges fall in the areas of bank supervision reform, sovereign market access, and bail-out conditions for banks and sovereigns. The evolution of the Cyprus bail-out showed that bank deposits, although remaining guaranteed under the deposit insurance scheme, may not be as sacrosanct as previously thought. The impact on deposits in other euro area economies remains to be seen. Economic activity continued to be subdued in the United Kingdom (UK) where real output expanded slightly in the first quarter of 2013 compared with a moderate contraction in the previous quarter. Growth was supported by inventory investment, lower imports and personal consumption expenditure.
Real output growth in emerging Asia moderated in the first quarter of 2013 as economic activity slowed in most economies. Growth in China registered 6,4 per cent on an annualised basis in the first quarter of 2013, following a rate of 9,0 per cent in the preceding quarter. Retail sales and industrial output increased at a slower pace during the first quarter.
Regional economic activity in emerging Europe remained sluggish in the first quarter of 2013 underpinned by subdued growth in the Russian economy due to lower external demand, low capital investment and anaemic domestic demand. Economic outcomes in advanced Europe continue to restrain growth in the region.
Economic activity in Latin America slowed in the first quarter of 2013. Growth in Brazil, the region’s largest economy, again disappointed expectations by registering 2,2 per cent in the first quarter. Growth also slowed in Argentina, Colombia and Mexico, while output is expected to contract in Venezuela.
Growth in the volume of world trade accelerated from 2,7 per cent in the fourth quarter of 2012 to 2,9 per cent in the first quarter of 2013 due to a rebound in advanced economy export volumes. Export volumes of advanced economies expanded by 4,7 per cent in the first quarter after a sharp contraction in the previous quarter. Emerging-market export volumes, however, increased at a rate of 3,2 per cent compared with an expansion rate of 12,4 per cent in the previous quarter.
After initially increasing to around US$118 per barrel in mid-February 2013, Brent crude oil prices fell to a nine-month low of around US$97 per barrel in mid-April 2013. The decline was mainly due to a downward revision in global growth, weak industrial survey data from the US and a slowdown in Chinese growth. Oil prices have since rebounded to levels above US$102 per barrel by early June due to geopolitical concerns in the Middle East. Brent crude oil futures prices for delivery in the third quarter of 2013 were trading around US$103 per barrel in early June 2013.
Global demand for oil decreased moderately in the first quarter of 2013. The lower demand was mainly driven by non-Organisation for Economic Co-operation and Development (OECD) countries. The demand for crude oil decreased in China, Russia, Brazil, Saudi Arabia, Canada, Korea and Mexico, but increased in Japan and Iran. Global oil supply decreased from the fourth quarter of 2012 to the first quarter of 2013.
| | |
| | | Quarterly Bulletin June 2013 |
International crude oil prices
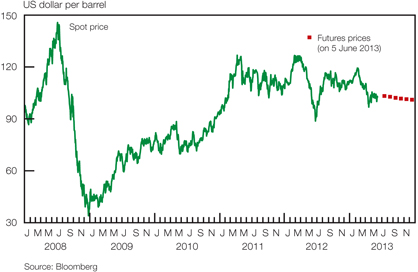
Global headline consumer price inflation declined to 2,9 per cent in April 2013, below its long-term average of 3,8 per cent since January 2000, as inflation in advanced economies remained well anchored below 2 per cent. Inflation outcomes in emerging-market and developing economies declined to 6,0 per cent in April 2013 compared with 6,4 per cent in March.
Global consumer price developments

Annual consumer price inflation remained stable in the US and stayed below the 2 per cent longer-run target of the Federal Open Market Committee (FOMC). Consumer prices rose at a twelve-month rate of 1,1 per cent in April 2013, down from 2,2 per cent late in 2012, while core inflation (excluding food and energy) also remained marginally below 2 per cent. The FOMC expects inflation to remain well anchored in the medium term. In Japan consumer price deflation continued in the first quarter of 2013, with consumer prices declining by 0,6 per cent. However, Japan’s consumer price outlook has improved significantly since the announcement of a 2 per cent inflation target. Two-year-ahead breakeven inflation rates have increased from around 0,5 per cent at the start of 2013 to 1,5 per cent in late April. Inflation in the euro area moderated from the end of 2011 and amounted to 1,2 per cent in April 2013. Consumer price inflation in the UK remained elevated in the first quarter of 2013, but moderated significantly to 2,4 per cent in April. Inflation remains above the Bank of England’s central target of 2 per cent, partly due to a depreciated pound sterling as well as the temporary impact of higher levies on tobacco and alcohol.
| | |
| Quarterly Bulletin June 2013 | | |


Consumer inflation in emerging Asia accelerated to 4,6 per cent in the first quarter of 2013, up from 4,2 per cent in the previous quarter. Inflation in the region was mainly driven by higher food prices. In India, the Wholesale Price Index (WPI) softened in the first quarter mainly due to a decline in the prices of food, fuel and power. Consumer price inflation in emerging Europe remained virtually unchanged at 5,9 per cent in the first quarter. Inflation remained elevated especially in Russia, Turkey and Romania due to rising food prices that followed shortages of grain products. Consumer price inflation in emerging Latin America rose to 6,3 per cent in the first quarter of 2013. In Brazil inflation breached the upper tolerance limit of the inflation target, reaching 6,6 per cent in March 2013.
Monetary policy remained highly accommodative in advanced economies as major central banks including the US Federal Reserve, Bank of Japan and the Bank of England continued with quantitative easing policies. In Japan, aggressive reforms were implemented with the introduction of quantitative and qualitative easing on 4 April 2013. This policy includes changing the main operating target to the monetary base from the uncollateralised overnight call rate. The Bank indicated that it would increase the monetary base annually by ¥60–70 trillion. The Bank would also continue to purchase Japanese government bonds, exchange-traded funds and Japanese real-estate investment trusts to encourage a decline of interest rates along the yield curve and a reduction in risk premia contained in asset prices.
The FOMC has kept the targeted federal funds rate unchanged at a record-low zero to 0,25 per cent since December 2008, but continued in the first quarter of 2013 with its unorthodox policies to support growth and employment. The committee anticipates that this exceptionally low range for the federal funds rate will be appropriate, at least as long as the unemployment rate remains above 6,5 per cent, inflation one to two years ahead no more than half a percentage point above the committee’s 2 per cent longer-run goal, and longer-term inflation expectations continue to be well anchored.
The European Central Bank (ECB) lowered rates on the main refinancing operations from 0,75 per cent to 0,5 per cent in May 2013 as the fiscal crisis continued to undermine growth in the region. The ECB indicated that although inflation expectations remained well anchored, risks in the monetary union required further policy action.
The Bank of England maintained both the official Bank Rate at 0,50 per cent and the stock of asset purchases financed by the issuance of central bank reserves at £375 billion over the first quarter of 2013 despite lethargic growth and higher-than-targeted inflation rates. The central banks of Canada and New Zealand have both maintained their policy rates, the former since September 2010 at 1,0 per cent and the latter since March 2011 at 2,5 per cent. The Reserve Bank of Australia has been more active in terms of setting policy in recent times, lowering its policy rate by a cumulative 200 basis points since late 2011 to 2,75 per cent.
Monetary policy in emerging economies has remained mixed since the beginning of 2013. In emerging Europe most central banks were able to lower rates to support growth. Poland, Hungary and Turkey reduced their key policy rates by 150, 125 and 100 basis points respectively. In emerging Asia, the Reserve Bank of India reduced the repo rate by a cumulative 50 basis points as lower inflation provided space to support growth. In Latin America, Mexico and Colombia lowered interest rates in the first quarter. By contrast, Brazil raised its policy rate by a cumulative 75 basis points to 8 per cent by the end of May 2013 as inflation breached the upper bound of its inflation target. In Africa most central banks kept rates unchanged in the first quarter of 2013, but in May several significant and unexpected changes were made. Botswana and Kenya lowered rates by 50 basis points to 9 per cent and 100 basis points to 8,5 per cent respectively, while Zambia increased rates by 25 basis points to 9,5 per cent. Ghana, with inflation at 10,6 per cent and an inflation target for 2013 of 9 per cent, raised rates by 100 basis points to 16 per cent. The Egyptian Central Bank raised its discount rate by 75 basis points in March 2013 as inflation rose significantly in the past few months.
Current account4
Consistent with the pick-up in world economic activity, global trade volumes gained further momentum in the first quarter of 2013. South African exporters consequently experienced
| | |
| | | Quarterly Bulletin June 2013 |
an increase in external demand from emerging-market economies, in particular. In addition, international prices of commodities produced by South Africa remained firm, with rand proceeds benefiting further from the more competitive exchange value of the rand. As expected from an economy with a high import propensity experiencing an upward phase of the business cycle, the demand for foreign goods increased further over the period. With the value of merchandise exports advancing at a slightly firmer pace compared to merchandise imports, the trade deficit narrowed from R86,1 billion in the fourth quarter of 2012 to R78,2 billion in the first quarter of 2013.
Balance of payments on current account
| | | | | | | | | | | | | | | | | | | | | | | | |
Seasonally adjusted and annualised R billions | | | | | | | | | | | | | | | | | | |
| | | 2012 | | | 2013 | |
| | | 1st qr | | | 2nd qr | | | 3rd qr | | | 4th qr | | | Year | | | 1st qr | |
Merchandise exports | | | 694,6 | | | | 686,1 | | | | 689,1 | | | | 715,0 | | | | 696,2 | | | | 800,1 | |
Net gold exports | | | 78,0 | | | | 77,9 | | | | 67,6 | | | | 60,7 | | | | 71,1 | | | | 69,9 | |
Merchandise imports | | | -821,4 | | | | -843,9 | | | | -844,0 | | | | -861,8 | | | | -842,8 | | | | -948,2 | |
Trade balance | | | -48,8 | | | | -79,9 | | | | -87,3 | | | | -86,1 | | | | -75,5 | | | | -78,2 | |
Net service, income and current transfer payments | | | -105,5 | | | | -128,6 | | | | -127,7 | | | | -126,5 | | | | -122,1 | | | | -112,7 | |
Balance on current account | | | -154,3 | | | | -208,5 | | | | -215,0 | | | | -212,6 | | | | -197,6 | | | | -190,9 | |
As a percentage of gross domestic product | | | -5,0 | | | | -6,7 | | | | -6,8 | | | | -6,5 | | | | -6,3 | | | | -5,8 | |
The shortfall on the services, income and current transfer account with the rest of the world, which had remained broadly unchanged since the second quarter of 2012, improved markedly in the first quarter of 2013, supporting the improvement in the trade balance. Consequently, the deficit on the current account of the balance of payments narrowed from R212,6 billion in the fourth quarter of 2012 to R190,9 billion in the first quarter of 2013. As a ratio of the country’s gross domestic product, the deficit came to 5,8 per cent in the first quarter of 2013, noticeably lower than the 6,5 per cent registered in the preceding quarter.
Balance of payments: Current account
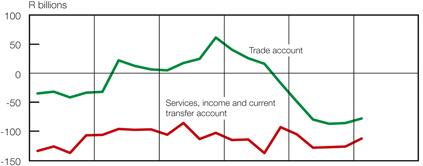
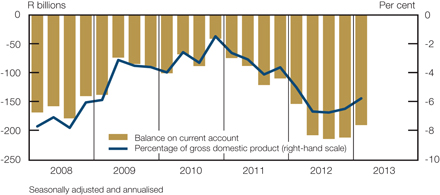
| | |
| Quarterly Bulletin June 2013 | | |


Reflecting the acceleration in global economic activity and trade, the volume of mining and manufactured goods exported from South Africa increased in the first quarter of 2013. At the same time, the export earnings of South African producers continued to benefit from the lower exchange value of the rand which extended into the first quarter of 2013. As a result, the value of merchandise exports advanced by 11,9 per cent to R800,1 billion in the first quarter of 2013, up from R715,0 billion in the fourth quarter of 2012.
Having contracted by 0,2 per cent in the fourth quarter of 2012, the volume of merchandise exports bounced back and rose by 7,6 per cent in the first quarter of 2013. Increased demand from mainly China and the US for domestically produced mining products was reflected in the higher physical quantities of exported platinum group metals, precious and semi-precious stones, and mineral products over the period. Mineral exports were boosted by higher quantities of exported iron ore following industrial action that affected supply in the final quarter of 2012. Further to these developments, foreign sales of South African iron ore also profited temporarily from a drop in production at the world’s largest iron ore producer domiciled in Brazil. By contrast, export volumes of ferrochrome were weighed down in the first quarter of 2013 by, inter alia, a decline in production following the shutdown of a furnace for maintenance purposes. As a result of this reduction in domestic production and the price competitiveness of the Chinese ferrochrome industry, China temporarily took over from South Africa as the world’s biggest ferrochrome producer in the opening months of 2013. Increased foreign demand for especially South African-produced vehicles and transport equipment and processed food, beverages and tobacco contributed to the higher volume of manufactured exports in the first quarter of 2013.
Value of merchandise exports
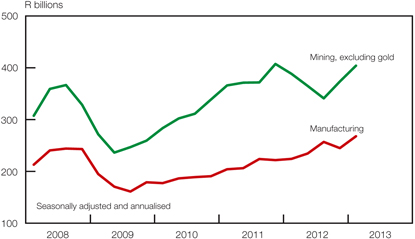
Following an increase of 1,3 per cent in the fourth quarter of 2012, the international price of a basket of South African-produced export commodities, excluding gold, rose by 8,9 per cent in the first quarter of 2013. Firm increases were noted in the international prices of, inter alia, iron ore, platinum and nickel over the period. The rise in the prices of these commodities amid the depreciation in the external value of the rand raised the overall rand price of merchandise exports by 4,0 per cent in the first quarter of 2013.
The value of net gold exports, which contracted by 10,2 per cent in the fourth quarter of 2012, advanced by 15,1 per cent in the first quarter of 2013. A recovery in the volume of net gold exports fully offset a 2,8 per cent decline in the average realised rand price of gold over the period. The retraction in the international price of gold from its most recent peak in October 2012 continued into the opening months of 2013, culminating in an average London fixing price of US$1 631 per fine ounce in the first quarter of 2013 – 5,1 per cent lower than in the fourth quarter of 2012. The recent weakness in the price of gold could, among other factors, be ascribed to better global economic prospects and lower inflation expectations. However, several central banks in emerging-market economies including Belarus, Indonesia, Kazakhstan, Korea, Russia and Turkey continued to accumulate gold reserves over the period.
| | |
| | | Quarterly Bulletin June 2013 |
South African export commodity prices
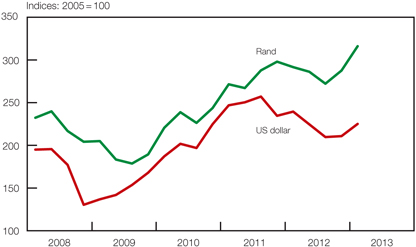
| Box 2: | The long-run price elasticities of imports and exports in the South African Reserve Bank’s core macroeconometric model |
The recent depreciation of the rand has highlighted the question of how responsive South African imports and exports are to changes in the exchange rate and relative price movements. In the case of a depreciation of the rand, South African exports become cheaper for foreigners, while in instances where South Africa is a price taker in international markets with foreign currency-denominated prices given, the rand receipts of exporters rise. This boosts South African export volumes. Simultaneously, with a depreciation of the domestic currency, imported goods become more expensive for South Africans, causing a substitution effect favouring locally produced goods over imported goods.
The accompanying table displays the long-run import and export price elasticities in the South African Reserve Bank’s core macroeconometric model. Import volumes are more responsive to changes in relative prices than export volumes. In the long run, an increase of 1,0 per cent in the relative price of exported goods and services leads to an increase of 0,3 per cent in the volume of such exports. Furthermore, an increase of 1,0 per cent in the relative price of imported goods and services eventually results in a decline of 0,8 per cent in the volume of non-oil imports. The immediate effects of such price changes are much smaller since these substitution effects take time to work through. It may be noted that imports of oil are treated as an exogenous variable in the model.
| | | | |
| | | | |
| Long-run import and export price elasticities | | Absolute price elasticity | |
Imports of non-oil goods and services | | | 0,8 | |
Total exports of goods and services | | | 0,3 | |
Sum | | | 1,1 | |
The combined import and export price elasticity in excess of 1,0 in absolute terms validates that the Marshall-Lerner condition holds for the South African economy. Over the long run, a depreciation in the domestic currency will lead to an improvement in the net position on the current account of the balance of payments.
An earlier version of the core model of the South African Reserve Bank is discussed in “The core forecasting model of the South African Reserve Bank”, Working Paper WP/07/02, available on the Bank’s website. In the current version of the model the external block still functions in essentially the same way, although coefficient estimates have been updated on the basis of new data.
| | |
| Quarterly Bulletin June 2013 | | |


The volume of merchandise imports rose by 8,2 per cent in the first quarter of 2013 after contracting by almost 3 per cent in the final quarter of 2012. Although the increase in import volumes occurred in the face of an expansion in gross domestic expenditure, it was probably also affected by concerns that in the near future the prices of imported goods could increase at a faster pace relative to domestically produced goods due to the depreciation in the exchange value of the rand. The increase in import volumes was mainly evident in the categories for manufactured products, more especially of machinery and electrical equipment as well as vehicles and transport equipment, and mineral products. Contrary to expectations of a decline in the volume of crude oil imports due to scheduled maintenance shutdowns at various oil refineries during February and March 2013, crude oil imports increased in the first quarter.
The rand price of imported goods advanced by 1,7 per cent in the first quarter of 2013 as the depreciation in the external value of the rand made itself felt alongside higher international crude oil prices. As a result of increases in the volume and price of South African imports, the value of merchandise imports advanced by a further 10 per cent in the first quarter of 2013. An analysis of imports according to the stage of production revealed that the value of imported intermediate and capital goods regained momentum in the first quarter of 2013 while the value of imported consumption goods increased at a slower pace in line with the moderation in household consumption expenditure.
Imports according to stage of production
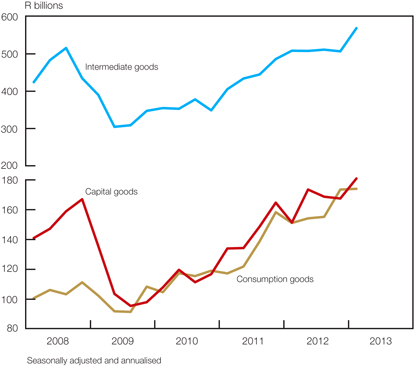
The shortfall on the services, income and current transfer account of the balance of payments improved from R126,5 billion in the fourth quarter of 2012 to R112,7 billion in the first quarter of 2013, or by about 11 per cent.
Gross dividend payments to foreign shareholders increased by 12,4 per cent from the fourth quarter of 2012 to the first quarter of 2013. This increase was, however, more than fully countered by an increase in dividend receipts of resident investors over the same period. Gross interest payments to foreign creditors and investors escalated further in the first quarter of 2013 despite the relatively low interest rate environment. The higher interest payments primarily reflected the
| | |
| | | Quarterly Bulletin June 2013 |
escalation in the country’s foreign debt levels which increased from almost 29 per cent of gross domestic product in 2010 to about 36 per cent in 2012. The increase in interest payments was, however, partly cushioned by a moderate increase in interest receipts by the banking sector.
In the category “other services”, a marginal increase in net payments was recorded in the first quarter of 2013 as an increase in royalty payments was partially offset by lower payments for services of a technical nature. Expenditure on technical services rendered by non-resident parties nevertheless remained high, consistent with ongoing infrastructural development in South Africa.
The improvement of the deficit on the services, income and current transfer account in the first quarter of 2013 was further assisted by an increase in travel receipts from foreign tourists and a concurrent decrease in travel payments to the rest of the world. While the depreciation in the exchange value of the rand during the first quarter of 2013 might have been instrumental in shaping the developments in both these aggregates, the hosting of the Africa Cup of Nations by South Africa in early 2013 gave further impetus to travel receipts from non-residents.
Having deteriorated in the fourth quarter of 2012, South Africa’s terms of trade improved somewhat in the first quarter of 2013 as export commodity prices held up well relative to the prices of imported goods and services.
Financial account
The South African economy continued to attract foreign capital inflows. Including unrecorded transactions, the net inward movement of capital amounted to R55,5 billion in the first quarter of 2013 compared with an inflow of R48,8 billion in the fourth quarter of 2012. This sizeable inflow of foreign capital occurred against the backdrop of interest rate differentials with the mature economies which continued to favour South Africa. The categories for direct investment and other investment showed an inflow of capital on a net basis, while portfolio investment switched to a net outflow of capital over the period.
Net financial transactions not related to reserves
| | | | | | | | | | | | | | | | | | | | | | | | |
| R billions | | | | | | | | | | | | | | | | | | |
| | | 2012 | | | 2013 | |
| | | 1st qr | | | 2nd qr | | | 3rd qr | | | 4th qr | | | Year | | | 1st qr | |
Change in liabilities | | | | | | | | | | | | | | | | | | | | | | | | |
Direct investment | | | 10,2 | | | | 6,6 | | | | 22,2 | | | | -1,4 | | | | 37,6 | | | | 12,9 | |
Portfolio investment | | | 32,0 | | | | 22,7 | | | | 27,5 | | | | 12,5 | | | | 94,7 | | | | 1,4 | |
Other investment | | | 0,3 | | | | 19,9 | | | | 7,1 | | | | 38,4 | | | | 65,7 | | | | 23,7 | |
Change in assets | | | | | | | | | | | | | | | | | | | | | | | | |
Direct investment | | | -5,3 | | | | -4,1 | | | | -9,6 | | | | -16,8 | | | | -35,8 | | | | -4,5 | |
Portfolio investment | | | -21,4 | | | | -4,7 | | | | -4,7 | | | | -9,2 | | | | -40,0 | | | | -5,9 | |
Other investment | | | 22,7 | | | | -16,8 | | | | 19,3 | | | | 15,1 | | | | 40,3 | | | | -11,2 | |
Total financial transactions* | | | 50,8 | | | | 48,0 | | | | 58,6 | | | | 48,8 | | | | 206,2 | | | | 55,5 | |
Financial transactions as a ratio of gross domestic product | | | 6,7 | | | | 6,1 | | | | 7,3 | | | | 6,0 | | | | 6,5 | | | | 6,8 | |
| * | Including unrecorded transactions |
Foreign-owned assets in South Africa
Foreign direct investment into South Africa changed from an outflow of R1,4 billion in the fourth quarter of 2012 to an inflow of R12,9 billion in the first quarter of 2013. The capital inflow in the first quarter originated mainly from long-term loan financing extended by foreign parent companies to their domestic subsidiaries.
| | |
| Quarterly Bulletin June 2013 | | |


Inward foreign portfolio investment flows shrank from R12,5 billion in the fourth quarter of 2012 to R1,4 billion in the first quarter of 2013. Foreign investors’ appetite for domestic securities continued to be affected by ongoing concerns about the sustainability of South Africa’s current-account deficit, the less vibrant outlook for domestic economic growth and the downgrading of the country’s sovereign credit rating from BBB-plus to BBB by Fitch Ratings. Portfolio inflows in the first three months of 2013 included the proceeds of international bond issues by private-sector companies which only partly offset the redemption of international bonds by a parastatal and private-sector companies.
Other investment capital inflows into South Africa amounted to R23,7 billion in the first quarter of 2013, significantly lower than the inflow of R38,4 billion recorded in the fourth quarter of 2012. The inward movement of capital in the first quarter of 2013 mainly stemmed from an increase in long-term loan financing extended to the South African banking sector. These capital inflows were partially countered by a decrease in non-resident deposits with the domestic banking sector.
Balance on financial account*

South African-owned assets abroad
Outward direct investment registered an outflow of R4,5 billion in the first quarter of 2013 following an outflow of R16,8 billion in the fourth quarter of 2012. The outflow of capital in the first quarter of 2013 was smaller than the outflow registered in any of the preceding two quarters.
The acquisition of foreign portfolio investment assets by South African institutional investors and households also appears to have lost some momentum in the first quarter of 2013 as the outward movement of capital in this investment category shrank from R9,2 billion in the fourth quarter of 2012 to R5,9 billion in the first quarter. The downward revision of global economic prospects, together with the deterioration and volatility in the exchange value of the rand, could probably have encouraged domestic investors to take a more cautious approach in accumulating foreign portfolio assets for the time being.
The steady inflow of other investment capital in the second half of 2012, representing a reduction in other investment assets abroad, again switched to an outflow of capital in the first quarter of 2013. The outward movement of capital in this investment category amounted to R11,2 billion in the first quarter of 2013 and mainly took the form of an increase in foreign currency-denominated deposits with, and loan financing extended by, the South African banking sector to their counterparts abroad.
| | |
| | | Quarterly Bulletin June 2013 |
Foreign debt
South Africa’s total outstanding foreign currency and rand-denominated foreign debt increased from US$131,6 billion at the end of September 2012 to US$137,5 billion at the end of December – an increase of US$24,4 billion or 21,5 per cent when compared with the level at the end of December 2011. The bulk of the increase in the external debt in the final quarter of 2012 was due to rising foreign currency-denominated debt; rand-denominated debt increased at a more subdued pace over the period. Expressed in rand terms, the country’s external debt increased from R1 082 billion at the end of the third quarter of 2012 to R1 167 billion at the end of the fourth quarter.
Foreign debt of South Africa
| | | | | | | | | | | | | | | | | | | | | | |
US$ billions at end of period | | | | | | | | | | | | | | | | | | | | | | |
| | | 2011 | | | 2012 | |
| | | 4th qr | | | 1st qr | | | 2nd qr | | | | | 3rd qr | | | 4th qr | |
Foreign currency-denominated debt | | | 50,9 | | | | 53,3 | | | | 50,3 | | | | | | 53,0 | | | | 57,2 | |
Bonds | | | 20,9 | | | | 22,9 | | | | 21,0 | | | | | | 22,2 | | | | 22,4 | |
Other | | | 30,0 | | | | 30,4 | | | | 29,3 | | | | | | 30,8 | | | | 34,8 | |
Public sector | | | 7,6 | | | | 8,3 | | | | 8,6 | | | | | | 9,0 | | | | 9,0 | |
Monetary sector | | | 9,9 | | | | 11,0 | | | | 9,3 | | | | | | 9,5 | | | | 13,8 | |
Non-monetary private sector | | | 12,5 | | | | 11,1 | | | | 11,4 | | | | | | 12,3 | | | | 12,0 | |
Rand-denominated debt | | | 62,2 | | | | 67,4 | | | | 71,3 | | | | | | 78,6 | | | | 80,3 | |
Bonds | | | 30,2 | | | | 33,1 | | | | 36,1 | | | | | | 41,5 | | | | 44,8 | |
Other | | | 32,0 | | | | 34,3 | | | | 35,2 | | | | | | 37,1 | | | | 35,5 | |
Total foreign debt | | | 113,1 | | | | 120,7 | | | | 121,6 | | | | | | 131,6 | | | | 137,5 | |
As a percentage of gross domestic product | | | 28,1 | | | | 30,2 | | | | 30,7 | | | | | | 34,2 | | | | 35,8 | |
As a percentage of total export earnings | | | 91,9 | | | | 98,2 | | | | 101,3 | | | | | | 112,6 | | | | 120,1 | |
Foreign currency-denominated debt rose from US$53,0 billion at the end of September 2012 to US$57,2 billion at the end of December, largely due to an increase in the domestic banking sector’s external loan financing and increased non-resident deposits with the South African banking sector. Over the corresponding period, South Africa’s rand-denominated foreign debt rose from US$78,6 billion to US$80,3 billion as non-resident investors continued to acquire domestic government bonds on a net basis. This increase was partly countered by a decline in the rand-denominated loan debt of the non-monetary private sector.
The sustained increase in South Africa’s external debt levels gave rise to a steady upward trend in the country’s debt ratios. As a percentage of gross domestic product, external debt advanced from 34,2 per cent at the end of September 2012 to 35,8 per cent at the end of December. Relative to export earnings, the ratio increased from 112,6 per cent to 120,1 per cent over the same period.
During March 2013, the ratings agency Standard & Poor’s (S&P) affirmed South Africa’s sovereign credit rating at BBB with a negative outlook, citing the country’s recent lacklustre economic performance, widening external imbalances and potentially resurging labour tensions as factors that could adversely affect South Africa’s macroeconomic policy framework. All three main rating agencies, however, maintained an investment grade rating for South Africa.
| | |
| Quarterly Bulletin June 2013 | | |


Foreign debt ratios
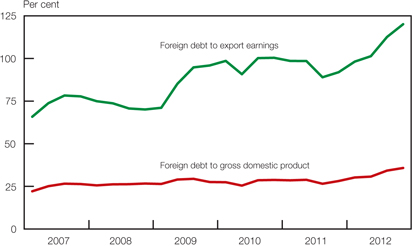
International reserves and liquidity
The change in South Africa’s net international reserves due to balance-of-payments transactions amounted to R1,2 billion in the first quarter of 2013, following a marginal increase of R0,3 billion in the fourth quarter of 2012.
At the same time, the value of the country’s gross gold and other foreign reserves declined in US dollar terms from US$50,7 billion at the end of December 2012 to US$50,0 billion at the end of March 2013 and to US$48,1 billion at the end of May 2013 as a result of the repayment of an international bond by the National Treasury. The level of import cover, defined as the value of gross international reserves relative to the value of imports of goods, services and income, decreased slightly from 19,8 weeks at the end of December 2012 to 19,5 weeks at the end of March 2013.
Change in net foreign reserves
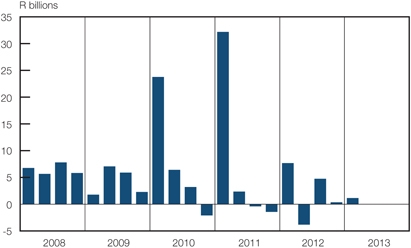
| | |
| | | Quarterly Bulletin June 2013 |
The international liquidity position of the South African Reserve Bank (the Bank) declined from US$47,9 billion at the end of December 2012 to US$46,1 billion at the end of March 2013 and US$45,4 billion at the end of May 2013 as a result of a decline in the Bank’s overbought forward position in foreign currency.
Exchange rates
The currencies of most emerging-market economies continued to be adversely affected by the uncertainty emanating from unresolved economic issues in the eurozone countries, and the unsatisfactory and partial solution to the reduction of the fiscal deficit in the US. Over and above these factors, lower international prices of some key export commodities, concerns about the sustainability of the financing of South Africa’s current-account deficit and ongoing tension in the domestic labour market have put further pressure on the domestic currency which, in the first quarter of 2013, declined, on balance, by 5,7 per cent against a basket of trading-partner currencies. The nominal effective exchange rate of the rand displayed increased levels of volatility in the first quarter of 2013 when the currency declined, on balance, by 6,6 per cent in January 2013, increased by 4,3 per cent in February before declining again by 3,2 per cent in March.
Exchange rates of the rand
| | | | | | | | | | | | | | | | |
| Percentage change | | | | | | | | | | | | |
| | | 30 Jun 2012
to
30 Sep 2012 | | | 30 Sep 2012
to
31 Dec 2012 | | | 31 Dec 2012
to
31 Mar 2013 | | | 31 Mar 2013
to
31 May 2013 | |
Weighted average* | | | -1,3 | | | | -2,8 | | | | -5,7 | | | | -9,0 | |
Euro | | | -1,9 | | | | -5,0 | | | | -5,5 | | | | -10,9 | |
US dollar | | | 1,0 | | | | -3,1 | | | | -8,3 | | | | -9,3 | |
Chinese yuan | | | -0,1 | | | | -3,9 | | | | -8,5 | | | | -10,4 | |
British pound | | | -2,7 | | | | -2,7 | | | | -2,3 | | | | -9,5 | |
Japanese yen | | | -1,4 | | | | 7,6 | | | | 0,3 | | | | -3,3 | |
| * | Against a basket of 15 currencies |
The higher volatility demonstrated by the exchange value of the rand continued during April 2013 as the currency initially strengthened on the announcement of significant monetary stimulus by the central bank of Japan. The downward adjustment of global economic growth projections by the IMF and slower-than-expected first-quarter economic growth data in China, however, once again resulted in an increase in risk aversion of international investors. This contributed to depreciation of the exchange value of the rand during the second half of April and again during the second half of May. More specific to South Africa, incidents of violent labour unrest in May highlighted the risk of further mining supply disruptions, exacerbating the depreciation of the exchange rate.
The real effective exchange rate of the rand declined by 11,2 per cent over the twelve-month period ending March 2013, improving the external price competitiveness of South African exporters in international markets.
| | |
| Quarterly Bulletin June 2013 | | |


Effective exchange rates of the rand
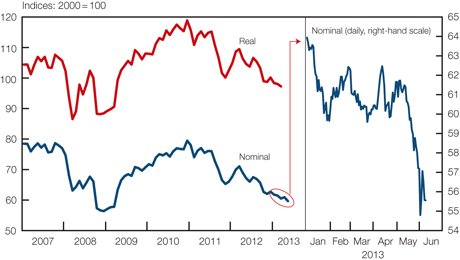
The average net daily turnover in the domestic market for foreign exchange increased from US$18,7 billion in the fourth quarter of 2012 to US$19,5 billion in the first quarter of 2013. While the average net daily turnover against the rand remained roughly unchanged, the increase was attributable to domestic banks’ trading with non-resident counterparties in currencies other than the South African rand.
| | |
| | | Quarterly Bulletin June 2013 |
Monetary developments, interest rates and financial markets
Money supply
The broadly defined money supply (M3) displayed a firm pace of increase in the first quarter of 2013, despite the hesitant recovery in economic activity. The quarter-to-quarter growth5 rate in M3 picked up from 5,0 per cent in the fourth quarter of 2012 to 7,7 per cent in the first quarter of 2013, but nonetheless remained well below the high double-digit growth of 13,0 per cent recorded in the third quarter of 2012. An expansion in the deposit holdings of non-financial companies dominated growth in money supply during the first quarter of 2013. Private financial companies also recorded further gains in their deposit holdings possibly reflecting portfolio rotation following a buildup of risks associated with the steep decline in the exchange rate of the rand, while an uptick in household deposits consistent with increases in household income and wealth added further support to growth in M3. Measured over twelve months, growth in M3 fluctuated higher from 5,2 per cent in December 2012 to a recent high of 10,0 per cent in April 2013.
Growth in M3
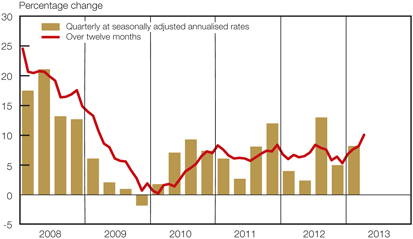
Despite the low interest rate environment, the maturity structure of deposit holdings revealed that depositors maintained a preference for long-term deposits in the first quarter of 2013. Cheque and transmission deposits were also favoured whereas the other categories by maturity recorded muted or negative growth. Notes and coin recorded its weakest growth since the second quarter of 2010, possibly reflecting changing seasonal patterns as banks adapt to the decentralised banknote processing system.
Maturity analysis of growth in M3
| | | | | | | | | | | | | | | | |
| Per cent at seasonally adjusted annualised rates | | | | | | | | | | | | |
| | | 2012 | | | 2013 | |
| | | 2nd qr | | | 3rd qr | | | 4th qr | | | 1st qr | |
Notes and coin | | | 16,0 | | | | 15,6 | | | | 3,1 | | | | -0,0 | |
Cheque and transmission deposits | | | -1,8 | | | | 16,7 | | | | 24,2 | | | | 10,2 | |
Call and overnight deposits | | | -0,1 | | | | 21,7 | | | | 6,4 | | | | -5,5 | |
Other short - and medium-term deposits* | | | 7,1 | | | | 0,9 | | | | -5,3 | | | | 0,9 | |
Long-term deposits** | | | -1,3 | | | | 25,7 | | | | 19,3 | | | | 19,1 | |
M3 | | | 2,4 | | | | 13,0 | | | | 5,0 | | | | 7,7 | |
| * | Unexpired maturities of more than one day and up to six months, and savings deposits |
| ** | Unexpired maturities of more than six months |
| | |
| Quarterly Bulletin June 2013 | | |


The overall increase in M3 amounted to R30,7 billion in the first quarter of 2013, slightly higher than the increase of R29,4 billion recorded in the fourth quarter of 2012. The increase in M3 deposits in the first quarter of 2013 was mainly concentrated in deposits holdings of the corporate sector, with a relatively subdued rise in deposits of the household sector. Within the corporate sector, deposit holdings of non-financial institutions outpaced those of financial companies. However, on aggregate the deposit holdings of financial companies continue to dominate total deposit balances held with the monetary sector.
| | | | | | | | | | | | | | | | | | | | | | | | |
| M3 holdings of households and companies | | | | | | | | | | |
| | | Quarterly change
(R billions) | | | Percentage holdings of total
M3 deposits | |
| | | 2012 | | | 2013 | | | 2012 | | | 2013 | |
| | | 3rd qr | | | 4th qr | | | 1st qr | | | 3rd qr | | | 4th qr | | | 1st qr | |
Households | | | 19,3 | | | | 8,6 | | | | 10,0 | | | | 28,8 | | | | 28,8 | | | | 28,8 | |
Companies | | | 74,2 | | | | 20,8 | | | | 20,8 | | | | 71,2 | | | | 71,2 | | | | 71,2 | |
Of which: Financial | | | 45,5 | | | | -8,7 | | | | 9,4 | | | | 42,0 | | | | 41,1 | | | | 41,0 | |
Non-financial | | | 28,7 | | | | 29,5 | | | | 11,4 | | | | 29,2 | | | | 30,1 | | | | 30,2 | |
Total M3 deposits | | | 93,5 | | | | 29,4 | | | | 30,7 | | | | 100,0 | | | | 100,0 | | | | 100,0 | |
After improving during the first half of 2012, growth over twelve months in M3 deposit holdings of the household sector fluctuated lower towards the end of 2012 and levelled out between 9 and 10 per cent in the first three months of 2013. In April, growth came to 9,2 per cent. By contrast, twelve-month growth in deposit holdings of the corporate sector accelerated from 3,6 per cent in December 2012 to a two-year high of 10,3 per cent in April 2013.
Statistically, the increase in M3 during the first quarter of 2013 could be explained by a significant increase in the net foreign assets of the monetary sector, supported by further growth in claims on the private sector. Net claims on the government sector and net other assets and liabilities declined. The increase in net foreign assets mostly reflected valuation effects of a weaker exchange rate and resulted from an increase in foreign assets and a simultaneous decline in foreign liabilities. Claims on the private sector fell back from firm growth in the last two quarters of 2012, as growth in credit extension moderated in the first quarter of 2013. Net claims on the government sector declined due to a significant increase in government deposits alongside higher tax revenue inflows.
Statistical counterparts of change in M3
| | | | | | | | | | | | | | | | |
| R billions | | | | | | | | | | | | |
| | | 2012 | | | 2013 | |
| | | 2nd qr | | | 3rd qr | | | 4th qr | | | 1st qr | |
Net foreign assets | | | 60,6 | | | | 18,1 | | | | -35,2 | | | | 51,7 | |
Net claims on the government sector | | | -16,7 | | | | 34,5 | | | | 6,2 | | | | -22,4 | |
Claims on the private sector | | | 12,0 | | | | 74,4 | | | | 62,7 | | | | 30,4 | |
Net other assets and liabilities | | | -30,1 | | | | -33,6 | | | | -4,4 | | | | -29,1 | |
Total change in M3 | | | 25,8 | | | | 93,5 | | | | 29,4 | | | | 30,7 | |
The income velocity of circulation of M3 pulled back from a recent high of 1,40 in the fourth quarter of 2012 to 1,38 in the first quarter of 2013, as growth in money supply exceeded that of nominal gross domestic product. Fluctuations in the income velocity have remained relatively subdued during the past two years, suggesting that growth in money supply generally kept pace with growth in nominal gross domestic product.
| | |
| | | Quarterly Bulletin June 2013 |
Credit extension
The strong growth in credit extension exhibited in the third and fourth quarters of 2012 moderated significantly in the first quarter of 2013, as unsecured lenders and the high household indebtedness came under more scrutiny. Quarter-to-quarter seasonally adjusted and annualised growth in total loans and advances to the private sector receded from a post-recession high of 13,1 per cent in the fourth quarter of 2012 to 8,5 per cent in the first quarter of 2013. Measured over twelve months, growth in total loans and advances decelerated from a four-year high of 10,0 per cent in December 2012 to 8,8 per cent in April 2013.
| | |
Total loans and advances to the private sector | | Contribution to growth |
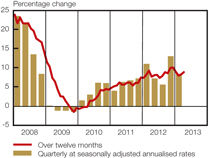 | |  |
Total loans and advances increased by R38,7 billion in the first quarter of 2013, substantially lower than the R62,6 billion and R74,3 billion recorded in the third and fourth quarters of 2012 respectively. Credit to the corporate sector fell back noticeably in the first quarter of 2013, after healthy growth was recorded during the second half of 2012.
| | | | | | | | | | | | | | | | | | | | | | | | |
| Composition of total loans and advances by type of credit | | | | | | | |
| Type of credit | | Quarterly change
(R billions) | | | Percentage
of total
loans and
advances* | |
| | | 2012 | | | 2013 | | | 2013 | |
| | | 1st qr | | | | 2nd qr | | | | 3rd qr | | | | 4th qr | | | | 1st qr | | | | 1st qr | |
Household sector | | | | | | | | | | | | | | | | | | | | | | | | |
Instalment sale credit and leasing finance | | | 5,0 | | | | 6,4 | | | | 7,2 | | | | 9,3 | | | | 7,7 | | | | 9,2 | |
Mortgage advances | | | 9,3 | | | | 4,7 | | | | 4,8 | | | | 4,2 | | | | 6,4 | | | | 34,2 | |
Other loans and advances | | | 12,6 | | | | 12,8 | | | | 14,0 | | | | 26,0 | | | | 11,9 | | | | 13,1 | |
Overdrafts | | | 2,5 | | | | -0,7 | | | | 0,6 | | | | 1,3 | | | | 2,9 | | | | 1,4 | |
General loans | | | 7,9 | | | | 11,2 | | | | 11,3 | | | | 13,0 | | | | 7,1 | | | | 8,3 | |
Credit card advances | | | 2,3 | | | | 2,4 | | | | 2,1 | | | | 11,7 | | | | 2,0 | | | | 3,4 | |
Total loans and advances to the household sector | | | 26,9 | | | | 23,9 | | | | 26,0 | | | | 39,5 | | | | 26,1 | | | | 56,5 | |
Corporate sector | | | | | | | | | | | | | | | | | | | | | | | | |
Instalment sale credit and leasing finance | | | 1,6 | | | | 2,2 | | | | 0,7 | | | | 0,7 | | | | 1,6 | | | | 3,8 | |
Mortgage advances | | | -4,7 | | | | 2,5 | | | | -2,6 | | | | 2,2 | | | | -4,9 | | | | 12,6 | |
Other loans and advances | | | 48,0 | | | | -28,3 | | | | 38,5 | | | | 31,9 | | | | 16,0 | | | | 27,2 | |
Overdrafts | | | 21,6 | | | | -8,8 | | | | -10,9 | | | | -1,4 | | | | 0,8 | | | | 4,7 | |
General loans | | | 26,1 | | | | -19,8 | | | | 49,0 | | | | 33,4 | | | | 14,5 | | | | 22,3 | |
Credit cards advances | | | 0,2 | | | | 0,3 | | | | 0,5 | | | | -0,0 | | | | 0,6 | | | | 0,2 | |
Total loans and advances to incorporate sector | | | 44,8 | | | | -23,6 | | | | 36,6 | | | | 34,8 | | | | 12,7 | | | | 43,5 | |
Total loans and advances to the private sector | | | 71,7 | | | | 0,2 | | | | 62,6 | | | | 74,3 | | | | 38,7 | | | | 100,0 | |
| * | Expressed as a percentage of outstanding balance of total loans and advances |
| | |
| Quarterly Bulletin June 2013 | | |


Credit extended to the household sector also moderated but outperformed that of the corporate sector in the first quarter, with nearly 70 per cent of new loans and advances for the period taken up by the household sector.
The category of other loans and advances remained the main driver of credit extension in the first months of 2013, although the pace of increase moderated. Other loans and advances, comprising bank overdrafts, general loans and credit card advances, grew by R27,9 billion during the first three months of 2013, substantially down from increases of R52,6 billion and R57,8 billion recorded in the third and fourth quarters of 2012. Consequently, twelve-month growth in other loans and advances decelerated sharply from 20,5 per cent in December 2012 to 16,4 per cent in April 2013. Declines were most prominent in the sub-categories for general loans and bank overdrafts.
The growth trend in instalment sale credit and leasing finance continued on a steady path in the opening months of 2013. After briefly slowing to 12,7 per cent in December 2012, twelve-month growth in instalment sale credit and leasing finance rebounded to 13,2 per cent in January 2013 and accelerated further to 13,4 per cent in March and 14,0 per cent in April – such high growth rates were last recorded in early 2008. The upward trend was predominantly driven by the instalment sale credit category, as demand for new and second-hand vehicles remained resilient in a competitive trading environment characterised by the introduction of new car models and low financing costs.
Contrary to the strong growth in instalment sale credit, the other asset-backed category, mortgage advances, remained lacklustre. Growth in both commercial and residential mortgage advances remained subdued, reflecting the sluggish real-estate market. Year-on-year growth in mortgage advances fell below the 2 per cent level at the end of 2012 and receded to a historic low of 1,6 per cent in March 2013. Relatively low bank margins on long-term mortgage loans and accelerated capital repayments in the low interest rate environment continued to dampen growth in mortgage advances. Disruptions in municipal offices also affected property registrations, exacerbating the weak growth in mortgage loans in recent months.
Credit extension to the private sector by type
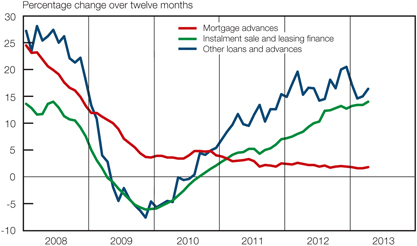
After steadily gaining momentum during 2012, growth in loans and advances to the household sector started to moderate from November. Twelve-month growth in credit extended to the household sector reached a high of 10,4 per cent in November 2012, the highest growth rate since December 2008, but fell back to 9,6 per cent and 9,5 per cent in March and April 2013, respectively. General loans to the household sector, often referred to as unsecured lending,
| | |
| | | Quarterly Bulletin June 2013 |
displayed early signs of moderation, as its year-on-year growth receded from a recent high of 34,3 per cent in November 2012 to 25,7 per cent in April 2013. Credit demand was dampened by elevated levels of household debt and lustreless employment and income prospects, while credit supply was impacted by greater restraint by banks in order to keep in check overexposure to the mortgage and unsecured lending markets. In addition, the Banking Association of South Africa announced in April 2013 that it is planning to propose changes to lending rules for unsecured credit in an effort to address the issue of mounting bad debts. This includes tougher rules related to lending affordability and the garnishing of workers’ salaries in cases of delinquent payments.
Total loans and advances extended to households and companies
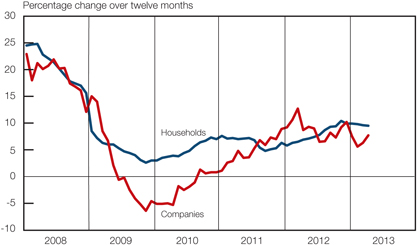
The sturdy revival in the corporate sector’s reliance on bank-intermediated funding observed during the second half of 2012 was partly reversed in the first quarter of 2013. Year-on-year growth in bank lending to companies declined from a recent peak of 10,2 per cent in December 2012 to 5,6 per cent in February 2013 and 7,7 per cent in April. The deceleration was especially evident in corporate overdrafts which fell from double-digit growth rates in 2012 to negative growth of 9,7 per cent in April 2013. However, general loans to companies displayed a more positive growth trend and declined only moderately from 21,3 per cent in December 2012 to 18,1 per cent in April 2013, suggesting some resilience in corporate activity.
Interest rates and yields
At its March 2013 meeting, the Monetary Policy Committee (MPC) assessed the existing monetary policy stance to be appropriately accommodative, given the persistence of a negative output gap. As a result, the repurchase rate was left unchanged at 5,0 per cent. The balance of risks to the infiation outlook was deemed to be on the upside, with the depreciation in the exchange rate of the rand being the main risk to the infiation outlook. The MPC expressed its concern that excessive wage settlements not only posed upside risk to the infiation outlook but also dampened employment growth. Upside risks to infiation were neutralised somewhat by the general absence of demand pressures in the economy due to a continued moderation in the growth in real consumption expenditure by households, lower risk emanating from food and electricity price increases, and subdued domestic economic growth prospects. The MPC expected domestic infiation to remain mostly contained within the target range, with a temporary breach of the upper band of the range in the third quarter of 2013. The outlook remained similar at the May 2013 meeting. However, it was stated that the difficult labour relations environment and the depreciating and volatile exchange rate raised the upside risks to the infiation outlook at a time of worsening real growth prospects.
| | |
| Quarterly Bulletin June 2013 | | |


The MPC statements discussing developments underlying recent monetary policy decisions are reproduced in full from page 67 of this Quarterly Bulletin.
Money-market rates
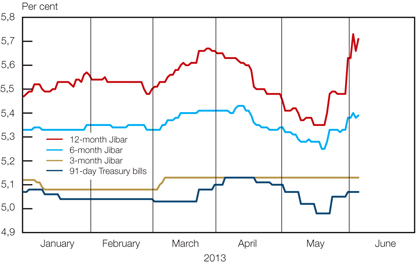
Money-market rates rose sharply from the end of February 2013 to March, in response to a deterioration in infiation expectations emanating from the steep decline in the exchange rate of the rand. Rates subsequently receded somewhat, alongside better-than-expected infiation outcomes, signs of a moderate recovery in selected global markets and an improvement in the exchange rate of the rand. The twelve-month Johannesburg Interbank Agreed Rate (Jibar) rose by 19 basis points from 5,48 per cent on 27 February to a high of 5,67 per cent on 27 March. The rate then declined during April and May but rose sharply to 5,91 per cent on 7 June 2013 when the exchange rate depreciated. By contrast, the three-month Jibar increased by 5 basis points to 5,13 per cent on 6 March 2013 and has since remained at that level, while the tender rate on 91-day Treasury bills fiuctuated lower from a recent high of 5,13 per cent on 5 April to below 5 per cent in mid-May before rebounding to 5,10 per cent on 7 June.
Forward rate agreements
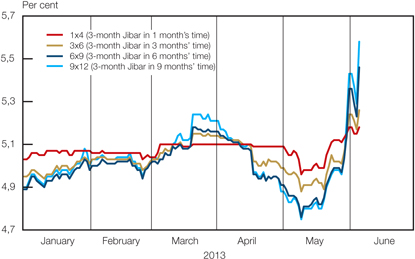
| | |
| | | Quarterly Bulletin June 2013 |
After declining briefiy in February, forward rate agreements (FRAs) responded to the sharp depreciation in the exchange rate of the rand by fluctuating higher in March 2013. The increase was more pronounced at the long end of the curve with the 9x12-month FRA rising by 29 basis points from 4,95 per cent on 25 February 2013 to 5,24 per cent on 20 March. While the short-term FRA rates rose at a more subdued pace, they fell back sharply when conditions in the market normalised. The FRA rates then indicated that market participants expected a pronounced decline in short-term interest rates. However, a more conservative outlook started to emerge after the repurchase rate was left unchanged at the May 2013 meeting, followed by a sharp rise in FRA rates from the end of May when the rand depreciated. The slope of the FRA yield curve and the Jibar futures yield curve now seem to indicate less optimistic expectations for interest rates for the remainder of 2013 while the Reuters consensus forecast indicates expectations of a rising trend in interest rates from the first quarter of 2014.
Interest rate expectations
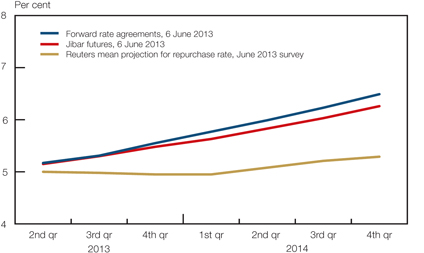
During the first five months of 2013, conditions in the domestic overnight money market were generally stable, with only modest fiuctuations in overnight rates. The South African Benchmark Overnight Rate on deposits (Sabor) remained in a narrow range of 4,72 to 4,79 per cent throughout the first five months of 2013, while the overnight FX rate ranged between a high of 5,20 per cent and a low of 4,77 per cent during the same period. Both rates continued to trend around the mid-point of the standing facility limits.
Benchmark overnight rates
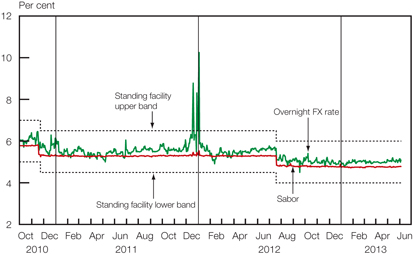
| | |
| Quarterly Bulletin June 2013 | | |


The prime lending rate and predominant rate on mortgage loans has remained unchanged at 8,50 per cent since July 2012. Other lending and deposit rates offered by banks also remained fairly closely aligned with the unchanged policy rate.
Selected bank interest rates
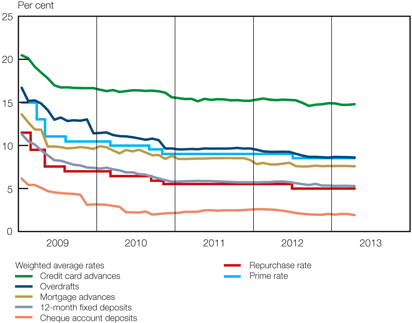
The depreciation in the exchange value of the rand facilitated a moderate increase in the daily average yield on the R208 government bond (maturing in 2021) from 6,28 per cent on 10 January 2013 to 6,59 per cent on 22 March. Thereafter, the yield dropped noticeably by 81 basis points to an all-time low of 5,78 per cent on 13 May. This occurred despite the increased amounts
Bond yield and non-residents’ net transactions
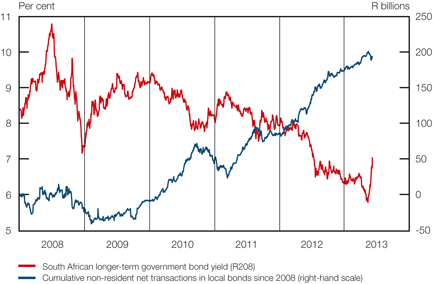
| | |
| | | Quarterly Bulletin June 2013 |
offered at the weekly auctions of government bonds since April 2013 and was fuelled by the release of generally better-than-expected consumer price inflation data, consistent demand for local bonds by non-residents amid the significant positive yield differential and increased global liquidity spurred anew by the release of the Bank of Japan’s bond-buying programme. Subsequently, the yield rebounded to 7,03 per cent on 6 June in response to the weaker rand.
Following these developments in the bond market, the yield curve initially moved lower from March 2013 to mid-May, before moving higher to early June. As the extreme short end of the curve remained broadly anchored to the unchanged repurchase rate, the yield gap, measured as the difference between yields at the extreme long and short ends of the curve, narrowed from 351 basis points on 13 March 2013 to 274 basis points on 2 May, before widening to 390 basis points on 6 June. Given the decline in the yield on the rand-denominated bond, together with a rise in the yield on the US dollar-denominated bond, the currency risk premium6 on South African government bonds narrowed from 357 basis points in November 2012 to 284 basis points in April 2013. This scenario changed in May when the currency risk premium widened to 295 basis points, following the more pronounced increase in the rand-denominated bond yield.
In tandem with a narrowing of emerging-market bond spreads in general as measured by the JPMorgan Emerging Markets Bond Index Plus (EMBI+),7 the sovereign risk premium over US Treasuries on South African government US dollar-denominated bonds in the nine-year maturity range reached a recent low of 102 basis points on 7 January 2013. Subsequently, the yield differential increased to 185 basis points on 6 June, along with the risk aversion towards emerging-market securities.
Both the South African and emerging-market sovereign risk premiums are currently below their long-term averages. The sovereign risk premium of South African government US dollar-denominated debt has, on average, been 126 basis points less than that of typical emerging-market debt thus far in 2013.
Sovereign risk premiums
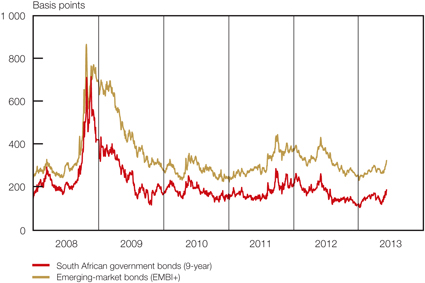
Money market
The actual daily liquidity requirement of the private-sector banks varied between a high of R30,7 billion and a low of R16,9 billion during the first quarter of 2013, down from a seasonally boosted range of between R22,0 billion and R38,2 billion recorded in the fourth quarter of 2012. Despite the slowdown, the gradual longer-term rise in the daily liquidity requirement of the private-sector banks reflected the reforms introduced in recent years to keep the money-market shortage more closely aligned with conditions in the money market, ultimately improving the effectiveness of the transmission of monetary policy.
| | |
| Quarterly Bulletin June 2013 | | |


Liquidity requirement
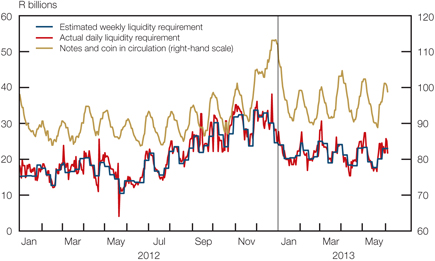
During the first quarter of 2013, the net result of the money-market liquidity flows was an injection of liquidity to the value of R0,5 billion. Notes and coin in circulation injected liquidity to the value of R9,0 billion in the market, which was partially neutralised by an increase of R1,6 billion in required cash reserve deposits of banks while the usage of liquidity management instruments, such as reverse repurchase transactions and SARB debentures, drained a further R4,0 billion. A significant liquidity injection to the value of R11,0 billion, emanating from the Bank’s operations in the foreign-exchange market, was completely neutralised by a R11,6 billion increase in government deposits with the Bank.
Money-market liquidity flows
| | | | | | | | | | | | |
| R billions (easing + tightening –) | | | | | | | | | |
| | | 2012 | | | 2013 | |
| | | Jul–Sep | | | Oct–Dec | | | Jan–Mar | |
Notes and coin in circulation | | | -5,1 | | | | -15,2 | | | | 9,0 | |
Required cash reserve deposits | | | -0,9 | | | | -2,0 | | | | -1,6 | |
Money-market effect of SARB* foreign-exchange transactions | | | 4,9 | | | | 2,0 | | | | 11,0 | |
Government deposits with the SARB* | | | -3,9 | | | | -2,9 | | | | -11,6 | |
Use of liquidity management instruments | | | -6,4 | | | | 16,4 | | | | -4,0 | |
Reverse repurchase transactions | | | -1,9 | | | | 1,9 | | | | -1,5 | |
SARB debentures | | | -4,5 | | | | 14,5 | | | | -2,5 | |
Other items net | | | -4,7 | | | | 3,4 | | | | -2,3 | |
Banks’ liquidity requirement (decrease + increase –) | | | -6,7 | | | | -1,8 | | | | 0,5 | |
| * | SARB: South African Reserve Bank |
Capital redemption payments and scheduled coupon interest payments on various government bonds amounting to R51,9 billion were effected from the government tax and loan account during the first quarter of 2013. The redemption of the R189 inflation-linked bond to an amount of R27,3 billion, was effected on 2 April 2013, since 31 March, the formal redemption date, fell over the Easter weekend.
| | |
| | | Quarterly Bulletin June 2013 |
Bond market
Activity in the primary bond market continued steadily in the first five months of 2013, dominated by public-sector issuances. The public sector recorded net issues of R55,0 billion in the first five months of 2013, considerably lower when compared with the net issues of R74,4 billion recorded in the same period of 2012. The lower net issues were mainly due to the redemption of the R189 inflation-linked government bond in March 2013 to the amount of R27 billion. National government increased the amount allotted at the weekly bond auctions from around R2,9 billion in March 2013 to around R3,2 billion from April, reflecting the funding needs of national government. In April 2013 the City of Tshwane Metro Municipality became the fourth local government to list bonds on the JSE when it raised R1,4 billion through two bond issues.
Private-sector funding in the domestic bond market continued at a slower pace thus far in 2013, with net issues of R22,5 billion in the first five months of 2013, which were less than the R46,4 billion raised in the same period of 2012. Company expansion activities and capital expenditure remained subdued under the current economic environment. The total outstanding nominal value of debt securities listed on the JSE increased by R76,8 billion in the five months of 2013 to reach R1,7 trillion at the end of May. Of the total amount in issue, national government accounted for 62 per cent in May 2013, followed by banks with 14 per cent. Securitised debt instruments made a small contribution of 5 per cent, much lower than the 17 per cent recorded before and carried up to the financial crisis.
Issuers’ contribution to the nominal amount of debt securities listed on the JSE Limited
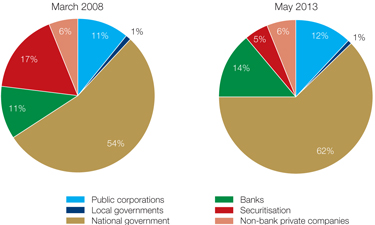
Turnover in the domestic secondary bond market declined from an all-time quarterly high of R6,9 trillion in the third quarter of 2012 to R5,9 trillion in the fourth quarter and further to R5,4 trillion in the first quarter of 2013, following lower trading volumes. The value of turnover of R9,7 trillion in the first five months of 2013 was 4 per cent lower than the value traded in the corresponding period of 2012.
Rand-denominated bond issuances by non-residents in the European bond markets rebounded in 2013 as the net issues of R6,8 billion recorded in the first five months of 2013 overshadowed the net redemptions of R1,0 billion recorded in the corresponding period of 2012. The issuances of rand-denominated bonds by non-residents in the Uridashi bond market continued steadily in 2013, although at a slower pace than in the same period of 2012. Redemptions exceeded new issues, resulting in net redemptions of R4,1 billion in the first five months of 2013, compared with the net issues of R0,3 billion recorded in the same period of 2012, as indicated in the accompanying table.
| | |
| Quarterly Bulletin June 2013 | | |


Rand-denominated bonds issued in international bond markets, January to May
| | | | | | | | | | | | | | | | | | | | | | | | |
| R millions | | | | | | | | | | | | | | | | | | |
| | | Eurorand | | | Uridashi | | | Total | |
| | | 2012 | | | 2013 | | | 2012 | | | 2013 | | | 2012 | | | 2013 | |
Issues | | | 5 265 | | | | 8 804 | | | | 5 125 | | | | 4 191 | | | | 10 390 | | | | 12 995 | |
Redemptions | | | 6 275 | | | | 2 021 | | | | 4 863 | | | | 8 252 | | | | 11 138 | | | | 10 273 | |
Net | | | -1 010 | | | | 6 783 | | | | 263 | | | | -4 061 | | | | -747 | | | | 2 722 | |
In the run-up to the inclusion of South African government bonds in the Citi World Government Bond Index (WGBI) from October 2012, interest in these bonds was very strong. After the inclusion, non-residents’ net purchases of local bonds dwindled so that their quarterly net purchases declined from R28,8 billion in the third quarter of 2012 to R10,6 billion in the fourth quarter and further to R9,9 billion in the first quarter of 2013. Although net purchases rebounded in April, non-residents recorded net sales of R4,1 billion in May – their first monthly net sales since May 2012. Total net purchases of local bonds of R15,5 billion by non-residents in the five months to May 2013 therefore fell short of the R27,5 billion net purchases recorded in the same period of 2012.
Share market
Companies listed on the JSE stepped up the amount of equity capital raised in the domestic and international primary share markets in early 2013, as the R30,6 billion raised in the first five months of 2013 was 23 per cent higher than the amount raised in the corresponding period of 2012. This was despite a somewhat lower number of companies listed on the JSE at 394 by the end of May 2013. While 8 delistings were recorded in the first five months of 2013, only 2 new listings were recorded over the same period. The largest contributor to the total equity capital raised was the financial sector, with companies in that sector raising 51 per cent of the total equity capital raised thus far in 2013, followed by the resources sector at 24 per cent.
Equity capital raised on the JSE Limited by sector
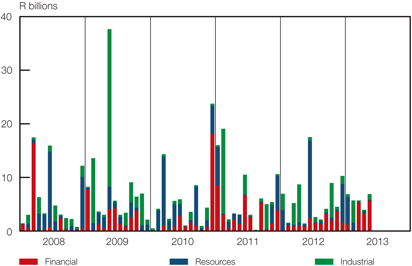
Turnover in the secondary share market increased from R831 billion in the fourth quarter of 2012 to an all-time quarterly high of R986 billion in the first quarter of 2013. This reflected both higher trading volumes and amplified share prices. Trading activity in April and May 2013 remained
| | |
| | | Quarterly Bulletin June 2013 |
brisk, contributing to turnover of R1,7 trillion in the first five months of 2013, which was 21 per cent higher compared with the value traded in the corresponding period of 2012. The total market capitalisation of the JSE increased from R8,4 trillion in April 2013 to an all-time high of R9,1 trillion in May, buoyed by record high share prices.
Non-residents recorded net purchases of shares in the domestic secondary share market amounting to R1,1 billion in the fourth quarter of 2012, rising to R3,0 billion in the first quarter of 2013. Defying this trend, net sales of R5,4 billion were registered in March 2013 as non-residents reduced their holdings of domestic mining-sector shares. The local mining sector has taken strain following the decline in the platinum price, widespread illegal strikes, and alleged uncertainties emanating from proposed changes in the mineral and petroleum resources law. In the first five months of 2013 non-residents recorded net purchases of shares amounting to R15,8 billion, in particular adding to their holdings of domestic general industrials and banking-sector shares.
The JSE implemented a methodology change to the FTSE/JSE Africa Index Series with effect from 15 March 2013, in line with a global change to index methodology applied by the FTSE Group. The FTSE/JSE Africa Index Series comprises weighted indices where the weights are the free-float market capitalisation of each company. Free-float market capitalisation is calculated by multiplying a company’s share price by the number of shares readily available in the market. The indices are now constructed according to an actual free float rounded up to the next 1 per cent, rather than with a banded free float. Banded free floats were calculated by categorising the size of free-float in different bands between 5 and 25 percentage points, and assigning percentage weights to the bands. The “old” banded free-float methodology resulted in a relatively small change in the free float of a company, causing a significant change in its weight in the index. These large movements had the potential to cause short-term supply-demand imbalances. The free-float figure for a constituent will only be adjusted if the move in free float is larger than the newly introduced 3 per cent buffer. This change to actual free float will improve the market representation of the indices and potentially reduce large changes to constituent weights.
Domestic share prices retained the upward movement in 2013. The FTSE/JSE All-Share Price Index (Alsi) rose by a stellar 44 per cent from a recent low of 28 391 index points on 8 August 2011 to reach a high of 40 984 index points on 11 March 2013. The Alsi was boosted by the positive global market sentiment and the depreciation in the exchange value of the rand. Although the Alsi declined by 8 per cent to 37 802 index points on 17 April, alongside lower international commodity prices, lower global equity prices and concerns regarding economic prospects for the euro area, it again soared by 11 per cent to an all-time high of 42 016 index points on 31 May. Thereafter some downward correction of 4 per cent occurred to 6 June.
Share prices in local currency
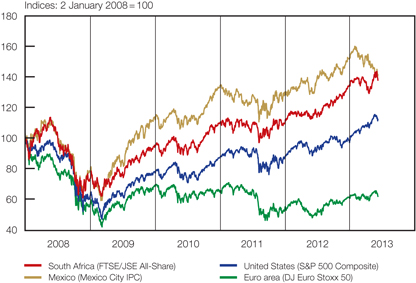
| | |
| Quarterly Bulletin June 2013 | | |


Market for exchange-traded derivatives
Safcom, South Africa’s clearing house for exchange-traded derivatives, achieved a risk management global standard at the end of 2012. In line with its objectives of overhauling the risk process in the domestic exchange-traded derivatives market and raising credibility ahead of the JSE’s plans to launch an onshore over-the-counter clearing service, the clearing house announced in March 2013 the promulgation of new rules relating to the establishment of a derivatives market default fund. This buffer fund is aimed at providing an additional layer of investor protection in the exchange-traded derivatives market in the event of a clearing member defaulting. This will contribute to a reduction in clearing members’ exposure to counterparty credit risk when clearing through Safcom.
In response to market demand, in April 2013 the JSE announced the extension of the Quanto futures product range under its existing licensing agreement with the Chicago Mercantile Exchange (CME) Group. The additional products include heating oil, gasoline, natural gas, palladium, sugar, cocoa, cotton, coffee and corn. The popularity of Quanto contracts largely emanates from the feature that they, although rand-denominated, enable investors to gain exposure to the price movements in the underlying foreign commodity, while shielding them against exchange rate fluctuations.
The trading volume of 1,2 million contracts traded in commodity futures and options on the JSE during the first five months of 2013 was 4 per cent higher than in the corresponding period of 2012. This contributed to higher turnover over the same period. Despite the lower production forecasts published by the Crop Estimates Committee, domestic grain prices portrayed a downward trend in 2013 along with international grain prices.
Consistent introduction of new can-do and any-day contracts continued to buoy trading activity in the Interest Rate and Currency Derivatives Markets of the JSE in 2013. Brisk trading activity brought the total number of contracts traded during the five months to May 2013 to 16,2 million, while only 6,0 million contracts were traded in the corresponding period of 2012.
The volume of warrants traded on the JSE during the first five months of 2013 remained subdued and amounted to only 1,1 billion, compared with 1,6 billion traded during the same period of 2012. Turnover in all derivatives traded on the JSE during the first five months of 2013 is indicated in the accompanying table.
Derivatives turnover on the JSE, January to May 2013
| | | | | | | | |
| Type of derivative | | Value
(R billions) | | | Change over
one year
(Per cent) | |
Equity | | | 1 825 | | | | 16 | |
Warrants | | | 0,2 | | | | -33 | |
Commodity | | | 198 | | | | 16 | |
Interest rate | | | 259 | | | | 94 | |
Currency | | | 135 | | | | 201 | |
Real-estate market
Across the various house price barometers, the year-on-year rate of increase in nominal house prices seemed somewhat firmer and varied between 6 and 11 per cent in May 2013. The luxury segment of the market was the worst performer, whereas the prices of houses in the affordable and middle segments increased in the first quarter of 2013. The current pedestrian economic growth and sticky household indebtedness contributed to subdued growth in mortgage loans. According to FNB’s Estate Agent Survey, the average time residential properties remained on the market increased from 15,4 weeks in the fourth quarter of 2012 to 17,2 weeks in the first
| | |
| | | Quarterly Bulletin June 2013 |
quarter of 2013. However, the survey results also showed more agents citing stock constraints as a factor influencing expectations of near-term activity. The real value of residential building plans passed has also trended higher over the past year.
Nominal house prices
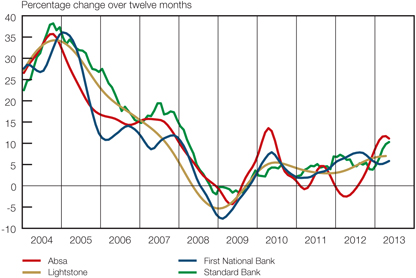
Non-bank financial intermediaries
Buoyed by higher asset prices, the balance sheet of insurers, pension and provident funds and unit trusts grew by 3 per cent from R5,4 trillion in the final quarter of 2012 to R5,6 trillion in the first quarter of 2013. The total assets of these intermediaries registered annual growth rates of 6 per cent in 2011 and 18 per cent in 2012, largely mirroring developments in financial market conditions and defying the moderation in economic activity. There have been reallocations out of cash to fixed-interest securities and equities since 2009. Of the total assets, the balance sheet of insurers and pension and provident funds accounted for R4,3 trillion in the first quarter of 2013.
Asset holdings of insurers, pension and provident funds and unit trusts
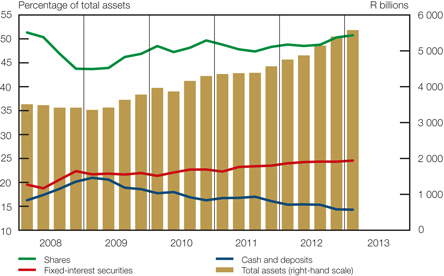
| | |
| Quarterly Bulletin June 2013 | | |


Holdings of ordinary shares by insurers, pension and provident funds and unit trusts increased from 50 per cent of total assets in the final quarter of 2012 to 51 per cent in the first quarter of 2013 – the highest since the first quarter of 2008. Simultaneously, the proportion of assets allocated to fixed-interest securities grew from 24 per cent of total assets to 25 per cent over the same period, despite the deterioration in the inflation outlook.
The National Treasury released an updated discussion document on retirement reform proposals for further consultation. This document followed a series of technical discussion papers that were released in 2012. It proposed, inter alia, that all retirement funds be required to identify a preservation fund for transferring members’ pension balance when benefits were withdrawn before retirement – this would also be applicable to payments from divorce settlements. The tax regime for all retirement funds would be harmonised to minimise tax arbitrage, while the official pension funds would be brought into the purview of the Pension Fund Act, 1956. These proposed changes, which are also meant to complement the Twin Peaks model of financial regulation, seem likely to have a positive effect on retirement savings.
| | |
| | | Quarterly Bulletin June 2013 |
Public finance8
Non-financial public-sector borrowing requirement9
While general government incurred a somewhat larger deficit in 2012/13, the financial shortfall of the non-financial public enterprises and corporations widened more dramatically over the period as the public sector stepped up its infrastructure investment drive. This resulted in a considerable widening of the deficit of the non-financial public sector. The non-financial public-sector borrowing requirement amounted to R207 billion in fiscal 2012/13 – approximately R57 billion higher than the deficit recorded in the previous fiscal year.
Non-financial public-sector borrowing requirement
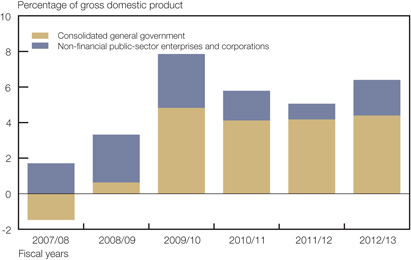
As a ratio of gross domestic product, the non-financial public-sector cash deficit rose to 6,4 per cent in fiscal 2012/13 compared with a deficit of 5,1 per cent in fiscal 2011/12. Financial activities at various levels of the non-financial public sector are summarised in the accompanying table.
Non-financial public-sector borrowing requirement
| | | | | | | | |
R billions | | | | | | |
| Level of government | | 2011/12* | | | 2012/13* | |
Consolidated general government | | | 124,2 | | | | 142,7 | |
National government | | | 142,8 | | | | 171,6 | |
Extra-budgetary institutions | | | -2,7 | | | | -5,6 | |
Social security funds | | | -12,3 | | | | -12,2 | |
Provincial governments | | | -5,9 | | | | -6,2 | |
Local governments | | | -2,4 | | | | -4,9 | |
Non-financial public enterprises and corporations | | | 26,3 | | | | 64,5 | |
Total** | | | 150,5 | ** | | | 207,2 | ** |
As a percentage of gross domestic product | | | 5,1 | | | | 6,4 | |
| ** | Components may not add up to totals due to rounding |
| | |
| Quarterly Bulletin June 2013 | | |

In January–March 2013, the consolidated general government recorded a cash deficit estimated at R30,9 billion, bringing the cash deficit for the full fiscal year to R143 billion. The latter amount was R18,5 billion higher when compared with the cash deficit recorded in fiscal 2011/12. As a ratio of gross domestic product, the consolidated general government borrowing requirement amounted to 4,4 per cent, when compared with a cash deficit of 4,2 per cent recorded in the preceding fiscal year.
In fiscal 2012/13, non-financial public enterprises and corporations, including major state-owned companies,10 recorded a preliminary cash deficit of R64,5 billion, substantially higher than the cash deficit of R26,3 billion incurred in the previous fiscal year. This sizeable deficit could be attributed to higher infrastructure-related capital spending.
Preliminary estimates indicate that net investment in non-financial assets by non-financial public enterprises and corporations amounted to R124 billion in fiscal 2012/13, R22,7 billion higher than in the previous fiscal year. Accelerated infrastructure investment was set as a top priority in the National Development Plan (NDP). Infrastructure spending was estimated to total R397 billion over the three-year projection period 2013/14—2015/16, with Eskom and Transnet accounting for 82,9 per cent of this spending. Transnet has embarked on a vigorous modernisation and expansion strategy, set to gain momentum over the remainder of the decade.
Finances of non-financial public enterprises and corporations
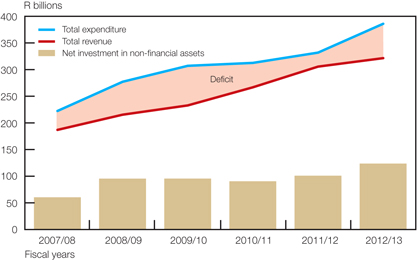
Early in 2013 Eskom had secured 82 per cent of the funding required for its current build programme, and indicated that it would spend more than R200 billion for the supply of coal over the next five years.
As a ratio of gross domestic product, investment in non-financial assets by non-financial public enterprises and corporations reached 3,8 per cent in fiscal 2012/13. This was higher than the ratio of 3,4 per cent recorded in the previous fiscal year.
An analysis of national government finance statistics indicates that cash receipts from operating activities amounted to R831 billion, an increase of 8,6 per cent in fiscal 2012/13. This increase resulted predominantly from an increase in taxes on income, profits and capital gains, and was well aligned with the increase in nominal gross domestic product over this period. Cash payments for operating activities increased by 10,4 per cent year on year and totalled R989 billion. Grants to other levels of government remained the main contributor to higher total expenses. Net cash flow from operating activities, together with net investment in non-financial assets, resulted in a cash deficit of R172 billion – some R28,8 billion higher than the cash deficit recorded in the previous fiscal year.
| | |
| | | Quarterly Bulletin June 2013 |
In the period under review, provincial governments’ financial activities resulted in a cash surplus of R6,2 billion – slightly higher than the cash surplus of R5,9 billion recorded in the preceding fiscal year. The Budget Review 2012 provided for a full-year provincial cash surplus of R7,4 billion in fiscal 2012/13.
Total provincial revenue, primarily driven by grants received from national government, amounted to R401 billion in fiscal 2012/13, some R5,3 billion more than the originally budgeted amount. Provincial grants, which included equitable share transfers and conditional grants allocated for specific purposes, amounted to R388 billion during the period under review. These grants increased at a year-on-year rate of 7,1 per cent when compared with a year earlier.
Provincial government expenditure amounted to R395 billion in fiscal 2012/13, some 7,3 per cent more than in the previous fiscal year. Compensation of employees accounted for the bulk of provincial government expenditure, amounting to R234 billion in fiscal 2012/13. Spending in this category was 7,6 per cent higher than in fiscal 2011/12, down from double-digit rates of increase in earlier years.
Provincial government compensation of employees
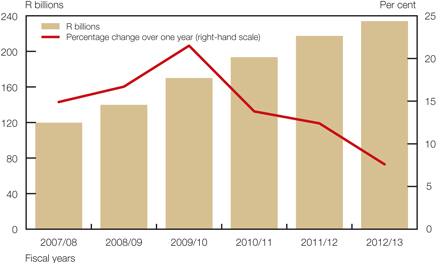
Education and health-related expenditure accounted for the greater share of provincial governments’ spending. This reaffirmed government’s financial commitment to improving the quality of education, and to improve diagnostics in public health care and increase the take-up of anti-retroviral medication. Spending on these functions increased by 7,7 per cent year on year to amount to R289 billion in fiscal 2012/13.
Net investment in non-financial assets by provincial governments amounted to R28,2 billion in fiscal 2012/13. This represented a slight increase from R27,8 billion recorded in fiscal 2011/12.
The provincial cash surplus resulted in an increase in provincial governments’ deposits with the Corporation for Public Deposits from R6,4 billion at the end of March 2012 to R7,4 billion at the end of March 2013. Provincial deposits with private banks increased by R0,4 billion, while their overall indebtedness to banks increased from R1,1 billion to R1,9 billion.
Unaudited local government statistics as presented in the Quarterly Financial Statistics (QFS) indicate that the consolidated local government recorded an accumulated net operating surplus of R49,3 billion in fiscal 2012/13. This outcome, together with the net investment in non-financial assets, resulted in a cash surplus of R4,9 billion, in contrast to a cash deficit of R2,4 billion recorded a year earlier.
| | |
| Quarterly Bulletin June 2013 | | |


The turnaround in the financial position of local governments was on account of an increase in total municipal revenue which outpaced the increase in these institutions’ total expenditure. Total receipts of local governments recorded a year-on-year rate of increase of 13,9 per cent to amount to R267 billion in fiscal 2012/13. Municipal own revenue increased considerably at a year-on-year rate of 11,5 per cent to amount to R183 billion in fiscal 2012/13. This increase was driven by higher revenue from sales of water and electricity, and higher collections of municipal property rates.
Municipal rates and taxes*
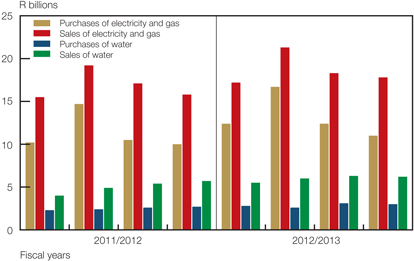
| * | Purchases and sales of water and electricity by municipalities are recorded on an invoice basis, that is, when the municipality receives an invoice from the suppliers of bulk water and electricity a purchase is recorded and, similarly, when the municipality invoices the consumers for consumption of water and electricity, a sale is recorded. Transactions include prepaid cash as well as payables to service providers (creditors), receivables from consumers (debtors) and cash prepayments for water and electricity by consumers. |
According to the 2011 Census, the population of some municipalities grew by over 50 per cent between 2001 and 2011. Local governments received inter-governmental transfers – from national and provincial governments – to supplement their own revenue in order to meet the rising costs of providing basic services and to cater for the growing population. These grants increased at a year-on-year rate of 19,5 per cent to amount to R83,8 billion in fiscal 2012/13. Included in this amount was a total of R9,0 billion received from national government as part of the general fuel levy-sharing agreement with metropolitan municipalities – some 5,4 per cent more than the total amount received a year earlier.
In fiscal 2012/13 municipalities’ total expenditure amounted to R262 billion – some R25,2 billion more than in the preceding fiscal year. This increase could be attributed to a significant increase in their purchases of water and electricity, subsequent to the 8,1 per cent average tariff increase for water purchases from water boards and the 16,1 per cent tariff increase granted to Eskom by the National Energy Regulator of South Africa (Nersa). At the same time, net investment in non-financial assets increased by 5,7 per cent to amount to R44,4 billion.
Extra-budgetary institutions recorded a preliminary cash surplus of R5,6 billion in fiscal 2012/13 – more than double the cash surplus of R2,7 billion recorded in the same period of the preceding fiscal year.
Preliminary estimates indicate that the financial position of social security funds remained broadly unchanged with cash surpluses of just more than R12 billion being recorded in both fiscal 2011/12 and 2012/13.
| | |
| | | Quarterly Bulletin June 2013 |
Budget comparable analysis of national government finance
In fiscal 2012/13 national government expenditure increased at a slower pace when compared with both the outcome of the previous fiscal year and the budget projections. Unaudited data indicate that national government expenditure totalled R962 billion in fiscal 2012/13, recording a year-on-year rate of increase of 8,4 per cent. The preliminary outcome was R5,6 billion below the original budgetary provision and R3,4 billion less than the revised estimate presented to Parliament by the Minister of Finance in February 2013. As a ratio of gross domestic product, national government spending remained broadly unchanged at 29,9 per cent in both fiscal 2011/12 and fiscal 2012/13.
National government expenditure
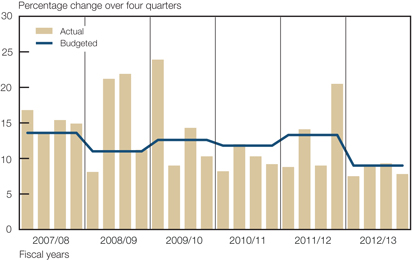
Spending by national government was mainly driven by an increase in voted amounts, consisting of current payments, transfers and subsidies, and payments for capital assets. Total voted expenditure was originally budgeted to increase at a rate of 8,8 per cent in the full fiscal year 2012/13, but the outcome has been a lower rate of increase of 7,9 per cent. The lower rate of increase reflected underspending by national government to the tune of R3,2 billion when compared to the revised projections in the Budget Review 2013.
The Justice, Crime Prevention and Security Cluster accounted for the bulk of current payments. The increase in current payments by this cluster was driven by the Departments of Defence and Military Veterans, of Justice and Constitutional Development, and of Police, with the last-mentioned department contributing the greatest share. Increased spending by these departments resulted from changes made to cost-of-living adjustment bonuses, which were paid out to labour-intensive departments in October 2012.
In fiscal 2012/13 total transfers and subsidies paid by national government recorded an increase of 7,9 per cent year on year, with the Social Services Cluster contributing the highest proportion. The increase in transfers by this cluster emanated from the Departments of Education, Health and Social Development. Transfers and subsidies paid by the departments responsible for education increased by 11,2 per cent year on year and were mainly to improve the quality of learning in schools and to provide financial support to universities. The firm increase of 8,7 per cent in transfers by the Department of Social Development was mainly to provide income support to vulnerable groups.
| | |
| Quarterly Bulletin June 2013 | | |


Interest paid on national government debt equalled R88,1 billion in fiscal 2012/13, or 15,3 per cent more than in fiscal 2011/12. The increase was underpinned by the higher stock of domestic government bonds and Treasury bills outstanding on account of the sizeable fiscal deficit; the interest rates on these instruments were slightly lower than in the previous fiscal year. Interest payments were originally budgeted to amount to R89,3 billion or increase by 16,8 per cent in fiscal 2012/13. This statutory payment was revised slightly lower to amount to R88,3 billion in the Budget Review 2013.
In fiscal 2012/13 equitable share transfers to provinces amounted to R313 billion or 7,3 per cent more than in the previous fiscal year, much higher than the originally budgeted increase of 5,9 per cent. Higher equitable share transfers to provinces reflected government’s commitment to improved service delivery in the health and education sectors.
After taking into account cash-flow adjustments,11 national government’s cash-flow expenditure equalled R910 billion in fiscal 2012/13, which represents a modest year-on-year rate of increase of 3,8 per cent. However, this differs significantly from the cash-book expenditure as a result of outstanding transfers to the value of R34,4 billion.
Total national government revenue amounted to R787 billion in fiscal 2012/13, representing a year-on-year rate of increase of 6,3 per cent. This revenue outcome, while falling short of the original budget, was still about R5,0 billion higher than the February 2013 revised projections. National government revenue was originally budgeted to increase at a rate of 8,0 per cent and total R799 billion in fiscal 2012/13. However, it was revised downwards in the Budget Review 2013 to amount to R782 billion, representing a year-on-year rate of increase of only 5,7 per cent.
As a ratio of gross domestic product, national government revenue amounted to 24,5 per cent in fiscal 2012/13, slightly lower than the 24,9 per cent recorded in fiscal 2011/12.
Taxes on income, profits and capital gains, as a major contributor to national government revenue, recorded a lower increase when compared with the rate of increase anticipated in the budget estimates. This could be the result of a weaker economy, job losses which occurred particularly in the third quarter of fiscal 2012/13, and generally lower wage settlements and bonuses. Both corporate income tax and individual income tax collections fell short of originally budgeted projections.
National government revenue
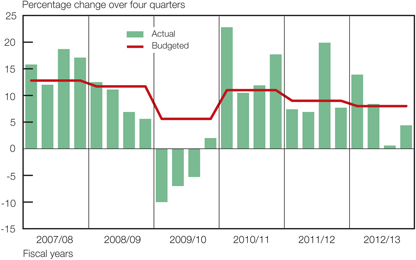
Value-added tax (VAT) – the main component of taxes on goods and services – recorded a firm increase in fiscal 2012/13 and collections exceeded the originally budgeted amount. Strong growth in fuel levy and excise duty collections also contributed to the higher increase in taxes on
| | |
| | | Quarterly Bulletin June 2013 |
goods and services, with specific excise duties on cigarettes and cigarette tobacco recording particularly strong increases. Domestic VAT recorded an increase of 10,1 per cent year on year, with smaller vendors contributing more to this growth than the large business vendors. Import VAT also showed an increase of 10,2 per cent due to higher import volumes of machinery, vehicles and parts for the Automotive Production and Development Programme (APDP). VAT refunds increased at a moderate rate of 5,9 per cent year on year, compared with a rate of 26,4 per cent in fiscal 2011/12. The labour unrest in the mining sector resulted in lower intermediate input costs and, to a lesser extent, also constrained capital expenditure as production stalled in this sector. These developments had a significant impact on overall VAT refunds as mining is a major contributor to VAT refunds.
Proceeds from taxes on international trade and transactions increased firmly due to improved international trading conditions, resulting in an increase in revenue collected from specific excise duties on imports. Customs duties contributed a higher portion to taxes on international trade and transactions, mainly due to the increase in imports of vehicles, beverages and tobacco products, buoyed by strong domestic demand.
Non-tax revenue amounted to R15,5 billion in fiscal 2012/13, a decline of 19,3 per cent, which resulted mainly from the decline in collections from mineral and petroleum royalties as a result of lower profits recorded by mining companies.
National government revenue in fiscal 2012/13
| | | | | | | | | | | | | | | | |
| | | Originally budgeted
Full year | | | Actual
Full year | |
| Revenue source | | R billions | | | Percentage
change* | | | R billions | | | Percentage
change* | |
Taxes on income, profits and capital gains | | | 475,7 | | | | 11,5 | | | | 457,3 | | | | 7,2 | |
Income tax on individuals | | | 287,2 | | | | 14,3 | | | | 276,7 | | | | 10,1 | |
Income tax on companies | | | 169,5 | | | | 10,6 | | | | 160,9 | | | | 5,0 | |
Payroll taxes | | | 11,1 | | | | 9,4 | | | | 11,4 | | | | 11,8 | |
Taxes on property | | | 8,6 | | | | 10,4 | | | | 8,6 | | | | 10,6 | |
Taxes on goods and services | | | 294,5 | | | | 11,6 | | | | 297,6 | | | | 12,8 | |
Value-added tax | | | 209,7 | | | | 9,8 | | | | 215,8 | | | | 13,0 | |
Taxes on international trade and transactions | | | 36,4 | | | | 6,6 | | | | 38,7 | | | | 13,5 | |
Other revenue | | | 15,2 | | | | -21,2 | | | | 15,6 | | | | -19,1 | |
Less: SACU** payments | | | 42,2 | | | | 93,7 | | | | 42,2 | | | | 93,7 | |
Total revenue | | | 799,3 | | | | 8,0 | | | | 787,1 | | | | 6,3 | |
| * | Fiscal 2011/12 to fiscal 2012/13 |
| ** | Southern African Customs Union |
Transfers to South Africa’s partners in the Southern African Customs Union amounted to R42,2 billion in fiscal 2012/13, the same as the originally budgeted amount. These payments almost doubled, coming from a low base in the previous fiscal year.
Netting national government revenue and expenditure yielded a cash-book deficit before borrowing and debt repayment of R175 billion in fiscal 2012/13. This deficit was R27,6 billion higher than the cash-book deficit recorded in fiscal 2011/12. In relation to the previous fiscal year, firm national government spending, which exceeded the slower increase in revenue, resulted in the higher deficit. The full-year cash-book deficit was originally budgeted to amount to R168 billion in fiscal 2012/13, but was revised upwards to R183 billion in the Budget Review 2013. The preliminary outcome was, however, R8,0 billion lower than the February 2013 revised estimate. As a ratio of gross domestic product, the cash-book deficit amounted to 5,4 per cent, almost equivalent to the originally budgeted deficit of 5,1 per cent in fiscal 2012/13.
| | |
| Quarterly Bulletin June 2013 | | |


Cumulative deficit of national government
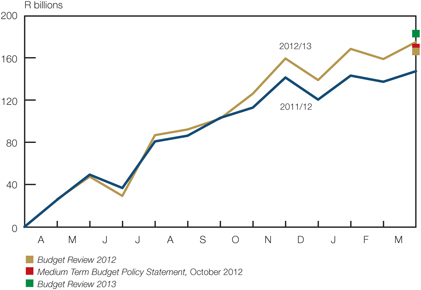
In fiscal 2012/13, the primary balance12 reached a deficit of R87,0 billion, or 2,7 per cent as a ratio of gross domestic product. This deficit could be compared with a primary deficit of R71,0 billion – or a deficit ratio of 2,4 per cent – recorded in fiscal 2011/12. The primary balance can be used as an indicator of fiscal sustainability as it reflects how much resources government is left with for spending on public goods and services after accounting for debt service costs; sound public finances require a return to primary surpluses within a reasonable timeframe to avoid an ever-increasing government debt ratio.
The net result of national government cash-flow revenue and expenditure was a cash-flow deficit of R123 billion in fiscal 2012/13, some R13,1 billion lower than the cash-flow deficit recorded in the previous fiscal year. Given that 31 March 2013 fell over a long weekend, the significant difference between the cash-book deficit and cash-flow deficit was a result of the substantial difference between the cash-book expenditure and cash-flow expenditure as a result of outstanding transfers of R34,4 billion. Extraordinary payments amounted to R2,6 billion in fiscal 2012/13, which consisted mainly of premiums on debt portfolio restructuring to the value of R2,2 billion, together with revaluation losses on foreign currency transactions and losses on the Gold and Foreign Exchange Contingency Reserve Account (GFECRA). Included in the R1,0 billion extraordinary revenue were penalties on retail bonds, revaluation profits on foreign currency transactions and the liquidation proceeds of the South African Special Risks and Insurance Association (SASRIA) investment. After accounting for extraordinary transactions and the profit on revaluation of foreign debt at redemption in fiscal 2012/13, the net borrowing requirement of national government amounted to R122 billion. This net borrowing requirement was R14,0 billion less than the net borrowing requirement recorded in the preceding fiscal year.
In fiscal 2012/13, the net borrowing requirement was mainly financed domestically through issuances of Treasury bills and long-term government bonds. South Africa’s well-developed and liquid financial markets allowed government to secure funding from investors to cover the budget deficit at a reasonable cost. Net issues of government bonds included net issues of inflation-linked bonds worth R23,5 billion, bringing the outstanding balance on these instruments to R244 billion as at 31 March 2013. Net redemptions to the value of R1,0 billion for RSA Government Retail Savings Bonds were recorded in fiscal 2012/13, bringing the outstanding balance on these funding instruments to R11,3 billion at the end of the fiscal year. Government introduced retail bonds not only as another source of funding, but also to encourage savings by households and small businesses.
| | |
| | | Quarterly Bulletin June 2013 |
National government financing in fiscal 2012/13
| | | | | | | | | | | | | | | | |
| R billions | | | | | | | | | | | | |
| Item or instrument | | Originally
budgeted | | | Revised
estimate1 | | | Actual | | | Actual | |
| | | 2012/13 | | | 2011/12 | |
Deficit | | | 168,4 | | | | 183,0 | | | | 122,8 | 2 | | | 135,9 | 2 |
Plus: Extraordinary payments | | | — | | | | 2,6 | | | | 2,6 | | | | 1,4 | |
Cost/Profit on revaluation of foreign debt at redemption3 | | | -2,3 | | | | -2,4 | | | | -2,4 | | | | 0,5 | |
Less: Extraordinary receipts | | | — | | | | 0,8 | | | | 1,0 | | | | 1,7 | |
Net borrowing requirement | | | 166,1 | | | | 182,4 | | | | 122,0 | | | | 136,1 | |
Treasury bills | | | 22,0 | | | | 22,0 | | | | 22,6 | | | | 18,7 | |
Domestic government bonds | | | 119,5 | | | | 135,0 | | | | 120,1 | | | | 133,8 | |
Foreign bonds and loans | | | -9,8 | | | | -9,8 | | | | -14,0 | | | | 9,6 | |
Change in available cash balances4 | | | 34,3 | | | | 35,2 | | | | -6,6 | | | | -26,1 | |
Total net financing5 | | | 166,1 | | | | 182,4 | | | | 122,0 | | | | 136,1 | |
| 2 | Cash-flow deficit. This differs from the cash-book deficit in the Budget Reviews |
| 5 | Components may not add up to totals due to rounding |
The R201 and R206 bonds were partly redeemed for R22,1 billion and R15,3 billion respectively in fiscal 2012/13. These bonds were mainly switched to bonds with longer-dated maturities ranging up to 2041. In 2012/13 domestic funding through Treasury bills was attained at an average interest rate of 5,3 per cent, whereas domestic marketable government bonds attracted an average rate of 7,9 per cent per annum. In March 2013 National Treasury redeemed the remaining balance of R27,3 billion on the R189 inflation-linked bond.13 Following these funding activities of government, the average outstanding maturity of national government’s domestic marketable bonds lengthened from 130 months as at 31 March 2012 to 146 months at the end of March 2013.
In fiscal 2012/13 net redemptions worth R14,0 billion were recorded in foreign bonds and loans. Between March 2012 and March 2013, the average outstanding maturity of foreign marketable bonds of national government decreased from 90 months to 86 months, partly due to large redemptions of foreign debt in the period under review.
National government’s overall available cash balances increased by R6,6 billion in fiscal 2012/13, bringing these balances to R212 billion as at 31 March 2013, whereas at the same time deposits with the South African Reserve Bank remained broadly unchanged at R141 billion. The cash balance as at 31 March 2013 did not reflect the redemption of the R189 bond as the transaction was only recorded on 2 April 2013, although it was budgeted for in fiscal 2012/13.
The domestic debt of national government increased significantly from R1 071 billion as at 31 March 2012 to R1 241 billion at the end of March 2013, broadly in line with initial budgetary projections. Higher issuances of Treasury bills and government bonds contributed to the rise in domestic debt levels. Government’s liabilities consisted mainly of domestic debt instruments, which accounted for about 90 per cent of its entire debt portfolio although approximately 38 per cent of such rand-denominated instruments were held by non-residents.
| | |
| Quarterly Bulletin June 2013 | | |


National government foreign debt
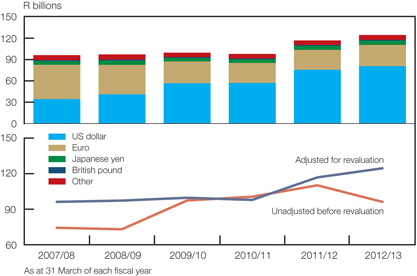
Between March 2012 and March 2013, the foreign debt of national government increased from R117 billion to R125 billion. This increase was registered despite net redemptions recorded in the same fiscal year, and was due to revaluation effects. The revaluation adjustments emanated from the weaker exchange value of the domestic currency against other major currencies. The rand value of foreign debt at historical exchange rates (exchange rates ruling at the time of issue) amounted to R96,2 billion as at 31 March 2013.
Total gross loan debt of national government
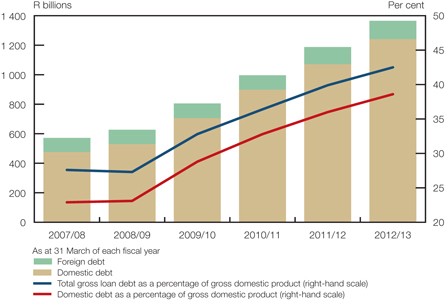
The gross loan debt of national government, consisting of domestic and foreign debt, increased from R1 188 billion to R1 366 billion between March 2012 and March 2013. Total gross loan debt was originally budgeted to amount to R1 355 billion at the end of the fiscal year. As a ratio of gross domestic product, total gross loan debt increased from 39,9 per cent to 42,5 per cent during the period under review.
| | |
| | | Quarterly Bulletin June 2013 |
Statement of the Monetary Policy Committee
20 March 2013
Issued by Gill Marcus, Governor of the South African Reserve Bank, at a meeting of the Monetary Policy Committee (MPC) in Pretoria
There are a number of key developments that this meeting of the Monetary Policy Committee (MPC) had to consider, not least among them on the domestic front the challenge of moderate growth, rising inflation, a depreciated currency, a wider current-account deficit and difficult labour relations and unemployment that remains stubbornly high.
Since the previous meeting of the MPC the domestic inflation outlook has deteriorated slightly. Risks posed by the depreciation of the rand exchange rate have overshadowed the more favourable developments, including lower electricity price increases and some moderation in food price inflation. Nevertheless, inflation is expected to remain contained within the target range apart from a temporary breach in the third quarter of 2013. The domestic economic growth prospects remain fragile amid continued tensions in the labour market, particularly in the mining sector.
The global economy is still characterised by a multispeed recovery. However, recent events in Europe, particularly as they affect Cyprus, have increased risk and uncertainty in the region, and have the potential to reignite the banking and sovereign debt crisis and undermine growth prospects further. The global outlook is also clouded by the fiscal gridlock in the United States (US) that remains unresolved.
The year-on-year inflation rate as measured by the consumer price index (CPI) for all urban areas was 5,9 per cent in February 2013, up from 5,4 per cent in January. The upside surprise in February was mainly due to the increase in medical insurance costs, which resulted in the contribution to CPI from miscellaneous goods and services increasing from 0,7 percentage points to 1,1 percentage points. This category also impacted on core inflation, which increased markedly from 4,7 per cent in January to 5,3 per cent in February. Petrol prices also contributed to the upward trend, having increased by 11,9 per cent. Food price inflation measured 6,3 per cent, down from a recent high of 7,5 per cent in November 2012, and its contribution to overall inflation declined from 1,0 percentage points to 0,9 percentage points. Administered prices increased by 8,9 per cent, and by 7,5 per cent, excluding petrol, year-on-year. The producer price inflation for final manufactured goods measured 5,8 per cent in January.1
The inflation forecast of the Bank reflects a slight deterioration in the inflation outlook for 2013 compared with the previous forecast. The forecasts incorporate the new CPI weights and rebasing announced by Statistics South Africa (Stats SA), as well as the lower electricity price increase of 8 per cent granted to Eskom by Nersa. Inflation is now expected to average 5,9 per cent in 2013 and 5,3 per cent in 2014, compared with the previous forecasts of 5,8 per cent and 5,2 per cent for these respective years. Inflation is expected to breach temporarily the upper end of the target range in the third quarter of 2013, when it is expected to average 6,3 per cent, and then to moderate gradually to 5,2 per cent in the final quarter of 2014. This deterioration is largely due to the depreciation of the rand and higher petrol prices, which more than offset the impact of the lower electricity price increases and a lower starting point.
The forecast of core inflation is more or less unchanged for 2013 but higher for 2014, yet still indicates the continued absence of significant demand pressures. This measure is expected to peak at 5,1 per cent in the second quarter of 2014, and to average 4,8 per cent and 4,9 per cent in 2013 and 2014 respectively. This forecast is likely to be adjusted upwards in the light of the increase in medical insurance costs announced earlier today.
Inflation expectations as reflected in the Reuters survey of analysts conducted in February 2013 have remained more or less unchanged since December. Expectations remained anchored within the target range. but close to the upper end, and, as with the Bank’s forecast, the peak is expected in the third quarter of 2013.
| | |
| Quarterly Bulletin June 2013 | | |


The global economic outlook presents a mixed picture following a disappointing fourth quarter in most of the advanced economies. Recent data from the US indicate positive trends in the labour market and household consumption expenditure due in part to positive wealth effects from the housing and equity markets. However, uncertainty about the possible negative impulse from fiscal tightening continues amid political differences over fiscal policy. Economic growth is still expected to remain below trend in 2013.
The outlook for some of South Africa’s other main advanced-economy trading partners is less positive. The eurozone remains in recession, and is not expected to recover before mid-2013 at the earliest. The tail risks from a sovereign debt crisis appeared to have subsided, but the uncertainty created by the inconclusive Italian general election and the crisis in Cyprus have renewed concerns about the stability of the region. The outlook for the United Kingdom economy remains subdued against the backdrop of continued fiscal austerity.
Growth prospects in the Asian economies are more positive. The Japanese economy is expected to be bolstered by positive consumer sentiment in response to fiscal and monetary stimuli, but the response on the capital expenditure side is still cautious. Nevertheless, an improved growth performance is expected, particularly given the 18 per cent depreciation of the yen against the US dollar since October 2012. Growth in China is expected to be sustained at relatively robust levels as fixed investment expenditure remains strong despite a moderation in consumption expenditure growth. Growth in other emerging markets remains positive.
These trends suggest that monetary policy in the advanced economies will remain accommodative for some time despite recent fears in the financial markets of an early reversal of quantitative easing in the US. The relatively weak growth outlook in the advanced economies has contributed to the subdued global inflation environment.
The exchange rate of the rand continues to pose the main upside risk to the inflation outlook. Since the beginning of the year, the rand has depreciated by 8,4 per cent against the US dollar and fluctuated within a range of R8,45 and R9,26. However, given the significant realignment of global currencies, and particularly the depreciation of the Japanese yen and the pound sterling against the US dollar, the trade-weighted depreciation since the beginning of the year was more moderate at 5,6 per cent.
Domestic factors contributing to the recent rand depreciation include continued work stoppages in parts of the mining sector, which also have the potential to disrupt electricity supplies, and the further widening of the deficit on the current account of the balance of payments, which measured 6,3 per cent in 2012. Some narrowing of the deficit is expected in the course of the year in response to the depreciation, although the degree of response will be constrained by weak demand from advanced economies as well as strong infrastructure-related import demands. Mining export growth will also be dependent on the resolution of labour market issues with a resumption of full production and on the extent of possible shaft closures.
Equity and bond flows to emerging economies have generally moderated in the past few months, making for a more challenging global environment for financing the deficit. Inflows into South African bond and equity markets have, however, been sustained, and year-to-date non-resident net purchases of equities and government bonds have totalled R6,1 billion and R11,3 billion respectively. These flows have, however, been volatile, and the growing proportion of bonds owned by non-residents, currently around 37 per cent of the total outstanding stock of debt, could constrain the pace of inflows.
The rand is likely to remain sensitive to both domestic and global developments. The exchange rate is expected to remain volatile and subject to overshooting, and further sustained depreciation would increase the upside risk to the inflation outlook. The Reuters Econometer survey conducted in February shows that most analysts still expect the rand to appreciate from current levels during the year, although the degree of dispersion is indicative of the uncertainty around these forecasts. According to this survey, the consensus forecast for the rand/US$ exchange rate at the end of 2013 is R8,61, with a range of forecasts between R9,19 and R7,80.
| | |
| | | Quarterly Bulletin June 2013 |
Domestic growth prospects remain relatively subdued, notwithstanding a better-than-expected fourth quarter GDP growth outcome, and positive developments in the mining and manufacturing sectors in January. The economy grew by 2,5 per cent in 2012, having recorded annualised growth of 2,1 per cent in the fourth quarter, despite a 9,3 per cent contraction in the mining sector. The moderate pace of recovery is expected to continue in 2013. The Bank’s forecast is for growth of 2,7 per cent this year, marginally up from the previous forecast of 2,6 per cent, and 3,7 per cent in 2014, compared with a previous forecast of 3,8 per cent. The risks to these forecasts are assessed to be on the downside.
The flat trajectory of the Bank’s leading indicator of economic activity is consistent with this forecast. Growth this year is therefore expected to remain below potential output growth of 3,5 per cent, and this is expected to result in a slight widening of the Bank’s revised estimate of the output gap which, at 2,0 per cent, reflects the continued subdued state of the economy.
The mining sector recorded year-on-year growth of 7,3 per cent in January, with three-month-on-three-month growth of 5,4 per cent following four consecutive months of contraction. Nevertheless, the sector is expected to remain under pressure, given the unsettled labour relations environment. The outlook for manufacturing appears to have improved, but this recovery is still very tentative. The sector grew at a year-on-year rate of 3,9 per cent in January, and by 1,8 per cent on a three-month-on-three-month basis. This was consistent with improvements in the Kagiso Purchasing Managers Index, which increased from 49,1 in January to 53,6 in February.
Growth in gross fixed capital formation, which measured 5,7 per cent in 2012, has been on a moderate upward trend since 2009, driven mainly by investment growth of around 9 per cent by public corporations and general government. Private-sector investment growth moderated from 4,6 per cent in 2011 to 3,9 per cent in 2012 due in part to excess capacity in manufacturing and electricity supply constraints.
While household consumption expenditure has been the main driver of growth since 2010, its contribution to growth has been diminishing. The general absence of demand pressures in the economy is reflected in the continued moderation in the growth in real consumption expenditure by households, which grew by 3,5 per cent in 2012 compared with 4,8 per cent in 2011. Nevertheless, growth in the consumption of durable goods remained robust at 11 per cent, compared with demand for services, which grew at only 1,8 per cent in 2012. Sales of new motor vehicles declined on both a month-on-month and on a three-month-on-three-month basis in February.
Retail trade sales in January appear to reflect this weakening trend, with a three-month-on-three-month decline of 0,7 per cent, and a lower-than-expected year-on-year increase of 1,9 per cent. There are indications that consumption growth may moderate further in 2013 amid slower real income growth, higher inflation, elevated household debt levels, and a possible slow-down in credit extension to consumers.
Twelve-month growth in banks’ total loans and advances to the private sector measured 8,9 per cent in January, following growth of 10,0 per cent in December. Loans and advances to the corporate sector grew by 7,5 per cent in January, and to the household sector by 9,9 per cent. Growth in general loans to households – mainly unsecured lending – moderated to 30,1 per cent, following a recent peak growth of 39,3 per cent in June. General loans to households amounted to 8,3 per cent of total loans and advances, and 14,6 per cent of loans and advances to household. Growth in this category of lending is likely to be constrained by lower income growth and high household debt levels. Household debt to disposable income measured 75,8 per cent in the final quarter of 2012. Non-mortgage debt as a percentage of total household debt increased from 37 per cent in the third quarter of 2009 to 46 per cent in the final quarter of 2012.
The trend in wage settlements remains an upside risk to the inflation outlook, although recent data is somewhat contradictory. The minimum wage in the agricultural sector has been increased by 52,2 per cent, and indications from the Andrew Levy Employment Publications are that wage
| | |
| Quarterly Bulletin June 2013 | | |


settlements in collective bargaining agreements picked up significantly from 6,8 per cent in the third quarter of 2012 to 8,2 per cent in the fourth quarter. According to Stats SA, average salaries and wages per worker in the non-agricultural sector increased over four quarters by 7,0 per cent in the final quarter of 2012, down from 8,9 per cent in the previous quarter, while unit labour cost increases declined from 7,4 per cent to 5,7 per cent in the same period.
The MPC remains concerned about the possible impact of excessively high wage increases on employment growth. Employment in the formal non-agricultural sector increased by 1,0 per cent during 2012, compared with annual employment growth of 1,6 per cent in 2011. This included employment growth of 0,2 per cent in the mining and quarrying industry, and a 0,3 per cent contraction in the manufacturing sector. In the fourth quarter of 2012 mining-sector employment increased by 1 000 employees, following a decline of 16 000 in the third quarter.
Of concern is the seasonally adjusted annualised decline of 0,7 per cent in total non-agricultural employment during the fourth quarter of 2012.
The recent national government budget tabled before parliament reflects a difficult balance between a commitment to medium-term fiscal consolidation and the need for counter-cyclical policy. The projected deficit of 5,7 per cent for the past fiscal year was wider than initially budgeted for – a result of lower revenue due to weaker economic growth. The fiscal deficit as a percentage of GDP is budgeted to be 5,1 per cent in the 2013/14 fiscal year, and to decline to 3,6 per cent by 2015/16. The government net debt-to-GDP ratio is expected to stabilise at around 40 per cent in 2015/16, well below the international benchmark for debt sustainability of around 60 per cent.
There are indications that the pressures on inflation emanating from food prices may be moderating. Food price inflation at the consumer price level declined from a recent high of 7,5 per cent in November 2012 to 6,4 per cent in January and 6,3 per cent in February. A similar trend is evident at the producer price level where manufactured food inflation declined to 5,9 per cent in January, compared with a recent peak of 11,1 per cent in November 2012. Similarly, producer price inflation in agricultural products moderated from a recent high of 6,3 per cent in October 2012 to 3,5 per cent in January. Global agricultural commodity prices have declined, on average, by almost 20 per cent since their recent peak in August 2012, and expectations are for further moderation in the absence of adverse weather shocks.
Administered prices continue to put upside pressure on inflation, although lower electricity price increases from the third quarter will dampen some of these pressures. The petrol price, which has increased by a cumulative R1,24 per litre since January 2013, remains an upside risk. Although global oil prices have declined over the past few weeks, resulting in an over-recovery of the petrol price so far this month, it is unlikely to be sufficient to offset the adverse exchange rate impacts and the fuel levy increases – and a further increase in the petrol price is likely in April.
The MPC continues to assess the balance of risks to the inflation outlook to be on the upside, mainly due to the exchange rate and wage pressures. These upside risks are mitigated in part by lower risk from food price inflation. Underlying inflation appears to be relatively contained, consistent with the moderating trend in consumption expenditure by households.
The economic growth outlook is more or less unchanged from the previous meeting of the MPC, and risks to the outlook remain on the downside. The unresolved labour disputes in the mining sector pose a significant risk to the exchange rate and to economic growth through their negative impact on export revenues, employment growth and investor perceptions of South Africa.
However, the depreciated exchange rate provides an opportunity for the manufacturing sector in particular to become more competitive despite the challenging export environment. Ensuring that this increase in competitiveness is sustained will require improved productivity, and the containment of wage and other cost pressures, which underline the need to keep inflation under control.
| | |
| | | Quarterly Bulletin June 2013 |
The MPC continues to assess the monetary policy stance to be appropriately accommodative, given the persistence of the negative output gap. At the same time, further accommodation remains constrained by the upside risks to the inflation outlook. The MPC has therefore decided to keep the repurchase rate unchanged at 5,0 per cent per annum. The committee will continue to apply monetary policy consistent with its mandate of price stability within a flexible inflation-targeting framework.
| | |
| Quarterly Bulletin June 2013 | | |


Statement of the Monetary Policy Committee
23 May 2013
Issued by Gill Marcus, Governor of the South African Reserve Bank, at a meeting of the Monetary Policy Committee (MPC) in Pretoria
The South African economy is facing a number of domestic challenges, while headwinds from the fragile and uneven global recovery remain a constraint to growth. The uncertain, and increasingly difficult, labour relations environment continues to dominate the economic landscape, contributing to declining domestic and foreign investor confidence. The growing vulnerability of the economy to changes in sentiment has been reflected in the depreciating and volatile exchange rate, which was already under pressure from the widening deficit on the current account of the balance of payments. Although inflation is forecast to remain relatively contained, these factors have raised the upside risks to the outlook at a time of worsening real growth prospects.
The year-on-year inflation rate as measured by the consumer price index (CPI) for all urban areas was 5,9 per cent in April 2013, unchanged from the previous two months. However, the drivers of the overall rate changed somewhat. Food price inflation measured 6,3 per cent in April, reversing the downward trend that had prevailed since November 2012. The contribution of food to overall inflation remained unchanged at 0,9 percentage points, while housing and utilities contributed 1,4 percentage points. Administered prices increased by 8,9 per cent, and by 7,8 per cent excluding petrol. Core inflation, which excludes food, petrol and electricity, measured 5,2 per cent – marginally up from 5,1 per cent in March. The headline producer price inflation for final manufactured goods measured 5,7 per cent in March – up from 5,4 per cent in February.
The inflation forecast of the Bank has remained relatively unchanged since the previous meeting of the MPC. Inflation is now expected to average 0,1 percentage points lower in 2013 and 2014 at 5,8 per cent and 5,2 per cent respectively, and to average 5,0 per cent in 2015. A temporary breach of the upper end of the target range is still expected in the third quarter of 2013, but at a lower average level of 6,1 per cent (6,3 per cent previously), followed by a gradual moderation of inflation to 4,9 per cent in the final quarter of 2015. The slight improvement is due to changed assumptions about international commodity prices, including oil, and lower global inflation.
The forecast for core inflation for 2013, at an average of 5,3 per cent, is significantly higher than the forecast of 4,8 per cent previously. This follows the sharp increase in medical insurance costs in the February CPI. Core inflation is also expected to be adversely affected over the coming months by increases in a number of other administered prices, particularly water and municipal rates and taxes. This measure is expected to peak at 5,4 per cent in both the third and fourth quarter of 2013, and to average 5,0 per cent and 4,6 per cent in the coming two years. Despite the higher near-term trend, this indicator is still assessed to reflect an absence of significant demand pressures.
Inflation expectations, as reflected in the Reuters survey of analysts conducted in April, has remained relatively stable for some months. The forecast is the same as the Bank’s for 2013, although higher for the next two years but still within the target range. The relatively anchored inflation expectations at the upper end of the target range are also evident in the survey conducted by the Bureau for Economic Research (BER) at Stellenbosch University in the first quarter of 2013. Overall, respondents expect inflation to average 6,0 per cent in both 2013 and 2014, and 6,1 per cent in 2015.
The global economic environment remains challenging, with different regions growing at varying rates. Within the advanced economies, the United States (US) appears to be showing a number of positive signs of recovery: the University of Michigan’s consumer confidence index is at its highest in almost six years; labour market developments have been more favourable; and there are strong wealth effects from the booming equity market as well as from the recovering housing market. However, headwinds can be expected from the fiscal contraction resulting from the fiscal cliff compromise and the spending cuts that were part of the recent sequester. The impact of this contraction is expected to be as high as 2 percentage points of GDP.
| | |
| | | Quarterly Bulletin June 2013 |
The eurozone remains in recession, having contracted at an annualised rate of 0,9 per cent in the first quarter of 2013, compared with a contraction of 2,7 per cent in the previous quarter. The French economy has recorded two consecutive quarters of negative growth, while Germany managed to avoid recession by recording annualised growth of 0,3 per cent in the first quarter of this year. The eurozone is constrained by continued deleveraging by households, banks and governments, and the region is also characterised by increasing financial fragmentation. Although a slower pace of fiscal consolidation in the periphery has been agreed to in terms of the bail-out agreements, negative or, at best, very low growth is expected to persist in the region for some time.
The Japanese economy rebounded from its 2012 recession in the first quarter of 2013, but it is still too soon to assess the impact of the fiscal, monetary and structural policy stimulus packages that were announced recently. The yen exchange rate, which has depreciated by around 30 per cent against the US dollar since October 2012, is likely to contribute positively to growth.
Emerging markets remain the main global source of growth, but there are signs of moderation in some of the systemically important countries, particularly China, India and Brazil. The rebalancing of the Chinese economy away from fixed capital formation and production towards internal consumption has resulted in some slowdown, which has contributed to the declining trend of global commodity prices.
The persistence of slow global growth and weaker commodity prices have resulted in a moderation in global inflation. This is particularly the case with respect to energy prices in the advanced economies. This combination of lower inflation and slow growth prompted further monetary easing by the European Central Bank, and with Japan yet to begin with its quantitative monetary easing, these accommodative policy stances are likely to persist for some time. While there are concerns about the possible risks posed to financial markets and global capital flows by an early reversal of the US monetary policy stance, any such action is likely to be extremely cautious, and is only expected to begin once a sustained recovery is well entrenched. There are, however, growing concerns that the buoyant conditions in the financial markets in many countries are indicative of bubbles caused by excessive global liquidity, rather than reflecting underlying positive growth prospects.
Movements in the exchange rate of the rand continue to be impacted by external developments, but since mid-2012 they have been compounded by domestic factors, which have undermined investor sentiment. The increasingly fraught labour relations environment, and high wage demands in the mining sector in particular, are likely to continue to impact adversely on the volume of mining exports against a backdrop of falling international commodity prices and concerns about the widening of the current-account deficit of the balance of payments. These developments also have the potential to affect, directly and indirectly, South Africa’s credit ratings, and increase the cost of much-needed finance. The rand has also been influenced in recent weeks by the hedging related to renewable energy projects and by a strengthening dollar. Since the previous meeting of the MPC, the rand has depreciated by around 4,6 per cent against the US dollar and by 3,7 per cent on a trade-weighted basis.
Despite the current negative sentiment towards the rand, non-residents have remained net buyers of bonds and equities this year. Since January, non-residents have been net buyers of equities to the value of R12,7 billion, and bonds to the value of R22,5 billion. However, these positive inflows can reverse very quickly in response to changing risk perceptions. Furthermore, any hedging of these exposures, as is sometimes the case during periods of rand weakness, puts pressure on the rand even though the underlying assets are still held by non-residents.
As we have noted previously, the impact of the weaker rand on inflation is dependent on the extent, speed and duration of the depreciation, as well as the phase of the business cycle. While some of the recent decline reflects changes in the underlying fundamentals, the rand remains highly vulnerable to changes in sentiment. The rand has a tendency to overshoot in either direction and, at times, for extended but uncertain periods, which makes the impact on inflation difficult to forecast. The current level of the exchange rate, if sustained, poses a significant upside risk to the inflation outlook.
| | |
| Quarterly Bulletin June 2013 | | |


Domestic growth prospects remain fragile amid low consumer confidence, continued output disruptions in the mining sector, electricity supply constraints and a weak global environment. The growth forecast of the Bank has been revised down from 2,7 per cent to 2,4 per cent for 2013 and from 3,7 per cent to 3,5 per cent in 2014. Growth is expected to accelerate to 3,8 per cent in 2015. At these growth rates, the negative output gap will widen further before stabilising next year, and begin to close during 2015. This outlook is consistent with the flat trajectory of the Bank’s leading indicator of economic activity. Notwithstanding the increase in the Rand Merchant Bank/BER Business Confidence Index in the first quarter of 2013, given the difficult labour relations environment in the country and the risks to global growth, the downside risk to growth remains as does the possibility of increased job losses.
Although the physical volume of mining production recorded a quarter-to-quarter increase of 6,1 per cent in the first quarter of 2013 following the disruptions in the previous quarter, output contracted on a month-to-month basis in both February and March. The outlook for the sector remains bleak, with threats of shaft closures and retrenchments, falling commodity prices, high wage demands, and a risk of protracted periods of industrial action and further supply disruptions.
Manufacturing production declined in the first quarter of 2013 compared with the previous quarter, although the extent of the decline is complicated by the seasonal adjustment for the Easter weekend, which fell over March and April. The Kagiso Purchasing Managers Index, which increased marginally above the neutral 50 level in April, reflects the uncertain outlook for the sector. The depreciated value of the rand should improve the competitiveness of the sector, provided that gains are not eroded by rising wages and prices. The weaker rand is expected to result in some narrowing of the trade deficit. However, the subdued global demand, together with robust import volume growth, driven to a large extent by infrastructure projects, suggests that the net export position will remain negative over the forecast period and continue to be a constraint on growth. Nevertheless, the BER Manufacturing Confidence Index, while still low, improved somewhat in the first quarter.
The outlook for household consumption expenditure – in recent years the main driver of growth – appears to have weakened with the FNB/BER Consumer Confidence Index declining to a nine-year low in the first quarter of 2013. Retail sales grew at a modest quarter-to-quarter rate of 0,6 per cent in the first quarter of this year, while sales contracted on a month-to-month basis in March. This was consistent with the decline in the BER Retail Confidence Index in the first quarter. New vehicle sales growth, while increasing significantly on a year-on-year basis, moderated to 0,1 per cent on a three-month-to-three-month basis in April 2013.
Consumption expenditure by households is expected to be constrained in part by lower real income growth, significant increases in the price of electricity and petrol, and high debt levels. The slowdown in expenditure growth has also been related to the moderation in some categories of credit extension by banks. Year-on-year growth in total loans and advances to the private sector moderated steadily from a recent peak of 10 per cent in December, to 8,1 percent in March 2013. Excluding the weak growth in mortgage advances, year-on-year growth in loans and advances declined from 18,5 per cent in December 2012 to 14,5 per cent in March. Although growth in unsecured lending to households remains at high levels, it has declined continuously since September 2012, to measure 27,9 per cent in March. This moderating trend is expected to continue, due in part to the increasing number of impaired advances in this category of lending at some of the banks. However, the ratio of total impaired advances to total loans and advances in the banking sector continues to decline and stands at just below 4 per cent.
A number of sectors in the economy are entering into wage-bargaining rounds. The MPC is increasingly concerned about the prospect of settlements well above inflation and productivity growth, and the risk of protracted and disruptive strike action, with negative implications for growth and exports. Furthermore, excessively high settlements will come at the expense of retention of employees, employment creation and could result in higher inflation. The risk of a wage-price spiral remains high. This would negate the benefits of wage increases to workers, and undermine the competitive gains of the currency depreciation. According to Andrew Levy Employment Publications, the overall wage settlement rate in collective bargaining agreements increased from 7,6 per cent in 2012 to 7,9 per cent in the first quarter of 2013. Should this upward momentum continue, it is likely to impart an upside risk to inflation. At a time of high and rising unemployment, and slowing growth, the imperative of an economy-wide commitment to wage and salary restraint at all levels, including executive pay, cannot be over-emphasised.
| | |
| | | Quarterly Bulletin June 2013 |
International oil prices are expected to remain constrained by the subdued global growth environment, but vulnerable to political developments in the Middle East in particular. Having reached a recent high of around US$118 per barrel in mid-February of this year, Brent crude oil prices have remained in a range of between US$97 and US$105 per barrel since April. The domestic price of petrol increased by 12 cents in April, but declined by 73 cents in May, mainly as a result of lower international oil prices. Although there is currently a small average over-recovery on the petrol price, recent exchange rate movements have raised the probability of further petrol price increases in the near term.
The higher CPI food price increases in April may have reversed the favourable food price developments observed in recent months. Since the end of November 2012 to date, domestic maize prices have declined by about 17 per cent and wheat prices by around 9 per cent. This is reflected in the producer price index for agriculture which increased at a year-on-year rate of 1,4 per cent in February and declined by 0,2 per cent in March. Manufactured food prices, by contrast, increased by 6,1 per cent and 6,3 per cent in the same months respectively, in line with CPI food price increases. The exchange rate poses an upside risk to food inflation as the prices of agricultural commodities such as wheat and maize are based on international prices.
The MPC is increasingly concerned about the deteriorating outlook for the South African economy. There are a number of critical domestic issues that are contributing to the vulnerability of the economy that need to be addressed. urgently These include the financing of the deficit on the current account of the balance of payments; the fractious labour relations environment and the associated risks of protracted work stoppages and excessive wage increases; electricity supply constraints; upside risks to inflation; downside risks to growth and employment creation in a context of high unemployment; and declining domestic and foreign investor confidence which could impact directly on capital flows. These interrelated developments are reflected in the volatility and weakness in the exchange rate. There is an urgent imperative for all parties – government, business, labour and civil society – to interact and address these issues and vulnerabilities at a national level. While the Bank is prepared to play its part, many of these challenges are beyond the role, scope and effectiveness of monetary policy.
While a depreciated exchange rate is part of the balance-of-payments adjustment mechanism, the competitive advantages thereof need to be realised through price and wage restraint. In the absence of such restraint, the outcome is simply higher inflation, with the risk of an exchange rate–inflation spiral. Given the current unsettled environment in the economy, the MPC assesses the risks to inflation to be on the up side, while many of the above factors contribute to a downside risk to growth.
The MPC assesses the current stance of monetary policy to be accommodative. Given the risks outlined above, the scope for further monetary easing is limited at this stage. The MPC has therefore decided to leave the repurchase rate unchanged at 5 per cent per annum. The MPC is ready to act appropriately in either direction in the event of material changes in the outlook.
| | |
| Quarterly Bulletin June 2013 | | |


Note on the flow of funds in South Africa’s national financial account for the year 2012
by C Monyela and Z Nhleko1
Introduction
The flow of funds in the domestic economy expanded in 2012 and was supplemented by large inflows from the foreign sector, as renewed interest in emerging markets’ debt securities surfaced among global investors.
This note analyses the movement of funds across surplus and deficit sectors that participated in the South African economy, in pursuit of their investment and financing interests during 2012. Investment and financing behaviour was influenced by broader macroeconomic conditions, the regulatory environment, and the risk-return profiles of the various financial instruments. The quarterly accounts for 2012 are attached to this note, whereas the annual summary account is presented on pages S–46 to S–47 of this issue of the Quarterly Bulletin.
Sectoral financing balances
The financing balances in Table 1 reveal that South Africa’s reliance on the foreign sector for funding deepened in 2012, as the combined domestic sectors’ deficit position widened to R197 billion from R98 billion a year earlier. Non-residents augmented domestic saving by 32 per cent. The general government sector was the largest borrower of funds, with a financing shortfall of R194 billion in 2012. Public business enterprises also recorded a financing deficit position, as the broader public sector attempted to discharge its mandate of providing socioeconomic infrastructure and social security against the backdrop of high unemployment. Private corporate business enterprises played a key role, both as a saver and real economy investor. Their savings accounted for 50 per cent of the total amount recorded by the country and their gross capital formation represented 49 per cent of the total. With gross saving of R71 billion exceeding gross capital formation of R61 billion, the household sector also recorded a surplus position in 2012, albeit smaller than in 2011.
Table 1 Financing balances, 1, 2 2011 and 2012
R millions Surplus units (+)/deficit units (-)
| | | | | | | | | | | | | | | | | | | | | | | | |
| | | 2011 | | | 2012 | |
| | | Gross
saving | | | Gross
capital
formation | | | Net lending
(+)/net
borrowing (-) | | | Gross
saving | | | Gross
capital
formation | | | Net lending
(+)/net
borrowing (-) | |
Foreign sector3 | | | 98 544 | | | | — | | | | 98 544 | | | | 197 356 | | | | — | | | | 197 356 | |
Financial intermediaries | | | 88 968 | | | | 18 443 | | | | 70 525 | | | | 85 295 | | | | 16 767 | | | | 68 528 | |
General government | | | -76 896 | | | | 87 160 | | | | -164 056 | | | | -95 650 | | | | 98 519 | | | | -194 169 | |
Non-financial business enterprises | | | | | | | | | | | | | | | | | | | | | | | | |
Public | | | 187 699 | | | | 143 936 | | | | 43 763 | | | | 48 494 | | | | 133 907 | | | | -85 413 | |
Private | | | 194 348 | | | | 261 608 | | | | -67 260 | | | | 305 626 | | | | 302 489 | | | | 3 137 | |
Households4 | | | 76 212 | | | | 57 728 | | | | 18 484 | | | | 71 430 | | | | 60 869 | | | | 10 561 | |
| | | | | | | | | | | | | | | | | | | | | | | | |
Total | | | 568 875 | | | | 568 875 | | | | — | | | | 612 551 | | | | 612 551 | | | | — | |
| | | | | | | | | | | | | | | | | | | | | | | | |
| 1. | Gross saving plus net capital transfers less gross capital formation. Gross capital formation consists of fixed capital formation and changes in inventories, before providing for consumption (depreciation) of fixed capital. |
| 2. | A positive amount reflects a net lending position and, by implication, the net acquisition of financial assets, whereas a negative amount reflects a net borrowing position and, by implication, the net incurrence of financial liabilities. |
| 3. | A positive amount reflects a surplus for the rest of the world and is therefore a deficit on South Africa’s current account. A negative amount would represent a deficit for the rest of the world and a surplus on South Africa’s current account. |
| 4. | Including unincorporated business enterprises and non-profit institutions serving households. |
| | |
| | | Quarterly Bulletin June 2013 |
The inter-sectoral diagram below provides a synopsis of the financial inter-linkages across the main sectors that participate in the economy. The largest recipients of non-residents’ funds in 2012 were non-financial business enterprises and the general government sectors, which received R116 billion and R84 billion respectively. The non-financial business enterprises sector then extended R98 billion to the general government sector, thereby enabling the latter to fund its net borrowing position of R194 billion. Along with its net lending position of R69 billion, the financial intermediaries sector extended R66 billion to the non-financial business enterprises.
Figure 1 Net inter-sectoral flows of funds, 2012
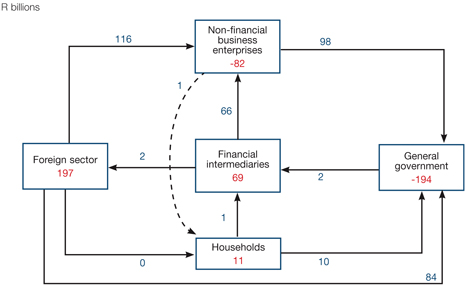
| Note: | Numbers may not balance perfectly due to rounding. The numbers inside the boxes represent the net lending (+) or borrowing (-) positions of the sectors, and those outside the boxes illustrate inter-sectoral flow of funds and the direction of flows. To calculate the net lending or borrowing position of each sector, inflows are treated as negatives and outflows as positives |
Sectoral analysis
The use of suitable financial instruments by each sector to defray financing shortfalls and investment needs in 2012 is briefly discussed below.
Foreign sector
Funding from non-residents continued to play a key role during 2012, as they continued to show appetite to acquire financial instruments issued by the domestic economy. This was against the backdrop of sovereign debt credit rating downgrades and benign domestic economic growth level. Non-resident units financed the domestic economy mainly through buying long-term government bonds, their appetite raised by the inclusion of the South African government bonds in the Citi World Government Bond Index; the relatively high yield on those bonds; and the generally sound fiscal stance. Inflows into long-term government bonds amounted to R91 billion in 2012. The foreign sector’s acquisition of domestic equity instruments was muted in 2012.
A marked interest in foreign equities was shown by local insurers and pension funds, banks and other financial institutions as they continued to take advantage of the changes in capital control regulations. Figure 2 depicts the cross-border flows for bonds and equities.
| | |
| Quarterly Bulletin June 2013 | | |


Figure 2 Cross-border flows: Bonds and equities
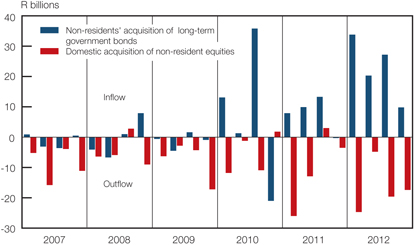
Financial intermediaries
During 2012, financial intermediaries received funds amounting to R213 billion from deposits and R90 billion from interest in retirement and life funds. In turn, financial intermediaries extended funding to various sectors through loans and purchases of equity and debt securities. Of the R266 billion loans extended, households received R94 billion in bank loans and advances, and R25 billion in mortgage loans. Private corporate businesses also received a sizeable amount of loans, which helped to finance their shortfall. While interest rates remained low in 2012, mortgage lending continued to weaken as potential property buyers remained off the market. Although credit extension by monetary institutions picked up from the level recorded in 2011, it was still quite low, consistent with the lustreless economic activity. Meanwhile non-bank financial intermediaries2 acquired equities of R227 billion and long-term government bonds of R67 billion during the review period, in line with their long-term asset-liability maturity matching. Figure 3 shows how, over the past three years, economic agents gradually returned to loans as a preferred intermediation tool.
Figure 3 Financial intermediation by type of instrument
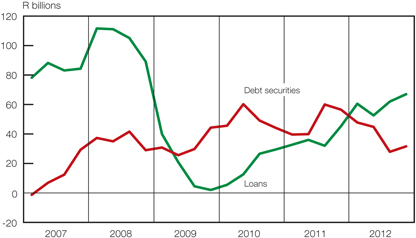
General government
The general government sector’s financing shortfall widened to R194 billion in 2012 from R164 billion in 2011, as the tax base remained constrained by softer economic conditions.
| | |
| | | Quarterly Bulletin June 2013 |
This larger deficit was registered as both capital and current expenditure obligations increased. Government decided to source the bulk of its funds in the domestic debt market. The sector’s 2012 financing requirement amounted to 6 per cent of gross domestic product. A total amount of R157 billion was raised in the domestic market through bond and Treasury bill issuance. Non-bank financial intermediaries, notably insurers and pension funds, and non-residents bought most of the government paper issued. Figure 4 shows the cumulative sum of government funding.
Figure 4 Government funding
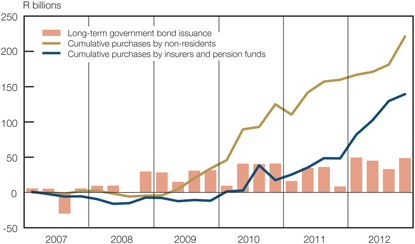
Corporate business enterprises
Corporate business enterprises’ financial transactions accounted for a large proportion of the total flows in 2012. They continued to contribute significantly to the country’s gross capital formation, spending an amount of R436 billion during the review period. This represented a share of 71 per cent of the total gross capital formation and 14 per cent of gross domestic product. Of this amount, public businesses contributed R134 billion and private businesses added R302 billion. As a result of this continued pace of investment in capital goods amid lacklustre economic activity, the corporate businesses collectively incurred a financing deficit for the second consecutive year in 2012. Figure 5 shows the evolution in these sectors’ financial positions.
Figure 5 Corporate business enterprises’ financial positions

| | |
| Quarterly Bulletin June 2013 | | |


Public business enterprises recorded a financial deficit in 2012 as their capital spending commitments required some borrowing amid insufficient retained earnings. To finance the shortfall, public businesses used cash and deposits, raised R19 billion by issuing debt securities, and obtained R31 billion in loans. Their private business counterparts continued to report retained earnings that were more than adequate to cover capital spending needs, leaving them with a small surplus of R3 billion. They also raised funds through equity issues and loans, taking advantage of the current bull market and low interest rates.
Households
In 2012 households realised a financing surplus of R11 billion, which was lower than the amount recorded a year earlier. Along with these surplus funds, households were able to increase both their discretionary and contractual savings. An amount of R72 billion was saved through the banks and other financial institutions, while R71 billion was added to interest in retirement and life funds. During the same period, households took up loans amounting to R125 billion, which comprised mainly bank loans and advances. The extension of mortgage loans to households was still low by historical levels and was both a cause and affect of the subdued market in fixed property. Figure 6 depicts the cumulative sum of selected household flows.
Figure 6 Cumulative sum of selected household flows
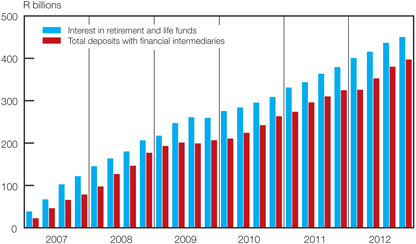
Summary and conclusion
The analysis of flow of funds in 2012 revealed that the economy’s capital market remained lively, while the real side of the economy operated below capacity. The highlights of the analysis are as follows:
| | • | | Gross capital formation continued, led by corporate business enterprises |
| | • | | The financial shortfall in the domestic economy widened but was readily financed by the foreign sector |
| | • | | Bank loans and advances recovered, albeit still remaining far below previous highs, while lending remained sluggish |
| | • | | The household sector recorded a surplus position, increasing its cash and deposits, and its interest in retirement and life funds |
| | • | | The general government sector’s deficit position widened further. |
| | |
| | | Quarterly Bulletin June 2013 |
Bibliography
Nhleko, Z and Meyer, D H. “Note on Flow of Funds in South Africa’s National Financial Accounts for the Year 2005”. Quarterly Bulletin, 139. Pretoria: South African Reserve Bank, March 2007: 67–76.
Nhleko, Z and Monyela, C. “Note on Flow of Funds in South Africa’s National Financial Accounts for the Year 2009”. Quarterly Bulletin, 256. Pretoria: South African Reserve Bank, June 2010: 67–83.
South African Reserve Bank. Quarterly Bulletin, various issues.
| | |
| Quarterly Bulletin June 2013 | | |
National financial account
Flow of funds for the first quarter 20121
| | | | | | | | | | | | | | | | | | | | | | | | | | | | | | | | | | | | | | | | | | | | | | | | | | |
| R millions | | | | |
| | | Sectors | | | | | | | | Financial intermediaries | |
| | | | | Foreign
sector | | | Monetary
authority | | | Other monetary
institutions2 | | | Public
Investment
Corporation3 | | | Insurers and
retirement
funds | | | Other
financial
institutions | |
| Transaction items | | S | | | U | | | S | | | U | | | S | | | U | | | S | | | U | | | S | | | U | | | S | | | U | |
| 1. | | Net saving4 | | | 43 206 | | | | | | | | 694 | | | | | | | | 4 161 | | | | | | | | | | | | | | | | -767 | | | | | | | | 4 767 | | | | | |
| 2. | | Consumption of fixed capital4 | | | | | | | | | | | 9 | | | | | | | | 2 330 | | | | | | | | | | | | | | | | 67 | | | | | | | | 96 | | | | | |
| 3. | | Capital transfers | | | 36 | | | | 94 | | | | | | | | | | | | | | | | | | | | | | | | | | | | | | | | | | | | | | | | | |
| 4. | | Gross capital formation4 | | | | | | | | | | | | | | | 50 | | | | | | | | 2 277 | | | | | | | | | | | | | | | | 141 | | | | | | | | 251 | |
| 5. | | Net lending (+)/net borrowing (-) (S) | | | 43 148 | | | | | | | | 653 | | | | | | | | 4 214 | | | | | | | | | | | | | | | | -841 | | | | | | | | 4 612 | | | | | |
| 6. | | Net financial investment (+) or (-) (U) | | | | | | | 43 148 | | | | | | | | 653 | | | | | | | | 4 214 | | | | | | | | | | | | | | | | -841 | | | | | | | | 4 612 | |
| 7. | | Net incurrence of financial liabilities (Total S 9 – 32) | | | 11 717 | | | | | | | | -8208 | | | | | | | | 49 012 | | | | | | | | 23 671 | | | | | | | | 64 653 | | | | | | | | -15 252 | | | | | |
| 8. | | Net acquisition of financial assets (Total U 9 – 32) | | | | | | | 54 865 | | | | | | | | -7 555 | | | | | | | | 53 226 | | | | | | | | 23 671 | | | | | | | | 63 812 | | | | | | | | -10 640 | |
| 9. | | Gold and other foreign reserves | | | 7 671 | | | | | | | | | | | | 7 671 | | | | | | | | | | | | | | | | | | | | | | | | | | | | | | | | | |
| 10. | | Cash and demand monetary deposits5 | | | | | | | -4 340 | | | | 11616 | | | | 1 101 | | | | 4 979 | | | | -4 777 | | | | | | | | -1 461 | | | | | | | | 529 | | | | | | | | -2 269 | |
| 11. | | Short/medium-term monetary deposits5 | | | | | | | 43 | | | | 54 | | | | 655 | | | | 1 895 | | | | | | | | | | | | -6 331 | | | | | | | | 5 921 | | | | | | | | -16 876 | |
| 12. | | Long-term monetary deposits5 | | | | | | | 844 | | | | -1251 | | | | 1 927 | | | | -29 356 | | | | | | | | | | | | 2 074 | | | | | | | | -1 499 | | | | | | | | -37 891 | |
| 13. | | Deposits with other financial institutions | | | 681 | | | | 11 | | | | | | | | | | | | | | | | 4 707 | | | | | | | | -1 442 | | | | | | | | 498 | | | | -2 249 | | | | 681 | |
| 14. | | Deposits with other institutions | | | -29 288 | | | | | | | | | | | | | | | | | | | | -33 759 | | | | 23 671 | | | | 5 366 | | | | 5 366 | | | | 20 952 | | | | | | | | 2 699 | |
| 15. | | Treasury bills | | | | | | | | | | | | | | | 285 | | | | | | | | -1 803 | | | | | | | | | | | | | | | | 285 | | | | | | | | -887 | |
| 16. | | Other bills | | | -12 440 | | | | | | | | -389 | | | | -8038 | | | | 1 466 | | | | -3 796 | | | | | | | | -1 432 | | | | | | | | 651 | | | | 1 802 | | | | -16 122 | |
| 17. | | Bank loans and advances | | | 8 900 | | | | | | | | -272 | | | | 5 465 | | | | 5 376 | | | | 80 349 | | | | | | | | | | | | 79 | | | | | | | | 15 460 | | | | | |
| 18. | | Trade credit and short-term loans | | | 2 687 | | | | 33 632 | | | | -1066 | | | | -3 | | | | 32 411 | | | | 4 874 | | | | | | | | | | | | 9 900 | | | | 600 | | | | -3 537 | | | | 6 952 | |
| 19. | | Short-term government bonds | | | | | | | | | | | | | | | -31 | | | | | | | | 7 643 | | | | | | | | -1 079 | | | | | | | | -22 502 | | | | | | | | 13 464 | |
| 20. | | Long-term government bonds | | | | | | | 33 846 | | | | | | | | | | | | | | | | 578 | | | | | | | | 5 039 | | | | | | | | 6 978 | | | | | | | | 1 952 | |
| 21. | | Non-marketable government bonds6 | | | | | | | -320 | | | | | | | | 358 | | | | | | | | | | | | | | | | 1 | | | | | | | | | | | | | | | | | |
| 22. | | Securities of local governments | | | | | | | | | | | | | | | | | | | | | | | -2 | | | | | | | | -4 | | | | | | | | -624 | | | | | | | | -265 | |
| 23. | | Securities of public enterprises | | | 412 | | | | 145 | | | | -3 439 | | | | | | | | | | | | -4 242 | | | | | | | | 1 903 | | | | | | | | 4 432 | | | | 2 056 | | | | 625 | |
| 24. | | Other loan stock and preference shares | | | 4 926 | | | | 2 947 | | | | | | | | | | | | 999 | | | | -4 309 | | | | | | | | 1 336 | | | | 77 | | | | -1 477 | | | | 138 | | | | 7 527 | |
| 25. | | Ordinary shares | | | 24 715 | | | | 2 693 | | | | | | | | | | | | 6 214 | | | | 15 202 | | | | | | | | 7 555 | | | | 38 | | | | 41 525 | | | | | | | | 30 743 | |
| 26. | | Foreign branch/head office balances | | | | | | | | | | | | | | | | | | | | | | | | | | | | | | | | | | | | | | | | | | | | | | | | |
| 27. | | Long-term loans | | | 1 006 | | | | -18 500 | | | | -11 300 | | | | -5 | | | | -10 801 | | | | | | | | | | | | | | | | 28 | | | | 4 331 | | | | 5 196 | | | | -4 832 | |
| 28. | | Mortgage loans | | | -527 | | | | | | | | | | | | | | | | | | | | 1 265 | | | | | | | | | | | | | | | | 269 | | | | -1 027 | | | | 1 159 | |
| 29. | | Interest in retirement and life funds7 | | | | | | | 419 | | | | | | | | | | | | | | | | 86 | | | | | | | | | | | | 24 818 | | | | | | | | | | | | | |
| 30. | | Amounts receivable/payable | | | 8 490 | | | | -1 467 | | | | 5 035 | | | | -3744 | | | | 7 579 | | | | 12 630 | | | | | | | | 12 146 | | | | 12 453 | | | | -1 313 | | | | -17 341 | | | | 2 736 | |
| 31. | | Other assets/liabilities | | | -5 516 | | | | 4 912 | | | | -7 196 | | | | -13196 | | | | 28 188 | | | | -21 315 | | | | | | | | | | | | 11 671 | | | | 3 942 | | | | -15 563 | | | | -55 | |
| 32. | | Balancing item | | | | | | | | | | | | | | | | | | | 62 | | | | -105 | | | | | | | | | | | | 223 | | | | 314 | | | | -187 | | | | 19 | |
S = Sources, i.e.,net increase in liabilities at transaction value.
U = Uses, . i.e., net increase in assets at transaction value.
KB230
| 1. | A negative amount reflects a decrease in that item. In the case of liabilities (sources) it denotes a reduction in the available sources of funds and in the case of assets (uses) it indicates an additional source of funds. |
| 2. | Including mutual banks and the Postbank. |
| 3. | Before April 2005 the Public Investment Commissioners. |
| 4. | As taken from the national income (and production) accounts. |
| 5. | Namely deposits with the South African Reserve Bank (including coin liabilities), Corporation for Public Deposits, banks, the Land Bank, mutual banks and the Postbank. |
| 6. | Non-marketable bonds and other Treasury bills. |
| 7. | Members’ interest in the reserves of retirement and all insurance funds. |
| | | | |
| 82 | | | | Quarterly Bulletin June 2013 |
National financial account (continued)
Flow of funds for the first quarter 20121
| | | | | | | | | | | | | | | | | | | | | | | | | | | | | | | | | | | | | | | | | | | | | | | | | | | | |
| R millions |
| General government | | | Corporate business enterprises | | | | | | | | | | | | | | | | | | Sectors |
Central
and
provincial
governments | | | Local
governments | | | Public
sector | | | Private
sector | | | Households,
etc. | | | Total | | | | | | |
| S | | | U | | | S | | | U | | | S | | | U | | | S | | | U | | | S | | | U | | | S | | | U | | | Transaction items |
| | -1 014 | | | | | | | | -18 200 | | | | | | | | 525 | | | | | | | | 26 054 | | | | | | | | -20 523 | | | | | | | | 38 903 | | | | | | | | 1. | | | Net saving4 |
| | 8 164 | | | | | | | | 5 861 | | | | | | | | 9 435 | | | | | | | | 59 649 | | | | | | | | 13 006 | | | | | | | | 98 617 | | | | | | | | 2. | | | Consumption of fixed capital4 |
| | | | | 9 264 | | | | 3 655 | | | | | | | | 157 | | | | | | | | 118 | | | | 13 | | | | 5 428 | | | | 23 | | | | 9 394 | | | | 9 394 | | | | 3. | | | Capital transfers |
| | | | | 11 742 | | | | | | | | 11 134 | | | | | | | | 31 180 | | | | | | | | 65 740 | | | | | | | | 15 005 | | | | | | | | 137 520 | | | | 4. | | | Gross capital formation4 |
| | -13 856 | | | | | | | | -19 818 | | | | | | | | -21 063 | | | | | | | | 21 124 | | | | | | | | -18 173 | | | | | | | | — | | | | | | | | 5. | | | Net lending (+)/net borrowing (-) (S) |
| | | | | -13 856 | | | | | | | | -19 818 | | | | | | | | -21 063 | | | | | | | | 21 124 | | | | | | | | -18 173 | | | | | | | | — | | | | 6. | | | Net financial investment (+) or (-) (U) |
| | 29 670 | | | | | | | | 21 062 | | | | | | | | 18 442 | | | | | | | | 99 548 | | | | | | | | 34 360 | | | | | | | | 328 675 | | | | | | | | 7. | | | Net incurrence of financial liabilities (Total S 9 – 32) |
| | | | | 15 814 | | | | | | | | 1 244 | | | | | | | | -2 621 | | | | | | | | 120 672 | | | | | | | | 16 187 | | | | | | | | 328 675 | | | | 8. | | | Net acquisition of financial assets (Total U 9 – 32) |
| | | | | | | | | | | | | | | | | | | | | | | | | | | | | | | | | | | | | | | | | 7 671 | | | | 7 671 | | | | 9. | | | Gold and other foreign reserves |
| | | | | 7 838 | | | | | | | | 2 153 | | | | | | | | 2 816 | | | | | | | | 22 031 | | | | | | | | -7 026 | | | | 16 595 | | | | 16 595 | | | | 10. | | | Cash and demand monetary deposits5 |
| | | | | 17 590 | | | | | | | | 4 603 | | | | | | | | -11 678 | | | | | | | | -5 533 | | | | | | | | 13 555 | | | | 1 949 | | | | 1 949 | | | | 11. | | | Short/medium-term monetary deposits5 |
| | | | | -937 | | | | | | | | 154 | | | | | | | | 3 037 | | | | | | | | 610 | | | | | | | | 1 074 | | | | -30 607 | | | | -30 607 | | | | 12. | | | Long-term monetary deposits5 |
| | | | | | | | | | | | | -3 | | | | -157 | | | | 800 | | | | | | | | -286 | | | | | | | | -6 691 | | | | -1 725 | | | | -1 725 | | | | 13. | | | Deposits with other financial institutions |
| | | | | 2 863 | | | | | | | | | | | | | | | | | | | | 257 | | | | 1 554 | | | | | | | | 331 | | | | 6 | | | | 6 | | | | 14. | | | Deposits with other institutions |
| | -5 379 | | | | | | | | | | | | | | | | | | | | | | | | | | | | -3 259 | | | | | | | | | | | | -5 379 | | | | -5 379 | | | | 15. | | | Treasury bills |
| | | | | 173 | | | | | | | | | | | | -1 537 | | | | -2 686 | | | | -11 703 | | | | 8 449 | | | | | | | | | | | | -22 801 | | | | -22 801 | | | | 16. | | | Other bills |
| | 1 399 | | | | | | | | -1 446 | | | | | | | | 2 435 | | | | | | | | 35 183 | | | | | | | | 18 700 | | | | | | | | 85 814 | | | | 85 814 | | | | 17. | | | Bank loans and advances |
| | | | | -1 212 | | | | -1 246 | | | | -5 567 | | | | 506 | | | | 2 069 | | | | 25 833 | | | | 19 109 | | | | -1 867 | | | | 3 167 | | | | 63 621 | | | | 63 621 | | | | 18. | | | Trade credit and short-term loans |
| | -2 486 | | | | | | | | | | | | | | | | | | | | 19 | | | | | | | | | | | | | | | | | | | | -2 486 | | | | -2 486 | | | | 19. | | | Short-term government bonds |
| | 49 462 | | | | | | | | | | | | | | | | | | | | 1 069 | | | | | | | | | | | | | | | | | | | | 49 462 | | | | 49 462 | | | | 20. | | | Long-term government bonds |
| | -9 190 | | | | | | | | | | | | | | | | | | | | | | | | | | | | | | | | | | | | -9 229 | | | | -9 190 | | | | -9 190 | | | | 21. | | | Non-marketable government bonds6 |
| | | | | | | | | | | | | | | | | | | | | | | | | | | | | 895 | | | | | | | | | | | | | | | | | | | | 22. | | | Securities of local governments |
| | | | | 1 286 | | | | | | | | | | | | 5 125 | | | | | | | | | | | | | | | | | | | | 5 | | | | 4 154 | | | | 4 154 | | | | 23. | | | Securities of public enterprises |
| | | | | -185 | | | | 13 | | | | -165 | | | | -1 | | | | -4 691 | | | | 1 341 | | | | 6 510 | | | | | | | | | | | | 7 493 | | | | 7 493 | | | | 24. | | | Other loan stock and preference shares |
| | | | | -2 488 | | | | | | | | | | | | 5 868 | | | | -62 | | | | 55 356 | | | | -2 977 | | | | | | | | | | | | 92 191 | | | | 92 191 | | | | 25. | | | Ordinary shares |
| | | | | | | | | | | | | | | | | | | | | | | | | | | | | | | | | | | | | | | | | | | | | | | | | 26. | | | Foreign branch/head office balances |
| | -2 94 | | | | -15 209 | | | | 89 | | | | -23 | | | | -4 734 | | | | 898 | | | | -5 709 | | | | 7 231 | | | | 410 | | | | | | | | -26 109 | | | | -26109 | | | | 27. | | | Long-term loans |
| | | | | | | | | | | | | -6 | | | | 12 | | | | | | | | -3 951 | | | | | | | | 8 180 | | | | | | | | 2 687 | | | | 2 687 | | | | 28. | | | Mortgage loans |
| | | | | -129 | | | | | | | | | | | | | | | | 9 | | | | | | | | 2 683 | | | | | | | | 21 750 | | | | 24 818 | | | | 24 818 | | | | 29. | | | Interest in retirement and life funds7 |
| | 20 654 | | | | 6 224 | | | | 23 482 | | | | | | | | 11 551 | | | | 6 707 | | | | -10 158 | | | | 36 449 | | | | 7 874 | | | | -749 | | | | 70 675 | | | | 70 675 | | | | 30. | | | Amounts receivable/payable |
| | -24 372 | | | | | | | | 127 | | | | 74 | | | | -469 | | | | -696 | | | | 13 079 | | | | 26 290 | | | | 7 | | | | | | | | -44 | | | | -44 | | | | 31. | | | Other assets/liabilities |
| | -124 | | | | | | | | 43 | | | | 24 | | | | -157 | | | | -232 | | | | 20 | | | | -140 | | | | | | | | | | | | -120 | | | | -120 | | | | 32. | | | Balancing item |
S = Sources i.e., net increase in liabilities at transaction value.
U = Uses, i.e,. net increase in assets at transaction value.
KB231
| 1. | A negative amount reflects a decrease in that item. In the case of liabilities (sources) it denotes a reduction in the available sources of funds and in the case of assets (uses) it indicates an additional source of funds. |
| 2. | Including mutual banks and the Postbank. |
| 3. | Before April 2005 the Public Investment Commissioners. |
| 4. | As taken from the national income (and production) accounts. |
| 5. | Namely deposits with the South African Reserve Bank (including coin liabilities), Corporation for Public Deposits, banks, the Land Bank, mutual banks and the Postbank. |
| 6. | Non-marketable bonds and other Treasury bills. |
| 7. | Members’ interest in the reserves of retirement and all insurance funds. |
| | | | |
| Quarterly Bulletin June 2013 | | | | 83 |
National financial account
Flow of funds for the second quarter 20121
| | | | | | | | | | | | | | | | | | | | | | | | | | | | | | | | | | | | | | | | | | | | | | | | | | |
| R millions | |
| | | Sectors | | | | | | | | Financial intermediaries | |
| | | | | Foreign
sector | | | Monetary
authority | | | Other monetary
institutions2 | | | Public
Investment
Corporation3 | | | Insurers and
retirement
funds | | | Other
financial
institutions | |
| Transaction items | | S | | | U | | | S | | | U | | | S | | | U | | | S | | | U | | | S | | | U | | | S | | | U | |
| 1. | | Net saving4 | | | 51 904 | | | | | | | | 396 | | | | | | | | 15 195 | | | | | | | | | | | | | | | | -3 344 | | | | | | | | 6 523 | | | | | |
| 2. | | Consumption of fixed capital4 | | | | | | | | | | | 9 | | | | | | | | 2 372 | | | | | | | | | | | | | | | | 70 | | | | | | | | 97 | | | | | |
| 3. | | Capital transfers | | | 38 | | | | 98 | | | | | | | | | | | | | | | | | | | | | | | | | | | | | | | | | | | | | | | | | |
| 4. | | Gross capital formation4 | | | | | | | | | | | | | | | 12 | | | | | | | | 3 585 | | | | | | | | | | | | | | | | 365 | | | | | | | | 290 | |
| 5. | | Net lending (+)/net borrowing (-) (S) | | | 51 844 | | | | | | | | 393 | | | | | | | | 13 982 | | | | | | | | | | | | | | | | -3 639 | | | | | | | | 6 330 | | | | | |
| 6. | | Net financial investment (+) or (-) (U) | | | | | | | 51 844 | | | | | | | | 393 | | | | | | | | 13 982 | | | | | | | | | | | | | | | | -3 639 | | | | | | | | 6 330 | |
| 7. | | Net incurrence of financial liabilities (Total S 9 – 32) | | | 21 697 | | | | | | | | 15 446 | | | | | | | | 58 590 | | | | | | | | 26 519 | | | | | | | | 18 837 | | | | | | | | 3 576 | | | | | |
| 8. | | Net acquisition of financial assets (Total U 9 – 32) | | | | | | | 73 541 | | | | | | | | 15 839 | | | | | | | | 72 572 | | | | | | | | 26 519 | | | | | | | | 15 198 | | | | | | | | 9 906 | |
| 9. | | Gold and other foreign reserves | | | -3 817 | | | | | | | | | | | | -3 817 | | | | | | | | | | | | | | | | | | | | | | | | | | | | | | | | | |
| 10. | | Cash and demand monetary deposits5 | | | | | | | 3 179 | | | | 1 716 | | | | -428 | | | | 11 155 | | | | 548 | | | | | | | | 14 415 | | | | | | | | -1 671 | | | | | | | | -15 499 | |
| 11. | | Short/medium-term monetary deposits5 | | | | | | | 1 865 | | | | -146 | | | | 309 | | | | -15 969 | | | | | | | | | | | | 8 186 | | | | | | | | 994 | | | | | | | | -34 899 | |
| 12. | | Long-term monetary deposits5 | | | | | | | -56 | | | | | | | | 1 947 | | | | 59 080 | | | | | | | | | | | | 3 832 | | | | | | | | 3 995 | | | | | | | | 46 606 | |
| 13. | | Deposits with other financial institutions | | | 1 314 | | | | 524 | | | | | | | | | | | | | | | | -464 | | | | | | | | 3 802 | | | | | | | | -2 569 | | | | 2 342 | | | | 1 314 | |
| 14. | | Deposits with other institutions | | | 10 588 | | | | | | | | | | | | | | | | | | | | 11 626 | | | | 26 519 | | | | -300 | | | | -300 | | | | 22 308 | | | | | | | | 2 827 | |
| 15. | | Treasury bills | | | -1 332 | | | | | | | | | | | | 751 | | | | | | | | 1 263 | | | | | | | | | | | | | | | | 180 | | | | | | | | -397 | |
| 16. | | Other bills | | | 12 881 | | | | | | | | 5 | | | | 11 738 | | | | 1 002 | | | | 1 894 | | | | | | | | 1 184 | | | | | | | | 30 | | | | -434 | | | | 734 | |
| 17. | | Bank loans and advances | | | 20 103 | | | | | | | | 91 | | | | -9 151 | | | | -9 091 | | | | 20 140 | | | | | | | | | | | | 41 | | | | | | | | -12 527 | | | | | |
| 18. | | Trade credit and short-term loans | | | 7 234 | | | | 30 060 | | | | 929 | | | | 349 | | | | 15 589 | | | | -9 597 | | | | | | | | -1 | | | | -5 613 | | | | -497 | | | | -550 | | | | 3 176 | |
| 19. | | Short-term government bonds | | | | | | | | | | | | | | | 175 | | | | | | | | -9 085 | | | | | | | | | | | | | | | | 1 317 | | | | | | | | -10 464 | |
| 20. | | Long-term government bonds | | | | | | | 20 322 | | | | | | | | 1 646 | | | | | | | | 10 383 | | | | | | | | 122 | | | | | | | | 4 189 | | | | | | | | 6 829 | |
| 21. | | Non-marketable government bonds6 | | | | | | | -1 111 | | | | | | | | 649 | | | | | | | | | | | | | | | | -3 | | | | | | | | | | | | | | | | | |
| 22. | | Securities of local governments | | | | | | | | | | | | | | | | | | | | | | | 216 | | | | | | | | 179 | | | | | | | | 258 | | | | | | | | 100 | |
| 23. | | Securities of public enterprises | | | 123 | | | | 2 223 | | | | 115 | | | | | | | | | | | | 3 457 | | | | | | | | 252 | | | | | | | | 1 842 | | | | 1 552 | | | | 626 | |
| 24. | | Other loan stock and preference shares | | | 3 031 | | | | -3 048 | | | | | | | | | | | | -4 328 | | | | 12 612 | | | | | | | | 1 144 | | | | -117 | | | | 8 479 | | | | 373 | | | | -174 | |
| 25. | | Ordinary shares | | | 4 752 | | | | 2 770 | | | | | | | | | | | | 2 296 | | | | 1 860 | | | | | | | | 5 717 | | | | 31 | | | | 11 599 | | | | | | | | 7 380 | |
| 26. | | Foreign branch/head office balances | | | | | | | | | | | | | | | | | | | | | | | | | | | | | | | | | | | | | | | | | | | | | | | | |
| 27. | | Long-term loans | | | -91 | | | | 16 855 | | | | 15 921 | | | | -3 | | | | | | | | | | | | | | | | | | | | 144 | | | | 2 663 | | | | 16 445 | | | | -11 878 | |
| 28. | | Mortgage loans | | | -264 | | | | | | | | | | | | | | | | | | | | 11 674 | | | | | | | | | | | | | | | | -96 | | | | 210 | | | | 1 056 | |
| 29. | | Interest in retirement and life funds7 | | | | | | | 418 | | | | | | | | | | | | | | | | 132 | | | | | | | | | | | | 22 293 | | | | | | | | | | | | | |
| 30. | | Amounts receivable/payable | | | -18 663 | | | | -7 204 | | | | -4 096 | | | | 3 968 | | | | 4 084 | | | | 9 991 | | | | | | | | -12 010 | | | | 4 788 | | | | -19 641 | | | | -273 | | | | 12 105 | |
| 31. | | Other assets/liabilities | | | -14 162 | | | | 6 744 | | | | 911 | | | | 7 706 | | | | -5 171 | | | | 5 691 | | | | | | | | | | | | -2 322 | | | | -17 886 | | | | -3 421 | | | | 348 | |
| 32. | | Balancing item | | | | | | | | | | | | | | | | | | | -57 | | | | 231 | | | | | | | | | | | | -108 | | | | -296 | | | | -141 | | | | 116 | |
S = Sources, i.e., net increase in liabilities at transaction value.
U = Uses, i.e,. net increase in assets at transaction value.
KB230
| 1. | A negative amount reflects a decrease in that item. In the case of liabilities (sources) it denotes a reduction in the available sources of funds and in the case of assets (uses) it indicates an additional source of funds. |
| 2. | Including mutual banks and the Postbank. |
| 3. | Before April 2005 the Public Investment Commissioners. |
| 4. | As taken from the national income (and production) accounts. |
| 5. | Namely deposits with the South African Reserve Bank (including coin liabilities), Corporation for Public Deposits, banks, the Land Bank, mutual banks and the Postbank. |
| 6. | Non-marketable bonds and other Treasury bills. |
| 7. | Members’ interest in the reserves of retirement and all insurance funds. |
| | | | |
| 84 | | | | Quarterly Bulletin June 2013 |
National financial account (continued)
Flow of funds for the second quarter 20121
| | | | | | | | | | | | | | | | | | | | | | | | | | | | | | | | | | | | | | | | | | | | | | | | | | | | |
| R millions |
| General government | | | Corporate business enterprises | | | | | | | | | | | | | | | | | | Sectors |
Central
and
provincial
governments | | | Local
governments | | | Public
sector | | | Private
sector | | | Households,
etc. | | | Total | | | | | | |
| S | | | U | | | S | | | U | | | S | | | U | | | S | | | U | | | S | | | U | | | S | | | U | | | Transaction items |
| | -35 677 | | | | | | | | -8 390 | | | | | | | | 4 328 | | | | | | | | 6027 | | | | | | | | 30 008 | | | | | | | | 66 970 | | | | | | | | 1. | | | Net saving4 |
| | 8 305 | | | | | | | | 5 955 | | | | | | | | 9 674 | | | | | | | | 60 611 | | | | | | | | 13 250 | | | | | | | | 100 343 | | | | | | | | 2. | | | Consumption of fixed capital4 |
| | | | | 3 611 | | | | 23 | | | | | | | | 430 | | | | | | | | 100 | | | | 13 | | | | 3 156 | | | | 25 | | | | 3 747 | | | | 3 747 | | | | 3. | | | Capital transfers |
| | | | | 11 754 | | | | | | | | 12 256 | | | | | | | | 33 950 | | | | | | | | 89 575 | | | | | | | | 15 526 | | | | | | | | 167 313 | | | | 4. | | | Gross capital formation4 |
| | -42 737 | | | | | | | | -14 668 | | | | | | | | -19518 | | | | | | | | -23 512 | | | | | | | | 31 525 | | | | | | | | — | | | | | | | | 5. | | | Net lending (+)/net borrowing (-) (S) |
| | | | | -42 737 | | | | | | | | -14 668 | | | | | | | | -19 518 | | | | | | | | -23 512 | | | | | | | | 31 525 | | | | | | | | — | | | | 6. | | | Net financial investment (+) or (-) (U) |
| | 59 668 | | | | | | | | 19 125 | | | | | | | | 10 696 | | | | | | | | 24 413 | | | | | | | | 20 342 | | | | | | | | 278 909 | | | | | | | | 7. | | | Net incurrence of financial liabilities (Total S 9 – 32) |
| | | | | 16 931 | | | | | | | | 4 457 | | | | | | | | -8 822 | | | | | | | | 901 | | | | | | | | 51 867 | | | | | | | | 278 909 | | | | 8. | | | Net acquisition of financial assets (Total U 9 – 32) |
| | | | | | | | | | | | | | | | | | | | | | | | | | | | | | | | | | | | | | | | | -3 817 | | | | -3 817 | | | | 9. | | | Gold and other foreign reserves |
| | | | | 19 394 | | | | | | | | -4 364 | | | | | | | | -2 336 | | | | | | | | -14 551 | | | | | | | | 14 184 | | | | 12 871 | | | | 12 871 | | | | 10. | | | Cash and demand monetary deposits5 |
| | | | | 2 172 | | | | | | | | -6 867 | | | | | | | | -7 340 | | | | | | | | 10 791 | | | | | | | | 8 674 | | | | -16 115 | | | | -16 115 | | | | 11. | | | Short/medium-term monetary deposits5 |
| | | | | 1 140 | | | | | | | | -332 | | | | | | | | 887 | | | | | | | | -270 | | | | | | | | 1 331 | | | | 59 080 | | | | 59 080 | | | | 12. | | | Long-term monetary deposits5 |
| | | | | | | | | | | | | 3 330 | | | | | | | | -672 | | | | | | | | -4 352 | | | | | | | | 2 743 | | | | 3 656 | | | | 3 656 | | | | 13. | | | Deposits with other financial institutions |
| | | | | 3 092 | | | | | | | | | | | | | | | | | | | | -130 | | | | -2 965 | | | | | | | | 89 | | | | 36 677 | | | | 36 677 | | | | 14. | | | Deposits with other institutions |
| | 7 449 | | | | | | | | | | | | | | | | | | | | | | | | | | | | 4 320 | | | | | | | | | | | | 6 117 | | | | 6 117 | | | | 15. | | | Treasury bills |
| | | | | 105 | | | | | | | | | | | | -53 | | | | -940 | | | | -1 642 | | | | -2 986 | | | | | | | | | | | | 11 759 | | | | 11 759 | | | | 16. | | | Other bills |
| | -124 | | | | | | | | 4 178 | | | | | | | | -1 696 | | | | | | | | -7 783 | | | | | | | | 17 797 | | | | | | | | 10 989 | | | | 10 989 | | | | 17. | | | Bank loans and advances |
| | | | | 1 959 | | | | 7 136 | | | | 4 107 | | | | -411 | | | | -287 | | | | -3 842 | | | | -4 609 | | | | 10 248 | | | | 6 060 | | | | 30 720 | | | | 30 720 | | | | 18. | | | Trade credit and short-term loans |
| | -18 028 | | | | | | | | | | | | | | | | | | | | 29 | | | | | | | | | | | | | | | | | | | | -18 028 | | | | -18 028 | | | | 19. | | | Short-term government bonds |
| | 45 108 | | | | | | | | | | | | | | | | | | | | 1 617 | | | | | | | | | | | | | | | | | | | | 45 108 | | | | 45 108 | | | | 20. | | | Long-term government bonds |
| | 3 093 | | | | | | | | | | | | | | | | | | | | | | | | | | | | | | | | | | | | 3 558 | | | | 3 093 | | | | 3 093 | | | | 21. | | | Non-marketable government bonds6 |
| | | | | | | | | 800 | | | | | | | | | | | | | | | | | | | | 47 | | | | | | | | | | | | 800 | | | | 800 | | | | 22. | | | Securities of local governments |
| | | | | 348 | | | | | | | | | | | | 6 961 | | | | | | | | | | | | | | | | | | | | 3 | | | | 8 751 | | | | 8 751 | | | | 23. | | | Securities of public enterprises |
| | | | | -61 | | | | -112 | | | | -695 | | | | 32 | | | | -2 312 | | | | 14 521 | | | | -2 545 | | | | | | | | | | | | 13 400 | | | | 13 400 | | | | 24. | | | Other loan stock and preference shares |
| | | | | | | | | | | | | | | | | 1 988 | | | | -56 | | | | 28 939 | | | | 8 736 | | | | | | | | | | | | 38 006 | | | | 38 006 | | | | 25. | | | Ordinary shares |
| | | | | | | | | | | | | | | | | | | | | | | | | | | | | | | | | | | | | | | | | | | | | | | | | 26. | | | Foreign branch/head office balances |
| | -1 214 | | | | 23 753 | | | | 4 811 | | | | -24 | | | | 18 655 | | | | 784 | | | | -7 406 | | | | 15 576 | | | | 542 | | | | 81 | | | | 47 807 | | | | 47 807 | | | | 27. | | | Long-term loans |
| | | | | | | | | 348 | | | | -93 | | | | -4 | | | | | | | | 6 651 | | | | | | | | 5 600 | | | | | | | | 12 541 | | | | 12 541 | | | | 28. | | | Mortgage loans |
| | | | | -1 378 | | | | | | | | | | | | | | | | -98 | | | | | | | | 8 623 | | | | | | | | 14 596 | | | | 22 293 | | | | 22 293 | | | | 29. | | | Interest in retirement and life funds7 |
| | 23 384 | | | | -33 593 | | | | -50 | | | | 11 715 | | | | -19 054 | | | | 1 064 | | | | -15 264 | | | | -3 529 | | | | -11 442 | | | | 548 | | | | -37 248 | | | | -37 248 | | | | 30. | | | Amounts receivable/payable |
| | | | | | | | | 2 011 | | | | -2 240 | | | | 4 208 | | | | 628 | | | | 10 188 | | | | -10 490 | | | | -1 741 | | | | | | | | -9 499 | | | | -9 499 | | | | 31. | | | Other assets/liabilities |
| | | | | | | | | 3 | | | | -80 | | | | 70 | | | | 210 | | | | 181 | | | | -233 | | | | | | | | | | | | -52 | | | | -52 | | | | 32. | | | Balancing item |
S = Sources, i.e., net increase in liabilities at transaction value.
U = Uses, i.e., net increase in assets at transaction value.
KB231
| 1. | A negative amount reflects a decrease in that item. In the case of liabilities (sources) it denotes a reduction in the available sources of funds and in the case of assets (uses) it indicates an additional source of funds. |
| 2. | Including mutual banks and the Postbank. |
| 3. | Before April 2005 the Public Investment Commissioners. |
| 4. | As taken from the national income (and production) accounts. |
| 5. | Namely deposits with the South African Reserve Bank (including coin liabilities), Corporation for Public Deposits, banks, the Land Bank, mutual banks and the Postbank. |
| 6. | Non-marketable bonds and other Treasury bills. |
| 7. | Members’ interest in the reserves of retirement and all insurance funds. |
| | | | |
| Quarterly Bulletin June 2013 | | | | 85 |
National financial account
Flow of funds for the third quarter 20121
| | | | | | | | | | | | | | | | | | | | | | | | | | | | | | | | | | | | | | | | | | | | | | | | | | |
| R millions | |
| | | Sectors | | | | | | | | Financial intermediaries | |
| | | | | Foreign
sector | | | Monetary
authority | | | Other
monetary
institutions2 | | | Public
Investment
Corporation3 | | | Insurers and
retirement
funds | | | Other
financial
institutions | |
| Transaction items | | S | | | U | | | S | | | U | | | S | | | U | | | S | | | U | | | S | | | U | | | S | | | U | |
| 1. | | Net saving4 | | | 53 942 | | | | | | | | 541 | | | | | | | | 11 496 | | | | | | | | | | | | | | | | 2 148 | | | | | | | | 4 729 | | | | | |
| 2. | | Consumption of fixed capital4 | | | | | | | | | | | 9 | | | | | | | | 2 439 | | | | | | | | | | | | | | | | 72 | | | | | | | | 96 | | | | | |
| 3. | | Capital transfers | | | 39 | | | | 99 | | | | | | | | | | | | | | | | | | | | | | | | | | | | | | | | | | | | | | | | | |
| 4. | | Gross capital formation4 | | | | | | | | | | | | | | | 24 | | | | | | | | 3 556 | | | | | | | | | | | | | | | | 141 | | | | | | | | 230 | |
| 5. | | Net lending (+)/net borrowing (-) (S) | | | 53 882 | | | | | | | | 526 | | | | | | | | 10 379 | | | | | | | | | | | | | | | | 2 079 | | | | | | | | 4 595 | | | | | |
| 6. | | Net financial investment (+) or (-) (U) | | | | | | | 53 882 | | | | | | | | 526 | | | | | | | | 10 379 | | | | | | | | | | | | | | | | 2 079 | | | | | | | | 4 595 | |
| 7. | | Net incurrence of financial liabilities (Total S 9 – 32) | | | -251 | | | | | | | | 41 560 | | | | | | | | 72 471 | | | | | | | | 20 879 | | | | | | | | 43 113 | | | | | | | | 81 560 | | | | | |
| 8. | | Net acquisition of financial assets (Total U 9 – 32) | | | | | | | 53 631 | | | | | | | | 42 086 | | | | | | | | 82 850 | | | | | | | | 20 879 | | | | | | | | 45 192 | | | | | | | | 86 155 | |
| 9. | | Gold and other foreign reserves | | | 4 753 | | | | | | | | | | | | 4 753 | | | | | | | | | | | | | | | | | | | | | | | | | | | | | | | | | |
| 10. | | Cash and demand monetary deposits5 | | | | | | | -1 973 | | | | 22 154 | | | | 588 | | | | -7268 | | | | 3 580 | | | | | | | | 10 122 | | | | | | | | 2 241 | | | | | | | | 15 965 | |
| 11. | | Short/medium-term monetary deposits5 | | | | | | | 5 283 | | | | -89 | | | | 4 163 | | | | 29 139 | | | | | | | | | | | | 5 411 | | | | | | | | 1 507 | | | | | | | | -17 825 | |
| 12. | | Long-term monetary deposits5 | | | | | | | -181 | | | | | | | | 6 343 | | | | 31 043 | | | | | | | | | | | | -1 311 | | | | | | | | -1 940 | | | | | | | | 40 691 | |
| 13. | | Deposits with other financial institutions | | | -347 | | | | 1 | | | | | | | | | | | | | | | | 1 402 | | | | | | | | -16 353 | | | | | | | | 1 244 | | | | 42 606 | | | | -347 | |
| 14. | | Deposits with other institutions | | | -17 443 | | | | | | | | | | | | | | | | | | | | -7 891 | | | | 20 879 | | | | -1 760 | | | | -1 760 | | | | 16 157 | | | | | | | | 11 780 | |
| 15. | | Treasury bills | | | | | | | | | | | | | | | 1 041 | | | | | | | | 574 | | | | | | | | | | | | | | | | -706 | | | | | | | | 879 | |
| 16. | | Other bills | | | 5 034 | | | | | | | | -5 | | | | 5 268 | | | | 1 464 | | | | 62 | | | | | | | | -4 | | | | | | | | 32 | | | | 109 | | | | 9 100 | |
| 17. | | Bank loans and advances | | | 2 143 | | | | | | | | 2 033 | | | | 6 685 | | | | 13 001 | | | | 55 309 | | | | | | | | | | | | 24 | | | | | | | | 16 593 | | | | | |
| 18. | | Trade credit and short-term loans | | | -4 298 | | | | 622 | | | | 730 | | | | -334 | | | | -3 537 | | | | 8 134 | | | | | | | | 98 | | | | 6 513 | | | | -542 | | | | 3 877 | | | | -6 396 | |
| 19. | | Short-term government bonds | | | | | | | 1 | | | | | | | | 181 | | | | | | | | 12 652 | | | | | | | | -8 504 | | | | | | | | 347 | | | | | | | | 7 468 | |
| 20. | | Long-term government bonds | | | | | | | 27 176 | | | | | | | | -1 176 | | | | | | | | -12 447 | | | | | | | | 5 676 | | | | | | | | 10 239 | | | | | | | | 3 738 | |
| 21. | | Non-marketable government bonds6 | | | | | | | -375 | | | | | | |
| -12
997 |
| | | | | | | | | | | | | | | -39 | | | | | | | | | | | | | | | | | |
| 22. | | Securities of local governments | | | | | | | | | | | | | | | | | | | | | | | 34 | | | | | | | | -3 | | | | | | | | -1 | | | | | | | | -30 | |
| 23. | | Securities of public enterprises | | | 354 | | | | 99 | | | | 312 | | | | | | | | | | | | 495 | | | | | | | | 1 512 | | | | | | | | 2 486 | | | | -995 | | | | 215 | |
| 24. | | Other loan stock and preference shares | | | -2 120 | | | | -5 406 | | | | | | | | | | | | -6 112 | | | | -5 999 | | | | | | | | -370 | | | | -22 | | | | 2 653 | | | | -104 | | | | -1 445 | |
| 25. | | Ordinary shares | | | 19 579 | | | | 3 262 | | | | | | | | | | | | 3 193 | | | | -5 535 | | | | | | | | 24 774 | | | | 214 | | | | 25 946 | | | | | | | | 22 909 | |
| 26. | | Foreign branch/head office balances | | | | | | | | | | | | | | | | | | | | | | | | | | | | | | | | | | | | | | | | | | | | | | | | |
| 27. | | Long-term loans | | | -722 | | | | 15 168 | | | | 13 684 | | | | -113 | | | | 672 | | | | | | | | | | | | | | | | -993 | | | | 3 184 | | | | -1 805 | | | | 4 500 | |
| 28. | | Mortgage loans | | | -3 | | | | | | | | | | | | | | | | | | | | 703 | | | | | | | | | | | | | | | | -51 | | | | 277 | | | | 718 | |
| 29. | | Interest in retirement and life funds7 | | | | | | | 516 | | | | | | | | | | | | | | | | -71 | | | | | | | | | | | | 26 656 | | | | | | | | | | | | | |
| 30. | | Amounts receivable/payable | | | -8 263 | | | | 7 576 | | | | 2 965 | | | | 15 050 | | | | 3 546 | | | | 21 726 | | | | | | | | 1 630 | | | | 5 621 | | | | -10 070 | | | | 9 298 | | | | -5 409 | |
| 31. | | Other assets/liabilities | | | 1 082 | | | | 1 862 | | | | -224 | | | | 12 634 | | | | 6 998 | | | | 9 841 | | | | | | | | | | | | 6 645 | | | | -7 400 | | | | 11 528 | | | | -267 | |
| 32. | | Balancing item | | | | | | | | | | | | | | | | | | | 332 | | | | 281 | | | | | | | | | | | | 215 | | | | -134 | | | | 176 | | | | -89 | |
S = Sources, i.e., net increase in liabilities at transaction value.
U = Uses, i.e., net increase in assets at transaction value.
KB230
| 1. | A negative amount reflects a decrease in that item. In the case of liabilities (sources) it denotes a reduction in the available sources of funds and in the case of assets (uses) it indicates an additional source of funds. |
| 2. | Including mutual banks and the Postbank. |
| 3. | Before April 2005 the Public Investment Commissioners. |
| 4. | As taken from the national income (and production) accounts. |
| 5. | Namely deposits with the South African Reserve Bank (including coin liabilities), Corporation for Public Deposits, banks, the Land Bank, mutual banks and the Postbank. |
| 6. | Non-marketable bonds and other Treasury bills. |
| 7. | Members’ interest in the reserves of retirement and all insurance funds. |
| | | | |
| 86 | | | | Quarterly Bulletin June 2013 |
National financial account (continued)
Flow of funds for the third quarter 20121
| | | | | | | | | | | | | | | | | | | | | | | | | | | | | | | | | | | | | | | | | | | | | | | | |
| R millions |
| General government | | | Corporate business enterprises | | | | | | | | | Sectors |
Central and
provincial
governments | | | Local
governments | | | Public sector | | | Private sector | | | Households,
etc. | | | Total | | | |
| S | | | U | | | S | | | U | | | S | | | U | | | S | | | U | | | S | | | U | | | S | | | U | | | Transaction items |
| | -33 929 | | | | | | | | -16 845 | | | | | | | | 4 314 | | | | | | | | 18 288 | | | | | | | | 11 471 | | | | | | | | 56 155 | | | | | | | 1. Net saving4 |
| | 8 389 | | | | | | | | 6 013 | | | | | | | | 9 881 | | | | | | | | 61 754 | | | | | | | | 13 466 | | | | | | | | 102 119 | | | | | | | 2. Consumption of fixed capital4 |
| | | | | 10 811 | | | | 7 005 | | | | | | | | 104 | | | | | | | | 109 | | | | 14 | | | | 3 692 | | | | 25 | | | | 10 949 | | | | 10 949 | | | 3. Capital transfers |
| | | | | 12 652 | | | | | | | | 12 546 | | | | | | | | 34 155 | | | | | | | | 79 014 | | | | | | | | 15 956 | | | | | | | | 158 274 | | | 4. Gross capital formation4 |
| | -49 003 | | | | | | | | -16 373 | | | | | | | | -19 856 | | | | | | | | 181 | | | | | | | | 13 590 | | | | | | | | — | | | | | | | 5. Net lending (+)/net borrowing (-) (S) |
| | | | | -49 003 | | | | | | | | -16 373 | | | | | | | | -19 856 | | | | | | | | 181 | | | | | | | | 13 590 | | | | | | | | — | | | 6. Net financial investment (+) or (-) (U) |
| | 43 265 | | | | | | | | 6 946 | | | | | | | | 19 339 | | | | | | | | 83 678 | | | | | | | | 34 963 | | | | | | | | 447 523 | | | | | | | 7. Net incurrence of financial liabilities (Total S 9 – 32) |
| | | | | -5 738 | | | | | | | | -9 427 | | | | | | | | -517 | | | | | | | | 83 859 | | | | | | | | 48 553 | | | | | | | | 44 7523 | | | 8. Net acquisition of financial assets (Total U 9 – 32) |
| | | | | | | | | | | | | | | | | | | | | | | | | | | | | | | | | | | | | | | | | 4 753 | | | | 4 753 | | | 9. Gold and other foreign reserves |
| | | | | -38 843 | | | | | | | | 1 159 | | | | | | | | 1 041 | | | | | | | | 14 109 | | | | | | | | 6 897 | | | | 14 886 | | | | 14 886 | | | 10. Cash and demand monetary deposits5 |
| | | | | 8 967 | | | | | | | | 3 530 | | | | | | | | 10 192 | | | | | | | | -1 191 | | | | | | | | 9 013 | | | | 29 050 | | | | 29 050 | | | 11. Short/medium-term monetary deposits5 |
| | | | | -6 422 | | | | | | | | 733 | | | | | | | | -4 123 | | | | | | | | -3 382 | | | | | | | | 635 | | | | 31 043 | | | | 31 043 | | | 12. Long-term monetary deposits5 |
| | | | | | | | | | | | | -116 | | | | | | | | 939 | | | | | | | | 44 583 | | | | | | | | 10 906 | | | | 42 259 | | | | 42 259 | | | 13. Deposits with other financial institutions |
| | | | | 4 734 | | | | | | | | | | | | | | | | | | | | 61 | | | | -21 509 | | | | | | | | 226 | | | | 1 737 | | | | 1 737 | | | 14. Deposits with other institutions |
| | -2 406 | | | | | | | | | | | | | | | | | | | | | | | | | | | | -4 194 | | | | | | | | | | | | -2 406 | | | | -2 406 | | | 15. Treasury bills |
| | | | | 296 | | | | 40 | | | | | | | | -442 | | | | 71 | | | | 16 221 | | | | 7 596 | | | | | | | | | | | | 22 421 | | | | 22 421 | | | 16. Other bills |
| | 3 | | | | | | | | 240 | | | | | | | | -352 | | | | | | | | 6 611 | | | | | | | | 21 698 | | | | | | | | 61 994 | | | | 61 994 | | | 17. Bank loans and advances |
| | | | | 1 881 | | | | 96 | | | | 3 237 | | | | 1 071 | | | | 346 | | | | -1 706 | | | | -19 925 | | | | -5214 | | | | 10 411 | | | | -2 468 | | | | -2 468 | | | 18. Trade credit and short-term loans |
| | 12 146 | | | | | | | | | | | | | | | | | | | | -1 | | | | | | | | | | | | | | | | 2 | | | | 12 146 | | | | 12 146 | | | 19. Short-term government bonds |
| | 33 124 | | | | | | | | | | | | | | | | | | | | -80 | | | | | | | | | | | | | | | | -2 | | | | 33 124 | | | | 33 124 | | | 20. Long-term government bonds |
| | -13 618 | | | | | | | | | | | | | | | | | | | | | | | | | | | | | | | | | | | | -207 | | | | -13 618 | | | | -13 618 | | | 21. Non-marketable government bonds6 |
| | | | | | | | | | | | | | | | | | | | | | | | | | | | | | | | | | | | | | | | | | | | | | | | 22. Securities of local governments |
| | | | | | | | | | | | | | | | | 5 139 | | | | | | | | | | | | | | | | | | | | 3 | | | | 4 810 | | | | 4 810 | | | 23. Securities of public enterprises |
| | | | | 14 | | | | -39 | | | | 74 | | | | 216 | | | | -1 289 | | | | 3 090 | | | | 6 730 | | | | | | | | -53 | | | | -5 091 | | | | -5 091 | | | 24. Other loan stock and preference shares |
| | | | | | | | | | | | | | | | | -2 915 | | | | 5 | | | | 55 897 | | | | 4 607 | | | | | | | | | | | | 75 968 | | | | 75 968 | | | 25. Ordinary shares |
| | | | | | | | | | | | | | | | | | | | | | | | | | | | | | | | | | | | | | | | | | | | | | | | 26. Foreign branch/head office balances |
| | -581 | | | | 23 554 | | | | -183 | | | | 297 | | | | 14 380 | | | | 2 013 | | | | 16 414 | | | | -7 263 | | | | 475 | | | | 1 | | | | 41 341 | | | | 41 341 | | | 27. Long-term loans |
| | | | | | | | | -312 | | | | | | | | 354 | | | | | | | | -4 905 | | | | | | | | 5 959 | | | | | | | | 1 370 | | | | 1 370 | | | 28. Mortgage loans |
| | | | | -366 | | | | | | | | | | | | | | | | -2 | | | | | | | | 5 741 | | | | | | | | 20 838 | | | | 26 656 | | | | 26 656 | | | 29. Interest in retirement and life funds7 |
| | 14 597 | | | | 447 | | | | 5 422 | | | | -19 385 | | | | -3 404 | | | | -10 049 | | | | -20 627 | | | | 30 360 | | | | 12 604 | | | | -10 117 | | | | 20 817 | | | | 20 817 | | | 30. Amounts receivable/payable |
| | | | | | | | | 1 511 | | | | 783 | | | | 4 969 | | | | 315 | | | | 12 198 | | | | 27 322 | | | | 383 | | | | | | | | 45 090 | | | | 45 090 | | | 31. Other assets/liabilities |
| | | | | | | | | 171 | | | | 261 | | | | 323 | | | | 105 | | | | 424 | | | | 1 217 | | | | | | | | | | | | 1 641 | | | | 1 641 | | | 32. Balancing item |
S = Sources, i.e., net increase in liabilities at transaction value.
U = Uses, i.e. net increase in assets at transaction value.
KB231
| 1. | A negative amount reflects a decrease in that item. In the case of liabilities (sources) it denotes a reduction in the available sources of funds and in the case of assets (uses) it indicates an additional source of funds. |
| 2. | Including mutual banks and the Postbank. |
| 3. | Before April 2005 the Public Investment Commissioners. |
| 4. | As taken from the national income (and production) accounts. |
| 5. | Namely deposits with the South African Reserve Bank (including coin liabilities), Corporation for Public Deposits, banks, the Land Bank, mutual banks and the Postbank. |
| 6. | Non-marketable bonds and other Treasury bills. |
| 7. | Members’ interest in the reserves of retirement and all insurance funds. |
| | | | |
| Quarterly Bulletin June 2013 | | | | 87 |
National financial account
Flow of funds for the fourth quarter 20121
| | | | | | | | | | | | | | | | | | | | | | | | | | | | | | | | | | | | | | | | | | | | | | | | |
| R millions | |
| Sectors | | | | | Financial intermediaries | |
| | | Foreign
sector | | | Monetary
authority | | | Other monetary
institutions2 | | | Public
Investment
Corporation3 | | | Insurers and
retirement
funds | | | Other
financial
institutions | |
Transaction items | | S | | | U | | | S | | | U | | | S | | | U | | | S | | | U | | | S | | | U | | | S | | | U | |
1. Net saving4 | | | 48 543 | | | | | | | | 397 | | | | | | | | 18 856 | | | | | | | | | | | | | | | | 3 042 | | | | | | | | 6 127 | | | | | |
2. Consumption of fixed capital4 | | | | | | | | | | | 9 | | | | | | | | 2 490 | | | | | | | | | | | | | | | | 72 | | | | | | | | 97 | | | | | |
3. Capital transfers | | | 40 | | | | 101 | | | | | | | | | | | | | | | | | | | | | | | | | | | | | | | | | | | | | | | | | |
4. Gross capital formation4 | | | | | | | | | | | | | | | 38 | | | | | | | | 5 257 | | | | | | | | | | | | | | | | 232 | | | | | | | | 318 | |
5. Net lending (+)/net borrowing (-) (S) | | | 48 482 | | | | | | | | 368 | | | | | | | | 16 089 | | | | | | | | | | | | | | | | 2 882 | | | | | | | | 5 906 | | | | | |
6. Net financial investment (+) or (-) (U) | | | | | | | 48 482 | | | | | | | | 368 | | | | | | | | 16 089 | | | | | | | | | | | | | | | | 2 882 | | | | | | | | 5 906 | |
7. Net incurrence of financial liabilities (Total S 9 – 32) | | | 11 309 | | | | | | | | -8 980 | | | | | | | | 87 176 | | | | | | | | 26 328 | | | | | | | | 52 666 | | | | | | | | 50 365 | | | | | |
8. Net acquisition of financial assets (Total U 9 – 32) | | | | | | | 59 791 | | | | | | | | -8 612 | | | | | | | | 103 265 | | | | | | | | 26 328 | | | | | | | | 55 548 | | | | | | | | 56 271 | |
9. Gold and other foreign reserves | | | 364 | | | | | | | | | | | | 364 | | | | | | | | | | | | | | | | | | | | | | | | | | | | | | | | | |
10. Cash and demand monetary deposits5 | | | | | | | 1 573 | | | | 800 | | | | 5 047 | | | | 45 040 | | | | 9765 | | | | | | | | 6 124 | | | | | | | | 2 881 | | | | | | | | 13 446 | |
11. Short/medium-term monetary deposits5 | | | | | | | 2 187 | | | | 45 | | | | -2 730 | | | | -7 998 | | | | | | | | | | | | 2 618 | | | | | | | | -8 049 | | | | | | | | 5 975 | |
12. Long-term monetary deposits5 | | | | | | | 8 079 | | | | | | | | -10 216 | | | | -10 839 | | | | | | | | | | | | -626 | | | | | | | | -44 | | | | | | | | -15 572 | |
13. Deposits with other financial institutions | | | -585 | | | | -25 | | | | | | | | | | | | | | | | -308 | | | | | | | | 3 105 | | | | | | | | 463 | | | | 24 122 | | | | -585 | |
14. Deposits with other institutions | | | -10 158 | | | | | | | | | | | | | | | | | | | | -620 | | | | 26 328 | | | | 173 | | | | 173 | | | | 21 568 | | | | | | | | 6 566 | |
15. Treasury bills | | | | | | | | | | | | | | | -1 456 | | | | | | | | 6 676 | | | | | | | | | | | | | | | | 167 | | | | | | | | -349 | |
16. Other bills | | | 7 051 | | | | | | | | | | | | 2 699 | | | | 2 684 | | | | 1 275 | | | | | | | | -3 082 | | | | | | | | -43 | | | | -1 966 | | | | 427 | |
17. Bank loans and advances | | | -14 668 | | | | | | | | -3 781 | | | | -3 888 | | | | -3 875 | | | | 55 804 | | | | | | | | | | | | 14 | | | | | | | | 16 487 | | | | | |
18. Trade credit and short-term loans | | | -10 511 | | | | 42 155 | | | | 614 | | | | -2 | | | | 29 030 | | | | 8 927 | | | | | | | | -118 | | | | -673 | | | | 245 | | | | -1 012 | | | | 4 318 | |
19. Short-term government bonds | | | | | | | 53 | | | | | | | | -28 | | | | | | | | 2 277 | | | | | | | | -2 767 | | | | | | | | -444 | | | | | | | | -8 543 | |
20. Long-term government bonds | | | | | | | 9 812 | | | | | | | | | | | | | | | | -934 | | | | | | | | 6 989 | | | | | | | | 39 842 | | | | | | | | -6 978 | |
21. Non-marketable government bonds6 | | | | | | | -1 143 | | | | | | | | -1 535 | | | | | | | | | | | | | | | | | | | | | | | | | | | | | | | | | |
22. Securities of local governments | | | | | | | | | | | | | | | | | | | | | | | -53 | | | | | | | | -44 | | | | | | | | 1 735 | | | | | | | | 7 | |
23. Securities of public enterprises | | | 92 | | | | 143 | | | | -7 698 | | | | | | | | | | | | -9 292 | | | | | | | | 436 | | | | | | | | 8 787 | | | | 6 319 | | | | 246 | |
24. Other loan stock and preference shares | | | 9 953 | | | | 935 | | | | | | | | | | | | 879 | | | | 10 598 | | | | | | | | -213 | | | | 65 | | | | 8 911 | | | | -376 | | | | -495 | |
25. Ordinary shares | | | 17 391 | | | | -787 | | | | | | | | | | | | 7 327 | | | | -303 | | | | | | | | 12 674 | | | | 52 | | | | 30 177 | | | | | | | | 56 406 | |
26. Foreign branch/head office balances | | | | | | | | | | | | | | | | | | | | | | | | | | | | | | | | | | | | | | | | | | | | | | | | |
27. Long-term loans | | | 4 270 | | | | 4 106 | | | | 5 700 | | | | -3 | | | | 984 | | | | | | | | | | | | | | | | 903 | | | | 6 736 | | | | 8 753 | | | | 1 283 | |
28. Mortgage loans | | | 2 287 | | | | | | | | | | | | | | | | | | | | 12 400 | | | | | | | | | | | | | | | | 105 | | | | 1 339 | | | | 380 | |
29. Interest in retirement and life funds7 | | | | | | | 726 | | | | | | | | | | | | | | | | 43 | | | | | | | | | | | | 16 713 | | | | | | | | | | | | | |
30. Amounts receivable/payable | | | 9 223 | | | | -3 410 | | | | -6 816 | | | | 3 642 | | | | 30 418 | | | | 3 380 | | | | | | | | 804 | | | | 19 331 | | | | -29 527 | | | | -4 167 | | | | 223 | |
31. Other assets/liabilities | | | -3 400 | | | | -4 613 | | | | 2 156 | | | | -506 | | | | -6 356 | | | | 3 473 | | | | | | | | 255 | | | | 16 066 | | | | -27 722 | | | | 650 | | | | -363 | |
32. Balancing item | | | | | | | | | | | | | | | | | | | -118 | | | | 157 | | | | | | | | | | | | 22 | | | | -240 | | | | 216 | | | | -121 | |
S = Sources, i.e., net increase in liabilities at transaction value.
U = Uses, i.e., net increase in assets at transaction value.
KB230
| 1. | A negative amount reflects a decrease in that item. In the case of liabilities (sources) it denotes a reduction in the available sources of funds and in the case of assets (uses) it indicates an additional source of funds. |
| 2. | Including mutual banks and the Postbank. |
| 3. | Before April 2005 the Public Investment Commissioners. |
| 4. | As taken from the national income (and production) accounts. |
| 5. | Namely deposits with the South African Reserve Bank (including coin liabilities), Corporation for Public Deposits, banks, the Land Bank, mutual banks and the Postbank. |
| 6. | Non-marketable bonds and other Treasury bills. |
| 7. | Members’ interest in the reserves of retirement and all insurance funds. |
| | | | |
| 88 | | | | Quarterly Bulletin June 2013 |
National financial account (continued)
Flow of funds for the fourth quarter 20121
| | | | | | | | | | | | | | | | | | | | | | | | | | | | | | | | | | | | | | | | | | | | | | | | |
| R millions |
| General government | | | Corporate business enterprises | | | | | | | | | | | | | | | Sectors |
Central and
provincial
governments | | | Local
governments | | | Public sector | | | Private sector | | | Households,
etc. | | | Total | | | |
| S | | | U | | | S | | | U | | | S | | | U | | | S | | | U | | | S | | | U | | | S | | | U | | | Transaction items |
| | -2 086 | | | | | | | | -17 993 | | | | | | | | -638 | | | | | | | | 10 008 | | | | | | | | -20 680 | | | | | | | | 45 576 | | | | | | | 1. Net saving4 |
| 8
462 |
| | | | | | | 6 147 | | | | | | | | 10 166 | | | | | | | | 62 859 | | | | | | | | 13 566 | | | | | | | | 103 868 | | | | | | | 2. Consumption of fixed capital4 |
| | | | | 14 989 | | | | 9 180 | | | | | | | | 118 | | | | | | | | 103 | | | | 14 | | | | 5 689 | | | | 26 | | | | 15 130 | | | | 15 130 | | | 3. Capital transfers |
| | | | | 13 268 | | | | | | | | 13 167 | | | | | | | | 34 622 | | | | | | | | 68 160 | | | | | | | | 14 382 | | | | | | | | 149 444 | | | 4. Gross capital formation4 |
| | -21 881 | | | | | | | | -15 833 | | | | | | | | -24 976 | | | | | | | | 5 344 | | | | | | | | -16 381 | | | | | | | | — | | | | | | | 5. Net lending (+)/net borrowing (-) (S) |
| | | | | -21 881 | | | | | | | | -15 833 | | | | | | | | -24 976 | | | | | | | | 5 344 | | | | | | | | -16 381 | | | | | | | | — | | | 6. Net financial investment (+) or (-) (U) |
| | 40 924 | | | | | | | | 8 079 | | | | | | | | 18 071 | | | | | | | | 65 148 | | | | | | | | 35 611 | | | | | | | | 386 697 | | | | | | | 7. Net incurrence of financial liabilities (Total S 9 – 32) |
| | | | | 19 043 | | | | | | | | -7 754 | | | | | | | | -6 905 | | | | | | | | 70 492 | | | | | | | | 19 230 | | | | | | | | 386 697 | | | 8. Net acquisition of financial assets (Total U 9 – 32) |
| | | | | | | | | | | | | | | | | | | | | | | | | | | | | | | | | | | | | | | | | 364 | | | | 364 | | | 9. Gold and other foreign reserves |
| | | | | 78 | | | | | | | | 2 472 | | | | | | | | -2 168 | | | | | | | | 1 877 | | | | | | | | 4 745 | | | | 45 840 | | | | 45 840 | | | 10. Cash and demand monetary deposits5 |
| | | | | -15 744 | | | | | | | | 3 634 | | | | | | | | -5 663 | | | | | | | | 9 944 | | | | | | | | -125 | | | | -7 953 | | | | -7 953 | | | 11. Short/medium-term monetary deposits5 |
| | | | | -385 | | | | | | | | 44 | | | | | | | | -1 727 | | | | | | | | 7 511 | | | | | | | | 2 097 | | | | -10 839 | | | | -10 839 | | | 12. Long-term monetary deposits5 |
| | | | | | | | | | | | | -1 | | | | | | | | -830 | | | | | | | | 11 370 | | | | | | | | 10 348 | | | | 23 537 | | | | 23 537 | | | 13. Deposits with other financial institutions |
| | | | | 4 926 | | | | | | | | | | | | | | | | | | | | 18 | | | | -16 322 | | | | | | | | 70 | | | | 16 361 | | | | 16 361 | | | 14. Deposits with other institutions |
| | -1 153 | | | | | | | | | | | | | | | | | | | | | | | | | | | | -6 191 | | | | | | | | | | | | -1 153 | | | | -1 153 | | | 15. Treasury bills |
| | | | | 432 | | | | -3 | | | | | | | | -252 | | | | 1 | | | | -2 440 | | | | 3 365 | | | | | | | | | | | | 5 074 | | | | 5 074 | | | 16. Other bills |
| | -198 | | | | | | | | -1 685 | | | | | | | | -1 030 | | | | | | | | 24 794 | | | | | | | | 35 858 | | | | | | | | 51 916 | | | | 51 916 | | | 17. Bank loans and advances |
| | | | | 544 | | | | 1 319 | | | | 441 | | | | 1 582 | | | | 183 | | | | -4 222 | | | | -32 400 | | | | 1 160 | | | | -7 006 | | | | 17 287 | | | | 17 287 | | | 18. Trade credit and short-term loans |
| | -9 456 | | | | | | | | | | | | | | | | | | | | -1 | | | | | | | | | | | | | | | | -3 | | | | -9 456 | | | | -9 456 | | | 19. Short-term government bonds |
| | 48 692 | | | | | | | | | | | | | | | | | | | | -39 | | | | | | | | | | | | | | | | | | | | 48 692 | | | | 48 692 | | | 20. Long-term government bonds |
| | 14 937 | | | | | | | | | | | | | | | | | | | | | | | | | | | | | | | | | | | | 17 615 | | | | 14 937 | | | | 14 937 | | | 21. Non-marketable government bonds6 |
| | | | | | | | | | | | | | | | | | | | | | | | | | | | | -1 645 | | | | | | | | | | | | | | | | | | | 22. Securities of local governments |
| | | | | | | | | | | | | | | | | 1 610 | | | | | | | | | | | | | | | | | | | | 3 | | | | 323 | | | | 323 | | | 23. Securities of public enterprises |
| | | | | 200 | | | | -30 | | | | -6 | | | | 1 047 | | | | 49 | | | | 3 916 | | | | -4 525 | | | | | | | | | | | | 15 454 | | | | 15 454 | | | 24. Other loan stock and preference shares |
| | | | | | | | | | | | | | | | | 16 072 | | | | 634 | | | | 61 332 | | | | 3 373 | | | | | | | | | | | | 102 174 | | | | 102 174 | | | 25. Ordinary shares |
| | | | | | | | | | | | | | | | | | | | | | | | | | | | | | | | | | | | | | | | | | | | | | | | 26. Foreign branch/head office balances |
| | -1 276 | | | | 5 436 | | | | -357 | | | | 114 | | | | 714 | | | | 800 | | | | 9 589 | | | | 11 635 | | | | 828 | | | | 1 | | | | 30 108 | | | | 30 108 | | | 27. Long-term loans |
| | | | | | | | | | | | | -6 | | | | -39 | | | | | | | | 4 423 | | | | | | | | 4 869 | | | | | | | | 12 879 | | | | 12 879 | | | 28. Mortgage loans |
| | | | | -366 | | | | | | | | | | | | | | | | -91 | | | | | | | | 2 469 | | | | | | | | 13 932 | | | | 16 713 | | | | 16 713 | | | 29. Interest in retirement and life funds7 |
| | -10 622 | | | | 23 922 | | | | -427 | | | | | | | | -1 391 | | | | 1 769 | | | | -5 855 | | | | 43 644 | | | | -7 694 | | | | -22 447 | | | | 22 548 | | | | 22 548 | | | 30. Amounts receivable/payable |
| | | | | | | | | 8 946 | | | | -14 335 | | | | -181 | | | | 134 | | | | -26 136 | | | | 35 464 | | | | 42 | | | | | | | | -8 213 | | | | -8 213 | | | 31. Other assets/liabilities |
| | | | | | | | | 316 | | | | -111 | | | | -61 | | | | 44 | | | | -271 | | | | 375 | | | | | | | | | | | | 104 | | | | 104 | | | 32. Balancing item |
S = Sources, i.e., net increase in liabilities at transaction value.
U = Uses, i.e., net increase in assets at transaction value.
KB231
| 1. | A negative amount reflects a decrease in that item. In the case of liabilities (sources) it denotes a reduction in the available sources of funds and in the case of assets (uses) it indicates an additional source of funds. |
| 2. | Including mutual banks and the Postbank. |
| 3. | Before April 2005 the Public Investment Commissioners. |
| 4. | As taken from the national income (and production) accounts. |
| 5. | Namely deposits with the South African Reserve Bank (including coin liabilities), Corporation for Public Deposits, banks, the Land Bank, mutual banks and the Postbank. |
| 6. | Non-marketable bonds and other Treasury bills. |
| 7. | Members’ interest in the reserves of retirement and all insurance funds. |
| | | | |
| Quarterly Bulletin June 2013 | | | | 89 |

Notes to tables
Producer prices: Tables S–142 and S–154
Statistics South Africa introduced a new methodology to calculate the producer price index (PPI) with the publication of the January 2013 PPI data. The headline PPI for domestic output was discontinued and replaced with five industry-specific PPIs that reflect the stages of domestic production, namely a final manufactured goods PPI; an intermediate manufactured goods PPI; an electricity and water PPI; a mining PPI; and an agriculture, forestry and fishing PPI.
Statistics South Africa views the PPI for final manufactured goods as the new headline PPI measure, as it best reflects the effects of price changes through the stages of production. Table S–142 will henceforth capture the five new PPI measures, as well as the seven subcategories with the largest weighting in the PPI for final manufactured goods.
In Table S–154 the rates of change captured as key information on producer prices have been amended to show the five new industry-specific PPIs.
| | |
| | | Quarterly Bulletin June 2013 |