Exhibit 99.F
Budget Review
2013
National Treasury
Republic of South Africa
27 February 2013

| | |
ISBN: | | 978-0-621-41455-4 |
RP: | | 344/2012 |
The Budget Review is compiled using the latest available information from departmental and other sources. Some of this information is unaudited or subject to revision.
To obtain additional copies of this document, please contact:
Communications Directorate
National Treasury
Private Bag X115
Pretoria
0001
South Africa
Tel: +27 12 315 5526
Fax: +27 12 315 5126
The document is also available on the internet at: www.treasury.gov.za.
ii
Foreword
The 2013 Budget is about national development and fiscal sustainability.
It is the first budget in which government’s plans to implement the National Development Plan (NDP) are beginning to take shape. The plan expresses the central priorities of public policy: eliminating poverty and reducing inequality, with a focus on lowering the costs of living and doing business, increasing exports, creating more jobs and making economic growth more inclusive. Government departments will increasingly align their planning and expenditure to meet the objectives of the NDP. At the same time, growing collaborative dialogue between government, the private sector, trade unions and civil society is needed to make the plan a reality.
The national infrastructure programme is the most immediate contribution to the goals of the NDP. Capital investments in economic and social infrastructure will relieve serious constraints in electricity, transport, liquid fuels, water and housing, allowing for improved economic growth and quality of life for all South Africans. A total of R827 billion is budgeted for infrastructure over the next three years, with a wide range of additional projects under consideration. Decisions on whether to proceed with these investments will be taken on the basis of their contribution to long-term development and value for money.
This budget is also an expression of government’s resolve, in the face of difficult economic conditions, to maintain firm control over expenditure, ensuring that South Africa’s finances remain sustainable so that in 10, 20 or 30 years our children do not have to pay for what we do today.
For five years, government has been budgeting in the context of the global financial crisis and its long-term consequences. Although there are signs that growth will begin to accelerate over the medium term, the risks abound and the world economic outlook remains subdued. South Africa’s economy has continued to grow over the past year, but more slowly than anticipated, as a result of both cyclical and structural factors. As a result, revenue has underperformed. A budget deficit of 5.2 per cent is projected for 2012/13, narrowing to 3.1 per cent by 2015/16.
The 2012 Medium Term Budget Policy Statement noted that if the economic environment were to deteriorate, realising government’s fiscal objectives would require a reconsideration of spending and revenue plans. To ensure that the deficit is narrowed and that the fiscus moves towards debt stabilisation, government is trimming its medium-term spending plans by R10.4 billion.
Government will ensure that national development is financed in a fiscally responsible manner, so that future generations inherit a healthy, growing economy that is creating jobs and that is not burdened by the chains of the past. We will relentlessly look for opportunities to improve the efficacy of spending and tighten supply chain management, starting with national and provincial government.
Given the fiscally constrained environment, this has been a challenging budget to prepare. I would like to acknowledge the hard work by the Ministers’ Committee on the Budget, Cabinet and my colleagues across government, who have helped to make some tough decisions.
I extend thanks particularly to Minister of Finance Gordhan and Deputy Minister Nene for their guidance, energy and determination. And as always, I acknowledge the dedication and skills of the staff of the National Treasury, who set the bar for accountability and transparency in public finance.

Lungisa Fuzile
Director-General: National Treasury
iii
Highlights of the 2013 Budget
Economic recovery and employment
| | • | | Economic growth projected at 2.7 per cent in 2013, 3.5 per cent in 2014 and 3.8 per cent in 2015. |
| | • | | Consumer price inflation to remain within target band over medium term. |
| | • | | Current account deficit to average 6.2 per cent over next three years. |
| | • | | Moderate employment growth expected over medium term. Pace of job creation depends on faster private-sector growth. |
Budget framework
| | • | | Tax revenue for 2012/13 expected to be R16.3 billion below 2012 Budget estimate. |
| | • | | Spending cuts of R10.4 billion over next three years in response to tight fiscal conditions. |
| | • | | Contingency reserve reduced by R23.5 billion over medium term. |
| | • | | Real growth in spending to average 2.3 per cent over medium-term expenditure framework period. |
| | • | | Budget deficit of 5.2 per cent of GDP expected for 2012/13, narrowing to 3.1 per cent in 2015/16. |
| | • | | Debt stock as percentage of GDP to stabilise at about 40 per cent in 2015/16. |
Tax proposals
| | • | | Personal income tax relief of R7 billion. |
| | • | | Employment incentives to support young work seekers and special economic zones. |
| | • | | Tax relief for small businesses. |
| | • | | Tax treatment of contributions to pension, retirement annuity and provident funds to be harmonised. |
| | • | | Phased implementation of carbon tax proposed. |
| | • | | Increase in general fuel levy of 15c/l. |
| | • | | Malt beer increases by 7.5c to R1.08 per 340ml can. |
| | • | | Unfortified wine increases by 15c per 750ml bottle. |
| | • | | Ciders and alcoholic fruit beverages increase by 7.3c per 330ml bottle. |
| | • | | Spirits increase by R3.60 to R39.60 per 750ml bottle. |
| | • | | Cigarettes increase by 60c to R10.92 per packet of 20. |
Additions to spending plans over next three years
| | • | | R5.2 billion for local government equitable share to help smaller municipalities meet developmental commitments. |
| | • | | R4.2 billion to provincial equitable share to phase in adjustments resulting from Census 2011. |
| | • | | R3.2 billion to Passenger Rail Association of South Africa for rail signalling infrastructure. |
| | • | | R2.6 billion for regional bulk water infrastructure. |
| | • | | R1.9 billion for the municipal water infrastructure grant. |
| | • | | R1.5 billion for De Hoop dam. |
| | • | | R1.4 billion to South African National Roads Agency Limited for road construction and maintenance. |
| | • | | R1.1 billion for Square Kilometre Array and R0.6 billion for science and technology infrastructure. |
| | • | | R1 billion to provinces to increase number of teachers and R0.8 billion for grade R teachers. |
| | • | | R1 billion to human settlements grant. |
| | • | | R0.9 billion to integrated national electrification programme. |
iv
Contents
| | | | | | |
| Chapter 1 | | A new trajectory for national development | | | 1 | |
| | Overview | | | 1 | |
| | Fiscal sustainability | | | 4 | |
| | Overview of the 2013 Budget Review | | | 5 | |
| | Budget documentation | | | 10 | |
| | Conclusion | | | 10 | |
| | |
Chapter 2 | | Economic outlook | | | 11 | |
| | Overview | | | 11 | |
| | Global outlook | | | 12 | |
| | Domestic outlook | | | 15 | |
| | Trends in the real economy | | | 17 | |
| | Toward structural change in the real economy | | | 21 | |
| | Labour market | | | 22 | |
| | Domestic expenditure | | | 24 | |
| | Monetary and financial sector developments | | | 26 | |
| | Balance of payments | | | 27 | |
| | Conclusion | | | 30 | |
| | |
Chapter 3 | | Fiscal policy | | | 31 | |
| | Overview | | | 31 | |
| | Revenue and spending trends | | | 33 | |
| | Fiscal sustainability | | | 39 | |
| | Conclusion | | | 44 | |
| | |
Chapter 4 | | Revenue trends and tax proposals | | | 45 | |
| | Overview | | | 45 | |
| | Consolidated budget revenue – revised estimates | | | 46 | |
| | Long-term tax revenue trends | | | 47 | |
| | Direct tax relief measures | | | 49 | |
| | Protecting the tax base | | | 54 | |
| | Longer-term tax considerations | | | 56 | |
| | Indirect tax proposals | | | 57 | |
| | Revenue impact of tax proposals | | | 59 | |
| | Medium-term revenue outlook | | | 60 | |
| | Tax administration | | | 62 | |
| | Tax policy research projects | | | 63 | |
| | Conclusion | | | 63 | |
| | |
Chapter 5 | | Asset and liability management | | | 65 | |
| | Overview | | | 65 | |
| | Developments in South Africa’s debt markets | | | 67 | |
| | Consolidated borrowing requirement | | | 68 | |
| | National government borrowing requirement | | | 69 | |
| | Financing the national borrowing requirement | | | 69 | |
| | Debt-service costs | | | 73 | |
| | Government’s debt portfolio | | | 74 | |
| | State-owned companies | | | 76 | |
| | Development finance institutions | | | 78 | |
| | Conclusion | | | 80 | |
v
| | | | | | |
| | |
Chapter 6 | | Social security and the social wage | | | 81 | |
| | Overview | | | 81 | |
| | Social assistance and welfare services | | | 84 | |
| | Towards quality health care for all | | | 87 | |
| | Education | | | 88 | |
| | Transforming human settlements | | | 89 | |
| | Contributory social security | | | 91 | |
| | Retirement reform | | | 93 | |
| | Conclusion | | | 94 | |
| | |
Chapter 7 | | Infrastructure | | | 95 | |
| | Overview | | | 95 | |
| | Sector update | | | 97 | |
| | Improving infrastructure delivery | | | 103 | |
| | Conclusion | | | 108 | |
| | |
Chapter 8 | | Medium-term expenditure and division of revenue | | | 109 | |
| | Overview | | | 109 | |
| | Division of national revenue | | | 110 | |
| | Expenditure outcome and revised estimate: 2011/12 and 2012/13 | | | 117 | |
| | Consolidated government expenditure | | | 117 | |
| | Revised medium-term expenditure plans | | | 120 | |
| | Conclusion | | | 128 | |
| | |
Annexure A | | Report of the Minister of Finance to Parliament | | | 131 | |
| | |
Annexure B | | Statistical tables | | | 139 | |
| | |
Annexure C | | Miscellaneous tax amendments | | | 177 | |
| | |
Annexure D | | Summary of Budget | | | 197 | |
| | |
Annexure E | | Glossary | | | 201 | |
vi
Tables
| | | | | | |
| 1.1 | | Macroeconomic outlook – summary | | | 6 | |
| 1.2 | | Consolidated government fiscal framework | | | 6 | |
| 1.3 | | Summary of tax proposals | | | 7 | |
| 1.4 | | Projected state debt and debt-service cost | | | 7 | |
| 1.5 | | Consolidated government expenditure by function | | | 8 | |
| 1.6 | | Public-sector infrastructure spending, 2011/12 – 2015/16 | | | 9 | |
| 1.7 | | Division of Revenue | | | 10 | |
| | |
| 2.1 | | Annual percentage change in GDP and consumer prices in selected regions/countries, 2012 – 2014 | | | 12 | |
| 2.2 | | Macroeconomic performance and projections, 2009 – 2015 | | | 16 | |
| 2.3 | | Macroeconomic performance and projections, 2009/10 – 2015/16 | | | 17 | |
| 2.4 | | Sector growth trends, 2000 – 2012 | | | 18 | |
| 2.5 | | Components of domestic demand, 2010 – 2012 | | | 24 | |
| 2.6 | | Composition of household credit extension, 2010 – 2012 | | | 26 | |
| 2.7 | | Current account balance, 2007 – 2012 | | | 28 | |
| 2.8 | | Financial account of the balance of payments, 2007 – 2012 | | | 29 | |
| | |
| 3.1 | | Consolidated fiscal framework, 2009/10 – 2015/16 | | | 33 | |
| 3.2 | | Consolidated government budget revenue, 2009/10 – 2015/16 | | | 35 | |
| 3.3 | | Revisions to revenue outcomes and projections, 2011/12 – 2014/15 | | | 36 | |
| 3.4 | | Main budget non-interest expenditure, 2010/11 – 2015/16 | | | 36 | |
| 3.5 | | Consolidated government expenditure, 2009/10 – 2015/16 | | | 37 | |
| 3.6 | | Revised estimates of consolidated government expenditure, 2012/13 – 2014/15 | | | 38 | |
| 3.7 | | Composition of spending by economic classification, 2011/12 and 2015/16 | | | 39 | |
| 3.8 | | Consolidated deficit, 2009/10 – 2015/16 | | | 39 | |
| 3.9 | | Current and capital balances, 2010/11 – 2015/16 | | | 40 | |
| 3.10 | | Public-sector borrowing requirement, 2009/10 – 2015/16 | | | 40 | |
| | |
| 4.1 | | Budget estimates and revenue outcome, 2011/12 and 2012/13 | | | 47 | |
| 4.2 | | Nominal tax revenue collections, 2007/08 – 2012/13 | | | 49 | |
| 4.3 | | Mining sector: corporate income tax and mineral and petroleum royalties 2005/06 – 2012/13 | | | 49 | |
| 4.4 | | Personal income tax rate and bracket adjustments, 2012/13 – 2013/14 | | | 50 | |
| 4.5 | | Estimates of individual taxpayers and taxable income, 2013/14 | | | 50 | |
| 4.6 | | Small business corporations, 2012/13 – 2013/14 | | | 53 | |
| 4.7 | | Total combined fuel taxes on petrol and diesel, 2011/12 – 2013/14 | | | 58 | |
| 4.8 | | Changes in specific excise duties, 2013/14 | | | 59 | |
| 4.9 | | Impact of tax proposals on 2013/14 revenue | | | 60 | |
| 4.10 | | Budget revenue, 2009/10 – 2015/16 | | | 61 | |
| 4.11 | | Summary of tax expenditure estimates, 2007/08 – 2010/11 | | | 62 | |
| | |
| 5.1 | | Ownership of domestic government bonds, 2008 – 2012 | | | 67 | |
| 5.2 | | Financing of consolidated government net borrowing requirement, 2009/10 – 2015/16 | | | 68 | |
| 5.3 | | National government net borrowing requirement, 2011/12 – 2015/16 | | | 69 | |
| 5.4 | | Financing of national government net borrowing requirement, 2011/12 – 2015/16 | | | 70 | |
| 5.5 | | Domestic short-term borrowing, 2012/13 – 2013/14 | | | 70 | |
| 5.6 | | Domestic long-term market loan issuance, 2012/13 | | | 71 | |
| 5.7 | | New domestic government bonds, 2013/14 | | | 71 | |
| 5.8 | | Domestic bond switch programme, 2012/13 | | | 72 | |
| 5.9 | | Change in cash balances, 2011/12 – 2015/16 | | | 73 | |
| 5.10 | | National government debt-service costs, 2011/12 – 2015/16 | | | 74 | |
| 5.11 | | Total national government debt, 2009/10 – 2015/16 | | | 74 | |
vii
| | | | | | |
| 5.12 | | Composition of provisions and contingent liabilities, 2011/12 – 2015/16 | | | 75 | |
| 5.13 | | Guarantee exposure to major state-owned companies and development finance institutions, 2011/12 – 2012/13 | | | 75 | |
| 5.14 | | Major state-owned companies’ capital expenditure programmes, 2011/12 – 2015/16 | | | 76 | |
| 5.15 | | Funding sources for state-owned companies, 2011/12 – 2015/16 | | | 77 | |
| 5.16 | | Consolidated balance sheets of state-owned companies, 2007/08 – 2011/12 | | | 77 | |
| | |
| 6.1 | | Monthly social grant values, 2012/13 and 2013/14 | | | 84 | |
| 6.2 | | Social grant beneficiary numbers by type and province, 2009/10 – 2015/16 | | | 85 | |
| 6.3 | | Social grant trends as a percentage of GDP, 2009/10 – 2015/16 | | | 86 | |
| 6.4 | | Key mortality indicators, 2009 – 2011 | | | 87 | |
| 6.5 | | Expansion of no-fee schools, 2007 and 2012 | | | 88 | |
| 6.6 | | UIF benefits and beneficiaries, 2009/10 – 2012/13 | | | 92 | |
| 6.7 | | Social security funds, 2009/10 – 2015/16 | | | 93 | |
| | |
| 7.1 | | Mega-projects under construction, 2013 – 2023 | | | 97 | |
| 7.2 | | Public-sector infrastructure expenditure by area of responsibility, 2011/12 – 2015/16 | | | 103 | |
| 7.3 | | Major infrastructure projects | | | 104 | |
| | |
| 8.1 | | Division of nationally raised revenue, 2009/10 – 2015/16 | | | 111 | |
| 8.2 | | Total transfers to provinces, 2011/12 – 2015/16 | | | 112 | |
| 8.3 | | Conditional grants to provinces, 2012/13 – 2015/16 | | | 114 | |
| 8.4 | | National transfers to local government, 2009/10 – 2015/16 | | | 115 | |
| 8.5 | | Consolidated government expenditure by function, 2012/13 – 2015/16 | | | 118 | |
| 8.6 | | Additional allocations to infrastructure project | | | 119 | |
| 8.7 | | Employment and social security expenditure, 2009/10 – 2015/16 | | | 120 | |
| 8.8 | | Health and social protection expenditure, 2009/10 – 2015/16 | | | 121 | |
| 8.9 | | Social grants expenditure, 2009/10 – 2015/16 | | | 122 | |
| 8.10 | | Education, sport and culture expenditure, 2009/10 – 2015/16 | | | 123 | |
| 8.11 | | Economic services and environmental protection expenditure, 2009/10 – 2015/16 | | | 124 | |
| 8.12 | | Science and technology expenditure, 2009/10 – 2015/16 | | | 125 | |
| 8.13 | | Transport, energy and communications expenditure, 2009/10 – 2015/16 | | | 126 | |
| 8.14 | | Local government, housing and community amenities expenditure, 2009/10 – 2015/16 | | | 126 | |
| 8.15 | | General public services expenditure, 2009/10 – 2015/16 | | | 127 | |
| 8.16 | | Defence, public order and safety expenditure, 2009/10 – 2015/16 | | | 128 | |
| | |
| Figures | | | | | | |
| | |
| 2.1 | | Commodity price trends, 2006 – 2013 | | | 14 | |
| 2.2 | | Contribution to annual manufacturing production growth by sector and weights, 2006 – 2012 | | | 19 | |
| 2.3 | | Annual growth in non-agricultural gross value added and formal employment, 2007 – 2012 | | | 22 | |
| 2.4 | | Contributions to real investment growth, 2005 – 2012 | | | 25 | |
| 2.5 | | Components of the trade balance, 2005 – 2012 | | | 28 | |
| 2.6 | | Trends in the rand and other emerging market currencies against the US dollar, 2010 – 2013 | | | 30 | |
| | |
| 3.1 | | Tax revenue performance and projections, 2005/06 – 2015/16 | | | 35 | |
| 3.2 | | Real growth in expenditure by economic classification, outcomes for 2008/09 – 2011/12 and projections
for 2012/13 –2015/16 | | | 38 | |
| 3.3 | | South Africa’s gross debt-to-GDP ratio compared with peer economies, 2000 – 2016 | | | 41 | |
| 3.4 | | Net government debt, 2005/06 – 2016/17 | | | 42 | |
| | |
| 4.1 | | Gross tax revenue as percentage of GDP, 1983/84 – 2012/13 | | | 48 | |
viii
| | | | | | |
| 6.1 | | Means tests and the distribution of income | | | 82 | |
| 6.2 | | Spending on the social wage, 2002/03 – 2012/13 | | | 83 | |
| 6.3 | | Free housing and serviced sites, 1994/95 – 2011/12 | | | 89 | |
| 6.4 | | Allocations to local government equitable share, 2009/10 – 2013/14 | | | 90 | |
| 6.5 | | Households with access to free basic services, 2011 | | | 91 | |
| | |
| 7.1 | | Public-and private-sector capital investment as share of GDP, 1960 – 2011 | | | 96 | |
| 7.2 | | Planning and project development | | | 106 | |
| | |
| 8.1 | | Population growth by province, 2001 – 2011 | | | 111 | |
| 8.2 | | Equitable share allocations per qualifying household by type of municipality, 2012/13 and 2013/14 | | | 116 | |
ix
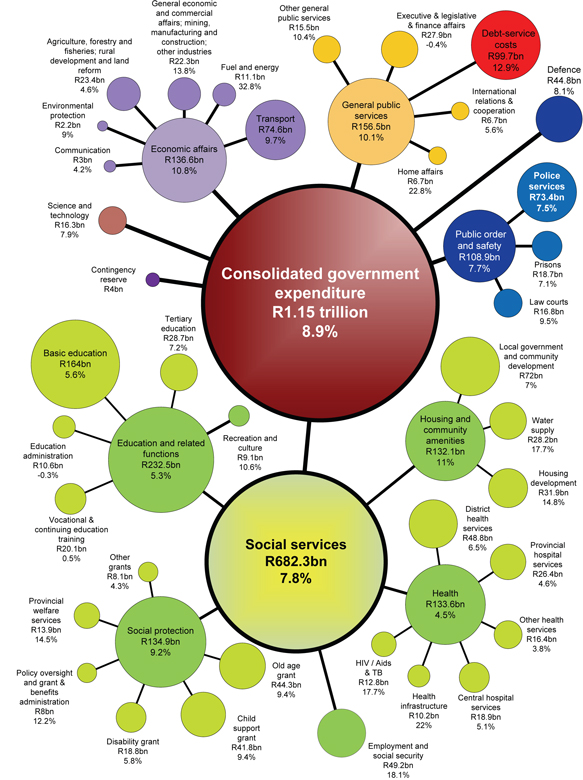
Note: Consolidated government expenditure, 2013/14. Percentages reflect growth relative to 2012/13 estimated outcome.
x
1
A new trajectory for
national development
In brief
| • | | The 2013 Budget is the first to be tabled within the framework of the National Development Plan (NDP). The NDP sets out an integrated strategy for accelerating growth, eliminating poverty and reducing inequality – recognising that South Africa’s urbanising, youthful population is a strength on which to build. |
| • | | While development is a long-term process, South Africa can achieve more in the short term if government, business, labour and civil society reach consensus on national priorities. |
| • | | The economic outlook is constrained by a difficult global environment and domestic restructuring challenges. Gross domestic product (GDP) growth of 2.7 per cent is expected in 2013, rising to 3.8 per cent in 2015. |
| • | | Strong capital investment by the public sector, the addition of electricity-generating capacity, relatively stable inflation and low interest rates will support improved economic performance. More rapid, inclusive growth requires steps to expand employment, provide greater policy certainty, improve education and training, accelerate infrastructure investment and strengthen regional linkages. |
| • | | The proposed medium-term-expenditure framework (MTEF) takes account of present fiscal constraints. A disciplined spending trajectory and improved GDP growth over the next three years will ensure the sustainability of the public finances. |
| | |
| ¢ Overview | | |
| |
The 2013 Budget is tabled at a challenging moment, with opportunities for change. While continued growth in a weak global environment demonstrates the resilience of the domestic economy, the pace of economic expansion is inadequate to address the country’s needs. South Africa has to give greater impetus to the investment and structural reforms that will lead to faster growth, generate jobs, create new opportunities for emerging businesses, and yield the revenue needed to meet long-term economic development and social expenditure goals. Economic growth is expected to increase from 2.5 per cent in 2012 to 3.8 per cent in 2015. To grow more rapidly, and to address the social pressures that arise from a high degree of inequality, a long-term strategy for national development needs to be implemented effectively. | | ‘We have all adopted the National Development Plan, which outlines the type of society we want to build, giving effect to the Constitution’ – President Zuma |
1
2013 BUDGET REVIEW
| | |
| Our complex transformation challenge is about housing, living conditions, service delivery, unemployment and the cost of living | | Social turbulence over the past year has highlighted both the urgency and complexity of the country’s transformation challenge. Industrial relations disputes are not confined to workplace concerns – they are also about housing and living conditions. Community unrest reflects uneven service delivery and local government tensions. Protests against rising costs also signal frustration at the absence of jobs. Our challenge is to address not the symptoms, but the root causes of public dissatisfaction. The National Planning Commission has proposed a development vision for 2030, and a plan for getting there. The Commission has cautioned that South Africa’s development objectives cannot be achieved in a few years, but rapid progress is possible if consensus can be reached on priorities, key programmes, and the roles and responsibilities of government, business, labour and civil society. National Development Plan: a new trajectory |
| ‘Alongside hard work and effort, capabilities and the opportunities that flow from development enable individuals to live the lives to which they aspire. A developmental state builds the capabilities of people to improve their own lives, while intervening to correct historical inequalities. Neither government nor the market can develop the necessary capabilities on their own.’ – NDP 2030: Our Future, Make it Work | | The NDP provides a broad strategic framework to put the economy and society on a new trajectory. It recognises that ours is a youthful, urbanising society, and that this presents opportunities for growth and development. It sets out a wide range of actions needed to boost growth, eliminate poverty and reduce inequality, beginning with an approach to change that focuses on enhanced capabilities and an active citizenry. The NDP was prepared by an expert commission, and drew on extensive research and consultation through public forums with thousands of South Africans. It points out that while government will play a significant role, all sectors of society are called on to make the plan a reality. The NDP also recognises that development has never been a linear process, one step following another in a predictable and orderly sequence. Instead, development requires a multidimensional framework of interacting initiatives, policies and investments that generate a virtuous cycle of progress, with actions in one area supporting advances in others. Several strategic imperatives emerge strongly from the NDP, and have implications for public policy and budget priorities: • South Africa’s population is young. A million people leave school every year, but the economy has yet to adapt to the imperative of more rapid job creation. • Urbanisation is gathering momentum, bringing greater demands on housing, services, schools and hospitals in towns and cities. • The quality of education and training opportunities are critical determinants of long-term growth and equality of opportunity. • More rapid economic growth requires a more diversified economy, and greater adaptability to changing market opportunities and technology. • Links with other emerging markets and fast-growing African economies represent strong growth opportunities. • While there are costs associated with adapting to a low-carbon future, such adjustments can lead to new industries and new jobs. • Related to all of these challenges is the overwhelming imperative to build a more equal society, for a shared future. |
2
CHAPTER 1: A NEW TRAJECTORY FOR NATIONAL DEVELOPMENT
| | |
| |
| These themes find practical expression in the 2013 Budget, and will continue to inform public policy and contribute to better planning and programme implementation in the period ahead. | | |
Critical actions to promote growth and development
The NDP sets out 10 “critical actions” on which government policy can proceed in partnership with the private sector, trade unions and civil society:
| • | | A social compact to reduce poverty and inequality, and raise employment and investment. |
| • | | A strategy to address poverty and its effects by broadening access to employment, strengthening the social wage, improving public transport and raising rural incomes. |
| • | | Steps by the state to professionalise the public service, strengthen accountability, improve coordination and prosecute corruption. |
| • | | Boost private investment in labour-intensive areas, competitiveness and exports, with adjustments to lower the risk of hiring younger workers. |
| • | | An education accountability chain, with lines of responsibility from state to classroom. |
| • | | Phase in national health insurance, with a focus on upgrading public health facilities, producing more health professionals and reducing the relative cost of private health care. |
| • | | Public infrastructure investment to reach 10 per cent of GDP, financed through tariffs, public-private partnerships, taxes and loans and focused on transport, energy and water. |
| • | | Interventions to ensure environmental sustainability and resilience to future shocks. |
| • | | New spatial norms and standards – densifying cities, improving transport, locating jobs closer to where people live, upgrading informal settlements and fixing housing market gaps. |
| • | | Reduce crime by strengthening criminal justice and improving community environments. |
Aligning the budget to the NDP
| | |
| |
The 2013 Budget marks the beginning of a process through which government departments and agencies will align their planning and expenditure to the NDP. As the plan itself states, “the NDP will shape resource allocations over the next two decades, but it will not determine annual budgets. The best way to generate resources to implement the plan is to grow the economy faster.” | | ‘The best way to generate resources to implement the plan is to grow the economy faster’ – NDP 2030 |
| |
There is vast potential to increase existing alignment between budget priorities and the NDP – for example, in government’s intent to shift resources towards investment that grows the economy, broadens opportunities and enhances capabilities. Other areas of continuing focus include education, job creation and state capacity building – which have enjoyed priority in resource allocation over several years. Cross-cutting initiatives such as the New Growth Path also address these concerns. | | |
| |
| Over the longer term, the integration of the NDP into government’s strategic and operational plans will strengthen alignment between NDP priorities and budgets, and improve coordination across complementary areas of policy and expenditure. The work of the Presidential Infrastructure Coordinating Commission (PICC) is already contributing to improved planning and budgeting for strategic infrastructure programmes. Initiatives are also under way to improve coordination in state capacity building, human capital development and economic policy implementation. | | Allocation of public resources should prioritise infrastructure investment, institution-building and human capital development |
3
2013 BUDGET REVIEW
Some short-term NDP focus areas
Economy
| • | | Reviewing the regulatory environment for small, medium and micro enterprises |
| • | | Speeding up land reform, expanding agricultural output and job creation |
| • | | Expanding public employment programmes |
| • | | Implementing employment incentives. |
State capacity
| • | | Clarifying delegations and strengthening performance accountability of heads of departments and state-owned entities |
| • | | Strengthening government accountability mechanisms |
| • | | Establishing graduate recruitment schemes for the public service and local government. |
Education
| • | | Improving and extending early childhood development programmes |
| • | | Introducing school inspectors |
| • | | Addressing deployment of excess teachers |
| • | | Securing internship placement for further education and training graduates. |
| | |
| | The NDP, government planning and a capable state |
| |
| Government is working to improve capacity for planning and implementation | | Identifying an effective response to a public policy challenge is not just about allocating funds. While many of the objectives contained in the NDP have been a part of the strategic planning and budget priority landscape for many years, service delivery in certain areas has fallen short of expectations due to lack of effective planning, inadequate state capacity and the absence of clear lines of responsibility. A large part of implementing the NDP is therefore about proper planning, building public-sector capacity and enhanced accountability chains. The next medium-term strategic framework will identify the NDP priority objectives and actions over the next five-year term of government. These priorities will be reflected in departmental strategic plans, with key actions set out in annual performance plans. Executive authorities and Parliament will hold departments and ministers accountable for meeting these objectives. |
| |
| Directors-general have begun a process to align long-term departmental plans with the NDP | | The Forum of South African Directors-General has begun a process to align the long-term plans of departments with the NDP, and to identify areas where policy change is required to ensure consistency and coherence. |
| |
| | ¢ Fiscal sustainability National development is a long-term project that must be financed sustainably. The children born in 2013, in 2023 or 2033 should not be burdened with spending cuts or tax increases to pay for debt incurred in the present. In line with this approach, the October 2012 Medium Term Budget Policy Statement noted that if the economic environment were to deteriorate, government would need to reassess its revenue and spending plans to ensure a narrowing of the budget deficit and a stabilisation of debt. |
4
CHAPTER 1: A NEW TRAJECTORY FOR NATIONAL DEVELOPMENT
| | |
| Over the past year the slow rate of economic growth has resulted in lower-than-anticipated tax revenue, leading to a widening of the budget deficit. To protect the sustainability of the fiscus, the 2013 Budget takes additional measures to control spending, reducing real expenditure growth to an average of 2.3 per cent over the next three years, compared with the 2.9 per cent signalled in October 2012. This results in the budget deficit declining from an expected 5.2 per cent of GDP in 2012/13 to 3.1 per cent by 2015/16. Debt will stabilise at a peak of about 40 per cent of GDP in 2015/16, declining in subsequent years. | | 2013 Budget takes additional steps to maintain firm control of spending |
| |
| This fiscal approach requires government departments to do more with less, paying greater attention to the efficiency with which they spend public funds, and prioritising resource allocation to strengthen service delivery. Agencies that exercise oversight of public funds – such as Parliament, the Department of Performance Monitoring and Evaluation, the Auditor-General, the Accountant-General and the National Treasury – will need to strengthen capacity to ensure that government not only meets its financial targets, but also achieves the intended developmental outcomes. | | Government at all levels needs to do more with less |
| |
| Government needs a fair and equitable tax system that meets its growth and development objectives. With this goal in mind, during 2013 the Minister of Finance will commission a review of current tax policies to ensure that public spending is supported by an appropriate revenue base. Part of this review will evaluate the current mining royalties regime with regard to its ability to suitably serve public finance priorities. | | Tax policy review to begin during 2013 |
| |
¢ Overview of the 2013 Budget Review Economic outlook Chapter 2 sets out the economic outlook on which government bases the budget. Since 2008, economic activity has remained subdued in many advanced economies. The slowdown in trade and investment has also affected emerging economies such as China, India and Brazil. The South African economy has grown since the 2009 recession, but has not achieved the rate of expansion and broadening participation recorded from 2003 to 2008. | | |
| |
| GDP growth is estimated to have been 2.5 per cent in 2012, and is projected to reach 2.7 per cent in 2013 and 3.8 per cent in 2015. Strong capital investment by the public sector, the addition of electricity-generating capacity, relatively stable inflation and low interest rates will be supportive of improved growth rates. The pace of economic recovery depends critically on the rate at which private investment and exports strengthen. As the policy environment becomes more stable, confidence returns and competitiveness improves, the pace of growth will accelerate. | | Strong public-sector capital investment, new electricity plants, stable inflation and low interest rates will support higher growth |
5
2013 BUDGET REVIEW
| | | | | | | | | | | | | | | | |
| Table 1.1 Macroeconomic outlook – summary | | | | | | | | | | | | | | | | |
| | | | |
| Real growth | | 2012 | | | 2013 | | | 2014 | | | 2015 | |
Percentage | | Estimate | | | Forecast | |
Household consumption | | | 3.4 | | | | 3.1 | | | | 3.7 | | | | 3.9 | |
Gross fixed capital formation | | | 6.4 | | | | 5.7 | | | | 5.9 | | | | 6.5 | |
Exports | | | 1.1 | | | | 3.9 | | | | 6.7 | | | | 7.2 | |
Imports | | | 7.2 | | | | 5.9 | | | | 7.2 | | | | 7.3 | |
Gross domestic product | | | 2.5 | | | | 2.7 | | | | 3.5 | | | | 3.8 | |
| | | | | | | | | | | | | | | | |
Consumer price inflation (CPI) | | | 5.7 | | | | 5.6 | | | | 5.5 | | | | 5.4 | |
Current account balance (% of GDP) | | | -6.1 | | | | -6.2 | | | | -6.3 | | | | -6.0 | |
| | | | | | | | | | | | | | | | |
| | |
| Improving the quality of education, accelerating capital investment and opening up the labour market will boost growth | | Over the medium term, the NDP provides a framework to focus attention on resolving problems in education, accelerating infrastructure investment, opening the labour market to new entrants and strengthening the capacity of the state – steps that will begin to raise the growth momentum of the economy. |
| |
| | Fiscal policy Chapter 3 discusses fiscal policy – the management of revenue, expenditure and debt – alongside changes to the budget framework. |
| | | | | | | | | | | | | | | | |
| Table 1.2 Consolidated government fiscal framework | |
| | | | |
| | | 2012/13 | | | 2013/14 | | | 2014/15 | | | 2015/16 | |
R billion | | Revised estimate | | | Medium-term estimates | |
Revenue | | | 887.8 | | | | 985.7 | | | | 1 091.1 | | | | 1 199.8 | |
Percentage of GDP | | | 27.7 | % | | | 28.0 | % | | | 28.1 | % | | | 28.1 | % |
Expenditure | | | 1 055.9 | | | | 1 149.4 | | | | 1 244.3 | | | | 1 334.1 | |
Percentage of GDP | | | 32.9 | % | | | 32.7 | % | | | 32.1 | % | | | 31.2 | % |
Budget balance | | | -168.0 | | | | -163.7 | | | | -153.2 | | | | -134.4 | |
Percentage of GDP | | | -5.2 | % | | | -4.6 | % | | | -3.9 | % | | | -3.1 | % |
| | | | | | | | | | | | | | | | |
Gross domestic product | | | 3 209.1 | | | | 3 520.3 | | | | 3 880.4 | | | | 4 270.8 | |
| | | | | | | | | | | | | | | | |
| | |
| Fiscal sustainability is supported by curbs in expenditure growth | | South Africa’s fiscal framework remains grounded in a sustainable, countercyclical approach to managing revenue and expenditure. Short-term weakness in the economy is projected to result in a deficit of 5.2 per cent of GDP in 2012/13. To ensure fiscal sustainability, government has curbed the growth in spending by reducing allocations and the contingency reserve. Revenue collection is expected to improve in line with economic growth, narrowing deficit to 3.1 per cent of GDP by 2015/16. Continuing its efforts to improve the impact of spending, government will conduct expenditure reviews aimed at reducing waste and improving efficiency. The National Treasury has drafted a long-term fiscal report that considers 15-25 year budgetary projections based on demographic trends and alternative economic scenarios. |
6
CHAPTER 1: A NEW TRAJECTORY FOR NATIONAL DEVELOPMENT
| | |
| Revenue trends and tax proposals | | |
| |
| Chapter 4 discusses revenue trends and tax proposals. The revised tax revenue estimate for 2012/13 is R16.3 billion lower than the estimate made in the 2012 Budget. Corporate and personal income taxes have not met budget projections. More rapid growth in revenue collection depends on an improved economic growth outlook. | | Revised revenue estimate for 2012/13 is R16.3 billion lower than 2012 estimate |
| | | | | | | | | | | | |
| Table 1.3 Summary of tax proposals | | | | | | | | | | | | |
| | |
| | | 2012/13 | | | 2013/14 | |
R billion | | Budget
estimate | | | Revised
estimate | | | Budget
estimate | |
Tax revenue (gross) | | | 826.4 | | | | 810.2 | | | | 900.4 | |
Non-tax revenue | | | 15.1 | | | | 14.5 | | | | 18.3 | |
Less: SACU payments | | | -42.2 | | | | -42.2 | | | | -43.4 | |
| | | | | | | | | | | | |
National budget revenue | | | 799.3 | | | | 782.5 | | | | | |
| | | | | | | | | | | | |
Tax revenue (before tax proposals) | | | | | | | | | | | 900.4 | |
| | | | | | | | | | | | |
Tax proposals | | | | | | | | | | | -2.4 | |
(Net) personal income tax relief | | | | | | | | | | | -7.4 | |
Business taxes | | | | | | | | | | | -0.9 | |
Taxes on goods and services | | | | | | | | | | | 5.8 | |
Tax revenue (after tax proposals) | | | | | | | | | | | 898.0 | |
| | | | | | | | | | | | |
Budget revenue (after tax proposals) | | | | | | | | | | | 987.2 | |
| | | | | | | | | | | | |
| | |
| The 2013 tax proposals include: | | Personal income tax relief and tax incentives for employment |
• Personal income tax relief of R7 billion. • Employment incentives targeting special economic zones and young work seekers. • Steps to encourage higher savings. • Requirements that foreign businesses that sell digital goods in South Africa to register for VAT. • Several measures to close tax loopholes. Asset and liability management | | |
| |
| Chapter 5 discusses government’s debt management and borrowing requirements. Government’s debt strategy is intended to keep the cost of debt as low as possible, ensure access to global and domestic markets, diversify funding instruments and encourage the growth of South Africa’s liquid capital market. | | Debt strategy aims to keep interest costs low |
Table 1.4 Projected state debt and debt-service costs
| | | | | | | | | | | | | | | | |
R billion | | 2012/13 | | | 2013/14 | | | 2014/15 | | | 2015/16 | |
Net loan debt | | | 1 165.1 | | | | 1 357.3 | | | | 1 544.5 | | | | 1 719.8 | |
Percentage of GDP | | | 36.3 | % | | | 38.6 | % | | | 39.8 | % | | | 40.3 | % |
Debt-service costs | | | 88.3 | | | | 99.7 | | | | 108.7 | | | | 118.2 | |
Percentage of GDP | | | 2.8 | % | | | 2.8 | % | | | 2.8 | % | | | 2.8 | % |
| | | | | | | | | | | | | | | | |
| | |
| Government’s gross borrowing requirement of R215.5 billion in 2013/14 will be financed mainly with domestic bonds. Net loan debt is projected to reach 38.6 per cent of GDP in 2013/14. Debt-service costs are expected to stabilise at 2.8 per cent of GDP in 2012/13. Total contingent liabilities, net loan debt and provisions will peak at 53.4 per cent of GDP in 2014/15. | | |
7
2013 BUDGET REVIEW
| | |
| State-owned companies plan R397 billion in infrastructure investments over next three years | | State-owned companies plan to spend R397 billion on infrastructure over the next three years. Government continues to support these companies to ensure that they can borrow at reasonable cost. Those facing persistent financial difficulties will be urgently reviewed to establish sustainability. |
| | Social security and the social wage Chapter 6 reviews the role of the social security system in providing income support and helping to alleviate poverty. |
| |
| Social wage contributes to reducing cost of living | | The NDP recognises that reducing the cost of living is essential for broadening economic participation and eliminating poverty. Public spending on social services, income assistance for vulnerable households and improvements in contributory social insurance will enhance this goal. Government spending on social development, health, education, housing and local amenities – the “social wage” – has more than doubled in real terms over the past decade and now accounts for almost 60 per cent of public expenditure. Social assistance provides a safety net for the most vulnerable and will contribute to the monthly incomes of over half of all households in 2013. |
| |
| National health insurance reforms to be piloted over medium term | | Further steps in retirement reform, improvements in contributory social insurance and piloting of national health insurance reforms will progress over the medium term. |
| | | | | | | | | | | | |
Table 1.5 Consolidated government expenditure by function | |
| | | 2012/13 | | | 2013/14 | | | % Average growth | |
R billion | | Revised
estimate | | | Budget
estimate | | | 2012/13 –
2015/16 | |
General public services | | | 53.8 | | | | 56.7 | | | | 6.5 | % |
Defence, public order and safety | | | 142.5 | | | | 153.7 | | | | 6.4 | % |
Economic infrastructure | | | 79.2 | | | | 88.6 | | | | 10.2 | % |
Economic services and environmental protection | | | 44.1 | | | | 48.0 | | | | 6.7 | % |
Local government, housing and community amenities | | | 119.0 | | | | 132.1 | | | | 10.1 | % |
Health and social protection | | | 251.3 | | | | 268.5 | | | | 6.8 | % |
Education,sport and culture | | | 220.9 | | | | 232.5 | | | | 6.2 | % |
Employment and social security | | | 41.7 | | | | 49.2 | | | | 13.5 | % |
Science and technology | | | 15.1 | | | | 16.3 | | | | 7.8 | % |
| | | | | | | | | | | | |
Allocated expenditure | | | 967.6 | | | | 1 045.6 | | | | 7.6 | % |
Debt-service cost | | | 88.3 | | | | 99.7 | | | | 10.2 | % |
Contingency reserve | | | — | | | | 4.0 | | | | | |
| | | | | | | | | | | | |
Consolidated expenditure1 | | | 1 055.9 | | | | 1 149.4 | | | | 8.1 | % |
| | | | | | | | | | | | |
| | |
| | 1. Consisting of national, provincial, social security funds and selected public entities. Refer to Annexure W2 for a detailed list of entities included Infrastructure Chapter 7 discusses public-sector infrastructure investment. Budgeted spending for public-sector infrastructure totals R827 billion over the next three years. |
8
CHAPTER 1: A NEW TRAJECTORY FOR NATIONAL DEVELOPMENT
| | |
A much larger set of projects is under consideration over the longer term. Decisions on which projects to implement will be guided by the NDP, accompanied by thorough assessments of feasibility and value for money. Government has a range of initiatives in place to address identified shortcomings in project management. The PICC has concentrated its efforts over the past year on improving planning and decision-making processes. The first of Eskom’s two new large, coal-fired power plants will begin producing electricity in 2014, significantly easing the country’s power constraints. Transnet’s pipeline, rail and port investments will gain further impetus in 2013. Construction and upgrading of dams, water transfer schemes, schools, hospitals, clinics and housing are under way. | | Infrastructure investment to be guided by NDP and feasibility assessment of projects |
Table 1.6 Public-sector infrastructure spending, 2011/12 – 2015/16
| | | | | | | | | | | | |
R million | | 2011/12
Outcome | | | 2012/13
Budget | | | MTEF
2013/14 –
2015/16 | |
National departments | | | 6 599 | | | | 10 802 | | | | 39 600 | |
Provincial departments | | | 43 449 | | | | 43 762 | | | | 147 685 | |
Local government | | | 33 239 | | | | 38 489 | | | | 150 607 | |
Extra-budgetary institutions1 and | | | 26 128 | | | | 33 652 | | | | 91 940 | |
public-private partnerships2 | | | | | | | | | | | | |
State-owned companies3 | | | 98 871 | | | | 129 200 | | | | 397 246 | |
| | | | | | | | | | | | |
Total | | | 208 286 | | | | 255 905 | | | | 827 078 | |
| | | | | | | | | | | | |
| | |
1. Includes SANRAL non-toll infrastructure investment and Trans-Caledon tunnel authority, which are defined as non-financial public enterprises in the Reserve Bank data 2. Public-private partnerships include project development funds, capital contribution and unitary payments 3. Excludes SANRAL capex funded through budget allocations from the fiscus Estimates provided to National Treasury by management of these companies Medium-term expenditure and division of revenue Chapter 8 presents government’s spending priorities over the medium term and the division of nationally raised revenue. The 2013 Budget provides for a division of revenue, after providing for state debt costs and a contingency reserve, of R951 billion in 2013/14, rising to R1.1 trillion in 2015/16. National departments are allocated 47.6 per cent of available funds, provincial government 43.5 per cent and local government 8.9 per cent in 2013/14. | | |
| The proposed budget framework reflects government’s continued commitment to investment in infrastructure, health, education and social welfare. Moderate growth in public spending is proposed. Taking into account the constrained fiscal environment, consolidated non-interest expenditure is projected to grow from R967.6 billion in 2012/13 to R1.2 trillion in 2015/16, increasing by 7.9 per cent a year. Debt-service costs will increase by 10.2 per cent a year to R118 billion in 2015/16. | | Consolidated non-interest expenditure to reach R1.2 trillion in 2015/16 |
9
2013 BUDGET REVIEW
| | | | | | | | | | | | | | | | |
| Table 1.7 Division of revenue | | | | | | | | | | | | | | | | |
| | | | |
R billion | | 2012/13 | | | 2013/14 | | | 2014/15 | | | 2015/16 | |
National allocations | | | 413.1 | | | | 452.5 | | | | 489.5 | | | | 521.7 | |
Provincial allocations | | | 388.5 | | | | 414.2 | | | | 441.7 | | | | 474.4 | |
Equitable share | | | 313.0 | | | | 337.6 | | | | 359.9 | | | | 383.7 | |
Conditional grants | | | 75.5 | | | | 76.6 | | | | 81.8 | | | | 90.7 | |
Local government allocations | | | 77.0 | | | | 84.7 | | | | 91.6 | | | | 101.5 | |
| | | | | | | | | | | | | | | | |
Total allocations | | | 878.6 | | | | 951.3 | | | | 1 022.8 | | | | 1 097.6 | |
| | | | | | | | | | | | | | | | |
Changes to baseline | | | | | | | | | | | | | | | | |
National allocations | | | 0.7 | | | | 6.3 | | | | 10.6 | | | | 24.8 | |
Provincial allocations | | | 4.0 | | | | 3.1 | | | | 4.7 | | | | 17.3 | |
Equitable share | | | 4.0 | | | | 8.7 | | | | 10.6 | | | | 18.3 | |
Conditional grants | | | 0.1 | | | | -5.6 | | | | -5.9 | | | | -1.0 | |
Local government allocations | | | — | | | | 1.0 | | | | 1.0 | | | | 7.0 | |
| | | | | | | | | | | �� | | | | | |
Total | | | 4.8 | | | | 10.4 | | | | 16.4 | | | | 49.0 | |
| | | | | | | | | | | | | | | | |
| | |
| | Government at all levels has contributed to savings and reprioritisation to support policy priorities. To ensure greater value for money, expenditure-control systems and procurement will be strengthened. ¢ Budget documentation The 2013 Budget Review includes the following annexures: • A: Report of the Minister of Finance to Parliament • B: Statistical tables • C: Miscellaneous tax amendments • D: Summary of Budget • E: Glossary Three additional annexures are available on the National Treasury website: • W1: Explanatory memorandum to the division of revenue • W2: Structure of the government accounts • W3: Gateway to Africa and other reforms The Budget Review accompanies several other documents and submissions tabled in Parliament on Budget Day. These include: • The Budget Speech • The Division of Revenue Bill and the Appropriation Bill • Estimates of National Expenditure • People’s Guide to the Budget. These and other fiscal and financial publications are available at www.treasury.gov.za. ¢ Conclusion Challenging times require South Africans to unify and give effect to the sound plans that we have adopted. While the global outlook is not expected to improve markedly, there are many areas of opportunity. A sound fiscal framework supports the sustainable financing of government spending, while progressive alignment between departmental budgets and the objectives of the NDP will bolster government’s contribution to development. |
10
Economic outlook
In brief
| | • | | South Africa’s economy continues to grow, but at a slower rate than previously expected. GDP growth is projected at 2.7 per cent in 2013, 3.5 per cent in 2014 and 3.8 per cent in 2015. |
| | • | | Faster economic growth will require greater private investment and improved trade performance. As the policy environment becomes more stable, the global economy recovers and confidence returns, South Africa’s opportunities for growth will expand. |
| | • | | Strong public-sector capital investment, additional electricity-generating capacity, relatively stable inflation, low interest rates and robust economic activity in southern Africa will contribute to a supportive environment for improved growth over the medium term. |
| | • | | Moderate employment growth is expected over the next three years. Job creation prospects depend largely on private-sector hiring as fiscal pressures constrain public-sector employment growth. |
| | • | | The current account deficit is forecast to average 6.2 per cent over the medium term. Consumer inflation is projected to remain within the 3-6 per cent target band over the next three years. |
| | • | | Implementing the National Development Plan (NDP) will strengthen growth and accelerate job creation, while broadening social development and economic participation. |
| | |
There are signs of improvement in the world economy. Policy actions during 2012 helped to avert new economic and fiscal crises in advanced economies. Yet buoyancy in world markets and improved sentiment should be assessed in the context of continued and widespread risk. Many advanced economies contracted during the fourth quarter of 2012 and global growth prospects are expected to improve only marginally, from 3.2 per cent in 2012 to 3.5 per cent in 2013. More rapid progress depends to a large degree on credible policy actions that promote increased confidence and investment, while securing fiscal sustainability. South Africa’s economy has continued to grow, but at a slower rate than projected at the time of the 2012 Budget. GDP growth is expected to reach 2.5 per cent in 2012 and 2.7 per cent in 2013, accelerating to 3.8 per cent in 2015. Strong capital investment by the public sector, the addition of electricity-generating capacity, relatively stable inflation and low interest | | GDP growth is a primary indicator of the health of an economy. Strong GDP growth generally indicates an economy where investment is increasing and jobs are being created. Since taxes are levied on economic activity, high GDP growth rates increase the size and value of the tax base that pays for public spending |
11
2013 BUDGET REVIEW
| | |
| | rates are expected to support improved growth rates over the medium term. But a far higher rate of growth is needed, particularly in the private sector, to tackle poverty, draw unemployed South Africans into economic activity and generate the revenue needed to support government’s long-term development plans. |
| |
| NDP can shift South Africa towards a new trajectory of growth and job creation | | The NDP provides a framework that can shift South Africa towards a new trajectory of economic growth and job creation. Over the medium term, focused attention to resolve problems in education, open the labour market to new entrants and strengthen the capacity of the state will ease current constraints to growth. Macroeconomic stability provides the foundation for the strong and sustainable growth and job creation envisioned in the NDP by supporting investment and confidence, and ensuring that future liabilities can be met. The framework for the 2013 Budget safeguards fiscal sustainability, and targets low and stable inflation. Concerted efforts by business, labour and government are needed to support the NDP and translate it into action. As government and the private sector take steps to implement the plan, progress will bolster business and consumer confidence, establish greater certainty about the economic trajectory and encourage more rapid investment. ¢ Global outlook |
| Global growth projected to pick up from 3.2 per cent in 2012 to 3.5 per cent in 2013 | | The International Monetary Fund (IMF) expects world economic growth to increase marginally from 3.2 per cent in 2012 to 3.5 per cent in 2013. Financial market volatility has declined but remains a concern, and recovery is uneven. Targeted monetary policy measures in advanced economies continue to ease financial conditions, boosting liquidity and asset prices. Emerging markets – particularly China and India – continue to lead global growth. |
Table 2.1 Annual percentage change in GDP and consumer prices in selected regions/countries, 2012 – 2014
| | | | | | | | | | | | | | | | | | | | | | | | |
| Region / country | | 2012 | | | 2013 | | | 2014 | | | 2012 | | | 2013 | | | 2014 | |
Percentage | | GDP projections1 | | | Consumer price index projections1 | |
World | | | 3.2 | | | | 3.5 | | | | 4.1 | | | | 4.0 | | | | 3.7 | | | | 3.6 | |
Advanced economies | | | 1.3 | | | | 1.4 | | | | 2.2 | | | | 1.9 | | | | 1.6 | | | | 1.8 | |
US | | | 2.3 | | | | 2.0 | | | | 3.0 | | | | 2.0 | | | | 1.8 | | | | 1.8 | |
Euro area | | | -0.4 | | | | -0.2 | | | | 1.0 | | | | 2.3 | | | | 1.6 | | | | 1.4 | |
UK | | | -0.2 | | | | 1.0 | | | | 1.9 | | | | 2.7 | | | | 1.9 | | | | 1.7 | |
Japan | | | 2.0 | | | | 1.2 | | | | 0.7 | | | | 0.0 | | | | -0.2 | | | | 2.1 | |
Emerging markets and developing economies | | | 5.1 | | | | 5.5 | | | | 5.9 | | | | 6.1 | | | | 5.8 | | | | 5.3 | |
Brazil | | | 1.0 | | | | 3.5 | | | | 4.0 | | | | 5.2 | | | | 4.9 | | | | 4.8 | |
Russia | | | 3.6 | | | | 3.7 | | | | 3.8 | | | | 5.1 | | | | 6.6 | | | | 6.5 | |
India | | | 4.5 | | | | 5.9 | | | | 6.4 | | | | 10.3 | | | | 9.7 | | | | 8.3 | |
China | | | 7.8 | | | | 8.2 | | | | 8.5 | | | | 3.0 | | | | 3.0 | | | | 3.0 | |
Sub-Saharan Africa | | | 4.8 | | | | 5.8 | | | | 5.7 | | | | 9.1 | | | | 7.1 | | | | 6.1 | |
South Africa2 | | | 2.5 | | | | 2.7 | | | | 3.5 | | | | 5.7 | | | | 5.6 | | | | 5.5 | |
1. IMF, World Economic Outlook, October 2012 and Update, January 2013
2. National Treasury forecasts
12
CHAPTER 2: ECONOMIC OUTLOOK
| | |
| Trends in major economies and regions | | |
| |
United States – Growth in the world’s largest economy is projected at 2 per cent in 2013, down from an estimated 2.3 per cent in 2012. Capital spending has improved, with signs of an incipient revival in the housing sector. Unemployment remains high. The Federal Reserve’s “quantitative easing” programme is expected to remain in place until there is a substantive improvement in the labour market. High levels of global liquidity have boosted financial flows to corporate and government bond markets, but banks remain cautious about increasing private credit extension, restraining the recovery in demand. Europe – The euro monetary area entered a deepening recession during the second half of 2012 and is expected to contract by 0.2 per cent in 2013. Bank deleveraging has had a severe effect on consumption and investment, particularly in Greece, Italy, Portugal and Spain, where high joblessness has dented confidence. The German economy, which until recently enjoyed a robust recovery and accounts for more than a quarter of eurozone GDP, contracted by 0.6 per cent in the fourth quarter of 2012. The fragility of bank balance sheets continues to pose a serious risk to financial stability, resulting in a number of bank recapitalisations. | | Weak growth in the US and recession in Europe |
| |
Emerging markets – Emerging market economies continue to grow more rapidly than developed economies. However, emerging market output growth weakened in 2012 as external demand softened. Fluctuations in investor risk appetite contributed to continued volatility in currencies and commodity prices. China’s economy is expected to grow by 8.2 per cent in 2013 as a result of lower interest rates, reduced reserve requirements for banks and public infrastructure spending. In the period ahead, a rebalancing of growth away from net exports and investment towards household consumption could affect international production, trade and commodity price trends. The IMF forecasts average growth of 8.5 per cent over the next five years, compared with 10.5 per cent over the previous two decades. The Chinese growth model, which has been reliant on a plentiful supply of low-wage workers, is beginning to confront the effects of rising real wages and large-scale demographic changes. Real GDP growth in India is projected to rise to 5.9 per cent in 2013 from 4.5 per cent in 2012. Double-digit consumer inflation will restrain near-term growth momentum. The Indian economy is opening up to global investors, which should bolster productivity and investment over the medium term. After nearly stalling in 2012 following weak investment spending, real GDP growth in Brazil is projected to increase to 3.5 per cent in 2013, supported by earlier decisions to ease monetary policy and provide fiscal stimulus. | | China’s economic growth forecast at 8.5 per cent over next five years, down from 10.5 per cent over previous two decades |
| |
| Sub-Saharan Africa – Relatively high commodity prices continue to support growth, particularly in resource-rich countries. The IMF expects regional growth to rise from 4.8 per cent in 2012 to 5.8 per cent in 2013. Greater macroeconomic and political stability are attracting increased capital investment. The United Nations World Investment Report 2012 showed that foreign direct investment (FDI) inflows into sub-Saharan | | Relatively high commodity prices continue to support growth in sub-Saharan Africa |
13
2013 BUDGET REVIEW
| | |
| | Africa rose from US$29.5 billion in 2010 to US$36.9 billion in 2011, just below the 2008 peak. While most foreign investment is channelled towards commodity economies, the continent’s youthful population and rising per capita incomes and expenditure are drawing greater inflows into consumer-related activities. Several risks to the global economic outlook should be noted: |
| |
| World Economic Forum says income inequality, fiscal imbalances, volatile oil and food prices, systemic financial failure and labour market imbalances are major risks for next 10 years | | • The uncertain trajectory of fiscal policy in major economies. The absence of credible medium-term consolidation strategies, particularly in the US and Japan, could jeopardise sustainable growth. • Continued crisis in Europe. Sovereign debt levels, banking-sector strains and weak growth may continue to destabilise the euro monetary area. • High global unemployment and inequality. Joblessness and inequality undermine confidence and social cohesion, and could prompt political strife. • Oil price volatility. Tensions in the Middle East are likely to continue destabilising the market, leading to higher oil prices. Commodity prices |
| Industrial commodity prices weakened in 2012 as global demand slowed | | Commodity prices slipped during 2012, prompted largely by a slowdown in Chinese industrial production. Coal prices declined by 20 per cent on average and iron ore prices were 23.4 per cent lower than in 2011. Chinese re-stocking helped lift iron ore prices by almost 30 per cent in the fourth quarter of 2012. The platinum price increased by 9.7 per cent in 2012, reflecting supply concerns. High global liquidity continued to support the gold price, which increased by 6.4 per cent during 2012. |
| |
| | Figure 2.1 Commodity price trends, 2006 – 2013 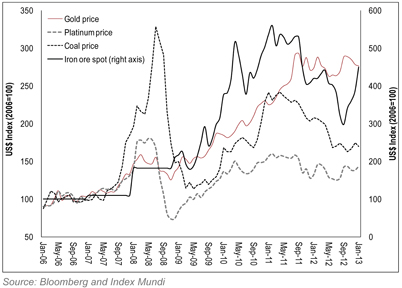
|
14
CHAPTER 2: ECONOMIC OUTLOOK
The world economic crisis half a decade on
The collapse of Lehman Brothers in September 2008 precipitated a synchronised recession in advanced economies, a sharp decline in global trade and manufacturing, and a sovereign debt crisis in highly indebted eurozone countries.
Unresolved global challenges
Five years on, a lasting recovery has eluded the world economy, which faces a range of challenges:
| | • | | High levels of public and private debt. Balance sheet repair is imperative for households, banks and governments, but synchronised deleveraging is acting as a brake on growth. |
| | • | | Austerity versus growth. Large fiscal deficits and high debt levels have made many economies reliant on continuing monetary stimulus, and policy makers are struggling to find the right balance between fiscal consolidation and growth. Austerity in some countries has proved costly and unproductive. |
| | • | | High levels of long-term and youth unemployment. The crisis brought on a global dilemma of rising joblessness, higher poverty and worsening income inequality. |
| | • | | Spill-over effects from high global liquidity and exchange rate policies. Low interest rates in advanced economies, the search for yield and currency interventions by major economies have led to volatile capital flows, commodity price swings and large-scale currency adjustments in emerging markets. |
| | • | | Limited progress in rebalancing. Countries that had large current account deficits before the crisis have done little to raise domestic savings, while surplus countries have done little to boost domestic demand. |
| | • | | Global policy coordination. In recent years global policy coordination has weakened, moving away from the orchestrated fiscal and monetary stimulus in 2008 that halted the free-fall in financial markets and helped to stave off a global economic depression. Attempts by the Group of 20 to achieve strong, sustained and balanced growth have been frustrated. Rising protectionism and exchange rate intervention are slowing adjustment efforts. Investor confidence remains fragile in the face of global risk. |
| | • | | Structural constraints. The inability or reluctance of governments to address structural constraints is delaying the adjustments needed to improve productivity, competitiveness and growth. |
Effect on South Africa
The global crisis has had consequences for South African trade, capital flows and currency:
| | • | | Weak external demand among South Africa’s traditional trading partners – Europe, the US and Japan – has affected exports, particularly for manufactured goods. Growth in exports to China has partially offset reduced trade with advanced economies, but has made South Africa more vulnerable to shifts in Chinese demand and related commodity price adjustments. Africa has become a more important export destination. |
| | • | | High levels of global liquidity and fluctuating risk appetite have increased exchange rate volatility, with the rand oscillating between periods of prolonged strength and weakness. South Africa relies on foreign inflows to sustain current investment levels and fund the current account and budget deficits. |
| | |
¢ Domestic outlook | | |
| |
The South African economy is expected to grow by 2.7 per cent in 2013, 3.5 per cent in 2014 and 3.8 per cent in 2015. The gradual improvement will be supported by robust investment spending and rising exports as global trade gathers pace. Additional electricity supply from new power plants coming online, water supply and rail capacity upgrades, strong regional growth, stable inflation and relatively low interest rates will also support higher levels of growth. The outlook for household consumption, which accounts for about 60 per cent of GDP, is modest, with growth expected to average 3.6 per cent over the medium term. Sluggish job creation is likely to inhibit real disposable income growth, while elevated household debt levels could restrain consumer spending. | | Robust domestic expenditure and rising exports will support growth over medium term |
15
2013 BUDGET REVIEW
| | |
| | Continued implementation of the national infrastructure programme is expected to result in robust public-sector fixed capital formation, which is forecast to grow at an average of 9 per cent over the next three years. A moderate acceleration in private-sector investment is also expected as rising capacity utilisation necessitates additional investment, housing construction recovers after five years of contraction and inventory restocking takes place. Export performance is projected to pick up as the mining sector rebounds and external demand strengthens. The current account deficit will, however, remain under some pressure, averaging 6.2 per cent over the next three years, as the terms of trade show little improvement and import growth responds to rising domestic demand, particularly public-sector capital investment. |
| |
| Consumer inflation expected to remain near upper range of target band | | Headline consumer inflation is projected to remain near the upper range of the 3-6 per cent inflation target band over the medium term. A relatively weak exchange rate and adjustments to the consumer price index (CPI) to account for changes in household consumption, particularly the increasing weight of fuel and electricity, will raise headline inflation relative to earlier forecasts. The pace of economic recovery will be determined largely by the rate at which private investment and export growth strengthen. Policy clarity, implementation of the NDP and the effective rollout of economic infrastructure are needed to boost confidence and competitiveness over the medium term. |
Boosting South Africa’s competitiveness in a changing world economy
The Organisation for Economic Cooperation and Development estimates that, adjusting for the relative purchasing power of different currencies, China and India will represent about 40 per cent of global GDP by 2030. These changes underline the need to improve the South African economy’s dynamism and competitiveness to take advantage of shifting patterns in global economic activity. The NDP sets out measures to lower the costs of doing business and improve the ability of exporters to compete in world markets. Government is also working to enhance South Africa’s trading relationships with major emerging economies, including Brazil, Russia, India and China.
Annexure W3, available on the National Treasury website, describes proposed reforms aimed at securing South Africa’s position as the financial Gateway to Africa. These include a new tax-efficient subsidiary free of foreign-currency constraints, an additional 5 per cent Africa allowance for banks, and reclassification of certain debt instruments and exchange-traded funds as domestic investments.
Table 2.2 Macroeconomic performance and projections, 2009 – 2015
| | | | | | | | | | | | | | | | | | | | | | | | | | | | |
| | | 2009 | | | 2010 | | | 2011 | | | 2012 | | | 2013 | | | 2014 | | | 2015 | |
| Calendar year | | Actual | | | Estimate | | | Forecast | |
Percentage change unless otherwise indicated | | | | | | | | | | | | | | | | | | | | | | | | | | | | |
Final household consumption | | | -1.6 | | | | 4.4 | | | | 4.8 | | | | 3.4 | | | | 3.1 | | | | 3.7 | | | | 3.9 | |
Final government consumption | | | 4.8 | | | | 5.0 | | | | 4.6 | | | | 3.9 | | | | 3.3 | | | | 3.3 | | | | 3.2 | |
Gross fixed capital formation | | | -4.3 | | | | -2.0 | | | | 4.5 | | | | 6.4 | | | | 5.7 | | | | 5.9 | | | | 6.5 | |
Gross domestic expenditure | | | -1.6 | | | | 4.4 | | | | 4.6 | | | | 4.1 | | | | 3.4 | | | | 3.9 | | | | 4.1 | |
Exports | | | -19.5 | | | | 4.5 | | | | 5.9 | | | | 1.1 | | | | 3.9 | | | | 6.7 | | | | 7.2 | |
Imports | | | -17.4 | | | | 9.6 | | | | 9.7 | | | | 7.2 | | | | 5.9 | | | | 7.2 | | | | 7.3 | |
Real GDP growth | | | -1.5 | | | | 3.1 | | | | 3.5 | | | | 2.5 | | | | 2.7 | | | | 3.5 | | | | 3.8 | |
| | | | | | | | | | | | | | | | | | | | | | | | | | | | |
GDP inflation | | | 8.3 | | | | 7.2 | | | | 6.0 | | | | 5.2 | | | | 6.6 | | | | 6.3 | | | | 6.0 | |
GDP at current prices (R billion) | | | 2 406 | | | | 2 659 | | | | 2 918 | | | | 3 145 | | | | 3 445 | | | | 3 790 | | | | 4 170 | |
| | | | | | | | | | | | | | | | | | | | | | | | | | | | |
CPI inflation | | | 7.1 | | | | 4.3 | | | | 5.0 | | | | 5.7 | | | | 5.6 | | | | 5.5 | | | | 5.4 | |
Current account balance (% of GDP) | | | -4.0 | | | | -2.8 | | | | -3.4 | | | | -6.1 | | | | -6.2 | | | | -6.3 | | | | -6.0 | |
| | | | | | | | | | | | | | | | | | | | | | | | | | | | |
16
CHAPTER 2: ECONOMIC OUTLOOK
Table 2.3 Macroeconomic performance and projections, 2009/10 – 2015/16
| | | | | | | | | | | | | | | | | | | | | | | | | | | | |
| | | 2009/10 | | | 2010/11 | | | 2011/12 | | | 2012/13 | | | 2013/14 | | | 2014/15 | | | 2015/16 | |
| Fiscal year | | Actual | | | Estimate | | | Forecast | |
Percentage change unless otherwise indicated | | | | | | | | | | | | | | | | | | | | | | | | | | | | |
Real GDP growth | | | -0.8 | | | | 3.4 | | | | 3.1 | | | | 2.5 | | | | 3.0 | | | | 3.6 | | | | 3.8 | |
GDP inflation | | | 7.6 | | | | 7.8 | | | | 5.4 | | | | 5.3 | | | | 6.5 | | | | 6.4 | | | | 6.0 | |
CPI inflation | | | 6.5 | | | | 3.8 | | | | 5.6 | | | | 5.6 | | | | 5.6 | | | | 5.4 | | | | 5.4 | |
GDP at current prices (R billion) | | | 2 453 | | | | 2 735 | | | | 2 973 | | | | 3 209 | | | | 3 520 | | | | 3 880 | | | | 4 271 | |
| | | | | | | | | | | | | | | | | | | | | | | | | | | | |
| | |
| Risks to the domestic outlook | | |
| |
Risks to the growth outlook include weaknesses in the mining sector, a worse-than-expected deterioration in the current account deficit, falling consumer and producer confidence, and infrastructure constraints. Prolonged strike action and rising real wages that outpace productivity gains would slow job creation. The ability of businesses to adjust to rising user charges required to fund new infrastructure, and adapt to shifting patterns of global trade, will also affect the strength of private-sector economic activity. | | A weak mining recovery or deterioration in the current account would limit domestic growth |
Growth and the National Development Plan
Opening the path to stronger economic growth requires that identified barriers to growth be addressed. The NDP emphasises the importance of:
| | • | | Rebuilding confidence and encouraging private investment through establishing policy and regulatory certainty, maintaining fiscal credibility and demonstrating effective public service delivery. |
| | • | | Addressing the country’s distorted spatial legacy through urban planning and public transport policies that reduce the cost and time of travel to work, and improve the quality of life by lowering living costs. |
| | • | | Lowering the costs of doing business to improve competitiveness, including actions to reduce regulatory burdens, and promote entrepreneurship and small business. |
| | • | | Strong regional growth, with opportunities for firms with expertise in mining, construction, retail and finance, and manufactured exports. |
| | • | | Removing bottlenecks in economic and social infrastructure. |
| | • | | Implementing labour activation policies that get young people into employment and onto career paths. |
| | |
| ¢ Trends in the real economy | | |
| |
| Growth in gross value added slowed to 2.4 per cent in the first nine months of 2012, compared with an average of 3.2 per cent in the two previous years. A contraction in the mining sector, sluggish growth in manufacturing and weakness in services as a result of a deceleration in consumption spending explain the slowdown. There was a marginal improvement in construction sector activity, but sustained growth will depend on a recovery in the local housing market and continued implementation of infrastructure projects. | | Many economic sectors experienced weak growth during 2012 |
Weak output growth in many sectors
| | |
| Mining value added declined by 4.3 per cent in the first three quarters of 2012 in response to strike-related production stoppages. Weaker global growth slowed Chinese demand and softened commodity prices. Between July and October, mining output fell by 16.7 per cent. The National Treasury estimates that the total value of mining production lost due to strikes and stoppages in 2012 amounted to R15.3 billion. | | Between July and October mining output fell by 16.7 per cent as a result of widespread strikes |
17
2013 BUDGET REVIEW
Table 2.4 Sector growth trends, 2000 – 2012
| | | | | | | | | | | | | | | | | | | | | | | | | | | | |
| | | Shares | | | Growth (per cent) | | | Contribution to gross
value- added
(percentage points) | |
| | | | | | 2000 –
2008 | | | 2011 | | | 20121 | | | 2000 –
2008 | | | 2011 | | | 20121 | |
Agriculture, forestry and fishing | | | 2.4 | | | | 2.4 | | | | -0.1 | | | | 0.5 | | | | 0.1 | | | | -0.0 | | | | 0.0 | |
Mining and quarrying | | | 5.9 | | | | 0.0 | | | | 0.3 | | | | -4.3 | | | | 0.0 | | | | 0.0 | | | | -0.3 | |
Manufacturing | | | 17.2 | | | | 3.7 | | | | 3.6 | | | | 2.2 | | | | 0.7 | | | | 0.6 | | | | 0.4 | |
Electricity and water | | | 2.0 | | | | 2.3 | | | | 1.1 | | | | -1.1 | | | | 0.1 | | | | 0.0 | | | | -0.0 | |
Construction | | | 3.4 | | | | 9.1 | | | | 0.5 | | | | 2.3 | | | | 0.2 | | | | 0.0 | | | | 0.1 | |
Wholesale and retail trade; hotels and restaurants | | | 13.8 | | | | 3.9 | | | | 4.5 | | | | 4.0 | | | | 0.5 | | | | 0.6 | | | | 0.6 | |
Transport and communication | | | 10.1 | | | | 5.9 | | | | 3.1 | | | | 2.4 | | | | 0.6 | | | | 0.3 | | | | 0.2 | |
Finance, real estate and business services | | | 23.7 | | | | 7.1 | | | | 4.0 | | | | 3.5 | | | | 1.5 | | | | 0.9 | | | | 0.8 | |
General government | | | 15.2 | | | | 2.5 | | | | 3.9 | | | | 3.3 | | | | 0.4 | | | | 0.6 | | | | 0.5 | |
Personal services | | | 6.1 | | | | 3.8 | | | | 2.5 | | | | 2.1 | | | | 0.2 | | | | 0.2 | | | | 0.1 | |
| | | | | | | | | | | | | | | | | | | | | | | | | | | | |
Gross value-added | | | 100.0 | | | | 4.3 | | | | 3.3 | | | | 2.4 | | | | 4.3 | | | | 3.3 | | | | 2.4 | |
| | | | | | | | | | | | | | | | | | | | | | | | | | | | |
1. First three quarters of 2012
Source: Reserve Bank
| | |
| | Mining output rebounded somewhat in the last two months of the year, but was 3.1 per cent lower in 2012 compared with 2011. There were notable production losses in copper (-21.8 per cent), gold (-14.5 per cent) and platinum group metals (-12 per cent). In contrast, iron ore production increased by 15.7 per cent. |
Realising the potential of South Africa’s mining sector
Mining remains a cornerstone of the South African economy, with strong ties to industry. Mining is a large contributor to corporate tax and export revenues, and a substantial direct and indirect source of economic activity and jobs.
The sector’s potential to contribute more to the economy is contingent on higher rates of investment. The value of South Africa’s planned mining investments over the next two decades is low compared with other commodity economies. Investment requires a supportive policy climate. The NDP argues for certainty of property rights, a stable regulatory framework particularly for licenses, securing reliable electricity and rail transport, deepening links with other sectors, and focusing research and development to improve extraction methods that prolong mine life, boost energy efficiency, and find new uses for minerals. Greater institutional capacity to manage the regulatory framework would also help realise the sector’s potential.
Mining investment plans, 2012 – 20301
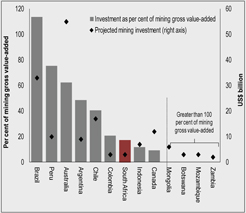
| 1. | As announced by 10 largest global mining houses |
Source: McKinsey and Deloitte
Mining in numbers, 2011
| | | | | | | | |
R million unless otherwise stated | | Value | | | Share of total (%) | |
GDP—direct | | | 99 415 | | | | 5.9 | |
(Including indirect effects)1 | | | 467 952 | | | | 18.7 | |
Employment (‘000) | | | | | | | | |
Direct (formal non-agricultural) (‘000) | | | 519 | | | | 6.1 | |
Indirect (total) (‘000) | | | 840 | | | | 6.2 | |
Investment | | | 45 097 | | | | 11.8 | |
FDI (stocks)1 | | | 682 174 | | | | 38.3 | |
Exports2 | | | 444 926 | | | | 64.3 | |
Corporate income tax | | | 18 553 | | | | 17.0 | |
Value-added tax | | | 7 040 | | | | 5.3 | |
Royalties | | | 5 612 | | | | — | |
| | | | | | | | |
| 2. | Nominal figures, including base metals and related articles |
Source: Reserve Bank, South African Revenue Service, Quantec, Statistics South Africa and Industrial Development Corporation
18
CHAPTER 2: ECONOMIC OUTLOOK
| | |
Delays in the resumption of full operations, shaft closures and fraught labour relations could constrain output for a prolonged period. Structural impediments and a changing global context are affecting the outlook for the sector. China and other emerging markets are now the principal drivers of demand and prices for a range of industrial, energy and agricultural commodities. Weak automobile markets in Europe and Japan and increased recycling have contributed to lower demand for platinum. Domestic constraints include ever-deeper shafts and declining ore quality in gold mining, rising electricity prices, water supply and licence issues, and bottlenecks in logistics infrastructure. | | |
| |
| Overall manufacturing output strengthened during the fourth quarter of 2012, but increased by just 2.1 per cent during the year, despite relatively strong growth in petrochemicals, wood and paper, and food and beverages. Manufacturing production has fallen in industries closely linked to mining. Metal products – the largest component in manufacturing output – and the electrical machinery sector were the worst performers in 2012. Output in many sectors remains significantly below pre-recession levels. | | Manufacturing production grew by 2.1 per cent, led by petrochemicals, wood and paper, food and beverages |
Figure 2.2 Contribution to annual manufacturing production growth by sector and weights, 2006 – 2012 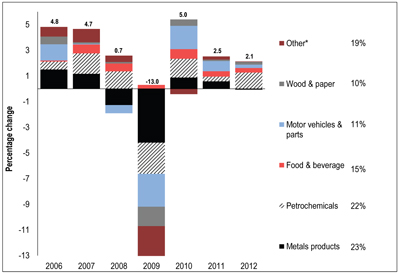
* Furniture, clothing, non-metallics, electrical machinery, radio and TV Non-seasonally adjusted annual data Source: Statistics South Africa | | |
| |
Subdued output in industry and mining, as well as Eskom’s maintenance operations and its power buy-back programme, contributed to a 1.8 per cent decline in electricity distribution in 2012. The margin between electricity supply and demand remains narrow, limiting the economy’s growth potential in the near term, but the supply constraint will begin to lift in 2014. Growth momentum in the agriculture sector was strong over the first nine months of 2012. International supply disruptions resulted in higher prices for maize, wheat and soya beans in the second half of 2012. This has supported farming revenues but has also raised food prices. Following prolonged strikes in the Cape Winelands, an agreement to raise the minimum wage by 50 per cent to R105 per day will boost farmworker incomes but may result in some job losses. | | Electricity supply constraint will ease beginning in 2014 |
19
2013 BUDGET REVIEW
| | |
| |
| | Lower levels of local economic activity, relatively weak global demand and the three-week truck drivers’ strike in September 2012 constrained growth in the transport and communications sector. |
| |
| Government, business and labour have agreed to work together to strengthen collective bargaining | | The depth of labour frustrations in the mining and agricultural sectors is partly rooted in unsustainable economic and social conditions, sharpened by the rising cost of living. Concerted and collaborative attempts by employers and labour to resolve these concerns are critical for these sectors to prosper in the long term. More broadly, the events of 2012 have revealed weaknesses in South Africa’s collective bargaining system. Government, business and labour have agreed to work together to strengthen the system of labour relations. |
Manufacturing in the 21st century
The manufacturing sector is critically important for the country’s growth and development. Manufacturing is a driver of innovation, productivity and competitiveness.
South Africa’s manufacturing sector has become more capital intensive over the past decade. This is consistent with global trends and reflects technological innovation (often labour- and cost-saving), trade liberalisation (economies of scale) and shifting patterns of global demand. Traditional labour-intensive sectors such as clothing, textiles and furniture account for only 7 per cent of world manufacturing value added, and global trade in these goods has declined. High- and medium-skilled labour is laying a greater role in global manufactured trade, gradually displacing labour-intensive manufacturing.
Historically, South Africa’s industrial policies and low electricity prices have favoured capital-intensive industries, such as steel and petrochemicals. In recent years, shortages of skilled workers, sluggish external demand and rising domestic costs have intensified competitive pressures in industrry, and reduced employment.
Skills composition of global and South African manufacturing exports
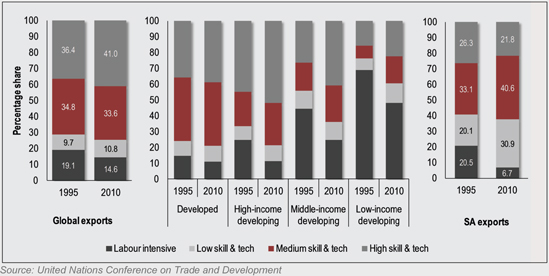
Government can support manufacturing through various interventions. The NDP argues for the sequential elimination of binding constraints to industrial expansion, including the supply of skilled labour, reliability of electricity supply, low productivity levels and high logistics costs. The manufacturing competitiveness enhancement programme, introduced in the 2012 Budget, provides targeted support to firms working toward greater efficiency and competitiveness.
20
CHAPTER 2: ECONOMIC OUTLOOK
| | ¢ | | Toward structural change in the real economy |
| | |
| The NDP recognises that the key to more rapid, sustained growth lies in addressing structural constraints. South Africa is a relatively small market distant from most of its major trading partners. The country faces complex challenges, including high unemployment, shortcomings in public education, a weak skills base, a resource-intensive economy bias, high levels of inequality and spatial distribution patterns that raise the costs of living and doing business. Government’s existing policies and actions that will be put in place will begin to address these issues. | | Structural challenges include unemployment, narrow skills base, inequality, resource bias and skewed spatial legacy |
| |
| In overcoming the historical reliance on the resource sector, industrial policy will need to continue its transition away from an approach that favoured capital- and energy-intensive goods, often with limited domestic linkages, towards an increasingly diversified industrial base. This transition has begun with the strategic intent of the New Growth Path, the removal of implicit energy subsidies, and the re-evaluation of freight transport tariffs and cargo duties. | | |
| |
| Making the shift towards more dynamic, sustainable sectors will take time. The private sector’s response to changing incentives and patterns of investment decisions occur over the medium to long term. Fixed equipment cannot be easily replaced, new value chains need to be developed, and skills and experience take years to accumulate. | | |
How can South Africa meet the challenge of supporting small business?
Small, medium and micro enterprises (SMMEs) and entrepreneurship are engines of growth in many developing nations. South Africa has relatively low levels of entrepreneurship (see table) and SMMEs contribute 55 per cent of total employment, compared with 90 per cent or more in China, India and Indonesia.
The 2013 SBP SME Growth Index surveyed 500 established small and medium-sized businesses in the manufacturing and business services that employ 10 or more workers. Over 70 per cent of firms reported that 2012 had been a difficult year, with a small average increase in turnover (9 per cent) and declining employment. Over 25 per cent of firms identified rising input costs (electricity prices, municipal rates and services) as constraints. Other challenges include poor work ethics, an increasing regulatory burden, inadequate sources of finance and skills shortages. Concentrated product markets also inhibit SMME growth.
Moreover, the survey highlighted that the country’s entrepreneurial community is aging. In manufacturing, 43 per cent of SMME owners are older than 50 years and have no succession plan.
A 2012 study1 on tax compliance demonstrates that small businesses still carry significant time and cost burdens associated with complying with tax rules. Policy initiatives to support SMMEs – such as credit guarantee schemes, entrepreneurship training, business incubation and technology assistance – have not yet had the desired effect. The NDP identifies several ways to support SMMEs and new firm creation, including public and private procurement to stimulate demand, easing access to finance, regulatory simplification – in areas such as business registration, tax and labour regulation – and reforms to the skills training landscape.
International comparison of entrepreneurial activity
| | | | | | | | |
Percentage | | Adult population
engaged in
entrepreneurship | | | Adult population with
entrepreneurial
intent | |
South Africa | | | 9.0 | | | | 14.0 | |
Brazil | | | 15.0 | | | | 28.0 | |
China | | | 24.0 | | | | 43.0 | |
Malaysia | | | 2.3 | | | | 8.7 | |
Chile | | | 24.0 | | | | 46.0 | |
Argentina | | | 21.0 | | | | 42.0 | |
Thailand | | | 19.0 | | | | 25.0 | |
| | | | | | | | |
Source: Global Entrepreneurship Monitor 2011
| 1 | Smulders, Stigling, Franzsen, Fletcher. 2012. Tax Compliance Costs for Small Business Sector in South Africa. |
21
2013 BUDGET REVIEW
| | |
| Promoting entrepreneurship and cutting regulatory red tape are required to support small business | | Small firms and new ventures are expected to be a source of dynamism, innovation, competition, growth and job creation. This highlights the importance of cultivating an economic climate that promotes entrepreneurial talent and facilitates small firm expansion, in part by reducing bureaucratic encumbrances and associated costs found in the present regulatory environment. |
| |
| | The NDP and the current Industrial Policy Action Plan highlight the importance of investing in tradable goods and services as an engine of growth – and domestically orientated and service-sector firms as a primary source of jobs – and strengthening the links between the two. Such a large-scale transition will inevitably require difficult adjustments. Government has an important role to play in smoothing the transition by protecting individuals through a combination of income support, labour-matching services and access to retraining. Existing tax and investment incentives provide support to firms undergoing structural change. |
| |
| | ¢ Labour market |
| |
| The broad unemployment rate stands at 33.2 per cent | | High unemployment is the most pressing challenge facing the country. There are 4.5 million jobless South Africans and another 2.3 million people categorised as “discouraged” who are no longer actively seeking work, raising the broad unemployment rate to 33.2 per cent. Total employment is 450 000 below pre-crisis levels. |
| |
| About 82 000 formal-sector jobs were created in the year to September 2012 | | Slow economic growth in 2012 hindered formal non-agricultural employment growth. Between September 2011 and September 2012, about 82 000 jobs were created, bolstered by rapid growth in national and provincial government payrolls in the middle of the year. |
| |
| | Figure 2.3 Annual growth in non-agricultural gross value added and formal employment, 2007 – 2012 |
| |
| | 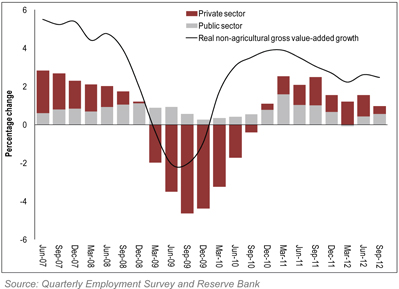 |
| |
| | Nominal wage settlements averaged 7.6 per cent in 2012 compared with 7.7 per cent in 2011. After moderating to 5.9 per cent in 2011, growth in nominal unit labour costs has started to rise. Productivity growth averaged just 1.2 per cent over the last two years. |
22
CHAPTER 2: ECONOMIC OUTLOOK
| | |
Moderate employment growth is expected over the next three years. With fiscal pressures providing little room for an expansion of public-sector employment, job creation prospects will largely depend on private-sector hiring. | | |
| |
| Youth employment | | |
| |
| Youth joblessness remains exceptionally high, with more than 40 per cent of those who are economically active and under the age of 30 unemployed. Low levels of demand, lack of experience, divergence between job search and firm hiring strategies, and an absence of appropriate skills and networks contribute to lower employment prospects for young workers. To date, interventions to encourage the private sector to hire younger workers have proven inadequate. | | Labour activation policies will help increase young work seekers’ chances of getting jobs |
| |
| The NDP suggests a range of labour activation policies to help young people enter into formal employment. | | |
| |
| Employment tax incentives | | |
| |
| As part of a package of measures aimed at boosting opportunities for young work seekers, government recognises the need to share the costs of expanding job opportunities with the private sector. Government’s existing approach to supporting employment growth focuses on training, skills development, labour market activation and short-term public employment. Programmes in support of these objectives include sector education and training authorities, further education and training colleges, small enterprise support, the Industrial Policy Action Plan, the expanded public works programme and the community work programme. | | Firms that hire young, unskilled workers will receive a tax credit |
| |
| To complement existing programmes, a youth employment tax incentive aimed at encouraging firms to employ young work seekers will be tabled for consideration by Parliament. The introduction of this tax incentive, which takes into account the concerns of organised labour, will help young people enter the labour market, gain valuable experience and access career opportunities. Protection provided by existing labour legislation, combined with oversight by the South African Revenue Service and the Department of Labour, will avoid displacement. A similar tax incentive will be made available to eligible workers of all ages within special economic zones. | | |
23
2013 BUDGET REVIEW
Dynamics in the youth labour market
Since 2009, the National Treasury has worked with the African Micro-Economic Research Unit at the University of Witwatersrand to study the youth labour market. The study tracked 4 000 non-economically active and unemployed young people aged 20-24 years, and more than 600 firms, over a period of three years. Part of this research included testing the impact of a R5 000 hiring voucher on employment outcomes. Half the sample received a hiring voucher that could be used to reduce the initial cost of labour for their prospective employer, over a minimum of six months, while leaving their wage unaffected.
The main findings of the research included the following:
| | • | | There is a large asymmetry between how young people look for work, enquiring at workplaces, and how firms hire people, through formal channels or networks. |
| | • | | The structure of the household and extended social connections are important for success in the labour market. Networks are the main channel through which information about jobs is transmitted. |
| | • | | Young people who were allocated a hiring voucher were up to 25 per cent more likely to be employed than those who were not. This effect persisted two years after the hiring voucher was allocated. |
| | • | | The majority of firms stated they would not substitute older workers for younger ones if there was a youth employment incentive, in part because older workers are more reliable and experienced. |
| | |
| | ¢ Domestic expenditure |
| |
| | Growth in gross domestic expenditure moderated to an estimated 4.1 per cent in 2012, compared with 4.6 per cent in 2011, with a rebalancing in composition away from the private sector towards the public sector. Private domestic expenditure growth is expected to slow to a modest 3.1 per cent in 2013. Accelerated public investment has cushioned the impact of slowing private domestic demand and is expected to remain robust over the medium term. |
| |
| | Consumption trends |
| |
| Slowdown in household consumption marked by decelerating spending on services | | After rising by 4.8 per cent in 2011, household consumption growth slowed to 3.4 per cent in the first three quarters of 2012, with a sharp loss of momentum in the third quarter. Annual growth in retail sales slowed from 5.9 per cent in 2011 to 4.4 per cent in 2012. The slowdown was marked by decelerating spending on services as consumer confidence fell and real disposable income growth moderated. |
Table 2.5 Components of domestic demand, 2010 – 2012
| | | | | | | | | | | | | | | | | | | | | | | | |
| | | Growth rates (per cent) | | | Contributions to demand growth
(percentage points) | |
| | | 2010 | | | 2011 | | | 20121 | | | 2010 | | | 2011 | | | 20121 | |
Household consumption | | | 4.4 | | | | 4.8 | | | | 3.4 | | | | 2.7 | | | | 3.0 | | | | 2.1 | |
Durables | | | 18.8 | | | | 15.8 | | | | 13.1 | | | | 1.0 | | | | 0.9 | | | | 0.8 | |
Semi-durables | | | 3.6 | | | | 5.9 | | | | 6.1 | | | | 0.2 | | | | 0.4 | | | | 0.4 | |
Non-durables | | | 1.8 | | | | 3.1 | | | | 2.6 | | | | 0.4 | | | | 0.7 | | | | 0.6 | |
Services | | | 4.0 | | | | 3.5 | | | | 1.2 | | | | 1.1 | | | | 1.0 | | | | 0.3 | |
Government consumption | | | 5.0 | | | | 4.6 | | | | 4.5 | | | | 1.0 | | | | 0.9 | | | | 0.9 | |
Gross fixed capital formation | | | -2.0 | | | | 4.5 | | | | 6.7 | | | | -0.4 | | | | 0.8 | | | | 1.2 | |
Private sector | | | -0.5 | | | | 4.6 | | | | 4.3 | | | | -0.1 | | | | 0.5 | | | | 0.5 | |
Public corporations | | | -1.5 | | | | 1.5 | | | | 8.6 | | | | -0.1 | | | | 0.1 | | | | 0.3 | |
General government | | | -9.0 | | | | 8.6 | | | | 14.7 | | | | -0.3 | | | | 0.2 | | | | 0.4 | |
Domestic demand | | | 3.3 | | | | 4.7 | | | | 4.2 | | | | 3.3 | | | | 4.7 | | | | 4.2 | |
| | | | | | | | | | | | | | | | | | | | | | | | |
1. First three quarters of 2012
Source: Reserve Bank
24
CHAPTER 2: ECONOMIC OUTLOOK
| | |
Consumer confidence waned in response to poor global economic conditions, local industrial action, rand weakness and downgrades of South Africa’s credit ratings. Slower real disposable income gains were consistent with muted formal-sector employment gains and lower real wage growth in 2012. Growth in real disposable income decelerated to 3.4 per cent in the first three quarters of 2012, after averaging 5.2 per cent in 2010 and 2011. Household indebtedness remains elevated at 76 per cent of gross disposable income, although debt-service costs declined from 6.9 per cent to 6.5 per cent of gross disposable income in the third quarter of 2012 following an interest rate cut in July. | | Household indebtedness remains elevated at 76 per cent of gross disposable income |
| |
| Gross fixed capital formation | | |
| |
| Real gross fixed capital formation – investment in fixed capital by general government, public corporations and private enterprises before depreciation – accelerated to an estimated 6.4 per cent in 2012 from 4.5 per cent in 2011. Strong public-sector fixed capital formation offset a marked deceleration in private investment. | | Public-sector fixed capital formation drove investment higher in 2012 |
| |
| Public-sector capital spending grew by 11 per cent during the first nine months of 2012 as a result of major Eskom and Transnet projects, provincial investment in roads and hospitals, and local government road and housing projects. | | |
| |
| Private-sector investment growth slowed to 4.3 per cent in the first three quarters of 2012 compared with 4.6 per cent in 2011. Investment by the mining and manufacturing sectors, which accounted for about 60 per cent of overall investment growth in 2011, slowed sharply in 2012. Inventory levels are relatively low at 12.7 per cent of GDP, compared with 15.9 per cent between 2000 and 2008. Manufacturing capacity utilisation rose to 83.8 per cent in December 2012, marginally below pre-recession levels, suggesting that the need to invest and add capacity may support an increase in private investment. | | Private-sector investment growth slowed to 4.3 per cent in first three quarters of 2012 |
Figure 2.4 Contributions to real investment growth, 2005 – 2012
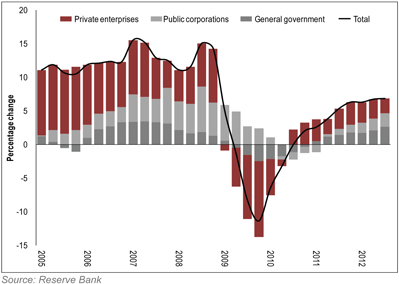
| | |
| Significant strike activity, ratings downgrades and perceived policy uncertainty have contributed to reduced confidence and deterred or postponed private investment decisions. In addition, the residential | | |
25
2013 BUDGET REVIEW
| | |
| | housing market continues to struggle and many commercial buildings stand vacant. The BER/RMB business confidence index recorded a significant decline in investment intentions in the fourth quarter in response to weak demand and strike-related concerns. |
| |
| High levels of corporate savings, but low levels of household savings | | Domestic savings rates remain low, resulting in a significant gap between investment and savings. High levels of gross corporate savings contrast with low levels of household savings, and government dissaving. |
| |
| | ¢ Monetary and financial sector developments |
| |
| | Credit |
| |
| Increasing corporate and household credit in 2012 | | Corporate credit increased by 10.3 per cent in 2012, up from 6.1 per cent in 2011, despite uncertainty in the economic outlook and high corporate savings. |
| |
| | Table 2.6 Composition of household credit extension, 2010 – 2012 |
| | | | | | | | | | | | | | | | |
| | | Shares | | | Annual growth (per cent)1 | |
| | | 2012 | | | 2010 | | | 2011 | | | 2012 | |
Household credit | | | 100.0 | | | | 7.0 | | | | 6.3 | | | | 9.9 | |
of which: | | | | | | | | | | | | | | | | |
Mortgage advances | | | 61.3 | | | | 4.6 | | | | 1.2 | | | | 3.0 | |
Installment sale and leasing finance | | | 15.9 | | | | 7.8 | | | | 10.9 | | | | 15.7 | |
Other loans and advances | | | 22.8 | | | | 16.9 | | | | 22.9 | | | | 28.6 | |
of which: | | | | | | | | | | | | | | | | |
Overdrafts | | | 2.3 | | | | -0.8 | | | | 3.0 | | | | 14.1 | |
General loans and advances (mostly unsecured credit) | | | 14.5 | | | | 30.0 | | | | 35.1 | | | | 30.1 | |
Credit cards | | | 6.0 | | | | 5.0 | | | | 8.3 | | | | 31.3 | |
| | | | | | | | | | | | | | | | |
| | |
| | 1. End of year Source: Reserve Bank |
| |
| | Household credit extension also picked up in 2012, rising to 9.9 per cent in 2012 from 6.3 per cent in 2011. Low interest rates, benign inflation and a relaxation in lending criteria supported improved credit appetite. |
Progress on responsible market conduct in bank lending
In November 2012, the Minister of Finance and the chairperson of the Banking Association of South Africa agreed on steps to reduce costs and ensure responsible market conduct in bank lending to help prevent rising household indebtedness. These actions include:
| | • | | Mechanisms by banks to assist distressed borrowers and prevent future indebtedness by selling appropriate credit. |
| | • | | A review of the consumer credit insurance industry by the National Treasury, Financial Services Board and National Credit Regulator to inform policy and regulatory reforms. |
| | • | | Joint work by the National Treasury, the Department of Trade and Industry, and Department of Justice to prevent further abuse of emolument attachment orders. |
| | • | | Working with the National Credit Regulator and Department of Trade and Industry to ensure that proposed measures to help households reduce indebtedness do not have adverse consequences and increase the incidence of reckless lending. |
| | |
| | The distribution of household credit continues to shift from mortgage advances to unsecured credit, which accounted for nearly 60 per cent of household credit extension in 2012. This trend began in 2010, reflecting the banking sector’s shift to more profitable lending due to low interest |
26
CHAPTER 2: ECONOMIC OUTLOOK
| | |
rates, a stagnant property market and Basel III regulations requiring closer matching of assets and liabilities. The National Treasury, the Reserve Bank and regulators will continue to carefully monitor the level of unsecured credit. | | |
| |
| The ratio of impaired advances (that is, loans that are not likely to be fully repaid) to total loans and advances has fallen to 4.1 per cent in November 2012 from a high of 6 per cent in November 2009. Surveys of the financial sector indicate optimism among retail bankers, but expectations of tighter credit conditions to control impaired loans. | | |
| |
| Inflation | | |
| |
| Consumer inflation increased to 5.4 per cent in January 2013 from a low of 4.9 per cent in July 2012. Food and fuel prices have pushed up headline inflation as a result of supply shocks in agriculture and the continuing high price of oil, despite weak global growth. Currency weakness during the second half of 2012 compounded these effects and is expected to place upward pressure on inflation in 2013. Moderate consumer demand is likely to contain rising core inflationary pressures over the near term. | | Food and fuel prices have driven headline inflation higher |
| |
| The 2010/11 Income and Expenditure survey conducted by Statistics South Africa highlighted shifts in household spending patterns over the last five years and informed the weights in the CPI basket. These include a rise in the relative importance of electricity, petrol, rentals and medical aid contributions. The changes are expected to raise headline CPI inflation for 2013 by 0.3 percentage points relative to earlier forecasts. | | |
| |
| Inflation for more than 70 per cent of the administered price basket exceeds 6 per cent, with double-digit increases in municipal charges on water supply, refuse and sewerage collection. Higher charges to fund municipal infrastructure needs for water and electricity suggest there will be limited relief for middle-income earners and businesses. There is a need for better coordination of administered prices to help manage inflation pressures. | | High municipal charges for water supply, refuse and sewerage collection put upward pressure on inflation |
| |
| n Balance of payments | | |
| |
| The balance of payments measures all trade and financial transactions between South Africa and the rest of the world. | | |
| |
| A large trade deficit and higher net current transfers abroad due to payments to the Southern African Customs Union (SACU) widened the current account deficit to an estimated 6.1 per cent of GDP in 2012 from 3.4 per cent in 2011. The elevated deficit is a source of external vulnerability. Policies that aim to improve manufacturing competitiveness, ensure the long-term viability of mining and reorient South Africa’s exports towards fast-growing African and emerging markets should bolster the economy’s export potential over time. | | Current account deficit is a source of external vulnerability, offset to date by strong investment inflows |
| |
| The financial account continues to be in surplus, with strong non-resident demand for government bonds and other investment inflows. South Africa will need to attract a cumulative inflow of global savings estimated at R703 billion over the next three years to finance the current account deficit. Sustained inflows require improvements to both investor confidence and the investment climate. | | |
27
2013 BUDGET REVIEW
| | |
| | Current account |
| |
| | The trade balance substantially weakened during the first three quarters of 2012, recording a deficit of 2.1 per cent of GDP compared with a surplus of 0.6 per cent in 2011. Low export volumes, high imports and less favourable terms of trade lay behind the reversal of the trade balance. The terms of trade, including gold, declined by 1.9 per cent over the period. |
Table 2.7 Current account balance, 2007 – 2012
| | | | | | | | | | | | | | | | | | | | | | | | |
Percentage of GDP | | 2007 | | | 2008 | | | 2009 | | | 2010 | | | 2011 | | | 20121 | |
Total current account | | | -7.0 | | | | -7.2 | | | | -4.0 | | | | -2.8 | | | | -3.4 | | | | -5.9 | |
Trade balance | | | -1.8 | | | | -1.6 | | | | 0.1 | | | | 1.0 | | | | 0.6 | | | | -2.1 | |
Net services, income and transfer payments | | | -5.2 | | | | -5.6 | | | | -4.1 | | | | -3.8 | | | | -4.0 | | | | -3.8 | |
Net service payments | | | -0.9 | | | | -1.5 | | | | -1.0 | | | | -1.2 | | | | -1.2 | | | | -0.7 | |
Net income payments | | | -3.4 | | | | -3.3 | | | | -2.2 | | | | -2.0 | | | | -2.3 | | | | -2.1 | |
Net dividend payments | | | -3.1 | | | | -2.6 | | | | -1.6 | | | | -1.5 | | | | -1.9 | | | | -1.6 | |
Net current transfer payments (mainly SACU) | | | -0.8 | | | | -0.8 | | | | -0.9 | | | | -0.6 | | | | -0.5 | | | | -1.0 | |
Current account excluding net current transfers | | | -6.1 | | | | -6.3 | | | | -3.1 | | | | -2.2 | | | | -2.9 | | | | -4.9 | |
| | | | | | | | | | | | | | | | | | | | | | | | |
1. First three quarters of 2012, seasonally adjusted and annualised
Source: Reserve Bank
| | |
| Sluggish exports reflect slowing global demand and falling prices for some major commodities | | Sluggish export performance reflects a combination of slowing global demand, declining competiveness due to a changing cost structure, falling prices for some major commodity exports, rand volatility and the impact of extensive disruption in the mining sector. Imports grew at a robust pace, driven by oil, investment goods and vehicles. The weakening rand exchange rate pushed up the prices of imported goods. |
| |
| | As a result of weak growth in Japan and Germany, and softer growth in China, exports to these countries fell by 20 per cent, 12 per cent and 4.9 per cent respectively in 2012. Platinum exports were hardest hit, falling by 18.5 per cent by value, while iron and steel exports fell by 7.6 per cent. Other countries in the Southern African Development Community continue to absorb a growing share of South Africa’s manufactured exports, up from 17.9 per cent in 2009 to 22.4 per cent in 2012. |
| |
| | Figure 2.5 Components of the trade balance, 2005 – 2012 |
| |
| | 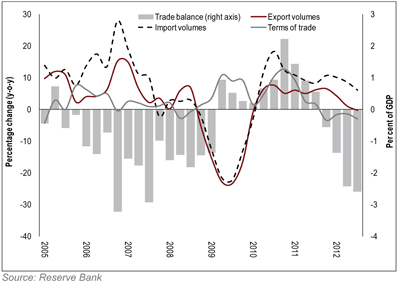 |
28
CHAPTER 2: ECONOMIC OUTLOOK
| | |
Financial account | | |
| |
| The financial account of the balance of payments was supported by net inflows of portfolio and other investment in the first nine months of 2012. | | |
Table 2.8 Financial account of the balance of payments, 2007 – 2012
| | | | | | | | | | | | | | | | | | | | | | | | |
Percentage of GDP | | 2007 | | | 2008 | | | 2009 | | | 2010 | | | 2011 | | | 20121 | |
Financial account balance2 | | | 9.3 | | | | 8.3 | | | | 4.7 | | | | 4.0 | | | | 4.5 | | | | 6.6 | |
Net portfolio investment | | | 3.6 | | | | -6.0 | | | | 3.9 | | | | 2.8 | | | | -0.6 | | | | 2.2 | |
Net foreign direct investment | | | 1.0 | | | | 4.4 | | | | 1.5 | | | | 0.4 | | | | 1.6 | | | | 0.9 | |
Net other investment | | | 3.0 | | | | 5.8 | | | | -0.7 | | | | -0.5 | | | | 1.0 | | | | 2.2 | |
Unrecorded transactions | | | 1.7 | | | | 4.1 | | | | 0.0 | | | | 1.4 | | | | 2.5 | | | | 1.3 | |
Change in net reserves due to balance of payment transactions | | | 2.4 | | | | 1.2 | | | | 0.7 | | | | 1.2 | | | | 1.1 | | | | 0.4 | |
| | | | | | | | | | | | | | | | | | | | | | | | |
1. First three quarters of 2012
2. Includes unrecorded transactions
Source: Reserve Bank
| | |
| Non-residents were strong net purchasers of local bonds worth R92.4 billion in 2012, compared with R46.7 billion in 2011, which helped to finance South Africa’s current account and budget deficits. Substantial inflows, boosted by South Africa’s inclusion in the Citigroup World Government Bond Index, occurred despite periods of global risk aversion, negative investor sentiment towards South Africa, the wider current account deficit and ratings downgrades. | | Non-residents purchased a net R92.4 billion in South African bonds during 2012 |
| |
| Foreign investors reduced their holdings of local equities by R3.6 billion in 2012. Net foreign direct investment totalled R19.9 billion over the first nine months of 2012, reflecting net inward investment of R38.9 billion and net outward investment of R19 billion. Strong net inflows of other investment totalled R52.6 billion in the first three quarters of 2012, marginally lower than during the same period in 2011. Total gross foreign exchange reserves increased from US$48.9 billion at the end of 2011 to US$51.2 billion at the end of January 2013, primarily due to valuation adjustments on gold reserves and cash holdings. | | |
Factors influencing the current account outlook
The current account deficit is forecast to be higher than expected at the time of the 2012 Medium Term Budget Policy Statement. Several factors will affect the outcome:
| | • | | Continued supply-side disruptions in major export industries such as mining, delays in additional electricity supply coming online, or a slower-than-expected global recovery could result in a larger deficit. |
| | • | | Faster growth in African and other emerging market trading partners can stimulate exports, supporting higher commodity prices and an improvement in the terms of trade. Rand weakness can also boost export growth, provided that the real depreciation is sustained and improves competitiveness. |
| | • | | Structural improvements in the current account require a significant increase in the domestic savings rate and decreased reliance on foreign savings. |
Exchange rate
| | |
| Exchange rate volatility remained elevated in 2012 as global risk appetite responded to continued uncertainty in the euro area, weak global economic data and concerns over US fiscal policy. Most emerging market currencies appreciated in the second half of the year as risk appetite returned, in combination with US dollar weakness and strong equity inflows. Country-specific challenges resulted in further depreciation or sustained weakness in currencies including the rand, the Brazilian real and the Indian rupee. | | Country-specific challenges resulted in weakness of the rand, Brazilian real and Indian rupee |
29
2013 BUDGET REVIEW
| | |
| | Sentiment towards the rand was negatively affected by industrial action in the mining sector, the deterioration of the current account and credit ratings downgrades. The rand was among the worst-performing currencies in the fourth quarter of 2012. Overall, the average nominal trade-weighted rand was 8.6 per cent weaker in 2012 compared with a year earlier, and in real terms, about 5.7 per cent weaker. |
| |
| | Movements in the rand will continue to reflect global risk appetite and investor sentiment towards South Africa. |
| |
| | Figure 2.6 Trends in the rand and other emerging market currencies against the US dollar, 2010 – 2013 |
| |
| | 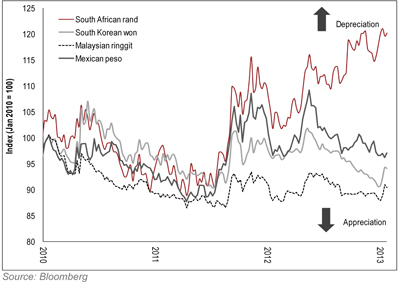 |
| |
| | ¢ Conclusion |
| |
| Growth expected to pick up over medium term as confidence returns and global conditions improve | | Growth is expected to be muted this year, and then to accelerate over the medium term. Macroeconomic stability continues to provide the platform for stronger and sustainable growth. South Africa’s economic prospects remain closely linked to global developments and are reliant on a rebound in business and investor confidence. The real economy is expected to strengthen gradually over the medium term. Government will work to improve investor sentiment, contributing to attracting the inflows required to fund the budget and current account deficits. |
| |
| | Implementation of the NDP will alleviate structural constraints, enabling the country to achieve sustained inclusive growth and broadening economic participation. |
30
3
Fiscal policy
In brief
| • | | Economic growth has been weaker than anticipated and revenue collection below projections, leading to a budget deficit of 5.2 per cent in 2012/13. As a result, government is taking additional steps to ensure that expenditure remains firmly under control. |
| • | | Growth in spending has been curbed, with medium-term expenditure framework (MTEF) allocations to national departments adjusted downwards to reduce the deficit. |
| • | | The contingency reserve is reduced by a total of R23.5 billion over the medium term, with R4 billion, R6.5 billion and R10 billion allocated to the reserve during each year of the spending period. |
| • | | Real growth in non-interest spending will average 2.3 per cent over the medium term, down from 2.9 per cent projected at the time of the 2012 Medium Term Budget Policy Statement. Real growth in capital expenditure will average 3.4 per cent. |
| • | | Expenditure reviews will seek to increase the efficiency of spending and eliminate waste. A tax policy review will examine whether revenue levels are sufficient to ensure fiscal sustainability over the long term. |
| | |
Government continues to provide support for the economy while ensuring sustainable public finances. Fiscal policy is anchored by the principles of countercyclicality, debt sustainability and intergenerational fairness: | | Countercyclicality, debt sustainability and intergenerational equity are guiding principles of policy |
| |
• Countercyclicality means that spending supports the economy during downturns, even if revenue is insufficient, and the accumulation of debt is reversed to build fiscal space as the economy recovers. | | |
| |
• Sustainability ensures that debt remains under control so that government can continue to borrow at reasonable rates. | | |
| |
• Intergenerational fairness means that our children do not have to repay debts taken on today unless they also share in the benefits of assets created by that spending. | | |
31
2013 BUDGET REVIEW
| | |
Expenditure will moderate, debt will stabilise and capital investment will be prioritised | | Within this framework, government has three medium-term objectives: |
| | • Moderating expenditure growth to expand public services at a sustainable pace. |
| | • Stabilising debt as a share of national income by narrowing the budget deficit. |
| | • Improving the impact of public spending by prioritising capital investment, and reducing waste and inefficiency. |
| | With the onset of the global financial crisis in 2008, and in line with its countercyclical stance, government sustained expenditure levels even as revenue declined sharply. South Africa’s economic cycle reached a low point during the 2009 recession. Since then structural constraints and weak global demand have dampened the pace of economic growth. Revenue has not yet fully recovered and, although spending growth has been well contained, the budget deficit has remained elevated. |
| |
| | Economic weakness over the past six months has resulted in a pronounced shortfall in revenue, leading to an unavoidable widening of the deficit in 2012/13. The budget deficit is now estimated at 5.2 per cent of GDP. The widening of the deficit supports the economy, but continued countercyclicality in the short term necessitates a stronger medium-term path of consolidation to ensure debt sustainability. |
| |
| | Reduction in core spending plans |
| |
| To realise government’s objectives, core spending has been reduced | | The 2013 Budget adjusts the fiscal framework to ensure a stronger path of consolidation towards debt sustainability. Compared with the fiscal framework outlined in the October 2012 Medium Term Budget Policy Statement, government’s core spending plans are reduced by R10.4 billion over the next three years. This has been achieved by moderating the growth of allocations, mainly to national departments. Government has also reduced the unallocated portion of spending by trimming the contingency reserve, which will now be R4 billion, R6.5 billion and R10 billion over the three years of the MTEF. Real non-interest expenditure is projected to grow at an average rate of 2.3 per cent per year over the medium term, down from 2.9 per cent projected in October 2012. |
| |
| | Government is committed to remaining within its expenditure ceiling. New policy initiatives will be financed from savings, efficiency gains and reprioritisation over the next three fiscal years. |
| |
| Expenditure reviews will be conducted to find savings and improve value for money | | To support this process, the Ministers’ Committee on the Budget will oversee expenditure reviews in the coming year to analyse patterns of public spending, including personnel spending. The reviews will also identify opportunities to improve value for money, such as enhanced procurement controls and the phasing out of projects that are ineffective or no longer aligned with policy priorities. A complementary review will assess whether tax policy is appropriate to support government’s policy objectives, including fiscal sustainability. |
| |
| | Over the longer term, faster and more inclusive economic growth is required to create jobs, widen the tax base and generate sufficient revenue to support government’s priorities. |
32
CHAPTER 3: FISCAL POLICY
| | |
Fiscal framework | | |
| |
| Table 3.1 summarises the consolidated fiscal framework. The 2012/13 budget deficit is projected at 5.2 per cent of GDP, up from 4.8 per cent of GDP projected in October 2012. The wider deficit is largely the result of a revenue shortfall, as well as downward revisions to nominal GDP by the Reserve Bank to correct previous estimates. A stronger moderation in expenditure growth offsets the wider deficit over the medium term. The budget deficit is projected to narrow as economic growth and revenue collections gather pace over the three-year period, reaching 3.1 per cent of GDP in the outer year. | | Budget deficit widens to 5.2 per cent of GDP in 2012/13 as a result of revenue shortfall |
Table 3.1 Consolidated fiscal framework, 2009/10 – 2015/16
| | | | | | | | | | | | | | | | | | | | | | | | | | | | |
| | | 2009/10 | | | 2010/11 | | | 2011/12 | | | 2012/13 | | | 2013/14 | | | 2014/15 | | | 2015/16 | |
R billion / percentage of GDP | | Outcome | | | Revised
estimate | | | Medium-term estimates | |
Revenue | | | 664.5 | | | | 757.2 | | | | 836.9 | | | | 887.8 | | | | 985.7 | | | | 1 091.1 | | | | 1 199.8 | |
| | | 27.1 | % | | | 27.7 | % | | | 28.1 | % | | | 27.7 | % | | | 28.0 | % | | | 28.1 | % | | | 28.1 | % |
Expenditure | | | 824.1 | | | | 877.5 | | | | 954.2 | | | | 1 055.9 | | | | 1 149.4 | | | | 1 244.3 | | | | 1 334.1 | |
| | | 33.6 | % | | | 32.1 | % | | | 32.1 | % | | | 32.9 | % | | | 32.6 | % | | | 32.1 | % | | | 31.2 | % |
Non-interest expenditure | | | 766.9 | | | | 811.3 | | | | 877.7 | | | | 967.6 | | | | 1 049.6 | | | | 1 135.6 | | | | 1 215.9 | |
| | | 31.3 | % | | | 29.7 | % | | | 29.5 | % | | | 30.2 | % | | | 29.8 | % | | | 29.3 | % | | | 28.5 | % |
Debt-service cost | | | 57.1 | | | | 66.2 | | | | 76.5 | | | | 88.3 | | | | 99.7 | | | | 108.7 | | | | 118.2 | |
| | | 2.3 | % | | | 2.4 | % | | | 2.6 | % | | | 2.8 | % | | | 2.8 | % | | | 2.8 | % | | | 2.8 | % |
| | | | | | | | | | | | | | | | | | | | | | | | | | | | |
Budget balance | | | -159.6 | | | | -120.4 | | | | -117.3 | | | | -168.0 | | | | -163.7 | | | | -153.2 | | | | -134.4 | |
| | | -6.5 | % | | | -4.4 | % | | | -3.9 | % | | | -5.2 | % | | | -4.6 | % | | | -3.9 | % | | | -3.1 | % |
Primary balance | | | -4.2 | % | | | -2.0 | % | | | -1.4 | % | | | -2.5 | % | | | -1.8 | % | | | -1.1 | % | | | -0.4 | % |
| | | | | | | | | | | | | | | | | | | | | | | | | | | | |
New format for the consolidated government account
The annexures to the 2013 Budget present the statistical tables for the consolidated government accounts in a new format. The tables in this chapter are presented in the old format.
The new format, which was announced in the 2012 Budget, clearly distinguishes between operating activities and capital budgets, and separates transactions in financial assets and liabilities, which includes loans and equity provided to public corporations and agencies. Extraordinary receipts and payments are brought into the budget framework in line with global standards, in particular the International Monetary Fund’s Government Finance Statistics Manual 2001.
One consequence of the new format is that the budget deficit is narrower than previously reported, since it is financed partly by extraordinary receipts. Applying the new format to historical numbers results in revisions of 0.1 to 0.5 per cent of GDP. For 2012/13 the difference amounts to 0.3 per cent.
The old format is retained in this chapter to maintain comparability with the Medium Term Budget Policy Statement – which set out fiscal policy parameters over the current MTEF. The new format is presented in Table 8 of Annexure B. In future, all budget data will appear in the new format.
| | |
¢ Revenue and spending trends | | |
| |
| The consolidated fiscal framework brings national and provincial government, social security funds and a diverse set of public entities under the purview of a single budget process. The main budget finances the bulk of spending, and includes funds appropriated by Parliament in the form of budget votes as well as the provincial share of revenue and other direct charges mandated by the Constitution. Provincial governments, social security funds and public entities also finance their activities from own revenue, and the consolidated budget includes these elements. These budget categories are explained in the box below. | | Main budget finances the bulk of spending, including funds appropriated by Parliament in budget votes |
33
2013 BUDGET REVIEW
| | |
An overview of the consolidated budget Government finances are presented in two ways, each highlighting key aspects of the budget. The main budget determines national government’s borrowing requirement. It consists of two elements. The first, appropriations by Parliament through budget votes, are mainly for national departments, and includes transfers to provinces, local government and public entities. The second, direct charges against the National Revenue Fund, includes the provincial equitable share, debt-service costs, and the salaries of judges and public representatives. The consolidated budget provides a fuller picture of government’s contribution to the economy. It takes account of the main budget as well as the spending of provinces, social security funds and public entities financed from their own revenue. | | 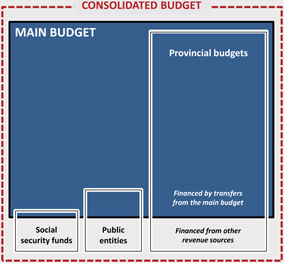 |
Provincial budgets are largely financed by the provincial equitable share and conditional grants from the main budget. But provinces supplement these funds with their own revenues, such as gambling taxes, hospital fees and sales of goods and services. Also excluded from the consolidation is expenditure by metros and other large municipalities, which is financed from own revenue, such as property rates.
The consolidated budget includes 187 public entities. These include large entities such as the South African National Roads Agency Limited, the Passenger Rail Agency, the South African Revenue Service and agencies that provide bulk water infrastructure. Public entities receive some transfers from the main budget, but are also financed from own revenue. State-owned companies that function as standalone operations largely on a commercial basis, such as Eskom and Transnet, are not included in the consolidated accounts.
Social security funds include the Unemployment Insurance Fund, compensation funds and the Road Accident Fund. They are financed mainly by statutory levies or contributions, but receive some transfers from the main budget.
| | |
| | Revenue |
| |
| | Weaker-than-expected economic growth and supply disruptions in the mining sector have resulted in a downward adjustment in revenue estimates for 2012/13. Tax revenue is expected to be R16.3 billion below the 2012 Budget estimate of R826 billion. The lower base of revenue collection carries through over the three-year spending period. Compared with the 2012 Budget, tax revenue is revised down by R13.2 billion and R27.8 billion in 2013/14 and 2014/15 respectively. |
| |
| Corporate income tax is likely to stabilise at a lower share of GDP than during the mid-2000s | | Corporate income tax collections are expected to yield R156.4 billion compared with the 2012 Budget estimate of R167.4 billion. Corporate income tax is likely to stabilise at a lower share of GDP than at the height of the economic upturn in the mid-2000s, with a moderate improvement over the medium term, as shown in Figure 3.1. |
| |
| | Personal income tax is also lower than projected for 2012/13. Against a budget estimate of R286 billion, government now expects to collect R274 billion. This underperformance began in August 2012, with the outcome in the second half of the year 5.7 per cent lower than in the first half, owing to mining sector disputes and sluggish employment growth. |
34
CHAPTER 3: FISCAL POLICY
| Figure 3.1 | Tax revenue performance and projections, 2005/06 – 2015/16 |
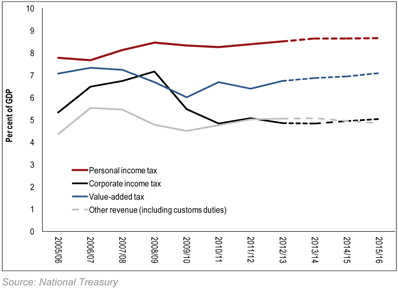
| | |
Transfers under the Southern African Customs Union (SACU) agreement have recovered promptly to their pre-crisis levels. This has led to substantial increases in SACU transfers over the past three years. Government continues to seek agreement from its partners on a new SACU revenue-sharing formula that would reduce the volatility of transfers and contribute more effectively to regional development. | | A new SACU revenue-sharing formula would reduce regional volatility |
| |
| Non-tax revenue included a once-off reimbursement of R3.5 billion in 2011/12 due to the cancellation of the A400M Airbus contract by the Department of Defence. During 2012/13, turbulence in the mining sector led to reduced mineral royalties. Non-tax revenue for 2012/13 is now estimated at R14.5 billion, R616 million lower than the 2012 Budget estimate. | | |
Table 3.2 Consolidated government budget revenue, 2009/10 – 2015/16
| | | | | | | | | | | | | | | | | | | | | | | | | | | | |
| | | 2009/10 | | | 2010/11 | | | 2011/12 | | | 2012/13 | | | 2013/14 | | | 2014/15 | | | 2015/16 | |
R billion | | Outcomes | | | Revised
estimate | | | Medium-term estimates | |
Main budget revenue | | | | | | | | | | | | | | | | | | | | | | | | | | | | |
Gross tax revenue | | | 598.7 | | | | 674.2 | | | | 742.7 | | | | 810.2 | | | | 898.0 | | | | 991.8 | | | | 1 099.0 | |
Non-tax revenue | | | 8.9 | | | | 13.5 | | | | 19.2 | | | | 14.5 | | | | 18.3 | | | | 19.1 | | | | 20.2 | |
SACU transfers | | | -27.9 | | | | -17.9 | | | | -21.8 | | | | -42.2 | | | | -43.4 | | | | -43.0 | | | | -48.5 | |
| | | | | | | | | | | | | | | | | | | | | | | | | | | | |
National revenue fund | | | 579.7 | | | | 669.7 | | | | 740.1 | | | | 782.5 | | | | 873.0 | | | | 967.9 | | | | 1 070.7 | |
Percentage of GDP | | | 23.6 | % | | | 24.5 | % | | | 24.9 | % | | | 24.4 | % | | | 24.8 | % | | | 24.9 | % | | | 25.1 | % |
| | | | | | | | | | | | | | | | | | | | | | | | | | | | |
Net own revenue of: | | | | | | | | | | | | | | | | | | | | | | | | | | | | |
Net additions due to consolidation1 | | | 84.8 | | | | 87.4 | | | | 96.8 | | | | 105.4 | | | | 112.8 | | | | 123.2 | | | | 129.0 | |
| | | | | | | | | �� | | | | | | | | | | | | | | | | | | | |
Consolidated budget revenue | | | 664.5 | | | | 757.2 | | | | 836.9 | | | | 887.8 | | | | 985.7 | | | | 1 091.1 | | | | 1 199.8 | |
Percentage of GDP | | | 27.1 | % | | | 27.7 | % | | | 28.1 | % | | | 27.7 | % | | | 28.0 | % | | | 28.1 | % | | | 28.1 | % |
| | | | | | | | | | | | | | | | | | | | | | | | | | | | |
| 1. | Includes revenue earned by social security funds, public entities and provinces net of transfers and transactions between institutions |
35
2013 BUDGET REVIEW
Table 3.3 Revisions to revenue outcomes and projections, 2011/12 – 2014/15
| | | | | | | | | | | | | | | | | | | | | | | | | | | | | | | | |
| | | 2011/12 | | | 2012/13 | | | 2013/14 | | | 2014/15 | |
R billion | | Budget
estimate | | | Outcome | | | Budget
estimate | | | Revised
estimate | | | 2012
Forward
estimate | | | 2013
Budget | | | 2012
Forward
estimate | | | 2013
Budget | |
Revenue | | | | | | | | | | | | | | | | | | | | | | | | | | | | | | | | |
Gross tax revenue | | | 738.7 | | | | 742.7 | | | | 826.4 | | | | 810.2 | | | | 913.6 | | | | 898.0 | | | | 1 019.6 | | | | 991.8 | |
Non-tax revenue | | | 17.6 | | | | 19.2 | | | | 15.1 | | | | 14.5 | | | | 17.9 | | | | 18.3 | | | | 19.0 | | | | 19.1 | |
SACU transfers | | | -21.8 | | | | -21.8 | | | | -42.2 | | | | -42.2 | | | | -37.2 | | | | -43.4 | | | | -41.4 | | | | -43.0 | |
| | | | | | | | | | | | | | | | | | | | | | | | | | | | | | | | |
Main budget revenue | | | 734.6 | | | | 740.1 | | | | 799.3 | | | | 782.5 | | | | 894.3 | | | | 873.0 | | | | 997.2 | | | | 967.9 | |
Percentage of GDP | | | 24.5 | % | | | 24.9 | % | | | 24.2 | % | | | 24.4 | % | | | 24.7 | % | | | 24.8 | % | | | 24.9 | % | | | 24.9 | % |
| | | | | | | | | | | | | | | | | | | | | | | | | | | | | | | | |
Net additions due to consolidation1 | | | 95.7 | | | | 96.8 | | | | 105.5 | | | | 105.4 | | | | 111.6 | | | | 112.8 | | | | 121.0 | | | | 123.2 | |
| | | | | | | | | | | | | | | | | | | | | | | | | | | | | | | | |
Consolidated budget revenue | | | 830.2 | | | | 836.9 | | | | 904.8 | | | | 887.8 | | | | 1 005.9 | | | | 985.7 | | | | 1 118.2 | | | | 1 091.1 | |
Percentage of GDP | | | 27.7 | % | | | 28.1 | % | | | 27.4 | % | | | 27.7 | % | | | 27.8 | % | | | 28.0 | % | | | 28.0 | % | | | 28.1 | % |
| | | | | | | | | | | | | | | | | | | | | | | | | | | | | | | | |
| 1. | Includes revenue earned by social security funds, public entities and provinces net of transfers and transactions between institutions |
| | |
| | Expenditure |
| |
| Government has moderated spending over MTEF period, trimmed contingency reserve and reprioritised allocations | | The 2012 Medium Term Budget Policy Statement reported that government would stay within the overall spending projection set out in the 2012 Budget. In light of subsequent developments, government has taken the additional step of moderating spending growth over the next three years to offset the effects of lower revenue collection on the deficit. |
| |
| | Since the publication of the Medium Term Budget Policy Statement in October 2012, government has: |
| |
| | • Trimmed the medium-term spending projections of national departments. Reductions focused on programmes that had forecast high spending growth, but had not met their projections. |
| |
| | • Reduced the contingency reserve, which is the unallocated portion of non-interest expenditure. While the adjusted levels are consistent with the historic needs of unforeseen and unavoidable expenditure, this step also means that there is a limited pool of financing for new policy initiatives over the medium term unless there are significant improvements in revenue collection. |
| |
| | • Reprioritised resource allocation to strengthen service delivery, paying attention to the efficiency of spending. Departments were asked to review their spending, and R52.1 billion has been shifted in support of key priorities. |
Table 3.4 Main budget non-interest expenditure, 2010/11 – 2015/16
| | | | | | | | | | | | | | | | | | | | | | | | |
R billion | | 2010/11 | | | 2011/12 | | | 2012/13 | | | 2013/14 | | | 2014/15 | | | 2015/16 | |
Budget 2010 | | | 746.8 | | | | 799.9 | | | | 860.3 | | | | | | | | | | | | | |
Budget 2011 | | | 743.4 | | | | 812.3 | | | | 877.3 | | | | 949.0 | | | | | | | | | |
Budget 2012 | | | | | | | 814.6 | | | | 880.0 | | | | 953.0 | | | | 1 030.5 | | | | | |
MTBPS 2012 | | | | | | | | | | | 878.7 | | | | 953.0 | | | | 1 030.5 | | | | 1 119.0 | |
Budget 2013 | | | | | | | | | | | 878.6 | | | | 955.3 | | | | 1 029.3 | | | | 1 107.6 | |
36
CHAPTER 3: FISCAL POLICY
| | |
In combination, these revisions bring reductions in government’s main budget non-interest expenditure to R10.4 billion over the MTEF period compared with the October 2012 estimate. The main budget spending plans are the core components of expenditure over which government has direct control. | | Reduction in main budget non-interest expenditure of R10.4 billion |
| |
| In 2013/14, main budget non-interest expenditure is expected to be about R2.3 billion higher than set out in the 2012 Budget. This deviation is the result of government’s decision to recapitalise the Development Bank of Southern Africa to improve the financing of local government infrastructure. This transaction, however, will not affect the overall borrowing requirement, as it is financed fully through a corresponding disposal of non-core assets. | | |
| |
| Consolidated non-interest expenditure is now estimated to grow by 2.3 per cent in real terms on average over the three years, lower than the 2.9 per cent presented in the 2012 Medium Term Budget Policy Statement and the 2.6 per cent anticipated at the time of the 2012 Budget. | | Expenditure growth over medium term will be lower than forecast in October 2012 |
The contingency reserve
Government allocates a contingency reserve to fund unforeseeable and unavoidable expenditure not included in the baseline. The reserve is relatively small in the first year of the MTEF, but increases in the outer years owing to a greater degree of uncertainty. In the first year, the contingency reserve is allocated in the adjustment budget six months after the start of the fiscal year (October), and is usually applied to cover the balance of revenue shortfalls or spending overruns.
| | | | | | | | | | | | | | | | | | | | |
| Contingency reserve, 1998 – 2013 Budgets | |
| | | | | |
R million | | 1998 | | | 2002 | | | 2006 | | | 2010 | | | 2013 | |
Year 1 | | | 1 000 | | | | 3 300 | | | | 2 500 | | | | 6 000 | | | | 4 000 | |
Year 2 | | | 3 000 | | | | 5 000 | | | | 5 000 | | | | 12 000 | | | | 6 500 | |
Year 3 | | | 7 000 | | | | 9 000 | | | | 8 000 | | | | 24 000 | | | | 10 000 | |
| | | | | | | | | | | | | | | | | | | | |
Total | | | 11 000 | | | | 17 300 | | | | 15 500 | | | | 42 000 | | | | 20 500 | |
| | | | | | | | | | | | | | | | | | | | |
Between 2008 and 2012, the three-year contingency reserve averaged R39.7 billion. Unforeseen and unavoidable expenditure adjustments have, however, averaged just R4 billion in the last five years, implying considerable space to reduce the reserve without jeopardising the financing of unexpected contingencies.
Table 3.5 Consolidated government expenditure, 2009/10 – 2015/16
| | | | | | | | | | | | | | | | | | | | | | | | | | | | |
| | | 2009/10 | | | 2010/11 | | | 2011/12 | | | 2012/13 | | | 2013/14 | | | 2014/15 | | | 2015/16 | |
R billion | | Outcomes | | | Revised
estimate | | | Medium-term estimates | |
Main budget expenditure | | | | | | | | | | | | | | | | | | | | | | | | | | | | |
Main appropriation | | | 436.4 | | | | 455.6 | | | | 499.3 | | | | 542.4 | | | | 592.7 | | | | 642.4 | | | | 695.0 | |
Direct charges | | | 310.8 | | | | 349.5 | | | | 389.2 | | | | 424.6 | | | | 462.4 | | | | 495.6 | | | | 530.7 | |
of which: | | | | | | | | | | | | | | | | | | | | | | | | | | | | |
Provincial equitable share | | | 236.9 | | | | 265.1 | | | | 291.7 | | | | 313.0 | | | | 337.6 | | | | 359.9 | | | | 383.7 | |
Debt-service cost | | | 57.1 | | | | 66.2 | | | | 76.5 | | | | 88.3 | | | | 99.7 | | | | 108.7 | | | | 118.2 | |
| | | | | | | | | | | | | | | | | | | | | | | | | | | | |
Main budget expenditure | | | 747.2 | | | | 805.1 | | | | 888.5 | | | | 967.0 | | | | 1 055.1 | | | | 1 138.0 | | | | 1 225.7 | |
Percentage of GDP | | | 30.5 | % | | | 29.4 | % | | | 29.9 | % | | | 30.1 | % | | | 30.0 | % | | | 29.3 | % | | | 28.7 | % |
| | | | | | | | | | | | | | | | | | | | | | | | | | | | |
Net additions due to consolidation1 | | | 76.9 | | | | 72.4 | | | | 65.7 | | | | 88.9 | | | | 94.3 | | | | 106.4 | | | | 108.4 | |
| | | | | | | | | | | | | | | | | | | | | | | | | | | | |
Consolidated expenditure | | | 824.1 | | | | 877.5 | | | | 954.2 | | | | 1 055.9 | | | | 1 149.4 | | | | 1 244.3 | | | | 1 334.1 | |
Percentage of GDP | | | 33.6 | % | | | 32.1 | % | | | 32.1 | % | | | 32.9 | % | | | 32.6 | % | | | 32.1 | % | | | 31.2 | % |
| | | | | | | | | | | | | | | | | | | | | | | | | | | | |
| 1. | Includes expenditure incurred by social security funds, public entities and provinces not financed from the main budget, net of transfers and transactions between institutions |
37
2013 BUDGET REVIEW
| | |
| | Revisions to estimates of expenditure are relatively small, with the outcome for 2012/13 anticipated at R2 billion below the forward estimate of the 2012 Budget. |
Table 3.6 Revised estimates of consolidated government expenditure, 2012/13 – 2014/15
| | | | | | | | | | | | | | | | | | | | | | | | |
| | | 2012/13 | | | 2013/14 | | | 2014/15 | |
R billion | | Budget
estimate1 | | | Revised
estimate | | | 2012
Forward
estimate1 | | | 2013
Budget | | | 2012
Forward
estimate1 | | | 2013
Budget | |
Expenditure | | | | | | | | | | | | | | | | | | | | | | | | |
Current payments | | | 640.4 | | | | 637.1 | | | | 690.3 | | | | 688.8 | | | | 736.4 | | | | 740.5 | |
of which: | | | | | | | | | | | | | | | | | | | | | | | | |
Compensation of employees | | | 371.1 | | | | 376.6 | | | | 394.4 | | | | 406.2 | | | | 417.9 | | | | 431.7 | |
Debt-service costs | | | 89.4 | | | | 88.3 | | | | 100.8 | | | | 99.7 | | | | 109.0 | | | | 108.7 | |
Transfers and subsidies | | | 340.0 | | | | 346.2 | | | | 371.7 | | | | 375.6 | | | | 398.5 | | | | 406.0 | |
Payments for capital assets | | | 70.9 | | | | 71.2 | | | | 77.1 | | | | 78.0 | | | | 83.1 | | | | 88.0 | |
Payments for financial assets | | | 1.6 | | | | 1.5 | | | | 0.5 | | | | 2.9 | | | | 0.7 | | | | 3.3 | |
Contingency reserve | | | 5.8 | | | | — | | | | 11.9 | | | | 4.0 | | | | 24.0 | | | | 6.5 | |
| | | | | | | | | | | | | | | | | | | | | | | | |
Total | | | 1 058.7 | | | | 1 055.9 | | | | 1 151.6 | | | | 1 149.4 | | | | 1 242.8 | | | | 1 244.3 | |
Percentage of GDP | | | 32.1 | % | | | 32.9 | % | | | 31.8 | % | | | 32.6 | % | | | 31.1 | % | | | 32.1 | % |
| | | | | | | | | | | | | | | | | | | | | | | | |
| 1. | Adjusted for accounting policy changes and additional netting of inter-entity transactions |
| | |
| | Expenditure by economic classification |
| |
| A greater share of public funds must become available for capital investment over time | | Government is committed to ensuring that a greater share of public funds becomes available for capital investment over time. Over the medium term, government will moderate growth in employee compensation, progressively reduce capital underspending, accelerate rollout of infrastructure, and eliminate waste in goods and services budgets. |
| |
| | Figure 3.2 Real growth in expenditure by economic classification, outcomes for 2008/09 – 2011/12 and projections for 2012/13 – 2015/16 |
| |
| | 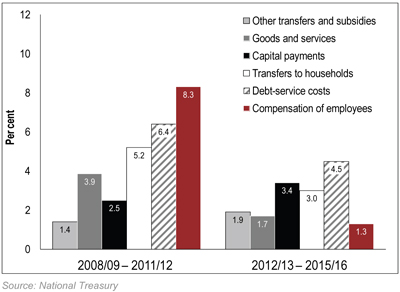 |
| |
| Interest payments are fastest-growing expenditure item over MTEF, followed by real capital expenditure | | Interest payments for debt are projected to be the fastest-growing expenditure item over the next three years, followed by real capital expenditure, which is forecast to grow by an annual average of 3.4 per cent over the MTEF period. |
| | |
38
CHAPTER 3: FISCAL POLICY
| | |
Spending on compensation of employees is far slower than in previous years, growing at an annual average of 1.3 per cent in real terms over the MTEF period. As a result, government’s wage bill declines as a share of total spending. The multi-year wage settlement reached in 2012 provides greater certainty against unanticipated wage increases that have to be financed by the fiscus. Government will continue to monitor growth in state employment, which has been a major contributor to the increasing wage bill over the past five years, to ensure that budget objectives are met. | | Employee compensation as percentage of spending declines over medium term |
Table 3.7 Composition of spending by economic classification, 2011/12 and 2015/16
| | | | | | | | |
Share of allocated spending | | 2011/12
Outcome | | | 2015/16
Projection | |
Compensation of employees | | | 36.2 | % | | | 34.5 | % |
Goods and services | | | 16.1 | % | | | 15.3 | % |
Interest and rent on land | | | 8.8 | % | | | 9.5 | % |
Transfers and subsidies | | | 32.2 | % | | | 32.8 | % |
of which: | | | | | | | | |
Households | | | 15.5 | % | | | 15.8 | % |
Departmental agencies, provinces and municipalities | | | 9.7 | % | | | 9.8 | % |
Public corporations and private enterprises | | | 2.2 | % | | | 2.5 | % |
Higher education institutions | | | 2.1 | % | | | 2.0 | % |
Payments for capital assets | | | 6.5 | % | | | 6.9 | % |
| | | | | | | | |
Composition of the deficit
| | |
The main budget deficit, which determines the level of state borrowing, deteriorated in 2012/13. From an estimated R170 billion at the time of the 2012 Budget, the gap between spending and revenue on the main budget is now projected as R184.5 billion. This wider borrowing requirement will carry through over the MTEF period. | | |
Table 3.8 Consolidated deficit, 2009/10 – 2015/16
| | | | | | | | | | | | | | | | | | | | | | | | | | | | |
R billion | | 2009/10 | | | 2010/11 | | | 2011/12 | | | 2012/13 | | | 2013/14 | | | 2014/15 | | | 2015/16 | |
Main budget balance | | | -167.5 | | | | -135.4 | | | | -148.4 | | | | -184.5 | | | | -182.1 | | | | -170.1 | | | | -155.0 | |
Social security funds | | | 10.6 | | | | 10.8 | | | | 15.1 | | | | 15.6 | | | | 14.2 | | | | 12.4 | | | | 13.2 | |
Public entities | | | -2.5 | | | | -0.5 | | | | 9.7 | | | | 0.3 | | | | -0.8 | | | | -2.5 | | | | -2.1 | |
Provinces | | | -0.2 | | | | 4.7 | | | | 6.3 | | | | 0.6 | | | | 5.0 | | | | 6.9 | | | | 9.5 | |
| | | | | | | | | | | | | | | | | | | | | | | | | | | | |
Consolidated budget balance | | | -159.6 | | | | -120.4 | | | | -117.3 | | | | -168.0 | | | | -163.7 | | | | -153.2 | | | | -134.4 | |
| | | | | | | | | | | | | | | | | | | | | | | | | | | | |
| | |
The main budget deficit is offset by surpluses expected on the accounts of provincial governments and social security funds. Provinces have been asked to budget for surpluses, in part to compensate for previous unauthorised expenditure. Spending of social security funds is projected to be lower owing to weaknesses in processing claims in the Road Accident Fund and compensation funds. Delayed rollout of decentralisation and lower actuarial projections of benefit payments by the Unemployment Insurance Fund and compensation funds over the medium term are contributing factors. Borrowing by public entities for capital investment widens the consolidated deficit. | | |
39
2013 BUDGET REVIEW
| | |
| | The result of these dynamics is that the consolidated deficit is considerably lower than the main budget deficit. Risks that may affect this outcome include moderating social security fund surpluses as operational weaknesses are addressed, and rising spending pressures that reduce provincial surpluses. The National Treasury will monitor these developments closely. |
| |
| Current balance shows how much government borrows to run its operations | | The sustainability of the deficit and the question of intergenerational fairness are reflected in the current balance, which shows how much government borrows to run its operations. A long-term operating deficit is unsustainable, while a positive operating balance allows for investment in future productive capacity. The current deficit of 3 per cent of GDP in 2012/13 will narrow over the MTEF period. Lower borrowing for current spending, alongside sustained spending on capital investment, will improve the composition of the deficit. |
Table 3.9 Current and capital balances, 2010/11 – 2015/16
| | | | | | | | | | | | | | | | | | | | | | | | |
| | | 2010/11 | | | 2011/12 | | | 2012/13 | | | 2013/14 | | | 2014/15 | | | 2015/16 | |
R billion | | Outcome | | | Estimate | | | Medium-term estimates | |
Current receipts | | | 755.0 | | | | 831.1 | | | | 886.5 | | | | 984.5 | | | | 1 089.9 | | | | 1 198.5 | |
Current payments | | | 800.3 | | | | 890.4 | | | | 983.2 | | | | 1 064.4 | | | | 1 146.6 | | | | 1 228.7 | |
Current balance | | | -45.3 | | | | -59.3 | | | | -96.8 | | | | -79.9 | | | | -56.7 | | | | -30.2 | |
Percentage of GDP | | | -1.7 | % | | | -2.0 | % | | | -3.0 | % | | | -2.3 | % | | | -1.5 | % | | | -0.7 | % |
Capital financing requirement | | | -55.4 | | | | -62.2 | | | | -71.0 | | | | -77.9 | | | | -87.9 | | | | -92.3 | |
Percentage of GDP | | | -2.0 | % | | | -2.1 | % | | | -2.2 | % | | | -2.2 | % | | | -2.3 | % | | | -2.2 | % |
| | |
| | Public-sector borrowing requirement |
| |
| | The public-sector borrowing requirement covers consolidated government, local government and non-financial public institutions, but excludes the development finance institutions. |
| |
| | This category of borrowing represents the funds needed by the entire non-financial public sector to cover any deficit in financing its activities. The borrowing requirement is forecast to widen to 7.4 per cent of GDP in 2012/13, up from the 7.1 per cent of GDP projected a year ago, largely as a result of the wider budget deficit. |
Table 3.10 Public-sector borrowing requirement,1 2009/10 – 2015/16
| | | | | | | | | | | | | | | | | | | | | | | | | | | | |
| | | 2009/10 | | | 2010/11 | | | 2011/12 | | | 2012/13 | | | 2013/14 | | | 2014/15 | | | 2015/16 | |
R billion / percentage of GDP | | Outcome | | | Revised
estimate | | | Medium-term estimates | |
Consolidated government2 | | | 153.8 | | | | 118.2 | | | | 113.5 | | | | 159.8 | | | | 159.6 | | | | 150.3 | | | | 131.3 | |
| | | 6.3 | % | | | 4.3 | % | | | 3.8 | % | | | 5.0 | % | | | 4.5 | % | | | 3.9 | % | | | 3.1 | % |
Local authorities | | | 10.5 | | | | 8.9 | | | | 6.2 | | | | 9.6 | | | | 8.3 | | | | 9.3 | | | | 9.8 | |
| | | 0.4 | % | | | 0.3 | % | | | 0.2 | % | | | 0.3 | % | | | 0.2 | % | | | 0.2 | % | | | 0.2 | % |
State-owned companies3 | | | 76.3 | | | | 44.4 | | | | 42.5 | | | | 68.5 | | | | 57.9 | | | | 43.6 | | | | 46.0 | |
| | | 3.1 | % | | | 1.6 | % | | | 1.4 | % | | | 2.1 | % | | | 1.6 | % | | | 1.1 | % | | | 1.1 | % |
| | | | | | | | | | | | | | | | | | | | | | | | | | | | |
Borrowing requirement | | | 240.7 | | | | 171.5 | | | | 162.2 | | | | 238.0 | | | | 225.8 | | | | 203.3 | | | | 187.0 | |
| | | 9.8 | % | | | 6.3 | % | | | 5.5 | % | | | 7.4 | % | | | 6.4 | % | | | 5.2 | % | | | 4.4 | % |
| | | | | | | | | | | | | | | | | | | | | | | | | | | | |
| 1. | A negative number reflects a surplus and a positive number a deficit |
| 2. | Net borrowing requirement including extraordinary receipts and payments |
| 3. | South African National Roads Agency Limited and Trans-Caledon Tunnel Authority are included in consolidated government net borrowing |
40
CHAPTER 3: FISCAL POLICY
| | |
Borrowing by state-owned companies is projected to decline from 2.1 per cent of GDP in 2012/13 to 1.1 per cent of GDP by 2015/16. Eskom and Transnet remain the largest contributors to the borrowing requirement. The financing of their capital infrastructure programmes will be supported by higher cash flows, limiting the need for increased debt-issuance. | | Borrowing requirement of state-owned companies declines to 1.1 per cent of GDP in outer year |
| |
| Compared to the 2012 Budget, municipal debt issuance has been revised upwards. Local government borrowing is projected to stabilise as a percentage of GDP over the three-year framework. Several metropolitan municipalities are nearing their prudential debt limits, reducing their ability to increase borrowing at low rates on the open market. Municipalities are increasingly substituting borrowing for grant financing from the main budget to fund capital expenditure, as weaknesses in revenue collection persist. Government is providing R7.9 billion to recapitalise the Development Bank of Southern Africa over the MTEF period to support the financing of municipal infrastructure. | | |
| |
| Debt sustainability | | |
| |
| During the mid-2000s, South Africa built up ample fiscal space that enabled a robust countercyclical response to the 2009 recession. Since then, substantial deficits and the slow economic recovery have eroded South Africa’s debt position relative to its peers, as shown in Figure 3.3. | | Fiscal framework is adjusted to stabilise debt over medium term |
| |
Figure 3.3 South Africa’s gross debt-to-GDP ratio compared with peer economies,1
2000 – 2016 | | |
| |
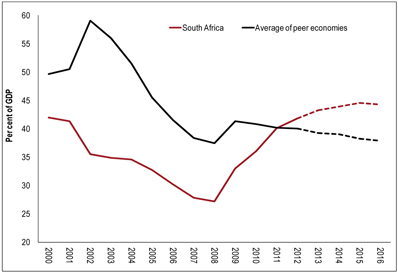 | | |
| |
1. Average of Argentina, Brazil, Bulgaria, Chile, Colombia, India, Indonesia, Kenya, Latvia, Lithuania, Malaysia, Mexico, Morocco, Peru, Poland, Russia, Thailand, Turkey and Uruguay Source: International Monetary Fund, National Treasury; South African data is for fiscal years | | |
| |
| The fiscal framework accommodates the wider deficit position this year but is adjusted to stabilise the debt over the medium term. | | |
| |
| The principal factor influencing the debt trajectory is the primary balance on the main budget – the gap between revenue and non-interest expenditure that government must finance. The 2013 fiscal framework narrows the primary deficit on the main budget from 3 per cent of GDP in | | Primary balance narrows to 0.9 per cent of GDP in outer year |
41
2013 BUDGET REVIEW
2012/13 to 0.9 per cent of GDP in 2015/16, ensuring that debt stabilises as a share of GDP in the outer year. The level at which debt stabilises, however, is marginally above the October 2012 estimate of 40 per cent, owing to downward revisions to nominal GDP, a weaker growth outlook and the higher deficit in the current year.
Figure 3.4 Net government debt, 2005/06 – 2016/17
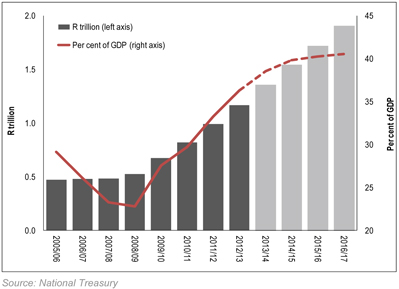
Beyond the medium term, debt sustainability requires government to close the gap between long-term trend revenue and structural non-interest spending. The 2013 fiscal framework also achieves this objective, as discussed in the box below.
Long-term fiscal sustainability
| | |
| Long-term fiscal report projects expenditure trends over 15-25 years based on demographic trends and economic scenarios | | Beyond the medium term, as the economy strengthens, government will consolidate the fiscal position by maintaining a rate of expenditure growth commensurate with increasing economic potential, and reducing the ratio of debt to GDP. |
| | The National Treasury has prepared a long-term fiscal report. The report projects expenditure trends over the next 15-25 years based on demographic trends and economic scenarios that model the main components of social spending, including social grants, health and education expenditure. The report contrasts a “no policy change” trajectory with the likely impact of new policies on expenditure, and draws on proposals contained in the National Development Plan. |
Long-term projections are inherently uncertain and depend heavily on the underlying assumptions. Noting this caveat, the study concludes that the current fiscal policy and spending mix is sustainable, but would remain vulnerable unless government builds fiscal space beyond the medium term. It also shows that structural increases in spending require concomitant revenue increases if they are to be financed sustainably.
42
CHAPTER 3: FISCAL POLICY
Structural revenue and expenditure
The business cycle has a significant short-term impact on the fiscus. During a boom, tax revenue overperforms. The resulting improvement in the budget balance is temporary, and an economy seems “richer” than it really is. In poor economic conditions, part of the deficit is explained by a temporary shortfall from ordinary levels of revenue. Distinguishing between temporary, cyclical effects and enduring structural factors helps provide a truer picture of government’s fiscal position. This is reflected in the structural budget balance.
During the 2000s, non-interest expenditure grew sharply as a percentage of GDP. The figure at the left shows that since 2008, spending has been sustained well above long-term trend revenue. However, the deficit is also explained by revenue shortfalls that result from economic weakness. The widening of the deficit in 2012/13 is largely the result of such a temporary weakening. As revenue recovers, however, a structural deficit will remain, pointing to the need to slow expenditure growth over the medium term.
| | |
Structural spending and revenue as share of GDP | | Composition of primary balance |
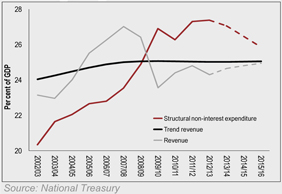 | | 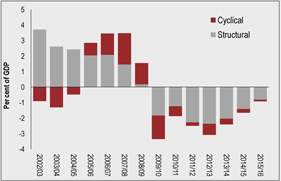
|
Government spending does not vary automatically with the business cycle, but revenue fluctuates strongly with economic conditions. The figure at the right shows the primary balance on the main budget, broken down into its cyclical and structural components. The cyclical component is the gap between actual revenue and its long-term trend, which can be seen in the figure at the left. The structural deficit is the gap between non-interest spending and trend revenue.
Trend revenue is calculated by applying a statistical filter to main budget revenue as a share of GDP. Structural non-interest expenditure is also calculated on the main budget and excludes once-off payments and transactions in financial assets and liabilities, such as large loans to Eskom between 2008/09 and 2010/11.
| | |
| |
| In the baseline scenario, in which the economy grows at 3.5 per cent per year, and policy is unchanged, projections suggest that: | | |
| |
• The pressure that social grants place on the fiscus will begin to decline over the next decade. | | |
| |
• Government spending on health will continue to rise as a share of GDP in coming decades, even without reforms. Implementing national health insurance will increase public health expenditure. | | |
| |
• As the school-age population begins to decline, resource pressures on the basic education sector will ease. This highlights the need to improve the quality of inputs and ensure better learning outcomes. | | |
| |
| As the National Development Plan points out, if the economy grows by more than 5 per cent a year, government revenue will double in the next 20 years. This will make major new policy initiatives such as national health insurance or expanded vocational education affordable with relatively limited adjustments to tax policy. If growth continues on the existing trajectory, however, significant adjustments in revenue and/or reductions in other areas of spending would be required to sustainably meet those commitments. | | Without faster economic growth, South Africa’s finances will remain vulnerable to external shocks for years to come |
43
2013 BUDGET REVIEW
| | |
| | ¢ Conclusion |
| |
Budget reduces real growth in expenditure, while maintaining strong growth in capital investment | | With economic growth weaker than anticipated and revenue collections below projection, the fiscal environment is more constrained than before. In response, the 2013 Budget reduces real growth in medium-term expenditure, while maintaining strong growth in capital investment. |
| |
| | Given limited fiscal space, new policy initiatives will have to be financed through savings and improved spending quality. Expenditure reviews over the year ahead will help to improve value for money in public spending, complementing a comprehensive review of tax policy. |
44
4
Revenue trends and tax proposals
In brief
| | • | | Revenue collection has deteriorated as a result of weaker-than-expected economic conditions. The revised tax revenue estimate for 2012/13 is R16.3 billion lower than the 2012 Budget estimate. |
| | • | | Higher revenue collections will depend on an improved economic growth outlook. |
| | • | | The 2013 tax proposals include personal income tax relief of R7 billion, the creation of an employment tax incentive and steps to encourage higher savings. |
| | • | | A study will be conducted to evaluate the robustness of the tax system. It will assess the tax system’s ability to support long-term policy objectives, including those set out in the National Development Plan, and faster economic growth. |
| | |
| The tax system raises the revenue needed to fund government programmes and deliver services. While the South African economy has continued to grow since the 2009 recession, the moderate pace of economic growth has adversely affected revenue performance. | | Tax revenues are expected to improve over medium term in line with moderately higher economic growth |
| The revised tax revenue estimate for 2012/13 is R810.2 billion, R16.3 billion lower than the estimate made in the 2012 Budget. This underperformance is largely the result of weak economic growth during the second half of 2012, labour unrest and lower commodity prices. Tax revenues are expected to improve over the medium-term expenditure framework (MTEF) period in line with higher economic growth and the stabilisation of key commodity prices at marginally higher levels. | |
| |
| The main tax proposals for 2013 include: | | |
| |
• Personal income tax relief of R7 billion | | |
| |
• Reforms to the tax treatment of contributions to retirement savings | | |
| |
• An employment tax incentive targeted to support young workers and those employed in special economic zones | | |
45
2013 BUDGET REVIEW
| | |
| |
| | • Tax relief for small businesses • Requiring foreign businesses selling digital goods in South Africa to register as VAT vendors • Increases in fuel and excise taxes • Alignment of the proposed carbon tax, energy-efficiency savings tax incentive and the electricity levy. |
| |
Tax system to be reviewed for its impact on employment and fiscal sustainability | | Over the next year, a tax review will assess whether present tax policy is appropriate to support government’s objectives of inclusive growth, employment, development and fiscal sustainability. As the National Development Plan notes, the best way to generate resources to implement the national vision is to grow the economy more rapidly. It envisages that “what we contribute in our taxes, we get back through the high quality of our public services”. |
| |
| | ¢ Consolidated budget revenue – revised estimates |
| |
Consolidated budget revenue consists of tax revenue net of SACU transfers, departmental revenue, mineral royalties, social security fund revenue, and provincial and public entity own revenue | | Table 4.1 highlights budget estimates and revenue outcomes of the major tax instruments for 2011/12, and revised projected revenue outcomes for 2012/13. Tables 2 and 3 in Annexure B set out these trends in more detail. Audited results show that tax revenue for 2011/12 of R742.7 billion was R68.5 billion or 10.2 per cent higher than the amount collected in 2010/11. Customs duties (up 28.3 per cent), corporate income tax (14 per cent) and personal income tax (10.3 per cent) accounted for the increase. The revised tax revenue estimate for 2012/13 of R810.2 billion is R67.5 billion or 9.1 per cent higher than in 2011/12. However, it is R16.3 billion lower than the estimate at the time of the 2012 Budget. |
| |
| | Post-recession nominal gross tax revenue collections grew by 12.6 per cent in 2010/11 and 10.2 per cent in 2011/12. This growth is markedly slower than the 15 per cent average growth rate between 2006/07 and 2008/09. |
| |
Gross tax revenue collections slowed in final three months of 2012/13 | | During 2012/13, tax revenue collection slowed in response to conditions in the domestic economy – including labour unrest – and uncertainty in the global economy, in particular the continued downturn in Europe, which is one of South Africa’s major trading partners. These factors led to a deceleration in gross tax revenue collection in the last three months of the calendar year. Personal income tax and corporate income tax revenues are respectively R12 billion and R11.5 billion below the estimate made in February 2012. Fuel tax revenues are R2.3 billion below initial estimates. This performance has been partially offset by better-than-expected collections of value-added tax (VAT) (R7.3 billion) and customs duties (R1.5 billion). Flowing from these trends, projected gross tax revenue collections for the MTEF period have been revised downwards from the estimates at the time of the 2012 Medium Term Budget Policy Statement. |
46
CHAPTER 4: REVENUE TRENDS AND TAX PROPOSALS
Table 4.1 Budget estimates and revenue outcome, 2011/12 and 2012/13
| | | | | | | | | | | | | | | | | | | | | | | | | | | | |
| | | 2011/12 | | | 2012/13 | | | 2011/12 to | |
| | | | | | | | | 2012/13 % | |
R million | | Budget | | | Outcome | | | Deviation | | | Budget | | | Revised | | | Deviation | | | change1 | |
Taxes on income and profits | | | 418 345 | | | | 426 584 | | | | 8 239 | | | | 475 729 | | | | 453 522 | | | | -22 208 | | | | 6.3 | % |
Persons and individuals | | | 252 750 | | | | 250 400 | | | | -2 350 | | | | 285 970 | | | | 274 020 | | | | -11 950 | | | | 9.4 | % |
Companies | | | 144 165 | | | | 151 627 | | | | 7 462 | | | | 167 839 | | | | 156 350 | | | | -11 489 | | | | 3.1 | % |
Secondary tax on companies/ Dividend withholding tax | | | 18 100 | | | | 21 965 | | | | 3 865 | | | | 19 050 | | | | 21 000 | | | | 1 950 | | | | -4.4 | % |
Tax on retirement funds | | | — | | | | 7 | | | | 7 | | | | — | | | | — | | | | — | | | | — | |
Other taxes on income and profits2 | | | 3 330 | | | | 2 585 | | | | -744 | | | | 2 871 | | | | 2 152 | | | | -719 | | | | -16.8 | % |
Taxes on payroll and workforce | | | 9 150 | | | | 10 173 | | | | 1 023 | | | | 11 131 | | | | 11 400 | | | | 269 | | | | 12.1 | % |
Taxes on property | | | 9 590 | | | | 7 817 | | | | -1 773 | | | | 8 627 | | | | 8 200 | | | | -427 | | | | 4.9 | % |
Domestic taxes on goods and services | | | 274 210 | | | | 263 950 | | | | -10 260 | | | | 294 554 | | | | 298 935 | | | | 4 381 | | | | 13.3 | % |
Value-added tax | | | 200 880 | | | | 191 020 | | | | -9 860 | | | | 209 675 | | | | 217 000 | | | | 7 325 | | | | 13.6 | % |
Specific excise duties | | | 25 085 | | | | 25 411 | | | | 326 | | | | 28 772 | | | | 28 360 | | | | -412 | | | | 11.6 | % |
Ad valorem excise duties | | | 2 230 | | | | 1 828 | | | | -402 | | | | 2 000 | | | | 2 190 | | | | 190 | | | | 19.8 | % |
General fuel levy | | | 36 900 | | | | 36 602 | | | | -298 | | | | 42 776 | | | | 40 500 | | | | -2 276 | | | | 10.6 | % |
Other domestic taxes on goods and services3 | | | 9 115 | | | | 9 088 | | | | -27 | | | | 11 331 | | | | 10 885 | | | | -446 | | | | 19.8 | % |
Taxes on international trade and transactions | | | 30 325 | | | | 34 121 | | | | 3 796 | | | | 36 359 | | | | 38 093 | | | | 1 734 | | | | 11.6 | % |
Customs duties | | | 29 860 | | | | 34 198 | | | | 4 338 | | | | 36 160 | | | | 37 640 | | | | 1 480 | | | | 10.1 | % |
Diamond export levy | | | 56 | | | | 64 | | | | 9 | | | | 50 | | | | 53 | | | | 4 | | | | -16.9 | % |
Miscellaneous customs and excise receipts | | | 410 | | | | -141 | | | | -551 | | | | 150 | | | | 400 | | | | 250 | | | | -383.3 | % |
Stamp duties and fees | | | — | | | | -3 | | | | -3 | | | | — | | | | — | | | | — | | | | — | |
State miscellaneous revenue4 | | | — | | | | 9 | | | | 9 | | | | — | | | | — | | | | — | | | | — | |
| | | | | | | | | | | | | | | | | | | | | | | | | | | | |
Total tax revenue | | | 741 620 | | | | 742 651 | | | | 1 031 | | | | 826 401 | | | | 810 150 | | | | -16 250 | | | | 9.1 | % |
Non-tax revenue5 | | | 10 001 | | | | 19 193 | | | | 9 192 | | | | 15 091 | | | | 14 475 | | | | -616 | | | | -24.6 | % |
of which: | | | | | | | | | | | | | | | | | | | | | | | | | | | | |
Mineral royalties | | | 4 890 | | | | 5 612 | | | | 722 | | | | 6 510 | | | | 5 000 | | | | -1 510 | | | | -10.9 | % |
Less: SACU6 payments | | | -21 763 | | | | -21 760 | | | | 3 | | | | -42 151 | | | | -42 151 | | | | — | | | | 93.7 | % |
| | | | | | | | | | | | | | | | | | | | | | | | | | | | |
National budget revenue | | | 729 858 | | | | 740 084 | | | | 10 227 | | | | 799 340 | | | | 782 474 | | | | -16 866 | | | | 5.7 | % |
Provinces, social security funds and selected public entities | | | 94 609 | | | | 96 766 | | | | 2 157 | | | | 105 489 | | | | 105 375 | | | | -114 | | | | 8.9 | % |
| | | | | | | | | | | | | | | | | | | | | | | | | | | | |
Budget revenue | | | 824 467 | | | | 836 850 | | | | 12 384 | | | | 904 829 | | | | 887 849 | | | | -16 981 | | | | 6.1 | % |
| | | | | | | | | | | | | | | | | | | | | | | | | | | | |
| 1. | Percentage change 2011/12 outcome versus 2012/13 revised estimate |
| 2. | Includes interest on overdue income tax, and small business tax amnesty levy |
| 3. | Includes turnover tax for small businesses, air departure tax, plastic bags levy, electricity levy, CO2 tax on motor vehicle emissions, incandescent light bulb levy and Universal Service Fund |
| 4. | Revenue received by SARS that could not be allocated to a specific tax instrument |
| 5. | Includes mineral royalties, mining leases, departmental revenue and sales of capital assets |
| 6. | Southern African Customs Union |
| ¢ | | Long-term tax revenue trends |
| | |
| Nationally levied taxes are collected by the South African Revenue Service (SARS) for the National Revenue Fund. As a percentage of gross domestic product (GDP), gross tax revenues have increased from 22.1 per cent in the 1980s to an average of 25 per cent over the past | | Gross tax revenues have averaged at about 25 per cent of GDP over the past decade |
47
2013 BUDGET REVIEW
10 years. During 2007/08, at the height of the economic boom, the ratio of gross tax revenue to GDP reached a high of 27.6 per cent. As the global economic crisis took hold in 2009/10, the ratio declined to 24.4 per cent, marking the first time that nominal gross tax revenues declined. Tax revenues have since recovered, but at a much slower pace than expected. Gross tax revenue as a percentage of GDP is expected to average 25.2 per cent in 2012/13. Figure 4.1 shows these trends.
Figure 4.1 Gross tax revenue as percentage of GDP,1 1983/84 – 2012/13
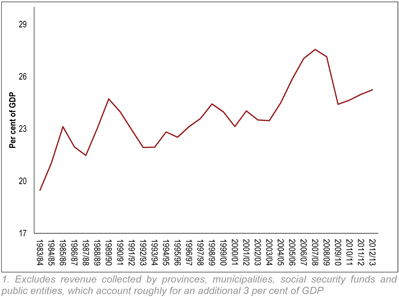
| | |
| |
Personal income tax, VAT and corporate income tax account for more than 80 per cent of total budget revenue | | Revenues from personal income tax, VAT and corporate income tax account for more than 80 per cent of total budget revenue. From 1994/95 to 2012/13, personal income tax, VAT and corporate income tax accounted for, on average, 36, 26, and 18 per cent respectively of budget revenue. About 58 per cent of tax revenues are derived from direct taxes (taxes on personal and corporate income, and on wealth) and 42 per cent from indirect taxes (VAT, fuel taxes, excise and customs duties, and so on). Corporate income tax revenues fell sharply from an average of 23.4 per cent of budget revenue in the 1980s to 14 per cent between 1990/91 and 1999/00. The resulting revenue shortfall was made up by revenue from individuals, mainly through “bracket creep” (movement into higher tax brackets) because little or no relief was provided for inflation. |
| |
Mid-2000s recovery in corporate income tax based on strong growth allowed for direct tax relief to individuals | | From 2000, corporate income tax revenues recovered strongly, reaching about 20 per cent of budget revenue, or 5 per cent of GDP. This strong recovery, which lasted until 2008/09, was the result of robust economic growth, base broadening (including the introduction of capital gains tax) and more rigorous enforcement. It provided scope to extend direct tax relief to individuals by fully compensating for inflation and providing additional real relief in some years. A sharp decline in corporate income tax revenues from 7.2 per cent of GDP in 2008/09 to 5.5 per cent in 2009/10 and 4.9 per cent in 2010/11 was a major shock to the fiscus. This ratio recovered marginally in 2011/12 to 5.1 per cent, but may deteriorate again to 4.9 per cent in 2012/13. |
48
CHAPTER 4: REVENUE TRENDS AND TAX PROPOSALS
| | |
| Recent trends in the three main tax instruments are shown in Table 4.2. Nominal tax revenues from personal income tax and VAT have each increased by about 40 per cent over the past six years. Projected nominal corporate income tax revenue in 2012/13, however, will be 5.5 per cent lower than the peak reached in 2008/09. | | |
| |
| Table 4.2 Nominal tax revenue collections, 2007/08 – 2012/13 | | |
| | | | | | | | | | | | | | | | | | | | | | | | |
| | | Individuals | | | Companies | | | Value-added tax | |
| | | R million | | | %
change | | | R million | | | %
change | | | R million | | | %
change | |
2007/08 | | | 168 379 | | | | | | | | 140 191 | | | | | | | | 150 443 | | | | | |
2008/09 | | | 195 115 | | | | 15.9 | | | | 165 378 | | | | 18.0 | | | | 154 340 | | | | 2.6 | |
2009/10 | | | 205 145 | | | | 5.1 | | | | 134 883 | | | | -18.4 | | | | 147 941 | | | | -4.1 | |
2010/11 | | | 226 925 | | | | 10.6 | | | | 132 902 | | | | -1.5 | | | | 183 571 | | | | 24.1 | |
2011/12 | | | 250 389 | | | | 10.3 | | | | 151 563 | | | | 14.0 | | | | 191 014 | | | | 4.1 | |
2012/13 | | | 274 020 | | | | 9.4 | | | | 156 350 | | | | 3.2 | | | | 217 000 | | | | 13.6 | |
2012/13 vs. 2008/09 | | | | | | | 40.4 | | | | | | | | -5.5 | | | | | | | | 40.6 | |
| | | | | | | | | | | | | | | | | | | | | | | | |
| | |
| |
| As Table 4.3 shows, corporate income tax revenue from the mining sector is volatile, driven by global commodity prices and the rand exchange rate. Mining-related corporate income tax revenue, which had been recovering following the 2009 recession, is expected to contract in 2012/13, largely due to lower commodity prices and labour unrest. | | |
|
| Table 4.3 Mining sector: corporate income tax and mineral and petroleum royalties 2005/06 – 2012/13 |
| | | | | | | | | | | | | | | | | | | | | | | | | | | | | | | | |
R million | | 2005/06 | | | 2006/07 | | | 2007/08 | | | 2008/09 | | | 2009/10 | | | 2010/11 | | | 2011/12 | | | 2012/13
Estimate | |
Total provisional corporate income tax1 | | | 89 753 | | | | 119 874 | | | | 143 072 | | | | 166 213 | | | | 135 695 | | | | 136 872 | | | | 158 782 | | | | 162 000 | |
of which: | | | | | | | | | | | | | | | | | | | | | | | | | | | | | | | | |
Mining and quarrying | | | 5 875 | | | | 12 176 | | | | 15 068 | | | | 22 522 | | | | 9 873 | | | | 14 996 | | | | 17 029 | | | | 12 200 | |
Percentage of total corporate income tax | | | 6.5 | % | | | 10.2 | % | | | 10.5 | % | | | 13.6 | % | | | 7.3 | % | | | 11.0 | % | | | 10.7 | % | | | 7.5 | % |
Mineral royalties | | | — | | | | — | | | | — | | | | — | | | | — | | | | 3 555 | | | | 5 612 | | | | 5 000 | |
| | | | | | | | | | | | | | | | | | | | | | | | | | | | | | | | |
Total mining and quarrying | | | 5 875 | | | | 12 176 | | | | 15 068 | | | | 22 522 | | | | 9 873 | | | | 18 551 | | | | 22 641 | | | | 17 200 | |
| | | | | | | | | | | | | | | | | | | | | | | | | | | | | | | | |
| 1. | Provisional corporate income tax excludes refunds and final assessment |
| ¢ | | Direct tax relief measures |
Personal income tax relief
| | |
| Personal income tax provides the foundation for an equitable and progressive tax system. Personal income tax brackets and rebates are partially adjusted for “fiscal drag” to take inflation into account. The 2013 Budget proposes direct personal income tax relief of R7 billion. In addition, adjustments to the monetary thresholds, such as the medical tax credit, will provide relief of about R350 million. Table 4.4 gives an overview of the 2013/14 income tax brackets, rates and rebates. | | Personal income tax relief of R7 billion |
49
2013 BUDGET REVIEW
Table 4.4 Personal income tax rate and bracket adjustments, 2012/13 – 2013/14
| | | | | | |
| 2012/13 | | 2013/14 |
Taxable income (R) | | Rates of tax | | Taxable income (R) | | Rates of tax |
| R0 - R160 000 | | 18% of each R1 | | R0 - R165 600 | | 18% of each R1 |
| | | |
| R160 001 - R250 000 | | R28 800 + 25% of the | | R165 601 - R258 750 | | R29 808 + 25% of the |
| | amount above R160 000 | | | | amount above R165 600 |
| | | |
| R250 001 - R346 000 | | R51 300 + 30% of the | | R258 751 - R358 110 | | R53 096 + 30% of the |
| | amount above R250 000 | | | | amount above R258 750 |
| | | |
| R346 001 - R484 000 | | R80 100 + 35% of the | | R358 111 - R500 940 | | R82 904 + 35% of the |
| | amount above R346 000 | | | | amount above R358 110 |
| | | |
| R484 001 - R617 000 | | R128 400 + 38% of the | | R500 941 - R638 600 | | R132 894 + 38% of the |
| | amount above R484 000 | | | | amount above R500 940 |
| | | |
| R617 001 | | R178 940 + 40% of the | | R638 601 | | R185 205 + 40% of the |
| | amount above R617 000 | | | | amount above R638 600 |
| | | |
| Rebates | | | | Rebates | | |
Primary | | R11 440 | | Primary | | R12 080 |
Secondary | | R6 390 | | Secondary | | R6 750 |
Tertiary | | R2 130 | | Tertiary | | R2 250 |
| | | |
| Tax threshold | | | | Tax threshold | | |
Below age 65 | | R63 556 | | Below age 65 | | R67 111 |
Age 65 and over | | R99 056 | | Age 65 and over | | R104 611 |
Age 75 and over | | R110 889 | | Age 75 and over | | R117 111 |
| | |
| | Table 4.5 shows taxpayers’ relative contributions to the income tax base. In 2013/14, a quarter of individual taxpayers – those with taxable income of between R150 000 and R250 000 – will account for 13.2 per cent of personal income tax revenues, and 8.4 per cent of individual taxpayers – those earning a taxable income above R500 000 – will account for 54.4 per cent of personal income tax revenues. |
Table 4.5 Estimates of individual taxpayers and taxable income, 2013/14
| | | | | | | | | | | | | | | | | | | | | | | | | | | | | | | | | | | | | | | | |
| | | Taxpayers | | | Taxable income | | | Income tax payable | | | Personal income tax relief | | | Tax revenue | |
Taxable bracket | | Number | | | % | | | R million | | | % | | | R million | | | % | | | R million | | | % | | | R million | | | % | |
0 to R60 000 | | | 8 067 075 | | | | | | | | 155 911 | | | | 10.8 | | | | — | | | | — | | | | — | | | | — | | | | — | | | | — | |
| | | | | | | | | | | | | | | | | | | | | | | | | | | | | | | | | | | | | | | | |
R60 001 to R150 000 | | | 3 018 270 | | | | 47.4 | | | | 279 699 | | | | 19.4 | | | | 18 924 | | | | 6.0 | | | | 1 867 | | | | 26.6 | | | | 17 057 | | | | 5.6 | |
R150 001 to R250 000 | | | 1 596 649 | | | | 25.1 | | | | 290 735 | | | | 20.2 | | | | 42 148 | | | | 13.4 | | | | 1 579 | | | | 22.5 | | | | 40 569 | | | | 13.2 | |
R250 001 to R350 000 | | | 853 430 | | | | 13.4 | | | | 239 884 | | | | 16.6 | | | | 47 821 | | | | 15.3 | | | | 1 269 | | | | 18.1 | | | | 46 551 | | | | 15.2 | |
R350 001 to R500 000 | | | 362 713 | | | | 5.7 | | | | 145 761 | | | | 10.1 | | | | 36 217 | | | | 11.5 | | | | 759 | | | | 10.8 | | | | 35 458 | | | | 11.6 | |
R500 001 to R750 000 | | | 187 374 | | | | 2.9 | | | | 97 202 | | | | 6.7 | | | | 27 470 | | | | 8.8 | | | | 487 | | | | 6.9 | | | | 26 983 | | | | 8.8 | |
R750 001 to R1 000 000 | | | 203 646 | | | | 3.2 | | | | 142 687 | | | | 9.9 | | | | 45 711 | | | | 14.6 | | | | 618 | | | | 8.8 | | | | 45 093 | | | | 14.7 | |
R1 000 001 + | | | 148 468 | | | | 2.3 | | | | 246 803 | | | | 17.1 | | | | 95 279 | | | | 30.4 | | | | 452 | | | | 6.4 | | | | 94 827 | | | | 30.9 | |
| | | | | | | | | | | | | | | | | | | | | | | | | | | | | | | | | | | | | | | | |
Total | | | 6 370 550 | | | | 100.0 | | | | 1 442 771 | | | | 100.0 | | | | 313 570 | | | | 100.0 | | | | 7 032 | | | | 100.0 | | | | 306 538 | | | | 100.0 | |
| | | | | | | | | | | | | | | | | | | | | | | | | | | | | | | | | | | | | | | | |
Grand total | | | 14 437 625 | | | | | | | | 1 598 682 | | | | | | | | | | | | | | | | | | | | | | | | | | | | | |
| | | | | | | | | | | | | | | | | | | | | | | | | | | | | | | | | | | | | | | | |
| | |
| | Relief for low-cost employer-provided housing |
| |
Fringe-benefit tax relief to support lower-income earners | | Some businesses provide their employees with subsidised rental accommodation or home loans. There are also instances where employers build houses for their employees, initially on a rental basis, with the understanding that the house will become the property of the employee over time. Where an employer transfers a house to an employee at a price below market value, a taxable fringe benefit is triggered. The fringe benefit tax is often unaffordable for low-income employees. To contribute to a more stable workforce and adequate housing, government proposes to provide fringe-benefit tax relief for lower-income earners in such cases. |
50
CHAPTER 4: REVENUE TRENDS AND TAX PROPOSALS
| | |
| Medical tax credits | | |
| |
Monthly tax credits for medical scheme contributions will be increased from R230 to R242 for the first two beneficiaries, and from R154 to R162 for each additional beneficiary, with effect from 1 March 2013. Employer-provided bursaries to relatives The rules covering the exemption of fringe benefit taxation for bursaries given to relatives will be reviewed. Government proposes to increase the relevant monetary thresholds. Differential monetary thresholds for bursaries to students attending tertiary institutions and to learners at schools are shown in Table C.6 in Annexure C. | | Monthly medical tax credits increased |
| Non-retirement savings | | |
In the 2012 Budget Review, tax-preferred savings and investment accounts were proposed as alternatives to the current tax-free interest-income caps, to encourage greater savings. A discussion document was published in September 2012 and, after consideration of comments received, government intends to proceed with the implementation of tax-preferred savings and investment accounts. All returns accrued within these accounts and any withdrawals would be exempt from tax. The account would have an initial annual contribution limit of R30 000 and a lifetime limit of R500 000, to be increased regularly in line with inflation. The new accounts will be introduced by April 2015. In the meantime, with effect from 1 March 2013, tax-free interest-income annual thresholds will be increased from R33 000 to R34 500 for individuals 65 years and over, and from R22 800 to R23 800 for individuals below 65 years. These thresholds will not be adjusted for inflation in future years. | | Tax-preferred savings and investment accounts to be phased in over two years |
| Retirement savings reforms | | |
Individuals’ contributions to pension and retirement annuity funds are tax deductible. To promote savings, the deductibility of such contributions, as well as contributions to provident funds and employer contributions that will constitute fringe benefits, will be increased to 27.5 per cent of the greater of remuneration or taxable income (excluding retirement annuity or lump sum income). For equity reasons, an annual cap on deductible contributions of R350 000 will be applied. | | Changes to tax treatment of pension and provident funds |
Tax treatment of contributions to pension, retirement annuity and provident funds will be harmonised, allowing provident fund members to receive a tax deduction on their own contributions. Vested benefits will be protected: balances in provident funds at the date of implementation, and subsequent growth, will not be required to be annuitised. It is proposed, however, subject to public consultations, that future contributions made to provident funds after an agreed date be subject to the same annuitisation requirements applicable to retirement annuity and pension funds. This requirement will not apply to provident fund members older than 55 years at the date of implementation. New employees can still join and contribute to existing provident funds, and new funds can be created subject to the same tax and annuitisation rules. This will reduce the complexity of the retirement system significantly. | | Vested rights will be protected |
51
2013 BUDGET REVIEW
| | |
Contributions in excess of the annual caps may be rolled over to future years | | Contributions in excess of the annual caps may be rolled over to future years. At retirement, where any non-deductible contributions remain, they will be set off against any lump sum or annuity income before tax is calculated to avoid double taxation. Specific provisions will need to be made for defined-benefit pension plans and will require further engagement with industry. |
| | Taxpayers with multiple sources of income People receiving multiple incomes are often faced with a higher-than-expected tax liability on assessment, due to the aggregation of these incomes. These include people with more than one job and widows/widowers on the death of a spouse. Individual employers and pension funds are typically unaware that there are two or more income streams and each calculates pay-as-you-earn (PAYE) as if there is only one. The result is that too little PAYE is deducted. Government will address this issue during 2013/14. Steps under consideration include higher levels of withholding by employers (though confidentiality is a concern); holding employees responsible for PAYE at a higher tax rate to take into account the “aggregation effect”; SARS informing affected taxpayers and suggesting preventative measures; and temporary relief in the case of widows and widowers. Employment tax incentives |
Incentive to encourage hiring of young people | | The introduction of a youth employment tax incentive will help young people enter the labour market, gain valuable experience and access career opportunities. The administratively simple incentive will create a graduated tax incentive at the entry-level wage, falling to zero when earnings reach the personal income tax threshold. Protection provided by existing labour legislation, combined with oversight by the South African Revenue Service and the Department of Labour, will avoid displacement that might arise. A similar tax incentive will be made available to eligible workers of all ages within special economic zones. |
| | Special economic zones |
Tax treatment in special economic zones designed to attract investment | | In certain special economic zones, the Minister of Finance will authorise the following tax incentives, after consultation with the Minister of Trade and Industry: |
| | • A 15 per cent corporate income tax rate for businesses in such areas. • An employment incentive allowing for a tax deduction for employment of workers earning less than R60 000 per year. • An accelerated depreciation allowance for buildings in these areas, based on the existing regime for urban development zones, to encourage developers to invest more in industrial premises. |
52
CHAPTER 4: REVENUE TRENDS AND TAX PROPOSALS
| | |
| |
| Small business corporation relief and social-impact firms | | |
| |
| Government proposes that the R14 million turnover threshold for small business corporations be increased to R20 million and that the graduated tax structure for such corporations be revised as shown in Table 4.6. | | Proposal to afford relief to small business corporations |
| |
| Table 4.6 Small business corporations, 2012/13 – 2013/14 | | |
| | | | | | | | | | |
| Current rates 2012/13 | | | Proposed rates 2013/14 | |
Taxable Income | | Rate | | | Taxable Income | | Rate | |
Below R63 556 | | | 0.0 | % | | Below R67 111 | | | 0.0 | % |
R63 557 to R350 000 | | | 7.0 | % | | R67 112 to R365 000 | | | 7.0 | % |
Above R350 000 | | | 28.0 | % | | R365 001 to R550 000 | | | 21.0 | % |
| | | | | | Above R550 001 | | | 28.0 | % |
| | |
| The application of the same rate structure to the trading activities of public-benefit organisations (PBOs) will also be explored. | | |
| |
| The feasibility of special support for social-impact businesses, which have both profit-making and social objectives, is being explored. Encouraging investment in such businesses is in line with the policy objectives of small business development, social solidarity and job creation. | | Feasibility of support for social-impact businesses being explored |
Public-benefit organisations | | |
| Donations to PBOs working in the areas of welfare and humanitarian activities, health care, education, conservation, environmental protection, animal welfare, and land and housing are deductible up to 10 per cent of taxable income in the year the donation is made.1 Donations in excess of this figure cannot be carried forward, which reportedly discourages large donations. Government proposes to allow donations in excess of 10 per cent of taxable income in any given year to be rolled over as allowable deductions in subsequent years. Also under consideration are rules governing the amount of funding that must be distributed where PBOs provide funding to other PBOs. | | Adjustments to help organisations involved in environmental, welfare and humanitarian activities |
Reforms to the biodiversity tax incentive | | |
| Government proposes to modify the rules concerning the allowable deductions for setting aside private land as a protected area. The limitation of not allowing a rollover of donations in excess of 10 per cent of taxable income will be scrapped. Where land has been owned for many years, the original cost of the land is generally much lower than its current market value. Presently, the incentive is calculated using the lower of cost or market value of the protected area for 99-year contracts. Government proposes that the value for the purpose of this incentive should be the lower of the municipal or market value. Capital gains will be triggered, but the taxable proportion of these gains will be set off against the deduction allowed over a period. Certain conservation capital and maintenance expenditure will be allowed as deductible tax expenses. | | Rules on tax incentives that encourage biodiversity management to be modified |
| 1 | For the full list, see part 2, schedule 9 of the Income Tax Act (1962). |
53
2013 BUDGET REVIEW
| | |
| | Medium-term proposal on old age grant |
Secondary and tertiary rebates to be phased out with the means test | | The means test for the existing old age grant is complex and costly to administer, generates arbitrary inequities, and creates disincentives for individuals to save for retirement. Government proposes to establish a universal old age grant, phasing out the means test, by 2016. All citizens over a designated age would be eligible for the grant, irrespective of income level. To ensure equity, adjustments to the secondary and tertiary rebates will be made to offset the costs of this change and retain broadly the same progressive tax structure. |
| | ¢ Protecting the tax base |
| | Reforming the taxation of trusts |
| Legislative measures will address tax avoidance through trusts | | To curtail tax avoidance associated with trusts, government is proposing several legislative measures during 2013/14. Certain aspects of local and offshore trusts have long been a problem for global tax enforcement due to their flexibility and flow-through nature. Also of concern is the use of trusts to avoid estate duty, which will be reviewed. |
| | The proposals will not apply to trusts established to attend to the legitimate needs of minor children and people with disabilities. The proposals are as follows: • Discretionary trusts should no longer act as flow-through vehicles. Taxable income and loss (including capital gains and losses) should be fully calculated at trust level with distributions acting as deductible payments to the extent of current taxable income. Beneficiaries will be eligible to receive tax-free distributions, except where they give rise to deductible payments (which will be included as ordinary revenue). • Trading trusts will similarly be taxable at the entity level, with distributions acting as deductible payments to the extent of current taxable income. Trusts will be viewed as trading trusts if they either conduct a trade or if beneficial ownership interests in these trusts are freely transferable. • Distributions from offshore foundations will be treated as ordinary revenue. This amendment targets schemes designed to shield income from global taxation. |
| | Employment share schemes |
| Employment share schemes will be subject to uniform tax treatment | | Some employers offer staff equity schemes as part of their compensation packages. Some of these arrangements are also used as a tool to lower overall tax rates for executives and other high-income earners. Schemes for lower-income taxpayers, however, are sometimes subject to anomalies that may give rise to double taxation. A special dispensation is proposed to ensure uniform tax treatment of these schemes. The way that employers claim deductions will be examined. |
54
CHAPTER 4: REVENUE TRENDS AND TAX PROPOSALS
| | |
Disability or income protection policies | | |
| Disability insurance policies that fall outside the ambit of retirement funds are treated differently, depending on whether they compensate for the loss of future income (deductible for employees when premiums are incurred) or compensate against loss of personal capital, such as the loss of an arm (not deductible). Many policies blur this distinction. Government proposes a more consistent treatment: all non-retirement fund disability and income-protection policies will conform to the overall tax paradigm of non-deductible contributions and exempt payouts. | | Disability and income protection policies to receive consistent tax treatment |
Business taxes Restricting debt to prevent base erosion | | |
| Although debt financing is a feature of all healthy economies, debt is often used to erode the tax base. Closure of artificial and excessive debt has been on the tax policy agenda for more than two years. To bring this matter to a conclusion, government proposes the following: | | Steps to restrict erosion of tax base |
• Artificial debt: Some debt instruments will be re-characterised as shares (along with the underlying yield) if they contain certain features. The main concerns are so-called debt instruments that do not have a realistic possibility of being repaid in 30 years, or debt that is convertible into shares at the request of the issuer. Banks and insurers will be excluded from this re-characterisation. • Connected person debt: Excessive debt issued to connected person creditors is of concern if the creditor is exempt from tax on the interest, because connected persons can often use debt and equity interchangeably without serious economic consequence. Limits will be imposed so that the interest on this form of debt does not exceed 40 per cent of earnings after interest on other debts is taken into account. Excess interest will be allowed to roll over for up to five years. • Acquisition debt: In corporate restructuring, use of acquisition debt against future earnings effectively eliminates taxable profits for years to come (with the debt often renewed via a new acquisition in later years). Interest on excessive debt will be allowed to roll over for up to five years. This system will replace the discretionary system applied to interest on discretionary debt. Taxation of long-term insurers (four funds) | | |
| Policies representing the risk business of long-term insurers will no longer be taxed in the policyholder funds but in the corporate (shareholder) fund. As a result, significant amounts of policy-selling expenses will be deductible against taxable premium income from risk policies, and no longer against a relatively smaller investment-income tax base. Reserving will be allowed for this risk business on a similar basis as for short-term insurers. | | Risk business of long-term insurers will no longer be taxed in the policyholder funds |
55
2013 BUDGET REVIEW
| | |
| | Unlisted real estate investment trusts |
New treatment for real estate investment trusts | | A real estate investment trust (REIT) is a listed company or trust that invests in immovable property, receives income from rental and distributes it to investors. A REIT can deduct such distributions if it resides in South Africa and at least 75 per cent of its gross income is rental income. This regime will be extended to unlisted REITs once they are subject to similar regulation as listed REITs. This form of regulation should initially be extended to wholly owned entities of private and government pension funds, as well as long-term insurers. Property syndication legislation is also proposed to protect investors from Ponzi schemes. REIT tax relief will similarly be extended to cover other real estate entities if they become subject to property syndication regulation. Hedge funds |
Hedge funds to fall under collective investment scheme legislation | | Hedge funds will fall under collective investment scheme legislation and will be regulated accordingly. While regulated hedge funds will be treated much the same as other collective investment schemes, unit holders will be required to treat their earnings as ordinary revenue when realised. This should generate the intended tax result without interfering with daily operations. A similar regime will be considered for interest-income funds. |
| | Uniform cross-border withholding to prevent base erosion |
Service fees to be included in cross-border withholding framework | | Government proposes that the cross-border withholding regime on interest and royalties be extended to cross-border service fees, subject to treaty relief. To facilitate administration, all three sets of withholding regimes (interest, royalties and cross-border service fees) will become effective from 1 March 2014. Prior changes to interest and royalty withholding will also be deferred until this date. ¢ Longer-term tax considerations Mining taxation review |
Review of mining taxation as part of broader review of tax system | | The mineral and petroleum royalty regime has broadened the tax base and allowed for increased revenue during periods of high commodity prices, while providing relief to marginal mines when commodity prices and profitability are low. The broader review of the tax system will consider whether this approach is sufficiently robust and assess what the most appropriate mining tax regime is to ensure that South Africa remains a competitive investment destination. National health insurance discussion paper |
Paper with funding options for national health insurance to be released during 2013 | | National health insurance will be phased in over a 14-year period (see Chapter 6). This will require additional funding over time. A discussion paper presenting funding options will be released during 2013. |
56
CHAPTER 4: REVENUE TRENDS AND TAX PROPOSALS
| | |
¢ Indirect tax proposals Carbon tax, energy-efficiency savings and the electricity levy | | |
Government has proposed a carbon tax as part of South Africa’s efforts to mitigate the effects of climate change. By pricing the external costs associated with carbon dioxide (CO2) emissions, incentives will be created to change behaviour and encourage energy-efficiency measures. Government proposes to phase the tax in over time. During the first phase of implementation (between 2015 and 2020), a basic tax-free threshold of 60 per cent is proposed, as well as offset percentages of 5-10 per cent to allow emission-intensive and trade-exposed industries to invest in projects outside their normal operations to help reduce their carbon tax liabilities. With effect from 1 January 2015, a carbon tax at a rate of R120 per ton of CO2 equivalent is proposed, with the rate increasing at 10 per cent a year during the first phase of implementation. An updated policy paper will be published by the end of March 2013 for further comment and consultation. The energy-efficiency savings tax incentive will help companies to reduce their energy intensity and the country’s level of CO2 emissions. Some of the revenues generated through the carbon tax will be recycled to fund the energy-efficiency savings tax incentive. A gradual phasing out of the electricity levy as the carbon tax is phased in is also being considered. Increase in vehicle CO2 emissions tax | | Government to phase in carbon tax over time |
The motor vehicle CO2 emissions tax encourages consumers to buy vehicles with lower carbon emissions. Data shows declining average CO2 emissions for passenger vehicles since the tax was introduced. Government proposes an increase in the tax for passenger vehicles from R75 to R90 for every gram of emissions/km above 120 gCO2/km and, in the case of double cabs, from R100 to R125 for every gram/km in excess of 175 gCO2/km, effective from 1 April 2013. Certified emission reductions tax incentive To stimulate the uptake of Clean Development Mechanism projects in South Africa, income from primary certified emissions reductions has been exempt from income tax from 2009 to 2012. In light of the adoption of a second commitment period of the Kyoto Protocol, government proposes to extend the incentive to 31 December 2020. Increase in plastic bag and incandescent light bulb levies | | Increase in CO2 emissions tax for passenger vehicles |
Government proposes to increase the levy on plastic shopping bags, which has been at 4c/bag since 2009, to 6c/bag from 1 April 2013, and the environmental levy on incandescent light bulbs from R3 to R4 per bulb from 1 April 2013. Increase in fuel levies Government proposes to increase the general fuel levy and Road Accident Fund levy by 22.5c/l and 8c/l respectively with effect from 3 April 2013. Since April 2010, the general fuel levy has included a new multiproduct pipeline levy (7.5c/l) component. This component was introduced for 36 months to help fund the construction of additional pipeline capacity and will end on 2 April 2013. The net increase in the general fuel levy on 3 April 2013 will thus be only 15c/l and not the full 22.5c/l. The demand-side levy on 95 octane petrol sold inland will be increased later this year. | | Levy on plastic shopping bags to increase to 6c/bag |
57
2013 BUDGET REVIEW
Table 4.7 Total combined fuel taxes on petrol and diesel, 2011/12 – 2013/14
| | | | | | | | | | | | | | | | | | | | | | | | |
| | | 2011/12 | | | 2012/13 | | | 2013/14 | |
c / litre | | 93 Octane
petrol | | | Diesel | | | 93 Octane
petrol | | | Diesel | | | 93 Octane
petrol | | | Diesel | |
General fuel levy | | | 177.50 | | | | 162.50 | | | | 197.50 | | | | 182.50 | | | | 212.50 | | | | 197.50 | |
Road Accident Fund levy | | | 80.00 | | | | 80.00 | | | | 88.00 | | | | 88.00 | | | | 96.00 | | | | 96.00 | |
Customs and excise levy | | | 4.00 | | | | 4.00 | | | | 4.00 | | | | 4.00 | | | | 4.00 | | | | 4.00 | |
Illuminating paraffin marker | | | 0.00 | | | | 0.01 | | | | 0.00 | | | | 0.01 | | | | 0.00 | | | | 0.01 | |
| | | | | | | | | | | | | | | | | | | | | | | | |
Total | | | 261.50 | | | | 246.51 | | | | 289.50 | | | | 274.51 | | | | 312.50 | | | | 297.51 | |
Pump price: Gauteng (as in February)1 | | | 884.00 | | | | 814.05 | | | | 1 077.00 | | | | 1 026.69 | | | | 1 206.00 | | | | 1 129.17 | |
| | | | | | | | | | | | | | | | | | | | | | | | |
Taxes as percentage of pump price | | | 29.6 | % | | | 30.3 | % | | | 26.9 | % | | | 26.7 | % | | | 25.9 | % | | | 26.3 | % |
| | | | | | | | | | | | | | | | | | | | | | | | |
1. Diesel (0.05% sulphur) wholesale price (retail price not regulated)
| | |
| | Biofuels production incentive |
Support for expanded biofuels industry in South Africa | | The South African biofuels strategy proposes to establish eight biofuels manufacturing plants. As in other countries, a fiscal incentive is required to overcome the initial capital cost hurdles and offset risks. The proposed incentive is based on benchmark costs of hypothetical world-scale plants in South Africa, and will compensate for monthly movements in benchmark feedstock and output prices. It will serve as an “infant industry” support mechanism and will be phased out over an assumed 20-year lifetime of a benchmark plant. The initial cost of the incentive will be 3.5c/l to 4c/l of petrol or diesel, recovered through a levy included in the monthly price determination. |
| | Excise duties on tobacco and alcohol |
Excise duties on tobacco products to increase by between 5.8 and 10 per cent | | The excise duties on tobacco products are determined in accordance with a targeted total tax burden (excise duties plus VAT) of 52 per cent of the retail price. Government proposes increases in the excise duties of tobacco products of between 5.8 and 10 per cent. The current targeted tax burdens (excise duties plus VAT) expressed as a percentage of the weighted average retail selling price for wine, clear beer and spirits are 23, 35, and 48 per cent respectively. Government proposes to increase excise duties on alcoholic beverages for this year by between 5.7 and 10 per cent. |
58
CHAPTER 4: REVENUE TRENDS AND TAX PROPOSALS
Table 4.8 Changes in specific excise duties, 2013/14
| | | | | | | | | | | | |
| | | Current excise | | Proposed excise | | Percentage change | |
Product | | duty rate | | duty rate | | Nominal | | | Real | |
| Malt beer | | R59.36 / litre of absolute alcohol (100.98c / average 340ml can) | | R63.81 / litre of absolute alcohol (108.48c / average 340ml can) | | | 7.5 | % | | | 1.9 | % |
| Traditional African beer | | 7.82c / litre | | 7.82c / litre | | | 0.0 | % | | | -5.6 | % |
| Traditional African beer | | 34.70c / kg | | 34.70c / kg | | | 0.0 | % | | | -5.6 | % |
| Unfortified wine | | R2.50 / litre | | R2.70 / litre | | | 8.0 | % | | | 2.4 | % |
| Fortified wine | | R4.59 / litre | | R4.85 / litre | | | 5.7 | % | | | 0.1 | % |
| Sparkling wine | | R7.53 / litre | | R8.28 / litre | | | 10.0 | % | | | 4.4 | % |
| Ciders and alcoholic fruit beverages | | R2.97 / litre (100.98c / average 340ml can) | | R3.19 / litre (108.48c / average 340ml can) | | | 7.4 | % | | | 1.9 | % |
| Spirits | | R111.64 / litre of absolute alcohol (R36.00 / 750ml bottle) | | R122.80 / litre of absolute alcohol (R39.60 / 750ml bottle) | | | 10.0 | % | | | 4.4 | % |
| Cigarettes | | R10.32/ 20 cigarettes | | R10.92/ 20 cigarettes | | | 5.8 | % | | | 0.3 | % |
| Cigarette tobacco | | R11.05/ 50g | | R12.16/ 50g | | | 10.0 | % | | | 4.5 | % |
| Pipe tobacco | | R3.22/ 25g | | R3.54/ 25g | | | 9.9 | % | | | 4.4 | % |
| Cigars | | R53.05 / 23g | | R56.76 / 23g | | | 7.0 | % | | | 1.4 | % |
| | |
VAT registration of foreign businesses VAT is payable where goods and services are consumed. Consequently, exports are zero-rated and imports are subject to VAT. This principle does not lend itself to simple application for imported services or e-commerce. While the consumer bears the burden of VAT, the law requires vendors to register with SARS, collect VAT and pay it to SARS. In the case of imported services or digital supplies, such as e-books or music, no border post or post office can perform the function as collecting agent, as is the case with physical goods. The net result is that the local consumer can buy imported digital goods or services without paying VAT. | | |
| Government proposes that all foreign businesses supplying e-books, music and other digital goods and services in South Africa be required to register as VAT vendors. This proposal is in line with international trends, such as regulations adopted by the European Union requiring such suppliers to register for VAT in the country where the consumer resides. | | Foreign businesses supplying digital goods and services will have to register for VAT |
¢ Revenue impact of tax proposals | | |
| Table 4.9 shows the expected impact of tax proposals on revenue collection in 2013/14, the net effect of which decreases the estimated total tax revenue by R2.4 billion. | | 2013/14 tax proposals reduce total tax revenue by a net R2.4 billion |
59
2013 BUDGET REVIEW
Table 4.9 Impact of tax proposals on 2013/14 revenue
| | | | | | | | |
R million | | Effect of tax proposals | |
Tax revenue (before tax proposals) | | | | | | | 900 416 | |
Non-tax revenue | | | | | | | 18 336 | |
Less: SACU payments | | | | | | | -43 374 | |
| | | | | | | | |
National budget revenue | | | | | | | 875 378 | |
Provinces, social security funds and selected public entities | | | | | | | 114 273 | |
| | | | | | | | |
Budget revenue (before tax proposals) | | | | | | | 989 651 | |
Budget 2013/14 proposals: | | | | | | | -2 412 | |
Taxes on individuals and companies | | | -8 242 | | | | | |
Personal income tax | | | -7 382 | | | | | |
Adjustment in personal tax rate structure | | | -7 032 | | | | | |
Adjustment in monetary thresholds | | | -350 | | | | | |
Business income tax | | | -860 | | | | | |
Employment tax incentive | | | -500 | | | | | |
Small business corporations | | | -360 | | | | | |
Indirect taxes | | | 5 830 | | | | | |
Increase in general fuel levy | | | 3 270 | | | | | |
Increase in excise duties on tobacco products | | | 855 | | | | | |
Increase in alcoholic beverages | | | 1 210 | | | | | |
Increase in incandescent bulb levy | | | 50 | | | | | |
Increase in plastic bag levy | | | 90 | | | | | |
Increase in CO2vehicle emission tax | | | 355 | | | | | |
| | | | | | | | |
Tax revenue (after tax proposals) | | | | | | | 898 004 | |
| | | | | | | | |
Budget revenue (after tax proposals) | | | | | | | 987 240 | |
| | | | | | | | |
| | |
| | ¢ Medium-term revenue outlook |
Revenue expected to increase to 25.7 per cent of GDP in 2015/16 | | Table 4.10 sets out actual revenue collections for 2009/10 to 2011/12, the revised estimate for 2012/13 and the medium-term estimates. After taking the tax proposals into account, tax revenue as a percentage of GDP is expected to increase from 25.2 per cent in 2012/13 to 25.7 per cent in 2015/16. |
60
CHAPTER 4: REVENUE TRENDS AND TAX PROPOSALS
Table 4.10 Budget revenue, 2009/10 – 2015/16
| | | | | | | | | | | | | | | | | | | | | | | | | | | | |
| | | 2009/10 | | | 2010/11 | | | 2011/12 | | | 2012/13 | | | 2013/14 | | | 2014/15 | | | 2015/16 | |
R million | | Outcome | | | Revised | | | Medium-term estimates | |
Taxes on income and profits1 | | | 359 045 | | | | 379 941 | | | | 426 584 | | | | 453 522 | | | | 501 353 | | | | 557 285 | | | | 618 813 | |
of which: | | | | | | | | | | | | | | | | | | | | | | | | | | | | |
Personal income tax | | | 205 145 | | | | 226 925 | | | | 250 400 | | | | 274 020 | | | | 306 188 | | | | 337 420 | | | | 372 160 | |
Corporate income tax | | | 134 883 | | | | 132 902 | | | | 151 627 | | | | 156 350 | | | | 169 830 | | | | 191 376 | | | | 214 745 | |
Taxes on payroll and workforce | | | 7 805 | | | | 8 652 | | | | 10 173 | | | | 11 400 | | | | 12 403 | | | | 13 544 | | | | 14 817 | |
Taxes on property | | | 8 826 | | | | 9 102 | | | | 7 817 | | | | 8 200 | | | | 9 070 | | | | 10 130 | | | | 11 350 | |
Domestic taxes on goods and services | | | 203 667 | | | | 249 490 | | | | 263 950 | | | | 298 935 | | | | 333 344 | | | | 364 300 | | | | 401 530 | |
of which: | | | | | | | | | | | | | | | | | | | | | | | | | | | | |
Value-added tax | | | 147 941 | | | | 183 571 | | | | 191 020 | | | | 217 000 | | | | 242 990 | | | | 270 540 | | | | 304 010 | |
Taxes on international trade and transactions | | | 19 319 | | | | 26 977 | | | | 34 121 | | | | 38 093 | | | | 41 834 | | | | 46 570 | | | | 52 445 | |
Stamp duties and fees | | | 49 | | | | 3 | | | | -3 | | | | — | | | | — | | | | — | | | | — | |
State miscellaneous revenue2 | | | -6 | | | | 17 | | | | 9 | | | | — | | | | — | | | | — | | | | — | |
| | | | | | | | | | | | | | | | | | | | | | | | | | | | |
Tax revenue | | | 598 705 | | | | 674 183 | | | | 742 651 | | | | 810 150 | | | | 898 004 | | | | 991 830 | | | | 1098 955 | |
Non-tax revenue3 | | | 8 894 | | | | 13 460 | | | | 19 193 | | | | 14 475 | | | | 18 336 | | | | 19 129 | | | | 20 241 | |
of which: | | | | | | | | | | | | | | | | | | | | | | | | | | | | |
Mineral and petroleum royalties | | | — | | | | 3 555 | | | | 5 612 | | | | 5 000 | | | | 5 900 | | | | 6 500 | | | | 7 200 | |
Less: SACU payments4 | | | -27 915 | | | | -17 906 | | | | -21 760 | | | | -42 151 | | | | -43 374 | | | | -43 036 | | | | -48 469 | |
| | | | | | | | | | | | | | | | | | | | | | | | | | | | |
National budget revenue | | | 579 685 | | | | 669 738 | | | | 740 084 | | | | 782 474 | | | | 872 966 | | | | 967 923 | | | | 1070 727 | |
Provinces, social security funds and selected public entities | | | 84 790 | | | | 87 418 | | | | 96 766 | | | | 105 375 | | | | 114 273 | | | | 124 613 | | | | 130 368 | |
Repayment of Gautrain loan | | | — | | | | — | | | | — | | | | — | | | | -1 521 | | | | -1 430 | | | | -1 340 | |
| | | | | | | | | | | | | | | | | | | | | | | | | | | | |
Budget revenue | | | 664 475 | | | | 757 156 | | | | 836 850 | | | | 887 849 | | | | 985 719 | | | | 1091 105 | | | | 1199 755 | |
| | | | | | | | | | | | | | | | | | | | | | | | | | | | |
As percentage of GDP | | | | | | | | | | | | | | | | | | | | | | | | | | | | |
Tax revenue | | | 24.4 | % | | | 24.6 | % | | | 25.0 | % | | | 25.2 | % | | | 25.5 | % | | | 25.6 | % | | | 25.7 | % |
Budget revenue | | | 27.1 | % | | | 27.7 | % | | | 28.1 | % | | | 27.7 | % | | | 28.0 | % | | | 28.1 | % | | | 28.1 | % |
| | | | | | | | | | | | | | | | | | | | | | | | | | | | |
GDP (R billion) | | | 2 453 | | | | 2 735 | | | | 2 973 | | | | 3 209 | | | | 3 520 | | | | 3 880 | | | | 4 271 | |
Tax/GDP multiplier | | | 0.83 | | | | 1.09 | | | | 1.17 | | | | 1.15 | | | | 1.12 | | | | 1.02 | | | | 1.07 | |
| | | | | | | | | | | | | | | | | | | | | | | | | | | | |
| 1. | Also includes secondary tax on companies/dividend with holding tax and interest on overdue income tax and small business tax amnesty levy |
| 2. | Revenue received by SARS that could not be allocated to a specific tax instrument |
| 3. | Includes mineral royalties, mining leases, departmental revenue and sales of capital assets |
| 4. | 2010/11 SACU includes adjustment for a previous error in calculation |
| | |
Tax expenditure statement As part of its commitment to transparent budgeting, government publishes a tax expenditure statement. The statement is presented in Annexure C and summarised in Table 4.11 below. | | |
| The statement summarises the effect of provisions in tax legislation that reduce the amount of tax revenue that could otherwise have been realised to help achieve social and economic policy objectives. The estimate of total tax expenditure in 2010/11 was R105.2 billion, or 3.8 per cent of GDP. Some of the incentives that give rise to these tax expenditures will be reviewed. | | Tax expenditure in 2010/11 estimated at R105.2 billion |
61
2013 BUDGET REVIEW
Table 4.11 Summary of tax expenditure estimates, 2007/08 – 2010/11
| | | | | | | | | | | | | | | | |
R million | | 2007/08 | | | 2008/09 | | | 2009/10 | | | 2010/11 | |
Personal income tax1 | | | 24 987 | | | | 29 913 | | | | 33 364 | | | | 38 602 | |
Corporate income tax2 | | | 2 613 | | | | 2 715 | | | | 3 321 | | | | 2 754 | |
Value-added tax3 | | | 27 706 | | | | 30 354 | | | | 30 701 | | | | 34 959 | |
Customs and excise duties4 | | | 20 334 | | | | 16 714 | | | | 17 139 | | | | 28 912 | |
| | | | | | | | | | | | | | | | |
Total tax expenditure | | | 75 641 | | | | 79 695 | | | | 84 524 | | | | 105 226 | |
Tax expenditure as percentage of total gross tax revenue | | | 13.2 | % | | | 12.7 | % | | | 14.1 | % | | | 15.6 | % |
Total gross tax revenue | | | 572 815 | | | | 625 100 | | | | 598 705 | | | | 674 183 | |
Tax expenditure as percentage of GDP | | | 3.6 | % | | | 3.5 | % | | | 3.4 | % | | | 3.8 | % |
| | | | | | | | | | | | | | | | |
| 1. | Retirement savings and medical expenses |
| 2. | Investment incentives, urban development zones, research and development, and learnerships |
| 3. | Zero-rating of basic food stuffs, petrol and diesel |
| 4. | Motor industry, textiles, agriculture and mining |
| | |
| | ¢ Tax administration Aggressive tax planning, base erosion and profit shifting |
SARS to continue with efforts to arrest aggressive tax planning, base erosion and profits shifting | | The Group of 20 has recognised the international problems of base erosion and profit shifting. South Africa is participating in the Organisation for Economic Cooperation and Development’s work in this area. South Africa has also committed to the development of a BRICS (Brazil, Russia, India, China and South Africa) mechanism to assist in countering abusive tax avoidance, as well as the abuse of tax treaty benefits, incomplete disclosure and fraudulent claims. SARS will continue with efforts to arrest aggressive tax planning, base erosion and profit shifting. Streamlining registration and filing for businesses and individuals A single registration process for multiple tax products will be launched to simplify registration for all businesses. VAT registration will be streamlined to ease the compliance burden while guarding against fraud. A new company income tax form will be introduced that requires fewer fields to be completed by smaller businesses. Individuals with a single source of taxable employment income currently do not have to submit tax returns if their taxable income is below a threshold of R120 000 per year. The threshold is raised to R250 000. Tenders and tax compliance |
SARS to implement automated tax clearance certificate later this year | | Last year it was announced that the tax clearance system would be strengthened to ensure that non-compliant taxpayers cannot do business with the state. SARS is now testing an automated tax clearance certificate for implementation later this year. This will enable the real-time tracking of the tax compliance of the person who tendered. SARS is also following up on payments made by the state to tenderers to check whether full tax disclosure was made. |
62
CHAPTER 4: REVENUE TRENDS AND TAX PROPOSALS
| | |
Illicit economy SARS has continued to uncover illicit activities related to customs duty fraud, smuggling of goods, counterfeiting, round tripping and trans-shipments, as well as tax evasion and money laundering. A total of 1 531 seizures of goods to the value of R151.8 million have occurred. In collaboration with labour and business, reference-pricing risk indicators to detect and deal with potential undervaluation of imported clothing, textile and home-ware products have been introduced. Small and micro business registration SARS is working with the Department of Home Affairs and other agencies to register small and micro businesses, including those operated by foreigners. Understatement penalties The penalty provisions will be refined and relief will be provided for bona fide errors. ¢ Tax policy research projects | | |
In addition to the investigations described above, the National Treasury will undertake the following research during 2013/14: • Reviewing the VAT treatment of financial services and VAT apportionment within the financial sector. • Exploring a sustainable framework for financing local government. • Assessing the effectiveness of various tax incentives. • Investigating the taxation of alternative transport fuels such as liquefied natural gas and liquefied petroleum gas. • Reviewing the taxation of various innovative financial instruments. ¢ Conclusion Government will continue to protect the tax revenue base to support the fiscus, while maintaining a fair tax system. Tax reforms seek to improve the robustness of tax collection by ensuring that cross-border e-commerce, for example, is subject to VAT. A youth employment tax incentive is proposed to help young work seekers gain access to employment. The introduction of a carbon tax is proposed in gradual phases. Various loopholes are being closed. Revenue collection has slowed in line with the economic environment. Higher tax collections will depend on improved economic growth and better compliance over the medium term. | | Research on VAT treatment of financial services and sustainable financing of local government |
63
2013 BUDGET REVIEW
This page has been left blank intentionally.
64
5
Asset and liability management
In brief
| | • | | Government’s debt management strategy is intended to keep the cost of debt as low as possible, ensure access to global and domestic markets, diversify funding instruments and encourage the growth of South Africa’s liquid capital market. Fiscal policy works to ensure that debt levels remain sustainable. |
| | • | | Net loan debt is projected to reach 38.6 per cent in 2013/14. Debt-service costs are expected to stabilise at 2.8 per cent of GDP in 2012/13. Total contingent liabilities, net loan debt and provisions will stabilise at 53.4 per cent of GDP in 2014/15. |
| | • | | Government’s gross borrowing requirement of R215.5 billion in 2013/14 will be financed by domestic bond issuance of R165.6 billion, net short-term loans of R23 billion, cash balances of R15.8 billion and borrowing of US$1.5 billion on global markets. Five new domestic bonds will be introduced in 2013/14. |
| | • | | State-owned companies plan to spend R377.5 billion on infrastructure over the medium term. Government supports these companies to ensure that they can borrow at reasonable cost. Those facing persistent difficulties may be restructured to ensure that resources can be more productively applied to finance policy priorities. Government’s holdings of equity and cash in various entities are therefore under review. |
¢ Overview
| | |
| When its spending exceeds its income, government has a budget deficit. The deficit has to be financed by borrowing on the domestic and international financial markets. These loans add to government’s overall debt. | | Government debt is financed by borrowing on financial markets |
| |
| The debt, which is also known as the principal, has to be repaid by an agreed date. Government also pays interest on the debt. To the degree that public funds are absorbed by interest payments, the state has less money for social and economic programmes. In other words, high and growing levels of debt mean that a rising portion of tax revenue must be spent on servicing the debt. | | |
65
2013 BUDGET REVIEW
| | |
| Increase in state debt over last several years was in line with countercyclical fiscal policy | | In response to the global financial crisis of 2008 and the recession that followed, government allowed for budget deficits to increase as revenue declined. This was in line with countercyclical fiscal policy and supported the economy by maintaining investment in infrastructure and core social expenditure. Because government has maintained a prudent approach to managing its financial affairs – and because South Africa has well-developed financial markets – the state has been able to secure borrowing from investors to cover these deficits at a reasonable cost. |
| |
| | As a consequence of increased borrowing, net government debt rose from R483 billion in 2007/08 to R1.2 trillion in 2012/13, or from 23.3 per cent to 36.3 per cent of GDP. Over the next three years, government needs to borrow an additional R497 billion, increasing debt to R1.7 trillion or 40.3 per cent of GDP. As a result, interest costs will rise from R52.9 billion in 2007/08 to R88.3 billion in 2012/13, and to R118.2 billion in 2015/16. |
| |
| | Government is committed to managing its debt in a manner consistent with the principles of sustainability and intergenerational equity. |
| |
| Government plans to borrow R215.5 billion in 2013/14 | | In 2013/14 government plans to borrow R215.5 billion, which includes the refinancing of R37.5 billion of debt scheduled for repayment during 2013/14. This borrowing requirement will be financed mainly in the domestic market through issuing fixed-rate and inflation-linked government bonds and Treasury bills, and making use of surplus cash. In keeping with government’s commitment to develop the market, new fixed-rate and inflation-linked bonds will be issued. South Africa will also borrow in global capital markets to finance part of its foreign currency commitments. |
Financing strategy and financing instruments
Government’s debt management strategy is intended to keep the cost of debt as low as possible, ensure access to domestic and international financial markets, diversify funding instruments and encourage the continued development of liquid capital markets in South Africa.
The main instruments that government uses to finance its debt include the following:
| | • | | Fixed-rate bonds offer a fixed rate of interest, known as the “coupon”, which is paid periodically during the life of the bond – usually twice a year. |
| | • | | Inflation-linked bonds provide investors with cover against inflation, adjust the principal in line with movements in the consumer price index, and pay a fixed rate of interest on the adjusted principal. |
| | • | | Treasury bills are debt instruments with maturities of less than a year. They are issued at a discount, which represents the interest. |
Other instruments available to finance debt include cash balances, which can be drawn down, and cash borrowings from the Corporation for Public Deposits.
| | |
| Capital investments by state-owned companies need to be financed from the strength of their own balance sheets | | State-owned companies are at the centre of South Africa’s infrastructure expansion. Government continues to support these companies to ensure that they are able to borrow at reasonable cost, while seeking ways to increase their efficiency. Some state-owned companies facing persistent difficulties will require restructuring to become financially sustainable, and to ensure that they are playing their mandated roles. |
| |
| | This chapter provides an overview of developments in South Africa’s debt markets, the 2013/14 funding strategy and the state debt portfolio. It also reviews the challenges and opportunities facing state-owned companies and development finance institutions. |
66
CHAPTER 5: ASSET AND LIABILITY MANAGEMENT
¢ Developments in South Africa’s debt markets
Domestic bond market
| | |
| Demand for South African domestic bonds remained strong during 2012/13, anchored by a global search for higher yield and positive growth prospects in emerging markets. Domestic bonds also benefited from South Africa’s listing in Citigroup’s World Government Bond Index in October 2012, exposing government paper to a new set of investors. International investors purchased a net R92.4 billion of domestic bonds, taking their holdings of local currency government debt from 29.1 per cent in 2011 to 35.9 per cent in 2012. This marks the first time that holdings by global investors exceed those of local pension funds. | | Strong demand for South African bonds reflects global search for higher yield |
Table 5.1 Ownership of domestic government bonds, 2008 – 2012
| | | | | | | | | | | | | | | | | | | | |
Percentage of total | | 2008 | | | 2009 | | | 2010 | | | 2011 | | | 2012 | |
Pension funds | | | 43.9 | | | | 39.9 | | | | 36.5 | | | | 33.0 | | | | 29.8 | |
International investors | | | 12.8 | | | | 13.8 | | | | 21.8 | | | | 29.1 | | | | 35.9 | |
Monetary institutions | | | 18.0 | | | | 18.3 | | | | 17.7 | | | | 16.3 | | | | 17.0 | |
Insurers | | | 13.7 | | | | 12.4 | | | | 14.1 | | | | 11.6 | | | | 9.4 | |
Other financial institutions | | | 10.2 | | | | 13.2 | | | | 8.1 | | | | 8.0 | | | | 5.8 | |
Other | | | 1.4 | | | | 2.4 | | | | 1.8 | | | | 2.0 | | | | 2.1 | |
Source: Share Transactions Totally Electronic Ltd
| | |
| These capital inflows have helped to finance government’s infrastructure investments. They have also helped to keep borrowing costs at historic lows. The funding costs on long-term fixed-rate bonds, for example, have fallen by an average of 2.34 percentage points since 2010. | | Capital inflows have helped to finance infrastructure and kept borrowing costs low |
| |
| Government recognises the risks associated with increased investment from overseas, including currency volatility and the potential for rapid withdrawal of capital. | | |
Listing on World Government Bond Index: a vote of confidence in South Africa
In October 2012, South Africa became the first African country listed on Citigroup’s World Government Bond Index.
The index includes bonds from 22 countries, including Australia, Canada, Germany and the United States. It is used by global investors as a benchmark for allocating about US$2 trillion of assets under management. To be included in the index, countries must have a minimum market capitalisation of US$50 billion equivalent in outstanding local currency debt, an investment-grade rating from Standard and Poor’s, or Moody’s Investor Services, and no barriers to entry for international investors.
Inclusion in the index is a vote of confidence in South Africa’s commitment to prudent fiscal and monetary policy, and reflects the depth of the rand-denominated bond market.
International bond market
| | |
| During 2012 global financial markets benefited from low interest rates resulting from moves by central banks to provide liquidity. Assets that major global investors often perceive as risky, such as emerging market equities and high-yield sovereign bonds, outperformed lower-yielding developed-country assets. | | |
| |
| From January to December 2012, emerging market governments issued US$375 billion in bonds, surpassing the US$306 billion issued in 2011. Reflecting the popularity of emerging market bonds, new issuances have been characterised by lower interest rates, oversubscribed order books and a record number of issuers. This trend supports government’s continued access to global finance for its foreign currency commitments. | | During 2012, emerging market governments issued US$375 billion in bonds |
67
2013 BUDGET REVIEW
Sovereign credit ratings
During 2012/13, three rating agencies downgraded South Africa’s credit ratings. Moody’s Investor Services downgraded the rating to Baa1 from A3, and Standard and Poor’s and Fitch Ratings each downgraded their ratings to BBB from BBB+. Both Moody’s and S&P have maintained South Africa’s credit outlook at negative while Fitch has assigned a stable outlook. The downgrades also affected the ratings of state-owned companies and development finance institutions.
Factors cited for the downgrades included:
| | • | | A weaker business and investment climate |
| | • | | Infrastructure bottlenecks |
| | • | | A deteriorating growth outlook, which could affect the fiscus and raise social and political tensions. |
Government views these observations in the context of persistent uncertainty about the strength of the global economic recovery. Europe, for example, which accounts for 21 per cent of South Africa’s exports, is undergoing a debt crisis that has sharply reduced trade with South Africa.
At the same time, government is mindful of risks posed by sluggish economic growth to the sustainability of its fiscal accounts, and has taken measures to contain spending and stabilise the growth of debt over the medium term. Prudent macroeconomic policies and the country’s sound institutional environment should continue to support a positive long-term rating outlook. The National Development Plan provides a broad strategic framework to eliminate poverty and reduce inequality, focusing in part on massive infrastructure and skills investment to boost long-term growth potential.
| | |
| | ¢ Consolidated borrowing requirement |
| |
| | The consolidated government borrowing requirement includes the financing requirements of national and provincial government, the social security funds and national extra-budgetary institutions. |
| |
| Consolidated borrowing stood at an estimated R159.8 billion in 2012/13 | | Consolidated borrowing is estimated to increase to R159.8 billion in 2012/13, before declining to R131.3 billion in 2015/16. This requirement is lower than that of the national government – mainly because of large investments held by the social security funds and capital reserves held by extra-budgetary institutions, which constitute prefunding for infrastructure investment. Extra-budgetary institutions also raise loans to finance large-scale infrastructure investment. These include the South African National Roads Agency Limited (SANRAL), Trans-Caledon Tunnel Authority and water board project loans, which will amount to about R17.9 billion over the medium term. |
Table 5.2 Financing of consolidated government net borrowing requirement, 2009/10 – 2015/16
| | | | | | | | | | | | | | | | | | | | | | | | | | | | |
| | | 2009/10 | | | 2010/11 | | | 2011/12 | | | 2012/13 | | | 2013/14 | | | 2014/15 | | | 2015/16 | |
R billion | | Actual | | | Estimate | | | Medium-term estimates | |
Budget balance1 | | | -159.6 | | | | -120.4 | | | | -117.3 | | | | -168.0 | | | | -163.7 | | | | -153.2 | | | | -134.4 | |
Extraordinary receipts and payments | | | 5.8 | | | | 2.2 | | | | 3.8 | | | | 8.2 | | | | 4.1 | | | | 2.9 | | | | 3.1 | |
| | | | | | | | | | | | | | | | | | | | | | | | | | | | |
Net borrowing requirement | | | -153.8 | | | | -118.2 | | | | -113.5 | | | | -159.8 | | | | -159.6 | | | | -150.3 | | | | -131.3 | |
| | | | | | | | | | | | | | | | | | | | | | | | | | | | |
Domestic loans | | | 177.6 | | | | 176.5 | | | | 160.1 | | | | 148.1 | | | | 169.8 | | | | 164.5 | | | | 167.4 | |
Foreign loans | | | 24.2 | | | | 4.7 | | | | 11.6 | | | | -8.1 | | | | -3.3 | | | | 3.1 | | | | 8.9 | |
Change in cash and other balances2 | | | -48.0 | | | | -63.0 | | | | -58.2 | | | | 19.9 | | | | -6.9 | | | | -17.3 | | | | -45.0 | |
| | | | | | | | | | | | | | | | | | | | | | | | | | | | |
Financing | | | 153.8 | | | | 118.2 | | | | 113.5 | | | | 159.8 | | | | 159.6 | | | | 150.3 | | | | 131.3 | |
| | | | | | | | | | | | | | | | | | | | | | | | | | | | |
| 1. | A negative number reflects a deficit |
| 2. | A negative change indicates an increase in cash balances |
68
CHAPTER 5: ASSET AND LIABILITY MANAGEMENT
| | |
| ¢ National government borrowing requirement | | |
| |
| Government’s net borrowing requirement is the sum of the main budget balance and the net of extraordinary receipts and extraordinary payments. In addition, government borrows to refinance its redeeming debt. | | |
| |
| As Table 5.3 shows, the net borrowing requirement is expected to amount to R176.3 billion in 2012/13, increasing to R178 billion in 2013/14 before declining to R151.9 billion in 2015/16. | | Net borrowing requirement of R178 billion in 2013/14 |
Table 5.3 National government net borrowing requirement, 2011/12 – 2015/16
| | | | | | | | | | | | | | | | | | | | | | | | |
| | | 2011/12 | | | 2012/13 | | | 2013/14 | | | 2014/15 | | | 2015/16 | |
R million | | Outcome | | | Budget | | | Revised | | | Medium-term estimates | |
National budget balance1 | | | -148 439 | | | | -170 025 | | | | -184 493 | | | | -182 109 | | | | -170 058 | | | | -155 000 | |
Extraordinary receipts | | | 5 209 | | | | 1 200 | | | | 10 780 | | | | 4 992 | | | | 2 900 | | | | 3 100 | |
Premiums on loan transactions2 | | | 3 483 | | | | 1 200 | | | | 9 975 | | | | 4 740 | | | | 2 900 | | | | 3 100 | |
Saambou Bank curatorship | | | 30 | | | | — | | | | — | | | | — | | | | — | | | | — | |
Revaluation profits on foreign currency transactions3 | | | 641 | | | | — | | | | 755 | | | | 252 | | | | — | | | | — | |
Liquidation of SASRIA investment4 | | | 228 | | | | — | | | | 50 | | | | — | | | | — | | | | — | |
Profits on GFECRA5 | | | 794 | | | | — | | | | — | | | | — | | | | — | | | | — | |
Other6 | | | 33 | | | | — | | | | — | | | | — | | | | — | | | | — | |
Extraordinary payments | | | -1 388 | | | | -24 | | | | -2 584 | | | | -930 | | | | — | | | | — | |
Premiums on loan transactions2 | | | — | | | | — | | | | -2 170 | | | | -930 | | | | — | | | | — | |
Revaluation losses on foreign currency transactions3 | | | -448 | | | | — | | | | -262 | | | | — | | | | — | | | | — | |
Defrayal of GFECRA losses5 | | | -940 | | | | -24 | | | | -152 | | | | — | | | | — | | | | — | |
| | | | | | | | | | | | | | | | | | | | | | | | |
Borrowing requirement | | | -144 618 | | | | -168 849 | | | | -176 297 | | | | -178 047 | | | | -167 158 | | | | -151 900 | |
| | | | | | | | | | | | | | | | | | | | | | | | |
| 1. | A negative number reflects a deficit |
| 2. | Premiums received or incurred on new loan issues, bond switch and buy-back transactions |
| 3. | Revaluation profits or losses on government’s foreign exchange deposits at the Reserve Bank when used to meet government’s foreign currency commitments |
| 4. | Liquidation of government’s investments in the South African Special Risk Insurance Association |
| 5. | Realised profits/losses on the Gold and Foreign Exchange Contingency Reserve Account |
| 6. | Mainly penalties on early withdrawal of retail bonds |
Extraordinary receipts and payments
| | |
| Premiums on loan transactions and revaluations of foreign currency transactions, and substantial once-off capital transactions, are reported as extraordinary payments and receipts. Extraordinary receipts of R10.8 billion and extraordinary payments of R2.6 billion are expected in 2012/13. Over the medium term, extraordinary receipts of R11 billion and extraordinary payments of R930 million are projected. | | Extraordinary receipts of R10.8 billion, extraordinary payments of R2.6 billion expected in 2012/13 |
| |
| Government is reviewing its substantial investments in state-owned companies. Some of these companies hold cash, excess financial reserves or assets that are not associated with public service delivery. Where such resources can be more productively applied to support policy priorities, the sale of such assets – or the return of surplus funds to the fiscus – will be considered. | | |
| |
| ¢ Financing the national borrowing requirement | | |
| |
| The net borrowing requirement is financed through loans made in the domestic and global markets and by using surplus cash. Table 5.4 outlines the financing of the net borrowing requirement for 2011/12, revised estimates for 2012/13 and projections over the medium term. Loan redemptions in 2012/13 amount to R42.9 billion. Over the medium term domestic and foreign loan redemptions of R113 billion are projected. | | |
69
2013 BUDGET REVIEW
Table 5.4 Financing of national government net borrowing requirement,1 2011/12 – 2015/16
| | | | | | | | | | | | | | | | | | | | | | | | |
| | | 2011/12 | | | 2012/13 | | | 2013/14 | | | 2014/15 | | | 2015/16 | |
R million | | Outcome | | | Budget | | | Revised | | | Medium-term estimates | |
Domestic short-term loans (net) | | | 18 725 | | | | 22 000 | | | | 22 000 | | | | 23 000 | | | | 24 000 | | | | 24 000 | |
Treasury bills | | | 19 009 | | | | 22 000 | | | | 20 897 | | | | 24 103 | | | | 24 000 | | | | 24 000 | |
Corporation for Public Deposits | | | -284 | | | | — | | | | 1 103 | | | | -1 103 | | | | — | | | | — | |
Domestic long-term loans (net) | | | 138 501 | | | | 119 998 | | | | 126 448 | | | | 143 610 | | | | 132 292 | | | | 137 032 | |
Market loans (gross) | | | 154 861 | | | | 151 367 | | | | 161 557 | | | | 165 648 | | | | 165 405 | | | | 165 119 | |
Loans issued for switches2 | | | -753 | | | | — | | | | -3 790 | | | | -1 310 | | | | — | | | | — | |
Redemptions3 | | | -15 607 | | | | -31 369 | | | | -31 319 | | | | -20 728 | | | | -33 113 | | | | -28 087 | |
Foreign loans (net) | | | 9 135 | | | | -7 492 | | | | -7 379 | | | | -4 335 | | | | 964 | | | | 9 724 | |
Market loans (gross) | | | 12 025 | | | | 4 035 | | | | 4 190 | | | | 12 390 | | | | 12 435 | | | | 12 630 | |
Arms procurement loan agreements (gross) | | | 569 | | | | 183 | | | | 61 | | | | — | | | | — | | | | — | |
Redemptions (including revaluation of loans) | | | -3 459 | | | | -11 710 | | | | -11 630 | | | | -16 725 | | | | -11 471 | | | | -2 906 | |
Change in cash and other balances4 | | | -21 743 | | | | 34 343 | | | | 35 228 | | | | 15 772 | | | | 9 902 | | | | -18 856 | |
Cash balances | | | -21 270 | | | | 30 743 | | | | 26 728 | | | | 11 272 | | | | 5 402 | | | | -23 356 | |
Other balances5 | | | -473 | | | | 3 600 | | | | 8 500 | | | | 4 500 | | | | 4 500 | | | | 4 500 | |
| | | | | | | | | | | | | | | | | | | | | | | | |
Financing | | | 144 618 | | | | 168 849 | | | | 176 297 | | | | 178 047 | | | | 167 158 | | | | 151 900 | |
| | | | | | | | | | | | | | | | | | | | | | | | |
| 1. | A longer time series is presented in Table 1 of Annexure B |
| 2. | Net of loans issued and redeemed in switch transactions |
| 3. | Domestic loan redemption figures in 2014/15 are net of anticipated switches of R11.9 billion |
| 4. | A negative change indicates an increase in cash balances |
| 5. | Net movement in national departments’ bank balances due to differences between funds requested and actual cash flows |
| | |
| | Domestic short-term borrowing |
| |
| Domestic short-terms loans increased by R22 billion in 2012/13 | | Short-term borrowing consists of Treasury bill issuance and borrowing of surplus cash from the public sector through the Corporation for Public Deposits, into which provinces and some public companies are required to invest their surplus cash. Government borrows from the corporation to finance a portion of its borrowing requirement. In 2012/13, short-term loans will increase by an estimated R22 billion to R190.4 billion. |
Table 5.5 Domestic short-term borrowing, 2012/13 – 2013/14
| | | | | | | | | | | | | | | | | | | | | | | | | | | | |
| | | | | | 2012/13 | | | | | | 2013/14 | | | 2012/13 | | | 2013/14 | |
R million | | Opening
balance | | | Net change | | | Closing
balance | | | Net change | | | Closing
balance | | | Weekly auction
estimates | |
Corporation for | | | 13 256 | | | | 1 103 | | | | 14 359 | | | | -1 103 | | | | 13 256 | | | | | | | | | |
Public Deposits | | | | | | | | | | | | | | | | | | | | | | | | | | | | |
Treasury bills | | | 155 159 | | | | 20 897 | | | | 176 056 | | | | 24 103 | | | | 200 159 | | | | 7 210 | | | | 7 770 | |
91-day | | | 46 909 | | | | 996 | | | | 47 905 | | | | — | | | | 47 905 | | | | 3 685 | | | | 3 685 | |
182-day | | | 35 880 | | | | 2 929 | | | | 38 809 | | | | 4 481 | | | | 43 290 | | | | 1 515 | | | | 1 665 | |
273-day | | | 38 220 | | | | 5 640 | | | | 43 860 | | | | 6 840 | | | | 50 700 | | | | 1 130 | | | | 1 300 | |
364-day | | | 34 150 | | | | 11 332 | | | | 45 482 | | | | 12 782 | | | | 58 264 | | | | 880 | | | | 1 120 | |
| | | | | | | | | | | | | | | | | | | | | | | | | | | | |
Total | | | 168 415 | | | | 22 000 | | | | 190 415 | | | | 23 000 | | | | 213 415 | | | | | | | | | |
| | | | | | | | | | | | | | | | | | | | | | | | | | | | |
| | |
| | Of the total amount of Treasury bills issued, 73.4 per cent is held by domestic commercial banks to partly meet their prescribed liquid asset requirements and 3.4 per cent is held by international investors. Over the medium term, Treasury bill net issuance is expected to average R24 billion a year, concentrated in longer maturities. |
70
CHAPTER 5: ASSET AND LIABILITY MANAGEMENT
| | |
| Domestic long-term borrowing | | |
| |
| Domestic long-term loans consist of fixed-rate bonds, inflation-linked bonds and retail bonds. In 2012/13, the budgeted domestic long-term loan issuance increased by R10.2 billion to R161.6 billion. This increase was financed by higher-than-anticipated take-up of non-competitive auctions. Domestic long-term loan issuance is expected to increase to an average of R165 billion a year over the medium term. As a result, current weekly auction levels will increase in 2013/14. Table 5.6 shows that fixed-rate bond issuance in 2012/13 was concentrated in longer maturities. | | Long-term domestic loan issuance reached R161.6 billion in 2012/13 |
Table 5.6 Domestic long-term market loan issuance, 2012/13
| | | | | | | | | | | | |
As of 31 January 2013 R million | | Cash value | | | Average
yield % | | | Outstanding
value | |
Fixed-rate1 | | | 114 746 | | | | 7.7 | | | | | |
R157 (13.5%; 2014/15/16) | | | 14 445 | | | | 6.5 | | | | 71 949 | |
R203 (8.25%; 2017) | | | 5 232 | | | | 7.0 | | | | 85 272 | |
R204 (8%; 2018) | | | 5 240 | | | | 7.2 | | | | 81 854 | |
R208 (6.75%; 2021) | | | 4 986 | | | | 7.6 | | | | 87 220 | |
R2023 (7.75%; 2023) | | | 20 128 | | | | 7.2 | | | | 20 495 | |
R186 (10.5%; 2025/26/27) | | | 6 484 | | | | 7.7 | | | | 121 605 | |
R213 (7%; 2031) | | | 15 030 | | | | 8.2 | | | | 48 828 | |
R209 (6.25%; 2036) | | | 7 594 | | | | 8.6 | | | | 63 319 | |
R214 (6.5%; 2041) | | | 12 974 | | | | 8.1 | | | | 45 991 | |
R2048 (8.75%; 2047/48/49) | | | 19 487 | | | | 8.5 | | | | 19 500 | |
Retail | | | 3 146 | | | | 6.9 | | | | 11 113 | |
Inflation-linked2 | | | 33 113 | | | | 1.9 | | | | | |
R211 (2.5%; 2017) | | | 1 438 | | | | 0.7 | | | | 24 044 | |
R212 (2.75%; 2022) | | | 5 171 | | | | 1.6 | | | | 31 128 | |
I2025 (2.0%; 2025) | | | 4 160 | | | | 1.5 | | | | 4 029 | |
R210 (2.6%; 2028) | | | 4 372 | | | | 2.4 | | | | 36 869 | |
R202 (3.45%; 2033) | | | 1 938 | | | | 2.4 | | | | 61 158 | |
I2038 (2.25%; 2038) | | | 7 442 | | | | 2.0 | | | | 7 278 | |
I2050 (2.5%; 2049/50/51) | | | 8 521 | | | | 2.1 | | | | 7 830 | |
Retail | | | 71 | | | | 1.5 | | | | 250 | |
| | | | | | | | | | | | |
Total | | | 147 859 | | | | | | | | | |
| | | | | | | | | | | | |
| 1. | Includes non-competitive auction allocations of R19.5 billion |
| 2. | Outstanding value is revalued using the relevant reference consumer price index |
| | |
| Government will continue to hold competitive auctions in domestic fixed-rate bonds, followed by non-competitive auctions to broaden participation. | | |
| |
| Five new bonds will be introduced in 2013/14, as shown in Table 5.7. | | |
Table 5.7 New domestic government bonds, 2013/14
| | | | | | | | | | |
Fixed-rate | | | Inflation-linked | |
Bond code | | Maturity date | | | Bond code | | Maturity date | |
R2030 | | | 31 January 2030 | | | I2046 | | | 31 March 2046 | |
R2032 | | | 31 March 2032 | | | | | | | |
R2037 | | | 31 January 2037 | | | | | | | |
R20441 | | | 31 January 2043 | | | | | | | |
| | | 31 January 2044 | | | | | | | |
| | | 31 January 2045 | | | | | | | |
| 1. | Bond with a maturity value split equally over three years |
Government bond auctions
Domestic bonds are sold in weekly auctions. Both fixed-rate and inflation-linked bond auctions start with competitive bidding, where bidders offer to buy specific amounts at a specific yield or rate. The auction is settled on the basis of highest yield and available amount, with the highest rate accepted for all successful bidders. The fixed-rate competitive bid auction is followed by a non-competitive bid auction, which gives successful bidders a 48-hour option of taking up an additional 30 per cent of their competitive bid auction allocations at the same yield.
71
2013 BUDGET REVIEW
| | |
| | An important part of the debt strategy is managing refinancing risk – the risk that government will not be able to raise the money to repay debt at any scheduled redemption point, or will have to do so at very high cost. To manage this risk and improve liquidity, government will continue to issue bonds with the maturity split over three years – and introduce new bonds along the existing curve, extending the curve when required. |
| |
| Switch programme reduces refinancing risk | | Government’s bond-switch programme mitigates refinancing risk by switching short-term for longer-term debt. In 2012/13, domestic loan redemptions for 2013/14 and 2014/15 were reduced by R37.4 billion, as shown in Table 5.8. Switch auctions in 2013/14 will reduce 2014/15 loan redemptions by a further R11.9 billion. Government also plans to increase cash balances to meet redemptions beyond the medium term, reducing dependence on switches. |
| |
| | Government will also work to ensure a smooth schedule of repayments over the long term that avoids sharp swings in redemptions. |
| |
| | Table 5.8 Domestic bond switch programme, 2012/13 |
| | | | | | | | | | |
As of 31 January 2013 R million | | Source bonds | | | | | Destination bonds1 | |
R206 (7.50%; 2014) | | | 15 335 | | | R157 (13.5%; 2014/15/16) | | | 8 711 | |
| | | | | | R186 (10.5%; 2025/26/27) | | | 4 363 | |
R201 (8.75%; 2014) | | | 22 072 | | | R208 (6.75%; 2021) | | | 1 894 | |
| | | | | | R2023 (7.75%; 2023) | | | 366 | |
| | | | | | R186 (10.5%; 2025/26/27) | | | 13 448 | |
| | | | | | R213 (7.0%; 2031) | | | 2 131 | |
| | | | | | R209 (6.25%; 2036) | | | 478 | |
| | | | | | R214 (6.5%; 2041) | | | 2 169 | |
| | | | | | | | | | |
Total | | | 37 407 | | | Total | | | 33 560 | |
| | | | | | | | | | |
| | |
| | 1. Excludes discount on destination bonds |
| |
| A total of R11.4 billion is invested in retail savings bonds | | Since they were launched in 2004, government’s retail bonds have helped to promote household savings and finance the borrowing requirement. During 2012/13, investments in retail bonds amounted to R3.2 billion, of which R1.3 billion were reinvestments of maturing bonds and capitalised interest. A total of R11.4 billion is currently invested in these bonds. More retail bond products are under consideration to cater for younger savers and to allow for regular deposits into existing investments. |
| |
| | Foreign borrowing |
| |
| To diversify funding options, government is preparing to enter the sukuk market | | Over the medium term, government intends to borrow about US$1.5 billion a year in global markets to maintain benchmarks in major currencies and meet part of its foreign currency commitments. To diversify funding options, government is preparing to enter the sukuk (Islamic bond) market and is identifying assets to structure these certificates. |
| |
| | The final drawdown on the arms procurement loan agreements took place in 2012/13. |
| |
| | Cash balances |
| |
| | Table 5.9 shows the projected change in cash balances over the medium term. Government’s total cash consists of deposits in rands and in other currencies held with commercial banks and the Reserve Bank. |
72
CHAPTER 5: ASSET AND LIABILITY MANAGEMENT
Table 5.9 Change in cash balances, 2011/12 – 2015/16
| | | | | | | | | | | | | | | | | | | | | | | | |
| | | 2011/12 | | | 2012/13 | | | 2013/14 | | | 2014/15 | | | 2015/16 | |
R million | | Outcome | | | Budget | | | Revised | | | Medium-term estimates | |
Rand currency | | | | | | | | | | | | | | | | | | | | | | | | |
Opening balance | | | 111 413 | | | | 129 425 | | | | 130 450 | | | | 100 041 | | | | 102 657 | | | | 97 157 | |
Used for domestic funding | | | 21 481 | | | | -13 013 | | | | -10 706 | | | | 2 616 | | | | 2 685 | | | | 23 000 | |
Foreign exchange purchases1 | | | -2 444 | | | | -7 352 | | | | -19 703 | | | | — | | | | -8 185 | | | | — | |
Closing balance | | | 130 450 | | | | 109 060 | | | | 100 041 | | | | 102 657 | | | | 97 157 | | | | 120 157 | |
| of which: | | | | | | | | | | | | | | | | | | | | | | | | |
Tax and loan accounts | | | 63 293 | | | | 41 903 | | | | 32 884 | | | | 35 500 | | | | 30 000 | | | | 53 000 | |
Sterilisation deposits 2 | | | 67 157 | | | | 67 157 | | | | 67 157 | | | | 67 157 | | | | 67 157 | | | | 67 157 | |
Change in rand cash balance3 (opening less closing balance) | | | -19 037 | | | | 20 365 | | | | 30 409 | | | | -2 616 | | | | 5 500 | | | | -23 000 | |
| | | | | | | | | | | | | | | | | | | | | | | | |
Foreign currency4 | | | | | | | | | | | | | | | | | | | | | | | | |
Opening balance | | | 62 143 | | | | 65 287 | | | | 64 376 | | | | 68 057 | | | | 54 169 | | | | 54 267 | |
Foreign exchange purchases1 | | | 2 444 | | | | 7 352 | | | | 19 703 | | | | — | | | | 8 185 | | | | — | |
Interest on foreign exchange balances | | | 995 | | | | 1 000 | | | | 1 006 | | | | 1 000 | | | | 998 | | | | 1 000 | |
International borrowing | | | 12 594 | | | | 4 218 | | | | 4 251 | | | | 12 390 | | | | 12 435 | | | | 12 630 | |
Used for foreign funding | | | -13 800 | | | | -22 948 | | | | -21 279 | | | | -27 278 | | | | -21 520 | | | | -13 274 | |
Closing balance | | | 64 376 | | | | 54 909 | | | | 68 057 | | | | 54 169 | | | | 54 267 | | | | 54 623 | |
US$ equivalent | | | 8 804 | | | | 7 624 | | | | 9 236 | | | | 7 524 | | | | 7 536 | | | | 7 578 | |
Change in foreign currency cash balance3 (opening less closing balance) | | | -2 233 | | | | 10 378 | | | | -3 681 | | | | 13 888 | | | | -98 | | | | -356 | |
| | | | | | | | | | | | | | | | | | | | | | | | |
Total change in cash balances3 | | | -21 270 | | | | 30 743 | | | | 26 728 | | | | 11 272 | | | | 5 402 | | | | -23 356 | |
| | | | | | | | | | | | | | | | | | | | | | | | |
Total closing cash balance | | | 194 826 | | | | 163 969 | | | | 168 098 | | | | 156 826 | | | | 151 424 | | | | 174 780 | |
| | | | | | | | | | | | | | | | | | | | | | | | |
| 1. | Foreign currency purchased in the spot market and obtained from the settlement of forward exchange contracts entered into by the Reserve Bank to sterilise sizable foreign direct investment flows |
| 2. | Deposits made with the Reserve Bank to increase the level of official foreign exchange reserves |
| 3. | A negative value indicates an increase in cash balances and a positive value indicates that cash is used to finance part of the borrowing requirement |
| 4. | Rand values at which foreign currency was purchased or borrowed |
| | |
| Foreign exchange deposits held by the Reserve Bank are made from money borrowed in global markets and from purchases of foreign currency in the local market. | | |
| |
| Total cash with the Reserve Bank and commercial banks reached a high of R194.8 billion in 2011/12. Cash balances are projected to decline to R151.4 billion in 2014/15 as cash is used to finance part of the gross borrowing requirement. In 2015/16, cash balances will increase to R174.8 billion to provide for large redemptions beyond the medium term. Of government’s total cash balances, R121 billion are deposits made with the Reserve Bank to increase the level of official foreign exchange reserves and are not available to finance government expenditure. | | Some cash will be used to finance part of the gross borrowing requirement |
| |
| ¢ Debt-service costs | | |
| |
| The costs of servicing government debt are influenced by the volume of debt, new borrowing and market variables such as interest, inflation and exchange rates. Table 5.10 summarises trends and projections to 2015/16. Debt-service costs as a percentage of GDP are expected to stabilise in 2012/13. | | Debt-service costs as a percentage of GDP are set to stabilise in 2012/13 |
73
2013 BUDGET REVIEW
Table 5.10 National government debt-service costs, 2011/12 – 2015/16
| | | | | | | | | | | | | | | | | | | | | | | | |
| | | 2011/12 | | | 2012/13 | | | 2013/14 | | | 2014/15 | | | 2015/16 | |
R million | | Outcome | | | Budget | | | Revised | | | Medium-term estimates | |
Domestic loans | | | 70 478 | | | | 82 563 | | | | 81 471 | | | | 92 596 | | | | 102 340 | | | | 111 525 | |
Short-term | | | 12 764 | | | | 10 864 | | | | 9 722 | | | | 10 971 | | | | 12 121 | | | | 13 321 | |
Long-term | | | 57 714 | | | | 71 699 | | | | 71 749 | | | | 81 625 | | | | 90 219 | | | | 98 204 | |
Foreign loans | | | 5 982 | | | | 6 825 | | | | 6 854 | | | | 7 145 | | | | 6 378 | | | | 6 638 | |
| | | | | | | | | | | | | | | | | | | | | | | | |
Total | | | 76 460 | | | | 89 388 | | | | 88 325 | | | | 99 741 | | | | 108 718 | | | | 118 163 | |
| | | | | | | | | | | | | | | | | | | | | | | | |
As percentage of: | | | | | | | | | | | | | | | | | | | | | | | | |
GDP | | | 2.6 | | | | 2.7 | | | | 2.8 | | | | 2.8 | | | | 2.8 | | | | 2.8 | |
Expenditure | | | 8.6 | | | | 10.0 | | | | 9.1 | | | | 9.5 | | | | 9.6 | | | | 9.6 | |
Revenue | | | 10.3 | | | | 12.2 | | | | 11.3 | | | | 11.4 | | | | 11.2 | | | | 11.0 | |
| | |
| | ¢ Government’s debt portfolio |
| |
| | Total loan debt |
| |
| | Net loan debt consists of total domestic and foreign debt, less cash balances. Net loan debt is expected to be R1.2 trillion by the end of 2012/13, or 36.3 per cent of GDP, increasing to 40.3 per cent of GDP in 2015/16. |
Table 5.11 Total national government debt,1 2009/10 – 2015/16
| | | | | | | | | | | | | | | | | | | | | | | | | | | | |
| | | 2009/10 | | | 2010/11 | | | 2011/12 | | | 2012/13 | | | 2013/14 | | | 2014/15 | | | 2015/16 | |
R billion | | Outcome | | | Estimate | | | Medium-term estimates | |
Total gross loan debt2 | | | 805.0 | | | | 990.6 | | | | 1 187.8 | | | | 1 342.5 | | | | 1 522.1 | | | | 1 704.1 | | | | 1 903.8 | |
Total net loan debt3 | | | 673.1 | | | | 820.4 | | | | 989.7 | | | | 1 165.1 | | | | 1 357.3 | | | | 1 544.5 | | | | 1 719.8 | |
| | | | | | | | | | | | | | | | | | | | | | | | | | | | |
As percentage of GDP: | | | | | | | | | | | | | | | | | | | | | | | | | | | | |
Total gross loan debt | | | 32.8 | | | | 36.2 | | | | 39.9 | | | | 41.8 | | | | 43.2 | | | | 43.9 | | | | 44.6 | |
Total net loan debt | | | 27.4 | | | | 30.0 | | | | 33.3 | | | | 36.3 | | | | 38.6 | | | | 39.8 | | | | 40.3 | |
Foreign debt as percentage of: | | | | | | | | | | | | | | | | | | | | | | | | | | | | |
Gross loan debt | | | 12.4 | | | | 9.9 | | | | 9.8 | | | | 8.7 | | | | 7.4 | | | | 6.7 | | | | 6.7 | |
Net loan debt | | | 11.0 | | | | 4.8 | | | | 5.0 | | | | 3.5 | | | | 3.7 | | | | 3.3 | | | | 3.6 | |
| 1. | A longer time series is presented in Table 9 of Annexure B |
| 2. | Forward estimates are based on projections of exchange and inflation rates |
| 3. | Net loan debt is calculated with due account of the cash balances of the National Revenue Fund (cash balances of government’s accounts with the Reserve Bank and commercial banks) |
| | |
| | Composition of government loan debt |
| |
| Average term-to-maturity of government bonds to reach 11.7 years in 2012/13 | | The average term-to-maturity of government bonds – the time remaining until a bond is repaid – is expected to increase marginally from 11.1 years in 2011/12 to 11.7 years in 2012/13. The longer the average term to maturity, the lower the refinancing risk. The non-fixed rate debt component of the domestic portfolio will increase from 29.6 per cent in 2008/09 to 35.5 per cent in 2012/13. Over time, government will return the domestic debt portfolio to the current risk benchmark of 70/30 fixed-rate versus non-fixed rate debt. |
| |
| | Government’s exposure to loans raised in the international market will be 8.7 per cent of total debt in 2012/13, well below the 20-25 per cent risk limit established by the National Treasury. |
74
CHAPTER 5: ASSET AND LIABILITY MANAGEMENT
Provisions and contingent liabilities
| | |
| Projections for provisions and contingent liabilities are shown in Table 5.12. Provisions are liabilities for which the payment date or amount is uncertain. Contingent liabilities are obligations, such as government guarantees, that only result in expenditure when a specific event occurs. | | |
| |
| As at 31 March 2013, net loan debt, provisions and contingent liabilities are expected to amount to 51.3 per cent of GDP, and are projected to reach 53.4 per cent of GDP by 31 March 2015, before falling to 52.8 per cent in 2015/16. This remains below the Southern African Development Community’s macroeconomic convergence target of 60 per cent of GDP. | | Net loan debt, provisions and contingent liabilities remain well below the SADC macroeconomic convergence target |
Table 5.12 Composition of provisions and contingent liabilities,1 2011/12 – 2015/16
| | | | | | | | | | | | | | | | | | | | |
| End of period | | 2011/12 | | | 2012/13 | | | 2013/14 | | | 2014/15 | | | 2015/16 | |
R billion | | Outcome | | | Estimate | | | Medium-term estimates | |
Net loan debt | | | 989.7 | | | | 1 165.1 | | | | 1 357.3 | | | | 1 544.5 | | | | 1 719.8 | |
Provisions | | | 98.6 | | | | 106.4 | | | | 117.0 | | | | 117.9 | | | | 120.1 | |
International Monetary Fund2 | | | 43.4 | | | | 46.9 | | | | 57.5 | | | | 57.7 | | | | 58.6 | |
International Bank for Reconstruction and Development2 | | | 11.7 | | | | 12.8 | | | | 12.6 | | | | 12.6 | | | | 12.8 | |
Multilateral Investment Guarantee Agency2 | | | 0.1 | | | | 0.1 | | | | 0.1 | | | | 0.1 | | | | 0.1 | |
African Development Bank2 | | | 27.3 | | | | 29.8 | | | | 29.4 | | | | 29.5 | | | | 30.0 | |
Development Bank of Southern Africa Limited3 | | | 4.8 | | | | 4.8 | | | | 4.8 | | | | 4.8 | | | | 4.8 | |
Government employee leave credits | | | 11.3 | | | | 12.0 | | | | 12.6 | | | | 13.2 | | | | 13.8 | |
Contingent liabilities | | | 335.4 | | | | 373.2 | | | | 399.0 | | | | 409.1 | | | | 413.3 | |
Guarantees | | | 153.9 | | | | 182.9 | | | | 207.7 | | | | 218.8 | | | | 225.8 | |
Post-retirement medical assistance | | | 65.3 | | | | 65.3 | | | | 65.3 | | | | 65.3 | | | | 65.3 | |
Road Accident Fund | | | 53.9 | | | | 56.7 | | | | 56.7 | | | | 54.0 | | | | 50.7 | |
Government Employees Pension Fund | | | — | | | | — | | | | — | | | | — | | | | — | |
Claims against government departments | | | 43.0 | | | | 43.0 | | | | 43.0 | | | | 43.0 | | | | 43.0 | |
Export Credit Insurance Corporation of SA Limited | | | 10.0 | | | | 15.7 | | | | 16.1 | | | | 17.1 | | | | 16.8 | |
Unemployment Insurance Fund | | | 3.4 | | | | 3.7 | | | | 4.3 | | | | 5.0 | | | | 5.8 | |
Other4 | | | 5.9 | | | | 5.9 | | | | 5.9 | | | | 5.9 | | | | 5.9 | |
| | | | | | | | | | | | | | | | | | | | |
Total | | | 1 423.7 | | | | 1 644.7 | | | | 1 873.3 | | | | 2 071.5 | | | | 2 253.2 | |
| | | | | | | | | | | | | | | | | | | | |
Percentage of GDP | | | 47.9 | | | | 51.3 | | | | 53.2 | | | | 53.4 | | | | 52.8 | |
| | | | | | | | | | | | | | | | | | | | |
| 1. | Medium-term forecasts of some figures are not available and are kept constant |
| 2. | Represents the unpaid portion of government’s subscription to these institutions |
| 3. | Represents callable capital provided for in terms of the Development Bank of Southern Africa Act |
| 4. | Represents a liability to Reserve Bank for old coinage in circulation and other unconfirmed balances by departments |
| | |
| The major public entities that hold guarantees are shown in Table 5.13. Details of guarantee commitments are set out in Table 10 of Annexure B. Fees of R40.1 million were received in 2012/13 on these guarantees. | | |
| |
Table 5.13 Guarantee exposure to major state-owned companies and development finance institutions,1 2011/12 – 2012/13 | | |
| | | | | | | | | | | | | | | | |
| Institution | | 2011/12 | | | 2012/13 | |
R billion | | Guarantee | | | Exposure2 | | | Guarantee | | | Exposure2 | |
Total | | | 464.2 | | | | 153.9 | | | | 470.8 | | | | 182.9 | |
of which: | | | | | | | | | | | | | | | | |
Eskom | | | 350.0 | | | | 77.2 | | | | 350.0 | | | | 103.5 | |
SANRAL | | | 40.0 | | | | 19.4 | | | | 40.0 | | | | 19.4 | |
Development Bank of Southern Africa | | | 28.9 | | | | 25.7 | | | | 28.9 | | | | 25.7 | |
Trans-Caledon Tunnel Authority | | | 25.5 | | | | 19.9 | | | | 25.5 | | | | 19.9 | |
South African Airways | | | 2.9 | | | | 1.3 | | | | 7.9 | | | | 2.9 | |
Transnet | | | 3.5 | | | | 4.0 | | | | 3.5 | | | | 3.8 | |
Land Bank | | | 3.6 | | | | 1.1 | | | | 4.6 | | | | 1.9 | |
| 1. | A longer time series is presented in Table 10 of Annexure B |
| 2. | Includes accrued interest |
75
2013 BUDGET REVIEW
Monitoring guarantees to state-owned companies
The National Treasury monitors the status of contingent liabilities. Requests for guarantees by state-owned companies are subject to thorough risk assessment, both for the individual entity and to assess the impact on the overall guarantee portfolio. Where a guarantee is issued, the National Treasury works with other departments to monitor the financial commitments of the company and to take action where necessary. All state-owned companies are required to adhere strictly to the guarantee conditions. The risk associated with the overall guarantee portfolio remains moderate.
| | |
| New guarantees in 2012/13 totalled R6.5 billion | | During 2012/13, government issued new guarantees totalling R6.5 billion: |
| | • South African Airways (SAA) received an additional R5 billion, two-year guarantee for its going-concern and liquidity requirements, which enabled its board of directors to sign off on the carrier’s 2011/12 annual financial statements. |
| | • South African Express (SAX) has been granted a R539 million two-year guarantee to enable the company to raise funding pending the finalisation of its restated annual financial statements. |
| |
| | • The Land Bank received an additional guarantee of R1 billion for a loan from the African Development Bank to support small farmers. |
| |
| | Denel’s three guarantees were consolidated into a single guarantee of R1.9 billion for administrative purposes and renewed for five years, enabling the company to take advantage of low interest rates by issuing longer-term debt. |
| |
| SAA, SAX and Denel are required to report each month to a monitoring team | | SAA, SAX and Denel are required to report each month to a monitoring team and to deliver turnaround strategies with associated funding plans, which must be approved by government. |
| |
| | ¢ State-owned companies |
| |
| | Capital expenditure and financial plans |
| |
| | Over the medium term, capital expenditure by state-owned companies is projected at R377.5 billion. The majority of this investment will take place in energy and transport (Eskom and Transnet account for 87 per cent of this amount) and in the water sector. |
Table 5.14 Major state-owned companies’ capital expenditure programmes, 2011/12 – 2015/16
| | | | | | | | | | | | | | | | | | | | | | | | |
| | | 2011/12 | | | 2012/13 | | | 2013/14 | | | 2014/15 | | | 2015/16 | |
R billion | | Outcome | | | Budget | | | Revised | | | Medium-term estimate | |
Capital expenditure | | | 92.6 | | | | 137.6 | | | | 108.2 | | | | 125.3 | | | | 123.5 | | | | 128.7 | |
Of which: | | | | | | | | | | | | | | | | | | | | | | | | |
Eskom | | | 58.8 | | | | 64.9 | | | | 59.9 | | | | 72.1 | | | | 68.0 | | | | 64.9 | |
Transnet | | | 21.8 | | | | 31.2 | | | | 29.7 | | | | 37.3 | | | | 38.8 | | | | 48.0 | |
Central Energy Fund | | | 1.2 | | | | 23.3 | | | | 4.8 | | | | 3.7 | | | | 2.0 | | | | 0.4 | |
SANRAL | | | 8.2 | | | | 8.9 | | | | 9.6 | | | | 8.3 | | | | 9.5 | | | | 11.6 | |
Trans-Caledon Tunnel Authority | | | 1.2 | | | | 3.6 | | | | 1.5 | | | | 1.2 | | | | 3.1 | | | | 1.9 | |
| | |
| | In delivering on their infrastructure commitments, state-owned companies improved their performance, spending R92.6 billion of a budgeted R131.7 billion (70 per cent) in 2011/12, compared with R82 billion of a budgeted R132 billion (62.1 per cent) in the prior year. The shortfall against budget, however, was substantial, resulting largely from procurement and project implementation delays. |
76
CHAPTER 5: ASSET AND LIABILITY MANAGEMENT
| | |
| Over the next three years, 43 per cent of the funding required for infrastructure development by state-owned companies is expected to be raised in the debt markets, with the remainder coming from internally generated cash. Funding has also been diversified to reduce borrowing costs. State-owned companies are benefiting from concessional funding opportunities presented by multilateral financial institutions such as the African Development Bank, Agence Française de Développement and Kreditanstalt für Wiederaufbau. | | Large share of state-owned companies’ infrastructure investments to be funded from debt markets |
Table 5.15 Funding sources for state-owned companies, 2011/12 – 2015/16
| | | | | | | | | | | | | | | | | | | | | | | | |
| | | 2011/12 | | | 2012/13 | | | 2013/14 | | | 2014/15 | | | 2015/16 | |
R billion | | Outcome | | | Budget | | | Revised | | | Medium-term estimates | |
Domestic loans (gross) | | | 31.5 | | | | 30.1 | | | | 36.7 | | | | 40.5 | | | | 35.0 | | | | 36.4 | |
Short-term | | | 11.3 | | | | 9.5 | | | | 13.1 | | | | 18.9 | | | | 12.0 | | | | 12.7 | |
Long-term | | | 20.2 | | | | 20.6 | | | | 23.6 | | | | 21.6 | | | | 23.0 | | | | 23.7 | |
Foreign loans (gross) | | | 17.1 | | | | 41.2 | | | | 35.4 | | | | 21.0 | | | | 14.1 | | | | 13.6 | |
Long-term | | | 17.1 | | | | 41.2 | | | | 35.4 | | | | 21.0 | | | | 14.1 | | | | 13.6 | |
of which: | | | | | | | | | | | | | | | | | | | | | | | | |
Multilateral institutions | | | 8.9 | | | | 19.3 | | | | 15.0 | | | | 13.2 | | | | 10.5 | | | | 9.8 | |
Export credit agency financing | | | 8.0 | | | | 12.9 | | | | 9.7 | | | | 5.8 | | | | 3.6 | | | | 3.8 | |
| | | | | | | | | | | | | | | | | | | | | | | | |
Total | | | 48.6 | | | | 71.3 | | | | 72.1 | | | | 61.5 | | | | 49.1 | | | | 50.0 | |
| | | | | | | | | | | | | | | | | | | | | | | | |
As percentage of total: | | | | | | | | | | | | | | | | | | | | | | | | |
Domestic loans | | | 64.8 | | | | 42.2 | | | | 50.9 | | | | 65.9 | | | | 71.3 | | | | 72.8 | |
Foreign loans | | | 35.2 | | | | 57.8 | | | | 49.1 | | | | 34.1 | | | | 28.7 | | | | 27.2 | |
| | |
| To sustain their infrastructure plans, state-owned companies need strong balance sheets. Government is reviewing its holdings of these entities to direct capital to investment priorities. It will also be necessary to forge strategic partnerships with private firms to co-invest and bring technical expertise to large public infrastructure projects. An example of this approach has been the renewable energy independent power producer programme, which attracted R46.6 billion worth of investments from the private sector in 2012/13. | | |
| |
| Large-scale capital investments have led to a steady increase in the asset base of state-owned companies, from R382.5 billion in 2007/08 to R707 billion at the end of 2011/12. Eskom and Transnet collectively account for about 79 per cent of the total net asset value. In 2011/12, the average return on equity improved to 9.3 per cent from 6.7 per cent in the prior year. | | Asset base of state-owned companies reached R707 billion in 2011/12 |
Table 5.16 Consolidated balance sheets of state-owned companies,1 2007/08 – 2011/12
| | | | | | | | | | | | | | | | | | | | |
R billion | | 2007/08 | | | 2008/09 | | | 2009/10 | | | 2010/11 | | | 2011/12 | |
Total assets | | | 382.5 | | | | 450.1 | | | | 517.8 | | | | 639.4 | | | | 707.0 | |
% growth in assets | | | 22.0 | % | | | 17.7 | % | | | 15.0 | % | | | 23.5 | % | | | 10.7 | % |
Total liabilities | | | 229.0 | | | | 290.6 | | | | 341.6 | | | | 422.9 | | | | 469.7 | |
% growth in total liabilities | | | 22.0 | % | | | 26.9 | % | | | 17.6 | % | | | 23.8 | % | | | 11.1 | % |
Net asset value | | | 153.5 | | | | 159.5 | | | | 176.2 | | | | 216.5 | | | | 237.3 | |
% growth in asset value | | | 22.0 | % | | | 3.9 | % | | | 10.5 | % | | | 22.9 | % | | | 9.6 | % |
Return on equity | | | 4.7 | % | | | -4.0 | % | | | 3.8 | % | | | 6.7 | % | | | 9.3 | % |
| 1. | Major state-owned companies listed in Schedule 2 of the PFMA |
77
2013 BUDGET REVIEW
| | |
| During 2011/12, Airports Company and Eskom recorded profits, but SAA, Alexkor and Armscor lost money | | In 2011/12 the Airports Company of South Africa (ACSA), Eskom, and Air Traffic and Navigation Services registered returns in excess of 10 per cent. SAA, Alexkor and Armscor lost money. Reasons for the poor performance of these three companies included policy uncertainty, costs associated with non-commercial activities, operational inefficiencies, management instability, and lack of adequate coordination between boards and the shareholder. In the case of SAA, fundamental changes in the global airline industry also played a role. |
| |
| | Over time, the equity of entities that persistently lose money is gradually eroded, which eventually requires that they be recapitalised. Over the next year, government will work with SAA, SAX, Denel, the South African Broadcasting Corporation and the South African Post Office to develop sustainable long-term strategies, which may include some form of restructuring. |
| |
| | Government will also review the developmental activities carried out by state-owned companies. Where such activities are mandated, they should be funded sustainably through explicit fiscal allocations, transparent cross-subsidies from other users or by government accepting a lower return on equity than would be expected if they were operating on commercial principles. |
| Reforms to improve regulation and operation of public infrastructure and draw in private capital | | Government is working on a series of reforms to improve regulation and operation of public infrastructure and facilitate greater private-sector participation: |
| |
| | • Parliament is considering the Independent System and Market Operator Bill to establish an independent procurer of electricity. |
| |
| | • A single transport economic regulator is to be established, encompassing regulation of ports, aviation, rail and possibly roads. |
| |
| | • The review of the national broadband policy will clarify the roles of the public and private sectors in rolling out broadband infrastructure. During 2013/14, government will finalise the strategy and implementation plan. |
| |
| | • Government will review the Integrated Resources Plan 2010, assessing the trade-offs to be considered between nuclear and other technologies. |
| |
| | ¢ Development finance institutions |
| |
| Aggregate assets of development finance institutions reached R201.5 billion in 2012 | | Aggregate assets of development finance institutions at 31 March 2012 amounted to R201.5 billion, of which the Industrial Development Corporation (IDC) holds 56 per cent (R112.2 billion), the Development Bank of Southern Africa (DBSA) 26 per cent (R52.3 billion) and the Land Bank 13 per cent (R25.4 billion). Growth in the asset base has enabled these institutions to borrow against their balance sheets to extend loans to the value of R81.1 billion. |
| |
| A balance is needed between sustainable lending and non-revenue-generating activities | | Development finance institutions are expected to maintain financial sustainability, and care has to be taken to balance sustainable lending and non-revenue-generating activities. Over the next three years, these institutions will concentrate on financing infrastructure and industrial development, low-cost housing, rural development and land reform, small business growth and black economic empowerment enterprises, and regional development. |
78
CHAPTER 5: ASSET AND LIABILITY MANAGEMENT
| | |
| Development Bank of Southern Africa | | |
| |
| The DBSA’s mandate is to provide financial and technical support for infrastructure to extend basic service delivery among municipalities and promote economic growth in South Africa and the region. The bank is restructuring to reduce costs, increase efficiency and sharpen focus on its core mandate. Support to government departments will be undertaken strictly on a cost-recovery basis. | | DBSA is recapitalised by R7.9 billion over medium term |
| |
| After a profit of R29.4 million in 2010/11, the DBSA reported a net loss of R371 million for 2011/12. The loss stemmed mainly from revaluation of equity investments, which led to unrealised losses. The bank disbursed loans of R8.1 billion, of which R4.9 billion were in South Africa and R3.2 billion in the southern African region. | | |
| |
| The bank will be recapitalised by R7.9 billion over the medium term. This recapitalisation will support the DBSA’s refocused mandate on core infrastructure, with increased lending to municipalities, state-owned companies, regional lending and public-private partnerships. Rebuilding of the bank’s capital base will allow it to increase loan disbursements from R8.1 billion to R21 billion per year. | | |
| |
| Land Bank | | |
| |
| The Land Bank’s profits declined by 34 per cent from R284.6 million in 2010/11 to R187.2 million in 2011/12. Over the same period, the performing loan book grew by 54.4 per cent to R21 billion, and non-performing loans decreased by 15 per cent to R1.4 billion as the bank increased collections and improved operational efficiency. The Land Bank has stepped up its developmental assistance by establishing a dedicated division for emerging farmers, which approved loans worth R112 million to 260 farmers between April and December 2012. | | Land Bank recorded profit of R187.2 million in 2011/12 and is stepping up developmental loans |
| |
| Industrial Development Corporation | | |
| |
| The IDC’s mandate is to promote and finance industrial projects in South Africa and the African continent. During 2011/12, the IDC made a profit of R3.3 billion – a 22 per cent increase from the prior year, largely as a result of increased dividend income and gains from the disposal of mature investments. | | IDC recorded a R3.3 billion profit in 2011/12 and has approved R31.6 billion in funding over past three years |
| |
| A resilient balance sheet enabled the IDC to approve a net R31.6 billion funding in the form of loans and equity over the past three years. This funding supported the objectives of the New Growth Path and the Industrial Policy Action Plan. | | |
| |
| Human settlement institutions | | |
| |
| The Department of Human Settlements is rationalising the three housing institutions to improve efficiency and effectiveness. During 2012/13, government capitalised the National Urban Reconstruction and Housing Agency to the value of R100 million, and the Rural Housing Loan Fund to the value of R51.9 million, to expand their capacity to support subsidised housing. | | |
79
2013 BUDGET REVIEW
| | |
| | Since inception, the Rural Housing Loan Fund has distributed 197 291 loans worth about R1 billion through its intermediary network. The National Urban Reconstruction and Housing Agency has distributed 1 348 loans to the value of R2.3 billion for 265 000 completed houses. Since 2008, the National Housing Finance Corporation has disbursed R664 million. |
| |
| | ¢ Conclusion |
| |
| | Government’s debt management strategies will ensure that the borrowing requirement is financed at the lowest possible cost, while minimising repayment risk. The strategy complements the fiscal guidelines, which emphasise long-term debt sustainability. Government will continue to support state-owned companies and, through prudent financial oversight, ensure that they remain financially sound and contribute to the rollout of economic infrastructure. |
80
6
Social security and the social wage
In brief
| | • | | The National Development Plan (NDP) recognises that reducing the cost of living is essential for broadening economic participation and eliminating poverty. Alongside the “economic wage” earned through work, the “social wage” provided by government represents a steadily rising contribution to improved living conditions of working people and their families. |
| | • | | Spending on social development, health, education, housing and local amenities has more than doubled in real terms over the past decade and now accounts for almost 60 per cent of public expenditure. In the fiscally constrained period ahead, the emphasis will need to be on improved value for money. |
| | • | | Social assistance provides a safety net for the most vulnerable and will contribute to the monthly incomes of over 16 million people in 2013. |
| | • | | Social development spending has improved living conditions over the past decade, but service delivery must be improved through shared efforts between government, the private sector and civil society. |
| | • | | Further steps in retirement reform, improvements in contributory social insurance and piloting of national health insurance reforms will progress over the medium term, reinforcing the links between earnings, social services and income support. |
| | |
| The state’s contribution to poverty reduction and social development is substantial and wide-ranging. As emphasised in the NDP, reducing the cost of living for low-income and working-class households is essential for broadening economic participation and inclusive growth. | | Social expenditure lowers the cost of living for poor and working-class households |
| |
| Government contributes to reducing the cost of living in three ways: | | |
| |
• Investment in the social wage, comprising education, health services, social development, public transport, housing and local amenities. | | |
81
2013 BUDGET REVIEW
| | |
| |
| | • Support to vulnerable households through the old age grant, the child support grant and other social assistance grants. |
| |
| | • Contributory social security, including unemployment insurance, injury compensation and death or disability benefits. |
| |
| | The social wage and economic growth |
| |
| Faster growth is needed because the fiscus cannot carry the entire burden of social development | | Decent work is about both earned income and the living conditions of working people. Employment and productivity advances can be reinforced by improvements in education, health care, housing and other services. These, in turn, will have greater impact on reducing poverty and inequality if accompanied by more rapid job creation and enterprise development. South Africa’s medium-term fiscal constraints underline the need for accelerated growth, because the fiscus cannot carry the entire burden of social development. |
| |
| | South Africa confronts high levels of poverty and inequality. Figure 6.1 shows the distribution of individual earnings across the working population, indicating that over 60 per cent of working people earn less than the tax threshold of about R5 000 a month. |
| |
| | Figure 6.1 also shows the principal means tests associated with different public services. Parents or caregivers earning less than R2 800 per month are eligible for the child support grant, which pays R280 per month for each child they are looking after. Some of these tests apply to households: where a household earns less than R3 500 per month, it qualifies for a housing subsidy currently worth R84 000. |
| |
| | Figure 6.1 Means tests and the distribution of income |
| |
| | 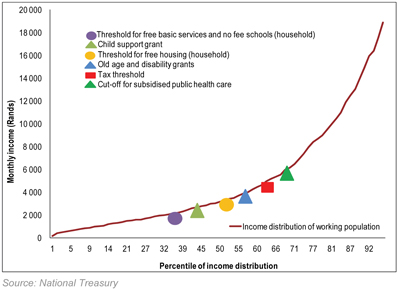
|
| |
| Improving quality and reach of education, health, housing and services is central to social development | | This illustration shows how the thresholds for social assistance, housing and free health care accommodate a substantial proportion of the population. Improving the quality and reach of education, public health, housing, municipal amenities and welfare services is therefore central to reducing poverty and improving the living conditions of working people and their families. |
82
CHAPTER 6: SOCIAL SECURITY AND THE SOCIAL WAGE
| | |
| Expanding opportunities for work and improving earnings are also essential. South Africa’s human development challenge and the goals of the NDP are addressed both through public investment in the social wage and expanded participation in employment and economic growth. | | |
| |
| Close to 60 per cent of government spending is allocated to the social wage. As Figure 6.2 shows, expenditure on these services has more than doubled in real terms over the past decade. As a percentage of GDP, spending on the social wage has risen from 13 per cent to 19 per cent over the same period. Social assistance pays an income directly to vulnerable households, while the other public services that make up the social wage replace or subsidise day-to-day expenses such as housing, education and amenities, reducing the cost of living. | | Social wage has more than doubled in real terms since 2002 |
| |
| Figure 6.2 Spending on the social wage, 2002/03 – 2012/13 | | |
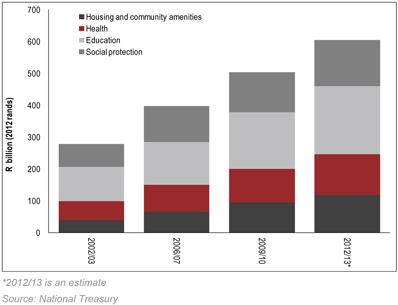
| | |
An expression of social solidarity | | |
| |
| The social wage achieves a redistribution of income and opportunities through the fiscus, partly because benefits are directed on the basis of need, and partly because costs are met through a progressively structured tax system.1 This gives practical expression, in South Africa’s circumstances, to the principle of social solidarity. | | Social wage achieves a progressive redistribution of income and opportunities through the fiscus |
| |
| Substantial growth in social spending over the past decade has financed a threefold increase in the number of people receiving social grants, a doubling in per capita health spending, the construction of 1.5 million free homes and the provision of free basic education to the poorest 60 per cent of learners. The impact is evident in improved living standards, expanded access to basic services and the changing urban/rural landscape. | | |
| 1 | Van der Berg, Servaas. 2009. Fiscal incidence of social spending in South Africa, 2006. Available at www.treasury.gov.za. |
83
2013 BUDGET REVIEW
| | |
| |
| | While access to services has expanded rapidly, there is much to be done to improve the management and effectiveness of social services, and to strengthen development coordination at local level between government, the private sector and civil society partners. There also has to be progressive growth in household income from productive economic activity. |
| |
| | This chapter provides an overview of social assistance and relief programmes supporting the unemployed and most vulnerable, and broader investment in social services aimed at improving living conditions for all. It summarises contributory social security arrangements and the status of retirement reform and national health insurance (NHI). |
| |
| | ¢ Social assistance and welfare services |
| |
| About 16 million people benefit from social grants, up from 2.5 million in 1998 | | The social assistance programme provides a regular income to South Africa’s most vulnerable households and is government’s most direct means of combating poverty. By the end of 2012/13, nearly 16.1 million people were beneficiaries of social grants, up from 2.5 million in 1998. Most of this increase relates to the expansion of the child support grant. |
| |
| | More than half of all households benefit from social assistance. For 22 per cent of households, social grants are the main source of income. Social grants are funded directly through the fiscus and will contribute R113 billion to the income of low-income households in 2013/14. Access to social grants has been broadened in recent years by raising the means test income thresholds. |
| |
| 11.4 million children benefit from child support grant | | The number of child support grant beneficiaries has risen from 5.7 million in 2004/05 to about 11.4 million as a result of the increase in the eligibility age to a child’s 18th birthday. An impact study conducted in 2012 found that receipt of this grant promotes early childhood development, improves educational outcomes, and contributes to better nutrition and health.2 |
| |
| | Table 6.1 Monthly social grant values, 2012/13 and 2013/14 |
| | | | | | | | | | | | |
Rand | | 2012/13 | | | 2013/14 | | | Increase | |
Old age grant | | | 1 200 | | | | 1 260 | | | | 5.0 | % |
Old age grant, over 75s | | | 1 220 | | | | 1 280 | | | | 4.9 | % |
War veterans grant | | | 1 220 | | | | 1 280 | | | | 4.9 | % |
Disability grant | | | 1 200 | | | | 1 260 | | | | 5.0 | % |
Foster care grant | | | 770 | | | | 800 | | | | 3.9 | % |
Care dependency grant | | | 1 200 | | | | 1 260 | | | | 5.0 | % |
Child support grant1 | | | 280 | | | | 290 | | | | 3.6 | % |
| | |
| | 1. Value will increase to R300 in October 2013 |
| |
| Adjustments for all grants compensate for effects of inflation | | Table 6.1 shows the adjustments for grants in 2013/14. The old age, war veterans, disability and care dependency grants will increase by R60. The foster care grant will increase by R30 and the child support grant by R10 in April and a further R10 in October 2013. |
| |
| | 2 Department of Social Development, South African Social Security Agency and United Nations Children’s Fund. 2012. The South African Child Support Grant Impact Assessment: Evidence from a survey of children, adolescents and their households. Pretoria: UNICEF South Africa. |
84
CHAPTER 6: SOCIAL SECURITY AND THE SOCIAL WAGE
| | |
| Table 6.2 shows beneficiary numbers by social grant and by province. Average annual growth in the number of grant recipients was 5.3 per cent over the four years to 2012/13, and is projected to moderate to 2.2 per cent a year over the period ahead. | | |
Table 6.2 Social grant beneficiary numbers by type and province, 2009/10 – 2015/16
| | | | | | | | | | | | | | | | | | | | | | | | | | | | | | | | |
| | | 2009/10 | | | 2010/11 | | | 2011/12 | | | 2012/131 | | | 2013/14 | | | 2014/15 | | | 2015/16 | | | Average | |
Thousands | | Actual | | | Revised
estimate | | | Projected | | | annual
growth
2009/10 –
2015/16 | |
Type of grant | | | | | | | | | | | | | | | | | | | | | | | | | | | | | | | | |
Old age2 | | | 2 491 | | | | 2 648 | | | | 2 711 | | | | 2 851 | | | | 2 931 | | | | 3 013 | | | | 3 096 | | | | 3.7 | % |
Disability | | | 1 299 | | | | 1 212 | | | | 1 172 | | | | 1 179 | | | | 1 180 | | | | 1 181 | | | | 1 181 | | | | -1.6 | % |
Foster care | | | 489 | | | | 490 | | | | 518 | | | | 529 | | | | 569 | | | | 604 | | | | 633 | | | | 4.4 | % |
Care dependency | | | 119 | | | | 121 | | | | 122 | | | | 130 | | | | 135 | | | | 140 | | | | 146 | | | | 3.4 | % |
Child support | | | 9 381 | | | | 10 154 | | | | 10 675 | | | | 11 406 | | | | 11 699 | | | | 11 937 | | | | 12 116 | | | | 4.4 | % |
| | | | | | | | | | | | | | | | | | | | | | | | | | | | | | | | |
Total | | | 13 779 | | | | 14 625 | | | | 15 198 | | | | 16 095 | | | | 16 514 | | | | 16 875 | | | | 17 172 | | | | 3.7 | % |
| | | | | | | | | | | | | | | | | | | | | | | | | | | | | | | | |
Province | | | | | | | | | | | | | | | | | | | | | | | | | | | | | | | | |
Eastern Cape | | | 2 416 | | | | 2 544 | | | | 2 613 | | | | 2 694 | | | | 2 753 | | | | 2 803 | | | | 2 844 | | | | 2.8 | % |
Free State | | | 806 | | | | 869 | | | | 900 | | | | 941 | | | | 961 | | | | 977 | | | | 992 | | | | 3.5 | % |
Gauteng | | | 1 702 | | | | 1 815 | | | | 1 909 | | | | 2 189 | | | | 2 250 | | | | 2 304 | | | | 2 352 | | | | 5.5 | % |
KwaZulu-Natal | | | 3 456 | | | | 3 633 | | | | 3 734 | | | | 3 879 | | | | 3 984 | | | | 4 074 | | | | 4 145 | | | | 3.1 | % |
Limpopo | | | 1 974 | | | | 2 100 | | | | 2 113 | | | | 2 135 | | | | 2 188 | | | | 2 232 | | | | 2 268 | | | | 2.3 | % |
Mpumalanga | | | 1 009 | | | | 1 069 | | | | 1 178 | | | | 1 411 | | | | 1 455 | | | | 1 492 | | | | 1 519 | | | | 7.1 | % |
Northern Cape | | | 348 | | | | 373 | | | | 392 | | | | 419 | | | | 429 | | | | 438 | | | | 445 | | | | 4.2 | % |
North West | | | 1 071 | | | | 1 103 | | | | 1 148 | | | | 1 111 | | | | 1 138 | | | | 1 162 | | | | 1 184 | | | | 1.7 | % |
Western Cape | | | 997 | | | | 1 119 | | | | 1 209 | | | | 1 317 | | | | 1 356 | | | | 1 392 | | | | 1 424 | | | | 6.1 | % |
| | | | | | | | | | | | | | | | | | | | | | | | | | | | | | | | |
Total | | | 13 779 | | | | 14 625 | | | | 15 198 | | | | 16 095 | | | | 16 514 | | | | 16 875 | | | | 17 172 | | | | 3.7 | % |
| | | | | | | | | | | | | | | | | | | | | | | | | | | | | | | | |
| 1. | Projected numbers at fiscal year end |
| 2. | Includes recipients of war veterans grant |
| | |
Two social assistance reforms are proposed for the period ahead. First, the Department of Social Development will explore ways to improve income support for orphaned children who live with their relatives. Second, the means test for the old age grant will be phased out. This will simplify administration, prevent the exclusion of vulnerable individuals and eliminate the disincentive to preserve retirement savings arising from the present means test. Adjustments to personal income tax rebates will partially offset the costs of this reform and will ensure that the overall incidence of tax and income support arrangements remains redistributive. Table 6.3 shows that total spending on social grants is projected to decline as a percentage of GDP from 3.4 per cent in 2011/12 to 3.2 per cent in 2015/16 as economic growth outpaces growth in recipients. | | Removal of means tests to simplify administration and encourage retirement savings is proposed |
85
2013 BUDGET REVIEW
Table 6.3 Social grant trends as a percentage of GDP, 2009/10 – 2015/16
| | | | | | | | | | | | | | | | | | | | | | | | | | | | |
| | | 2009/10 | | | 2010/11 | | | 2011/12 | | | 2012/13 | | | 2013/14 | | | 2014/15 | | | 2015/16 | |
R million | | Actual | | | Revised
estimate | | | Projected | |
Grants | | | 79 260 | | | | 87 493 | | | | 95 962 | | | | 104 239 | | | | 113 007 | | | | 121 482 | | | | 129 493 | |
Administration1 | | | 5 550 | | | | 5 313 | | | | 5 358 | | | | 5 848 | | | | 6 683 | | | | 6 961 | | | | 7 160 | |
| | | | | | | | | | | | | | | | | | | | | | | | | | | | |
Total | | | 84 810 | | | | 92 806 | | | | 101 320 | | | | 110 087 | | | | 119 690 | | | | 128 443 | | | | 136 653 | |
Administration as % of total | | | 6.2 | % | | | 6.2 | % | | | 6.1 | % | | | 5.6 | % | | | 5.6 | % | | | 5.4 | % | | | 5.2 | % |
Total as % of GDP | | | 3.4 | % | | | 3.4 | % | | | 3.4 | % | | | 3.4 | % | | | 3.4 | % | | | 3.3 | % | | | 3.2 | % |
| | | | | | | | | | | | | | | | | | | | | | | | | | | | |
| 1. | Administration includes SASSA, payment contractors and appeals tribunal |
| | |
| |
| | South African Social Security Agency |
| |
| SASSA administrative reforms have contributed to improved social grants processing times | | The South African Social Security Agency (SASSA) administers social assistance. Following improvements in its financial position in recent years, it is now able to fast-track projects to improve service delivery and reduce fraud. Of the 1.2 million new applications for grants last year, 89 per cent were finalised within 21 days, with an average processing time of nine days. In 2012/13, SASSA implemented a new payment system that will reduce the unit cost per payment from as high as R32 to a standard rate of R16. Beneficiaries are now able to receive their grants anywhere in the country and have access to the banking system. |
| |
| | Social welfare |
| |
| NGOs play an important role, partnering with government in provision of welfare services | | Government partners with non-governmental organisations (NGOs) to provide welfare services. NGOs provide a range of statutory services for which they are partly subsidised by government, and also receive support from corporate and other donors. Special priority is given to implementation of the Children’s Act (2005), which provides for protection against child abuse and neglect, support for children in conflict with the law, foster care and expanded access to early childhood development. National and provincial social development departments transferred R5 billion to the non-governmental sector for welfare services in 2012/13. These transfers will increase to R6.5 billion in 2015/16. As of June 2012, there were 100 000 NGOs registered in South Africa, of which 40 per cent operate in social services, providing assistance to children, the elderly, the disabled and victims of abuse. Many NGOs are facing financial difficulties as a result of additional demand associated with their responsibilities and a decline in external donor funding. |
| |
| Budget support for NGOs includes strengthening their involvement in public employment | | The 2013 Budget contains additional funding for NGOs and for the recruitment of social worker graduates. Partly to address the funding challenges faced by welfare services, government is also strengthening the involvement of NGOs in public employment programmes. The social sector of the expanded public works programme, which is run by provincial departments of health, social development and education, recruits unemployed community members to assist with early child development and home- and community-based care. |
86
CHAPTER 6: SOCIAL SECURITY AND THE SOCIAL WAGE
| | |
¢ Towards quality health care for all | | |
| |
| South Africa confronts a substantial burden of ill-health. Public health facilities provide vital services to millions of citizens. Primary health care is available free of charge and hospital services are provided at relatively low cost according to income level, with exemptions provided for children under six, pregnant women and social grant beneficiaries. | | |
| |
| Private health services mainly operate on a fee-for-service basis and are largely out of reach of households not insured through medical schemes, which cover about 16 per cent of the population. Private health services are generally better resourced than public facilities, and so the quality of available health care is strongly correlated with income level. There are also considerable regional disparities in the quality of public health facilities. The introduction of NHI will seek to address these inequalities, making quality health care accessible to all. | | NHI aims to ensure provision of quality health care to all, regardless of income |
National health insurance pilot projects
In 2012, the Minister of Health launched 10 pilot projects to assess various policy options for NHI. These include developing new models for primary health-care delivery, contracting with general practitioners to support health delivery in the public sector, improving revenue management at central hospitals, new mechanisms of reimbursing health-care providers, and separating the roles of purchaser and provider of health services.
Conditional grant funding worth R1.3 billion is helping to finance the pilot projects, which have been established in all provinces and cover a total of 10 million people. In the 2013 Budget a new national health conditional grant is established through which the national Department of Health, with the concurrence of provinces, will play a greater role in contracting general practitioners and managing hospital revenue.
Improvement in health outcomes
| | |
| South Africa’s health indicators have improved significantly in recent years. Average life expectancy increased from 56.5 in 2009 to 60 years in 2011, largely due to government’s HIV and Aids programmes. An estimated 1.7 million people received antiretroviral medication in 2012. Important advances have been made in the diagnosis of tuberculosis. | | Steady improvement in health indicators owing to HIV and Aids programmes, tuberculosis diagnosis and child vaccines |
Table 6.4 Key mortality indicators, 2009 – 2011
| | | | | | | | | | | | | | | | |
Indicator | | 2009 | | | 2010 | | | 2011 | | | Target 20141 | |
Life expectancy at birth: total | | | 57 | | | | 58 | | | | 60 | | | | 59 | |
Life expectancy at birth: male | | | 54 | | | | 56 | | | | 57 | | | | 56 | |
Life expectancy at birth: female | | | 59 | | | | 61 | | | | 63 | | | | 61 | |
Adult mortality: total | | | 46 | % | | | 43 | % | | | 40 | % | | | 43 | % |
Adult mortality: male | | | 52 | % | | | 49 | % | | | 46 | % | | | 48 | % |
Adult mortality: female | | | 40 | % | | | 37 | % | | | 34 | % | | | 37 | % |
Under-5 mortality per 1 000 live births | | | 56 | | | | 53 | | | | 42 | | | | 50 | |
Infant mortality (<one year) per 1 000 live births | | | 40 | | | | 37 | | | | 30 | | | | 36 | |
Neonatal mortality 2 (<28 days) per 1 000 live births | | | 14 | | | | 13 | | | | 14 | | | | 12 | |
Maternal mortality3 per 100 000 live births | | | 310 | | | | 333 | | | | — | | | | 270 | |
| 1. | Health data advisory and coordinating committee, National Department of Health |
| 2. | District health information system |
| Source: | Medical Research Council (Rapid Mortality Surveillance Report 2011) |
87
2013 BUDGET REVIEW
| | |
| | Mother-to-child transmission of HIV, as measured by the number of children born with HIV as a proportion of those exposed to the virus, has fallen from 8.5 per cent in 2008 to 2.7 per cent in 2011, contributing to a marked reduction in child mortality. New vaccines for pneumonia and diarrhoea have helped to reduce child mortality from 56 deaths per 1 000 live births in 2009 to 42 in 2011. Efforts are under way to achieve a similar improvement in the maternal mortality rate. |
| |
| In preparation for NHI, medical and nursing training are expanding | | Over the past five years, employment in the public health service has increased by 50 000, bringing total employment to 300 000. In preparation for NHI, government is expanding medical and nursing training capacity, and channelling additional investment to primary health care services and health infrastructure under the hospital revitalisation programme. |
| |
| | Financing national health insurance |
| |
| Need for increase in taxes over long term to support NHI to be addressed in 2013 discussion paper | | The initial phase of NHI development will not place substantial new revenue demands on the fiscus over the medium term. Investment in improved health facilities and piloting local health service reforms are accommodated within annual health budgets and revenue arrangements. Over the longer term, more significant funding will be required and it is anticipated that a tax increase will be needed to fund implementation. The National Treasury is working with the Department of Health to examine the required funding arrangements for NHI. A discussion paper inviting public comment on various options will be published in 2013. The paper will also examine arrangements for risk and revenue pooling, mechanisms for the purchasing of health services – including the size and cost of the proposed health benefits package – and the mix of public and private provision of health care. ¢ Education Education builds the country’s human capital and equips children with the skills they need to become economically productive. Raising the quality of education is essential to combat poverty, unemployment and inequality. |
Table 6.5 Expansion of no-fee schools, 2007 and 2012
| | | | | | | | | | | | | | | | | | | | | | | | |
| | | 2007 | | | 2012 | |
Province | | Learners
in no-fee
schools | | | No-fee
schools | | | Percentage
of no-fee
learners | | | Learners
in no-fee
schools | | | No-fee
schools | | | Percentage
of no-fee
learners | |
Eastern Cape | | | 1 224 711 | | | | 3 825 | | | | 73.0 | % | | | 1 599 008 | | | | 5 370 | | | | 81.9 | % |
Free State | | | 298 184 | | | | 1 304 | | | | 51.9 | % | | | 500 303 | | | | 1 205 | | | | 75.6 | % |
Gauteng | | | 377 274 | | | | 432 | | | | 21.2 | % | | | 1 040 140 | | | | 1 241 | | | | 50.1 | % |
KwaZulu-Natal | | | 1 173 503 | | | | 3 341 | | | | 32.9 | % | | | 1 781 471 | | | | 4 806 | | | | 61.9 | % |
Limpopo | | | 1 015 524 | | | | 2 557 | | | | 58.7 | % | | | 1 586 437 | | | | 3 844 | | | | 92.5 | % |
Mpumalanga | | | 404 431 | | | | 983 | | | | 42.2 | % | | | 856 314 | | | | 1 625 | | | | 81.2 | % |
Northern Cape | | | 102 244 | | | | 335 | | | | 40.9 | % | | | 176 157 | | | | 446 | | | | 63.5 | % |
North West | | | 267 042 | | | | 728 | | | | 36.6 | % | | | 658 938 | | | | 1 472 | | | | 85.0 | % |
Western Cape | | | 132 560 | | | | 407 | | | | 18.8 | % | | | 368 142 | | | | 679 | | | | 35.5 | % |
| | | | | | | | | | | | | | | | | | | | | | | | |
Total | | | 4 995 473 | | | | 13 912 | | | | 42 | % | | | 8 566 910 | | | | 20 688 | | | | 70 | % |
| | | | | | | | | | | | | | | | | | | | | | | | |
| | |
| | The Constitution guarantees universal access to basic education. Since 2007, government has given effect to this commitment by providing “no-fee schools”, which are identified according to the income levels of the surrounding communities. The state provides an increased allocation per learner to compensate for loss of school fees. The policy initially covered |
88
CHAPTER 6: SOCIAL SECURITY AND THE SOCIAL WAGE
| | |
| the poorest 20 per cent of schools – known as quintile 1. When it was introduced, just under 5 million learners were exempted from paying school fees. Since then, the policy has been extended to include quintile 2 and 3 schools. As shown in Table 6.5, by 2012, 70 per cent of learners in 20 688 schools were not required to pay school fees. | | |
| |
| In recent years, government has also increased funding to help students from poor backgrounds obtain tertiary education and vocational training. The National Student Financial Aid Scheme will provide loans and bursaries to 288 188 students in 2012/13, up from 118 160 in 2008/09. This number is projected to grow to 642 269 in 2015/16. The number of poor students receiving bursaries for vocational training will reach 245 655 in 2016, up from 55 173 in 2009. | | In higher education, assistance for students from poor backgrounds is increased |
National school nutrition programme
The national school nutrition programme is part of government’s anti-poverty strategy, targeting learners in quintile 1, 2 and 3 schools. Up until 2009, the programme fed a daily meal to over 6 million learners at primary schools in these quintiles. It was progressively extended to secondary schools from 2009/10 onwards, reaching quintile 3 secondary school learners in 2011/12, when the number of learners fed a meal each school day had increased to over 8.8 million. The programme is now focused on getting better value for money and reducing administrative costs.
National school nutrition programme, 2006/07 – 2011/12
| | | | | | | | | | | | | | | | | | | | | | | | |
| | | 2006/07 | | | 2007/08 | | | 2008/09 | | | 2009/10 | | | 2010/11 | | | 2011/12 | |
Number of learners fed | | | 6 075 410 | | | | 6 138 971 | | | | 6 340 079 | | | | 7 125 273 | | | | 8 281 927 | | | | 8 850 208 | |
Expenditure (‘000 rand) | | | 1 098 036 | | | | 1 152 939 | | | | 1 927 109 | | | | 2 394 528 | | | | 3 663 326 | | | | 4 578 752 | |
| ¢ | | Transforming human settlements |
| | |
| From 1994 to 2012, government built 2.7 million houses for low-income families across the country, providing shelter to an estimated 20 per cent of the population. In so doing, it has given effect to the progressive realisation of access to adequate housing as set out in the Constitution. | | Government has built 2.7 million houses for low-income families since 1994 |
Figure 6.3 Free housing and serviced sites, 1994/95 – 2011/121
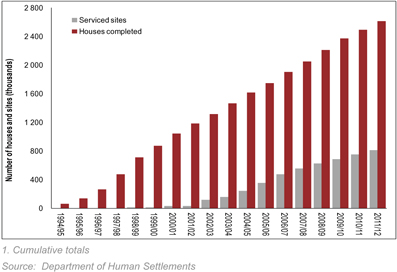
89
2013 BUDGET REVIEW
| | |
| Informal settlement upgrading programme provides roads, lighting and sanitation | | Another component of government’s housing policy is the informal settlement upgrading programme, launched in 2010. This gives residents the right of occupation and provides infrastructure such as roads, lighting, water and sanitation. The rural sanitation programme and a microfinance programme offering home improvement loans provide support for rural households. Chapter 7 discusses plans to improve public transport. Effective, safe and affordable public transport reduces travel time and increases convenience for both commuters and job-seekers. Improvements in transport infrastructure strengthen links between urban and rural settlements, and reduce the costs of living and doing business. Free basic services |
| Level of free services designed to meet international benchmarks | | Progress continues to be made in extending access to electricity, water, sanitation and refuse removal services. Government’s aim is to ensure that all citizens receive at least a basic level of amenities. Drawing on international benchmarks, minimum standards of 50kWh of free electricity and 6 000 litres of water per month per household have been adopted. However, the level of free services provided to poor households varies, depending on local circumstances and municipal capacity. |
| |
| Revisions to local government equitable share formula to improve targeting of funding | | The national budget contributes to the financing of household amenities through the local government equitable share, which is mainly allocated for provision of free basic services. Figure 6.4 shows the growth in allocations to the local government equitable share over the past four years. |
| | Figure 6.4 Allocations to local government equitable share, 2009/10 – 2013/14 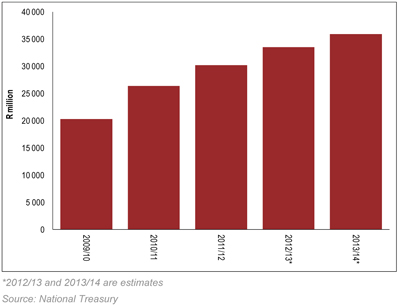
The new local government equitable share formula provides a subsidy of R275 for every household with a monthly income less than R2 300, which is about 59 per cent of all households. The previous formula for the local government equitable share targeted 47 per cent of households. Revisions are under way that take into account varying local circumstances: some municipalities have difficulty identifying which households are eligible for free services or do not yet maintain accurate records of service provision. |
90
CHAPTER 6: SOCIAL SECURITY AND THE SOCIAL WAGE
| | |
| While census data indicates steady progress towards universal access to electricity and clean water, achievement of free basic service standards still has some way to go. Figure 6.5 shows the estimated number of households with access to free basic water, electricity, sanitation and refuse collection services in 2011 against the 59 per cent target. | | Government is making progress towards meeting targets for free basic services |
Figure 6.5 Households with access to free basic services, 2011
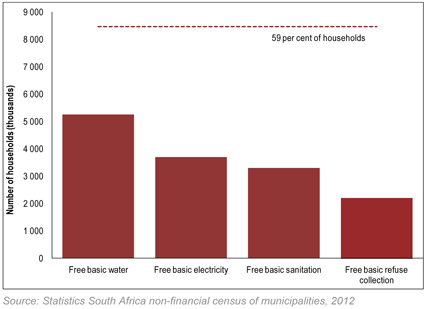
| | |
| The 2011 Census shows that there has been considerable population growth and internal migration over the past decade. This new data assists in improving the targeting of municipal funding. The new equitable share formula will reflect these changes and make allocations for free basic services more transparent. Municipalities need to prioritise funding for the provision and maintenance of these services. | | Census results contribute to better targeting of budget allocations to municipalities |
| |
| The funding and provision of infrastructure are also important requirements for continued improvement in basic service delivery. It is not possible to give households free access to services if the supporting infrastructure – such as water distribution systems – is not in place. Programmes to address infrastructure backlogs are discussed in Chapter 7. | | Infrastructure backlogs must be cleared to support expanded service provision |
| |
¢ Contributory social security | | |
| |
Contributory social insurance funds form part of South Africa’s broad social security net. The state manages social insurance funds that pay benefits under specific circumstances. Improvements to social security, including administrative reforms and the introduction of a mandatory pension fund, are key elements in broadening social solidarity and supporting decent work opportunities. The Unemployment Insurance Fund (UIF) provides short-term unemployment insurance to qualifying workers. It is financed by contributions worth 2 per cent of workers’ salaries up to a prescribed ceiling. Contributions are divided between employers and employees. As Table 6.6 shows, the UIF paid benefits of R5.6 billion to 706 000 people in 2011/12. | | UIF, RAF and compensation funds pay benefits for unemployment, accident or on-the-job injury |
91
2013 BUDGET REVIEW
| | | | | | | | | | | | | | | | |
| Table 6.6 UIF benefits and beneficiaries, 2009/10 – 2012/13 | |
| | | | |
| | | 2009/10 | | | 2010/11 | | | 2011/12 | | | 2012/13 | |
Benefits (R million) | | | | | Outcome | | | | | | Revised
estimate | |
R million | | | | | | | | | | | | | | | | |
Unemployment | | | 4 536 | | | | 4 173 | | | | 4 354 | | | | 5 473 | |
Illness | | | 232 | | | | 233 | | | | 234 | | | | 305 | |
Maternity/adoption | | | 625 | | | | 659 | | | | 708 | | | | 863 | |
Dependant | | | 317 | | | | 317 | | | | 316 | | | | 416 | |
| | | | | | | | | | | | | | | | |
Total paid1 | | | 5 710 | | | | 5 382 | | | | 5 612 | | | | 7 057 | |
| | | | | | | | | | | | | | | | |
Beneficiaries (thousand) | | | | | | | | | | | | | | | | |
Unemployment | | | 475 | | | | 629 | | | | 556 | | | | 612 | |
Illness | | | 26 | | | | 25 | | | | 21 | | | | 23 | |
Maternity/adoption | | | 94 | | | | 105 | | | | 104 | | | | 114 | |
benefits | | | | | | | | | | | | | | | | |
Dependant | | | 16 | | | | 22 | | | | 25 | | | | 28 | |
| | | | | | | | | | | | | | | | |
Total beneficiaries | | | 611 | | | | 781 | | | | 706 | | | | 777 | |
| | | | | | | | | | | | | | | | |
1. Numbers are recorded on an accrual basis, excluding provisions | |
| | |
| RAF outstanding claims represent liability of R57 billion | | The Road Accident Fund (RAF) provides compensation for injuries caused by the wrongful or negligent driving of another vehicle. The RAF is funded from a dedicated fuel levy collected by the South African Revenue Service. The fund has experienced difficulties in settling claims, mainly because of the need to apportion blame for an accident before cases can be settled. This results in long delays in settling claims and substantial expenditure on legal fees rather than benefits for accident victims. There are 250 000 claims outstanding, representing a liability estimated at R57.4 billion. |
| |
| Road Accident Benefit Scheme proposed for consideration in Parliament | | This arrangement is to be replaced by the Road Accident Benefit Scheme, which will be run on a no-fault basis with statutory limits to claim values. Proposals have been approved for public consultation, and legislation is set to be tabled in Parliament this year. Funds established under the Compensation Fund for Occupational Injuries and Diseases Act (COIDA) (1993) and the Occupational Diseases in Mines and Works Act (1973) pay medical care and income benefits to workers who suffer an employment-related disability or illness. The funds are financed by levies on employers. Employers operating under COIDA register either with the Compensation Fund or two independently managed arrangements – the Rand Mutual Association and the Federated Employers’ Mutual Assurance – which compensate injured workers from the mining and building industries respectively. The Compensation Commissioner for Occupational Diseases in the Department of Health provides compensation to miners and former miners who have contracted lung-related diseases. At present, effective compensation services are compromised by administrative difficulties within the Compensation Fund and the Compensation Commissioner for Occupational Diseases. |
92
CHAPTER 6: SOCIAL SECURITY AND THE SOCIAL WAGE
Table 6.7 Social security funds, 2009/10 – 2015/16
| | | | | | | | | | | | | | | | | | | | | | | | | | | | |
| | | 2009/10 | | | 2010/11 | | | 2011/12 | | | 2012/13 | | | 2013/14 | | | 2014/15 | | | 2015/16 | |
R million | | Outcome | | | Revised
estimate | | | Medium-term estimates | |
Unemployment Insurance Fund | | | | | | | | | | | | | | | | | | | | | | | | | | | | |
Revenue | | | 14 199 | | | | 13 878 | | | | 15 206 | | | | 17 821 | | | | 18 683 | | | | 20 167 | | | | 21 683 | |
Expenditure | | | 6 581 | | | | 6 435 | | | | 6 780 | | | | 8 881 | | | | 9 600 | | | | 10 799 | | | | 12 237 | |
Compensation funds | | | | | | | | | | | | | | | | | | | | | | | | | | | | |
Revenue | | | 7 343 | | | | 6 948 | | | | 7 715 | | | | 7 526 | | | | 8 071 | | | | 8 576 | | | | 9 001 | |
Expenditure | | | 3 902 | | | | 4 060 | | | | 4 158 | | | | 4 382 | | | | 4 663 | | | | 5 020 | | | | 5 185 | |
Road Accident Fund | | | | | | | | | | | | | | | | | | | | | | | | | | | | |
Revenue | | | 11 785 | | | | 14 293 | | | | 16 155 | | | | 18 682 | | | | 21 097 | | | | 23 266 | | | | 25 424 | |
Expenditure | | | 12 221 | | | | 13 810 | | | | 13 047 | | | | 15 213 | | | | 19 370 | | | | 23 761 | | | | 25 471 | |
| | | | | | | | | | | | | | | | | | | | | | | | | | | | |
Total: Social security funds | | | | | | | | | | | | | | | | | | | | | | | | | | | | |
Tax revenue | | | 26 964 | | | | 29 600 | | | | 32 432 | | | | 36 492 | | | | 39 688 | | | | 43 377 | | | | 46 965 | |
Non-tax revenue | | | 6 353 | | | | 5 508 | | | | 6 605 | | | | 7 520 | | | | 8 145 | | | | 8 612 | | | | 9 122 | |
Grants received | | | 10 | | | | 12 | | | | 39 | | | | 17 | | | | 19 | | | | 20 | | | | 21 | |
| | | | | | | | | | | | | | | | | | | | | | | | | | | | |
Total revenue | | | 33 328 | | | | 35 119 | | | | 39 076 | | | | 44 029 | | | | 47 851 | | | | 52 009 | | | | 56 108 | |
Total expenditure | | | 22 704 | | | | 24 306 | | | | 23 985 | | | | 28 476 | | | | 33 633 | | | | 39 579 | | | | 42 893 | |
Budget balance1 | | | 10 624 | | | | 10 813 | | | | 15 090 | | | | 15 553 | | | | 14 218 | | | | 12 430 | | | | 13 215 | |
| | | | | | | | | | | | | | | | | | | | | | | | | | | | |
| 1. | A positive number reflects a surplus and a negative number a deficit |
| | |
| |
| An interdepartmental task team on social security reform has developed proposals for consolidation and modernisation of the administration of the social security funds, as part of the phasing in of a comprehensive social security system. These reforms would include standard death and disability benefits and a basic retirement pension, financed through an earnings-related statutory contribution. | | Reform proposals aim to consolidate social security administration and enhance death and disability benefits |
| | |
| |
| South Africa is an outlier among countries of similar income level in that it does not have a statutory requirement for pension provision, or death and disability insurance. Government is examining ways in which every working South African can be guaranteed access to these components of social security. As in many other countries, a key element of this reform would be the provision of subsidised contributions for low-income workers. | | Access to social security for every working South African should be guaranteed |
| |
| In the absence of a statutory requirement for retirement provision, a large number of employers provide retirement and insurance funds as a condition of employment. However, coverage of such arrangements is uneven, with workers’ access to an occupational fund dependent on factors such as income, employer size and economic sector. According to research based on the 2010 Labour Force Survey, only 32 per cent of people earning below the tax threshold and only 36 per cent of workers at companies with fewer than 50 employees have access to an occupational retirement fund. Just 12 per cent of workers in construction, agriculture or domestic service are enrolled in an occupational fund. | | Retirement fund coverage is poor for low-income workers and employees in small firms |
93
2013 BUDGET REVIEW
| | |
| | Government’s contribution to occupational and individual retirement arrangements is twofold: it incentivises contributions to retirement funds via the tax system, and it regulates retirement funds. The reforms described in the accompanying box on retirement reform will lay the foundation for the eventual introduction of a mandatory tier of a comprehensive social security system that provides death, disability and retirement cover to all workers. |
Refined proposals on retirement reform
In 2012, the National Treasury published draft reform proposals on savings and retirement. Following public consultation, proposals in the following areas have been developed for consideration:
| | • | | Retirement funds will be required to transfer members’ balances into a preservation fund when they change employer. Existing rules for these funds will be relaxed to allow one withdrawal per year, although the amount of each withdrawal will be limited. Unused withdrawals may be carried forward. The transfer of pension wealth resulting from divorce settlements will also be paid into preservation funds rather than being paid in cash. Annuitisation requirements of provident and pension funds will be harmonised. |
| | • | | The tax treatment of contributions to retirement funds will be harmonised, as discussed in Chapter 4. |
| | • | | Trustees will guide members through retirement, identify a default retirement product and automatically shift members into that product when they retire, unless members request otherwise. Living annuities will be eligible for selection provided that certain standards are met. Retirement funds will be encouraged to remove any bias on members opting to retire later than the fund’s retirement age. To increase competition, providers other than registered life offices will be allowed to sell living annuities. The Financial Services Board’s review of the remuneration of financial intermediaries will be strengthened. |
A formal consultation process on these proposals will begin after the budget. The intention is to introduce legislation to Parliament during 2013. A paper addressing costs in the retirement industry will be published shortly.
| | |
| | ¢ Conclusion Since 1994, government has significantly expanded provision of public services. While much of the state’s social spending is targeted at the poorest households, it also lowers the cost of living and supports broader participation in the productive economy. |
| |
| Social wage complements employment earnings and contributes to more equitable growth | | State-funded services cannot fully meet either social and development challenges or all the needs of households and communities. Economic growth, employment and rising wages are the main determinants of social progress and poverty reduction. Of particular importance is the need to accelerate job creation for young people. The social wage complements employment earnings and contributes to a more equitable and inclusive economic growth path. Phasing in of NHI and further steps in social security reform will also reinforce social solidarity and the decent work agenda. |
94
7
Infrastructure
In brief
| • | | Budgeted spending for public-sector infrastructure totals R827 billion over the next three years. |
| • | | A much larger set of projects is under consideration over the longer term. Decisions on which projects to implement will be guided by the National Development Plan (NDP), accompanied by thorough assessments of feasibility and value for money. |
| • | | The first of two new large, coal-fired power plants will begin producing electricity in 2014, significantly easing the country’s power constraints. |
| • | | Transnet’s pipeline, rail and port investments will gain further impetus in 2013. |
| • | | Construction and upgrading of dams, water transfer schemes, schools, hospitals, clinics and housing are under way. |
| • | | Government has a range of initiatives in place to address identified shortcomings in infrastructure planning and project management. |
| | |
South Africa’s infrastructure investments will increase the ability of the economy to grow in an inclusive manner while improving delivery of basic services to all citizens. The national infrastructure programme coordinated by the Presidential Infrastructure Coordinating Commission (PICC) contains a pipeline of projects under consideration. The NDP provides clear guidelines for capital investment priorities and the sequences of decisions required to ensure that the country’s infrastructure needs are provided for in a sustainable, equitable, affordable and practical manner. Following estimated spending of R642 billion over the last three years, planned spending on infrastructure projects by the public sector totals R827 billion over the medium-term expenditure framework (MTEF) period. A substantial number of projects are in progress or about to get under way. Weaknesses in planning and capacity, however, continue to delay implementation of some projects. Steps are being taken to address these problems. | | NDP provides clear guidelines for capital investment priorities |
95
2013 BUDGET REVIEW
| | |
| |
Government has expanded initiatives to improve planning, procurement and project management | | Government is improving capacity to plan, procure, manage and monitor projects, as well as working more closely with the private sector at various stages of the project development cycle. Building technical capacity in the public sector is a multi-year effort, and initiatives to strengthen these functions have expanded. The PICC has concentrated its efforts over the past year on improved planning and decision processes. |
| |
In real terms, public- and private-sector capital spending shows improvement | | National accounts estimates show that public- and private-sector capital spending increased in real terms by 4.3 per cent and 4.6 per cent respectively in 2011, and 11.1 per cent and 4.3 per cent in the first three quarters of 2012. However, as a percentage of GDP, capital spending has not yet recovered to the level reached in 2008, prior to the recession. Nominal public-sector capital investment stood at 7.1 per cent of GDP in 2011, with private-sector investment at 11.9 per cent of GDP. |
| |
NDP targets gross fixed capital formation of 30 per cent of GDP | | The NDP points out that “to grow faster and in an inclusive manner, the country needs a higher level of capital spending. Gross fixed capital formation needs to reach about 30 per cent of GDP by 2030, with public-sector investment reaching 10 per cent of GDP, to realise a sustained impact on growth and household services.” Improved and timely maintenance of infrastructure is also an important requirement for efficient transport, electricity and water service delivery. |
| |
| | Figure 7.1 Public- and private-sector capital investment as share of GDP, 1960 – 2011 |
| | 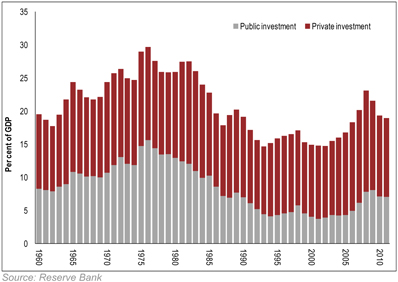 |
| |
| | The value of major infrastructure projects in progress or under consideration in the public sector totals R3.6 trillion, as summarised in Table 7.1 and listed in greater detail in Table 7.3. There are also several private-sector projects identified in the strategic integrated projects of the PICC, bringing the total value of projects being considered to over R4 trillion. |
96
CHAPTER 7: INFRASTRUCTURE
| | |
| About 40 per cent of these projects are in implementation. For the remainder of projects, concept proposals have to be assessed for alignment with the priorities set out in the NDP, followed by rigorous feasibility evaluations. The trade-offs between technical viability, affordability, level of demand and financial feasibility need to be assessed to ensure a selection of projects and sequencing of implementation that best meets the growth and development objectives of the country. | | All projects will be assessed rigorously to ensure maximum public benefit |
Table 7.1 Mega-projects under consideration, 2013 – 2023
| | | | | | | | | | | | | | | | | | | | | | | | | | | | | | | | | | | | | | | | |
| | | Project stage | | | | | | | |
R billion | | Con-
cept | | | Pre-
feasi-
bility | | | Feasi-
bility | | | Finan-
cing | | | Detailed
design | | | Tender | | | Con-
struc-
tion | | | Ongoing
pro-
grammes1 | | | Total | | | Per-
cent of
total | |
Water | | | — | | | | — | | | | 20 | | | | 47 | | | | 22 | | | | 7 | | | | 15 | | | | 20 | | | | 131 | | | | 3.6 | |
Transport | | | 383 | | | | — | | | | 130 | | | | 19 | | | | 52 | | | | 88 | | | | 25 | | | | 126 | | | | 823 | | | | 22.9 | |
Electricity | | | 300 | | | | 53 | | | | 550 | | | | — | | | | 98 | | | | 464 | | | | 385 | | | | 152 | | | | 2 002 | | | | 55.7 | |
Liquid fuels | | | — | | | | 3 | | | | 209 | | | | 8 | | | | — | | | | — | | | | 23 | | | | — | | | | 243 | | | | 6.8 | |
Education | | | 12 | | | | — | | | | — | | | | 68 | | | | — | | | | — | | | | 18 | | | | 34 | | | | 133 | | | | 3.6 | |
Health | | | — | | | | — | | | | 50 | | | | 29 | | | | — | | | | — | | | | — | | | | 37 | | | | 116 | | | | 3.2 | |
Telecommunication | | | 12 | | | | — | | | | — | | | | 0 | | | | 4 | | | | 16 | | | | 3 | | | | — | | | | 36 | | | | 1.0 | |
Human settlement | | | — | | | | — | | | | — | | | | 84 | | | | — | | | | — | | | | 26 | | | | — | | | | 110 | | | | 3.2 | |
| | | | | | | | | | | | | | | | | | | | | | | | | | | | | | | | | | | | | | | | |
Total | | | 707 | | | | 56 | | | | 958 | | | | 256 | | | | 176 | | | | 575 | | | | 496 | | | | 368 | | | | 3 592 | | | | | |
% total expenditure | | | 19.7 | % | | | 1.6 | % | | | 26.7 | % | | | 7.1 | % | | | 4.9 | % | | | 16.0 | % | | | 13.8 | % | | | 10.2 | % | | | 100.0 | % | | | | |
| | | | | | | | | | | | | | | | | | | | | | | | | | | | | | | | | | | | | | | | |
| 1. | Ongoing programmes include multiple projects at different stages of development, such as universal access to electricity and school building programme |
Electricity
| | |
A sufficient and affordable supply of electricity is needed to sustain economic activity and ensure quality of life for South African households. According to the 2011 Census, by 2011, 84.7 per cent of households had access to the electricity grid, compared with 69.7 per cent in 2001. South Africa’s electricity supply constraint will ease as the first power from new coal-fired plants becomes available in 2014. Eskom’s capital investment programme is the largest in the public sector. The commissioning of its two large coal-fired power plants, Medupi and Kusile, has been delayed by labour unrest, weak contractor performance and skills shortages. The first units of these plants are expected to deliver electricity to the grid in 2014 and 2015. The Ingula pumped storage scheme is on schedule for 2014, and the Grootvlei and Komati return-to-service power stations are operating, though not yet at full capacity. | | |
| These investments are complemented by the renewable energy independent power producer programme, which will introduce private-sector participants into the electricity generation sector. During the first round of bidding, covering 1 416MW of electricity, all 28 preferred bidders raised the required capital, and some plants will begin to sell electricity into the grid in 2013. A second bidding round covering 1 044MW of electricity, completed in 2012, showed a substantial improvement in local content and a strong decline in price. A third round | | Independent power producer programme will begin selling electricity to the grid this year |
97
2013 BUDGET REVIEW
| | |
| | covering 1 166MW is due for submission in August 2013. In addition, Eskom’s 100MW Sere wind farm project is scheduled to be completed in March 2014, and construction on a 100MW concentrated solar power plant in Upington will begin in March 2014. For the longer term, several other generation options are being examined. A joint assessment is under way with authorities in the Democratic Republic of the Congo with a view to South Africa participating in the next phases of the Grand Inga hydroelectric project. Other opportunities for hydroelectric plants, coal and piped gas facilities within the southern African region, nuclear power and utilisation of natural gas reserves are being considered. |
Decisions on future power sources must weigh need for adequate, diversified supply with environmental protection and affordability | | The NDP highlights the need for careful review of the costs and potential of natural gas and nuclear power options. With sufficient support for development and rollout of cost-effective technologies, wind and solar power could also be viable on a large scale. A critical aspect of these decisions will be weighing the trade-offs to ensure an adequate and diversified electricity supply, environmental protection and end-user affordability. The increase in generation capacity is complemented by Eskom’s large investments to expand and upgrade the transmission grid. Both Eskom and municipalities are investing in distribution infrastructure to replace or upgrade outdated equipment. |
| | Liquid fuels |
Options to meet production demand must take account of size and distribution of liquid fuels market | | Public entities and private firms supply South Africa’s liquid fuel requirements, some of which is refined locally and some of which is imported. Government recognises that a number of options for expanding local production are available, including construction of a new refinery, expanding existing refinery capacity or partnering in a regional venture. In determining the way forward, account has to be taken of size and geographic distribution of the liquid fuels market, and the need to upgrade existing production processes to meet cleaner fuel specifications. There is also scope for partial import replacement through biofuels production, which will be supported through a fiscal production incentive to be introduced in the period ahead. A new supply of gas is required for PetroSA’s Mossel Bay refinery, replacing the dwindling offshore reserve. PetroSA, which is state owned, is investigating importing liquefied natural gas to provide feedstock for the refinery and to supply its neighbouring gas-fired power station. If this project moves ahead, infrastructure will have to be built at the port to receive the gas, and to distribute it to industrial users and households. |
Transnet’s multiproduct pipeline is complete, with terminals to be finished by year-end | | Transnet’s construction of the main trunk of the new multiproduct pipeline is complete, and the Durban and inland terminals are scheduled to be finished by December 2013, marking the completion of phase 1. This will reduce the number of fuel tankers travelling along the Durban/Gauteng corridor and eliminate the inland fuel supply constraint. Moreover, the pipeline will complement private-sector investments in berths, and allow for investment in handling infrastructure at the port, where bigger pipe racks are being installed to remove bottlenecks. |
98
CHAPTER 7: INFRASTRUCTURE
| | |
An investment of about R40 billion in the country’s six refineries is needed over the next five years to upgrade production processes to meet new fuel specifications. These requirements will reduce vehicle emissions and allow new technologies to be introduced. Basic fuel prices, which are regulated, will be adjusted to accommodate cost recovery for the upgrades while minimising the impact on consumers. Water and sanitation The 2011 Census confirms a large-scale expansion of access to water and sanitation. Access to piped water inside dwellings improved from 60.7 per cent in 1996 to 73.4 per cent in 2011. Over the same period the percentage of households without access to clean water fell from 19.7 per cent to 8.8 per cent, and those without access to sanitation from 36.4 per cent to 28.6 per cent. These achievements have made a tangible difference in the lives of millions. | | R40 billion investment required to upgrade refineries to meet new fuel specifications |
The NDP notes, however, that expanded access, combined with a lack of maintenance, has strained existing infrastructure. There is a need to strengthen planning to improve the management of resources. | | A need to strengthen maintenance and planning |
| Expanding access to water requires investments all along the supply chain. This starts with investing in dams, bulk water supply schemes and wastewater infrastructure. | | |
Dam construction and rehabilitation under way
In addition to rehabilitating 25 dams, government is building seven new dams at various locations and increasing capacity at Hazelmere Dam, Clanwilliam Dam, Tzaneen Dam and Nwamitwa Dam.
Over the MTEF period, about R150 million will be allocated from the fiscus to implement a short-term action plan to address acid mine drainage. Rand Water and the Development Bank of Southern Africa are developing a sustainable financing framework to tackle the acid mine drainage problem over the long term.
| | |
Large pipeline schemes to transfer water from dams to distribution centres are being financed and implemented by the Trans-Caledon Tunnel Authority, which has several projects that will serve industrial, commercial and municipal clients, some beginning operations in 2013. | | |
Next in the supply chain, the 12 water boards have been investing in the maintenance, refurbishment and expansion of treatment and distribution facilities, spending a combined R2.1 billion in 2011/12. Umgeni Water and Rand Water, the largest boards, accounted for about 90 per cent of this spending, which targeted augmentation projects, rural development initiatives and upgrading of existing infrastructure. Municipalities form the last link in the water distribution chain. In addition to their own financial resources, municipalities will receive R42.3 billion from the fiscus over the medium term to improve reticulation, sanitation and sewerage processing plants. Capital expenditure by municipalities on water infrastructure grew by an annual average of 32 per cent between 2009/10 and 2012/13. However, absolute expenditure remains low, and many municipalities are struggling to operate their water infrastructure at an adequate level. The newly established Municipal Infrastructure Support Agency and the water boards are providing municipalities with technical assistance. | | Water boards are prioritising maintenance, refurbishment and expansion of treatment and distribution facilities |
99
2013 BUDGET REVIEW
| | |
| | Transport |
| | The NDP emphasises the need for priority investment in cost-effective freight transport and urban public transport. |
| | |
Transnet increases spending on bulk rail, general freight infrastructure and ports
To increase freight transport and handling capacity, Transnet, the state-owned company responsible for port, rail and pipeline infrastructure, undertook capital expenditure of R22.3 billion in 2011/12, up from R21.5 billion in 2010/11. Transnet has:
| • | | Increased capacity on bulk export rail lines for an additional 24 million tons and bought 110 new locomotives for these lines to date. |
| • | | Invested R14.5 billion to upgrade and maintain general freight infrastructure and rolling stock between April 2011 and September 2012. |
| • | | Completed five fully functional deep-water berths at Ngqura. |
| • | | Invested in a reconfigured facility for refrigerated containers and six new ship-to-shore cranes at the Cape Town container terminal. |
| | |
21 per cent increase in handling capacity at the port of Durban | | During 2013, investment in new cranes and terminal reengineering will boost container capacity at the port of Durban by about 21 per cent to 2.9 million 20-foot equivalent units. The introduction of a transport regulator should help ensure cost recovery in a manner that is fair and competitive for freight customers. The state-owned Passenger Rail Agency of South Africa (PRASA) is working to improve the quality and capacity of its commuter rail services. PRASA has begun a 20-year procurement programme for rolling stock. Transfers from the fiscus totalling R4.2 billion have been allocated for this purpose over the next three years, complementing revenue raised from user chargers. Contract negotiations are in progress and the first coaches will be delivered in 2015. |
Construction of bus rapid transit systems to begin in Tshwane, Nelson Mandela Bay, Rustenburg and eThekwini | | Investment in bus rapid transport systems continues in Johannesburg and Cape Town, with Tshwane, Nelson Mandela Bay, Rustenburg and eThekwini expected to begin construction of their networks in 2013. During 2012 the final Gautrain link was completed, which will help to alleviate highway congestion in and around Johannesburg. South Africa’s road network requires significant continuing investment to ensure that trade and commuter arteries support a growing economy and efficient movement of goods and people. The South African National Roads Agency Limited (SANRAL) is responsible for national road maintenance and upgrading. SANRAL spent R2.9 billion on non-toll roads and R1.1 billion on toll roads in the first half of 2012/13. Government has allocated R32.9 billion to SANRAL over the MTEF period for national road improvements and R2 billion for rehabilitation of coal haulage roads in Mpumalanga. Provincial spending on roads is expected to total R27.6 billion over the medium term. User charges raised through toll fees remain an important additional source of funding for national roads. The Airports Company of South Africa completed its core capital investment programme in 2011. Capital spending has subsequently tapered off to R237 million in the first half of 2012/13. This amount covers minor refurbishments, replacements and preparatory work on runways at the Cape Town and East London airports, and on tunnels to remote aircraft stands at OR Tambo airport. |
100
CHAPTER 7: INFRASTRUCTURE
| | |
Telecommunications | | |
Information and communications infrastructure is a critical enabler of economic activity in today’s world. The 2011 Census results show that 64.8 per cent of households do not have access to the internet, and that most of those with access are reliant on cellphone connections. Access to internet is still hampered by relatively high costs and undersupply of broadband infrastructure across the country. An improved regulatory environment would allow for expanded access and lower costs across the sector. | | Improved regulatory environment would allow for lower telecommunications costs |
The private sector has made substantial investments in broadband connectivity, concentrated in mobile networks and fibre-optic cable infrastructure (both overland and undersea). Average internet connection speeds increased by 32 per cent to 2.1MBps between October 2011 and October 2012. The increase in broadband capacity means that user charges have fallen somewhat, but remain high by global standards. Public-sector investments by Broadband Infraco and Sentech are currently focused on service provision in rural areas and institutions such as schools, libraries and clinics. Cape Town, eThekwini and Johannesburg have also been investing in their own urban networks. The national broadband policy is currently being revised. Over the MTEF period, additional funding for enhanced broadband connectivity will be allocated once a policy framework is agreed. | | Internet user charges have fallen somewhat, but remain high by global standards |
Urban planning, human settlements and economic zones | | |
South Africa’s urban areas continue to experience strong growth, with 62 per cent of the population living in cities and towns. As a proportion of total households, informal dwellings declined from 16.4 per cent in 2001 to 13.6 per cent in 2011. However, focused efforts are required to deliver basic services where they are most needed. Appropriate changes to the local government infrastructure grant system are under consideration. The persistent divisions between town and township impose costs on communities, the economy and the fiscus. Government’s new approach to developing urban centres involves giving large municipalities more authority to coordinate spatial planning, manage land use and lead housing delivery. The cities support programme is coordinating government’s promotion of integrated urban development. In addition, grants will be redirected to ensure that housing and associated amenities are delivered in the areas where they are needed. | | Government to review and recommend changes to local government infrastructure grant system |
Providing housing for low-income groups remains a major policy objective. Over the medium term, government will provide R3 billion for social housing (medium-density rental housing in urban areas), R30.3 billion to upgrade informal housing in metropolitan municipalities and R1.1 billion for rapidly urbanising mining towns. The special economic zone programme of the Department of Trade and Industry is receiving funds amounting to R2.9 billion to provide earthworks for purpose-built industrial parks incorporating customs-controlled areas adjacent to international ports or airports. | �� | Over medium term, fiscus provides R3 billion for social housing and R30.3 billion to upgrade informal housing |
101
2013 BUDGET REVIEW
| | |
| | Education Government’s objective is for all schools to meet minimum infrastructure standards by 2016. |
Over medium term, 496 inappropriate school structures to be replaced | | A medium-term allocation of R8 billion will see 496 inappropriate structures replaced (of which 395 are mud schools), and provide water to 1 257 schools, sanitation to 868 schools and electricity to 878 schools. Provincial education departments are responsible for continued maintenance costs. The education infrastructure grant to provinces provides R23.9 billion over the 2013 MTEF to build, upgrade or maintain existing structures. An allocation of R820 million will support upgrading facilities in special schools and for classrooms to accommodate increased enrolment of grade R. Challenges in the provision of infrastructure include the limited capacity of some implementing agents, and remote locations where site access is hampered by topography and poor road conditions. |
Construction of new universities in Mpumalanga and Northern Cape to begin over medium term | | In higher education, R6.5 billion is allocated over the next three years to begin building new universities in Mpumalanga and the Northern Cape, improve facilities for disabled students and staff, and strengthen broadband connectivity and information and communications technology infrastructure at universities. This complements about R2 billion of university revenue that supports new construction and site improvements. Health Health infrastructure spending has increased over the last three years by an annual average of 17 per cent. By the end of 2011/12, a total of 1 967 health facilities and 49 nursing colleges were in different stages of planning, construction and refurbishment – including four hospitals that had been completed. Progress in health infrastructure is partly the result of work by a projects support unit that has been helping the national department and provinces with capital and maintenance projects. |
Infrastructure at district hospitals to receive support | | Provinces will continue to invest significantly over the next three years, with a large share of their combined R29.5 billion budget funding infrastructure at district hospitals, such as Mangaung Hospital and Jubilee Hospital in Tshwane, and regional hospitals, including Edendale Hospital and the Natalspruit Hospital in Ekurhuleni. In line with the prioritisation of primary health care, provincial health departments will spend R5 billion on primary health-care facilities, of which R3.2 billion is for clinics. Regional investments |
Investment in roads, electricity and other projects across Africa | | South Africa is partnering on a range of projects in sub-Saharan Africa. • During 2012, the Development Bank of Southern Africa invested R10.2 billion in projects across southern and central Africa, up from R7.6 billion in 2011. The largest investments are in Zambia, Zimbabwe and Mozambique. Capital is being provided to develop national roads, electricity generation and transmission, and numerous other projects. • The Industrial Development Corporation’s investments outside of South Africa stood at R6.2 billion in 2011/12, spread across 41 projects in 17 countries. The bulk of projects are in mining, industrial infrastructure, agro-processing and tourism. |
102
CHAPTER 7: INFRASTRUCTURE
| | |
• Eskom is considering several regional generation and transmission projects, including hydroelectric, gas and coal options. These have the potential to both provide cheaper and more diversified sources of electricity to South Africa and alleviate the supply shortage in the region (outside South Africa) estimated at 6 000MW. | | |
These investments will help to accelerate regional economic development. Increased electricity generation and improved transport connections will boost industrialisation and trade, and help to build a regional market with larger economies of scale. ¢ Improving infrastructure delivery There has been a steady increase in overall infrastructure expenditure by the public sector, including capital and maintenance spending, shown in Table 7.2. However, there are many areas within government and the broader public sector where infrastructure delivery is weak, characterised by delays, poor planning, lack of project management capacity and inadequate oversight. | | Investments in southern Africa are a step towards a stronger regional market |
Table 7.2 Public-sector infrastructure expenditure by area of responsibility, 2011/12 – 2015/16
| | | | | | | | | | | | | | | | | | | | | | | | |
| | | 2011/12 | | | 2012/13 | | | 2013/14 | | | 2014/15 | | | 2015/16 | | | MTEF
Total | |
R million | | Outcome | | | Budget | | | Medium-term estimates | | |
National departments | | | 6 599 | | | | 10 802 | | | | 11 225 | | | | 14 046 | | | | 14 329 | | | | 39 600 | |
Provincial departments | | | 43 449 | | | | 43 762 | | | | 46 202 | | | | 49 385 | | | | 52 098 | | | | 147 685 | |
Local government | | | 33 239 | | | | 38 489 | | | | 46 940 | | | | 50 506 | | | | 53 161 | | | | 150 607 | |
Extra-budgetary institutions1 | | | 15 418 | | | | 15 697 | | | | 21 493 | | | | 21 909 | | | | 23 176 | | | | 66 578 | |
of which: | | | | | | | | | | | | | | | | | | | | | | | | |
SANRAL non-toll building programme | | | 8 296 | | | | 9 667 | | | | 10 206 | | | | 10 433 | | | | 10 960 | | | | 31 599 | |
Public-private partnerships2 | | | 10 710 | | | | 17 955 | | | | 7 145 | | | | 4 504 | | | | 13 713 | | | | 25 362 | |
| | | | | | | | | | | | | | | | | | | | | | | | |
General government | | | 109 415 | | | | 126 705 | | | | 133 005 | | | | 140 350 | | | | 156 477 | | | | 429 832 | |
| | | | | | | | | | | | | | | | | | | | | | | | |
Eskom investment programme | | | 58 815 | | | | 76 141 | | | | 72 107 | | | | 68 016 | | | | 64 934 | | | | 205 057 | |
Transnet investment programme | | | 21 821 | | | | 31 183 | | | | 37 320 | | | | 38 815 | | | | 48 026 | | | | 124 161 | |
SANRAL3 | | | 5 683 | | | | 2 012 | | | | 1 785 | | | | 1 620 | | | | 2 669 | | | | 6 074 | |
Central Energy Fund | | | 1 209 | | | | 5 226 | | | | 3 719 | | | | 2 061 | | | | 398 | | | | 6 178 | |
Trans-Caledon Tunnel Authority | | | 1 191 | | | | 1 659 | | | | 1 230 | | | | 3 068 | | | | 1 871 | | | | 6 169 | |
Rand Water | | | 1 514 | | | | 1 352 | | | | 2 108 | | | | 1 966 | | | | 1 820 | | | | 5 894 | |
Other state-owned companies | | | 8 638 | | | | 11 627 | | | | 11 537 | | | | 15 184 | | | | 16 992 | | | | 43 713 | |
| | | | | | | | | | | | | | | | | | | | | | | | |
State-owned companies4 | | | 98 871 | | | | 129 200 | | | | 129 806 | | | | 130 730 | | | | 136 710 | | | | 397 246 | |
| | | | | | | | | | | | | | | | | | | | | | | | |
Total | | | 208 286 | | | | 255 905 | | | | 262 811 | | | | 271 080 | | | | 293 187 | | | | 827 078 | |
| | | | | | | | | | | | | | | | | | | | | | | | |
| 1. | Includes SANRAL non-toll infrastructure investment and Trans-Caledon tunnel authority, which are defined as non-financial public enterprises in the Reserve Bank data |
| 2. | Public-private partnerships include project development funds, capital contribution and unitary payments |
| 3. | Excludes SANRAL capex funded through budget allocations from the fiscus |
| 4. | Estimates provided to National Treasury by management of these companies |
103
2013 BUDGET REVIEW
Table 7.3 Major infrastructure projects
| | | | | | |
Project name/ implementing agent/ cost | | Project description | | Finance | | Status |
Energy | | | | | | |
| Solar Park (Central Energy Fund) R200bn | | Build 1GW solar park near Upington and 4GW facility elsewhere in Northern Cape | | Possibly through project finance | | Feasibility study delayed, to be completed early 2013 |
| Renewable energy independent power producer programme R120bn | | Procure photovoltaic, concentrated solar power and wind power | | Private-sector funding; repaid through tariffs | | First two bidding rounds completed for procurement of 1 415MW and 1 044MW; third round due August 2013 |
| Eskom concentrated solar plant (Eskom) R9.8bn | | Construct 100MW concentrated solar power with storage | | World Bank loan repaid by users over plant lifetime | | Construction begins March 2014 |
| Sere wind farm (Eskom) R3bn | | Construct 100MW wind power in Ceres | | | Construction begins in March 2013; to be complete in 2014 |
| Medupi (Eskom) R98.1bn | | Construct 4 788MW coal plant in Waterberg | | | | Delays experienced; first unit to be delivered 2014 with full generation by 2015 |
| Kusile (Eskom) R121bn | | Construct 4 800MW coal plant in Mpumalanga | | | | Workplan revised in response to labour concerns. First unit to be operational by 2015 with full generation by 2018 |
| Grootvlei (Eskom) R7.8bn | | Return to service of 1 180MW power station | | Corporate debt backed by government guarantees; users repay through tariffs over the plant lifetime | | 1 150MW operational, remaining 30MW to be commissioned by March 2013 |
| Komati Power Station (Eskom) R12.9bn | | Return to service of 1 000MW power station | | | Power station operational |
| Ingula (Eskom) R21.4bn | | Construct 1 332MW hydroelectric power station | | | First twin turbines installation under way; to be completed 2014 |
| New transmission lines (Eskom) R95bn | | Upgrade and new transmission lines over 5 years | | | | Ongoing programme |
New distribution network (Eskom) R88bn | | Install new distribution network | | | | Ongoing programme |
| Electricity distribution backlog (Eskom and municipalities) R27.5bn | | Maintain, refurbish and strengthen distribution assets | | Municipal and Eskom tariffs with partial fiscal contribution | | Ongoing programme |
| Integrated national electrification programme (Eskom and municipalities) R13.6bn | | Provide electricity for all | | Fully funded by fiscus | | 141 390 households electrified in 2012/13, target 904 000 households over next three years |
Solar water geysers (Eskom and municipalities) R3.6bn | | Install solar water geysers in low-income houses | | Subsidy programme funded by fiscus | | 286 065 solar water geysers installed |
| Grand Inga (Government of the Democratic Republic of Congo) R200bn | | Hydroelectric project of 40 000MW | | To be decided once feasibility study complete | | Draft treaty approved by Cabinet, negotiations on treaty of joint cooperation with DRC soon |
Liquid fuels | | | | | | |
| New multiproduct pipeline (Transnet) R23.4bn | | Construct trunk line from Durban to Jameson Park, nothern pipeline network and terminals | | Corporate debt with fiscal contribution; users repay through tariffs | | Trunk line completed in 2012 construction of terminals under way |
| Oil and gas exploration on west coast (PetroSA) R8.5bn | | Explore deepwater oil and gas reserves for gas-to-liquid refinery | | Own revenues | | Well drilling ongoing, including deepwater oil exploration |
| Liquefied natural gas importation (PetroSA) R3.2bn | | Construct break water pier and pipelines at Mossel Bay | | Project finance with PetroSA equity contribution from own revenues | | Feasibility studies under way |
Telecommunications | | | | | | |
| Digital terrestrial television (Sentech) R2.7bn | | Finalise digital terrestrial network by 2013 | | Signal distribution charges with partial fiscal contribution | | Delays experienced, signal testing completed and rollout fasttracked to meet 2013 deadline |
| Square Kilometre Array (National Research Foundation) R16bn | | Radio telescope | | International science partnerships and fiscal contribution | | SKA preparing separate deliverables for Africa and Australia; hosting agreement to be finalised March 2013 |
Health | | | | | | |
| King Edward VIII Hospital R6bn | | Upgrade and rehabilitate hospital | | Government capital contribution with partial public-private partnership project finance | | Feasibility studies for upgrade and rehabilitation under way |
Limpopo Academic Hospital R6bn | | Develop academic hospital | | |
| Nelson Mandela Hospital R6bn | | Upgrade and rehabilitate hospital | | |
Chris Hani Baragwanath Hospital R6bn | | Upgrade and rehabilitate hospital | | |
Dr George Mukhari Hospital R6bn | | Upgrade and rehabilitate hospital | | |
Education | | | | | | |
Education infrastructure conditional grant (Provinces) R23.9bn | | Build new schools, upgrade and maintain existing infrastructure | | Funded by fiscus | | Ongoing programme |
Mpumalanga University (Department of Higher Education and Training) R7bn | | New university | | Preparatory work funded by fiscus | | |
| Northern Cape University (Department of Higher Education and Training) R5.4bn | | New university | | | Feasibility study completed |
104
CHAPTER 7: INFRASTRUCTURE
Table 7.3 Major infrastructure projects (continued)
| | | | | | |
Project name/ Implementing agent/
Cost | | Project description | | Finance | | Status |
Transport | | | | | | |
| Rolling stock for passenger rail (PRASA) R80bn | | Rolling stock fleet renewal over 20 years from 2012 | | Fully funded by fiscus | | Contract negotiations and first coaches in 2015 |
Rolling stock and locomotive for freight rail (Transnet) R7.7bn | | Acquire rolling stock and locomotives | | Corporate debt raised through market; users repay through tariffs | | 110 new locomotives purchased |
| Nqgura container terminal (Transnet) R7.9bn | | Increase port capacity by 800 000 units, first phase completed in 2012 | | | Port complete, 5 berths fully functional and construction of port rail line under way |
Manganese rail and terminal (Transnet) R18bn | | Upgrade rail, port and terminal capacity | | | |
| Iron ore line (Transnet) R13bn | | Expand Sishen Saldanha iron ore railway | | | Feasibility studies complete |
N2/R72 Port Elizabeth to East London (SANRAL) R5.3bn | | Capacity upgrades additional lanes and resurfacing | | | | Conceptual designs drafted |
| N2 Richards Bay to Ermelo (SANRAL) R6.2bn | | Capacity upgrades additional lanes and resurfacing | | Bonds and corporate debt possibly with government guarantees | | Conceptual designs and traffic and toll feasibility studies completed |
| Gauteng Freeway Improvement Project (SANRAL) R18.9bn | | Upgrade highways in Gauteng | | | | Most construction completed, some resurfacing ongoing |
| Public transport networks (municipalities) R15.1bn | | Rollout of public transport in prioritised metropolitan areas | | Mainly funded through fiscus with user charges to cover operational costs | | Work in progress in six municipalities: construction and operation in Cape Town and Johannesberg; construction in Nelson Mandela Bay construction about to begin in Tshwane, Rustenburg and eThekwini |
Water | | | | | | |
| Mokolo Crocodile water augmentation phase II (TCTA) R14bn | | Construct water transfer system from Crocodile River (west) to Lephalale | | Possible contribution from fiscus; repaid through user charges | | Financing options being explored |
uMzimvubu water resources development (Department of Water Affairs) R20bn | | Build dam for hydroelectricity and agricultural irrigation scheme | | Decided after feasibility study | | Feasibility studies under way |
| Lesotho Highlands water project phase II (TCTA) R7.5bn | | Generate hydroelectric power and develop bulk water transfer scheme from Lesotho to Gauteng | | Guarantee from government; repaid through user charges | | Memorandum of agreement ratified; financing options under discussion and tender for designs under way |
| Vaal River eastern sub-system augmentation project (TCTA) R2.7bn | | Construct 120km water supply line from Vaal dam to Sasol and Eskom plants in Mpumalanga | | Project financed; repaid through user charges | | Project handed to Department of Water Affairs for operation and maintenance |
| Komati water scheme augmentation project (TCTA) R1.7bn | | Construct pumping station and two pipelines for Duvha and Matla power stations | | | Duvha line 97% complete, Matla 7km pipes delivered and pump station civil works complete. Water delivery soon |
| Mooi-Mgeni transfer scheme phase II (TCTA) R1.7bn | | Construct dam, associated transfer system and refurbish existing pumping station and transfer system | | | Dam impounding delayed, construction of water supply system to start June 2013. Water delivery milestone April 2013 |
| Rehabilitation of dams (Department of Water Affairs) R2.7bn | | Dam safety rehabilitation programme | | Funded by fiscus; cost recovery through water tariffs | | 30 dams completed, 25 dams in design and 7 dams under construction |
| Sedibeng regional sanitation scheme (Emfuleni and Midvaal local municipality) R5bn | | Increase capacity of wastewater treatment system | | Project financed with fiscal contribution | | Designs for treatment plant finalised and tenders for construction advertised. Tenders for Sebokeng and Meyerton sub regions are being adjudicated |
| Olifants River water resource development (TCTA) R2.2bn | | Construct dam and bulk distribution | | | Dam completed and scope of bulk distribution reduced based on expert recommendations |
Human settlements | | | | | | |
| Urban settlement development grant (Provinces) R30.1bn | | Upgrade informal settlements and related infrastructure in metropolitan municipalities | | Supplementary grant to municipalities | | Ongoing programme |
| Human settlement development grant (municipalties) R54bn | | Low-income housing, informal settlements and rural housing in all provinces | | Fully funded by fiscus | | Ongoing programme |
| Cornubia integrated human settlement (Housing Development Agency and eThekwini) R25.8bn | | Construct 24 000 housing units | | Largely private-sector funding with fiscal contribution | | Detailed engineering design started and pilot phase construction |
105
2013 BUDGET REVIEW
| | |
| | Planning, assessing and prioritising |
| |
| Most failures to meet deadlines and stick to budgets are rooted in insufficient planning | | Thorough planning is needed to accelerate the delivery of infrastructure. Most failures to meet project deadlines, budgets or specifications are the result of insufficient planning. Feasibility studies during the planning stage are also instrumental in assessing whether a project represents value for money. Regulations governing planning requirements will therefore be strengthened, and evidence of credible feasibility studies will be required to show that a project is worthy of support from the fiscus. |
| | Figure 7.2 illustrates the importance of proper planning on the project cycle. Figure 7.2 Planning and project development 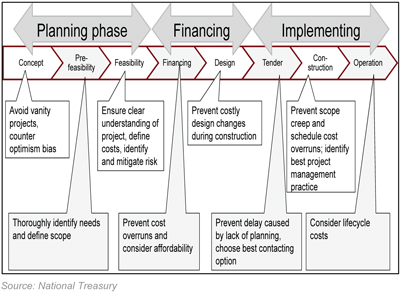
Financing |
| Long-term, large infrastructure projects tend to produce ‘lumpy’ expenditure patterns | | Over the next three years, national and provincial government and state-owned companies intend to spend R827 billion on infrastructure. A large portion of this is earmarked for projects in the energy and transport sectors, most of which are multi-year projects that began before the current MTEF period. Patterns in overall expenditure from one year to the next are distorted by the timing of very large projects, such as those undertaken by state-owned companies and in public-private partnerships. Such projects tend to be “lumpy”, with long lead times in project development before significant construction expenditure takes place. |
| |
| Over medium term, fiscus provides R429 billion for projects that address social needs | | Financing of these projects has been tailored to the nature of the activity being funded. Projects that aim to address social needs do not result in revenue streams, and are financed by the fiscus and undertaken by national, provincial and municipal government. Over the MTEF period, R429 billion has been allocated to support such projects. |
106
CHAPTER 7: INFRASTRUCTURE
| | |
Over the longer term the majority of projects involve economic infrastructure, with clearly identifiable users that will pay charges for the services they receive. Most of these projects are undertaken by municipalities and state-owned companies. As discussed in Chapter 5, over the next three years state-owned companies plan to borrow about R160 billion on local and global capital markets, along with internally generated resources, to fund their infrastructure investments. Eskom and Transnet account for 88 per cent of this borrowing. Currently, municipalities raise finance from user charges and property rates, supplemented by grants from the fiscus. The largest municipalities also borrow from the capital markets. Projects that meet the following criteria will be in a strong position to receive support from the fiscus: • The project is aligned with the priorities set out in the NDP. • Sufficient demand has been demonstrated. • The option proposed is the most efficient, effective solution. • The project is affordable, with a practical and fair method of cost recovery. • The proposed implementing agent is capable of delivery to specification. Building capacity | | |
| While developing adequate capacity is a long-term project, a range of short- to medium-term interventions are contributing to this objective. Significant strides in improving the ability to deliver infrastructure will go hand in hand with improving the general capabilities, ethos and performance of the public service. | | Greater ability to deliver infrastructure will go hand in hand with improved general capabilities of public sector |
Recent progress on building capacity includes the following: • The infrastructure delivery improvement programme has continued to provide technical assistance and training in planning, procurement and management systems for the provincial and national departments of health, education and public works, along with management oversight functions in provincial treasuries. Over the last year, a course was co-developed with the University of Pretoria to train managers to use an infrastructure delivery management toolkit. • New infrastructure procurement regulations in proposed amendments to the Public Finance Management Act (1999) encourage a greater focus on quality when assessing project bids, and require dedicated supply chain teams and expert panels to adjudicate tender awards. This approach will complement performance-based infrastructure grants to provinces, which will take into account adherence to best practice in planning and procurement in determining additional allocations. • The Municipal Infrastructure Support Agency, established in May 2012, is working with 29 water services authorities to eradicate supply backlogs and conduct adequate maintenance in water and sanitation. In the last year, 21 experts were assigned to these tasks, 108 apprentices were trained and deployed nationally, and 110 civil engineers were registered professionally and hired by municipalities. • The infrastructure skills development grant placed 240 graduates in municipal jobs in the areas of civil and electrical engineering, geographic information systems, land valuation and water technology over the past year. The number of municipalities supported by the grant grew from six to 23. | | |
107
2013 BUDGET REVIEW
| | |
| | • The neighbourhood development programme continues to assist 150 townships, and the number of approved projects that have received funding to improve infrastructure has increased from 220 to 285 over the past year. • The National Treasury is increasing the depth and frequency of monitoring of conditional grant expenditure by municipalities. This has been made possible by the completion of two large projects instituting uniform budgeting and reporting standards across all 278 municipalities. Expenditure reports will be required quarterly. • A turnaround programme, supported by external experts, is under way in the Department of Public Works. A review of the leasing function will be concluded in 2013, followed by a business process re-engineering of this function. Analysis of the immovable assets record is nearly complete and physical verification will take place in 2013. Finance and supply chain specialists have been deployed to all of the department’s offices. ¢ Conclusion |
| Progress is being made at all levels of infrastructure delivery | | Government’s infrastructure investment priorities are guided by the broad framework established in the NDP. The PICC is coordinating a long-term project pipeline. Government will continue to pursue its aim of shifting infrastructure from consumption to investment and has budgeted R827 billion for infrastructure projects over the medium term. |
108
8
Medium-term expenditure and division of revenue
In brief
| | • | | The 2013 Budget provides for total main budget spending of R1.06 trillion in 2013/14. |
| | • | | In 2013/14, national government departments are allocated 47.6 per cent of nationally raised revenue, provincial government 43.5 per cent and local government 8.9 per cent. |
| | • | | The proposed budget framework reflects government’s continued commitment to investing in infrastructure, health, education and social welfare. |
| | • | | Moderate growth in public spending is proposed. Given the constrained fiscal environment, growth in medium-term expenditure is reduced from 8.1 per cent as projected in October 2012 to 7.9 per cent. |
| | • | | Demographic changes observed in the 2011 Census are reflected in new allocations to provinces and municipalities. |
| | • | | Government at all levels has contributed to savings and reprioritisation to support policy priorities. To ensure greater value for money, expenditure-control systems and procurement will be strengthened. |
| | |
| |
The spending plans outlined in the 2013 Budget continue to support government’s commitment to broadening service delivery and expanding investment in infrastructure, while taking account of the constrained fiscal environment. The medium-term expenditure framework (MTEF) takes as a point of departure the National Development Plan (NDP), which establishes a framework to eliminate poverty and reduce inequality by 2030. Due to lower-than-projected economic growth and revenue underperformance, government has adjusted the spending plans presented in the 2012 Medium Term Budget Policy Statement. Savings have been made at every level of government to moderate the fiscal deficit while supporting economic recovery. Expenditure has been trimmed in areas that will not adversely affect service delivery, or where programmes are not performing as expected. | | Spending plans take NDP as a point of departure |
109
2013 BUDGET REVIEW
| | |
| Real growth in public spending supports tangible gains in welfare, health, education and employment | | The budget framework provides for average annual real growth in consolidated government spending of 2.3 per cent over the MTEF period. The number of social grant recipients will grow from 16.1 million today to 17.2 million by 2015/16. The number of people receiving antiretroviral treatment will grow by 500 000 per year and public employment programmes will continue to expand. Large-scale investment in schools and hospitals will continue, and access to free basic services will broaden. Government is already funding many of the programmes highlighted in the NDP. Road and rail infrastructure, for example, receive significant support over the three-year spending period, and there will be major investments in public transport and human settlements. The economic competitiveness and support package will receive R14.9 billion over the spending period to give effect to various growth policies, including the New Growth Path and the Industrial Policy Action Plan. |
| |
| Rules for infrastructure projects will be tightened to ensure greater value for money | | Expenditure-control systems across government will be revised over the period ahead. There will be tighter rules for intergovernmental transfers, especially for infrastructure projects. Measures will be taken in supply chain management to make it harder for tender processes to be manipulated and to avoid situations where government pays above-market prices for goods and services. The results of the 2011 Census, which capture important shifts in the size and distribution of the population, inform the future distribution of funds. Demographic changes will be reflected in new allocations to provinces and municipalities, which will be phased in to avoid disruption of services. ¢ Division of national revenue National, provincial and local government are responsible for delivering public services. Some of these services are the exclusive responsibility of one level of government, while others – known as concurrent functions – are shared. The division of nationally raised revenue provides for the appropriate funding of each level of government, taking into account their service-delivery responsibilities and other sources of revenue available to them. |
| |
| Local government allocations focus on provision of basic services to low-income households | | In 2013/14, national government departments are allocated 47.6 per cent of available funds after debt costs and the contingency reserve have been provided for. Provincial government is allocated 43.5 per cent of available funds, mainly for education, health and social welfare. Local government receives 8.9 per cent of the available funds, primarily for providing basic services to low-income households. Most municipalities fund the majority of their spending through charges and taxes. The Explanatory Memorandum to the Division of Revenue sets out the provincial and municipal allocations, and explains how the division takes into account the recommendations of the Financial and Fiscal Commission. The memorandum is available as Annexure W1 of the Budget Review on the National Treasury website (www.treasury.gov.za). Table 8.1 summarises the division of revenue for the 2013 Budget. |
110
CHAPTER 8: MEDIUM-TERM EXPENDITURE AND DIVISION OF REVENUE
Table 8.1 Division of nationally raised revenue, 2009/10 – 2015/16
| | | | | | | | | | | | | | | | | | | | | | | | | | | | |
| | | 2009/10 | | | 2010/11 | | | 2011/12 | | | 2012/13 | | | 2013/14 | | | 2014/15 | | | 2015/16 | |
R million | | | | | Outcome | | | | | | Revised
estimate | | | Medium-term estimates | |
Debt-service cost | | | 57 129 | | | | 66 227 | | | | 76 460 | | | | 88 325 | | | | 99 741 | | | | 108 718 | | | | 118 163 | |
Non-interest expenditure | | | 690 068 | | | | 738 914 | | | | 812 063 | | | | 878 642 | | | | 955 333 | | | | 1 029 262 | | | | 1 107 564 | |
Percentage increase | | | 18.7 | % | | | 7.1 | % | | | 9.9 | % | | | 8.2 | % | | | 8.7 | % | | | 7.7 | % | | | 7.6 | % |
| | | | | | | | | | | | | | | | | | | | | | | | | | | | |
Total expenditure | | | 747 197 | | | | 805 141 | | | | 888 523 | | | | 966 967 | | | | 1 055 075 | | | | 1 137 981 | | | | 1 225 727 | |
Percentage increase | | | 17.5 | % | | | 7.8 | % | | | 10.4 | % | | | 8.8 | % | | | 9.1 | % | | | 7.9 | % | | | 7.7 | % |
Contingency reserve | | | — | | | | — | | | | — | | | | — | | | | 4 000 | | | | 6 500 | | | | 10 000 | |
| | | | | | | | | | | | | | | | | | | | | | | | | | | | |
Division of available funds | | | | | | | | | | | | | | | | | | | | | | | | | | | | |
National departments | | | 345 366 | | | | 355 188 | | | | 381 324 | | | | 413 098 | | | | 452 530 | | | | 489 456 | | | | 521 706 | |
Provinces | | | 293 164 | | | | 322 822 | | | | 362 488 | | | | 388 516 | | | | 414 152 | | | | 441 727 | | | | 474 389 | |
Equitable share | | | 236 891 | | | | 265 139 | | | | 291 736 | | | | 313 016 | | | | 337 572 | | | | 359 924 | | | | 383 697 | |
Conditional grants | | | 56 273 | | | | 57 682 | | | | 70 753 | | | | 75 500 | | | | 76 580 | | | | 81 803 | | | | 90 692 | |
Local government | | | 51 537 | | | | 60 904 | | | | 68 251 | | | | 77 028 | | | | 84 651 | | | | 91 579 | | | | 101 469 | |
Equitable share1 | | | 23 845 | | | | 30 541 | | | | 33 173 | | | | 37 373 | | | | 40 582 | | | | 44 490 | | | | 50 208 | |
General fuel levy sharing with metropolitan municipalities | | | 6 800 | | | | 7 542 | | | | 8 573 | | | | 9 040 | | | | 9 613 | | | | 10 190 | | | | 10 659 | |
Conditional grants | | | 20 892 | | | | 22 821 | | | | 26 505 | | | | 30 615 | | | | 34 456 | | | | 36 899 | | | | 40 603 | |
| | | | | | | | | | | | | | | | | | | | | | | | | | | | |
Total | | | 690 068 | | | | 738 914 | | | | 812 063 | | | | 878 642 | | | | 951 333 | | | | 1 022 762 | | | | 1 097 564 | |
| | | | | | | | | | | | | | | | | | | | | | | | | | | | |
Percentage shares | | | | | | | | | | | | | | | | | | | | | | | | | | | | |
National departments | | | 50.0 | % | | | 48.1 | % | | | 47.0 | % | | | 47.0 | % | | | 47.6 | % | | | 47.9 | % | | | 47.5 | % |
Provinces | | | 42.5 | % | | | 43.7 | % | | | 44.6 | % | | | 44.2 | % | | | 43.5 | % | | | 43.2 | % | | | 43.2 | % |
Local government | | | 7.5 | % | | | 8.2 | % | | | 8.4 | % | | | 8.8 | % | | | 8.9 | % | | | 9.0 | % | | | 9.2 | % |
| 1. | With effect from 2006/07, the local government equitable share includes compensation for the termination of Regional Services Council (RSC) and Joint Services Board levies for metros and district municipalities From 2009/10 the RSC levies replacement grant is only allocated to district municipalities |
| | |
| Transfers to provinces | | |
| |
| The formula for calculating equitable share transfers to provinces has been updated to reflect population changes observed in the 2011 Census. Figure 8.1 shows how population growth varies significantly across the country, with more urbanised provinces growing faster than others. | | 2011 Census reveals sharp growth in most urbanised provinces |
| |
Figure 8.1 Population growth by province, 2001 – 2011 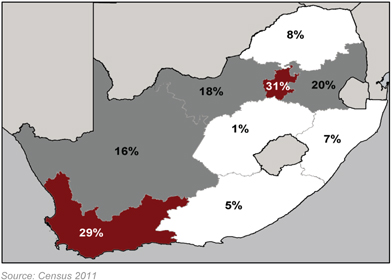
| | |
111
2013 BUDGET REVIEW
| | |
| | Overall, the population grew from 44.8 million in 2001 to 51.8 million in 2011. Provinces that have grown more rapidly will receive higher funding to help them meet demand for services. An amount of R4.2 billion over the 2013 MTEF is reserved to help provinces with declining allocations adjust to their lower relative share. The provincial equitable share accounts for 81.5 per cent of transfers to provinces and is worth R337.6 billion in 2013/14. The provincial equitable share increases by 7.8 per cent between 2012/13 and 2013/14, growing at an average annual rate of 6.6 per cent over the MTEF period. |
| |
| Of R36.1 billion added to provincial equitable share, R26.1 billion is applied to costs of wage agreement | | The 2013 MTEF adds R36.1 billion to the provincial equitable share baseline. Of this, R26.1 billion contributes to the three-year public-sector wage settlement; R1.5 billion pays for the absorption of social work graduates and provides additional support to non-governmental organisations (NGOs); and R1.8 billion finances an increase in the number of teachers for the poorest 20 per cent of schools and grade R classes. Under the revised allocation, provinces also receive an additional R338 million for improved tuberculosis diagnostic systems. Over the MTEF baseline, the devolution of property rate funds grant, allocated R6.5 billion, will be phased into the equitable share. |
Table 8.2 Total transfers to provinces, 2011/12 – 2015/16
| | | | | | | | | | | | | | | | | | | | | | | | |
| | | 2011/12 | | | 2012/13 | | | 2013/14 | | | 2014/15 | | | 2015/16 | |
R million | | Outcome | | | Budget | | | Revised | | | Medium-term estimates | |
Eastern Cape | | | 53 486 | | | | 57 258 | | | | 57 258 | | | | 59 631 | | | | 60 877 | | | | 64 061 | |
Free State | | | 22 920 | | | | 24 487 | | | | 24 487 | | | | 26 021 | | | | 26 828 | | | | 28 612 | |
Gauteng | | | 65 648 | | | | 70 858 | | | | 70 858 | | | | 76 885 | | | | 81 926 | | | | 89 630 | |
KwaZulu-Natal | | | 76 955 | | | | 83 288 | | | | 83 288 | | | | 88 085 | | | | 91 764 | | | | 97 762 | |
Limpopo | | | 44 094 | | | | 46 815 | | | | 46 738 | | | | 48 541 | | | | 49 962 | | | | 52 820 | |
Mpumalanga | | | 29 189 | | | | 30 829 | | | | 30 829 | | | | 32 998 | | | | 34 700 | | | | 36 607 | |
Northern Cape | | | 10 740 | | | | 11 440 | | | | 11 298 | | | | 12 295 | | | | 12 874 | | | | 13 886 | |
North West | | | 24 224 | | | | 25 818 | | | | 25 818 | | | | 27 744 | | | | 29 157 | | | | 31 607 | |
Western Cape | | | 35 231 | | | | 37 942 | | | | 37 942 | | | | 41 764 | | | | 43 728 | | | | 47 660 | |
Unallocated | | | — | | | | — | | | | — | | | | 188 | | | | 9 910 | | | | 11 745 | |
| | | | | | | | | | | | | | | | | | | | | | | | |
Total | | | 362 488 | | | | 388 735 | | | | 388 516 | | | | 414 152 | | | | 441 727 | | | | 474 389 | |
| | | | | | | | | | | | | | | | | | | | | | | | |
| | |
| | Allocations to provinces and municipalities are made up of conditional and unconditional transfers. Equitable share allocations are unconditional, and are spent by provinces and municipalities according to their own budget processes. Conditional grants are transferred from national departments to finance or co-fund specific programmes and activities. These funds can only be used for the purpose prescribed by the transferring department, subject to conditions set out in the grant framework. |
| |
| Conditional grants support expanded classroom construction and community libraries | | Conditional grants to provinces will total R76.6 billion in 2013/14, R81.8 billion in 2014/15 and R90.7 billion in 2015/16. Over this period, R5.3 billion is added to the education infrastructure grant, including R820 million for the construction of grade R classrooms and facilities for learners with special needs. A total of R1.1 billion has been reprioritised from the school infrastructure backlog grant to the community library services grant. The comprehensive HIV and Aids grant is allocated an additional R1.3 billion to bolster prevention programmes and compensate for a cut in donor funding for Aids relief. A further R1.1 billion is added to the human settlements development grant for upgrading informal settlements in mining towns, and an additional R738 million is earmarked for provincial roads, particularly in the North West. |
112
CHAPTER 8: MEDIUM-TERM EXPENDITURE AND DIVISION OF REVENUE
| | |
Infrastructure transfers to provinces have increased sharply in recent years, growing from R4.8 billion in 2005/06 to R39.7 billion in 2012/13. To improve the quality of spending, the application process for health and education infrastructure grants is being revised: provinces will be required to submit building plans two years ahead of implementation and will only receive allocations if plans meet certain benchmarks. Provinces with good records of planning and implementation will be able to apply for additional funds, creating a further incentive to plan well. To improve the rollout of health infrastructure, several grants are being merged into the health facility revitalisation grant so that funds can be moved easily to where they can be spent. A new indirect grant will enable the Department of Health to improve the management and delivery of health infrastructure projects and will fund a portion of the national health insurance pilot projects on behalf of provinces. Transfers to local government | | Provinces with good records of planning and implementation will be able to apply for additional funds |
Over the 2013 MTEF, R277.7 billion will be transferred directly to local government and a further R21.5 billion has been allocated to indirect grants. An amount of R5.4 billion is added to the local government equitable share to meet the rising costs of providing municipal services and to help rural municipalities, and R9.2 billion is added to direct conditional grants, which include the new municipal water infrastructure, public transport network operations and integrated city development grants. A further R5 billion is added to indirect transfers, through which national departments and public entities provide infrastructure and services on behalf of municipalities. According to the 2011 Census, the population of some municipalities grew by over 50 per cent between 2001 and 2011, while others experienced a decline in population. The transfers that municipalities receive through the local government equitable share and the municipal infrastructure grant will be updated to reflect these changes. A new formula for the local government equitable share will be introduced in 2013/14, following a review conducted by the National Treasury, the Department of Cooperative Governance and the South African Local Government Association, with assistance from the Financial and Fiscal Commission and Statistics South Africa, as well as extensive consultation with municipalities. | | Over medium term, R277.7 billion will be transferred directly to local government |
Subsidised services for more households
The new formula for the local government equitable share provides more households with a subsidy for free basic water, electricity, sanitation and refuse-removal services. The threshold for receiving free basic services rises from R800 per month (in 2001 prices) to R2 300 per month (in 2011 prices). The formula also provides funds for the institutional costs of municipalities and for community services, such as parks and recreation and fire fighting.
113
2013 BUDGET REVIEW
Table 8.3 Conditional grants to provinces, 2012/13 – 2015/16
| | | | | | | | | | | | | | | | | | | | |
| | | 2012/13 | | | 2013/14 | | | 2014/15 | | | 2015/16 | | | | |
R million | | Revised
estimate | | | Medium-term estimates | | | MTEF
Total | |
Agriculture, Forestry and Fisheries | | | 1 925 | | | | 2 147 | | | | 2 194 | | | | 2 294 | | | | 6 635 | |
Comprehensive agricultural support programme | | | 1 393 | | | | 1 600 | | | | 1 665 | | | | 1 742 | | | | 5 007 | |
Ilima/Letsema projects | | | 416 | | | | 438 | | | | 461 | | | | 482 | | | | 1 381 | |
Land care programme: Poverty relief and infrastructure development | | | 116 | | | | 109 | | | | 68 | | | | 71 | | | | 248 | |
Arts and Culture | | | 565 | | | | 598 | | | | 1 016 | | | | 1 341 | | | | 2 955 | |
Community library services | | | 565 | | | | 598 | | | | 1 016 | | | | 1 341 | | | | 2 955 | |
Basic Education | | | 10 990 | | | | 12 343 | | | | 13 188 | | | | 16 350 | | | | 41 882 | |
Dinaledi schools | | | 100 | | | | 105 | | | | 111 | | | | 116 | | | | 333 | |
Education infrastructure | | | 5 587 | | | | 6 631 | | | | 7 161 | | | | 10 059 | | | | 23 851 | |
HIV and Aids (life skills education) | | | 203 | | | | 214 | | | | 221 | | | | 226 | | | | 661 | |
National school nutrition programme | | | 4 906 | | | | 5 173 | | | | 5 462 | | | | 5 704 | | | | 16 339 | |
Technical secondary schools recapitalisation | | | 194 | | | | 221 | | | | 233 | | | | 244 | | | | 699 | |
Cooperative Governance and Traditional Affairs | | | 180 | | | | 188 | | | | 197 | | | | 204 | | | | 590 | |
Provincial disaster | | | 180 | | | | 188 | | | | 197 | | | | 204 | | | | 590 | |
Health | | | 26 073 | | | | 27 517 | | | | 29 610 | | | | 32 083 | | | | 89 210 | |
Comprehensive HIV and Aids | | | 8 763 | | | | 10 534 | | | | 12 311 | | | | 13 957 | | | | 36 802 | |
Africa Cup of Nations 2013: medical services | | | 15 | | | | — | | | | — | | | | — | | | | — | |
Health professions training and development | | | 2 076 | | | | 2 190 | | | | 2 322 | | | | 2 429 | | | | 6 941 | |
Health facility revitalisation | | | 6 191 | | | | 5 124 | | | | 4 739 | | | | 4 988 | | | | 14 850 | |
National health insurance | | | 150 | | | | 49 | | | | 70 | | | | 74 | | | | 192 | |
National tertiary services | | | 8 878 | | | | 9 620 | | | | 10 168 | | | | 10 636 | | | | 30 425 | |
Higher Education and Training | | | 4 845 | | | | 2 443 | | | | 2 600 | | | | 2 759 | | | | 7 802 | |
Further education and training colleges | | | 4 845 | | | | 2 443 | | | | 2 600 | | | | 2 759 | | | | 7 802 | |
Human Settlements | | | 15 726 | | | | 16 984 | | | | 17 918 | | | | 19 667 | | | | 54 569 | |
Human settlements development | | | 15 726 | | | | 16 984 | | | | 17 918 | | | | 19 667 | | | | 54 569 | |
Public Works | | | 2 429 | | | | 613 | | | | 644 | | | | 667 | | | | 1 925 | |
Devolution of property rate funds | | | 1 919 | | | | — | | | | — | | | | — | | | | — | |
Expanded public works programme integrated grant for provinces | | | 293 | | | | 356 | | | | 371 | | | | 382 | | | | 1 108 | |
Social sector expanded public works programme incentive grant for provinces | | | 217 | | | | 258 | | | | 273 | | | | 286 | | | | 816 | |
Sport and Recreation South Africa | | | 470 | | | | 498 | | | | 526 | | | | 550 | | | | 1 573 | |
Mass participation and sport development | | | 470 | | | | 498 | | | | 526 | | | | 550 | | | | 1 573 | |
Transport | | | 12 299 | | | | 13 249 | | | | 13 909 | | | | 14 777 | | | | 41 934 | |
Provincial roads maintenance | | | 7 982 | | | | 8 696 | | | | 9 126 | | | | 9 774 | | | | 27 596 | |
Public transport operations | | | 4 317 | | | | 4 553 | | | | 4 783 | | | | 5 003 | | | | 14 338 | |
| | | | | | | | | | | | | | | | | | | | |
Total conditional grants | | | 75 500 | | | | 76 580 | | | | 81 803 | | | | 90 692 | | | | 249 075 | |
| | | | | | | | | | | | | | | | | | | | |
Indirect transfers | | | 1 277 | | | | 3 060 | | | | 5 269 | | | | 5 032 | | | | 13 361 | |
Basic Education | | | 1 277 | | | | 1 956 | | | | 3 170 | | | | 2 912 | | | | 8 038 | |
School infrastructure backlogs | | | 1 277 | | | | 1 956 | | | | 3 170 | | | | 2 912 | | | | 8 038 | |
Health | | | — | | | | 1 104 | | | | 2 100 | | | | 2 120 | | | | 5 324 | |
2014 African Nations Championship health and medical services | | | — | | | | 6 | | | | — | | | | — | | | | 6 | |
National health | | | — | | | | 1 098 | | | | 2 100 | | | | 2 120 | | | | 5 318 | |
| | | | | | | | | | | | | | | | | | | | |
114
CHAPTER 8: MEDIUM-TERM EXPENDITURE AND DIVISION OF REVENUE
Table 8.4 National transfers to local government, 2009/10 – 2015/16
| | | | | | | | | | | | | | | | | | | | | | | | | | | | |
| | | 2009/10 | | | 2010/11 | | | 2011/12 | | | 2012/13 | | | 2013/14 | | | 2014/15 | | | 2015/16 | |
R million | | | | | Outcome | | | | | | Revised
estimate | | | Medium-term estimates | |
Direct transfers | | | | | | | | | | | | | | | | | | | | | | | | | | | | |
Equitable share and related | | | 23 845 | | | | 30 541 | | | | 33 173 | | | | 37 373 | | | | 40 582 | | | | 44 490 | | | | 50 208 | |
General fuel levy sharing with metropolitan municipalities | | | 6 800 | | | | 7 542 | | | | 8 573 | | | | 9 040 | | | | 9 613 | | | | 10 190 | | | | 10 659 | |
Infrastructure | | | 18 699 | | | | 20 871 | | | | 24 643 | | | | 28 029 | | | | 31 132 | | | | 33 698 | | | | 37 121 | |
Municipal infrastructure grant | | | 8 728 | | | | 9 704 | | | | 11 443 | | | | 13 882 | | | | 14 352 | | | | 14 684 | | | | 15 448 | |
Urban settlement development grant | | | 4 418 | | | | 4 968 | | | | 6 267 | | | | 7 392 | | | | 9 077 | | | | 10 335 | | | | 10 700 | |
Public transport infrastructure and systems grant | | | 2 421 | | | | 3 700 | | | | 4 612 | | | | 4 988 | | | | 4 669 | | | | 5 126 | | | | 5 279 | |
Integrated national electrification programme grant | | | 900 | | | | 1 033 | | | | 1 097 | | | | 1 151 | | | | 1 635 | | | | 1 565 | | | | 2 056 | |
Neighbourhood development partnership grant | | | 508 | | | | 832 | | | | 738 | | | | 578 | | | | 598 | | | | 591 | | | | 600 | |
2010 FIFA World Cup stadiums development grant | | | 1 661 | | | | 302 | | | | — | | | | — | | | | — | | | | — | | | | — | |
Rural roads asset management systems grant | | | 10 | | | | 10 | | | | 35 | | | | 37 | | | | 52 | | | | 75 | | | | 98 | |
Integrated city development grant | | | — | | | | — | | | | — | | | | — | | | | 40 | | | | 150 | | | | 150 | |
Rural households infrastructure grant | | | — | | | | — | | | | — | | | | — | | | | 107 | | | | 113 | | | | 118 | |
Municipal drought relief grant | | | 54 | | | | 320 | | | | 450 | | | | — | | | | — | | | | — | | | | — | |
Municipal water infrastructure grant | | | — | | | | — | | | | — | | | | — | | | | 603 | | | | 1 059 | | | | 2 672 | |
Capacity building and other | | | 2 194 | | | | 1 951 | | | | 1 862 | | | | 2 586 | | | | 3 324 | | | | 3 201 | | | | 3 482 | |
2010 FIFA World Cup host city operating grant | | | 508 | | | | 210 | | | | — | | | | — | | | | — | | | | — | | | | — | |
Financial management grant | | | 300 | | | | 365 | | | | 385 | | | | 403 | | | | 425 | | | | 449 | | | | 470 | |
Public transport network operations grant | | | — | | | | — | | | | — | | | | — | | | | 881 | | | | 745 | | | | 862 | |
Municipal systems improvements grant | | | 200 | | | | 212 | | | | 220 | | | | 230 | | | | 240 | | | | 252 | | | | 261 | |
2013 African Cup of Nations host city operating grant | | | — | | | | — | | | | — | | | | 123 | | | | — | | | | — | | | | — | |
2014 African Nations Championship host city operating grant | | | — | | | | — | | | | — | | | | — | | | | 120 | | | | — | | | | — | |
Expanded public works programme incentive grant for municipalities | | | 101 | | | | 280 | | | | 364 | | | | 662 | | | | 611 | | | | 632 | | | | 661 | |
Infrastructure skills development grant | | | — | | | | — | | | | 39 | | | | 75 | | | | 99 | | | | 154 | | | | 179 | |
Water services operating subsidy grant | | | 849 | | | | 664 | | | | 542 | | | | 562 | | | | 421 | | | | 450 | | | | 470 | |
Energy efficiency and demand-side management grant | | | 175 | | | | 220 | | | | 280 | | | | 200 | | | | 181 | | | | 155 | | | | 202 | �� |
Municipal disaster grant | | | 61 | | | | — | | | | 32 | | | | 330 | | | | 347 | | | | 364 | | | | 376 | |
| | | | | | | | | | | | | | | | | | | | | | | | | | | | |
Subtotal direct transfers | | | 51 537 | | | | 60 904 | | | | 68 251 | | | | 77 028 | | | | 84 651 | | | | 91 579 | | | | 101 469 | |
| | | | | | | | | | | | | | | | | | | | | | | | | | | | |
115
2013 BUDGET REVIEW
Table 8.4 National transfers to local government, 2009/10 – 2015/16, (continued)
| | | | | | | | | | | | | | | | | | | | | | | | | | | | |
| | | 2009/10 | | | 2010/11 | | | 2011/12 | | | 2012/13 | | | 2013/14 | | | 2014/15 | | | 2015/16 | |
R million | | | | | Outcome | | | | | | Revised
estimate | | | Medium-term estimates | |
Indirect transfers | | | | | | | | | | | | | | | | | | | | | | | | | | | | |
Infrastructure transfers | | | 2 763 | | | | 2 682 | | | | 2 553 | | | | 4 823 | | | | 5 399 | | | | 7 029 | | | | 8 617 | |
Regional bulk infrastructure grant | | | 577 | | | | 851 | | | | 1 260 | | | | 2 523 | | | | 3 203 | | | | 4 483 | | | | 4 872 | |
Backlogs in the electrification of clinics and schools | | | 149 | | | | — | | | | — | | | | — | | | | — | | | | — | | | | — | |
Backlogs in water and sanitation at clinics and schools | | | 350 | | | | — | | | | — | | | | — | | | | — | | | | — | | | | — | |
Integrated national electrification programme (Eskom) grant | | | 1 616 | | | | 1 720 | | | | 1 165 | | | | 1 879 | | | | 2 141 | | | | 2 488 | | | | 3 680 | |
Urban settlement development grant | | | — | | | | — | | | | | | | | | | | | | | | | 58 | | | | 65 | |
Neighbourhood development partnership grant | | | 70 | | | | 50 | | | | 50 | | | | 80 | | | | 55 | | | | — | | | | — | |
Rural households infrastructure grant | | | — | | | | 62 | | | | 78 | | | | 341 | | | | — | | | | — | | | | — | |
Capacity building and other | | | 318 | | | | 257 | | | | 217 | | | | 133 | | | | 139 | | | | 7 171 | | | | 8 768 | |
Energy efficiency and demand-side management grant | | | 75 | | | | 109 | | | | 119 | | | | — | | | | — | | | | 142 | | | | 151 | |
Water services operating subsidy grant | | | 243 | | | | 148 | | | | 98 | | | | 133 | | | | 139 | | | | 7 029 | | | | 8 617 | |
| | | | | | | | | | | | | | | | | | | | | | | | | | | | |
Subtotal indirect transfers | | | 3 081 | | | | 2 939 | | | | 2 770 | | | | 4 956 | | | | 5 538 | | | | 14 200 | | | | 17 385 | |
| | | | | | | | | | | | | | | | | | | | | | | | | | | | |
Total | | | 54 618 | | | | 63 843 | | | | 71 021 | | | | 81 984 | | | | 90 190 | | | | 105 780 | | | | 118 854 | |
| | | | | | | | | | | | | | | | | | | | | | | | | | | | |
| | |
| | The formula applies a revenue-adjustment factor that will direct funding for institutional and community services to municipalities that cannot meet these costs from their own revenues. The new formula and updated population data will result in significant changes in allocations to local governments. More funding will be allocated to municipalities that have higher poverty rates and consequently less ability to raise their own revenue. Figure 8.2 shows how rural municipalities will benefit from the new formula. The new allocations will be phased in over a five-year period to mitigate the impact of these changes. A full description of the new formula is provided in Annexure W1. |
Figure 8.2 Equitable share allocations1 per qualifying household by type of municipality, 2012/13 and 2013/14
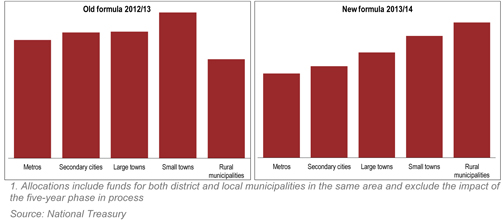
116
CHAPTER 8: MEDIUM-TERM EXPENDITURE AND DIVISION OF REVENUE
| | |
¢ Expenditure outcome and revised estimate: 2011/12 and 2012/13 | | |
During 2011/12, national and provincial spending amounted to R885.9 billion, including transfers to provinces and municipalities. This represented 99.1 per cent of a total adjusted appropriation of R893.7 billion. Provincial expenditure fell 1.3 per cent short of an adjusted budget of R373 billion in 2011/12, primarily due to underspending on health and basic education in the Eastern Cape, KwaZulu-Natal and the Free State. | | In 2011/12, national and provincial spending was 99.1 per cent of adjusted appropriation |
Municipalities underspent by R31 billion in 2011/12, representing 11.7 per cent of total budgeted municipal expenditure. Of 278 local municipalities, 212 underspent their transfer receipts by more than 5 per cent, while 30 overspent by more than 5 per cent. These figures do not include expenditure from municipalities’ own revenue. According to the revised expenditure estimate for 2012/13, national departments are projected to underspend on their national allocations by R4 billion, out of a total adjusted budget of R546.4 billion (0.7 per cent). ¢ Consolidated government expenditure Consolidated government expenditure information is shown in Table 8.5. The estimates in this section cover spending across government, including provinces, public entities, government institutions and transfers to municipalities, but excluding spending by municipalities from their own revenue. Consolidated government expenditure grows by 8.1 per cent a year, from R1.1 trillion in 2012/13 to R1.3 trillion in 2015/16. | | 212 of 278 local municipalities underspent their transfer receipts by more than 5 per cent |
117
2013 BUDGET REVIEW
Table 8.5 Consolidated government expenditure by function, 2012/13 – 2015/16
| | | | | | | | | | | | | | | | | | | | |
| | | 2012/13 | | | 2013/14 | | | 2014/15 | | | 2015/16 | | | Average | |
R million | | Revised
estimate | | | Medium-term estimates | | | annual
growth
2012/13 –
2015/16 | |
General public services | | | 53 787 | | | | 56 717 | | | | 61 565 | | | | 64 910 | | | | 6.5 | % |
Defence, public order and safety | | | 142 533 | | | | 153 694 | | | | 162 889 | | | | 171 745 | | | | 6.4 | % |
Defence and state security | | | 41 420 | | | | 44 776 | | | | 47 555 | | | | 50 201 | | | | 6.6 | % |
Police services | | | 68 284 | | | | 73 399 | | | | 77 617 | | | | 81 780 | | | | 6.2 | % |
Law courts | | | 15 318 | | | | 16 770 | | | | 17 996 | | | | 18 968 | | | | 7.4 | % |
Prisons | | | 17 511 | | | | 18 749 | | | | 19 722 | | | | 20 796 | | | | 5.9 | % |
Economic infrastructure | | | 79 184 | | | | 88 623 | | | | 96 972 | | | | 105 890 | | | | 10.2 | % |
Communication | | | 2 855 | | | | 2 974 | | | | 2 894 | | | | 2 883 | | | | 0.3 | % |
Fuel and energy | | | 8 350 | | | | 11 091 | | | | 12 163 | | | | 12 803 | | | | 15.3 | % |
Transport | | | 67 980 | | | | 74 558 | | | | 81 915 | | | | 90 204 | | | | 9.9 | % |
Economic services and environmental protection | | | 44 060 | | | | 47 997 | | | | 50 238 | | | | 53 489 | | | | 6.7 | % |
Local government, housing and community amenities | | | 119 022 | | | | 132 084 | | | | 146 976 | | | | 158 743 | | | | 10.1 | % |
Housing development | | | 27 757 | | | | 31 858 | | | | 33 956 | | | | 35 848 | | | | 8.9 | % |
Local government and community development | | | 67 259 | | | | 71 981 | | | | 77 289 | | | | 84 558 | | | | 7.9 | % |
Water supply | | | 24 006 | | | | 28 245 | | | | 35 731 | | | | 38 336 | | | | 16.9 | % |
Health and social protection | | | 251 291 | | | | 268 477 | | | | 288 598 | | | | 306 332 | | | | 6.8 | % |
Education, sport and culture | | | 220 916 | | | | 232 530 | | | | 247 250 | | | | 264 899 | | | | 6.2 | % |
Employment and social security | | | 41 677 | | | | 49 232 | | | | 57 239 | | | | 61 015 | | | | 13.5 | % |
Science and technology | | | 15 096 | | | | 16 294 | | | | 17 394 | | | | 18 926 | | | | 7.8 | % |
| | | | | | | | | | | | | | | | | | | | |
Allocated expenditure | | | 967 566 | | | | 1 045 648 | | | | 1 129 121 | | | | 1 205 949 | | | | 7.6 | % |
Debt-service cost | | | 88 325 | | | | 99 741 | | | | 108 718 | | | | 118 163 | | | | 10.2 | % |
Contingency reserve | | | — | | | | 4 000 | | | | 6 500 | | | | 10 000 | | | | | |
| | | | | | | | | | | | | | | | | | | | |
Consolidated expenditure1 | | | 1 055 891 | | | | 1 149 390 | | | | 1 244 340 | | | | 1 334 111 | | | | 8.1 | % |
| | | | | | | | | | | | | | | | | | | | |
| 1. | Consisting of national, provincial, social security funds and selected public entities Refer to Annexure W2 for a detailed list of entities included |
| | |
| | State debt costs will increase by an annual average of 10.2 per cent over the next three years. Total estimated non-interest expenditure for 2012/13 is R967.6 billion, rising to R1.2 trillion in 2015/16, at an average annual growth rate of 7.9 per cent. The budget framework includes a contingency reserve for the 2013 MTEF period of R4 billion, R6.5 billion and R10 billion for each of the three years to accommodate unforeseen and unavoidable expenditure, and unfunded priorities. |
118
CHAPTER 8: MEDIUM-TERM EXPENDITURE AND DIVISION OF REVENUE
Table 8.6 Additional allocations to infrastructure projects
| | | | | | | | | | | | | | | | |
R million | | 2013/14 | | | 2014/15 | | | 2015/16 | | | Total | |
Local government, housing and community amenities | | | 1 321 | | | | 2 134 | | | | 5 652 | | | | 9 108 | |
Interim bulk water supply | | | 311 | | | | 585 | | | | 1 400 | | | | 2 296 | |
Indirect grant: Regional bulk water infrastructure | | | 269 | | | | 954 | | | | 1 953 | | | | 3 176 | |
Pilanesberg (Magalies water) | | | 200 | | | | — | | | | — | | | | 200 | |
Human settlements development (informal settlements upgrading) | | | — | | | | 110 | | | | 830 | | | | 940 | |
Social housing | | | 160 | | | | 90 | | | | 435 | | | | 686 | |
Municipal infrastructure support agency | | | 60 | | | | 60 | | | | 60 | | | | 180 | |
De Hoop dam | | | 171 | | | | 335 | | | | 974 | | | | 1 480 | |
Acid mine drainage | | | 150 | | | | — | | | | 0 | | | | 150 | |
Transport, energy and communication | | | 1 193 | | | | 1 596 | | | | 3 284 | | | | 6 073 | |
Sentech | | | 277 | | | | — | | | | — | | | | 277 | |
SANEDI:1 Research and development | | | 71 | | | | 111 | | | | 35 | | | | 217 | |
Integrated national electrification programme | | | 320 | | | | 77 | | | | 500 | | | | 897 | |
South African National Roads Agency (SANRAL) | | | 275 | | | | — | | | | 1 126 | | | | 1 401 | |
Passenger Rail Agency of South Africa (PRASA) | | | 250 | | | | 1 408 | | | | 1 623 | | | | 3 281 | |
Education and related functions | | | 150 | | | | 500 | | | | 1 000 | | | | 1 650 | |
New universities in Northern Cape and Mpumalanga | | | 150 | | | | 500 | | | | 1 000 | | | | 1 650 | |
Health | | | 30 | | | | 30 | | | | 30 | | | | 90 | |
Infrastructure unit systems support programme | | | 30 | | | | 30 | | | | 30 | | | | 90 | |
Transport, energy and communication | | | 191 | | | | 195 | | | | 1 922 | | | | 2 309 | |
Indirect grant: Integrated national electrification programme: Eskom | | | 191 | | | | 195 | | | | 1 522 | | | | 1 909 | |
Provincial roads maintenance | | | — | | | | — | | | | 400 | �� | | | 400 | |
| | | | | | | | | | | | | | | | |
Total | | | 2 886 | | | | 4 455 | | | | 11 888 | | | | 19 229 | |
| | | | | | | | | | | | | | | | |
| 1. | South African National Energy Development Institute |
| | |
Government’s commitment to consolidating the deficit by 2015/16 means there is limited space for new policy priorities within the contingency reserve. However, spending reviews will be conducted to identify options to improve value for money. | | Additional allocations of R19.2 billion for key infrastructure projects |
Additional allocations and upward adjustments to non-interest expenditure plans over the 2013 MTEF are financed through drawdowns on the 2012 Budget contingency reserve and extensive baseline reprioritisation. They include: • R37.5 billion for improved conditions of service for public-sector employees, with 70.9 per cent (R26.6 billion) allocated to provinces and 29.1 per cent (R10.9 billion) to national government. • R19.2 billion for key infrastructure projects (see Table 8.6). • R1.9 billion to meet the costs of new social grant beneficiaries. The Estimates of National Expenditure provides more detail on national government expenditure. The spending plans of provinces are published no more than two weeks after the national budget is tabled, while draft municipal budgets are tabled in municipal councils by 31 March (90 days before the start of the municipal financial year). | | |
119
2013 BUDGET REVIEW
| | |
| | ¢ Revised medium-term expenditure plans Job creation and labour |
Job programme allocations increase by annual average of 13.4 per cent over medium term | | Projected expenditure on employment programmes, labour services and social security grows by an annual average of 13.5 per cent, from R41.7 billion in 2012/13 to R61 billion in 2015/16. Employment programme allocations increase by an annual average of 13.4 per cent over this period, with the bulk of this support focused on the community work programme. The expanded public works programme aims to create 502 174 full-time equivalent jobs1 in 2012/13 and 684 783 in 2013/14. |
Table 8.7 Employment and social security expenditure, 2009/10 – 2015/16
| | | | | | | | | | | | | | | | | | | | | | | | | | | | | | | | |
| | | 2009/10 | | | 2010/11 | | | 2011/12 | | | 2012/13 | | | 2013/14 | | | 2014/15 | | | 2015/16 | | | MTEF | |
R million | | | | | Outcome | | | | | | Revised
estimate | | | Medium-term estimates | | | Average
annual
growth | |
National departments | | | 8 490 | | | | 7 118 | | | | 8 742 | | | | 11 332 | | | | 13 181 | | | | 15 134 | | | | 15 497 | | | | 11.0 | % |
Provinces | | | 1 044 | | | | 1 348 | | | | 1 440 | | | | 1 265 | | | | 1 671 | | | | 1 677 | | | | 1 720 | | | | 10.8 | % |
Social security funds | | | 22 704 | | | | 24 306 | | | | 23 985 | | | | 28 476 | | | | 33 633 | | | | 39 579 | | | | 42 893 | | | | 14.6 | % |
Public entities | | | 462 | | | | 475 | | | | 516 | | | | 604 | | | | 746 | | | | 849 | | | | 905 | | | | 14.4 | % |
| | | | | | | | | | | | | | | | | | | | | | | | | | | | | | | | |
Total | | | 32 700 | | | | 33 247 | | | | 34 683 | | | | 41 677 | | | | 49 232 | | | | 57 239 | | | | 61 015 | | | | 13.5 | % |
| | | | | | | | | | | | | | | | | | | | | | | | | | | | | | | | |
Of which: | | | | | | | | | | | | | | | | | | | | | | | | | | | | | | | | |
Expanded public works programme 1 | | | 430 | | | | 915 | | | | 1 163 | | | | 1 729 | | | | 1 948 | | | | 2 076 | | | | 2 156 | | | | 7.6 | % |
Community work programme | | | 155 | | | | 449 | | | | 624 | | | | 1 348 | | | | 1 675 | | | | 2 390 | | | | 2 505 | | | | 22.9 | % |
Commission for Conciliation, Mediation and Arbitration | | | 356 | | | | 402 | | | | 448 | | | | 479 | | | | 594 | | | | 687 | | | | 734 | | | | 15.3 | % |
| 1. | The expanded public works programme is a programme within the national Department of Public Works |
| | |
| | A total of R247.5 million was reprioritised over the three-year period from infrastructure and environmental programmes at the municipal level to the non-state sector of the expanded public works programme, which supports employment in the NGO sector. Funds were reprioritised within the environment sector to finance Working for Fisheries. The employment programmes and institutional arrangements of the expanded public works programme will be reviewed in 2013/14. This review will inform the third phase of the programme, which will start in 2014 with higher employment targets. |
Support for greater capacity in Commission for Conciliation, Mediation and Arbitration | | The Department of Labour receives R183 million over the three-year spending period to improve sheltered employment factories, which provide jobs for workers with disabilities. The department also receives R380 million to boost the capacity of the Commission for Conciliation, Mediation and Arbitration in preparation for amendments to labour legislation. The allocation to the Jobs Fund was reduced in response to its slower-than-expected rollout. |
| 1 | The total number of work days created by a programme divided by 230 – the number of working days in a year. |
120
CHAPTER 8: MEDIUM-TERM EXPENDITURE AND DIVISION OF REVENUE
| | |
Health and social protection | | |
Consolidated expenditure on health and social protection will grow at an average annual rate of 6.8 per cent over the MTEF, from R251.3 billion in 2012/13 to R306.3 billion in 2015/16. Public health spending grows at an average rate of 5.7 per cent per year over this period. Health The 2013 Budget strengthens prevention and treatment programmes for tuberculosis and HIV and Aids. An amount of R338 million has been allocated to provinces over the medium term to roll out a new diagnostic technology for tuberculosis, while R484 million is allocated to offset a 50 per cent decrease in United States donor funding for Aids programmes. The National Institute of Communicable Diseases receives R78 million to strengthen surveillance of rotavirus, pneumococcus, HIV, tuberculosis and other infectious diseases, and R800 million is set aside to expand antiretroviral treatment to cover 500 000 more people per year. | | Consolidated spending on health and social protection grows by 6.8 per cent a year over MTEF |
Table 8.8 Health and social protection expenditure, 2009/10 – 2015/16
| | | | | | | | | | | | | | | | | | | | | | | | | | | | | | | | |
| | | 2009/10 | | | 2010/11 | | | 2011/12 | | | 2012/13 | | | 2013/14 | | | 2014/15 | | | 2015/16 | | | MTEF | |
R million | | | | | Outcome | | | | | | Revised
estimate | | | Medium-term estimates | | | Average
annual
growth | |
National departments | | | 81 733 | | | | 89 867 | | | | 98 816 | | | | 107 288 | | | | 117 185 | | | | 126 677 | | | | 134 815 | | | | 7.9 | % |
Provinces | | | 94 635 | | | | 105 145 | | | | 119 521 | | | | 134 488 | | | | 140 434 | | | | 149 935 | | | | 159 067 | | | | 5.8 | % |
Public entities | | | 8 838 | | | | 9 348 | | | | 9 438 | | | | 9 514 | | | | 10 858 | | | | 11 986 | | | | 12 450 | | | | 9.4 | % |
| | | | | | | | | | | | | | | | | | | | | | | | | | | | | | | | |
Total | | | 185 206 | | | | 204 361 | | | | 227 775 | | | | 251 291 | �� | | | 268 477 | | | | 288 598 | | | | 306 332 | | | | 6.8 | % |
| | | | | | | | | | | | | | | | | | | | | | | | | | | | | | | | |
Of which: | | | | | | | | | | | | | | | | | | | | | | | | | | | | | | | | |
Health financing and national health insurance | | | 53 | | | | 27 | | | | 40 | | | | 182 | | | | 371 | | | | 517 | | | | 546 | | | | 44.2 | % |
Health infrastructure | | | 6 712 | | | | 6 605 | | | | 8 252 | | | | 9 164 | | | | 10 247 | | | | 11 478 | | | | 11 432 | | | | 7.6 | % |
Transfers to non-profit organisations | | | 4 937 | | | | 5 568 | | | | 6 349 | | | | 7 035 | | | | 7 768 | | | | 8 177 | | | | 8 516 | | | | 6.6 | % |
| | |
The Medical Research Council receives R440 million over the MTEF to improve research programmes and infrastructure, and to support joint projects carried out with development partners. The Department of Health has reprioritised R30 million per year over the MTEF period to pay for technical support from the Development Bank of Southern Africa and the Council of Scientific and Industrial Research to improve the management and delivery of health infrastructure projects. Social development | | |
| Social grant spending will increase to R129.5 billion in 2015/16, reaching 17.2 million beneficiaries, up from 16.1 million in 2012/13. | | By the outer year, social grants will benefit 17.2 million people |
121
2013 BUDGET REVIEW
Table 8.9 Social grant expenditure, 2009/10 – 2015/16
| | | | | | | | | | | | | | | | | | | | | | | | | | | | | | | | |
| | | 2009/10 | | | 2010/11 | | | 2011/12 | | | 2012/13 | | | 2013/14 | | | 2014/15 | | | 2015/16 | | | MTEF | |
R million | | | | | Outcome | | | | | | Revised
estimate | | | Medium-term estimates | | | Average
annual
growth | |
Old age1 | | | 29 843 | | | | 33 765 | | | | 37 131 | | | | 40 529 | | | | 44 336 | | | | 47 920 | | | | 51 470 | | | | 8.3 | % |
Disability | | | 16 567 | | | | 16 840 | | | | 17 375 | | | | 17 752 | | | | 18 776 | | | | 19 754 | | | | 20 659 | | | | 5.2 | % |
Foster care | | | 4 434 | | | | 4 616 | | | | 5 011 | | | | 5 409 | | | | 5 576 | | | | 6 176 | | | | 6 719 | | | | 7.5 | % |
Care dependency | | | 1 434 | | | | 1 586 | | | | 1 736 | | | | 1 887 | | | | 2 059 | | | | 2 253 | | | | 2 444 | | | | 9.0 | % |
Child support | | | 26 670 | | | | 30 342 | | | | 34 319 | | | | 38 190 | | | | 41 793 | | | | 44 855 | | | | 47 619 | | | | 7.6 | % |
Grant-in-aid | | | 146 | | | | 170 | | | | 204 | | | | 236 | | | | 247 | | | | 274 | | | | 303 | | | | 8.8 | % |
Social relief of distress | | | 165 | | | | 174 | | | | 185 | | | | 235 | | | | 219 | | | | 249 | | | | 278 | | | | 5.7 | % |
| | | | | | | | | | | | | | | | | | | | | | | | | | | | | | | | |
Total | | | 79 260 | | | | 87 493 | | | | 95 962 | | | | 104 239 | | | | 113 007 | | | | 121 482 | | | | 129 494 | | | | 7.5 | % |
| | | | | | | | | | | | | | | | | | | | | | | | | | | | | | | | |
Province | | | | | | | | | | | | | | | | | | | | | | | | | | | | | | | | |
Eastern Cape | | | 13 914 | | | | 15 281 | | | | 16 579 | | | | 17 787 | | | | 19 526 | | | | 20 991 | | | | 22 375 | | | | 7.9 | % |
Free State | | | 5 055 | | | | 5 530 | | | | 6 101 | | | | 6 491 | | | | 7 185 | | | | 7 724 | | | | 8 233 | | | | 8.2 | % |
Gauteng | | | 9 390 | | | | 10 539 | | | | 11 827 | | | | 13 319 | | | | 13 929 | | | | 14 974 | | | | 15 961 | | | | 6.2 | % |
KwaZulu-Natal | | | 19 454 | | | | 21 308 | | | | 23 044 | | | | 24 727 | | | | 27 140 | | | | 29 175 | | | | 31 099 | | | | 7.9 | % |
Limpopo | | | 10 855 | | | | 11 986 | | | | 12 943 | | | | 13 326 | | | | 15 243 | | | | 16 387 | | | | 17 467 | | | | 9.4 | % |
Mpumalanga | | | 5 567 | | | | 6 024 | | | | 6 872 | | | | 8 312 | | | | 8 093 | | | | 8 700 | | | | 9 274 | | | | 3.7 | % |
Northern Cape | | | 2 227 | | | | 2 497 | | | | 2 765 | | | | 2 962 | | | | 3 256 | | | | 3 500 | | | | 3 731 | | | | 8.0 | % |
North West | | | 6 366 | | | | 6 869 | | | | 7 389 | | | | 7 986 | | | | 8 690 | | | | 9 342 | | | | 9 958 | | | | 7.6 | % |
Western Cape | | | 6 432 | | | | 7 460 | | | | 8 443 | | | | 9 329 | | | | 9 944 | | | | 10 690 | | | | 11 395 | | | | 6.9 | % |
| | | | | | | | | | | | | | | | | | | | | | | | | | | | | | | | |
Total | | | 79 260 | | | | 87 493 | | | | 95 962 | | | | 104 239 | | | | 113 007 | | | | 121 482 | | | | 129 494 | | | | 7.5 | % |
| | | | | | | | | | | | | | | | | | | | | | | | | | | | | | | | |
| 1. | Includes expenditure on war veterans grant |
| | |
| | The child support grant was the largest programme by number of beneficiaries (11.4 million) in 2012/13 and the old age grant was the largest by expenditure (R40.5 billion). There has been strong growth in expenditure on both grants in recent years due to an expansion of the eligibility criteria. There has also been strong growth in expenditure on the foster care and care dependency grants. Spending on the disability grant, on the other hand, has moderated in recent years and will continue to do so over the spending period ahead. |
| |
| Additional support for provincial welfare services | | The Department of Social Development receives R120 million (R30 million in 2013/14, R40 million in 2014/15 and R50 million in 2015/16) to support the Zero Hunger and Food for All campaigns. To strengthen provincial social welfare services, R938 million is allocated over the medium term to employ social workers, and R600 million is allocated to NGOs to offset reductions in donor funding. Funds are made available to absorb social work graduates in response to a nationwide shortage of social workers. Education, sport and culture Expenditure on education, sport and culture will grow at an average annual rate of 6.2 per cent over the MTEF period, from R220.9 billion in 2012/13 to R264.9 billion in 2015/16. |
122
CHAPTER 8: MEDIUM-TERM EXPENDITURE AND DIVISION OF REVENUE
Table 8.10 Education, sport and culture expenditure, 2009/10 – 2015/16
| | | | | | | | | | | | | | | | | | | | | | | | | | | | | | | | |
| | | 2009/10 | | | 2010/11 | | | 2011/12 | | | 2012/13 | | | 2013/14 | | | 2014/15 | | | 2015/16 | | | MTEF | |
R million | | | | | Outcome | | | | | | Revised
estimate | | | Medium-term estimates | | | Average
annual
growth | |
National departments | | | 20 757 | | | | 21 463 | | | | 24 118 | | | | 27 428 | | | | 33 097 | | | | 36 400 | | | | 38 616 | | | | 12.1 | % |
Provinces | | | 129 859 | | | | 141 796 | | | | 160 742 | | | | 171 621 | | | | 179 010 | | | | 189 248 | | | | 203 677 | | | | 5.9 | % |
Public entities | | | 12 396 | | | | 14 234 | | | | 14 242 | | | | 21 867 | | | | 20 423 | | | | 21 602 | | | | 22 606 | | | | 1.1 | % |
| | | | | | | | | | | | | | | | | | | | | | | | | | | | | | | | |
Total | | | 163 012 | | | | 177 494 | | | | 199 101 | | | | 220 916 | | | | 232 530 | | | | 247 250 | | | | 264 899 | | | | 6.2 | % |
| | | | | | | | | | | | | | | | | | | | | | | | | | | | | | | | |
Of which: | | | | | | | | | | | | | | | | | | | | | | | | | | | | | | | | |
Provincial compensation of employees | | | 99 257 | | | | 109 857 | | | | 122 141 | | | | 130 871 | | | | 137 915 | | | | 146 998 | | | | 158 336 | | | | 6.6 | % |
University subsidies | | | 15 258 | | | | 17 163 | | | | 19 340 | | | | 20 419 | | | | 21 692 | | | | 23 072 | | | | 24 634 | | | | 6.5 | % |
National Student Financial Aid Scheme | | | 1 639 | | | | 1 875 | | | | 3 009 | | | | 5 686 | | | | 6 125 | | | | 6 447 | | | | 6 697 | | | | 5.6 | % |
School infrastructure backlogs grant | | | — | | | | — | | | | 76 | | | | 1 277 | | | | 1 956 | | | | 3 170 | | | | 2 912 | | | | 31.6 | % |
Education infrastructure grant | | | 3 885 | | | | 3 163 | | | | 5 311 | | | | 5 587 | | | | 6 631 | | | | 7 161 | | | | 10 059 | | | | 21.7 | % |
| | |
Over this period, the basic education sector will focus on improving numeracy and literacy, expanding enrolment in grade R and reducing school infrastructure backlogs. The Department of Higher Education and Training will seek to improve throughput rates at universities and further education and training colleges. The arts and sport sector will focus on the Mzansi golden economy job-creation projects and the implementation of the new national sports plan. Due to implementation delays, the school infrastructure backlogs grant has been rescheduled (and some funding has been reprioritised) to align spending with the department’s capacity to implement school building projects. The school infrastructure backlogs programme will now be completed over a five-year period instead of over three years. The school infrastructure backlogs grant is allocated R8 billion over the MTEF period and the education infrastructure grant is allocated R23.9 billion. The R7.2 billion reprioritised from the school infrastructure backlogs grant has been allocated as follows: R1.65 billion for new universities in Mpumalanga and the Northern Cape, R1.1 billion for the community library services grant and R4.47 billion to the education infrastructure grant. | | A focus on expanding numeracy and literacy in basic education and expanding grade R |
| |
| Transfers to higher education institutions increase from R20.4 billion in 2012/13 to R24.6 billion in 2015/16 to accommodate higher university enrolment, renew infrastructure and improve teaching. Supported by the National Student Financial Aid Scheme, which provides bursaries and loans to students from low-income backgrounds, the total number of students enrolled in higher education institutions is expected to increase from 909 716 in 2012/13 to 988 888 in 2015/16. The number of graduates is also projected to increase, from 167 807 to 200 315 over the same period. | | Financial aid will boost student numbers in higher education by nearly 80 000 over next three years |
123
2013 BUDGET REVIEW
| | |
| | Economic services and environmental protection Expenditure on economic services and environmental protection will grow at an average annual rate of 6.7 per cent over the spending period, from R44.1 billion in 2012/13 to R53.5 billion in 2015/16. |
| |
| Economic competitiveness and support package grows by nearly 11 per cent a year | | The Department of Trade and Industry will oversee the economic competitiveness and support package and promote industrial development while broadening economic participation. Over the medium term, expenditure is expected to grow to R11.4 billion, at an average annual rate of 10.9 per cent. This includes R5.5 billion for the manufacturing competiveness enhancement programme and R2.1 billion for special economic zones. |
Table 8.11 Economic services and environmental protection expenditure, 2009/10 – 2015/16
| | | | | | | | | | | | | | | | | | | | | | | | | | | | | | | | |
| | | 2009/10 | | | 2010/11 | | | 2011/12 | | | 2012/13 | | | 2013/14 | | | 2014/15 | | | 2015/16 | | | MTEF | |
R million | | | | | Outcome | | | | | | Revised
estimate | | | Medium-term estimates | | | Average
annual
growth | |
National departments | | | 13 437 | | | | 14 635 | | | | 15 706 | | | | 18 897 | | | | 20 612 | | | | 21 388 | | | | 23 636 | | | | 7.7 | % |
Provinces | | | 14 428 | | | | 14 539 | | | | 15 501 | | | | 16 739 | | | | 18 463 | | | | 19 376 | | | | 20 065 | | | | 6.2 | % |
Public entities | | | 5 076 | | | | 6 218 | | | | 7 844 | | | | 8 423 | | | | 8 892 | | | | 9 474 | | | | 9 787 | | | | 5.1 | % |
| | | | | | | | | | | | | | | | | | | | | | | | | | | | | | | | |
Total | | | 32 940 | | | | 35 392 | | | | 39 052 | | | | 44 060 | | | | 47 967 | | | | 50 238 | | | | 53 489 | | | | 6.7 | % |
| | | | | | | | | | | | | | | | | | | | | | | | | | | | | | | | |
Of which: | | | | | | | | | | | | | | | | | | | | | | | | | | | | | | | | |
Land reform | | | 2 570 | | | | 1 937 | | | | 3 318 | | | | 3 284 | | | | 3 395 | | | | 3 474 | | | | 3 530 | | | | 2.4 | % |
Trade and industry–incentive development | | | 3 338 | | | | 2 793 | | | | 3 284 | | | | 4 451 | | | | 5 543 | | | | 5 646 | | | | 6 704 | | | | 14.6 | % |
Food security and agrarian reform | | | 901 | | | | 1 048 | | | | 1 249 | | | | 1 411 | | | | 1 598 | | | | 1 709 | | | | 1 787 | | | | 8.2 | % |
| | |
| | The Economic Development Department promotes economic development and decent work through development finance initiatives and competition policy. The department receives R450 million from the economic competitiveness and support package to capitalise the Small Enterprise Finance Agency. The department also supports the Presidential Infrastructure Coordinating Commission. |
| |
| Support for economic competitiveness and support package | | The Department of Environmental Affairs receives R1.2 billion over the spending period from the economic competitiveness and support package. This includes R344 million for the oceans and coasts research programme, R300 million for the Green Fund and R390 million for South African National Parks to improve infrastructure and equipment. The park service also receives R75 million over the medium term to combat rhinoceros poaching. Environmental programmes funded by the department will continue to be an integral part of government’s public employment strategy. |
| |
| Support to settle land restitution claims and speed up land reform | | Spending by the Department of Rural Development and Land Reform will increase by an annual average of 4.6 per cent over the medium term to settle land restitution claims, speed up the land reform process, assist distressed farms and acquire land. A new animal and veld management programme has been introduced to support farmers. |
124
CHAPTER 8: MEDIUM-TERM EXPENDITURE AND DIVISION OF REVENUE
| | |
| The allocation to the Department of Science and Technology grows from R15.1 billion in 2012/13 to R18.9 billion in 2015/16 and includes R2 billion to support the Square Kilometre Array project. Allocations to human capital development and research and infrastructure grow by 17.8 per cent and 19.8 per cent respectively. | | |
Table 8.12 Science and technology expenditure, 2009/10 – 2015/16
| | | | | | | | | | | | | | | | | | | | | | | | | | | | | | | | |
| | | 2009/10 | | | 2010/11 | | | 2011/12 | | | 2012/13 | | | 2013/14 | | | 2014/15 | | | 2015/16 | | | MTEF | |
R million | | | | | Outcome | | | | | | Revised
estimate | | | Medium-term estimates | | | Average
annual
growth | |
National departments | | | 3 507 | | | | 3 360 | | | | 3 691 | | | | 4 067 | | | | 4 616 | | | | 4 716 | | | | 5 565 | | | | 11.0 | % |
Public entities | | | 7 712 | | | | 9 291 | | | | 10 021 | | | | 11 030 | | | | 11 679 | | | | 12 678 | | | | 13 361 | | | | 6.6 | % |
| | | | | | | | | | | | | | | | | | | | | | | | | | | | | | | | |
Total | | | 11 220 | | | | 12 651 | | | | 13 713 | | | | 15 096 | | | | 16 294 | | | | 17 394 | | | | 18 926 | | | | 7.8 | % |
| | | | | | | | | | | | | | | | | | | | | | | | | | | | | | | | |
Of which: | | | | | | | | | | | | | | | | | | | | | | | | | | | | | | | | |
Square Kilometre Array | | | 502 | | | | 13 | | | | 11 | | | | 231 | | | | 641 | | | | 661 | | | | 715 | | | | 45.8 | % |
Human capital and science platforms | | | 1 119 | | | | 1 244 | | | | 1 408 | | | | 1 434 | | | | 1 707 | | | | 1 858 | | | | 2 346 | | | | 17.8 | % |
Research and infrastructure | | | 449 | | | | 485 | | | | 531 | | | | 603 | | | | 738 | | | | 792 | | | | 1 036 | | | | 19.8 | % |
| | |
| Over the medium term, the Department of Mineral Resources will review the Mining Charter, enhance beneficiation and rehabilitate 32 derelict and ownerless mines. The Department of Agriculture, Forestry and Fisheries will support smallholder farmers through the comprehensive agricultural support, landcare and Ilima/Letsema programmes. | | Review of Mining Charter to be conducted over the medium term |
Transport, energy and communications Expenditure on transport, energy and communications will grow at an average annual rate of 10.2 per cent over the MTEF, from R79.2 billion in 2012/13 to R105.9 billion in 2015/16. Transport is the major contributor to expenditure in this function. The allocation to the Department of Transport increases from R42.3 billion to R53.4 billion over the three-year period, reflecting growth in the allocation to the Passenger Rail Agency and further investment in the national road network by the South African National Roads Agency Limited. Allocations for integrated public transport networks in urban areas increase at an average annual rate of 7.2 per cent over the MTEF period, and there is strong growth in the allocation for provincial road maintenance. | | |
| |
| The integrated national electrification grant will grow by R2.7 billion to increase the number of new electricity connections by 645 000 over the spending period. In addition, distribution upgrades will be supported by a pilot programme for municipalities where infrastructure is in critical condition. The solar water geyser programme has been rescheduled to run until 2015/16 and Sentech will receive R599.1 million over the medium term for the migration from analogue to digital terrestrial television. | | New electricity connections to grow by 645 000 by 2015/16 |
125
2013 BUDGET REVIEW
Table 8.13 Transport, energy and communications expenditure, 2009/10 – 2015/16
| | | | | | | | | | | | | | | | | | | | | | | | | | | | | | | | |
| | | 2009/10 | | | 2010/11 | | | 2011/12 | | | 2012/13 | | | 2013/14 | | | 2014/15 | | | 2015/16 | | | MTEF | |
R million | | | | | Outcome | | | | | | Revised
estimate | | | Medium-term estimates | | | Average
annual
growth | |
National departments | | | 39 793 | | | | 31 034 | | | | 13 077 | | | | 13 912 | | | | 16 410 | | | | 17 738 | | | | 18 690 | | | | 10.3 | % |
Provinces | | | 28 438 | | | | 26 251 | | | | 27 715 | | | | 29 631 | | | | 30 156 | | | | 32 705 | | | | 36 156 | | | | 6.9 | % |
Public entities | | | 33 638 | | | | 30 276 | | | | 31 014 | | | | 35 641 | | | | 42 057 | | | | 46 529 | | | | 51 044 | | | | 12.7 | % |
| | | | | | | | | | | | | | | | | | | | | | | | | | | | | | | | |
Total | | | 101 869 | | | | 87 561 | | | | 71 806 | | | | 79 184 | | | | 88 623 | | | | 96 972 | | | | 105 890 | | | | 10.2 | % |
| | | | | | | | | | | | | | | | | | | | | | | | | | | | | | | | |
Of which: | | | | | | | | | | | | | | | | | | | | | | | | | | | | | | | | |
Rail transport | | | 10 528 | | | | 9 260 | | | | 9 532 | | | | 10 296 | | | | 11 241 | | | | 14 687 | | | | 18 024 | | | | 20.5 | % |
Electrification and energy programme management | | | 2 559 | | | | 2 782 | | | | 3 286 | | | | 3 170 | | | | 3 943 | | | | 4 224 | | | | 5 917 | | | | 23.1 | % |
ICT infrastructure support | | | 303 | | | | 109 | | | | 437 | | | | 235 | | | | 581 | | | | 126 | | | | 58 | | | | -37.2 | % |
| | |
| | Local government, housing and community amenities |
New investment in bulk water, water treatment and distribution at local level | | Consolidated expenditure on local government, housing and community amenities will grow at an average annual rate of 10.1 per cent over the MTEF, from R119 billion in 2012/13 to R158.7 billion in 2015/16. The largest increases in expenditure relate to bulk water, water treatment and distribution, and allocations to the local government equitable share. Through reprioritisation from the municipal infrastructure grant and an additional medium-term allocation, R4.3 billion is allocated to a new municipal water infrastructure grant in the Department of Water Affairs, providing for water treatment, distribution, demand management and support for rural municipalities. Over the MTEF period, R12.6 billion is allocated for bulk infrastructure, and the Municipal Infrastructure Support Agency receives R820.3 million to provide technical support to rural and low-capacity municipalities to build basic infrastructure. |
Funding for housing includes support for informal settlement upgrading in mining towns | | Funding for improving human settlements will grow from R26.2 billion to R30.5 billion over the spending period, including R1.1 billion to support the informal settlement upgrading programme in mining towns. Social housing receives an additional allocation of R685 million. |
Table 8.14 Local government, housing and community amenities expenditure, 2009/10 – 2015/16
| | | | | | | | | | | | | | | | | | | | | | | | | | | | | | | | |
| | | 2009/10 | | | 2010/11 | | | 2011/12 | | | 2012/13 | | | 2013/14 | | | 2014/15 | | | 2015/16 | | | MTEF | |
R million | | | | | Outcome | | | | | | Revised
estimate | | | Medium-term estimates | | | Average
annual
growth | |
National departments | | | 51 740 | | | | 61 001 | | | | 68 877 | | | | 78 284 | | | | 85 087 | | | | 93 108 | | | | 102 403 | | | | 9.4 | % |
Provinces | | | 16 084 | | | | 18 511 | | | | 20 601 | | | | 21 271 | | | | 23 407 | | | | 24 590 | | | | 25 794 | | | | 6.6 | % |
Public entities | | | 13 640 | | | | 15 711 | | | | 19 401 | | | | 19 467 | | | | 23 590 | | | | 29 279 | | | | 30 545 | | | | 16.2 | % |
| | | | | | | | | | | | | | | | | | | | | | | | | | | | | | | | |
Total | | | 81 464 | | | | 95 223 | | | | 108 879 | | | | 119 022 | | | | 132 084 | | | | 146 976 | | | | 158 743 | | | | 10.1 | % |
| | | | | | | | | | | | | | | | | | | | | | | | | | | | | | | | |
Of which: | | | | | | | | | | | | | | | | | | | | | | | | | | | | | | | | |
Water–regional implementation | | | 3 063 | | | | 3 499 | | | | 4 376 | | | | 5 154 | | | | 5 983 | | | | 7 685 | | | | 9 772 | | | | 23.8 | % |
Housing development finance | | | 16 012 | | | | 18 461 | | | | 22 114 | | | | 24 244 | | | | 27 377 | | | | 29 451 | | | | 31 957 | | | | 9.6 | % |
Intergovernmental relations | | | 23 937 | | | | 30 664 | | | | 33 271 | | | | 37 609 | | | | 40 707 | | | | 44 621 | | | | 50 343 | | | | 10.2 | % |
126
CHAPTER 8: MEDIUM-TERM EXPENDITURE AND DIVISION OF REVENUE
Paying for water
Government’s long-term infrastructure plans require a set of funding mechanisms that do not impose a major burden on the fiscus. The water sector illustrates how financial responsibility for infrastructure can be shared.
Municipalities collect revenues from end-users for the water they consume, while equitable share allocations support the provision of free basic water to low-income households. Revenues from user charges are used to cover operating costs and to expand and maintain infrastructure. Operating costs include the cost of bulk water purchased from water boards, or (if municipalities do the purification themselves) the raw water that they purchase from the Department of Water Affairs and the costs of purification. Other costs relate to operations, maintenance and customer services, such as billing and collections. In addition, municipalities need to invest in expanding distribution infrastructure into new areas; the revenues they receive may be used to pay for the expansions or to service the debt incurred to finance such expansions.
Water boards use the revenues they receive from municipalities for the purchase of bulk water to cover the costs of their raw water purchases, purification and energy costs, and to invest in new infrastructure. Similarly, the Department of Water Affairs transfers some of the funds that it generates from the sale of raw water to the Trans-Caledon Tunnel Authority to repay the costs associated with bulk water transfer schemes. The remaining funds are used to cover operating costs.
The development of most raw water infrastructure, such as dams and pipelines, is initially financed by the fiscus, and then generates revenue for maintenance and further expansion through water charges.
| | |
General public services The budget for general public services grows from R53.8 billion in 2012/13 to R64.9 billion in 2015/16, while provincial spending will increase from R17 billion in 2013/14 to R20 billion in 2015/16. The South African Revenue Service will receive R9 billion per year over the spending period to expand operations. The allocation to the Department of International Relations and Cooperation will increase from R5.3 billion in 2012/13 to R6.2 billion in 2015/16 to enhance southern African integration. | | |
| The Department of Public Works reprioritised R464 million over the medium term to fund its turnaround strategy, which focuses on lease and property management portfolios. The Department of Public Enterprises receives R34.2 million over the spending period to improve monitoring and oversight of state-owned entities, while the Public Service Commission receives R71.4 million to combat corruption and address grievances. | | Turnaround at Public Works focuses on lease and property management portfolios |
Table 8.15 General public services expenditure, 2009/10 – 2015/16
| | | | | | | | | | | | | | | | | | | | | | | | | | | | | | | | |
| | | 2009/10 | | | 2010/11 | | | 2011/12 | | | 2012/13 | | | 2013/14 | | | 2014/15 | | | 2015/16 | | | MTEF | |
R million | | | | | Outcome | | | | | | Revised
estimate | | | Medium-term estimates | | | Average
annual
growth | |
National departments | | | 15 453 | | | | 10 865 | | | | 12 764 | | | | 10 509 | | | | 9 620 | | | | 10 434 | | | | 10 037 | | | | -1.5 | % |
Provinces | | | 13 652 | | | | 14 670 | | | | 15 481 | | | | 16 838 | | | | 18 236 | | | | 19 244 | | | | 20 473 | | | | 6.7 | % |
Public entities | | | 19 584 | | | | 20 968 | | | | 24 656 | | | | 26 439 | | | | 28 861 | | | | 31 886 | | | | 34 400 | | | | 9.2 | % |
| | | | | | | | | | | | | | | | | | | | | | | | | | | | | | | | |
Total | | | 48 689 | | | | 46 504 | | | | 52 902 | | | | 53 787 | | | | 56 717 | | | | 61 565 | | | | 64 910 | | | | 6.5 | % |
| | | | | | | | | | | | | | | | | | | | | | | | | | | | | | | | |
Of which: | | | | | | | | | | | | | | | | | | | | | | | | | | | | | | | | |
Infrastructure 1 | | | 5 501 | | | | 6 042 | | | | 6 172 | | | | 6 152 | | | | 4 312 | | | | 4 664 | | | | 5 043 | | | | -6.4 | % |
ICT projects 2 | | | 2 076 | | | | 2 284 | | | | 2 428 | | | | 2 257 | | | | 2 636 | | | | 2 868 | | | | 2 590 | | | | 4.7 | % |
International relations 3 | | | 3 573 | | | | 3 138 | | | | 3 597 | | | | 4 059 | | | | 4 486 | | | | 4 788 | | | | 5 028 | | | | 7.4 | % |
| 1. | Spending on infrastructure projects in the Departments of Public Works and International Relations and Cooperation |
| 2. | Spending on information, communication and technology projects in the Departments of Home Affairs, National Treasury and Public Service and Administration |
| 3. | Spending on international relations in the Departments of International Relations and Cooperation, Public Service and Administration and National Treasury |
127
2013 BUDGET REVIEW
| | |
| | Over the MTEF period, the Department of Home Affairs will spend R1 billion on its information systems modernisation programme, which has already led to substantial reductions in the time required to produce official documents. |
| |
| | Defence, public order and safety Expenditure on defence, public order and safety will grow at an average annual rate of 6.4 per cent over the MTEF, from R142.5 billion in 2012/13 to R171.7 billion in 2015/16. |
Table 8.16 Defence, public order and safety expenditure, 2009/10 – 2015/16
| | | | | | | | | | | | | | | | | | | | | | | | | | | | | | | | |
| | | 2009/10 | | | 2010/11 | | | 2011/12 | | | 2012/13 | | | 2013/14 | | | 2014/15 | | | 2015/16 | | | MTEF | |
R million | | | | | Outcome | | | | | | Revised
estimate | | | Medium-term estimates | | | Average
annual
growth | |
National departments | | | 104 639 | | | | 111 754 | | | | 123 086 | | | | 135 066 | | | | 144 725 | | | | 153 290 | | | | 161 636 | | | | 6.2 | % |
Provinces | | | 1 964 | | | | 3 525 | | | | 3 653 | | | | 4 176 | | | | 4 624 | | | | 4 856 | | | | 5 039 | | | | 6.5 | % |
Public entities | | | 3 227 | | | | 3 585 | | | | 3 081 | | | | 3 291 | | | | 4 344 | | | | 4 744 | | | | 5 070 | | | | 15.5 | % |
| | | | | | | | | | | | | | | | | | | | | | | | | | | | | | | | |
Total | | | 109 830 | | | | 118 864 | | | | 129 820 | | | | 142 533 | | | | 153 694 | | | | 162 889 | | | | 171 745 | | | | 6.4 | % |
| | | | | | | | | | | | | | | | | | | | | | | | | | | | | | | | |
Of which: | | | | | | | | | | | | | | | | | | | | | | | | | | | | | | | | |
Court services | | | 4 129 | | | | 4 285 | | | | 4 620 | | | | 5 377 | | | | 5 862 | | | | 6 224 | | | | 6 501 | | | | 6.5 | % |
Detective services | | | 8 449 | | | | 10 120 | | | | 11 917 | | | | 13 543 | | | | 14 349 | | | | 15 121 | | | | 15 923 | | | | 5.5 | % |
Offender management | | | 1 164 | | | | 1 338 | | | | 1 500 | | | | 1 431 | | | | 1 550 | | | | 1 653 | | | | 1 759 | | | | 7.1 | % |
| | |
| | The Department of Defence has deployed 400 defence force personnel to the Central African Republic at a total cost of R415 million in 2013/14 and 2014/15. The department has also allocated R1.7 billion over the medium term to fight piracy in the Mozambique Channel and R300 million to improve border security. The Department of Military Veterans receives R1.3 billion for veterans’ benefits. The Department of Police has reprioritised R2.5 billion over the MTEF to improve detective and forensic capability. The Department of Justice and Constitutional Development receives R1.2 billion for the criminal justice sector revamp and modernisation programme. The Public Protector of South Africa receives R24 million to increase its investigative capacity and R45 million goes to Legal Aid South Africa to improve legal representation for the poor. Additional funds are also made available to the South African Human Rights Commission to increase capacity and to the National Prosecuting Authority for the Thuthuzela Care Centres. ¢ Conclusion |
Over the next three years, government will learn to do more with less | | All levels of government have responded to the fiscal challenges facing South Africa. National departments, provinces and local government have revised their spending plans and reprioritised funds to ensure key objectives are achieved and well-performing programmes are supported. Expenditure plans reflect both the medium-term investment plans and long-term goals identified in the National Development Plan. Over the next three years, government will learn to do more with less. The efficiencies that are established will protect public finances and enable the country to accelerate development when economic conditions improve. |
128
ANNEXURES
In addition to the material published in the Budget Review, the following annexures are available at www.treasury.gov.za:
| | • | | Annexure W1: Explanatory memorandum to the division of revenue |
| | • | | Annexure W2: Structure of the government accounts |
| | • | | Annexure W3: Further details on Gateway to Africa reforms |
129
2013 BUDGET REVIEW
This page has been left blank intentionally.
130
A
Report of the Minister of
Finance to Parliament
Section 7(4) of the Money Bills Amendment Procedure and Related Matters Act (2009, the Act) prescribes that the Minister of Finance (the Minister) must submit a report to Parliament at the time of the budget explaining how the Division of Revenue Bill and the national budget give effect to, or the reasons for not taking into account, the recommendations contained in:
| | • | | Budgetary review and recommendation (BRR) reports submitted by committees of the National Assembly in terms of section 5 of the Act. |
| | • | | Reports on the fiscal framework proposed in the Medium Term Budget Policy Statement (MTBPS) submitted by the finance committees in terms of section 6 of the Act. |
| | • | | Reports on the proposed division of revenue and the conditional grant allocation to provinces and local governments set out in the MTBPS submitted by the appropriations committees in terms of section 6 of the Act. |
| | ¢ | | Budgetary review and recommendation reports |
Section 5 of the Act sets out a procedure to be followed prior to the introduction of the national budget by the National Assembly, through its committees, for assessing the performance of each national department. The committees prepare BRR reports, which:
| | • | | Must provide an assessment of the department’s service-delivery performance given available resources. |
| | • | | Must provide an assessment of the effectiveness and efficiency of the department’s use and forward allocation of available resources. |
| | • | | May include recommendations on the forward use of resources. |
At the time of tabling the annual budget, the Minister is required to explain how the budget gives effect to these recommendations, or why they have not been taken into account.
131
2013 BUDGET REVIEW
The BRR reports were tabled by the relevant portfolio committees between October and December 2012. Due to the large number of BRR reports, a separate document will be tabled in Parliament with detailed responses to the portfolio committees’ recommendations. In many cases, however, the different committees have made the same recommendations to a number of departments. This report contains a summary of these overarching concerns, drawing on responses to the specific issues raised in each committee’s report set out in the detailed document.
General issues
| | • | | Accelerated recruitment: Departments must speed up the process of filling vacant positions, especially the recruitment of high-level staff. |
| | • | | Reducing staff turnover: Departments need to tackle high rates of staff turnover, for example, through human-resource development strategies. |
| | • | | Realistic targets: Departments need to establish feasible targets in their annual performance plans that are aligned to their core objectives and budgets. |
| | • | | Quarterly reporting: The importance of quarterly reporting of financial performance in many departments was underlined. |
| | • | | Auditor-General recommendations: Departments should work more closely with the Auditor-General and abide by its recommendations. |
| | • | | Performance agreements: All departments should have staff performance agreements in place. |
| | • | | Greater coordination across government: Greater coordination of activities and strategic planning is required across national departments and the three spheres of government. |
| | • | | Strengthen information and communications technology: Departments need to strengthen their information and communications technology to improve the quality of data on spending and performance. |
| | • | | Disabled workers: Departments must remain committed to employing people with disabilities. |
| | • | | Monitoring and evaluation: Departments must establish mechanisms for monitoring and evaluating their programmes, with measurable objectives and clear timeframes. |
| | • | | Stronger internal audit and financial controls: Internal audit capacity and risk-management systems should be strengthened in a number of departments to ensure compliance with relevant legislation. Financial controls are needed to reduce irregular or fraudulent spending. |
| | • | | Better supply chain management: Departments should focus on proper supply chain management to combat corruption. |
| | • | | Abide by previous BRR reports: Departments should abide by the BRR report recommendations. |
| | ¢ | | Reports without recommendations |
The following reports did not have any recommendations:
| | • | | Standing Committee on Appropriations on the 2012 Division of Revenue Amendment Bill |
| | • | | Select Committee on Appropriations on the proposed division of revenue and conditional grant allocations in the 2012 MTBPS |
| | • | | Select Committee on Appropriations on the 2012 Division of Revenue Amendment Bill. |
The Minister thanks these committees and all those that made recommendations for their important contribution to the Budget process.
132
ANNEXURE A: REPORT OF THE MINISTER OF FINANCE TO PARLIAMENT
| | ¢ | | Recommendations of the Standing Committee on Appropriations on the 2012 MTBPS |
Savings and underspending
The National Treasury reports to Parliament on declared savings and projected underspending by departments and the effect thereof on performance targets of departments.
The Adjusted Estimates of National Expenditure, which are published in October each year at the time of the MTBPS, report on declared savings and (where possible) projected underspending. The National Treasury agrees that, in future, the Adjusted Estimates of National Expenditure guidelines and template should show where savings and underspending have implications for service delivery.
Implementing agents for infrastructure programmes
The National Treasury reports to Parliament on the minimisation of costs associated with the employment of implementing agents for delivery of infrastructural programmes.
The National Treasury recognises the importance of ensuring that implementing agents employed by the public sector deliver their services cost-effectively. The National Treasury oversees departmental spending through the annual budget process, but the responsibility for overseeing contractors that departments or state-owned companies have engaged remains with those entities. The Public Finance Management Act (1999) and Municipal Finance Management Act (2003) require that accounting officers at public entities are responsible for ensuring value for money and cost-effectiveness in their duties. The National Treasury will further support departments and public entities with the appointment of a Chief Procurement Officer, whose office will build new capacity to assess the cost-effectiveness of large programmes.
A critical aspect in achieving cost-effectiveness is to improve the public sector’s capacity and competence in managing both projects and the implementing agents that participate in project delivery. The first step to achieving this is to improve the planning process in departments and entities, where projects are evaluated thoroughly and costed reliably. This provides a sound foundation for procuring contractors, with contracts set at realistic values, and a basis against which capital expenditure can be monitored. Contracts should address cost overruns, either through penalty clauses or by transferring full responsibility for cost overruns to providers.
Proper management of implementing agents is key to ensuring that projects are kept on-track, on-budget and to specification. The National Treasury assists with building capacity and competence in these areas through the infrastructure development management system and the infrastructure development improvement programme. The programme is a capacity-building initiative, which targets key infrastructure-delivery organs of state, such as the national and provincial departments of health, education, public works and treasuries.
Reviewing the medium-term expenditure framework (MTEF) budgeting framework
The National Treasury reports to Parliament on the possibility of reviewing the MTEF budgeting framework so as to strengthen the management, planning and spending in government departments to ensure credible budgets.
The National Treasury constantly reviews South Africa’s budgeting process to strengthen it where possible. The current MTEF budgeting framework incorporates the three previous years, the current financial year and the three future years. This rolling budget means that planning for the outer year must take place at least two years in advance. This focuses the management of the budget over the MTEF period. The National Treasury interrogates the budget and departmental spending information throughout the year. This information affects the proposed budget allocations for future years. It is through this methodology that the National Treasury continues to strengthen management, planning and spending in government departments.
133
2013 BUDGET REVIEW
Stemming from the view that better planning during budget formulation will lead to better management of resources and spending during budget execution, the National Treasury continues to play an active role in the implementation of the Framework for Strategic Plans and Annual Performance Plans. The National Treasury is collaborating with the Department of Performance Monitoring and Evaluation in this regard.
Accountability of transferring entities
The National Treasury puts in place measures to ensure that transferring entities are held accountable for the administration and performance of the conditional grants.
The roles and responsibilities of transferring national officers are clearly defined in the annual Division of Revenue Act. Additional, grant-specific responsibilities of national departments are contained in the frameworks for each grant. Each department must submit to the National Treasury monthly financial performance reports and quarterly non-financial performance reports on the grants it administers. These reports are also shared with Parliament on a quarterly basis to facilitate parliamentary oversight of national departments.
Based on information from this monitoring system, the National Treasury has quarterly meetings with national departments to discuss the performance of the grants they administer. These meetings provide a forum for the National Treasury to suggest actions that national departments can take to improve the performance of underperforming grants and to hold departments accountable if such measures are not implemented. Where necessary, departments are requested to add reviews of underperforming grants to their list of responsibilities in the grant framework. This is used as another mechanism to hold departments accountable for completing the work necessary to improve the grant’s performance.
| | ¢ | | Recommendations of the Standing Committee on Appropriations on the Adjustments Appropriation Bill |
Infrastructure planning
The Minister of Finance ensures that the National Treasury considers incorporating a clause into the Appropriation Bill to enforce planning as a requirement for infrastructure programmes.
Adequate planning should precede the proposal of an appropriation of funds in an Appropriation Bill. Section 30 of the draft Treasury Regulations published in the Government Gazette No. 35939 (30 November 2012) governs supply chain management for the delivery and maintenance of infrastructure. This includes a requirement that infrastructure must be provided in line with accepted norms and standards.
| | ¢ | | Joint recommendations of the Standing and Select Committees on Finance on the Revised Fiscal Framework for 2012 |
Expenditure monitoring
The National Treasury should develop mechanisms to increase monitoring to ensure value for money in terms of proper coordination and procurement processes, which will assist the containment of expenditure within the available budget.
134
ANNEXURE A: REPORT OF THE MINISTER OF FINANCE TO PARLIAMENT
Since the 2011 Budget process, government has adopted a functional approach to budgeting by grouping activities according to broad policy purpose or type of expenditure. Government institutions that contribute to achieving a particular function are grouped together in a workgroup, including national and provincial departments and their respective entities, so that they reach a common understanding of the function’s work.
These agreements are reflected in the budget submissions put forward by the different institutions. They also inform the analysis of the submissions and the proposed budget allocations. This approach promotes transparency and better coordination in the budget formulation process, and provides an opportunity for greater collaboration between departments, programme managers and public entities. The ongoing monitoring of institutional expenditure and performance during budget execution takes place within this setting.
Compensation spending
Government departments should monitor overspending on compensation of employees over time including managing of sick leave and efficient use of available staff in order to reduce personnel over time.
Government is putting mechanisms in place to oversee the filling of funded vacant posts and the reprioritisation of personnel budgets during the financial year. This will allow treasuries and other relevant stakeholders to monitor personnel budgets and prevent the filling of unfunded posts.
Ghost employees
The National Treasury should work together with the Public Service Commission in addressing the issue of “ghost” employees by, for example, rolling out the head count project that was piloted in Limpopo Province to the rest of the country.
The National Treasury agrees with this recommendation. It has already started discussions with provincial treasuries to ensure that Statistics South Africa will be called in if headcount verifications have not been undertaken by a credible service provider.
Departmental savings
Government, through the National Treasury, should develop plans/mechanisms to monitor the departmental savings without compromising the delivery of services.
In the budget guidelines issued by the National Treasury, departments and entities are tasked with identifying expenditure reductions in areas that will not affect service delivery. Reductions are sought from non-performing programmes and programmes that are not closely aligned to departmental/entity core mandates and policy priorities. Where expenditure reductions are effected in areas that have an impact on service delivery, this is generally due to the institution indicating that it will not be able to deliver in accordance with its original plans due to circumstances generally not linked to the availability of funds. In such cases, funds are reprioritised to areas where effective spending can take place within the respective budget cycle.
Under the Public Finance Management Act, departments need to report on their expenditure on a monthly basis. Treasury Regulation 5.3.1 requires accounting officers of institutions to establish procedures for quarterly reporting to an executive authority, including on performance, to facilitate effective monitoring, evaluation and corrective action. Throughout the budget cycle, departments and entities are required to show the impact of proposed expenditure and actual expenditure on key performance indicators.
135
2013 BUDGET REVIEW
| | ¢ | | Recommendations of the Select Committee on Finance on the Proposed Fiscal Framework for 2013 |
These are substantially the same recommendations as were made by the Standing Committee on Finance on the 2012 MTBPS.
Administered prices
The National Treasury should formulate a better planned and coordinated approach to the issues of affordability in decisions around administered prices and their effect on the cost of doing business, and report back to the House within 90 days of the adoption of this report by the House.
The Minister agrees that a more coordinated response to the formation of administered prices is both desirable and necessary. Administered prices provide a signal for production and consumption decisions, so it is critical that they are set at a level that ensures that demand and supply are balanced in the long term, investment funding is adequate and ratepayers receive value for money.
Managing the burden of administered prices on households and businesses requires balancing the benefits that individual users enjoy when receiving a service with the wider social and economic benefits that are enjoyed when people have access to services. The balance between user charges and taxpayer-funded subsidies for these services needs to be considered accordingly.
The National Treasury has analysed administered prices that affect households, as measured in the consumer price index – including water, electricity, waste management, assessment rates, tuition fees, petrol, licence fees and telecommunication fees. It has also investigated the impact on business of administered prices such as port and rail charges.
The current frameworks governing the setting of administered prices mean that price setters are generally focused on revenue generation and cost-recovery. Less attention is paid to improving spending efficiency or ensuring adequate maintenance to reduce final infrastructure costs. The devolved nature of much administered price-setting results in price applications that plan for infrastructure expenditure that may be highly ambitious and inappropriate considering the other competing pressures facing users. Engagement through the Economic Cluster can serve to enhance our understanding of these prices and improve the administered-price-setting framework.
Cross-border investment
The National Treasury should finalise a policy document on guidelines for cross-border investment in order to help contain a decline in foreign direct investment flows to the Republic of South Africa by 44 per cent in the 2011/12 financial year, and report back to the House within 90 days of the adoption of this report by the House.
The National Treasury is preparing a detailed response to the Select Committee’s request. The policy document will outline a number of reforms that will encourage foreign direct investment (FDI) within a context of broader policies to boost investment. These include modernising the tax system to simplify the tax treatment of investment and reducing tax and exchange control barriers to support trade with Africa, and pursuing an outward-oriented international policy, particularly focused on deepening economic relationships with Brazil, Russia, India and China.
The National Treasury strongly supports an investment environment free of uncertainty, with no bias in favour of or against foreign investors, and aligned to the objective of job-creating economic growth. The decline in FDI in 2011/12 is cause for concern, though the fall is somewhat overstated due to large inflows the year before. The focus should be broader than FDI, as portfolio capital flows are also important. In particular, inflows into the bond market allow South Africa to finance the fiscal deficit, while offshore borrowing is an important part of government’s funding programme.
136
ANNEXURE A: REPORT OF THE MINISTER OF FINANCE TO PARLIAMENT
A broader discussion is needed between the many departments that have an influence on the investment climate, such as the Department of Trade and Industry, the Department of Mineral Resources and the Department of Environmental Affairs. The National Treasury seeks the support of the Select Committee to engage with other relevant committees on this important area of policy.
Contingency plan to deal with downside risk in macroeconomic projections
The National Treasury should develop and provide the House with a contingency plan in the event that macroeconomic projections do not result as expected in the Proposed Fiscal Framework, and report back to the Standing Committee on Finance.
At the time of the 2012 MTBPS, the National Treasury wrote: “If … the substantial risks to the outlook materialise and the economic environment deteriorates, realising [the] fiscal objectives [of counter-cyclicality and debt sustainability] will require a reconsideration of current spending and revenue plans. [T]he necessary adjustments will avoid an unwarranted early withdrawal of fiscal support for the recovery.”
Since then, some of the risks to the economy outlined in the MTBPS have been realised. A weak recovery in the global economy, combined with domestic labour disruptions, has produced lower-than-expected economic and tax revenue growth. As a result, the 2012/13 budget deficit is now estimated at 5.2 per cent of GDP. This widening deficit is necessary to support the economy, but continued counter-cyclicality in the short term necessitates a stronger path of consolidation over the medium term.
To ensure fiscal sustainability, the National Treasury has taken steps to moderate growth in expenditure. First, programmes with particularly rapid forecast spending growth were identified, and where these had experienced difficulties in realising spending, additions to spending were reduced. In total, spending projections of national departments were reduced by R10 billion over the MTEF. Second, government has reduced the contingency reserve to a minimum level consistent with the historic needs of unforeseen and unavoidable expenditure.
Government will conduct two expenditure reviews over the coming year. The first will consider general public services (which includes executive and legislative services, financial and fiscal affairs, and foreign affairs). The second will consider personnel expenditure, with a particular emphasis on administrative and managerial hiring. The results will be incorporated into revised spending plans for the 2014 Budget. Expenditure measures will be complemented by a review of tax policy, which will consider whether revenue levels are sufficient to ensure fiscal sustainability over the longer term, and the potential impact of tax changes on growth, employment and equity.
Procurement processes
The National Treasury should develop mechanisms to increase monitoring and to ensure value for money in terms of proper coordination and procurement processes, which will assist the containment of expenditure within the available budget, and report back to the House within 90 days of the adoption of this report by the House.
The National Treasury is finalising a revised supply chain management regulatory framework. Compliance monitoring is being strengthened to maximise value-for-money and eliminate waste and abuse of the procurement system.
Other steps to improve procurement capacity and service delivery include reducing fragmentation and strengthening the national procurement architecture; strengthening the tax clearance system to ensure that those who have defrauded the state cannot do business with the state; and introducing measures to improve institutions’ ability to set up their bid committee structures for the invitation, evaluation and adjudication of tenders.
137
2013 BUDGET REVIEW
To intensify compliance monitoring and expenditure containment, institutions are required to submit tender programmes to relevant treasuries. Demand-management procurement plans are scrutinised against the tender programmes.
Regulations of the Preferential Procurement Policy Framework Act, which came into effect on 7 December 2011, are applicable to all organs of state, including state-owned enterprises, from 7 December 2012. These regulations are aligned with the Broad-Based Black Economic Empowerment Act (2003). They provide for the designation of certain sectors for local content and production to encourage industrial development and bolster job creation.
Managing the wage bill
The National Treasury should report on government’s approach to managing overall employment and moderate expenditure on compensation of employees, and report back to the House within 90 days of the adoption of this report by the House.
Government is committed to moderating growth in the wage bill and aligning it with improvements in productivity in the public sector. As a first step, government has negotiated a three-year wage agreement, which improves predictability of growth in the wage bill over the medium term. This allows government to focus on initiatives to improve the quality of personnel spending, including rationalising staff establishments, restraining growth in personnel numbers and better use of excess personnel. Over time, these measures will help shift the composition of public spending away from compensation of employees towards more productive areas.
Infrastructure spending
The National Treasury should report to the House on actual spending on infrastructure by government departments and
state-owned enterprises, within 90 days of the adoption of this report by the House.
The National Treasury publishes expenditure on infrastructure by government departments and state-owned enterprises each year in the Budget Review, which is released on the day of the annual Budget Speech in February. Information is provided by sphere of government – national, provincial, local – as well as by public-private partnerships, extra-budgetary institutions and state-owned enterprises, with a breakdown by the largest entities.
Economic impact of infrastructure projects
The National Treasury should facilitate development of an Infrastructure Investment Plan that, in turn, should determine how it would generate levels of economic activity, within 90 days of the adoption of this report by the House.
The National Treasury recognises the importance of South Africa’s infrastructure investment plans. Both the National Development Plan, with its direction on the country’s infrastructure priorities, and the Presidential Infrastructure Coordinating Commission, with its focus on providing impetus to the planning and implementation of major capital projects, give shape to the country’s national infrastructure plan. The National Treasury supports infrastructure initiatives by ensuring that infrastructure projects and programmes receive substantial finance, and through its various capacity-building initiatives, particularly the infrastructure development improvement programme.
138
B
Statistical tables
| 1 | Main budget: revenue, expenditure, budget balance and financing, 2006/07 to 2015/16 |
| 2 | Main budget: estimates of national revenue – summary of revenue, 1995/96 to 2015/16 |
| 3 | Main budget: estimates of national revenue – detailed classification of revenue, 2009/10 to 2013/14 |
| 4 | Main budget: expenditure defrayed from the National Revenue Fund by vote, 2009/10 to 2015/16 |
| 5 | Consolidated national, provincial and social security funds expenditure: economic classification, 2009/10 to 2015/16 |
| 6 | Consolidated national, provincial and social security funds expenditure: functional classification, 2009/10 to 2015/16 |
| 7 | Consolidated government revenue and expenditure by economic classification, 2009/10 to 2015/16 |
| 8 | Consolidated government expenditure by functional classification, 2009/10 to 2015/16 |
| 9 | Consolidated government revenue, expenditure and financing, 2009/10 to 2015/16 |
| 10 | Total debt of government, 1988/89 to 2015/16 |
| 11 | Financial guarantees: amounts drawn on government guarantees, 2009/10 to 2012/13 |
General remarks
This annexure presents details of the main budget, consolidated national and provincial expenditure, consolidated government expenditure, the borrowing requirement and financing thereof, government debt and financial guarantees. The relationship between budget categories is shown in the image below:
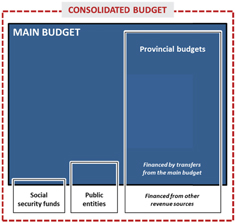
139
2013 BUDGET REVIEW
The government accounts are categorised according to government levels, from the main budget to the consolidated government account. The first is the main budget, which consists of receipts of the National Revenue Fund, expenditure either voted by Parliament or allocated by statutory appropriation and the financing of the deficit. It is the national budget, including transfers to other spheres of government as appropriated. The second is the consolidated national, provincial and social security funds, which consists of the main (national), the provincial and the social security funds budgets or expenditure. These budgets are aggregated and then the transfers between the three spheres are netted out to arrive at a total consolidated expenditure. The third is the consolidated government revenue, expenditure and financing, which includes national, provincial, social security funds, the Reconstruction and Development Programme (RDP) Fund and national public entities.
While government revenues are concentrated at national level, a large proportion of expenditure has shifted towards the provincial sphere since 1994. Equitable share transfers to the nine provinces as a statutory commitment of government began in 1998/99, and the 1998 Budget marked the introduction of the local government equitable share. The consolidated government account includes all the activities of national government, which includes existing and newly listed public entities. The consolidation also includes several business enterprises of national government.
Since more than 70 per cent of total expenditure on the 2013/14 main budget consists of transfer payments to other levels of general government, economic and functional classifications of national budget expenditure are not comprehensive. For purposes of analysis, it would be preferable to present economic and functional classifications of general government expenditure, but this would require information on expenditure at all levels of general government and on its financing through revenue, balances brought forward and transfer payments (mainly from the national budget). This information is not readily available for local government, making it impossible to present consolidated general government finances at the time of the national budget. Historical data on general government finances are, however, published by the Reserve Bank in its Quarterly Bulletin and by Statistics South Africa.
Treatment of foreign grants to the RDP Fund
Before 1999/00, foreign grants were paid to the National Revenue Fund and expenditure was included in departmental appropriations. From 1999/00 onwards, no foreign grants for RDP-related purposes have been included in national departments’ appropriations. All international technical assistance and other RDP-related grants are paid to the RDP Fund account, which is separated from government accounts. Departments incur expenditure on RDP-related projects by direct requisitions from this account. However, disbursements of foreign grants and technical assistance are included in the consolidated national and provincial expenditure estimates in Tables 5 and 6, and in the consolidated government expenditure in Table 7.
In 2002/03 and 2003/04, R117.5 million and R66.7 million respectively were included in revenue as grants received from international donors. These were contributions to defray expenditure on the Burundi peacekeeping mission, appropriated on the budget of the Department of Defence.
Prior-year adjustments due to function shifts
Function shifts implemented in previous budgets affect the presentation of the government accounts. These include:
| | • | | The establishment of the South African Social Security Agency (SASSA), responsible for administering the delivery of social assistance grants, resulted in function shifts between national and provincial government and public entities. The shifting of this function to national government resulted in transfers to provincial revenue funds being reclassified as transfers to households, and transfers to departmental agencies and accounts. |
| | • | | The introduction of an accommodation charge payable by national departments for the use of government properties, levied by the Property Management Trading Entity and included in the accounts of the Department of Public Works. As a result, the presentation of individual departments was amended to provide for these accommodation charges and a new trading entity was introduced for the Department of Public Works. |
140
ANNEXURE B: STATISTICAL TABLES
| | • | | Expenditure related to Regional Services Council levies, previously included as a departmental expenditure item, and in previous budgets presented as a transfer to local government forming part of the local government equitable share, was replaced by a direct charge financed by the general fuel levy and paid by the National Treasury to metropolitan municipalities. This adjustment was effected in the government accounts from 2006/07. |
| | • | | Up until 2008/09, payment of benefits to former employees for civil and military pensions and contributions to medical funds were classified as compensation of employees and transfers to households respectively. In 2009/10, in line with the international standard for classification, the Government Finance Statistics Manual (GFS 2001), it was determined that payment for medical benefits to former employees should also be classified as transfers to households, and the data in the Budget Review has been adjusted accordingly. |
Adjustments due to transactions in government debt
As part of the state’s active management of its debt portfolio, government bonds are repurchased or switched into new bonds. In the process, government may make a capital profit, which is a book entry change in the bond discount and is regarded as an extraordinary receipt. As such, capital profit does not represent actual cash flow and is regarded as a “book profit”, and recorded as a negative receipt and loan redemption for analysis purposes.
A premium may also be accrued, or be payable, in managing the debt portfolio or when entering into new loans. Premiums paid are accounted for as extraordinary payments and premiums received as extraordinary receipts.
Sources of information
The information in Tables 1 to 7 on national and provincial government and public entity finances is obtained from the following sources:
| | • | | Reports of the Auditor-General on the Appropriation and Miscellaneous Accounts. |
| | • | | Printed estimates of revenue and expenditure for the national and provincial budgets. |
| | • | | The Development Bank of Southern Africa (DBSA). |
| | • | | Annual statements of Inland Revenue and Customs and Excise (previously of the Department of Finance) and of the South African Revenue Service (SARS). |
| | • | | Monthly press releases of the National Treasury, published in terms of Section 32 of the Public Finance Management Act (1999). |
Main budget: revenue, expenditure, budget balance and financing (Table 1)
Table 1 summarises the main budget balances since 2006/07 and medium-term estimates to 2015/16. To be in line with the economic reporting format introduced in 2004/05, the revenue classification has been amended to show departmental sales of capital assets separately. These were previously included in non-tax current revenue.
Repayments of loans and advances, which were previously shown as negative expenditure, have been reclassified as revenue. Given that the same amount is added to both revenue and expenditure, the national budget deficit is unaffected.
Appropriations by vote are divided into current payments, transfers and subsidies, payments for capital assets and payments for financial assets. The provision for standing appropriations has been shifted from direct charges against the National Revenue Fund to the transfers and subsidies line item, with the history adjusted accordingly. Both current and capital transfers are included in transfers and subsidies, in line with the requirements of the economic reporting format.
141
2013 BUDGET REVIEW
The size of the deficit figures presented in this table differ from those presented in budgets before 1995/96, as a number of items that were previously regarded as “below-the-line” expenditure have been included in total expenditure. In addition, revaluations of foreign loan obligations are now excluded from expenditure, in keeping with international practice.
Under loan redemptions and financing, short-term loans include the net result of transactions in Treasury bills and borrowing from the Corporation for Public Deposits. Long-term loans include all transactions in government bonds and foreign loans (new loan issues, repayments on maturity, buy-backs, switches and reverse purchase transactions).
Extraordinary issues represent the settlement of extraordinary payments by means of government bond issues. This excludes extraordinary payments in cash.
Before the 1998 Budget Review, transfers from the Strategic Fuel Fund and the National Supplies Procurement Fund, as well as proceeds from the sale and restructuring of state assets, were treated as financing items. These, together with extraordinary payments unrelated to expenditure, are now shown below the budget balance and before financing. The reclassification does not affect the budget balance.
Main budget: estimates of national revenue (Tables 2 and 3)
Table 2 presents a summary of revenue; the details are set out in Table 3. Main budget revenue collections are recorded on an adjusted cash basis as the revenue is recorded in the ledgers of SARS. Tax revenue is classified according to standard international categories and departmental receipts according to the requirements of the economic reporting format.
Certain receipts into the National Revenue Fund are not regarded as revenue. These include proceeds from the restructuring of state assets and adjustments due to transactions in government bonds.
The historical data presented in Table 3 has been reclassified to be in line with the economic reporting format. However, a large amount of the data cannot be reclassified, as departments captured these transactions within their ledgers as miscellaneous receipts. These amounts are therefore reported as unspecified receipts.
Main budget: expenditure defrayed from the National Revenue Fund by vote (Table 4)
Table 4 contains estimates of expenditure on national budget votes for the period 2009/10 to 2015/16. In 2011/12, amounts appropriated in the main budget, the adjusted estimates and preliminary estimates of spending on each vote are shown. Following the 2009 elections, a number of new departments were created; some functions were shifted between departments and some existing departments were renamed. Historical data has been adjusted to account for function shifts between departments and as a result the figures presented for some departments may differ from their financial statements. Total expenditure, however, is not influenced by these changes.
Consolidated national, provincial and social security funds expenditure (Tables 5 and 6)
Tables 5 and 6 show the economic and functional classification of payments for consolidated national and provincial government and the social security funds, including the Unemployment Insurance Fund, the Road Accident Fund and the Compensation Funds. The national expenditure figures are for the 2013 Budget. Provincial expenditure estimates are preliminary because their budgets are tabled after the national budget. These estimates are based on preliminary information provided by the provinces and are subject to change before being tabled in provincial legislatures.
142
ANNEXURE B: STATISTICAL TABLES
The National Treasury introduced a new economic classification in the 2004 Budget that brought budget reporting in line with international best practice. Further changes were introduced on 1 April 2008 to improve the standard chart of accounts. This was the culmination of work on various initiatives to improve financial data, such as the infrastructure reporting process and improvement to item classification, and took into account lessons learnt from data observations over the previous four years.
The functional classification
The functional classification in this annexure is aligned to the Classification of Functions of Government as set out in the GFS, which differs from the categories used in budgets before 2009. Since then, classification has been presented at a more detailed level, meaning departmental programmes that were allocated to one function can be disaggregated to more than one function due to the availability of more detailed financial information. The historical data published in these tables has been reclassified accordingly. Chapter 8 of the Budget Review, which sets out the medium-term expenditure framework and division of revenue, outlines the budget allocations across these function groups.
To support this approach, data at programme and entity level is aggregated into spending categories, which provides for a higher level of aggregation than in the functional classification. For example, in the functional classification in Annexure B, science and technology activities are included in individual functions, while in Chapter 8 these are grouped together as a separate category. The fiscal statistics are an outcome of the budget process and can only be used as a guide to categorise expenditure for budgeting purposes. They are not used as a framework for presenting budget allocations.
Some of the most important differences between the key spending categories presented in Chapter 8 and the more detailed functional classification presented in the statistical tables are as follows:
| | • | | Science and technology – This category groups together various science-related activities. For example, the expenditure estimates of the Medical Research Council, included in the health function in Annexure B, are presented as part of this spending category. |
| | • | | Recreation and culture – This category includes the expenditure estimates of the National Lotteries Distribution Trust, because a major portion of its expenditure is allocated to recreational and cultural activities. However, in the statistical tables in Annexure B, a more detailed functional breakdown of the trust’s expenditure is allocated to various functions. |
| | • | | Economic services and environmental protection – This excludes economic infrastructure, which is identified as a separate spending category, and includes environmental protection. Estimates relating to communication, transport, and fuel and energy have been included in the economic infrastructure spending category. Environmental-protection public entities involved in science and technology activities (like the South African Weather Service) are included in the science and technology group, while in Annexure B they are classified within the economic services and environmental protection function. |
| | • | | Health – Payments made to nursing colleges are included in the health spending category, but classified as an education function in Annexure B. The Medical Research Council is also excluded from the health function because it falls under science and technology for budget preparation. |
| | • | | Defence – Military health services is included in the defence spending category for budget preparation, but classified as a health function in Annexure B. |
| | • | | Local government, housing and community amenities – Includes contributions to the South African Local Government Association and the Municipal Demarcation Board, classified as general public services in the statistical tables. |
| | • | | General public services – In the budget’s key spending categories, transfers made to international organisations are classified within the category of the paying department. In Annexure B, they are classified under general public services. |
143
2013 BUDGET REVIEW
Consolidated government revenue, expenditure and financing (Table 7)
Table 7 presents the new format of the government account, which distinguishes between government’s operating activities and its plans to invest in capital and infrastructure.
The balance on the operating account shows the outcome of the government’s operating activities, which is a measure of the cost of ongoing operations. It is calculated as the difference between current revenue and current expenditure, and the resulting balance shows how much government must borrow to run its operations. The current balance demonstrates the sustainability of government operations.
Capital investment activities are presented in the capital account. Government’s capital financing requirement is the outcome of this account, which is calculated as the difference between capital revenue and capital expenditure. This account will mainly be in deficit, owing to continuous investment in infrastructure and substantial capital outlays.
The new format separates all transactions in financial assets and liabilities – mainly including loans extended to public corporations. Extraordinary receipts and payments are currently not included in the main budget presentation. The introduction of the operating account and capital account makes extraordinary items obsolete; these are included in the main transaction categories. The classification principles and categories used in this new format will be the same as those used for classifying government transactions.
Consolidated government revenue and expenditure (Table 8)
Table 8 shows the economic and functional classification of payments for the consolidated government budget. This consists of the consolidated national, provincial and social security figures presented in Tables 5 and 6, combined with entities forming part of the general government sector, as well as some government business enterprises.
The government budget consolidation includes all entities controlled and mainly financed by government revenue, where such revenue is defined as either taxes, levies and administrative or service fees prescribed by government, or direct budgetary support in the form of transfer payments. This consolidation also includes a number of government business enterprises, based on the principle that they either sell most of their goods and services produced to government institutions or departments at regulated prices, and are therefore not businesses in the true sense of the word, or they are directly involved in infrastructure financing and development.
Accordingly, state-owned entities are broadly identified as one of the following:
| | • | | Enterprises that sell mainly to government departments or institutions, have no clear competitors and whose prices are therefore not clearly market related. |
| | • | | Science councils that conduct research or fulfil a regulatory or advisory function, where regulatory or administration fees are determined by government. |
| | • | | Government-regulated businesses that are primarily financed by a dedicated tax, administration fee or levy, the level of which is dictated by government, or that are directly involved in the maintenance or extension of critical infrastructure. |
To present consolidated accounts, all units must adopt the same accounting standards and policies. Thus, the format of the accounts, terminology used, classification, transaction coverage and accounting base (cash or accrual) must be the same. In this respect the consolidated government budget is prepared on the adjusted cash basis of accounting. This is not strictly comparable to the financial information published in the consolidated financial statements, which have two components – a consolidation of departments using the modified cash basis of accounting, and a separate consolidation of public entities that apply the accrual basis of accounting.
144
ANNEXURE B: STATISTICAL TABLES
In the consolidated government budget, the accrual data of public entities is converted into cash. This involves the adjustment of the data presented in the statement of financial performance with changes that are due to non-cash transactions. These adjustments are based on all relevant changes in balances on the statement of financial position, which once removed from the statement of financial performance results in the presentation of only the cash receipts and payments for the accounting period.
Once the data has been converted into a comparable set of numbers, a consolidated account can be produced. Consolidation involves the elimination of all transactions that occur between the units being consolidated. A transaction of one unit is matched with the same transaction as recorded for the second unit and both transactions are eliminated from the consolidation. For example, if a public entity sells a service to a government department and data for the two units is being consolidated, neither the sale nor the purchase of the service is reported. In this way, only transactions between government and non-government entities are recorded without inflating total government revenue as a result of internal transactions.
In the consolidation process, all intra-entity transactions must be eliminated. However, in the accounting systems of government and many of its agencies, not all intra-entity transactions are identifiable, complicating the consolidation process. Therefore, in preparing the consolidated government budget, only identifiable intra-entity transactions have been eliminated. These broadly include:
| | • | | Transactions involving transfers from one government unit to another, including transfers made by national departments to public entities, and transfers between public entities (such as Water Trading Entity transfers to water boards). |
| | • | | Purchases of goods and services from other government units included in the consolidation (such as transactions between the Trans-Caledon Tunnel Authority, water boards and the Water Trading Entity). |
This process is not yet comprehensive. As data collection and recording procedures for transactions improve, additional intra-entity transactions will be identified and removed from the consolidated government budget.
In the 2013 Budget, a total of 163 national and provincial departments and 187 entities are included in the consolidated government budget. The National Treasury is committed to presenting a full consolidation of the whole of general government. This implies that the consolidated account presented in this budget must be extended to include local government accounts. A process has been initiated and initial data sets for local government have been published in the Local Government Budgets and Expenditure Review. However, considerable work remains to align this data with the consolidated account.
A discussion on the consolidation procedures, as well as a detailed list of all entities included in the consolidation, is available in Annexure W2 of the Budget Review on the National Treasury website: www.treasury.gov.za.
Total debt of government (Table 9)
Table 9 shows the major components of government debt. Net total loan debt consists of total domestic and foreign debt less the cash balances of the National Revenue Fund. Realised profits and losses on the Gold and Foreign Exchange Contingency Reserve Account are also disclosed. The projections for 2012/13 to 2015/16 are based on national budget data.
Financial guarantees: amounts drawn on government guarantees (Table 10)
The national government furnishes guarantees to various institutions that will only realise as liabilities to government if these institutions are unable to meet their commitments. It is not possible to predict the portion of these guarantees that will realise as liabilities, and they are therefore disclosed as contingent liabilities in the national government’s consolidated financial information. Amounts drawn in respect of guarantees and interest on these amounts, if guaranteed, are disclosed.
145
2013 BUDGET REVIEW
| | | | | | | | | | | | | | | | | | | | | | | | | | |
Table 1 Main budget: Revenue, expenditure, budget balance and financing 1) | | | | | | | | | | | | | | | | | | | | | | | | | | |
| | | | | 2006/07 | | | 2007/08 | | | 2008/09 | | | 2009/10 | | | 2010/11 | | | 2011/12 | |
R million | | | | Actual outcome | | | Preliminary outcome | |
Main budget revenue | | | | | | | | | | | | | | | | | | | | | | | | | | |
Current revenue | | | | | 481 158.2 | | | | 559 267.5 | | | | 607 867.5 | | | | 578 691.1 | | | | 668 489.7 | | | | 735 420.1 | |
Tax revenue (gross) | | 2) | | | 495 548.6 | | | | 572 814.6 | | | | 625 100.2 | | | | 598 705.4 | | | | 674 183.1 | | | | 742 651.1 | |
Less: SACU payments | | | | | -25 194.9 | | | | -24 712.6 | | | | -28 920.6 | | | | -27 915.4 | | | | -14 991.3 | | | | -21 760.0 | |
Other adjustment | | 3) | | | — | | | | — | | | | — | | | | — | | | | -2 914.4 | | | | — | |
Non-tax revenue (departmental receipts) | | 4) | | | 10 804.5 | | | | 11 165.5 | | | | 11 687.9 | | | | 7 901.1 | | | | 12 212.3 | | | | 14 529.0 | |
Financial transactions in assets and liabilities | | | | | — | | | | 1 296.9 | | | | 797.1 | | | | 957.1 | | | | 1 212.4 | | | | 4 549.3 | |
Sales of capital assets | | | | | 38.8 | | | | 230.2 | | | | 131.2 | | | | 36.3 | | | | 35.4 | | | | 114.7 | |
| | | | | | | | | | | | | | | | | | | | | | | | | | |
Total revenue | | | | | 481 197.0 | | | | 560 794.6 | | | | 608 795.7 | | | | 579 684.5 | | | | 669 737.5 | | | | 740 084.2 | |
Main budget expenditure | | | | | | | | | | | | | | | | | | | | | | | | | | |
Direct charges against the National Revenue Fund | | | | | 208 090.9 | | | | 231 642.6 | | | | 265 332.8 | | | | 310 813.2 | | | | 349 548.1 | | | | 389 192.6 | |
Debt-service costs | | 5) | | | 52 192.2 | | | | 52 877.1 | | | | 54 393.7 | | | | 57 129.2 | | | | 66 226.8 | | | | 76 460.0 | |
Provincial equitable share | | | | | 149 245.6 | | | | 171 053.7 | | | | 201 795.6 | | | | 236 890.8 | | | | 265 139.4 | | | | 291 735.5 | |
General fuel levy sharing with metropolitan municipalities | | | | | — | | | | — | | | | — | | | | 6 800.1 | | | | 7 542.4 | | | | 8 573.1 | |
Skills levy and Setas | | | | | 5 328.4 | | | | 6 284.3 | | | | 7 234.1 | | | | 7 815.6 | | | | 8 379.3 | | | | 10 025.3 | |
Other | | 6) | | | 1 324.7 | | | | 1 427.6 | | | | 1 909.3 | | | | 2 177.5 | | | | 2 260.2 | | | | 2 398.7 | |
Appropriated by vote | | | | | 262 101.6 | | | | 309 800.8 | | | | 370 620.6 | | | | 436 383.5 | | | | 455 592.4 | | | | 499 330.6 | |
Current payments | | 7) | | | 76 586.8 | | | | 87 084.5 | | | | 101 323.1 | | | | 114 745.6 | | | | 128 992.4 | | | | 142 841.7 | |
Transfers and subsidies | | 8) | | | 178 111.1 | | | | 214 591.9 | | | | 249 672.6 | | | | 279 020.7 | | | | 293 987.1 | | | | 343 279.6 | |
Payments for capital assets | | 9) | | | 6 067.8 | | | | 7 018.5 | | | | 8 652.1 | | | | 9 453.9 | | | | 11 407.6 | | | | 12 043.0 | |
Payments for financial assets | | 10) | | | 1 335.8 | | | | 1 105.9 | | | | 10 972.6 | | | | 33 163.3 | | | | 21 205.3 | | | | 1 166.4 | |
Plus: unallocated funds | | | | | — | | | | — | | | | — | | | | — | | | | — | | | | — | |
Contingency reserve | | | | | — | | | | — | | | | — | | | | — | | | | — | | | | — | |
| | | | | | | | | | | | | | | | | | | | | | | | | | |
Total expenditure | | | | | 470 192.5 | | | | 541 443.4 | | | | 635 953.3 | | | | 747 196.8 | | | | 805 140.5 | | | | 888 523.2 | |
Budget balance | | | | | 11 004.5 | | | | 19 351.2 | | | | -27 157.6 | | | | -167 512.3 | | | | -135 403.0 | | | | -148 439.0 | |
Budget balance as percentage of GDP | | | | | 0.6 | % | | | 0.9 | % | | | -1.2 | % | | | -6.8 | % | | | -5.0 | % | | | -5.0 | % |
Extraordinary payments | | 11) | | | -4 213.7 | | | | -775.6 | | | | -4 284.1 | | | | -671.2 | | | | -838.6 | | | | -1 388.3 | |
Extraordinary receipts | | 12) | | | 3 438.1 | | | | 1 849.8 | | | | 8 203.4 | | | | 6 428.6 | | | | 3 009.7 | | | | 5 209.2 | |
| | | | | | | | | | | | | | | | | | | | | | | | | | |
Net borrowing requirement (-) | | | | | 10 228.9 | | | | 20 425.4 | | | | -23 238.3 | | | | -161 754.9 | | | | -133 231.9 | | | | -144 618.1 | |
| | | | | | | | | | | | | | | | | | | | | | | | | | |
Financing | | | | | | | | | | | | | | | | | | | | | | | | | | |
Change in loan liabilities | | | | | | | | | | | | | | | | | | | | | | | | | | |
Domestic short-term loans (net) | | | | | 5 334.1 | | | | 5 672.9 | | | | 12 225.1 | | | | 49 770.3 | | | | 34 893.0 | | | | 18 724.6 | |
Domestic long-term loans (net) | | | | | 891.7 | | | | -2 448.2 | | | | 23 059.0 | | | | 118 855.8 | | | | 136 849.8 | | | | 138 500.8 | |
Market loans | | | | | 36 595.4 | | | | 25 453.1 | | | | 44 301.4 | | | | 132 794.3 | | | | 150 292.0 | | | | 154 860.9 | |
Extraordinary issues | | | | | 342.9 | | | | 1 367.1 | | | | -1 947.1 | | | | -399.4 | | | | 93.4 | | | | -753.0 | |
Redemptions | | | | | -36 046.6 | | | | -29 268.4 | | | | -19 295.3 | | | | -13 539.1 | | | | -13 535.6 | | | | -15 607.1 | |
Foreign loans (net) | | | | | 181.5 | | | | -4 745.4 | | | | -3 954.4 | | | | 23 257.5 | | | | 2 839.6 | | | | 9 135.3 | |
Market loans | | | | | 3 617.9 | | | | -1 568.0 | | | | — | | | | 30 872.4 | | | | 5 151.1 | | | | 12 025.2 | |
Arms procurement loan agreements | | | | | 3 690.0 | | | | 2 426.5 | | | | 3 057.3 | | | | 800.0 | | | | 470.4 | | | | 569.4 | |
World Bank loans | | | | | — | | | | 20.0 | | | | 1.4 | | | | — | | | | — | | | | — | |
Redemptions (including revaluation of loans) | | 13) | | | -7 126.4 | | | | -5 623.9 | | | | -7 013.1 | | | | -8 414.9 | | | | -2 781.9 | | | | -3 459.3 | |
Change in cash and other balances
( - increase) | | | | | -16 636.2 | | | | -18 904.7 | | | | -8 091.4 | | | | -30 128.7 | | | | -41 350.6 | | | | -21 742.7 | |
| | | | | | | | | | | | | | | | | | | | | | | | | | |
Total financing (net) | | | | | -10 228.9 | | | | -20 425.4 | | | | 23 238.3 | | | | 161 754.9 | | | | 133 231.9 | | | | 144 618.1 | |
| | | | | | | | | | | | | | | | | | | | | | | | | | |
GDP | | | | | 1 832 763 | | | | 2 075 414 | | | | 2 296 571 | | | | 2 452 538 | | | | 2 735 274 | | | | 2 973 286 | |
| | | | | | | | | | | | | | | | | | | | | | | | | | |
| 1) | This table summarises revenue, expenditure and the main budget balance since 2006/07. As available data is incomplete, the estimates are not fully consistent with other sources, such as the government finance statistics series of the South African Reserve Bank. |
| 2) | Mining leases and ownership has been reclassified as non-tax revenue (rent on land). Historical numbers have been adjusted for comparative purposes. |
| 3) | Payment to Southern African Customs Union partners in respect of a previous error in calculation of the 1969 agreement. |
| 4) | Excludes sales of capital assets, discount and premium on the issuance of new government debt instruments, premium on debt portfolio restructuring and revaluation of foreign loan repayments. |
| 5) | Includes interest, cost of raising loans and management cost. |
| 6) | Includes direct appropriations in respect of the salaries of the President, Deputy President, judges, magistrates and members of Parliament. |
146
ANNEXURE B: STATISTICAL TABLES
| | |
| | Table 1 Main budget: Revenue, expenditure, budget balance and financing 1) |
| | | | | | | | | | | | | | | | | | | | | | | | | | | | |
| 2012/13 | | | 2013/14 | | | 2014/15 | | | 2015/16 | | | | | | |
Budget
estimate | | | Revised
estimate | | | Deviation | | | Medium-term estimates | | | | | | R million |
| | | | | | | | | | | | | | | | | | | | | | | | | | | | Main budget revenue |
| | 798 452.0 | | | | 781 409.1 | | | | -17 042.9 | | | | 868 582.7 | | | | 967 857.0 | | | | 1 070 660.7 | | | | | | | Current revenue |
| | 826 401.1 | | | | 810 150.3 | | | | -16 250.7 | | | | 898 003.9 | | | | 991 829.7 | | | | 1 098 955.4 | | | | 2) | | | Tax revenue (gross) |
| | -42 151.3 | | | | -42 151.3 | | | | — | | | | -43 374.3 | | | | -43 036.0 | | | | -48 469.3 | | | | | | | Less: SACU payments |
| | — | | | | — | | | | — | | | | — | | | | — | | | | — | | | | 3) | | | Other adjustment |
| | 14 202.2 | | | | 13 410.0 | | | | -792.1 | | | | 13 953.2 | | | | 19 063.4 | | | | 20 174.7 | | | | 4) | | | Non-tax revenue (departmental receipts) |
| | 824.5 | | | | 973.9 | | | | 149.4 | | | | 4 317.5 | | | | — | | | | — | | | | | | | Financial transactions in assets and liabilities |
| | 64.3 | | | | 91.1 | | | | 26.8 | | | | 65.7 | | | | 65.5 | | | | 65.9 | | | | | | | Sales of capital assets |
| | | | | | | | | | | | | | | | | | | | | | | | | | | | |
| | 799 340.8 | | | | 782 474.1 | | | | -16 866.6 | | | | 872 965.9 | | | | 967 922.5 | | | | 1 070 726.6 | | | | | | | Total revenue |
| | | | | | | |
| | | | | | | | | | | | | | | | | | | | | | | | | | | | Main budget expenditure |
| | 419 925.9 | | | | 424 615.3 | | | | 4 689.3 | | | | 462 362.5 | | | | 495 591.0 | | | | 530 697.7 | | | | | | | Direct charges against the National Revenue Fund |
| | 89 388.1 | | | | 88 325.1 | | | | -1 062.9 | | | | 99 741.4 | | | | 108 718.4 | | | | 118 162.5 | | | | 5) | | | Debt-service costs |
| | 309 057.4 | | | | 313 015.8 | | | | 3 958.4 | | | | 337 572.4 | | | | 359 924.2 | | | | 383 697.2 | | | | | | | Provincial equitable share |
| | 9 039.7 | | | | 9 039.7 | | | | — | | | | 9 613.4 | | | | 10 190.2 | | | | 10 658.9 | | | | | | | General fuel levy sharing with metropolitan municipal |
| | 9 606.1 | | | | 11 400.0 | | | | 1 793.9 | | | | 12 403.0 | | | | 13 544.0 | | | | 14 817.0 | | | | | | | Skills levy and Setas |
| | 2 834.7 | | | | 2 834.7 | | | | — | | | | 3 032.3 | | | | 3 214.2 | | | | 3 362.1 | | | | 6) | | | Other |
| | 543 629.5 | | | | 542 351.7 | | | | -1 277.8 | | | | 588 682.1 | | | | 635 889.8 | | | | 685 029.2 | | | | | | | Appropriated by vote |
| | 155 802.5 | | | | 158 366.3 | | | | 2 563.8 | | | | 168 867.0 | | | | 179 234.2 | | | | 188 385.7 | | | | 7) | | | Current payments |
| | 371 010.0 | | | | 369 488.9 | | | | -1 521.0 | | | | 402 651.7 | | | | 435 813.5 | | | | 476 102.4 | | | | 8) | | | Transfers and subsidies |
| | 15 176.3 | | | | 13 045.1 | | | | -2 131.2 | | | | 14 258.4 | | | | 17 590.1 | | | | 17 517.1 | | | | 9) | | | Payments for capital assets |
| | 1 640.7 | | | | 1 451.4 | | | | -189.4 | | | | 2 905.0 | | | | 3 252.0 | | | | 3 024.0 | | | | 10) | | | Payments for financial assets |
| | 30.0 | | | | — | | | | -30.0 | | | | 30.0 | | | | — | | | | — | | | | | | | Plus: unallocated funds |
| | 5 780.0 | | | | — | | | | -5 780.0 | | | | 4 000.0 | | | | 6 500.0 | | | | 10 000.0 | | | | | | | Contingency reserve |
| | | | | | | | | | | | | | | | | | | | | | | | | | | | |
| | 969 365.5 | | | | 966 967.0 | | | | -2 398.4 | | | | 1 055 074.6 | | | | 1 137 980.7 | | | | 1 225 726.9 | | | | | | | Total expenditure |
| | | | | | | |
| | -170 024.8 | | | | -184 492.9 | | | | -14 468.1 | | | | -182 108.7 | | | | -170 058.2 | | | | -155 000.3 | | | | | | | Budget balance |
| | -5.2% | | | | -5.7 | % | | | -0.6 | % | | | -5.2 | % | | | -4.4 | % | | | -3.6 | % | | | | | | Budget balance as percentage of GDP |
| | -24.0 | | | | -2 584.0 | | | | -2 560.0 | | | | -930.0 | | | | — | | | | — | | | | 11) | | | Extraordinary payments |
| | 1 200.0 | | | | 10 780.0 | | | | 9 580.0 | | | | 4 992.0 | | | | 2 900.0 | | | | 3 100.0 | | | | 12) | | | Extraordinary receipts |
| | | | | | | | | | | | | | | | | | | | | | | | | | | | |
| | -168 848.8 | | | | -176 296.9 | | | | -7 448.1 | | | | -178 046.7 | | | | -167 158.2 | | | | -151 900.3 | | | | | | | Net borrowing requirement (-) |
| | | | | | | | | | | | | | | | | | | | | | | | | | | | |
| | | | | | | | | | | | | | | | | | | | | | | | | | | | Financing |
| | | | | | | | | | | | | | | | | | | | | | | | | | | | Change in loan liabilities |
| | | | | | | |
| | 22 000.0 | | | | 22 000.0 | | | | — | | | | 23 000.0 | | | | 24 000.0 | | | | 24 000.0 | | | | | | | Domestic short-term loans (net) |
| | | | | | | |
| | 119 998.0 | | | | 126 448.0 | | | | 6 450.0 | | | | 143 610.0 | | | | 132 292.0 | | | | 137 032.0 | | | | | | | Domestic long-term loans (net) |
| | 151 367.0 | | | | 161 557.0 | | | | 10 190.0 | | | | 165 648.0 | | | | 165 405.0 | | | | 165 119.0 | | | | | | | Market loans |
| | — | | | | -3 790.0 | | | | -3 790.0 | | | | -1 310.0 | | | | — | | | | — | | | | | | | Extraordinary issues |
| | -31 369.0 | | | | -31 319.0 | | | | 50.0 | | | | -20 728.0 | | | | -33 113.0 | | | | -28 087.0 | | | | | | | Redemptions |
| | | | | | | |
| | -7 492.0 | | | | -7 379.0 | | | | 113.0 | | | | -4 335.0 | | | | 964.0 | | | | 9 724.0 | | | | | | | Foreign loans (net) |
| | 4 035.0 | | | | 4 190.0 | | | | 155.0 | | | | 12 390.0 | | | | 12 435.0 | | | | 12 630.0 | | | | | | | Market loans |
| | 183.0 | | | | 61.0 | | | | -122.0 | | | | — | | | | — | | | | — | | | | | | | Arms procurement loan agreements |
| | — | | | | — | | | | — | | | | — | | | | — | | | | — | | | | | | | World Bank loans |
| | -11 710.0 | | | | -11 630.0 | | | | 80.0 | | | | -16 725.0 | | | | -11 471.0 | | | | -2 906.0 | | | | 13) | | | Redemptions (including revaluation of loans) |
| | 34 342.8 | | | | 35 228.0 | | | | 885.2 | | | | 15 771.7 | | | | 9 902.3 | | | | -18 855.8 | | | | | | | Change in cash and other balances (-increase) |
| | | | | | | | | | | | | | | | | | | | | | | | | | | | |
| | 168 848.8 | | | | 176 296.9 | | | | 7 448.1 | | | | 178 046.7 | | | | 167 158.2 | | | | 151 900.3 | | | | | | | Total financing (net) |
| | | | | | | | | | | | | | | | | | | | | | | | | | | | |
| | 3 301 374 | | | | 3 209 142 | | | | -92 232 | | | | 3 520 268 | | | | 3 880 406 | | | | 4 270 848 | | | | | | | GDP |
| | | | | | | | | | | | | | | | | | | | | | | | | | | | |
| 7) | Includes compensation of employees, payments for goods and services, interest and rent on land. Payment for medical benefits to former employees has been moved to transfers. |
| 8) | Includes current and capital transfers and subsidies to business, households, foreign countries and other levels and funds of general government. |
| 9) | Includes acquisition and own account construction of new assets and the cost of upgrading, improving and extentions to existing capital assets. |
| 10) | Consists mainly of lending to public corporations or making equity investments in them for policy purposes. Previously included in transfers and subsidies. |
| 11) | Includes premiums incurred on loan issues, bond switch and buy-back transactions and revaluation adjustments when utilising foreign exchange deposits. |
| 12) | Includes proceeds from the sale of state assets and strategic supplies as well as premiums received on loan issues, bond switches and buy-back transactions and revaluation adjustments when utilising foreign exchange deposits. |
| 13) | Revaluation estimates are based on National Treasury’s projection of exchange rates. |
147
2013 BUDGET REVIEW
Table 2
Main budget: estimates of national revenue
Summary of revenue 1)
| | | | | | | | | | | | | | | | | | | | | | | | | | | | | | | | |
| | | | | | 1995/96 | | | 1996/97 | | | 1997/98 | | | 1998/99 | | | 1999/00 | | | 2000/01 | | | 2001/02 | |
R million | | | | | | | | | | | | | | | | | | | | | | | | |
Taxes on income and profits | | | | | | | 68 883.8 | | | | 82 876.1 | | | | 95 003.6 | | | | 108 021.5 | | | | 116 148.9 | | | | 126 145.2 | | | | 147 310.4 | |
Persons and individuals | | | | | | | 51 179.3 | | | | 59 519.8 | | | | 68 342.4 | | | | 77 733.9 | | | | 85 883.8 | | | | 86 478.0 | | | | 90 389.5 | |
Gold mines | | | | | | | 893.7 | | | | 507.7 | | | | 332.5 | | | | 188.6 | | | | — | | | | — | | | | — | |
Other mines | | | | | | | 714.8 | | | | 1 341.6 | | | | 1 349.4 | | | | 1 946.1 | | | | — | | | | — | | | | — | |
Companies | | | | | | | 14 059.0 | | | | 16 985.0 | | | | 19 696.4 | | | | 20 388.0 | | | | 20 971.6 | | | | 29 491.8 | | | | 42 354.5 | |
Secondary tax on companies | | | | | | | 1 262.2 | | | | 1 337.9 | | | | 1 446.4 | | | | 1 930.8 | | | | 3 149.9 | | | | 4 031.3 | | | | 7 162.7 | |
Tax on retirement funds | | | | | | | — | | | | 2 565.5 | | | | 3 229.7 | | | | 5 098.8 | | | | 5 330.4 | | | | 5 219.8 | | | | 6 190.6 | |
Other | | | 1 | ) | | | 774.8 | | | | 618.6 | | | | 606.8 | | | | 735.3 | | | | 813.1 | | | | 924.3 | | | | 1 213.1 | |
| | | | | | | | |
Taxes on payroll and workforce | | | | | | | — | | | | — | | | | — | | | | — | | | | 0.1 | | | | 1 257.4 | | | | 2 717.3 | |
Skills development levy | | | 2 | ) | | | — | | | | — | | | | — | | | | — | | | | 0.1 | | | | 1 257.4 | | | | 2 717.3 | |
| | | | | | | | |
Taxes on property | | | | | | | 2 233.9 | | | | 2 359.3 | | | | 2 618.4 | | | | 2 830.4 | | | | 3 808.4 | | | | 3 978.8 | | | | 4 628.3 | |
Donations tax | | | | | | | 61.0 | | | | 46.7 | | | | 17.7 | | | | 9.1 | | | | 15.2 | | | | 32.1 | | | | 20.6 | |
Estate duty | | | | | | | 181.3 | | | | 181.8 | | | | 302.6 | | | | 256.4 | | | | 304.2 | | | | 442.7 | | | | 481.9 | |
Securities transfer tax | | | 3 | ) | | | 462.9 | | | | 397.3 | | | | 442.3 | | | | 721.1 | | | | 1 090.4 | | | | 1 102.1 | | | | 1 212.8 | |
Transfer duties | | | | | | | 1 528.7 | | | | 1 733.5 | | | | 1 855.8 | | | | 1 565.4 | | | | 1 821.6 | | | | 2 401.9 | | | | 2 913.0 | |
Demutualisation charge | | | | | | | — | | | | — | | | | — | | | | 278.5 | | | | 577.0 | | | | — | | | | — | |
| | | | | | | | |
Domestic taxes on goods and services | | | | | | | 48 881.7 | | | | 53 572.9 | | | | 60 619.0 | | | | 66 213.2 | | | | 72 184.7 | | | | 78 877.5 | | | | 86 885.1 | |
Value-added tax | | | 4 | ) | | | 32 768.2 | | | | 35 902.9 | | | | 40 095.6 | | | | 43 985.4 | | | | 48 376.8 | | | | 54 455.2 | | | | 61 056.6 | |
Specific excise duties | | | | | | | 6 075.0 | | | | 5 912.4 | | | | 7 425.8 | | | | 8 052.8 | | | | 8 886.1 | | | | 9 126.6 | | | | 9 797.2 | |
Ad valorem excise duties | | | | | | | 400.2 | | | | 718.7 | | | | 581.6 | | | | 518.9 | | | | 584.3 | | | | 693.9 | | | | 776.1 | |
General fuel levy | | | | | | | 8 928.0 | | | | 10 391.6 | | | | 12 091.2 | | | | 13 640.0 | | | | 14 289.8 | | | | 14 495.3 | | | | 14 923.2 | |
Air departure tax | | | | | | | — | | | | — | | | | — | | | | — | | | | — | | | | 85.8 | | | | 296.4 | |
Other | | | 5 | ) | | | 710.2 | | | | 647.2 | | | | 424.8 | | | | 16.0 | | | | 47.6 | | | | 20.7 | | | | 35.5 | |
| | | | | | | | |
Taxes on international trade and transactions | | | | | | | 6 169.6 | | | | 7 200.5 | | | | 5 638.6 | | | | 6 052.5 | | | | 6 778.1 | | | | 8 226.6 | | | | 8 680.1 | |
Customs duties | | | | | | | 5 325.9 | | | | 6 518.0 | | | | 6 055.7 | | | | 5 985.7 | | | | 6 517.8 | | | | 7 853.6 | | | | 8 632.2 | |
Import surcharges | | | | | | | 456.7 | | | | -5.9 | | | | -1.4 | | | | 1.6 | | | | 0.4 | | | | 0.0 | | | | 0.5 | |
Other | | | 6 | ) | | | 387.1 | | | | 688.4 | | | | -415.7 | | | | 65.2 | | | | 259.9 | | | | 372.9 | | | | 47.5 | |
| | | | | | | | |
Stamp duties and fees | | | | | | | 1 024.8 | | | | 1 202.4 | | | | 1 483.8 | | | | 1 489.0 | | | | 1 618.9 | | | | 1 561.6 | | | | 1 767.2 | |
State miscellaneous revenue | | | 7 | ) | | | 84.1 | | | | 121.2 | | | | -36.0 | | | | 179.3 | | | | 727.0 | | | | 72.0 | | | | 306.7 | |
| | | | | | | | | | | | | | | | | | | | | | | | | | | | | | | | |
TOTAL TAX REVENUE (gross) | | | | | | | 127 278.0 | | | | 147 332.3 | | | | 165 327.4 | | | | 184 785.9 | | | | 201 265.9 | | | | 220 119.1 | | | | 252 295.0 | |
| | | | | | | | |
Non-tax revenue | | | 8 | ) | | | 2 614.9 | | | | 3 522.7 | | | | 3 299.4 | | | | 4 796.2 | | | | 4 093.8 | | | | 3 868.8 | | | | 4 172.2 | |
Less: SACU payments | | | 9 | ) | | | -3 890.1 | | | | -4 362.7 | | | | -5 237.2 | | | | -5 576.7 | | | | -7 197.3 | | | | -8 396.1 | | | | -8 204.8 | |
| | | | | | | | | | | | | | | | | | | | | | | | | | | | | | | | |
TOTAL MAIN BUDGET REVENUE | | | | | | | 126 002.7 | | | | 146 492.4 | | | | 163 389.6 | | | | 184 005.4 | | | | 198 162.4 | | | | 215 591.9 | | | | 248 262.4 | |
| | | | | | | | | | | | | | | | | | | | | | | | | | | | | | | | |
Current revenue | | | | | | | 125 979.4 | | | | 146 477.7 | | | | 163 371.2 | | | | 183 978.6 | | | | 198 120.7 | | | | 215 548.4 | | | | 248 258.2 | |
Direct taxes | | | | | | | 69 126.1 | | | | 83 104.6 | | | | 95 323.9 | | | | 108 565.5 | | | | 117 045.3 | | | | 127 877.4 | | | | 150 530.1 | |
Indirect taxes | | | | | | | 58 067.7 | | | | 64 106.6 | | | | 70 039.5 | | | | 76 041.1 | | | | 83 493.7 | | | | 92 169.7 | | | | 101 458.2 | |
State miscellaneous revenue | | | | | | | 84.1 | | | | 121.2 | | | | -36.0 | | | | 179.3 | | | | 727.0 | | | | 72.0 | | | | 306.7 | |
Non-tax revenue (excluding sales of capital assets) | | | 11 | ) | | | 2 591.5 | | | | 3 508.0 | | | | 3 280.9 | | | | 4 769.3 | | | | 4 052.1 | | | | 3 825.4 | | | | 4 168.0 | |
Less: SACU payments | | | | | | | -3 890.1 | | | | -4 362.7 | | | | -5 237.2 | | | | -5 576.7 | | | | -7 197.3 | | | | -8 396.1 | | | | -8 204.8 | |
Sales of capital assets | | | | | | | 23.4 | | | | 14.7 | | | | 18.4 | | | | 26.9 | | | | 41.7 | | | | 43.5 | | | | 4.2 | |
| | | | | | | | | | | | | | | | | | | | | | | | | | | | | | | | |
Extraordinary receipts | | | 12 | ) | | | 1 391.4 | | | | 1 629.4 | | | | 2 947.4 | | | | 2 757.6 | | | | 7 238.3 | | | | 2 983.5 | | | | 4 159.1 | |
| | | | | | | | | | | | | | | | | | | | | | | | | | | | | | | | |
| 1) | Includes interest on overdue income tax, non-resident shareholders’ tax (prior to 1999/00), non-residents’ tax on interest (prior to 1999/00), undistributed profits tax (prior to 1999/00) and small business tax amnesty (in 2006/07, 2007/08 and 2008/09). |
| 2) | Levy on payroll dedicated to skills development. |
| 3) | The securities transfer tax replaced the uncertificated securities tax as from 1 July 2008. The uncertificated securities tax replaced the marketable securities tax as from 1 June 1999. |
| 4) | The value-added tax (VAT) replaced the general sales tax in September 1991. |
| 5) | Includes plastic bag levy (from 2004/05), Universal Service Fund (from 1998/99), Human Resources Fund and Universal Service Agency (in 1998/99 and 1999/00), levies on financial services (up to 2004/05) and carbon dioxide motor vehicle emissions tax (from 2010/11). Mining leases and ownership has been reclassified as non-tax revenue. The historical years from 1998/99 have been adjusted for comparative purposes. |
148
ANNEXURE B: STATISTICAL TABLES
| | |
| | Table 2 Main budget: estimates of national revenue Summary of revenue 1) |
| | | | | | | | | | | | | | | | | | | | | | | | | | | | | | | | |
| 2002/03 | | | 2003/04 | | | 2004/05 | | | 2005/06 | | | 2006/07 | | | 2007/08 | | | 2008/09 | | | | | | |
| Actual collections | | | | | | R million |
| | 164 565.9 | | | | 171 962.8 | | | | 195 219.1 | | | | 230 803.6 | | | | 279 990.5 | | | | 332 058.3 | | | | 383 482.7 | | | | | | | Taxes on income and profits |
| | 94 336.7 | | | | 98 495.1 | | | | 110 981.9 | | | | 125 645.3 | | | | 140 578.3 | | | | 168 774.4 | | | | 195 115.0 | | | | | | | Persons and individuals |
| | — | | | | — | | | | — | | | | — | | | | — | | | | — | | | | — | | | | | | | Gold mines |
| | — | | | | — | | | | — | | | | — | | | | — | | | | — | | | | — | | | | | | | Other mines |
| | 55 745.1 | | | | 60 880.8 | | | | 70 781.9 | | | | 86 160.8 | | | | 118 998.6 | | | | 140 119.8 | | | | 165 378.3 | | | | | | | Companies |
| | 6 325.6 | | | | 6 132.9 | | | | 7 487.1 | | | | 12 277.6 | | | | 15 291.4 | | | | 20 585.4 | | | | 20 017.6 | | | | | | | Secondary tax on companies |
| | 6 989.7 | | | | 4 897.7 | | | | 4 406.1 | | | | 4 783.1 | | | | 3 190.5 | | | | 285.4 | | | | 143.3 | | | | | | | Tax on retirement funds |
| | 1 169.0 | | | | 1 556.3 | | | | 1 562.2 | | | | 1 936.7 | | | | 1 931.7 | | | | 2 293.3 | | | | 2 828.6 | | | | 1 | ) | | Other |
| | | | | | | | |
| | 3 352.1 | | | | 3 896.4 | | | | 4 443.3 | | | | 4 872.0 | | | | 5 597.4 | | | | 6 330.9 | | | | 7 327.5 | | | | | | | Taxes on payroll and workforce |
| | 3 352.1 | | | | 3 896.4 | | | | 4 443.3 | | | | 4 872.0 | | | | 5 597.4 | | | | 6 330.9 | | | | 7 327.5 | | | | 2 | ) | | Skills development levy |
| | | | | | | | |
| | 5 084.6 | | | | 6 707.5 | | | | 9 012.6 | | | | 11 137.5 | | | | 10 332.3 | | | | 11 883.9 | | | | 9 477.1 | | | | | | | Taxes on property |
| | 17.7 | | | | 17.1 | | | | 25.2 | | | | 29.5 | | | | 47.0 | | | | 27.6 | | | | 125.0 | | | | | | | Donations tax |
| | 432.7 | | | | 417.1 | | | | 506.9 | | | | 624.7 | | | | 747.4 | | | | 691.0 | | | | 756.7 | | | | | | | Estate duty |
| | 1 205.2 | | | | 1 101.1 | | | | 1 365.9 | | | | 1 973.4 | | | | 2 763.9 | | | | 3 757.1 | | | | 3 664.5 | | | | 3 | ) | | Securities transfer tax |
| | 3 429.0 | | | | 5 172.1 | | | | 7 114.6 | | | | 8 510.0 | | | | 6 774.0 | | | | 7 408.2 | | | | 4 930.9 | | | | | | | Transfer duties |
| | — | | | | — | | | | — | | | | — | | | | — | | | | — | | | | — | | | | | | | Demutualisation charge |
| | | | | | | | |
| | 97 311.5 | | | | 110 108.6 | | | | 131 980.6 | | | | 151 223.7 | | | | 174 671.4 | | | | 194 690.3 | | | | 201 416.0 | | | | | | | Domestic taxes on goods and services |
| | 70 149.9 | | | | 80 681.8 | | | | 98 157.9 | | | | 114 351.6 | | | | 134 462.6 | | | | 150 442.8 | | | | 154 343.1 | | | | 4 | ) | | Value-added tax |
| | 10 422.6 | | | | 11 364.6 | | | | 13 066.7 | | | | 14 546.5 | | | | 16 369.5 | | | | 18 218.4 | | | | 20 184.5 | | | | | | | Specific excise duties |
| | 1 050.2 | | | | 1 016.2 | | | | 1 015.2 | | | | 1 157.3 | | | | 1 282.7 | | | | 1 480.5 | | | | 1 169.5 | | | | | | | Ad valorem excise duties |
| | 15 333.8 | | | | 16 652.4 | | | | 19 190.4 | | | | 20 506.7 | | | | 21 844.6 | | | | 23 740.5 | | | | 24 883.8 | | | | | | | General fuel levy |
| | 324.8 | | | | 367.2 | | | | 412.2 | | | | 458.2 | | | | 484.8 | | | | 540.6 | | | | 549.4 | | | | | | | Air departure tax |
| | 30.3 | | | | 26.5 | | | | 138.3 | | | | 203.4 | | | | 227.2 | | | | 267.5 | | | | 285.7 | | | | 5 | ) | | Other |
| | | | | | | | |
| | 9 619.8 | | | | 8 414.3 | | | | 13 286.5 | | | | 18 201.9 | | | | 24 002.2 | | | | 27 081.9 | | | | 22 852.4 | | | | | | | Taxes on international trade and transactions |
| | 9 330.7 | | | | 8 479.4 | | | | 12 888.4 | | | | 18 303.5 | | | | 23 697.0 | | | | 26 469.9 | | | | 22 751.0 | | | | | | | Customs duties |
| | 0.0 | | | | — | | | | — | | | | — | | | | — | | | | — | | | | — | | | | | | | Import surcharges |
| | 289.1 | | | | -65.1 | | | | 398.1 | | | | -101.6 | | | | 305.2 | | | | 612.0 | | | | 101.4 | | | | 6 | ) | | Other |
| | | | | | | | |
| | 1 572.4 | | | | 1 360.1 | | | | 1 167.7 | | | | 792.8 | | | | 615.7 | | | | 557.1 | | | | 571.8 | | | | | | | Stamp duties and fees |
| | | | | | | | |
| | 433.0 | | | | -7.1 | | | | -130.9 | | | | 164.2 | | | | 339.2 | | | | 212.2 | | | | -27.4 | | | | 7 | ) | | State miscellaneous revenue |
| | | | | | | | | | | | | | | | | | | | | | | | | | | | | | | | |
| | 281 939.3 | | | | 302 442.6 | | | | 354 978.8 | | | | 417 195.7 | | | | 495 548.6 | | | | 572 814.6 | | | | 625 100.2 | | | | | | | TOTAL TAX REVENUE (gross) |
| | 4 827.9 | | | | 6 711.3 | | | | 6 203.3 | | | | 8 697.1 | | | | 10 843.3 | | | | 12 692.6 | | | | 12 616.2 | | | | 8 | ) | | Non-tax revenue |
| | -8 259.4 | | | | -9 722.7 | | | | -13 327.8 | | | | -14 144.9 | | | | -25 194.9 | | | | -24 712.6 | | | | -28 920.6 | | | | 9 | ) | | Less: SACU payments |
| | | | | | | | | | | | | | | | | | | | | | | | | | | | | | | | |
| | 278 507.7 | | | | 299 431.2 | | | | 347 854.4 | | | | 411 747.9 | | | | 481 197.0 | | | | 560 794.6 | | | | 608 795.7 | | | | | | | TOTAL MAIN BUDGET REVENUE |
| | | | | | | | | | | | | | | | | | | | | | | | | | | | | | | | |
| | 278 449.9 | | | | 299 414.7 | | | | 347 824.2 | | | | 411 668.6 | | | | 481 158.2 | | | | 560 564.4 | | | | 608 664.5 | | | | | | | Current revenue |
| | 168 368.4 | | | | 176 293.5 | | | | 200 194.5 | | | | 236 329.7 | | | | 286 382.4 | | | | 339 107.8 | | | | 391 691.9 | | | | | | | Direct taxes |
| | 113 137.9 | | | | 126 156.1 | | | | 154 915.3 | | | | 180 701.8 | | | | 208 827.1 | | | | 233 494.6 | | | | 233 435.6 | | | | | | | Indirect taxes |
| | 433.0 | | | | -7.1 | | | | -130.9 | | | | 164.2 | | | | 339.2 | | | | 212.2 | | | | -27.4 | | | | | | | State miscellaneous revenue |
| | 4 770.0 | | | | 6 694.8 | | | | 6 173.2 | | | | 8 617.8 | | | | 10 804.5 | | | | 12 462.4 | | | | 12 485.0 | | | | 11 | ) | | Non-tax revenue (excluding sales of capital assets) |
| | -8 259.4 | | | | -9 722.7 | | | | -13 327.8 | | | | -14 144.9 | | | | -25 194.9 | | | | -24 712.6 | | | | -28 920.6 | | | | | | | Less: SACU payments |
| | 57.8 | | | | 16.5 | | | | 30.2 | | | | 79.3 | | | | 38.8 | | | | 230.2 | | | | 131.2 | | | | | | | Sales of capital assets |
| | | | | | | | | | | | | | | | | | | | | | | | | | | | | | | | |
| | 8 167.9 | | | | 1 598.2 | | | | 2 492.0 | | | | 6 905.2 | | | | 3 438.1 | | | | 1 849.8 | | | | 8 203.4 | | | | 12 | ) | | Extraordinary receipts |
| | | | | | | | | | | | | | | | | | | | | | | | | | | | | | | | |
| 6) | Includes miscellaneous customs and excise receipts, ordinary levy (up to 2004/05) and diamond export duties. |
| 7) | Includes revenue received by SARS that could not be allocated to a specific revenue type. |
| 8) | Includes sales of goods and services, fines, penalties and forfeits, interest, dividends and rent on land (including mineral and petroleum royalties), sales of capital assets as well as transactions in financial assets and liabilities. |
| 9) | Payments in terms of SACU agreements. |
| 10) | Payment to SACU partners in respect of a previous error in calculation of the 1969 agreement. |
| 11) | Excludes sales of capital assets. |
| 12) | Sales of strategic fuel stocks, proceeds from sales of state assets and certain other receipts are, by law, paid into the National Revenue Fund, but are not regarded as departmental receipts. |
149
2013 BUDGET REVIEW
Table 2
Main budget: estimates of national revenue
Summary of revenue 1)
| | | | | | | | | | | | | | | | | | | | | | | | | | | | | | | | |
| | | | | | 2009/10 | | | 2010/11 | | | 2011/12 | | | 2012/13 | | | 2013/14 | |
| | | | | | | | | | | | | | | | | | % change | | | Budget estimates | |
| | | | | | | | | Actual | | | | | | Revised | | | on actual | | | Before | | | After | |
R million | | | | | | | | collections | | | | | | estimates | | | 2011/12 | | | tax proposals | |
Taxes on income and profits | | | | | | | 359 044.8 | | | | 379 941.2 | | | | 426 583.7 | | | | 453 521.6 | | | | 6.3 | % | | | 509 595.1 | | | | 501 353.1 | |
Persons and individuals | | | | | | | 205 145.0 | | | | 226 925.0 | | | | 250 399.6 | | | | 274 020.1 | | | | 9.4 | % | | | 313 570.0 | | | | 306 188.0 | |
Companies | | | | | | | 134 883.4 | | | | 132 901.7 | | | | 151 626.7 | | | | 156 350.0 | | | | 3.1 | % | | | 170 690.0 | | | | 169 830.0 | |
Secondary tax on companies | | | | | | | 15 467.8 | | | | 17 178.2 | | | | 21 965.4 | | | | 21 000.0 | | | | -4.4 | % | | | 22 930.0 | | | | 22 930.0 | |
Tax on retirement funds | | | | | | | 42.7 | | | | 2.8 | | | | 6.7 | | | | — | | | | -100.0 | % | | | — | | | | — | |
Other | | | 1 | ) | | | 3 505.9 | | | | 2 933.6 | | | | 2 585.3 | | | | 2 151.5 | | | | -16.8 | % | | | 2 405.1 | | | | 2 405.1 | |
| | | | | | | | |
Taxes on payroll and workforce | | | | | | | 7 804.8 | | | | 8 652.3 | | | | 10 173.1 | | | | 11 400.0 | | | | 12.1 | % | | | 12 403.0 | | | | 12 403.0 | |
Skills development levy | | | 2 | ) | | | 7 804.8 | | | | 8 652.3 | | | | 10 173.1 | | | | 11 400.0 | | | | 12.1 | % | | | 12 403.0 | | | | 12 403.0 | |
| | | | | | | | |
Taxes on property | | | | | | | 8 826.4 | | | | 9 102.3 | | | | 7 817.5 | | | | 8 200.1 | | | | 4.9 | % | | | 9 070.0 | | | | 9 070.0 | |
Donations tax | | | | | | | 60.1 | | | | 64.6 | | | | 52.7 | | | | 79.9 | | | | 51.7 | % | | | 90.0 | | | | 90.0 | |
Estate duty | | | | | | | 759.3 | | | | 782.3 | | | | 1 045.2 | | | | 820.2 | | | | -21.5 | % | | | 900.0 | | | | 900.0 | |
Securities transfer tax | | | 3 | ) | | | 3 324.0 | | | | 2 932.9 | | | | 2 886.1 | | | | 3 200.0 | | | | 10.9 | % | | | 3 490.0 | | | | 3 490.0 | |
Transfer duties | | | | | | | 4 683.0 | | | | 5 322.5 | | | | 3 833.6 | | | | 4 100.0 | | | | 7.0 | % | | | 4 590.0 | | | | 4 590.0 | |
| | | | | | | | |
Domestic taxes on goods and services | | | | | | | 203 666.8 | | | | 249 490.4 | | | | 263 949.9 | | | | 298 935.2 | | | | 13.3 | % | | | 327 513.7 | | | | 333 344.0 | |
Value-added tax | | | 4 | ) | | | 147 941.3 | | | | 183 571.4 | | | | 191 020.2 | | | | 217 000.0 | | | | 13.6 | % | | | 242 990.0 | | | | 242 990.0 | |
Specific excise duties | | | | | | | 21 289.3 | | | | 22 967.6 | | | | 25 411.1 | | | | 28 360.2 | | | | 11.6 | % | | | 29 200.0 | | | | 31 265.0 | |
Ad valorem excise duties | | | | | | | 1 275.9 | | | | 1 596.2 | | | | 1 828.3 | | | | 2 189.7 | | | | 19.8 | % | | | 2 400.0 | | | | 2 400.0 | |
General fuel levy | | | | | | | 28 832.5 | | | | 34 417.6 | | | | 36 602.3 | | | | 40 500.0 | | | | 10.6 | % | | | 41 700.0 | | | | 44 970.0 | |
Air departure tax | | | | | | | 580.3 | | | | 647.8 | | | | 762.4 | | | | 920.3 | | | | 20.7 | % | | | 950.0 | | | | 950.0 | |
Electricity levy | | | | | | | 3 341.7 | | | | 4 996.4 | | | | 6 429.7 | | | | 7 900.0 | | | | 22.9 | % | | | 8 130.0 | | | | 8 130.0 | |
Other | | | 5 | ) | | | 405.7 | | | | 1 293.3 | | | | 1 895.8 | | | | 2 065.0 | | | | 8.9 | % | | | 2 143.7 | | | | 2 639.0 | |
| | | | | | | | |
Taxes on international trade and transactions | | | | | | | 19 318.9 | | | | 26 977.1 | | | | 34 121.0 | | | | 38 093.4 | | | | 11.6 | % | | | 41 833.7 | | | | 41 833.7 | |
Customs duties | | | | | | | 19 577.1 | | | | 26 637.4 | | | | 34 197.9 | | | | 37 640.2 | | | | 10.1 | % | | | 41 340.0 | | | | 41 340.0 | |
Other | | | 6 | ) | | | -258.3 | | | | 339.7 | | | | -76.9 | | | | 453.2 | | | | -689.2 | % | | | 493.7 | | | | 493.7 | |
| | | | | | | | |
Stamp duties and fees | | | | | | | 49.5 | | | | 3.1 | | | | -2.9 | | | | — | | | | -100.0 | % | | | — | | | | — | |
State miscellaneous revenue | | | 7 | ) | | | -5.7 | | | | 16.7 | | | | 8.8 | | | | — | | | | — | | | | — | | | | — | |
| | | | | | | | | | | | | | | | | | | | | | | | | | | | | | | | |
TOTAL TAX REVENUE (gross) | | | | | | | 598 705.4 | | | | 674 183.1 | | | | 742 651 | | | | 810 150.3 | | | | 9.1 | % | | | 900 415.5 | | | | 898 003.9 | |
Non-tax revenue | | | 8 | ) | | | 8 894.4 | | | | 13 460.1 | | | | 19 193.1 | | | | 14 475.1 | | | | -24.6 | % | | | -18 336.4 | | | | -18 336.4 | |
Less: SACU payments | | | 9 | ) | | | -27 915.4 | | | | -14 991.3 | | | | -21 760.0 | | | | -42 151.3 | | | | 93.7 | % | | | -43 374.3 | | | | -43 374.3 | |
Other adjustment | | | 10 | ) | | | — | | | | -2 914.4 | | | | — | | | | — | | | | — | | | | — | | | | — | |
| | | | | | | | | | | | | | | | | | | | | | | | | | | | | | | | |
TOTAL MAIN BUDGET REVENUE | | | | | | | 579 684.5 | | | | 669 737.5 | | | | 740 084.2 | | | | 782 474.1 | | | | 5.7 | % | | | 875 377.6 | | | | 872 965.9 | |
| | | | | | | | | | | | | | | | | | | | | | | | | | | | | | | | |
Current revenue | | | | | | | 579 648.2 | | | | 669 702.1 | | | | 740 022.0 | | | | 782 432.3 | | | | 5.7 | % | | | 875 311.9 | | | | 872 900.2 | |
Direct taxes | | | | | | | 367 669.0 | | | | 389 440.5 | | | | 437 854.7 | | | | 465 821.7 | | | | 6.4 | % | | | 522 988.1 | | | | 514 746.1 | |
Indirect taxes | | | | | | | 231 042.1 | | | | 284 726.0 | | | | 304 787.6 | | | | 344 328.7 | | | | 13.0 | % | | | 377 427.4 | | | | 383 257.8 | |
State miscellaneous revenue | | | | | | | -5.7 | | | | 16.7 | | | | 8.8 | | | | — | | | | -100.0 | % | | | — | | | | — | |
Non-tax revenue (excluding sales of capital assets) | | | 11 | ) | | | 8 858.2 | | | | 13 424.6 | | | | 19 130.9 | | | | 14 433.3 | | | | -24.6 | % | | | 18 270.7 | | | | 18 270.7 | |
Less: SACU payments | | | | | | | -27 915.4 | | | | -17 905.7 | | | | -21 760.0 | | | | -42 151.3 | | | | 93.7 | % | | | -43 374.3 | | | | -43 374.3 | |
Sales of capital assets | | | | | | | 36.3 | | | | 35.4 | | | | 62.2 | | | | 41.8 | | | | -32.8 | % | | | 65.7 | | | | 65.7 | |
| | | | | | | | | | | | | | | | | | | | | | | | | | | | | | | | |
Extraordinary receipts | | | 12 | ) | | | 6 428.7 | | | | 3 009.7 | | | | 5 209.4 | | | | 11 044.1 | | | | 112.0 | % | | | — | | | | — | |
| | | | | | | | | | | | | | | | | | | | | | | | | | | | | | | | |
| 1) | Includes interest on overdue income tax, non-resident shareholders’ tax (prior to 1999/00), non-residents’ tax on interest (prior to 1999/00), undistributed profits tax (prior to 1999/00) and small business tax amnesty (in 2006/07, 2007/08 and 2008/09). |
| 2) | Levy on payroll dedicated to skills development. |
| 3) | The securities transfer tax replaced the uncertificated securities tax as from 1 July 2008. The uncertificated securities tax replaced the marketable securities tax as from 1 June 1999. |
| 4) | The value-added tax (VAT) replaced the general sales tax in September 1991. |
| 5) | Includes plastic bag levy (from 2004/05), Universal Service Fund (from 1998/99), Human Resources Fund and Universal Service Agency (in 1998/99 and 1999/00), levies on financial services (up to 2004/05) and carbon dioxide motor vehicle emissions tax (from 2010/11). Mining leases and ownership has been reclassified as non-tax revenue. The historical years from 1998/99 have been adjusted for comparative purposes. |
150
ANNEXURE B: STATISTICAL TABLES
| | |
| | Table 2 Main budget: estimates of national revenue Summary of revenue 1) |
| | | | | | | | | | | | | | | | | | | | | | | | | | | | |
| 2013/14 | | | 2014/15 | | | 2015/16 | | | | | | |
% change
on revised
2012/13 | | | % of
total budget
revenue | | | Estimates | | | % change on
after tax proposals
2013/14 | | | Estimates | | | % change
on
2014/15 | | | | | | R million |
| | 10.5% | | | | 57.4 | % | | | 557 285.4 | | | | 11.2 | % | | | 618 813.2 | | | | 11.0 | % | | | | | | Taxes on income and profits |
| | 11.7% | | | | 35.1 | % | | | 337 420.0 | | | | 10.2 | % | | | 372 160.0 | | | | 10.3 | % | | | | | | Persons and individuals |
| | 8.6% | | | | 19.5 | % | | | 191 376.2 | | | | 12.7 | % | | | 214 744.5 | | | | 12.2 | % | | | | | | Companies |
| | 9.2% | | | | 2.6 | % | | | 25 840.0 | | | | 12.7 | % | | | 29 000.0 | | | | 12.2 | % | | | | | | Secondary tax on companies |
| | — | | | | — | | | | — | | | | — | | | | — | | | | — | | | | | | | Tax on retirement funds |
| | 11.8% | | | | 0.3 | % | | | 2 649.2 | | | | 10.1 | % | | | 2 908.7 | | | | 9.8 | % | | | 1 | ) | | Other |
| | | | | | | |
| | 8.8% | | | | 1.4 | % | | | 13 544.0 | | | | 9.2 | % | | | 14 817.0 | | | | 9.4 | % | | | | | | Taxes on payroll and workforce |
| | 8.8% | | | | 1.4 | % | | | 13 544.0 | | | | 9.2 | % | | | 14 817.0 | | | | 9.4 | % | | | 2 | ) | | Skills development levy |
| | 10.6% | | | | 1.0 | % | | | 10 130.0 | | | | 11.7 | % | | | 11 350.0 | | | | 12.0 | % | | | | | | Taxes on property |
| | 12.7% | | | | 0.0 | % | | | 100.0 | | | | 11.1 | % | | | 110.0 | | | | 10.0 | % | | | | | | Donations tax |
| | 9.7% | | | | 0.1 | % | | | 990.0 | | | | 10.0 | % | | | 1 090.0 | | | | 10.1 | % | | | | | | Estate duty |
| | 9.1% | | | | 0.4 | % | | | 3 930.0 | | | | 12.6 | % | | | 4 410.0 | | | | 12.2 | % | | | 3 | ) | | Securities transfer tax |
| | 12.0% | | | | 0.5 | % | | | 5 110.0 | | | | 11.3 | % | | | 5 740.0 | | | | 12.3 | % | | | | | | Transfer duties |
| | | | | | | |
| | 11.5% | | | | 38.2 | % | | | 364 300.0 | | | | 9.3 | % | | | 401 530.0 | | | | 10.2 | % | | | | | | Domestic taxes on goods and services |
| | 12.0% | | | | 27.8 | % | | | 270 540.0 | | | | 11.3 | % | | | 304 010.0 | | | | 12.4 | % | | | 4 | ) | | Value-added tax |
| | 10.2% | | | | 3.6 | % | | | 32 390.0 | | | | 3.6 | % | | | 33 630.0 | | | | 3.8 | % | | | | | | Specific excise duties |
| | 9.6% | | | | 0.3 | % | | | 2 650.0 | | | | 10.4 | % | | | 2 920.0 | | | | 10.2 | % | | | | | | Ad valorem excise duties |
| | 11.0% | | | | 5.2 | % | | | 46 580.0 | | | | 3.6 | % | | | 48 360.0 | | | | 3.8 | % | | | | | | General fuel levy |
| | 3.2% | | | | 0.1 | % | | | 980.0 | | | | 3.2 | % | | | 1 020.0 | | | | 4.1 | % | | | | | | Air departure tax |
| | 2.9% | | | | 0.9 | % | | | 8 420.0 | | | | 3.6 | % | | | 8 740.0 | | | | 3.8 | % | | | | | | Electricity levy |
| | 27.8% | | | | 0.3 | % | | | 2 740.0 | | | | 3.8 | % | | | 2 850.0 | | | | 4.0 | % | | | 5 | ) | | Other |
| | | | | | | |
| | 9.8% | | | | 4.8 | % | | | 46 570.3 | | | | 11.3 | % | | | 52 445.1 | | | | 12.6 | % | | | | | | Taxes on international trade and transactions |
| | 9.8% | | | | 4.7 | % | | | 46 020.0 | | | | 11.3 | % | | | 51 830.0 | | | | 12.6 | % | | | | | | Customs duties |
| | 8.9% | | | | 0.1 | % | | | 550.3 | | | | 11.5 | % | | | 615.1 | | | | 11.8 | % | | | 6 | ) | | Other |
| | — | | | | — | | | | — | | | | — | | | | — | | | | — | | | | | | | Stamp duties and fees |
| | — | | | | — | | | | — | | | | — | | | | — | | | | — | | | | 7 | ) | | State miscellaneous revenue |
| | | | | | | | | | | | | | | | | | | | | | | | | | | | |
| | 10.8% | | | | 102.9 | % | | | 991 829.7 | | | | 10.4 | % | | | 1 098 955.4 | | | | 10.8 | % | | | | | | TOTAL TAX REVENUE (gross) |
| | | | | | | |
| | 26.7% | | | | 2.1 | % | | | 19 128.9 | | | | 4.3 | % | | | 20 240.6 | | | | 5.8 | % | | | 8 | ) | | Non-tax revenue |
| | 2.9% | | | | -5.0 | % | | | -43 036.0 | | | | -0.8 | % | | | -48 469.3 | | | | 12.6 | % | | | 9 | ) | | Less: SACU payments |
| | — | | | | — | | | | — | | | | — | | | | — | | | | — | | | | 10 | ) | | Other adjustment |
| | | | | | | | | | | | | | | | | | | | | | | | | | | | |
| | 11.6% | | | | 100.0 | % | | | 967 922.5 | | | | 10.9 | % | | | 1 070 726.6 | | | | 10.6 | % | | | | | | TOTAL MAIN BUDGET REVENUE |
| | | | | | | | | | | | | | | | | | | | | | | | | | | | |
| | 11.6% | | | | 100.0 | % | | | 967 857.0 | | | | 10.9 | % | | | 1 070 660.7 | | | | 10.6 | % | | | | | | Current revenue |
| | 10.5% | | | | 59.0 | % | | | 571 919.4 | | | | 11.1 | % | | | 634 830.2 | | | | 11.0 | % | | | | | | Direct taxes |
| | 11.3% | | | | 43.9 | % | | | 419 910.3 | | | | 9.6 | % | | | 464 125.1 | | | | 10.5 | % | | | | | | Indirect taxes |
| | — | | | | — | | | | — | | | | — | | | | — | | | | — | | | | | | | State miscellaneous revenue |
| | 26.6% | | | | 2.1 | % | | | 19 063.4 | | | | 4.3 | % | | | 20 174.7 | | | | 5.8 | % | | | 11 | ) | | Non-tax revenue (excluding sales of capital assets) |
| | 2.9% | | | | -5.0 | % | | | -43 036.0 | | | | -0.8 | % | | | -48 469.3 | | | | 12.6 | % | | | | | | Less: SACU payments |
| | 57.2% | | | | 0.0 | % | | | 65.5 | | | | -0.3 | % | | | 65.9 | | | | 0.6 | % | | | | | | Sales of capital assets |
| | | | | | | | | | | | | | | | | | | | | | | | | | | | |
| | — | | | | — | | | | — | | | | — | | | | — | | | | — | | | | 12 | ) | | Extraordinary receipts |
| | | | | | | | | | | | | | | | | | | | | | | | | | | | |
| 6) | Includes miscellaneous customs and excise receipts, ordinary levy (up to 2004/05) and diamond export duties. |
| 7) | Includes revenue received by SARS that could not be allocated to a specific revenue type. |
| 8) | Includes sales of goods and services, fines, penalties and forfeits, interest, dividends and rent on land (including mineral and petroleum royalties), sales of capital assets as well as transactions in financial assets and liabilities. |
| 9) | Payments in terms of SACU agreements. |
| 10) | Payment to SACU partners in respect of a previous error in calculation of the 1969 agreement. |
| 11) | Excludes sales of capital assets. |
| 12) | Sales of strategic fuel stocks, proceeds from sales of state assets and certain other receipts are, by law, paid into the National Revenue Fund, but are not regarded as departmental receipts. |
151
2013 BUDGET REVIEW
Table 3
Main budget: estimates of national revenue
Detailed classification of revenue
| | | | | | | | | | | | | | | | | | | | | | | | | | | | |
| | | | | | 2009/10 | | | 2010/11 | | | 2011/12 | |
| | | | | | Actual | | | Before | | | After | | | Revised | | | Actual | |
R thousands | | | | | collections | | | tax proposals | | | estimate | | | collection | |
Taxes on income and profits | | | | | | | 359 044 847 | | | | 379 941 233 | | | | 426 694 589 | | | | 418 344 589 | | | | 423 805 031 | | | | 426 583 730 | |
Income tax on persons and individuals | | | | | | | 205 145 021 | | | | 226 925 026 | | | | 261 600 000 | | | | 252 750 000 | | | | 249 700 000 | | | | 250 399 638 | |
Tax on corporate income | | | | | | | | | | | | | | | | | | | | | | | | | | | | |
Companies | | | | | | | 134 883 420 | | | | 132 901 680 | | | | 143 665 000 | | | | 144 165 000 | | | | 152 000 000 | | | | 151 626 676 | |
Secondary tax on companies/Dividends tax | | | | | | | 15 467 795 | | | | 17 178 189 | | | | 18 100 000 | | | | 18 100 000 | | | | 19 500 000 | | | | 21 965 409 | |
Tax on retirement funds | | | | | | | 42 699 | | | | 2 772 | | | | — | | | | — | | | | — | | | | 6 665 | |
Other | | | | | | | | | | | | | | | | | | | | | | | | | | | | |
Interest on overdue income tax | | | | | | | 3 433 025 | | | | 2 904 485 | | | | 3 329 589 | | | | 3 329 589 | | | | 2 605 031 | | | | 2 585 012 | |
Small business tax amnesty | | | | | | | 72 888 | | | | 29 080 | | | | — | | | | — | | | | — | | | | 330 | |
| | | | | | | |
Taxes on payroll and workforce | | | | | | | 7 804 829 | | | | 8 652 340 | | | | 9 150 000 | | | | 9 150 000 | | | | 10 100 000 | | | | 10 173 133 | |
Skills development levy | | | | | | | 7 804 829 | | | | 8 652 340 | | | | 9 150 000 | | | | 9 150 000 | | | | 10 100 000 | | | | 10 173 133 | |
| | | | | | | |
Taxes on property | | | | | | | 8 826 422 | | | | 9 102 302 | | | | 10 340 000 | | | | 9 590 000 | | | | 7 870 000 | | | | 7 817 499 | |
Estate, inheritance and gift taxes | | | | | | | | | | | | | | | | | | | | | | | | | | | | |
Donations tax | | | | | | | 60 084 | | | | 64 584 | | | | 70 000 | | | | 70 000 | | | | 50 000 | | | | 52 657 | |
Estate duty | | | | | | | 759 273 | | | | 782 325 | | | | 870 000 | | | | 870 000 | | | | 1 110 000 | | | | 1 045 163 | |
Taxes on financial and capital transactions | | | | | | | | | | | | | | | | | | | | | | | | | | | | |
Securities transfer tax | | | 1) | | | | 3 324 017 | | | | 2 932 906 | | | | 3 300 000 | | | | 3 300 000 | | | | 2 840 000 | | | | 2 886 114 | |
Transfer duties | | | | | | | 4 683 047 | | | | 5 322 487 | | | | 6 100 000 | | | | 5 350 000 | | | | 3 870 000 | | | | 3 833 565 | |
| | | | | | | |
Domestic taxes on goods and services | | | | | | | 203 666 753 | | | | 249 490 373 | | | | 269 225 000 | | | | 274 210 000 | | | | 264 649 769 | | | | 263 949 858 | |
Value-added tax | | | | | | | | | | | | | | | | | | | | | | | | | | | | |
Domestic VAT | | | | | | | 195 049 764 | | | | 205 028 786 | | | | 237 192 247 | | | | 237 192 247 | | | | 220 211 257 | | | | 220 215 115 | |
Import VAT | | | | | | | 70 319 949 | | | | 82 188 621 | | | | 90 538 625 | | | | 90 538 625 | | | | 101 999 893 | | | | 101 812 696 | |
Refunds | | | | | | | -117 428 391 | | | | -103 645 967 | | | | -126 850 872 | | | | -126 850 872 | | | | -131 396 150 | | | | -131 007 612 | |
Specific excise duties | | | | | | | | | | | | | | | | | | | | | | | | | | | | |
Beer | | | | | | | 5 738 164 | | | | 7 006 915 | | | | 6 669 113 | | | | 7 180 030 | | | | 7 555 000 | | | | 7 602 586 | |
Sorghum beer and sorghum flour | | | | | | | 34 394 | | | | 35 959 | | | | 44 989 | | | | 48 436 | | | | 36 621 | | | | 33 743 | |
Wine and other fermented beverages | | | | | | | 1 482 517 | | | | 1 494 710 | | | | 1 525 048 | | | | 1 641 882 | | | | 1 955 372 | | | | 1 875 112 | |
Spirits | | | | | | | 2 790 309 | | | | 2 831 005 | | | | 2 959 155 | | | | 3 185 854 | | | | 3 319 988 | | | | 3 399 456 | |
Cigarettes and cigarette tobacco | | | | | | | 9 187 982 | | | | 9 367 944 | | | | 9 854 259 | | | | 10 609 188 | | | | 10 474 787 | | | | 10 172 151 | |
Pipe tobacco and cigars | | | | | | | 482 195 | | | | 485 745 | | | | 563 069 | | | | 606 205 | | | | 668 729 | | | | 628 820 | |
Petroleum products | | | 2) | | | | 872 701 | | | | 917 927 | | | | 1 057 231 | | | | 1 138 224 | | | | 926 000 | | | | 924 433 | |
Revenue from neighbouring countries | | | 3) | | | | 701 017 | | | | 827 409 | | | | 627 136 | | | | 675 180 | | | | 943 503 | | | | 774 847 | |
Ad valorem excise duties | | | | | | | 1 275 942 | | | | 1 596 229 | | | | 2 080 000 | | | | 2 230 000 | | | | 1 814 644 | | | | 1 828 347 | |
General fuel levy | | | | | | | 28 832 536 | | | | 34 417 577 | | | | 35 000 000 | | | | 36 900 000 | | | | 37 180 000 | | | | 36 602 263 | |
Taxes on use of goods or permission to use goods or to perform activities | | | | | | | | | | | | | | | | | | | | | | | | | | | | |
Air passenger tax | | | | | | | 580 326 | | | | 647 810 | | | | 730 000 | | | | 730 000 | | | | 730 124 | | | | 762 416 | |
Plastic bags levy | | | | | | | 110 510 | | | | 258 222 | | | | 300 000 | | | | 300 000 | | | | 25 000 | | | | 53 832 | |
Electricity levy | | | | | | | 3 341 691 | | | | 4 996 366 | | | | 5 380 000 | | | | 6 530 000 | | | | 6 430 000 | | | | 6 429 721 | |
Incandescent light bulb levy | | | | | | | 63 880 | | | | 151 083 | | | | 75 000 | | | | 75 000 | | | | 105 000 | | | | 143 787 | |
CO2tax—motor vehicle emissions | | | | | | | — | | | | 625 891 | | | | 1 200 000 | | | | 1 200 000 | | | | 1 565 000 | | | | 1 617 353 | |
Turnover tax for micro businesses | | | | | | | 6 493 | | | | 2 802 | | | | 15 000 | | | | 15 000 | | | | 5 000 | | | | 5 703 | |
Other | | | | | | | | | | | | | | | | | | | | | | | | | | | | |
Universal Service Fund | | | | | | | 224 774 | | | | 255 341 | | | | 265 000 | | | | 265 000 | | | | 100 000 | | | | 75 089 | |
| | | | | | | |
Taxes on international trade and transactions | | | | | | | 19 318 860 | | | | 26 977 132 | | | | 30 325 440 | | | | 30 325 440 | | | | 32 310 000 | | | | 34 120 983 | |
Import duties | | | | | | | | | | | | | | | | | | | | | | | | | | | | |
Customs duties | | | | | | | 19 577 115 | | | | 26 637 438 | | | | 29 860 400 | | | | 29 860 400 | | | | 32 260 000 | | | | 34 197 901 | |
Other | | | | | | | | | | | | | | | | | | | | | | | | | | | | |
Miscellaneous customs and excise receipts | | | | | | | -294 020 | | | | 269 304 | | | | 409 540 | | | | 409 540 | | | | 5 000 | | | | -141 146 | |
Diamond export levy | | | | | | | 35 766 | | | | 70 390 | | | | 55 500 | | | | 55 500 | | | | 45 000 | | | | 64 229 | |
| | | | | | | |
Other taxes | | | | | | | 49 457 | | | | 3 069 | | | | — | | | | — | | | | — | | | | -2 894 | |
Stamp duties and fees | | | | | | | 49 457 | | | | 3 069 | | | | — | | | | — | | | | — | | | | -2 894 | |
State miscellaneous revenue | | | 4) | | | | -5 724 | | | | 16 698 | | | | — | | | | — | | | | — | | | | 8 761 | |
| | | | | | | | | | | | | | | | | | | | | | | | | | | | |
TOTAL TAX REVENUE (gross) | | | | | | | 598 705 444 | | | | 674 183 147 | | | | 745 735 029 | | | | 741 620 029 | | | | 738 734 800 | | | | 742 651 072 | |
| | | | | | | | | | | | | | | | | | | | | | | | | | | | |
Less: SACU payments | | | 5) | | | | -27 915 405 | | | | -17 905 679 | | | | -21 763 239 | | | | -21 763 239 | | | | -21 763 239 | | | | -21 759 964 | |
Payments in terms of Customs Union agreements (sec. 51(2) of Act 91 of 1964) | | | | | | | -27 915 405 | | | | -14 991 309 | | | | -21 763 239 | | | | -21 763 239 | | | | -21 763 239 | | | | -21 759 964 | |
Other adjustment | | | 6) | | | | — | | | | -2 914 370 | | | | — | | | | — | | | | — | | | | — | |
| | | | | | | | | | | | | | | | | | | | | | | | | | | | |
TOTAL TAX REVENUE (net of SACU payments) | | | | | | | 570 790 038 | | | | 656 277 467 | | | | 723 971 790 | | | | 719 856 790 | | | | 716 971 561 | | | | 720 891 108 | |
| | | | | | | | | | | | | | | | | | | | | | | | | | | | |
| 1) | The securities transfer tax replaced the uncertificated securities tax as from 1 July 2008. |
| 2) | Specific excise duties on petrol, distillate fuel, residual fuel and base oil. |
| 3) | Excise duties that are collected by Botswana, Lesotho, Namibia and Swaziland. |
152
ANNEXURE B: STATISTICAL TABLES
| | |
| | Table 3 Main budget: estimates of national revenue Detailed classification of revenue |
| | | | | | | | | | | | | | | | | | | | | | | | | | | | |
| 2012/13 | | | 2013/14 | | | | | | |
| Budget estimates | | | | | | % change on | | | | | | | | | | | | |
| Before | | | After | | | Revised | | | 2011/12 | | | Before | | | After | | | | | | |
| tax proposals | | | estimate | | | actual | | | tax proposals | | | | | | R thousands |
| | 486 379 255 | | | | 475 729 255 | | | | 453 521 614 | | | | 6.3 | % | | | 509 595 117 | | | | 501 353 117 | | | | | | | Taxes on income and profits |
| | 295 769 650 | | | | 285 969 650 | | | | 274 020 092 | | | | 9.4 | % | | | 313 570 000 | | | | 306 188 000 | | | | | | | Income tax on persons and individuals |
| | | | | | | | | | | | | | | | | | | | | | | | | | | | Tax on corporate income |
| | 166 738 600 | | | | 167 838 600 | | | | 156 350 000 | | | | 3.1 | % | | | 170 690 004 | | | | 169 830 004 | | | | | | | Companies |
| | 21 000 000 | | | | 19 050 000 | | | | 21 000 000 | | | | -4.4 | % | | | 22 930 000 | | | | 22 930 000 | | | | | | | Secondary tax on companies/Dividends tax |
| | — | | | | — | | | | — | | | | -100.0 | % | | | — | | | | — | | | | | | | Tax on retirement funds |
| | | | | | | | | | | | | | | | | | | | | | | | | | | | Other |
| | 2 871 005 | | | | 2 871 005 | | | | 2 151 523 | | | | -16.8 | % | | | 2 405 113 | | | | 2 405 113 | | | | | | | Interest on overdue income tax |
| | — | | | | — | | | | — | | | | -100.0 | % | | | — | | | | — | | | | | | | Small business tax amnesty |
| | | | | | | |
| | 11 131 211 | | | | 11 131 211 | | | | 11 400 000 | | | | 12.1 | % | | | 12 403 000 | | | | 12 403 000 | | | | | | | Taxes on payroll and workforce |
| | 11 131 211 | | | | 11 131 211 | | | | 11 400 000 | | | | 12.1 | % | | | 12 403 000 | | | | 12 403 000 | | | | | | | Skills development levy |
| | | | | | | |
| | 8 627 127 | | | | 8 627 127 | | | | 8 200 060 | | | | 4.9 | % | | | 9 070 000 | | | | 9 070 000 | | | | | | | Taxes on property |
| | | | | | | | | | | | | | | | | | | | | | | | | | | | Estate, inheritance and gift taxes |
| | 55 105 | | | | 55 105 | | | | 79 885 | | | | 51.7 | % | | | 90 000 | | | | 90 000 | | | | | | | Donations tax |
| | 1 220 731 | | | | 1 220 731 | | | | 820 175 | | | | -21.5 | % | | | 900 000 | | | | 900 000 | | | | | | | Estate duty |
| | | | | | | | | | | | | | | | | | | | | | | | | | | | Taxes on financial and capital transactions |
| | 3 104 972 | | | | 3 104 972 | | | | 3 200 000 | | | | 10.9 | % | | | 3 490 000 | | | | 3 490 000 | | | | 1) | | | Securities transfer tax |
| | 4 246 319 | | | | 4 246 319 | | | | 4 100 000 | | | | 7.0 | % | | | 4 590 000 | | | | 4 590 000 | | | | | | | Transfer duties |
| | | | | | | |
| | 286 212 003 | | | | 294 554 204 | | | | 298 935 231 | | | | 13.3 | % | | | 327 513 673 | | | | 333 344 041 | | | | | | | Domestic taxes on goods and services |
| | | | | | | | | | | | | | | | | | | | | | | | | | | | Value-added tax |
| | 242 674 851 | | | | 242 674 851 | | | | 243 000 000 | | | | 10.3 | % | | | 272 104 000 | | | | 272 104 000 | | | | | | | Domestic VAT |
| | 105 000 000 | | | | 105 000 000 | | | | 112 000 000 | | | | 10.0 | % | | | 125 414 000 | | | | 125 414 000 | | | | | | | Import VAT |
| | -138 000 000 | | | | -138 000 000 | | | | -138 000 000 | | | | 5.3 | % | | | -154 528 000 | | | | -154 528 000 | | | | | | | Refunds |
| | | | | | | | | | | | | | | | | | | | | | | | | | | | Specific excise duties |
| | 7 934 824 | | | | 8 476 896 | | | | 8 252 288 | | | | 8.5 | % | | | 8 496 662 | | | | 9 172 709 | | | | | | | Beer |
| | 38 281 | | | | 40 896 | | | | 35 750 | | | | 5.9 | % | | | 36 809 | | | | 36 809 | | | | | | | Sorghum beer and sorghum flour |
| | 1 803 041 | | | | 1 926 217 | | | | 1 929 290 | | | | 2.9 | % | | | 1 986 422 | | | | 2 150 010 | | | | | | | Wine and other fermented beverages |
| | 3 471 249 | | | | 3 708 389 | | | | 3 810 199 | | | | 12.1 | % | | | 3 923 030 | | | | 4 333 663 | | | | | | | Spirits |
| | 10 984 624 | | | | 11 735 044 | | | | 11 460 139 | | | | 12.7 | % | | | 11 799 507 | | | | 12 538 090 | | | | | | | Cigarettes and cigarette tobacco |
| | 745 992 | | | | 796 955 | | | | 710 660 | | | | 13.0 | % | | | 731 705 | | | | 807 854 | | | | | | | Pipe tobacco and cigars |
| | 1 026 259 | | | | 1 096 369 | | | | 1 042 587 | | | | 12.8 | % | | | 1 073 461 | | | | 1 073 461 | | | | 2) | | | Petroleum products |
| | 928 251 | | | | 991 665 | | | | 1 119 259 | | | | 44.4 | % | | | 1 152 403 | | | | 1 152 403 | | | | 3) | | | Revenue from neighbouring countries |
| | 1 999 920 | | | | 1 999 920 | | | | 2 189 711 | | | | 19.8 | % | | | 2 400 000 | | | | 2 400 000 | | | | | | | Ad valorem excise duties |
| | 38 258 220 | | | | 42 775 510 | | | | 40 500 000 | | | | 10.6 | % | | | 41 700 000 | | | | 44 970 000 | | | | | | | General fuel levy |
| | | | | | | | | | | | | | | | | | | | | | | | | | | | Taxes on use of goods or permission to use goods or to perform activities |
| | 750 298 | | | | 750 298 | | | | 920 300 | | | | 20.7 | % | | | 950 000 | | | | 950 000 | | | | | | | Air passenger tax |
| | 149 725 | | | | 149 725 | | | | 160 462 | | | | 198.1 | % | | | 170 000 | | | | 260 000 | | | | | | | Plastic bags levy |
| | 6 616 470 | | | | 8 601 470 | | | | 7 900 000 | | | | 22.9 | % | | | 8 130 000 | | | | 8 130 000 | | | | | | | Electricity levy |
| | 110 000 | | | | 110 000 | | | | 129 817 | | | | -9.7 | % | | | 133 673 | | | | 183 673 | | | | | | | Incandescent light bulb levy |
| | 1 610 000 | | | | 1 610 000 | | | | 1 570 016 | | | | -2.9 | % | | | 1 620 000 | | | | 1 975 368 | | | | | | | CO2tax—motor vehicle emissions |
| | 10 000 | | | | 10 000 | | | | 4 686 | | | | -17.8 | % | | | 10 000 | | | | 10 000 | | | | | | | Turnover tax for micro businesses |
| | | | | | | | | | | | | | | | | | | | | | | | | | | | Other |
| | 100 000 | | | | 100 000 | | | | 200 068 | | | | 166.4 | % | | | 210 000 | | | | 210 000 | | | | | | | Universal Service Fund |
| | | | | | | |
| | 36 359 673 | | | | 36 359 265 | | | | 38 093 426 | | | | 11.6 | % | | | 41 833 712 | | | | 41 833 712 | | | | | | | Taxes on international trade and transactions |
| | | | | | | | | | | | | | | | | | | | | | | | | | | | Import duties |
| | 36 160 000 | | | | 36 160 000 | | | | 37 640 215 | | | | 10.1 | % | | | 41 340 000 | | | | 41 340 000 | | | | | | | Customs duties |
| | | | | | | | | | | | | | | | | | | | | | | | | | | | Other |
| | 150 000 | | | | 149 592 | | | | 399 834 | | | | -383.3 | % | | | 438 162 | | | | 438 162 | | | | | | | Miscellaneous customs and excise receipts |
| | 49 673 | | | | 49 673 | | | | 53 376 | | | | -16.9 | % | | | 55 550 | | | | 55 550 | | | | | | | Diamond export levy |
| | | | | | | |
| | — | | | | — | | | | — | | | | -100.0 | % | | | — | | | | — | | | | | | | Other taxes |
| | — | | | | — | | | | — | | | | -100.0 | % | | | — | | | | — | | | | | | | Stamp duties and fees |
| | | | | | | |
| | — | | | | — | | | | — | | | | -100.0 | % | | | — | | | | — | | | | 4) | | | State miscellaneous revenue |
| | | | | | | | | | | | | | | | | | | | | | | | | | | | |
| | 828 709 270 | | | | 826 401 062 | | | | 810 150 332 | | | | 9.1 | % | | | 900 415 502 | | | | 898 003 870 | | | | | | | TOTAL TAX REVENUE (gross) |
| | | | | | | | | | | | | | | | | | | | | | | | | | | | |
| | -42 151 276 | | | | -42 151 276 | | | | -42 151 276 | | | | 93.7 | % | | | -43 374 338 | | | | -43 374 338 | | | | 5) | | | Less: SACU payments |
| | | | | | | | | | | | | | | | | | | | | | | | | | | | Payments in terms of Customs Union agreements |
| | -42 151 276 | | | | -42 151 276 | | | | -42 151 276 | | | | 93.7 | % | | | -43 374 338 | | | | -43 374 338 | | | | | | | (sec. 51(2) of Act 91 of 1964) |
| | — | | | | — | | | | — | | | | — | | | | — | | | | — | | | | 6) | | | Other adjustment |
| | | | | | | | | | | | | | | | | | | | | | | | | | | | |
| | 786 557 994 | | | | 784 249 786 | | | | 767 999 056 | | | | 6.5 | % | | | 857 041 164 | | | | 854 629 532 | | | | | | | TOTAL TAX REVENUE (net of SACU payments) |
| | | | | | | | | | | | | | | | | | | | | | | | | | | | |
| 4) | Revenue received by SARS in respect of taxation that could not be allocated to specific revenue types. |
| 5) | Payments in terms of SACU agreements. |
| 6) | Payment to SACU partners in respect of a previous error in calculation of the 1969 agreement. |
153
2013 BUDGET REVIEW
Table 3
Main budget: estimates of national revenue
Detailed classification of revenue
| | | | | | | | | | | | | | | | | | | | | | | | | | | | |
| | | | | | 2009/10 | | | 2010/11 | | | 2011/12 | |
| | | | | | Actual | | | Before | | | After | | | Revised | | | Actual | |
R thousands | | | | | collections | | | tax proposals | | | estimate | | | collection | |
TOTAL TAX REVENUE (net of SACU payments) | | | | | | | 570 790 038 | | | | 656 277 467 | | | | 723 971 790 | | | | 719 856 790 | | | | 716 971 561 | | | | 720 891 108 | |
| | | | | | | | | | | | | | | | | | | | | | | | | | | | |
Sales of goods and services other than capital assets | | | | | | | 2 313 946 | | | | 2 334 458 | | | | 1 548 626 | | | | 1 548 626 | | | | 2 565 800 | | | | 2 894 056 | |
Sales of goods and services produced by departments | | | | | | | | | | | | | | | | | | | | | | | | | | | | |
Sales by market establishments | | | 7) | | | | 34 744 | | | | 40 372 | | | | 69 505 | | | | 69 505 | | | | 40 823 | | | | 51 151 | |
Administrative fees | | | | | | | 1 529 124 | | | | 1 675 693 | | | | 945 028 | | | | 945 028 | | | | 1 903 479 | | | | 2 198 078 | |
Other sales | | | | | | | 726 067 | | | | 596 341 | | | | 510 041 | | | | 510 041 | | | | 590 578 | | | | 626 656 | |
Sales of scrap, waste, arms and other used current goods | | | | | | | 24 011 | | | | 22 052 | | | | 24 052 | | | | 24 052 | | | | 30 920 | | | | 18 171 | |
| | | | | | | |
Transfers received | | | | | | | 237 515 | | | | 250 895 | | | | 172 353 | | | | 172 353 | | | | 3 668 546 | | | | 360 296 | |
| | | | | | | |
Fines, penalties and forfeits | | | | | | | 1 698 145 | | | | 1 457 182 | | | | 526 859 | | | | 526 859 | | | | 917 990 | | | | 934 156 | |
| | | | | | | |
Interest, dividends and rent on land | | | | | | | 3 651 459 | | | | 8 169 733 | | | | 6 796 512 | | | | 6 796 512 | | | | 9 641 962 | | | | 10 340 527 | |
Interest | | | | | | | | | | | | | | | | | | | | | | | | | | | | |
Cash and cash equivalents | | | | | | | 127 053 | | | | 123 244 | | | | 112 459 | | | | 112 459 | | | | 45 336 | | | | 233 616 | |
Interest on loan | | | | | | | — | | | | — | | | | — | | | | — | | | | — | | | | — | |
Exchequer investments | | | | | | | 2 005 699 | | | | 2 400 884 | | | | 900 000 | | | | 900 000 | | | | 2 500 000 | | | | 2 725 461 | |
Dividends | | | | | | | | | | | | | | | | | | | | | | | | | | | | |
Airports Company South Africa | | | | | | | — | | | | — | | | | 124 000 | | | | 124 000 | | | | — | | | | | |
South African Special Risks Insurance Association | | | | | | | 78 911 | | | | 153 299 | | | | | | | | | | | | 126 656 | | | | | |
Vodacom | | | | | | | — | | | | 735 018 | | | | — | | | | — | | | | 1 118 157 | | | | 1 118 057 | |
Industrial Development Corporation | | | | | | | 120 000 | | | | 50 000 | | | | 95 400 | | | | 95 400 | | | | — | | | | 50 000 | |
Reserve Bank (National Treasury) | | | | | | | — | | | | — | | | | — | | | | — | | | | — | | | | 126 656 | |
Telkom | | | | | | | 238 105 | | | | 258 810 | | | | 621 143 | | | | 621 143 | | | | 300 219 | | | | 300 219 | |
Department of Mineral Resources | | | | | | | 227 752 | | | | — | | | | — | | | | — | | | | — | | | | | |
Public Investment Corporation | | | | | | | — | | | | — | | | | — | | | | — | | | | — | | | | — | |
Rent on land | | | | | | | | | | | | | | | | | | | | | | | | | | | | |
Mineral and petroleum royalties | | | 8) | | | | — | | | | 3 554 722 | | | | 4 890 000 | | | | 4 890 000 | | | | 5 500 000 | | | | 5 611 539 | |
Mining leases and ownership | | | 9) | | | | 633 125 | | | | 860 238 | | | | — | | | | — | | | | — | | | | 80 | |
Royalties, prospecting fees and surface rental | | | 10) | | | | 210 579 | | | | — | | | | 23 063 | | | | 23 063 | | | | — | | | | | |
Land rent | | | | | | | 10 235 | | | | 33 518 | | | | 30 447 | | | | 30 447 | | | | 51 594 | | | | 174 900 | |
| | | | | | | |
Sales of capital assets | | | | | | | 36 263 | | | | 35 448 | | | | 62 177 | | | | 62 177 | | | | 41 788 | | | | 114 738 | |
| | | | | | | |
Financial transactions in assets and liabilities | | | 11) | | | | 957 093 | | | | 1 212 359 | | | | 894 350 | | | | 894 350 | | | | 743 375 | | | | 4 549 319 | |
| | | | | | | | | | | | | | | | | | | | | | | | | | | | |
TOTAL NON-TAX REVENUE | | | | | | | 8 894 421 | | | | 13 460 075 | | | | 10 000 877 | | | | 10 000 877 | | | | 17 579 461 | | | | 19 193 092 | |
| | | | | | | | | | | | | | | | | | | | | | | | | | | | |
TOTAL MAIN BUDGET REVENUE | | | | | | | 579 684 459 | | | | 669 737 542 | | | | 733 972 667 | | | | 729 857 667 | | | | 734 551 022 | | | | 740 084 200 | |
| | | | | | | | | | | | | | | | | | | | | | | | | | | | |
Extraordinary receipts | | | | | | | 6 428 749 | | | | 3 009 738 | | | | | | | | | | | | 5 075 935 | | | | 5 209 376 | |
Adjustments due to transactions in government stock | | | | | | | 1 843 915 | | | | 1 777 405 | | | | | | | | | | | | 4 177 000 | | | | 3 507 744 | |
Revaluation profits on foreign currency transactions | | | | | | | — | | | | — | | | | | | | | | | | | 640 935 | | | | 640 935 | |
Penalties and forfeits from South African Reserve Bank | | | | | | | — | | | | — | | | | | | | | | | | | — | | | | — | |
Energy—Central energy fund | | | | | | | — | | | | — | | | | | | | | | | | | — | | | | — | |
Saambou Bank | | | | | | | — | | | | 20 000 | | | | | | | | | | | | — | | | | 30 000 | |
Proceeds from the sale of Telkom’s share in Vodacom | | | | | | | 3 933 903 | | | | — | | | | | | | | | | | | — | | | | — | |
Surplus cash from Independent Communications | | | | | | | 8 947 | | | | | | | | | | | | | | | | | | | | | |
Authority of South Africa | | | | | | | — | | | | — | | | | | | | | | | | | — | | | | 8 427 | |
Equalisation Fund account transfer | | | | | | | | | | | 700 000 | | | | | | | | | | | | | | | | | |
Profits on GFECRA | | | 12) | | | | — | | | | — | | | | | | | | | | | | — | | | | 794 283 | |
Special dividends | | | | | | | | | | | | | | | | | | | | | | | | | | | | |
Telkom | | | | | | | 538 324 | | | | 362 333 | | | | | | | | | | | | — | | | | — | |
Special restructuring proceeds from South African | | | | | | | | | | | | | | | | | | | | | | | | | | | | |
Special Risks Insurance Association | | | | | | | 103 660 | | | | 150 000 | | | | | | | | | | | | 228 000 | | | | 227 987 | |
Winding down of Diabo Share Trust | | | | | | | — | | | | — | | | | | | | | | | | | 30 000 | | | | — | |
| | | | | | | | | | | | | | | | | | | | | | | | | | | | |
| 7) | New item introduced on the standard chart of accounts from 2008/09. |
| 8) | Mineral royalties imposed on the transfer of mineral resources in terms of the Mineral and Petroleum Resources Royalty Act (2008), which came into operation on 1 May 2009. |
| 9) | Mining leases and ownership has been reclassified as non-tax revenue. The historical years from 1998/99 have been adjusted for comparative purposes. |
154
ANNEXURE B: STATISTICAL TABLES
| | | | | | | | | | | | | | | | | | | | | | | | | | | | |
| | | | | | | | | | | | | | | | | | | | | | | | | | | | Table 3 Main budget: estimates of national revenue Detailed classification of revenue |
| | | |
| 2012/13 | | | 2013/14 | | | | | | |
| Budget estimates | | | | | | % change on | | | | | | | | | | | | |
| Before | | | After | | | Revised | | | 2011/12 | | | Before | | | After | | | | | | |
| tax proposals | | | estimate | | | actual | | | tax proposals | | | | | | R thousands |
| | 786 557 994 | | | | 784 249 786 | | | | 767 999 056 | | | | 6.5 | % | | | 857 041 164 | | | | 854 629 532 | | | | | | | TOTAL TAX REVENUE (net of SACU payments) |
| | | | | | | | | | | | | | | | | | | | | | | | | | | | |
| | 2 408 056 | | | | 2 408 056 | | | | 2 112 578 | | | | -27.0 | % | | | 2 071 628 | | | | 2 071 628 | | | | | | | Sales of goods and services other than capital assets |
| | | | | | | | | | | | | | | | | | | | | | | | | | | | Sales of goods and services produced by departments |
| | 43 194 | | | | 43 194 | | | | 161 647 | | | | 216.0 | % | | | 44 767 | | | | 44 767 | | | | 7 | ) | | Sales by market establishments |
| | 1 727 650 | | | | 1 727 650 | | | | 1 332 472 | | | | -39.4 | % | | | 1 338 706 | | | | 1 338 706 | | | | | | | Administrative fees |
| | 606 150 | | | | 606 150 | | | | 595 744 | | | | -4.9 | % | | | 657 666 | | | | 657 666 | | | | | | | Other sales |
| | 31 063 | | | | 31 063 | | | | 22 715 | | | | 25.0 | % | | | 30 489 | | | | 30 489 | | | | | | | Sales of scrap, waste, arms and other used current goods |
| | 168 561 | | | | 168 561 | | | | 280 407 | | | | -22.2 | % | | | 171 207 | | | | 171 207 | | | | | | | Transfers received |
| | 951 887 | | | | 951 887 | | | | 864 565 | | | | -7.4 | % | | | 1 103 517 | | | | 1 103 517 | | | | | | | Fines, penalties and forfeits |
| | 10 673 670 | | | | 10 673 670 | | | | 10 152 489 | | | | -1.8 | % | | | 10 606 858 | | | | 10 606 858 | | | | | | | Interest, dividends and rent on land |
| | | | | | | | | | | | | | | | | | | | | | | | | | | | Interest |
| | 79 178 | | | | 79 178 | | | | 110 933 | | | | -52.5 | % | | | 78 877 | | | | 78 877 | | | | | | | Cash and cash equivalents |
| | — | | | | — | | | | — | | | | — | | | | 681 000 | | | | 681 000 | | | | | | | Interest on loan |
| | 2 305 000 | | | | 2 305 000 | | | | 3 137 000 | | | | 15.1 | % | | | 1 700 000 | | | | 1 700 000 | | | | | | | Exchequer investments |
| | | | | | | | | | | | | | | | | | | | | | | | | | | | Dividends |
| | — | | | | — | | | | — | | | | — | | | | — | | | | — | | | | | | | Airports Company South Africa |
| | 135 981 | | | | 135 981 | | | | 135 981 | | | | — | | | | 142 639 | | | | 142 639 | | | | | | | South African Special Risks Insurance Association |
| | 1 174 065 | | | | 1 174 065 | | | | 1 666 721 | | | | 49.1 | % | | | 1 666 721 | | | | 1 666 721 | | | | | | | Vodacom |
| | 101 124 | | | | 101 124 | | | | 50 000 | | | | — | | | | 50 000 | | | | 50 000 | | | | | | | Industrial Development Corporation |
| | — | | | | — | | | | — | | | | -100.0 | % | | | — | | | | — | | | | | | | Reserve Bank (National Treasury) |
| | 315 230 | | | | 315 230 | | | | — | | | | -100.0 | % | | | — | | | | — | | | | | | | Telkom |
| | — | | | | — | | | | — | | | | — | | | | — | | | | — | | | | | | | Department of Mineral Resources |
| | — | | | | — | | | | — | | | | — | | | | 330 991 | | | | 330 991 | | | | | | | Public Investment Corporation |
| | | | | | | | | | | | | | | | | | | | | | | | | | | | Rent on land |
| | 6 510 000 | | | | 6 510 000 | | | | 5 000 000 | | | | -10.9 | % | | | 5 900 000 | | | | 5 900 000 | | | | 8 | ) | | Mineral and petroleum royalties |
| | — | | | | — | | | | — | | | | -100.0 | % | | | — | | | | — | | | | 9 | ) | | Mining leases and ownership |
| | — | | | | — | | | | — | | | | — | | | | — | | | | — | | | | 10 | ) | | Royalties, prospecting fees and surface rental |
| | 53 092 | | | | 53 092 | | | | 51 854 | | | | -70.4 | % | | | 56 630 | | | | 56 630 | | | | | | | Land rent |
| | 64 294 | | | | 64 294 | | | | 91 076 | | | | -20.6 | % | | | 65 695 | | | | 65 695 | | | | | | | Sales of capital assets |
| | 824 496 | | | | 824 496 | | | | 973 940 | | | | -78.6 | % | | | 4 317 487 | | | | 4 317 487 | | | | 11 | ) | | Financial transactions in assets and liabilities |
| | | | | | | | | | | | | | | | | | | | | | | | | | | | |
| | 15 090 964 | | | | 15 090 964 | | | | 14 475 055 | | | | -24.6 | % | | | 18 336 392 | | | | 18 336 392 | | | | | | | TOTAL NON-TAX REVENUE |
| | | | | | | | | | | | | | | | | | | | | | | | | | | | |
| | 801 648 958 | | | | 799 340 750 | | | | 782 474 111 | | | | 5.7 | % | | | 875 377 556 | | | | 872 965 924 | | | | | | | TOTAL MAIN BUDGET REVENUE |
| | | | | | | | | | | | | | | | | | | | | | | | | | | | |
| | | | | | | | | 11 044 117 | | | | | | | | | | | | | | | | | | | Extraordinary receipts |
| | | | | | | | | 10 500 000 | | | | | | | | | | | | | | | | | | | Adjustments due to transactions in government stock |
| | | | | | | | | 100 000 | | | | | | | | | | | | | | | | | | | Revaluation profits on foreign currency transactions |
| | | | | | | | | — | | | | | | | | | | | | | | | | | | | Penalties and forfeits from South African Reserve Bank |
| | | | | | | | | 387 618 | | | | | | | | | | | | | | | | | | | Energy-Central energy fund |
| | | | | | | | | — | | | | | | | | | | | | | | | | | | | Saambou Bank |
| | | | | | | | | — | | | | | | | | | | | | | | | | | | | Proceeds from the sale of Telkom’s share in Vodacom |
| | | | | | | | | | | | | | | | | | | | | | | | | | | | Surplus cash from Independent Communications |
| | | | | | | | | 6 499 | | | | | | | | | | | | | | | | | | | Authority of South Africa |
| | | | | | | | | | | | | | | | | | | | | | | | | | | | Equalisation Fund account transfer |
| | | | | | | | | — | | | | | | | | | | | | | | | | 12 | ) | | Profits on GFECRA |
| | | | | | | | | | | | | | | | | | | | | | | | | | | | Special dividends |
| | | | | | | | | — | | | | | | | | | | | | | | | | | | | Telkom |
| | | | | | | | | | | | | | | | | | | | | | | | | | | | Special restructuring proceeds from South African |
| | | | | | | | | 50 000 | | | | | | | | | | | | | | | | | | | Special Risks Insurance Association |
| | | | | | | | | — | | | | | | | | | | | | | | | | | | | Winding down of Diabo Share Trust |
| 10) | Royalties, prospecting fees and surface rental collected by the Department of Minerals and Energy. |
| 11) | Includes recoveries of loans and advances. |
| 12) | Gold and foreign exchange contingency reserve account. |
155
2013 BUDGET REVIEW
Table 4
Main budget: expenditure defrayed from the National Revenue Fund by vote
| | | | | | | | | | | | | | | | | | | | | | | | |
| | | | | | 2009/10 | | | 2010/11 | |
| | | | | | Expenditure | | | of which | | | Expenditure | | | of which | |
R million | | | | | on budget
vote
outcome | | | transfers
to
provinces 1) | | | transfers
to local
government 2) | | | on budget
vote
outcome | | | transfers
to
provinces 1) | |
Central government administration | | | | | | | | | | | | | | | | | | | | | | | | |
The Presidency | | | | | | | 817.5 | | | | — | | | | — | | | | 958.7 | | | | — | |
Parliament | | | | | | | 1 009.0 | | | | — | | | | — | | | | 1 198.9 | | | | — | |
Cooperative Governance and Traditional Affairs | | | | | | | 33 661.6 | | | | — | | | | 32 833.8 | | | | 41 821.4 | | | | 214.4 | |
of which: local government equitable share | | | | | | | — | | | | — | | | | 23 845.5 | | | | — | | | | — | |
Home Affairs | | | | | | | 5 288.2 | | | | — | | | | — | | | | 6 619.8 | | | | — | |
International Relations and Cooperation | | | | | | | 5 417.4 | | | | — | | | | — | | | | 4 417.2 | | | | — | |
Performance Monitoring and Evaluation | | | | | | | 13.4 | | | | — | | | | — | | | | 47.3 | | | | — | |
Public Works | | | | | | | 5 533.6 | | | | 1 466.0 | | | | 100.5 | | | | 6 615.1 | | | | 2 104.3 | |
Women, Children and People with Disabilities | | | | | | | 77.5 | | | | — | | | | — | | | | 109.9 | | | | — | |
Financial and administrative services | | | | | | | | | | | | | | | | | | | | | | | | |
Government Communication and Information System | | | | | | | 334.0 | | | | — | | | | — | | | | 352.2 | | | | — | |
National Treasury | | | | | | | 53 240.6 | | | | 4 200.0 | | | | 808.1 | | | | 38 226.2 | | | | — | |
Public Enterprises | | | | | | | 3 983.3 | | | | — | | | | — | | | | 540.0 | | | | — | |
Public Service and Administration | | | | | | | 670.8 | | | | — | | | | — | | | | 628.2 | | | | — | |
Statistics South Africa | | | | | | | 1 555.8 | | | | — | | | | — | | | | 1 694.9 | | | | — | |
Social services | | | | | | | | | | | | | | | | | | | | | | | | |
Arts and Culture | | | | | | | 2 224.9 | | | | 440.6 | | | | — | | | | 2 248.8 | | | | 462.4 | |
Basic Education | | | | | | | 7 854.3 | | | | 6 460.1 | | | | — | | | | 8 677.9 | | | | 7 078.6 | |
Health | | | | | | | 19 168.6 | | | | 17 523.8 | | | | — | | | | 22 520.3 | | | | 21 042.0 | |
Higher Education and Training | | | | | | | 20 684.4 | | | | 3 155.3 | | | | — | | | | 23 752.4 | | | | 3 804.0 | |
Labour | | | | | | | 1 698.7 | | | | — | | | | — | | | | 1 826.3 | | | | — | |
Social Development | | | | | | | 85 318.2 | | | | — | | | | — | | | | 94 031.0 | | | | — | |
Sport and Recreation South Africa | | | | | | | 2 866.4 | | | | 402.3 | | | | 2 168.7 | | | | 1 252.0 | | | | 426.4 | |
Justice, crime prevention and security | | | | | | | | | | | | | | | | | | | | | | | | |
Correctional Services | | | | | | | 13 687.3 | | | | — | | | | — | | | | 14 698.8 | | | | — | |
Defence and Military Veterans | | | | | | | 31 324.2 | | | | — | | | | — | | | | 30 442.4 | | | | — | |
Independent Police Investigative Directorate | | | | | | | 106.2 | | | | — | | | | — | | | | 128.4 | | | | — | |
Justice and Constitutional Development | | | | | | | 9 560.7 | | | | — | | | | — | | | | 10 586.8 | | | | — | |
Police | | | | | | | 47 662.5 | | | | — | | | | — | | | | 53 529.7 | | | | — | |
Economic services and infrastructure | | | | | | | | | | | | | | | | | | | | | | | | |
Agriculture, Forestry and Fisheries | | | | | | | 3 961.8 | | | | 973.7 | | | | — | | | | 3 850.7 | | | | 1 125.7 | |
Communications | | | | | | | 2 301.9 | | | | — | | | | — | | | | 1 426.5 | | | | — | |
Economic Development | | | | | | | 314.6 | | | | — | | | | — | | | | 400.7 | | | | — | |
Energy | | | | | | | 3 690.9 | | | | — | | | | 1 074.6 | | | | 5 505.4 | | | | — | |
Environmental Affairs | | | | | | | 2 749.3 | | | | — | | | | — | | | | 3 279.5 | | | | — | |
Human Settlements | | | | | | | 16 407.4 | | | | 10 819.3 | | | | 4 418.2 | | | | 18 916.5 | | | | 13 032.1 | |
Mineral Resources | | | | | | | 853.8 | | | | — | | | | — | | | | 994.7 | | | | — | |
Rural Development and Land Reform | | | | | | | 5 863.8 | | | | — | | | | — | | | | 7 122.9 | | | | — | |
Science and Technology | | | | | | | 4 183.9 | | | | — | | | | — | | | | 4 051.9 | | | | — | |
Tourism | | | | | | | 1 145.6 | | | | — | | | | — | | | | 1 143.5 | | | | — | |
Trade and Industry | | | | | | | 5 923.3 | | | | — | | | | — | | | | 5 796.7 | | | | — | |
Transport | | | | | | | 28 664.0 | | | | 10 832.1 | | | | 2 431.0 | | | | 29 155.1 | | | | 8 392.5 | |
Water Affairs | | | | | | | 6 563.7 | | | | — | | | | 902.4 | | | | 7 023.7 | | | | — | |
| | | | | | | | | | | | | | | | | | | | | | | | |
| | | | | | | 436 383.5 | | | | 56 273.0 | | | | 44 737.2 | | | | 455 592.4 | | | | 57 682.4 | |
Plus: | | | | | | | | | | | | | | | | | | | | | | | | |
Unallocated/projected underspending | | | | | | | — | | | | — | | | | — | | | | — | | | | — | |
Contingency reserve | | | | | | | — | | | | — | | | | — | | | | — | | | | — | |
| | | | | | | | | | | | | | | | | | | | | | | | |
Subtotal: appropriation by vote | | | | | | | 436 383.5 | | | | 56 273.0 | | | | 44 737.2 | | | | 455 592.4 | | | | 57 682.4 | |
Plus: | | | | | | | | | | | | | | | | | | | | | | | | |
Direct charges against the National Revenue Fund | | | | | | | | | | | | | | | | | | | | | | | | |
President and Deputy President salary (The Presidency) | | | | | | | 3.8 | | | | — | | | | — | | | | 4.0 | | | | — | |
Members’ remuneration (Parliament) | | | | | | | 398.8 | | | | — | | | | — | | | | 346.0 | | | | — | |
Debt-service costs (National Treasury) | | | | | | | 57 129.2 | | | | — | | | | — | | | | 66 226.8 | | | | — | |
Provincial equitable share (National Treasury) | | | 4 | ) | | | 236 890.8 | | | | 236 890.8 | | | | — | | | | 265 139.4 | | | | 265 139.4 | |
General fuel levy sharing with metropolitan municipalities (National Treasury) | | | | | | | 6 800.1 | | | | — | | | | 6 800.1 | | | | 7 542.4 | | | | — | |
Skills levy and Setas (Higher Education and Training) | | | | | | | 7 815.6 | | | | — | | | | — | | | | 8 379.3 | | | | — | |
Judges’ and magistrates’ salaries (Justice and Constitutional Development) | | | | | | | 1 774.9 | | | | — | | | | — | | | | 1 910.2 | | | | — | |
| | | | | | | | | | | | | | | | | | | | | | | | |
Main budget expenditure | | | | | | | 747 196.8 | | | | 293 163.8 | | | | 51 537.3 | | | | 805 140.5 | | | | 322 821.8 | |
| 1) | Includes provincial equitable share and conditional grants allocated to provinces. |
| 2) | Includes local government equitable share and conditional grants allocated to local government as well as general fuel levy sharing with metros. |
156
ANNEXURE B: STATISTICAL TABLES
| | | | | | | | | | | | | | | | | | | | | | | | | | |
| | | | | | | | | | | | | | | | | | | | | | | | | | Table 4 Main budget: expenditure defrayed from the National Revenue Fund by vote |
| | | | |
| 2010/11 | | | 2011/12 | | | 2012/13 | | | | | |
| of which | | | Expenditure | | | of which | | | | | | | | | | | |
transfers
to local
government 2) | | | on budget
vote
outcome | | | transfers
to
provinces 1) | | | transfers to
local
government 2) | | | Budget
estimate 3) | | | Adjusted
appro-
priation | | | | | R million |
| | | | | | | | | | | | | | | | | | | | | | | | | | Central government administration |
| | — | | | | 979.1 | | | | — | | | | — | | | | 1 018.0 | | | | 1 061.9 | | | | | The Presidency |
| | — | | | | 1 214.8 | | | | — | | | | — | | | | 1 333.3 | | | | 1 338.3 | | | | | Parliament |
| | 40 456.9 | | | | 46 221.6 | | | | 15.1 | | | | 44 869.1 | | | | 54 715.6 | | | | 54 855.2 | | | | | Cooperative Governance and Traditional Affairs |
| | 30 540.6 | | | | — | | | | — | | | | 33 173.2 | | | | — | | | | — | | | | | of which: local government equitable share |
| | — | | | | 5 752.5 | | | | — | | | | — | | | | 5 405.4 | | | | 5 353.1 | | | | | Home Affairs |
| | — | | | | 5 021.8 | | | | — | | | | — | | | | 5 116.6 | | | | 5 271.5 | | | | | International Relations and Cooperation |
| | — | | | | 95.6 | | | | — | | | | — | | | | 174.2 | | | | 174.2 | | | | | Performance Monitoring and Evaluation |
| | 279.6 | | | | 7 061.4 | | | | 2 229.0 | | | | 363.9 | | | | 7 993.8 | | | | 7 891.2 | | | | | Public Works |
| | — | | | | 165.9 | | | | — | | | | — | | | | 172.2 | | | | 192.8 | | | | | Women, Children and People with Disabilities |
| | | | | | | | | | | | | | | | | | | | | | | | | | Financial and administrative services |
| | — | | | | 343.6 | | | | — | | | | — | | | | 429.1 | | | | 461.0 | | | | | Government Communication and Information System |
| | 1 196.4 | | | | 21 362.0 | | | | 1 089.7 | | | | 1 162.0 | | | | 21 551.1 | | | | 21 177.6 | | | | | National Treasury |
| | — | | | | 346.1 | | | | — | | | | — | | | | 1 249.1 | | | | 1 376.8 | | | | | Public Enterprises |
| | — | | | | 645.5 | | | | — | | | | — | | | | 731.5 | | | | 726.9 | | | | | Public Service and Administration |
| | — | | | | 3 674.4 | | | | — | | | | — | | | | 1 721.6 | | | | 1 761.7 | | | | | Statistics South Africa |
| | | | | | | | | | | | | | | | | | | | | | | | | | Social services |
| | — | | | | 2 405.8 | | | | 569.9 | | | | — | | | | 2 685.7 | | | | 2 672.5 | | | | | Arts and Culture |
| | — | | | | 12 900.9 | | | | 10 357.7 | | | | — | | | | 16 343.6 | | | | 16 204.0 | | | | | Basic Education |
| | — | | | | 25 712.8 | | | | 24 034.8 | | | | — | | | | 27 557.0 | | | | 28 057.2 | | | | | Health |
| | — | | | | 28 281.7 | | | | 4 375.3 | | | | — | | | | 31 500.4 | | | | 31 586.2 | | | | | Higher Education and Training |
| | — | | | | 2 007.1 | | | | — | | | | — | | | | 2 119.7 | | | | 2 139.6 | | | | | Labour |
| | — | | | | 103 139.2 | | | | — | | | | — | | | | 112 216.8 | | | | 112 143.6 | | | | | Social Development |
| | 512.6 | | | | 810.6 | | | | 452.0 | | | | — | | | | 848.4 | | | | 1 063.1 | | | | | Sport and Recreation South Africa |
| | | | | | | | | | | | | | | | | | | | | | | | | | Justice, crime prevention and security |
| | — | | | | 16 276.8 | | | | — | | | | — | | | | 17 732.2 | | | | 17 700.3 | | | | | Correctional Services |
| | — | | | | 34 331.4 | | | | — | | | | — | | | | 37 493.0 | | | | 37 888.5 | | | | | Defence and Military Veterans |
| | — | | | | 153.5 | | | | — | | | | — | | | | 197.0 | | | | 197.9 | | | | | Independent Police Investigative Directorate |
| | — | | | | 11 470.4 | | | | — | | | | — | | | | 12 970.4 | | | | 12 912.2 | | | | | Justice and Constitutional Development |
| | — | | | | 57 933.1 | | | | — | | | | — | | | | 62 485.4 | | | | 63 388.7 | | | | | Police |
| | | | | | | | | | | | | | | | | | | | | | | | | | Economic services and infrastructure |
| | — | | | | 4 928.3 | | | | 1 651.7 | | | | — | | | | 5 798.8 | | | | 5 868.9 | | | | | Agriculture, Forestry and Fisheries |
| | — | | | | 1 792.0 | | | | — | | | | — | | | | 1 712.3 | | | | 1 655.0 | | | | | Communications |
| | — | | | | 577.6 | | | | — | | | | — | | | | 672.7 | | | | 696.5 | | | | | Economic Development |
| | 1 253.4 | | | | 6 174.3 | | | | — | | | | 1 376.6 | | | | 6 805.9 | | | | 6 734.5 | | | | | Energy |
| | — | | | | 4 108.5 | | | | — | | | | — | | | | 4 512.2 | | | | 5 175.3 | | | | | Environmental Affairs |
| | 4 968.0 | | | | 22 598.9 | | | | 15 121.5 | | | | 6 267.0 | | | | 25 263.2 | | | | 25 137.8 | | | | | Human Settlements |
| | — | | | | 1 029.4 | | | | — | | | | — | | | | 1 169.1 | | | | 1 175.5 | | | | | Mineral Resources |
| | — | | | | 7 997.7 | | | | — | | | | — | | | | 8 877.6 | | | | 8 974.1 | | | | | Rural Development and Land Reform |
| | — | | | | 4 403.5 | | | | — | | | | — | | | | 4 955.9 | | | | 4 999.6 | | | | | Science and Technology |
| | — | | | | 1 250.2 | | | | — | | | | — | | | | 1 367.3 | | | | 1 374.1 | | | | | Tourism |
| | — | | | | 6 801.0 | | | | — | | | | — | | | | 9 092.1 | | | | 8 351.1 | | | | | Trade and Industry |
| | 3 709.9 | | | | 41 196.5 | | | | 10 855.9 | | | | 4 647.1 | | | | 38 829.0 | | | | 39 647.2 | | | | | Transport |
| | 984.6 | | | | 8 164.9 | | | | — | | | | 992.3 | | | | 8 812.7 | | | | 8 993.2 | | | | | Water Affairs |
| | | | | | | | | | | | | | | | | | | | | | | | | | |
| | 53 361.3 | | | | 499 330.6 | | | | 70 752.7 | | | | 59 678.1 | | | | 543 629.5 | | | | 546 378.7 | | | | | |
| | | | | | | | | | | | | | | | | | | | | | | | | | Plus: |
| | — | | | | — | | | | — | | | | — | | | | 30.0 | | | | -4 000.0 | | | | | Unallocated/projected underspending |
| | — | | | | — | | | | — | | | | — | | | | 5 780.0 | | | | — | | | | | Contingency reserve |
| | | | | | | | | | | | | | | | | | | | | | | | | | |
| | 53 361.3 | | | | 499 330.6 | | | | 70 752.7 | | | | 59 678.1 | | | | 549 439.5 | | | | 542 378.7 | | | | | Subtotal: appropriation by vote |
| | | | | | | | | | | | | | | | | | | | | | | | | | Plus: |
| | | | | | | | | | | | | | | | | | | | | | | | | | Direct charges against the National Revenue Fund |
| | — | | | | 4.0 | | | | — | | | | — | | | | 2.7 | | | | 2.7 | | | | | President and Deputy President salary (The Presidency) |
| | — | | | | 357.6 | | | | — | | | | — | | | | 430.1 | | | | 430.1 | | | | | Members’ remuneration (Parliament) |
| | — | | | | 76 460.0 | | | | — | | | | — | | | | 89 388.1 | | | | 88 794.5 | | | | | Debt-service costs (National Treasury) |
| | — | | | | 291 735.5 | | | | 291 735.5 | | | | — | | | | 309 057.4 | | | | 313 015.8 | | | 4) | | Provincial equitable share (National Treasury) |
| | 7 542.4 | | | | 8 573.1 | | | | — | | | | 8 573.1 | | | | 9 039.7 | | | | 9 039.7 | | | | | General fuel levy sharing with metropolitan municipalities (National Treasury) |
| | — | | | | 10 025.3 | | | | — | | | | — | | | | 9 606.1 | | | | 11 400.0 | | | | | Skills levy and Setas (Higher Education and Training) |
| | — | | | | 2 037.1 | | | | — | | | | — | | | | 2 401.9 | | | | 2 401.9 | | | | | Judges’ and magistrates’ salaries (Justice and Constitutional Development) |
| | | | | | | | | | | | | | | | | | | | | | | | | | |
| | 60 903.7 | | | | 888 523.2 | | | | 362 488.2 | | | | 68 251.2 | | | | 969 365.5 | | | | 967 463.3 | | | | | Main budget expenditure |
| 3) | Budget estimate adjusted for function shifts. |
| 4) | Provincial equitable share, excluding conditional grants to provinces. |
157
2013 BUDGET REVIEW
Table 4
Main budget: expenditure defrayed from the National Revenue Fund by vote
| | | | | | | | | | | | | | | | | | | | | | | | | | |
| | | | | 2012/13 | | | 2013/14 | |
| | | | | | | | of which | | | | | | of which | |
R million | | | | Projected
vote
outturn | | | transfers
to
provinces 1) | | | transfers
to local
government 2) | | | Budget
estimate | | | transfers
to
provinces 1) | | | transfers
to local
government 2) | |
Central government administration | | | | | | | | | | | | | | | | | | | | | | | | | | |
The Presidency | | | | | 1 061.9 | | | | — | | | | — | | | | 1 092.9 | | | | — | | | | — | |
Parliament | | | | | 1 338.3 | | | | — | | | | — | | | | 1 419.4 | | | | — | | | | — | |
Cooperative Governance and Traditional Affairs | | | | | 54 176.2 | | | | 180.0 | | | | 51 815.1 | | | | 58 252.7 | | | | 188.1 | | | | 55 520.7 | |
of which: local government equitable share | | | | | — | | | | — | | | | 37 373.4 | | | | — | | | | — | | | | 40 581.8 | |
Home Affairs | | | | | 5 353.1 | | | | — | | | | — | | | | 6 567.8 | | | | — | | | | — | |
International Relations and Cooperation | | | | | 5 271.5 | | | | — | | | | — | | | | 5 548.4 | | | | — | | | | — | |
Performance Monitoring and Evaluation | | | | | 157.9 | | | | — | | | | — | | | | 192.7 | | | | — | | | | — | |
Public Works | | | | | 7 729.2 | | | | 2 428.8 | | | | 662.1 | | | | 6 170.0 | | | | 613.5 | | | | 610.7 | |
Women, Children and People with Disabilities | | | | | 188.7 | | | | — | | | | — | | | | 198.3 | | | | — | | | | — | |
Financial and administrative services | | | | | | | | | | | | | | | | | | | | | | | | | | |
Government Communication and Information System | | | | | 461.0 | | | | — | | | | — | | | | 396.7 | | | | — | | | | — | |
National Treasury | | | | | 21 053.7 | | | | — | | | | 1 056.3 | | | | 25 556.0 | | | | — | | | | 1 161.3 | |
Public Enterprises | | | | | 1 376.8 | | | | — | | | | — | | | | 236.9 | | | | — | | | | — | |
Public Service and Administration | | | | | 693.5 | | | | — | | | | — | | | | 816.4 | | | | — | | | | — | |
Statistics South Africa | | | | | 1 761.7 | | | | — | | | | — | | | | 1 737.7 | | | | — | | | | — | |
Social services | | | | | | | | | | | | | | | | | | | | | | | | | | |
Arts and Culture | | | | | 2 663.6 | | | | 564.6 | | | | — | | | | 2 914.8 | | | | 597.8 | | | | — | |
Basic Education | | | | | 15 034.8 | | | | 10 989.9 | | | | — | | | | 17 591.9 | | | | 12 343.3 | | | | — | |
Health | | | | | 27 942.2 | | | | 26 072.6 | | | | — | | | | 30 706.7 | | | | 27 516.7 | | | | — | |
Higher Education and Training | | | | | 31 571.2 | | | | 4 844.6 | | | | — | | | | 34 322.4 | | | | 2 442.7 | | | | — | |
Labour | | | | | 2 133.9 | | | | — | | | | — | | | | 2 415.2 | | | | — | | | | — | |
Social Development | | | | | 111 472.5 | | | | — | | | | — | | | | 120 491.6 | | | | — | | | | — | |
Sport and Recreation South Africa | | | | | 1 047.3 | | | | 469.6 | | | | 123.1 | | | | 1 073.5 | | | | 497.6 | | | | 120.0 | |
Justice, crime prevention and security | | | | | | | | | | | | | | | | | | | | | | | | | | |
Correctional Services | | | | | 17 510.3 | | | | — | | | | — | | | | 18 748.1 | | | | — | | | | — | |
Defence and Military Veterans | | | | | 37 888.5 | | | | — | | | | — | | | | 40 243.3 | | | | — | | | | — | |
Independent Police Investigative Directorate | | | | | 197.9 | | | | — | | | | — | | | | 217.0 | | | | — | | | | — | |
Justice and Constitutional Development | | | | | 12 912.2 | | | | — | | | | — | | | | 14 134.2 | | | | — | | | | — | |
Police | | | | | 63 388.7 | | | | — | | | | — | | | | 67 917.1 | | | | — | | | | — | |
Economic services and infrastructure | | | | | | | | | | | | | | | | | | | | | | | | | | |
Agriculture, Forestry and Fisheries | | | | | 5 727.3 | | | | 1 924.8 | | | | — | | | | 6 178.0 | | | | 2 147.5 | | | | — | |
Communications | | | | | 1 655.0 | | | | — | | | | — | | | | 2 043.9 | | | | — | | | | — | |
Economic Development | | | | | 649.5 | | | | — | | | | — | | | | 771.5 | | | | — | | | | — | |
Energy | | | | | 6 733.5 | | | | — | | | | 1 351.4 | | | | 6 598.2 | | | | — | | | | 1 815.5 | |
Environmental Affairs | | | | | 5 175.3 | | | | — | | | | — | | | | 5 431.2 | | | | — | | | | — | |
Human Settlements | | | | | 24 882.8 | | | | 15 726.0 | | | | 7 392.2 | | | | 28 110.5 | | | | 16 983.9 | | | | 9 183.6 | |
Mineral Resources | | | | | 1 163.0 | | | | — | | | | — | | | | 1 393.8 | | | | — | | | | — | |
Rural Development and Land Reform | | | | | 8 974.1 | | | | — | | | | — | | | | 9 459.7 | | | | — | | | | — | |
Science and Technology | | | | | 4 999.6 | | | | — | | | | — | | | | 6 198.2 | | | | — | | | | — | |
Tourism | | | | | 1 374.1 | | | | — | | | | — | | | | 1 500.6 | | | | — | | | | — | |
Trade and Industry | | | | | 8 305.2 | | | | — | | | | — | | | | 9 572.6 | | | | — | | | | — | |
Transport | | | | | 39 576.5 | | | | 12 299.1 | | | | 5 025.4 | | | | 42 275.3 | | | | 13 248.7 | | | | 5 602.2 | |
Water Affairs | | | | | 8 749.2 | | | | — | | | | 562.4 | | | | 10 187.0 | | | | — | | | | 1 023.9 | |
| | | | | | | | | | | | | | | | | | | | | | | | | | |
| | | | | 542 351.7 | | | | 75 500.0 | | | | 67 988.2 | | | | 588 682.1 | | | | 76 579.6 | | | | 75 037.9 | |
Plus: | | | | | | | | | | | | | | | | | | | | | | | | | | |
Unallocated/projected underspending | | | | | — | | | | — | | | | — | | | | 30.0 | | | | — | | | | — | |
Contingency reserve | | | | | — | | | | — | | | | — | | | | 4 000.0 | | | | — | | | | — | |
| | | | | | | | | | | | | | | | | | | | | | | | | | |
Subtotal: appropriation by vote | | | | | 542 351.7 | | | | 75 500.0 | | | | 67 988.2 | | | | 592 712.1 | | | | 76 579.6 | | | | 75 037.9 | |
Plus: | | | | | | | | | | | | | | | | | | | | | | | | | | |
Direct charges against the National Revenue Fund | | | | | | | | | | | | | | | | | | | | | | | | | | |
President and Deputy President salary (The Presidency) | | | | | 2.7 | | | | — | | | | — | | | | 2.8 | | | | — | | | | — | |
Members’ remuneration (Parliament) | | | | | 430.1 | | | | — | | | | — | | | | 453.8 | | | | — | | | | — | |
Debt-service costs (National Treasury) | | | | | 88 325.1 | | | | — | | | | — | | | | 99 741.4 | | | | — | | | | — | |
Provincial equitable share (National Treasury) | | 4) | | | 313 015.8 | | | | 313 015.8 | | | | — | | | | 337 572.4 | | | | 337 572.4 | | | | — | |
General fuel levy sharing with metropolitan municipalities (National Treasury) | | | | | 9 039.7 | | | | — | | | | 9 039.7 | | | | 9 613.4 | | | | — | | | | 9 613.4 | |
Skills levy and Setas (Higher Education and Training) | | | | | 11 400.0 | | | | — | | | | — | | | | 12 403.0 | | | | — | | | | — | |
Judges’ and magistrates’ salaries (Justice and Constitutional Development) | | | | | 2 401.9 | | | | — | | | | — | | | | 2 575.7 | | | | — | | | | — | |
| | | | | | | | | | | | | | | | | | | | | | | | | | |
Main budget expenditure | | | | | 966 967.0 | | | | 388 515.8 | | | | 77 027.9 | | | | 1 055 074.6 | | | | 414 152.0 | | | | 84 651.2 | |
| 1) | Includes provincial equitable share and conditional grants allocated to provinces. |
| 2) | Includes local government equitable share and conditional grants allocated to local government as well as general fuel levy sharing with metros. |
158
ANNEXURE B: STATISTICAL TABLES
| | | | | | | | | | | | | | | | | | | | | | | | | | |
| | | | | | | | | | | | | | | | | | | | | | | | | | Table 4 Main budget: expenditure defrayed from the National Revenue Fund by vote |
| 2014/15 | | | 2015/16 | | | | | |
| | | | of which | | | | | | of which | | | | | |
Budget
estimate | | | transfers to
provinces 1) | | | transfers
to local
government 2) | | | Budget
estimate | | | transfers
to
provinces 1) | | | transfers
to local
government 2) | | | | | R million |
| | | | | | | | | | | | | | | | | | | | | | | | | | Central government administration |
| | 1 152.1 | | | | — | | | | — | | | | 1 213.4 | | | | — | | | | — | | | | | The Presidency |
| | 1 508.2 | | | | — | | | | — | | | | 1 594.3 | | | | — | | | | — | | | | | Parliament |
| | 63 287.4 | | | | 197.4 | | | | 59 789.7 | | | | 69 948.9 | | | | 204.3 | | | | 66 293.3 | | | | | Cooperative Governance and Traditional Affairs |
| | — | | | | — | | | | 44 490.1 | | | | — | | | | — | | | | 50 207.7 | | | | | of which: local government equitable share |
| | 6 893.2 | | | | — | | | | — | | | | 6 763.4 | | | | — | | | | — | | | | | Home Affairs |
| | 5 864.8 | | | | — | | | | — | | | | 6 166.5 | | | | — | | | | — | | | | | International Relations and Cooperation |
| | 202.0 | | | | — | | | | — | | | | 210.7 | | | | — | | | | — | | | | | Performance Monitoring and Evaluation |
| | 6 579.7 | | | | 643.9 | | | | 632.3 | | | | 6 979.9 | | | | 667.1 | | | | 661.0 | | | | | Public Works |
| | 218.5 | | | | — | | | | — | | | | 230.2 | | | | — | | | | — | | | | | Women, Children and People with Disabilities |
| | | | | | | | | | | | | | | | | | | | | | | | | | Financial and administrative services |
| | 413.1 | | | | — | | | | — | | | | 430.8 | | | | — | | | | — | | | | | Government Communication and Information System |
| | 27 741.8 | | | | — | | | | 1 344.7 | | | | 27 869.9 | | | | — | | | | 1 399.0 | | | | | National Treasury |
| | 259.8 | | | | — | | | | — | | | | 279.3 | | | | — | | | | — | | | | | Public Enterprises |
| | 859.5 | | | | — | | | | — | | | | 879.7 | | | | — | | | | — | | | | | Public Service and Administration |
| | 1 964.1 | | | | — | | | | — | | | | 2 052.7 | | | | — | | | | — | | | | | Statistics South Africa |
| | | | | | | | | | | | | | | | | | | | | | | | | | Social services |
| | 3 528.1 | | | | 1 016.2 | | | | — | | | | 3 975.4 | | | | 1 340.6 | | | | — | | | | | Arts and Culture |
| | 19 941.3 | | | | 13 188.3 | | | | — | | | | 23 023.6 | | | | 16 349.9 | | | | — | | | | | Basic Education |
| | 33 924.3 | | | | 29 610.2 | | | | — | | | | 36 685.2 | | | | 32 083.5 | | | | — | | | | | Health |
| | 36 815.3 | | | | 2 600.3 | | | | — | | | | 39 541.8 | | | | 2 758.8 | | | | — | | | | | Higher Education and Training |
| | 2 633.5 | | | | — | | | | — | | | | 2 785.6 | | | | — | | | | — | | | | | Labour |
| | 129 279.4 | | | | — | | | | — | | | | 137 610.1 | | | | — | | | | — | | | | | Social Development |
| | 968.0 | | | | 525.6 | | | | — | | | | 1 012.7 | | | | 549.8 | | | | — | | | | | Sport and Recreation South Africa |
| | | | | | | | | | | | | | | | | | | | | | | | | | Justice, crime prevention and security |
| | 19 721.1 | | | | — | | | | — | | | | 20 795.3 | | | | — | | | | — | | | | | Correctional Services |
| | 42 695.5 | | | | — | | | | — | | | | 45 121.5 | | | | — | | | | — | | | | | Defence and Military Veterans |
| | 234.7 | | | | — | | | | — | | | | 247.2 | | | | — | | | | — | | | | | Independent Police Investigative Directorate |
| | 15 060.3 | | | | — | | | | — | | | | 15 812.1 | | | | — | | | | — | | | | | Justice and Constitutional Development |
| | 71 914.6 | | | | — | | | | — | | | | 75 853.8 | | | | — | | | | — | | | | | Police |
| | | | | | | | | | | | | | | | | | | | | | | | | | Economic services and infrastructure |
| | 6 558.9 | | | | 2 193.6 | | | | — | | | | 6 799.6 | | | | 2 294.5 | | | | — | | | | | Agriculture, Forestry and Fisheries |
| | 1 598.4 | | | | — | | | | — | | | | 1 592.5 | | | | — | | | | — | | | | | Communications |
| | 752.9 | | | | — | | | | — | | | | 987.4 | | | | — | | | | — | | | | | Economic Development |
| | 7 214.6 | | | | — | | | | 1 720.1 | | | | 7 970.6 | | | | — | | | | 2 258.1 | | | | | Energy |
| | 5 577.5 | | | | — | | | | — | | | | 6 128.5 | | | | — | | | | — | | | | | Environmental Affairs |
| | 30 206.2 | | | | 17 918.3 | | | | 10 447.8 | | | | 32 746.6 | | | | 19 667.2 | | | | 10 818.1 | | | | | Human Settlements |
| | 1 491.3 | | | | — | | | | — | | | | 1 619.2 | | | | — | | | | — | | | | | Mineral Resources |
| | 9 905.3 | | | | — | | | | — | | | | 10 274.5 | | | | — | | | | — | | | | | Rural Development and Land Reform |
| | 6 600.2 | | | | — | | | | — | | | | 7 644.3 | | | | — | | | | — | | | | | Science and Technology |
| | 1 694.1 | | | | — | | | | — | | | | 1 911.2 | | | | — | | | | — | | | | | Tourism |
| | 9 958.0 | | | | — | | | | — | | | | 11 404.7 | | | | — | | | | — | | | | | Trade and Industry |
| | 48 223.2 | | | | 13 908.9 | | | | 5 946.1 | | | | 53 377.7 | | | | 14 776.6 | | | | 6 238.7 | | | | | Transport |
| | 12 449.0 | | | | — | | | | 1 508.5 | | | | 15 488.4 | | | | — | | | | 3 142.2 | | | | | Water Affairs |
| | | | | | | | | | | | | | | | | | | | | | | | | | |
| | 635 889.8 | | | | 81 802.7 | | | | 81 389.3 | | | | 685 029.2 | | | | 90 692.3 | | | | 90 810.3 | | | | | |
| | | | | | | | | | | | | | | | | | | | | | | | | | Plus: |
| | — | | | | — | | | | — | | | | — | | | | — | | | | — | | | | | Unallocated/projected underspending |
| | 6 500.0 | | | | — | | | | — | | | | 10 000.0 | | | | — | | | | — | | | | | Contingency reserve |
| | | | | | | | | | | | | | | | | | | | | | | | | | |
| | 642 389.8 | | | | 81 802.7 | | | | 81 389.3 | | | | 695 029.2 | | | | 90 692.3 | | | | 90 810.3 | | | | | Subtotal: appropriation by vote |
| | | | | | | | | | | | | | | | | | | | | | | | | | Plus: |
| | | | | | | | | | | | | | | | | | | | | | | | | | Direct charges against the National Revenue Fund |
| | 3.0 | | | | — | | | | — | | | | 3.1 | | | | — | | | | — | | | | | President and Deputy President salary (The Presidency) |
| | 481.0 | | | | — | | | | — | | | | 503.1 | | | | — | | | | — | | | | | Members’ remuneration (Parliament) |
| | 108 718.4 | | | | — | | | | — | | | | 118 162.5 | | | | — | | | | — | | | | | Debt-service costs (National Treasury) |
| | 359 924.2 | | | | 359 924.2 | | | | — | | | | 383 697.2 | | | | 383 697.2 | | | | — | | | 4) | | Provincial equitable share (National Treasury) |
| | 10 190.2 | | | | — | | | | 10 190.2 | | | | 10 658.9 | | | | — | | | | 10 658.9 | | | | | General fuel levy sharing with metropolitan municipalities (National Treasury) |
| | 13 544.0 | | | | — | | | | — | | | | 14 817.0 | | | | — | | | | — | | | | | Skills levy and Setas (Higher Education and Training) |
| | 2 730.3 | | | | — | | | | — | | | | 2 855.9 | | | | — | | | | — | | | | | Judges’ and magistrates’ salaries (Justice and Constitutional Development) |
| | | | | | | | | | | | | | | | | | | | | | | | | | |
| | 1 137 980.7 | | | | 441 726.9 | | | | 91 579.4 | | | | 1 225 726.9 | | | | 474 389.5 | | | | 101 469.2 | | | | | Main budget expenditure |
| 3) | Budget estimate adjusted for function shifts. |
| 4) | Provincial equitable share excluding conditional grants to provinces. |
159
2013 BUDGET REVIEW
Table 5
Consolidated national, provincial and social security funds expenditure: economic classification 1)
| | | | | | | | | | | | | | | | | | | | | | | | | | | | | | |
| | | | | 2009/10 | | | 2010/11 | | | 2011/12 | | | 2012/13 | |
R million | | | | Outcome | | | %
of
total | | | Outcome | | | %
of
total | | | Outcome | | | %
of
total | | | Revised
estimate | |
Current payments | | | | | 412 285.7 | | | | 52.7 | % | | | 458 341.2 | | | | 54.7 | % | | | 514 289.6 | | | | 55.8 | % | | | 567 783.8 | |
Compensation of employees | | | | | 248 628.2 | | | | 31.8 | % | | | 281 786.9 | | | | 33.6 | % | | | 314 549.0 | | | | 34.1 | % | | | 344 557.1 | |
Goods and services | | | | | 106 174.4 | | | | 13.6 | % | | | 109 875.4 | | | | 13.1 | % | | | 123 091.0 | | | | 13.3 | % | | | 134 781.3 | |
Interest and rent on land | | | | | 57 483.2 | | | | 7.3 | % | | | 66 678.9 | | | | 8.0 | % | | | 76 649.6 | | | | 8.3 | % | | | 88 445.4 | |
| | | | | | | | |
Transfers and subsidies | | | | | 303 926.2 | | | | 38.8 | % | | | 324 075.6 | | | | 38.7 | % | | | 366 750.1 | | | | 39.8 | % | | | 398 619.1 | |
Provinces and municipalities | | | | | 55 878.7 | | | | 7.1 | % | | | 65 222.1 | | | | 7.8 | % | | | 72 248.8 | | | | 7.8 | % | | | 81 832.0 | |
of which: local government share | | 2) | | | 44 737.2 | | | | 5.7 | % | | | 53 361.3 | | | | 6.4 | % | | | 59 678.1 | | | | 6.5 | % | | | 67 988.2 | |
Departmental agencies and accounts | | | | | 67 997.7 | | | | 8.7 | % | | | 64 144.0 | | | | 7.7 | % | | | 80 132.8 | | | | 8.7 | % | | | 81 132.5 | |
Higher education institutions | | | | | 15 547.2 | | | | 2.0 | % | | | 17 865.3 | | | | 2.1 | % | | | 19 738.1 | | | | 2.1 | % | | | 21 154.0 | |
Foreign governments and international organisations | | | | | 1 366.7 | | | | 0.2 | % | | | 1 248.0 | | | | 0.1 | % | | | 1 547.4 | | | | 0.2 | % | | | 1 733.4 | |
Public corporations and private enterprises | | | | | 24 349.3 | | | | 3.1 | % | | | 25 682.2 | | | | 3.1 | % | | | 28 512.3 | | | | 3.1 | % | | | 30 776.6 | |
Public corporations | | | | | 20 045.4 | | | | 2.6 | % | | | 21 448.5 | | | | 2.6 | % | | | 22 725.8 | | | | 2.5 | % | | | 24 229.1 | |
Subsidies on products and production | | | | | 7 564.5 | | | | 1.0 | % | | | 9 423.4 | | | | 1.1 | % | | | 9 624.6 | | | | 1.0 | % | | | 10 803.3 | |
Other transfers | | | | | 12 480.9 | | | | 1.6 | % | | | 12 025.1 | | | | 1.4 | % | | | 13 101.2 | | | | 1.4 | % | | | 13 425.7 | |
Private enterprises | | | | | 4 304.0 | | | | 0.5 | % | | | 4 233.7 | | | | 0.5 | % | | | 5 786.6 | | | | 0.6 | % | | | 6 547.5 | |
Subsidies on products and production | | | | | 2 061.3 | | | | 0.3 | % | | | 1 412.8 | | | | 0.2 | % | | | 2 332.1 | | | | 0.3 | % | | | 3 187.9 | |
Other transfers | | | | | 2 242.7 | | | | 0.3 | % | | | 2 820.9 | | | | 0.3 | % | | | 3 454.4 | | | | 0.4 | % | | | 3 359.6 | |
Non-profit institutions | | | | | 16 453.0 | | | | 2.1 | % | | | 17 616.3 | | | | 2.1 | % | | | 20 953.0 | | | | 2.3 | % | | | 24 331.6 | |
Households | | | | | 122 333.6 | | | | 15.6 | % | | | 132 297.5 | | | | 15.8 | % | | | 143 617.6 | | | | 15.6 | % | | | 157 658.9 | |
Social benefits | | | | | 105 802.4 | | | | 13.5 | % | | | 113 192.2 | | | | 13.5 | % | | | 121 931.0 | | | | 13.2 | % | | | 133 658.3 | |
Other transfers to households | | | | | 16 531.2 | | | | 2.1 | % | | | 19 105.3 | | | | 2.3 | % | | | 21 686.7 | | | | 2.4 | % | | | 24 000.6 | |
| | | | | | | | |
Payments for capital assets | | | | | 33 031.8 | | | | 4.2 | % | | | 34 390.9 | | | | 4.1 | % | | | 39 930.9 | | | | 4.3 | % | | | 42 285.8 | |
Buildings and other fixed structures | | | | | 25 941.0 | | | | 3.3 | % | | | 25 707.0 | | | | 3.1 | % | | | 30 304.9 | | | | 3.3 | % | | | 34 375.7 | |
Buildings | | | | | 16 299.1 | | | | 2.1 | % | | | 16 091.6 | | | | 1.9 | % | | | 18 370.8 | | | | 2.0 | % | | | 19 934.3 | |
Other fixed structures | | | | | 9 641.9 | | | | 1.2 | % | | | 9 615.4 | | | | 1.1 | % | | | 11 934.1 | | | | 1.3 | % | | | 14 441.4 | |
Machinery and equipment | | | | | 6 350.6 | | | | 0.8 | % | | | 7 288.8 | | | | 0.9 | % | | | 8 772.8 | | | | 1.0 | % | | | 7 321.2 | |
Transport equipment | | | | | 1 919.1 | | | | 0.2 | % | | | 2 588.8 | | | | 0.3 | % | | | 3 155.0 | | | | 0.3 | % | | | 2 679.9 | |
Other machinery and equipment | | | | | 4 431.6 | | | | 0.6 | % | | | 4 700.0 | | | | 0.6 | % | | | 5 617.8 | | | | 0.6 | % | | | 4 641.3 | |
Land and sub-soil assets | | | | | 246.5 | | | | 0.0 | % | | | 854.4 | | | | 0.1 | % | | | 195.6 | | | | 0.0 | % | | | 97.7 | |
Software and other intangible assets | | | | | 481.9 | | | | 0.1 | % | | | 520.2 | | | | 0.1 | % | | | 626.5 | | | | 0.1 | % | | | 408.3 | |
Other assets | | 3) | | | 11.7 | | | | 0.0 | % | | | 20.4 | | | | 0.0 | % | | | 31.1 | | | | 0.0 | % | | | 82.8 | |
| | | | | | | | |
Payments for financial assets | | | | | 33 312.9 | | | | 4.3 | % | | | 21 492.1 | | | | 2.6 | % | | | 1 408.2 | | | | 0.2 | % | | | 1 472.3 | |
| | | | | | | | | | | | | | | | | | | | | | | | | | | | | | |
Subtotal: votes and direct charges | | | | | 782 556.6 | | | | 100 | % | | | 838 299.7 | | | | 100 | % | | | 922 378.8 | | | | 100 | % | | | 1 010 161.0 | |
Plus: | | | | | | | | | | | | | | | | | | | | | | | | | | | | | | |
Contingency reserve | | | | | — | | | | — | | | | — | | | | — | | | | — | | | | — | | | | — | |
Unallocated | | | | | — | | | | — | | | | — | | | | — | | | | — | | | | — | | | | — | |
| | | | | | | | | | | | | | | | | | | | | | | | | | | | | | |
Total consolidated expenditure | | | | | 782 556.6 | | | | 100 | % | | | 838 299.7 | | | | 100 | % | | | 922 378.8 | | | | 100 | % | | | 1 010 161.0 | |
| 1) | These figures were estimated by the National Treasury and may differ from data published by Statistics South Africa and the South African Reserve Bank. The numbers in this table are not strictly comparable to those published in previous years due to the reclassification of expenditure items for previous years. Data for the history years has been adjusted accordingly. |
160
ANNEXURE B: STATISTICAL TABLES
| | | | | | | | | | | | | | | | | | | | | | | | | | | | | | | | |
| | | | | | | | | | | | | | | | | | | | | | | | | | | | | | | | Table 5 Consolidated national, provincial and social security funds expenditure: economic classification 1) |
| | | | | |
| | | | 2013/14 | | | 2014/15 | | | 2015/16 | | | | | | |
% of
total | | | Budget
estimate | | | %
of
total | | | Budget
estimate | | | %
of
total | | | Budget
estimate | | | %
of
total | | | | | | R million |
| | 56.2% | | | | 608 453.4 | | | | 55.5 | % | | | 649 444.6 | | | | 54.9 | % | | | 694 756.1 | | | | 54.6 | % | | | | | | Current payments |
| | 34.1% | | | | 368 886.9 | | | | 33.6 | % | | | 390 531.4 | | | | 33.0 | % | | | 415 758.2 | | | | 32.7 | % | | | | | | Compensation of employees |
| | 13.3% | | | | 139 706.7 | | | | 12.7 | % | | | 150 070.8 | | | | 12.7 | % | | | 160 698.2 | | | | 12.6 | % | | | | | | Goods and services |
| | 8.8% | | | | 99 859.9 | | | | 9.1 | % | | | 108 842.4 | | | | 9.2 | % | | | 118 299.6 | | | | 9.3 | % | | | | | | Interest and rent on land |
| | 39.5% | | | | 436 189.7 | | | | 39.8 | % | | | 473 705.3 | | | | 40.0 | % | | | 512 420.4 | | | | 40.3 | % | | | | | | Transfers and subsidies |
| | 8.1% | | | | 87 915.4 | | | | 8.0 | % | | | 94 101.1 | | | | 8.0 | % | | | 104 094.6 | | | | 8.2 | % | | | | | | Provinces and municipalities |
| | 6.7% | | | | 75 037.9 | | | | 6.8 | % | | | 81 389.3 | | | | 6.9 | % | | | 90 810.3 | | | | 7.1 | % | | | 2 | ) | | of which: local government share |
| | 8.0% | | | | 88 400.3 | | | | 8.1 | % | | | 95 340.3 | | | | 8.1 | % | | | 102 504.6 | | | | 8.1 | % | | | | | | Departmental agencies and accounts |
| | 2.1% | | | | 22 582.5 | | | | 2.1 | % | | | 24 347.6 | | | | 2.1 | % | | | 26 429.2 | | | | 2.1 | % | | | | | | Higher education institutions |
| | 0.2% | | | | 1 854.4 | | | | 0.2 | % | | | 1 976.1 | | | | 0.2 | % | | | 2 050.7 | | | | 0.2 | % | | | | | | Foreign governments and international organisations |
| | 3.0% | | | | 33 989.4 | | | | 3.1 | % | | | 38 526.7 | | | | 3.3 | % | | | 44 033.6 | | | | 3.5 | % | | | | | | Public corporations and private enterprises |
| | 2.4% | | | | 26 020.0 | | | | 2.4 | % | | | 29 896.1 | | | | 2.5 | % | | | 34 245.1 | | | | 2.7 | % | | | | | | Public corporations |
| | 1.1% | | | | 10 331.7 | | | | 0.9 | % | | | 11 414.4 | | | | 1.0 | % | | | 12 287.3 | | | | 1.0 | % | | | | | | Subsidies on products and production |
| | 1.3% | | | | 15 688.3 | | | | 1.4 | % | | | 18 481.7 | | | | 1.6 | % | | | 21 957.8 | | | | 1.7 | % | | | | | | Other transfers |
| | 0.6% | | | | 7 969.5 | | | | 0.7 | % | | | 8 630.6 | | | | 0.7 | % | | | 9 788.6 | | | | 0.8 | % | | | | | | Private enterprises |
| | 0.3% | | | | 4 524.6 | | | | 0.4 | % | | | 5 039.4 | | | | 0.4 | % | | | 6 058.0 | | | | 0.5 | % | | | | | | Subsidies on products and production |
| | 0.3% | | | | 3 444.9 | | | | 0.3 | % | | | 3 591.2 | | | | 0.3 | % | | | 3 730.6 | | | | 0.3 | % | | | | | | Other transfers |
| | 2.4% | | | | 28 473.9 | | | | 2.6 | % | | | 30 335.8 | | | | 2.6 | % | | | 31 389.0 | | | | 2.5 | % | | | | | | Non-profit institutions |
| | 15.6% | | | | 172 973.8 | | | | 15.8 | % | | | 189 077.7 | | | | 16.0 | % | | | 201 918.7 | | | | 15.9 | % | | | | | | Households |
| | 13.2% | | | | 147 097.1 | | | | 13.4 | % | | | 161 453.3 | | | | 13.6 | % | | | 172 751.1 | | | | 13.6 | % | | | | | | Social benefits |
| | 2.4% | | | | 25 876.7 | | | | 2.4 | % | | | 27 624.4 | | | | 2.3 | % | | | 29 167.6 | | | | 2.3 | % | | | | | | Other transfers to households |
| | 4.2% | | | | 45 346.3 | | | | 4.1 | % | | | 50 328.4 | | | | 4.3 | % | | | 51 812.1 | | | | 4.1 | % | | | | | | Payments for capital assets |
| | 3.4% | | | | 36 826.5 | | | | 3.4 | % | | | 42 005.7 | | | | 3.6 | % | | | 43 166.6 | | | | 3.4 | % | | | | | | Buildings and other fixed structures |
| | 2.0% | | | | 21 979.7 | | | | 2.0 | % | | | 25 092.3 | | | | 2.1 | % | | | 25 068.1 | | | | 2.0 | % | | | | | | Buildings |
| | 1.4% | | | | 14 846.8 | | | | 1.4 | % | | | 16 913.4 | | | | 1.4 | % | | | 18 098.5 | | | | 1.4 | % | | | | | | Other fixed structures |
| | 0.7% | | | | 8 065.4 | | | | 0.7 | % | | | 7 915.0 | | | | 0.7 | % | | | 8 174.5 | | | | 0.6 | % | | | | | | Machinery and equipment |
| | 0.3% | | | | 2 355.4 | | | | 0.2 | % | | | 2 442.9 | | | | 0.2 | % | | | 2 268.0 | | | | 0.2 | % | | | | | | Transport equipment |
| | 0.5% | | | | 5 709.9 | | | | 0.5 | % | | | 5 472.0 | | | | 0.5 | % | | | 5 906.5 | | | | 0.5 | % | | | | | | Other machinery and equipment |
| | 0.0% | | | | 62.3 | | | | 0.0 | % | | | 60.7 | | | | 0.0 | % | | | 100.9 | | | | 0.0 | % | | | | | | Land and sub-soil assets |
| | 0.0% | | | | 335.3 | | | | 0.0 | % | | | 290.9 | | | | 0.0 | % | | | 297.5 | | | | 0.0 | % | | | | | | Software and other intangible assets |
| | 0.0% | | | | 56.7 | | | | 0.0 | % | | | 56.2 | | | | 0.0 | % | | | 72.6 | | | | 0.0 | % | | | 3 | ) | | Other assets |
| | 0.1% | | | | 2 915.7 | | | | 0.3 | % | | | 3 279.3 | | | | 0.3 | % | | | 3 033.9 | | | | 0.2 | % | | | | | | Payments for financial assets |
| | | | | | | | | | | | | | | | | | | | | | | | | | | | | | | | |
| | 100% | | | | 1 092 905.1 | | | | 99.6 | % | | | 1 176 757.7 | | | | 99.5 | % | | | 1 262 022.5 | | | | 99.2 | % | | | | | | Subtotal: votes and direct charges |
| | | | | | | | | | | | | | | | | | | | | | | | | | | | | | | | Plus: |
| | — | | | | 4 000.0 | | | | 0.4 | % | | | 6 500.0 | | | | 0.5 | % | | | 10 000.0 | | | | 0.8 | % | | | | | | Contingency reserve |
| | — | | | | 30.0 | | | | 0.0 | % | | | — | | | | — | | | | — | | | | — | | | | | | | Unallocated |
| | | | | | | | | | | | | | | | | | | | | | | | | | | | | | | | |
| | 100% | | | | 1 096 935.1 | | | | 100 | % | | | 1 183 257.7 | | | | 100 | % | | | 1 272 022.5 | | | | 100 | % | | | | | | Total consolidated expenditure |
| 2) | Includes equitable share and conditional grants to local government. |
| 3) | Includes biological, heritage and specialised military assets. |
161
2013 BUDGET REVIEW
Table 6
Consolidated national, provincial and social security funds expenditure: functional classification 1)
| | | | | | | | | | | | | | | | | | | | | | | | | | | | | | | | |
| | | | | | 2009/10 | | | 2010/11 | | | 2011/12 | | | 2012/13 | |
R million | | | | | Estimated
outcome | | | %
of
total | | | Estimated
outcome | | | %
of
total | | | Estimated
outcome | | | %
of
total | | | Revised
estimate | |
General public services | | | 2 | ) | | | 110 842.10 | | | | 14.2 | % | | | 123 601.58 | | | | 14.7 | % | | | 138 723.19 | | | | 15.0 | % | | | 153 666.74 | |
of which: debt-service costs | | | | | | | 57 129.2 | | | | 7.3 | % | | | 66 226.8 | | | | 7.9 | % | | | 76 460.0 | | | | 8.3 | % | | | 88 325.1 | |
Defence | | | | | | | 31 768.3 | | | | 4.1 | % | | | 30 599.0 | | | | 3.7 | % | | | 34 549.9 | | | | 3.7 | % | | | 38 176.9 | |
Public order and safety | | | | | | | 74 846.8 | | | | 9.6 | % | | | 82 640.3 | | | | 9.9 | % | | | 89 778.2 | | | | 9.7 | % | | | 98 832.1 | |
Police services | | | | | | | 50 104.1 | | | | 6.4 | % | | | 55 690.3 | | | | 6.6 | % | | | 60 196.2 | | | | 6.5 | % | | | 66 240.4 | |
Law courts | | | | | | | 11 480.5 | | | | 1.5 | % | | | 12 684.7 | | | | 1.5 | % | | | 13 744.9 | | | | 1.5 | % | | | 15 565.7 | |
Prisons | | | | | | | 13 202.7 | | | | 1.7 | % | | | 14 191.9 | | | | 1.7 | % | | | 15 758.8 | | | | 1.7 | % | | | 16 872.8 | |
Public order and safety not elsewhere classified | | | | | | | 59.5 | | | | 0.0 | % | | | 73.4 | | | | 0.0 | % | | | 78.3 | | | | 0.0 | % | | | 153.2 | |
Economic affairs | | | | | | | 119 848.1 | | | | 15.3 | % | | | 111 661.3 | | | | 13.3 | % | | | 107 033.2 | | | | 11.6 | % | | | 112 195.4 | |
General economic, commercial, and labour affairs | | | | | | | 14 962.4 | | | | 1.9 | % | | | 16 943.1 | | | | 2.0 | % | | | 18 127.2 | | | | 2.0 | % | | | 20 274.0 | |
Agriculture, forestry, fishing and hunting | | | | | | | 13 717.0 | | | | 1.8 | % | | | 14 454.5 | | | | 1.7 | % | | | 15 732.1 | | | | 1.7 | % | | | 17 339.9 | |
Fuel and energy | | | | | | | 36 523.6 | | | | 4.7 | % | | | 24 800.4 | | | | 3.0 | % | | | 5 288.3 | | | | 0.6 | % | | | 5 191.5 | |
Mining, manufacturing, and construction | | | | | | | 3 102.0 | | | | 0.4 | % | | | 2 696.4 | | | | 0.3 | % | | | 3 417.6 | | | | 0.4 | % | | | 5 292.5 | |
Transport | | | | | | | 47 013.9 | | | | 6.0 | % | | | 48 448.1 | | | | 5.8 | % | | | 59 274.4 | | | | 6.4 | % | | | 58 016.9 | |
Communication | | | | | | | 1 786.9 | | | | 0.2 | % | | | 1 130.3 | | | | 0.1 | % | | | 1 629.6 | | | | 0.2 | % | | | 1 417.3 | |
Other industries | | | | | | | 1 597.9 | | | | 0.2 | % | | | 1 647.4 | | | | 0.2 | % | | | 1 729.9 | | | | 0.2 | % | | | 2 190.5 | |
Research and development economic affairs | | | | | | | 1 119.2 | | | | 0.1 | % | | | 1 472.4 | | | | 0.2 | % | | | 1 547.5 | | | | 0.2 | % | | | 1 781.7 | |
Economic affairs not elsewhere classified | | | | | | | 25.4 | | | | 0.0 | % | | | 68.8 | | | | 0.0 | % | | | 286.6 | | | | 0.0 | % | | | 690.9 | |
Environmental protection | | | | | | | 2 899.1 | | | | 0.4 | % | | | 3 349.6 | | | | 0.4 | % | | | 4 053.7 | | | | 0.4 | % | | | 4 469.1 | |
Housing and community amenities | | | | | | | 62 783.1 | | | | 8.0 | % | | | 74 726.7 | | | | 8.9 | % | | | 85 250.7 | | | | 9.2 | % | | | 95 555.6 | |
Housing development | | | | | | | 16 243.9 | | | | 2.1 | % | | | 20 507.8 | | | | 2.4 | % | | | 23 864.3 | | | | 2.6 | % | | | 26 282.6 | |
Community development | | | | | | | 37 495.3 | | | | 4.8 | % | | | 46 260.6 | | | | 5.5 | % | | | 52 184.7 | | | | 5.7 | % | | | 59 533.2 | |
Water supply | | | | | | | 7 361.8 | | | | 0.9 | % | | | 7 556.9 | | | | 0.9 | % | | | 8 852.7 | | | | 1.0 | % | | | 9 328.4 | |
Research and development housing and community amenities | | | | | | | 3.0 | | | | 0.0 | % | | | 2.5 | | | | 0.0 | % | | | 2.8 | | | | 0.0 | % | | | 2.5 | |
Housing and community amenities not elsewhere classified | | | | | | | 1 679.1 | | | | 0.2 | % | | | 399.1 | | | | 0.0 | % | | | 346.3 | | | | 0.0 | % | | | 409.0 | |
Health | | | | | | | 93 346.0 | | | | 11.9 | % | | | 103 326.6 | | | | 12.3 | % | | | 117 440.8 | | | | 12.7 | % | | | 132 228.4 | |
Recreation and culture | | | | | | | 9 094.3 | | | | 1.2 | % | | | 7 288.3 | | | | 0.9 | % | | | 7 476.3 | | | | 0.8 | % | | | 7 895.8 | |
Education | | | | | | | 155 241.3 | | | | 19.8 | % | | | 170 383.9 | | | | 20.3 | % | | | 196 353.2 | | | | 21.3 | % | | | 211 743.2 | |
Social protection | | | | | | | 121 887.6 | | | | 15.6 | % | | | 130 722.3 | | | | 15.6 | % | | | 141 719.6 | | | | 15.4 | % | | | 155 397.7 | |
| | | | | | | | | | | | | | | | | | | | | | | | | | | | | | | | |
Subtotal: votes and direct charges | | | | | | | 782 556.6 | | | | 100 | % | | | 838 299.7 | | | | 100 | % | | | 922 378.8 | | | | 100 | % | | | 1 010 161.0 | |
Plus: | | | | | | | | | | | | | | | | | | | | | | | | | | | | | | | | |
Contingency reserve | | | | | | | — | | | | | | | | — | | | | | | | | — | | | | | | | | — | |
Unallocated | | | | | | | — | | | | | | | | — | | | | | | | | — | | | | | | | | — | |
| | | | | | | | | | | | | | | | | | | | | | | | | | | | | | | | |
Total consolidated expenditure | | | | | | | 782 556.6 | | | | | | | | 838 299.7 | | | | | | | | 922 378.8 | | | | | | | | 1 010 161.0 | |
| 1) | These figures were estimated by the National Treasury and may differ from data published by Statistics South Africa. The numbers in this table are not strictly comparable to those published in previous years due to the allocation of some of the unallocable expenditure for previous years. Data for the history years has been adjusted accordingly. |
162
ANNEXURE B: STATISTICAL TABLES
| | | | | | | | | | | | | | | | | | | | | | | | | | | | | | |
| | | | | | | | | | | | | | | | | | | | | | | | | | | | | | Table 6 Consolidated national, provincial and social security funds expenditure: functional classification 1) |
| | | | | |
| | | | 2013/14 | | | 2014/15 | | | 2015/16 | | | | | |
%
of
total | | | Budget
estimate | | | %
of
total | | | Budget
estimate | | | %
of
total | | | Budget
estimate | | | %
of
total | | | | | R million |
| | 15.2 | % | | | 170 585.72 | | | | 15.6 | % | | | 183 526.29 | | | | 15.6 | % | | | 197 015.63 | | | | 15.6 | % | | 2) | | General public services |
| | 8.7 | % | | | 99 741.4 | | | | 9.1 | % | | | 108 718.4 | | | | 9.2 | % | | | 118 162.5 | | | | 9.4 | % | | | | of which: debt-service costs |
| | 3.8 | % | | | 40 574.4 | | | | 3.7 | % | | | 43 072.3 | | | | 3.7 | % | | | 45 525.3 | | | | 3.6 | % | | | | Defence |
| | 9.8 | % | | | 106 190.6 | | | | 9.7 | % | | | 112 371.6 | | | | 9.5 | % | | | 118 394.7 | | | | 9.4 | % | | | | Public order and safety |
| | 6.6 | % | | | 70 966.5 | | | | 6.5 | % | | | 75 097.7 | | | | 6.4 | % | | | 79 189.4 | | | | 6.3 | % | | | | Police services |
| | 1.5 | % | | | 16 973.0 | | | | 1.6 | % | | | 18 070.9 | | | | 1.5 | % | | | 18 960.4 | | | | 1.5 | % | | | | Law courts |
| | 1.7 | % | | | 18 076.5 | | | | 1.7 | % | | | 19 009.6 | | | | 1.6 | % | | | 20 042.4 | | | | 1.6 | % | | | | Prisons |
| | 0.0 | % | | | 174.6 | | | | 0.0 | % | | | 193.5 | | | | 0.0 | % | | | 202.4 | | | | 0.0 | % | | | | Public order and safety not elsewhere classified |
| | 11.1 | % | | | 121 402.4 | | | | 11.1 | % | | | 133 268.9 | | | | 11.3 | % | | | 144 154.0 | | | | 11.4 | % | | | | Economic affairs |
| | 2.0 | % | | | 20 222.8 | | | | 1.9 | % | | | 21 294.6 | | | | 1.8 | % | | | 22 351.8 | | | | 1.8 | % | | | | General economic, commercial, and labour affairs |
| | 1.7 | % | | | 18 452.1 | | | | 1.7 | % | | | 19 398.4 | | | | 1.6 | % | | | 20 237.9 | | | | 1.6 | % | | | | Agriculture, forestry, fishing and hunting |
| | 0.5 | % | | | 9 298.5 | | | | 0.9 | % | | | 10 248.6 | | | | 0.9 | % | | | 10 769.7 | | | | 0.9 | % | | | | Fuel and energy |
| | 0.5 | % | | | 5 497.6 | | | | 0.5 | % | | | 5 965.2 | | | | 0.5 | % | | | 7 074.3 | | | | 0.6 | % | | | | Mining, manufacturing, and construction |
| | 5.7 | % | | | 60 751.4 | | | | 5.6 | % | | | 68 616.9 | | | | 5.8 | % | | | 76 369.8 | | | | 6.1 | % | | | | Transport |
| | 0.1 | % | | | 1 687.4 | | | | 0.2 | % | | | 1 240.5 | | | | 0.1 | % | | | 1 224.4 | | | | 0.1 | % | | | | Communication |
| | 0.2 | % | | | 2 348.2 | | | | 0.2 | % | | | 2 565.8 | | | | 0.2 | % | | | 2 806.2 | | | | 0.2 | % | | | | Other industries |
| | 0.2 | % | | | 1 844.9 | | | | 0.2 | % | | | 1 996.0 | | | | 0.2 | % | | | 1 957.3 | | | | 0.2 | % | | | | Research and development economic affairs |
| | 0.1 | % | | | 1 299.3 | | | | 0.1 | % | | | 1 942.8 | | | | 0.2 | % | | | 1 362.8 | | | | 0.1 | % | | | | Economic affairs not elsewhere classified |
| | 0.4 | % | | | 5 021.6 | | | | 0.5 | % | | | 4 709.5 | | | | 0.4 | % | | | 5 323.1 | | | | 0.4 | % | | | | Environmental protection |
| | 9.5 | % | | | 105 362.9 | | | | 9.6 | % | | | 114 991.8 | | | | 9.8 | % | | | 126 723.0 | | | | 10.0 | % | | | | Housing and community amenities |
| | 2.6 | % | | | 30 048.4 | | | | 2.7 | % | | | 32 176.5 | | | | 2.7 | % | | | 33 949.9 | | | | 2.7 | % | | | | Housing development |
| | 5.9 | % | | | 64 185.3 | | | | 5.9 | % | | | 69 501.2 | | | | 5.9 | % | | | 76 437.3 | | | | 6.1 | % | | | | Community development |
| | 0.9 | % | | | 10 653.3 | | | | 1.0 | % | | | 12 802.0 | | | | 1.1 | % | | | 15 798.9 | | | | 1.3 | % | | | | Water supply |
| | 0.0 | % | | | 3.1 | | | | 0.0 | % | | | 3.3 | | | | 0.0 | % | | | 3.5 | | | | 0.0 | % | | | | Research and development housing |
| | | | | | | | | | | | | | | | | | | | | | | | | | | | | | and community amenities |
| | 0.0 | % | | | 472.7 | | | | 0.0 | % | | | 508.9 | | | | 0.0 | % | | | 533.5 | | | | 0.0 | % | | | | Housing and community amenities |
| | | | | | | | | | | | | | | | | | | | | | | | | | | | | | not elsewhere classified |
| | 13.1 | % | | | 137 674.0 | | | | 12.6 | % | | | 147 631.4 | | | | 12.5 | % | | | 156 599.7 | | | | 12.4 | % | | | | Health |
| | 0.8 | % | | | 8 723.3 | | | | 0.8 | % | | | 9 075.3 | | | | 0.8 | % | | | 9 462.5 | | | | 0.7 | % | | | | Recreation and culture |
| | 21.0 | % | | | 225 873.5 | | | | 20.7 | % | | | 240 748.7 | | | | 20.5 | % | | | 258 738.2 | | | | 20.5 | % | | | | Education |
| | 15.4 | % | | | 171 496.8 | | | | 15.7 | % | | | 187 362.0 | | | | 15.9 | % | | | 200 086.4 | | | | 15.9 | % | | | | Social protection |
| | | | | | | | | | | | | | | | | | | | | | | | | | | | | | |
| | 100 | % | | | 1 092 905.1 | | | | 100 | % | | | 1 176 757.7 | | | | 100 | % | | | 1 262 022.5 | | | | 100 | % | | | | Subtotal: votes and direct charges |
| | | | | | | | | | | | | | | | | | | | | | | | | | | | | | Plus: |
| | | | | 4 000.0 | | | | | | | | 6 500.0 | | | | | | | | 10 000.0 | | | | | | | | | Contingency reserve |
| | | | | 30.0 | | | | | | | | — | | | | | | | | — | | | | | | | | | Unallocated |
| | | | | | | | | | | | | | | | | | | | | | | | | | | | | | |
| | | | | 1 096 935.1 | | | | | | | | 1 183 257.7 | | | | | | | | 1 272 022.5 | | | | | | | | | Total consolidated expenditure |
| 2) | Mainly general administration, cost of raising loans and unallocatable capital expenditure. |
163
2013 BUDGET REVIEW
| | | | | | | | | | | | | | | | | | | | | | | | | | | | | | |
Table 7 Consolidated government revenue and expenditure by economic classification 1) | | | | | | | | | | | | | | | | | | | | | | | | | | | | | | |
| | | | | 2009/10 | | | 2010/11 | | | 2011/12 | | | 2012/13 | |
R million | | | | Outcome | | | % of
total | | | Outcome | | | % of
total | | | Outcome | | | % of
total | | | Revised
estimate | |
Revenue | | | | | | | | | | | | | | | | | | | | | | | | | | | | | | |
Current revenue | | | | | 664 256.1 | | | | 100.0 | % | | | 756 773.6 | | | | 99.9 | % | | | 836 615.2 | | | | 100.0 | % | | | 887 662.5 | |
Tax revenue (net of SACU) | | | | | 604 013.2 | | | | 90.9 | % | | | 692 624.3 | | | | 91.5 | % | | | 761 132.6 | | | | 91.0 | % | | | 812 458.5 | |
Non-tax revenue | | | | | 60 242.9 | | | | 9.1 | % | | | 64 149.3 | | | | 8.5 | % | | | 75 482.6 | | | | 9.0 | % | | | 75 204.0 | |
Sales of capital assets | | | | | 218.5 | | | | 0.0 | % | | | 382.0 | | | | 0.1 | % | | | 235.0 | | | | 0.0 | % | | | 186.1 | |
| | | | | | | | | | | | | | | | | | | | | | | | | | | | | | |
Total revenue | | | | | 664 474.6 | | | | 100.0 | % | | | 757 155.6 | | | | 100.0 | % | | | 836 850.2 | | | | 100.0 | % | | | 887 848.6 | |
Expenditure | | | | | | | | | | | | | | | | | | | | | | | | | | | | | | |
Economic classification | | | | | | | | | | | | | | | | | | | | | | | | | | | | | | |
| | | | | | | | |
Current payments | | | | | 469 899.2 | | | | 57.0 | % | | | 520 425.8 | | | | 59.3 | % | | | 583 290.3 | | | | 61.1 | % | | | 637 055.3 | |
Compensation of employees | | | | | 274 120.8 | | | | 33.3 | % | | | 309 765.1 | | | | 35.3 | % | | | 345 547.2 | | | | 36.2 | % | | | 376 561.5 | |
Goods and services | | | | | 133 226.5 | | | | 16.2 | % | | | 135 791.2 | | | | 15.5 | % | | | 153 948.4 | | | | 16.1 | % | | | 165 457.5 | |
Interest and rent on land | | | | | 62 551.9 | | | | 7.6 | % | | | 74 869.5 | | | | 8.5 | % | | | 83 794.7 | | | | 8.8 | % | | | 95 036.4 | |
| | | | | | | | |
Transfers and subsidies | | | | | 263 320.5 | | | | 32.0 | % | | | 279 860.2 | | | | 31.9 | % | | | 307 079.8 | | | | 32.2 | % | | | 346 167.1 | |
Provinces and municipalities | | | | | 56 956.4 | | | | 6.9 | % | | | 66 374.3 | | | | 7.6 | % | | | 73 452.3 | | | | 7.7 | % | | | 82 810.5 | |
Departmental agencies and accounts | | | | | 25 819.1 | | | | 3.1 | % | | | 17 217.0 | | | | 2.0 | % | | | 19 463.0 | | | | 2.0 | % | | | 20 188.0 | |
Higher education institutions | | | | | 15 547.2 | | | | 1.9 | % | | | 17 940.4 | | | | 2.0 | % | | | 19 801.5 | | | | 2.1 | % | | | 21 154.0 | |
Foreign governments and international organisations | | | 1 697.7 | | | | 0.2 | % | | | 1 649.1 | | | | 0.2 | % | | | 1 916.9 | | | | 0.2 | % | | | 2 251.4 | |
Public corporations and private enterprises | | | | | 20 078.8 | | | | 2.4 | % | | | 19 971.7 | | | | 2.3 | % | | | 21 108.6 | | | | 2.2 | % | | | 28 563.0 | |
Non-profit institutions | | | | | 18 286.0 | | | | 2.2 | % | | | 21 102.4 | | | | 2.4 | % | | | 23 423.0 | | | | 2.5 | % | | | 26 352.3 | |
Households | | | | | 124 935.4 | | | | 15.2 | % | | | 135 605.3 | | | | 15.5 | % | | | 147 914.6 | | | | 15.5 | % | | | 164 847.9 | |
| | | | | | | | |
Payments for capital assets | | | | | 57 525.4 | | | | 7.0 | % | | | 55 744.8 | | | | 6.4 | % | | | 62 412.2 | | | | 6.5 | % | | | 71 196.4 | |
Buildings and other fixed structures | | | | | 44 069.0 | | | | 5.3 | % | | | 41 430.0 | | | | 4.7 | % | | | 47 186.3 | | | | 4.9 | % | | | 54 738.8 | |
Machinery and equipment | | | | | 11 520.9 | | | | 1.4 | % | | | 10 838.5 | | | | 1.2 | % | | | 11 461.3 | | | | 1.2 | % | | | 13 301.3 | |
Land and sub-soil assets | | | | | 768.1 | | | | 0.1 | % | | | 2 073.1 | | | | 0.2 | % | | | 2 501.7 | | | | 0.3 | % | | | 1 574.6 | |
Software and other intangible assets | | | | | 1 012.8 | | | | 0.1 | % | | | 1 252.1 | | | | 0.1 | % | | | 1 191.7 | | | | 0.1 | % | | | 1 464.2 | |
Other assets | | 2) | | | 154.6 | | | | 0.0 | % | | | 151.1 | | | | 0.0 | % | | | 71.3 | | | | 0.0 | % | | | 117.5 | |
| | | | | | | | |
Payments for financial assets | | | | | 33 312.9 | | | | 4.0 | % | | | 21 492.1 | | | | 2.4 | % | | | 1 408.2 | | | | 0.1 | % | | | 1 472.3 | |
| | | | | | | | | | | | | | | | | | | | | | | | | | | | | | |
| | | | | | | | |
Subtotal: economic classification | | | | | 824 058.0 | | | | 100 | % | | | 877 522.9 | | | | 100.0 | % | | | 954 190.5 | | | | 100.0 | % | | | 1 055 891.2 | |
| | | | | | | | | | | | | | | | | | | | | | | | | | | | | | |
Contingency reserve | | | | | — | | | | | | | | — | | | | | | | | — | | | | | | | | — | |
Unallocated | | | | | — | | | | | | | | — | | | | | | | | — | | | | | | | | — | |
| | | | | | | | | | | | | | | | | | | | | | | | | | | | | | |
Total consolidated expenditure | | | | | 824 058.0 | | | | | | | | 877 522.9 | | | | | | | | 954 190.5 | | | | | | | | 1 055 891.2 | |
| | | | | | | | |
Consolidated budget balance | | | | | -159 583.5 | | | | | | | | -120 367.3 | | | | | | | | -117 340.3 | | | | | | | | -168 042.6 | |
Budget balance as percentage of GDP | | | | | -6.5 | % | | | | | | | -4.4 | % | | | | | | | -3.9 | % | | | | | | | -5.2 | % |
Extraordinary payments | | | | | -671.2 | | | | | | | | -838.6 | | | | | | | | -1 388.3 | | | | | | | | -2 584.0 | |
Extraordinary receipts | | | | | 6 434.5 | | | | | | | | 3 009.7 | | | | | | | | 5 209.2 | | | | | | | | 10 780.0 | |
| | | | | | | | | | | | | | | | | | | | | | | | | | | | | | |
Net borrowing requirement (-) | | | | | -153 820.2 | | | | | | | | -118 196.2 | | | | | | | | -113 519.4 | | | | | | | | -159 846.6 | |
| | | | | | | | | | | | | | | | | | | | | | | | | | | | | | |
Financing | | | | | | | | | | | | | | | | | | | | | | | | | | | | | | |
Change in loan liabilities | | | | | | | | | | | | | | | | | | | | | | | | | | | | | | |
Domestic short and long-term loans (net) | | | | | 177 642.2 | | | | | | | | 176 491.0 | | | | | | | | 160 112.1 | | | | | | | | 148 060.4 | |
Foreign loans (net) | | | | | 24 189.3 | | | | | | | | 4 718.7 | | | | | | | | 11 560.5 | | | | | | | | -8 079.4 | |
| | | | | | | | |
Change in cash and other balances (- increase) | | | | | -48 011.4 | | | | | | | | -63 013.5 | | | | | | | | -58 153.2 | | | | | | | | 19 865.5 | |
| | | | | | | | |
Borrowing requirement (net) | | | | | 153 820.2 | | | | | | | | 118 196.2 | | | | | | | | 113 519.4 | | | | | | | | 159 846.6 | |
GDP | | | | | 2 452 538.0 | | | | | | | | 2 735 274.0 | | | | | | | | 2 973 286.0 | | | | | | | | 3 209 141.9 | |
| 1) | Consisting of national and provincial government, social security funds and public entities. Refer to Annexure W2 for a detailed list of entities included. In some cases figures were estimated by the National Treasury and may differ from data published by Statistics South Africa and the Reserve Bank. |
164
ANNEXURE B: STATISTICAL TABLES
| | | | | | | | | | | | | | | | | | | | | | | | | | | | | | |
| | | | | | | | | | | | | | | | | | | | | | | | | | | | | | Table 7 Consolidated government revenue and expenditure by economic classification 1) |
2012/13 | | 2013/14 | | | 2014/15 | | | 2015/16 | | | | | | |
% of
total | | Budget
estimate | | | % of
total | | | Budget
estimate | | | % of
total | | | Budget
estimate | | | % of
total | | | | | | R million |
| | | | | | | | | | | | | | | | | | | | | | | | | | | | | | Revenue |
| 100.0% | | | 985 592.7 | | | | 100.0 | % | | | 1 090 960.2 | | | | 100.0 | % | | | 1 199 632.2 | | | | 100.0 | % | | | | | | Current revenue |
| 91.5% | | | 902 826.8 | | | | 91.6 | % | | | 1 001 019.0 | | | | 91.7 | % | | | 1 106 646.9 | | | | 92.2 | % | | | | | | Tax revenue (net of SACU) |
| 8.5% | | | 82 765.9 | | | | 8.4 | % | | | 89 941.2 | | | | 8.2 | % | | | 92 985.2 | | | | 7.8 | % | | | | | | Non-tax revenue |
| 0.0% | | | 126.1 | | | | 0.0 | % | | | 145.2 | | | | 0.0 | % | | | 122.2 | | | | 0.0 | % | | | | | | Sales of capital assets |
| | | | | | | | | | | | | | | | | | | | | | | | | | | | | | |
| 100.0% | | | 985 718.7 | | | | 100.0 | % | | | 1 091 105.4 | | | | 100.0 | % | | | 1 199 754.4 | | | | 100.0 | % | | | | | | Total revenue |
| | | | | | | | | | | | | | | | | | | | | | | | | | | | | | Expenditure |
| | | | | | | | | | | | | | | | | | | | | | | | | | | | | | Economic classification |
| | | | | | | | |
| 60.3% | | | 688 841.2 | | | | 60.1 | % | | | 740 538.2 | | | | 59.8 | % | | | 791 075.2 | | | | 59.7 | % | | | | | | Current payments |
| 35.7% | | | 406 181.8 | | | | 35.5 | % | | | 431 742.2 | | | | 34.9 | % | | | 459 696.1 | | | | 34.7 | % | | | | | | Compensation of employees |
| 15.7% | | | 176 136.7 | | | | 15.4 | % | | | 191 944.5 | | | | 15.5 | % | | | 204 003.6 | | | | 15.4 | % | | | | | | Goods and services |
| 9.0% | | | 106 522.7 | | | | 9.3 | % | | | 116 851.5 | | | | 9.4 | % | | | 127 375.6 | | | | 9.6 | % | | | | | | Interest and rent on land |
| | | | | | | | |
| 32.8% | | | 375 591.8 | | | | 32.8 | % | | | 406 019.9 | | | | 32.8 | % | | | 437 579.5 | | | | 33.0 | % | | | | | | Transfers and subsidies |
| 7.8% | | | 88 983.8 | | | | 7.8 | % | | | 95 268.0 | | | | 7.7 | % | | | 105 364.9 | | | | 8.0 | % | | | | | | Provinces and municipalities |
| 1.9% | | | 21 565.2 | | | | 1.9 | % | | | 23 597.0 | | | | 1.9 | % | | | 25 930.8 | | | | 2.0 | % | | | | | | Departmental agencies and accounts |
| 2.0% | | | 22 582.5 | | | | 2.0 | % | | | 24 347.6 | | | | 2.0 | % | | | 26 429.2 | | | | 2.0 | % | | | | | | Higher education institutions |
| 0.2% | | | 2 331.3 | | | | 0.2 | % | | | 2 478.1 | | | | 0.2 | % | | | 2 575.7 | | | | 0.2 | % | | | | | | Foreign governments and international organisations |
| 2.7% | | | 28 050.3 | | | | 2.4 | % | | | 29 922.3 | | | | 2.4 | % | | | 32 187.2 | | | | 2.4 | % | | | | | | Public corporations and private enterprises |
| 2.5% | | | 30 990.5 | | | | 2.7 | % | | | 32 769.3 | | | | 2.6 | % | | | 34 201.4 | | | | 2.6 | % | | | | | | Non-profit institutions |
| 15.6% | | | 181 088.1 | | | | 15.8 | % | | | 197 637.7 | | | | 16.0 | % | | | 210 890.2 | | | | 15.9 | % | | | | | | Households |
| | | | | | | | |
| 6.7% | | | 78 011.0 | | | | 6.8 | % | | | 88 002.2 | | | | 7.1 | % | | | 92 422.6 | | | | 7.0 | % | | | | | | Payments for capital assets |
| 5.2% | | | 61 173.4 | | | | 5.3 | % | | | 71 060.7 | | | | 5.7 | % | | | 70 507.2 | | | | 5.3 | % | | | | | | Buildings and other fixed structures |
| 1.3% | | | 14 244.0 | | | | 1.2 | % | | | 14 273.9 | | | | 1.2 | % | | | 19 152.3 | | | | 1.4 | % | | | | | | Machinery and equipment |
| 0.1% | | | 1 416.8 | | | | 0.1 | % | | | 1 505.6 | | | | 0.1 | % | | | 1 642.8 | | | | 0.1 | % | | | | | | Land and sub-soil assets |
| 0.1% | | | 1 109.6 | | | | 0.1 | % | | | 1 062.6 | | | | 0.1 | % | | | 995.7 | | | | 0.1 | % | | | | | | Software and other intangible assets |
| 0.0% | | | 67.2 | | | | 0.0 | % | | | 99.5 | | | | 0.0 | % | | | 124.6 | | | | 0.0 | % | | | 2 | ) | | Other assets |
| | | | | | | | |
| 0.1% | | | 2 915.7 | | | | 0.3 | % | | | 3 279.3 | | | | 0.3 | % | | | 3 033.9 | | | | 0.2 | % | | | | | | Payments for financial assets |
| | | | | | | | | | | | | | | | | | | | | | | | | | | | | | |
| 100.0% | | | 1 145 359.7 | | | | 100.0 | % | | | 1 237 839.7 | | | | 100.0 | % | | | 1 324 111.2 | | | | 100.0 | % | | | | | | Subtotal: economic classification |
| | | | | | | | | | | | | | | | | | | | | | | | | | | | | | |
| | | 4 000.0 | | | | | | | | 6 500.0 | | | | | | | | 10 000.0 | | | | | | | | | | | Contingency reserve |
| | | 30.0 | | | | | | | | — | | | | | | | | — | | | | | | | | | | | Unallocated |
| | | | | | | | | | | | | | | | | | | | | | | | | | | | | | |
| | | 1 149 389.7 | | | | | | | | 1 244 339.7 | | | | | | | | 1 334 111.2 | | | | | | | | | | | Total consolidated expenditure |
| | | | | | | | |
| | | -163 670.9 | | | | | | | | -153 234.2 | | | | | | | | -134 356.8 | | | | | | | | | | | Consolidated budget balance |
| | | -4.6 | % | | | | | | | -3.9 | % | | | | | | | -3.1 | % | | | | | | | | | | Budget balance as percentage of GDP |
| | | -930.0 | | | | | | | | — | | | | | | | | — | | | | | | | | | | | Extraordinary payments |
| | | 4 992.0 | | | | | | | | 2 900.0 | | | | | | | | 3 100.0 | | | | | | | | | | | Extraordinary receipts |
| | | | | | | | | | | | | | | | | | | | | | | | | | | | | | |
| | | -159 608.9 | | | | | | | | -150 334.2 | | | | | | | | -131 256.8 | | | | | | | | | | | Net borrowing requirement (-) |
| | | | | | | | | | | | | | | | | | | | | | | | | | | | | | |
| | | | | | | | | | | | | | | | | | | | | | | | | | | | | | Financing |
| | | | | | | | | | | | | | | | | | | | | | | | | | | | | | Change in loan liabilities |
| | | 169 836.8 | | | | | | | | 164 523.5 | | | | | | | | 167 385.7 | | | | | | | | | | | Domestic short and long-term loans (net) |
| | | -3 318.3 | | | | | | | | 3 062.1 | | | | | | | | 8 853.9 | | | | | | | | | | | Foreign loans (net) |
| | | -6 909.6 | | | | | | | | -17 251.3 | | | | | | | | -44 982.8 | | | | | | | | | | | Change in cash and other balances (- increase) |
| | | | | | | | |
| | | 159 608.9 | | | | | | | | 150 334.2 | | | | | | | | 131 256.8 | | | | | | | | | | | Borrowing requirement (net) |
| | | 3 520 268.2 | | | | | | | | 3 880 405.7 | | | | | | | | 4 270 848.3 | | | | | | | | | | | GDP |
| 2) | Includes biological, heritage and specialised military assets. |
165
2013 BUDGET REVIEW
| | | | | | | | | | | | | | | | | | | | | | | | | | | | | | | | |
Table 8 Consolidated government expenditure by functional classification 1) | | | | | | | | | | | | | | | | | | | | | | | | | | | | | | | | |
| | | | | | 2009/10 | | | 2010/11 | | | 2011/12 | | | 2012/13 | |
R million | | | | | Outcome | | | % of
total | | | Outcome | | | % of
total | | | Outcome | | | % of
total | | | Revised
estimate | |
General public services | | | 2 | ) | | | 115 233.4 | | | | 14.0 | % | | | 127 111.7 | | | | 14.5 | % | | | 144 929.2 | | | | 15.2 | % | | | 159 712.2 | |
of which: debt-service costs | | | | | | | 57 129.2 | | | | 6.9 | % | | | 66 226.8 | | | | 7.5 | % | | | 76 460.0 | | | | 8.0 | % | | | 88 325.1 | |
Defence | | | | | | | 32 004.7 | | | | 3.9 | % | | | 30 840.7 | | | | 3.5 | % | | | 34 440.1 | | | | 3.6 | % | | | 37 919.8 | |
| | | | | | | | |
Public order and safety | | | | | | | 74 989.6 | | | | 9.1 | % | | | 82 707.4 | | | | 9.4 | % | | | 89 900.1 | | | | 9.4 | % | | | 98 930.1 | |
Police services | | | | | | | 50 083.2 | | | | 6.1 | % | | | 55 648.9 | | | | 6.3 | % | | | 60 214.9 | | | | 6.3 | % | | | 66 187.4 | |
Law courts | | | | | | | 11 544.4 | | | | 1.4 | % | | | 12 678.7 | | | | 1.4 | % | | | 13 722.4 | | | | 1.4 | % | | | 15 544.0 | |
Prisons | | | | | | | 13 202.7 | | | | 1.6 | % | | | 14 191.9 | | | | 1.6 | % | | | 15 758.8 | | | | 1.7 | % | | | 16 872.8 | |
Public order and safety not elsewhere classified | | | | | | | 159.3 | | | | 0.0 | % | | | 187.8 | | | | 0.0 | % | | | 204.1 | | | | 0.0 | % | | | 325.9 | |
| | | | | | | | |
Economic affairs | | | | | | | 142 731.7 | | | | 17.3 | % | | | 131 662.8 | | | | 15.0 | % | | | 117 369.2 | | | | 12.3 | % | | | 131 720.7 | |
General economic, commercial, and labour affairs | | | | | | | 18 442.2 | | | | 2.2 | % | | | 22 248.4 | | | | 2.5 | % | | | 21 967.9 | | | | 2.3 | % | | | 24 378.2 | |
Agriculture, forestry, fishing and hunting | | | | | | | 13 685.8 | | | | 1.7 | % | | | 15 169.2 | | | | 1.7 | % | | | 16 492.2 | | | | 1.7 | % | | | 18 008.9 | |
Fuel and energy | | | | | | | 37 229.4 | | | | 4.5 | % | | | 25 558.1 | | | | 2.9 | % | | | 6 366.7 | | | | 0.7 | % | | | 6 458.1 | |
Mining, manufacturing, and construction | | | | | | | 3 621.1 | | | | 0.4 | % | | | 3 626.0 | | | | 0.4 | % | | | 4 023.6 | | | | 0.4 | % | | | 6 018.1 | |
Transport | | | | | | | 64 051.7 | | | | 7.8 | % | | | 59 712.3 | | | | 6.8 | % | | | 63 043.0 | | | | 6.6 | % | | | 69 088.6 | |
Communication | | | | | | | 2 629.3 | | | | 0.3 | % | | | 1 931.1 | | | | 0.2 | % | | | 1 766.7 | | | | 0.2 | % | | | 2 616.9 | |
Other industries | | | | | | | 1 663.2 | | | | 0.2 | % | | | 1 850.9 | | | | 0.2 | % | | | 2 010.7 | | | | 0.2 | % | | | 2 313.2 | |
Research and development economic affairs | | | | | | | 1 383.5 | | | | 0.2 | % | | | 1 498.1 | | | | 0.2 | % | | | 1 411.8 | | | | 0.1 | % | | | 2 147.8 | |
Economic affairs not elsewhere classified | | | | | | | 25.4 | | | | 0.0 | % | | | 68.8 | | | | 0.0 | % | | | 286.6 | | | | 0.0 | % | | | 690.9 | |
| | | | | | | | |
Environmental protection | | | | | | | 4 198.7 | | | | 0.5 | % | | | 5 189.0 | | | | 0.6 | % | | | 5 996.0 | | | | 0.6 | % | | | 5 777.1 | |
| | | | | | | | |
Housing and community amenities | | | | | | | 75 077.4 | | | | 9.1 | % | | | 88 800.6 | | | | 10.1 | % | | | 102 279.5 | | | | 10.7 | % | | | 112 934.7 | |
Housing development | | | | | | | 17 080.2 | | | | 2.1 | % | | | 20 914.7 | | | | 2.4 | % | | | 24 698.5 | | | | 2.6 | % | | | 27 461.4 | |
Community development | | | | | | | 38 353.4 | | | | 4.7 | % | | | 47 149.7 | | | | 5.4 | % | | | 52 868.2 | | | | 5.5 | % | | | 60 792.3 | |
Water supply | | | | | | | 17 961.7 | | | | 2.2 | % | | | 20 334.7 | | | | 2.3 | % | | | 24 363.7 | | | | 2.6 | % | | | 24 269.5 | |
Research and development housing | | | | | | | 3.0 | | | | 0.0 | % | | | 2.5 | | | | 0.0 | % | | | 2.8 | | | | 0.0 | % | | | 2.5 | |
and community amenities | | | | | | | | | | | | | | | | | | | | | | | | | | | | | | | | |
Housing and community amenities | | | | | | | 1 679.1 | | | | 0.2 | % | | | 399.1 | | | | 0.0 | % | | | 346.3 | | | | 0.0 | % | | | 409.0 | |
not elsewhere classified | | | | | | | | | | | | | | | | | | | | | | | | | | | | | | | | |
| | | | | | | | |
Health | | | | | | | 93 614.2 | | | | 11.4 | % | | | 104 069.0 | | | | 11.9 | % | | | 117 529.3 | | | | 12.3 | % | | | 132 223.6 | |
Recreation and culture | | | | | | | 9 358.7 | | | | 1.1 | % | | | 7 502.2 | | | | 0.9 | % | | | 7 720.9 | | | | 0.8 | % | | | 7 976.0 | |
Education | | | | | | | 154 629.1 | | | | 18.8 | % | | | 169 141.1 | | | | 19.3 | % | | | 192 909.4 | | | | 20.2 | % | | | 213 796.0 | |
Social protection | | | | | | | 122 220.6 | | | | 14.8 | % | | | 130 498.4 | | | | 14.9 | % | | | 141 116.8 | | | | 14.8 | % | | | 154 901.3 | |
| | | | | | | | | | | | | | | | | | | | | | | | | | | | | | | | |
Subtotal: functional classification | | | | | | | 824 058.0 | | | | 100 | % | | | 877 522.9 | | | | 100 | % | | | 954 190.5 | | | | 100 | % | | | 1 055 891.2 | |
Plus: | | | | | | | | | | | | | | | | | | | | | | | | | | | | | | | | |
Contingency reserve | | | | | | | — | | | | | | | | — | | | | | | | | — | | | | | | | | — | |
Unallocated | | | | | | | — | | | | | | | | — | | | | | | | | — | | | | | | | | — | |
| | | | | | | | | | | | | | | | | | | | | | | | | | | | | | | | |
Total consolidated expenditure | | | | | | | 824 058.0 | | | | | | | | 877 522.9 | | | | | | | | 954 190.5 | | | | | | | | 1 055 891.2 | |
| 1) | Consisting of national and provincial government, social security funds and public entities. Refer to Annexure W2 for a detailed list of entities included. In some cases figures were estimated by the National Treasury and may differ from data published by Statistics South Africa and the Reserve Bank. |
166
ANNEXURE B: STATISTICAL TABLES
| | | | | | | | | | | | | | | | | | | | | | | | | | | | | | | | |
| | | | | | | | | | | | | | | | Table 8 Consolidated government expenditure by functional classification 1) |
2012/13 | | | 2013/14 | | | 2014/15 | | | 2015/16 | | | | | | |
% of
total | | | Budget
estimate | | | %
of
total | | | Budget
estimate | | | %
of
total | | | Budget
estimate | | | %
of
total | | | | | | R million |
| | | | | | | | | | | | | | | | | | | | | | | | | | | | | | | | |
| | 15.1% | | | | 176 890.1 | | | | 15.4 | % | | | 192 066.7 | | | | 15.5 | % | | | 206 471.7 | | | | 15.6 | % | | | 2 | ) | | General public services |
| | 8.4% | | | | 99 741.4 | | | | 8.7 | % | | | 108 718.4 | | | | 8.8 | % | | | 118 162.5 | | | | 8.9 | % | | | | | | of which: debt-service costs |
| | | | | | | | |
| | 3.6% | | | | 41 129.9 | | | | 3.6 | % | | | 43 759.5 | | | | 3.5 | % | | | 46 292.4 | | | | 3.5 | % | | | | | | Defence |
| | | | | | | | |
| | 9.4% | | | | 106 452.4 | | | | 9.3 | % | | | 112 804.6 | | | | 9.1 | % | | | 118 936.9 | | | | 9.0 | % | | | | | | Public order and safety |
| | 6.3% | | | | 71 020.4 | | | | 6.2 | % | | | 75 155.2 | | | | 6.1 | % | | | 79 250.9 | | | | 6.0 | % | | | | | | Police services |
| | 1.5% | | | | 17 015.0 | | | | 1.5 | % | | | 18 264.5 | | | | 1.5 | % | | | 19 251.2 | | | | 1.5 | % | | | | | | Law courts |
| | 1.6% | | | | 18 076.5 | | | | 1.6 | % | | | 19 009.6 | | | | 1.5 | % | | | 20 042.4 | | | | 1.5 | % | | | | | | Prisons |
| | 0.0% | | | | 340.5 | | | | 0.0 | % | | | 375.3 | | | | 0.0 | % | | | 392.3 | | | | 0.0 | % | | | | | | Public order and safety not elsewhere classified |
| | | | | | | | |
| | 12.5% | | | | 145 452.5 | | | | 12.7 | % | | | 157 640.3 | | | | 12.7 | % | | | 169 360.3 | | | | 12.8 | % | | | | | | Economic affairs |
| | 2.3% | | | | 24 575.0 | | | | 2.1 | % | | | 25 881.5 | | | | 2.1 | % | | | 27 056.6 | | | | 2.0 | % | | | | | | General economic, commercial, and labour affairs |
| | 1.7% | | | | 19 140.3 | | | | 1.7 | % | | | 20 094.7 | | | | 1.6 | % | | | 20 889.9 | | | | 1.6 | % | | | | | | Agriculture, forestry, fishing and hunting |
| | 0.6% | | | | 10 666.1 | | | | 0.9 | % | | | 11 738.2 | | | | 0.9 | % | | | 12 481.6 | | | | 0.9 | % | | | | | | Fuel and energy |
| | 0.6% | | | | 6 232.4 | | | | 0.5 | % | | | 6 748.6 | | | | 0.5 | % | | | 7 862.7 | | | | 0.6 | % | | | | | | Mining, manufacturing, and construction |
| | 6.5% | | | | 76 126.2 | | | | 6.6 | % | | | 83 511.9 | | | �� | 6.7 | % | | | 91 817.0 | | | | 6.9 | % | | | | | | Transport |
| | 0.2% | | | | 2 617.3 | | | | 0.2 | % | | | 2 536.2 | | | | 0.2 | % | | | 2 514.4 | | | | 0.2 | % | | | | | | Communication |
| | 0.2% | | | | 2 473.9 | | | | 0.2 | % | | | 2 692.5 | | | | 0.2 | % | | | 2 969.3 | | | | 0.2 | % | | | | | | Other industries |
| | 0.2% | | | | 2 322.1 | | | | 0.2 | % | | | 2 493.8 | | | | 0.2 | % | | | 2 405.8 | | | | 0.2 | % | | | | | | Research and development economic affairs |
| | 0.1% | | | | 1 299.3 | | | | 0.1 | % | | | 1 942.8 | | | | 0.2 | % | | | 1 362.8 | | | | 0.1 | % | | | | | | Economic affairs not elsewhere classified |
| | | | | | | | |
| | 0.5% | | | | 6 511.4 | | | | 0.6 | % | | | 6 278.9 | | | | 0.5 | % | | | 6 981.9 | | | | 0.5 | % | | | | | | Environmental protection |
| | | | | | | | |
| | 10.7% | | | | 125 817.0 | | | | 11.0 | % | | | 140 823.0 | | | | 11.4 | % | | | 152 313.8 | | | | 11.5 | % | | | | | | Housing and community amenities |
| | 2.6% | | | | 31 545.9 | | | | 2.8 | % | | | 33 637.6 | | | | 2.7 | % | | | 35 484.0 | | | | 2.7 | % | | | | | | Housing development |
| | 5.8% | | | | 65 289.7 | | | | 5.7 | % | | | 70 667.4 | | | | 5.7 | % | | | 77 671.7 | | | | 5.9 | % | | | | | | Community development |
| | 2.3% | | | | 28 505.5 | | | | 2.5 | % | | | 36 005.9 | | | | 2.9 | % | | | 38 621.1 | | | | 2.9 | % | | | | | | Water supply |
| | 0.0% | | | | 3.1 | | | | 0.0 | % | | | 3.3 | | | | 0.0 | % | | | 3.5 | | | | 0.0 | % | | | | | | Research and development housing and community amenities |
| | 0.0% | | | | 472.7 | | | | 0.0 | % | | | 508.9 | | | | 0.0 | % | | | 533.5 | | | | 0.0 | % | | | | | | Housing and community amenities not elsewhere classified |
| | | | | | | | |
| | 12.5% | | | | 138 199.5 | | | | 12.1 | % | | | 148 389.1 | | | | 12.0 | % | | | 157 290.9 | | | | 11.9 | % | | | | | | Health |
| | | | | | | | |
| | 0.8% | | | | 8 671.1 | | | | 0.8 | % | | | 8 994.6 | | | | 0.7 | % | | | 9 395.0 | | | | 0.7 | % | | | | | | Recreation and culture |
| | | | | | | | |
| | 20.2% | | | | 224 593.3 | | | | 19.6 | % | | | 239 133.3 | | | | 19.3 | % | | | 256 460.0 | | | | 19.4 | % | | | | | | Education |
| | | | | | | | |
| | 14.7% | | | | 171 642.4 | | | | 15.0 | % | | | 187 949.6 | | | | 15.2 | % | | | 200 608.3 | | | | 15.2 | % | | | | | | Social protection |
| | | | | | | | | | | | | | | | | | | | | | | | | | | | | | | | |
| | | | | | | | |
| | 100% | | | | 1 145 359.7 | | | | 100 | % | | | 1 237 839.7 | | | | 100 | % | | | 1 324 111.2 | | | | 100 | % | | | | | | Subtotal: functional classification |
| | | | | | | | | | | | | | | | | | | | | | | | | | | | | | | | Plus: |
| | | | | 4 000.0 | | | | | | | | 6 500.0 | | | | | | | | 10 000.0 | | | | | | | | | | | Contingency reserve |
| | | | | 30.0 | | | | | | | | — | | | | | | | | — | | | | | | | | | | | Unallocated |
| | | | | | | | | | | | | | | | | | | | | | | | | | | | | | | | |
| | | | | 1 149 389.7 | | | | | | | | 1 244 339.7 | | | | | | | | 1 334 111.2 | | | | | | | | | | | Total consolidated expenditure |
| | | | | | | | | | | | | | | | | | | | | | | | | | | | | | | | |
| 2) | Mainly general administration, cost of raising loans and unallocatable capital expenditure. |
167
2013 BUDGET REVIEW
Table 9
Consolidated government revenue, expenditure and financing
| | | | | | | | | | | | | | | | |
| | | 2009/10 | | | 2010/11 | | | 2011/12 | | | 2012/13 | |
| R million | | Outcome | | | Outcome | | | Outcome | | | Revised
estimate | |
Operating account | | | | | | | | | | | | | | | | |
Current receipts | | | 664 669.3 | | | | 756 804.2 | | | | 836 058.0 | | | | 897 193.8 | |
Tax receipts (net of SACU transfers) | | | 604 013.2 | | | | 692 624.3 | | | | 761 132.6 | | | | 812 458.5 | |
Non-tax receipts (including departmental receipts) | | | 54 347.6 | | | | 57 509.0 | | | | 63 712.8 | | | | 68 119.3 | |
Transfers received | | | 6 308.5 | | | | 6 670.9 | | | | 11 212.5 | | | | 16 616.0 | |
| | | | |
Current payments | | | 733 830.5 | | | | 801 124.6 | | | | 891 758.4 | | | | 985 806.5 | |
Compensation of employees | | | 274 120.8 | | | | 309 765.1 | | | | 345 547.2 | | | | 376 561.5 | |
Goods and services | | | 133 221.1 | | | | 135 791.2 | | | | 153 948.4 | | | | 165 457.5 | |
Interest and rent on land | | | 62 551.9 | | | | 74 869.5 | | | | 83 794.7 | | | | 95 036.4 | |
Transfers and subsidies | | | 263 936.7 | | | | 280 698.8 | | | | 308 468.1 | | | | 348 751.1 | |
Current balance | | | -69 161.2 | | | | -44 320.4 | | | | -55 700.4 | | | | -88 612.7 | |
% of GDP | | | -2.8 | % | | | -1.6 | % | | | -1.9 | % | | | -2.8 | % |
Capital account | | | | | | | | | | | | | | | | |
Capital receipts | | | 218.5 | | | | 382.0 | | | | 235.0 | | | | 186.1 | |
Transfers and subsidies | | | 18 699.2 | | | | 20 870.0 | | | | 24 642.6 | | | | 28 028.8 | |
Payments for capital assets | | | 38 826.2 | | | | 34 874.8 | | | | 37 769.7 | | | | 43 167.6 | |
Capital financing requirement | | | -57 306.9 | | | | -55 362.9 | | | | -62 177.2 | | | | -71 010.3 | |
% of GDP | | | -2.3 | % | | | -2.0 | % | | | -2.1 | % | | | -2.2 | % |
| | | | |
Transactions in financial assets and liabilities | | | 27 352.2 | | | | 18 513.0 | | | | -4 358.2 | | | | 223.6 | |
| | | | |
Contingency reserve | | | — | | | | — | | | | — | | | | — | |
Unallocated | | | — | | | | — | | | | — | | | | — | |
Budget balance | | | -153 820.2 | | | | -118 196.2 | | | | -113 519.4 | | | | -159 846.6 | |
% of GDP | | | -6.3 | % | | | -4.3 | % | | | -3.8 | % | | | -5.0 | % |
| | | | |
Primary balance | | | -96 691.0 | | | | -51 969.4 | | | | -37 059.4 | | | | -71 521.4 | |
% of GDP | | | -3.9 | % | | | -1.9 | % | | | -1.2 | % | | | -2.2 | % |
| | | | |
Financing | | | | | | | | | | | | | | | | |
Change in loan liabilities | | | | | | | | | | | | | | | | |
Domestic short-and long-term loans (net) | | | 177 642.2 | | | | 176 491.0 | | | | 160 112.1 | | | | 148 060.4 | |
Foreign loans (net) | | | 24 189.3 | | | | 4 718.7 | | | | 11 560.5 | | | | -8 079.4 | |
Change in cash and other balances (-increase) | | | -48 011.4 | | | | -63 013.5 | | | | -58 153.2 | | | | 19 865.5 | |
Borrowing requirement (net) | | | 153 820.2 | | | | 118 196.2 | | | | 113 519.4 | | | | 159 846.6 | |
GDP | | | 2 452 538.0 | | | | 2 735 274.0 | | | | 2 973 286.0 | | | | 3 209 141.9 | |
168
ANNEXURE B: STATISTICAL TABLES
| | | | | | | | | | | | |
| | | | | | | | | | Table 9 Consolidated government revenue, expenditure and financing |
| 2013/14 | | | 2014/15 | | | 2015/16 | | | |
Budget
estimate | | | Budget
estimate | | | Budget
estimate | | | R million |
| | | | | | | | | | | | Operating account |
| | 989 512.7 | | | | 1 092 769.5 | | | | 1 201 579.6 | | | Current receipts |
| | 902 826.8 | | | | 1 001 019.0 | | | | 1 106 646.9 | | | Tax receipts (net of SACU transfers) |
| | 76 335.8 | | | | 84 192.9 | | | | 87 596.2 | | | Non-tax receipts (including departmental receipts) |
| | 10 350.1 | | | | 7 557.5 | | | | 7 336.5 | | | Transfers received |
| | | |
| | 1 065 363.0 | | | | 1 146 558.1 | | | | 1 228 654.7 | | | Current payments |
| | 406 181.8 | | | | 431 742.2 | | | | 459 696.1 | | | Compensation of employees |
| | 176 136.7 | | | | 191 944.5 | | | | 204 003.6 | | | Goods and services |
| | 106 522.7 | | | | 116 851.5 | | | | 127 375.6 | | | Interest and rent on land |
| | 376 521.8 | | | | 406 019.9 | | | | 437 579.5 | | | Transfers and subsidies |
| | | |
| | -75 850.3 | | | | -53 788.6 | | | | -27 075.1 | | | Current balance |
| | -2.2 | % | | | -1.4 | % | | | -0.6 | % | | % of GDP |
| | | | | | | | | | | | Capital account |
| | 126.1 | | | | 145.2 | | | | 122.2 | | | Capital receipts |
| | 31 132.3 | | | | 33 697.7 | | | | 37 120.8 | | | Transfers and subsidies |
| | 46 878.6 | | | | 54 304.5 | | | | 55 301.8 | | | Payments for capital assets |
| | -77 884.9 | | | | -87 857.0 | | | | -92 300.4 | | | Capital financing requirement |
| | -2.2 | % | | | -2.3 | % | | | -2.2 | % | | % of GDP |
| | | |
| | 1 843.7 | | | | 2 188.6 | | | | 1 881.4 | | | Transactions in financial assets and liabilities |
| | | |
| | 4 000.0 | | | | 6 500.0 | | | | 10 000.0 | | | Contingency reserve |
| | 30.0 | | | | — | | | | — | | | Unallocated |
| | -159 608.9 | | | | -150 334.2 | | | | -131 256.8 | | | Budget balance |
| | -4.5 | % | | | -3.9 | % | | | -3.1 | % | | % of GDP |
| | | |
| | -59 867.5 | | | | -41 615.9 | | | | -13 094.3 | | | Primary balance |
| | -1.7 | % | | | -1.1 | % | | | -0.3 | % | | % of GDP |
| | | | | | | | | | | | Financing |
| | | | | | | | | | | | Change in loan liabilities |
| | 169 836.8 | | | | 164 523.5 | | | | 167 385.7 | | | Domestic short-and long-term loans (net) |
| | -3 318.3 | | | | 3 062.1 | | | | 8 853.9 | | | Foreign loans (net) |
| | | |
| | -6 909.6 | | | | -17 251.3 | | | | -44 982.8 | | | Change in cash and other balances (-increase) |
| | | |
| | 159 608.9 | | | | 150 334.2 | | | | 131 256.8 | | | Borrowing requirement (net) |
| | 3 520 268.2 | | | | 3 880 405.7 | | | | 4 270 848.3 | | | GDP |
169
2013 BUDGET REVIEW
Table 10
Total debt of government 1)
| | | | | | | | | | | | | | | | | | | | | | | | | | | | | | |
| | | | | 1988/89 | | | 1989/90 | | | 1990/91 | | | 1991/92 | | | 1992/93 | | | 1993/94 | | | 1994/95 | |
R million | | | | | | | | | | | | | | | | | | | | | | | |
| | | | | | | | |
Domestic debt | | | | | | | | | | | | | | | | | | | | | | | | | | | | | | |
Marketable | | | | | 61 124 | | | | 72 923 | | | | 85 546 | | | | 104 646 | | | | 138 681 | | | | 181 460 | | | | 225 662 | |
Government bonds | | | | | 60 860 | | | | 71 026 | | | | 82 824 | | | | 100 662 | | | | 132 853 | | | | 174 892 | | | | 210 191 | |
Treasury bills | | | | | 264 | | | | 1 897 | | | | 2 722 | | | | 3 984 | | | | 5 828 | | | | 6 568 | | | | 7 018 | |
Bridging bonds | | | | | — | | | | — | | | | — | | | | — | | | | — | | | | — | | | | 8 453 | |
Non-marketable | | 3) | | | 5 386 | | | | 6 883 | | | | 7 989 | | | | 6 520 | | | | 4 703 | | | | 3 310 | | | | 5 705 | |
| | | | | | | | |
Gross loan debt | | | | | 66 510 | | | | 79 806 | | | | 93 535 | | | | 111 166 | | | | 143 384 | | | | 184 770 | | | | 231 367 | |
Cash balances | | 4) | | | -3 785 | | | | -11 181 | | | | -8 524 | | | | -9 762 | | | | -4 750 | | | | -4 591 | | | | -6 665 | |
Net loan debt | | | | | 62 725 | | | | 68 625 | | | | 85 011 | | | | 101 404 | | | | 138 634 | | | | 180 179 | | | | 224 702 | |
| | | | | | | | | | | | | | | | | | | | | | | | | | | | | | |
| | | | | | | | |
Foreign debt | | | | | | | | | | | | | | | | | | | | | | | | | | | | | | |
Gross loan debt | | 5) | | | 2 227 | | | | 2 090 | | | | 1 770 | | | | 2 940 | | | | 2 348 | | | | 5 201 | | | | 8 784 | |
Cash balances | | 4) | | | — | | | | — | | | | — | | | | — | | | | — | | | | — | | | | — | |
Net loan debt | | | | | 2 227 | | | | 2 090 | | | | 1 770 | | | | 2 940 | | | | 2 348 | | | | 5 201 | | | | 8 784 | |
| | | | | | | | | | | | | | | | | | | | | | | | | | | | | | |
| | | | | | | | |
Gross loan debt | | | | | 68 737 | | | | 81 896 | | | | 95 305 | | | | 114 106 | | | | 145 732 | | | | 189 971 | | | | 240 151 | |
Net loan debt | | | | | 64 952 | | | | 70 715 | | | | 86 781 | | | | 104 344 | | | | 140 982 | | | | 185 380 | | | | 233 486 | |
| | | | | | | | | | | | | | | | | | | | | | | | | | | | | | |
| | | | | | | | |
Gold and foreign exchange contingency reserve account | | 6) | | | 11 158 | | | | 14 140 | | | | 10 351 | | | | 12 508 | | | | 8 934 | | | | 2 190 | | | | 4 147 | |
| | | | | | | | | | | | | | | | | | | | | | | | | | | | | | |
| | | | | | | | |
Composition of gross debt (excluding deduction of cash balances) | | | | | | | | | | | | | | | | | | | | | | | | | | | | | | |
Marketable domestic debt | | | | | 88.9 | % | | | 89.0 | % | | | 89.8 | % | | | 91.7 | % | | | 95.2 | % | | | 95.5 | % | | | 94.0 | % |
Government bonds | | | | | 88.5 | % | | | 86.7 | % | | | 86.9 | % | | | 88.2 | % | | | 91.2 | % | | | 92.1 | % | | | 87.5 | % |
Treasury bills | | | | | 0.4 | % | | | 2.3 | % | | | 2.9 | % | | | 3.5 | % | | | 4.0 | % | | | 3.5 | % | | | 2.9 | % |
Bridging bonds | | | | | 0.0 | % | | | 0.0 | % | | | 0.0 | % | | | 0.0 | % | | | 0.0 | % | | | 0.0 | % | | | 3.5 | % |
Non-marketable domestic debt | | 3) | | | 7.8 | % | | | 8.4 | % | | | 8.4 | % | | | 5.7 | % | | | 3.2 | % | | | 1.7 | % | | | 2.4 | % |
| | | | | | | | | | | | | | | | | | | | | | | | | | | | | | |
| | | | | | | | |
Domestic debt | | | | | 96.8 | % | | | 97.4 | % | | | 98.1 | % | | | 97.4 | % | | | 98.4 | % | | | 97.3 | % | | | 96.3 | % |
Foreign debt | | 5) | | | 3.2 | % | | | 2.6 | % | | | 1.9 | % | | | 2.6 | % | | | 1.6 | % | | | 2.7 | % | | | 3.7 | % |
| | | | | | | | |
Total as percentage of GDP | | | | | | | | | | | | | | | | | | | | | | | | | | | | | | |
Gross domestic debt | | | | | 30.3 | % | | | 30.6 | % | | | 31.2 | % | | | 32.3 | % | | | 37.5 | % | | | 41.8 | % | | | 46.5 | % |
Net domestic debt | | | | | 28.6 | % | | | 26.3 | % | | | 28.4 | % | | | 29.5 | % | | | 36.2 | % | | | 40.8 | % | | | 45.2 | % |
Gross foreign debt | | | | | 1.0 | % | | | 0.8 | % | | | 0.6 | % | | | 0.9 | % | | | 0.6 | % | | | 1.2 | % | | | 1.8 | % |
Net foreign debt | | | | | 1.0 | % | | | 0.8 | % | | | 0.6 | % | | | 0.9 | % | | | 0.6 | % | | | 1.2 | % | | | 1.8 | % |
Gross loan debt | | | | | 31.3 | % | | | 31.4 | % | | | 31.8 | % | | | 33.2 | % | | | 38.1 | % | | | 43.0 | % | | | 48.3 | % |
Net loan debt | | | | | 29.6 | % | | | 27.1 | % | | | 29.0 | % | | | 30.3 | % | | | 36.8 | % | | | 41.9 | % | | | 47.0 | % |
| 1) | Debt of the central government, excluding extra-budgetary institutions and social security funds. |
| 2) | As projected at the end of January 2013. |
| 3) | Includes non-marketable Treasury bills, retail bonds, former Namibian loans and loan levies. |
| 4) | Bank balances of the National Revenue Fund (balances of government’s accounts with the Reserve Bank and commercial banks). Bank balances in foreign currencies are revaluated using forward estimates of exchange rates. |
170
ANNEXURE B: STATISTICAL TABLES
| | | | | | | | | | | | | | | | | | | | | | | | | | | | | | |
| | | | | | | | | | | | | | | | | | | | | | | | | | | | | | Table 10 Total debt of government 1) |
| 1995/96 | | | 1996/97 | | | 1997/98 | | | 1998/99 | | | 1999/00 | | | 2000/01 | | | 2001/02 | | | | | |
| | | | | | | | | | | | | | | | | | | | | | | | R million |
| | | | | | | | | | | | | | | | | | | | | | | | | | | | | | Domestic debt |
| | 263 844 | | | | 290 424 | | | | 318 773 | | | | 344 938 | | | | 354 706 | | | | 365 231 | | | | 349 415 | | | | | Marketable |
| | 248 877 | | | | 276 124 | | | | 301 488 | | | | 325 938 | | | | 332 706 | | | | 339 731 | | | | 331 505 | | | | | Government bonds |
| | 10 700 | | | | 14 300 | | | | 17 285 | | | | 19 000 | | | | 22 000 | | | | 25 500 | | | | 17 910 | | | | | Treasury bills |
| | 4 267 | | | | — | | | | — | | | | — | | | | — | | | | — | | | | — | | | | | Bridging bonds |
| | 4 700 | | | | 6 421 | | | | 2 778 | | | | 2 013 | | | | 998 | | | | 2 382 | | | | 2 030 | | | 3) | | Non-marketable |
| | 268 544 | | | | 296 845 | | | | 321 551 | | | | 346 951 | | | | 355 704 | | | | 367 613 | | | | 351 445 | | | | | Gross loan debt |
| | -8 630 | | | | -2 757 | | | | -4 798 | | | | -5 166 | | | | -7 285 | | | | -2 650 | | | | -6 549 | | | 4) | | Cash balances |
| | 259 914 | | | | 294 088 | | | | 316 753 | | | | 341 785 | | | | 348 419 | | | | 364 963 | | | | 344 896 | | | | | Net loan debt |
| | | | | | | | | | | | | | | | | | | | | | | | | | | | | | |
| | | | | | | | | | | | | | | | | | | | | | | | | | | | | | Foreign debt |
| | 10 944 | | | | 11 394 | | | | 14 560 | | | | 16 276 | | | | 25 799 | | | | 31 938 | | | | 82 009 | | | 5) | | Gross loan debt |
| | — | | | | — | | | | — | | | | — | | | | — | | | | — | | | | — | | | 4) | | Cash balances |
| | 10 944 | | | | 11 394 | | | | 14 560 | | | | 16 276 | | | | 25 799 | | | | 31 938 | | | | 82 009 | | | | | Net loan debt |
| | | | | | | | | | | | | | | | | | | | | | | | | | | | | | |
| | 279 488 | | | | 308 239 | | | | 336 111 | | | | 363 227 | | | | 381 503 | | | | 399 551 | | | | 433 454 | | | | | Gross loan debt |
| | 270 858 | | | | 305 482 | | | | 331 313 | | | | 358 061 | | | | 374 218 | | | | 396 901 | | | | 426 905 | | | | | Net loan debt |
| | | | | | | | | | | | | | | | | | | | | | | | | | | | | | |
| | — | | | | 2 169 | | | | 73 | | | | 14 431 | | | | 9 200 | | | | 18 170 | | | | 28 024 | | | 6) | | Gold and foreign exchange contingency reserve account |
| | | | | | | | | | | | | | | | | | | | | | | | | | | | | | |
| | | | | | | | | | | | | | | | | | | | | | | | | | | | | | Composition of gross debt (excluding deduction of cash balances) |
| | 94.4 | % | | | 94.2 | % | | | 94.8 | % | | | 95.0 | % | | | 93.0 | % | | | 91.4 | % | | | 80.6 | % | | | | Marketable domestic debt |
| | 89.0 | % | | | 89.6 | % | | | 89.7 | % | | | 89.7 | % | | | 87.2 | % | | | 85.0 | % | | | 76.5 | % | | | | Government bonds |
| | 3.8 | % | | | 4.6 | % | | | 5.1 | % | | | 5.2 | % | | | 5.8 | % | | | 6.4 | % | | | 4.1 | % | | | | Treasury bills |
| | 1.5 | % | | | 0.0 | % | | | 0.0 | % | | | 0.0 | % | | | 0.0 | % | | | 0.0 | % | | | 0.0 | % | | | | Bridging bonds |
| | 1.7 | % | | | 2.1 | % | | | 0.8 | % | | | 0.6 | % | | | 0.3 | % | | | 0.6 | % | | | 0.5 | % | | 3) | | Non-marketable domestic debt |
| | | | | | | | | | | | | | | | | | | | | | | | | | | | | | |
| | 96.1 | % | | | 96.3 | % | | | 95.7 | % | | | 95.5 | % | | | 93.2 | % | | | 92.0 | % | | | 81.1 | % | | | | Domestic debt |
| | 3.9 | % | | | 3.7 | % | | | 4.3 | % | | | 4.5 | % | | | 6.8 | % | | | 8.0 | % | | | 18.9 | % | | 5) | | Foreign debt |
| | | | | | | | | | | | | | | | | | | | | | | | | | | | | | |
| | | | | | | | | | | | | | | | | | | | | | | | | | | | | | Total as percentage of GDP |
| | 47.6 | % | | | 46.7 | % | | | 45.9 | % | | | 45.8 | % | | | 42.5 | % | | | 38.6 | % | | | 33.5 | % | | | | Gross domestic debt |
| | 46.1 | % | | | 46.3 | % | | | 45.3 | % | | | 45.1 | % | | | 41.6 | % | | | 38.3 | % | | | 32.9 | % | | | | Net domestic debt |
| | 1.9 | % | | | 1.8 | % | | | 2.1 | % | | | 2.1 | % | | | 3.1 | % | | | 3.4 | % | | | 7.8 | % | | | | Gross foreign debt |
| | 1.9 | % | | | 1.8 | % | | | 2.1 | % | | | 2.1 | % | | | 3.1 | % | | | 3.4 | % | | | 7.8 | % | | | | Net foreign debt |
| | 49.5 | % | | | 48.5 | % | | | 48.0 | % | | | 48.0 | % | | | 45.6 | % | | | 42.0 | % | | | 41.3 | % | | | | Gross loan debt |
| | 48.0 | % | | | 48.1 | % | | | 47.3 | % | | | 47.3 | % | | | 44.7 | % | | | 41.7 | % | | | 40.7 | % | | | | Net loan debt |
| 5) | Valued at appropriate foreign exchange rates up to 31 March 2012 as at the end of each period. Forward estimates are based on exchange rates prevailing at 31 January 2013, projected to depreciate in line with inflation differentials. |
| 6) | The balance on the gold and foreign exchange contingency reserve account on 31 March 2013 represents an estimated balance on the account. No provision for any profits or losses on this account has been made for subsequent years. A negative balance indicates a profit and a positive balance a loss. |
171
2013 BUDGET REVIEW
Table 10
Total debt of government 1)
| | | | | | | | | | | | | | | | | | | | | | | | | | | | | | |
| | | | | 2002/03 | | | 2003/04 | | | 2004/05 | | | 2005/06 | | | 2006/07 | | | 2007/08 | | | 2008/09 | |
R million | | | | | | | | | | | | | | | | | | | | | | | |
| | | | | | | | |
Domestic debt | | | | | | | | | | | | | | | | | | | | | | | | | | | | | | |
Marketable | | | | | 350 870 | | | | 388 300 | | | | 428 593 | | | | 457 780 | | | | 467 864 | | | | 478 265 | | | | 527 751 | |
Government bonds | | | | | 328 820 | | | | 359 700 | | | | 394 143 | | | | 417 380 | | | | 422 064 | | | | 426 415 | | | | 462 751 | |
Treasury bills | | | | | 22 050 | | | | 28 600 | | | | 34 450 | | | | 40 400 | | | | 45 800 | | | | 51 850 | | | | 65 000 | |
Bridging bonds | | | | | — | | | | — | | | | — | | | | — | | | | — | | | | — | | | | — | |
Non-marketable | | 3) | | | 1 910 | | | | 1 999 | | | | 3 498 | | | | 3 699 | | | | 3 238 | | | | 2 555 | | | | 1 956 | |
| | | | | | | | |
Gross loan debt | | | | | 352 780 | | | | 390 299 | | | | 432 091 | | | | 461 479 | | | | 471 102 | | | | 480 821 | | | | 529 707 | |
Cash balances | | 4) | | | -9 730 | | | | -12 669 | | | | -30 870 | | | | -58 187 | | | | -75 315 | | | | -93 809 | | | | -101 349 | |
Net loan debt | | | | | 343 050 | | | | 377 630 | | | | 401 221 | | | | 403 292 | | | | 395 787 | | | | 387 012 | | | | 428 358 | |
| | | | | | | | | | | | | | | | | | | | | | | | | | | | | | |
| | | | | | | | |
Foreign debt | | | | | | | | | | | | | | | | | | | | | | | | | | | | | | |
Gross loan debt | | 5) | | | 74 286 | | | | 64 670 | | | | 69 405 | | | | 66 846 | | | | 82 581 | | | | 96 218 | | | | 97 268 | |
Cash balances | | 4) | | | — | | | | — | | | | — | | | | — | | | | — | | | | — | | | | — | |
Net loan debt | | | | | 74 286 | | | | 64 670 | | | | 69 405 | | | | 66 846 | | | | 82 581 | | | | 96 218 | | | | 97 268 | |
| | | | | | | | | | | | | | | | | | | | | | | | | | | | | | |
| | | | | | | | |
Gross loan debt | | | | | 427 066 | | | | 454 969 | | | | 501 496 | | | | 528 325 | | | | 553 683 | | | | 577 039 | | | | 626 975 | |
Net loan debt | | | | | 417 336 | | | | 442 300 | | | | 470 626 | | | | 470 138 | | | | 478 368 | | | | 483 230 | | | | 525 626 | |
| | | | | | | | | | | | | | | | | | | | | | | | | | | | | | |
| | | | | | | | |
Gold and foreign exchange contingency reserve account | | 6) | | | 36 577 | | | | 18 036 | | | | 5 292 | | | | -1 751 | | | | -28 514 | | | | -72 189 | | | | -101 585 | |
| | | | | | | | | | | | | | | | | | | | | | | | | | | | | | |
| | | | | | | | |
Composition of gross debt (excluding deduction of cash balances) | | | | | | | | | | | | | | | | | | | | | | | | | | | | | | |
Marketable domestic debt | | | | | 82.2 | % | | | 85.3 | % | | | 85.5 | % | | | 86.6 | % | | | 84.5 | % | | | 82.9 | % | | | 84.2 | % |
Government bonds | | | | | 77.0 | % | | | 79.1 | % | | | 78.6 | % | | | 79.0 | % | | | 76.2 | % | | | 73.9 | % | | | 73.8 | % |
Treasury bills | | | | | 5.2 | % | | | 6.3 | % | | | 6.9 | % | | | 7.6 | % | | | 8.3 | % | | | 9.0 | % | | | 10.4 | % |
Bridging bonds | | | | | 0.0 | % | | | 0.0 | % | | | 0.0 | % | | | 0.0 | % | | | 0.0 | % | | | 0.0 | % | | | 0.0 | % |
Non-marketable domestic debt | | 3) | | | 0.4 | % | | | 0.4 | % | | | 0.7 | % | | | 0.7 | % | | | 0.6 | % | | | 0.4 | % | | | 0.3 | % |
| | | | | | | | | | | | | | | | | | | | | | | | | | | | | | |
| | | | | | | | |
Domestic debt | | | | | 82.6 | % | | | 85.8 | % | | | 86.2 | % | | | 87.3 | % | | | 85.1 | % | | | 83.3 | % | | | 84.5 | % |
Foreign debt | | 5) | | | 17.4 | % | | | 14.2 | % | | | 13.8 | % | | | 12.7 | % | | | 14.9 | % | | | 16.7 | % | | | 15.5 | % |
| | | | | | | | | | | | | | | | | | | | | | | | | | | | | | |
| | | | | | | | |
Total as percentage of GDP | | | | | | | | | | | | | | | | | | | | | | | | | | | | | | |
Gross domestic debt | | | | | 29.3 | % | | | 29.9 | % | | | 29.8 | % | | | 28.6 | % | | | 25.7 | % | | | 23.2 | % | | | 23.1 | % |
Net domestic debt | | | | | 28.5 | % | | | 29.0 | % | | | 27.7 | % | | | 25.0 | % | | | 21.6 | % | | | 18.6 | % | | | 18.7 | % |
Gross foreign debt | | | | | 6.2 | % | | | 5.0 | % | | | 4.8 | % | | | 4.1 | % | | | 4.5 | % | | | 4.6 | % | | | 4.2 | % |
Net foreign debt | | | | | 6.2 | % | | | 5.0 | % | | | 4.8 | % | | | 4.1 | % | | | 4.5 | % | | | 4.6 | % | | | 4.2 | % |
Gross loan debt | | | | | 35.5 | % | | | 34.9 | % | | | 34.6 | % | | | 32.7 | % | | | 30.2 | % | | | 27.8 | % | | | 27.3 | % |
Net loan debt | | | | | 34.7 | % | | | 33.9 | % | | | 32.5 | % | | | 29.1 | % | | | 26.1 | % | | | 23.3 | % | | | 22.9 | % |
| 1) | Debt of the central government, excluding extra-budgetary institutions and social security funds. |
| 2) | As projected at the end of January 2013. |
| 3) | Includes non-marketable Treasury bills, retail bonds, former Namibian loans and loan levies. |
| 4) | Bank balances of the National Revenue Fund (balances of government’s accounts with the Reserve Bank and commercial banks). Bank balances in foreign currencies are revaluated using forward estimates of exchange rates. |
172
ANNEXURE B: STATISTICAL TABLES
| | | | | | | | | | | | | | | | | | | | | | | | | | | | | | |
| | | | | | | | | | | | | | | | | | | | | | | | | | | | | | Table 10 Total debt of government 1) |
| 2009/10 | | | 2010/11 | | | 2011/12 | | | 2012/13 2) | | | 2013/14 | | | 2014/15 | | | 2015/16 | | | | | |
| | | | | | | | | | | | | | | | | | | | | | | | R million |
| | | | | | | | | | | | | | | | | | | | | | | | | | | | | | Domestic debt |
| | 700 532 | | | | 869 588 | | | | 1 045 415 | | | | 1 198 369 | | | | 1 386 030 | | | | 1 566 921 | | | | 1 754 712 | | | | | Marketable |
| | 585 992 | | | | 733 438 | | | | 890 256 | | | | 1 022 313 | | | | 1 185 871 | | | | 1 342 762 | | | | 1 506 553 | | | | | Government bonds |
| | 114 540 | | | | 136 150 | | | | 155 159 | | | | 176 056 | | | | 200 159 | | | | 224 159 | | | | 248 159 | | | | | Treasury bills |
| | — | | | | — | | | | — | | | | — | | | | — | | | | — | | | | — | | | | | Bridging bonds |
| | 4 943 | | | | 23 133 | | | | 25 524 | | | | 25 859 | | | | 23 659 | | | | 23 380 | | | | 23 779 | | | 3) | | Non-marketable |
| | 705 475 | | | | 892 721 | | | | 1 070 939 | | | | 1 224 228 | | | | 1 409 689 | | | | 1 590 301 | | | | 1 778 491 | | | | | Gross loan debt |
| | -106 550 | | | | -111 413 | | | | -130 450 | | | | -100 041 | | | | -102 657 | | | | -97 157 | | | | -120 157 | | | 4) | | Cash balances |
| | 598 925 | | | | 781 308 | | | | 940 489 | | | | 1 124 187 | | | | 1 307 032 | | | | 1 493 144 | | | | 1 658 334 | | | | | Net loan debt |
| | | | | | | | | | | | | | | | | | | | | | | | | | | | | | |
| | | | | | | | | | | | | | | | | | | | | | | | | | | | | | Foreign debt |
| | 99 454 | | | | 97 851 | | | | 116 851 | | | | 118 303 | | | | 112 439 | | | | 113 794 | | | | 125 261 | | | 5) | | Gross loan debt |
| | -25 339 | | | | -58 750 | | | | -67 609 | | | | -77 398 | | | | -62 148 | | | | -62 473 | | | | -63 807 | | | 4) | | Cash balances |
| | 74 115 | | | | 39 101 | | | | 49 242 | | | | 40 905 | | | | 50 291 | | | | 51 321 | | | | 61 454 | | | | | Net loan debt |
| | | | | | | | | | | | | | | | | | | | | | | | | | | | | | |
| | 804 929 | | | | 990 572 | | | | 1 187 790 | | | | 1 342 531 | | | | 1 522 128 | | | | 1 704 095 | | | | 1 903 752 | | | | | Gross loan debt |
| | 673 040 | | | | 820 409 | | | | 989 731 | | | | 1 165 092 | | | | 1 357 323 | | | | 1 544 465 | | | | 1 719 788 | | | | | Net loan debt |
| | | | | | | | | | | | | | | | | | | | | | | | | | | | | | |
| | -35 618 | | | | -28 283 | | | | -67 655 | | | | -103 167 | | | | -103 167 | | | | -103 167 | | | | -103 167 | | | 6) | | Gold and foreign exchange contingency reserve account |
| | | | | | | | | | | | | | | | | | | | | | | | | | | | | | |
| | | | | | | | | | | | | | | | | | | | | | | | | | | | | | Composition of gross debt (excluding deduction of cash balances) |
| | 87.0 | % | | | 87.8 | % | | | 88.0 | % | | | 89.3 | % | | | 91.1 | % | | | 92.0 | % | | | 92.2 | % | | | | Marketable domestic debt |
| | 72.8 | % | | | 74.0 | % | | | 75.0 | % | | | 76.1 | % | | | 77.9 | % | | | 78.8 | % | | | 79.1 | % | | | | Government bonds |
| | 14.2 | % | | | 13.7 | % | | | 13.1 | % | | | 13.1 | % | | | 13.1 | % | | | 13.2 | % | | | 13.0 | % | | | | Treasury bills |
| | 0.0 | % | | | 0.0 | % | | | 0.0 | % | | | 0.0 | % | | | 0.0 | % | | | 0.0 | % | | | 0.0 | % | | | | Bridging bonds |
| | 0.6 | % | | | 2.3 | % | | | 2.1 | % | | | 1.9 | % | | | 1.6 | % | | | 1.4 | % | | | 1.2 | % | | 3) | | Non-marketable domestic debt |
| | | | | | | | | | | | | | | | | | | | | | | | | | | | | | |
| | 87.6 | % | | | 90.1 | % | | | 90.2 | % | | | 91.2 | % | | | 92.6 | % | | | 93.3 | % | | | 93.4 | % | | | | Domestic debt |
| | 12.4 | % | | | 9.9 | % | | | 9.8 | % | | | 8.8 | % | | | 7.4 | % | | | 6.7 | % | | | 6.6 | % | | 5) | | Foreign debt |
| | | | | | | | | | | | | | | | | | | | | | | | | | | | | | |
| | | | | | | | | | | | | | | | | | | | | | | | | | | | | | Total as percentage of GDP |
| | 28.8 | % | | | 32.6 | % | | | 36.0 | % | | | 38.1 | % | | | 40.0 | % | | | 41.0 | % | | | 41.6 | % | | | | Gross domestic debt |
| | 24.4 | % | | | 28.6 | % | | | 31.6 | % | | | 35.0 | % | | | 37.1 | % | | | 38.5 | % | | | 38.8 | % | | | | Net domestic debt |
| | 4.1 | % | | | 3.6 | % | | | 3.9 | % | | | 3.7 | % | | | 3.2 | % | | | 2.9 | % | | | 2.9 | % | | | | Gross foreign debt |
| | 3.0 | % | | | 1.4 | % | | | 1.7 | % | | | 1.3 | % | | | 1.4 | % | | | 1.3 | % | | | 1.4 | % | | | | Net foreign debt |
| | 32.8 | % | | | 36.2 | % | | | 39.9 | % | | | 41.8 | % | | | 43.2 | % | | | 43.9 | % | | | 44.6 | % | | | | Gross loan debt |
| | 27.4 | % | | | 30.0 | % | | | 33.3 | % | | | 36.3 | % | | | 38.6 | % | | | 39.8 | % | | | 40.3 | % | | | | Net loan debt |
| 5) | Valued at appropriate foreign exchange rates up to 31 March 2012 as at the end of each period. Forward estimates are based on exchange rates prevailing at 31 January 2013, projected to depreciate in line with inflation differentials. |
| 6) | The balance on the gold and foreign exchange contingency reserve account on 31 March 2013 represents an estimated balance on the account. No provision for any profits or losses on this account has been made for subsequent years. A negative balance indicates a profit and a positive balance a loss. |
173
2013 BUDGET REVIEW
Table 11
Financial guarantees:
amounts drawn on government guarantees
| | | | | | | | | | | | | | | | | | | | | | | | |
| | | 2009/10 | | | 2010/11 | |
| | | Domestic | | | Foreign | | | Total | | | Domestic | | | Foreign | | | Total | |
R million | | | | | | | | | | | | | | | | | | |
General government sector | | | 418 | | | | — | | | | 418 | | | | 294 | | | | — | | | | 294 | |
| | | | | | |
Central government | | | 418 | | | | — | | | | 418 | | | | 294 | | | | — | | | | 294 | |
| | | | | | |
Former regional authorities | | | 190 | | | | — | | | | 190 | | | | 154 | | | | — | | | | 154 | |
Guarantee scheme for housing loans to employees | | | 154 | | | | — | | | | 154 | | | | 104 | | | | — | | | | 104 | |
Guarantee scheme for motor vehicles - senior officials | | | 3 | | | | — | | | | 3 | | | | 3 | | | | — | | | | 3 | |
Universities and technikons | | | 71 | | | | — | | | | 71 | | | | 33 | | | | — | | | | 33 | |
| | | | | | |
Public entities | | | 111 403 | | | | 17 159 | | | | 128 562 | | | | 127 321 | | | | 21 891 | | | | 149 212 | |
Non-financial | | | 93 703 | | | | 5 037 | | | | 98 740 | | | | 110 371 | | | | 10 638 | | | | 121 009 | |
Central Energy Fund | | | — | | | | 19 | | | | 19 | | | | — | | | | — | | | | — | |
Denel | | | 1 850 | | | | — | | | | 1 850 | | | | 1 850 | | | | — | | | | 1 850 | |
Eskom | | | 46 678 | | | | — | | | | 46 678 | | | | 60 662 | | | | 6 395 | | | | 67 057 | |
Irrigation boards | | | 46 | | | | — | | | | 46 | | | | 44 | | | | — | | | | 44 | |
Kalahari East Water Board | | | 16 | | | | — | | | | 16 | | | | 16 | | | | — | | | | 16 | |
Komati Basin Water Authority | | | 1 406 | | | | — | | | | 1 406 | | | | 1 340 | | | | — | | | | 1 340 | |
Lesotho Highlands Development Authority | | | 5 | | | | 396 | | | | 401 | | | | 2 | | | | 225 | | | | 227 | |
Nuclear Energy Corporation of South Africa | | | 20 | | | | — | | | | 20 | | | | 20 | | | | — | | | | 20 | |
Passenger Rail Agency of South Africa | | | 1 217 | | | | — | | | | 1 217 | | | | 468 | | | | — | | | | 468 | |
South African Airways | | | 1 300 | | | | 51 | | | | 1 351 | | | | 1 916 | | | | — | | | | 1 916 | |
South African Broadcasting Corporation | | | 1 000 | | | | — | | | | 1 000 | | | | 1 000 | | | | — | | | | 1 000 | |
South African Express | | | — | | | | — | | | | — | | | | — | | | | — | | | | — | |
South African National Roads Agency Limited | | | 12 287 | | | | — | | | | 12 287 | | | | 18 605 | | | | — | | | | 18 605 | |
Telkom South Africa | | | — | | | | 108 | | | | 108 | | | | — | | | | 90 | | | | 90 | |
Trans-Caledon Tunnel Authority | | | 20 523 | | | | 198 | | | | 20 721 | | | | 18 317 | | | | 172 | | | | 18 489 | |
Transnet | | | 7 355 | | | | 4 265 | | | | 11 620 | | | | 6 131 | | | | 3 756 | | | | 9 887 | |
| | | | | | |
Financial | | | 17 700 | | | | 12 122 | | | | 29 822 | | | | 16 950 | | | | 11 253 | | | | 28 203 | |
Development Bank of Southern Africa | | | 15 200 | | | | 11 170 | | | | 26 370 | | | | 15 200 | | | | 10 513 | | | | 25 713 | |
Industrial Development Corporation of South Africa | | | — | | | | 952 | | | | 952 | | | | — | | | | 740 | | | | 740 | |
Land Bank | | | 2 500 | | | | — | | | | 2 500 | | | | 1 750 | | | | — | | | | 1 750 | |
South African Reserve Bank | | | — | | | | — | | | | — | | | | — | | | | — | | | | — | |
Private sector | | | 94 | | | | — | | | | 94 | | | | 94 | | | | — | | | | 94 | |
Agricultural cooperatives | | | 94 | | | | — | | | | 94 | | | | 94 | | | | — | | | | 94 | |
Foreign sector | | | 25 | | | | — | | | | 25 | | | | — | | | | — | | | | — | |
Foreign central banks and governments | | | 25 | | | | — | | | | 25 | | | | — | | | | — | | | | — | |
| | | | | | | | | | | | | | | | | | | | | | | | |
| | | | | | |
Total | | | 111 940 | | | | 17 159 | | | | 129 099 | | | | 127 709 | | | | 21 891 | | | | 149 600 | |
| 1) | As projected at the end of December 2012. |
174
ANNEXURE B: STATISTICAL TABLES
| | | | | | | | | | | | | | | | | | | | | | | | |
| | | | | | | Table 11 Financial guarantees: amounts drawn on government guarantees |
| 2011/12 | | | 2012/13 1) | | | |
| Domestic | | | Foreign | | | Total | | | Domestic | | | Foreign | | | Total | | | |
| | | | | | | | | | | | | | | | | | | | | | | | R million |
| | 224 | | | | — | | | | 224 | | | | 224 | | | | — | | | | 224 | | | General government sector |
| | 224 | | | | — | | | | 224 | | | | 224 | | | | — | | | | 224 | | | Central government |
| | 138 | | | | — | | | | 138 | | | | 138 | | | | — | | | | 138 | | | Former regional authorities |
| | 64 | | | | — | | | | 64 | | | | 64 | | | | — | | | | 64 | | | Guarantee scheme for housing loans to employees |
| | 2 | | | | — | | | | 2 | | | | 2 | | | | — | | | | 2 | | | Guarantee scheme for motor vehicles - senior officials |
| | 20 | | | | — | | | | 20 | | | | 20 | | | | — | | | | 20 | | | Universities and technikons |
| | 126 583 | | | | 27 023 | | | | 153 606 | | | | 141 186 | | | | 41 388 | | | | 182 574 | | | Public entities |
| | 110 383 | | | | 16 023 | | | | 126 406 | | | | 124 186 | | | | 30 387 | | | | 154 573 | | | Non-financial |
| | — | | | | — | | | | — | | | | — | | | | — | | | | — | | | Central Energy Fund |
| | 1 850 | | | | — | | | | 1 850 | | | | 1 850 | | | | — | | | | 1 850 | | | Denel |
| | 65 367 | | | | 11 863 | | | | 77 230 | | | | 77 249 | | | | 26 227 | | | | 103 476 | | | Eskom |
| | 48 | | | | — | | | | 48 | | | | 48 | | | | — | | | | 48 | | | Irrigation boards |
| | 15 | | | | — | | | | 15 | | | | 15 | | | | — | | | | 15 | | | Kalahari East Water Board |
| | 1 247 | | | | — | | | | 1 247 | | | | 1 247 | | | | — | | | | 1 247 | | | Komati Basin Water Authority |
| | 1 | | | | 170 | | | | 171 | | | | 1 | | | | 170 | | | | 171 | | | Lesotho Highlands Development Authority |
| | 20 | | | | — | | | | 20 | | | | 20 | | | | — | | | | 20 | | | Nuclear Energy Corporation of South Africa |
| | 264 | | | | — | | | | 264 | | | | 264 | | | | — | | | | 264 | | | Passenger Rail Agency of South Africa |
| | 1 300 | | | | — | | | | 1 300 | | | | 2 900 | | | | — | | | | 2 900 | | | South African Airways |
| | 889 | | | | — | | | | 889 | | | | 889 | | | | — | | | | 889 | | | South African Broadcasting Corporation |
| | — | | | | — | | | | — | | | | 539 | | | | — | | | | 539 | | | South African Express |
| | 19 426 | | | | — | | | | 19 426 | | | | 19 426 | | | | — | | | | 19 426 | | | South African National Roads Agency Limited |
| | — | | | | 85 | | | | 85 | | | | — | | | | 85 | | | | 85 | | | Telkom South Africa |
| | 19 738 | | | | 148 | | | | 19 886 | | | | 19 738 | | | | 148 | | | | 19 886 | | | Trans-Caledon Tunnel Authority |
| | 218 | | | | 3 757 | | | | 3 975 | | | | — | | | | 3 757 | | | | 3 757 | | | Transnet |
| | 16 200 | | | | 11 000 | | | | 27 200 | | | | 17 000 | | | | 11 001 | | | | 28 001 | | | Financial |
| | 15 200 | | | | 10 354 | | | | 25 554 | | | | 15 200 | | | | 10 354 | | | | 25 554 | | | Development Bank of Southern Africa |
| | — | | | | 646 | | | | 646 | | | | — | | | | 647 | | | | 647 | | | Industrial Development Corporation of South Africa |
| | 1 000 | | | | — | | | | 1 000 | | | | 1 800 | | | | — | | | | 1 800 | | | Land Bank |
| | — | | | | — | | | | — | | | | — | | | | — | | | | — | | | South African Reserve Bank |
| | 94 | | | | — | | | | 94 | | | | 93 | | | | — | | | | 93 | | | Private sector |
| | 94 | | | | — | | | | 94 | | | | 93 | | | | — | | | | 93 | | | Agricultural cooperatives |
| | — | | | | — | | | | — | | | | — | | | | — | | | | — | | | Foreign sector |
| | — | | | | — | | | | — | | | | — | | | | — | | | | — | | | Foreign central banks and governments |
| | | | | | | | | | | | | | | | | | | | | | | | |
| | 126 901 | | | | 27 023 | | | | 153 924 | | | | 141 503 | | | | 41 388 | | | | 182 891 | | | Total |
| | | | | | | | | | | | | | | | | | | | | | | | |
175
2013 BUDGET REVIEW
176
C
Miscellaneous tax amendments
| ¢ | | Tax expenditure statement: February 2013 |
Introduction
This is the third instalment of the summarised tax expenditure estimates. In brief, tax expenditures are provisions in tax legislation that reduce the amount of tax revenue that could otherwise have been realised. Tax expenditures can be defined as deviations from the benchmark of a standard tax legislative framework.
Table C.2 details the 2013 tax expenditure statement. Tax expenditure estimates reported in the previous statements might have changed due to availability of more reliable data, updated estimating assumptions and other corrections.
Major changes for tax expenditure
Tax expenditure on exempt interest income was estimated in the previous tax expenditure report. Figures have been revised as accuracy improves due to increased use of e-filing and assessed data (as opposed to information on taxpayer returns). The calculation is based on whether taxpayers are under or over 65 years and whether their interest income has breached the applicable threshold or not. For taxpayers with interest income over the exemption cap, the calculation applied is the number of taxpayers multiplied by the exemption cap and the marginal tax rate for each income group. For those taxpayers with interest income below the exemption cap, the amounts allowed are multiplied by the appropriate marginal tax rates.
For tax expenditures associated with the small business corporation (SBC) tax regime, data for the 2012 calculation was obtained from a list of all companies with a turnover of up to R14 million per year based on the last year assessed. The estimate was based on the difference between the income tax a company would have paid at the corporate tax rate and what the same business would have paid at the SBC tax rate. This has been rectified by obtaining the actual tax cost of the SBC regime. In addition, the latest report includes estimates of tax expenditure stemming from the accelerated depreciation allowance for small businesses.
177
2013 BUDGET REVIEW
Previously reported figures for urban development zones include tax expenditure associated with businesses, individuals and trusts. This data has been grouped accordingly and only the business component is reported for all years. Due to a small portion of the tax expenditure being attributable to individuals and trusts, and the unreliability of this data, it has been excluded from the report.
The motor industry development programme’s outer year reflects a considerable increase relative to prior years. This is due to a change in the way that data is extracted and a retrospective change to include dumpers (heavy duty trucks) as part of the heavy motor vehicle motor industry development programme, which was implemented at the end of 2010 retrospectively to 2007.
VAT relief on fuel sales
As petrol, diesel and illuminating paraffin are zero-rated for value-added tax (VAT) purposes, the resulting deviation is regarded as tax expenditure. This is calculated by estimating the value for sales and making assumptions about the estimated volumes used by final consumers. It was assumed that 20 per cent of petrol sales was used for business purposes (by VAT vendors) and would have qualified to claim input VAT. For diesel, it was assumed that 90 per cent of sales was used for business purposes and would have qualified for input VAT.
Average national diesel, petrol and paraffin prices are shown below.
Table C.1 National average price and national quantity fuel sold (million litres)
| | | | | | | | | | | | | | | | | | | | | | | | | | | | | | | | | | | | | | | | |
| | | 2007 | | | 2008 | | | 2009 | | | 2010 | | | 2011 | |
Fuel type | | Price
(Rand/l) | | | Quantity | | | Price
(Rand/l) | | | Quantity | | | Price
(Rand/l) | | | Quantity | | | Price
(Rand/l) | | | Quantity | | | Price
(Rand/l) | | | Quantity | |
Diesel | | | 5.8 | | | | 8 977 | | | | 6.7 | | | | 9 976 | | | | 9.0 | | | | 9 914 | | | | 6.7 | | | | 9 570 | | | | 7.7 | | | | 10 333 | |
Petrol | | | 6.1 | | | | 11 400 | | | | 7.1 | | | | 11 531 | | | | 8.6 | | | | 11 055 | | | | 7.6 | | | | 11 319 | | | | 8.4 | | | | 11 541 | |
Paraffin | | | 4.5 | | | | 714 | | | | 5.2 | | | | 694 | | | | 7.1 | | | | 506 | | | | 4.8 | | | | 776 | | | | 5.4 | | | | 482 | |
Estimates of tax expenditure
The following table summarises tax expenditure in terms of the Income Tax Act (1962), the VAT Act (1991) and the Customs and Excise Act (1964).
178
ANNEXURE C: MISCELLANEOUS TAX AMENDMENTS
Table C.2 Tax expenditure estimates
| | | | | | | | | | | | | | | | |
| | | 2007/08 | | | 2008/09 | | | 2009/10 | | | 2010/11 | |
Personal income tax | | | | | | | | | | | | | | | | |
Pension and retirement annuity1 | | | 13 078 | | | | 15 554 | | | | 17 566 | | | | 20 592 | |
pension contributions – employees | | | 4 774 | | | | 5 765 | | | | 6 602 | | | | 7 265 | |
pension contributions – employers | | | 5 368 | | | | 6 484 | | | | 7 425 | | | | 9 372 | |
retirement annuity | | | 2 936 | | | | 3 305 | | | | 3 538 | | | | 3 955 | |
Medical | | | 8 544 | | | | 10 222 | | | | 11 771 | | | | 13 959 | |
medical contributions & deductions – employees | | | 4 750 | | | | 5 696 | | | | 6 663 | | | | 13 959 | |
medical contributions – employers 2 | | | 3 793 | | | | 4 527 | | | | 5 108 | | | | – | |
Interest exemptions | | | 1 961 | | | | 2 518 | | | | 2 423 | | | | 2 157 | |
Secondary rebate (65 years and older) | | | 1 194 | | | | 1 426 | | | | 1 430 | | | | 1 710 | |
Donations | | | 84 | | | | 107 | | | | 111 | | | | 118 | |
Capital gains tax (annual exclusion) | | | 126 | | | | 84 | | | | 64 | | | | 66 | |
| | | | | | | | | | | | | | | | |
Total personal income tax | | | 24 987 | | | | 29 913 | | | | 33 364 | | | | 38 602 | |
| | | | | | | | | | | | | | | | |
| | | | |
Corporate income tax | | | | | | | | | | | | | | | | |
Small business corporation tax savings | | | 1 196 | | | | 1 279 | | | | 1 330 | | | | 1 343 | |
reduced headline rate | | | 1 174 | | | | 1 254 | | | | 1 307 | | | | 1 321 | |
Section 12E 3 depreciation allowance | | | 22 | | | | 25 | | | | 23 | | | | 22 | |
Research and development | | | 358 | | | | 538 | | | | 714 | | | | 416 | |
Learnership allowances | | | 424 | | | | 397 | | | | 644 | | | | 501 | |
Strategic industrial policy | | | 228 | | | | 61 | | | | 215 | | | | 138 | |
Film incentive | | | 297 | | | | 280 | | | | 180 | | | | 2 | |
Urban development zones | | | 110 | | | | 159 | | | | 238 | | | | 354 | |
| | | | | | | | | | | | | | | | |
Total corporate income tax | | | 2 613 | | | | 2 715 | | | | 3 321 | | | | 2 754 | |
| | | | | | | | | | | | | | | | |
| | | | |
Value-added tax Zero-rated supplies | | | | | | | | | | | | | | | | |
19 basic food items4 | | | 13 107 | | | | 13 907 | | | | 14 606 | | | | 15 962 | |
Petrol5 | | | 9 176 | | | | 10 524 | | | | 9 463 | | | | 10 845 | |
Diesel5 | | | 948 | | | | 1 249 | | | | 918 | | | | 1 107 | |
Paraffin5 | | | 516 | | | | 520 | | | | 356 | | | | 367 | |
Municipal property rates | | | 3 081 | | | | 3 210 | | | | 4 309 | | | | 5 536 | |
Reduced inclusion rate for “commercial” accommodation | | | 94 | | | | 112 | | | | 127 | | | | 142 | |
Subtotal zero-rated supplies | | | 26 921 | | | | 29 522 | | | | 29 779 | | | | 33 958 | |
| | | | | | | | | | | | | | | | |
Exempt supplies (public transport & education) | | | 785 | | | | 832 | | | | 922 | | | | 1 001 | |
| | | | | | | | | | | | | | | | |
| | | | |
Customs duties and excise | | | | | | | | | | | | | | | | |
Motor vehicles (MIDP, including IRCCs)6 | | | 16 169 | | | | 12 089 | | | | 12 673 | | | | 22 645 | |
Textile and clothing (Duty credits – DCCs)6 | | | 1 829 | | | | 2 024 | | | | 2 231 | | | | 1 621 | |
Furniture and fixtures | | | 166 | | | | 128 | | | | 153 | | | | 562 | |
Other customs7 | | | 1 141 | | | | 1 231 | | | | 787 | | | | 2 801 | |
Diesel refund (mining, agriculture and fishing) | | | 1 030 | | | | 1 242 | | | | 1 295 | | | | 1 283 | |
Total customs and excise | | | 20 334 | | | | 16 714 | | | | 17 139 | | | | 28 912 | |
| | | | | | | | | | | | | | | | |
Total tax expenditure | | | 75 641 | | | | 79 695 | | | | 84 524 | | | | 105 226 | |
| | | | | | | | | | | | | | | | |
Tax expenditure as % of total gross tax revenue | | | 13.2 | % | | | 12.7 | % | | | 14.1 | % | | | 15.6 | % |
Total gross tax revenue | | | 572 815 | | | | 625 100 | | | | 598 705 | | | | 674 183 | |
| | | | | | | | | | | | | | | | |
Tax expenditure as % of GDP | | | 3.6 | % | | | 3.5 | % | | | 3.5 | % | | | 3.8 | % |
| | | | | | | | | | | | | | | | |
| 1. | Some of this tax expenditure is recouped when amounts are withdrawn as either a lump sum or an annuity |
| 2. | Prior to 2010/11 employer contributions were assumed to be equivalent to employee deductions |
| 3. | Section 12E of the Income Tax Act No. 58 of 1962 |
| 4. | VAT relief in respect of basic food items based on an independent study |
| 5. | Based on fuel volumes and average retail selling prices |
| 6. | MIDP = motor industry development programme, IRCC = import rebate credit certificate, DCC = duty credit certificates |
| 7. | Goods manufactured exclusively for exports, television monitors and agricultural goods exempted |
179
2013 BUDGET REVIEW
Personal income tax rate and bracket structure
The primary rebate has been increased to R12 080 per year for all individuals. The secondary rebate, which applies to individuals aged 65 years and over, is increased to R6 750 per year. The third rebate, which applies to individuals aged 75 years and over, is increased to R2 250 per year. The threshold below which individuals are not liable for personal income tax is increased to R67 111 of taxable income per year for those below the age of 65, R104 611 per year for those aged 65 to 74, and R117 111 for age 75 and over. The rates for the 2012/13 tax year and the proposed rates for 2013/14 are set out in Table C.3.
Table C.3 Personal income tax rate and bracket adjustments, 2012/13 – 2013/14
| | | | | | |
| 2012/13 | | 2013/14 |
Taxable income (R) | | Rates of tax | | Taxable income (R) | | Rates of tax |
R0 - R160 000 | | 18% of each R1 | | R0 - R165 600 | | 18% of each R1 |
R160 001 - R250 000 | | R28 800 + 25% of the | | R165 601 - R258 750 | | R29 808 + 25% of the |
| | amount above R160 000 | | | | amount above R165 600 |
R250 001 - R346 000 | | R51 300 + 30% of the | | R258 751 - R358 110 | | R53 096 + 30% of the |
| | amount above R250 000 | | | | amount above R258 750 |
R346 001 - R484 000 | | R80 100 + 35% of the | | R358 111 - R500 940 | | R82 904 + 35% of the |
| | amount above R346 000 | | | | amount above R358 110 |
R484 001 - R617 000 | | R128 400 + 38% of the | | R500 941 - R638 600 | | R132 894 + 38% of the |
| | amount above R484 000 | | | | amount above R500 940 |
R617 001 | | R178 940 + 40% of the | | R638 601 | | R185 205 + 40% of the |
| | amount above R617 000 | | | | amount above R638 600 |
Rebates | | | | Rebates | | |
Primary | | R11 440 | | Primary | | R12 080 |
Secondary | | R6 390 | | Secondary | | R6 750 |
Tertiary | | R2 130 | | Tertiary | | R2 250 |
| | | |
Tax threshold | | | | Tax threshold | | |
Below age 65 | | R63 556 | | Below age 65 | | R67 111 |
Age 65 and over | | R99 056 | | Age 65 and over | | R104 611 |
Age 75 and over | | R110 889 | | Age 75 and over | | R117 111 |
Table C.4 Medical scheme contributions, 2012/13 – 2013/14
| | | | |
| | | Illustrative thresholds | | Proposed thresholds |
Description | | 2012/13 | | 2013/14 |
Medical scheme fees tax credit, in respect of benefits to the taxpayer | | R230 | | R242 |
Medical scheme fees tax credit, in respect of benefits to the taxpayer and one dependant | | R460 | | R484 |
Medical scheme fees tax credit, in respect of benefits to each additional dependant | | R154 | | R162 |
Table C.5 Employee-related fringe benefits, 2012/13 – 2013/14
| | | | |
| | | Illustrative thresholds | | Proposed thresholds |
Description | | 2012/13 | | 2013/14 |
Employee accommodation | | R63 556 | | R67 111 |
180
ANNEXURE C: MISCELLANEOUS TAX AMENDMENTS
Table C.6 Miscellaneous proposals, 2012/13 – 2013/14
| | | | |
| | | Illustrative thresholds | | Proposed thresholds |
Description | | 2012/13 | | 2013/14 |
Low-cost housing | | | | |
Max cost of residential unit where that residential unit is an apartment in a building, paragraph (a) | | R250 000 | | R350 000 |
Max cost of residential unit where that residential unit is an apartment in a building, paragraph (b) | | R200 000 | | R300 000 |
Exempt scholarships and bursaries | | | | |
Annual income ceiling for employees | | R100 000 | | R200 000 |
Annual ceiling for bursaries to employee relatives – higher education | | R10 000 | | R30 000 |
Annual ceiling for bursaries to employee relatives – basic education | | R10 000 | | R10 000 |
The proposed tax schedule in Table C.3 largely compensates individuals for the effect of inflation on income tax liabilities and results in reduced tax liability for all taxpayers. These tax reductions are set out in tables C.7, C.8 and C.9. The average tax rates (tax as a percentage of taxable income) for individuals are illustrated in figures C.1, C.2 and C.3.
Table C.7 Income tax payable, 2013/14 (taxpayers below age 65)
| | | | | | | | | | | | | | | | |
| Taxable income | | 2012 rates | | | Proposed rates | | | Tax deduction | | | % | |
(Rands) | | (Rands) | | | (Rands) | | | (Rands) | | | reduction | |
75 000 | | | 2 060 | | | | 1 420 | | | | -640 | | | | -31.1 | % |
80 000 | | | 2 960 | | | | 2 320 | | | | -640 | | | | -21.6 | % |
85 000 | | | 3 860 | | | | 3 220 | | | | -640 | | | | -16.6 | % |
90 000 | | | 4 760 | | | | 4 120 | | | | -640 | | | | -13.4 | % |
100 000 | | | 6 560 | | | | 5 920 | | | | -640 | | | | -9.8 | % |
120 000 | | | 10 160 | | | | 9 520 | | | | -640 | | | | -6.3 | % |
150 000 | | | 15 560 | | | | 14 920 | | | | -640 | | | | -4.1 | % |
200 000 | | | 27 360 | | | | 26 328 | | | | -1 032 | | | | -3.8 | % |
250 000 | | | 39 860 | | | | 38 828 | | | | -1 032 | | | | -2.6 | % |
300 000 | | | 54 860 | | | | 53 391 | | | | -1 469 | | | | -2.7 | % |
400 000 | | | 87 560 | | | | 85 486 | | | | -2 075 | | | | -2.4 | % |
500 000 | | | 123 040 | | | | 120 486 | | | | -2 555 | | | | -2.1 | % |
750 000 | | | 220 700 | | | | 217 685 | | | | -3 015 | | | | -1.4 | % |
1 000 000 | | | 320 700 | | | | 317 685 | | | | -3 015 | | | | -0.9 | % |
181
2013 BUDGET REVIEW
Figure C.1 Average tax rates for taxpayers under age 65
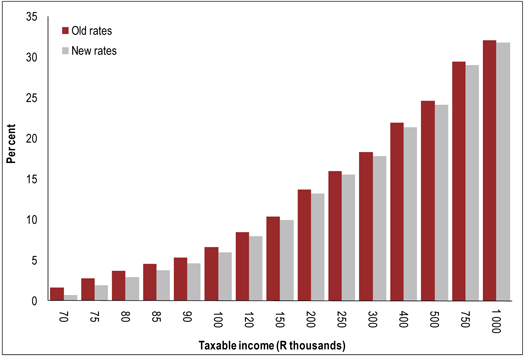
Table C.8 Income tax payable, 2013/14 (taxpayers age 65 and over)
| | | | | | | | | | | | | | | | |
| Taxable income | | 2012 rates | | | Proposed rates | | | Tax deduction | | | % | |
(Rands) | | (Rands) | | | (Rands) | | | (Rands) | | | reduction | |
120 000 | | | 3 770 | | | | 2 770 | | | | -1 000 | | | | -26.5 | % |
150 000 | | | 9 170 | | | | 8 170 | | | | -1 000 | | | | -10.9 | % |
200 000 | | | 20 970 | | | | 19 578 | | | | -1 392 | | | | -6.6 | % |
250 000 | | | 33 470 | | | | 32 078 | | | | -1 392 | | | | -4.2 | % |
300 000 | | | 48 470 | | | | 46 641 | | | | -1 829 | | | | -3.8 | % |
400 000 | | | 81 170 | | | | 78 736 | | | | -2 435 | | | | -3.0 | % |
500 000 | | | 116 650 | | | | 113 736 | | | | -2 915 | | | | -2.5 | % |
750 000 | | | 214 310 | | | | 210 935 | | | | -3 375 | | | | -1.6 | % |
1 000 000 | | | 314 310 | | | | 310 935 | | | | -3 375 | | | | -1.1 | % |
182
ANNEXURE C: MISCELLANEOUS TAX AMENDMENTS
Figure C.2 Average tax rates for taxpayers age 65 and over
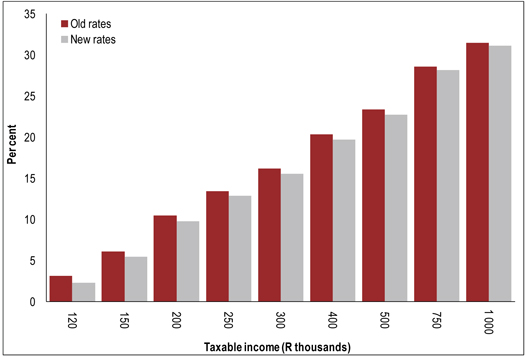
Table C.9 Income tax payable, 2013/14 (taxpayers age 75 and over)
| | | | | | | | | | | | | | | | |
| Taxable income | | 2012 rates | | | Proposed rates | | | Tax deduction | | | % | |
(Rands) | | (Rands) | | | (Rands) | | | (Rands) | | | reduction | |
120 000 | | | 1 640 | | | | 520 | | | | -1 120 | | | | -68.3 | % |
150 000 | | | 7 040 | | | | 5 920 | | | | -1 120 | | | | -15.9 | % |
200 000 | | | 18 840 | | | | 17 328 | | | | -1 512 | | | | -8.0 | % |
250 000 | | | 31 340 | | | | 29 828 | | | | -1 512 | | | | -4.8 | % |
300 000 | | | 46 340 | | | | 44 391 | | | | -1 949 | | | | -4.2 | % |
400 000 | | | 79 040 | | | | 76 486 | | | | -2 555 | | | | -3.2 | % |
500 000 | | | 114 520 | | | | 111 486 | | | | -3 035 | | | | -2.6 | % |
750 000 | | | 212 180 | | | | 208 685 | | | | -3 495 | | | | -1.6 | % |
1 000 000 | | | 312 180 | | | | 308 685 | | | | -3 495 | | | | -1.1 | % |
183
2013 BUDGET REVIEW
Figure C.3 Average tax rates for taxpayers age 75 and over
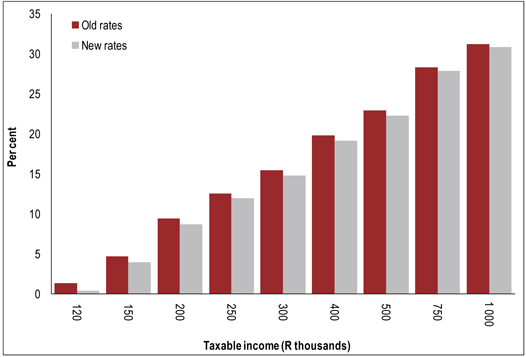
It is proposed that the customs and excise duties in the Customs and Excise Act (schedule 1, part 2 of section A) be amended with effect from 27 February 2013 to the extent shown in Table C.10.
184
ANNEXURE C: MISCELLANEOUS TAX AMENDMENTS
Table C.10 Specific excise duties, 2012/13 – 2013/14
| | | | | | | | |
Tariff Item | | Tariff
subheading | | Article description | | 2012
Rate of excise
duty | | 2013
Rate of excise
duty |
| 104.00 | | | | PREPARED FOODSTUFFS; BEVERAGES, SPIRITS AND VINEGAR; TOBACCO | | | | |
| 104.01 | | 19.01 | | Malt extract; food preparations of flour, groats, meal, starch or malt extract, not containing cocoa or containing less than 40 per cent by mass of cocoa calculated on a totally defatted basis, not elsewhere specified or included; food preparations of goods of headings 04.01 to 04.04, not containing cocoa or containing less than 5 per cent by mass of cocoa calculated on a totally defatted basis not elsewhere specified or included: | | | | |
| 104.01.10 | | 1901.90.20 | | Traditional African beer powder as defined in Additional Note 1 to Chapter 19 | | 34.7c/kg | | 34.7c/kg |
| 104.10 | | 22.03 | | Beer made from malt: | | | | |
| 104.10.10 | | 2203.00.05 | | Traditional African beer as defined in Additional Note 1 to Chapter 22 | | 7.82c/li | | 7.82c/li |
| 104.10.20 | | 2203.00.90 | | Other | | R59.36/li aa | | R63.81/li aa |
| 104.15 | | 22.04 | | Wine of fresh grapes, including fortified wines; grape must (excluding that of heading 20.09): | | | | |
| 104.15.01 | | 2204.10 | | Sparkling wine | | R7.53/li | | R8.28/li |
| 104.15 | | 2204.21 | | In containers holding 2 li or less: | | | | |
| 104.15 | | 2204.21.4 | | Unfortified wine: | | | | |
| 104.15.03 | | 2204.21.41 | | With an alcoholic strength of at least 6.5 per cent by volume but not exceeding 16.5 per cent by vol. | | R2.50/li | | R2.70/li |
| 104.15.04 | | 2204.21.42 | | Other | | R111.64/li aa | | R122.80/li aa |
| 104.15 | | 2204.21.5 | | Fortified wine: | | | | |
| 104.15.05 | | 2204.21.51 | | With an alcoholic strength of at least 15 per cent by volume but not exceeding 22 per cent by vol. | | R4.59/li | | R4.85/li |
| 104.15.06 | | 2204.21.52 | | Other | | R111.64/li aa | | R122.80/li aa |
| 104.15 | | 2204.29 | | Other: | | | | |
| 104.15 | | 2204.29.4 | | Unfortified wine: | | | | |
| 104.15.07 | | 2204.29.41 | | With an alcoholic strength of at least 6.5 per cent by volume but not exceeding 16.5 per cent by vol. | | R2.50/li | | R2.70/li |
| 104.15.08 | | 2204.29.42 | | Other | | R111.64/li aa | | R122.80/li aa |
| 104.15 | | 2204.29.5 | | Fortified wine: | | | | |
| 104.15.09 | | 2204.29.51 | | With an alcoholic strength of at least 15 per cent by volume but not exceeding 22 per cent by vol. | | R4.59/li | | R4.85/li |
| 104.15.10 | | 2204.29.52 | | Other | | R111.64/li aa | | R122.80/li aa |
| 104.16 | | 22.05 | | Vermouth and other wine of fresh grapes flavoured with plants or aromatic substances: | | | | |
| 104.16 | | 2205.10 | | In containers holding 2 li or less: | | | | |
| 104.16.01 | | 2205.10.10 | | Sparkling | | R7.53/li | | R8.28/li |
| 104.16 | | 2205.10.2 | | Unfortified: | | | | |
| 104.16.03 | | 2205.10.21 | | With an alcoholic strength of at least 6.5 per cent by volume but not exceeding 15 per cent by vol. | | R2.50/li | | R2.70/li |
| 104.16.04 | | 2205.10.22 | | Other | | R111.64/li aa | | R122.80/li aa |
| 104.16 | | 2205.10.3 | | Fortified: | | | | |
| 104.16.05 | | 2205.10.31 | | With an alcoholic strength of at least 15 per cent by volume but not exceeding 22 per cent by vol. | | R4.59/li | | R4.85/li |
| 104.16.06 | | 2205.10.32 | | Other | | R111.64/li aa | | R122.80/li aa |
| 104.16 | | 2205.90 | | Other: | | | | |
| 104.16 | | 2205.90.2 | | Unfortified: | | | | |
| 104.16.09 | | 2205.90.21 | | With an alcoholic strength of at least 6.5 per cent by volume but not exceeding 15 per cent by vol. | | R2.50/li | | R2.70/li |
| 104.16.10 | | 2205.90.22 | | Other | | R111.64/li aa | | R122.80/li aa |
185
2013 BUDGET REVIEW
Table C.10 Specific excise duties, 2012/13 – 2013/14 (continued)
| | | | | | | | |
Tariff Item | | Tariff
subheading | | Article description | | 2012
Rate of excise
duty | | 2013
Rate of excise
duty |
| 104.16 | | 2205.90.3 | | Fortified: | | | | |
| 104.16.11 | | 2205.90.31 | | With an alcoholic strength of at least 15 per cent by volume but not exceeding 22 per cent by vol. | | R4.59/li | | R4.85/li |
| 104.16.12 | | 2205.90.32 | | Other | | R111.64/li aa | | R122.80/li aa |
| 104.17 | | 22.06 | | Other fermented beverages (for example, cider, perry and mead); mixtures of fermented beverages and mixtures of fermented beverages and non-alcoholic beverages, not elsewhere specified or included: | | | | |
| 104.17.03 | | 2206.00.05 | | Sparkling fruit beverages and sparkling mead | | R7.53/li | | R8.28/li |
| 104.17.05 | | 2206.00.15 | | Traditional African beer as defined in Additional Note 1 to Chapter 22 | | 7.82c/li | | 7.82c/li |
| 104.17.07 | | 2206.00.17 | | Other fermented beverages, unfortified, with an alcoholic strength below 2.5 per cent by vol. | | R59.36/li aa | | R63.81/li aa |
| 104.17.15 | | 2206.00.81 | | Other fermented apple or pear beverages, unfortified, with an alcoholic strength of at least 2.5 per cent by volume but not exceeding 15 per cent by vol. | | R2.97c/li | | R3.19c/li |
| 104.17.16 | | 2206.00.82 | | Other fermented fruit beverages and mead beverages, including mixtures of fermented beverages derived from the fermentation of fruit or honey, unfortified, with an alcoholic strength of at least 2.5 per cent by volume but not exceeding 15 per cent by vol. | | R2.97c/li | | R3.19c/li |
| 104.17.17 | | 2206.00.83 | | Other fermented apple or pear beverages, fortified, with an alcoholic strength of at least 15 per cent by volume but not exceeding 23 per cent by vol. | | R45.60/li aa | | R50.16/li aa |
| 104.17.21 | | 2206.00.84 | | Other fermented fruit beverages and mead beverages including mixtures of fermented beverages derived from the fermentation of fruit or honey, fortified, with an alcoholic strength of at least 15 per cent by volume but not exceeding 23 per cent by vol. | | R45.60/li aa | | R50.16/li aa |
| 104.17.22 | | 2206.00.85 | | Other mixtures of fermented fruit beverages or mead beverages and non-alcoholic beverages, unfortified, with an alcoholic strength of at least 2.5 per cent by volume but not exceeding 15 per cent by vol. | | R2.97c/li | | R3.19c/li |
| 104.17.25 | | 2206.00.87 | | Other mixtures of fermented fruit beverages or mead beverages and non-alcoholic beverages, fortified, with an alcoholic strength of at least 15 per cent by volume but not exceeding 23 per cent by vol. | | R45.60/li aa | | R50.16/li aa |
| 104.17.90 | | 2206.00.90 | | Other | | R59.36/li aa | | R63.81/li aa |
| 104.21 | | 22.07 | | Undenatured ethyl alcohol of an alcoholic strength by volume of 80 per cent vol. or higher; ethyl alcohol and other spirits, denatured, of any strength: | | | | |
| 104.21.01 | | 2207.10 | | Undenatured ethyl alcohol of an alcoholic strength by volume of 80 per cent vol. or higher | | R111.64/li aa | | R122.80/li aa |
| 104.21.03 | | 2207.20 | | Ethyl alcohol and other spirits, denatured of any strength | | R111.64/li aa | | R122.80/li aa |
| 104.23 | | 22.08 | | Undenatured ethyl alcohol of an alcoholic strength by volume of less than 80 per cent vol.; spirits, liqueurs and other spirituous beverages: | | | | |
| 104.23 | | 2208.20 | | Spirits obtained by distilling grape wine or grape marc: | | | | |
| 104.23.01 | | 2208.20.10 | | In containers holding 2 li or less | | R111.64/li aa | | R122.80/li aa |
| 104.23.03 | | 2208.20.90 | | Other | | R111.64/li aa | | R122.80/li aa |
| 104.23 | | 2208.30 | | Whiskies: | | | | |
| 104.23.05 | | 2208.30.10 | | In containers holding 2 li or less | | R111.64/li aa | | R122.80/li aa |
| 104.23.07 | | 2208.30.90 | | Other | | R111.64/li aa | | R122.80/li aa |
| 104.23 | | 2208.40 | | Rum and other spirits obtained by distilling fermented sugarcane products: | | | | |
| 104.23.09 | | 2208.40.10 | | In containers holding 2 li or less | | R111.64/li aa | | R122.80/li aa |
| 104.23.11 | | 2208.40.90 | | Other | | R111.64/li aa | | R122.80/li aa |
186
ANNEXURE C: MISCELLANEOUS TAX AMENDMENTS
Table C.10 Specific excise duties, 2012/13 – 2013/14 (continued)
| | | | | | | | |
Tariff Item | | Tariff
subheading | | Article description | | 2012
Rate of excise
duty | | 2013
Rate of excise
duty |
| 104.23 | | 2208.50 | | Gin and Geneva: | | | | |
| 104.23.13 | | 2208.50.10 | | In containers holding 2 li or less | | R111.64/li aa | | R122.80/li aa |
| 104.23.15 | | 2208.50.90 | | Other | | R111.64/li aa | | R122.80/li aa |
| 104.23 | | 2208.60 | | Vodka: | | | | |
| 104.23.17 | | 2208.60.10 | | In containers holding 2 li or less | | R111.64/li aa | | R122.80/li aa |
| 104.23.19 | | 2208.60.90 | | Other | | R111.64/li aa | | R122.80/li aa |
| 104.23 | | 2208.70 | | Liqueurs and cordials: | | | | |
| 104.23 | | 2208.70.2 | | In containers holding 2 li or less: | | | | |
| 104.23.21 | | 2208.70.21 | | With an alcoholic strength by volume exceeding 15 per cent vol. but not exceeding 23 per cent vol. | | R45.60/li aa | | R50.16/li aa |
| 104.23.22 | | 2208.70.22 | | Other | | R111.64/li aa | | R122.80/li aa |
| 104.23 | | 2208.70.9 | | Other: | | | | |
| 104.23.23 | | 2208.70.91 | | With an alcoholic strength by volume exceeding 15 per cent vol. but not exceeding 23 per cent vol. | | R45.60/li aa | | R50.16/li aa |
| 104.23.24 | | 2208.70.92 | | Other | | R111.64/li aa | | R122.80/li aa |
| 104.23 | | 2208.90 | | Other: | | | | |
| 104.23 | | 2208.90.2 | | In containers holding 2 li or less: | | | | |
| 104.23.25 | | 2208.90.21 | | With an alcoholic strength by volume exceeding 15 per cent vol. but not exceeding 23 per cent vol. | | R45.60/li aa | | R50.16/li aa |
| 104.23.26 | | 2208.90.22 | | Other | | R111.64/li aa | | R122.80/li aa |
| 104.23 | | 2208.90.9 | | Other: | | | | |
| 104.23.27 | | 2208.90.91 | | With an alcoholic strength by volume exceeding 15 per cent vol. but not exceeding 23 per cent vol. | | R45.60/li aa | | R50.16/li aa |
| 104.23.28 | | 2208.90.92 | | Other | | R111.64/li aa | | R122.80/li aa |
| 104.30 | | 24.02 | | Cigars, cheroots, cigarillos and cigarettes, of tobacco or of tobacco substitutes: | | | | |
| 104.30 | | 2402.10 | | Cigars, cheroots and cigarillos containing tobacco: | | | | |
| 104.30.01 | | 2402.10.10 | | Imported from Switzerland | | R2 306.48/kg
net | | R2 467.83/kg
net |
| 104.30.03 | | 2402.10.90 | | Other | | R2 306.48/kg
net | | R2 467.83/kg
net |
| 104.30 | | 2402.20 | | Cigarettes containing tobacco: | | | | |
| 104.30.05 | | 2402.20.10 | | Imported from Switzerland | | R5.16/10
cigarettes | | R5.46/10
cigarettes |
| 104.30.07 | | 2402.20.90 | | Other | | R5.16/10
cigarettes | | R5.46/10
cigarettes |
| 104.30 | | 2402.90.1 | | Cigars, cheroots and cigarillos of tobacco substitutes: | | | | |
| 104.30.09 | | 2402.90.12 | | Imported from Switzerland | | R2 306.48/kg
net | | R2 467.83/kg
net |
| 104.30.11 | | 2402.90.14 | | Other | | R2 306.48/kg
net | | R2 467.83/kg
net |
| 104.30 | | 2402.90.2 | | Cigarettes of tobacco substitutes: | | | | |
| 104.30.13 | | 2402.90.22 | | Imported from Switzerland | | R5.16/10
cigarettes | | R5.46/10
cigarettes |
| 104.30.15 | | 2402.90.24 | | Other | | R5.16/10
cigarettes | | R5.46/10
cigarettes |
| 104.30 | | 2402.90.1 | | Cigars, cheroots and cigarillos of tobacco substitutes: | | | | |
| 104.30.09 | | 2402.90.12 | | Imported from Switzerland | | R2 306.48/kg
net | | R2 467.83/kg
net |
| 104.30.11 | | 2402.90.14 | | Other | | R2 306.48/kg
net | | R2 467.83/kg
net |
187
2013 BUDGET REVIEW
Table C.10 Specific excise duties, 2012/13 – 2013/14 (continued)
| | | | | | | | |
Tariff Item | | Tariff
subheading | | Article description | | 2012
Rate of excise
duty | | 2013
Rate of excise
duty |
| 104.30 | | 2402.90.2 | | Cigarettes of tobacco substitutes: | | | | |
| 104.30.13 | | 2402.90.22 | | Imported from Switzerland | | R5.16/10
cigarettes | | R5.46/10
cigarettes |
| 104.30.15 | | 2402.90.24 | | Other | | R5.16/10
cigarettes | | R5.46/10
cigarettes |
| 104.35 | | 24.03 | | Other manufactured tobacco and manufactured tobacco substitutes; “homogenised” or “reconstituted” tobacco; tobacco extracts and essences: | | | | |
| 104.35 | | 2403.1 | | Smoking tobacco, whether or not containing tobacco substitutes in any proportion: | | | | |
| 104.35.01 | | 2403.11 | | Water pipe tobacco specified in Subheading Note 1 to Chapter 24 | | R128.69/kg net | | R141.60/kg net |
| 104.35 | | 2403.19 | | Other: | | | | |
| 104.35.02 | | 2403.19.10 | | Pipe tobacco, in immediate packings of a content of less than 5 kg | | R128.69/kg net | | R141.60/kg net |
| 104.35.03 | | 2403.19.20 | | Other pipe tobacco | | R128.69/kg net | | R141.60/kg net |
| 104.35.05 | | 2403.19.30 | | Cigarette tobacco | | R221.04/kg | | R243.20/kg |
| 104.35 | | 2403.99 | | Other: | | | | |
| 104.35.07 | | 2403.99.30 | | Other cigarette tobacco substitutes | | R221.04/kg | | R243.20/kg |
| 104.35.09 | | 2403.99.40 | | Other pipe tobacco substitutes | | R128.69/kg net | | R141.60/kg net |
Excise duties of fruit fermented beverages
The structure of tariff heading 22.06 has been amended to align the excise duty provisions for fruit fermented beverages with the requirements of the Liquor Products Act (1989). As a result, only products that are predominantly fruit fermented will be distinctly classified in this beverage category. Fermented products that are not mainly derived from fruit will be included in the band for beverages with an alcoholic strength below 2.5 per cent or in the generic “other” band. The other band uses the highest excise rate – the full spirits rate – to encourage products to comply with the requirements for fruit fermented beverages. However, as current manufacturers may need time to comply with the requirements for fruit fermentation, the other band will only be increased to the highest spirits rate in Budget 2014. These changes necessitate corresponding amendments to part 1 of schedule 1 of the Customs and Excise Act, as indicated in Table C.11.
188
ANNEXURE C: MISCELLANEOUS TAX AMENDMENTS
Table C.11 Amendment of part 1 of schedule 1
By the insertion of additional note 5 to chapter 22 in part 1 of schedule 1 with the following
| 5. | For the purposes of heading 22.06 – |
| (a) | Not more than 20 per cent of the fermentable sugars used in any fermented fruit beverage, fortified or unfortified, may be of an origin other than fruit. |
| (b) | Subject to paragraph (c)(iii) and (c)(iv) below, fortified apple or fortified pear beverages shall be fortified by the addition of a rectified spirits derived from apples or pears respectively. |
| (c) | Not more than 25 per cent of the final volume of – |
| (i) | Fermented apple beverages shall consist of fruit juice derived from pears or added fermented pear beverages. |
| (ii) | Fermented pear beverages shall consist of fruit juice derived from apples or added fermented apple beverages. |
| (iii) | Fortified fermented apple beverages shall consist of fruit juice derived from pears, or added fermented pear beverages or fortified fermented pear beverages. |
| (iv) | Fortified fermented pear beverages shall consist of fruit juice derived from apples, or added fermented apple beverages, or fortified fermented apple beverages. |
| | | | | | | | | | | | | | | | | | | | | | | | | | |
By the insertion of the following: | | | | | | | | Rate of duty | |
Heading | | Subheading | | Check
digit | | Article description | | Statistical
unit | | | General | | | European
Union | | | European
Free Trade
Association | | | Southern
African
Develop–
ment
Community | |
| 22.06 | | 2206.00.17 | | 7 | | Other fermented beverages, unfortified, with an alcoholic strength below 2.5 per cent vol. | | | li | | | | 25 | % | | | free | | | | 25 | % | | | free | |
| 22.06 | | 2206.00.84 | | 3 | | Other fermented fruit beverages and mead beverages including mixtures of fermented beverages derived from the fermentation of fruit or honey, fortified, with an alcoholic strength of at least 15 per cent by volume but not exceeding 23 per cent by vol. | | | li | | | | 25 | % | | | free | | | | 25 | % | | | free | |
| | | |
By the substitution of the following: | | | | | | | | Rate of duty | |
Heading | | Subheading | | Check
digit | | Article description | | Statistical
unit | | | General | | | European
Union | | | European
Free Trade
Association | | | Southern
African
Develop–
ment
Community | |
| 22.06 | | 2206.00.05 | | 3 | | Sparkling fruit beverages and sparkling mead | | | li | | | | 25 | % | | | free | | | | 25 | % | | | free | |
| 22.06 | | 2206.00.15 | | 0 | | Traditional African beer as defined in Additional Note 1 to Chapter 22 | | | li | | | | 25 | % | | | free | | | | 25 | % | | | free | |
| 22.06 | | 2206.00.81 | | 9 | | Other fermented apple or pear beverages, unfortified, with an alcoholic strength of at least 2.5 per cent by volume but not exceeding 15 per cent by vol. | | | li | | | | 25 | % | | | free | | | | 25 | % | | | free | |
| 22.06 | | 2206.00.82 | | 7 | | Other fermented fruit beverages and mead beverages, including mixtures of fermented beverages derived from the fermentation of fruit or honey, unfortified, with an alcoholic strength of at least 2.5 per cent by volume but not exceeding 15 per cent by vol. | | | li | | | | 25 | % | | | free | | | | 25 | % | | | free | |
| 22.06 | | 2206.00.83 | | 5 | | Other fermented apple or pear beverages, fortified, with an alcoholic strength of at least 15 per cent by volume but not exceeding 23 per cent by vol. | | | li | | | | 25 | % | | | free | | | | 25 | % | | | free | |
| 22.06 | | 2206.00.85 | | 1 | | Other mixtures of fermented fruit beverages or mead beverages and non-alcoholic beverages, unfortified, with an alcoholic strength of at least 2.5 per cent by volume but not exceeding 15 per cent by vol. | | | li | | | | 25 | % | | | free | | | | 25 | % | | | free | |
| 22.06 | | 2206.00.87 | | 8 | | Other mixtures of fermented fruit beverages or mead beverages and non-alcoholic beverages, fortified, with an alcoholic strength of at least 15 per cent by volume but not exceeding 23 per cent by vol. | | | li | | | | 25 | % | | | free | | | | 25 | % | | | free | |
| 22.06 | | 2206.00.90 | | 8 | | Other | | | li | | | | 25 | % | | | free | | | | 25 | % | | | free | |
189
2013 BUDGET REVIEW
Ad valorem excise duties
It is proposed that video recorders of item 124.55.01, with eight or more input channels and a value for duty purposes exceeding R13 000, be exempted from ad valorem excise duties with effect from 1 April 2013. The exemption will only remove industrial type recorders from the ad valorem tax base, as the value differs vastly between these and household-type recorders.
| ¢ | Miscellaneous tax amendments |
Miscellaneous tax amendments proposed for the upcoming tax legislative cycle are set out below.
Individuals, employment and savings
Cross-border remuneration and retirement savings
Cross-border salaries and retirement savings give rise to special issues.
| | • | | Cross-border services: South African residents are generally subject to worldwide tax, except for long-term services provided offshore (for example, for at least 183 days or more in any 12 month period). At issue is whether the worldwide tax regime of South African services should be extended (subject to appropriate credits), especially if a South African employer is involved. |
| | • | | Cross-border pensions: South African residents working abroad and foreign residents working in South Africa regularly contribute to local and foreign pension funds, which gives rise to a variety of tax issues. While certain limited rules have long been in place, these rules are largely ad hoc. With overall retirement reform now in effect, cross-border pension issues need to be fully reconsidered. The main issue is whether the tax focus should rely solely on the national source of the services provided or the national origin of the pension fund serving as the savings vehicle. |
Given the complexity of the issues involved, extensive consultation is required. Possible legislative action may occur if consensus is easily achieved (such as neutralising any unintended differences between cross-border lump sum payouts and annuities).
Business (general)
Share cross-issues
Share cross-issues have longstanding anti-avoidance rules. These rules prevent taxpayers from obtaining any tax cost when issuing shares for the cross-issue of other shares, because the cross-issue does not trigger tax for any party (justifying a rollover result at zero tax cost). Unfortunately, these rules are impractical in South Africa, because cross-issues are a common feature of many commercially driven share schemes (especially involving black economic empowerment). In addition, cross-issues can also be used to migrate offshore without incurring an exit charge. To mitigate these problems, the anti-avoidance cross-issue rules will be completely reworked. The zero base cost rule will either be eliminated or narrowed. Cross-issues (and share-for-share transactions) acting as a mechanism to indirectly shift value into tax-exempt hands will trigger immediate taxation.
Business (financial institutions)
Banks and brokers
In 2012, mark-to-market taxation was legislatively added to income tax, but the effective date was deferred until 2014. This legislation will be refined based on further consultations. The main refinements are as follows:
| | • | | Covered persons will be extended to include most of the companies in regulated banking groups to reduce the potential for mismatches between the new mark-to-market system and the historic system of realisation. |
190
ANNEXURE C: MISCELLANEOUS TAX AMENDMENTS
| | • | | Rules to prevent artificial losses from dividend transactions. |
| | • | | Assets and liabilities will be disregarded to the extent that they are not recognised under relevant international financial reporting standards (IFRS). |
| | • | | Different treatment of impairment of financial assets for accounting and bad and doubtful debt for tax purposes are under consideration. |
Revised treatment of captive insurers
In 2012, a new set of rules were proposed that deny deductions for payments of insurance premiums to short-term insurers if the overall arrangement lacks any significant risk transfer. Risk transfer was measured from an IFRS perspective as opposed to a legal perspective. While these rules were conceptually correct, the focus of the risk transfer should have been on the policyholder, not the insurer. In addition, concerns continue to exist that dividends from captive insurers most likely represent the recoupment of previous reserved amounts as opposed to dividends from underlying taxable profits. The anti-avoidance rules in this area will be revised accordingly. These anti-avoidance rules will also be extended to long-term insurer policyholders that pay premiums to reinsurers in respect of reinsurance that similarly lacks a significant element of risk transfer.
Financial intermediaries and securities transfer tax
Unlike the London Stock Exchange, only brokers can be members of the JSE and receive exemption from the securities transfer tax (STT). Other financial intermediaries, such as banks, do not receive comparable relief. This lack of relief for financial intermediaries inadvertently disrupts intermediary transactions where profits are small, because the STT potentially eliminates (or even exceeds) all intermediary profits. It is accordingly proposed that certain intermediaries be exempt from the STT so that transacting on the JSE remains internationally competitive.
Business (incentives)
Streamlining the oil and gas incentive
Oil and gas tax incentives were finalised in 2006 as part of the overall changes associated with the Mineral and Petroleum Resources Development Act (2002). With regulatory approvals now fully under way, a series of minor issues have emerged that could be streamlined for easier enforcement and compliance. In addition, certain anomalies have emerged that have left new entrants in a worse position than previous stakeholders. These anomalies will be removed and a uniform system of fiscal stability agreements will be developed.
Tenant improvements to landlord land
Many sophisticated commercial tenants undertake substantial improvements (or wholesale construction) on the fixed property of a landlord, especially in the case of long-term leases. However, none of these improvements are depreciable because depreciation is generally allowed only on “owned” property, and tenant improvements are not technically owned by the tenant. This lack of depreciation is complicating many commercial arrangements. It is proposed that the ownership test for depreciation be replaced with “possession and use”. Associated amendments to the taxation of the lessor and treatment of leasehold improvements will be effected.
Ancillary aspects to pipelines
As pipelines are depreciable, ancillary equipment such as electrical wiring and certain related components will be depreciable to the same extent as the underlying pipelines.
191
2013 BUDGET REVIEW
Clarification of trading stock cost calculations
The cost price of trading stock is currently calculated in line with generally accepted accounting practices, approved by the South African Revenue Service (SARS). Given recent changes to IFRS, it is proposed that the cost price of trading stock automatically comport to IFRS without the need for SARS approval.
Closure of unintended claims for the research and development incentive
Although the research and development incentive was recently adjusted, information has come to light that it is still being misused. The incentive aims to facilitate South Africa’s establishment as an innovation hub by global standards. It is not intended to assist in routine upgrades or standard adjustments to match global competition. The criteria for eligibility will be adjusted to ensure that the incentive is available only in support of the initial policy intention.
Mining dewatering association
Although the tax system contains an exemption for mining rehabilitation entities, a comparable exemption does not exist for a mining dewatering association, which restores water levels adversely impacted by mining. This association is funded by several mining houses in a manner similar to a mining rehabilitation fund. The exemption of this association is under consideration.
Incentives for the construction of affordable housing
A tax incentive is under consideration for developers (and employers) to build new housing stock (at least five units in compliance with prescribed standards) for sale below R300 000 per dwelling. This incentive would address challenges faced by households in the “gap market”. An exclusion of R60 000 per qualifying house sold is proposed.
International
Deferral of expenditure incurred by certain connected persons
The tax system triggers income upon receipt or accrual, as well as deductible expenditure based on payment or incurral. While this system is largely appropriate, taxpayers have an incentive to accelerate deductions on incurred expenditure if a connected counterparty lacks immediate (or deferred) corresponding income. This situation often arises in the case of a South African subsidiary when expenditure is incurred in relation to a foreign parent company. To limit potential abuse, deductions will be deferred until payment.
Further easing of cross-border anomalies
Over the past several years, a number of amendments have been undertaken to eliminate double taxation in the case of South African investment into offshore active operations. While most of the issues have been resolved, certain concerns remain, such as complexities associated with the calculation of the acceptably taxed exemption, the threshold for the participation exemption and transfer pricing requirements in management activities for the benefit of foreign branches. Headquarter company relief also needs to be refined to ensure it is more effective and easier to understand. These anomalies will be removed.
Gateway subsidiary
It is not uncommon for South African multinationals to use an offshore subsidiary as a treasury operation. Unlike local treasuries, offshore treasuries can freely move currency without regulatory approvals, creating an incentive to move offshore. To eliminate this incentive, listed South African multinationals will be allowed to treat a single local subsidiary as a non-resident company for Reserve Bank purposes, so treasury operations can remain within South Africa. In addition, these entities can use their foreign functional currency, rather than the rand, as the starting point for tax calculations.
192
ANNEXURE C: MISCELLANEOUS TAX AMENDMENTS
Controlled foreign company activities
Imputation for controlled foreign companies should theoretically apply only in the case of passive income and certain forms of income likely to lead to transfer pricing avoidance (known as diversionary income). Although the current rules achieve this result in most cases, certain anomalies have arisen over the years that require clarification. In particular, active offshore research and development activities appear to be inadvertently falling within the net, as well as international shipping activities, international pipelines and commodity hedges associated with active operations. It is also a concern that intra-controlled foreign companies’ insurance premiums are not receiving the same relief as their other payments. These anomalies will be removed.
Removal of source focus for initial copyright authors
Under current law, the initial author of a copyright is exempt from tax on a foreign source of income if that source is subject to foreign tax. This relief was initially enacted in line with source principles many years ago. With the shift to worldwide taxation in 2001, this relief no longer makes sense and should be removed.
Streamlining currency taxation
The current tax calculation of currency gains and losses is extremely complex and not wholly in sync with accounting principles. The currency taxation rules are being simplified in favour of a more practical approach. Changes in this area will continue along these lines, especially in regard to the capital gains tax and basic measurement methods (for example, spot versus weighted average). A longer-term shift is being considered towards an IFRS approach that simplifies the tax system without compromising enforcement.
Value-added tax
Motor cars
The current definition of “motor car” in the VAT Act excludes, among others, a vehicle capable of accommodating only one person. A racing car or cart that is acquired by a vendor partly for recreational use and partly for business use (for example, advertising purposes) falls into this exclusion. As a result, the purchase of these vehicles could qualify for a deduction of input tax, even though these cars are often used for recreational (or even normal commuting) purposes. There are no policy reasons to treat these vehicles differently from that of a normal passenger vehicle and the law will be changed accordingly.
Repossession of goods
A vendor (debtor) makes a deemed supply of goods under an instalment credit agreement to the creditor if the creditor (at their discretion) repossesses those goods. With the introduction of the National Credit Act (2005), a debtor (at the debtor’s discretion) may similarly surrender goods supplied under an instalment credit agreement. For VAT purposes, the rules should be the same regardless of whether the creditor or the debtor is exercising the discretion to surrender the goods.
Future supplies of services
A special time-of-supply rule exists for goods supplied under an agreement (excluding rental or instalment credit agreements). When the recipient takes possession of those goods and consideration for that supply cannot be determined upfront, the supply is deferred until the earlier of the dates when payments are due or received, or when an invoice is issued. A similar rule for services will be added when the consideration for that service cannot be determined upfront due to a contingent future event (for example, share price and exchange rate).
193
2013 BUDGET REVIEW
In-flight entertainment
Input tax deductions on entertainment expenditure are disallowed. However, this general prohibition does not apply in several circumstances where business objectives dominate. In-flight entertainment (movies and video games) is currently disallowed even though it is ancillary to the flight. This in-flight entertainment should accordingly not be part of the prohibition (like the meals and refreshments, which are not disallowed).
Supplies between connected persons
Special time-of-supply rules apply to transactions between connected persons. The purpose of these rules is to prevent artificial deferrals. However, no apparent reason exists for this rule to apply if the transaction gives rise to an input for the purchaser that is simultaneous with the output for the seller. Relief in this area is accordingly proposed.
Tax invoices issued in foreign currency
Under current law, a valid tax invoice must be stated in rands. However, the VAT Act does not prescribe how to deal with a scenario in which the transaction is conducted in foreign currency. This will be addressed by converting foreign currency invoices to rands at the spot rate agreed upon by the parties. In the absence of an agreement, the spot rate on the date of supply will be used.
Temporary letting of residential fixed property
Developers that use the temporary relief provisions for the letting of residential fixed property are required to furnish SARS with a declaration containing certain information within 30 days of the supply. It would be more practical and appropriate if the vendors retained the information as part of their normal recordkeeping (without being required to file a declaration with SARS).
Conversion from a share block scheme to a sectional title
The conversion of a share block company to a sectional title is considered a “non-supply” for VAT purposes (from an output tax point of view, no VAT is levied on the supply). From an input tax point of view, there is some debate on whether the shareholder is entitled to a notional input tax deduction on acquisition of the unit supplied by the share block company. This mismatch will be removed.
Home-owners association
The supply of services by a sectional title association to its members in the course of the management of the sectional title body corporate is generally exempt from VAT. However, a home-owners association lacks a similar exemption (due to previous differences in how municipalities billed sectional title body corporates versus home-owner associations). It is proposed that this unequal treatment be removed.
The right of use of fixed property
The supply of a share by a share block company falls within the definition of “fixed property” in the VAT Act and is consequently subject to VAT at the standard rate (because a share block unit is roughly equivalent to a direct interest in property). However, a cooperative that supplies membership units falls outside the VAT Act. Property cooperatives will accordingly be treated like share block companies.
Indirect exports
The export incentive scheme will be replaced by new export regulations. Legislative amendments will be required to ensure alignment.
194
ANNEXURE C: MISCELLANEOUS TAX AMENDMENTS
Imported goods – damaged or destroyed
Goods imported into South Africa are levied with VAT at the rate of 14 per cent when those goods are entered for home consumption. In terms of the Customs and Excise Act, imported goods that are destroyed, damaged or abandoned are considered to have been entered for home consumption (with a rebate of the customs duty becoming applicable). The VAT Act does not have a similar relief mechanism for goods damaged, destroyed or abandoned, which means that when those goods are entered for home consumption, VAT applies. It is proposed that comparable VAT relief be provided for goods that are destroyed, damaged or abandoned.
Pooling arrangements
Pooling arrangements are mainly applicable to the agricultural and rental markets to simplify VAT administration. To address the complexities that may emanate from the “pool” being treated as separate from its members, it is proposed that a VAT review of all pooling arrangements be undertaken, resulting in possible legislation in 2014.
Square Kilometre Array
The Square Kilometre Array, an international collaboration to build the world’s largest radio telescope, is eligible for income-tax exemption under existing public-benefit provisions. VAT relief will be provided through a refund mechanism or the zero-rating of consideration received by the project and for imported goods and services.
Mineral and petroleum royalties
The Mineral and Petroleum Resources Royalty Act (2008), which has been in operation for three years, needs to be refined. Areas of ongoing concern include the appropriate specified condition of mineral extraction acting as a reference point to calculate the mineral royalty tax base, interaction of the royalty regime rate with the income tax calculation and information reporting requirements. Concerns also exist that small business relief needs to be more administratively accessible. All of these concerns will be addressed.
Gambling tax
A national gambling tax was proposed in 2011. The tax will apply at a rate of 1 per cent of gross gambling revenue in addition to provincial rates. This legislation will be implemented by the close of 2013.
Research projects
Company restructurings
In 2012, the National Treasury (in consultation with SARS) began a series of workshops to review the tax rules relating to domestic and foreign reorganisations so that these rules can be streamlined (while continuing to safeguard against undue tax avoidance). These engagements will continue in 2013, with legislative focus on urgent matters and anomalies.
Dividend cessions and manufactured dividends
The tax impact of a dividend transfer depends on whether the transfer is a cession or a dividend compensation payment (even though the economic impact is largely the same). In the case of a cession, the dividend generally retains its tax nature. In the case of a dividend compensation payment, the payment is largely deductible by the payor and largely includible by the payee. Both sets of rules continually give rise to tax avoidance or mismatches that reduce the ultimate tax due before the economic profit. Under consideration is a single unified treatment for both forms of transfers and certain anti-avoidance rules to eliminate the shifting of income from taxable parties to exempt parties.
195
2013 BUDGET REVIEW
Relief for international shipping
In 2006, the possibility of a tonnage tax for international shipping was mooted (as a substitute for the 28 per cent income tax on companies). Upon review and extensive consultation with the industry, relief in the form of an outright exemption for shipping income appears to be the most viable option to attract international shipping, given recent trends. However, for any tax incentive to be viable, comparable relief mechanisms will be required. The National Treasury will continue to engage with other national departments to ensure that any tax incentive proposed is part of a regulatory package.
Debt relief
The payback provisions within the VAT Act seek to claw-back input tax claimed on supplies received by a vendor if the vendor has not discharged the debt for that supply within a period of 12 months. This claw-back is often onerous when debts are relieved to help the debtor avoid potential or actual insolvency. Debt relief to assist distressed debtors (such as business rescue) is under consideration. The question is whether the need for this relief can be balanced against potential misuse (deliberate input deductions without any subsequent output).
Apportionment – non-financial sectors
The default apportionment method, which is based on turnover, appears to be inequitable at times because there may not be a direct correlation between expenditure incurred versus turnover generated. It is proposed that the default application of this method be re-evaluated.
Collateral for share lending
The pension fund rules were recently amended to tighten the margin required if a borrower pledges a non-cash margin as security to a pension fund that undertakes a share lending transaction. This heightened level of security triggers income tax and the STT. Given these adverse tax consequences, the new pension margin requirements will be postponed so that they can be properly coordinated with the related tax rules.
Technical corrections
In addition to the amendments described above, the 2013 tax legislation will effect various technical corrections (as in prior years). These technical corrections mainly cover inconsequential items – typing errors, grammar, punctuation, numbering, misplaced cross-references, updating and removing obsolete provisions, the removal of superfluous text, and the incorporation of regulation and commonly accepted interpretations into formal law. Technical corrections also include changes to effective dates and the proper coordination of transitional tax changes.
A final set of technical corrections relates to modifications that account for practical implementation of the tax law. Although tax amendments go through an intensive comment and review process, new issues arise once the law is applied (including obvious omissions and ambiguities). These issues typically arise when returns are prepared for the first time after legislation is applied. Technical corrections of this nature are almost exclusively limited to recent legislative changes.
196
D
Summary of Budget
197
2013 BUDGET REVIEW
Summary of the national budget
| | | | | | | | | | | | | | | | | | | | |
| | | 2012/13 | | | 2013/14 | | | 2014/15 | | | 2015/16 | |
R million | | Budget
estimate | | | Revised
estimate | | | Budget
estimate | | | Medium-term estimates | |
REVENUE | | | | | | | | | | | | | | | | | | | | |
Estimate of revenue before tax proposals | | | | | | | | | | | 875 378 | | | | | | | | | |
Budget 2013/14 proposals: | | | | | | | | | | | | | | | | | | | | |
Taxes on individuals and companies | | | | | | | | | | | -8 242 | | | | | | | | | |
Personal income tax | | | | | | | | | | | -7 382 | | | | | | | | | |
Adjustment in personal tax rate structure | | | | | | | | | | | -7 032 | | | | | | | | | |
Adjustment in monetary thresholds | | | | | | | | | | | -350 | | | | | | | | | |
Business income tax | | | | | | | | | | | -860 | | | | | | | | | |
Employment tax incentive | | | | | | | | | | | -500 | | | | | | | | | |
Small business corporations | | | | | | | | | | | -360 | | | | | | | | | |
Indirect Taxes | | | | | | | | | | | 5 830 | | | | | | | | | |
Increase in general fuel levy | | | | | | | | | | | 3 270 | | | | | | | | | |
Increase in excise duties on tobacco products | | | | | | | | | | | 855 | | | | | | | | | |
Increase in alcoholic beverages | | | | | | | | | | | 1 210 | | | | | | | | | |
Increase in incandescent bulb levy | | | | | | | | | | | 50 | | | | | | | | | |
Increase in plastic bag levy | | | | | | | | | | | 90 | | | | | | | | | |
Increase in CO2vehicle emission tax | | | | | | | | | | | 355 | | | | | | | | | |
| | | | | | | | | | | | | | | | | | | | |
Estimate of revenue after tax proposals | | | 799 341 | | | | 782 474 | | | | 872 966 | | | | 967 923 | | | | 1 070 727 | |
Percentage change from previous year | | | | | | | | | | | 11.6 | % | | | 10.9 | % | | | 10.6 | % |
| | | | | | | | | | | | | | | | | | | | |
| | | | | |
EXPENDITURE | | | | | | | | | | | | | | | | | | | | |
Direct charges against the National Revenue Fund | | | 419 926 | | | | 424 615 | | | | 462 363 | | | | 495 591 | | | | 530 698 | |
Debt-service costs | | | 89 388 | | | | 88 325 | | | | 99 741 | | | | 108 718 | | | | 118 163 | |
Provincial equitable share | | | 309 057 | | | | 313 016 | | | | 337 572 | | | | 359 924 | | | | 383 697 | |
General fuel levy sharing with metros | | | 9 040 | | | | 9 040 | | | | 9 613 | | | | 10 190 | | | | 10 659 | |
Skills development levy and Setas | | | 9 606 | | | | 11 400 | | | | 12 403 | | | | 13 544 | | | | 14 817 | |
Other 1) | | | 2 835 | | | | 2 835 | | | | 3 032 | | | | 3 214 | | | | 3 362 | |
Appropriated by vote | | | 543 630 | | | | 542 352 | | | | 588 682 | | | | 635 890 | | | | 685 029 | |
Current payments | | | 155 803 | | | | 158 366 | | | | 168 867 | | | | 179 234 | | | | 188 386 | |
Transfers and subsidies | | | 371 010 | | | | 369 489 | | | | 402 652 | | | | 435 813 | | | | 476 102 | |
Payments for capital assets | | | 15 176 | | | | 13 045 | | | | 14 258 | | | | 17 590 | | | | 17 517 | |
Payments for financial assets | | | 1 641 | | | | 1 451 | | | | 2 905 | | | | 3 252 | | | | 3 024 | |
Plus: | | | | | | | | | | | | | | | | | | | | |
Unallocated funds | | | 30 | | | | — | | | | 30 | | | | — | | | | — | |
Contingency reserve | | | 5 780 | | | | — | | | | 4 000 | | | | 6 500 | | | | 10 000 | |
| | | | | | | | | | | | | | | | | | | | |
Estimate of national expenditure | | | 969 365 | | | | 966 967 | | | | 1 055 075 | | | | 1 137 981 | | | | 1 225 727 | |
Percentage change from previous year | | | | | | | | | | | 9.1 | % | | | 7.9 | % | | | 7.7 | % |
| | | | | | | | | | | | | | | | | | | | |
2012 Budget estimate of expenditure | | | | | | | 969 365 | | | | 1 053 830 | | | | 1 139 579 | | | | | |
Increase / decrease (-) | | | | | | | -2 398 | | | | 1 245 | | | | -1 598 | | | | | |
| | | | | | | | | | | | | | | | | | | | |
Gross domestic product | | | 3 301 374 | | | | 3 209 142 | | | | 3 520 268 | | | | 3 880 406 | | | | 4 270 848 | |
| | | | | | | | | | | | | | | | | | | | |
| 1) | Consists mainly of salaries of Members of Parliament, judges and magistrates. |
198
ANNEXURE D: SUMMARY OF BUDGET
Summary of the consolidated budget
| | | | | | | | | | | | | | | | | | | | |
| | | 2012/13 | | | 2013/14 | | | 2014/15 | | | 2015/16 | |
R million | | Budget
estimate | | | Revised
estimate | | | Budget
estimate | | | Medium-term estimates | |
National budget revenue 1) | | | 799 341 | | | | 782 474 | | | | 872 966 | | | | 967 923 | | | | 1 070 727 | |
Revenue of provinces, social security funds and public entities | | | 105 489 | | | | 105 375 | | | | 114 273 | | | | 124 613 | | | | 130 368 | |
Repayment of Gautrain loan 2) | | | — | | | | — | | | | -1 521 | | | | -1 430 | | | | -1 340 | |
| | | | | | | | | | | | | | | | | | | | |
Consolidated budget revenue 3) | | | 904 830 | | | | 887 849 | | | | 985 719 | | | | 1 091 105 | | | | 1 199 755 | |
| | | | | | | | | | | | | | | | | | | | |
National budget expenditure 1) | | | 969 365 | | | | 966 967 | | | | 1 055 075 | | | | 1 137 981 | | | | 1 225 727 | |
Expenditure of provinces, social security funds and public entities | | | 88 956 | | | | 88 924 | | | | 94 315 | | | | 106 359 | | | | 108 384 | |
| | | | | | | | | | | | | | | | | | | | |
Consolidated budget expenditure 3) | | | 1 058 321 | | | | 1 055 891 | | | | 1 149 390 | | | | 1 244 340 | | | | 1 334 111 | |
| | | | | | | | | | | | | | | | | | | | |
Consolidated budget balance | | | -153 491 | | | | -168 043 | | | | -163 671 | | | | -153 234 | | | | -134 357 | |
Percentage of GDP | | | -4.6 | % | | | -5.2 | % | | | -4.6 | % | | | -3.9 | % | | | -3.1 | % |
Extraordinary payments | | | -24 | | | | -2 584 | | | | -930 | | | | — | | | | — | |
Extraordinary receipts | | | 1 200 | | | | 10 780 | | | | 4 992 | | | | 2 900 | | | | 3 100 | |
Consolidated borrowing requirement (net) | | | -152 315 | | | | -159 847 | | | | -159 609 | | | | -150 334 | | | | -131 257 | |
| | | | | | | | | | | | | | | | | | | | |
FINANCING | | | | | | | | | | | | | | | | | | | | |
Domestic loans (net) | | | 151 137 | | | | 148 060 | | | | 169 837 | | | | 164 523 | | | | 167 386 | |
Foreign loans (net) | | | -7 673 | | | | -8 079 | | | | -3 318 | | | | 3 062 | | | | 8 854 | |
Change in cash and other balances | | | 8 851 | | | | 19 866 | | | | -6 910 | | | | -17 251 | | | | -44 983 | |
| | | | | | | | | | | | | | | | | | | | |
Total financing (net) | | | 152 315 | | | | 159 847 | | | | 159 609 | | | | 150 334 | | | | 131 257 | |
| | | | | | | | | | | | | | | | | | | | |
| 1) | Transfers to provinces, social security funds and public entities presented as part of the national budget |
| 2) | Repayment of Gautrain loan, repaid by the Gauteng province to the National Revenue Fund, netted out in consolidation |
| 3) | Flows between national, provincial, social security funds and public entities are netted out |
199
2013 BUDGET REVIEW
200
E
Glossary
| | |
| Accounting officer | | The civil servant in a department who is accountable to Parliament for financial management, usually the director-general or head of the department. |
| |
| Accrual | | An accounting convention by which payments and receipts are recorded as they occur, even if no cash flow takes place. |
| |
| Acquisition debt | | Debt used to purchase shares or assets. |
| |
| Ad valorem duties | | Duties levied on commodities as a certain percentage of their value. |
| |
| Adjustments estimate | | Presentation to Parliament of the amendments to be made to the appropriations voted in the main budget for the year. |
| |
| Administered prices | | Prices set outside ordinary market processes through administrative decisions by government, a public entity or a regulator. |
| |
| Allocated expenditure | | The part of the national budget that can be divided between the national, provincial and local spheres of government, after interest and the contingency reserve have been taken into account. |
| |
| Amortisation | | The repayment of a loan by instalments over the duration of the loan. |
| |
| Appropriation | | The approval by Parliament of spending from the National Revenue Fund, or by a provincial legislature from a provincial revenue fund. |
| |
| Artificial debt | | A “loan” that is presented as debt but is in effect equity. Often used in tax avoidance or tax evasion. |
| |
| Asset price bubble | | A condition occurring when prices for a category of assets rise above the level justified by economic fundamentals. |
| |
| Asset swap | | An arrangement in which financial institutions exchange a portfolio of South African shares and securities for a portfolio of foreign shares and securities. |
| |
| Balance of payments | | A summary statement of all the international transactions of the residents of a country with the rest of the world over a particular period of time. |
201
2013 BUDGET REVIEW
| | |
| Basel III | | Reforms developed by the Basel Committee on Banking Supervision to strengthen the regulation, supervision and risk management of the banking sector. |
| |
| Baseline | | The initial allocations used during the budget process, derived from the previous year’s forward estimates. |
| |
| Basis point | | One hundredth of one per cent. |
| |
| Bond | | A certificate of debt issued by a government or corporation guaranteeing payment of the original investment plus interest by a specified future date. |
| |
| Bond premium | | Amount by which the purchase price of a bond is greater than its par value. |
| |
| Bond spread | | The difference in yield between two bonds. |
| |
| Budget balance | | The difference between budgeted expenditure and budgeted revenue. If expenditure exceeds revenue, the budget is in deficit. If the reverse is true, it is in surplus. |
| |
| Capital adequacy | | A measure of a financial institution’s capital, expressed as a percentage of its credit exposure. |
| |
| Capital asset | | Property of any kind, including assets that are movable or immovable, tangible or intangible, fixed or circulating, but excluding trading stock held for the purpose of realising a financial or economic return. |
| |
| Capital expenditure | | Spending on assets such as buildings, land, infrastructure and equipment. |
| |
| Capital flow | | A flow of investments in and out of the country. |
| |
| Capital formation | | A measure of the net increase in the country’s total stock of capital goods, after allowing for depreciation. |
| |
| Capital gains tax | | Tax levied on the income realised from the disposal of a capital asset by a taxpayer. A capital gain is the excess of the selling price over the purchase price of the capital asset. |
| |
| Capital goods | | Durable goods used over a period of time for the production of other goods. See also intermediate goods. |
| |
| Capital-output ratio | | The amount of units of capital employed to produce a certain level of output. |
| |
| Carbon tax | | An environmental tax on emissions of carbon dioxide (CO2). |
| |
| Category A, B and C municipalities | | Municipal categories established by the Constitution: Category A, or metropolitan municipalities; Category B, or local municipalities; and Category C, or district municipalities. |
| |
| Clean development mechanism | | An initiative developed under the Kyoto Protocol that allows emission-reduction projects in developing countries to earn certified emission-reduction credits, each equivalent to one ton of CO2. These credits can be traded and sold, and used to meet emission-reduction targets. |
202
ANNEXURE E: GLOSSARY
| | |
| Collective bargaining | | Negotiations between employees and employers on procedures and rules to cover conditions of work and rates of pay. |
| |
| Conditional grants | | Allocations of money from one sphere of government to another, conditional on certain services being delivered or on compliance with specified requirements. |
| |
| Connected person debt/credit | | Debt or credit granted by a person/entity to a connected person/entity. In the case of a holding company, for example, a subsidiary company would be a connected person. |
| |
| Consolidated general government | | National, provincial and local government, as well as extra-budgetary government institutions and social security funds. |
| |
| Consolidated government expenditure | | Total expenditure by national and provincial government, social security funds and selected public entities, including transfers and subsidies to municipalities, businesses and other entities. |
| |
| Consumer price index (CPI) | | The measure of inflation based on prices in a basket of goods and services. |
| |
| Consumption expenditure | | Expenditure on goods and services, including salaries, which are used up within a short period of time, usually a year. |
| |
| Contingency reserve | | An amount set aside, but not allocated in advance, to accommodate changes to the economic environment and to meet unforeseeable spending pressures. |
| |
| Contingent liabilities | | A government obligation, such as a guarantee, that will only result in expenditure upon the occurrence of a specific event. |
| |
| Controlled foreign entity | | A foreign business in which South Africans hold a greater than 50 per cent interest, usually of the share capital of a company. |
| |
| Corporatisation | | The transformation of state-owned enterprises into commercial entities, subject to commercial legal requirements and governance structures, while retaining state ownership. |
| |
| Cost-push inflation | | Inflation that is caused by an increase in production costs, such as wages or oil prices. |
| |
| Countercyclical fiscal policy | | Policy that has the opposite effect on economic activity to that caused by the business cycle, such as slowing spending growth in a boom period and accelerating spending in a recession. |
| |
| Coupon (bond) | | The periodic interest payment made to bondholders during the life of the bond. The interest is usually paid twice a year. |
| |
| Credit rating | | An indicator of the risk of default by a borrower or the riskiness of a financial instrument. |
| |
| Crowding-in | | Increase of private investment through the income-raising effect of government spending financed by deficits. |
| |
| Crowding-out | | A fall in private investment or consumption as a result of increased government expenditure financed through borrowing, thereby competing for loanable funds and raising the interest rate, which curtails private investment and consumption spending. |
203
2013 BUDGET REVIEW
| | |
| Current account (of the balance of payments) | | The difference between total imports and total exports, also taking into account service payments and receipts, interest, dividends and transfers. The current account can be in deficit or surplus. See also trade balance. |
| |
| Current balance | | The difference between revenue and current expenditure, which consists of compensation of employees, goods and services, and interest and rent on land. |
| |
| Current expenditure | | Government expenditure on salaries and goods and services, such as rent, maintenance and interest payments. See also consumption expenditure. |
| |
| Customs duties | | Tax levied on imported goods. |
| |
| Debenture | | An unsecured loan backed by general credit rather than by specified assets. |
| |
| Debt-service costs | | The cost of interest on government debt and other costs directly associated with borrowing. |
| |
| Debt switching | | The exchange of bonds to manage refinancing risk or improve tradability. |
| |
| Deleveraging | | The reduction of debt previously used to increase the potential return of an investment. |
| |
| Depreciation (capital) | | A reduction in the value of fixed capital as a result of wear and tear or redundancy. |
| |
| Depreciation (exchange rate) | | A reduction in the external value of a currency. |
| |
| Derivative financial instrument | | A financial asset that derives its value from an underlying asset, which may be a physical asset such as gold, or a financial asset such as a government bond. |
| |
| Designated countries | | Foreign countries from which income may be exempt from South African tax under certain circumstances. See also double tax agreement. |
| |
| Development finance institutions | | State agencies that aim to meet the credit needs of riskier but socially and economically desirable projects that are beyond the acceptance limits of commercial banks. |
| |
| Direct taxes | | Taxes charged on taxable income or capital of individuals and legal entities. |
| |
| Disposable income | | Total income by households less all taxes and employee contributions. |
| |
| Dissaving | | An excess of current expenditure, including the depreciation of fixed capital, over current income. |
| |
| Division of revenue | | The allocation of funds between spheres of government, as required by the Constitution. See also equitable share. |
| |
| Domestic demand | | The total level of spending in an economy, including imports but excluding exports. |
| |
| Double tax agreement | | An agreement between two countries to prevent income that is taxed in one country from being taxed in the other as well. See also designated countries. |
204
ANNEXURE E: GLOSSARY
| | |
| Economically active population | | The part of the population that is of working age and is either employed or seeking work. |
| |
| Economic cost | | The cost of an alternative that must be forgone to pursue a certain action. In other words, the benefits that could have been received by taking an alternative action. |
| |
| Economic growth | | An increase in the total amount of output, income and spending in the economy. |
| |
| Economic rents | | The difference between the return made by a factor of production (capital or labour) and the return necessary to keep the factor in its current occupation. For example, a firm making excess profits is earning economic rent. |
| |
| Effective tax rate | | Actual tax liability (or a reasonable estimate thereof) expressed as a percentage of a pre-tax income base rather than as a percentage of taxable income, i.e. tax rates that take into account not only the statutory or nominal tax rate, but also other aspects of the tax system (for example, allowable deductions), which determine the tax liability. |
| |
| Emerging economies | | A name given by international investors to middle-income economies. |
| |
| Employment coefficient | | The ratio of employment growth to economic growth. |
| |
| Equalisation Fund levy | | A dedicated fuel levy used to subsidise the local synthetic fuel industry. It is also used to smooth the impact of fluctuations in the international oil price (and exchange rate) on the domestic fuel price. |
| |
| Equitable share | | The allocation of revenue to the national, provincial and local spheres of government as required by the Constitution. See also division of revenue. |
| |
| Equity finance | | Raising money by selling shares of stock to investors, who receive an ownership interest in return. |
| |
| Exchange control | | Rules that regulate the flow of currency out of South Africa, or restrict the amount of foreign assets held by South African individuals and companies. |
| |
| Excise duties | | Taxes on the manufacture or sale of certain domestic or imported products. Excise duties are usually charged on products such as alcoholic beverages, tobacco and petroleum. |
| |
| Extra-budgetary institutions | | Public entities not directly funded from the fiscus. |
| |
| Extraordinary payments | | Payments, excluding departmental appropriated payments, that are not expected to recur frequently. |
| |
| Extraordinary receipts | | Receipts, other than departmental receipts, that are not expected to recur frequently. |
| |
| Financial account | | A statement of all financial transactions between the nation and the rest of the world, including portfolio and fixed investment flows and movements in foreign reserves. |
205
2013 BUDGET REVIEW
| | |
| Financial and Fiscal | | An independent body established by the Constitution to make |
| |
| Commission (FFC) | | recommendations to Parliament and provincial legislatures about financial issues affecting the three spheres of government. |
| |
| Financial Services Board | | An independent institution established by statute that regulates insurers, intermediaries, retirement funds, friendly societies, unit trust schemes, management companies and financial markets. |
| |
| Financial Stability Board | | An international body made up of representatives of financial authorities and institutions, and central banks. It proposes regulatory, supervisory and other policies in the interest of financial stability. |
| |
| Financial year | | The 12 months according to which companies and organisations budget and account. See also fiscal year. |
| |
| Fiscal consolidation | | Policy aimed at reducing government deficits and debt accumulation. |
| |
| Fiscal incidence | | The combined overall economic impact that fiscal policy has on the economy. |
| |
| Fiscal policy | | Policy on taxation, public spending and borrowing by the government. |
| |
| Fiscal space | | The ability of government’s budget to provide additional resources for a desired programme without jeopardising fiscal or debt sustainability. |
| |
| Fiscal year | | The 12 months on which government budgets are based, beginning 1 April and ending 31 March of the subsequent calendar year. |
| |
| Fixed-income bond | | A bond that pays a specific interest rate. |
| |
| Fixed investment/capital formation | | Spending on buildings, machinery and equipment contributing to production capacity in the economy. See also gross fixed capital formation. |
| |
| Floating rate notes | | A bond on which the interest rate is reset periodically in line with a money market reference rate. |
| |
| Flow-through vehicles | | A vehicle, such as a trust, where income earned is treated as income of the vehicle’s beneficiaries. |
| |
| Foreign currency swaps | | The exchange of principal and/or interest payments in one currency for those in another. |
| |
| Foreign direct investment (FDI) | | The acquisition of a controlling interest by governments, institutions or individuals of a business in another country. |
| |
| Forward book | | The total amount of contracts for the future exchange of foreign currency entered into by the Reserve Bank at any given point in time. |
| |
| Forward cover | | Transactions involving an agreed exchange rate at which foreign currency will be purchased or sold at a future date. |
| |
| Forward markets | | Markets in which currencies, commodities or securities are bought and sold at agreed prices for delivery at specified future dates. |
206
ANNEXURE E: GLOSSARY
| | |
| Fuel levy | | An excise tax on liquid fuels. |
| |
| Function shift | | The movement of a function from one departmental vote or sphere of government to another. |
| |
| Funded pension arrangements | | A pension scheme in which expected future benefits are funded in advance and as entitlement accrues. |
| |
| GDP inflation | | A measure of the total increase in prices in the whole economy. Unlike CPI inflation, GDP inflation includes price increases in goods that are exported and intermediate goods such as machines, but excludes imported goods. |
| |
| Gold and foreign exchange reserves | | Reserves held by the Reserve Bank to meet foreign exchange obligations and to maintain liquidity in the presence of external shocks. |
| |
| Government debt | | The total amount of money owed by the government as a consequence of its borrowing in the past. |
| |
| Green paper | | A policy document intended for public discussion. |
| |
| Gross borrowing requirement | | The sum of the main budget balance, extraordinary receipts and payments, and maturing debt. The amount is funded through domestic short- and long-term loans, foreign loans and changes in cash balances. |
| |
| Gross domestic product (GDP) | | A measure of the total national output, income and expenditure in the economy. GDP per head is the simplest overall measure of welfare, although it does not take account of the distribution of income, nor of goods and services that are produced outside the market economy, such as work within the household. |
| |
| Gross fixed capital formation | | The addition to a country’s fixed capital stock during a specific period, before provision for depreciation. |
| |
| Gross value added | | The value of output less intermediate consumption. It is also a measure of the contribution to the economy made by an industry or sector. |
| |
| Hedging | | An action taken by a buyer or seller to protect income against changes in prices, interest rates or exchange rates. |
| |
| Horizontal equity | | A principle in taxation that holds that similarly situated taxpayers should face a similar tax treatment or tax burden, i.e. taxpayers with the same amount of income or capital should be accorded equal treatment. |
| |
| Impaired advances | | Loans or advances that may not be collected in full. |
| |
| Import parity pricing | | When a firm sells goods locally at the price customers would pay if they were to import the same goods from another country. |
| |
| Inclusion rate | | The portion of the net capital gain derived from the disposal of an asset that will be taxed at the applicable rate. |
207
2013 BUDGET REVIEW
| | |
| Industrial development zone | | Designated sites linked to an international air or sea port, supported by incentives to encourage investment in export-orientated manufacturing and job creation. |
| |
| Inflation | | An increase in the general level of prices. |
| |
| Inflation targeting | | A monetary policy framework intended to achieve price stability over a certain period of time. |
| |
| Intermediate goods | | Goods produced to be used as inputs in the production of final goods. |
| |
| Inventories | | Stocks of goods held by firms. An increase in inventories reflects an excess of output relative to spending over a period. |
| |
| Labour intensity | | The relative amount of labour used to produce a unit of output. |
| |
| Liquidity | | The ease with which assets can be bought and sold. |
| |
| Liquidity requirements | | The amount of liquid or freely convertible assets that banks are required to hold relative to their liabilities, for prudential and regulatory purposes. |
| |
| M3 | | The broadest definition of money supply in South Africa, including notes and coins, demand and fixed deposits, and credit. |
| |
| Macroeconomics | | The branch of economics that deals with the whole economy – including issues such as growth, inflation, unemployment and the balance of payments. |
| |
| Marginal income tax rate | | The rate of tax on an incremental unit of income. |
| |
| Marginal lending rate | | A penalty rate of interest charged by the Reserve Bank for lending to financial institutions in the money market in excess of the daily liquidity provided to the money market at the repurchase rate. See also repurchase agreements. |
| |
| Marketable securities | | Tradable financial securities listed with a securities exchange. |
| |
| Means test | | A method for determining whether someone qualifies for state assistance. |
| |
| Medium Term Expenditure Committee (MTEC) | | The technical committee responsible for evaluating the MTEF budget submissions of national departments and making recommendations to the Minister of Finance regarding allocations to national departments. |
| |
| Medium-term expenditure framework (MTEF) | | The three-year spending plans of national and provincial governments, published at the time of the Budget. |
| |
| Microeconomics | | The branch of economics that deals with the behaviour of individual firms, consumers and sectors. |
| |
| Ministers’ Committee on the Budget | | The political committee that considers key policy and budgetary issues that pertain to the budget process before they are tabled in Cabinet. |
| |
| Monetary policy | | Policy concerning total money supply, exchange rates and the general level of interest rates. |
208
ANNEXURE E: GLOSSARY
| | |
| Money supply | | The total stock of money in an economy. |
| |
| National budget | | The projected revenue and expenditures that flow through the National Revenue Fund. It does not include spending by provinces or local government from their own revenues. |
| |
| National Development Plan | | A planning framework prepared by the National Planning Commission that aims to eliminate poverty and reduce inequality by 2030. |
| |
| National Revenue Fund | | The consolidated account of the national government into which all taxes, fees and charges collected by SARS and departmental revenue must be paid. |
| |
| Negotiable certificate of deposit | | Short-term deposit instruments issued by banks, at a variable interest rate, for a fixed period. |
| |
| Net borrowing requirement | | The sum of the main budget balance, extraordinary receipts and extraordinary payments. Deficits increase the borrowing requirement; surpluses reduce the requirement. |
| |
| Net exports | | Exports less imports. |
| |
| Net open foreign currency position | | Gold and foreign exchange reserves minus oversold forward book. The figure is expressed in dollars. |
| |
| Net trade | | The difference between the value of exports and the value of imports. |
| |
| Nominal exchange rates | | The current rate of exchange between the rand and foreign currencies. The “effective” exchange rate is a trade-weighted average of the rates of exchange with other currencies. |
| |
| Nominal wage | | The return, or wage, to employees at the current price level. |
| |
| Non-financial public enterprises | | Government-owned or controlled organisations that deliver goods and non-financial services, trading as business enterprises, such as Eskom or Transnet. |
| |
| Non-interest expenditure | | Total expenditure by government less debt-service costs. |
| |
| Non-tax revenue | | Income received by government as a result of administrative charges, licences, fees, sales of goods and services, and so on. |
| |
| Occupation-specific salary dispensation | | Revised salary structures unique to identified occupations in the public service, including doctors, nurses and teachers. |
| |
| Opportunity cost | | The value of that which must be given up to achieve or acquire something. It is represented by the next highest valued alternative use of a resource. |
| |
| Organisation for Economic Cooperation and | | An organisation of 30 mainly industrialised member countries. South Africa is not a member. |
| |
| Development (OECD) | | |
| |
| Outputs | | Goods and services delivered by government. |
209
2013 BUDGET REVIEW
| | |
| Payroll tax | | Tax an employer withholds and/or pays on behalf of employees based on employee wages or salaries. |
| |
| Policy reserve | | Additional money in the fiscus to fund new and crucial priorities. |
| |
| Portfolio investment | | Investment in financial assets such as stocks and bonds. |
| |
| Potential growth | | The fastest growth an economy can sustain without increasing inflation. |
| |
| Presidential Infrastructure Coordinating Commission (PICC) | | A commission established by Cabinet to develop, review and coordinate a 20-year infrastructure plan. |
| |
| Price discovery | | The process of determining the price level of a commodity or asset based on supply and demand factors. |
| |
| Primary deficit/surplus | | The difference between total revenue and non-interest expenditure. When revenue exceeds non-interest expenditure there is a surplus. |
| |
| Primary sector | | The agricultural and mining sectors of the economy. |
| |
| Private-sector credit extension | | Credit provided to the private sector. This includes all loans, credit cards and leases. |
| |
| Privatisation | | The full or partial sale of state-owned enterprises to private individuals or companies. |
| |
| Producer price inflation (PPI) | | Price increases measured by the producer price index – a measure of the prices paid based mainly on producers’ published price lists. |
| |
| Productivity | | A measure of the amount of output generated from every unit of input. Typically used to measure changes in labour efficiency. |
| |
| Public-benefit organisations (PBOs) | | Organisations that are mainly funded by donations from the public and other institutions, which engage in social activities to meet the needs of the general public. |
| |
| Public entities | | Companies, agencies, funds and accounts that are fully or partly owned by government or public authorities and are regulated by law. |
| |
| Public Finance Management Act (PFMA) | | The act regulating financial management of national and provincial government, including the efficiency and effectiveness of public expenditure and the responsibilities of those engaging with government financial management. |
| |
| Public goods | | Goods and services that would not be fully provided in a pure free-market system and are largely provided by government. |
| |
| Public Investment Corporation (PIC) | | A government-owned investment management company that invests funds on behalf of public-sector entities. Its largest client is the Government Employees Pension Fund. |
210
ANNEXURE E: GLOSSARY
| | |
| Public-private partnerships (PPPs) | | A contractual arrangement whereby a private party performs part of a government function and assumes the associated risks. In return, the private party receives a fee according to predefined performance criteria. |
| |
| Public sector | | National government, provincial government, local government, extra-budgetary governmental institutions, social security funds and non-financial public enterprises. |
| |
| Public-sector borrowing requirement | | The consolidated cash borrowing requirement of general government and non-financial public enterprises. |
| |
| Purchasing managers’ index (PMI) | | A composite index measuring the change in manufacturing activity compared with the previous month. An index value of 50 indicates no change in activity, a value above 50 indicates increased activity and a value below 50 indicates decreased activity. |
| |
| Quantitative easing | | A measure used by central banks to stimulate economic growth when interest rates are near zero by increasing money supply. |
| |
| Rating agency | | Companies that evaluate the ability of countries or other borrowers to honour their debt obligations. Credit ratings are used by international investors as indications of sovereign risk. See also credit rating. |
| |
| Real effective exchange rate | | A measure of the rate of exchange of the rand relative to a trade-weighted average of South Africa’s trading partners’ currencies, adjusted for price trends in South Africa and the countries included. |
| |
| Real exchange rate | | The level of the exchange rate taking account of inflation differences. |
| |
| Real expenditure | | Expenditure measured in constant prices, i.e. after taking account of inflation. |
| |
| Real interest rate | | The level of interest after taking account of inflation. |
| |
| Real wage | | The return, or wage, to employees, measured at a constant price level. |
| |
| Recapitalisation | | Injection of funds into a company or entity to aid liquidity, either as a loan or in return for equity. |
| |
| Recession | | A period in which national output and income decline. A recession is usually defined as two consecutive quarters of negative growth. |
| |
| Regional integration | | An economic policy intended to boost economic activity in a geographical area extending beyond one country. |
| |
| Remuneration | | The costs of personnel including salaries, housing allowances, car allowances and other benefits received by personnel. |
| |
| Repurchase agreements | | Short-term contracts between the Reserve Bank and private banks in the money market to sell specified amounts of money at an interest rate determined by daily auction. |
| |
| Repurchase (repo) rate | | The rate at which the Reserve Bank lends to commercial banks. |
211
2013 BUDGET REVIEW
| | |
| Reserves (foreign exchange) | | Holdings of foreign exchange, either by the Reserve Bank only or by the Reserve Bank and domestic banking institutions. |
| |
| Residence-based income tax system | | A tax system in which the worldwide income accruing to a resident of a country is subject to the taxes of that country. |
| |
| Revaluation gain/loss | | The difference between the value of a foreign currency deposit from the original (historic) rate to execution of a trade based on the spot rate. |
| |
| Risk premium | | A return that compensates for uncertainty. |
| |
| Saving | | The difference between income and spending. |
| |
| Seasonally adjusted and annualised | | Removal of seasonal volatility (monthly or quarterly) from a time series. This provides a measure of the underlying trend in the data. |
| |
| Secondary rebate | | A rebate from income tax, in addition to the primary rebate, that is available to taxpayers aged 65 years and older. |
| |
| Secondary sector | | The part of the economy concerned with the manufacture of goods. |
| |
| Secondary tax on companies (STC) | | Tax on dividends declared by a company, calculated at the rate of 10 per cent of the net amount of dividends declared. |
| |
| Section 21 company | | Non-profit entities registered in terms of Section 21 of the Companies Act. |
| |
| Sector education and training authorities | | Institutions funded through employer training levies, responsible for learnership programmes and implementing strategic sector skills plans. |
| |
| Secured debt instruments | | Debt backed or secured by collateral to reduce the risk of lending. |
| |
| Service and transfer payments | | Services involve transactions of non-tangible commodities, while transfers are unrequited transactions that do not generate a counter-economic value (for example, gifts and grants). |
| |
| Skills development levy | | A payroll tax designed to finance training initiatives, in terms of the skills development strategy. |
| |
| Social infrastructure | | Infrastructure that supports social services. |
| |
| Social wage | | Social benefits available to all individuals, funded wholly or partly by the state. |
| |
| Source-based income tax system | | A system in which income is taxed in the country where the income originates. |
| |
| Southern African Customs Union (SACU) agreement | | An agreement that allows for the unrestricted flow of goods and services, and the sharing of customs and excise revenue, between South Africa, Botswana, Namibia, Lesotho and Swaziland. |
| |
| Southern African Development Community (SADC) | | A regional intergovernmental organisation that promotes collaboration, economic integration and technical cooperation throughout southern Africa. |
212
ANNEXURE E: GLOSSARY
| | |
| Sovereign debt | | Debt issued by a government. |
| |
| Sovereign debt rating | | An assessment of the likelihood that a government will default on its debt obligations. |
| |
| Specific excise duty | | A tax on each unit of output or sale of a good, unrelated to the value of a good. |
| |
| Standing appropriations | | Government’s expenditure obligations that do not require a vote or statutory provision, including contractual guarantee commitments and international agreements. |
| |
| Statutory appropriations | | Amounts appropriated to be spent in terms of statutes and not requiring appropriation by vote. |
| |
| Sterilisation | | Action taken by the Reserve Bank to neutralise excess cash created in the money market when purchasing foreign currency. |
| |
| Structural budget balance | | A representation of what government revenue and expenditure would be if output were at its potential level, with cyclical variations stripped out. |
| |
| Switch auction | | Auctions to exchange bonds to manage refinancing risk or improve tradability. |
| |
| Syndicated loan | | A large loan in which a group of banks work together to provide funds, which they solicit from their clients for the borrower. |
| |
| Tax amnesty | | A period allowed by tax authorities during which taxpayers who are outside the tax net, but should be registered for tax purposes, can register for tax without incurring penalties. |
| |
| Tax avoidance | | When individuals or businesses legitimately use provisions in the tax law to reduce their tax liability. |
| |
| Tax base | | The aggregate value of income, sales or transactions on which particular taxes are levied. |
| |
| Tax evasion | | When individuals or businesses illegally reduce their tax liability. |
| |
| Tax gap | | A measure of tax evasion that emerges from comparing the tax liability or tax base declared to the tax authorities with the tax liability or tax base calculated from other sources. |
| |
| Tax incentives | | Specific provisions in the tax code that provide favourable tax treatment to individuals and businesses to encourage specific behaviour or activities. |
| |
| Tax incidence | | The final distribution of the burden of tax. Statutory incidence defines where the law requires a tax to be levied. Economic incidence refers to those who experience a decrease in real income as a result of the imposition of a tax. |
213
2013 BUDGET REVIEW
| | |
| Tax loopholes | | Unintended weaknesses in the legal provisions of the tax system used by taxpayers to avoid paying tax liability. |
| |
| Tax-to-GDP ratio | | For public finance comparison purposes, a country’s tax burden, or tax-to-GDP ratio, is computed by taking the total tax payments for a particular fiscal year as a fraction or percentage of the GDP for that year. |
| |
| Term-to-maturity | | The time between issuance and expiry. |
| |
| Terms of trade | | An index measuring the ratio of a country’s export prices relative to its import prices. |
| |
| Tertiary sector | | The part of the economy concerned with the provision of services. |
| |
| Total factor productivity | | An index used to measure the efficiency of all inputs that contribute to the production process. |
| |
| Trade balance | | The monetary record of a country’s net imports and exports of physical merchandise. See also current account. |
| |
| Trade regime | | The system of tariffs, quotas and quantitative restrictions applied to protect domestic industries, together with subsidies and incentives used to promote international trade. |
| |
| Trademark | | A legal right pointing distinctly to the origin or ownership of merchandise to which it is applied and legally reserved for the exclusive use of the owner as maker or seller. |
| |
| Trade-weighted rand | | The value of the rand pegged to or expressed relative to a market basket of selected foreign currencies. |
| |
| Treasury committee | | The Cabinet committee that evaluates all requests for additional funds for unavoidable and unforeseen expenditure during a financial year. |
| |
| Trend GDP growth | | The theoretical level of GDP growth determined by the full utilisation of all factors of production (land, labour and capital). Growth above the trend rate results in macroeconomic imbalances such as rising inflation or a weakening of the current account. Increases in trend GDP growth are achieved through capital formation, growth in employment and/or technological development. |
| |
| Unallocated reserves | | Potential expenditure provision not allocated to a particular use. It mainly consists of the contingency reserve and amounts of money left unallocated by provinces. |
| |
| Unemployment (broad definition) | | All those of working age who are unemployed, including those actively seeking employment and discouraged worker seekers. |
| |
| Unemployment (official definition) | | Those of working age, who are unemployed and actively seeking work (excludes discouraged work seekers). |
| |
| Unit labour cost | | The cost of labour per unit of output, calculated by dividing average wages by productivity (output per worker per hour). |
214
ANNEXURE E: GLOSSARY
| | |
| Unsecured debt instruments | | Debt not backed or secured by collateral to reduce the risk of lending. |
| |
| Unsecured lending | | A loan that is not backed or secured by any type of collateral to reduce the lender’s risk. |
| |
| User charge | | Payments made in exchange for direct benefits accrued, for example, road toll fees. |
| |
| Vertical division | | The division of revenue between spheres of government. |
| |
| Vertical equity | | A doctrine in taxation that holds that differently situated taxpayers should be treated differently in terms of income tax provisions – i.e. taxpayers with more income and/or capital should pay more tax. |
| |
| Virement | | The transfer of resources from one programme to another within the same department during a financial year. |
| |
| Vote | | An appropriation voted by Parliament. |
| |
| Withholding tax | | Tax on income deducted at source. Withholding taxes are widely used in respect of dividends, interest and royalties. |
| |
| Yield | | A financial return or interest paid to buyers of government bonds. The yield/rate of return on bonds takes into account the total annual interest payments, the purchase price, the redemption value and the amount of time remaining until maturity. |
| |
| Yield curve | | A graph showing the relationship between the yield on bonds of the same credit quality but different maturity at a given point in time. |
215
W1
Website annexure to the 2013 Budget Review
Explanatory memorandum to the division of revenue
¢ Background
Section 214(1) of the Constitution requires that every year a Division of Revenue Act determine the equitable division of nationally raised revenue between national government, the nine provinces and 278 municipalities. This process takes into account the powers and functions assigned to each sphere of government. The division of revenue process fosters transparency and is at the heart of constitutional cooperative governance.
The Intergovernmental Fiscal Relations Act (1997) prescribes the process for determining the equitable sharing and allocation of nationally raised revenue. Sections 9 and 10(4) of the act set out the consultation process to be followed with the Financial and Fiscal Commission (FFC), including considering recommendations made regarding the division of revenue.
This explanatory memorandum to the 2013 Division of Revenue Bill fulfils the requirement set out in section 10(5) of the Intergovernmental Fiscal Relations Act that the bill be accompanied by an explanatory memorandum detailing how it takes account of the matters listed in sections 214(2)(a) to (j) of the Constitution, government’s response to the FFC’s recommendations, and any assumptions and formulas used in arriving at the respective divisions among provinces and municipalities. This explanatory memorandum has six sections:
| | • | | Part 1 lists the factors that inform the division of resources between national, provincial and local government. |
| | • | | Part 2 describes the 2013 division of revenue. |
| | • | | Part 3 sets out how the FFC’s recommendations on the 2013 division of revenue have been taken into account. |
| | • | | Part 4 explains the formula and criteria for the division of the provincial equitable share and conditional grants between provinces. |
1
2013 BUDGET REVIEW
| | • | | Part 5 sets out the formula and criteria for the division of the local government equitable share and conditional grants between municipalities. |
| | • | | Part 6 summarises issues that will form part of subsequent reviews of provincial and local government fiscal frameworks. |
The Division of Revenue Bill and its underlying allocations are the result of extensive consultation between national, provincial and local government. The Budget Council deliberated on the matters discussed in this memorandum at several meetings during the year. The approach to local government allocations was discussed with organised local government at technical meetings with the South African Local Government Association (SALGA), culminating in meetings of the Budget Forum (Budget Council plus SALGA). An extended Cabinet meeting involving ministers, provincial premiers and the SALGA chairperson was held on 10 October 2012. The division of revenue – and the government priorities that underpin it – was agreed for the next three years.
¢ Part 1: Constitutional considerations
Section 214 of the Constitution requires that the annual Division of Revenue Act be enacted only after factors in sub-sections (2)(a) to (j) of the Constitution are taken into account. These include national interest, debt provision, needs of national government and emergencies, the resource allocation for basic services and developmental needs, fiscal capacity and efficiency of the provincial and local spheres, reduction of economic disparities, and promotion of stability and predictability. The constitutional principles taken into account in deciding on the division of revenue are briefly noted below.
National interest and the division of resources
The national interest is encapsulated by those governance goals that benefit the nation as a whole. The National Development Plan, endorsed by Cabinet in November 2012, sets out a long-term vision for the country’s development. This is complemented by the strategic integrated projects (SIPs) overseen by the Presidential Infrastructure Coordinating Council and the 12 priority outcomes adopted by Cabinet in 2010. In the 2012 Medium Term Budget Policy Statement, the Minister of Finance outlined how the resources available to government over the 2013 medium-term expenditure framework (MTEF) would be allocated to help achieve these goals. A detailed analysis of how funds have been allocated based on these priorities can be found in Chapter 4 of the 2012 Medium Term Budget Policy Statement and Chapter 8 of the 2013 Budget Review. The frameworks for each conditional grant allocated as part of the division of revenue also note how the grant is linked to the 12 priority outcomes.
Provision for debt costs
The resources shared between national, provincial and local government include proceeds from national government borrowing used to fund spending by all spheres. National government provides for the resulting debt costs to protect the country’s integrity and credit reputation. A more detailed discussion can be found in Chapter 5 of the 2013 Budget Review.
National government’s needs and interests
The Constitution assigns exclusive and concurrent powers and functions to each sphere of government. National government is exclusively responsible for functions that serve the national interest and are best centralised. National and provincial government have concurrent responsibility for a range of functions. Provincial and local government receive equitable shares and conditional grants to enable them to provide basic services and perform their functions. Changes have been made to a number of national transfers to provincial and local government to improve their efficiency, effectiveness and alignment with national strategic objectives.
2
ANNEXURE W1: EXPLANATORY MEMORANDUM TO THE DIVISION OF REVENUE
Provincial and local government basic services
Provinces and municipalities are assigned key service-delivery functions such as education, health, social development, housing, roads, and provision of electricity, water and municipal infrastructure. They have significant autonomy to allocate resources to meet basic needs and respond to provincial and local priorities, while giving effect to national priorities. The division of revenue provides equitable shares to provinces and local government. This year’s division of revenue allocates additional resources to provinces to provide for the effects of the 2012 public-sector wage agreements, repair infrastructure damaged by floods, extend and improve school facilities, expand library services, improve health services and increase social welfare services. Transfers to local government have grown significantly in recent years, providing municipalities with greater resources to deliver basic services. This is in addition to the substantial own-revenue-raising powers available to local government. In the 2013 division of revenue, additional resources have been made available to compensate for the rising costs of providing free basic water and electricity, accelerate access to these services and ensure their sustainability.
Fiscal capacity and efficiency
National government has primary revenue-raising powers. Provinces have limited revenue-raising capacity and the resources required to deliver provincial functions do not lend themselves to self-funding or cost recovery. Municipalities finance most of their expenditure through property rates, user charges and fees. However, rural municipalities raise significantly less revenue than larger urban and metropolitan municipalities. Due to their limited revenue-raising potential and their responsibility to implement government priorities, provinces receive a larger share of nationally raised revenue than local government. Local government’s portion has significantly increased over the last few years and will continue to grow over the medium term. The provincial equitable share formula was reviewed in 2010 and the recommendations were implemented in 2011. In the 2013 MTEF, the formula is updated with 2011 Census data. Over this period, a new approach to the funding of provincial infrastructure will be implemented to promote better planning and implementation (details of this new approach are provided in part 6 of this annexure). A review of the local government equitable share was completed during 2012 and a new formula will be phased in from 2013/14 (details of the formula review and the new formulas are provided in part 5 of this annexure). These reviews are part of wider, ongoing reviews of provincial and local government functions and the funding thereof to ensure efficient and effective resource allocations.
Developmental needs
Developmental needs are accounted for at two levels: first, in the determination of the division of revenue, which explains the continued commitment to grow provincial and local government shares of nationally raised revenue, and second, in the determination of the division within each sphere through the formulas used for dividing national transfers among municipalities and provinces. Developmental needs are encapsulated in the equitable share formulas for provincial and local government and in specific conditional grants. In particular, various infrastructure grants and growing capital budgets aim to boost the economic and social development of provinces and municipalities.
Economic disparities
Both the equitable share and infrastructure grant formulas are redistributive towards poorer provinces and municipalities. Government is investing in economic infrastructure (roads) and social infrastructure (schools, hospitals and clinics) to stimulate economic development and job creation, and address economic and social disparities.
Obligations in terms of national legislation
The Constitution confers autonomy on provincial governments and municipalities to determine priorities and allocate budgets. National government is responsible for policy development, national mandates, setting national norms and standards for provincial and municipal functions and monitoring
3
2013 BUDGET REVIEW
implementation for concurrent functions. The 2013 MTEF and division of revenue provide additional funding for the 2012 wage agreements, which were higher than expected. Additions to conditional grants address the demand for HIV and Aids prevention and treatment programmes, and access to housing and basic services. The local government equitable share has been increased to address the rising costs of providing free basic services to poor households. These allocations are in addition to obligations funded through existing provincial and local government baseline allocations.
Predictability and stability
Provincial and local government equitable share allocations are based on estimates of nationally raised revenue. If nationally raised revenue falls short of the estimates within a given year, the equitable shares of provinces and local government will not be adjusted downwards. Allocations are assured (voted, legislated and guaranteed) for the first year and are transferred according to a payment schedule. To contribute to longer-term predictability and stability, estimates for a further two years are published with the annual proposal for appropriations. Adjusted estimates as a result of changes to data underpinning the equitable share formulas and revisions to the formulas are phased in to ensure minimal disruption.
Flexibility in responding to emergencies
Government has a contingency reserve that provides a cushion for emergencies and unforeseeable events. In addition, two conditional grants for disasters allow for the swift allocation and transfer of funds to affected provinces and municipalities. Sections 16 and 25 of the Public Finance Management Act (1999) make specific provision for the allocation of funds to deal with emergency situations. Section 30(2) deals with adjustment allocations for unforeseeable and unavoidable expenditure. Section 29 of the Municipal Finance Management Act (2003) allows a municipal mayor to authorise unforeseeable and unavoidable expenditure in an emergency.
¢ Part 2: The 2013 division of revenue
Expenditure in the 2013 MTEF will remain within the bounds set out in the 2012 Budget. National and provincial departments implemented savings measures and reprioritised spending to make additional resources available to fund government priorities in the 2013 Budget.
Excluding debt-service costs and the contingency reserve, allocated expenditure shared between the three spheres amounts to R951.3 billion, R1 trillion and R1.1 trillion over each of the MTEF years. These allocations take into account government’s spending priorities, the revenue-raising capacity and responsibilities of each sphere, and input from various intergovernmental forums and the FFC. The provincial and local equitable share formulas are designed to ensure desirable, stable and predictable revenue shares, and to address economic and fiscal disparities.
Government’s policy priorities for the 2013 MTEF
Government has adopted a policy of changing the composition of spending to focus on promoting economic support and development, investing in infrastructure, creating jobs and enhancing local government capacity.
Following the saving exercise mentioned above, additional resources are allocated to provinces to cover the following:
| | • | | The 2012 wage agreements |
| | • | | Cushioning the impact of the phasing in of the 2011 Census data in the provincial equitable share formula |
| | • | | Increased numbers of teachers for poor schools and Grade R |
| | • | | Improved diagnostics for tuberculosis |
4
ANNEXURE W1: EXPLANATORY MEMORANDUM TO THE DIVISION OF REVENUE
| | • | | Increased assistance to non-governmental organisations providing social development services |
| | • | | Absorption of social work graduates |
| | • | | Continued expansion of HIV and Aids prevention and treatment programmes |
| | • | | Investment in provincial roads |
| | • | | Upgrade of informal settlements in mining towns |
| | • | | Improvements in community library services |
Local government allocations receive additional funds to:
| | • | | Compensate for the rising costs of providing free basic water and electricity to poor households |
| | • | | Accelerate provision of access to clean water through bulk and reticulation projects |
| | • | | Accelerate provision of access to electricity and improving the sustainability of access through the refurbishment of key infrastructure |
| | • | | Expand the collection and use of data on the condition of municipal roads |
| | • | | Increasing the number of interns with infrastructure-related skills working in municipalities |
| | • | | Host the 2014 African Nations Championship |
| | • | | Promote more integrated and efficient cities. |
Table W1.1 shows additional allocations for major infrastructure projects.
Table W1.1 Infrastructure project proposals
| | | | | | | | | | | | | | | | |
R million | | 2013/14 | | | 2014/15 | | | 2015/16 | | | Total | |
Local government, housing and community amenities | | | 1 321 | | | | 2 134 | | | | 5 652 | | | | 9 108 | |
Interim bulk water supply | | | 311 | | | | 585 | | | | 1 400 | | | | 2 296 | |
Indirect grant: Regional bulk water infrastructure | | | 269 | | | | 954 | | | | 1 953 | | | | 3 176 | |
Pilanesberg (Magalies water) | | | 200 | | | | — | | | | — | | | | 200 | |
Human settlements development (informal settlements upgrading) | | | — | | | | 110 | | | | 830 | | | | 940 | |
Social housing | | | 160 | | | | 90 | | | | 435 | | | | 686 | |
Municipal infrastructure supports agency | | | 60 | | | | 60 | | | | 60 | | | | 180 | |
De Hoop dam | | | 171 | | | | 335 | | | | 974 | | | | 1 480 | |
Acid mine drainage | | | 150 | | | | — | | | | — | | | | 150 | |
Transport, energy and communication | | | 1 193 | | | | 1 596 | | | | 3 284 | | | | 6 073 | |
Sentech | | | 277 | | | | — | | | | — | | | | 277 | |
SANEDI:1 Research and development | | | 71 | | | | 111 | | | | 35 | | | | 217 | |
Integrated national electrification programme | | | 320 | | | | 77 | | | | 500 | | | | 897 | |
South African National Roads Agency (SANRAL) | | | 275 | | | | — | | | | 1 126 | | | | 1 401 | |
Passenger Rail Agency of South Africa (PRASA) | | | 250 | | | | 1 408 | | | | 1 623 | | | | 3 281 | |
Education and related functions | | | 150 | | | | 500 | | | | 1 000 | | | | 1 650 | |
New universities in Northern Cape and Mpumalanga | | | 150 | | | | 500 | | | | 1 000 | | | | 1 650 | |
Health | | | 30 | | | | 30 | | | | 30 | | | | 90 | |
Infrastructure unit systems support programme | | | 30 | | | | 30 | | | | 30 | | | | 90 | |
Transport, energy and communication | | | 191 | | | | 195 | | | | 1 922 | | | | 2 309 | |
Indirect grant: Integrated national electrification programme: Eskom | | | 191 | | | | 195 | | | | 1 522 | | | | 1 909 | |
Provincial roads maintenance | | | — | | | | — | | | | 400 | | | | 400 | |
| | | | | | | | | | | | | | | | |
Total | | | 2 886 | | | | 4 455 | | | | 11 888 | | | | 19 229 | |
| | | | | | | | | | | | | | | | |
| 1. | South African National Energy Development Institute |
5
2013 BUDGET REVIEW
The fiscal framework
Table W1.2 presents medium-term macroeconomic forecasts for the 2013 Budget. It sets out the growth assumptions and fiscal policy targets on which the fiscal framework is based.
Table W1.2 Medium-term macroeconomic assumptions, 2012/13 – 2015/16
| | | | | | | | | | | | | | | | | | | | | | | | | | | | |
| | | 2012/13 | | | 2013/14 | | | 2014/15 | | | 2015/16 | |
R billion | | 2012
Budget | | | 2013
Budget | | | 2012
Budget | | | 2013
Budget | | | 2012
Budget | | | 2013
Budget | | | 2013
Budget | |
Gross domestic product | | | 3 301.4 | | | | 3 209.1 | | | | 3 622.2 | | | | 3 520.3 | | | | 3 997.0 | | | | 3 880.4 | | | | 4 270.8 | |
Real GDP growth | | | 3.0 | % | | | 2.5 | % | | | 3.8 | % | | | 3.0 | % | | | 4.3 | % | | | 3.6 | % | | | 3.8 | % |
GDP inflation | | | 7.0 | % | | | 5.4 | % | | | 5.7 | % | | | 5.3 | % | | | 5.8 | % | | | 6.5 | % | | | 6.4 | % |
| | | | | | | | | | | | | | | | | | | | | | | | | | | | |
National budget framework | | | | | | | | | | | | | | | | | | | | | | | | | | | | |
Revenue | | | 799.3 | | | | 782.5 | | | | 894.3 | | | | 873.0 | | | | 997.2 | | | | 967.9 | | | | 1 070.7 | |
Percentage of GDP | | | 24.2 | % | | | 24.4 | % | | | 24.7 | % | | | 24.8 | % | | | 24.9 | % | | | 24.9 | % | | | 25.1 | % |
Expenditure | | | 969.4 | | | | 967.0 | | | | 1 053.8 | | | | 1 055.1 | | | | 1 139.6 | | | | 1 138.0 | | | | 1 225.7 | |
Percentage of GDP | | | 29.4 | % | | | 30.1 | % | | | 29.1 | % | | | 30.0 | % | | | 28.5 | % | | | 29.3 | % | | | 28.7 | % |
Main budget balance1 | | | -170.0 | | | | -184.5 | | | | -159.5 | | | | -182.1 | | | | -142.4 | | | | -170.1 | | | | -155.0 | |
Percentage of GDP | | | -5.2 | % | | | -5.7 | % | | | -4.4 | % | | | -5.2 | % | | | -3.6 | % | | | -4.4 | % | | | -3.6 | % |
| | | | | | | | | | | | | | | | | | | | | | | | | | | | |
| 1. | A positive number reflects a surplus and a negative number a deficit |
Table W1.3 sets out the division of revenue for the 2013 MTEF after accounting for new policy priorities.
Table W1.3 Division of nationally raised revenue, 2009/10 – 2015/16
| | | | | | | | | | | | | | | | | | | | | | | | | | | | |
| | | 2009/10 | | | 2010/11 | | | 2011/12 | | | 2012/13 | | | 2013/14 | | | 2014/15 | | | 2015/16 | |
R million | | Outcome | | | Revised
estimate | | | Medium-term estimates | |
Debt-service costs | | | 57 129 | | | | 66 227 | | | | 76 460 | | | | 88 325 | | | | 99 741 | | | | 108 718 | | | | 118 163 | |
Non-interest expenditure | | | 690 068 | | | | 738 914 | | | | 812 063 | | | | 878 642 | | | | 955 333 | | | | 1 029 262 | | | | 1 107 564 | |
Percentage increase | | | 18.7 | % | | | 7.1 | % | | | 9.9 | % | | | 8.2 | % | | | 8.7 | % | | | 7.7 | % | | | 7.6 | % |
| | | | | | | | | | | | | | | | | | | | | | | | | | | | |
Total expenditure | | | 747 197 | | | | 805 141 | | | | 888 523 | | | | 966 967 | | | | 1 055 075 | | | | 1 137 981 | | | | 1 225 727 | |
Percentage increase | | | 17.5 | % | | | 7.8 | % | | | 10.4 | % | | | 8.8 | % | | | 9.1 | % | | | 7.9 | % | | | 7.7 | % |
Contingency reserve | | | — | | | | — | | | | — | | | | — | | | | 4 000 | | | | 6 500 | | | | 10 000 | |
| | | | | | | | | | | | | | | | | | | | | | | | | | | | |
Division of available funds | | | | | | | | | | | | | | | | | | | | | | | | | | | | |
National departments | | | 345 366 | | | | 355 188 | | | | 381 324 | | | | 413 098 | | | | 452 530 | | | | 489 456 | | | | 521 706 | |
Provinces | | | 293 164 | | | | 322 822 | | | | 362 488 | | | | 388 516 | | | | 414 152 | | | | 441 727 | | | | 474 389 | |
Equitable share | | | 236 891 | | | | 265 139 | | | | 291 736 | | | | 313 016 | | | | 337 572 | | | | 359 924 | | | | 383 697 | |
Conditional grants | | | 56 273 | | | | 57 682 | | | | 70 753 | | | | 75 500 | | | | 76 580 | | | | 81 803 | | | | 90 692 | |
Local government | | | 51 537 | | | | 60 904 | | | | 68 251 | | | | 77 028 | | | | 84 651 | | | | 91 579 | | | | 101 469 | |
Equitable share1 | | | 23 845 | | | | 30 541 | | | | 33 173 | | | | 37 373 | | | | 40 582 | | | | 44 490 | | | | 50 208 | |
General fuel levy sharing with metropolitan municipalities | | | 6 800 | | | | 7 542 | | | | 8 573 | | | | 9 040 | | | | 9 613 | | | | 10 190 | | | | 10 659 | |
Conditional grants | | | 20 892 | | | | 22 821 | | | | 26 505 | | | | 30 615 | | | | 34 456 | | | | 36 899 | | | | 40 603 | |
| | | | | | | | | | | | | | | | | | | | | | | | | | | | |
Total | | | 690 068 | | | | 738 914 | | | | 812 063 | | | | 878 642 | | | | 951 333 | | | | 1 022 762 | | | | 1 097 564 | |
| | | | | | | | | | | | | | | | | | | | | | | | | | | | |
Percentage shares | | | | | | | | | | | | | | | | | | | | | | | | | | | | |
National departments | | | 50.0 | % | | | 48.1 | % | | | 47.0 | % | | | 47.0 | % | | | 47.6 | % | | | 47.9 | % | | | 47.5 | % |
Provinces | | | 42.5 | % | | | 43.7 | % | | | 44.6 | % | | | 44.2 | % | | | 43.5 | % | | | 43.2 | % | | | 43.2 | % |
Local government | | | 7.5 | % | | | 8.2 | % | | | 8.4 | % | | | 8.8 | % | | | 8.9 | % | | | 9.0 | % | | | 9.2 | % |
| | | | | | | | | | | | | | | | | | | | | | | | | | | | |
| 1. | With effect from 2006/07, the local government equitable share includes compensation for the termination of Regional Services Council (RSC) and Joint Services Board levies for metros and district municipalities From 2009/10 the RSC levies replacement grant is only allocated to district municipalities |
6
ANNEXURE W1: EXPLANATORY MEMORANDUM TO THE DIVISION OF REVENUE
Table W1.4 shows how additional resources are divided. The new focus areas and additional allocations are accommodated through shifting savings towards priorities.
Table W1.4 Changes over baseline, 2013/14 – 2015/16
| | | | | | | | | | | | |
R million | | 2013/14 | | | 2014/15 | | | 2015/16 | |
National departments | | | 6 310 | | | | 10 628 | | | | 24 752 | |
Provinces | | | 3 060 | | | | 4 723 | | | | 17 283 | |
Local government | | | 793 | | | | 873 | | | | 6 608 | |
| | | | | | | | | | | | |
Allocated expenditure | | | 10 164 | | | | 16 223 | | | | 48 643 | |
| | | | | | | | | | | | |
Table W1.5 sets out schedule 1 of the Division of Revenue Bill, which reflects the legal division of revenue between national, local and provincial government. In this division, the national share includes all conditional grants to provinces and local government in line with section 214(1) of the Constitution, and their allocations reflect equitable shares only.
Table W1.5 Schedule 1 of the Division of Revenue Bill, 2013/14 – 2015/16
| | | | | | | | | | | | |
| | | 2013/14 | | | 2014/15 | | | 2015/16 | |
R million | | Column A
Allocation | | | Column B
Forward estimates | |
National1,2 | | | 676 920 | | | | 733 566 | | | | 791 822 | |
Provincial | | | 337 572 | | | | 359 924 | | | | 383 697 | |
Local | | | 40 582 | | | | 44 490 | | | | 50 208 | |
| | | | | | | | | | | | |
Total | | | 1 055 075 | | | | 1 137 981 | | | | 1 225 727 | |
| | | | | | | | | | | | |
| 1. | National share includes conditional grants to provinces and local government, general fuel levy sharing with metropolitan municipalities, debt-service costs and the contingency reserve |
| 2. | Direct charges for the provincial equitable share are netted out |
The 2013 Budget Review sets out in detail how constitutional issues and government’s priorities are taken into account in the 2013 division of revenue. It focuses on the economic and fiscal policy considerations, revenue issues, debt and financing considerations, and expenditure plans. Aspects of national, provincial and local government financing are discussed in detail in Chapter 8 of the 2013 Budget Review.
¢ Part 3: Response to the recommendations of the FFC
Section 9 of the Intergovernmental Fiscal Relations Act (1997) requires the FFC to make recommendations regarding:
| | a) | “An equitable division of revenue raised nationally, among the national, provincial and local spheres of government; |
| | b) | the determination of each province’s equitable share in the provincial share of that revenue; and |
| | c) | any other allocations to provinces, local government or municipalities from the national government’s share of that revenue, and any conditions on which those allocations should be made.” |
The act requires that the FFC table these recommendations at least 10 months before the start of each financial year. The FFC tabled its Submission for the Division of Revenue 2013/14 to Parliament in May 2012. These recommendations are divided into 10 chapters, which cover three main areas: supporting inclusive growth (jobs, knowledge and regional development); climate change and environmental sustainability (opportunities and risks for inclusive growth and innovation); and institutional development for inclusive growth and innovation.
Section 214 of the Constitution requires that the FFC’s recommendations be considered before tabling the division of revenue. Section 10 of the Intergovernmental Fiscal Relations Act requires that the Minister of Finance table a Division of Revenue Bill with the annual budget in the National Assembly. The bill must be accompanied by an explanatory memorandum setting out how government has taken into account the FFC’s recommendations when determining the division of revenue. This part of the explanatory memorandum complies with this requirement.
7
2013 BUDGET REVIEW
The FFC’s recommendations can be divided into three categories:
| | • | | Recommendations that apply directly to the division of revenue |
| | • | | Recommendations that indirectly apply to issues related to the division of revenue |
| | • | | Recommendations that do not relate to the division of revenue. |
Government responses to the first and second categories are provided below. Recommendations that do not apply to the division of revenue are being considered and dealt with through alternative processes.
Recommendations that apply directly to the division of revenue
Chapter 1: Perspectives and prospects for job creation and the intergovernmental fiscal relations system
Impact of government spending on unemployment
The FFC recommends that, “Government should re-direct government spending towards those activities that directly or indirectly create jobs through enhancing productivity performance. Activities such as health care, durable goods manufacturing, agriculture, community services, and hospitality and food service should also form the basis of much of the expanded infrastructure expenditure plan which traditionally have gone chiefly to construction activities (e.g. building highways and bridges, dams and flood control structures).”
Government response
Job creation is a key priority of government. The 2011 Budget Review discussed proposals to stimulate job creation based on government’s position that job creation is an outcome of business investment and a thriving economy, as well as government’s activities and the regulatory environment. These strategies include promoting education and skills development, the manufacturing competitiveness enhancement programme, the Jobs Fund, a youth wage subsidy, the community work and expanded public works programmes, and government’s infrastructure investment programmes. The 2012 Budget Review highlighted that productivity gains are essential to improved growth and rising incomes. Wage settlements that increase real wages at a pace higher than labour productivity gains threaten the labour market’s recovery and are a key impediment to growth throughout the economy.
Chapter 2: Financing e-education and achieving policy goals in public ordinary schools
Finance e-education and achieve policy goals in public ordinary schools
The FFC recommends that, “E-education policy should be funded as a part of government’s operating budget for the programme, just like teacher salaries, school buildings and other teaching aids.”
Government response
Government supports the FFC’s recommendation that an e-education policy should be funded and implemented, and that provinces should report on the implementation of and spending on e-education policy initiatives. This can be achieved by amending provincial performance indicators so that they include e-education in their annual performance plans and report against it in their annual reports.
Chapter 4: The impact of climate change on South Africa’s rural areas
Adjust the objectives, terms and conditions and procedures of the municipal infrastructure grant
The FFC recommends that, “The Department of Cooperative Governance should adjust the objectives, terms and conditions, and procedures of the municipal infrastructure grant to: (a) permit municipalities to use grant funds for climate adaptation and mitigation investments that involve creating, rehabilitating or modifying municipal infrastructure; and (b) ensure that these investments prioritise and directly address the vulnerabilities faced by poor households.”
8
ANNEXURE W1: EXPLANATORY MEMORANDUM TO THE DIVISION OF REVENUE
Government response
Government, through the Department of Cooperative Governance and the National Treasury, is reviewing the local government functional and fiscal framework, including local government conditional grants. The FFC’s concerns will be taken into account during this review. Possible reforms to the grants could include ensuring that infrastructure development (energy, water and transport sectors) is aligned with South Africa’s broader sustainable development and climate-change objectives.
Special municipal infrastructure grant component
The FFC recommends that, “The Department of Cooperative Governance should restructure the special municipal infrastructure grant component of the municipal infrastructure grant in order to (a) allow municipalities to acquire or rehabilitate ecological infrastructure, provided that the return on investment is greater than a comparable engineering solution; and (b) provide a funding window for rural municipalities to receive resources from the Green Fund and similar global resources in accordance with their terms and conditions.”
Government response
This issue will be addressed as part of the local government functional and fiscal framework review process discussed above.
Chapter 5: Alternative financing mechanisms for disaster management in South Africa
The design of existing key municipal conditional grant programmes
The FFC recommends that, “National Treasury should require that environmental management and vulnerability objectives are explicitly incorporated into the design of existing key municipal grant programmes. These objectives should promote disaster risk-reduction methods (ex ante approach) and enhance municipal resilience to climate change through mitigation and adaptation methods. They should: (a) include the integrated housing and human settlement development grant, the urban settlements development grant, the municipal infrastructure grant, the national electrification grant, the public transport infrastructure and systems grant and the regional bulk infrastructure grant; (b) incorporate a statement of environmental and climate-change resilience objectives in each grant programme, together with measurable indicators; (c) prioritise the most vulnerable municipalities when determining the horizontal division of available resources in each programme; (d) provide for beneficiary municipalities to conduct appropriate climate-resilience evaluations on existing infrastructure over the medium term, subject to disaster risk-reduction methods being incorporated in respective integrated development plans; and (e) be accompanied by capacity support to and engagement with the most vulnerable municipalities to ensure that they are able to identify and address disaster risk comprehensively.”
Government response
Government has developed a planning toolkit for climate-change response to help municipalities incorporate mitigation, adaptation and response strategies into their integrated development plans and other planning processes. In the horizontal division of available resources, several factors are considered to promote equity, including the fiscal capacity and efficiency of municipalities. Vulnerability to climate-change impacts does not necessarily translate into a lack of fiscal capacity. As a result, using climate-change vulnerability as a key indicator of determining the municipalities’ equitable share or other grant allocations may compromise the principle of equity.
9
2013 BUDGET REVIEW
Chapter 6: Financing of waste management in South Africa
Job creation in the waste management sector
The FFC recommends that, “Government should take greater advantage of the opportunities for job creation in the solid waste sector, by incentivising municipalities to create ‘green’ jobs through labour-intensive service delivery. In particular: (a) the Department of Public Works should review the expanded public works programme, which may negatively impact on the ability of municipalities to support job creation in the sector due to the comparatively higher capital costs associated with solid waste collection and recycling activities; (b) the Department of Cooperative Governance should review the funding conditions of the municipal infrastructure grant to ensure that local-level municipal waste management assets are eligible for financing; (c) a portion of resources from the recently established Green Fund should provide transitional financial support to municipalities that introduce innovative, labour-intensive waste collection, reduction and recycling mechanisms to areas where services are currently inadequate. These might include developing small waste collection and recycling contractors or community cooperatives to manage waste buy-back centres and materials recovery facilities; and (d) the Department of Environmental Affairs should develop municipal guidelines and regulations that support community involvement in waste management activities through community-based trusts and partnerships.”
Government response
Government, being conscious of the potential economic and social returns, is committed to investing in a green economy. The green economy is one of the New Growth Path’s ten “job drivers”. These interventions will accelerate and sustain economic growth in a more labour-absorbing, value-adding and environmentally sustainable manner.
Government will review the local government infrastructure conditional grants (including the municipal infrastructure grant and other infrastructure grants) during 2013/14. The FFC’s proposals will be considered as part of this review.
Expand access to solid waste services to poor households
The FFC recommends that, “Government should emphasise the expansion of access to solid waste services to poor communities, while strengthening the policy framework for the provision of refuse removal free basic services. In particular: (a) the Department of Cooperative Governance should review the municipal infrastructure grant guidelines to ensure that (i) adequate funding for solid waste assets is available to municipalities with weaker fiscal capacity; and (ii) expenditures on specialised vehicles and equipment required for solid waste management services are eligible for financing; (b) the Department of Environmental Affairs should prioritise support to municipalities seeking to expand services to poor communities using labour-intensive service delivery, including investigating potential fiscal instruments that might be incorporated with the expanded public works programme or Green Fund; and (c) the Department of Environmental Affairs should commission a review of the refuse removal free basic services policy, with a specific focus on its impacts on (i) expanding and sustaining services to poor households; (ii) the affordability and quality of service to poor households; and (iii) environmental impacts, such as the extent of reduction in illegal dumping.”
Government response
Government acknowledges the importance of promoting sustainable access to solid waste services. Conditional grants and the local government equitable share already provide funding for access to services for poor households. The primary capital grants available for municipal solid waste facilities are the municipal infrastructure grant and the urban settlements development grant. The municipal infrastructure grant provides basic residential infrastructure for poor households. The grant can be used for new infrastructure, upgrading bulk and connector infrastructure, or the rehabilitation of existing infrastructure. The urban settlements development grant replaced the municipal infrastructure grant in metropolitan municipalities. The local government equitable share includes funds for the operational costs of providing solid waste services. The equitable share formula was reviewed during 2012 (in partnership with the FFC) and the infrastructure grants will be reviewed during 2013/14. The FFC’s proposals will be taken into account as part of this process.
10
ANNEXURE W1: EXPLANATORY MEMORANDUM TO THE DIVISION OF REVENUE
The National Policy for the Provision of Basic Refuse Removal Services to Indigent Households was gazetted in June 2011 and should be given time to be implemented before it is reviewed. The Department of Environmental Affairs provides support to municipalities through a range of measures that are being continually strengthened.
Chapter 7: The impact of aggregate revenue and expenditure assignments on economic growth – the case of provinces and municipalities in South African intergovernmental relations
The role of non-metropolitan municipalities in economic growth
The FFC proposes that, “Municipalities, and particularly non-metropolitan municipalities, should be encouraged to play a more direct role in economic growth. This can be achieved by (a) national government assigning greater revenue and tax handles to the municipalities than is presently the case; and (b) reassessing all elements to support the growth-enhancing role of municipalities, when reviewing the fiscal framework. These elements would include local government equitable share, local own-revenue sources (e.g. local business taxes) and conditional grants. Such reassessment should ensure a better balance between equity and growth objectives in the local government fiscal framework.”
Government response
Government agrees that municipalities have an important role to play in supporting economic growth and that their ability to raise their own revenue creates both a source of funding for this objective and a positive incentive to promote economic activity in their municipal area. Government also agrees that potential impacts on economic growth should be considered in any review of local government funding. However, the fiscal framework also has to balance the need to ensure that government is able to meet its social and other objectives with the need to promote economic growth. Municipalities must ensure that they are making full use of their existing revenue-raising powers and that they spend their budgets efficiently.
Chapter 9: Understanding the dynamics of the capacity challenge at local government level
Environmental constraints
The FFC is of the view that, “Environmental constraints, specifically with respect to the allocation of powers and functions and the formulation of conditional grants, may need to be simultaneously adjusted.”
Government response
Government agrees that funding and capacity should be based on the assignment of powers and functions. Any change in these responsibilities should be accompanied by an assessment of whether changes are needed in the conditional grant and capacity-support systems.
Capacity-related conditional grants
The FFC recommends that, “The grants’ conditionality must commit municipalities to specific, independently verifiable capacity and performance improvements. Grants should be redesigned to consider the quality of capacity-building interventions, instead of having a narrow quantitative focus; and an external, objective evaluation dimension should also be included in capacity grant requirements.”
Government response
National government took steps in 2010/11 to streamline and focus capacity-building support efforts. The financial management grant and municipal systems improvement grant frameworks have been improved to remove overlaps and include conditionalities. Commitments and their deliverables are being audited in line with the accountability arrangements in the Division of Revenue Act.
11
2013 BUDGET REVIEW
Recommendations that indirectly apply to the division of revenue
Chapter 2: Financing e-education and achieving policy goals in public ordinary schools
Finance e-education and achieve policy goals in public ordinary schools in South Africa
The FFC recommends that, “A well-structured, inter-governmental financing mechanism should be established with explicit guidelines to provincial departments of education regarding the budget line items that must be prioritised in their annual budget allocations, as well as those budget line items that will be contained in the national budget allocation. Decisions on the particular line items can be informed by a review of policy documents and various studies conducted on e-education over several years and by a broader review of the available knowledge of e-education financing across the globe.
“The impact of e-education policy and financing should be continuously assessed, taking into account cross-departmental issues and supporting measures from a range of government departments and relevant public-sector bodies (Department of Basic Education, Department of Higher Education and Training, Department of Labour, Department of Science and Technology, Department of Communications, metropolitan municipalities, the Independent Communications Authority of South Africa and others). Such assessment would consider both school-level and economy-wide impacts. From an analytical perspective, the requirements would be twofold: (a) to understand how e-education affects students’ decisions about acquiring ongoing skills in the education system (econometric analysis coupled with case studies, repeated over time); and (b) to consider interactions between e-education and the rest of the economy. Quantifying these interactions allows the value of various policy and financing options to be compared.”
Government response
Government agrees that successful e-education requires both content and technology. Education departments will need to allocate resources for infrastructure, hard and software, and training for the implementation of e-education policies. These must be integrated with and support the delivery of the curriculum. E-education should be factored into existing norms and standards and be included in routine budgeting, monitoring and evaluation.
Chapter 6: Financing of waste management in South Africa
Full cost accounting
The FFC proposes that, “By the end of the 2015/16 financial year, government should phase in full cost accounting for solid waste management within municipalities. To achieve this goal, (a) government should develop specific (full cost accounting) guidelines for integrated municipal solid waste management that addresses the specific and interrelated environmental and service delivery needs of the sector, within the framework of activity-based costing that the National Treasury is introducing; and (b) government should develop a capacity-support programme to implement the guidelines that allows a phased introduction of full cost accounting starting with high-capacity municipalities that face major solid waste management.”
Government response
Government agrees that full cost accounting for solid waste should be phased in within municipalities. This will help determine the full costs of solid waste management as well as its component costs, which will allow municipalities to identify the service’s key cost drivers. Government has introduced many initiatives to support municipalities, such as the successful training of waste officers on waste-related issues. The Department of Environmental Affairs has also produced a costing tool to help municipalities cost their waste management service and set appropriate tariffs. Government will continue to encourage municipalities to use these tools.
12
ANNEXURE W1: EXPLANATORY MEMORANDUM TO THE DIVISION OF REVENUE
Chapter 7: The impact of aggregate revenue and expenditure assignments on economic growth – the case of provinces and municipalities in South African intergovernmental relations
Alternative aggregate revenue and expenditure assignment for provinces and municipalities
The FFC recommends that, “The key principles of national strategies such as the New Growth Path document and the National Planning Commission’s Vision for 2030 need to permeate provincial and local strategies. This can be achieved by translating these principles into complete sub-national strategies with full details on sustained implementation, followed by provincial and local governments’ commitment to achieve the goals identified in the strategies. Key components for sub-national government to consider are capital and labour inputs, and multifactor productivity. Provincial and municipal governments should continue to invest in physical and human capital, focusing specifically on issues such as lack of adequate skills and physical infrastructure needs (maintenance, better location, etc). In addition, effective management and accountability mechanisms should be aimed at increasing multifactor productivity.”
Government response
Government agrees that provinces and municipalities should continue to invest in physical and human capital. These investments should be consistent with the policy direction set out in the New Growth Path, the National Development Plan and other policies adopted by Cabinet.
Municipal revenue-collection efforts
The FFC is of the view that, “Municipalities are not necessarily doing a good job of collecting revenue from the public. Hence, municipalities need to improve their revenue-collection efforts, as these can positively contribute towards economic growth. It is well known that in South Africa some municipalities (for example, metropolitan municipalities) are raising substantial revenues, while other municipalities are still very dependent on transfers from national government. Issues that need to be addressed include weak capacity within local administrations, small tax bases, delivery of free basic services requiring high municipal expenditures (that can only be financed through national transfers), and a lack of ‘payment culture’ for services.”
Government response
Government acknowledges that revenue-collecting performance varies widely among municipalities. Not all municipalities have the potential to collect the same proportion of income from own revenue, but they all need to make the necessary effort to collect what they can. Failure to do so leaves municipalities with fewer resources to invest in service delivery, including services that support economic growth. While national government agrees that weak capacity within municipalities and a “lack of payment culture” are important issues to address, the costs of free basic services for poor households are already funded by transfers through the local government equitable share. Municipalities with small tax bases are still responsible for collecting revenue due to them and should be able to fund their operations with a combination of transfers and own revenues if they spend efficiently.
Government is addressing the quality of municipalities’ revenue-management capabilities through an in-depth analysis of the revenue value chain, considering all variables that constitute effective and efficient revenue management. Government agrees that the municipal administrative capabilities should be enhanced by building institutional knowledge and improving their ability to enforce by-laws.
Chapter 9: Understanding the dynamics of the capacity challenge at local government level
Capacity-building interventions
The FFC recommends that, “Capacity-building interventions should holistically coordinate individual, organisational and institutional level dimensions of capacity building in a particular municipality over the medium term. Instead of focusing disproportionately on training, support programmes should include technical support for new systems, business process redesign and change management, based on an assessment of the relevant municipality. The level dimensions have been summarised as follows:
13
2013 BUDGET REVIEW
“Individual: officials must have the necessary technical skills, knowledge, experience and competencies to fulfil their particular functions. This means appointing the correct person to the correct post (adherence to recruitment, selection and any minimum competency requirements) and ensuring that officials then receive training (both accredited and non-accredited) relevant to their areas of responsibilities, to ensure continued workplace effectiveness.
“Organisational: municipalities should be supported in compiling realistic integrated development plans, implementing functional and effective performance management systems and knowledge management policies, to enhance organisational memory and data management, and to ensure accurate and relevant reporting. Critical vacancies must also be filled and workable staff-retention strategies implemented. Skilled individuals must be appointed to vacant positions for which affirmative action candidates cannot be found, and audits should be conducted of municipal positions that fall outside the approved organisational structures.
“Institutional: greater differentiation and flexibility is required in the design of the local government fiscal framework. A differentiated approach is needed for the assignment of functions to municipalities, based on their capacity to effectively manage them. Once a municipality has proved its ability to provide a specific basket of services, decisions can be made regarding expanding the range of services provided by such a municipality. Where service delivery failures persist, such services should be removed from municipalities. Furthermore, the establishment of a coordinated capacity-building function across all local government departments is recommended. These actions must be complemented by simplified, streamlined and coordinated reporting requirements for local government and clearly defined roles and responsibilities for national and provincial departments. To assist rural municipalities, the value and practicality of an assistance programme should be explored, aimed at attracting and retaining scarce skills in these areas (similar to the scarce skills payments made to doctors in rural areas).”
Government response
Government supports the recommendations relating to the different dimensions of capacity building. The National Treasury has developed a strategy for capacity building that incorporates these dimensions to deal with financial management disciplines in national, provincial and local government. Government also agrees that minimum standards should be set for the sectors identified in the recommendations. The sector departments, with legislated responsibilities in their respective areas, have also been encouraged to address capacity building in a holistic manner. For the recommendation to be effective, all sectors and spheres of government need to implement systems that ensure the appointment of suitably skilled and qualified officials.
Minimum competencies entrenched in the Municipal Finance Management Act
The FFC recommends that, “Minimum competencies as entrenched in the Municipal Finance Management Act should be enforced so as to ensure that appropriate technical skills are in place. Based on field work conducted by the Commission, the following functions require particular attention: revenue management, supply chain management, sewerage and water treatment plant operators, road maintenance supervisors, health inspectors and planning and project managers.”
Government response
Government agrees with the recommendations. The National Treasury set out the compliance process for minimum competency requirements in regulations promulgated in 2007, which came into effect on 1 January 2013. The regulations cover a wide range of financial management disciplines, including revenue management, supply chain management and project management. To facilitate the process and improve communication and compliance, the National Treasury has issued Municipal Finance Management Act circulars, most recently in April 2012. This circular addressed the support measures in place, recognition of prior learning, non-compliance and consideration of special merit cases, reporting requirements, accountability arrangements for municipal managers, and requirements to include these arrangements in performance agreements of senior managers.
14
ANNEXURE W1: EXPLANATORY MEMORANDUM TO THE DIVISION OF REVENUE
Chapter 10: Assessing gender-responsive budgeting in local government
Assess gender-responsive budgeting in local government
The FFC recommends that, “National and provincial governments should (a) run gender budgeting pilots in a few municipalities first and evaluate results before wider application. These pilots could be linked to ensuring gender disaggregated data for key conditional grants as part of the grant framework in the Division of Revenue Act; (b) ensure municipal integrated development plans institutionalise gender planning by sector (e.g. water and sanitation, local economic development etc.) and include gender disaggregated performance indicators and targets; (c) provide gender budgeting good practice guides and toolkits; and (d) provide guidelines for collecting sex-disaggregated data for budgeting processes and ensure that municipalities have the capacity to analyse budgets from a gender perspective.”
The FFC also proposes that, “Local government should (a) institutionalise gender-responsive budgeting process linked to integrated development plans; (b) build capacity for gender mainstreaming and gender-responsive budgeting at local level; (c) ensure gender-responsive appropriations and budget allocations; and (d) ensure gender-sensitive public participation and consultations at local level.”
Government response
Government supports the proposals, which will help ensure that the collection and allocation of public resources is effectively carried out and contributes to advancing gender equality and women’s empowerment. It will provide tools to assess the different needs and contributions of men, women, boys and girls within existing revenues, expenditures and allocations, and will call for adjusted budget policies to benefit all groups.
Gender-responsive budget analysis, along with legislation and other practical policy measures, can address gender bias and discrimination. It is a step towards increased accountability and public transparency, and it can shift economic policies leading to gains across society. However, the proposals’ implementation may be hindered by capacity constraints in municipalities.
¢ Part 4: Provincial allocations
Sections 214 and 227 of the Constitution require that an equitable share of nationally raised revenue be allocated to provincial government to enable it to provide basic services and perform its allocated functions.
Of the R44.3 billion added to the provincial baseline over the next three years, the provincial equitable share baselines are revised upwards by R36.1 billion and conditional grants are increased by R8.2 billion. National transfers to provinces increase from R388.7 billion in 2012/13 to R414.2 billion in 2013/14. Over the MTEF period, provincial transfers will grow at an average annual rate of 6.9 per cent to R474.4 billion in 2015/16.
Table W1.6 sets out the total transfers to provinces for 2013/14, which amount to R414.2 billion, with R337.6 billion allocated to the provincial equitable share and R76.6 billion to conditional grants, which includes an unallocated R188 million for the provincial disaster grant, but excludes indirect transfers of R13.4 billion.
15
2013 BUDGET REVIEW
Table W1.6 Total transfers to provinces, 2013/14
| | | | | | | | | | | | |
R million | | Equitable
share | | | Conditional
grants | | | Total
transfers | |
Eastern Cape | | | 50 165 | | | | 9 466 | | | | 59 631 | |
Free State | | | 20 000 | | | | 6 021 | | | | 26 021 | |
Gauteng | | | 61 375 | | | | 15 510 | | | | 76 885 | |
KwaZulu-Natal | | | 73 510 | | | | 14 575 | | | | 88 085 | |
Limpopo | | | 41 362 | | | | 7 179 | | | | 48 541 | |
Mpumalanga | | | 27 211 | | | | 5 788 | | | | 32 998 | |
Northern Cape | | | 9 022 | | | | 3 274 | | | | 12 295 | |
North West | | | 22 754 | | | | 4 990 | | | | 27 744 | |
Western Cape | | | 32 175 | | | | 9 589 | | | | 41 764 | |
Unallocated | | | — | | | | 188 | | | | 188 | |
| | | | | | | | | | | | |
Total | | | 337 572 | | | | 76 580 | | | | 414 152 | |
| | | | | | | | | | | | |
Provincial equitable share
The equitable share constitutes the main source of revenue for meeting provincial expenditure responsibilities. The proposed revisions of R7.4 billion, R10.1 billion and R18.6 billion bring the equitable share allocations to R337.6 billion in 2013/14, R359.9 billion in 2014/15 and R383.7 billion in 2015/16. These revisions result in the provincial equitable share increasing by 7.2 per cent between 2012/13 and 2013/14, and growing at an average annual rate of 6.8 per cent over the MTEF. These equitable share amounts include R2 billion in 2013/14, R2.2 billion in 2014/15 and R2.3 billion in 2015/16, which were previously part of the devolution of property rate funds grant. This grant is being phased into the provincial equitable share in the 2013 MTEF. The phase-in process is discussed in more detail later.
Policy priorities underpinning equitable share revisions
The revisions to baseline equitable share allocations provide for personnel and policy adjustments for funding of urgent government priorities identified in education, health and social development. The personnel adjustments provide for the impact of the 2012 wage agreements on personnel budgets in all sectors. Policy-related adjustments to the provincial equitable share provide for an increased number of teachers in Quintile 1 schools and in Grade R, improved diagnostic tests for tuberculosis, absorption of social work graduates, and support to non-governmental organisations for the provision of social welfare services.
The equitable share formula
The provincial equitable share formula is reviewed and updated with new data annually. For the 2013 MTEF, the formula has been updated with data from the 2011 Census on the population and the school-age cohort (5 to 17 year olds); data from the 2012 School Realities Survey conducted by the Department of Basic Education on school enrolment; data from the 2011 General Household Survey for medical aid coverage; data from the health sector and the Risk Equalisation Fund for the risk-adjusted capitation index; and data from the 2010 gross domestic product by region (GDP-R) survey and the 2010 Income and Expenditure Survey for poverty. The impact of these updates on the provincial equitable share is phased in over three years (2013/14 to 2015/16).
Because the formula is largely population-driven, the allocations capture shifts in population across provinces, which leads to changes in the relative demand for public services across these areas. This can be seen in the changes in the equitable shares of different provinces after updating the formula with population data from the 2011 Census.
16
ANNEXURE W1: EXPLANATORY MEMORANDUM TO THE DIVISION OF REVENUE
Population shifts in 2011 Census data
Over 60 per cent of the formula uses population data and the new census reveals larger changes in the population of some provinces than anticipated in the mid-year population estimates (used to update the formula in previous years). Table W1.7 below shows population changes between the 2011 mid-year estimates used in the 2012 formula and the 2011 Census data. Some provinces recorded significantly smaller populations in the 2011 Census than had been estimated, including KwaZulu-Natal, the Eastern Cape, Limpopo and the Free State. Gauteng has the highest population increase of close to 1 million people.
Table W1.7 2011 mid-year estimates vs 2011 Census
| | | | | | | | | | | | | | | | | | | | | | | | |
| | | 2011 mid-
year
estimates | | | 2011 Census | | | Population
shifts | | | Percentage
shares
(mid-year
2011) | | | Percentage
shares
(2011
Census) | | | Population
shifts | |
Eastern Cape | | | 6 829 958 | | | | 6 562 053 | | | | -267 905 | | | | 13.5 | % | | | 12.7 | % | | | -0.83 | % |
Free State | | | 2 759 644 | | | | 2 745 590 | | | | -14 054 | | | | 5.5 | % | | | 5.3 | % | | | -0.15 | % |
Gauteng | | | 11 328 203 | | | | 12 272 263 | | | | 944 060 | | | | 22.4 | % | | | 23.7 | % | | | 1.31 | % |
KwaZulu-Natal | | | 10 819 130 | | | | 10 267 300 | | | | -551 830 | | | | 21.4 | % | | | 19.8 | % | | | -1.55 | % |
Limpopo | | | 5 554 657 | | | | 5 404 868 | | | | -149 789 | | | | 11.0 | % | | | 10.4 | % | | | -0.54 | % |
Mpumalanga | | | 3 657 181 | | | | 4 039 939 | | | | 382 758 | | | | 7.2 | % | | | 7.8 | % | | | 0.57 | % |
Northern Cape | | | 1 096 731 | | | | 1 145 861 | | | | 49 130 | | | | 2.2 | % | | | 2.2 | % | | | 0.05 | % |
North West | | | 3 253 390 | | | | 3 509 953 | | | | 256 563 | | | | 6.4 | % | | | 6.8 | % | | | 0.35 | % |
Western Cape | | | 5 287 863 | | | | 5 822 734 | | | | 534 871 | | | | 10.5 | % | | | 11.2 | % | | | 0.79 | % |
| | | | | | | | | | | | | | | | | | | | | | | | |
Total | | | 50 586 757 | | | | 51 770 561 | | | | 1 183 804 | | | | 100.0 | % | | | 100.0 | % | | | — | |
| | | | | | | | | | | | | | | | | | | | | | | | |
Provision for 2011 Census impact
The formula has been updated to reflect these shifts in provincial populations. As a result, provinces with increased populations received additional resources for their growing service-delivery responsibilities, while those with decreasing populations receive reduced allocations. Sufficient time will be given to provinces with reduced populations to adjust to smaller budgets. An addition of R6.3 billion is made available over the MTEF to cushion the impact of the new census data. An amount of R4.2 billion is added as a “top-up” for provinces with declining shares over the MTEF, and R2.1 billion is extended to all nine provinces and allocated through the formula in 2015/16. The R4.2 billion top-up for the four provinces with declining shares is shown in Table W1.8.
Table W1.8 Provincial equitable share: Cushioning for 2011 Census impact on provinces with declining shares
| | | | | | | | | | | | |
| | | 2013/14 | | | 2014/15 | | | 2015/16 | |
R thousand | | Medium-term estimates | |
Eastern Cape | | | 185 962 | | | | 421 166 | | | | 685 628 | |
Free State | | | 34 594 | | | | 78 350 | | | | 171 261 | |
Gauteng | | | — | | | | — | | | | — | |
KwaZulu-Natal | | | 289 915 | | | | 656 600 | | | | 773 075 | |
Limpopo | | | 131 193 | | | | 297 127 | | | | 487 036 | |
Mpumalanga | | | — | | | | —�� | | | | — | |
Northern Cape | | | — | | | | — | | | | — | |
North West | | | — | | | | — | | | | — | |
Western Cape | | | — | | | | — | | | | — | |
| | | | | | | | | | | | |
Total | | | 641 664 | | | | 1 453 243 | | | | 2 117 000 | |
| | | | | | | | | | | | |
17
2013 BUDGET REVIEW
This allocation will only provide relief in the 2013 MTEF. From 2016/17, the provincial equitable share will be allocated solely through the formula with no additions to support provinces with declining shares. Provinces must use the three years of support provided to adjust to their new baselines.
Phasing in the formula
To mitigate the impact of data updates on provincial equitable shares, the new shares are phased in over the MTEF. The data is updated each year and a new target share is calculated, which is shown in Table W1.9. The table shows the revised weighted provincial equitable shares for the period 2013/14 to 2015/16.
Table W1.9 Implementation of the equitable share weights, 2013/14 – 2015/16
| | | | | | | | | | | | | | | | |
| | | 2012/13 | | | 2013/14 | | | 2014/15 | | | 2015/16 | |
Percentage | | Weighted
shares | | | 2013 MTEF weighted shares 3-
year phasing | |
Eastern Cape | | | 15.2 | % | | | 14.9 | % | | | 14.5 | % | | | 14.2 | % |
Free State | | | 6.0 | % | | | 5.9 | % | | | 5.8 | % | | | 5.6 | % |
Gauteng | | | 17.6 | % | | | 18.2 | % | | | 18.8 | % | | | 19.4 | % |
KwaZulu-Natal | | | 21.9 | % | | | 21.7 | % | | | 21.5 | % | | | 21.3 | % |
Limpopo | | | 12.6 | % | | | 12.3 | % | | | 12.0 | % | | | 11.8 | % |
Mpumalanga | | | 8.1 | % | | | 8.1 | % | | | 8.1 | % | | | 8.2 | % |
Northern Cape | | | 2.7 | % | | | 2.7 | % | | | 2.7 | % | | | 2.7 | % |
North West | | | 6.7 | % | | | 6.7 | % | | | 6.8 | % | | | 6.9 | % |
Western Cape | | | 9.3 | % | | | 9.5 | % | | | 9.7 | % | | | 10.0 | % |
| | | | | | | | | | | | | | | | |
Total | | | 100.0 | % | | | 100.0 | % | | | 100.0 | % | | | 100.0 | % |
| | | | | | | | | | | | | | | | |
Summary of the formula’s structure
The formula, shown in Table W1.10 below, consists of six components that capture the relative demand for services between provinces and take into account specific provincial circumstances. The formula’s components are neither indicative budgets nor guidelines as to how much should be spent on functions in each province or by provinces collectively. Rather, the education and health components are weighted broadly in line with historical expenditure patterns to indicate relative need. Provincial executive councils have discretion regarding the determination of departmental allocations for each function, taking into account the priorities that underpin the division of revenue.
Table W1.10 Distributing the equitable shares by province, 2013 MTEF
| | | | | | | | | | | | | | | | | | | | | | | | | | | | |
| | | Education
48% | | | Health
27% | | | Basic share
16% | | | Poverty
3% | | | Economic
activity
1% | | | Institu-
tional
5% | | | Weighted
average
100% | |
Eastern Cape | | | 15.3 | % | | | 13.5 | % | | | 12.7 | % | | | 16.3 | % | | | 7.7 | % | | | 11.1 | % | | | 14.2 | % |
Free State | | | 5.3 | % | | | 5.4 | % | | | 5.3 | % | | | 5.4 | % | | | 5.5 | % | | | 11.1 | % | | | 5.6 | % |
Gauteng | | | 17.3 | % | | | 21.9 | % | | | 23.7 | % | | | 16.9 | % | | | 33.7 | % | | | 11.1 | % | | | 19.4 | % |
KwaZulu-Natal | | | 22.7 | % | | | 21.7 | % | | | 19.8 | % | | | 22.2 | % | | | 15.8 | % | | | 11.1 | % | | | 21.3 | % |
Limpopo | | | 13.1 | % | | | 10.3 | % | | | 10.4 | % | | | 13.6 | % | | | 7.2 | % | | | 11.1 | % | | | 11.8 | % |
Mpumalanga | | | 8.5 | % | | | 7.2 | % | | | 7.8 | % | | | 9.1 | % | | | 7.0 | % | | | 11.1 | % | | | 8.2 | % |
Northern Cape | | | 2.3 | % | | | 2.2 | % | | | 2.2 | % | | | 2.2 | % | | | 2.3 | % | | | 11.1 | % | | | 2.7 | % |
North West | | | 6.5 | % | | | 6.7 | % | | | 6.8 | % | | | 8.0 | % | | | 6.7 | % | | | 11.1 | % | | | 6.9 | % |
Western Cape | | | 8.9 | % | | | 11.1 | % | | | 11.2 | % | | | 6.1 | % | | | 14.1 | % | | | 11.1 | % | | | 10.0 | % |
| | | | | | | | | | | | | | | | | | | | | | | | | | | | |
Total | | | 100.0 | % | | | 100.0 | % | | | 100.0 | % | | | 100.0 | % | | | 100.0 | % | | | 100.0 | % | | | 100.0 | % |
| | | | | | | | | | | | | | | | | | | | | | | | | | | | |
18
ANNEXURE W1: EXPLANATORY MEMORANDUM TO THE DIVISION OF REVENUE
Full impact of data updates on the provincial equitable share
Table W1.11 shows the full impact of the data updates on the provincial equitable share per province. The provinces with negative shifts in population according to the 2011 Census experienced a declining trend in their equitable shares, with significant upward revisions in the shares of provinces with increased population numbers. This table compares the target shares for the 2012 and 2013 MTEF.
Table W1.11 Full impact on data updates on the equitable share
| | | | | | | | | | | | |
| | | 2012 MTEF | | | 2013 MTEF | | | Difference | |
Eastern Cape | | | 14.9 | % | | | 14.2 | % | | | -0.79 | % |
Free State | | | 5.8 | % | | | 5.6 | % | | | -0.20 | % |
Gauteng | | | 18.0 | % | | | 19.4 | % | | | 1.44 | % |
KwaZulu-Natal | | | 22.2 | % | | | 21.3 | % | | | -0.89 | % |
Limpopo | | | 12.4 | % | | | 11.8 | % | | | -0.56 | % |
Mpumalanga | | | 7.9 | % | | | 8.2 | % | | | 0.24 | % |
Northern Cape | | | 2.6 | % | | | 2.7 | % | | | 0.05 | % |
North West | | | 6.6 | % | | | 6.9 | % | | | 0.21 | % |
Western Cape | | | 9.4 | % | | | 10.0 | % | | | 0.51 | % |
| | | | | | | | | | | | |
Total | | | 100.0 | % | | | 100.0 | % | | | — | |
| | | | | | | | | | | | |
For the 2013 Budget, the formula components are set out as follows:
| | • | | An education component (48 per cent) based on the size of the school-age population (ages 5 to 17) and the number of learners (Grade R to 12) enrolled in public ordinary schools. |
| | • | | A health component (27 per cent) based on a combination of a risk-adjusted capitation index for the population, which takes into account the health risks associated with the demographic profile of the population and the relative share of case-loads in hospitals. The risk-adjusted capitation index is given a 75 per cent weighting and the case-load (output component) has a 25 per cent weighting. |
| | • | | A basic component (16 per cent) derived from each province’s share of the national population. |
| | • | | An institutional component (5 per cent) divided equally between the provinces. |
| | • | | A poverty component (3 per cent) reinforcing the redistributive bias of the formula. |
| | • | | An economic output component (1 per cent) based on GDP-R data. |
Education component (48 per cent)
The education component uses the school-age population (5 to 17 years), based on the 2011 Census, and enrolment data drawn from the 2012 School Realities Survey conducted by the Department of Basic Education. Each of these elements is assigned a weight of 50 per cent.
Table W1.12 shows the changes in the school-going age population between the census of 2001 and 2011.
19
2013 BUDGET REVIEW
Table W1.12 Impact of changes in school enrolment on the education component share
| | | | | | | | | | | | | | | | | | | | | | | | | | | | |
| | | | | | | | | | | | | | | | | | Difference in | |
| | | Age cohort | | | School enrolment | | | Changes in | | | Weighted average | | | weighted | |
| | | 5 – 17 | | | 2011 | | | 2012 | | | enrolment | | | 2012 MTEF | | | 2013 MTEF | | | average | |
Eastern Cape | | | 1 856 317 | | | | 1 963 578 | | | | 1 938 837 | | | | -24 741 | | | | 16.3 | % | | | 15.3 | % | | | -0.99 | % |
Free State | | | 657 489 | | | | 658 010 | | | | 660 966 | | | | 2 956 | | | | 5.6 | % | | | 5.3 | % | | | -0.29 | % |
Gauteng | | | 2 231 793 | | | | 2 017 931 | | | | 2 062 526 | | | | 44 595 | | | | 15.7 | % | | | 17.3 | % | | | 1.66 | % |
KwaZulu-Natal | | | 2 758 594 | | | | 2 847 378 | | | | 2 866 369 | | | | 18 991 | | | | 23.2 | % | | | 22.7 | % | | | -0.52 | % |
Limpopo | | | 1 536 294 | | | | 1 695 524 | | | | 1 714 518 | | | | 18 994 | | | | 13.9 | % | | | 13.1 | % | | | -0.73 | % |
Mpumalanga | | | 1 053 846 | | | | 1 046 551 | | | | 1 051 356 | | | | 4 805 | | | | 8.4 | % | | | 8.5 | % | | | 0.09 | % |
Northern Cape | | | 288 839 | | | | 274 745 | | | | 276 420 | | | | 1 675 | | | | 2.2 | % | | | 2.3 | % | | | 0.08 | % |
North West | | | 824 724 | | | | 765 120 | | | | 774 615 | | | | 9 495 | | | | 6.3 | % | | | 6.5 | % | | | 0.15 | % |
Western Cape | | | 1 174 625 | | | | 1 015 038 | | | | 1 034 392 | | | | 19 354 | | | | 8.4 | % | | | 8.9 | % | | | 0.56 | % |
| | | | | | | | | | | | | | | | | | | | | | | | | | | | |
Total | | | 12 382 521 | | | | 12 283 875 | | | | 12 379 999 | | | | 96 124 | | | | 100.0 | % | | | 100.0 | % | | | — | |
| | | | | | | | | | | | | | | | | | | | | | | | | | | | |
Table W1.13 shows the impact of the changes in school-age cohort (5 to 17 years) and new enrolment data on the education component shares.
Table W1.13 School-age cohort, 5 – 17 years (2001 Census versus 2011 Census)
| | | | | | | | | | | | | | | | | | | | | | | | |
Province | | Person age
5 – 17
(Census 2001) | | | Person age
5 – 17
(Census 2011) | | | Population
shifts | | | Percentage
shares (2001) | | | Percentage
shares (2011) | | | Population
shifts | |
Eastern Cape | | | 2 151 992 | | | | 1 856 317 | | | | -295 675 | | | | 16.6 | % | | | 15.0 | % | | | -1.65 | % |
Free State | | | 760 486 | | | | 657 489 | | | | -102 997 | | | | 5.9 | % | | | 5.3 | % | | | -0.57 | % |
Gauteng | | | 1 931 719 | | | | 2 231 793 | | | | 300 074 | | | | 14.9 | % | | | 18.0 | % | | | 3.09 | % |
KwaZulu-Natal | | | 3 013 243 | | | | 2 758 594 | | | | -254 649 | | | | 23.3 | % | | | 22.3 | % | | | -1.02 | % |
Limpopo | | | 1 798 862 | | | | 1 536 294 | | | | -262 568 | | | | 13.9 | % | | | 12.4 | % | | | -1.50 | % |
Mpumalanga | | | 1 074 972 | | | | 1 053 846 | | | | -21 126 | | | | 8.3 | % | | | 8.5 | % | | | 0.20 | % |
Northern Cape | | | 280 975 | | | | 288 839 | | | | 7 864 | | | | 2.2 | % | | | 2.3 | % | | | 0.16 | % |
North West | | | 826 218 | | | | 824 724 | | | | -1 494 | | | | 6.4 | % | | | 6.7 | % | | | 0.27 | % |
Western Cape | | | 1 094 565 | | | | 1 174 625 | | | | 80 060 | | | | 8.5 | % | | | 9.5 | % | | | 1.02 | % |
| | | | | | | | | | | | | | | | | | | | | | | | |
Total | | | 12 933 032 | | | | 12 382 521 | | | | -550 511 | | | | 100.0 | % | | | 100.0 | % | | | — | |
| | | | | | | | | | | | | | | | | | | | | | | | |
Health component (27 per cent)
A new health component for the provincial equitable share formula was adopted in 2010 and implemented in the 2011 Budget. The 2011 Annexure W1 explained how the new health component is calculated and the rationale behind it. The component uses a risk-adjusted capitation index based on the Risk Equalisation Fund and output data from public hospitals to estimate each province’s share of the health component. These two methods work together to balance needs (risk-adjusted capitation) and demands (output component).
The health component is presented in three parts below. Table W1.14 shows the shares of the risk-adjusted component, which accounts for 75 per cent of the health component.
20
ANNEXURE W1: EXPLANATORY MEMORANDUM TO THE DIVISION OF REVENUE
Table W1.14 Risk-adjusted sub-component shares
| | | | | | | | | | | | | | | | | | | | | | | | | | | | |
| | | Population
Census | | | Insured
population | | | Risk-
adjusted
index | | | Weighted | | | Risk-adjusted shares | | | | |
Thousand | | 2011 | | | 2011 | | | 2012 | | | population | | | 2012 | | | 2013 | | | Change | |
Eastern Cape | | | 6 562 | | | | 11.1 | % | | | 96.9 | % | | | 5 650 | | | | 14.0 | % | | | 13.0 | % | | | -0.94 | % |
Free State | | | 2 746 | | | | 17.0 | % | | | 103.3 | % | | | 2 353 | | | | 5.6 | % | | | 5.4 | % | | | -0.20 | % |
Gauteng | | | 12 272 | | | | 23.9 | % | | | 105.4 | % | | | 9 845 | | | | 21.0 | % | | | 22.7 | % | | | 1.72 | % |
KwaZulu-Natal | | | 10 267 | | | | 12.3 | % | | | 98.9 | % | | | 8 906 | | | | 22.0 | % | | | 20.6 | % | | | -1.45 | % |
Limpopo | | | 5 405 | | | | 7.2 | % | | | 91.6 | % | | | 4 596 | | | | 11.1 | % | | | 10.6 | % | | | -0.52 | % |
Mpumalanga | | | 4 040 | | | | 14.4 | % | | | 95.7 | % | | | 3 310 | | | | 7.2 | % | | | 7.6 | % | | | 0.43 | % |
Northern Cape | | | 1 146 | | | | 13.0 | % | | | 100.7 | % | | | 1 004 | | | | 2.3 | % | | | 2.3 | % | | | 0.06 | % |
North West | | | 3 510 | | | | 13.6 | % | | | 102.2 | % | | | 3 100 | | | | 6.8 | % | | | 7.2 | % | | | 0.32 | % |
Western Cape | | | 5 823 | | | | 25.1 | % | | | 104.0 | % | | | 4 537 | | | | 9.9 | % | | | 10.5 | % | | | 0.59 | % |
| | | | | | | | | | | | | | | | | | | | | | | | | | | | |
Total | | | 51 771 | | | | | | | | | | | | 43 301 | | | | 100.0 | % | | | 100.0 | % | | | — | |
| | | | | | | | | | | | | | | | | | | | | | | | | | | | |
The risk-adjusted sub-component estimates a weighted population in each province using the risk-adjusted capitation index, which is calculated using data from the Council for Medical Aids Scheme’s Risk Equalisation Fund. The percentage of the population with medical aid insurance, based on the 2011 General Household Survey, is deducted from the 2011 Census population data to estimate the uninsured population per province. The risk-adjusted index, which is an index of the health risk profile of each province, is applied to this uninsured population to estimate the weighted population. Each province’s share of this weighted population is used to estimate their share of the risk-adjusted sub-component. Table W1.14 shows the change in this sub-component between 2012 and 2013. In total, the risk-adjusted component is weighted at 75 per cent of the health component.
The output sub-component, which is updated with 2010/11 and 2011/12 data obtained from the District Health Information Services, is shown in Table W1.15 below.
Table W1.15 Output sub-component shares
| | | | | | | | | | | | | | | | | | | | | | | | | | | | | | | | |
| | | | | | Primary health care
visits | | | | | | Hospital workload patient-day equivalents | |
| | | 2010/11 | | | 2011/12 | | | Average | | | Share | | | 2010/11 | | | 2011/12 | | | Average | | | Share | |
Eastern Cape | | | 17 667 | | | | 18 269 | | | | 17 968 | | | | 14.6 | % | | | 4 666 | | | | 4 747 | | | | 4 707 | | | | 15.0 | % |
Free State | | | 6 596 | | | | 7 194 | | | | 6 895 | | | | 5.6 | % | | | 1 644 | | | | 1 751 | | | | 1 698 | | | | 5.4 | % |
Gauteng | | | 20 011 | | | | 22 318 | | | | 21 164 | | | | 17.1 | % | | | 6 007 | | | | 6 572 | | | | 6 289 | | | | 20.1 | % |
KwaZulu-Natal | | | 26 191 | | | | 29 197 | | | | 27 694 | | | | 22.4 | % | | | 7 886 | | | | 8 167 | | | | 8 026 | | | | 25.6 | % |
Limpopo | | | 13 941 | | | | 14 696 | | | | 14 319 | | | | 11.6 | % | | | 2 710 | | | | 2 869 | | | | 2 789 | | | | 8.9 | % |
Mpumalanga | | | 8 031 | | | | 8 769 | | | | 8 400 | | | | 6.8 | % | | | 1 726 | | | | 1 715 | | | | 1 720 | | | | 5.5 | % |
Northern Cape | | | 3 473 | | | | 3 340 | | | | 3 407 | | | | 2.8 | % | | | 532 | | | | 520 | | | | 526 | | | | 1.7 | % |
North West | | | 8 043 | | | | 7 889 | | | | 7 966 | | | | 6.5 | % | | | 1 545 | | | | 1 563 | | | | 1 554 | | | | 5.0 | % |
Western Cape | | | 15 671 | | | | 15 537 | | | | 15 604 | | | | 12.6 | % | | | 3 980 | | | | 4 112 | | | | 4 046 | | | | 12.9 | % |
| | | | | | | | | | | | | | | | | | | | | | | | | | | | | | | | |
Total | | | 119 626 | | | | 127 209 | | | | 123 417 | | | | 100.0 | % | | | 30 695 | | | | 32 017 | | | | 31 356 | | | | 100.0 | % |
| | | | | | | | | | | | | | | | | | | | | | | | | | | | | | | | |
In the 2011 division of revenue, normative costings derived from government’s Basic Accounting System and the District Health Information Services were used to weight primary health care visits and patient-day equivalents. The weighted visits were combined to estimate the output component. For the 2013 division of revenue, the output sub-component still uses patient load data from the District Health Information Services. The average number of clinic visits at primary health care clinics in 2010/11 and 2011/12 is calculated. Each province’s average is used to estimate their share of this part of the output component, making up 5 per cent of the health component. For hospitals, each province’s share of the total patient-day equivalents from public hospitals in 2010/11 and 2011/12 are used to estimate their share of this part of the output sub-component, making up 20 per cent of the health component. In total, the output component is 25 per cent of the health component. This new approach still applies a ratio to weight primary health care visits to patient-day equivalents, but it is simpler and more transparent than the method used in 2011.
21
2013 BUDGET REVIEW
Table W1.16 shows the updated health component shares for 2013.
Table W1.16 Health component weighted shares
| | | | | | | | | | | | | | | | | | | | | | | | |
| | | Risk- adjusted | | | Primary health care | | | Hospital component | | | Weighted shares | | | Change | |
Weight | | 75% | | | 5% | | | 20% | | | 2012 | | | 2013 | | |
Eastern Cape | | | 13.0 | % | | | 14.6 | % | | | 15.0 | % | | | 14.2 | % | | | 13.5 | % | | | -0.64 | % |
Free State | | | 5.4 | % | | | 5.6 | % | | | 5.4 | % | | | 5.5 | % | | | 5.4 | % | | | -0.09 | % |
Gauteng | | | 22.7 | % | | | 17.1 | % | | | 20.1 | % | | | 20.5 | % | | | 21.9 | % | | | 1.46 | % |
KwaZulu-Natal | | | 20.6 | % | | | 22.4 | % | | | 25.6 | % | | | 23.0 | % | | | 21.7 | % | | | -1.36 | % |
Limpopo | | | 10.6 | % | | | 11.6 | % | | | 8.9 | % | | | 10.7 | % | | | 10.3 | % | | | -0.39 | % |
Mpumalanga | | | 7.6 | % | | | 6.8 | % | | | 5.5 | % | | | 6.8 | % | | | 7.2 | % | | | 0.32 | % |
Northern Cape | | | 2.3 | % | | | 2.8 | % | | | 1.7 | % | | | 2.2 | % | | | 2.2 | % | | | 0.04 | % |
North West | | | 7.2 | % | | | 6.5 | % | | | 5.0 | % | | | 6.5 | % | | | 6.7 | % | | | 0.23 | % |
Western Cape | | | 10.5 | % | | | 12.6 | % | | | 12.9 | % | | | 10.6 | % | | | 11.1 | % | | | 0.43 | % |
| | | | | | | | | | | | | | | | | | | | | | | | |
Total | | | 100.0 | % | | | 100.0 | % | | | 100.0 | % | | | 100.0 | % | | | 100.0 | % | | | — | |
| | | | | | | | | | | | | | | | | | | | | | | | |
Basic component (16 per cent)
The basic component is derived from the proportion of each province’s share of the national population. This component constitutes 16 per cent of the total equitable share. For the 2013 MTEF, population data is drawn from the 2011 Census. Table W1.17 shows the impact on the basic component’s revised weighted shares.
Table W1.17 Impact of the changes in population on the basic component shares
| | | | | | | | | | | | | | | | | | | | | | | | | | | | |
| | | Mid-year population
estimates | | | Population | | | Population | | | %
population | | | Basic component shares | | | Change | |
| | | 2011 | | | Census 2011 | | | change | | | change | | | 2012 MTEF | | | 2013 MTEF | | |
Eastern Cape | | | 6 829 958 | | | | 6 562 053 | | | | -267 905 | | | | -3.9 | % | | | 13.5 | % | | | 12.7 | % | | | -0.83 | % |
Free State | | | 2 759 644 | | | | 2 745 590 | | | | -14 054 | | | | -0.5 | % | | | 5.5 | % | | | 5.3 | % | | | -0.15 | % |
Gauteng | | | 11 328 203 | | | | 12 272 263 | | | | 944 060 | | | | 8.3 | % | | | 22.4 | % | | | 23.7 | % | | | 1.31 | % |
KwaZulu-Natal | | | 10 819 130 | | | | 10 267 300 | | | | -551 830 | | | | -5.1 | % | | | 21.4 | % | | | 19.8 | % | | | -1.55 | % |
Limpopo | | | 5 554 657 | | | | 5 404 868 | | | | -149 789 | | | | -2.7 | % | | | 11.0 | % | | | 10.4 | % | | | -0.54 | % |
Mpumalanga | | | 3 657 181 | | | | 4 039 939 | | | | 382 758 | | | | 10.5 | % | | | 7.2 | % | | | 7.8 | % | | | 0.57 | % |
Northern Cape | | | 1 096 731 | | | | 1 145 861 | | | | 49 130 | | | | 4.5 | % | | | 2.2 | % | | | 2.2 | % | | | 0.05 | % |
North West | | | 3 253 390 | | | | 3 509 953 | | | | 256 563 | | | | 7.9 | % | | | 6.4 | % | | | 6.8 | % | | | 0.35 | % |
Western Cape | | | 5 287 863 | | | | 5 822 734 | | | | 534 871 | | | | 10.1 | % | | | 10.5 | % | | | 11.2 | % | | | 0.79 | % |
| | | | | | | | | | | | | | | | | | | | | | | | | | | | |
Total | | | 50 586 757 | | | | 51 770 561 | | | | 1 183 804 | | | | 2.3 | % | | | 100.0 | % | | | 100.0 | % | | | — | |
| | | | | | | | | | | | | | | | | | | | | | | | | | | | |
Institutional component (5 per cent)
The institutional component recognises that some costs associated with running a provincial government and providing services are not directly related to the size of a province’s population or the other factors included in other components. It is therefore distributed equally between provinces. It constitutes 5 per cent of the total equitable share, of which each province receives 11.1 per cent. This component benefits provinces with smaller populations, especially the Northern Cape and the North West, as the allocation per person for these provinces is much higher in this component.
22
ANNEXURE W1: EXPLANATORY MEMORANDUM TO THE DIVISION OF REVENUE
Poverty component (3 per cent)
The poverty component introduces a redistributive element to the formula and is assigned a weight of 3 per cent. The poor population includes people who fall in the first two quintiles of household incomes in the 2010 Income and Expenditure Survey. The estimated size of the poor population in each province is calculated by multiplying the proportion in that province from the survey by the population figure from the 2011 Census. Table W1.18 shows the poverty quintiles of the Income and Expenditure Survey, the 2011 Census data and the weighted share of the poverty component per province.
Table W1.18 Comparison of current and new poverty component weighted shares
| | | | | | | | | | | | | | | | | | | | | | | | | | | | | | | | |
| | | Income
and
Expenditure
Survey
2010/11 | | | Current (2012 MTEF) | | | New (2013 MTEF) | | | Difference
in
weighted
shares | |
| | | | Basic
component
value | | | Poor
population | | | Weighted
shares | | | Basic
component
value | | | Poor
population | | | Weighted
shares | | |
Eastern Cape | | | 52.0 | % | | | 6 830 | | | | 3 404 | | | | 16.7 | % | | | 6 562 | | | | 3 414 | | | | 16.3 | % | | | -0.43 | % |
Free State | | | 41.4 | % | | | 2 760 | | | | 1 151 | | | | 5.7 | % | | | 2 746 | | | | 1 137 | | | | 5.4 | % | | | -0.23 | % |
Gauteng | | | 28.9 | % | | | 11 328 | | | | 3 186 | | | | 15.7 | % | | | 12 272 | | | | 3 543 | | | | 16.9 | % | | | 1.26 | % |
KwaZulu-Natal | | | 45.3 | % | | | 10 819 | | | | 4 671 | | | | 23.0 | % | | | 10 267 | | | | 4 652 | | | | 22.2 | % | | | -0.75 | % |
Limpopo | | | 52.9 | % | | | 5 555 | | | | 2 936 | | | | 14.4 | % | | | 5 405 | | | | 2 857 | | | | 13.6 | % | | | -0.79 | % |
Mpumalanga | | | 47.3 | % | | | 3 657 | | | | 1 744 | | | | 8.6 | % | | | 4 040 | | | | 1 909 | | | | 9.1 | % | | | 0.54 | % |
Northern Cape | | | 40.8 | % | | | 1 097 | | | | 493 | | | | 2.4 | % | | | 1 146 | | | | 467 | | | | 2.2 | % | | | -0.19 | % |
North West | | | 47.9 | % | | | 3 253 | | | | 1 527 | | | | 7.5 | % | | | 3 510 | | | | 1 681 | | | | 8.0 | % | | | 0.52 | % |
Western Cape | | | 21.9 | % | | | 5 288 | | | | 1 221 | | | | 6.0 | % | | | 5 823 | | | | 1 273 | | | | 6.1 | % | | | 0.08 | % |
| | | | | | | | | | | | | | | | | | | | | | | | | | | | | | | | |
Total | | | | | | | 50 587 | | | | 20 332 | | | | 100.0 | % | | | 51 771 | | | | 20 933 | | | | 100.0 | % | | | — | |
| | | | | | | | | | | | | | | | | | | | | | | | | | | | | | | | |
Economic activity component (1 per cent)
The economic activity component is a proxy for provincial tax capacity and expenditure assignments. Given that these assignments are a relatively small proportion of provincial budgets, the component is assigned a weight of 1 per cent. For the 2013 MTEF, 2010 GDP-R data is used. Table W1.19 shows the impact of the revised weighted shares of the economic activity component. The right-hand column shows changes as a result of the relative growth of provincial contributions to GDP.
Table W1.19 Current and new economic activity component weighted shares
| | | | | | | | | | | | | | | | | | | | |
| | | Current (2012 MTEF) | | | New (2013 MTEF) | | | Difference in
weighted
shares | |
| | | GDP-R, 2009
(R million) | | | Weighted
shares | | | GDP-R, 2010
(R million) | | | Weighted
shares | | |
Eastern Cape | | | 182 147 | | | | 7.6 | % | | | 203 993 | | | | 7.7 | % | | | 0.06 | % |
Free State | | | 130 973 | | | | 5.5 | % | | | 145 405 | | | | 5.5 | % | | | -0.00 | % |
Gauteng | | | 811 907 | | | | 33.9 | % | | | 897 553 | | | | 33.7 | % | | | -0.16 | % |
KwaZulu-Natal | | | 384 937 | | | | 16.1 | % | | | 420 647 | | | | 15.8 | % | | | -0.26 | % |
Limpopo | | | 168 506 | | | | 7.0 | % | | | 191 934 | | | | 7.2 | % | | | 0.18 | % |
Mpumalanga | | | 169 973 | | | | 7.1 | % | | | 187 367 | | | | 7.0 | % | | | -0.05 | % |
Northern Cape | | | 54 917 | | | | 2.3 | % | | | 61 175 | | | | 2.3 | % | | | 0.01 | % |
North West | | | 156 374 | | | | 6.5 | % | | | 177 075 | | | | 6.7 | % | | | 0.13 | % |
Western Cape | | | 336 234 | | | | 14.0 | % | | | 376 284 | | | | 14.1 | % | | | 0.11 | % |
| | | | | | | | | | | | | | | | | | | | |
Total | | | 2 395 967 | | | | 100.0 | % | | | 2 661 433 | | | | 100.0 | % | | | — | |
| | | | | | | | | | | | | | | | | | | | |
23
2013 BUDGET REVIEW
Phasing of conditional grant into the provincial equitable share
The devolution of property rate funds grant will be phased into the provincial equitable share over the 2013 MTEF. The grant enables provinces to take over the responsibility of paying rates and municipal charges on properties that were administered by national government on their behalf. Progress has been made in ensuring that all provinces have records of their properties and liabilities for municipal rates. Over the 2013 MTEF period, provinces will continue to receive the same amounts they would have received from the grant, but these will be transferred as part of the equitable share and not as a separate conditional grant. From 2016/17, these funds will be allocated through the provincial equitable share formula.
Conditional grants to provinces
There are four types of provincial conditional grants. Schedule 4A sets out general grants that supplement various programmes partly funded by provinces, such as infrastructure and central hospitals. Transfer and spending accountability arrangements differ, as more than one national or provincial department may be responsible for different outputs. Schedule 5A grants fund-specific responsibilities for both the transferring and receiving of provincial accounting officers. A schedule 6A grant provides allocations-in-kind through which a national department implements projects in provinces. A schedule 7A grant provides for the swift allocation and transfer of funds to a province to help it deal with a disaster.
Changes to conditional grants
Given the challenging economic environment and fiscal constraints, government decided to find savings from existing baselines to fund key priorities. As a result, the baselines of some conditional grants have been revised downward. Table W1.20 shows the savings made on provincial conditional grants to make resources available for government priorities.
Table W1.20 Savings effected on provincial conditional grants
| | | | | | | | | | | | | | | | |
R million | | 2013/14 | | | 2014/15 | | | 2015/16 | | | MTEF total | |
Basic Education | | | -113 | | | | -324 | | | | -639 | | | | -1 075 | |
Education infrastructure | | | -100 | | | | -300 | | | | -600 | | | | -1 000 | |
HIV and Aids (life skills education) | | | -7 | | | | -12 | | | | -17 | | | | -35 | |
National school nutrition programme | | | -6 | | | | -12 | | | | -22 | | | | -40 | |
Cooperative Governance and Traditional Affairs | | | -2 | | | | -4 | | | | -6 | | | | -12 | |
Provincial disaster | | | -2 | | | | -4 | | | | -6 | | | | -12 | |
Health | | | -135 | | | | -184 | | | | -237 | | | | -556 | |
Health facility revitalisation | | | -125 | | | | -174 | | | | -232 | | | | -531 | |
National health insurance | | | -11 | | | | -10 | | | | -5 | | | | -26 | |
Public Works | | | -6 | | | | -12 | | | | -19 | | | | -37 | |
Expanded public works programme integrated grant forprovinces | | | -6 | | | | -12 | | | | -19 | | | | -37 | |
Transport | | | -13 | | | | -14 | | | | -14 | | | | -41 | |
Provincial roads maintenance | | | -13 | | | | -14 | | | | -14 | | | | -41 | |
| | | | | | | | | | | | | | | | |
Total | | | -268 | | | | -538 | | | | -916 | | | | -1 722 | |
| | | | | | | | | | | | | | | | |
Table W1.21 shows the revisions to provincial conditional grants, which provide for technical, policy and inflation adjustments. After accounting for the savings shown in Table W1.20 and shifts from provincial conditional grants, net revisions to conditional grant baseline allocations (a reduction of R8.6 million in 2013/14 and increases of R1.5 billion in 2014/15 and R6.6 billion in 2015/16, or a net increase of R8.2 billion over the MTEF) bring the new conditional grant baselines to R76.6 billion in 2013/14, R81.8 billion in 2014/15 and R90.7 billion in 2015/16.
24
ANNEXURE W1: EXPLANATORY MEMORANDUM TO THE DIVISION OF REVENUE
Table W1.21 Revisions to conditional grant baseline allocations, 2013/14 – 2015/16
| | | | | | | | | | | | | | | | |
R million | | 2013/14 | | | 2014/15 | | | 2015/16 | | | 2013 MTEF | |
Technical revisions | | | -5 583 | | | | -7 396 | | | | -7 635 | | | | -20 614 | |
Basic Education | | | 533 | | | | — | | | | — | | | | 533 | |
Education infrastructure1 | | | 533 | | | | — | | | | — | | | | 533 | |
Health | | | -1 098 | | | | -2 100 | | | | -2 120 | | | | -5 318 | |
Health infrastructure | | | -1 296 | | | | -1 219 | | | | -1 326 | | | | -3 841 | |
Hospital revitalisation | | | -3 752 | | | | -3 424 | | | | -3 564 | | | | -10 740 | |
Nursing colleges and schools | | | -76 | | | | -95 | | | | -98 | | | | -269 | |
Rescheduled to: | | | | | | | | | | | | | | | | |
Health facility revitalisation | | | 5 124 | | | | 4 739 | | | | 4 988 | | | | 14 850 | |
Health infrastructure2 | | | -401 | | | | -563 | | | | -563 | | | | -1 527 | |
Hospital revitalisation2 | | | -332 | | | | -1 012 | | | | -1 002 | | | | -2 346 | |
National health insurance2 | | | -291 | | | | -420 | | | | -444 | | | | -1 155 | |
Nursing colleges and schools2 | | | -74 | | | | -105 | | | | -111 | | | | -290 | |
Higher Education and Training | | | -2 966 | | | | -3 128 | | | | -3 248 | | | | -9 342 | |
Further education and training colleges3 | | | -2 966 | | | | -3 128 | | | | -3 248 | | | | -9 342 | |
Public Works | | | -2 052 | | | | -2 168 | | | | -2 267 | | | | -6 487 | |
Devolution of property rate funds4 | | | -2 052 | | | | -2 168 | | | | -2 267 | | | | -6 487 | |
| | | | | | | | | | | | | | | | |
Additions to baseline5 | | | 260 | | | | 2 083 | | | | 7 558 | | | | 9 901 | |
Arts and Culture | | | — | | | | 385 | | | | 680 | | | | 1 064 | |
Community library services | | | — | | | | 385 | | | | 680 | | | | 1 064 | |
Basic Education | | | — | | | | 1 191 | | | | 4 101 | | | | 5 292 | |
Education infrastructure | | | — | | | | 1 191 | | | | 4 101 | | | | 5 292 | |
Health | | | — | | | | 100 | | | | 1 184 | | | | 1 284 | |
Comprehensive HIV and Aids | | | — | | | | 100 | | | | 1 184 | | | | 1 284 | |
Higher Education and Training | | | 91 | | | | 110 | | | | 130 | | | | 331 | |
Further education and training colleges | | | 91 | | | | 110 | | | | 130 | | | | 331 | |
Human Settlements | | | — | | | | 110 | | | | 1 040 | | | | 1 150 | |
Human settlements development | | | — | | | | 110 | | | | 1 040 | | | | 1 150 | |
Transport | | | 169 | | | | 187 | | | | 424 | | | | 780 | |
Provincial roads maintenance | | | 169 | | | | 187 | | | | 424 | | | | 780 | |
| | | | | | | | | | | | | | | | |
Total additions to baseline | | | 260 | | | | 2 083 | | | | 7 558 | | | | 9 901 | |
| | | | | | | | | | | | | | | | |
Less: Savings effected on conditional grants | | | -268 | | | | -538 | | | | -916 | | | | -1 722 | |
Net additions to baselines | | | -9 | | | | 1 545 | | | | 6 642 | | | | 8 178 | |
| | | | | | | | | | | | | | | | |
| 1. | Conversion from school backlogs grant |
| 2. | Rescheduled to national health grant (indirect grant) |
| 3. | Subsidy portion transferred to national department |
| 4. | Rescheduled to provincial equitable share |
| 5. | Additions come from reprioritisation and policy reserve |
Table W1.22 provides a summary of conditional grants by sector for the 2013 MTEF. More detailed information, including the framework and allocation criteria for each grant, is provided in Annexure W2 of the 2013 Division of Revenue Bill. The frameworks provide the conditions for each grant, the outputs expected, the allocation criteria used for dividing each grant between provinces, a summary of the grant’s audited outcomes for 2011/12 and any other material issues to be addressed.
25
2013 BUDGET REVIEW
Table W1.22 Conditional grants to provinces, 2012/13 – 2015/16
| | | | | | | | | | | | | | | | | | | | |
R million | | 2012/13 | | | 2013/14 | | | 2014/15 | | | 2015/16 | | | MTEF total | |
Agriculture, Forestry and Fisheries | | | 1 925 | | | | 2 147 | | | | 2 194 | | | | 2 294 | | | | 6 635 | |
Comprehensive agricultural support programme | | | 1 393 | | | | 1 600 | | | | 1 665 | | | | 1 742 | | | | 5 007 | |
Ilima/Letsema projects | | | 416 | | | | 438 | | | | 461 | | | | 482 | | | | 1 381 | |
Land care programme: poverty relief and infrastructure development | | | 116 | | | | 109 | | | | 68 | | | | 71 | | | | 248 | |
Arts and Culture | | | 565 | | | | 598 | | | | 1 016 | | | | 1 341 | | | | 2 955 | |
Community library services | | | 565 | | | | 598 | | | | 1 016 | | | | 1 341 | | | | 2 955 | |
Basic Education | | | 10 990 | | | | 12 343 | | | | 13 188 | | | | 16 350 | | | | 41 882 | |
Dinaledi schools | | | 100 | | | | 105 | | | | 111 | | | | 116 | | | | 333 | |
Education infrastructure | | | 5 587 | | | | 6 631 | | | | 7 161 | | | | 10 059 | | | | 23 851 | |
HIV and Aids (life skills education) | | | 203 | | | | 214 | | | | 221 | | | | 226 | | | | 661 | |
National school nutrition programme | | | 4 906 | | | | 5 173 | | | | 5 462 | | | | 5 704 | | | | 16 339 | |
Technical secondary schools recapitalisation | | | 194 | | | | 221 | | | | 233 | | | | 244 | | | | 699 | |
Cooperative Governance and Traditional Affairs | | | 180 | | | | 188 | | | | 197 | | | | 204 | | | | 590 | |
Provincial disaster | | | 180 | | | | 188 | | | | 197 | | | | 204 | | | | 590 | |
Health | | | 26 073 | | | | 27 517 | | | | 29 610 | | | | 32 083 | | | | 89 210 | |
Africa Cup of Nations 2013: medical services | | | 15 | | | | — | | | | — | | | | — | | | | — | |
Comprehensive HIV and Aids | | | 8 763 | | | | 10 534 | | | | 12 311 | | | | 13 957 | | | | 36 802 | |
Health facility revitalisation | | | 6 191 | | | | 5 124 | | | | 4 739 | | | | 4 988 | | | | 14 850 | |
Health professions training and development | | | 2 076 | | | | 2 190 | | | | 2 322 | | | | 2 429 | | | | 6 941 | |
National tertiary services | | | 8 878 | | | | 9 620 | | | | 10 168 | | | | 10 636 | | | | 30 425 | |
National health insurance | | | 150 | | | | 49 | | | | 70 | | | | 74 | | | | 192 | |
Higher Education and Training | | | 4 845 | | | | 2 443 | | | | 2 600 | | | | 2 759 | | | | 7 802 | |
Further education and training colleges | | | 4 845 | | | | 2 443 | | | | 2 600 | | | | 2 759 | | | | 7 802 | |
Human Settlements | | | 15 726 | | | | 16 984 | | | | 17 918 | | | | 19 667 | | | | 54 569 | |
Human settlements development | | | 15 726 | | | | 16 984 | | | | 17 918 | | | | 19 667 | | | | 54 569 | |
Public Works | | | 2 429 | | | | 613 | | | | 644 | | | | 667 | | | | 1 925 | |
Devolution of property rate funds | | | 1 919 | | | | — | | | | — | | | | — | | | | — | |
Expanded public works programme integrated grant for provinces | | | 293 | | | | 356 | | | | 371 | | | | 382 | | | | 1 108 | |
Social sector expanded public works programme incentive for provinces | | | 217 | | | | 258 | | | | 273 | | | | 286 | | | | 816 | |
Sport and Recreation South Africa | | | 470 | | | | 498 | | | | 526 | | | | 550 | | | | 1 573 | |
Mass participation and sport development | | | 470 | | | | 498 | | | | 526 | | | | 550 | | | | 1 573 | |
Transport | | | 12 299 | | | | 13 249 | | | | 13 909 | | | | 14 777 | | | | 41 934 | |
Provincial roads maintenance | | | 7 982 | | | | 8 696 | | | | 9 126 | | | | 9 774 | | | | 27 596 | |
Public transport operations | | | 4 317 | | | | 4 553 | | | | 4 783 | | | | 5 003 | | | | 14 338 | |
| | | | | | | | | | | | | | | | | | | | |
Total | | | 75 500 | | | | 76 580 | | | | 81 803 | | | | 90 692 | | | | 249 075 | |
| | | | | | | | | | | | | | | | | | | | |
Indirect transfers | | | 1 277 | | | | 3 060 | | | | 5 269 | | | | 5 032 | | | | 13 361 | |
Basic Education | | | 1 277 | | | | 1 956 | | | | 3 170 | | | | 2 912 | | | | 8 038 | |
School infrastructure backlogs | | | 1 277 | | | | 1 956 | | | | 3 170 | | | | 2 912 | | | | 8 038 | |
Health | | | — | | | | 1 104 | | | | 2 100 | | | | 2 120 | | | | 5 324 | |
2014 African Nations Championship health and medical services | | | — | | | | 6 | | | | — | | | | — | | | | 6 | |
National health | | | — | | | | 1 098 | | | | 2 100 | | | | 2 120 | | | | 5 318 | |
| | | | | | | | | | | | | | | | | | | | |
26
ANNEXURE W1: EXPLANATORY MEMORANDUM TO THE DIVISION OF REVENUE
Agriculture grants
The comprehensive agricultural support programme aims to support newly established and emerging farmers. This grant includes the extension recovery programme, which focuses on improving extension services through training programmes and providing equipment for extension officers. The grant also aims to expand farm infrastructure and provide support for dipping, fencing and rehabilitation of viable irrigation schemes. The 2012 Budget allocated a total of R995 million to this conditional grant over the MTEF to repair flood damage to agricultural infrastructure in January and February 2011. The remaining allocations of R299 million and R298 million are already within the baselines for 2013/14 and 2014/15 and provinces are expected to continue allocating the funds towards these disaster recovery projects. The grant amounts to R5 billion over the 2013 MTEF.
The land care programme grant: poverty relief and infrastructure development aims to improve productivity and sustainable use of natural resources. Provinces are encouraged to use this grant to create jobs through the expanded public works programme. Over the medium term, R248 million is allocated to this grant.
The Ilima/Letsema projects grant is intended to boost food production by assisting previously disadvantaged farming communities. After the Department of Agriculture, Forestry and Fisheries has tested the new approach, it will make this grant subject to the standard operating procedure for farmer support. This grant is allocated R1.4 billion over the MTEF.
Arts and culture grant
The community library services grant, administered by the Department of Arts and Culture, aims to help South Africans access knowledge and information, so that their socioeconomic situation can be improved. The grant is allocated to the relevant provincial department and either administered by that department or through a service-level agreement with municipalities. This grant will receive additions of R385 million in 2014/15 and R680 million in 2015/16 to enhance capacity in the sector, address issues arising from the function shift and provide for dual-purpose libraries where needed. The total grant amounts to R3 billion over the next three years.
Basic education grants
The education infrastructure grant is used by provinces for maintenance, refurbishment and the construction of new education infrastructure and schools. This grant will receive additions of R1.2 billion in 2014/15 and R4.1 billion in 2015/16 to improve the delivery of school infrastructure in provinces. This brings the grant total to R23.9 billion over the MTEF, which includes R159 million previously allocated for 2013/14 to repair school infrastructure damaged by floods in 2011. The infrastructure conditional grants are being reformed and incentives will be introduced to promote improved performance. This grant, together with the health facility revitalisation grant, will be the first grants to form part of this new approach. These reforms are discussed in more detail in part 6 of this annexure.
The national school nutrition programme seeks to improve the nutrition of poor school children, enhance active learning capacity and improve attendance in schools. This grant is allocated R16.3 billion over the MTEF.
The technical secondary schools recapitalisation grant provides for equipment and facilities in technical high schools. Provision is made for this grant to extend to 2015/16 in response to the growing need to recapitalise technical schools identified in provincial needs assessments. This grant is allocated R699 million over the MTEF.
The Dinaledi schools grant, started in 2011/12, supports Dinaledi schools to improve the quality of learner performance in mathematics, physical science, life sciences and first additional language English, in line with the Action Plan to 2014. Dinaledi schools are schools in disadvantaged communities that perform well in mathematics and physical science. The grant is allocated R333 million over the MTEF.
27
2013 BUDGET REVIEW
The HIV and Aids (life skills) programme grant provides for life skills training, sexuality and HIV and Aids education in primary and secondary schools. It is fully integrated into the school system, with learner and teacher support material provided for Grade 1 to 9. This grant is allocated R661 million over the MTEF.
The schools infrastructure backlogs grant is an indirect grant to provinces introduced in 2011 as a short-term, high-impact grant to address backlogs in inappropriate structures and access to basic services. The grant’s funds have been rescheduled to align the baseline with capacity to spend. An amount of R2.5 billion is shifted from 2013/14 to 2015/16. A reprioritisation of R1.7 billion over the MTEF is also effected to make resources available for the construction of new universities in Mpumalanga and the Northern Cape as part of the SIPs identified by the Presidential Infrastructure Coordinating Committee; the community library services grant, which provides a complementary service to education; and the education infrastructure grant. The grant now amounts to R8 billion over the 2013 MTEF.
Cooperative governance grant
The provincial disaster grant is administered by the National Disaster Management Centre in the Department of Cooperative Governance as an unallocated grant to provincial government at the start of the financial year. The grant allows for an immediate (in-year) release of funds to be disbursed by the National Disaster Management Centre after a disaster is declared, without the need for the transfers to first be gazetted. Over the MTEF, R590 million is available for disbursement through this grant.
Health grants
The national tertiary services grant provides strategic funding to enable provinces to plan, modernise and transform tertiary hospital service delivery in line with national policy objectives. The grant operates in 26 hospitals across the nine provinces, concentrated in urban Gauteng and the Western Cape. These provinces receive the largest shares of the grant as they provide the largest proportion of these high-level, sophisticated services for the benefit of the health sector countrywide. This grant is allocated R30.4 billion over the MTEF.
The health facility revitalisation grant funds the construction and maintenance of health infrastructure. This grant has been created through the merger of three previous grants: the health infrastructure grant, the hospital revitalisation grant and the nursing colleges and schools grant, which are now three components within the merged grant. The combination gives greater flexibility to the Department of Health to shift funds between the three grant components, with the approval of the National Treasury, so that they can avoid under- or overspending in any one area of health infrastructure. This grant is supported by the national health grant. The three components of the grant are:
| | • | | Health infrastructure – Funds general maintenance and infrastructure needs at smaller hospitals and clinics. The National Treasury and the Department of Health have joint capacity-building programmes funded through this grant to support provinces’ best-practice planning and project implementation. The grant will be part of the first phase of infrastructure reforms (discussed in part 6 of this annexure), which will introduce incentives in the funding and delivery of infrastructure to improve planning and procurement practices in line with the infrastructure delivery management system and best practices by the Construction Industry Development Board. This component is allocated R3.8 billion over the MTEF. |
| | • | | Hospital revitalisation – Supports large projects that modernise hospital infrastructure and equipment. It is allocated R10.7 billion over the MTEF. |
| | • | | Nursing colleges and schools – Funds the refurbishment and upgrading of nursing colleges and schools. The Department of Health will play a more active role in the planning, packaging and procurement of projects funded through this window than it does in other infrastructure grants. It is allocated R269 million over the next three years. |
28
ANNEXURE W1: EXPLANATORY MEMORANDUM TO THE DIVISION OF REVENUE
The health professions training and development grant funds the training of health professionals, and the development and recruitment of medical specialists. It enables the shifting of teaching activities from central to regional and district hospitals. It is allocated R6.9 billion over the medium term.
The comprehensive HIV and Aids grant enables the health sector to develop a response to HIV and Aids. The grant supports prevention programmes and specific interventions, including voluntary counselling and testing, prevention of mother-to-child transmission, post-exposure prophylaxis, antiretroviral treatment and home-based care. In addition to substantial increases to this grant and the provincial equitable share over the previous three MTEF periods for HIV and Aids programmes, the grant is allocated an additional R100 million in 2014/15 and R1.2 billion in 2015/16 to cover the increased antiretroviral treatment take-up rate and the impact of the withdrawal of the Presidential Emergency Plan for Aids Relief donor funding used for HIV and Aids prevention, care and treatment programmes within this grant. This brings the baseline over the MTEF to R36.8 billion.
The national health insurance grant funds national health insurance pilots introduced in 2012/13. These projects aim to strengthen primary health care for the implementation of national health insurance. Ten districts have been selected as pilot sites to test interventions that aim to strengthen health systems and improve performance. Over the 2013 MTEF, the grant has been allocated R192 million. This grant is complemented by the national health insurance window within the national health grant.
The national health grant is a new indirect grant introduced in 2013/14 that will be spent by the Department of Health on behalf of provinces. The grant has two components, one to support infrastructure projects and the second to support the national health insurance scheme pilot sites. The infrastructure component will be used to accelerate construction, maintenance, upgrading and rehabilitation of new and existing health infrastructure and to supplement expenditure on infrastructure delivered through public-private partnerships. The second component will be used to contract general practitioners from the private sector for national health insurance sites. It will also support 10 central hospitals to strengthen their patient information systems and develop and pilot alternative hospital reimbursement tools. The grant is allocated R5.3 billion over the MTEF.
The 2014 African Nations Championship health and medical services grant will be introduced as an indirect grant for 2013/14 only, to support provinces hosting the 2014 African Nations Championship. This grant will be spent by the Department of Health in support of provinces providing medical services for the tournament. The grant has a value of R6 million in 2013/14.
Higher education and training grant
The further education and training colleges grant was introduced in 2010/11 to protect provincial spending on these colleges while the legislative processes required to shift this function to national government are completed. From 2013/14, a portion of the grant will be transferred directly to colleges as a subsidy, which will now flow from the Department of Higher Education and Training. The grant baselines over the MTEF have also been revised to accommodate this decision. In addition, an amount of R138 million in 2013/14, R178 million in 2014/15 and R243 million in 2015/16 is added to the grant to cover the cost of wage agreements, bringing the total value of this grant to R7.8 billion.
Human settlements grant
The human settlements development grant seeks to establish habitable, stable and sustainable human settlements in which all citizens have access to social and economic amenities. The human settlements function will be assigned to six metropolitan municipalities, with the assignment target date being the start of the municipal financial year (1 July 2013). From the date of assignment, funds for the human settlement development grant for these municipalities will be transferred directly to them. As the function has not yet been assigned, the funds for these cities are still reflected in the allocations to provinces. However, provisions in the 2013 Division of Revenue Bill will allow these funds to be transferred directly to cities once assignment takes place. Additional funding of R110 million in 2014/15 and R1 billion in 2015/16 is allocated to upgrade informal settlements in rapidly urbanising mining towns, in support of the SIPs. An amount of R299 million is included in the existing baseline, added in the previous MTEF for the repair of infrastructure damaged by floods. The grant amounts to R54.6 billion over the MTEF.
29
2013 BUDGET REVIEW
The formula used to allocate the human settlements development grant will be reviewed during 2013, resulting in new allocations. To provide scope for this change, while still providing some degree of planning certainty over the MTEF, only half of the funds for 2014/15 and 2015/16 have been indicatively allocated among provinces in the schedules of the Division of Revenue Bill. The remaining funds will be allocated once the revised formula is in place.
Public works grants
The expanded public works programme integrated grant for provinces was revised last year to be a schedule 5A grant. Allocations are now made available upfront based on meeting job targets in the preceding financial year rather than the in-year performance measures used previously. Transfers depend on provincial departments reporting on jobs created through the expanded public works programme and implementing labour-intensive projects. This grant is allocated R1.1 billion over the MTEF.
The social sector expanded public works programme incentive grant for provinces rewards provinces for creating jobs in the preceding financial year in the areas of home-based care and early childhood development, adult literacy and numeracy, community safety and security, and sports programme services. This grant is allocated R816 million over the MTEF.
Sport and recreation South Africa grant
The mass participation and sport development grant aims to increase and sustain mass participation in sport and recreational activities in provinces. This grant is allocated R1.6 billion over the MTEF.
Transport grants
The public transport operations grant subsidises commuter bus services. It allows national government to ensure that contractual obligations are met and services are efficiently provided. The public transport contracting and regulatory functions may be assigned to certain metropolitan municipalities during 2013/14. If this takes place, funds for this grant will be transferred directly to the assigned municipality. The grant is allocated R14.3 billion over the MTEF.
The provincial roads maintenance grant consists of three components. The largest component enables provinces to expand their maintenance activities. The other components allow provinces to repair roads damaged by floods and cover the cost of rehabilitation work created by coal haulage activities in Mpumalanga and Gauteng. Allocations for this grant are determined through a new formula based on provincial road networks, road traffic and weather conditions. These factors reflect the different costs of maintaining road networks in each province. Allocations will also depend on satisfactory use of the road asset management systems from 2013/14. The grant requires provinces to follow best practices for planning and to use and regularly update road asset management systems. From 2015/16, the grant will be based on performance. During 2013/14, the Department of Transport will finalise the indicators – probably vehicle operating costs and remaining asset lifespan – and the performance component to inform grant allocations. Additional allocations of R169 million in 2013/14, R187 million in 2014/15 and R424 million in 2015/16 are added to the grant for road maintenance, bringing the total allocation to R27.6 billion over the MTEF. This includes amounts of R368 million and R367 million in the first two years of the 2013 MTEF allocated in the 2012 Budget for the repair of infrastructure damaged by floods in January and February 2011. Amounts of R809 million in 2013/14, R803 million in 2014/15 and R840 million in 2015/16 are allocated to repair roads damaged by coal haulage.
In addition to these grants, R450 million was allocated in the 2012 Adjustment Appropriation Act to provide for the upgrading of the Mthatha airport. The Department of Transport paid for the upgrade, but as the airport is an asset of the Eastern Cape provincial government, the province will benefit from this expenditure once the work is completed in 2013/14.
30
ANNEXURE W1: EXPLANATORY MEMORANDUM TO THE DIVISION OF REVENUE
n Part 5: Local government fiscal framework and allocations
The local government fiscal framework responds to the constitutional assignment of powers and functions to this sphere of government. The framework refers to all resources available to municipalities to meet their expenditure responsibilities. National transfers account for a relatively small proportion of the local government fiscal framework, with the majority of local government revenues being raised by municipalities themselves through their substantial revenue-raising powers, including property rates and service charges. However, the proportion of revenue coming from transfers and own revenues varies dramatically across municipalities, with poor rural municipalities receiving most of their revenue from transfers, while urban municipalities raise the majority of their own revenues. This differentiation in the way municipalities are funded will continue in the period ahead.
In the 2013 MTEF, a number of significant changes are being introduced to the way funds are allocated among municipalities. The two largest transfers to municipalities, the equitable share and the municipal infrastructure grant, are allocated among municipalities based on census data. The release of the 2011 Census results means that the formulas used for both these allocations have been updated. In addition, the formula used to allocate the local government equitable share has been reviewed and redesigned. Four new conditional grants are also being introduced to:
| | • | | Increase access to clean water |
| | • | | Help cities develop more integrated and efficient patterns of urban development |
| | • | | Subsidise the operating costs of cities running new public transport networks |
| | • | | Support the host cities of the 2014 African Nations Championship (this is a once-off grant). |
It is also likely that human settlements and public transport functions will be assigned to selected metropolitan municipalities during 2013/14. This will result in the funds for these functions – currently allocated to provinces and described in part 4 of this annexure – being transferred directly to municipalities.
This section outlines the transfers made to local government and how these funds are distributed between municipalities. Funds raised by national government are transferred to municipalities through conditional and unconditional grants. National transfers to municipalities are published to enable them to plan fully for their 2013/14 budgets, and to promote better accountability and transparency by ensuring that all national allocations are included in municipal budgets.
Changes to local government allocations
Given the constrained and uncertain economic outlook, government will use savings from existing baselines to fund government priorities. As a result, the baselines of most conditional grants have been revised downward. Table W1.23 shows the savings made on local government conditional grants to make resources available. No savings were made on the local government equitable share.
31
2013 BUDGET REVIEW
Table W1.23 Savings effected on direct and indirect transfers to local government, 2013/14 – 2015/16
| | | | | | | | | | | | | | | | |
R million | | 2013/14 | | | 2014/15 | | | 2015/16 | | | 2013 MTEF
Total
revisions | |
Direct conditional grants | | | -36 | | | | -292 | | | | -414 | | | | -742 | |
Infrastructure transfers | | | — | | | | -211 | | | | -349 | | | | -560 | |
Urban settlements development grant | | | — | | | | -211 | | | | -331 | | | | -542 | |
Neighbourhood development partnership grant | | | — | | | | — | | | | -18 | | | | -18 | |
Recurrent transfers | | | -36 | | | | -81 | | | | -64 | | | | -182 | |
Energy efficiency and demand-side management grant | | | -19 | | | | -45 | | | | -7 | | | | -71 | |
Municipal disaster grant | | | -4 | | | | -7 | | | | -12 | | | | -23 | |
Municipal systems improvement grant | | | -2 | | | | -5 | | | | -8 | | | | -16 | |
Expanded public works programme integrated grant for municipalities | | | -11 | | | | -24 | | | | -37 | | | | -72 | |
Indirect conditional grants | | | -489 | | | | -221 | | | | -229 | | | | -939 | |
Integrated national electrification programme | | | -33 | | | | -36 | | | | -38 | | | | -106 | |
Rural households infrastructure grant | | | -282 | | | | — | | | | — | | | | -282 | |
Water services operating subsidy | | | -174 | | | | -186 | | | | -192 | | | | -551 | |
| | | | | | | | | | | | | | | | |
Total | | | -525 | | | | -513 | | | | -643 | | | | -1 681 | |
| | | | | | | | | | | | | | | | |
Table W1.24 outlines all of the technical revisions and additions to local government allocations for the 2013 MTEF.
32
ANNEXURE W1: EXPLANATORY MEMORANDUM TO THE DIVISION OF REVENUE
Table W1.24 Revisions to direct and indirect transfers to local government, 2013/14 – 2015/16
| | | | | | | | | | | | | | | | |
R million | | 2013/14 | | | 2014/15 | | | 2015/16 | | | 2013 MTEF
Total
revisions | |
Technical adjustments | | | -82 | | | | -289 | | | | 37 | | | | -334 | |
Direct transfers | | | 25 | | | | -289 | | | | 37 | | | | -227 | |
Municipal infrastructure grant | | | -291 | | | | -1 259 | | | | -1 273 | | | | -2 823 | |
Municipal water infrastructure grant | | | 291 | | | | 946 | | | | 1 273 | | | | 2 510 | |
Public transport infrastructure grant | | | -881 | | | | -745 | | | | -862 | | | | -2 488 | |
Public transport network operations grant | | | 881 | | | | 745 | | | | 862 | | | | 2 488 | |
Infrastructure skills development grant | | | -2 | | | | -2 | | | | -2 | | | | -5 | |
Expanded public works programme integrated grant for municipalities | | | -80 | | | | -88 | | | | -80 | | | | -248 | |
Rural households infrastructure grant | | | 107 | | | | 113 | | | | 118 | | | | 338 | |
Indirect transfers | | | -107 | | | | — | | | | — | | | | -107 | |
Rural households infrastructure grant | | | -107 | | | | — | | | | — | | | | -107 | |
| | | | | | | | | | | | | | | | |
Additions to baselines | | | 1 278 | | | | 3 010 | | | | 9 859 | | | | 14 147 | |
| | | | | | | | | | | | | | | | |
Direct transfers | | | 805 | | | | 1 454 | | | | 6 966 | | | | 9 225 | |
Equitable share | | | — | | | | 851 | | | | 4 561 | | | | 5 413 | |
Municipal water infrastructure grant | | | 312 | | | | 113 | | | | 1 399 | | | | 1 824 | |
Municipal infrastructure grant | | | — | | | | 179 | | | | 231 | | | | 410 | |
Integrated national electrification programme | | | 320 | | | | 77 | | | | 500 | | | | 897 | |
Infrastructure skills development grant | | | — | | | | 50 | | | | 70 | | | | 120 | |
Integrated city development grant | | | 40 | | | | 150 | | | | 150 | | | | 340 | |
2014 African Nations Championship host city operating grant | | | 120 | | | | — | | | | — | | | | 120 | |
Rural roads asset management systems grant | | | 13 | | | | 34 | | | | 54 | | | | 101 | |
Indirect transfers | | | 473 | | | | 1 556 | | | | 2 892 | | | | 4 922 | |
Neighbourhood development partnership grant | | | — | | | | — | | | | 4 | | | | 4 | |
Integrated national electrification programme | | | 191 | | | | 425 | | | | 1 522 | | | | 2 139 | |
Regional bulk infrastructure grant | | | 282 | | | | 1 131 | | | | 1 366 | | | | 2 779 | |
| | | | | | | | | | | | | | | | |
Due to the cumulative effect of the savings to fund national priorities, technical revisions and additions to baselines, the value of transfers to local government increases by R12.1 billion over the MTEF. Of this, R8.2 billion is added to direct transfers and R3.9 billion will be spent by national departments as indirect transfers.
Table W1.25 Net changes to direct and indirect transfers to local government, 2013/14 – 2015/16
| | | | | | | | | | | | | | | | |
R million | | 2013/14 | | | 2014/15 | | | 2015/16 | | | 2013 MTEF
total
revisions | |
Total of revisions to baselines | | | 1 196 | | | | 2 721 | | | | 9 896 | | | | 13 813 | |
Direct transfers | | | 830 | | | | 1 165 | | | | 7 003 | | | | 8 998 | |
Indirect transfers | | | 366 | | | | 1 556 | | | | 2 892 | | | | 4 815 | |
Less | | | | | | | | | | | | | | | | |
Total savings to fund government priorities | | | -525 | | | | -513 | | | | -643 | | | | -1 681 | |
Direct transfers | | | -36 | | | | -292 | | | | -414 | | | | -742 | |
Indirect transfers | | | -489 | | | | -221 | | | | -229 | | | | -939 | |
| | | | | | | | | | | | | | | | |
Net additions to baselines | | | 671 | | | | 2 208 | | | | 9 253 | | | | 12 131 | |
| | | | | | | | | | | | | | | | |
Direct transfers | | | 793 | | | | 873 | | | | 6 590 | | | | 8 256 | |
Indirect transfers | | | -123 | | | | 1 335 | | | | 2 663 | | | | 3 875 | |
| | | | | | | | | | | | | | | | |
33
2013 BUDGET REVIEW
Transfers to local government
Over the 2013 MTEF, R277.7 billion will be transferred directly to local government and a further R21.5 billion has been allocated to indirect grants. Direct transfers to local government in 2013/14 account for 8.9 per cent of national government’s non-interest expenditure. When indirect transfers are added to this, total spending on local government rises to 9.5 per cent of national non-interest expenditure. The value of direct transfers to local government grows at an average annual rate of 9.9 per cent over the MTEF. This is significantly above projected inflation, but lower than the rapid growth in transfers between 2001/02 and 2011/12 – when the value of direct transfers to local government grew from R6.5 billion to R68.3 billion, with an average annual growth rate of 27.2 per cent.
Table W1.26 Transfers to local government, 2009/10 – 2015/16
| | | | | | | | | | | | | | | | | | | | | | | | | | | | |
| | | 2009/10 | | | 2010/11 | | | 2011/12 | | | 2012/13 | | | 2013/14 | | | 2014/15 | | | 2015/16 | |
R million | | Outcome | | | Revised
estimate | | | Medium-term estimates | |
Direct transfers | | | 51 537 | | | | 60 904 | | | | 68 251 | | | | 77 028 | | | | 84 651 | | | | 91 579 | | | | 101 469 | |
Equitable share and related | | | 23 845 | | | | 30 541 | | | | 33 173 | | | | 37 373 | | | | 40 582 | | | | 44 490 | | | | 50 208 | |
Equitable share formula1 | | | 20 281 | | | | 26 761 | | | | 29 289 | | | | 32 981 | | | | 35 886 | | | | 39 409 | | | | 44 900 | |
RSC levy replacement | | | 3 306 | | | | 3 492 | | | | 3 544 | | | | 3 733 | | | | 3 930 | | | | 4 146 | | | | 4 337 | |
Support for councillor remuneration and ward committees | | | 258 | | | | 288 | | | | 340 | | | | 659 | | | | 766 | | | | 935 | | | | 971 | |
General fuel levy sharing with metros | | | 6 800 | | | | 7 542 | | | | 8 573 | | | | 9 040 | | | | 9 613 | | | | 10 190 | | | | 10 659 | |
Conditional grants | | | 20 893 | | | | 22 822 | | | | 26 505 | | | | 30 615 | | | | 34 456 | | | | 36 899 | | | | 40 603 | |
Infrastructure | | | 18 699 | | | | 20 871 | | | | 24 643 | | | | 28 029 | | | | 31 092 | | | | 33 548 | | | | 36 971 | |
Capacity building and other | | | 2 194 | | | | 1 951 | | | | 1 862 | | | | 2 586 | | | | 3 364 | | | | 3 351 | | | | 3 632 | |
Indirect transfers | | | 3 081 | | | | 2 939 | | | | 2 770 | | | | 4 956 | | | | 5 538 | | | | 7 171 | | | | 8 768 | |
Infrastructure | | | 2 763 | | | | 2 682 | | | | 2 553 | | | | 4 823 | | | | 5 399 | | | | 7 029 | | | | 8 617 | |
Capacity building and other | | | 318 | | | | 257 | | | | 217 | | | | 133 | | | | 139 | | | | 142 | | | | 151 | |
| | | | | | | | | | | | | | | | | | | | | | | | | | | | |
Total | | | 54 618 | | | | 63 843 | | | | 71 021 | | | | 81 984 | | | | 90 190 | | | | 98 751 | | | | 110 237 | |
| | | | | | | | | | | | | | | | | | | | | | | | | | | | |
| 1. | Outcome figures for the equitable share reflect amounts transferred after funds have been withheld to offset underspending by municipalities on conditional grants |
The local government equitable share
In terms of section 227 of the Constitution, local government is entitled to an equitable share of nationally raised revenue to enable it to provide basic services and perform its allocated functions. The local government equitable share is an unconditional transfer that supplements the income that municipalities can raise from the sources of own revenues available to them (including property rates and service charges). The equitable share provides funding for municipalities to deliver free basic services to poor households and subsidises the cost of administration and other core services for those municipalities that have the least potential to cover these costs from their own revenues.
Over the 2013 MTEF, the local government equitable share, including the RSC/JSB levies replacement grant and special support for councillor remuneration and ward committees, is worth R135.3 billion – R40.6 billion in 2013/14, R44.5 billion in 2014/15 and R50.2 billion in 2015/16.
Review of the equitable share formula
The share of national revenue allocated to local government through the equitable share is determined in the national budget process and endorsed by Cabinet (the vertical division). Local government’s equitable share is divided among the country’s 278 municipalities using a formula (the horizontal division).
34
ANNEXURE W1: EXPLANATORY MEMORANDUM TO THE DIVISION OF REVENUE
During 2012, the National Treasury, the Department of Cooperative Governance and SALGA, in partnership with the FFC and Statistics South Africa, reviewed the local government equitable share formula. The review did not include a review of the RSC/JSB levies replacement grant or the special support for councillor remuneration and ward committees, both of which are transferred with the equitable share, but calculated separately. The review proposed an improved structure for the formula, but did not make recommendations about the vertical division of revenue (total transfers to local government), as this is a decision made separately as part of the budget process.
The review was conducted in three phases. In the first phase, the formula’s principles and objectives were reviewed and proposed revisions were presented to, and broadly welcomed by, municipalities during a series of consultations in May and June 2012. In the second phase, these revised principles and objectives (following the consultations) were used to formulate a proposal for a new structure for the formula. This was presented to municipalities in a discussion paper and at a workshop held in September 2012. The proposed structure was generally accepted by municipalities and was endorsed by the Budget Forum in October 2012. In the third phase, the review team constructed the new formula using data from the 2011 Census results, taking into account comments and proposals from municipalities where possible. The new formula and allocations were endorsed by the Budget Forum on 7 February 2013 and by Cabinet on 13 February 2013.
Principles of the local government equitable share formula
Following the first round of consultations with municipalities, it was agreed that the following principles should underpin the new local government equitable share formula. These principles were endorsed at a meeting of the Budget Forum on 8 October 2012.
The local government equitable share formula must:
| | 1. | Be objective and fair – Municipalities with similar characteristics must be treated in the same way by the formula and the formula design must be immune to subjective adjustments to favour a particular municipality. |
| | 2. | Be dynamic and able to respond to changes – The formula must be capable of taking account of significant changes in the objective circumstances of municipalities, enable the smooth updating of data and be able to respond to policy changes. |
| | 3. | Recognise diversity among municipalities – The formula should take account of the different characteristics of municipalities and funds allocated for a particular function must go to the municipality officially authorised to perform that function (the local government equitable share will not fund municipalities for services that are the competency of other spheres). |
| | 4. | Only use high-quality, verifiable and credible data – Official, up-to-date data should be used wherever possible. Data must not be manipulated (this does not preclude the use of credible estimates and projections) and fair average cost estimates for basic services should be used (including maintenance costs). |
| | 5. | Be transparent and simple – The formula and information about how allocations are derived must be transparent and available to municipalities and the general public. The simpler the formula is, the more people will be able to engage with it. Local municipalities must remain accountable to their residents for resources they use, including transfers received. |
| | 6. | Provide for predictability and stability – Municipalities should be provided with a degree of certainty about their future allocations to enable them to plan and budget effectively. |
35
2013 BUDGET REVIEW
Objectives of the local government equitable share formula
The following objectives of the new local government equitable share formula were agreed upon following the first round of consultations with municipalities. These objectives were also endorsed at a meeting of the Budget Forum on 8 October 2012:
| | 1. | Enable municipalities to provide basic services to poor households |
The local government equitable share should:
| | • | | Supplement municipal budgets so that an efficient municipality will be able to progressively provide free basic services to its poor households in line with national policy norms and standards. |
| | • | | Assist with the operational costs (including maintenance costs) of basic services for poor households. Capital costs should be funded through conditional grants, own revenues and borrowing. |
| | • | | Support municipalities to create the foundation for economic growth through the sustainable provision of municipal functions. |
| | • | | Reflect that maintenance should be budgeted for as part of the operational costs of service delivery. |
| | • | | Promote the efficient delivery of services and not penalise efficient alternative modes of service delivery. |
| | • | | Create positive incentives for municipalities that roll out services to reach more households. |
| | 2. | Enable municipalities with limited own resources to afford basic administrative and governance capacity and perform core municipal functions |
The local government equitable share should:
| | • | | Provide funding to enable resource-poor municipalities to afford a basic level of administrative and governance capacity. |
| | • | | Provide funding towards the cost of performing essential functions in municipalities with limited own-revenue bases. |
| | • | | Recognise the ability of certain municipalities to cross-subsidise the delivery of administrative and other essential municipal services from their own revenue. |
| | • | | Take account of the different levels of fiscal capacity in municipalities, without rewarding inefficiency. |
| | • | | Ensure that allocations do not crowd out municipal own-revenue-raising efforts and the revenue-accountability link that the collection of these revenues creates. |
Structure of the local government equitable share formula
The formula uses demographics and other data to determine each municipality’s share of the local government equitable share. It has three parts, made up of five components:
| | • | | The first part of the formula consists of the basic services component, which provides for the cost of free basic services for poor households. |
| | • | | The second part enables municipalities with limited own resources to afford basic administrative and governance capacity and perform core municipal functions. It does this through three components: |
| | • | | The institutional component provides a subsidy for basic municipal administrative costs. |
| | • | | The community services component provides funds towards the provision of core municipal services not included under basic services. |
| | • | | The revenue adjustment factor ensures that funds from this part of the formula are only provided to municipalities with limited potential to raise own revenues. Municipalities the least able to fund these costs from their own revenues should receive the most funding. |
| | • | | The third part of the formula provides predictability and stability through a correction and stabilisation factor, which ensures that all of the formula’s guarantees can be met. |
Each of these components is described in detail in the subsections that follow, while the structure of the formula is summarised in the box below.
36
ANNEXURE W1: EXPLANATORY MEMORANDUM TO THE DIVISION OF REVENUE
Structure of the local government equitable share formula
LGES = BS + (I + CS)xRA ± C
where
LGES is the local government equitable share
BS is the basic services component
I is the institutional component
CS is the community services component
RA is the revenue adjustment factor
C is the correction and stabilisation factor
The basic services component
This component helps municipalities provide free basic water, sanitation, electricity and refuse removal services to households that fall below an affordability threshold. During the consultation process it emerged that municipalities would prefer the formula’s affordability measure (used to determine how many households should be targeted for free basic services) to be based on the level of two state old age pensions. When the 2011 Census was conducted, the state old age pension was worth R1 140 per month, two old age pensions were therefore worth R2 280 per month. A monthly household income of R2 300 per month has therefore been used to define the formula’s affordability threshold. Statistics South Africa has calculated the number of households in each municipality that fall below this income level in the 2011 Census. The basic services component provides a subsidy of R278 per month in 2013/14 for the cost of providing basic services to each of these households. The allocation to each municipality is calculated by multiplying this monthly subsidy by the number of households below the affordability threshold in each municipal area.
The free basic services subsidy includes funding for the provision of free basic water (6 kilolitres per poor household per month), energy (50 kilowatt-hours per month) and sanitation and refuse (based on service levels defined by national policy). The monthly amount provided for each service is detailed in Table W1.27 and includes an allocation of 10 per cent towards the maintenance costs of providing the service.
Table W1.27 Amounts per basic service allocated through the local government equitable share
| | | | | | | | | | | | | | | | |
| | | Allocation per household below affordability threshold
(Rands) | | | Total allocation
per service | |
| | | Operations | | | Maintenance | | | Total | | | (R millions) | |
Energy | | | 50.66 | | | | 5.63 | | | | 56.29 | | | | 5 719 | |
Water | | | 77.80 | | | | 8.64 | | | | 86.45 | | | | 8 783 | |
Sanitation | | | 64.84 | | | | 7.20 | | | | 72.04 | | | | 7 319 | |
Refuse | | | 54.35 | | | | 6.04 | | | | 60.39 | | | | 6 136 | |
| | | | | | | | | | | | | | | | |
Total basic services | | | 247.65 | | | | 27.52 | | | | 275.17 | | | | 27 957 | |
| | | | | | | | | | | | | | | | |
The formula uses the fairest estimates of the average costs of providing each service that could be derived from available information. These cost estimates do not account for municipalities’ different circumstances as there are no credible ways of estimating the cost pressures in each municipality. By using generous estimates for each of the four services, municipalities should receive sufficient funds to provide the full basket of free basic services to their poor households. More details of how the cost estimates were arrived at can be found in the discussion paper on the proposed structure of the new local government equitable share formula (available at the following address: http://mfma.treasury.gov.za/Media_Releases/LGESDiscussions/Pages/default.aspx).
Unlike the previous formula, which provided a lower subsidy for households without access to services, this formula provides the same basic services subsidy for all poor households. Funding for each basic service is allocated to the municipality (metro, district or local) that is authorised to provide that service. If another municipality provides a service on behalf of the authorised municipality, it should transfer funds to the provider in terms of section 28 of the Division of Revenue Act.
37
2013 BUDGET REVIEW
The previous local government equitable share formula used a household income level of R800 per month in terms of the 2001 Census to define the affordability threshold for funding free basic services. About 47 per cent of all households were below this threshold in 2001. Adjusting for the effects of inflation between 2001 and 2011, an income of R800 per month in 2001 would be worth about R1 500 in 2011. The new affordability threshold of R2 300 per month is substantially higher in real terms. As a result, more households (59 per cent) fall below this threshold in the new formula. This threshold is based on inputs from municipalities and should not be taken as an official poverty line or as a required level to be used by municipalities in their own indigence policies. However, if municipalities choose to provide fewer households with free basic services than they are funded for through the local government equitable share, then their budget documentation should clearly set out why they have made this choice and how it has been consulted on with their community during their budget process.
The basic services component
BS = basic services subsidy x number of poor households
The basic services component is worth R28 billion in 2013/14 and accounts for 77.9 per cent of the value of the local government equitable share.
The institutional component
To provide basic services to households, municipalities need to be able to run a basic administration. Most municipalities should be able to fund the majority of their administration costs through own revenues, but because poor households will not be able to contribute, the equitable share includes an institutional support component to help meet some of these costs. As this component is intended to assist municipalities with limited own-revenue-raising abilities, a revenue adjustment factor is applied to ensure that a larger proportion of the allocation is received by municipalities with less potential to raise own revenue. The revenue adjustment factor is described in more detail later in this annexure.
This component consists of a base allocation of R5 million that goes to every municipality and an additional amount that is based on the number of council seats in each municipality. This reflects the relative size of a municipality’s administration and is not intended to fund the costs of councillors only (the number of seats recognised for the formula is determined by the Minister of Cooperative Governance and Traditional Affairs for elections and composition). The base component acknowledges that there are some fixed costs that all municipalities face.
The institutional component
I = base allocation + [allocation per councillor * number of council seats]
The institutional component accounts for 8.8 per cent of the equitable share formula and is worth R3.2 billion in 2013/14. This component is also complemented by the special support for councillor remuneration to poor municipalities provided outside of the equitable share formula (described in more detail later).
The community services component
This new component funds services for communities rather than households (which are provided for in the basic services component). It includes funding for municipal health services, fire services, municipal roads, cemeteries, planning, storm water, street lighting, parks and so on. As this component is intended to assist municipalities with limited own-revenue-raising abilities, a revenue adjustment factor is applied to ensure that a larger proportion of the allocation is received by municipalities with less potential to raise own revenue. The revenue adjustment factor is described in more detail later in this annexure.
38
ANNEXURE W1: EXPLANATORY MEMORANDUM TO THE DIVISION OF REVENUE
The allocation for this component is split between district and local municipalities, as both provide community services. In 2013/14, the allocation to district and metropolitan municipalities for municipal health and related services is R7 per household per month. The component’s remaining funds are allocated to local and metropolitan municipalities based on the number of households in each municipality.
The community services component
CS = [municipal health and related services allocation x number of households] + [other services allocation x number of households]
The community services component accounts for 13.3 per cent of the equitable share formula and is worth R4.8 billion in 2013/14.
The revenue adjustment factor
The Constitution gives local government substantial own-revenue-raising powers (particularly through property rates and surcharges on services). Municipalities are expected to fund much of their own administrative costs and cross-subsidise some services for indigent residents. Given the different levels of poverty across South Africa, the formula does not expect all municipalities to be able to generate similar amounts of own revenue. A revenue adjustment factor is applied to the institutional and non-trading services components of the formula to ensure that these funds assist municipalities that are least likely to be able to fund these functions from their own revenues.
To account for the varying fiscal capacities of municipalities, this component is based on a per capita index using the following factors from the 2011 Census:
| • | | Total income of all individuals/households residing in a municipality (as a measure of economic activity and earning) |
| • | | Reported property values |
| • | | Number of households on traditional land |
| • | | Proportion of poor households as percentage of total number of households in the municipality. |
To create an index from these factors, a regression was run to determine to what extent each of these factors correlated with the ability of municipalities to collect own revenue from property rates in 2009/10 and 2010/11 (recorded in their audited budget figures). Based on this analysis, each factor was given a weighting and an index was calculated based on what these factors predict about the potential for municipalities to collect own revenue in future. Based on this index, municipalities were ranked from highest per capita revenue-raising potential to the lowest. The top 10 per cent of municipalities on this list have a revenue adjustment factor of zero, meaning that they will receive no allocation from the institutional and non-trading services components when the factor is applied to them. The 25 per cent of municipalities with the lowest scores have a revenue adjustment factor of 100 per cent, which means that they will receive their full allocation from the institutional and non-trading services components. Municipalities between the bottom 25 per cent and top 10 per cent have a revenue adjustment factor applied on a sliding scale so that those with higher per capita revenue-raising potential receive a lower revenue adjustment factor and those with less potential receive a larger revenue adjustment factor.
The revenue adjustment factor is not based on the actual revenues municipalities collect. This component therefore does not create any perverse incentive for municipalities to under-collect potential own revenues to receive a higher equitable share.
39
2013 BUDGET REVIEW
As district municipalities do not collect own revenues from property rates, the revenue adjustment factor applied to these municipalities is based on the RSC/JSB levies replacement grant allocations. This grant replaces a source of own revenues previously collected by district municipalities. It is still treated as an own-revenue source in many respects. Similar to the revenue adjustment factor for local and metropolitan municipalities, the factor applied to district municipalities is based on their per capita RSC/JSB levies replacement grant allocations. The 10 per cent of municipalities with the highest per capita scores receive a revenue adjustment factor of zero, while those with the lowest 10 per cent receive a factor of 100 per cent. District municipalities in between are given revenue adjustment factors on a sliding scale —those with a higher per capita RSC/JSB levies replacement grant allocation receive a lower revenue adjustment factor and those with lower allocations receive a larger revenue adjustment factor.
Correction and stabilisation factor
Providing municipalities with predictable and stable equitable share allocations is one of the principles of the equitable share formula. To ensure predictability, indicative allocations are published for the second and third years of the MTEF period. To provide stability for municipal planning, while giving national government flexibility to account for overall budget constraints and the need to amend the formula, municipalities are guaranteed to receive at least 90 per cent of the indicative allocation for the middle year of the MTEF.
With the introduction of the new equitable share formula and the updated 2011 Census data used in the formula, some municipalities will experience large changes in their equitable share allocations. To smooth the impact of these changes and give municipalities time to adjust (both for municipalities with increasing and decreasing allocations), the new allocations will be phased in over five years. For municipalities with smaller allocations under the new formula, the phase-in mechanism will measure the difference between the municipality’s old and new allocations and will close this gap by 20 per cent each year. This means that in the first year, a municipality will only experience a change equivalent to 20 per cent of the gap between their allocations under the old and the new formulas, in the second year they will experience a 40 per cent change, and so on until in the fifth year their allocation is determined entirely through the new formula.
To provide for this phase-in, while staying within the limits of the equitable share envelope, municipalities with larger allocations will also have their increases phased in over five years. The total top-up amount needed to fund the phase-in for municipalities with declining allocations is calculated and deducted from those that do not require a top-up in proportion to their “surplus.” This means that municipalities with larger allocations will have some of those gains delayed over the phase-in period.
Ensuring the formula balances
The formula is structured to ensure that all of the available funds are allocated. The formula automatically determines the value of the allocation per council seat in the institutional component and the allocation per household for other services in the community services component to ensure that it balances. The basic services component is determined by the number of poor households per municipality and the estimated cost of free basic services, so this component cannot be manipulated. This means that the balancing of the formula to the available envelope of resources must take place in the second part of the formula, which includes the institutional and community services components.
40
ANNEXURE W1: EXPLANATORY MEMORANDUM TO THE DIVISION OF REVENUE
Structure of the previous local government equitable share formula
The previous local government equitable share formula is shown below. Like the new formula described above, it has basic services and institutional and correction components. But while the previous formula subtracts a revenue-raising capacity correction from the whole formula, the proposed new formula applies a revenue adjustment factor to the institutional and community services components only. The community services component is a new addition to the formula. The development component in the previous formula has never been activated.
Grant = BS + D + I – R ± C
where
BS is the basic services component
D is the development component
I is the institutional support component
R is the revenue-raising capacity correction
C is a correction and stabilisation factor
Updating the formula for future years
One of the major changes introduced in the new formula is that the data underpinning each of the components will be updated annually to reflect changes or estimated changes. The previous formula’s demographic information was still based on the 2001 Census and cost of services was based on estimates from the mid-1990s.
In future, the following factors will be updated in the formula:
| • | | The electricity cost estimate is made up of bulk and other costs. Bulk costs will be updated based on the multi-year price determination approved by the National Energy Regulator of South Africa and other costs will be updated based on the National Treasury’s inflation projections. |
| • | | The water cost estimate is also made up of bulk and other costs. Bulk costs will be updated based on the weighted average increase in bulk tariffs charged by water boards (although not all municipalities purchase bulk water from water boards, their price increases serve as a proxy for the cost increases faced by all municipalities). Other components will be updated based on the National Treasury’s inflation projections. |
| • | | The cost estimates for other services will be updated based on the National Treasury’s inflation projections. |
| • | | The base amount for municipal health and related services and the base allocation in the institutional component will also be updated based on the National Treasury’s inflation projections. |
| • | | The number of households and those falling below the affordability threshold per municipality will be updated each year using average annual household growth in each municipality between the 2001 and 2011 Census. This data will be used to estimate future growth. The estimated total number of households reflected in the formula will be adjusted each year to balance with Statistics South Africa’s mid-year population estimate (for the purposes of calculating these estimates, it will be assumed that average household size remains constant in future years). It is assumed that municipalities that experienced negative household growth between 2001 and 2011 will have zero growth in future. The credibility of estimates will be constantly reviewed and this methodology will be updated to reflect any municipal-level population estimates endorsed by Statistics South Africa or any municipal-level survey or census. |
For the 2013 MTEF, the indicative allocations for 2014/15 and 2015/16 have been calculated assuming electricity bulk price increases of 16 per cent, water bulk increases of 7.2 per cent, inflation of 5.1 per cent in 2014/15 and 4.9 per cent in 2015/16 and household growth in line with the period between 2001 and 2011. These variables will be updated in future budgets to reflect any changes in the growth in prices or estimates of population growth. Such updates will result in changes to the allocations to municipalities, and indicative allocations for future years will change to reflect adjustments in these variables.
41
2013 BUDGET REVIEW
The need to introduce the new formula over a five-year period means that the full impact of the annual updates will be moderated by the phasing-in effect, which will slow the pace of both increases and decreases in the allocations to individual municipalities. This is necessary to avoid any sudden and potentially destabilising changes in allocations.
Potential refinements to the formula
Although the new local government equitable share formula has been through extensive consultations and much technical work, national government is still open to improving the formula’s functioning in terms of the agreed principles and objectives. Areas for possible refinement include the introduction of factors to account for the land area and settlement types of municipalities within the community services component (this was an option many municipalities were strongly in favour of during the consultations, but it was not technically feasible for the 2013 formula). The proposal for the new local government equitable share formula included a specific sub-component for fire services within the community services component. These funds were to be allocated to the municipality (district, local or metropolitan) authorised to perform the function. Unfortunately, implementation will have to be delayed as there is no credible and comprehensive database available on this function’s assignment.
While national government is committed to considering all proposed refinements to the formula, another full review is not envisaged until it has been fully phased in.
Impact of the new formula
The new local government equitable share formula has many advantages. The structure responds directly to the formula’s objectives; cost estimates for basic services are more realistic; the broadly accepted poverty measure covers nearly 60 per cent of households in South Africa; institutional funding for poor municipalities is better targeted; there is funding for community services; and the data used to calculate allocations is updated annually.
The new formula also changes the allocations to municipalities. As Figure W1.1 below demonstrates, under the previous equitable share formula the allocations for rural municipalities were the lowest when considered per poor household (comparison is made after adding all funds allocated to district and local municipalities to serve the same area). In the new formula, rural municipalities receive the largest allocations on a per-poor-household basis. As rural municipalities generally struggle to fund their costs from own revenues it is appropriate that they receive stronger support from transfers.
Figure W1.1 Equitable share allocations per poor household for different types of municipalities, 2012/13 allocations (left) and 2013/14 allocations (right) using the new formula
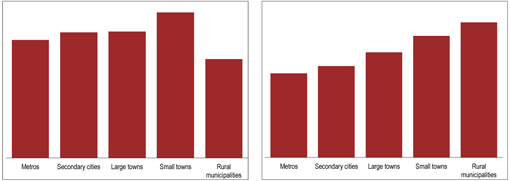
Note: Allocations reflect all funds allocated for services in the area of a municipality, whether those funds are transferred to a district or local municipality. Allocations for 2013/14 are determined through the new formula before the correction and stabilisation component is applied.
The full impact of these changes will not be felt in 2013/14 as the guarantees and phase-in process will keep the new formula’s allocations to some municipalities above the determined amount, and funds will be subtracted from allocations to other municipalities to fund these guarantees. The full impact of the new formula will therefore not be felt until 2017/18 when it is fully phased in.
42
ANNEXURE W1: EXPLANATORY MEMORANDUM TO THE DIVISION OF REVENUE
The addition of R5.4 billion to the equitable share over the 2013 MTEF (R851 million in 2014/15 and R4.6 billion in 2015/16) will cover the expected increases in the costs of basic services and provide for additional funds to flow through the institutional and community services components in 2015/16. These additions will further increase the allocations to municipalities with low own-revenue-raising potential.
Details of new allocations
In addition to the three-year formula allocations published in the Division of Revenue Bill, estimates of municipal allocations over the full five years of the phase-in period will be provided on the National Treasury’s website. This will enable municipalities to see what the full impact of the new formula will be once it is fully phased in. To promote transparency (in line with principle 5 of the formula), details of each component’s allocation and a summary version of the formula will also be published (available at: http://mfma.treasury.gov.za/Media_Releases/LGESDiscussions/Pages/default.aspx).
Other unconditional allocations
RSC/JSB levies replacement grant
Before 2006, district municipalities raised levies on local businesses through an RSC or JSB levy. This source of revenue was replaced in 2006/07 with the RSC/JSB levies replacement grant, which was allocated to all district and metropolitan municipalities based on the amounts they had previously collected through the levies (the RSC/JSB levies replacement grant for metropolitan municipalities has since been replaced by the sharing of the general fuel levy). The value of the grant increases every year. In 2013/14, the grant increases by 9 per cent a year for district municipalities authorised for water and sanitation and 3 per cent for unauthorised district municipalities. The different rates recognise the various service-delivery responsibilities of these district municipalities.
Special support for councillor remuneration and ward committees
Councillors’ salaries are subsidised in poor municipalities. This support is calculated separately to the local government equitable share and is in addition to the funding for governance costs provided in the institutional component. The level of support for each municipality is determined by the classification system used in the Government Gazette, which determines the upper limits of salaries, allowances and benefits of different members of municipal councils. The gazette, published annually by the Minister of Cooperative Governance and Traditional Affairs, classifies municipal councils into six grades based on their total income and population size. Special support is provided to the lowest three grades of municipal councils (the smallest and poorest municipalities). Funds were added in the 2012 MTEF to increase the support for councillor remuneration. These additions are still being phased in during 2013/14 and 2014/15. The proportion of councillors’ salaries subsidised through this allocation for different grades of municipalities is shown in Table W1.28. All subsidy levels are based on the gazetted upper maximum levels for part-time councillors. In addition, each municipality in grades 1 to 3 receives an allocation to provide stipends of R500 per month to 10 members of each ward committee in their municipality. Each municipality’s allocation for this special support is published in the appendices to the Division of Revenue Bill.
Table W1.28 Subsidy levels provided for councillor remuneration
| | | | | | | | | | | | |
Municipal grade | | 2013/14 | | | 2014/15 | | | 2015/16 | |
1 | | | 90.0 | % | | | 90.0 | % | | | 90.0 | % |
2 | | | 70.0 | % | | | 80.0 | % | | | 80.0 | % |
3 | | | 55.0 | % | | | 70.0 | % | | | 70.0 | % |
43
2013 BUDGET REVIEW
Conditional grants to local government
National government allocates funds to local government through a variety of conditional grants. These grants fall into two main groups: infrastructure and capacity building. The total value of conditional grants directly transferred to local government increases from R34.5 billion in 2013/14 to R36.9 billion in 2014/15 and R40.6 billion in 2015/16.
Infrastructure conditional grants to local government
National transfers for infrastructure, including indirect or in-kind allocations to entities executing specific projects in municipalities, amount to R122.7 billion over the 2013 MTEF.
Table W1.29 Infrastructure transfers to local government, 2009/10 – 2015/16
| | | | | | | | | | | | | | | | | | | | | | | | | | | | |
| | | 2009/10 | | | 2010/11 | | | 2011/12 | | | 2012/13 | | | 2013/14 | | | 2014/15 | | | 2015/16 | |
| R million | | Outcome | | | Revised
estimate | | | Medium-term estimates | |
Direct transfers | | | 18 699 | | | | 20 871 | | | | 24 643 | | | | 28 029 | | | | 31 092 | | | | 33 548 | | | | 36 971 | |
Municipal infrastructure grant | | | 8 728 | | | | 9 704 | | | | 11 443 | | | | 13 882 | | | | 14 352 | | | | 14 684 | | | | 15 448 | |
Municipal water infrastructure grant | | | — | | | | — | | | | — | | | | — | | | | 603 | | | | 1 059 | | | | 2 672 | |
Urban settlements development grant | | | 4 418 | | | | 4 968 | | | | 6 267 | | | | 7 392 | | | | 9 077 | | | | 10 335 | | | | 10 700 | |
Integrated national electrification programme | | | 900 | | | | 1 033 | | | | 1 097 | | | | 1 151 | | | | 1 635 | | | | 1 565 | | | | 2 056 | |
Public transport infrastructure grant | | | 2 421 | | | | 3 700 | | | | 4 612 | | | | 4 988 | | | | 4 669 | | | | 5 126 | | | | 5 279 | |
Neighbourhood development partnership grant | | | 508 | | | | 832 | | | | 738 | | | | 578 | | | | 598 | | | | 591 | | | | 600 | |
2010 FIFA World Cup stadiums development grant | | | 1 661 | | | | 302 | | | | — | | | | — | | | | — | | | | — | | | | — | |
Rural roads asset management systems grant | | | 10 | | | | 10 | | | | 35 | | | | 37 | | | | 52 | | | | 75 | | | | 98 | |
Rural households infrastructure grant | | | — | | | | — | | | | — | | | | — | | | | 107 | | | | 113 | | | | 118 | |
Municipal drought relief grant | | | 54 | | | | 320 | | | | 450 | | | | — | | | | — | | | | — | | | | — | |
Indirect transfers | | | 2 763 | | | | 2 682 | | | | 2 553 | | | | 4 823 | | | | 5 399 | | | | 7 029 | | | | 8 617 | |
Integrated national electrification programme | | | 1 616 | | | | 1 720 | | | | 1 165 | | | | 1 879 | | | | 2 141 | | | | 2 488 | | | | 3 680 | |
Neighbourhood development partnership grant | | | 70 | | | | 50 | | | | 50 | | | | 80 | | | | 55 | | | | 58 | | | | 65 | |
Regional bulk infrastructure grant | | | 577 | | | | 851 | | | | 1 260 | | | | 2 523 | | | | 3 203 | | | | 4 483 | | | | 4 872 | |
Backlogs in water and sanitation at clinics and schools | | | 350 | | | | — | | | | — | | | | — | | | | — | | | | — | | | | — | |
Backlogs in the electrification of clinics and schools | | | 149 | | | | — | | | | — | | | | — | | | | — | | | | — | | | | — | |
Rural households infrastructure grant | | | — | | | | 62 | | | | 78 | | | | 341 | | | | — | | | | — | | | | — | |
| | | | | | | | | | | | | | | | | | | | | | | | | | | | |
Total | | | 21 462 | | | | 23 553 | | | | 27 196 | | | | 32 852 | | | | 36 492 | | | | 40 577 | | | | 45 588 | |
| | | | | | | | | | | | | | | | | | | | | | | | | | | | |
Municipal infrastructure grant
The largest infrastructure transfer is made through the municipal infrastructure grant, which supports government’s aim to expand service delivery and alleviate poverty. The grant funds the provision of infrastructure for basic services, roads and social infrastructure for poor households in all non-metropolitan municipalities. The total allocations for this grant grow to R14.4 billion, R14.7 billion and R15.5 billion over the 2013 MTEF.
The municipal infrastructure grant is allocated through a formula with a vertical and horizontal division. The vertical division allocates resources between sectors and the horizontal division takes account of poverty, backlogs, and municipal powers and functions in allocating funds to municipalities. The five main components of the formula are described in the box below. A minimum allocation of R5 million ensures that a reasonable minimum allocation is made to small municipalities.
44
ANNEXURE W1: EXPLANATORY MEMORANDUM TO THE DIVISION OF REVENUE
Municipal infrastructure grant = C + B + P + E + N
C Constant to ensure increased minimum allocation for small municipalities (this allocation is made to all municipalities)
B Basic residential infrastructure (new and rehabilitation of existing infrastructure)
Proportional allocations for water supply and sanitation, roads and other (street lighting and solid waste removal)
P Public municipal service infrastructure (ring-fenced for municipal sport infrastructure)
E Allocation for social institutions and micro-enterprises infrastructure
N Allocation to the 23 priority districts identified by government
For the 2013 MTEF, the municipal infrastructure grant allocation formula has been updated with data from the 2011 Census. Allocations for basic services sub-components are based on the proportion of the national backlog for that basic service in each municipality. Other components are based on the proportion of the country’s poor households located in each municipality. Table W1.30 sets out the proportion of the grant accounted for by each component of the municipal infrastructure grant formula. The C-component provides a R5 million base to all municipalities.
In the 2011 division of revenue, the P-component (15 per cent of the grant) was ring-fenced for municipal sport and recreation infrastructure. This ring-fencing continues in the 2013 MTEF.
Amounts of R291.4 million in 2013/14, R946 million in 2014/15 and R1.2 billion in 2015/16 have been shifted from the municipal infrastructure grant to the new municipal water infrastructure grant described below. In the 2012 Division of Revenue Bill, the rural households infrastructure grant was to be phased into the municipal infrastructure grant. This decision has been reversed and amounts of R113.1 million in 2014/15 and R118.3 million in 2015/16 have been shifted from the municipal infrastructure grant to restore the rural households infrastructure grant.
Table W1.30 Municipal infrastructure grant allocations per sector
| | | | | | | | | | | | |
Municipal infrastructure grant (formula) | | Component
weights | | | Proportion of
MIG per sector | | | Value of
component
2013/14
(R millions) | |
B-component | | | 75.0 | % | | | | | | | 9 838 | |
Water and sanitation | | | 72.0 | % | | | 54.00 | % | | | 7 083 | |
Roads | | | 23.0 | % | | | 17.25 | % | | | 2 263 | |
Other | | | 5.0 | % | | | 3.75 | % | | | 492 | |
P-component | | | 15.0 | % | | | | | | | 1 968 | |
Sports | | | 100.0 | % | | | 15.00 | % | | | 1 968 | |
E-component | | | 5.0 | % | | | 5.00 | % | | | 656 | |
N-component | | | 5.0 | % | | | 5.00 | % | | | 656 | |
| | | | | | | | | | | | |
Constant | | | | | | | | | | | 1 235 | |
| | | | | | | | | | | | |
Total | | | | | | | | | | | 14 352 | |
| | | | | | | | | | | | |
Urban settlements development grant
In 2011/12, the urban settlements development grant was introduced for the eight metropolitan municipalities as an integrated source of infrastructure funding to upgrade urban informal settlements. The grant combines basic services funding (previously allocated through the municipal infrastructure grant)
45
2013 BUDGET REVIEW
with part of the basic services portion of the human settlements development grant (previously allocated to provinces). This shift reflects the importance of upgrading informal settlements and coordinating housing and basic services projects, and perhaps most significantly, government’s policy to devolve more housing authority to cities. The urban settlements development grant is allocated a total of R30.1 billion in the 2013 MTEF.
Municipal water infrastructure grant
This is a new grant, administered by the Department of Water Affairs, to accelerate the delivery of clean water to communities that do not have access to basic water services. The grant provides funding for municipalities to plan and implement various projects, including the construction of new infrastructure and the refurbishment and extension of existing water schemes. The grant has an allocation of R4.3 billion over the 2013 MTEF.
The public transport infrastructure grant
The public transport infrastructure grant is administered by the Department of Transport. This grant was previously the public transport infrastructure and systems grant. The operational portion of the previous grant has been separated as the public transport network operations grant from 2013/14, meaning that the infrastructure grant will only fund capital expenditure. The grant aims to help cities create new and improve existing public transport and non-motorised transport infrastructure. This includes the provision of infrastructure for bus rapid transit systems. The grant has an allocation of R15.1 billion over the 2013 MTEF.
The rural roads asset management systems grant
The rural roads asset management systems grant is administered by the Department of Transport to improve rural roads infrastructure. The grant funds the collection of accurate data on the condition and usage of rural roads in line with the Road Infrastructure Strategic Framework for South Africa. This data will guide investments to maintain and improve these roads. Rural district municipalities are funded to collect data on the condition and usage of all the municipal roads in their area so that the spending of infrastructure funds (from the municipal infrastructure grant and elsewhere) can be properly planned to maximise their impact. Over the 2013 MTEF, this grant will be extended to more municipalities. The grant has an allocation of R225.2 million over the MTEF.
The rural households infrastructure grant
The rural households infrastructure grant funds the provision of on-site solutions for water and sanitation services for rural households where piped infrastructure is not feasible. The grant will become a direct grant to municipalities in 2013/14. It was previously an indirect grant through which the Department of Human Settlements provided on-site infrastructure for water and sanitation in rural areas. From 2013/14, funds will be transferred directly to municipalities for these projects. This will allow municipalities to manage community consultation processes. The municipality will also be responsible for ensuring the infrastructure is maintained, providing a much greater incentive for maintenance planning to be included in projects from the beginning. The grant has an allocation of R338.2 million over the MTEF.
The neighbourhood development partnership grant
The neighbourhood development partnership grant seeks to develop community infrastructure and create a platform for private investment to improve the quality of life in townships. The grant is administered by the National Treasury and has an allocation of R2 billion over the MTEF for both the technical assistance (indirect) and capital (direct) grant.
The integrated national electrification programme
To sustain progress in connecting poor households to electricity, government will spend about R13.6 billion over the next three years on the national electrification programme. Of this, municipalities will spend R5.3 billion and Eskom will spend R8.3 billion on behalf of municipalities. This includes an additional R2.9 billion over the 2013 MTEF. This programme was instrumental in ensuring 85 per cent of all households have access to electricity, as reported in the 2011 Census.
46
ANNEXURE W1: EXPLANATORY MEMORANDUM TO THE DIVISION OF REVENUE
The regional bulk infrastructure grant
This grant supplements the financing of the social component of regional bulk water and sanitation. It targets projects that cut across several municipalities or are large bulk projects within one municipality. The grant supplements regional bulk collection and wastewater treatment works. It may also be used to appoint service providers to carry out feasibility studies, related planning or management studies for infrastructure projects. The grant has additional funding of R2.8 billion over the 2013 MTEF, bringing the total value of the grant to R12.6 billion over the MTEF.
Capacity-building grants and other current transfers
Capacity-building grants boost municipalities’ building management, planning, technical, budgeting and financial management skills. The expanded public works programme integrated grant for municipalities promotes increased labour intensity in municipalities and the water services operating subsidy grant supports particular national water schemes that are being transferred to municipalities.
Table W1.31 Capacity building and other current transfers to local government, 2009/10 – 2015/16
| | | | | | | | | | | | | | | | | | | | | | | | | | | | |
R million | | 2009/10 | | | 2010/11 | | | 2011/12 | | | 2012/13
Revised
estimate | | | 2013/14 | | | 2014/15 | | | 2015/16 | |
Direct transfers | | | 2 194 | | | | 1 951 | | | | 1 862 | | | | 2 586 | | | | 3 364 | | | | 3 351 | | | | 3 632 | |
Municipal systems improvement grant | | | 200 | | | | 212 | | | | 220 | | | | 230 | | | | 240 | | | | 252 | | | | 261 | |
Local government financial management grant | | | 300 | | | | 365 | | | | 385 | | | | 403 | | | | 425 | | | | 449 | | | | 470 | |
Public transport network operations grant | | | — | | | | — | | | | — | | | | — | | | | 881 | | | | 745 | | | | 862 | |
Integrated city development grant | | | — | | | | — | | | | — | | | | — | | | | 40 | | | | 150 | | | | 150 | |
2010 FIFA World Cup host city operating grant | | | 508 | | | | 210 | | | | — | | | | — | | | | — | | | | — | | | | — | |
2013 African Cup of Nations host city operating grant | | | — | | | | — | | | | — | | | | 123 | | | | — | | | | — | | | | — | |
2014 African Nations Championship host city operating grant | | | — | | | | — | | | | — | | | | — | | | | 120 | | | | — | | | | — | |
Water services operating subsidy grant | | | 849 | | | | 664 | | | | 542 | | | | 562 | | | | 421 | | | | 450 | | | | 470 | |
Expanded public works programme integrated grant for municipalities | | | 101 | | | | 280 | | | | 364 | | | | 662 | | | | 611 | | | | 632 | | | | 661 | |
Infrastructure skills development grant | | | — | | | | — | | | | 39 | | | | 75 | | | | 99 | | | | 154 | | | | 179 | |
Energy efficiency and demand-side | | | 175 | | | | 220 | | | | 280 | | | | 200 | | | | 181 | | | | 155 | | | | 202 | |
Municipal disaster grant | | | 61 | | | | — | | | | 32 | | | | 330 | | | | 347 | | | | 364 | | | | 376 | |
Indirect transfers | | | 318 | | | | 257 | | | | 217 | | | | 133 | | | | 139 | | | | 142 | | | | 151 | |
Energy efficiency and demand-side | | | 75 | | | | 109 | | | | 119 | | | | — | | | | — | | | | — | | | | — | |
Water services operating subsidy | | | 243 | | | | 148 | | | | 98 | | | | 133 | | | | 139 | | | | 142 | | | | 151 | |
| | | | | | | | | | | | | | | | | | | | | | | | | | | | |
Total | | | 2 512 | | | | 2 208 | | | | 2 079 | | | | 2 719 | | | | 3 503 | | | | 3 493 | | | | 3 783 | |
| | | | | | | | | | | | | | | | | | | | | | | | | | | | |
Local government financial management grant
The local government financial management grant, under the National Treasury vote, funds the modernisation of financial management, including building in-house municipal capacity to implement multi-year budgeting, linking integrated development plans to budgets, producing quality and timely in-year and annual reports, and generally supporting municipalities in the implementation of the Municipal Finance Management Act. Total allocations for the local government financial management grant amount to R1.3 billion over the 2013 MTEF.
47
2013 BUDGET REVIEW
The public transport network operations grant
The public transport network operations grant subsidises the operational costs of public transport systems built through the public transport infrastructure grant. Previously, both grants formed part of the public transport infrastructure and systems grant. This grant has been split into separate infrastructure and operational grants to provide more transparency on what is being funded and to provide cites with greater certainty about the levels of operational funding they can expect to receive to support the new public transport networks they are running. The public transport network operations grant is allocated R2.5 billion over the 2013 MTEF.
Integrated city development grant
This is a new grant that provides a financial incentive for metropolitan municipalities to integrate and focus their use of all available infrastructure investment and regulatory instruments to achieve a more compact urban spatial form. The grant has an allocation of R340 million over the MTEF.
Infrastructure skills development grant
This grant, introduced in 2012, places interns with technical skills in municipalities. These interns spend two years in a well-capacitated municipality or entity gaining skills and experience, and are then transferred to a rural municipality with poor capacity to complete their internship. This programme will increase the pool of qualified engineers and scientists working in municipalities and will give rural municipalities the opportunity to hire these skilled personnel when they have completed their internships. The first cohort of interns in this programme began working in 2012. The grant has an allocation of R432.2 million over the MTEF.
Municipal systems improvement grant
The municipal systems improvement grant provides funding to non-metropolitan municipalities to help them implement their local government turnaround strategies. The grant is administered by the Department of Cooperative Governance and is allocated R753.5 million over the MTEF.
Expanded public works programme integrated grant for municipalities
This grant promotes the use of labour-intensive methods in delivering municipal infrastructure and services. The grant is allocated through a formula based on past performance – creating an incentive effect – with a bonus to give bigger allocations to poor, rural municipalities. The grant has an allocation of R1.9 billion over the MTEF.
The energy efficiency and demand-side management grant
The energy efficiency and demand-side management grant was introduced following load shedding in 2008. It funds selected municipalities to implement demand-side management projects, with a focus on public lighting and energy-efficient municipal infrastructure. The grant has an allocation of R538.1 million over the MTEF.
The water services operating subsidy
The water services operating subsidy is a grant with schedule 5B (direct) and schedule 6B (in-kind) components to fund water schemes. The grant covers staff-related costs, direct operating and maintenance costs, and infrastructure refurbishment. Allocations per municipality are based on the operational budget for each scheme and the funding requirements identified in the transfer agreement. Before 1994, the Department of Water Affairs administered these schemes, which are now being transferred to
48
ANNEXURE W1: EXPLANATORY MEMORANDUM TO THE DIVISION OF REVENUE
municipalities. At the end of 2011/12, 59 agreements had been signed, 5 524 staff transferred and 1 655 schemes (including rudimentary schemes) with a total asset value of about R6.6 billion transferred to municipalities. In the 2013 MTEF, R1.8 billion is allocated for the water services operating subsidy (direct and indirect transfers). This grant enables the transfer of staff operating water schemes from national government to municipalities. It is a transitional grant that is expected to be phased out over time.
2014 African Nations Championship host city operating grant
Following the successful hosting of the African Cup of Nations in January/February 2013, South Africa will host the African Nations Championship tournament in January 2014. An allocation of R120 million in 2013/14 is provided to support the cities hosting the tournament.
Municipal disaster grant
The municipal disaster grant was introduced in the 2011 MTEF. This grant is administered by the National Disaster Management Centre in the Department of Cooperative Governance as an unallocated grant to local government. The centre is able to disburse disaster-response funds immediately – without the need for the transfers to be gazetted first. Over the 2013 MTEF, R1.1 billion is available through this grant.
¢ Part 6: Future work on provincial and municipal fiscal frameworks
Provincial infrastructure transfers
Infrastructure conditional grants to provinces will be reformed during the 2013 MTEF to introduce incentives in existing grant structures, which will promote good infrastructure delivery management system practices and complement existing capacity support programmes. These incentives will aim to address infrastructure planning and procurement failures in infrastructure delivery.
From 2015/16, provinces will only be eligible to receive allocations for the health facility revitalisation grant and the education infrastructure grant if they meet certain planning criteria. Provinces will be required to bid for their infrastructure grant allocations two years in advance (during 2013/14, provinces will bid for their 2015/16 allocations). A set of bidding prerequisites and criteria will be used to evaluate bids. Unsuccessful bids will not be funded and those allocations will be pooled in an unallocated fund, which provinces with successful bids can apply for. The 2013 Division of Revenue Bill requires provinces to complete and submit plans and bids for these grants during 2013/14.
Prerequisites
Provinces will only be entitled to bid for funds if they have the following in place:
| • | | An agreed framework outlining the roles and responsibilities within a provincial infrastructure delivery management system, which has been adopted and signed off by the Provincial Cabinet. This framework must also be supported by the appropriate capacity. |
| • | | Long-term infrastructure plans (a user asset management plan) for each sector, aligning a department’s strategic objectives and infrastructure needs. |
| • | | Appropriate monitoring systems and contract management systems that enable filing, record-keeping and tracking project expenditure. |
Approval processes
After the prerequisites have been met, there will be two approval processes. First, provinces will be required to bid for their allocations using a signed-off infrastructure programme management plan and supporting construction procurement strategy. In the second process, successful departments will have to prepare and define the project/programme packages that are to be implemented. These will be assessed to confirm each province’s allocation (confirmed by an allocation letter from the National Treasury). The province will be instructed to proceed with tender procedures. These two approval processes will be finalised during the two years before projects/packages are implemented.
49
2013 BUDGET REVIEW
After the second approval, the process is closed and the application process for the year is complete. But there will still be a possibility that allocations will be withdrawn if there is non-compliance, irregularities or material deviation from original submissions. Funds that remain unallocated at the end of this approval process can be allocated to provinces that are ready to implement additional projects. These projects, which would already be in the approval process but proposed for subsequent years, will be brought forward.
During the year in which funds are spent, measures will be put in place to ensure that if a province is not spending at the planned rate, they do not receive further transfers until they have spent the funds already transferred. Options will also be explored to shift unspent funds to projects where they can be spent during the year.
Local government infrastructure transfers
In the 14 years since the first Division of Revenue Act was first introduced in 1998, more than R165 billion in infrastructure grants have been made available to municipalities or to national departments to spend on their behalf. Of this amount, just over R134 billion was allocated in the last six years (2007/08 to 2012/13). The impact of this massive amount of funding on levels of access to service is revealed in the results of the 2011 Census. A preliminary analysis of these results reveals a mixed picture in which some municipalities have managed to make impressive inroads in providing access to basic services while in other areas progress has been very limited.
The 2011 Census results reveal where infrastructure spending has achieved results, and where it has been less effective. This will allow government to draw lessons from these successes and failures and examine how the grant system can be most effective in delivering infrastructure. The Budget Forum has recommended that the 2011 Census data should form the basis of a thorough review of the local government conditional grant system in the period leading up to the 2014 Budget. This review will be coordinated by the National Treasury, using a collaborative process that will include national departments, SALGA and the FFC, and extensive consultation with municipalities. Obtaining input from as many stakeholders as possible will enhance the analysis in the review and help to build consensus about the system’s challenges and potential solutions.
Municipal taxation
The national framework for municipal taxation powers is determined by section 229 of the Constitution, which empowers municipalities to impose a property tax and surcharges on fees for municipal services, subject to national regulation. However, in exercising their revenue-raising powers, it is important that municipalities do not materially or unreasonably prejudice national economic policies and economic activities across municipal boundaries.
The Municipal Property Rates Act (2004) and the Municipal Fiscal Powers and Functions Act (2007) regulate municipal fiscal powers and functions as provided for in section 229 of the Constitution.
Municipal Property Rates Act
The Municipal Property Rates Act regulates the power of municipalities to impose rates on properties. The act is administered by the Department of Cooperative Governance. The department proposed amendments to the act in 2011/12 to improve its implementation and minimise legal ambiguities. The Municipal Property Rates Amendment Bill was published on 9 June 2011 for public comment. The department has considered all inputs from the public and intends to resubmit the bill to Cabinet during 2013, following which the bill will be introduced to Parliament.
50
ANNEXURE W1: EXPLANATORY MEMORANDUM TO THE DIVISION OF REVENUE
Municipal Fiscal Powers and Functions Act
The Municipal Fiscal Powers and Functions Act, which came into effect on 7 September 2007, deals with the regulation of all municipal taxes other than property rates. The act aims to promote predictability, certainty and transparency of municipal fiscal powers and functions, and to ensure that these powers and functions are exercised in line with the provisions of section 229 of the Constitution. The National Treasury intends to amend the act to improve its implementation.
Application for a new municipal tax
Section 5 of the Municipal Fiscal Powers and Functions Act provides for a municipality, a group of municipalities or organised local government to apply to the Minister of Finance for the authorisation of a new municipal tax. A new municipal tax may not be imposed without prior approval by the minister. Any application for a new tax must set out the reasons for the proposed tax and the manner in which the revenue from the tax will be used.
To date, two applications that comply with the requirements of section 5 of the Municipal Fiscal Powers and Functions Act have been received by the National Treasury: (a) an application for the introduction of a rural-based development levy in areas where municipalities struggle to implement valuation rolls for the purposes of imposing property rates; and (b) an application for the introduction of a local business tax for businesses operating within the jurisdiction of metropolitan municipalities. The Minister of Finance did not approve the proposal for a local business tax. His ruling was informed by the following:
| • | | New taxes or increases in existing taxes during periods of slow growth would be unwise, as it could bankrupt businesses that are already struggling. |
| • | | Although metropolitan municipalities are relatively well equipped to exploit their existing own-revenue base, such as property rates, service charges and other own-revenue sources, there is still room to further improve own-revenue collections. |
Municipalities are encouraged to further improve their debt management and eliminate non-priority expenditure. This could raise significant additional funds for municipal priorities.
Sharing of the general fuel levy
The sharing of the general fuel levy was introduced in 2009/10 as a permanent replacement to the former RSC and JSB levies for metropolitan municipalities. This was done in addition to the VAT reforms introduced in 2006. District municipalities still receive the RSC/JSB levies replacement grant.
The transition from the RSC/JSB levies replacement grant system to the sharing of the general fuel levy has been phased in over three years to ensure a smooth transition. The final year of this phase-in process was 2011/12. From 2012/13, the sharing of the general fuel levy is based on fuel sales.
To determine the actual fuel sales in a metropolitan municipality, the fuel sales figures from the Department of Energy have been adjusted using population statistics to account for overlapping magisterial district boundaries, based on the 2011 Census.
The sharing of the general fuel levy is a direct charge and is formalised annually through the Government Gazette under schedule 1 of the Taxation Laws Amendment Act (2009).
51
W2
76Website annexure to the 2013 Budget Review
Structure of the government accounts
¢ Introduction
South Africa’s national government accounts are presented in Annexure B of the 2013 Budget Review. The structure of the reporting tables is based on recommendations in the most recent version of Government Finance Statistics1 (GFS), published in 2001, and the System of National Accounts2 (SNA), published in 1993. Certain modifications to the structure of the accounts and the labelling of the receipt and payment items have been made to take into account specific features of the South African environment.
The GFS presentation also differs in some respects from the presentation in Chapter 2 of the Budget Review, which is based on the SNA. This annexure describes the presentation format and structure of the government accounts, and explains deviations between GFS recommendations and the way government statistics in the national accounts are compiled and presented. It also describes the salient characteristics of the SNA’s section on government statistics.
¢ Recording basis
Both the SNA and the GFS recommend that items should be recorded on an accrual basis, which means that all government transactions should be included in the government accounts. This includes transactions that do not give rise to cash flows, such as changes in inventories, depreciation and accrued interest. In accrual accounting, the time of recording should coincide with the underlying economic event. The entry does not necessarily coincide with the timing of the resultant cash flow, but rather with the change of ownership or when economic value is created, transformed or extinguished. For example, debt repayment should be recorded when the debt expires, whether or not this coincides with an actual repayment that gives rise to a cash flow.
| 1 | International Monetary Fund, 2001, Government Finance Statistics. Washington, D.C. IMF. |
| 2 | United Nations, 1993, System of National Accounts. Brussels, Luxembourg, New York, Paris, Washington, D.C. Inter-Secretariat Working Group on National Accounts. |
1
2013 BUDGET REVIEW
The recommendation to use accrual accounting for government financial statements was first made in the 2001 GFS. Government intends to adopt this recommendation over time, but in the present, budget data continues to be presented on a cash basis. This means that the transaction is recorded when the cash flow occurs and therefore does not match the timing of the underlying economic event. In some cases, modified cash principles are applied. This includes recording expenditure at the time of recording the transaction in the cash book (when the transaction is processed in the financial system and the payment is issued) and accruing interest on some types of government debt (zero-coupon bonds).
In strict cash accounting, the time of recording should coincide with the actual cash flow. In South Africa, entries for the national budget data are made during the time period in which transactions are captured by financial systems. After the financial year-end, books remain open so that all year-end procedures can be finalised, such as reconciling actual bank account balances with revenue and expenditure reported, and correcting item classification. The year-end procedures do not influence revenue and expenditure levels, and consist primarily of:
| • | | Late requests for funds by government departments to settle obligations relating to the specific financial year. |
| • | | Surrenders of unspent funds by government departments (funds requested but not used). |
| • | | Corrections to revenue, expenditure or financing transactions that were, for example, erroneously classified. |
| • | | Adjustments to expenditure data, for auditing and parliamentary purposes, to show only authorised expenditure for the particular financial year (excluding all unauthorised spending). |
¢ Economic reporting format
The economic reporting format (ERF) was introduced in the 2004 Budget. The ERF is based on the GFS, as adapted for South Africa’s reporting requirements. The budget format is supported by a standard chart of accounts (SCOA), which is fully aligned with the ERF and provides for posting-level details of the budget within the financial systems.
In the ERF and the chart, each descriptive label reflects the actual content of the item. Opaque labels such as “other” or “miscellaneous” are avoided to improve transparency. This practice ensures that classifications are consistent across all national and provincial departments, improving the quality of information provided to legislatures, assisting in the policy-making process and enhancing accountability.
The evolution of accounting and reporting requirements, as well as the pending introduction of an integrated financial management system (IFMS), led to a review of the SCOA in 2008. These changes have improved government’s ability to report on infrastructure spending, provided for better control over departmental programme budgets, enabled the identification of more appropriate spending items in the chart, enhanced asset management through better recording of asset transactions, and enabled government to monitor regional spending.
To protect the integrity of the chart, the National Treasury helped departments meet the format requirements by developing a detailed training programme, and establishing a classification committee and call centre to support practitioners. Support initiatives aim to improve consistency in the application of the new classification rules and to recommend appropriate amendments to the SCOA and the financial system. The committee issues circulars that provide feedback to practitioners on changes made to the chart of accounts, ensuring a consistent approach to classification.
2
ANNEXURE W2: STRUCTURE OF THE GOVERNMENT ACCOUNTS
¢ Structure of accounts
The reporting format organises all government transactions into three broad categories: receipts, payments and financing. The budget balance (deficit or surplus) is calculated as receipts less payments, which is equal to total financing, but with the opposite sign.
Receipts
Government receipts are divided into taxes, sales, transfers, fines, penalties and forfeits, interest, dividends and rent on land, as well as transactions in financial assets and liabilities. Taxes are classified according to the type of activity on which they are levied, including income, profits, consumption of domestic goods and services, and international trade. Sales are disaggregated into sales of capital assets and other sales. Transfers are unrequited receipts – the party making the transfer does not receive anything of similar value directly in return. These are classified according to unit, for example, other government units, private enterprises and public corporations, households and so on. Fines, penalties and forfeits consist of all compulsory receipts imposed by a court or quasi-judicial body. Interest, dividends and rent on land includes all receipts associated with ownership of financial assets and land.
Transactions in financial assets and liabilities covers three financial transactions. The first two transactions are the repayments of loans and advances previously extended to employees and public corporations for policy purposes, and the reduction of equity investments made by government in public corporations. These transactions are recorded as receipts because they are fundamentally different from other financial transactions, which are market oriented and appear as financing items. The third transaction is associated with stale cheques from previous accounting periods. The temporary increase in receipts before a new cheque is issued is recorded as a receipt, because the financial system does not allow for a payment for the current accounting period to be reduced due to the cancellation of a payment from a previous period. Remaining financial transactions, for example, borrowing and repayment of loans in the capital markets, are included under the financing category.
Payments
Payments are divided into four broad categories: current payments, transfers and subsidies, payments for capital assets and payments for financial assets.
Current payments
Current payments provides for funds directly spent by a department. Detail is provided on:
| • | | Compensation of employees: This category includes all current personnel-related payments – all payments to government employees, both salaries and wages and social contributions. Social contributions are service benefits paid by government for its employees, such as pension or medical scheme contributions. This category excludes capitalised compensation. |
| • | | Goods and services: All government payments in exchange for goods and services, but excluding capital assets and goods used by government for construction of and improvements to capital assets. Generally, this item is the second-largest spending item for departments. The details of purchases of each department are provided, giving an indication of the largest spending items by department. For example, in an education department school books could be listed, while in a health department medicines might appear. This level of detail facilitates oversight and policy analysis. |
| • | | Interest and rent on land: This item is defined as payment for the use of borrowed money (interest on loans and bonds) and land (rent). It is distinguished from the repayment of borrowed money, which is classified under financing. |
Transfers and subsidies
The second part of the payments table provides for funds that are transferred to other institutions, businesses and individuals, which do not constitute final expenditure by the department. This item includes all unrequited, non-repayable payments by government – payments for which no goods or services are received in return.
3
2013 BUDGET REVIEW
The category transfers and subsidies is subdivided into the various targeted recipients or beneficiaries receiving funding from government, such as other levels of general government, households, non-profit institutions and public corporations. This allows for the separation of all transfers from payments controlled directly by departments.
Transfers and subsidies includes current and capital transfers. In the past, capital payments included capital transfers. This led to ambiguity, because these numbers could overstate government’s actual contribution to capital formation. By including capital transfers with other transfers, a clearer picture of government spending on capital emerges.
Payments for capital assets
Capital payments are identified as a separate item. This captures government’s contribution to capital formation and spending on new infrastructure, as well as upgrades, additions, rehabilitation and refurbishment of existing infrastructure. Capital assets are divided into seven categories:
| • | | Buildings and other fixed structures |
| • | | Machinery and equipment |
| • | | Specialised military assets |
| • | | Software and other intangible assets |
| • | | Land and sub-soil assets. |
Payments for capital assets covers purchases of new assets, as well as upgrades, additions, rehabilitation and refurbishment of existing assets. This also includes own-account construction – when government units engage in capital projects on their own account, such as provincial works and roads departments engaged in the construction of buildings and roads. In this case, certain payment categories are capitalised (compensation of employees and goods and services).
These two payment categories are not capitalised unless payments are directly associated with a capital project. A capital project is executed by the government unit to construct a new asset or upgrade/add to/rehabilitate/refurbish an existing capital asset. However, payments on current projects, namely maintenance and repair of existing capital assets, are not capitalised.
Payments for financial assets
This item consists mainly of lending to public corporations or making equity investments in them for policy purposes. The reason for expensing this payment rather than treating it as financing is that, unlike other financial transactions, the purpose of the transaction is not market oriented.
Financing
The broad classification category, financing, encompasses all financial transactions other than transactions in financial assets and liabilities and payments for financial assets, which are included as part of receipts and payments. Items recorded under financing reflect funding to cover a government deficit or the use of funds available from a government surplus. Government’s gross borrowing requirement, which represents the shortfall between revenue and expenditure plus the repayment of maturing loans, is included in the financing category. The gross borrowing requirement is financed in the domestic and international market through Treasury bills, fixed-income, inflation-linked and retail bonds, foreign loans and the use of government’s cash deposits.
4
ANNEXURE W2: STRUCTURE OF THE GOVERNMENT ACCOUNTS
¢ Functional classification
The GFS recommends that each government payment should be classified according to its functional and economic characteristics. The budget reporting format complies with this recommendation. The items in the economic classification have been described above, under payments. The main function of the economic classification is to categorise transactions according to type of object or input, such as compensation of employees or interest payments. Data must be classified this way for calculation of the surplus or deficit, as well as government’s contribution to the economy in the form of output, value added and final consumption.
The functional classification complements the economic classification. It serves to distinguish transactions by policy purpose or type of outlay. This is also referred to as expense by output. Its main purpose is to facilitate understanding of how funds available to government have been spent in health, education, general public services, public order and safety, and so on.
The broad categories in the functional classification are listed below:
| • | | General public services refers to the administration, operation or support of executive and legislative organs, financial and fiscal affairs, and external affairs. It includes foreign economic aid to developing countries and economic aid through international organisations. The category also covers general services, such as personnel services, overall planning and statistical services, and basic research in the general public service. State debt cost is included in this category. |
| • | | Defence includes administration, operation and support of military and civil defence, and the operation of military aid missions accredited to foreign governments or attached to international military organisations. Applied research and development (R&D) related to defence is also included. |
| • | | Public order and safety covers police services, fire protection services, justice and law courts, prisons and related R&D. |
| • | | Economic affairs covers government spending associated with the regulation and more efficient operation of the business sector. This category incorporates general economic affairs, commercial and labour affairs, agriculture, forestry, fishing and hunting, fuel and energy, mining, manufacturing and construction, transport, communication and related R&D. |
| • | | Environmental protection relates to the conservation of biodiversity and landscape – the protection of habitats, including the management of natural parks and reserves, waste management, wastewater management, pollution abatement and related R&D. |
| • | | Housing and community amenities includes the administration of housing and community development affairs and services, water supply, street lighting and related R&D. |
| • | | Health includes spending on services provided to individuals and on a collective basis, including medical products, appliances and equipment, outpatient services, hospital services, public health services and related R&D. |
| • | | Recreation and culture includes recreational and sporting services, cultural services, broadcasting and publishing services, and other community services. The function also covers related R&D. |
| • | | Education includes spending on services provided to individual pupils and students, as well as those provided on a collective basis. It includes pre-primary, primary, secondary and tertiary education, as well as subsidiary education services and related R&D. |
| • | | Social protection covers services supplied directly to communities, households or individuals, and includes transfers for sickness and disability, old age, survivors, family and children, unemployment, support to households to meet the cost of housing and related R&D. |
Expenditure in a particular budget vote may cover more than one function. For example, health expenditure may include spending on education for medical training.
5
2013 BUDGET REVIEW
¢ The consolidated government account
The presentation format of the consolidated government account includes the accounts of national and provincial government, and the social security funds. In the 2013 Budget Review, the coverage of the government accounts is extended to include a total of 163 national and provincial departments and 187 entities of central government, currently classified as extra-budgetary agencies. Some government business enterprises are also included in this number. Such enterprises either sell most of their goods and services to government institutions or departments at regulated prices, and are therefore not businesses in the true sense of the word, or they are directly involved in infrastructure financing and development. State-owned entities that provide goods at market prices, such as Transnet or Eskom, form part of the public-sector accounts and are excluded from the consolidation.
This presentation is broadly in line with the GFS requirement that the accounts of general government be presented on a consolidated basis. In the consolidation process, all relevant spheres of government are included and all intergovernmental transactions are eliminated. This ensures that only the interaction of the general government units with non-governmental units is recorded. As a result, the accounts reflect more accurately government’s financial position and the impact of its activity on the economy.
To present a true set of consolidated general government accounts, the accounts of both national and provincial departments must be consolidated with their associated public entities. The accounts of the social security funds and local authorities are then added to give the consolidated general government accounts.
As a final step, all government business enterprises should be included and consolidated with the general government units to create the consolidated public-sector account.
The following dimensions are considered during the consolidation process:
| • | | Coverage: This refers to the choice of entities to be included in the consolidation. Entities belonging to the general government sector should be consolidated. All business enterprises should then be added to this consolidation. The consolidation of the general government sector includes all entities that are mainly controlled and financed by government, and which provide goods and services at non-market prices. State-owned entities and local authority trading entities providing goods and services at market-related prices, which form part of the broader public sector, are excluded, as are privately owned entities. |
| • | | Elimination of inter-entity transactions: All inter-entity transactions are eliminated in the consolidation process. For this to be accurate, these transactions must be easily identifiable. However, in the accounting systems of government and many of its agencies, not all inter-entity transactions are identified. Elimination is impossible in many cases where goods and services are procured from other government units, because such transactions cannot be separated from other transactions in this category. However, all transactions involving transfers from one government unit to another can be identified and have been eliminated from the consolidation. |
| • | | Basis of accounting: Entity accounts can only be consolidated if they are compiled using the same basis of accounting. National and provincial governments are on a modified cash basis of accounting, while local authorities and public entities use accrual accounting. To provide data for consolidation, the accounts of the public entities have been adjusted to cash accounts. |
During consolidation, transfers and other identifiable goods and services were netted out, with the rest of the transactions being aggregated. In future budgets, the National Treasury will endeavour to include more entities to provide the full picture of public-sector spending. The consolidation in this budget includes all the entities listed in Table W2.1.
6
ANNEXURE W2: STRUCTURE OF THE GOVERNMENT ACCOUNTS
Table W2.1 List of public entities included in consolidation
| | | | |
Vote | | Department | | Public entity |
1 | | The Presidency | | National Youth Development Agency |
| | | | Brand South Africa |
| | |
3 | | Cooperative Governance and Traditional Affairs | | South African Local Government Association |
| | | | The Commission for the Promotion and Protection of |
| | | | the Rights of Cultural, Religious and Linguistic |
| | | | Communities |
| | |
| | | | The Municipal Demarcation Board |
| | |
4 | | Home Affairs | | Film and Publication Board |
| | | | Government Printing Works |
| | | | The Independent Electoral Commission |
| | |
5 | | International Relations and Cooperation | | African Renaissance and International Cooperation |
| | | | Fund |
| | |
7 | | Public Works | | Construction Industry Development Board |
| | | | Council for the Built Environment |
| | | | Independent Development Trust |
| | | | Property Management Trading Entity |
| | |
8 | | Women, Children and People with Disabilities | | The Commission on Gender Equality |
| | |
9 | | Government Communication and Information | | Media Development Diversity Agency |
| | System | | |
| | |
10 | | National Treasury | | Accounting Standards Board |
| | | | Independent Regulatory Board for Auditors |
| | | | Government Pension Administration Agency |
| | | | Financial Intelligence Centre |
| | | | Financial Services Board |
| | | | Public Investment Corporation Limited |
| | | | South African Revenue Service |
| | | | The Co-operatives Banks Development Agency |
| | | | The Financial and Fiscal Commission |
| | | | Office of the Ombud for Financial Service |
| | | | Providers |
| | | | Office of the Pension Funds Adjudicator |
| | |
12 | | Public Service and Administration | | State Information Technology Agency |
| | | | PALAMA Training Trading Account |
| | |
14 | | Arts and Culture | | Robben Island Museum – Cape Town |
| | | | National Arts Council of South Africa |
| | | | National Film and Video Foundation of South Africa |
| | | | National Heritage Council of South Africa |
| | | | The Pan South African Language Board |
| | | | South African Heritage Resources Agency |
| | | | Arts institutions consolidation (6 entities) |
| | | | Heritage institutions consolidation (12 entities) |
| | | | Libraries consolidation (2 entities) |
7
2013 BUDGET REVIEW
Table W2.1 List of public entities included in consolidation (continued)
| | | | |
Vote | | Department | | Public entity |
15 | | Basic Education | | Education Labour Relations Council |
| | | | South African Council for Educators |
| | | | uMalusi Council for Quality Assurance in General |
| | | | and Further Education and Training |
| | |
16 | | Health | | Council for Medical Schemes |
| | | | Medical Research Council of South Africa |
| | | | National Health Laboratory Service |
| | |
17 | | Higher Education and Training | | Council on Higher Education |
| | | | National Skills Fund |
| | | | National Student Financial Aid Scheme |
| | | | South African Qualifications Authority |
| | | | Quality Council for Trades and Occupations |
| | | | SETAs consolidation (21 entities) |
| | |
18 | | Labour | | Commission for Conciliation Mediation and |
| | | | Arbitration |
| | | | National Economic Development and Labour Council |
| | | | Productivity SA |
| | |
19 | | Social Development | | National Development Agency |
| | | | South African Social Security Agency |
| | |
20 | | Sport and Recreation South Africa | | Boxing South Africa |
| | | | The South African Institute for Drug-free Sport |
| | |
22 | | Defence and Military Veterans | | Armaments Corporation of South Africa Limited |
| | | | Castle Control Board |
| | |
24 | | Justice and Constitutional Development | | Legal Aid South Africa |
| | | | Special Investigating Unit |
| | | | The Public Protector of South Africa |
| | | | The South African Human Rights Commission |
| | |
25 | | Police | | Private Security Industry Regulatory Authority |
| | |
26 | | Agriculture, Forestry and Fisheries | | Agricultural Research Council |
| | | | Marine Living Resources Fund |
| | | | National Agricultural Marketing Council |
| | | | Ncera Farms (Pty) Ltd |
| | | | Onderstepoort Biological Products Limited |
| | | | Perishable Products Export Control Board |
| | |
27 | | Communications | | National Electronic Media Institute of South Africa |
| | | | Sentech Limited |
| | | | The Independent Communications Authority of |
| | | | South Africa |
| | | | Universal Service and Access Agency of |
| | | | South Africa |
| | | | Universal Service and Access Fund |
8
ANNEXURE W2: STRUCTURE OF THE GOVERNMENT ACCOUNTS
Table W2.1 List of public entities included in consolidation (continued)
| | | | |
Vote | | Department | | Public entity |
28 | | Economic Development | | Competition Commission |
| | | | Competition Tribunal |
| | | | International Trade Administration Commission |
| | |
29 | | Energy | | National Energy Regulator of South Africa |
| | | | National Nuclear Regulator |
| | | | South African National Energy Development Institute |
| | | | South African Nuclear Energy Corporation Limited |
| | | | The National Radioactive Waste Disposal Institute |
| | |
30 | | Environmental Affairs | | iSimangaliso Wetland Park |
| | | | South African National Biodiversity Institute |
| | | | South African Weather Service |
| | | | South African National Parks |
| | |
31 | | Human Settlements | | Housing Development Agency |
| | | | National Home Builders Registration Council |
| | | | Estate Agency Affairs Board |
| | | | National Housing Finance Corporation Limited |
| | | | National Urban Reconstruction and Housing Agency |
| | | | Estate Agents Fidelity Fund |
| | | | Rural Housing Loan Fund |
| | | | The Social Housing Regulatory Authority |
| | |
32 | | Mineral Resources | | Council for Geoscience |
| | | | Council for Mineral Technology |
| | | | State Diamond Trader |
| | | | South African Diamond and Precious Metals |
| | | | Mine Health and Safety Council |
| | |
33 | | Rural Development and Land Reform | | Agricultural Land Holding Account |
| | | | Ingonyama Trust Board |
| | | | Registration of Deeds Trading Entity |
| | |
34 | | Science and Technology | | Academy of Science of South Africa |
| | | | Africa Institute of South Africa |
| | | | Council for Scientific and Industrial Research |
| | | | Human Sciences Research Council |
| | | | National Research Foundation |
| | | | South African National Space Agency |
| | | | Technology Innovation Agency |
| | |
35 | | Tourism | | South African Tourism |
9
2013 BUDGET REVIEW
Table W2.1 List of public entities included in consolidation (continued)
| | | | |
Vote | | Department | | Public entity |
36 | | Trade and Industry | | Companies and Intellectual Property Commission |
| | | | Companies Tribunal |
| | | | National Consumer Tribunal |
| | | | National Credit Regulator |
| | | | National Empowerment Fund |
| | | | National Gambling Board of South Africa |
| | | | National Lotteries Board |
| | | | National Lotteries Board Distribution Trust Fund |
| | | | National Metrology Institute of South Africa |
| | | | National Regulator for Compulsory Specifications |
| | | | SA Bureau of Standards |
| | | | Small Enterprise Development Agency |
| | | | South African National Accreditation System |
| | | | National Consumer Commission |
| | |
37 | | Transport | | Credit Card Driving Licences |
| | | | Cross-Border Road Transport Agency |
| | | | Passenger Rail Agency of South Africa |
| | | | Ports Regulator of South Africa |
| | | | Railway Safety Regulator |
| | | | Road Traffic Infringement Agency |
| | | | Road Traffic Management Corporation |
| | | | South African Civil Aviation Authority |
| | | | South African Maritime Safety Authority |
| | | | The South African National Roads Agency Limited |
| | |
38 | | Water Affairs | | Breede River Catchment Management Agency |
| | | | Inkomati Catchment Management Agency |
| | | | The Water Services Trading Entity |
| | | | Trans-Caledon Tunnel Authority |
| | | | Water Research Commission |
| | | | Water Boards consolidation (12 entities) |
| ¢ | | Main adjustments to the consolidated government account |
The National Treasury regularly reviews the data presented in the consolidated government account to improve the scope and classification of data. To this end, a more detailed database of departmental financial information has been compiled for the 2013 Budget. This is part of a broader, long-term initiative to improve the quality of the financial and budget data.
Classification is now done at a more detailed level within the accounts of national and provincial departments and public entities. In reclassifying the data, activity-level information was collected and used to inform the functional classification. As a result, some functional breakdowns have been disaggregated into more detail, with some of this detail reclassified into other functions. In addition, detailed analyses of provincial spending and public-entity revenue revealed further inter-entity transactions that can now be eliminated in the consolidation process. This is a result of the improvement in information collected and clarity on the flow of transactions between the different spheres of government.
The historical data presented in the statistical tables in Annexure B has been updated with these classification adjustments, but care should be taken when comparing these numbers with previous budget publications as the data is not strictly comparable.
10
ANNEXURE W2: STRUCTURE OF THE GOVERNMENT ACCOUNTS
The functional classification published in Annexure B is now more closely aligned to the classification prescribed in the GFS. However, the stricter application of this classification requires a level of disaggregation of the departmental spending data, which complicates the use of the GFS functional data for budget preparation. As a result, the Budget Review spending data is presented by key spending categories, which group departments and programmes engaged in similar activities. This provides a classification that is similar to the functional classification presented in Annexure B.
| ¢ | | A new format for the consolidated government account |
This year the consolidated government account is presented in the new format shown in Table W2.2. This more transparent and user-friendly presentation clearly distinguishes between government’s operating activities and its plans to invest in capital infrastructure.
The balance on the operating account shows the outcome of the government’s operating activities, which is a measure of the cost of continuing operations. It is calculated as the difference between current revenue and current expenditure, and the resulting balance shows how much government needs to borrow to run its operations. The current balance demonstrates the sustainability of government operations – a long-term operating deficit is unsustainable, while a positive operating balance allows for investment in future productive capacity.
Capital investment activities are presented in the capital account. Government’s capital financing requirement is the outcome of this account, which is calculated as the difference between capital revenue and capital expenditure. This account will mainly be in deficit, owing to continuous investment in infrastructure and substantial capital outlays.
The new format separates out all transactions in financial assets and liabilities – mainly including loans extended to public corporations.
If cash generated from operations is insufficient to finance investment requirements, government has to borrow. The borrowing requirement is calculated by adding the operating balance, capital financing requirement, financial transactions and any unallocated expenditure, such as the contingency reserve. This results in the budget balance, or net financing requirement, which is the main outcome of the budget.
The main difference between the new balance and the previous version is the inclusion of extraordinary receipts and payments in the main budget presentation. The introduction of the operating account and capital account makes extraordinary items obsolete; these are now included in the main transaction categories. The classification principles and categories used in this new format will be the same as those used for classifying government transactions.
11
2013 BUDGET REVIEW
Table W2.2 Consolidated revenue, expenditure and financing
| | | | | | | | | | | | |
| | | 2013/14 | | | 2014/15 | | | 2015/16 | |
R billion | | Medium-term estimates | |
Operating account | | | | | | | | | | | | |
Current receipts | | | 989.5 | | | | 1 092.8 | | | | 1 201.6 | |
Tax receipts (net of SACU1 transfers) | | | 902.8 | | | | 1 001.0 | | | | 1 106.6 | |
Non-tax receipts (including departmental receipts) | | | 76.3 | | | | 84.2 | | | | 87.6 | |
Transfers received | | | 10.4 | | | | 7.6 | | | | 7.3 | |
Current payments | | | 1 065.4 | | | | 1 146.6 | | | | 1 228.7 | |
Compensation of employees | | | 406.2 | | | | 431.7 | | | | 459.7 | |
Goods and services | | | 176.2 | | | | 191.9 | | | | 204.0 | |
Interest and rent on land | | | 106.5 | | | | 116.9 | | | | 127.4 | |
Transfers and subsidies | | | 376.5 | | | | 406.0 | | | | 437.6 | |
| | | | | | | | | | | | |
Current balance | | | -75.9 | | | | -53.8 | | | | -27.1 | |
Percentage of GDP | | | -2.2 | % | | | -1.4 | % | | | -0.6 | % |
| | | | | | | | | | | | |
Capital account | | | | | | | | | | | | |
Capital receipts | | | 0.1 | | | | 0.1 | | | | 0.1 | |
Transfers and subsidies | | | 31.1 | | | | 33.7 | | | | 37.1 | |
Payments for capital assets | | | 46.9 | | | | 54.3 | | | | 55.3 | |
| | | | | | | | | | | | |
Capital financing requirement | | | -77.9 | | | | -87.9 | | | | -92.3 | |
Percentage of GDP | | | -2.2 | % | | | -2.3 | % | | | -2.2 | % |
| | | | | | | | | | | | |
Transactions in financial assets and liabilities | | | 1.8 | | | | 2.2 | | | | 1.9 | |
| | | | | | | | | | | | |
Contingency reserve | | | 4.0 | | | | 6.5 | | | | 10.0 | |
| | | | | | | | | | | | |
Budget balance | | | -159.6 | | | | -150.3 | | | | -131.3 | |
Percentage of GDP | | | -4.5 | % | | | -3.9 | % | | | -3.1 | % |
| | | | | | | | | | | | |
Primary balance2 | | | -59.9 | | | | -41.6 | | | | -13.1 | |
Percentage of GDP | | | -1.7 | % | | | -1.1 | % | | | -0.3 | % |
| | | | | | | | | | | | |
Financing | | | | | | | | | | | | |
Change in loan liabilities | | | | | | | | | | | | |
Domestic short- and long-term loans (net) | | | 169.8 | | | | 164.5 | | | | 167.4 | |
Foreign loans (net) | | | -3.3 | | | | 3.1 | | | | 8.9 | |
Change in cash and other balances (-increase) | | | -6.9 | | | | -17.3 | | | | -45.0 | |
| | | | | | | | | | | | |
Borrowing requirement (net) | | | 159.6 | | | | 150.3 | | | | 131.3 | |
| | | | | | | | | | | | |
GDP | | | 3 520.3 | | | | 3 880.4 | | | | 4 270.8 | |
| | | | | | | | | | | | |
| 1. | Southern African Customs Union |
| 2. | Includes extra-ordinary receipts and payments. |
| ¢ | | Budget data by key spending categories |
The spending framework outlined in Chapter 8 of the Budget Review is based on the allocation of financial resources of departmental programmes and entities to key spending areas. This improves engagement on budget allocations, as it groups programmes and entities that have a similar purpose together into a single budget decision-making process. To support this approach, data at programme and entity level are aggregated into spending categories, which provides for a higher level of aggregation than in the functional classification.
These spending categories are different from the functional classification published in Annexure B, which is more closely aligned to that prescribed in the GFS. The level of disaggregation of the departmental spending data required by the GFS functional data complicates budget preparation. As a result, the Budget Review spending data is presented by key spending categories that group departments and programmes
12
ANNEXURE W2: STRUCTURE OF THE GOVERNMENT ACCOUNTS
engaged in similar activities. For example, all science and technology activities were grouped together in a separate category, which, in terms of the stricter functional classification presented in Annexure B, is included in various functions. The classification framework for the presentation of fiscal data does not exclusively direct budgeting. Fiscal statistics are an outcome of the allocations process and are used as a guide to categorise expenditure for budgeting purposes. Listed below are a few of the more important differences between the key spending categories presented in Chapter 8 and the more detailed functional classification presented in the statistical tables in Annexure B:
| | • | | Science and technology – This category groups together various science-related activities. For example, the expenditure estimates of the Medical Research Council, included in the health function in Annexure B, are presented as part of this spending category. |
| | • | | Recreation and culture – This category includes the expenditure estimates of the National Lotteries Distribution Trust, because a major portion of its expenditure is allocated to recreational and cultural activities. However, in the statistical tables in Annexure B, a more detailed functional breakdown of the expenditure of the National Lotteries Distribution Trust is completed and allocated to various functions. |
| | • | | Economic services and environmental protection – This excludes economic infrastructure, which is identified as a separate spending category, and includes environmental protection. Estimates relating to communication, transport, and fuel and energy have been included in the economic infrastructure spending category. Environmental-protection public entities involved in science and technology activities (like the South African Weather Service) are included in the science and technology group, while in Annexure B they are classified within this function. |
| | • | | Health – Payments made to nursing colleges are included in the health spending category, but classified as an education function in Annexure B. The Medical Research Council is also excluded from the health function because it falls under science and technology for budget preparation. |
| | • | | Defence – Military health services is included in the defence spending category for purposes of budget preparation, but classified under the health function in Annexure B. |
| | • | | Local government, housing and community amenities – Includes contributions to the South African Local Government Association and the Municipal Demarcation Board, classified as general public services in the statistical tables. |
| | • | | General public services – In the budget’s key spending categories, transfers made to international organisations are classified within the category of the paying department. In Annexure B, they are classified under general public services. |
| ¢ | | Changes in spending estimates and projections in key spending categories |
To improve the budgeting process, spending categories were further broken down and their composition rearranged. This resulted in changes in some of the categories’ spending estimates and projections between the 2012 and 2013 Budget tables. The changes are as follows:
| | • | | Science and technology – These activities have been grouped together to show government activities in innovation and R&D. Spending in the environmental services and protection category has reduced due to the migration of its science and technology-related programmes and entities to this category. |
| | • | | Employment and social security – Spending categories relating to social security and employment have been grouped together. Labour was moved from education and related functions, as it does not relate to this category. The social security sub-category, with the bulk of its spending relating to unemployment and labour incapacitation, was extracted from the social protection category, while the remaining social assistance sub-category was moved to health and social protection. |
| | • | | Education and related functions – Labour-related activities were moved from this category and the recreation and culture categories were grouped together with education. |
13
2013 BUDGET REVIEW
| | • | | Economic infrastructure – The municipal infrastructure grant, previously split among three categories, moved to one category: local government and community development. As a result, expenditure increased in this category and decreased in the transport and water supply categories. |
Outcomes and budgets have been re-estimated to account for changes in the economic environment and in the accounting policies of units within spending categories. For the 2013 Budget, the major changes were as follows:
| | • | | Health and social protection – Revised estimated spending for the health sector, based on the expenditure levels recorded in the government financial systems by the end of the 2012 calendar year, caused expenditure in this category to be much higher than previously estimated. The medium-term expenditure framework projections reflect this revision. |
| | • | | Defence, public order and safety – Budget estimates for labour-intensive sectors such as police were revised because the negotiations of the conditions of service were higher than expected. |
| | • | | General public services – The Property Management Trading Entity recorded transactions relating to assets previously not recorded in its books, increasing the inter-entity transactions for this sector, which in turn reduced expenditure. |
| | • | | Local government, housing and community amenities – The Trans-Caledon Tunnel Authority reviewed the treatment of large infrastructure projects and the tariffs received from the Department of Water Affairs to repay costs incurred in constructing and financing these projects. Construction costs, previously recorded as capital expenditure, are now recorded as use of goods and services: contractors. The tariffs or recoveries payable to the Trans-Caledon Tunnel Authority by the department are recognised as a financial asset – a receivable against the department via the Water Trading Entity. The Water Trading Entity brought these assets and transactions onto their books, including liabilities arising from borrowing to fund procurement. Inter-entity transactions arising from these accounting policy adjustments have been accordingly netted out. |
| ¢ | | Consolidated budget data versus GFS recommendations |
GFS principles are used for the detailed classification of all transactions. However, there are important differences in the final presentation of the consolidated budget data and the GFS. This explains why the presentation of the government accounts in this publication differs from that published in the Reserve Bank’s Quarterly Bulletin, which adheres strictly to GFS recommendations.
The differences between the formats used by the National Treasury and the Reserve Bank are mainly in the structure of the accounts presented compared to that of the GFS, as well as the use of different labelling for some items. It is possible, however, to accurately convert the South African government tables into a GFS table for international comparison, given that the same classification basis is used at a detailed level.
The most important structural difference is that the receipts and payments tables include both current and capital transactions in the South African reporting format. In the GFS presentation of government accounts, current and capital transactions are presented in separate sub-accounts.
Differences in item labelling include the following:
| | • | | The South African presentation does not include unclear terms such as “other” and “miscellaneous”. |
| | • | | The term “grant” is not used in the South African budget presentation format. In the GFS, grants include all funds flowing from one level of government to another. However, in the local context, the majority of funds flowing to other levels of government are not appropriated as grants. They are identified as direct charges against the National Revenue Fund and are therefore included under transfers. |
| | • | | More detail is provided on various transfer categories in the South African presentation to enhance transparency and facilitate the monitoring process, especially on the payment side. |
14
ANNEXURE W2: STRUCTURE OF THE GOVERNMENT ACCOUNTS
| | • | | In the South African presentation, certain items are labelled more clearly than in the GFS version. For example, instead of using the term “sales of goods and services” for sales of goods and services produced by government, the label used is “sales of goods and services produced by a department”. |
| ¢ | | National budget data versus the national accounts presentation |
The SNA is a coherent, consistent and integrated set of macroeconomic accounts, balance sheets and tables based on a set of internationally agreed concepts, definitions, classifications and accounting rules. It provides a comprehensive accounting framework that enables economic data to be compiled and presented in a format designed for economic analysis, making decisions and formulating policy. The national accounts are compiled for a succession of periods, providing a continuous flow of information for monitoring, analysis and evaluation of economic performance.
The SNA provides a framework for calculating GDP, gross national income, savings, capital formation and other key economic variables. National accounts data covers all resident units in a given economy, which is divided into five sectors (including government).
In the national accounts, entries reflect all resident economic units, whereas government accounts reflect government only. This inevitably leads to some differences between the two accounting frameworks. For example, own-account construction is recorded as payments for capital assets in government accounts, with a counter-entry to reflect the use of financial assets or incurrence of a financial liability to finance the transaction. In the national accounts, the recording of the transaction is not complete until entries have also been made to reflect the production of a capital asset and the input in the asset production process. The productive activity is shown as output in the national accounts and compensation of employees and goods and services is the input. The values for output and compensation of employees/goods and services can be derived from the government accounts for national accounts purposes, but these are not directly shown in government’s financial statements. This implies that there is a difference between the values of compensation of employees and goods and services in the government accounts, and services payable by government in the national accounts.
The GFS government accounts differ in many ways from the national accounts, which form the basis for the statistics presented in Chapter 2 of the Budget Review. The most important differences are highlighted in Table W2.3 below.
15
2013 BUDGET REVIEW
Table W2.3 Differences between South African reporting format and government statistics in the 1993 SNA and 2001 GFS
| | | | | | |
Difference | | Budget data | | GFS | | SNA |
| Basis of reporting | | Mainly cash basis; i.e. mainly cash transactions are included in the account. Estimates for consumption of fixed capital and remuneration-in-kind are not included in the account. In addition, the time of recording reflects the cash flow. | | Accrual basis; i.e. including all non-cash transactions, for example, remuneration-in-kind and consumption of fixed capital. In addition, the time of recording reflects the underlying economic event, not the cash flow. | | Accrual |
| | | |
| | | |
| | | |
| | | |
| | | |
| | | |
| | | |
| | | |
| | For example, goods and services are recorded when they are purchased. | | For example, goods and services are recorded when they are used in the production process, not when they are purchased. | | |
| | | |
| | | |
| | | |
| | | |
| | | |
Compensation of employees | | Does not include compensation of employees paid out to government employees who are engaged in government own-account construction in association with a capital project. | | Does not include compensation of employees payable to government employees who are engaged in government own-account construction in association with a capital project. | | Includes compensation of employees payable to government employees, who are engaged in government own-account construction in association with a capital project. |
| | | |
| | | |
| | | |
| | | |
| | | |
| | | |
| | | |
Goods and services | | Does not include purchases of goods and services used in connection with a capital project within the context of government own-account construction. | | Does not include the value of goods and services used in connection with a capital project within the context of government own-account construction. | | Includes the value of goods and services used in connection with a capital project within the context of government own- account construction. |
| | | |
| | | |
| | | |
| | | |
| | | |
| | | |
Sales by government | | This item is explicitly shown in the government accounts. | | This item is explicitly shown in the government accounts. | | This item is not shown anywhere in the national accounts. Instead it is used to estimate final consumption by government. |
| | | |
| | | |
| | | |
| | | |
| | | |
Output, final consumption, savings, disposable income | | These variables are not explicitly shown in the government accounts, but the account can be used as a framework to derive values for them. | | These variables are not explicitly shown in the government accounts, but the accounts can be used as a framework to derive values for them. | | These variables are explicitly shown in the accounts. Estimates for these variables have been made from data in the government accounts. |
| | | |
| | | |
| | | |
| | | |
| | | |
16
W3
Website annexure to the 2013 Budget Review
Gateway to Africa and other reforms
| ¢ | | Helping South African companies expand internationally |
The proposals outlined below are intended to support South African companies that want to expand into the rest of Africa and offshore, which will boost local tax revenue, dividends, competitiveness and jobs, while supporting economic growth and regional integration across the continent.
With over 1 billion people, the African continent presents substantial economic opportunities for South Africa. Between 2007 and 2011, South African companies undertook nearly 1 000 new investments into 36 African countries, including Nigeria, Zambia, Mozambique, Zimbabwe, Kenya, Botswana and Angola.
In 2012, Africa accounted for 17.6 per cent1 of South Africa’s total exports. These exports are often routed through the African subsidiaries of South African firms.
South African companies also have opportunities to partner with advanced economies and to invest in high-growth economies in Asia and South America. As a member of BRICS (Brazil, Russia, India, China), South Africa is well placed to create a platform for African investment.
Gateway subsidiary for African and offshore operations
The National Treasury proposes a special type of South African corporate holding company, registered with the Financial Surveillance Department of the Reserve Bank. Each Johannesburg Stock Exchange listed entity will be entitled to establish one subsidiary to hold African and offshore operations (HoldCo), which will not be subject to foreign exchange restrictions. This will incentivise companies to manage their African and offshore operations from South Africa, maximising the benefits to South Africa’s economy. Following a pilot, this dispensation may be extended to other entities.
| 1 | Preliminary South African Revenue Service figures. |
1
2013 BUDGET REVIEW
The HoldCos will be subject to the following conditions:
| | • | | They must operate as South African tax residents, and be incorporated and effectively managed and controlled in South Africa. |
| | • | | Transfers from the parent company to HoldCo will be allowed up to R750 million per year. Additional amounts may be considered on application to the Reserve Bank. |
| | • | | HoldCos will be allowed to freely raise and deploy capital offshore, provided these funds are without South African guarantees. Additional domestic capital and guarantees will be allowed on funding genuine foreign direct investment (FDI) in the same manner as the current FDI allowance. |
| | • | | HoldCos will be allowed to operate as cash management centres for South African multinationals. Cash pooling will be allowed without any restrictions. |
| | • | | Local income generated from cash management will be freely transferrable. |
| | • | | HoldCos may choose their functional currency or currencies, and operate foreign currency accounts and a rand-denominated account for operational expenses. |
| | • | | Only one wholly owned HoldCo per JSE-listed entity will be allowed. In future, conditions for jointly owned HoldCos, multiple HoldCos and subsidiaries of non-listed entities may be prescribed. |
| | • | | Appropriate governance and transparency arrangements will be required. |
A complementary tax incentive will be considered to allow HoldCos to use foreign functional currency for tax accounting. This would ensure that a HoldCo is not taxable on currency gains and losses arising in the course of foreign functional currency treasury operations. Further details are in Annexure C.
A history of Gateway to Africa reforms
Since 1997, rules governing outward investment by domestic companies have been reformed to give preference to direct investments into Africa.
In 2004, limits on the use of domestic capital in funding offshore investment were removed to provide greater flexibility in financing international expansion. Reforms to facilitate inward listings by foreign companies in local capital markets were also introduced to support international companies investing in Africa.
These reforms have been reinforced by measures to reduce the administrative burden of controls on outward investment, including the removal of the formal Reserve Bank approval process for investments up to R500 million per year.
South African institutional investors (retirement funds, long-term insurance companies, collective investment scheme companies and registered investment managers) are allowed to hold an additional amount of African assets above their current foreign asset allowances, either directly or through the JSE.
South African banks can hold up to 25 per cent of the value of liabilities in foreign assets, which encourages diversification and supports the flow of capital for investment in Africa (see below for additional allowance). Certain private equity funds mandated to invest in Africa have been allowed to invest in the continent without further exchange control restrictions, subject to reporting requirements.
South Africa has eliminated restrictions on investments “passing through” the country to the rest of Africa through specific tax and exchange control rules that apply to qualifying international headquarter companies. This increases South Africa’s attractiveness as a location for regional headquarters.
Government recognises that the new dispensation may also benefit companies with legacy offshore operations. It is open to extending the HoldCo, secondary listing or international headquarter company rules (see below) to these companies, provided the new arrangements have clear benefits to South Africa.
Further refinements to international headquarter company rules
The international headquarter company rules were introduced in 2010 to encourage international companies to invest in Africa using South Africa as a base. International headquarter company status will now be allowed for companies with shares and debt listed on the JSE. The participation threshold will be reduced to 10 per cent.
ANNEXURE W3: GATEWAY TO AFRICA AND OTHER REFORMS
Increase in macroprudential limit for banks
An additional 5 percentage point allowance for African operations is proposed for the macroprudential limit to facilitate South African banks’ further expansion into Africa. A comprehensive review of the limit is being finalised.
Securities lending
Government proposes that authorised dealers be allowed to accept non-rand collateral for securities lending transactions with non-residents as a pilot project.
African listings on the JSE
Debt and equity instruments issued by entities in the Common Monetary Area will be classified as domestic assets, and the listing process will be streamlined.
Listing and trading of foreign referenced assets in foreign currency
The JSE will be allowed to offer African agricultural commodity derivative contracts in foreign currency subject to certain requirements. This will help African farmers hedge risk.
Exchange-traded funds
A limited number of financial institutions have been allowed to operate gold exchange-traded funds. Government proposes to open this product to other qualifying institutions, and to allow commodity exchange-traded funds, including platinum. These funds will be classified as domestic assets for prudential purposes.
Intellectual property
During 2012, intellectual property was deemed capital for Reserve Bank purposes. This was a temporary measure. Following consultation with industry, a joint National Treasury, Reserve Bank and South African Revenue Service will review the change to align it with the tax treatment.
Further details on all the changes outlined above will be made available by the Reserve Bank.
3