Exhibit 99.E


© South African Reserve Bank
All rights reserved. No part of this publication may be reproduced, stored in a retrieval system, or transmitted in any form or by any means, electronic, mechanical, photocopying, recording or otherwise, without fully acknowledging the Quarterly Bulletin of the South African Reserve Bank as the source. The contents of this publication are intended for general information only and are not intended to serve as financial or other advice. While every precaution is taken to ensure the accuracy of information, the South African Reserve Bank shall not be liable to any person for inaccurate information or opinions contained in this publication.
| | | | |
Enquiries relating to this Bulletin should be addressed to: | | | | |
| |
Head: Research Department | | | | |
South African Reserve Bank | | | | |
P O Box 427 | | | | |
Pretoria 0001 | | | | |
Tel. +27 12 313-3668/3676 | | | | |
| |
http://www.reservebank.co.za | | | ISSN 0038-2620 | |
| | |
 | | Quarterly Bulletin March 2014 |
Contents
Quarterly Economic Review
| | | | |
Introduction | | | 1 | |
Domestic economic developments | | | 4 | |
Domestic output | | | 4 | |
Real gross domestic expenditure | | | 8 | |
Factor income | | | 13 | |
Gross saving | | | 14 | |
Employment | | | 14 | |
Labour cost and productivity | | | 22 | |
Prices | | | 23 | |
Foreign trade and payments | | | 30 | |
International economic developments | | | 30 | |
Current account | | | 33 | |
Financial account | | | 38 | |
Foreign debt | | | 40 | |
International reserves and liquidity | | | 42 | |
Exchange rates | | | 43 | |
Monetary developments, interest rates and financial markets | | | 48 | |
Structural and regulatory issues in 2013 and early 2014 | | | 48 | |
Money supply | | | 52 | |
Credit extension | | | 54 | |
Interest rates and yields | | | 58 | |
Money market | | | 62 | |
Bond market | | | 63 | |
Share market | | | 65 | |
Market for exchange-traded derivatives | | | 66 | |
Real-estate market | | | 67 | |
Non-bank financial intermediaries | | | 68 | |
Flow of funds | | | 69 | |
Public finance | | | 70 | |
Non-financial public-sector borrowing requirement | | | 70 | |
Budget comparable analysis of national government finance | | | 72 | |
The Budget for fiscal 2014/15 to 2016/17 | | | 78 | |
Fiscal policy stance | | | 78 | |
| |
Statement issued by Gill Marcus, Governor of the South African Reserve Bank | | | | |
| |
Statement of the Monetary Policy Committee 29 January 2014 | | | 83 | |
| |
Notes to tables | | | 88 | |
| |
Statistical tables | | | | |
| |
Contents | | | S–0 | |
Statistical tables | | | S–2 | |
Key information | | | S–144 | |
| | |
| Quarterly Bulletin March 2014 | | |


Quarterly Economic Review
Introduction
Global economic activity, despite remaining fragile and uneven, has maintained a firmer undertone from the second quarter of 2013. However, the overall growth momentum slowed somewhat in the final quarter of the year after peaking in the third quarter as growth moderated in several emerging Asian and European countries, as well as in advanced economies. While the continued fragility of the recovery in the euro area and fears of deflation prompted the European Central Bank (ECB) to reduce its key policy interest rate in November 2013, signs of improvement in economic conditions brought the Federal Reserve in the United States (US) to announce in December 2013 the first cutback in the pace of its purchases of securities – while still maintaining ultra-low policy interest rates.
The actual onset of the tapering of quantitative easing influenced sentiment in global financial markets, reducing the relative attractiveness of exposure to emerging-market assets and triggering portfolio adjustment. Against this background, several emerging-market economies with large current-account deficits recently experienced significant currency depreciations and heightened inflation. However, international commodity prices remained well contained and with the world economy continuing to function below full capacity, global inflation remained fairly benign during the period under review, although significantly higher in emerging economies than in advanced economies.
The South African economy recorded erratic quarter-to-quarter growth in 2013, with the overall pace of expansion in real output for the year as a whole a disappointing 1,9 per cent. Apart from longer-term impediments to growth such as constrained electricity supply and logistical bottlenecks, production in the first quarter of 2013 was held back by industrial action, fire damage at a large steel mill and maintenance of production facilities, while widespread strike action again disrupted production in the third quarter. From the low base established in the third quarter, the subsequent normalisation of production propelled growth to an annualised rate of 3,8 per cent in the fourth quarter of the year. South Africa’s erratic growth pattern could well continue in the first quarter of 2014, with protracted industrial action again weighing on production.
As labour relations normalised, a rebound in manufacturing production, especially in the motor vehicles and components subsector, made the largest contribution to the buoyant rate of real economic growth in the fourth quarter of 2013. Mining production also rose briskly over the same period, led by diamonds, gold and platinum group metals. The trade sector similarly made a significant contribution to growth in the fourth quarter as rising retail and wholesale sales more than fully countered a decline in motor trade activity. Real agricultural production registered a strong performance in the fourth quarter of 2013 primarily on account of an increase in field crop production, particularly in sugar cane. Rising civil construction activity was reflected in an increase in real value added by the construction sector, whereas real electricity production declined in the fourth quarter, partly as a result of supply constraints.
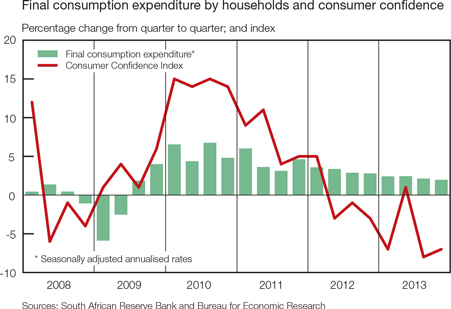
The gradual consolidation of household finances continued in the final quarter of 2013, as the pace of increase of real final household consumption expenditure slowed marginally further and the ratio of household debt to disposable income edged lower. Real spending on durable and semi-durable goods rose at a somewhat slower pace in the fourth quarter, with expenditure on furniture and appliances contracting along with slower growth in spending on personal transport equipment and on computers and related equipment.
The pace of increase in real final consumption expenditure by general government edged higher in the fourth quarter of 2013 as outlays on non-wage goods and services increased, reflecting in part the expenditure related to the state funeral of the former president of South Africa, Mr Nelson Mandela, alongside somewhat higher real compensation of government employees.
| | |
| Quarterly Bulletin March 2014 | | |


Growth in real capital expenditure moderated notably in the fourth quarter of 2013. This was due to a sharp deceleration in the pace of growth in real fixed capital formation by private business enterprises, as real outlays in the manufacturing sector slowed. Capital spending on wind farms and solar plants for the generation of electricity, which gained in significance in 2013, continued at a more moderate pace in the final quarter of the year.
While constituting less than a fifth of the country’s overall fixed capital formation, real capital spending by general government advanced at a brisk pace in the final quarter of 2013, broadly maintaining its momentum of the previous quarter. Priority areas included the construction and upgrading of roads, schools and hospitals, with the provincial governments and local authorities in particular stepping up their expenditure. At the same time the level of real fixed capital expenditure by public corporations essentially moved sideways – albeit at a high level, mainly reflecting ongoing spending by the electricity and transport sectors.
The accumulation of inventories recorded in the first three quarters of 2013 made way for destocking in the final quarter of the year. The reversal in stockpiling in the final quarter resulted mainly from a de-accumulation of inventories in the manufacturing sector and in the strike-prone mining sector, reflecting fairly subdued business confidence levels.
Partly related to the negative inventory investment, merchandise imports contracted significantly in the fourth quarter of 2013, albeit from a high base. Pronounced decreases were recorded in imports of especially machinery and electrical equipment, and vehicles and transport equipment. By contrast, merchandise exports rose in the fourth quarter, partly as a catch-up action following the strike-induced setbacks to production and exports in the previous quarter. At the same time the deficit on the services, income and current transfer account widened somewhat in the fourth quarter of 2013, not least due to lower gross dividend receipts from the rest of the world following exceptionally high receipts in the preceding quarter. These developments culminated in a somewhat narrower deficit on the current account of the balance of payments: the fourth-quarter deficit amounted to 5,1 per cent of gross domestic product, lower than in the third quarter when the shortfall ratio amounted to 6,4 per cent.
With international investor sentiment towards emerging-market economies having turned negative during the fourth quarter of 2013 in reaction to the imminent tapering of asset purchases by the US Federal Reserve, a sharp reversal of portfolio flows was registered in the final quarter of 2013. The net inward movement of foreign capital through the financial account of the balance of payments moderated considerably in the fourth quarter of the year, with the inflow mainly taking the form of an increase in other investment liabilities. Throughout the fourth quarter the South African Reserve Bank (the Bank) maintained its gross gold and other foreign-exchange reserves at a level of around four-and-a-half months’ worth of imports.
The investor dynamics generated by the tapering announcements in the US, the ongoing labour strife and the sizeable deficit on the current account of the balance of payments contributed to a renewed depreciation in the exchange value of the rand in the final weeks of 2013 and early 2014. Although the pass-through of the depreciation in the exchange rate to inflation remained muted, prices and expectations started to respond; bolstered by higher food and fuel prices, consumer price inflation for instance most recently picked up to a level just below the 6 per cent upper limit of the inflation target range.
Despite instances of adversarial industrial relations, average wage settlements in 2013 remained at levels just below 8 per cent throughout the year. Employer-surveyed data show modest growth in employment in the formal sector in the year to the third quarter of 2013, with the public sector rather than the private sector responsible for the limited number of jobs that were created. Unemployment remained structurally high at more than 24 per cent of the workforce.
The slow and uneven pace of economic growth and subdued levels of confidence contributed to sluggish growth in banks’ credit extension. Unsecured lending to households lost its earlier vigour in the course of 2013, while the pace of increase in installment sale credit and leasing finance slowed in recent months, consistent with the reduced buoyancy of vehicle sales. Growth in mortgage advances picked up slightly but remained subdued.
| | |
| | | Quarterly Bulletin March 2014 |
Towards the end of 2013 house price inflation was maintained at year-on-year rates of around 7 per cent, with tentative signs of an improvement in turnover. With yields on deposit-type investments low, South African share prices fluctuated higher in 2013 and early 2014 to successive record levels. Domestic bond yields, which increased significantly in the wake of the first tapering remarks by the US Federal Reserve in May 2013, rose further in the second half of 2013 and first two months of 2014. Owing to the marked depreciation in the exchange value of the rand, the rand value of most portfolios of foreign assets increased sharply in recent months.
The public-sector borrowing requirement remained marginally above 6 per cent of gross domestic product in the period April to December 2013, supporting the economic recovery as both general government and the non-financial public corporations incurred deficits. Delivered in February 2014, the Budget for fiscal 2014/15 essentially maintained an even keel fiscal policy, providing consistency and stability while simultaneously moving ahead in the implementation of the National Development Plan (NDP). Balancing the key principles of countercyclicality, debt sustainability and intergenerational fairness in an environment of lacklustre growth, the Budget provided for moderate increases in real spending, although within an explicit expenditure ceiling. Compared with the October 2013 Medium Term Budget Policy Statement, a slightly quicker pace of narrowing of the consolidated budget deficit was projected in support of debt stabilisation, while at the same time improving the composition of government expenditure through further emphasis on capital spending and alignment with the NDP.
A notable further depreciation in the exchange value of the rand in January 2014 significantly raised the risk of inflation rising above the target range and staying there for a protracted period of time. To address this risk the Monetary Policy Committee (MPC) at its January 2014 meeting decided to increase the repurchase rate from 5,0 per cent to 5,5 per cent per annum – the first change in the repurchase rate since July 2012, when it was lowered by 50 basis points. The 18-month trough in interest rates was therefore slightly longer than in the previous interest rate cycle: the 2005–2006 trough lasted 14 months, with the repurchase rate at the time being maintained at a level of 7 per cent.
| | |
| Quarterly Bulletin March 2014 | | |


Domestic economic developments
Domestic output1
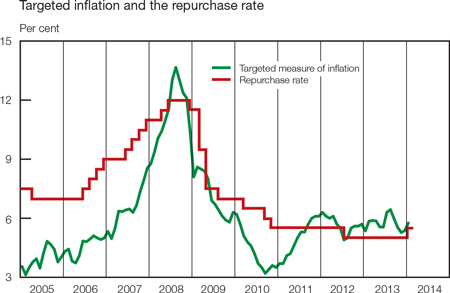
Domestic economic activity expanded notably in the fourth quarter of 2013. Growth in real gross domestic product picked up from an annualised rate of 0,7 per cent in the third quarter of 2013 to 3,8 per cent in the fourth quarter, mainly reflecting a rebound in the real value added by the secondary sector which had severely hampered the country’s growth performance in the preceding quarter. Stronger growth was also recorded in the real value added by the primary and tertiary sectors.
Despite the improved performance in the fourth quarter of 2013, aggregate real gross domestic product for the year 2013 as a whole increased by a disappointing 1,9 per cent, reflecting among other factors the adverse impact of sporadic labour disruptions in several sectors of the economy, subdued business and consumer confidence levels, structural impediments hampering production and ongoing subdued global economic conditions. Growth in real gross domestic product in 2013 was, with the exception of 2009 when gross domestic production contracted, the lowest during the past 15 years. On average, annual growth amounted to 2,8 per cent in the four years, from 2010 to 2013, compared with an average of 3,7 per cent in the preceding ten years.
Real gross domestic product
Percentage change at seasonally adjusted annualised rates
| | | | | | | | | | | | | | | | | | | | | | | | |
| | | 2012 | | | 2013 | |
| Sector | | Year | | | 1st qr | | | 2nd qr | | | 3rd qr | | | 4th qr | | | Year | |
Primary sector | | | -2,0 | | | | 7,5 | | | | -4,7 | | | | 8,9 | | | | 12,8 | | | | 2,9 | |
Agriculture | | | 2,0 | | | | -4,4 | | | | -3,0 | | | | 3,6 | | | | 6,4 | | | | 2,3 | |
Mining | | | -3,6 | | | | 13,4 | | | | -5,4 | | | | 11,4 | | | | 15,7 | | | | 3,1 | |
Secondary sector | | | 1,8 | | | | -5,9 | | | | 9,6 | | | | -4,5 | | | | 9,2 | | | | 1,0 | |
Manufacturing | | | 2,1 | | | | -7,9 | | | | 11,7 | | | | -6,6 | | | | 12,3 | | | | 0,8 | |
Tertiary sector | | | 3,2 | | | | 2,0 | | | | 2,2 | | | | 1,3 | | | | 1,5 | | | | 2,0 | |
Non-manufacturing sector | | | 2,5 | | | | 2,4 | | | | 1,6 | | | | 2,1 | | | | 2,5 | | | | 2,1 | |
Non-primary sector | | | 2,8 | | | | 0,0 | | | | 4,0 | | | | -0,1 | | | | 3,3 | | | | 1,8 | |
Total | | | 2,5 | | | | 0,8 | | | | 3,2 | | | | 0,7 | | | | 3,8 | | | | 1,9 | |
| | |
| | | Quarterly Bulletin March 2014 |
Compared to the erratic growth of the labour-affected and energy-dependent manufacturing sector, the real value added by the other sectors advanced more smoothly from quarter to quarter, as illustrated in the accompanying table. Excluding manufacturing, the economy registered annual growth of 2,1 per cent for the year 2013 as a whole.
The real output of the primary sector increased at a brisk pace of 12,8 per cent in the fourth quarter of 2013 following growth of 8,9 per cent in the third quarter, with both the agricultural and the mining sectors registering a firmer pace of growth in the final quarter of 2013.
The real value added by the agricultural sector increased at an annualised rate of 6,4 per cent in the fourth quarter of 2013 following an increase of 3,6 per cent in the third quarter. The strong performance in the fourth quarter stemmed primarily from an increase in field crop production, more in particular sugar cane, alongside higher animal and horticultural production. According to the final estimates of the Crop Estimates Liaison Committee, the maize crop for the 2012/13 production season amounted to 11,7 million tons compared with 12,1 million tons harvested in the 2011/12 production season.
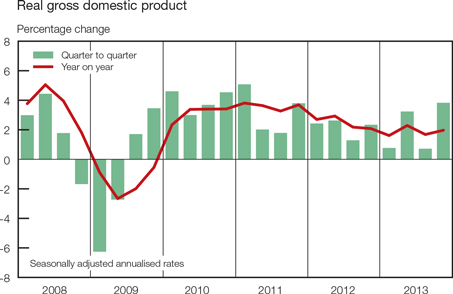
Growth in real value added by the mining sector accelerated from 11,4 per cent in the third quarter of 2013 to 15,7 per cent in the fourth quarter. This firm performance could largely be attributed to pronounced increases in the production of diamonds and other mining commodities, while some growth in the production of platinum group metals also contributed to the positive outcome. Gold production benefited from a higher grade of ore milled and lower operating cost experienced by some gold mines. Platinum production expanded further despite remnants of labour disruptions during the period. By contrast, the production of coal was affected by the scaling down of unprofitable collieries and disruptions due to construction activity to modify certain plants. In addition, the adverse weather conditions experienced in the preceding quarter continued to weigh upon certain open-cast coal operations over the period.
On an annual basis, the real output of the mining sector increased by 3,1 per cent in 2013 after having declined by 3,6 per cent in 2012. The recovery in mining output in 2013 largely reflected higher production volumes in the diamond, platinum and gold mining sectors. Labour strife and the policy environment continued to play a key role in 2013.
Subsequent to an annualised decline of 4,5 per cent in the third quarter of 2013, the real value added by the secondary sector expanded at a firm pace in the fourth quarter, rising by 9,2 per cent. The real output of the manufacturing sector improved from a low base established in the preceding quarter, alongside a firm increase in construction activity. Output of the electricity, gas and water sector, however, contracted over the period.
| | |
| Quarterly Bulletin March 2014 | | |


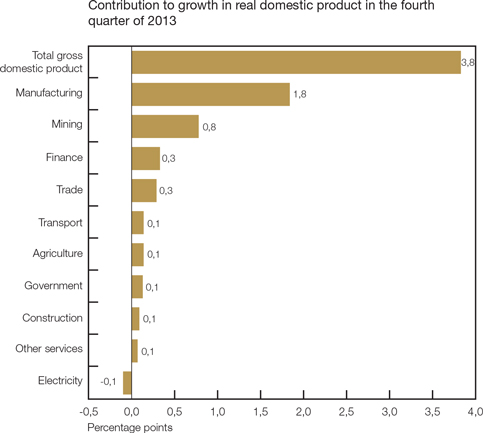
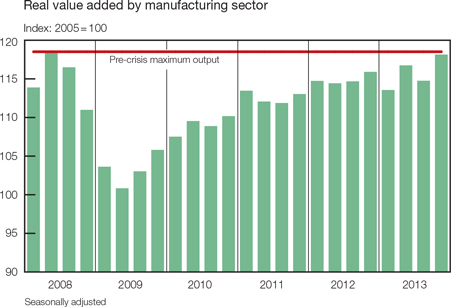
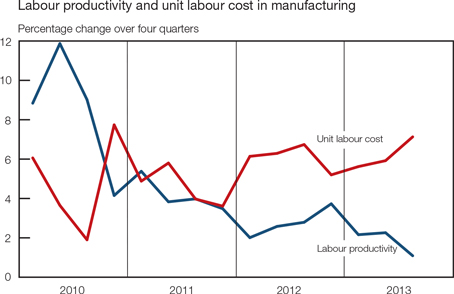
Having been fairly erratic in the first three quarters of 2013, growth in the real value added by the manufacturing sector rebounded in the final quarter of 2013, adding 1,8 percentage points to the overall economic growth rate of 3,8 per cent in the fourth quarter. Real output originating in the manufacturing sector increased at an annualised rate of 12,3 per cent in the final quarter of 2013, following a decline of 6,6 per cent in the third quarter. Notwithstanding the most recent recovery in manufacturing output, real production still fell short of levels recorded prior to the financial crisis. Production more recently benefited from somewhat more stable global economic conditions, stronger growth in advanced and emerging-market economies and enhanced competitiveness brought about by the depreciation in the exchange value of the rand. For the improved performance of the manufacturing sector to be sustained, however, the ongoing increases in nominal unit labour cost and diminishing productivity growth in the sector would need to be addressed.
| | |
| | | Quarterly Bulletin March 2014 |
Growth in production in the subsectors manufacturing motor vehicles, parts and accessories; petroleum and chemical products, rubber and plastic products; and radio, television and communication equipment accelerated over the period. Production, however, decreased in the subsectors producing wood and wood products; clothing and footwear; and basic iron and steel, non-ferrous metals and machinery. Consistent with the higher level of manufacturing production, the utilisation of production capacity in the manufacturing sector advanced from 81,2 per cent in the third quarter of 2013 to 82,6 per cent in the fourth quarter. Pronounced increases were registered in the subsectors manufacturing motor vehicles, parts and accessories, and other transport equipment.
For the year as a whole, real growth in manufacturing output, however, tapered off from 2,1 per cent in 2012 to only 0,8 per cent in 2013. The slower momentum in 2013 largely reflected locally driven dynamics such as a setback caused by a fire at a steel mill, maintenance of refineries and industrial action in the motor vehicle and component industries. Global demand for domestically produced manufactured products remained subdued over the period.
Having increased at an annualised rate of 3,8 per cent in the third quarter of 2013, real output of the sector supplying electricity, gas and water contracted by 5,6 per cent in the fourth quarter. The decline could primarily be explained by supply constraints following scheduled maintenance performed on two large generators during the quarter. The tight supply of electricity was furthermore exacerbated by the fact that air-cooled stations could not operate at maximum capacity due to extremely high temperatures experienced over the period. The real value added by the sector contracted by 0,4 per cent in 2013, following a decline of 1,6 per cent in 2012. The most recent decline could be attributed to the warmer winter temperatures experienced during 2013, increased savings by the household sector in response to higher electricity prices and sluggish economic growth over the period.
Real output of the construction sector continued to pick up pace and advanced at an annualised rate of 3,1 per cent in the fourth quarter of 2013 compared with a rate of 2,1 per cent in the third quarter. Civil construction activity in the public sector maintained its underlying upward momentum, driven by government’s infrastructural development plans. Activity in the residential and non-residential building industry, however, improved only marginally over the period. Owing mainly to increased activity in civil construction, the real value added by the construction sector rose by 2,8 per cent in 2013 compared with an increase of 2,3 per cent in 2012.
Growth in the real value added by the tertiary sector accelerated from an annualised rate of 1,3 per cent in the third quarter of 2013 to 1,5 per cent in the fourth quarter. Firmer growth in the commerce and finance, insurance, real-estate and business services sector was partly
| | |
| Quarterly Bulletin March 2014 | | |


neutralised by the weaker performance of the transport sector. The real value added by general government remained subdued over the period.
Real output of the trade sector increased at an annualised rate of 2,3 per cent in the fourth quarter of 2013, significantly faster than the rate of increase of 1,3 per cent in the third quarter. This solid performance primarily reflected an expansion in retail and wholesale trade, as somewhat less buoyant activity was registered in the motor trade subsector. The pickup in retail and wholesale trade in part followed a low base in the third quarter of 2013 caused by the spate of industrial action which negatively affected some sectors between August and October. Conversely, the more modest performance of the motor trade subsector reflected strike action and the somewhat weaker domestic demand for durable and semi-durable goods in the final quarter of 2013. Demand for tourism accommodation increased in the fourth quarter of 2013, inter alia, due to a surge in the number of foreign travellers. For the year as a whole, the growth in real value added by commerce moderated from a rate of 3,8 per cent in 2012 to 2,2 per cent in 2013 as the real value added by all subsectors slowed over the period.
Growth in the real value added by the transport, storage and communication sector edged lower from an annualised rate of 2,6 per cent in the third quarter of 2013 to 1,6 per cent in the fourth quarter, reflecting sluggish activity in the transport subsector. Activity in both freight and passenger transportation slowed over the period whereas activity in the telecommunication subsector picked up further. Overall, growth in the real value added by the transport, storage and communication sector slowed from 2,4 per cent in 2012 to 1,9 per cent in 2013.
Consistent with the acceleration in overall growth, the real value added by the finance, insurance, real-estate and business services sector picked up from an annualised rate of increase of 1,2 per cent in the third quarter of 2013 to 1,5 per cent in the fourth quarter. The increased growth reflected higher activity in the banking sector and in the equity, bond and financial markets. The growth in real value added by the finance, insurance, real-estate and business services sector moderated from 3,7 per cent in 2012 to 2,4 per cent in 2013.
Growth in real output of general government increased at an annualised rate of 0,9 per cent in the fourth quarter of 2013. On a calendar basis, the real value added by general government slowed to 1,5 per cent in 2013, compared with an increase of 2,8 per cent in 2012.
Real gross domestic expenditure
Aggregate real gross domestic expenditure declined further from an annualised rate of 0,8 per cent in the third quarter of 2013 to 3,6 per cent in the fourth quarter. In real terms, faster growth in final consumption expenditure by general government was more than neutralised by a slower pace of increase in household consumption expenditure and gross fixed capital formation; inventory holdings declined over the period. For the year 2013 as a whole, however, real gross domestic expenditure increased by 2,2 per cent, thereby exceeding growth in real gross domestic production.
Real gross domestic expenditure
Percentage change at seasonally adjusted annualised rates
| | | | | | | | | | | | | | | | | | | | | | | | |
| | | 2012 | | | 2013 | |
| Component | | Year | | | 1st qr | | | 2nd qr | | | 3rd qr | | | 4th qr | | | Year | |
Final consumption expenditure | | | | | | | | | | | | | | | | | | | | | | | | |
Households | | | 3,5 | | | | 2,4 | | | | 2,5 | | | | 2,1 | | | | 2,0 | | | | 2,6 | |
General government | | | 4,0 | | | | 2,8 | | | | 1,7 | | | | 1,5 | | | | 2,0 | | | | 2,4 | |
Gross fixed capital formation | | | 4,4 | | | | 3,8 | | | | 5,6 | | | | 7,0 | | | | 3,1 | | | | 4,7 | |
Domestic final demand | | | 3,8 | | | | 2,7 | | | | 2,9 | | | | 2,9 | | | | 2,2 | | | | 2,9 | |
Change in inventories (R billions)* | | | 9,9 | | | | 7,9 | | | | 16,4 | | | | 3,3 | | | | -22,3 | | | | 1,3 | |
Gross domestic expenditure | | | 4,0 | | | | 5,3 | | | | 3,2 | | | | -0,8 | | | | -3,6 | | | | 2,2 | |
| | |
| | | Quarterly Bulletin March 2014 |
Real net exports made the largest contribution to growth in real gross domestic product in the fourth quarter of 2013, adding 7,8 percentage points, followed by real final consumption expenditure by households. For the year 2013 as a whole, real private consumption expenditure by households, however, continued to make the largest contribution to real gross domestic product.
Contribution of expenditure components to growth in real gross domestic product
Percentage points
| | | | | | | | | | | | | | | | | | | | | | | | |
| | | 2012 | | | 2013 | |
| Component | | Year | | | 1st qr | | | 2nd qr | | | 3rd qr | | | 4th qr | | | Year | |
Final consumption expenditure | | | | | | | | | | | | | | | | | | | | | | | | |
Households | | | 2,3 | | | | 1,6 | | | | 1,6 | | | | 1,4 | | | | 1,3 | | | | 1,7 | |
General government | | | 0,8 | | | | 0,6 | | | | 0,4 | | | | 0,3 | | | | 0,4 | | | | 0,5 | |
Gross fixed capital formation | | | 0,9 | | | | 0,7 | | | | 1,1 | | | | 1,4 | | | | 0,6 | | | | 0,9 | |
Change in inventories | | | 0,1 | | | | 2,4 | | | | 1,7 | | | | -2,6 | | | | -5,2 | | | | -0,4 | |
Net exports | | | -1,7 | | | | -4,8 | | | | -0,2 | | | | 1,6 | | | | 7,8 | | | | -0,5 | |
Residual | | | 0,1 | | | | 0,2 | | | | -1,4 | | | | -1,4 | | | | -1,2 | | | | -0,3 | |
Gross domestic product | | | 2,5 | | | | 0,8 | | | | 3,2 | | | | 0,7 | | | | 3,8 | | | | 1,9 | |
Real final consumption expenditure by households increased at a slightly slower pace in the fourth quarter of 2013 due to, among other factors, rising inflation and tighter lending conditions. Having increased at an annualised rate of 2,1 per cent in the third quarter of 2013, real spending by households advanced at a marginally slower pace of 2,0 per cent in the fourth quarter. Growth in outlays on durable and semi-durable goods lost some momentum, whereas real expenditure on non-durable goods remained sluggish. Expenditure on services, however, increased at a faster pace over the period.
Real final consumption expenditure by households
Percentage change at seasonally adjusted annualised rates
| | | | | | | | | | | | | | | | | | | | | | | | |
| | | 2012 | | | 2013 | |
| Category | | Year | | | 1st qr | | | 2nd qr | | | 3rd qr | | | 4th qr | | | Year | |
Durable goods | | | 11,1 | | | | 5,9 | | | | 12,6 | | | | 9,4 | | | | 6,9 | | | | 7,9 | |
Semi-durable goods | | | 6,2 | | | | 7,6 | | | | 8,5 | | | | 7,1 | | | | 3,1 | | | | 6,7 | |
Non-durable goods | | | 2,7 | | | | 2,4 | | | | 2,7 | | | | 0,5 | | | | 0,2 | | | | 2,2 | |
Services | | | 1,7 | | | | 0,1 | | | | -2,1 | | | | 0,1 | | | | 1,7 | | | | 0,3 | |
Total | | | 3,5 | | | | 2,4 | | | | 2,5 | | | | 2,1 | | | | 2,0 | | | | 2,6 | |
Having increased by 3,5 per cent in 2012, growth in real consumption expenditure by households moderated to 2,6 per cent in 2013, still accounting for roughly 61 per cent of total expenditure on gross domestic product.
In the fourth quarter of 2013 household spending on durable goods expanded at a slower pace than in the preceding two quarters, moderating from 9,4 per cent in the third quarter to a still fairly brisk 6,9 per cent in the final quarter. Lower spending on furniture and appliances, along with slower growth in spending on personal transport equipment and on computers and related equipment – components which typically have a high import content – was partly offset by increased spending on durable recreational and entertainment goods and on other durable goods. The weaker demand for furniture and household appliances could probably in part be ascribed to a moderation in credit extension by some retailers. Consistent with slower growth in real disposable income of households and lower consumer confidence levels, the pace of increase in real spending on durable goods moderated from 11,1 per cent in 2012 to 7,9 per cent in 2013.
| | |
| Quarterly Bulletin March 2014 | | |


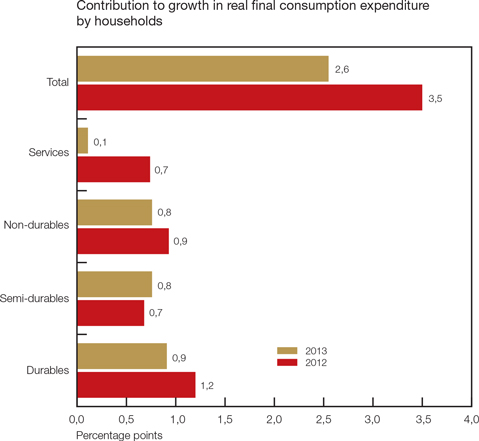
After growing at a steady pace of more than 7 per cent in the first three quarters of 2013, growth in real spending on semi-durable goods decelerated to 3,1 per cent in the final quarter of 2013. The slower growth was evident in most categories of semi-durable goods, with the exception of recreational and miscellaneous goods.
| | |
| | | Quarterly Bulletin March 2014 |
Owing to the largely non-discretionary nature of expenditure on non-durable goods, the level of real spending on this category remained broadly unchanged in the third and fourth quarters of 2013. Lower spending on petroleum products, probably related to the high real price of these products, was offset by increased expenditure on food, beverages and tobacco over the period.
Real spending on services, constituting the largest part of total consumption expenditure by households, increased at an annualised rate of 1,7 per cent in the fourth quarter of 2013, up from 0,1 per cent in the preceding quarter. Growth in spending on rent and household services more than neutralised slower spending on transport and communication services. For the calendar year 2013 as a whole, real spending by households on services rose by 0,3 per cent, that is, at a much slower pace than the increases of 3,6 per cent and 1,7 per cent recorded in 2011 and 2012 respectively.
Growth in real disposable income of households slowed marginally from an annualised rate of 2,1 per cent in the third quarter of 2013 to 2 per cent in the fourth quarter. On a year-on-year basis, growth in real disposable income of households, however, moderated more noticeably from 3,9 per cent in 2012 to 2,5 per cent in 2013. Household income continued to be negatively affected by rising inflation, the adverse effect of widespread labour unrest and (indirectly) the deterioration in the country’s terms of trade.
Alongside the slightly slower pace of increase in household consumption expenditure, growth in credit extended to the household sector moderated in the fourth quarter of 2013. The quarterly ratio of household debt to annualised disposable income remained below 76 per cent throughout the year, and as growth in disposable income outpaced growth in household debt, the ratio of household debt to disposable income decreased from 75 per cent in the third quarter of 2013 to 74,3 per cent in the fourth quarter.
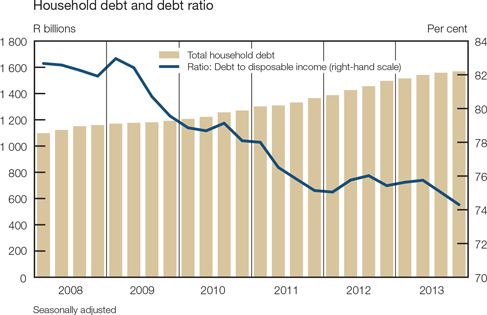
On an annual basis, growth in household debt slowed from 8,6 per cent in 2012 to 7,3 per cent in 2013. Simultaneously, the ratio of household debt to disposable income decreased marginally from 75,6 per cent in 2012 to 75,2 per cent in 2013, due to a more pronounced slowdown in debt relative to household income. The debt-service cost ratio, however, remained at 7,7 per cent in both 2012 and 2013, due to stronger growth in credit facilities in high interest-rate advances which offset slower growth in lower interest rate credit facilities over the period.
| | |
| Quarterly Bulletin March 2014 | | |


Having increased at a rather subdued annualised rate of 1,5 per cent in the third quarter of 2013, the pace of increase in real final consumption expenditure by general government edged higher to 2 per cent in the fourth quarter. The stronger growth could partly be attributed to increased outlays on non-wage goods and services which included, among other expenses, spending associated with the state funeral of the former president of South Africa, Mr Nelson Mandela. Growth in real compensation of employees edged higher in the final quarter of 2013.
Real final consumption expenditure by general government rose by 2,4 per cent in 2013 –slower than the increase of 4 per cent in 2012 when spending on armaments bolstered these outlays. The moderation in 2013 could also in part be attributed to slower growth in spending on compensation of employees. Relative to the country’s gross domestic product, consumption expenditure by general government remained elevated at roughly 22 per cent in both 2012 and 2013.
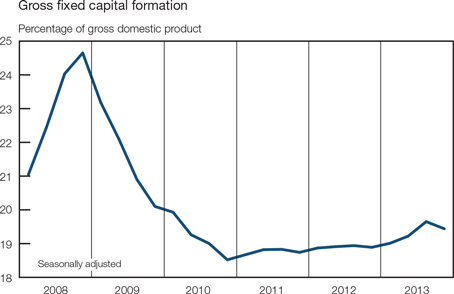
Growth in real gross fixed capital formation moderated in the fourth quarter of 2013, having maintained a steady pace throughout the year. Whereas private business enterprises recorded a significant deceleration, capital spending by the other institutional sectors increased at a slightly faster pace. Capital expenditure by general government advanced at a brisk pace of 9,2 per cent, roughly similar to the rate of increase recorded in the preceding quarter. As a ratio of gross domestic product, however, fixed capital formation tapered off from 19,6 per cent in the third quarter of 2013 to 19,4 per cent in the fourth quarter. The annual growth rate in real fixed capital spending improved further to 4,7 per cent in 2013 following an increase of 4,4 per cent in 2012.
Real gross fixed capital formation by private business enterprises slowed in the final quarter of 2013 as real outlays in the manufacturing sector continued at a more moderate pace. The momentum in capital spending reflected investors’ appetite to increase capacity and to spend on major additions and maintenance. The gradually rising real capital expenditure throughout the year brought the annual growth rate for 2013 to 5,5 per cent, higher than in 2012.
The mining sector continued to spend on ongoing projects, with the majority of the capital outlays directed at machinery and equipment, and construction works. The spending on capital assets was spread across the coal, gold and iron-ore subsectors of mining. Even though production activity at platinum mines was weighed down by industrial action, capital spending continued apace.
| | |
| | | Quarterly Bulletin March 2014 |
Real gross fixed capital formation
Percentage change at seasonally adjusted annualised rates
| | | | | | | | | | | | | | | | | | | | | | | | |
| | | 2012 | | | 2013 | |
| Sector | | Year | | | 1st qr | | | 2nd qr | | | 3rd qr | | | 4th qr | | | Year | |
Private business enterprises | | | 3,9 | | | | 6,2 | | | | 8,2 | | | | 8,6 | | | | 2,4 | | | | 5,5 | |
Public corporations | | | 4,9 | | | | -1,6 | | | | 0,1 | | | | 0,4 | | | | 0,8 | | | | 3,1 | |
General government | | | 6,2 | | | | 1,5 | | | | 2,6 | | | | 9,0 | | | | 9,2 | | | | 3,5 | |
Total | | | 4,4 | | | | 3,8 | | | | 5,6 | | | | 7,0 | | | | 3,1 | | | | 4,7 | |
The moderation in capital investment by the manufacturing sector in the fourth quarter of 2013 was mainly visible in spending on machinery and equipment. Capital spending was spread across a spectrum of manufactured goods industries, including food and beverages, chemicals, and motor parts and accessories.
Real capital formation by the electricity sector rose in the fourth quarter of 2013, partially underpinned by a sharp increase in the capital spending on wind farms and solar plants as part of the Renewable Energy Independent Power Producer Procurement Programme. This was in particular pronounced in the Northern and Eastern Cape. Some of these projects were completed in the final quarter of 2013.
Growth in real fixed capital expenditure by public corporations improved marginally to an annualised rate of 0,8 per cent in the fourth quarter of 2013, mainly due to ongoing spending by the electricity and transport sectors. Most of the leading entities, including Transnet, SANRAL and the Trans-Caledon Tunnel Authority, raised their capital spending. Despite the ongoing activity, real capital expenditure by public corporations increased at a rate of only 3,1 per cent in 2013, substantially lower than the rate of increase of 4,9 per cent recorded in 2012.
Real gross fixed capital formation by general government was maintained in the fourth quarter of 2013, with the provincial governments and local authorities in particular stepping up their expenditure. The impetus in capital spending continued to be upheld by outlays on education, health, transport and energy. In addition, the construction and upgrading of provincial roads, schools and provincial hospitals gained momentum. Despite brisk capital outlays in the second half of 2013, growth in 2013 as a whole slowed to 3,5 per cent compared with 6,2 per cent recorded in 2012.
Real inventory accumulation reversed from R3,2 billion in the third quarter of 2013 to destocking at a rate of R22,3 billion (at 2005 prices) in the fourth quarter, subtracting 4,7 percentage points from the growth in real gross domestic expenditure. The de-accumulation of inventories in the manufacturing and mining sectors in the final quarter of 2013 reflected fairly subdued business confidence levels, a stronger than expected increase in economic activity and a fairly sharp decline in imports over the period. On an annual basis, the level of real inventories came to R1,3 billion in 2013, less than the R9,9 billion recorded in 2012.
The decline in inventories in the mining sector largely reflected lower inventory holdings as industrial action adversely affected production in the fourth quarter of 2013. In the manufacturing sector, the de-accumulation of inventories was associated with lower imports of manufactured goods over the period. Industrial and commercial inventories as a percentage of the non-agricultural gross domestic product declined from 13,2 per cent in the third quarter of 2013 to 12,8 per cent registered in the fourth quarter.
Factor income
Growth over four quarters in aggregate nominal factor income edged lower from a revised rate of 7,5 per cent in the third quarter of 2013 to 7,1 per cent in the fourth quarter. This slower pace of increase reflected more moderate growth in both gross operating surpluses of business enterprises and compensation of employees. However, for the year 2013 as a whole, the rate of increase in total factor income amounted to 7,2 per cent compared with a rate of increase of 7,1 per cent registered in 2012.
| | |
| Quarterly Bulletin March 2014 | | |


Measured over a year, growth in total compensation of employees decelerated from 8,7 per cent in the third quarter of 2013 to 8,5 per cent in the fourth quarter. This moderation in growth was mainly evident in salaries paid by the general government, and by the manufacturing sector where the payment of wages was affected by illegal strike action in several subsectors. Consequently, the ratio of total compensation of employees to total factor income decreased from 53,4 per cent in the third quarter of 2013 to 53,3 per cent in the fourth quarter. For the year 2013 as a whole, growth in compensation of employees amounted to 8,6 per cent, compared with a rate of 8,8 per cent recorded in 2012. By contrast, the average wage settlement rate as compiled by Andrew Levy Employment Publications increased from 7,6 per cent in 2012 to 7,9 per cent in 2013.
Year-on-year growth in the total gross operating surplus decelerated from 6,3 per cent in the third quarter of 2013 to 5,5 per cent in the fourth quarter as the agricultural and finance sectors performed weaker over the period. Growth in the aggregate gross operating surplus nevertheless accelerated from 5,4 per cent in 2012 to 5,7 per cent in 2013, while the share of the gross operating surplus in total factor income edged lower from 47,8 per cent to 47,1 per cent over the same period.
Gross saving
Gross saving as a percentage of gross domestic product (i.e., the national saving ratio) declined from 13,3 per cent in the third quarter of 2013 to 13,2 per cent in the fourth quarter. This could mainly be attributed to a deterioration in the saving performance of the household sector and the general government as the saving ratio by corporates remained stable. The foreign financing ratio, measuring South Africa’s dependency on foreign capital to finance gross capital formation, decreased marginally from 32,3 per cent in the third quarter of 2013 to 28 per cent in the fourth quarter.
Gross saving by the corporate sector relative to gross domestic product remained unchanged at 13,7 per cent in the third and fourth quarters of 2013. Measured over a year, dividend payments declined by 1,8��per cent in the fourth quarter of 2013 while corporate tax payments advanced at a brisk pace of 14,8 per cent.
The corporate saving ratio receded from 14,7 per cent in 2012 to 14,1 per cent in 2013 as tougher trading conditions gave rise to slower growth in operating surpluses and lower receipts from property income, while dividend and tax payments increased modestly over the period.
Gross dissaving by general government rose from 2,1 per cent of gross domestic product in the third quarter of 2013 to 2,2 per cent in the fourth quarter. Government income moderated on account of lower growth in value added tax alongside an increase in total government expenditure reflecting, inter alia, higher transfers to households and increased interest payments on public debt over the period. The rate of dissaving by general government nevertheless remained at 2,2 per cent in 2012 and 2013.
The gross saving rate of the household sector weakened from 1,7 per cent in the third quarter of 2013 to 1,6 per cent in the fourth quarter, as both household final consumption expenditure and disposable income of households increased at a slower pace over the period.
Employment
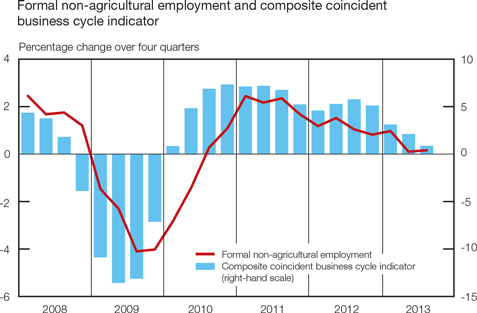
Consistent with the weakening in the growth momentum of the economy, the pace of increase in formal non-agricultural employment has stalled since the third quarter of 2012. This followed a period of ten quarters in which employment losses related to the recessionary conditions after the global financial crisis in 2008 were steadily recovered. Having increased slightly in the third quarter of 2013, the level of formal non-agricultural employment approximated that which existed immediately prior to the global financial crisis at around 8,45 million, according to Stats SA’s Quarterly Employment Statistics (QES) survey. Disappointingly, private-sector employment has not yet recovered to that level, having essentially remained stationary since the second quarter of 2012, unlike public-sector employment which increased apace in a contra-cyclical fashion.
| | |
| | | Quarterly Bulletin March 2014 |
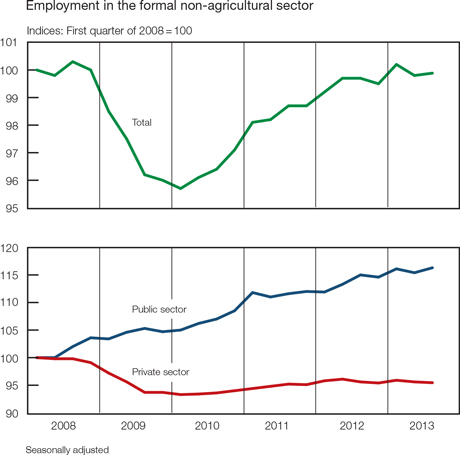
In fact, the public sector increased its staff complement by an annualised 3,1 per cent in the third quarter of 2013, reclaiming all the jobs lost in the preceding quarter. Employment increased at all public-sector tiers in the third quarter, with the largest increases registered by local governments and public-sector enterprises.
Conversely, private-sector employment decreased further at an annualised rate of 0,7 per cent in the third quarter of 2013. Similar to the previous quarter, job losses were again fairly pervasive throughout the private sector, occurring in the gold-mining sector (recording the highest rate of contraction at 22,2 per cent); the construction sector; the electricity sector; the finance, insurance, real-estate and business services sector; the manufacturing sector; the non-gold mining sector; and the private transport, storage and communication services sector. In the private sector employment creation took place in the community, social and personal services sector and in the trade, catering and accommodation services sector.
Entering its 52nd month in December 2013, the current upward phase in the South African business cycle appears to have lost some momentum. The accompanying graph shows the correlation between the year-on-year rate of change in the composite coincident business cycle indicator and that in formal non-agricultural employment. Following a sustained period of slowing output growth, exacerbated by numerous incidents of disruptive industrial action, formal non-agricultural employment growth has gradually lost momentum over the past two years. Over and above disappointing output and employment growth, the domestic industrial relations environment has dampened business and investor confidence in the South African economy. During the current upward phase in the business cycle, the RMB/BER Business Confidence Index breached the neutral level of 50 in only three of the seventeen quarters up to the fourth quarter of 2013 – an exceptionally low number for such a lengthy business-cycle expansion.
| | |
| Quarterly Bulletin March 2014 | | |


Change in enterprise-surveyed formal non-agricultural employment by sector*
| | | | | | | | | | | | | | | | | | | | | | | | |
| | | Change over
one quarter at
annualised rate
3rd qr 2013 | | | Change over four
quarters to
3rd qr 2013 | | | Cumulative job
losses (-) gains (+) | |
| Sector | | Number | | | Per
cent | | | Number | | | Per
cent | | | 4th qr
2008 to
1st qr 2010 | | | 2nd qr
2010 to
3rd qr 2013 | |
Finance, insurance, real-estate and business services | | | -6 500 | | | | -1,4 | | | | 10 600 | | | | 0,6 | | | | -163 400 | | | | 86 400 | |
Manufacturing | | | -2 500 | | | | -0,9 | | | | -5 000 | | | | -0,4 | | | | -118 300 | | | | -37 500 | |
Trade, catering and accommodation services | | | 7 300 | | | | 1,7 | | | | 7 300 | | | | 0,4 | | | | -75 700 | | | | 62 000 | |
Construction | | | -3 600 | | | | -3,3 | | | | -7 700 | | | | -1,8 | | | | -52 100 | | | | 7 200 | |
Total mining | | | -9 100 | | | | -6,9 | | | | -13 400 | | | | -2,6 | | | | -35 900 | | | | 8 600 | |
Gold mining | | | -8 200 | | | | -22,2 | | | | -15 400 | | | | 10,8 | | | | -8 900 | | | | -33 600 | |
Other mining | | | -900 | | | | -0,9 | | | | 2 000 | | | | 0,5 | | | | -27 000 | | | | 42 300 | |
Electricity | | | -200 | | | | -1,6 | | | | -600 | | | | -1,0 | | | | -3 300 | | | | 6 200 | |
Private transport, storage and communication services | | | -600 | | | | -0,9 | | | | -2 400 | | | | -0,9 | | | | -2 000 | | | | 700 | |
Community, social and personal services | | | 4 500 | | | | 4,3 | | | | 1 500 | | | | 0,3 | | | | 13 400 | | | | 12 700 | |
Private sector | | | -10 700 | | | | -0,7 | | | | -9 700 | | | | -0,2 | | | | -437 300 | | | | 146 300 | |
Provinces | | | 5 500 | | | | 2,0 | | | | 1 500 | | | | 0,1 | | | | 51 600 | | | | 91 900 | |
Local governments | | | 5 000 | | | | 7,5 | | | | 17 000 | | | | 6,5 | | | | 15 000 | | | | 37 800 | |
National departments | | | 900 | | | | 0,8 | | | | -5 700 | | | | -1,2 | | | | -800 | | | | 42 100 | |
Public transport, storage and communication services | | | 600 | | | | 2,1 | | | | 5 800 | | | | 5,1 | | | | -4 900 | | | | 15 800 | |
Other public-sector enterprises | | | 3 800 | | | | 11,1 | | | | 4 500 | | | | 3,2 | | | | -7 800 | | | | 16 600 | |
Total public sector | | | 15 800 | | | | 3,1 | | | | 23 000 | | | | 1,1 | | | | 53 100 | | | | 204 200 | |
Grand total | | | 5 100 | | | | 0,2 | | | | 13 300 | | | | 0,2 | | | | -384 200 | | | | 350 500 | |
| * | Seasonally adjusted. Components may not add up due to rounding |
| | |
| | | Quarterly Bulletin March 2014 |
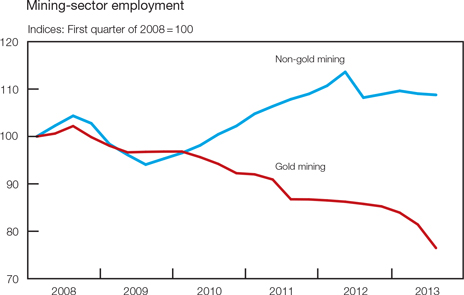
Employment in the mining sector decreased notably further in the third quarter of 2013, as job shedding in especially the gold-mining sector accelerated markedly. In addition, non-gold mining employment decreased for a second successive quarter in the third quarter of 2013. The industrial relations environment in the South African mining industry has changed dramatically since the Marikana tragedy in August 2012, subjecting the industry to high wage demands and intermittent bouts of disruptive industrial action in various subsectors. These labour tensions, coupled with relatively low global commodity prices, fairly sluggish demand for commodities and high domestic operating costs, adversely affected employment creation in the mining sector. In the five quarters up to the third quarter of 2013 the mining sector shed a cumulative 32 800 employment opportunities, lowering the total number of people formally employed in the mining sector to roughly 502 000. Employment prospects in the mining sector remain bleak, particularly considering the most recent widespread labour strike in the platinum-mining sector, which commenced late in January 2014.
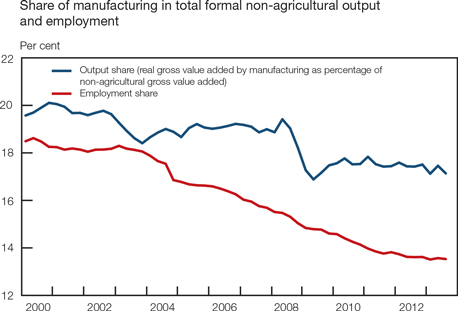
Following a marginal increase in employment in the second quarter of 2013, the manufacturing sector shed a further 2 500 jobs in the third quarter. In addition, the domestic automotive industry was subjected to lengthy and disruptive industrial action in the third and fourth quarters of 2013. The accompanying graph indicates the manufacturing sector’s share in the total formal non-agricultural economy in terms of employment and gross domestic product. Although the manufacturing sector’s share has declined in terms of both variables, the decline in the sector’s employment share has been more pronounced than that in output – probably reflecting the ongoing trend of labour-substituting mechanisation in the domestic manufacturing sector. Accordingly, the Manufacturing Survey of the Bureau for Economic Research (BER) for the fourth quarter of 2013 noted that while employment indicators remained fairly weak, the fixed investment indicator had risen to its highest level since the first quarter of 2012 despite indications that a large majority of manufacturers were not utilising their production capacity to the full. According to the BER, considering the lacklustre employment prospects in the manufacturing sector, this planned new investment is probably aimed at replacing existing capacity, evident in the net majority of respondents expecting an increase in real investment in machinery and equipment in 12 months’ time increasing notably from the third quarter to the fourth quarter of 2013. In general, the BER survey results for the fourth quarter of 2013 were fairly positive, with exporters in particular indicating improved sales volumes on account of a pick-up in global demand for manufactured goods and improved competitiveness associated with the depreciation in the exchange value of the rand.
| | |
| Quarterly Bulletin March 2014 | | |


Employment levels in the electricity-generating sector decreased in the third quarter of 2013, following notable employment gains in the second quarter. Despite the partial integration of independent power producers into the national electricity grid, South Africa’s electricity supply seems likely to remain fairly constrained until the end of 2014, when the first unit of the new Medupi power station is expected to become operational. Whereas electricity-supply constraints could continue to hamper output and employment growth in the electricity-intensive sectors of the domestic economy, the ongoing programme to expand electricity-generating capacity bodes well for employment creation in the electricity sector.
Employment in the finance, insurance, real-estate and business services sector decreased for a second successive quarter in the third quarter of 2013, with the pace of labour paring accelerating to an annualised rate of 1,4 per cent. Similarly, employment in the construction sector decreased for a third consecutive quarter in the third quarter of 2013, with the pace of job shedding accelerating in each successive quarter. Around 8 000 formal construction jobs were lost in the first three quarters of 2013. Encouragingly, however, the FNB/BER Civil Confidence Index increased by a further 15 index points to 66 in the fourth quarter of 2013 – its highest level since the third quarter of 2008. The increase in confidence resulted from a rise in construction activity and a concomitant moderation in tendering competition. Profitability improved only modestly, while the pace of employment losses moderated. In addition, civil contractors expect the improvement in activity and profitability to continue in the first quarter of 2014.
Employment in the trade, catering and accommodation services sector increased at an annualised rate of 1,7 per cent in the third quarter of 2013, lifting employment to a level only slightly higher than that in the same period in the preceding year. Despite a disappointing decline in retail business confidence, the Retail Survey of the BER for the fourth quarter of 2013 showed a notable improvement in employment in that quarter. However, a meaningful acceleration in retail sales growth is not expected, while new vehicle sales contracted in the fourth quarter of 2013. Encouragingly, the depreciation in the exchange rate of the rand appears to have provided a fillip to the tourism industry, which should support employment creation in the sector.
According to the Quarterly Labour Force Survey (QLFS) conducted by Stats SA, the number of persons employed in South Africa increased by 653 000 in the year to the fourth quarter of 2013, representing a year-on-year growth rate in total employment of 4,5 per cent. In February 2014, Stats SA updated the QLFS results for the full sample period – 2008 to 2013 – to reflect the new population benchmarks obtained from Census 2011. This resulted in the total number of people employed being revised upwards over the full sample period, bringing the total level of employment to almost 15,2 million in the fourth quarter of 2013. The bulk of the employment opportunities that were created in the year to the fourth quarter of 2013 were created in the
| | |
| | | Quarterly Bulletin March 2014 |
formal non-agricultural sectors of the economy, particularly in community and social services, trade, finance and other business services, transport and communication, and construction. In addition, 95 000 informal employment opportunities were created over the same period. The number of unemployed persons increased by 121 000 in the year to the fourth quarter of 2013, reducing the official unemployment rate in the South African economy to 24,1 per cent from 24,5 per cent a year earlier. (It was also 24,5 per cent in the third quarter of 2013.) The number of discouraged work-seekers, which registered a notable contraction of 128 000 in the third quarter of 2013, decreased by a further 97 000 in the fourth quarter of 2013. Encouragingly, youth unemployment receded for a third successive quarter in the fourth quarter of 2013, falling from 53,3 per cent in the first quarter of 2013 to 48,9 per cent in the fourth quarter.
Labour market statistics
Thousands
| | | | | | | | | | | | | | | | | | | | |
| | | Dec 2012 | | | Mar 2013 | | | Jun 2013 | | | Sep 2013 | | | Dec 2013 | |
a. Total employment | | | 14 524 | | | | 14 558 | | | | 14 692 | | | | 15 036 | | | | 15 177 | |
b. Total unemployment (official definition) | | | 4 709 | | | | 4 862 | | | | 4 972 | | | | 4 880 | | | | 4 830 | |
c. Total economically active (= a + b) | | | 19 233 | | | | 19 420 | | | | 19 663 | | | | 19 916 | | | | 20 007 | |
d. Total not economically active | | | 15 172 | | | | 15 138 | | | | 14 049 | | | | 14 952 | | | | 15 015 | |
e. Total aged 15–65 years (= c + d) | | | 34 405 | | | | 34 558 | | | | 34 712 | | | | 34 868 | | | | 35 022 | |
f. Official unemployment rate (= b*100/c) | | | 24,5 | % | | | 25,0 | % | | | 25,3 | % | | | 24,5 | % | | | 24,1 | % |
Source: Statistics South Africa, Quarterly Labour Force Survey
Box 1: Seasonally adjusting the official unemployment rate
Economic time series are often subject to seasonal fluctuations and other calendar effects, such as the number of trading days, weekends and public holidays in a month or quarter. These seasonal and calendar effects often mask the underlying movements in an economic time series, possibly resulting in an erroneous interpretation and analysis of the particular economic indicator. The aim of seasonal adjustment1 is to filter out seasonal and calendar effects that occur repeatedly in the same season and with similar intensity on an annual basis in an economic time series, thereby facilitating more accurate economic analysis of the time series. At the same time it is inappropriate to make any seasonal or calendar adjustment to a time series in the absence of clear statistical evidence and economic interpretation of the effect.
The unemployment rate is an extremely important macroeconomic indicator, particularly in the South African context, given government’s overarching policy objective of eradicating unemployment, inequality and poverty. The official South African unemployment rate has been available on a quarterly basis since the first quarter of 20082 and is calculated as the ratio of those persons who are classified as being unemployed to the total economically active population, expressed as a percentage. The calculation is depicted in the formulas below.
| | |
Employed + Unemployed = Economically Active Population Unemployment Rate = (Unemployed / Economically Active Population) * 100 | | |
In seasonally adjusting the official unemployment rate, the Bank employed the indirect method of seasonal adjustment, since the components comprising the total economically active population (i.e., employed and unemployed persons) could exhibit different seasonal patterns. Thus the two time series – the number of unemployed and employed persons – were tested separately for seasonality.3 Where seasonality was found to be present it was adjusted for, and the seasonally adjusted component time series were then used to calculate the seasonally adjusted unemployment rate, according to the formula above.
| 1 | According to the European Statistical System Guidelines on Seasonal Adjustment (2009 edition by Eurostat, European Commission), seasonal adjustment also includes the adjustment for calendar effects, such as the number of working days or trading days in a month, or particular dates that can statistically be shown to make a difference in the data, such as public holidays, or the number of weekends in a month. |
| 2 | Published by Statistics South Africa in the Quarterly Labour Force Survey. |
| 3 | Seasonal adjustment was done using the X12-ARIMA approach (supported by the Bureau of Census in the United States). |
| | |
| Quarterly Bulletin March 2014 | | |


Figure 1 shows that the number of unemployed persons usually decreases notably in the fourth quarter of each year and subsequently increases markedly in every first quarter. This can largely be explained by the temporary employment of casual workers in the trade, catering and accommodation services sector in the fourth quarter of each year. In addition to these temporary employees then becoming unemployed again in the first quarter of the following year, the large number of school leavers becoming economically active contributes further to the increase in the number of unemployed persons in the first quarter of each year.
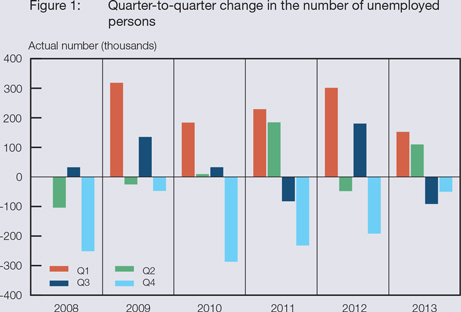
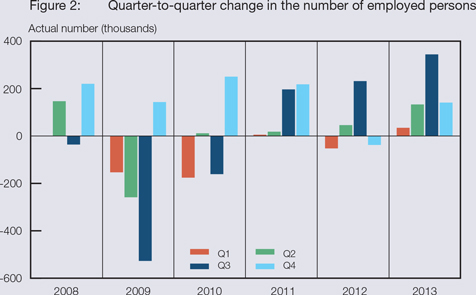
Figure 2 depicts the quarter-to-quarter change in the number of employed persons. The increase in employment in the fourth quarter of each year and the subsequent decrease in the first quarter of each year are neither as pronounced nor as consistent as that observed in the number of unemployed persons in Figure 1. As such, the statistical results show that the time series measuring the number of unemployed persons is influenced by seasonality, while the time series measuring the number of employed persons is not.
| | |
| | | Quarterly Bulletin March 2014 |
Individual tests for seasonality indicated significant seasonality in the time series measuring the number of unemployed persons at the 1 per cent confidence level for the Friedman test, the Kruskal-Wallis test, as well as the test for the presence of seasonality assuming stability. However, due to the relatively short data span the Evolutive seasonality test revealed no evidence of a change in the seasonal pattern over time, resulting in the combined test for significant seasonality to be inconclusive. As more data become available the combined test for significant seasonality should become more reliable and conclusive. However, due to the statistical evidence indicating a stable seasonal pattern, it seems prudent to seasonally adjust the time series measuring the number of unemployed persons.
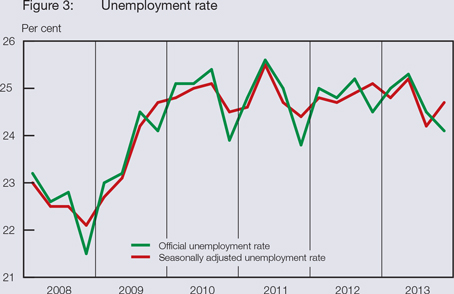
The seasonally adjusted unemployment rate was obtained by substituting the non-seasonally adjusted time series measuring the number of unemployed persons by its seasonally adjusted version in the formula calculating the unemployment rate. The seasonally adjusted unemployment rate is shown in Figure 3, together with the official unemployment rate. The seasonally adjusted unemployment rate is consistently lower than the official unemployment rate in the first quarter of each year, while it is consistently higher than the official unemployment rate in the fourth quarter of each year, thereby reducing the overall volatility in the indicator and providing a more steady measure of the domestic unemployment rate. Henceforth, both the official and the seasonally adjusted unemployment rate will be included in table KB814 on page S–154 of the Quarterly Bulletin. As with all seasonally adjusted data, the seasonally adjusted unemployment rate is subject to revision as further observations are added to the time series.
According to the latest Global Employment Trends 2014 Report of the International Labour Organization (ILO), labour markets have been adversely affected by the slower-than-expected global economic recovery. Employment growth slowed in 2013 across most regions, leading to a further increase in unemployment rates. Global employment rose by only 1,4 per cent in 2013 – broadly unchanged from the pace of increase in 2012 – but slower than in any year during the pre-crisis decade. The report further states that employment growth deteriorated in every geographic region except in South Asia and North Africa. The global unemployment rate remained unchanged at 6,0 per cent in 2013, compared with the preceding year. The number of unemployed persons around the world is estimated to have reached 202 million in 2013, an increase of 5 million from a revised 197 million in the previous year. The labour market outlook for young people worsened in nearly every region of the world. Globally the youth unemployment rate rose to 13,1 per cent in 2013, up from 12,9 per cent in 2012 and 11,6 per cent in 2007.
| | |
| Quarterly Bulletin March 2014 | | |


Labour cost and productivity
The pace of increase in total nominal salaries and wages per worker moderated notably from a year-on-year rate of 8,8 per cent in the second quarter of 2013 to 6,6 per cent in the third quarter due to a marked deceleration in public-sector wage growth. Consequently, growth in the real take-home pay of those formally employed in the non-agricultural sector of the economy decelerated from 2,7 per cent in the year to the second quarter of 2013 to 0,6 per cent in the year to the third quarter. Public-sector wages per worker increased at a rate of 3,1 per cent in the year to the third quarter of 2013, notably slower than the rate of increase of 11,7 per cent recorded in the year to the second quarter. The deceleration resulted mainly from the high remuneration base created in the third quarter of 2012, when civil servants at national departments and provinces received a backdated salary increase.
By contrast, the pace of increase in private-sector salaries and wages per worker accelerated continually during 2013, amounting to a year-on-year rate of 7,3 per cent in the second quarter and 8,1 per cent in the third quarter. Remuneration growth varied widely within the different private subsectors in the third quarter of 2013, with the gold-mining sector (14,6 per cent) and the trade, catering and accommodation services sector (12,4 per cent) recording double-digit year-on-year increases, while the lowest increases were recorded in the electricity sector (1,8 per cent) and the construction sector (5,2 per cent). Other subsectors where remuneration increases were higher than the 6 per cent upper limit of the inflation targeting band were the private community, social and personal services sector (6,6 per cent); the finance, insurance, real-estate and business services sector (6,8 per cent); the non-gold mining sector (6,8 per cent); the private transport, storage and communication services sector (7,1 per cent) and the manufacturing sector (8,3 per cent).
According to Andrew Levy Employment Publications, the overall average wage settlement rate in collective bargaining agreements amounted to 7,9 per cent in 2013, marginally above the average settlement rate of 7,6 per cent recorded in 2012. The number of workdays lost due to industrial action rose from 3,5 million in 2012 to 5,2 million in 2013, largely due to the conclusion of a number of multi-year wage negotiations resulting in increased labour unrest in various economic sectors. Workdays lost peaked at 2,9 million in the third quarter of 2013.
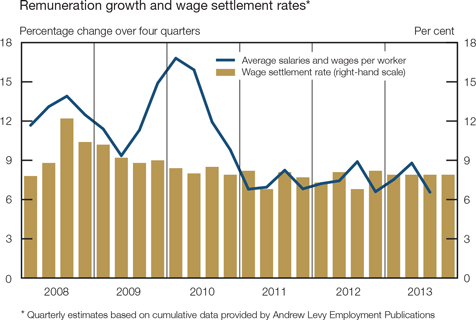
Year-on-year growth in total non-agricultural employment accelerated marginally, while that in real output decelerated in the third quarter of 2013, resulting in a moderation in productivity growth from 1,8 per cent in the second quarter of 2013 to 1,6 per cent in the third quarter. Similarly, productivity growth in the manufacturing sector decelerated from 2,6 per cent in the year to the second quarter of 2013 to 1,3 per cent in the year to the third quarter.
| | |
| | | Quarterly Bulletin March 2014 |
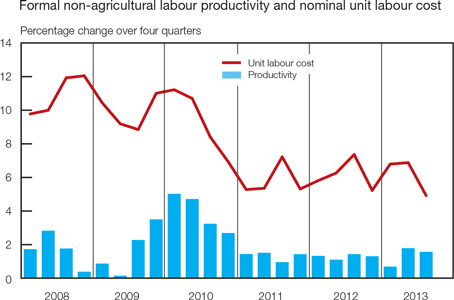
Nominal remuneration growth per worker in the formal non-agricultural sector of the economy decelerated at a faster pace than output growth, resulting in a notable slowdown in year-on-year nominal unit labour cost inflation from 6,9 per cent in the second quarter of 2013 to 4,9 per cent in the third quarter. However, the marked deceleration in public-sector remuneration growth, largely due to base effects, assisted this moderation in unit labour cost inflation. When assessing unit labour cost developments by applying the broader national accounts measure of compensation of employees per unit of output,2 the year-on-year rate of increase in unit labour cost decelerated less sharply from 7,7 per cent in the second quarter of 2013 to 6,9 per cent in the third quarter. These values still exceeded the upper limit of the inflation target range.
Prices
Within an environment of slowing output growth in 2013, the annual average headline consumer price inflation rate in South Africa remained contained within the inflation target range at 5,7 per cent, having accelerated only marginally compared with the preceding year. Having slightly exceeded the inflation target range in July and August 2013, headline inflation moderated to 5,4 per cent in December, before quickening to 5,8 per cent in January 2014.3 Recent movements in consumer price inflation can largely be ascribed to fluctuations in food and petrol prices, with underlying inflationary pressures remaining fairly stable. Key barometers of underlying inflation remained significantly below the upper limit of the inflation target range of 3 to 6 per cent, despite the protracted depreciation in the exchange rate of the rand.
The inflationary impact of the lower exchange value of the rand has thus far been more visible in domestic producer price inflation than in consumer price inflation. Producer price inflation for final manufactured goods accelerated to 7,0 per cent in January 2014, with price inflation remaining elevated in most subcategories of final manufactured goods. Disconcertingly, producer price inflation for intermediate manufactured goods almost doubled from 5,8 per cent in January 2013 to 11,1 per cent in August, before decelerating somewhat to 7,5 per cent in November. Producer price inflation for intermediate manufactured goods subsequently quickened to 9,3 per cent in January 2014. Inflationary pressures were prevalent throughout most subcategories of intermediate manufactured goods, with the prices of textiles and leather goods, chemicals, rubber products, glass products, and basic iron and steel products all registering double-digit rates of increase over the twelve months to January 2014. These price pressures do not augur well for inflation in the prices of final manufactured goods in coming months.
Most measures of producer price inflation accelerated in the closing months of 2013. Producer price inflation for mining products quickened from -0,2 per cent in October 2013 to 4,8 per cent in January 2014, while producer price inflation for agriculture, forestry and fishing products
| | |
| Quarterly Bulletin March 2014 | | |


accelerated from 1,8 per cent to 5,6 per cent over the same period. Of note is the fact that producer price inflation for fishing products accelerated briskly throughout 2013, amounting to 22,3 per cent in January 2014. Producer price inflation for electricity and water accelerated markedly and came to 14,5 per cent in January 2014, mainly on account of increases in the price of electricity.
Price inflation for imported commodities remained fairly elevated in recent months mainly due to the downward trend in the exchange value of the rand, but moderated from 9,7 per cent in October 2013 to 7,0 per cent in December. Partly driven by crude oil, price inflation of imported mining commodities in particular remained high, amounting to 20,3 per cent in October 2013 before slowing to 13,3 per cent in December. Conversely, price inflation of imported manufactured products remained fairly stable and well contained at around 2,8 per cent in the second half of 2013.
Recent movements in headline consumer price inflation resulted largely from changes in consumer goods price inflation, in turn driven almost exclusively by changes in non-durable goods price inflation. Consumer goods price inflation accelerated to 6,5 per cent in August 2013, before moderating to 4,6 per cent in November. Similarly, non-durable goods price inflation quickened to 8,9 per cent before slowing to 5,4 per cent over the same period, largely due to movements in petrol and food prices. Subsequently, consumer goods price inflation accelerated somewhat to 5,7 per cent in January 2014, as petrol price inflation in particular quickened notably.
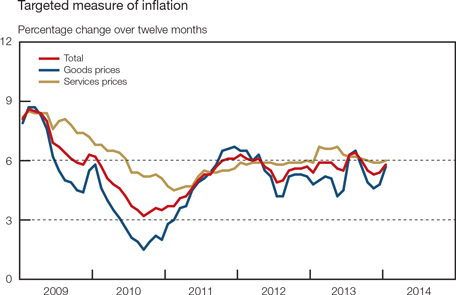
Despite the prolonged yet until recently fairly gradual depreciation in the exchange rate of the rand, little pass-through to consumer goods price inflation has thus far been observed. As such, semi-durable goods price inflation has remained fairly stable around the 3 per cent level throughout 2013, accelerating only marginally from 2,9 per cent in October to 3,8 per cent in January 2014. Following a prolonged period of deflation, durable goods price inflation accelerated gradually from a recent low of -0,8 per cent in February 2013 to 2,4 per cent in January 2014, largely due to an acceleration in new motor vehicle price inflation from 2,3 per cent to 5,8 per cent over the same period. However, the depreciation in the exchange rate of the rand became more pronounced in January 2014, suggesting an increased risk of accelerating domestic consumer goods price inflation in coming months.
The limited pass-through from the depreciation in the exchange rate of the rand to domestic inflation was probably related to a range of factors, including:
| • | | surplus capacity in the economy leading to stronger competition among producers; |
| | |
| | | Quarterly Bulletin March 2014 |
| • | | tight consumer budgets and conservatism among lenders and borrowers alike about the use and extension of credit; |
| • | | the length of the supply chain, inventory buffers and the use of instruments to hedge against exchange rate movements; |
| • | | continued inroads into the South African market by imports from the lowest-cost countries; |
| • | | technological advances lowering the real prices of a range of products such as telecommunication equipment and computers; and |
| • | | benign inflation expectations shaped by the generally successful inflation outcomes under inflation targeting. |
Consumer services price inflation slowed gradually from 6,7 per cent in May 2013 to 6,0 per cent in January 2014, reflecting a marked moderation in transport services price inflation and to a lesser extent a slower pace of increase in the prices of recreation and culture services. In the closing months of 2013 miscellaneous services price inflation also decelerated somewhat on account of a slowdown in funeral services price inflation. Conversely, housing and utilities service price inflation accelerated marginally from 4,9 per cent in October 2013 to 5,2 per cent in January 2014, as house rental price inflation picked up in the final quarter of the year.
Domestic food price pressures diminished somewhat in the closing months of 2013, following record international maize crops and relatively low domestic meat prices. As such, final manufactured producer food price inflation decelerated from 7,5 per cent in July 2013 to 5,2 per cent in November, before quickening to 6,7 per cent in January 2014. The moderation in final manufactured producer food price inflation resulted largely from a slower rate of increase in the price of meat, grain mill products, starch products and bakery products. Consequently, final manufactured producer food price inflation decelerated from an annual average rate of 8,4 per cent in 2012 to 6,4 per cent in 2013.
Final manufactured producer food prices
Annual average percentage change
| | | | | | | | |
| | | Weights | | | 2013 | |
Meat and meat products | | | 3,69 | | | | 5,5 | |
Fish and fish products | | | 1,49 | | | | 10,7 | |
Fruit and vegetables | | | 2,66 | | | | 3,7 | |
Oils and fats | | | 0,32 | | | | 8,1 | |
Dairy products | | | 2,81 | | | | 7,3 | |
Grain mill products | | | 2,13 | | | | 3,9 | |
Starch products | | | 1,32 | | | | 7,8 | |
Bakery products | | | 6,12 | | | | 10,8 | |
Sugar | | | 1,79 | | | | -0,3 | |
Other food products | | | 1,67 | | | | -0,5 | |
All items | | | 24,00 | | | | 6,4 | |
Despite agricultural producer price inflation remaining relatively muted throughout 2013, the prices of various agricultural products fluctuated markedly. Price inflation of cereals and other crops initially decelerated from 10,4 per cent in May 2013 to -8,2 per cent in August, but thereafter accelerated markedly to 24,4 per cent in January 2014 as domestic maize prices increased on account of drought conditions in the North West Province. Conversely, producer prices of live animals decreased throughout 2013, with the rate of deflation accelerating from 2,2 per cent in October 2013 to 5,4 per cent in December, as an increased number of animals were slaughtered following the drought conditions in North West, the Northern Cape, Botswana and Namibia.
| | |
| Quarterly Bulletin March 2014 | | |


Consumer food prices
Annual average percentage change
| | | | | | | | | | | | |
| | | Weights | | | 2012 | | | 2013 | |
Bread and cereals | | | 3,55 | | | | 8,4 | | | | 6,2 | |
Meat | | | 4,56 | | | | 7,6 | | | | 3,3 | |
Fish | | | 0,37 | | | | 8,9 | | | | 6,5 | |
Milk, cheese and eggs | | | 1,74 | | | | 7,9 | | | | 7,6 | |
Oils and fats | | | 0,55 | | | | 6,7 | | | | 4,4 | |
Fruit | | | 0,23 | | | | 4,6 | | | | 3,5 | |
Vegetables | | | 1,61 | | | | 4,2 | | | | 10,9 | |
Sugar, sweets and desserts | | | 0,65 | | | | 9,8 | | | | 6,9 | |
Other foods | | | 0,94 | | | | 7,7 | | | | 6,5 | |
All items | | | 14,20 | | | | 7,4 | | | | 5,9 | |
Subsequent to the slowdown in producer food price inflation, consumer food price inflation moderated from a recent high of 7,4 per cent in August 2013 to 3,5 per cent in December, with the deceleration fairly widely dispersed among the subcategories of the consumer food price basket. Nevertheless, the moderation in unprocessed consumer food price inflation was much more pronounced than that in processed consumer food price inflation in the closing months of 2013: unprocessed food price inflation slowed from 6,6 per cent in August 2013 to 1,2 per cent in December, while processed food price inflation moderated less meaningfully from 8,2 per cent to 5,9 per cent over the same period, arguably driven by additional cost pressures from items such as electricity, packaging expenses and transportation. Average annual consumer food price inflation consequently decelerated from 7,4 per cent in 2012 to 5,9 per cent in 2013, moderating in eight of the nine consumer food price categories and only accelerating in the vegetables category. More recently, consumer food price inflation accelerated to 4,3 per cent in January 2014.
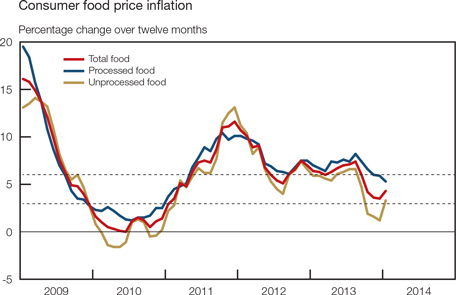
International food prices decreased marginally in 2013, with the United Nations’ Food and Agriculture Organization (FAO) international food price index (denominated in US dollar) declining at an annual average rate of 1,6 per cent in 2013. The decline in this index was largely driven by a sharp decline in the international cereals price subindex which, on an annual average basis,
| | |
| | | Quarterly Bulletin March 2014 |
decreased by 7,2 per cent in 2013 on account of surplus global supplies following record wheat and maize harvests in the year. Encouragingly, international cereals prices declined notably in the closing months of 2013, registering a year-on-year rate of decrease of 23,1 per cent in December which, before allowing for exchange rate movements, implies muted international food price pressure on domestic food price inflation in the months ahead.
Underlying inflation pressures remained largely unchanged in recent months, with most measures of underlying inflation converging to a level slightly below 5,5 per cent. Excluding the impact of the more volatile prices of food, non-alcoholic beverages and petrol from the calculation of targeted headline consumer price inflation, underlying inflation remained unchanged at 5,4 per cent for six consecutive months up to January 2014; on an annual average basis this rate accelerated marginally from 4,9 per cent in 2012 to 5,3 per cent in 2013. Similarly, when also excluding the impact of electricity prices from the calculation, underlying consumer price inflation remained unchanged at 5,3 per cent for five consecutive months up to January 2014. The annual average rate of increase in this measure of underlying inflation also accelerated from 4,6 per cent in 2012 to 5,2 per cent in 2013. Conversely, the trimmed mean measure of underlying inflation moderated marginally from 5,4 per cent in August 2013 to 5,2 per cent in December, before accelerating to 5,6 per cent in January 2014, but remained virtually unchanged on an annual average basis, accelerating from 4,8 per cent in 2012 to 4,9 per cent in 2013.
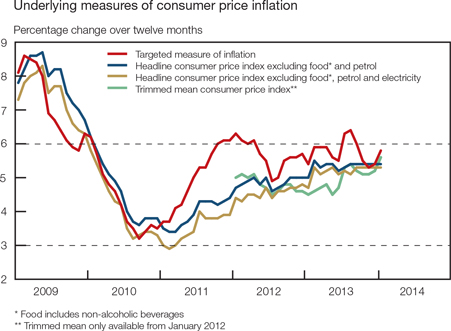
An analysis of price changes based on the classification of individual consumption by purpose (COICOP) categories confirms the relative containment of underlying inflationary pressures in the economy in 2013. The annual average rate of increase in five of the twelve categories exceeded the upper limit of the inflation target range of 6 per cent in 2013, compared with six categories in 2012. Six categories recorded price increases which fell between 3 and 6 per cent in 2013 compared with three categories in 2012, while only one category registered a rate of increase below the lower limit of 3 per cent of the inflation target range in 2013 compared with three categories the previous year. The accompanying graph shows the percentage contribution of the various COICOP categories to the annual average headline consumer price inflation rate in 2012 and 2013. Despite the contribution of the housing and utilities category decreasing somewhat, it was nevertheless responsible for almost a quarter of the 5,7 per cent annual average headline consumer price inflation rate in 2013. Of note is the contribution of four of the twelve categories, namely housing and utilities, miscellaneous goods and services (largely health insurance services), transport, and food and non-alcoholic beverages, which together amounted to roughly 75 per cent of the annual average inflation rate in 2012 and 2013.
| | |
| Quarterly Bulletin March 2014 | | |


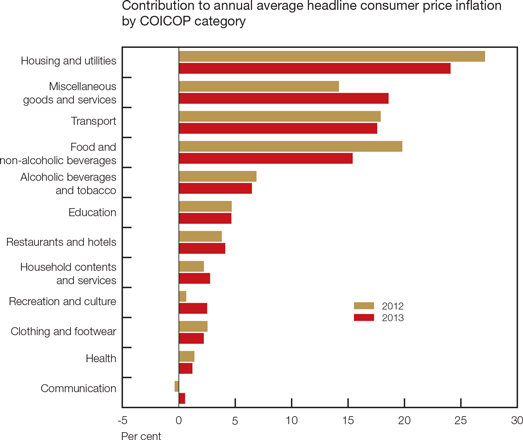
Recent movements in administered price inflation can largely be attributed to movements in domestic petrol prices. An increase in international crude oil prices alongside the continued depreciation in the exchange rate of the rand resulted in petrol price inflation accelerating markedly to 23,0 per cent in August 2013, lifting overall administered price inflation to 11,1 per cent in that month. Administered price inflation thereafter moderated to 7,3 per cent in November 2013, as petrol price inflation slowed to 7,7 per cent over the same period. More recently, administered price inflation quickened to 9,3 per cent in January 2014 on account of an acceleration in petrol price inflation following the further depreciation in the exchange value of the rand.
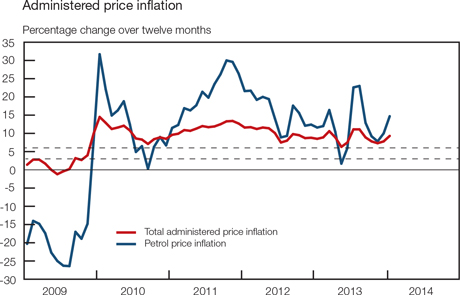
| | |
| | | Quarterly Bulletin March 2014 |
Excluding the effect of petrol prices from the calculation of administered prices, this rate of increase accelerated to 8,1 per cent in June 2013, before moderating to 6,9 per cent in January 2014. Similarly, when also excluding electricity prices from the above-mentioned calculation, administered price inflation accelerated to 8,5 per cent in June 2013, before slowing to 6,9 per cent in January 2014. Most categories within the administered prices basket continued to register rates of increase well above the upper limit of the inflation target range in January 2014.
Average inflation expectations for 2013, as reflected in the Inflation Expectations Survey conducted by the BER in the fourth quarter of 2013, remained almost unchanged compared with those of the previous quarter and remained anchored around the upper limit of the inflation target range of 3 to 6 per cent. Inflation was expected to average 6,0 per cent in 2013, before rising marginally to 6,1 per cent in both 2014 and 2015. However, financial analysts expect inflation to moderate in 2014 and in 2015, while business representatives and trade union officials expect inflation to accelerate in both years. Disconcertingly, while the five-year inflation expectations of financial analysts and business people remained at 5,5 per cent and 6,6 per cent respectively, those of trade union representatives increased from 6,2 per cent to 6,6 per cent in the latest survey. In addition, after gradually declining from 7,2 per cent in the fourth quarter of 2012 to 6,5 per cent in the third quarter of 2013, household inflation expectations for the next twelve months jumped to 6,9 per cent in the fourth quarter of 2013. The increase in inflation expectations of households occurred almost uniformly across race, income and age categories.
Headline consumer price inflation expectations
Per cent, as surveyed in the fourth quarter of 2013
| | | | | | | | | | | | | | | | |
| Average inflation expected for: | | Financial
analysts | | | Business
representatives | | | Trade union
representatives | | | All surveyed
participants | |
2013 | | | 5,9 | | | | 6,2 | | | | 6,0 | | | | 6,0 | |
2014 | | | 5,6 | | | | 6,4 | | | | 6,1 | | | | 6,1 | |
2015 | | | 5,5 | | | | 6,5 | | | | 6,4 | | | | 6,1 | |
Source: Bureau for Economic Research, Stellenbosch University
| | |
| Quarterly Bulletin March 2014 | | |


Foreign trade and payments
International economic developments
After peaking at 4,0 per cent in the third quarter of 2013, global economic growth moderated to an annualised rate of 3,5 per cent in the final quarter, brought about by slower growth in several emerging Asian and European countries. Although monetary policies continued to be stimulatory, economic growth in advanced economies nevertheless moderated from 2,5 per cent in the third quarter of 2013 to 2,2 per cent in the fourth quarter.
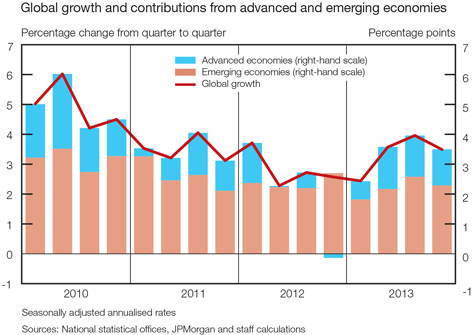
According to the International Monetary Fund’s January 2014 World Economic Outlook Update, global growth is expected to average 3,7 per cent in 2014 based on the improved outlook for growth in advanced economies – a meaningful improvement on the estimated annual growth rate of 3,0 per cent recorded in 2013. More than 70 per cent of the increment in global economic output is nevertheless anticipated to originate in emerging economies, which are forecast to grow at a rate of 5,1 per cent in 2014, compared with a rate of increase of 2,2 per cent in advanced economies.
The economic recovery in the US moderated in the fourth quarter of 2013, with annualised real growth slowing to 2,4 per cent, from 4,1 per cent in the previous quarter. The increase in real output primarily reflected positive contributions from household consumption expenditure, exports and non-residential fixed investment. The unemployment rate improved notably, declining to 6,7 per cent in December 2013 and 6,6 per cent in January 2014, even though non-farm payroll statistics suggest that only 74 000 new jobs were created in December and 131 000 in January – significantly fewer than the roughly 200 000 jobs that were added, on average, per month between August and November 2013. The US Federal Reserve has nevertheless interpreted the data as sufficient to justify the tapering of its quantitative easing programme, with its monthly asset purchases declining from US$85 billion to US$75 billion in January 2014 and US$65 billion in February. Meanwhile, the outlook for US fiscal policy improved significantly with the passage of the Federal budget in January and the suspension of the debt limit for one year in February.
| | |
| | | Quarterly Bulletin March 2014 |
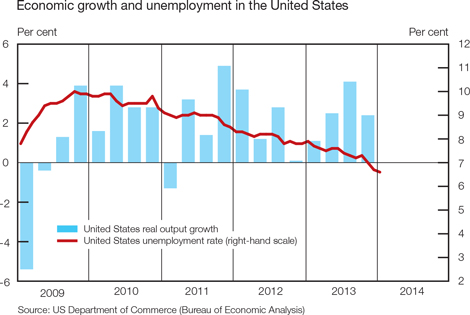
Real value added in the euro area rose at an annualised rate of 1,1 per cent in the fourth quarter of 2013, above the rate of increase of 0,5 per cent recorded in the preceding quarter. Despite a pick-up in economic activity towards the end of the year, real production in the euro area still contracted in calendar 2013 as a whole. Consumer price inflation remained well below the 2 per cent target of the ECB, decelerating to 0,8 per cent in February 2013. The ECB lowered its inflation forecast for 2014 from 1,3 per cent to 1,1 per cent with the Governing Council of the ECB reducing interest rates from 0,5 per cent to 0,25 per cent in November 2013 and also maintaining its forward guidance, indicating that it would not raise interest rates for a protracted period of time.
The United Kingdom showed a robust economic recovery in 2013, registering growth of 2,9 per cent in the fourth quarter, following an increase of 3,4 per cent in the previous quarter. The largest contribution to fourth-quarter growth came from gross fixed capital formation and exports. British labour market conditions improved towards the end of 2013, with the overall unemployment rate falling to 7,1 per cent in November, before edging up to 7,2 per cent in December. Headline consumer price inflation moderated to 1,9 per cent in January 2014, the slowest pace of increase since November 2009.
The Japanese economy grew at a slower-than-expected rate of 1 per cent in the final quarter of 2013, broadly unchanged from the increase of 1,1 per cent registered in the third quarter. Pre-emptive buying due to an increase in consumption tax that will come into effect in April 2014 may possibly lead to a temporary acceleration in the first quarter. Consumer price inflation continued to accelerate, reaching a year-on-year rate of 1,6 per cent in December 2013 – a substantial turnaround from deflation recorded in the first half of 2013. It furthermore provides some evidence of the success of the Bank of Japan’s policy of expanding its monetary base in order to achieve a 2 per cent inflation target. Although these measures have resulted in some yen depreciation, it is important to note that Japan recorded current-account deficits in the final months of 2013, an unusual feature for what has typically been a surplus economy. The changes in the balance on the current account, however, stemmed in particular from a higher value of energy imports brought about by a switch from nuclear power to fossil fuels.
Real output growth in emerging economies moderated in the fourth quarter of 2013, mainly due to slower growth in emerging and developing Asia and – to a lesser extent – emerging Europe. Growth in China moderated from 9,2 per cent in the third quarter of 2013 to 8,0 per cent in the fourth quarter. In November 2013, the Chinese government announced a series of major reforms designed to increase the influence of market forces in the economy, clamping down on credit
| | |
| Quarterly Bulletin March 2014 | | |


growth, closing factories in industries plagued by overcapacity and addressing local government debt. Real output growth in India weakened to 5,7 per cent in the fourth quarter of 2013, down from an increase of 6,3 per cent in the previous quarter. Consumer price inflation remained elevated at 8,8 per cent in January 2014. In January 2014, the Reserve Bank of India released a reform proposal advocating the adoption of a consumer price inflation target of 4 per cent, plus or minus 2 per cent.
Several emerging markets with large current-account deficits recently experienced large currency depreciations and heightened inflation. Consumer inflation in Brazil remained elevated at just below 6 per cent, exceeding the 4,5 per cent midpoint of the inflation target despite a series of steep interest rate increases which have lifted the policy rate from 7,25 per cent to 10,75 per cent since April 2013. In January 2014, price inflation in Indonesia amounted to 8,2 per cent – well above the inflation target of 4,5 per cent plus or minus one percentage point. Turkey’s consumer price inflation accelerated to 7,8 per cent in January 2014, also exceeding the 5 per cent inflation target. The Central Bank of the Republic of Turkey, after having attempted to conduct monetary policy through the adjustment of multiple interest rates, adopted a more orthodox approach in January 2014 by reviving the main policy rate and raising it to 10 per cent, up from 4,5 per cent.
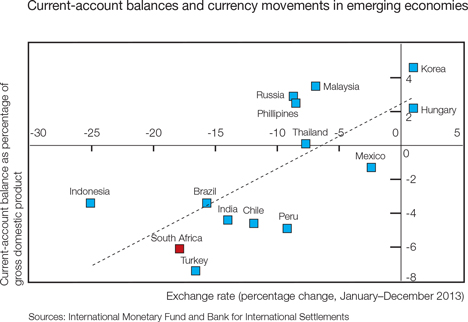
World trade volumes grew at an annualised rate of 7,1 per cent in the fourth quarter of 2013, significantly faster than the pace of increase of 4,7 per cent in the preceding quarter. The increase in trade stemmed primarily from higher exports from emerging economies, while exports of advanced economies remained stable over the period.
The price of Brent crude oil remained fairly stable around US$110 per barrel in the fourth quarter of 2013, except for a short period in early November when it fell to US$103 per barrel on news of reduced geopolitical risk and expected increase in stockpiles. Crude oil prices, however, increased to around US$110 per barrel towards the end of February 2014, underpinned by rising Chinese crude oil imports, cold US weather and geopolitical tensions. At the end of February Brent crude oil future contracts for delivery in the second and third quarters of 2014 traded at around US$109 and US$108 per barrel respectively. Although the dollar price of oil has been fairly stable, it rose in rand terms by 8,8 per cent from the end of September 2013 to the end of January 2014 due to the lower external value of the rand, reaching an all-time (nominal) high of R1 227 per barrel on 29 January 2014.
| | |
| | | Quarterly Bulletin March 2014 |
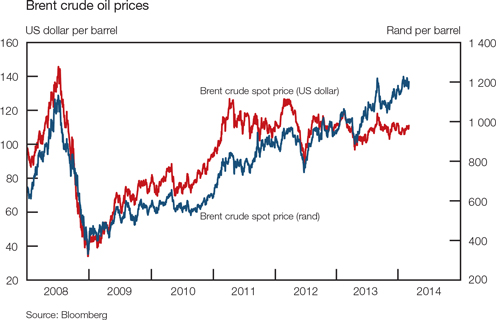
Current account4
The global economic recovery remained broadly on track in the fourth quarter of 2013 despite a moderately slower pace of economic growth. Growth in world trade continued to gather pace, benefiting, inter alia, South African exporters. These favourable developments coincided with a meaningful decline in the value of merchandise imports, following a surge in imports in the third quarter of 2013. As a result, South Africa’s seasonally adjusted and annualised trade deficit narrowed notably from R91 billion in the third quarter of 2013 to R45 billion in the fourth quarter.
Balance of payments on current account
| | | | | | | | | | | | | | | | | | | | | | | | |
| R billions, seasonally adjusted and annualised | | | | | | | | | | | | | | | | | | |
| | |
| | | 2012 | | | 2013 | |
| | | Year | | | 1st qr | | | 2nd qr | | | 3rd qr | | | 4th qr | | | Year | |
Merchandise exports | | | 744 | | | | 802 | | | | 826 | | | | 885 | | | | 901 | | | | 854 | |
Net gold exports | | | 71 | | | | 67 | | | | 70 | | | | 63 | | | | 56 | | | | 64 | |
Merchandise imports | | | -854 | | | | -941 | | | | -983 | | | | -1 039 | | | | -1 002 | | | | -991 | |
Trade balance | | | -39 | | | | -72 | | | | -87 | | | | -91 | | | | -45 | | | | -74 | |
Net service, income and current transfer payments | | | -125 | | | | -116 | | | | -120 | | | | -125 | | | | -134 | | | | -124 | |
Balance on current account | | | -164 | | | | -187 | | | | -207 | | | | -216 | | | | -179 | | | | -197 | |
As percentage of gross domestic product | | | -5,2 | | | | -5,7 | | | | -6,2 | | | | -6,4 | | | | -5,1 | | | | -5,8 | |
Components may not add up to totals due to rounding
The shortfall on the services, income and current transfer account with the rest of the world, however, widened further from the third quarter of 2013 to the fourth quarter, in part due to lower dividend receipts from the rest of the world. The larger deficit on the overall services account was, nonetheless, more than countered by the improvement in the trade balance, culminating in the narrowing of the deficit on current account. Relative to gross domestic product, the current-account deficit improved from 6,4 per cent in the third quarter of 2013 to 5,1 per cent in the fourth quarter. On an annual basis this ratio, however, weakened from 5,2 per cent in 2012 to 5,8 per cent in 2013.
| | |
| Quarterly Bulletin March 2014 | | |


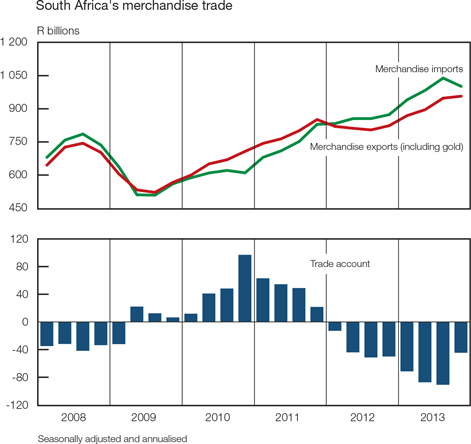
The marked improvement in the current-account balance in the fourth quarter of 2013 was mainly due to a substantial decrease in the value of merchandise imports. The value of imported goods receded by R37 billion or by 3,6 per cent in the final quarter of 2013 following an increase
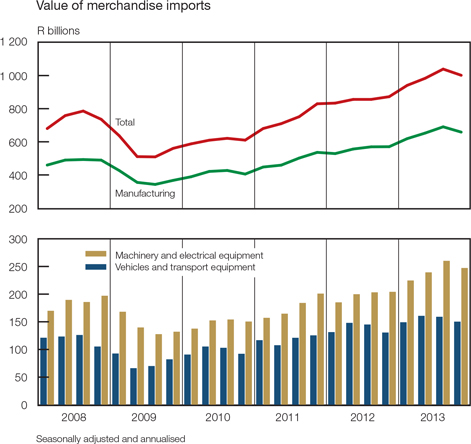
| | |
| | | Quarterly Bulletin March 2014 |
of almost 6 per cent in the third quarter. The lower import value of merchandise goods could mainly be attributed to a decrease in the value of manufactured imports, as pronounced decreases were registered in especially the categories for machinery and electrical equipment, and vehicles and transport equipment – the value of machinery and electrical equipment had surged in the preceding quarter.
Consistent with the decline in real gross domestic expenditure, merchandise import volumes contracted by 5,5 per cent in the fourth quarter of 2013, following growth of 2,1 per cent in the third quarter. The volume of non-oil imports declined in the fourth quarter of 2013, having increased in the first three quarters of the year. South Africa’s import penetration ratio, that is, the portion of real gross domestic expenditure that is satisfied through imports of goods, accordingly declined from 26,4 per cent in the third quarter of 2013 to a still elevated 25,2 per cent in the fourth quarter. This high ratio largely reflected South Africa’s structurally high propensity to import capital, intermediate and consumption goods.
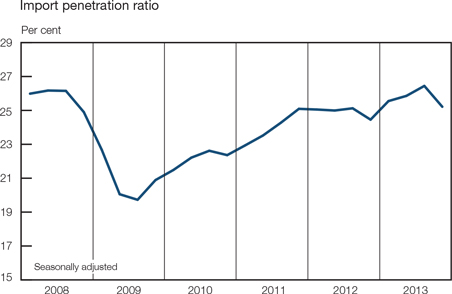
The sustained depreciation in the exchange rate of the rand in the fourth quarter of 2013 exerted upward pressure on the rand price of imported goods, causing it to rise by 2,0 per cent in that quarter – the fifth consecutive quarterly increase. Owing mainly to higher import prices, the value of merchandise imports increased by 16,0 per cent from R854 billion in 2012 to R991 billion in 2013.
The fixing price of gold on the London market trended downwards throughout 2013, decreasing from US$1 327 per fine ounce in the third quarter of 2013 to US$1 271 per fine ounce in the fourth quarter, or by 4,2 per cent. The most recent decline was partly related to the US Federal Reserve’s actions to gradually reduce its programme of quantitative easing, alongside controls over the importation of gold introduced in India. In rand terms the decrease was, however, more contained owing to the depreciation in the external value of the rand over the period. As a result, the average realised rand price of net gold exports declined by only 0,9 per cent over the period.
| | |
| Quarterly Bulletin March 2014 | | |


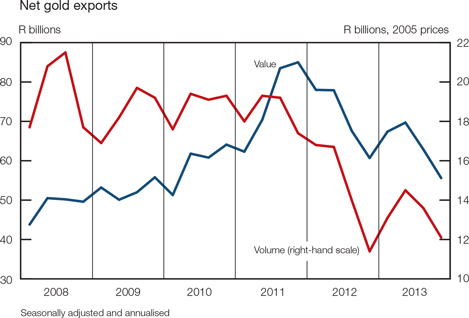
The physical quantity of gold exported contracted by 10,8 per cent in the final quarter of 2013 after having declined by 6,0 per cent in the third quarter. A decline in production coincided with lower demand from Indian importers over the period. According to the Annual Report of the World Gold Council, South Africa remained the fifth largest producer of gold despite its dwindling production in 2013. Largely as a result of significantly lower export volumes, South Africa’s net gold export proceeds shrank by 11,6 per cent in the fourth quarter of 2013. On an annual basis, the value of net gold exports contracted by about 10 per cent from R71 billion in 2012 to R64 billion in 2013.
The stronger demand for domestically produced goods following firm global growth along with the steady depreciation in the exchange value of the rand resulted in a further increase in merchandise export earnings. As a result, the value of merchandise exports rose by 1,8 per cent in the fourth quarter of 2013, following a particularly strong increase of 7,1 per cent in the preceding quarter. Both the volume and the prices of merchandise exports edged higher over the period.
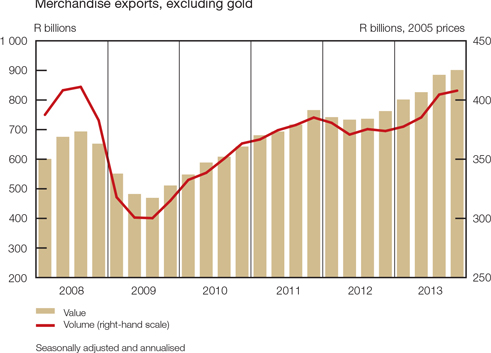
| | |
| | | Quarterly Bulletin March 2014 |
The US dollar price of a basket of mining commodities produced in South Africa continued to fall in the final quarter of 2013 as steady declines in the international prices of nickel and platinum were only partly offset by higher prices of iron ore and coal. However, the depreciation in the exchange value of the rand was sufficient to lift the rand price of total merchandise exports by 1,0 per cent over the period. In dollar terms, the price of a basket of South African-produced commodities dropped by 0,8 per cent in the fourth quarter of 2013 while the rand price rose by 1,0 per cent over the same period.
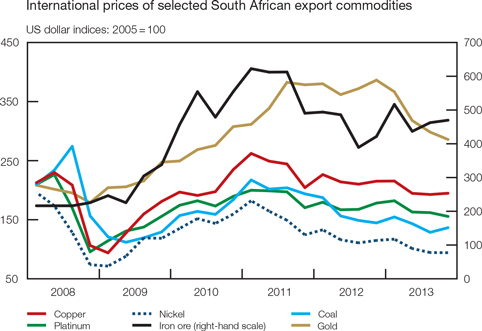
Merchandise export volumes rose by 0,8 per cent in the fourth quarter of 2013 following an increase of 5,0 per cent in the third quarter of 2013. The volume of manufactured exports picked up in the final quarter of 2013, partly due to higher exports of vehicles and transport equipment following the prolonged industrial strike action experienced in the automotive industry in the third quarter. In addition, an increase was noted in the category for chemical exports. The volume of exported mining products such as platinum, base metals and precious metals receded in the final quarter of 2013, whereas the export volumes of coal and iron ore advanced somewhat. Overall, export volumes amounted to 19,8 per cent of gross domestic product in 2013 compared with a ratio of 19,2 per cent registered in 2012.
Import price inflation marginally exceeded growth in export prices, causing South Africa’s terms of trade (i.e., the ratio of export prices to import prices) to deteriorate slightly further in the fourth quarter of 2013, its third consecutive quarterly decline. This implies that a greater volume of domestically produced goods had to be given up for an unchanged volume of imported goods which, all other things remaining unchanged, suggests that the national income of the country has declined relative to that of other countries.
The deficit on the services, income and current transfer account widened by approximately 7,5 per cent from the third quarter of 2013 to the fourth quarter. This larger deficit was to an important extent attributable to lower gross dividend receipts from the rest of the world, following exceptionally high receipts in the preceding quarter. Notwithstanding the larger deficit in the final quarter of 2013, the shortfall on the “services account” remained broadly unchanged from 2012 to 2013. As a ratio of gross domestic product the deficit, however, shrank from 4 per cent in 2012 to 3,7 per cent in 2013.
| | |
| Quarterly Bulletin March 2014 | | |


Gross dividend receipts increased noticeably in the first and third quarters of 2013, but decreased in the fourth quarter to levels recorded during 2012. For the year 2013 as a whole, dividend receipts rose by no less than 51 per cent, following a roughly similar rate of increase in 2012. The larger dividend inflows during the past two years – dividend receipts have doubled since 2011 – could be explained by the pick-up in global economic activity alongside the weakening in the external value of the rand which gained momentum during 2012 and 2013. By contrast, the level of gross dividend payments remained broadly unchanged from the third to the fourth quarter of 2013. During the first three quarters of 2013, gross dividend payments were on average twice as large as gross dividend receipts – well below the long-term average ratio of 4 between 2007 and 2013. Sizeable gross dividend payments by South African enterprises were made in particular by companies in a direct investment relationship, and have probably been influenced in the past two years by the liquidity requirements of parent companies abroad, apart from the domestic growth and profitability of local companies.
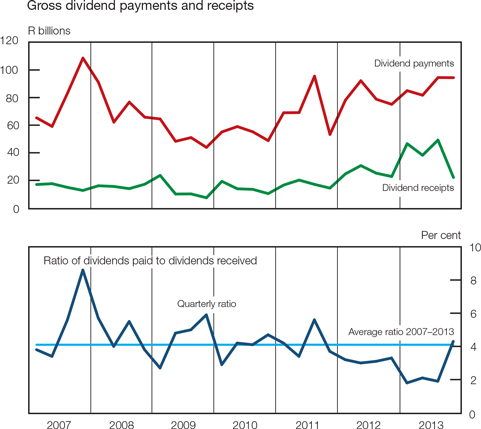
While net income payments advanced in the fourth quarter of 2013, the shortfall on the services account narrowed somewhat due to a decrease in net payments for technical services and services related to freight activities amid lower imports of merchandise. In addition, travel receipts increased for the fourth consecutive quarter buoyed by, inter alia, the depreciation in the exchange rate of the rand. Recent reports in the British media highlighting Cape Town as the top holiday destination for 2014 could provide a further impetus to travel receipts. Although gross interest payments declined from the third quarter of 2013 to the fourth quarter, it nevertheless increased by about 20 per cent for the year as a whole, consistent with higher foreign debt levels.
Financial account
International investor sentiment towards emerging-market economies turned negative during the fourth quarter of 2013 in reaction to the announcement of the imminent reduction in asset purchases by the Federal Reserve alongside uncertainty regarding the actual timing and pace of tapering of future bond purchases. Domestically, lingering labour market tensions, weak
| | |
| | | Quarterly Bulletin March 2014 |
economic growth and the current-account and fiscal deficits may have added to the shift in sentiment regarding emerging markets, resulting in a sharp reversal of portfolio flows during the final quarter of 2013. The net inward movement of foreign capital through the financial account of the balance of payments (including unrecorded transactions) moderated to R35,9 billion in the fourth quarter of 2013 compared with an inflow of R79,9 billion in the third quarter. The inflow of capital in the fourth quarter of 2013 mainly took the form of an increase in other investment liabilities. Cumulatively, the net inflow of capital came to R201,6 billion in 2013, noticeably more than the net capital inflow of R173,2 billion recorded in 2012.
Net financial transactions not related to reserves
R billions
| | | | | | | | | | | | | | | | | | | | | | | | |
| | | 2012 | | | 2013 | |
| | | Year | | | 1st qr | | | 2nd qr | | | 3rd qr | | | 4th qr | | | Year | |
Change in liabilities | | | | | | | | | | | | | | | | | | | | | | | | |
Direct investment | | | 37,5 | | | | 11,0 | | | | 16,6 | | | | 47,4 | | | | 4,1 | | | | 79,1 | |
Portfolio investment | | | 95,1 | | | | 1,4 | | | | -5,2 | | | | 48,8 | | | | -30,8 | | | | 14,2 | |
Other investment | | | 66,8 | | | | 24,5 | | | | -0,4 | | | | -6,4 | | | | 32,1 | | | | 49,8 | |
Change in assets | | | | | | | | | | | | | | | | | | | | | | | | |
Direct investment | | | -24,5 | | | | -6,2 | | | | -10,4 | | | | -29,2 | | | | -8,4 | | | | -54,2 | |
Portfolio investment | | | -40,6 | | | | -5,9 | | | | -6,4 | | | | -5,5 | | | | 6,3 | | | | -11,5 | |
Other investment | | | 40,9 | | | | -9,8 | | | | 4,6 | | | | 7,6 | | | | 2,0 | | | | 4,4 | |
Total financial transactions* | | | 173,2 | | | | 51,3 | | | | 34,5 | | | | 79,9 | | | | 35,9 | | | | 201,6 | |
Financial transactions as ratio of gross domestic product | | | 5,5 | | | | 6,3 | | | | 4,1 | | | | 9,3 | | | | 4,1 | | | | 6,0 | |
| * | Including unrecorded transactions |
Foreign-owned assets in South Africa
Foreign direct investment flows into South Africa recorded an inflow of R4,1 billion in the fourth quarter of 2013 compared with an inflow of R47,4 billion in the third quarter. The capital inflow in the fourth quarter partly reflected long-term loans granted to domestic subsidiaries by foreign direct investors. Cumulatively, direct investment inflows amounted to R79,1 billion in 2013, substantially more than the inflow of R37,5 billion recorded in 2012.
According to the latest UNCTAD Global Investment Trends Monitor, global foreign direct investment flows increased by 11 per cent to roughly pre-crisis levels in 2013. Foreign direct investment flows to developed countries accounted for 39 per cent of total foreign direct investment flows for the second consecutive year. Simultaneously, foreign direct investment flows to developing and transition economies accounted for 52 per cent and 9 per cent of global foreign direct investment flows respectively. At the regional level, flows to Latin America, the Caribbean and Africa increased; developing Asia attracted flows of similar magnitude as in 2012 and remained the largest host region in the world.
Inward foreign portfolio investment flows changed abruptly from an inflow of R48,8 billion in the third quarter of 2013 to an outflow of R30,8 billion in the fourth quarter of 2013 – the largest quarterly outflow since the fourth quarter of 2008. Foreign portfolio investors changed from being net buyers of both domestic shares and bonds in the third quarter of 2013 to net sellers in the fourth quarter. The outflow of portfolio capital in the fourth quarter was partially offset by the issuance of international bonds by, inter alia, a parastatal, the domestic banking sector as well as the non-bank private sector. Concerns about the financing requirements of the domestic economy have resulted in a deterioration in the risk metrics of international portfolio investors. As a consequence, inward portfolio investment flows shrank to R14,2 billion in 2013 compared with an inflow of R95,1 billion in 2012.
| | |
| Quarterly Bulletin March 2014 | | |


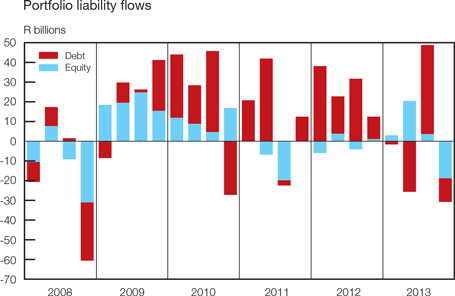
Other investment flows into South Africa switched from an outflow of R6,4 billion in the third quarter of 2013 to a substantial inflow of R32,1 billion in the fourth quarter of 2013. The inward movement of capital in the fourth quarter of 2013 resulted mainly from an increase in foreign currency-denominated loans extended to the South African banking sector, supplemented by an increase in non-resident deposits with domestic banks. For the year as a whole, inflows of other investment capital came to R49,8 billion compared with capital inflows of R66,8 billion in 2012.
South African-owned assets abroad
Outward direct investment recorded a much reduced outflow of R8,4 billion in the fourth quarter of 2013 following outflows of R29,2 billion in the third quarter. The outflow of capital in the fourth quarter of 2013 was spread among a wide variety of economic sectors. For the year 2013 as a whole, direct investment outflows amounted to R54,2 billion following an inflow of R24,5 billion in 2012.
During the fourth quarter of 2013, outward investment in foreign portfolio assets by South African entities registered an inflow (i.e., a decline in foreign portfolio assets) of R6,3 billion compared to an outflow of R5,5 billion in the third quarter. This decrease during the fourth quarter of 2013 can be attributed to the disposal of both equity and debt securities by the South African banking sector. On an annual basis, capital outflows related to the acquisition of portfolio investment assets amounted to R11,5 billion in 2013 compared with an outflow of R40,6 billion in 2012.
Other outward investment from South Africa recorded an inflow of R2,0 billion in the fourth quarter of 2013 compared to an inflow of R7,6 billion in the third quarter. This capital inflow mainly reflected a decrease in deposits and loans of South African banks with their foreign counterparts, partly countered by loans granted to non-residents under repurchase agreements. For the year 2013 as a whole, inflows of R4,4 billion were recorded compared to an inflow of R40,9 billion in 2012.
Foreign debt
South Africa’s total outstanding external debt increased from US$130,4 billion at the end of June 2013 to US$136,6 billion at the end of September as both foreign currency- and rand-denominated debt edged higher over the period. Expressed as a ratio of gross domestic product, the country’s outstanding foreign debt increased from 35,4 per cent at the end of June 2013 to 38,2 per cent at the end of September – the highest ratio to be recorded since the foreign debt standstill era of the mid-1980s.
| | |
| | | Quarterly Bulletin March 2014 |
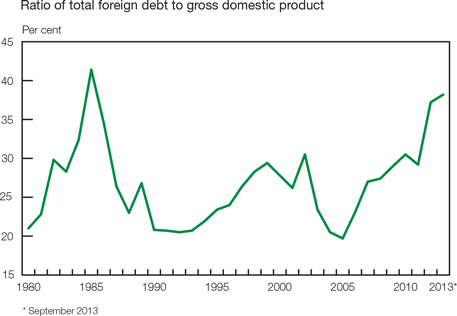
In US dollar terms, South Africa’s rand-denominated foreign debt rose from US$72,8 billion at the end of the second quarter of 2013 to US$76,0 billion at the end of the third quarter, following non-resident investors’ net purchase of domestically issued government bonds. The higher level of rand-denominated foreign debt also reflected a rise in the long-term debt of non-bank private-sector companies in a direct investment relationship. Over the corresponding period, foreign currency-denominated debt increased from US$57,6 billion to US$60,6 billion. This increase was largely brought about by international bond issues by the general government (US$2 billion) and a parastatal (US$1 billion) during the third quarter of 2013, which more than countered the redemption of maturing long-term debt commitments by the domestic banking sector.
Foreign debt of South Africa
US$ billions at end of period
| | | | | | | | | | | | | | | | | | | | |
| | | 2012 | | | 2013 | |
| | | 3rd qr | | | 4th qr | | | 1st qr | | | 2nd qr | | | 3rd qr | |
Foreign currency-denominated debt | | | 57,0 | | | | 61,0 | | | | 59,0 | | | | 57,6 | | | | 60,6 | |
Bonds | | | 22,2 | | | | 22,4 | | | | 20,9 | | | | 19,0 | | | | 22,2 | |
Other | | | 34,8 | | | | 38,6 | | | | 38,1 | | | | 38,6 | | | | 38,4 | |
Public sector | | | 9,0 | | | | 9,0 | | | | 9,1 | | | | 9,4 | | | | 9,6 | |
Monetary sector | | | 9,5 | | | | 13,8 | | | | 12,9 | | | | 11,7 | | | | 10,4 | |
Non-monetary private sector | | | 16,3 | | | | 15,8 | | | | 16,1 | | | | 17,5 | | | | 18,4 | |
Rand-denominated debt | | | 79,5 | | | | 81,3 | | | | 81,6 | | | | 72,8 | | | | 76,0 | |
Bonds | | | 41,5 | | | | 44,8 | | | | 45,9 | | | | 39,7 | | | | 42,2 | |
Other | | | 38,0 | | | | 36,5 | | | | 35,7 | | | | 33,1 | | | | 33,8 | |
Total foreign debt | | | 136,5 | | | | 142,3 | | | | 140,6 | | | | 130,4 | | | | 136,6 | |
As percentage of gross domestic product | | | 35,6 | | | | 37,2 | | | | 37,4 | | | | 35,4 | | | | 38,2 | |
As percentage of total export earnings | | | 111,2 | | | | 118,3 | | | | 119,0 | | | | 111,5 | | | | 117,6 | |
The ratio of South Africa’s short-term foreign currency-denominated debt (i.e., debt with an original maturity of less than one year and other foreign currency-denominated debt maturing within the next twelve months) to its total foreign currency-denominated debt improved marginally to 43,4 per cent at the end of September 2013, from 44,4 per cent at the end of June 2013. This improvement can largely be associated with the issuance of foreign currency-denominated bonds during the third quarter of 2013.
| | |
| Quarterly Bulletin March 2014 | | |


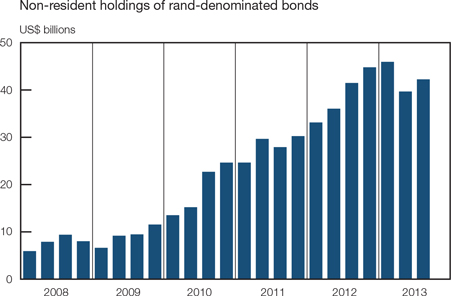
International reserves and liquidity
South Africa’s overall balance-of-payments position (i.e., the change in the country’s net international reserves due to balance-of-payments transactions) weakened by R31 million in the fourth quarter of 2013 following an increase of R18,7 billion in the third quarter. For the year 2013 as a whole, the country’s net international reserves increased by R4,7 billion compared with an increase of R9,0 billion in 2012.
Measured in US dollars, the value of South Africa’s gross gold and other foreign reserves (i.e., the international reserves of the Bank before accounting for reserve-related liabilities) declined from US$50,0 billion at the end of September 2013 to US$49,6 billion at the end of December and US$49,4 billion at the end of January 2014. On balance, the country’s gross international reserves declined by US$1,1 billion in 2013, largely due to a lower gold price used to value the gold reserves. The level of import cover (i.e., the value of gross international reserves relative to the value of imports of goods, services and income) increased from 19,4 weeks at the end of September 2013 to 20,7 weeks at the end of December; it has been fluctuating around these levels since 2009.
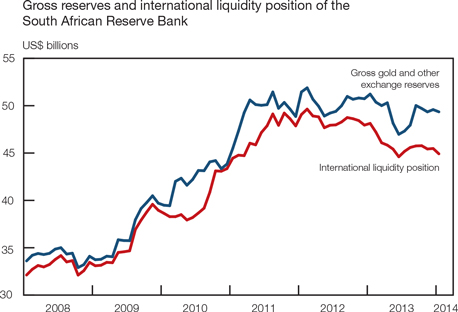
| | |
| | | Quarterly Bulletin March 2014 |
The international liquidity position declined marginally from US$45,8 billion at the end of September 2013 to US$45,5 billion at the end of December and US$44,9 billion at the end of January 2014. The international liquidity position declined, on balance, by US$2,5 billion in 2013, following an increase of US$0,1 billion in 2012.
Exchange rates
The nominal effective exchange rate of the rand declined, on balance, by 3,8 per cent in the fourth quarter of 2013, marking the seventh consecutive quarterly depreciation. Similar to the currencies of many emerging-market economies – not least Brazil, India, Indonesia and Turkey, that together with South Africa are closely scrutinised by international investors as a result of their comparatively large current-account and fiscal deficits – the exchange rate of the rand was weighed down by a decline in international commodity prices as well as the announcement of the start of the tapering of asset purchases by the Federal Reserve towards the end of 2013. While the weighted average exchange rate of the rand increased, on balance, by 0,8 per cent during October 2013, the currency’s weakening bias continued during November and December with declines of 1,5 per cent and 3,1 per cent respectively. The nominal effective exchange rate of the rand declined by 18,4 per cent from the end of 2012 to the end of 2013 –the third consecutive annual decline, which brought the total decline from the end of 2010 to the end of 2013 to 35,8 per cent.
Exchange rates of the rand
Percentage change
| | | | | | | | | | | | | | | | |
| | | 31 Mar 2013 | | | 30 Jun 2013 | | | 30 Sep 2013 | | | 31 Dec 2013 | |
| | | to | | | to | | | to | | | to | |
| | | 30 Jun 2013 | | | 30 Sep 2013 | | | 31 Dec 2013 | | | 28 Feb 2014 | |
Weighted average* | | | -6,8 | | | | -3,5 | | | | -3,8 | | | | -2,4 | |
Euro | | | -8,9 | | | | -4,7 | | | | -5,4 | | | | -1,9 | |
US dollar | | | -7,2 | | | | -1,3 | | | | -3,5 | | | | -2,3 | |
Chinese yuan | | | -8,3 | | | | -1,6 | | | | -4,6 | | | | -0,9 | |
British pound | | | -7,6 | | | | -6,9 | | | | -5,7 | | | | -3,5 | |
Japanese yen | | | -2,5 | | | | -2,4 | | | | 3,5 | | | | -5,4 | |
| * | Against a basket of 15 currencies |
During January 2014 emerging-market currencies in general continued to depreciate amid concerns about slowing economic growth in China. The nominal effective exchange rate of the rand decreased, on balance, by 5,7 per cent in January 2014. In addition to international factors, the exchange value of the rand was also affected by domestic factors such as the threat of another round of labour relations tension in the mining industry, the lack of economic growth, external and fiscal imbalances, and the slow pace of structural economic reforms. The Turkish lira declined to an all-time low against the US dollar, the Argentinian peso to its lowest value in twelve years, and the Ukrainian hryvnia to a four-year low, with the rand falling to its weakest level since October 2008. Factors such as the high-level corruption investigation in Turkey and protests in Thailand and Ukraine contributed to the depreciation of their respective currencies. The South African rand and the Indonesian rupiah proved to be the poorest performing currencies against the US dollar from September 2013 to December, and were subsequently joined by the Turkish lira at the start of 2014. The nominal effective exchange rate of the rand recovered somewhat during February 2014 and increased, on balance, by 3,6 per cent.
| | |
| Quarterly Bulletin March 2014 | | |


Box 2: South African fuel price movements
On 5 March 2014, the price of 95-octane unleaded petrol in Gauteng reached R14,32 per litre.1 There has been a significant rise in both the nominal and real price of petrol over the past decade. The decline in international oil prices during the global financial crisis provided some relief, but since the end of 2009, domestic petrol prices have increased by 80 per cent in nominal and by 43 per cent in real terms. This box analyses some of the factors underpinning the movement in petrol prices. Attention is also devoted to the impact of petrol price movements on inflation outcomes in South Africa.
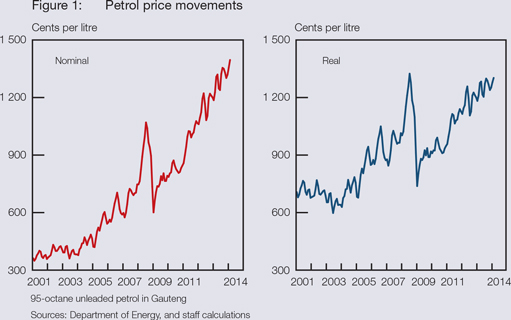
The retail price of petrol is regulated by government with prices being set on the first Wednesday of each month. While there are a number of factors that are taken into account when setting the pump price, these can generally be divided into two groups – one reflecting the impact of international developments and the other domestic influences. The impact of international influences is captured by the basic fuel price (BFP) element in the price-setting formula. In essence, the BFP is the imported rand cost of petroleum products. It is directly linked to the price of petrol quoted in US dollars at refineries in the Mediterranean area, the Arab Gulf and Singapore, and also includes other costs related to the transport and storage of petroleum products. Domestic influences include taxes, levies and margins which are added to the BFP to arrive at the final petrol pump price.2
Since the implementation of the current formula in April 2003, the contributions of both domestic and international influences to petrol price movements have steadily increased over time (Figure 2). However, in relative terms, the contribution of the international elements (BFP) to the pump price has increased from approximately 45 per cent in 2003 to 58 per cent in 2013, on average.
Given the importance of oil as an input in the manufacturing of petroleum products, it is not surprising that the BFP is strongly correlated with international oil price developments in domestic currency terms (Figure 2, right-hand panel). Movements in the BFP mainly account for the changes in the petrol price. The BFP is influenced by changes in international product prices and exchange rates. These two elements account for virtually all of the monthly changes in the domestic petrol price (Figure 3).
| 1 | The price of 93-octane unleaded petrol increased to R14,11 on 5 March. Real prices are obtained by deflating nominal values by the consumer price index (CPI). |
| 2 | Components of the BFP include the spot price of international petroleum products, freight costs, insurance costs, ocean loss allowance, cargo dues, coastal storage and stock financing costs. Domestic costs include inland transport costs, wholesale and retail profit margins, an equalisation fund levy, customs and excise, a levy for the road accident fund, a slate levy, a demand side management levy on 95-octane unleaded petrol and a petroleum pipelines levy. For a more detailed description of the elements see http://www.energy.gov.za/files/petroleum_frame.html. |
| | |
| | | Quarterly Bulletin March 2014 |
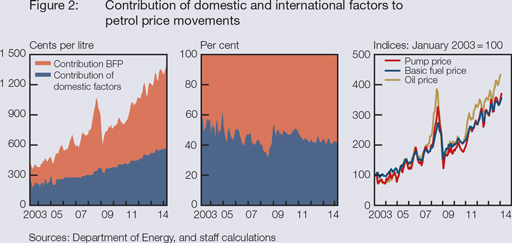
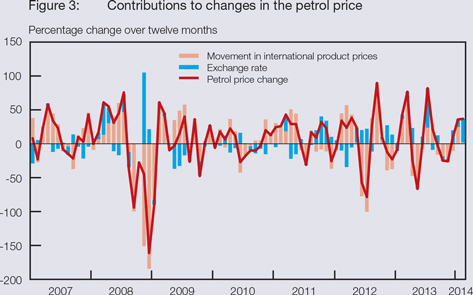
The impact of petrol price changes on headline consumer price inflation occurs either directly through its share in the CPI or indirectly through its impact on the prices of other (non-fuel or non-petrol) goods in the CPI. Between January 2004 and December 2013, petrol price increases made a direct contribution of around 13 per cent to the overall increase in the headline consumer price level – significantly above its weight of approximately 5 per cent in the CPI basket. In essence, this was due to petrol price inflation averaging 12,5 per cent per year which was significantly above the average headline inflation rate of 5,6 per cent during this period. Indirect or second-round effects of fuel price changes can be gauged by ascertaining the pass-through effects of petrol prices to non-fuel prices in the CPI. Econometric estimates for the period January 2003 to December 2013 using a fairly basic model show evidence of second-round effects from petrol price inflation in South
| | |
| Quarterly Bulletin March 2014 | | |


Africa.3 The results indicate that the impact of these price effects persists over periods of up to twelve months, but becomes statistically insignificant thereafter. Using the core macro-econometric model of the Bank for simulation, a petrol price shock (increase) of 10 per cent directly raises consumer price inflation by 0,6 percentage point, and indirectly by a further 0,3 percentage point after one year.
| 3 | Following Cecchetti and Moessner (2008, BIS Quarterly Review, pp55-66), second-round effects are estimated by considering the following gap model: |
 Equation (1)
where i = lags in months; = non-fuel inflation in period t;
 = headline inflation in period t. Equation 1 reflects the impact of fuel inflation (i.e., the gap between headline and non-fuel inflation) in period (t-i) on the increase in non-fuel inflation between period t and (t-i). The basic point here is that if ß is positive and significant then petrol price changes affect the prices of non-petrol goods (i.e., there is evidence of second-round effects from petrol price changes).
| | | | | | | | | | |
| Table: | | Pass-through price impacts of petrol price inflation into non-fuel |
| | | (non-petrol) inflation |
| | | | | | | | | | | | | | | | |
| Lags in months | | R¯ 2 | | | æ | | | ß | | | p value
H0: ß = 0 | |
i = 3 | | | 0,17 | | | | -0,38 | * | | | 0,95 | *** | | | 0,005 | |
| | | | | | | (0,22 | ) | | | (0,34 | ) | | | | |
i = 6 | | | 0,17 | | | | -0,63 | | | | 1,73 | *** | | | 0,004 | |
| | | | | | | (0,41 | ) | | | (0,58 | ) | | | | |
i = 12 | | | 0,07 | | | | -0,70 | | | | 1,94 | * | | | 0,062 | |
| | | | | | | (0,71 | ) | | | (1,04 | ) | | | | |
i = 18 | | | 0,04 | | | | -0,59 | | | | 1,66 | | | | 0,224 | |
| | | | | | | (1,66 | ) | | | (1,36 | ) | | | | |
i = 24 | | | 0,03 | | | | -0,66 | | | | 1,76 | | | | 0,275 | |
| | | | | | | (0,83 | ) | | | (1,60 | ) | | | | |
| Note: | The standard errors, which are reflected in brackets, are corrected for serial correlation. *** and * depicts significant at the 1 per cent and 10 per cent level respectively. |
Some emerging-market central banks attempted to protect their exchange rates by intervening in the foreign-exchange market, but a lack of sufficient foreign-exchange reserves have rendered these interventions unsustainable. The risks attached to intervention in the foreign-exchange market by selling foreign currency to protect the exchange rate was illustrated when intervention by the Argentinian central bank failed due to a depletion of its reserves, thereby rendering the country very vulnerable.
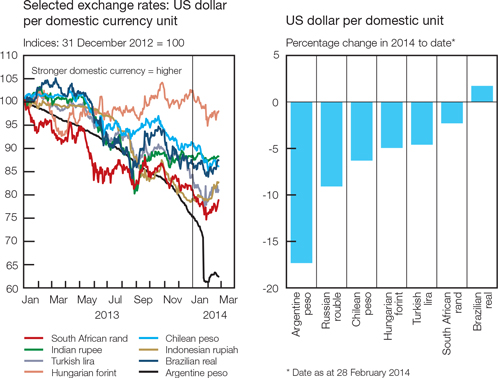
| | |
| | | Quarterly Bulletin March 2014 |
The real effective exchange rate of the rand declined by approximately 11 per cent from December 2012 to December 2013, improving the external price competitiveness of South African exporters in international markets; as usual the challenge is to ensure that such competitive advantage is not eroded by inflation.
The net average daily turnover in the South African foreign-exchange market decreased by 7,0 per cent from US$23,0 billion in the third quarter of 2013 to US$21,4 billion in the fourth quarter. The fourth-quarter level, which is traditionally lower due to the year-end holidays was, however, still 14,5 per cent higher than in the corresponding period in 2012.
The net average daily turnover in the rand market contributed significantly to the decrease in the total turnover, decreasing by 4,5 per cent from US$17,9 billion in the third quarter of 2013 to US$17,1 billion in the fourth quarter. The quarterly decreases were recorded across all categories of foreign-exchange transactions – spot, outright forward and swap transactions. The fourth-quarter level was however 18,0 per cent higher than the corresponding level in 2012. Swap transactions contributed 75 per cent to the net average daily turnover in the rand market, with non-residents accounting for 67 per cent of the transactions in the swap market.
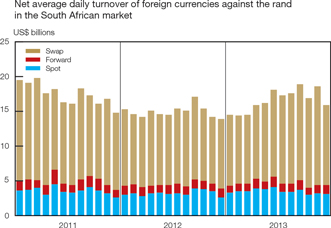
| | |
| Quarterly Bulletin March 2014 | | |


Monetary developments, interest rates and financial markets
Structural and regulatory issues in 2013 and early 2014
During 2013 and the first two months of 2014, the South African banking sector remained geared towards the further implementation of the Basel III supervisory requirements. Challenges were also posed by increased regulatory scrutiny and rising operating costs, as growth in demand for credit by both households and companies remained lustreless with banks generally maintaining a low risk appetite and relatively tight lending standards in the challenging macroeconomic environment. Nevertheless, the banking sector remained stable, profitable and well capitalised. The quality of bank assets improved during 2013, with the ratio of impaired advances to gross loans and advances receding to 3,7 per cent in December 2013, down from 4,1 per cent in January.
South African banks continued to source funding both locally and internationally, and gradually reduced their dependence on wholesale funding, such as the issuance of short-term bonds and commercial paper. Interbank and intragroup funding by banks – considered to be an unstable source of funding in the new global regulatory framework – was reduced from a peak of R565 billion in October 2008 to R310 billion in December 2013. In a similar fashion, the banking sector improved the term profile of its funding through financial institutions by increasing the share of long-term funding from these institutions from 35,2 per cent in 2008 to 43,8 per cent in 2013, at the expense of short- and medium-term funding. Banks’ dependence on foreign-currency funding remained relatively low, while activity in the securitisation market remained subdued in 2013 with only R0,7 billion in assets securitised. The banking sector continued to attract customers through competitive and innovative banking products, increased and refurbished its branch and automated teller machine (ATM) network and expanded further into African countries. The holding entity of a large domestic banking group was renamed during 2013 after the successful merger of its African operations with those of its main shareholder at the end of July.
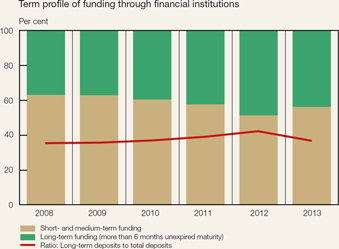
The banking sector continued to be dominated by four large banks, which together account for 83 per cent of the total assets of the South African banking sector. The number of locally registered banks in South Africa increased from 32 in January 2013 to 33 in January 2014 due
| | |
| | | Quarterly Bulletin March 2014 |
to the entry of a new branch of a foreign bank. The number of foreign banks with approved local representative offices in South Africa increased to 42 at the end of January 2014, up from 39 at the end of January 2013.
Size of the South African private banking sector
| | | | | | | | | | | | | | | | |
| | | January 2013 | | | January 2014 | |
| | | Number of | | | Total assets | | | Number of | | | Total assets | |
| | | institutions | | | (R billions) | | | institutions | | | (R billions) | |
Locally controlled banks | | | 10 | | | | 2 672 | | | | 10 | | | | 2 918 | |
Foreign-controlled banks | | | 6 | | | | 781 | | | | 6 | | | | 834 | |
Mutual banks | | | 3 | | | | 2 | | | | 3 | | | | 3 | |
South African branches of foreign banks | | | 13 | | | | 193 | | | | 14 | | | | 232 | |
Total registered banks | | | 32 | | | | 3 648 | | | | 33 | | | | 3 986 | |
Domestic banks continued to increase their holdings of liquid assets ahead of the gradual phasing in of the Basel III liquidity coverage ratio from 2015, which requires banks to hold enough high-quality liquid assets to be able to meet 30 days’ worth of obligations in the event of a bank run. In January 2014, the Basel Committee on Banking Supervision (Basel Committee) announced further refinements to this ratio which included the allowance for banks to draw on emergency funding from their central bank through committed lending facilities. To this effect, the Bank made available such a committed liquidity facility from January 2013, to help ensure that banks will be able to meet the required liquidity coverage ratio in times of inadequate supply of qualifying instruments.
Other revisions by the Basel Committee in January 2014 included adjustments to the leverage ratio – the capital provision designed to prevent the build-up of leverage in the banking system. Among other things, the netting of securities-financing transactions, such as repurchase agreements with the same counterparty, is now allowed. The net stable funding ratio, which governs how banks raise funds relative to the amount of foreseeable obligations over the next year, was also updated to ease the writedowns required on certain sources of capital and deposits, while more wholesale funding sources, previously regarded as unstable, are now permissible.
The Financial Services Laws General Amendment Bill was passed by the National Council of Provinces in November 2013, and assented to by the President in January 2014. The Act, which comes into effect at the end of February 2014, addresses urgent issues in eleven financial sector laws, including legislative gaps highlighted after the 2008 financial crisis and aligning these laws with the new Companies Act, 2008 (Act No. 71 of 2008) and other related legislation.
The National Credit Amendment Bill was tabled in Parliament in October 2013. This Bill aims to address problems that have hampered the achievement of the intended outcomes of the National Credit Act 2005, (Act No. 34 of 2005). In summary, the Bill seeks to amend certain definitions; empower the Chief Executive Officer to delegate certain functions to other officials of the National Credit Regulator; empower the National Credit Tribunal to suspend reckless credit agreements; empower the Minister of Trade and Industry to issue notice for the removal of adverse information; and provide for automatic removal of adverse consumer information.
Regulations for the removal of adverse credit information was published by the Department of Trade and Industry in February 2014. The regulations require the removal of all adverse information listings held by credit bureaus in respect of paid-up debt on an ongoing basis; and removal of all paid-up judgment information held by credit bureaus on an ongoing basis.
In addition to the consumer regulatory reforms, in December 2013 the government announced some preventative steps to minimise the risk of household over-indebtedness. This included new measures to assist over-indebted households by setting clear affordability criteria to enhance reckless lending controls; reviewing the pricing caps and regulatory framework for credit insurance policies; and engaging with lenders to provide appropriate relief to qualifying
| | |
| Quarterly Bulletin March 2014 | | |


distressed borrowers. Further measures include engaging with current lenders to take steps to withdraw certain categories of existing emolument attachment orders for credit; regulating debt-collection firms; and encouraging employers to investigate the legitimacy of all emolument attachment or garnishee orders.
In the private sector, the National Industry Steering Committee, a forum constituted of the full spectrum of credit providers and chaired by the Banking Association of South Africa, made some progress in reaching certain commitments agreed to with the government towards the end of 2013. For instance, in order to eradicate the abuse of emolument attachment orders, the committee agreed to remove emolument orders that had been identified as being faulty from its books and proposed a set of stringent criteria to be met in applying for emolument orders in future. The committee is also developing additional consumer education programmes and devotes a considerable amount of time and money to developing mechanisms to restructure some debt of qualifying over-indebted consumers.
During December 2013, the Bank published new interchange fees applicable to ATM payment streams. The new ATM interchange fees are the result of a project on interchange determination initiated by the Bank in 2011 to review interchange rates applicable to all relevant payment streams, following concerns raised in the Competition Commission Bank Enquiry report regarding interchange fees. The ATM payment stream was selected as the pilot phase for the project and the second phase of the project will focus on all card payment streams. The project considered withdrawals, balance enquiries and declined transactions, as these account for about 80 per cent of transactions undertaken at ATMs.
The JSE Limited (JSE) implemented amendments to its Equities Rules and Directives related to the segregation of securities in July 2013, separating JSE members’ client and proprietary business. This separation of the custody and settlement of controlled client and proprietary holdings and transactions enables equities members to comply with the requirements of section 22 of the Financial Markets Act, 2012 (Act No. 19 of 2012). Members are required to maintain an account in the name of their nominee company with their Central Securities Depository Participant (CSDP) for their controlled client holdings and settlements, and maintain a separate account in their own name for their proprietary holdings and settlements. The settlement of controlled client and proprietary transactions is split into two separate nets. This affords clients a greater level of protection due to segregation being achieved at a higher level in the holdings chain, but is also of material benefit to the CSDPs as they will have more insight into the member’s liquidity requirements in relation to the settlement of proprietary transactions.
The JSE published a revised booklet on Insider trading and other market abuses in August 2013. The purpose of this booklet is to bring together the various Acts, requirements and relevant corporate governance guidelines, which all have a bearing on preventing market abuse. This booklet has drawn on the Financial Markets Act, section 3 of the JSE Listings Requirements, and extracts from the Takeover Regulation Panel’s Merger and Takeover Code to provide an outline of the legal framework.
On 10 September 2013 the JSE published amendments to the JSE Listings Requirements to clarify the application of a general issuance for cash. The amendments provide shareholders and directors with certainty on the exact number of shares that may be issued under a general issue for cash authority. The JSE also published amendments to its Listings Requirements on 3 December 2013 to introduce Hybrid Financial Instruments, which have characteristics of both debt and equity securities.
The Currency Derivatives Market of the JSE expanded its Quanto product range during November 2013 in response to market demand. A Quanto derivatives contract based on the exchange rate between the euro and US dollar was introduced. The newly introduced currency contract is settled in local currency, while tracking the movement of the popular and actively traded euro/dollar currency pair.
In November 2013 the JSE implemented a trading and information system upgrade by introducing two new trading sessions. The Closing Price Publication (CPP) session facilitates the publication of official closing prices and is applicable to all segments. The Closing Price Cross (CPX) session facilitates the submission and continuous matching of eligible orders at the published closing price in the central order book.
| | |
| | | Quarterly Bulletin March 2014 |
The Financial Services Board (FSB) released a consultation paper on the regulation of exchanges under the Financial Markets Act, 2012 (Act No. 19 of 2012) for public comment in November 2013. The paper sets out the Registrar of Securities Services’ views that, among others, companies whose operations are limited to providing infrastructure that brings together buyers and sellers of only the companies’ own shares should be exempted from the exchange licensing requirements. A course of action to regularise the affairs of unlicensed exchanges is also proposed in the paper.
In December 2013 the Office of the Registrar of Banks issued a directive on transitional arrangements relating to the capital requirements applicable to banks transacting in over-the-counter (OTC) derivatives that are not transacted through a central counterparty (CCP) in 2014. The objective is therefore to encourage trading of derivatives on exchanges or settlement through a CCP in the case of OTC trading, in order to reduce counterparty credit risk.
The JSE introduced short-dated options on maize in December 2013, which follow the price of maize futures expiring in July 2014, but will be converted to futures at the end of March 2014. Aimed at guarding against fluctuations in maize prices, the newly introduced options are expected to increase trading and hedging opportunities for farmers and millers. The shorter time horizon on these contracts makes them relatively cheaper.
In an effort to reduce a sudden impact on client cash flows, a phased approach was used by the JSE from the end of January 2014 to introduce a new methodology for determining contract level Initial Margin Requirements for equity derivatives. The methodological enhancement was necessary in order to meet risk management best practices, and will align Safcom, South Africa’s clearing house for exchange-traded derivatives, with the minimum requirements stipulated by the European Market Infrastructure Regulation for CCPs.
Consistent with ongoing changes to enhance regulation and supervision in the South African insurance industry, the FSB released a discussion paper entitled: The Review of Third-party Cell Captive Insurance and Similar Arrangements in June 2013 for public comment. The paper evaluates prudential and market conduct risks for insurers using captive arrangements and for policyholders that may arise from such structures and business models. The paper proposes that cell captive insurance business be conducted under a dedicated insurance licence and not be combined with other insurance businesses, and cell captive insurance arrangements may only be entered into with a binder holder. Furthermore, enhanced regulatory requirements for third-party cell captive insurers will be put in place with respect to (i) adequate governance and risk management, (ii) market conduct and (iii) regulatory reporting.
In its continued effort to reform the retirement funds industry and encourage household savings, the National Treasury released the last of five technical discussion papers entitled: Charges in South African Retirement Funds in July 2013 for public comment. The paper discusses costs and charges in the industry and attempts to benchmark them internationally. Key findings outlined in the document are that structural factors, such as the current large number of active retirement funds in the system and the low rate of pension benefit preservation (when members switch jobs), are some of the drivers of costs in the system. Similarly, preference for an active investment management style, on the part of consumers and intermediaries, may also have contributed to increased investment-related costs for retirement funds. The policy options announced by the National Treasury to reduce costs include increasing competition in the industry, encouraging consolidation of funds, strengthening governance and fund regulation.
The FSB published the Treating Customers Fairly (TCF) implementation update and baseline study feedback report in December 2013. The aim of the study was to provide an initial view of how customer treatment practices in the financial services industry measure up against the six TCF outcomes, which will be used to assess future industry progress in delivering the TCF outcomes. Sectors that participated include long- and short-term insurance companies, collective investment schemes, banks and retirement funds. The FSB will be adopting an incremental approach to implementing the TCF outcomes and this will be the primary framework the market conduct regulator will use to fulfil its mandate. TCF will also be incorporated into the new twin peaks regulatory legislation.
In line with the adoption of new financial sector regulation in South Africa, the National Treasury published a draft bill on Financial Sector Regulation, 2013 in December 2013 for public
| | |
| Quarterly Bulletin March 2014 | | |


comment. The bill provides details about the implementation of the twin peaks model of financial regulation, which will take place in two phases. The Financial Sector Regulation Bill covers the first phase which is to establish two new regulatory authorities, namely prudential and market conduct authorities. The second phase will align the existing sectoral legislations with the twin peaks framework. The bill also gives the South African Reserve Bank the primary responsibility to oversee financial stability. Other objectives of the legislation include enhancing co-ordination and co-operation between regulators, creating a financial services tribunal and strengthening the operational independence of regulators, establishing a crisis management and resolution framework under the South African Reserve Bank, strengthening the ombudsman system, and balancing the accountability of respective regulators.
In December 2013 the FSB released amendments to Board Notice 80 under the Collective Investment Schemes Control Act, 2002 (Act No. 45 of 2002). The revision was aimed at clarifying certain provisions, removing inconsistencies from the previous conditions, allow for new developments and facilitate regulatory changes introduced by the Financial Stability Board and National Treasury.
Money supply
Growth in money supply initially firmed in the first two quarters of 2013, consistent with the improved yield differential between deposit holdings and bonds, only to recede sharply in the second half of the year as the yield differential reversed and corporate deposits in particular moderated during this period. Labour disruptions in selected industries and rising cost pressures probably impacted on revenue growth in the corporate sector, while the general sluggishness in the domestic economic recovery also had a bearing on the demand for money. Deposits of the household sector also slowed in the third quarter but recovered somewhat in the fourth quarter of 2013.
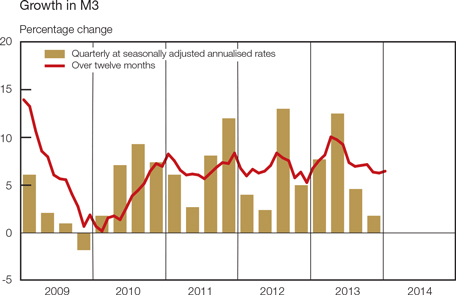
Growth in money supply displayed a moderate pace of expansion during the second half of 2013, consistent with weak underlying growth in real economic activity and an improvement in the yield on bonds relative to that on deposits. After reaching a post-recession high of 10,0 per cent in April 2013, twelve-month growth in the broadly defined money supply (M3) waned to 6,2 per cent in December, the lowest rate of growth recorded for the year as a whole. In January 2014, growth in M3 improved somewhat to 6,4 per cent. The slowdown in M3 growth during the second half of 2013 was also echoed in the quarter-to-quarter5 growth rates which fell from a high of 12,3 per cent in the second quarter to 4,1 per cent in the third quarter before declining even further to 2,2 per cent in the fourth quarter.
| | |
| | | Quarterly Bulletin March 2014 |
Maturity analysis of growth in M3
Per cent at seasonally adjusted annualised rates
| | | | | | | | | | | | | | | | |
| | | 2013 | |
| | | 1st qr | | | 2nd qr | | | 3rd qr | | | 4th qr | |
Notes and coin | | | 4,1 | | | | 18,9 | | | | 5,6 | | | | 1,5 | |
Cheque and transmission deposits | | | 10,2 | | | | 17,7 | | | | 14,5 | | | | 12,4 | |
Call and overnight deposits | | | -1,7 | | | | 13,3 | | | | 22,3 | | | | 1,7 | |
Other short- and medium-term deposits* | | | 2,8 | | | | 10,2 | | | | 9,6 | | | | 16,0 | |
Long-term deposits** | | | 16,6 | | | | 6,0 | | | | -25,8 | | | | -16,6 | |
M3 | | | 8,1 | | | | 12,3 | | | | 4,1 | | | | 2,2 | |
| * | Unexpired maturities of more than one day and up to six months, and savings deposits |
| ** | Unexpired maturities of more than six months |
Long-term deposits were the least favoured deposit category in the second half of 2013 as investors probably avoided locking in long-term deposit interest rates at the bottom of the interest rate cycle, and also found the bond market more attractive on account of the considerably higher yields since late May 2013. Cheque and transmission deposits, as well as other short-and medium-term deposits were the more preferred deposit categories during this period. Muted growth in notes and coin reflected a moderation in the transactions demand for cash during the fourth quarter of 2013, while growth in the demand for call and overnight deposits also decelerated significantly.
M3 holdings of households and companies
| | | | | | | | | | | | | | | | | | | | | | | | |
| | | Year-on-year change
(R billions) | | | Percentage holdings of
total M3 deposits | |
| | | 2011 | | | 2012 | | | 2013 | | | 2011 | | | 2012 | | | 2013 | |
Households | | | 59,5 | | | | 58,6 | | | | 67,9 | | | | 27,7 | | | | 28,8 | | | | 29,8 | |
Companies | | | 112,9 | | | | 58,0 | | | | 78,0 | | | | 72,3 | | | | 71,2 | | | | 70,2 | |
Of which: Financial | | | 34,4 | | | | 24,7 | | | | 31,1 | | | | 42,2 | | | | 41,1 | | | | 40,0 | |
Non-financial | | | 78,5 | | | | 33,3 | | | | 46,9 | | | | 30,1 | | | | 30,1 | | | | 30,2 | |
Total M3 deposits | | | 172,5 | | | | 116,6 | | | | 145,9 | | | | 100,0 | | | | 100,0 | | | | 100,0 | |
Overall, M3 money supply increased by R145,9 billion in 2013, more than the increase of R116,6 billion recorded in the previous year, but still well below the R172,5 billion recorded in 2011. Within the corporate sector, the deposit holdings of both financial and non-financial companies firmed during 2013, particularly in the first half of the year, while relatively sturdy growth in the deposit holdings of the household sector also contributed to the rise in money supply in 2013. However, after recording robust growth rates during 2012 and reaching a high of 13,9 per cent in August of that year, growth over twelve months in the M3 deposit holdings of the household sector slowed to 7,4 per cent in August 2013. Growth again regained some momentum during the final months of 2013 and improved to 10,0 per cent in December and 10,2 per cent in January 2014. Deposit growth of the corporate sector picked up from lacklustre growth in 2012 and was especially buoyant during the first months of 2013 when its twelve-month rate of increase reached a high of 10,3 per cent in April 2013, before receding steadily to 4,6 per cent in December. In January 2014, deposit growth of the corporate sector remained low at 4,9 per cent. Constrained profitability, labour disruptions and weak growth in employment creation continue to impact non-financial corporate and household deposits. Deposit growth of financial companies may have been dampened by robust conditions in selected financial markets which provide alternative investment avenues; in particular, significantly higher bond yields since May 2013 may have reduced the relative attractiveness of depository holdings.
| | |
| Quarterly Bulletin March 2014 | | |


Statistical counterparts of change in M3
R billions
| | | | | | | | | | | | | | | | | | | | |
| | | 2013 | |
| | | 1st qr | | | 2nd qr | | | 3rd qr | | | 4th qr | | | Year | |
Net foreign assets | | | 51,5 | | | | 45,1 | | | | 48,9 | | | | -3,0 | | | | 142,5 | |
Net claims on the government sector | | | -22,4 | | | | -6,0 | | | | 12,0 | | | | -12,6 | | | | -29,0 | |
Claims on the private sector | | | 30,4 | | | | 37,5 | | | | 46,4 | | | | 35,3 | | | | 149,7 | |
Net other assets and liabilities | | | -28,9 | | | | -23,9 | | | | -56,1 | | | | -8,5 | | | | -117,3 | |
Total change in M3 | | | 30,7 | | | | 52,7 | | | | 51,3 | | | | 11,2 | | | | 145,9 | |
In a statistical sense, the rise in M3 during the fourth quarter of 2013 was mainly attributable to an increase in claims on the private sector, brought about by continued growth in credit extension. The increase was, however, counteracted by a decline in all the other statistical counterparts. Net claims on the government sector declined in the fourth quarter due to an increase in government deposits which exceeded the rise in government securities held by the banking sector. Net other assets and liabilities declined due to an increase in other liabilities which resulted from a rise in the share capital and reserve holdings of the monetary sector.
The income velocity of circulation of M3 increased only marginally from 1,36 in the first quarter of 2011 to 1,38 throughout 2012 and recorded only minor fluctuations in 2013. Velocity came to 1,40 in the fourth quarter of 2013. The relatively subdued changes in the income velocity during the past two years indicate that growth in money supply generally kept pace with growth in nominal gross domestic product.
Credit extension
Moderate and slowing credit growth reflected the temperate economic conditions in 2013. Lingering uncertainty, precipitated by labour unrest in various industries, and caution among both lenders and borrowers contributed to subsiding growth in overall credit extension, although selected categories of credit extension maintained sturdy rates of increase.
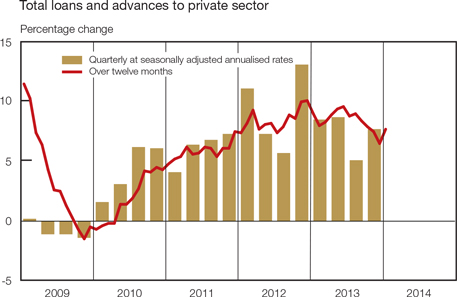
| | |
| | | Quarterly Bulletin March 2014 |
After gradually gaining momentum in the first six months of 2013 and registering an annual high of 9,5 per cent in June 2013, twelve-month growth in total loans and advances extended to the private sector receded to 7,4 per cent in November 2013 and further to 6,4 per cent in December. In January 2014, growth in total loans and advances improved somewhat to 7,6 per cent. The overall slowdown in credit extension could largely be ascribed to a moderation in credit extension to the household sector, which was further aggravated by high base values recorded in the final months of 2012.
The muted pace of increase in banks’ loans and advances to the domestic private sector was also reflected in the quarter-on-quarter seasonally adjusted and annualised growth rate which accelerated only marginally from 6,2 per cent in the third quarter of 2013 to 6,8 per cent in the fourth quarter.
An analysis of the relative growth performance of the different credit categories over the past four years highlights the structural change in the composition of credit since the 2009 recession. Mortgage loans, which were previously responsible for the bulk of the growth in total loans and advances, lost its popularity due to high non-performing loans and stringent collateral requirements, increased regulatory capital requirements, low profit margins for banks on long-term mortgage loans and an overhang of housing inventory. Owing to shorter maturities and more lucrative pricing structures, banks promoted general loans, a sub-category of other loans and advances, to the extent that it outperformed growth in mortgage advances throughout 2011 and 2012, although this drive lost momentum in 2013.
Composition of total loans and advances by type of credit
| | | | | | | | | | | | | | | | | | | | | | | | |
| Type of credit | | Year-on-year change
(R billions) | | | Percentage
of total
loans and advances* | |
| | | 2009 | | | 2012 | | | 2013 | | | 2009 | | | 2012 | | | 2013 | |
Household sector | | | | | | | | | | | | | | | | | | | | | | | | |
Instalment sale credit and leasing finance | | | -1,0 | | | | 27,9 | | | | 25,9 | | | | 8,0 | | | | 9,0 | | | | 9,5 | |
Mortgage advances | | | 26,8 | | | | 23,0 | | | | 18,9 | | | | 39,0 | | | | 34,5 | | | | 33,2 | |
Other loans and advances | | | 4,2 | | | | 65,4 | | | | 26,2 | | | | 8,6 | | | | 12,8 | | | | 13,1 | |
Overdrafts | | | -1,9 | | | | 3,7 | | | | 4,5 | | | | 1,4 | | | | 1,3 | | | | 1,4 | |
General loans | | | 9,0 | | | | 43,3 | | | | 11,4 | | | | 4,4 | | | | 8,2 | | | | 8,1 | |
Credit card advances | | | -3,0 | | | | 18,4 | | | | 10,3 | | | | 2,8 | | | | 3,4 | | | | 3,6 | |
Total loans and advances to the household sector | | | 30,0 | | | | 116,3 | | | | 71,0 | | | | 55,5 | | | | 56,3 | | | | 55,8 | |
Corporate sector | | | | | | | | | | | | | | | | | | | | | | | | |
Instalment sale credit and leasing finance | | | -14,1 | | | | 5,0 | | | | 12,8 | | | | 4,7 | | | | 3,7 | | | | 4,1 | |
Mortgage advances | | | 8,2 | | | | -2,6 | | | | 1,7 | | | | 14,9 | | | | 13,0 | | | | 12,3 | |
Other loans and advances | | | -34,4 | | | | 90,1 | | | | 61,4 | | | | 24,9 | | | | 26,9 | | | | 27,8 | |
Overdrafts | | | -7,8 | | | | 0,6 | | | | 6,4 | | | | 5,4 | | | | 4,7 | | | | 4,7 | |
General loans | | | -28,0 | | | | 88,7 | | | | 52,9 | | | | 19,3 | | | | 22,1 | | | | 22,9 | |
Credit cards advances | | | 1,4 | | | | 0,9 | | | | 2,1 | | | | 0,2 | | | | 0,2 | | | | 0,2 | |
Total loans and advances to the corporate sector | | | -40,4 | | | | 92,5 | | | | 75,9 | | | | 44,5 | | | | 43,7 | | | | 44,2 | |
Total loans and advances to the private sector | | | -10,4 | | | | 208,9 | | | | 147,0 | | | | 100,0 | | | | 100,0 | | | | 100,0 | |
| * | Expressed as a percentage of outstanding balances of total loans and advances (excluding investments and bills discounted) |
Growth in general loans to households recorded a significant moderation in 2013 and contributed to a marked decline in the contribution of other loans and advances to growth in banks’ total loans and advances, from 74 per cent in 2012 to 60 per cent in 2013. Twelve-month growth in other loans and advances decelerated from 17,2 per cent in January 2013 to 9,6 per cent
| | |
| Quarterly Bulletin March 2014 | | |


in December – the first single-digit growth since June 2011. Despite the recent decline, other loans and advances remained the dominant driver behind growth in total loans and advances extended to the private sector for 2013 as a whole.
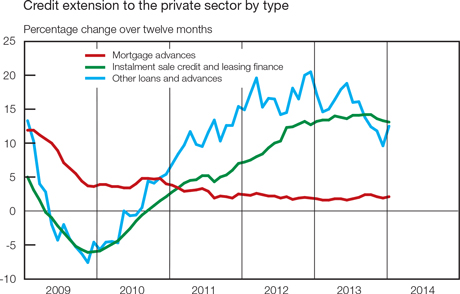
Growth in general loans to households, a proxy for unsecured lending, appears to have peaked in 2012, with twelve-month growth in this category of lending posting fourteen consecutive months of slowing growth up to January 2014. The slowdown is even more pronounced when measured over three months: in the three months to the end of January 2014, annualised growth was 4,8 per cent, compared with rates of increase in excess of 30 per cent during 2012. The moderation reflects a combination of factors, including greater caution on the part of lenders in an attempt to limit credit impairments and improve risk profiles; increased regulatory scrutiny of this type of lending; continued financial pressure experienced by highly indebted households amid constrained income growth and – in instances of strike activity and retrenchments – loss of income; and sustained high unemployment.
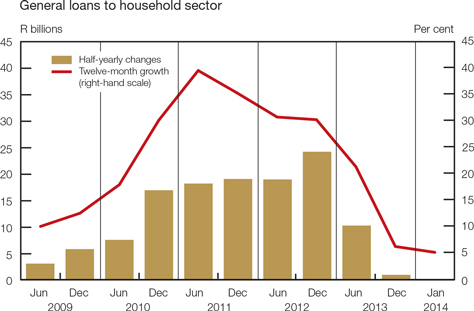
| | |
| | | Quarterly Bulletin March 2014 |
Notwithstanding a mild improvement in the contribution of mortgage advances towards overall growth in total loans and advances, year-on-year growth in mortgage advances remained fairly flat and averaged around 1,9 per cent in 2013, in line with relatively low volume growth in the housing market. In January 2014, growth over twelve months in these advances came to 2,1 per cent.
Instalment sale credit and leasing finance posted incrementally slower growth in the second half of 2013, but nonetheless continued to support overall growth in credit extension. Twelve-month growth reached a post-recession high of 14,2 per cent in October 2013, before moderating to 13,3 per cent in December and 13,1 per cent in January 2014, alongside declining momentum in durable goods sales and vehicle sales in particular, which became more pronounced from August 2013.
The overall increase in total loans and advances extended to the private sector amounted to R147 billion in 2013, significantly lower than the increase of R209 billion recorded in the previous year. This deterioration was mainly indicative of a substantial moderation in household credit which commenced from the end of 2012 and continued throughout 2013.
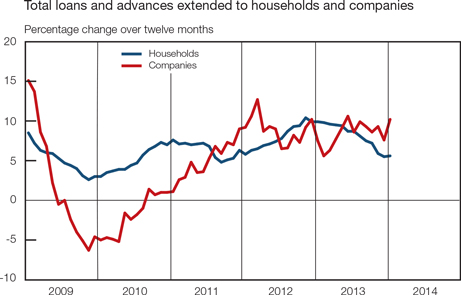
Households’ reliance on bank-intermediated funding slowed across all the main credit categories in recent months, with general loans being the main contributor towards the stepwise moderation. Twelve-month growth in loans and advances to the household sector receded from 9,9 per cent in January 2013 to 5,5 per cent in December, representing its lowest level since October 2011. The combination of lustreless consumer confidence, financial pressure experienced by highly indebted households amid constrained income growth and high unemployment, and the more cautious approach to the granting of unsecured credit continue to dampen the household sector’s utilisation of credit. In addition, the lingering stickiness in pre-existing debt levels as well as the recent 50 basis point rise in the repurchase rate may present a further impediment to incremental credit uptake by households, Loans and advances to the household sector expanded by 5,6 per cent year on year in January 2014.
The expansion in corporate credit growth initially lagged behind that of the household sector from mid-2012, but continued to improve and eventually surpassed that of the household sector in the latter part of 2013 to become the dominant driver behind the increase in total loans and advances extended to the private sector. The corporate sector’s appetite for bank credit was fairly resilient in 2013, largely on account of an uptake of general loans by companies. Year-on-year growth in loans and advances to companies fluctuated between 7 and 10 per cent from April to December 2013 and came to 10,2 per cent in January 2014. However, the uncertainty brought about by weak domestic economic growth and the fractious labour environment could further hamper business confidence and may continue to restrain fixed investment and the demand for credit in the short term.
| | |
| Quarterly Bulletin March 2014 | | |


Interest rates and yields
Following 18 months of an unchanged monetary policy stance, the Monetary Policy Committee (MPC) raised the repurchase rate to 5,5 per cent at its January 2014 meeting. This decision followed in the wake of the continued depreciation of the rand and the concomitant risk posed to the inflation outlook. The gradual withdrawal of quantitative easing by the US Federal Reserve also created a challenging environment for emerging markets, including South Africa, leading to sharply depreciating currencies, capital outflows, slowing growth, rising inflation and deteriorating confidence. The headline inflation forecast of the Bank was revised upwards mainly due to revisions to the assumptions regarding the rand exchange rate. Inflation is now expected to breach the upper end of the target range in the second quarter of 2014 and to reach a peak of 6,6 per cent in the final quarter of the year, before declining to 6,0 per cent in the second quarter of 2015. For the full statement of the MPC, see page 83 of this Quarterly Bulletin.
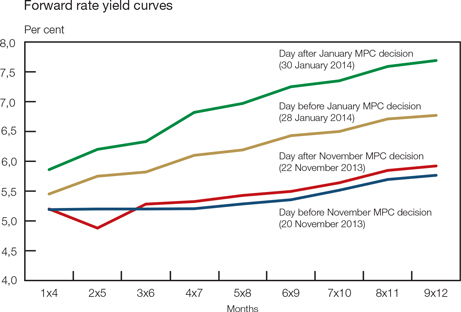
The May 2013 announcement by the US Federal Reserve of the intention to start the tapering of its policy of quantitative easing, and the concomitant impact on financial markets, resulted in forward rate agreements (FRAs) across the maturity spectrum starting to discount the possibility of an interest rate increase. For example, the 9x12-month FRA increased by 179 basis points from a recent low of 4,75 per cent on 9 May 2013 to 6,54 per cent on 11 June, although rates moderated somewhat towards the end of December. Longer-term FRA rates again rose sharply in the build-up to the MPC meeting (which coincided with the meeting by the US Federal Reserve) in January 2014 and escalated further after the policy rate was raised by 50 basis points, with the 9x12-month rate reaching a high of 7,83 per cent on 31 January 2014. Rates across the maturity spectrum generally increased after the rise in the policy interest rate was announced on 29 January, with the 3x6-month FRA rising by more than a hundred basis points from 5,39 per cent on 2 January 2014 to 6,43 per cent on 31 January 2014. Forward rates moderated somewhat towards the end of February with the 9x12-month FRA declining to 7,38 per cent and the 3x6-month FRA recording 6,34 per cent. However, at these levels forward rates still indicate market expectations of further interest rate increases in 2014.
| | |
| | | Quarterly Bulletin March 2014 |

Money-market rates moved broadly sideways during the fourth quarter of 2013, with longer-dated instruments generally moving in conformity with fluctuations in the exchange value of the rand. For example, the twelve-month Johannesburg Interbank Average rate (Jibar) increased by 35 basis points from 19 October 2013 to 6,13 per cent on 12 November, as market participants reacted to the first step in the unwinding of the US Federal Reserve’s monetary stimulus programme. The rate fluctuated sideways during December 2013 before starting to rise prior to the MPC meeting in late January 2014 due to heightened risk aversion towards emerging markets and labour unrest in the mining sector. The benchmark three-month Jibar recorded only modest fluctuations during the last quarter of 2013 as it increased from 5,13 per cent on 30 September 2013 to 5,23 per cent on 3 January 2014. The rate rose sharply to 5,68 per cent on 31 January 2014 following the increase in the repurchase rate and remained at that level to the end of February.
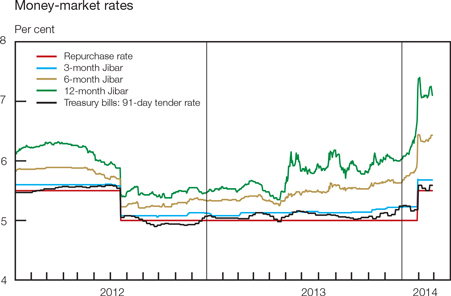
Funding conditions in the South African overnight interbank market remained largely accommodative during the final months of 2013. As is usually the case, some liquidity strains were experienced towards the end of the year due to typical seasonal demand factors. The implied rate on one-day rand funding in the foreign-exchange market (overnight FX rate)
| | |
| Quarterly Bulletin March 2014 | | |


displayed relatively high volatility between 19 and 21 December 2013, and breached the upper end of the standing facility band of 6,0 per cent on two occasions. However, liquidity conditions normalised thereafter, with the overnight FX rate again decreasing to well within the standing facility ranges. The rate also followed the change in the policy interest rate higher and increased from 4,85 per cent on 28 January 2014 to 5,23 per cent on 28 February.
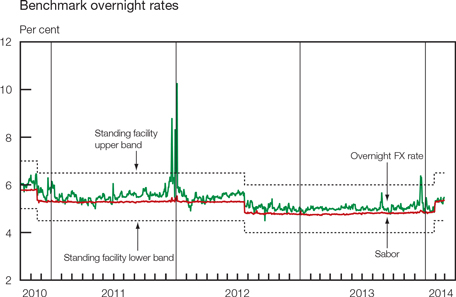
The South African Benchmark Overnight Rate on Deposits (Sabor) also increased from 4,88 per cent on 29 January 2014 to 5,33 per cent on 28 February after the change in the repurchase rate. Prior to that, the rate had remained fairly stable and well within the standing facility limits during the fourth quarter of 2013, fluctuating in a narrow band of between 4,79 and 4,93 per cent.
The prime lending rate and predominant rate on mortgage loans increased to 9,00 per cent following the 50 basis point increase in the repurchase rate at the end of January 2014.
Nervousness in the local bond market became evident from May 2013, as bond yields rose following the warnings by the US Federal Reserve of imminent curtailment of quantitative easing, the depreciation in the exchange value of the rand and the sell-off of local bonds by non-residents. After a short recovery from the end of August to October, bond yields once more soared to February 2014 in response to the prominent selling of domestic bonds by non-residents, a noticeably weaker rand and escalating inflation expectations following the actual start of liquidity withdrawal by the US Federal Reserve. The average yield on the South African R186 government bond (maturing in 2025/26/27) was 193 basis points higher at the end of February 2014 compared with the low recorded on 3 May 2013. Rising yields were not restricted to South Africa only, as a range of emerging-market economies found themselves in the same boat.
Following these developments in the local bond market, the yield curve moved higher from May 2013 across the maturity spectrum except at the extreme short end, which was anchored by the unchanged central bank policy rate. After the repurchase rate was raised in January 2014, bond yields in the short- to medium-term maturity range increased, reflecting the higher anchor rate and revised expectations informed by the policy adjustment, while the longer end of the curve flattened. The yield gap, measured as the difference between yields at the extreme long and short ends of the curve, therefore narrowed from 466 basis points on 22 August 2013 to 377 basis points on 28 February 2014.
| | |
| | | Quarterly Bulletin March 2014 |
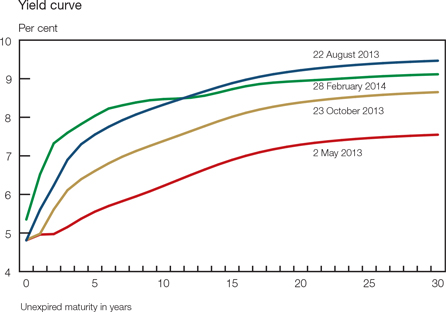
The increase in local bond yields also filtered through to the retail bond market of the National Treasury. Coupon rates on fixed-rate retail bonds were raised by 50 basis points across all maturities in February 2014 and by a further 25 basis points in March. Previously the relative attractiveness of other savings instruments had dampened demand for retail bonds. The amount in issue of all retail bonds, however, declined by R0,4 billion in 2012 and R2 billion in 2013.
Against the backdrop of the increase in the repurchase rate in January 2014, the deterioration in inflation expectations and the depreciation in the exchange value of the rand, the currency risk premium6 on South African government bonds widened towards the shorter end of the maturity spectrum. This was reflected in the increase of 134 basis points from October 2013 to February 2014, as yields on rand-denominated bonds increased while yields on dollar-denominated bonds, on balance, declined.
The JPMorgan Emerging Markets Bond Index Plus (EMBI+)7 yield spread above US government bonds fluctuated wider since 2013 to reach 348 basis points in February 2014. This largely reflected the pressure on emerging markets arising from the US Federal Reserve’s
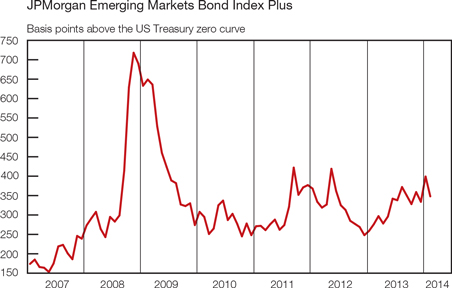
| | |
| Quarterly Bulletin March 2014 | | |


tapering of its stimulus programme. Emulating these developments, the sovereign risk premium on South African government US dollar-denominated bonds in the ten-year maturity range trading in international markets also widened noticeably from 170 basis points in May 2013 to 233 basis points in February 2014.
Money market
Money-market liquidity conditions were characterised by heightened volatility during the fourth quarter of 2013 and the first two months of 2014. The liquidity requirement of the private-sector banks widened significantly during this period and occasionally registered values in excess of the estimated weekly liquidity requirement. The actual daily money-market liquidity requirement varied within a broad range of R20,0 billion to R40,2 billion during the fourth quarter, compared with a range of between R17,6 billion and R31,2 billion during the third quarter of 2013.
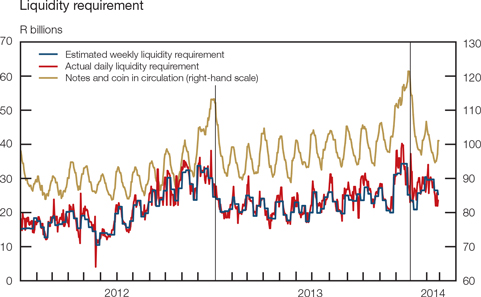
During the fourth quarter of 2013, liquidity to the net amount of R4,6 billion was injected into the money market, compared to a net drainage of R1,8 billion recorded in the preceding quarter. During the fourth quarter, notes and coin in circulation and banks’ required cash reserve deposits cumulatively drained liquidity to the value of R16,5 billion, mainly resulting from a greater demand for cash by the public during the festive season. The drainage was more than offset by the use of liquidity management instruments which served to inject R17,6 billion worth of liquidity into the money market. Of this total, maturing SARB debentures served to expand the market by R4,1 billion.
In January and February 2014 these mainly seasonal movements in money-market liquidity were reversed: notes flowed back to the Bank, allowing the use of liquidity-draining instruments to be curtailed.
Capital redemption payments and scheduled coupon interest payments on various government bonds amounting to R13,7 billion were effected from the government tax and loan accounts during the final quarter of 2013.
| | |
| | | Quarterly Bulletin March 2014 |
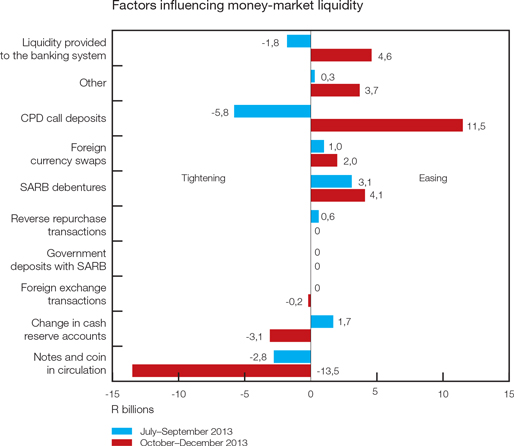
Bond market
Bond issuances by the public sector in the local primary bond market remained strong during 2013, in response to the sector’s eminent funding needs. Total net bond issues by the public sector amounted to R193 billion in 2013, which was only slightly higher than the R191 billion raised in 2012. However, general demand for government bonds continued to cover issuance by a sound margin with the average bid-to-cover ratio of 2,7 reached during auctions in 2013, signalling a strong market although bond yields trended higher from May 2013. Against the background of South Africa’s first listed corporate bond default, net bond issuances by the private sector progressed at a noticeably slower pace in 2013, dragged lower by subdued issuances by both
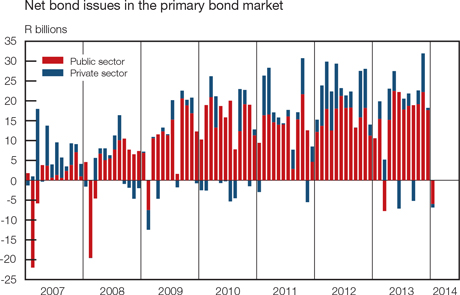
| | |
| Quarterly Bulletin March 2014 | | |

banks and non-bank issuers. The net issues of R30 billion made by the private sector in 2013 were considerably less than the net issues of R80 billion recorded in 2012. The total outstanding nominal value of all debt securities listed on the JSE declined by R6,9 billion in January 2014, as the R206 government bond matured, and reached R1,9 trillion at the end of January.
Turnover in the secondary bond market abated in 2013, on account of reduced participation by non-residents and higher bond yields. The daily average turnover declined from a high of R120 billion per day in June 2013 to a low of R58 billion in December. This resulted in daily average turnover of R89 billion in 2013, which was 11 per cent lower than in 2012. The liquidity ratio8 declined from a ratio of 14 times per annum in 2012 to 11 times in 2013, as the nominal value of bonds listed increased while turnover subsided. Given the negative investor sentiment and downward repricing from May 2013, the All-Bond Index (Albi) recorded a marginal increase of only 1 per cent in 2013, after recording a substantial gain of 16 per cent in 2012. In the first two months of 2014 daily turnover averaged R81 billion.
The issuances of rand-denominated bonds by non-residents in the European bond markets in 2013 exceeded those in 2012 by R10 billion, as issuers consistently used these instruments for investment diversification. On the contrary, issuances of rand-denominated bonds in the Japanese Uridashi bond market remained broadly on the same level in 2012 and 2013, with elevated redemptions overshadowing issues in 2013. These contributed to net issues in both markets amounting to R3,0 billion in 2013, which were more than the net issues of R0,1 billion registered in 2012. In January and February 2014 net issues in both markets amounted to R5,5 billion.
Rand-denominated bonds issued in international bond markets, January to December
| | | | | | | | | | | | | | | | | | | | | | | | |
| R millions | |
| | | Eurorand | | | Uridashi | | | Total | |
| | | 2012 | | | 2013 | | | 2012 | | | 2013 | | | 2012 | | | 2013 | |
Issues | | | 9 305 | | | | 19 644 | | | | 10 622 | | | | 10 251 | | | | 19 926 | | | | 29 895 | |
Redemptions | | | 8 975 | | | | 10 460 | | | | 10 811 | | | | 16 461 | | | | 19 786 | | | | 26 921 | |
Net | | | 330 | | | | 9 184 | | | | -190 | | | | -6 210 | | | | 140 | | | | 2 974 | |
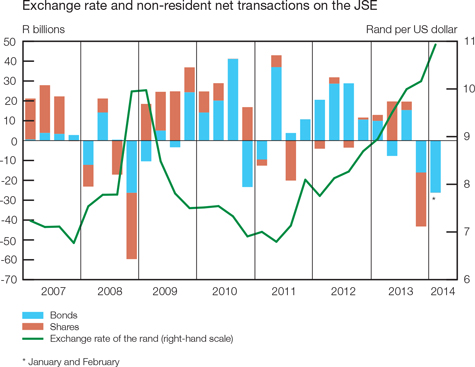
| | |
| | | Quarterly Bulletin March 2014 |
Given non-residents’ risk aversion towards emerging-market assets, their holdings of domestic bonds wavered. After recording net purchases of R15 billion in the third quarter of 2013, non-residents reduced their holdings of domestic bonds by R16 billion in the fourth quarter. On an annual basis, net purchases of local bonds by non-residents amounted to only R1,5 billion in 2013, compared with record-high net purchases of R89 billion in 2012. The sell-off continued in 2014 with further net sales by non-residents of local bonds amounting to R26 billion in the first two months of 2014.
Share market
Notwithstanding the fragile domestic economic outlook, companies continued to attract healthy levels of equity funding in 2013. Equity capital raised in the primary share market by companies listed on the JSE amounted to R93 billion in 2013, which was 19 per cent higher than the amount raised in 2012. This trend was mainly underpinned by companies in the financial sector, which accounted for 58 per cent of the total equity capital raised in 2013. Two deals by banks contributed nearly half of the financial sector’s equity funding in 2013. The increase in the value of new shares issued was despite the lower number of companies listed on the JSE, as delistings exceeded new listings for the fifth consecutive year in 2013. Company listings on the main board came to 322 at the end of February 2014, while 60 companies were listed on AltX and 3 on the development and venture capital boards. During 2013, the most noticeable method of raising capital was the issuance of shares for the acquisition of assets or merging with another company. Equity financing amounted to R20 billion in the first two months of 2014.
Number of listings on the JSE
| | | | | | | | | | | | | | | | | | | | | | | | |
| | | AltX | | | Africa, venture and
development
capital boards | | | Main
board | | | Total | | | New
listings:
Total for
the year | | | Delistings:
Total for
the year | |
December 2011 | | | 66 | | | | 8 | | | | 332 | | | | 406 | | | | 16 | | | | 17 | |
December 2012 | | | 63 | | | | 5 | | | | 332 | | | | 400 | | | | 12 | | | | 18 | |
December 2013 | | | 59 | | | | 5 | | | | 322 | | | | 386 | | | | 12 | | | | 26 | |
February 2014 | | | 60 | | | | 3 | | | | 322 | | | | 385 | | | | 2 | | | | 3 | |
Soaring share prices contributed to a 16 per cent increase in daily average turnover in the secondary share market from R14 billion traded per day in 2012 to R16 billion in 2013 – the highest daily average turnover in any calendar year. Subsequently, average daily turnover remained at R16 billion in the first two months of 2014. Aligned with higher share prices, the market capitalisation of the JSE benefited as it increased by 24 per cent from a recent low in June 2013 to reach a high of R10,6 trillion in December. Consequently, market liquidity9 declined from 41 per cent in 2012 to 37 per cent in 2013. Market capitalisation receded somewhat in early 2014 on the back of lower share prices, but recovered to a new record level of R11,0 trillion in February.
After recording net purchases of R27,0 billion in the first three quarters of 2013, non-residents more than offset these with net sales of R27,2 billion in the fourth quarter of 2013. This resulted in net sales of R0,2 billion in 2013, compared with net sales of R3,4 billion recorded in 2012. Non-residents continued to reduce their holdings of local shares to a net amount of R83 million in the first two months of 2014.
Domestic share prices continued to reach record-high levels in early 2014. For example the FTSE/JSE All-Share Price Index (Alsi) increased by 26 per cent from a recent low of 37 802 index points on 17 April 2013 to an all-time high of 47 603 index points on 4 March 2014. This was a result of, among other things, the depreciation in the exchange value of the rand, increased liquidity and higher international share prices. The Alsi, however, subsided somewhat towards the end of 2013 in line with lower international share markets, the selling of local shares by non-residents and the adverse effect of the platinum-mining strikes. Global share markets were affected by concerns
| | |
| Quarterly Bulletin March 2014 | | |


about the slowing growth in China, the uncertainty about when and whether the US Federal Reserve will make another cut to its bond-buying programme, the capital outflows from emerging markets and weak US corporate earnings.
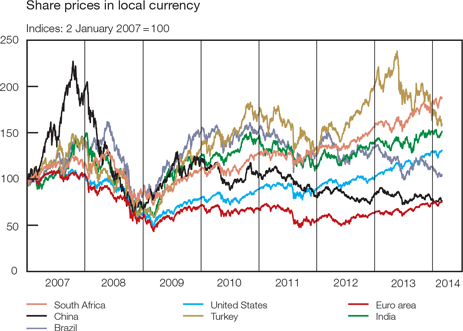
Alongside lacklustre real economic growth, total profits made by all companies listed on the JSE declined by 3 per cent from 2012 to 2013. Consequently, the average price-earnings ratio on the JSE soared from 14,0 in 2012 to 17,7 in 2013. The average dividend yield declined to 2,4 per cent in 2013.
Market for exchange-traded derivatives
The 2,8 million commodity futures and options contracts traded on the Commodity Derivatives Market of the JSE in 2013 was 7 per cent lower than the number of contracts traded in 2012. During most of 2013, local grain prices were suppressed by lower international prices. Increased export demand for local grains, the weaker exchange value of the rand and projections of tight grain supplies following the smallest white maize harvest since 2007, reversed this lower trend from late 2013 when domestic agricultural prices started to increase. Dry weather concerns in
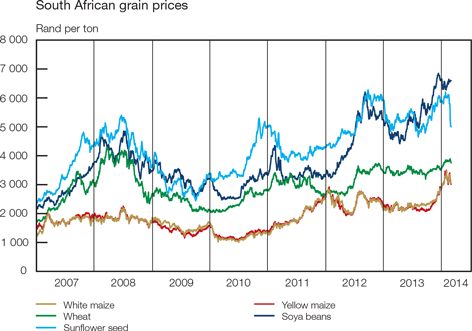
some of the key grain-producing areas, aggravated by grain quality concerns, strengthened prices further.
| | |
| | | Quarterly Bulletin March 2014 |
The trading volume of 36 million contracts recorded in the interest rate and currency derivatives markets of the JSE during 2013 was 84 per cent higher than in 2012, with the currency market alone contributing 90 per cent to the total trading activity during this period. Increased interest in this market is attributable to the continual introduction of products that have been refined to meet investor needs, while the weaker domestic currency continued to account for increased turnover. A further 7,1 million contracts were traded in the interest rate and currency derivatives markets during the first two months of 2014. Turnover in all derivatives traded on the JSE during 2013 and the first two months of 2014 is indicated in the table below.
Derivatives turnover on the JSE
| | | | | | | | | | | | | | | | |
| Type of derivative | | Value
(R billions) | | | Change over
one year
(Per cent) | |
| | | 2013 | | | Jan–Feb 2014 | | | 2013 | | | Jan–Feb 2014 | |
Equity | | | 5 062 | | | | 767 | | | | 17 | | | | 37 | |
Warrants | | | 1 | | | | 0,1 | | | | -12 | | | | 37 | |
Commodity | | | 490 | | | | 94 | | | | -4 | | | | 13 | |
Interest rate | | | 516 | | | | 125 | | | | 59 | | | | -19 | |
Currency | | | 335 | | | | 76 | | | | 113 | | | | 131 | |
Real-estate market
House price inflation remained moderate in 2013, affected by slow economic activity, limited growth in employment, subdued consumer confidence as well as the poor state of household finances being exacerbated further by inflation continuing to erode spending power. Nevertheless, housing rental inflation, which averaged 4,5 per cent in 2012, increased to 4,8 per cent in 2013. All three housing market segments recorded year-on-year price increases by the end of 2013, with the affordable segment recording only 4 per cent and the middle segment 9 per cent. Although the average time residential properties remained on the market increased from 14,5 weeks in the third quarter of 2013 to 15,1 weeks in the fourth quarter, on average, the time on the market in 2013 was the same as in 2012. The recent increase in the repurchase rate may also weigh upon future house price inflation. The overall seasonally adjusted value of turnover in the real-estate market, proxied by transfer duty collected, was 25 per cent higher in 2013 when compared with 2012.
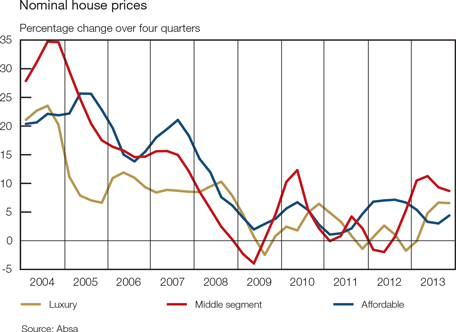
| | |
| Quarterly Bulletin March 2014 | | |


Non-bank financial intermediaries
Activity in non-bank financial institutions10 was spurred by an increase in inflows and higher equity prices during 2013. The gross inflows11 to these institutions increased by a marked 20 per cent from 2012 to R1,9 trillion in 2013, despite the deterioration in real economic growth. These flows were supported by a rise in premiums received by insurance companies and higher unit trust sales. Gross inflows were also lifted by an increase in investment income which, among other things, benefited from the rally in share prices. The ratio of gross inflows to gross domestic product increased from 51 per cent in 2012 to 57 per cent in 2013.
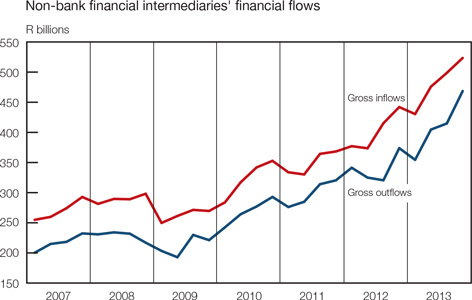
From 2012 to 2013 inflows received by unit trusts surged by 20 per cent to R1,1 trillion due to an increase in new investments, including re-investments in fixed-interest and multi-asset classes, which provide investors with stable returns and diversification benefits. Premiums received by insurance companies increased by 23 per cent over the same period to R627 billion in 2013, following an increase in employer-based premiums. The impact of weak economic conditions was probably reflected in the slow growth of 9 per cent in inflows to pension and provident funds over the same period.
The growth in gross outflows12 matched that of inflows in 2013, increasing by 20 per cent from 2012 to R1,6 trillion in 2013, following higher claims paid and surrenders reported by insurance companies. Outflows from unit trusts increased by 19 per cent to R1,0 trillion in 2013. As a result, the net inflows13 (a proxy for investable funds) received by these institutions grew by 17 per cent from 2012 to R286 billion in 2013. These funds supported investment in the economy as they were used to buy shares and bonds in 2013. The net acquisition of financial assets by these intermediaries increased from R419 billion in 2012 to R528 billion in 2013.
The net flows to private pension funds were somewhat subdued in 2013, as benefits paid to members remained slightly higher compared with the previous year. Growth in the industry’s inflows is likely to depend on factors such as the ebb and flow of economic activity, households’ disposable income and financial market conditions.
The total assets of the non-bank financial intermediaries increased by 10 per cent from 2012 to R6,9 trillion in 2013, due to a combination of an increase in asset prices – especially share prices – and net inflows over the same period. An increase in the asset base was mostly recorded in the holdings of equities and fixed-interest securities, which respectively accounted for 56 per cent and 28 per cent of total assets in 2013.
| | |
| | | Quarterly Bulletin March 2014 |
Flow of funds
Despite sluggish economic conditions, financial intermediaries’ total flows increased during the third quarter of 2013. Bank loans and advances rose by R37 billion, of which 37 per cent was absorbed by other non-bank financial institutions. Over the same period bank deposits from households, corporate business enterprises and general government increased by R33 billion.
The general government sector incurred a financing deficit of R63 billion in the third quarter of 2013. Not only did spending by national and provincial government exceed revenue, partly for anti-cyclical reasons, but buoyed by expenditure on water and sanitation projects, local government spending outpaced municipal revenue over the same period. The general government sector met the shortfall by issuing long-term bonds amounting to R53 billion, short-term bonds of R20 billion and Treasury bills amounting to R7,7 billion. Given the domestic liquid financial markets, the appetite for domestic debt securities remained satisfactory and government continued to participate in the global capital markets to diversify the funding instruments used.
Capital formation by the non-financial corporate business enterprises sector was maintained at a moderate pace during the third quarter of 2013. The public non-financial business enterprises’ capital formation increased by 19 per cent to R35 billion from the amount recorded in the second quarter of 2013, with expenditure mainly evident in the electricity and transport sectors. Capital formation by private non-financial business enterprises amounted to R90 billion in the third quarter of 2013, driven by the acquisition of machinery and equipment in the mining sector. Total non-financial corporate business enterprises incurred a financial deficit of R26 billion, which was met through loan funding and issuances of equities.
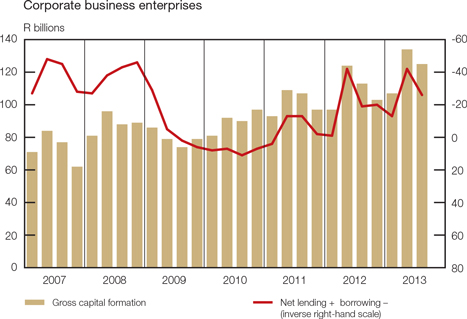
In line with subdued economic conditions, the household sector’s total flows both on the asset and the liability side of the balance sheet moderated to R44 billion, while the sector recorded a surplus position of R12 billion in the third quarter of 2013. Financial pressure experienced by highly indebted households and constrained creditworthiness was exacerbated by high unemployment and limited income growth. On the other side of the balance sheet, households’ total deposits and interest on retirement and life funds increased by R35 billion collectively over the same period.
| | |
| Quarterly Bulletin March 2014 | | |

Public finance14
Non-financial public-sector borrowing requirement15
A significantly higher cash deficit recorded by the non-financial public enterprises and corporations resulted in a widening of the non-financial public-sector borrowing requirement in the first nine months of fiscal 2013/14, relative to the same period a year earlier. With the exception of national government and the non-financial public enterprises and corporations, all other levels of government recorded cash surpluses, as indicated in the accompanying table. For the period under review, the non-financial public-sector borrowing requirement amounted to R157 billion – some R7,7 billion higher than in April to December 2012.
Relative to gross domestic product, the non-financial public-sector borrowing requirement remained broadly unchanged at 6,1 per cent in April–December 2013 when compared with a ratio recorded in the same period a year ago. The table below summarises the financial activities of the non-financial public sector at various levels of government.
Non-financial public-sector borrowing requirement
R billions
| | | | | | | | |
| Level of government | | Apr–Dec 2012* | | | Apr–Dec 2013* | |
Consolidated general government | | | 113,0 | | | | 97,9 | |
National government | | | 136,6 | | | | 122,1 | |
Extra-budgetary institutions | | | -4,8 | | | | -5,0 | |
Social security funds | | | -11,2 | | | | -8,7 | |
Provincial governments | | | -7,7 | | | | -7,5 | |
Local governments | | | 0,1 | | | | -3,1 | |
Non-financial public enterprises and corporations | | | 36,1 | | | | 58,9 | |
Total** | | | 149,1 | ** | | | 156,8 | ** |
As percentage of gross domestic product | | | 6,2 | | | | 6,1 | |
| ** | Components may not add up to totals due to rounding |
The borrowing requirement of the consolidated general government amounted to R98 billion in April–December 2013 – some R15 billion less than in the same period of 2012. As a ratio of gross domestic product, the consolidated general government borrowing requirement amounted to 3,8 per cent and 4,7 per cent between these respective dates.
In the first nine months of fiscal 2013/14, the non-financial public enterprises and corporations recorded a preliminary cash deficit of R59 billion – some R23 billion higher when compared with the cash deficit recorded in the same period of the previous fiscal year. The widening of the cash deficit was on account of pronounced growth in total expenditure, which outpaced the slower growth in total receipts. Expenditure of a current nature increased briskly, spread across all the main categories, whereas capital expenditure moderated over the period.
Net investment in non-financial assets by the non-financial public enterprises and corporations decreased by R5,6 billion to amount to R80 billion during the first three quarters of fiscal 2013/14. The Budget Review 2013 indicated that R130 billion in infrastructure investment would be undertaken by the non-financial public enterprises and corporations in fiscal 2013/14 as a whole, with Eskom and Transnet respectively accounting for 55,5 and 28,8 per cent of this investment.
An analysis of national government finance statistics indicated that cash receipts from operating activities amounted to R668 billion, an increase of 12,0 per cent in the first three quarters of fiscal 2013/14 compared with the same period a year earlier. The rising receipts resulted predominantly from a double-digit rate of increase in tax revenue. All major tax categories contributed to this increase.
| | |
| | | Quarterly Bulletin March 2014 |
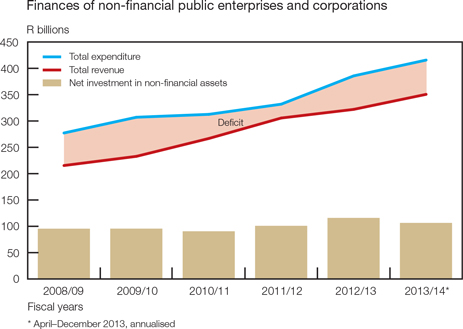
Cash payments for operating activities increased by 7,8 per cent year on year and totalled R783 billion in the first nine months of fiscal 2013/14. Grants paid by national government accounted for more than half of the total cash payments for operating activities. Included in grants are equitable share transfers and conditional grants – earmarked for specific purposes – to provinces, amounting to R312 billion. Net cash flow from operating activities, together with net investment in non-financial assets, resulted in a cash deficit of R122 billion – roughly R15 billion lower than the cash deficit recorded in April–December 2012.
In the first three quarters of fiscal 2013/14, provincial governments’ financial activities resulted in a cash surplus of R7,5 billion. This was R0,3 billion less than the cash surplus recorded in the corresponding period of the preceding fiscal year. Total provincial government revenue amounted to R322 billion during the first nine months of fiscal 2013/14, representing a year-on-year rate of increase of 7,0 per cent. This growth rate was mainly driven by grants from national government, which included equitable share transfers and conditional grants.
Provincial government expenditure amounted to R314 billion in April–December 2013 – some 7,3 per cent more than in the same period a year earlier. Growth in provincial government expenditure was mainly driven by personnel expenditure. This expenditure category accounted for 60,8 per cent of total provincial expenditure in the period under review. As government demonstrated its commitment towards improving the quality of life of all South Africans, greater emphasis was placed on social spending such as education and health. Spending on these functions amounted to R232 billion or 73,9 per cent of total provincial government expenditure.
Net investment in non-financial assets by this level of government amounted to R20,9 billion between April and December 2013. This represented an increase of 7,1 per cent when compared with the corresponding period in 2012. Spending among provinces for this spending category ranged from the highest share of 30,6 per cent in KwaZulu-Natal, to the lowest share of 5,2 per cent in Northern Cape.
Provincial governments’ deposits with the Corporation for Public Deposits increased from R7,4 billion at the end of March 2013 to R14,4 billion at the end of December. At the same time, their deposits with private banks decreased from R14,9 billion to R14,6 billion, while their overall indebtedness to banks increased from R1,9 billion to R2,0 billion.
Financial activities of the consolidated local government, as presented in the Quarterly Financial Statistics (QFS) published by Stats SA, recorded a net cash-flow surplus from operating activities of R43,0 billion during the first nine months of fiscal 2013/14. This outcome, together with net
| | |
| Quarterly Bulletin March 2014 | | |


investment in non-financial assets, resulted in a cash surplus of R3,1 billion, in contrast with the cash deficit of R0,1 billion recorded in the same period a year earlier. The cash surplus could be attributed to a higher growth rate in cash receipts, which outperformed the average growth rate in both cash payments for operating activities and net investment in non-financial assets.
Cash receipts from operating activities increased by 9,6 per cent, to amount to R214 billion during the first three quarters of fiscal 2013/14. Municipal cash receipts are derived from two sources, namely, intergovernmental transfers and municipal own revenue. The latter remained the main source of municipal cash receipts and constituted 73,3 per cent of total revenue in April–December 2013.
For the period under review, cash payments continued to follow an upward trajectory, and amounted to R171 billion. This is 7,4 per cent more than the cash payments recorded in April–December 2012. The bulk of the expense can be related to purchases of water and electricity as well as compensation of employees, which together accounted for 59,8 per cent of the total for the period under review. The rise in municipal interest payments increased by 15,2 per cent to amount to R5,4 billion in April–December 2013, relative to the same period a year ago.
Extra-budgetary institutions recorded a cash surplus of R5,0 billion in the first nine months of fiscal 2013/14 – moderately higher than the cash surplus of R4,8 billion recorded in the same period a year earlier. The higher cash surplus can be attributed to a substantial year-on-year rate of increase in grants received from national government which rose by 9,7 per cent and amounted to R87 billion in April to December 2013.
Preliminary estimates indicate that the cash surplus of social security funds amounted to R1,5 billion in the October–December quarter of 2013, bringing their cash surplus to R8,7 billion in the first nine months of fiscal 2013/14. This was R2,5 billion less than the surplus recorded in the same period of 2012/13. The deterioration in the cash surplus can be attributed to a significant rise of 22,5 per cent in social benefits being paid to beneficiaries, which amounted to R21,0 billion in the period under review.
Budget comparable analysis of national government finance
In the first nine months of fiscal 2013/14, spending by national government was in line with the revised (October 2013 Medium Term Budget Policy Statement (MTBPS)) projections, while national government revenue increased faster than the revised budgeted projections for the full fiscal year. Accordingly, the magnitude of the cash-book deficit was smaller when compared with the cash-book deficit for the same period in fiscal 2012/13.
National government expenditure amounted to R765 billion in the first nine months of fiscal 2013/14, representing a year-on-year rate of increase of 8,8 per cent. This increase was lower than the originally budgeted increase of 9,5 per cent for the full fiscal year, but in line with the ratio of 8,8 per cent indicated in the MTBPS 2013.
As a ratio of gross domestic product, national government expenditure amounted to 29,7 per cent in April–December 2013, compared with 29,4 per cent in the same period a year earlier.
Higher spending was notable in current payments along with transfers and subsidies by various departments, which recorded strong growth in the first nine months of fiscal 2013/14. The Justice, Crime Prevention and Security Cluster contributed 75,3 per cent of total current payments and was mainly driven by the Departments of Police as well as Defence and Military Veterans, of which Police contributed 52,1 per cent. Increased current payments by the latter department resulted from additional funding allocated for higher remuneration costs.
Transfers and subsidies grew by 7,8 per cent year on year, with the Social Services Cluster contributing the lion’s share. Total transfers and subsidies were originally budgeted to increase by 9,2 per cent, but were revised lower in the MTBPS 2013 to increase by 8,0 per cent for the full fiscal year. Departments responsible for public education, health and social services contributed substantially to the increase in transfers and subsidies by the Social Services Cluster. Spending by the Department of Social Development showed a particularly strong increase and was mainly to provide income support to the growing number of people in vulnerable groups.
| | |
| | | Quarterly Bulletin March 2014 |
In April–December 2013 interest paid on national government debt amounted to R67,5 billion, a year-on-year rate of increase of 11,6 per cent. Higher issuances of domestic government bonds and Treasury bills to finance the deficit contributed to the increase in the interest bill of government. Interest payments were budgeted to amount to R99,6 billion or increase by 13,1 per cent in the current fiscal year. This statutory payment was revised slightly higher to amount to R100 billion in the MTBPS 2013.
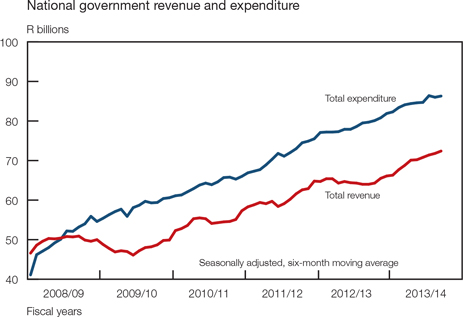
For the period under review, equitable share transfers to provinces amounted to R253 billion, representing a year-on-year rate of increase of 9,2 per cent. These transfers were expected to amount to over a third of total national government expenditure and continue to represent the bulk of provincial governments’ revenue.
The February 2013 Budget made provision for R9,6 billion to be paid from the National Revenue Fund to metropolitan municipalities as their share of the general fuel levy. These funds were meant to boost metropolitan municipalities’ budgets for road and transportation infrastructure, premised on the link between fuel sales and road usage. In April–December 2013, such transfers totalled R6,4 billion.
After taking into account cash-flow adjustments,16 national government’s cash-flow expenditure in the first nine months of fiscal 2013/14 equalled R789 billion – or 13,7 per cent more than in the same period a year earlier. The large difference between national government cash-book and cash-flow expenditure was mainly a result of outstanding transfers of R19,3 billion and the revaluation of index-linked bonds of R13,9 billion in April–December 2013.
In the first nine months of fiscal 2013/14, national government revenue amounted to R630 billion, increasing by 11,6 per cent. This increase in national government revenue was driven by higher growth in all major tax categories. The Budget Review 2013 predicted a 10,8 per cent year-on-year increase in national government receipts to amount to R873 billion for the current fiscal year. However, based on the economic climate at the time of the MTBPS 2013 revenue was revised slightly downwards to amount to R870 billion, representing a year-on-year rate of increase of 10,4 per cent.
As a ratio of gross domestic product, national government revenue amounted to 24,5 per cent in the first nine months of fiscal 2013/14 when compared with 23,6 per cent recorded in April–December 2012.
Taxes on income, profits and capital gains rose by 11,0 per cent year on year, underpinned by strong growth in personal- and corporate income tax collections. Higher pay-as-you-earn payments were driven by higher wage settlements, contributing to the strong growth in personal income tax. Increased collections from corporate income tax stemmed from higher provisional payments from the finance, manufacturing and mining sectors.
| | |
| Quarterly Bulletin March 2014 | | |


Property taxes continued to increase substantially, confirming improvement in real-estate and capital market activity. Transfer duties recorded a year-on-year rate of increase of 27,5 per cent in April–December 2013.
National government revenue in fiscal 2013/14
| | | | | | | | | | | | | | | | |
| | | Originally budgeted | | | Actual Apr–Dec 2013 | |
| Revenue source | | | | | | |
| | | R billions | | | Percentage
change* | | | R billions | | | Percentage
change* | |
Taxes on income, profits and capital gains | | | 501,4 | | | | 9,6 | | | | 365,9 | | | | 11,0 | |
Income tax on individuals | | | 307,2 | | | | 11,0 | | | | 218,3 | | | | 12,9 | |
Income tax on companies | | | 171,2 | | | | 6,4 | | | | 134,6 | | | | 12,7 | |
Payroll taxes | | | 12,4 | | | | 9,0 | | | | 9,1 | | | | 6,1 | |
Taxes on property | | | 9,1 | | | | 4,9 | | | | 7,7 | | | | 22,1 | |
Taxes on goods and services | | | 333,1 | | | | 12,3 | | | | 232,1 | | | | 9,3 | |
Value-added tax (VAT) | | | 243,0 | | | | 13,0 | | | | 169,5 | | | | 10,8 | |
Domestic VAT | | | 272,1 | | | | 12,2 | | | | 194,1 | | | | 8,9 | |
Import VAT | | | 125,4 | | | | 12,6 | | | | 91,9 | | | | 17,3 | |
VAT refunds | | | -154,5 | | | | 11,4 | | | | -116,5 | | | | 12,4 | |
Taxes on international trade and transactions | | | 41,8 | | | | 5,8 | | | | 32,4 | | | | 20,8 | |
Other revenue | | | 18,5 | | | | 13,5 | | | | 15,0 | | | | 21,5 | |
Less: SACU** payments | | | 43,4 | | | | 2,9 | | | | 32,5 | | | | 2,9 | |
Total revenue | | | 873,0 | | | | 10,8 | | | | 629,7 | | | | 11,6 | |
| * | Fiscal 2012/13 to fiscal 2013/14 |
| ** | Southern African Customs Union |
Receipts from taxes on goods and services increased strongly in the first nine months of fiscal 2013/14, boosted by higher proceeds from VAT and fuel levy. However, the increase was lower than the projections indicated in the 2013 February and October budgets.
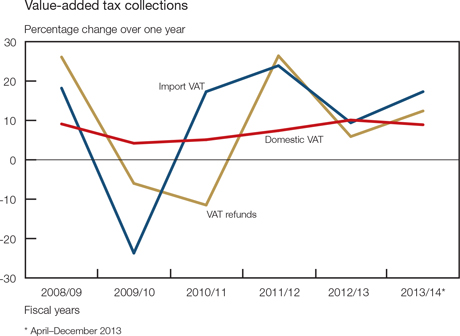
| | |
| | | Quarterly Bulletin March 2014 |
Domestic VAT collections recorded a year-on-year rate of increase of 8,9 per cent, which resulted from the growth in the mining and quarrying, agricultural, construction, and electricity and water sectors. VAT on imported goods recorded a substantial year-on-year rate of increase of 17,3 per cent, mainly due to higher imports of machinery, especially electrical machinery. VAT refunds were higher than in the same period of the previous year owing to increased claims from the manufacturing, wholesale and retail trade sectors and higher capital expenditure for electricity, gas and water provision.
Collections from import duties, of which customs duties is the main component, increased strongly year on year and boosted taxes on international trade and transactions. The strong increase was on account of higher imports of electrical machinery, clothing and petroleum products. Included in import duties is specific excise duties on imports amounting to R3,0 billion in April–December 2013.
Non-tax receipts recorded a substantial increase owing to higher receipts mainly from land rent, which comprises primarily mineral and petroleum royalties. These royalties are paid by mining companies that extract minerals on land that is owned by the government.
In the first nine months of fiscal 2013/14, an amount of R32,5 billion was paid to South Africa’s partners in the Southern African Customs Union, which was in line with the February 2013 budgeted projections.
Netting national government revenue and expenditure resulted in a cash-book deficit before borrowing and debt repayment of R135 billion in the first nine months of fiscal 2013/14 – R3,7 billion lower than the cash-book deficit recorded in the corresponding period of fiscal 2012/13. The full-year cash-book deficit was originally budgeted to amount to R179 billion in fiscal 2013/14. However, it was revised slightly downwards to R177 billion in the MTBPS 2013.
As a ratio of gross domestic product, the national government deficit amounted to 5,3 per cent in the first nine months of fiscal 2013/14, lower than the 5,8 per cent recorded in the same period of the previous fiscal year. The cash-book deficit ratio was originally budgeted to amount to 5,1 per cent for fiscal 2013/14 as a whole.
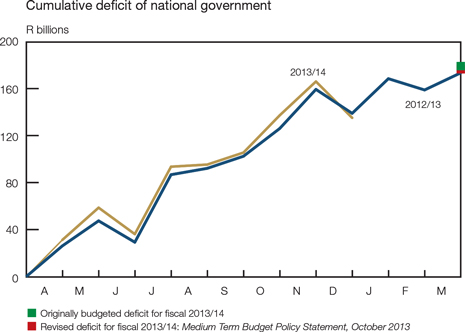
The primary balance17 reached a deficit of R68 billion in the first nine months of fiscal 2013/14, compared with a deficit of R78 billion recorded a year earlier. As a ratio of gross domestic product, the primary deficit reached 2,6 per cent in April–December 2013 – notably lower than the ratio of 3,3 per cent recorded in the same period of the previous fiscal year, and thereby signalling some progress being made on the road to fiscal sustainability.
| | |
| Quarterly Bulletin March 2014 | | |


National government’s cash-flow deficit amounted to R157 billion or 6,1 per cent of gross domestic product in the first three quarters of fiscal 2013/14. This was R28 billion higher than the cash-flow deficit recorded a year earlier. During the period under review, the difference of R22 billion between the cash-book deficit and the cash-flow deficit resulted from outstanding transfers and the revaluation of index-linked bonds. Included in extraordinary receipts were penalties on retail bonds, revaluation profits on foreign-currency transactions and special restructuring proceeds from Telkom and ICASA, together with the liquidation of the SASRIA investment.
After taking into account extraordinary transactions and the cost on revaluation of foreign debt at redemption, the net borrowing requirement of national government totalled R157 billion over the nine-month period under review. This could be measured against a net borrowing requirement of R129 billion recorded in the corresponding period of the previous fiscal year.
National government financing in fiscal 2013/14
R billions
| | | | | | | | | | | | |
| Item or instrument | | Originally
budgeted
2013/141 | | | Actual
Apr–Dec
2013 | | | Actual
Apr–Dec
2012 | |
Deficit | | | 179,2 | | | | 157,3 | 2 | | | 129,4 | 2 |
Plus: Extraordinary payments | | | 0,9 | | | | 0,5 | | | | 2,6 | |
Cost/profit on revaluation of foreign debt at redemption3 | | | 3,2 | | | | 5,4 | | | | -2,5 | |
Less: Extraordinary receipts | | | 0,3 | | | | 5,7 | | | | 0,7 | |
Net borrowing requirement | | | 183,1 | | | | 157,5 | | | | 128,8 | |
Treasury bills | | | 23,0 | | | | 25,8 | | | | 11,7 | |
Domestic government bonds | | | 145,4 | | | | 121,4 | | | | 113,6 | |
Foreign bonds and loans | | | -1,1 | | | | 6,4 | | | | -13,6 | |
Change in available cash balances4 | | | 15,8 | | | | 3,8 | | | | 17,2 | |
Total net financing5 | | | 183,1 | | | | 157,5 | | | | 128,8 | |
| 5 | Components may not add up to totals due to rounding |
The borrowing requirement was predominantly financed domestically through short-term loans and the issuances of government bonds. In fiscal 2013/14 demand for government debt instruments remained strong, given government’s debt management strategy and the encouragement of growth of South Africa’s liquid capital market. Inflation-linked bonds are popular under the current economic conditions. In the first nine months of fiscal 2013/14, net issues of inflation-linked bonds amounted to R43 billion, bringing the outstanding balance for these instruments to R287 billion at the end of December 2013.
In April–December 2013, the R201 bond was partly redeemed and switched for R10,6 billion. At the end of December 2013, short-term funding was acquired at an average interest rate of 5,3 per cent, while domestic government bonds attracted an average rate of 8,3 per cent per annum. Between March and December 2013, the average outstanding maturity of national government’s domestic marketable bonds lengthened from 146 months to 152 months. The extended maturity resulted from higher issuances of longer-maturity government bonds and switch transactions.
Net issues to the value of R6,4 billion were recorded in foreign bonds and loans of national government in April–December 2013. The average outstanding maturity of foreign marketable bonds of national government lengthened from 86 months at the end of March 2013 to 98 months as at the end of December.
National government’s funding activities decreased its available cash balances by R3,8 billion in the first nine months of the current fiscal year, bringing these balances to a level of R208 billion at the end of December 2013. Deposits with the Bank declined by R3,6 billion over the same nine-month period and amounted to R137 billion at the end of December 2012.
| | |
| | | Quarterly Bulletin March 2014 |
Total domestic debt of national government increased from R1 241 billion as at 31 March 2013 to R1 418 billion at the end of December. Higher issuances of domestic short-term loans and government bonds contributed to the considerable rise in domestic debt of national government. Domestic debt continued to account for about 90 per cent of total gross loan debt, with foreign debt accounting for the balance.
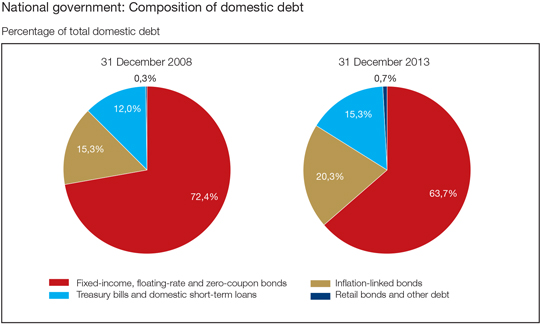
Between March and December 2013, foreign debt of national government increased from R125 billion to R143 billion. The increase in foreign debt emanated from the issuance of the new US dollar-denominated marketable bond, together with higher revaluation effects arising from the weaker exchange value of the rand.
Foreign debt of national government, valued at historical exchange rates, amounted to R103 billion as at 31 December 2013. The difference between foreign debt valued at historical exchange rates and foreign debt valued at prevailing exchange rates was R40 billion at the end of December 2013. The depreciation of the rand against major currencies contributed to the widening of this gap.
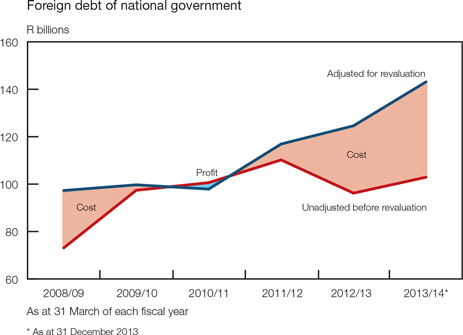
| | |
| Quarterly Bulletin March 2014 | | |


Total gross loan debt of national government, which includes domestic and foreign debt, increased sharply from R1 366 billion at the end of March 2013 to R1 561 billion as at 31 December. As a ratio of gross domestic product, total gross loan debt increased from 42,7 per cent to 46,1 per cent in the period under review. Total gross loan debt was originally budgeted to amount to R1 522 billion, or 43,2 per cent of gross domestic product, at the end of fiscal 2013/14.
The Budget for fiscal 2014/15 to 2016/17
Fiscal policy stance
On 26 February 2014 the Minister of Finance tabled the 2014 National Budget in Parliament. The Budget presented an even keel fiscal framework grounded in a sustainable, countercyclical approach to revenue and expenditure management. The Minister reconfirmed that over the medium term, government would balance continued support for economic recovery with fiscal consolidation. Whereas key social and economic programmes would be maintained, complemented by efforts to improve value for money, spending over the medium term would still be contained. The National Development Plan (NDP) increasingly guides the allocation of public resources and was building the platform for faster growth to enable the economy to sustain progress over the next twenty years of democracy.
Government was committed to continuing with its core social expenditure programmes while increasing public investment in infrastructure within a sustainable framework. The expenditure ceiling introduced in 2012 targeted a nominal limit on main budget non-interest expenditure, which is the core spending over which government has direct legislative authority. Thus, excluding interest payments, real expenditure was expected to grow at an annual average rate of 1,8 per cent over the medium-term period to 2016/17. The results of adopting spending limits were already evident in budget outcomes as expenditure growth had been substantially reduced. In some spending areas, such as compensation of government employees, higher-than-expected growth had been funded through reprioritisation. Since the introduction of expenditure ceilings, expenditure outcomes have been at or below initial estimates.
However, the Budget recognised that expenditure ceilings implied difficult trade-offs in an inflationary environment. For instance, if inflation exceeded current forecasts, the purchasing power of budgeted allocations would decline, while compensation budgets would automatically increase in terms of the current inflation-linked public-sector wage agreement. Rand depreciation could also lead to rising cost pressures outside of the control of government. However, faster economic recovery would ease fiscal pressures and allow government to direct a greater share of resources towards service delivery.
The 2014 Budget would continue with its tight control of budgets for purchases of goods and services, which would decline in real terms over the three-year spending period. To this end, budget allocations have been revised to ensure that goods and services required for core areas of service delivery, such as educational materials and medical supplies, would be protected. Furthermore, expenditure on travel, catering, consultants and other administrative payments would decline as a share of spending.
Despite the slower-than-expected growth in the economy, the consolidated budget deficit was expected to narrow to 4,0 per cent of gross domestic product in the current fiscal year, slightly down from 4,3 per cent in 2012/13. The reduction of the deficit would be achieved through a combination of enforcing government’s expenditure ceiling and strong revenue collections. It was expected that as economic growth improved and spending limits were kept in place, the consolidated budget deficit would narrow to 2,8 per cent of gross domestic product by fiscal 2016/17.
Over the medium term, higher growth is expected to support stronger investment and job creation, as major investment projects release constraints to greater private-sector output. Higher growth would be enhanced by new power stations which would become operational, while public transport and freight logistics would improve significantly. Furthermore, South Africa would draw strength from rapid expansion of trade and investment in Africa and government would increasingly align its policy frameworks to support economic integration with the African continent.
| | |
| | | Quarterly Bulletin March 2014 |
The following table shows the revised Main Budget estimates for fiscal 2013/14 and the three-year budget period.
Summary outcome of revised estimates1
| | | | | | | | | | | | | | | | | | | | | | | | | | | | | | | | |
| | | 2013/14 | | | 2014/15 | | | 2015/16 | | | 2016/17 | |
| Component | | R bn | | | Annual
change
(Per cent) | | | R bn | | | Annual
change
(Per cent) | | | R bn | | | Annual
change
(Per cent) | | | R bn | | | Annual
change
(Per cent) | |
Expenditure | | | 1 049,1 | | | | 8,7 | | | | 1 142,6 | | | | 8,9 | | | | 1 232,6 | | | | 7,9 | | | | 1 323,6 | | | | 7,4 | |
State debt cost2 | | | 101,3 | | | | 14,9 | | | | 114,9 | | | | 13,5 | | | | 126,6 | | | | 10,2 | | | | 139,2 | | | | 9,9 | |
Current payments | | | 176,3 | | | | 10,9 | | | | 184,1 | | | | 4,4 | | | | 193,5 | | | | 5,1 | | | | 207,4 | | | | 7,2 | |
Transfers and subsidies | | | 755,8 | | | | 7,6 | | | | 819,3 | | | | 8,4 | | | | 884,5 | | | | 8,0 | | | | 939,4 | | | | 6,2 | |
Payments for capital assets | | | 12,4 | | | | -11,3 | | | | 17,7 | | | | 42,5 | | | | 18,6 | | | | 5,2 | | | | 19,3 | | | | 3,8 | |
Payments for financial assets3 | | | 3,4 | | | | — | | | | 3,6 | | | | — | | | | 3,3 | | | | — | | | | 0,3 | | | | — | |
Extraordinary payments | | | 0,5 | | | | -81,4 | | | | — | | | | — | | | | — | | | | — | | | | — | | | | — | |
Contingency reserve and unallocated funds | | | — | | | | | | | | 3,0 | | | | | | | | 6,0 | | | | | | | | — | | | | | |
Expenditure as ratio of GDP | | | 30,3 | % | | | | | | | 30,1 | % | | | | | | | 29,7 | % | | | | | | | 29,1 | % | | | | |
Revenue | | | 886,2 | | | | 10,8 | | | | 962,8 | | | | 8,6 | | | | 1 058,1 | | | | 9,9 | | | | 1 172,6 | | | | 10,8 | |
Revenue as ratio of GDP | | | 25,6 | % | | | | | | | 25,4 | % | | | | | | | 25,5 | % | | | | | | | 25,8 | % | | | | |
Tax revenue (net of SACU4 payments) | | | 855,6 | | | | 10,9 | | | | 941,9 | | | | 10,1 | | | | 1037,8 | | | | 10,2 | | | | 1 149,0 | | | | 10,7 | |
Non-tax revenue5 | | | 30,5 | | | | 8,7 | | | | 20,9 | | | | -31,7 | | | | 20,3 | | | | -2,7 | | | | 23,6 | | | | 16,0 | |
Budget balance6 before borrowing and debt repayment | | | -162,9 | | | | | | | | -179,8 | | | | | | | | -174,5 | | | | | | | | -151,0 | | | | | |
Balance as ratio of GDP | | | -4,7 | % | | | | | | | -4,7 | % | | | | | | | -4,2 | % | | | | | | | -3,3 | % | | | | |
Balance as ratio of GDP: | | | | | | | | | | | | | | | | | | | | | | | | | | | | | | | | |
October 2013 MTBPS7 | | | -5,1 | % | | | | | | | -4,8 | % | | | | | | | -4,4 | % | | | | | | | -3,6 | % | | | | |
| 1 | Components may not add up to totals due to rounding |
| 2 | Includes interest, management cost and the cost of raising loans |
| 3 | Consists mainly of lending to public corporations or making equity investments in them for policy purposes. Previously included in transfers and subsidies |
| 4 | Southern African Customs Union |
| 5 | Including extraordinary receipts |
| 7 | Medium Term Budget Policy Statement 2013 |
Over twenty years, South Africa had built a progressive tax system founded on the principles of equity, efficiency, simplicity, transparency, certainty and tax buoyancy. The fairness of the tax system and effective use of tax revenues were the cornerstones of sound public finance and tax morale. Tax proposals for the 2014 Budget continued to prioritise economic growth, job creation and generating sufficient revenue to finance government spending in line with the NDP’s objectives of expanding the economy and reducing unemployment. The Budget Review 2014 further proposed direct tax relief to individuals of R9,3 billion through adjustments to personal income tax brackets and rebates, aimed to compensate for the effects of inflation.
The sizeable fiscal deficits, the accompanying increase in government debt and the likelihood of somewhat higher debt financing rates in future were reflected in strong increases in projected state debt cost; this was set to rise more rapidly than overall government expenditure in each of the fiscal years to 2016/17. The trends in debt service cost, illustrated in the graph on the next page, underline the need to contain fiscal deficits, and the difficult trade-off involved when there is also a strong need to support economic activity in the short run.
The net result of national government revenue and expenditure would be a cash-book deficit of R163 billion in fiscal 2013/14 – some R15,1 billion lower than the originally budgeted deficit. The narrower deficit was the result of stronger revenue growth and underspending by national departments. Government responded to the recent weaker economic conditions by limiting expenditure growth, trimming departmental budgets and reducing the contingency reserve.
| | |
| Quarterly Bulletin March 2014 | | |


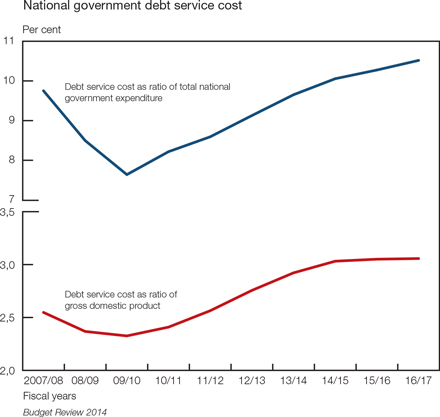
As a ratio of gross domestic product, the cash-book deficit of national government was projected to increase to 4,7 per cent in fiscal 2013/14. As the economy would begin to grow more rapidly and expenditure restraint would be maintained, the deficit was projected to narrow to 3,3 per cent in fiscal 2016/17.
In fiscal 2013/14, the primary balance was estimated to reach a deficit of 1,8 per cent of gross domestic product, narrower than the ratio of 2,4 per cent recorded in fiscal 2012/13. The primary deficit as a ratio of gross domestic product was projected to narrow over the medium term, reaching 0,3 per cent by 2016/17 but not yet reverting to a surplus.
The deficit of national government would continue to be financed through loans incurred in the domestic and global markets and by using surplus cash. Over the medium term, net Treasury bill issuance was expected to average R24 billion per year. To reduce supply pressures in 91-day Treasury bills, issuance would be concentrated in longer-dated maturities.
National government financing
R billions
| | | | | | | | | | | | | | | | |
| Item or instrument | | Revised
estimate | | | Medium-term estimates | |
| | | 2013/14 | | | 2014/15 | | | 2015/16 | | | 2016/17 | |
Deficit/net borrowing requirement | | | 162,9 | | | | 179,8 | | | | 174,5 | | | | 151,0 | |
Treasury bills | | | 23,0 | | | | 23,0 | | | | 24,0 | | | | 26,0 | |
Domestic government bonds issued | | | 149,0 | | | | 132,1 | | | | 135,4 | | | | 121,0 | |
Foreign bonds and loans* | | | 0,4 | | | | 1,3 | | | | 12,2 | | | | 3,0 | |
Changes in available cash balances** | | | -9,4 | | | | 23,4 | | | | 2,9 | | | | 1,0 | |
Total net financing*** | | | 162,9 | | | | 179,8 | | | | 174,5 | | | | 151,0 | |
| * | Including revaluation of foreign bonds and loans |
| *** | Components may not add up to totals due to rounding |
| | |
| | | Quarterly Bulletin March 2014 |
Loan redemptions would increase considerably over the medium and long term. Government would continue to exchange shorter-dated debt for longer-term debt to manage refinancing risk. Price manipulation and resulting market volatility would be limited as future switch auctions would be scheduled on an ad hoc basis, rather than being set out in a formal calendar, and there would no longer be pre-set targets. This would limit price manipulation and resulting market volatility.
A new top-up retail bond product that allows regular deposits into existing investments would be introduced in 2014. The top-up retail bond would also be accessible to community savings groups, such as stokvels. Government, learning from experiences in the wholesale market, would also explore introducing a sukuk (Islamic) retail bond.
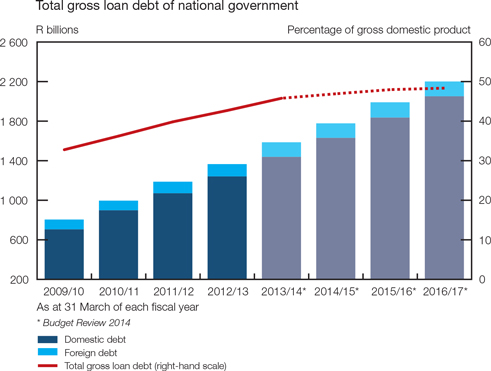
Gross loan debt of national government was projected to amount to R1 586 billion at the end of fiscal 2013/14, or 45,8 per cent of gross domestic product. Over the medium term, gross loan debt relative to gross domestic product was expected to average 47,7 per cent, amounting to R2 201 billion at the end of March 2017.
Expenditure at the consolidated government level covers spending across government, including provinces, public entities and transfers of nationally raised revenue to municipalities. In fiscal 2012/13, government expenditure amounted to R966 billion which represented underspending of 0,6 per cent of the budgeted amount, partly due to delays in rolling out school infrastructure. Consolidated government expenditure, excluding debt-service costs, was expected to amount to R1 048 billion in fiscal 2013/14, rising to R1 312 billion in fiscal 2016/17.
Government is using social security assistance as a direct means of combating poverty. Over the past decade, social grant values had grown in line with consumer inflation and the number of social-grant beneficiaries had doubled from 7,9 million beneficiaries in fiscal 2003/04 to 15,8 million in fiscal 2013/14, largely due to an expansion of the child support grant. Spending on social grants would rise from R118 billion in fiscal 2012/13 to R145 billion in fiscal 2016/17. Social grant expenditure would remain over 3 per cent of gross domestic product over the next three years.
The public-sector borrowing requirement was forecast to decline from 6,6 per cent of gross domestic product in fiscal 2013/14, to 4,3 per cent in fiscal 2016/17. The higher borrowing requirement in fiscal 2013/14 resulted from wider budget deficits foreseen at various levels of government.
| | |
| Quarterly Bulletin March 2014 | | |


The main budget deficit was offset by surpluses of provincial governments and social security funds. Social security funds held large surpluses owing to huge accumulated surpluses reported by the Unemployment Insurance Fund (UIF). Local government borrowing remains very low. Many local governments have weak balance sheets and have yet to develop reliable systems for collecting their own revenue, making them increasingly reliant on grants to fund capital expenditure. While several large cities were able to access capital markets, many are nearing their prudential debt limits.
Public-sector borrowing requirement*
R billions
| | | | | | | | | | | | | | | | |
| Level of government | | Revised
estimate | | | Medium-term estimates | |
| | | 2013/14 | | | 2014/15 | | | 2015/16 | | | 2016/17 | |
National government | | | 162,9 | | | | 179,8 | | | | 174,5 | | | | 151,0 | |
Public entities (extra-budgetary institutions) | | | -1,7 | | | | -8,5 | | | | -7,0 | | | | -5, | |
Social security funds | | | -17,9 | | | | -15,2 | | | | -13,1 | | | | -15,1 | |
Provincial governments | | | -4,1 | | | | -3,0 | | | | -4,1 | | | | -3,5 | |
Local authorities | | | 9,7 | | | | 9,7 | | | | 10,2 | | | | 10,8 | |
General government borrowing** | | | 148,9 | | | | 162,8 | | | | 160,5 | | | | 137,7 | |
Percentage of gross domestic product | | | 4,3 | % | | | 4,3 | % | | | 3,9 | | | | 3,0 | % |
State-owned companies*** | | | 78,7 | | | | 68,8 | | | | 82,7 | | | | 57,7 | |
Public-sector borrowing requirement** | | | 227,2 | | | | 231,6 | | | | 243,2 | | | | 195,4 | |
Percentage of gross domestic product | | | 6,6 | % | | | 6,1 | % | | | 5,9 | % | | | 4,3 | % |
Estimated gross domestic product | | | 3 464,9 | | | | 3 789,6 | | | | 4 150,5 | | | | 4 552,9 | |
| ** | Calculations may not add up to totals due to rounding |
| *** | South African National Roads Agency Limited and Trans-Caledon Tunnel Authority are included in consolidated government net borrowing |
The borrowing requirement of non-financial public enterprises and corporations was projected to decline as a percentage of gross domestic product, from 2,3 per cent in fiscal 2013/14 to 1,3 per cent in fiscal 2016/17. This would reflect an increasing reliance on internally generated resources to finance capital spending.
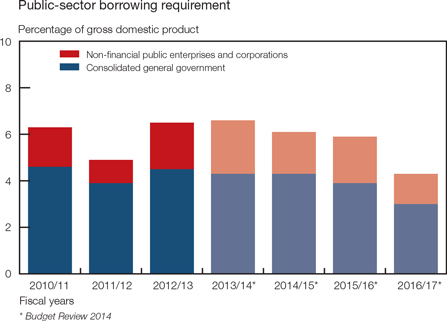
| | |
| | | Quarterly Bulletin March 2014 |
Statement of the Monetary Policy Committee
29 January 2014
Issued by Gill Marcus, Governor of the South African Reserve Bank, at a meeting of the Monetary Policy Review (MPC) in Pretoria
Since the previous meeting of the Monetary Policy Committee (MPC), the expected cutback in quantitative easing by the United States (US) Fed has begun. Although the initial response in global financial markets was generally fairly muted, emerging markets have subsequently experienced a high degree of turbulence, particularly in the wake of renewed fears of a slowdown in China. While the Fed action signals a recovery in the US, and the United Kingdom (UK) economic outlook is also improving, it does not mean that the global financial crisis is over. Rather, we are now entering a phase of the crisis that is creating new challenges for emerging-market economies.
In the longer run a sustained recovery in the US should be positive for the global economy in general, but the adjustment to the withdrawal of quantitative easing is likely to create significant short- to medium-term challenges. How to respond to a combination of sharply depreciating currencies, capital outflows, slowing growth, rising inflation, significant current account and/or fiscal deficits and deteriorating confidence is posing policy challenges and very difficult trade-offs for many emerging markets.
The rand exchange rate has been one of the currencies affected by these developments, and the recent depreciation of the rand, if sustained, will raise significantly the risk to the inflation outlook. Our inflation forecast shows a marked deterioration, despite the absence of clear evidence of domestic demand pressures.
The recent inflation data reflect positive outcomes that belie the incipient risks, largely from the depreciation of the currency, that our forecasts highlight. The year-on-year inflation rate as measured by the consumer price index (CPI) for all urban areas measured 5,3 per cent in November 2013 and 5,4 per cent in December, resulting in an average annual inflation rate of 5,7 per cent for 2013. Food and non-alcoholic beverage price inflation continued to moderate from a recent peak of 7,1 per cent in August, to 3,8 per cent in November and 3,5 per cent in December. The contribution of this category to the average CPI increase was 0,5 percentage points in December compared with 0,6 percentage points in the previous month. The petrol price, which was the main contributor to the higher overall inflation in December, increased at a year-on-year rate of 10,0 per cent, up from 7,7 per cent in November. Core inflation, which excludes food, petrol and electricity, has been unchanged at 5,3 per cent for the four months to December, while administered price inflation excluding petrol measured 6,8 per cent. The headline producer price inflation for final manufactured goods measured 5,8 per cent in November, compared with 6,3 per cent in October.
The headline inflation forecast of the Bank has deteriorated since the previous meeting of the MPC, mainly as a result of revisions to the assumptions regarding the rand exchange rate. The forecast average inflation rate for 2014 is 0,6 percentage points higher at 6,3 per cent, and 0,6 percentage points higher at 6,0 per cent in 2015, with inflation expected to average 5,9 per cent in the final quarter of that year. Inflation is expected to breach the upper end of the target range in the second quarter of 2014, and to reach a peak of 6,6 per cent in the final quarter of the year, before declining to 6,0 per cent in the second quarter of 2015.
Core inflation, which averaged 5,2 per cent in 2013, is expected to average 5,8 per cent in 2014, compared with 5,6 per cent in the previous forecast, while the forecast for 2015 has increased from 5,3 per cent to 5,9 per cent. The deterioration in this measure of underlying inflation continues to be driven primarily by the lagged effects of the depreciation of the rand exchange rate.
Inflation expectations appear to have remained relatively anchored at the upper end of the target range. According to the survey conducted in the fourth quarter of 2013 by the Bureau for Economic Research at Stellenbosch University, average inflation expectations of respondents
| | |
| Quarterly Bulletin March 2014 | | |


measured 6,1 per cent for both 2014 and 2015, and have remained more or less unchanged since 2011. There is, however, some divergence between the average expectations of respondents, which range between 5,6 per cent and 6,4 per cent in 2014, and 5,5 per cent and 6,5 per cent in 2015. Financial analysts have the lowest forecasts, which are also reflected in the latest Reuters survey that indicates expectations of 5,6 per cent and 5,5 per cent in 2014 and 2015 respectively.
While the economic growth outlook for a number of emerging-market economies has deteriorated somewhat in recent months, the prospects in the advanced economies have improved, particularly in the US and the UK. However, the recovery remains uneven and not without risks. In the US, growth is being driven by a recovery in the housing market, robust private-sector demand, and a dissipation of the negative impulse from fiscal consolidation. In its latest World Economic Outlook (WEO) update, the International Monetary Fund (IMF) forecasts growth of 2,8 per cent in 2014 for the US, compared with 1,9 per cent in 2013. The outlook for the eurozone remains fragile and uneven, particularly in the southern periphery where the risk of deflation, strong fiscal consolidation and weak banking sectors are constraining the recovery. Eurozone growth in 2014 is expected to remain subdued at around 1,0 per cent.
The Japanese economy has maintained its positive growth, but there are still doubts about its sustainability in the absence of continued fiscal stimulus. The outlook for the Chinese economy is increasingly uncertain, given the challenge of containing the excessive increase in credit extension without adversely impacting on growth. Although a growth rate of around 7,5 per cent is still generally expected, the latest Purchasing Managers’ Index (PMI), which suggests a contraction of industrial production, indicates some downside risk to this outlook. This uncertainty has contributed to increased risk aversion and volatility in financial markets of emerging economies in recent weeks, and is also likely to impact negatively on commodity prices.
Significant currency depreciation and weaker growth prospects are also evident in a number of other large emerging economies, particularly Brazil, Russia and Turkey, while the outlook for the Indian economy appears to have improved somewhat.
Global inflation remains benign despite abundant liquidity. However, spillover effects from increasingly divergent monetary policies are creating a difficult and volatile environment for emerging markets. There is still some uncertainty regarding the pace of tapering by the Fed in the coming months, and although market expectations are that the US policy rate is unlikely to increase before at least mid-2015, long-term bond yields have increased to around 2,8 per cent from around 1,6 per cent in May 2013. A further sustained improvement in UK growth and employment trends has brought forward the prospect of monetary tightening by the Bank of England. However, monetary policy is expected to remain highly accommodative in Japan and the eurozone where the risk of deflation persists.
The expectation of tapering by the Fed since May 2013 resulted in significant outflows from emerging economies’ domestic bond and equity markets, putting pressure on exchange rates and long-term bond yields, particularly in those countries with sizeable current-account deficits. Some countries, including Brazil, Turkey, Indonesia and India, responded by tightening monetary policy, either in reaction to inflationary pressures or in an attempt to stem the depreciation. Since May 2013, cumulative interest rate increases have amounted to 300 basis points in Brazil and 75 basis points in India. The most recent instance has been Turkey which raised its overnight interest rate (MFR) by 425 basis points to 12 per cent.
The impact of these developments on the rand exchange rate has resulted in a marked increase in the upside risk to the inflation forecast, despite the relatively muted pass-through to date. Since the previous MPC meeting, the rand has depreciated by about 7,4 per cent against the US dollar, by 9,0 per cent against the euro and by 8,0 per cent on a trade-weighted basis. Year to date the rand/dollar depreciation has been about 3,5 per cent.
In the final two months of 2013, total net sales by non-residents of South African domestic government bonds and equities amounted to R21,0 billion and R19,4 billion respectively.
| | |
| | | Quarterly Bulletin March 2014 |
These flows effectively reversed the inflows that occurred during the earlier part of the year, with net purchases of bond and equities for 2013 by non-residents amounting to R1,3 billion, compared with R85,2 billion for 2012. Year-to-date net sales of equities and bonds have totalled R19,3 billion, of which R15,6 billion were bonds.
While the recent rand weakness is part of a general emerging-market phenomenon, it has been reinforced by idiosyncratic factors including declining terms of trade, ongoing labour disputes, and the higher-than-expected current-account deficit in the third quarter.
Although to date the current account has been slow to react to the depreciation of the rand, the trade surplus of R0,8 billion recorded in November may signify a possible narrowing of the current-account deficit in the fourth quarter of 2013. However, given the volatility of the monthly trade data, it is too early to assess whether or not this is the beginning of a sustainable trend. The extent to which the strikes in the mining sector and resulting decline in exports are likely to impede the current-account adjustment further will depend on the duration of the strikes and the extent to which lost output can be compensated for by running down inventories.
The economic growth outlook remains subdued amid continued low business confidence. Growth in the fourth quarter of 2013 is estimated to have recovered somewhat from the low base of 0,7 per cent in the third quarter, and annual growth in 2013 is estimated to have been around 1,9 per cent. Although an improved outcome is forecast for 2014, growth is still expected to remain below estimated potential output of between 3,0 and 3,5 per cent. The Bank’s forecasts for growth in 2014 and 2015 have been revised to 2,8 per cent and 3,3 per cent respectively, down from 3,0 per cent and 3,4 per cent in the previous forecast round. The Bank’s composite leading business cycle indicator continues to trend sideways, and was marginally negative in November.
The mining sector is expected to remain under pressure in the face of work stoppages in the major platinum mines, with the risk of these disruptions spreading to the gold mines. Mining output recovered somewhat in the fourth quarter of 2013 from the September lows, and the sector is expected to have made a positive contribution to fourth-quarter growth. The manufacturing sector is also expected to have exhibited stronger growth in the final quarter, following the strike-induced contraction in the third quarter. However, the sector has yet to exhibit a meaningful response to the weaker exchange rate, and the Kagiso PMI declined to just below 50 index points in December, for the first time since April 2013.
The construction sector presents a mixed picture. The FNB/BER building confidence index remained unchanged at 48 index points in the fourth quarter of 2013, the highest level in 5 years. However, the upward trend in the real value of building plans passed observed in the earlier part of 2013 has levelled off, and there was a notable decline in November by 12,5 per cent on a month-to-month basis, and a 14,5 per cent decline on a year-on-year basis. The outlook for civil construction, by contrast, appears to be more favourable.
These restrained developments in the real sector have contributed to the slow pace of employment creation in the economy, and continued job losses in the private sector remain a concern. According to the Quarterly Employment Statistics (QES) survey of Statistics South Africa, formal-sector employment increased by 13 400 in the year to the third quarter of 2013, or by 0,2 per cent. In the third quarter of 2013, employment losses were most pronounced in mining and construction.
Growth in consumption expenditure by households moderated from 2,8 per cent in the second quarter to 2,3 per cent in the third quarter, and is expected to remain relatively constrained by disappointing employment growth and a modest rise in credit extension. Slow growth was particularly evident in the consumption of non-durable goods and services. Real expenditure on durable goods remained strong, with growth of 9,3 per cent. Nevertheless, domestic new vehicles sales appear to be under pressure, having contracted by 3,3 per cent on a quarter-to-quarter basis in the final quarter of 2013. Although retail trade sales increased by 1,2 per cent on a month-to-month basis in November 2013, they increased only marginally, by 0,1 per cent, when the three months to November are compared to the previous three months. Consumer confidence, as reflected in the FNB/BER consumer confidence index, remained at a low level of -7, a marginal improvement from the previous quarter.
| | |
| Quarterly Bulletin March 2014 | | |


Growth in credit extension by the banking system to the private sector continued to lose momentum. Twelve-month growth in total loans and advances to the private sector moderated to 7,4 per cent in November, with credit extension to households measuring 5,9 per cent, compared with 10,4 per cent at the same time in 2012. Twelve-month growth in general loans to households, mainly unsecured lending, measured 8,1 per cent in November, the lowest rate of growth since April 2009, while annualised growth over three months showed a contraction of 0,8 per cent. Although there has been an increase in commercial mortgage credit extension, growth in outstanding residential mortgages remains subdued at 1,3 per cent. Instalment sale credit and leasing finance has continued to be relatively brisk, but could moderate if motor vehicle demand continues to decline. Household debt as a percentage of household disposable income declined slightly from 75,8 per cent in the second quarter to 75,5 per cent in the third quarter of 2013.
Wage settlement rates, as measured by Andrew Levy Employment Publications, measured 7,9 per cent during 2013. However, according to QES data, growth in nominal remuneration per worker declined from 8,8 per cent in the year to the second quarter of 2013, to 6,6 per cent in the year to the third quarter. For the economy as a whole, despite a small decline in labour productivity growth, unit labour cost growth declined over the year from 6,9 per cent in the second quarter to 4,9 per cent in the third quarter. However there are important sectoral differences. For instance, unit labour cost growth in the manufacturing sector accelerated from 5,6 per cent to 6,9 per cent during the same period, while nominal remuneration per worker in the mining sector increased by 9,0 per cent.
Food prices have been the main contributor to the downside surprises in inflation in the past two months, with prices increasing by 3,5 per cent in December. Global food prices generally declined during the year amid improved wheat and maize harvests. The rand exchange rate, coupled with disappointing domestic harvests due to drought in some areas, has impacted adversely on the domestic maize and wheat prices in recent weeks, with the spot prices of maize increasing by about 12 per cent during January, following increases of around 20 per cent between August and December 2013. These pressures have not as yet been observed in the producer price index where cereal and other crop prices declined by one per cent over the year in November. Persistent drought conditions in a number of regions have resulted in the culling of cattle, leading to extremely low meat price inflation since September (0,1 per cent in December). However, these favourable food price outcomes are not expected to persist as higher spot grain prices work through to consumer prices.
Although the exchange rate pass-through has generally been relatively muted to date, the impact on the petrol price has been almost immediate. International oil prices have been fairly stable, with Brent crude oil trading in a range of between US$106 and US$109 during January. In December and January the domestic petrol price was increased by a cumulative 55 cent per litre, and a further significant increase, in excess of 30 cents per litre, can be expected in February, primarily as a result of the weaker exchange rate. Sustained upside pressure from petrol prices on inflation can therefore be anticipated should the rand continue to depreciate.
The MPC carefully considered the economic challenges facing South Africa and the appropriate policy response. On the one hand, inflation forecasts indicate the possibility of being out of the target range for an extended period, largely due to the impact of the depreciating currency. The risks to the inflation forecast are seen to be significantly on the upside. Large adjustments to the exchange rate will inevitably impact on inflation, even in conditions of relatively low pass-through such as we have been experiencing.
On the other hand, the growth outlook remains of concern. Credit extension is low and declining, few jobs on a net basis are being created, and gross fixed capital formation, particularly from the private sector, is significantly below what is required.
| | |
| | | Quarterly Bulletin March 2014 |
Capital outflows and a current-account deficit exacerbate the difficulties that lie ahead. Exchange rate pressures are expected to intensify as markets adjust to the new pattern of global capital flows. Although monetary policy in the advanced economies remains accommodative, the process of normalisation has begun, and the spillovers have implications for our own monetary policy.
The primary responsibility of the Bank is to keep inflation under control and ensure that inflation expectations remain well anchored. The depreciation experienced so far could improve our international competitiveness, provided that it is not eroded through higher wage and other input prices.
In the light of these circumstances and taking account of policy trade-offs, the MPC has decided to increase the repurchase rate by 50 basis points to 5,5 per cent per annum as of 30 January 2014. The MPC is of the view that, notwithstanding this increase in the repo rate, monetary policy remains accommodative. Further moves in the repo rate will be highly data-dependent. We will continue to monitor developments closely and will not hesitate to act as required in keeping with our mandate.
| | |
| Quarterly Bulletin March 2014 | | |


Notes to tables
South African Reserve Bank: Liabilities – Table S–2
Deposits by the central government with the Bank have been revised to distinguish between rand-denominated and foreign currency-denominated deposits. The redundant column on central government’s Exchequer and Paymaster-General deposits, which last had values in 2006, has been removed.
Land and Agricultural Development Bank of South Africa: Liabilities – Table S–16
The Land and Agricultural Development Bank of South Africa has recently added foreign funding to its sources of financing. Accordingly, the column for bank overdrafts and overnight loans has been replaced by loans and other funding, with a distinction between loans provided by domestic and by foreign counterparty sectors.
Selected money-market and related indicators – Table S–26
Deposits by the central government with the Bank have been revised to distinguish between rand-denominated and foreign currency-denominated deposits. As far as operations by the Bank in the money market are concerned, firstly the column on money-market swaps has been revised to include the monthly balance of foreign-exchange swaps entered into by the Bank, of which the forward legs are still outstanding. These swaps involve the selling by the Bank to a money-market counterparty of foreign currency against payment to the Bank in rand, with an agreement to reverse the transaction on a specified future date at a specified exchange rate. The swap transactions are usually conducted to sterilise the rand money-market effect of foreign-exchange purchases by the Bank, or for general liquidity management purposes. Secondly, a column has been added to reflect the amount of call deposits of the Corporation for Public Deposits (CPD) with the Bank. When surplus funds of the CPD are placed on deposit with the Bank (rather than in other forms such as on deposit with private-sector banks) it serves to drain money-market liquidity.
Derivative market activity – Table S–31
The futures and options contracts data have been combined under equity derivatives. Data on commodity, interest rate and currency derivatives have been added for a broader coverage of derivative market activity.
Labour in the non-agricultural sectors and unemployment rate – Table S–154
Table S–154 capturing key information on the labour market will henceforth include the official unemployment rate as published by Statistics South Africa in its Quarterly Labour Force Survey. In addition, a seasonally adjusted version of the unemployment rate will also be included. The seasonally adjusted series is calculated by the South African Reserve Bank, with the methodology explained in more detail in a text box on page 19 of this Quarterly Bulletin.
| | |
| | | Quarterly Bulletin March 2014 |