Exhibit 99.F
Budget Review
2014
National Treasury
Republic of South Africa
26 February 2014

| | |
ISBN: | | 978-0-621-42407-2 |
RP: | | 02/2014 |
The Budget Review is compiled using the latest available information from departmental and other sources. Some of this information is unaudited or subject to revision.
To obtain additional copies of this document, please contact:
Communications Directorate
National Treasury
Private Bag X115
Pretoria
0001
South Africa
Tel: +27 12 315 5526
Fax: +27 12 315 5126
The document is also available on the internet at: www.treasury.gov.za.
ii

iii
iv
Foreword
The 2014 Budget takes stock of our achievements and responds to the challenges that lie ahead.
Twenty years of freedom have transformed South African society. Our non-racial democracy is founded on the rule of law. We have strong institutions established by the Constitution and an independent monetary authority. Our public finances are sound and well managed, and our budgeting processes are recognised internationally for their transparency. South Africa is a wealthier and better-educated country than it was two decades ago. Millions of citizens who were previously disenfranchised and marginalised now have access to water, electricity, sanitation and other basic services. Six in 10 schools do not charge fees, and learners from less-privileged backgrounds will have better opportunities than their parents.
But after two decades, we still have a long way to go on our journey of reconstruction and development. South Africa has high levels of poverty, inequality and unemployment. Joblessness among young people is of great concern. In many parts of the country, public services are uneven or of poor quality. Our economy is not growing fast enough to meet the challenges we face.
The 2014 Budget addresses these challenges over the medium term in alignment with South Africa’s long-term framework for economic growth and social development – the National Development Plan.
The medium-term expenditure framework balances continued growth in spending with fiscal consolidation. Spending on social and economic programmes continues to grow in real terms, but more slowly than before. To ensure that our public finances remain sustainable, and that our children are not burdened with the debts of their parents, the expenditure ceiling remains in place.
And what we have must be well spent.
Over the next three years, many of the country’s large infrastructure projects will start to operate. New power stations will begin providing electricity for our factories, schools and households. New and upgraded rail infrastructure, roads and urban transport systems will get more goods to market, workers to work and learners to school. Large water scheme improvements will help to run our mines and farms, and ensure that communities have enough water.
Public works programmes will grow. The employment tax incentive will help young people enter the workforce. Urban planning initiatives will help our cities to become integrated places of work and social life. Innovative and competitive South African firms will be able to increase their exports as the world economy recovers. South Africa will benefit from strong economic growth in sub-Saharan Africa as we strengthen trade and investment links with our fellow African nations.
Consolidated budget expenditure for 2014/15 is R1.25 trillion. Government at all levels needs to improve the way it spends these funds to obtain value for money and to improve service delivery. The 2014 Budget emphasises containing costs and improving efficiency across government. To maintain the expenditure ceiling, additional allocations to priority areas and upward adjustments to the public-sector wage bill have been achieved through reprioritisation across departments.
I would like to acknowledge the hard work of the Ministers’ Committee on the Budget, Cabinet and my colleagues across government, who are helping us to realise our fiscal objectives in a challenging environment. I extend my appreciation to Minister of Finance Gordhan and Deputy Minister Nene for their leadership, dynamism and resolve. And I acknowledge the dedication of the National Treasury staff to ensuring that this institution lives up to its constitutional mandate.

Lungisa Fuzile
Director-General: National Treasury
v
vi
Contents
| | | | | | |
| Chapter 1 | | Building an inclusive economy for the next 20 years of freedom | | | 1 | |
| | Introduction | | | 1 | |
| | Overview of the 2014 Budget | | | 9 | |
| | Conclusion | | | 12 | |
| | |
Chapter 2 | | Economic outlook | | | 13 | |
| | Overview | | | 13 | |
| | Global outlook | | | 15 | |
| | Capital flows, exchange rates and inflation | | | 18 | |
| | Current account and the terms of trade | | | 20 | |
| | Domestic outlook and real economy trends | | | 22 | |
| | Conclusion | | | 29 | |
| | |
Chapter 3 | | Fiscal policy | | | 31 | |
| | Overview | | | 31 | |
| | Fiscal outlook | | | 32 | |
| | Fiscal framework | | | 36 | |
| | Elements of the consolidated budget | | | 37 | |
| | Fiscal sustainability and risks | | | 40 | |
| | Conclusion | | | 44 | |
| | |
Chapter 4 | | Revenue trends and tax proposals | | | 45 | |
| | Overview | | | 45 | |
| | Tax proposals | | | 46 | |
| | Direct taxes: individuals | | | 47 | |
| | Direct taxes: businesses | | | 49 | |
| | Indirect tax proposals | | | 53 | |
| | Revenue impact of tax proposals | | | 56 | |
| | Revenue trends | | | 57 | |
| | Tax administration | | | 59 | |
| | Tax policy research projects | | | 60 | |
| | Conclusion | | | 61 | |
| | |
Chapter 5 | | Asset and liability management | | | 63 | |
| | Overview | | | 63 | |
| | South African debt markets | | | 65 | |
| | National government debt | | | 67 | |
| | State-owned companies | | | 75 | |
| | Development finance institutions | | | 77 | |
| | Conclusion | | | 78 | |
| | |
Chapter 6 | | Medium-term expenditure plans | | | 79 | |
| | Overview | | | 79 | |
| | Consolidated government expenditure | | | 81 | |
| | Revised medium-term expenditure plans | | | 83 | |
| | Conclusion | | | 92 | |
| | |
Chapter 7 | | Provincial and local government | | | 93 | |
| | Overview | | | 93 | |
| | Division of revenue | | | 94 | |
| | Transfers to provinces | | | 96 | |
| | Transfers to local government | | | 100 | |
| | Coordinated planning in the urban environment | | | 103 | |
| | Conclusion | | | 104 | |
vii
| | | | | | |
| | |
Annexure A | | Report of the Minister of Finance to Parliament | | | 109 | |
| | |
Annexure B | | Statistical tables | | | 121 | |
| | |
Annexure C | | Miscellaneous tax amendments | | | 159 | |
| | |
Annexure D | | Summary of Budget | | | 175 | |
| | |
Annexure E | | Glossary | | | 178 | |
| |
Three annexures are available on the National Treasury website (www.treasury.gov.za): | | | | |
| | |
W1 | | Explanatory memorandum to the division of revenue | | | | |
W2 | | Structure of the government accounts | | | | |
W3 | | Strengthening trade and investment links with Africa | | | | |
| | |
Tables | | | | | | |
| | |
| 1.1 | | Macroeconomic outlook – summary | | | 9 | |
| 1.2 | | Consolidated government fiscal framework | | | 10 | |
| 1.3 | | Summary of tax proposals | | | 10 | |
| 1.4 | | Projected state debt and debt-service costs | | | 11 | |
| 1.5 | | Consolidated government expenditure by function | | | 11 | |
| 1.6 | | Division of revenue | | | 12 | |
| | |
| 2.1 | | Revised forecast, 2012 – 2016 | | | 14 | |
| 2.2 | | Annual percentage change in GDP and consumer price inflation in selected regions/countries, 2013 – 2015 | | | 15 | |
| 2.3 | | Composition of South Africa’s trade and trade performance, 2012 – 2013 | | | 21 | |
| 2.4 | | Macroeconomic performance and projections, 2010 – 2016 | | | 22 | |
| 2.5 | | Macroeconomic performance and projections, 2010/11 – 2016/17 | | | 22 | |
| 2.6 | | Public-sector infrastructure expenditure, 2010/11 – 2016/17 | | | 24 | |
| | |
| 3.1 | | Consolidated fiscal framework, 2010/11 – 2016/17 | | | 33 | |
| 3.2 | | Main budget non-interest expenditure, 2010/11 – 2016/17 | | | 34 | |
| 3.3 | | Selected items of goods and services: national and provinces, 2010/11 – 2016/17 | | | 35 | |
| 3.4 | | Consolidated operating and capital accounts, 2010/11 – 2016/17 | | | 36 | |
| 3.5 | | Main budget framework, 2010/11 – 2016/17 | | | 38 | |
| 3.6 | | Revisions to main budget revenue and expenditure estimates, 2013/14 – 2015/16 | | | 39 | |
| 3.7 | | Consolidated budget balance, 2010/11 – 2016/17 | | | 40 | |
| 3.8 | | Public-sector borrowing requirement, 2010/11 – 2016/17 | | | 43 | |
| | |
| 4.1 | | Personal income tax rate and bracket adjustments, 2013/14 – 2014/15 | | | 47 | |
| 4.2 | | Estimates of individual taxpayers and taxable income, 2014/15 | | | 48 | |
| 4.3 | | Pre-retirement lump-sum taxation, 2013/14 – 2014/15 | | | 49 | |
| 4.4 | | Retirement lump-sum taxation, 2013/14 – 2014/15 | | | 49 | |
| 4.5 | | Changes in specific excise duties, 2014/15 | | | 54 | |
| 4.6 | | Total combined fuel taxes on petrol and diesel, 2012/13 – 2014/15 | | | 54 | |
| 4.7 | | Impact of tax proposals on 2014/15 revenue | | | 57 | |
| 4.8 | | Budget estimates and revenue outcome, 2012/13 and 2013/14 | | | 58 | |
| 4.9 | | Budget revenue, 2010/11 – 2016/17 | | | 59 | |
| | |
| 5.1 | | Financing of national government borrowing requirement, 2012/13 – 2016/17 | | | 67 | |
| 5.2 | | Domestic short-term borrowing, 2013/14 – 2014/15 | | | 68 | |
| 5.3 | | Domestic long-term loan issuance, 2013/14 | | | 69 | |
viii
| | | | | | |
| | |
| 5.4 | | Interest rates on retails bonds, February 2014 | | | 70 | |
| 5.5 | | Change in cash balances, 2012/13 – 2016/17 | | | 71 | |
| 5.6 | | Total national government debt, 2010/11 – 2016/17 | | | 71 | |
| 5.7 | | National government debt-service costs, 2012/13 – 2016/17 | | | 72 | |
| 5.8 | | Ownership of domestic government bonds, 2009 – 2013 | | | 73 | |
| 5.9 | | Composition of provisions and contingent liabilities, 2012/13 – 2016/17 | | | 74 | |
| 5.10 | | Guarantee exposure to major state-owned companies and development finance institutions, 2012/13 – 2013/14 | | | 75 | |
| 5.11 | | Major state-owned companies’ capital expenditure programmes, 2012/13 – 2016/17 | | | 75 | |
| 5.12 | | Consolidated balance sheets of state-owned companies, 2008/09 – 2012/13 | | | 76 | |
| 5.13 | | Funding sources for state-owned companies, 2012/13 – 2016/17 | | | 76 | |
| 5.14 | | Consolidated balance sheets of development finance institutions, 2012/13 – 2015/16 | | | 77 | |
| | |
| 6.1 | | Consolidated government expenditure by function, 2013/14 – 2016/17 | | | 82 | |
| 6.2 | | Government support for industrial policy, 2013/14 – 2016/17 | | | 84 | |
| 6.3 | | Funding for employment programmes, 2010/11 – 2016/17 | | | 86 | |
| 6.4 | | Public health expenditure, 2010/11 – 2016/17 | | | 87 | |
| 6.5 | | Education expenditure, 2010/11 – 2016/17 | | | 88 | |
| 6.6 | | Social grant trends as a percentage of GDP, 2010/11 – 2016/17 | | | 89 | |
| 6.7 | | Social grants expenditure by type, 2010/11 – 2016/17 | | | 90 | |
| 6.8 | | Social grant values, 2013/14 and 2014/15 | | | 90 | |
| 6.9 | | Social grants beneficiary numbers by type, 2010/11 – 2016/17 | | | 91 | |
| 6.10 | | Social security funds, 2010/11 – 2016/17 | | | 91 | |
| | |
| 7.1 | | Division of nationally raised revenue, 2010/11 – 2016/17 | | | 95 | |
| 7.2 | | Provincial equitable share, 2014/15 – 2016/17 | | | 96 | |
| 7.3 | | Conditional grants to provinces, 2013/14 – 2016/17 | | | 97 | |
| 7.4 | | Infrastructure transfers to local government, 2010/11 – 2016/17 | | | 103 | |
| | |
Figures | | | | | | |
| | |
| 1.1 | | Real public-sector investment spending, 2000/01 – 2014/15 | | | 6 | |
| | |
| 2.1 | | Net portfolio inflows, 2009 – 2013 | | | 18 | |
| 2.2 | | Nominal and real effective exchange rates, 2000 – 2013 | | | 19 | |
| 2.3 | | Annual inflation, selected categories, 2009 – 2014 | | | 20 | |
| 2.4 | | Current account and terms of trade, 2010 – 2013 | | | 20 | |
| 2.5 | | Contribution to investment growth, 2003 – 2013 | | | 25 | |
| 2.6 | | Gross value added by sector, 2011 – 2013 | | | 25 | |
| 2.7 | | Annual growth in non-agricultural gross value-added and formal employment, 2007 – 2013 | | | 28 | |
| | |
| 3.1 | | Real main budget non-interest expenditure growth, 2003/04 – 2016/17 | | | 34 | |
| 3.2 | | Net government debt, 2005/06 – 2017/18 | | | 41 | |
| 3.3 | | Public-sector debt as percentage of GDP, 1994/95 – 2012/13 | | | 42 | |
| | |
| 5.1 | | Fixed-rate bond yield curve movement | | | 65 | |
| | |
| 6.1 | | Expenditure growth by function | | | 83 | |
ix
x
xi
xii
Building an inclusive economy for the next 20 years of freedom
In brief
| • | | Over the past 20 years, South Africa has built a solid foundation on which to address its challenges. |
| • | | The country’s fiscal and economic policy frameworks were tested by the global financial and economic crisis that began in 2008. Fiscal imbalances remain and growth is still below potential, but the economy has weathered the storm. |
| • | | Government has laid the basis for a new, more inclusive growth path. South Africa continues to face a difficult economic environment, but with bold decisions, the economy can grow more rapidly. |
| • | | The National Development Plan (NDP) increasingly guides the allocation of public resources. Building the platform for faster growth envisioned in the plan will enable the economy to sustain progress over the next 20 years of freedom. |
| | |
| |
It has been two decades since South Africans attained common citizenship in a non-racial democracy. Political change and reconciliation in a united country were the first steps on a long journey of reconstruction and development. A great deal of progress has been made in transforming the lives of South Africans over the past 20 years. Yet the country continues to face high levels of poverty, unemployment and inequality. Plans to address these challenges are at the heart of the budget framework. The constitutional order established in 1994 has proven to be a solid foundation on which to make progress: • The average income of South Africans, which declined by 15 per cent in the last decade of apartheid rule, has increased by over 30 per cent since 1994. The economy has been growing moderately since 2010 and gross domestic product (GDP) per person will continue to rise as investment and economic expansion gather pace. | | South Africa’s constitutional order has proven to be a solid foundation on which to make progress |
1
2014 BUDGET REVIEW
| | |
| | • The economy has created 5.9 million jobs since 1996. • Near-universal school enrolment and the steady increase in average years of education have improved the life prospects of millions of South Africans. University enrolment has doubled. • Access to basic services has grown rapidly. • There has been a significant increase in black participation in the economy, most visible in the transformation of the middle class. |
|
 |
| |
| | South Africa’s ability to sustain social and economic progress is supported by the sound institutional framework established by the Constitution and a vibrant civil society. The Auditor-General, the Reserve Bank, the Independent Electoral Commission, the Public Protector and the courts are effective and independent. Vigorous advocacy, community, labour and religious organisations, a robust free press and respected academic institutions support energetic public engagement on social and development challenges. |
| |
| Policy-making continues to be transparent and rooted in the rule of law | | Policy-making is transparent and rooted in the rule of law. This approach is exemplified by the manner in which public resources are raised and distributed across South Africa’s population of 53 million people. Government’s approach to fiscal governance is entrenched in the Constitution, which requires transparency, accountability, effective financial management and an equitable division of revenue between |
2
CHAPTER 1: BUILDING AN INCLUSIVE ECONOMY FOR THE NEXT 20 YEARS OF FREEDOM
| | |
| national, provincial and local government. The medium-term expenditure framework (MTEF) establishes a predictable budget process that is open to public scrutiny. The country has a progressive and efficient tax system. The stable macroeconomic platform has proven resilient and sufficiently flexible to adjust to a volatile global environment. | | |
| |
| No room for complacency | | |
| |
| Twenty years of democracy have brought enduring achievements for South Africa. Yet there is no room for complacency. The country continues to face profound challenges. Hard work and decisive action are required to diversify the economy and raise export competitiveness. Partnerships are needed to overcome entrenched structural unemployment. Broader economic opportunity, more effective social services and rapid job creation are required to overcome severe inequality of income and opportunity. The quality of learning and teaching in poor communities must be transformed. To overcome apartheid’s spatial legacy, the provision of housing and social infrastructure needs to be improved, and planning frameworks across government strengthened. | | 20 years of progress, but profound challenges remain |
| |
| Government recognises that service-delivery shortcomings and social marginalisation are widespread and have led to heightened tensions. While South Africa faces resource constraints, urgent concerns in communities across the country—from lack of housing to water service failures—require improved accountability, responsiveness and effective leadership. Where the labour relations environment has come under strain, more effective methods of cooperation are needed. Government is working to address these issues at the highest level, and is meeting with business, labour and communities to ensure that their concerns are heard. | | Government is meeting with business, labour and communities to ensure their concerns are heard |
| |
| Accelerating progress on the National Development Plan | | |
| |
| Government has adopted the NDP as the country’s framework for economic and social transformation. The plan aims to accelerate growth to eliminate poverty and reduce inequality by 2030. Together with the New Growth Path and Industrial Policy Action Plan, the NDP lays the basis for economic transformation, stressing that change is required on many fronts to modernise the economy, address development challenges and improve the lives of South Africans. | | The NDP is the country’s framework for economic and social development |
| |
| The NDP’s integrated approach increasingly guides the allocation of public resources within a sustainable framework. Government’s medium-term budget priorities include improvements to public infrastructure, actions to draw more young people into employment and improvements in the quality of services. The accompanying table contains examples of NDP priorities that are directly funded and supported over the medium term. | | Budget priorities include infrastructure, youth employment and improved service delivery |
3
2014 BUDGET REVIEW
| | |
NDP CRITICAL ACTIONS* | | MEDIUM-TERM INITIATIVES |
| PARTNERSHIP | | |
| |
| A social compact to reduce poverty and inequality, and raise employment and investment | | Building on formal social accords and consultation related to the mining sector, social cohesion, industrial development and youth employment, government will continue to develop active partnerships with business, labour and civil society |
| |
POVERTY AND THE SOCIAL WAGE Address poverty and its impacts by broadening access to employment, strengthening the social wage, improving public transport and raising rural incomes | | The Community Work Programme will be present in every municipality New bus rapid transit systems will be constructed in nine cities, while the existing networks in Johannesburg and Cape Town will be expanded There will be extensive support for smallholder farmers, rural employment programmes and land restitution |
| |
PUBLIC SERVICE Steps by the state to professionalise the public service, strengthen accountability, improve coordination and prosecute corruption | | Detailed expenditure reviews are under way across government The Chief Procurement Officer will step up monitoring of government tenders Indirect grants will improve spending on key service-delivery projects Capacity-building grants for municipalities will strengthen skills in local government |
| |
JOBS Boost private investment in labour- intensive areas, competitiveness and exports, with adjustments to lower the risk of hiring younger workers | | The employment tax incentive, which lowers the cost of hiring young workers, can be expanded to special economic zones and specific sectors Industrial support programmes and manufacturing incentives will boost competitiveness and promote inclusive growth The Expanded Public Works Programme will aim to create 6 million jobs of short to medium duration over the next five years. Special economic zones to promote exports will expand Support for small, medium and micro enterprises will grow |
| |
EDUCATION An education accountability chain, with lines of responsibility from state to classroom | | Annual national assessments will monitor progress in improving education outcomes The National Education Collaboration Trust fosters cooperation throughout the education system—from government to teachers, parents and students |
| |
HEALTH Phase in national health insurance (NHI), with a focus on upgrading public health facilities, producing more health professionals and reducing the relative cost of private healthcare | | More than R21 billion is allocated to build, refurbish and maintain health infrastructure Two NHI conditional grants will support contracting doctors and establishing new financial mechanisms for hospitals, and piloting health service innovations in 10 pilot districts The health professions training and development grant will boost the number of professionals in public health The Office of Health Standards Compliance will be launched in 2014/15 |
| |
INFRASTRUCTURE Public infrastructure investment at 10 per cent of GDP, financed through tariffs, public-private partnerships, taxes and loans, and focused on transport, energy and water | | Public-sector investment will total R847.3 billion, equivalent to 7 per cent of GDP each year The independent power producer programme is diversifying out of renewables into gas, hydroelectric, coal and cross-border projects Construction of Medupi and Kusile power stations is proceeding Transnet will upgrade its coal, iron ore and manganese lines, and 29 large bulk water schemes are under construction |
| |
ENVIRONMENT Interventions to ensure environmental sustainability and resilience to future shocks | | Tax reforms will support the transition to a low-carbon economy Additional rounds of renewable energy procurement will take place More than 62 000 hectares of degraded land and ecosystems will be restored |
| |
DYNAMIC CITIES New spatial norms and standards— densifying cities, improving transport, locating jobs where people live, upgrading informal settlements and fixing housing market gaps | | 1 400 informal settlements will be upgraded The Cities Support Programme and a range of grants related to urban infrastructure and development will promote more integrated cities The capital restructuring grant for social housing will finance construction of 18 000 medium-density rental units close to transport, economic and social amenities |
| |
FIGHTING CRIME Reduce crime by strengthening criminal justice and improving community environments | | Additional detectives will be appointed and a DNA database will be established Construction, rehabilitation, upgrade and maintenance of courts will continue Information technology enhancements will improve efficiency across the criminal justice cluster Procurement policies and supply-chain management systems will be reviewed to improve safeguards against corruption and maladministration |
|
* Source: http://www.npconline.co.za/MediaLib/Downloads/Home/Tabs/NDP%202030-Overview.pdf |
4
CHAPTER 1: BUILDING AN INCLUSIVE ECONOMY FOR THE NEXT 20 YEARS OF FREEDOM
| | |
The NDP advocates a new approach to addressing policy challenges that builds on expanded collaboration between the public and private sectors, labour and civil society. Recent examples of the kind of partnerships envisioned in the plan include: • The Renewable Energy Independent Power Producer Procurement Programme, which draws in private investment and encourages technological innovation to generate environmentally sustainable electricity. | | Renewable energy, education and jobs partnerships point the way to greater collaboration |
• The National Education Collaboration Trust, which mobilises business, communities and government in a collective effort to improve infrastructure and teaching in the neediest schools. • The Jobs Fund, which matches public-sector support with private- sector funding to support job creation. • The Clothing and Textiles Competitiveness Programme, which combines production incentives and skills development with efforts to prevent illegal imports. • The green economy and youth employment accords, through which government, business and labour commit to support clear objectives. | |
Renewable energy programme: investing in the future
The Renewable Energy Independent Power Producer Procurement Programme has raised private investment in solar, wind, hydroelectric and biomass-based technologies to generate electricity.
The programme was launched in August 2011. To date, there have been three bid submission windows. Out of 225 bids, 64 have been accepted for the procurement of nearly 4 000 MW of electricity. As expected, the competitive bidding process has led to progressive reductions in the contracted supply price, from more than R3 000/kWh in the first bid to less than R1 000/kWh in the third.
Investment worth R120.2 billion has been mobilised, one-third of which will be procured from local suppliers. Most power plants will be located in rural areas and about 20 000 jobs will be created in the construction phase, with another 35 000 jobs in plant operations. Most of this new employment will be in the Northern and Eastern Cape. Communities will also benefit from social investment obligations and equity participation.
Building a platform for faster, more inclusive growth
| | |
| More than five years of global economic turmoil have tested South Africa’s public finances, its economic policy framework and its regulatory environment. One million job losses and a marked fall in tax revenue constituted a real-world stress test of unexpected proportions. | | |
| |
| Government’s macroeconomic framework has proven resilient and adaptable. Prudent and transparent fiscal management, inflation targeting and a flexible exchange rate in the context of open capital markets enabled the economy to continue growing moderately following the 2009 recession. Fiscal imbalances remain and economic growth is still below potential, but output and employment have returned to pre-crisis levels. South Africa’s debt levels are manageable and the long-term fiscal outlook supports sustainable public finances. The R25 billion economic competitiveness and support package that government launched in 2011 helped vulnerable firms to weather the downturn, and will help to boost productivity in the years ahead. | | Fiscal imbalances remain,
but the public finances are
sustainable and debt levels
are manageable |
| |
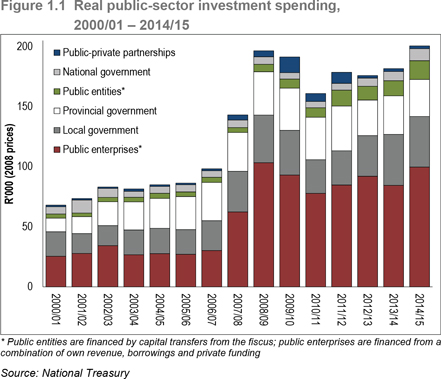
| Government’s response to the crisis has also helped to build a platform for faster, more inclusive economic growth. This is reflected in increased public-sector investment in electricity, transport, water, roads, schools and | | Government recognises
the need to achieve faster,
more inclusive growth |
5
2014 BUDGET REVIEW
| | |
| | hospitals. The annual volume of capital investment by public enterprises has increased by more than 260 per cent in real terms over the past 10 years. Local government’s annual infrastructure spending has doubled in real terms since the late 1990s. The public sector has invested over R1 trillion in infrastructure since 2009/10. |
| |
| |  |
| |
| Nearly 16 million South Africans now receive some form of social assistance | | Government has significantly increased social expenditure, notably in the expansion of social assistance grants and the implementation of antiretroviral therapy to combat HIV, which has contributed to a recovery of life expectancy from 52 years a decade ago to 60 years today. About 15.8 million South Africans now receive some form of social assistance. Social services have grown, with public employment increasing by 56 000 in health, 40 000 in criminal justice and 15 000 in education over the last five years. |
| |
| Third phase of Expanded Public Works Programme to launch April 2014 | | Policy innovations developed over the past five years, such as the Jobs Fund, are gaining traction. The third phase of the Expanded Public Works Programme will be launched in April of this year. Over the next five years, it aims to create 6 million jobs of short to medium duration, up from 4 million in the elapsing five-year period. |
| |
| | The shift towards a more labour-intensive growth path is supported by the employment tax incentive, which helps the private sector to create jobs. Tax revenue of R1 billion is foregone in the 2014 Budget to support this initiative, and government plans to expand the programme in the years ahead. |
| |
| Tax and other incentives will support special economic zones | | Government devotes significant resources to industrial development and transformation, helping to boost output and employment. Tax and other incentives to support special economic zones are being finalised. These zones will promote value-added exports and generate jobs in economically disadvantaged parts of the country. An action plan to support the NDP |
6
CHAPTER 1: BUILDING AN INCLUSIVE ECONOMY FOR THE NEXT 20 YEARS OF FREEDOM
| | |
| target of creating 1 million jobs in agriculture by 2030 is nearing completion. Government support for innovation and science is reflected in incentives for research and development, and investments such as the Square Kilometre Array. | | |
| |
| South Africa continues to face a challenging economic environment over the short term. Economic growth is expected to fall short of the NDP target of 5.4 per cent required to rapidly expand hiring and roll back unemployment. Over the period ahead, rapid progress depends on how well the country is able to innovate and respond competitively in a fast-changing global economy, with a particular focus on the African continent. Faster growth will require bold decisions and difficult trade-offs. | | Innovation is needed to compete in a fast-changing global economy |
| |
| Economic outlook strengthens over medium term | | |
| |
| The economy is growing at a moderate pace but continues to perform below its potential. Over the medium term, higher growth will support stronger investment and job creation as major infrastructure projects release constraints to greater private-sector output. New power stations, including the Medupi plant, will become operational. Public transport and freight logistics infrastructure will improve significantly. The details of government’s broadband development plan will soon be finalised. | | New power stations, public transport and other infrastructure to be rolled out over medium term |
| |
| South Africa will draw strength from the rapid expansion of trade and investment on the African continent. Today, 29 per cent of South Africa’s non-mineral exports go to Africa, up from 19 per cent a decade ago. By comparison, 28 per cent of exports go to the European Union. South African firms working in other African countries are competitive in fast-growing sectors, including mining, finance, telecommunications and retail. These and other investments promote growth and development across sub-Saharan Africa, while creating a platform for further export growth and improving the balance of payments over time. Government will increasingly align its policy frameworks to support economic integration with the African continent. | | Growing trade and investment links with other African countries |
| |
| Exports will benefit from an improving economic performance in the United States and the return to growth in the European Union. Emerging markets, which are expanding at a slower pace than in recent years, continue to be key growth markets for South Africa. Gains associated with the improving global outlook will be particularly beneficial if the depreciation in the rand’s exchange value is translated into permanent improvements in competitiveness. | | |
| |
| South Africa’s cities can generate dynamic economic growth. This requires improved planning, governance frameworks and infrastructure financing to overcome the inequitable spatial patterns that impose significant costs on poor households, the environment and the economy as a whole. Backed by a review of grant mechanisms and an increase in allocations to municipalities, the 2014 Budget supports investment in transport infrastructure and development corridors. | | Helping cities to generate dynamic growth by overcoming inequitable spatial patterns |
| |
| Adjusting to new economic conditions | | |
| |
| To take advantage of a stronger global recovery, South Africa will have to adapt to changes in the world economy. Slowing growth in China, and its shift from investment-led growth to greater domestic consumption, is | | |
7
2014 BUDGET REVIEW
| | |
| | weighing down the prices of some of South Africa’s key commodity exports. Faster recovery in the United States has the potential to improve global growth, but it is also leading to rising global interest rates. Recent US monetary policy adjustments have led to increased volatility in capital markets and capital inflows to South Africa have slowed. |
| |
| Elevated current account deficit remains a concern until exports increase and investment flows strengthen | | Prevailing global conditions limit the space available to the fiscus over the next several years. South Africa invests more than it saves and imports more than it exports, leading to a large current account deficit. The sharp depreciation in the rand’s nominal exchange value creates the potential for more competitive exports, but the economy remains vulnerable to external funding pressures until exports increase and investment flows strengthen. |
| |
| Flexible exchange rate acts as an effective shock absorber for external volatility | | To date, South Africa’s flexible exchange rate has acted as an effective shock absorber for global turbulence. Deep and liquid financial markets reduce the funding vulnerability of the fiscus. Well-regulated and well-managed financial institutions are able to respond to changing global conditions. Strong balance sheets and low levels of foreign currency denominated debt support the resilience of the financial system. |
| |
| | However, exchange rate depreciation means that imported capital goods required for public and private investment programmes will cost more. The inflation outlook has deteriorated and rising interest rates will increase the cost of borrowing for government and the private sector. A weaker terms-of-trade outlook may result in less buoyant tax collection even as bond yields rise, putting upward pressure on debt-service costs. |
| |
| Government will maintain its expenditure ceiling, with no additional funds added to total spending | | Aware of these risks, government is maintaining its expenditure ceiling. No additional funds have been added to the total expenditure announced in last year’s Budget. Spending continues to grow in real terms, but much more slowly than in previous years. Inflation and a nominal spending ceiling will put real budgets under pressure over the medium term, requiring government departments to work more efficiently. |
| |
| | Over the MTEF period, government is preparing the ground for national health insurance, and expanding further education and training, and early childhood development. There is a strong connection between the rate of economic growth and the affordability of social programmes. Public spending must be financed from resources drawn from the economy, and faster economic growth increases government revenue. Nevertheless, structural increases in expenditure will need to be financed by corresponding increases in revenue. Over the period ahead, careful attention will be paid to the design of tax arrangements that may be required to fund these initiatives. |
| |
| Tax Review Committee will issue its first reports during 2014 | | Last year, the Minister of Finance appointed the Tax Review Committee, chaired by Judge Dennis Davis. The committee has a broad mandate to investigate aspects of the tax system and make recommendations for possible reforms. The committee will issue its first reports during 2014. |
8
CHAPTER 1: BUILDING AN INCLUSIVE ECONOMY FOR THE NEXT 20 YEARS OF FREEDOM
| | |
| Improving the quality of public services and cutting waste | | |
| |
| The 2014 Budget aims to improve the quality of public services to achieve better outcomes within the current fiscal envelope. If resources are wasted or diverted, the potential outcomes of public interventions are diminished and so is the case for increased resource allocation. A series of related initiatives are focusing on these concerns: | | Spending reviews and
forensic investigations help
to cut waste, increase
efficiency |
| • | | Several spending reviews are under way, conducted jointly by the National Treasury and the Department of Performance Monitoring and Evaluation. The reviews aim to provide greater understanding of performance and value for money in areas such as housing, education and industrial policy. |
| • | | Similar spending reviews have been conducted in provincial government, and suggest a range of efficiency improvements that can enhance value for money. |
| • | | The Office of the Accountant-General is strengthening the control environment for government’s financial systems. Over the last 12 months, it conducted 68 investigations into fraud, corruption and maladministration, resulting in 47 criminal investigations and 65 disciplinary hearings. Payments worth R503 million have been cancelled and R61 million has been surrendered back to the fiscus. |
| • | | As part of efforts to combat waste, government issued cost- containment instructions in January 2014. Budgets for consultants, travel, accommodation and venue hire have been curtailed, and are expected to decline in real terms. |
| | |
| |
| The 2014 Budget responds to the challenges and opportunities facing South Africa over the period ahead. The sections that follow summarise the main elements of the budget. | | |
| ¢ | Overview of the 2014 Budget |
Economic outlook
| | |
| Chapter 2 presents the economic outlook. GDP growth, which declined from 2.5 per cent in 2012 to 1.8 per cent in 2013, is projected to increase to 2.7 per cent in 2014, reaching 3.5 per cent in 2016. Moderate employment growth is expected over the next three years. | | GDP growth of 1.8 per cent
in 2013, increasing to
3.5 per cent in 2016 |
Table 1.1 Macroeconomic outlook – summary
| | | | | | | | | | | | | | | | |
| | | 2013 | | | 2014 | | | 2015 | | | 2016 | |
Real percentage growth (unless otherwise indicated) | | Estimate | | | Forecast | |
Household consumption | | | 2.7 | | | | 2.8 | | | | 3.2 | | | | 3.4 | |
Gross fixed capital formation | | | 3.2 | | | | 4.2 | | | | 5.3 | | | | 6.0 | |
Exports | | | 4.8 | | | | 5.6 | | | | 6.3 | | | | 7.0 | |
Imports | | | 7.3 | | | | 5.3 | | | | 6.1 | | | | 7.0 | |
Gross domestic product | | | 1.8 | | | | 2.7 | | | | 3.2 | | | | 3.5 | |
| | | | | | | | | | | | | | | | |
Consumer price inflation (CPI) | | | 5.7 | | | | 6.2 | | | | 5.9 | | | | 5.5 | |
Current account balance (% of GDP) | | | -6.1 | | | | -5.9 | | | | -5.8 | | | | -5.5 | |
Across all tables in the Budget Review, the use of “0” refers to a value of small magnitude that is rounded up or down to zero. If a value is exactly zero, it will be denoted by “–”. If data is not available it is denoted by “N/A”
9
2014 BUDGET REVIEW
| | |
| | The private sector will be the major contributor to job creation, while the public sector will continue to support growth through a range of initiatives. Public investment in infrastructure is expected to reduce bottlenecks in electricity and transport, and encourage private investment, while stronger employment growth will contribute to increased household consumption. South Africa should also benefit from the improved export opportunities presented by a stronger global and regional outlook. |
| |
| | Fiscal policy |
| |
| Budget deficit narrows to 4.0 per cent in 2013/14 | | Chapter 3 sets out government’s fiscal policy. Despite slower-than-expected GDP growth, the budget deficit is expected to narrow to 4.0 per cent in 2013/14, down from 4.3 per cent in 2012/13. The reduced deficit is the combined result of government’s expenditure ceiling and strong revenue collections. Spending will be well contained over the MTEF period and the budget deficit is projected to narrow to 2.8 per cent of GDP by 2016/17. |
| | | | | | | | |
| Table 1.2 Consolidated government fiscal framework |
| | | | | | | | | | | | | | | | |
R billion | | 2013/14
Revised
estimate | | | 2014/15 | | | 2015/16 | | | 2016/17 | |
| | | Medium-term estimates | |
Revenue | | | 1 010.5 | | | | 1 099.2 | | | | 1 201.3 | | | | 1 324.7 | |
Percentage of GDP | | | 29.2 | % | | | 29.0 | % | | | 28.9 | % | | | 29.1 | % |
Expenditure | | | 1 149.3 | | | | 1 252.3 | | | | 1 351.6 | | | | 1 451.6 | |
Percentage of GDP | | | 33.2 | % | | | 33.0 | % | | | 32.6 | % | | | 31.9 | % |
Budget balance | | | -138.8 | | | | -153.1 | | | | -150.3 | | | | -126.9 | |
Percentage of GDP | | | -4.0 | % | | | -4.0 | % | | | -3.6 | % | | | -2.8 | % |
| | |
| | Revenue trends and tax proposals |
| |
| Tax revenue expected to recover to 25.9 per cent of GDP in 2013/14 | | Chapter 4 reviews revenue trends and sets out tax proposals. The tax policy framework has proven resilient in a period of global volatility. |
|
| Table 1.3 Summary of tax proposals |
| | | | | | | | | | | | |
| | | 2013/14 | | | 2014/15 | |
R billion | | Budget
estimate | | | Revised
estimate | | | Budget
estimate | |
Tax revenue (gross) | | | 898.0 | | | | 899.0 | | | | 999.2 | |
Non-tax revenue | | | 23.3 | | | | 30.5 | | | | 20.9 | |
Less: SACU payments | | | -43.4 | | | | -43.4 | | | | -51.7 | |
| | | | | | | | | | | | |
Main budget revenue | | | 878.0 | | | | 886.2 | | | | | |
| | | | | | | | | | | | |
Tax revenue (before tax proposals) | | | | | | | | | | | 999.2 | |
| | | | | | | | | | | | |
Tax proposals | | | | | | | | | | | -5.6 | |
(Net) personal income tax relief | | | | | | | | | | | -9.3 | |
Business taxes | | | | | | | | | | | -1.0 | |
Taxes on goods and services | | | | | | | | | | | 4.7 | |
Tax revenue (after tax proposals) | | | | | | | | | | | 993.7 | |
| | | | | | | | | | | | |
Consolidated budget revenue (after tax proposals) | | | | | | | | | | | 1 099.2 | |
| | | | | | | | | | | | |
| | |
| | While nominal gross tax revenue declined during the 2009 recession, tax revenue is expected to recover to 25.9 per cent of GDP in 2013/14, supported by strong growth in corporate income tax and customs duties. |
10
CHAPTER 1: BUILDING AN INCLUSIVE ECONOMY FOR THE NEXT 20 YEARS OF FREEDOM
| | |
| Tax proposals for the 2014 Budget continue to prioritise economic growth, job creation and generating sufficient revenue to finance government spending in line with the NDP. | | |
Asset and liability management
| | |
| |
| Chapter 5 discusses the management of government’s assets and liabilities. South Africa’s borrowing strategy is sufficiently responsive to withstand long-term adjustments in global and domestic capital allocations and short-term market shocks. | | Despite volatility in global capital flows, government’s borrowing programme remains on track |
Debt levels remain sustainable. South Africa’s debt has a long maturity structure and its exposure to foreign currency liabilities remains low, reducing the impact of global volatility. The 2013/14 borrowing requirement will be R162.9 billion, decreasing to R151 billion in 2016/17. Financing this requirement will increase government’s net loan debt from R1.4 trillion in 2013/14 to R2 trillion by 2016/17. The cost of servicing debt over the same period will increase from R101.3 billion to R139.2 billion. | |
Table 1.4 Projected state debt and debt-service costs
| | | | | | | | | | | | | | | | |
R billion | | 2013/14 | | | 2014/15 | | | 2015/16 | | | 2016/17 | |
Net loan debt | | | 1 375.5 | | | | 1 589.1 | | | | 1 804.6 | | | | 2 019.0 | |
Percentage of GDP | | | 39.7 | % | | | 41.9 | % | | | 43.5 | % | | | 44.3 | % |
Debt-service costs | | | 101.3 | | | | 114.9 | | | | 126.6 | | | | 139.2 | |
Percentage of GDP | | | 2.9 | % | | | 3.0 | % | | | 3.1 | % | | | 3.1 | % |
Medium-term expenditure plans
Chapter 6 presents national government’s medium-term spending priorities. Over the period ahead, government will continue to increase the breadth and the quality of services.
Table 1.5 Consolidated government expenditure by function
| | | | | | | | | | | | |
| | | 2013/14 | | | 2014/15 | | | % Average growth | |
R billion | | Revised estimate | | | Budget estimate | | | 2013/14 – 2016/17 | |
Defence, public order and safety | | | 154.5 | | | | 163.6 | | | | 6.0 | % |
Economic infrastructure | | | 84.7 | | | | 92.8 | | | | 7.5 | % |
Economic services | | | 47.9 | | | | 50.0 | | | | 5.0 | % |
Education and related functions | | | 240.5 | | | | 253.8 | | | | 6.8 | % |
Employment and social security | | | 47.9 | | | | 57.3 | | | | 13.1 | % |
General public services | | | 62.6 | | | | 65.1 | | | | 5.8 | % |
Health | | | 134.3 | | | | 145.7 | | | | 7.1 | % |
Local government, housing and community amenities | | | 127.2 | | | | 142.9 | | | | 8.7 | % |
Science and technology and environmental affairs | | | 17.5 | | | | 18.7 | | | | 6.4 | % |
Social protection | | | 130.9 | | | | 144.5 | | | | 7.7 | % |
| | | | | | | | | | | | |
Allocated expenditure | | | 1 048.0 | | | | 1 134.4 | | | | 7.3 | % |
Debt-service costs | | | 101.3 | | | | 114.9 | | | | 11.2 | % |
Contingency reserve | | | — | | | | 3.0 | | | | | |
| | | | | | | | | | | | |
Consolidated expenditure1 | | | 1 149.3 | | | | 1 252.3 | | | | 8.1 | % |
| �� | | | | | | | | | | | |
| 1. | Consisting of national, provincial, social security funds and selected public entities Refer to Annexure W2 for a detailed list of entities included |
11
2014 BUDGET REVIEW
| | |
| | | Social spending – including social grants, education and health – will remain the largest component of
government expenditure. There is strong growth in the allocations to public employment programmes,
particularly the Community Work Programme. Investment in infrastructure, with a specific focus on
water provision, also increases over the next three years. Reprioritisation has allowed government to
shift funds to areas targeted for support. The budget framework allows for average annual real growth in non-interest spending of 1.9 per cent
over the 2014/15–2016/17 MTEF period. |
| | |
| | Division of revenue |
| |
Helping provinces and
municipalities expand
investments in economic
infrastructure and services | | Over the medium term, the division of revenue is designed to help provinces and municipalities expand
investment in economic infrastructure and services that directly support economic activity. Provincial
governments are allocated 43.4 per cent of available funds, mainly for education, health and social
welfare. Transfers to municipalities stabilise at about 9 per cent of the total division of revenue over the
medium term, following more than a decade of strong growth. Local government’s share of the division
of revenue was only 3 per cent in 2000/01, but grew at an annual average rate of 24 per cent until
2013/14. |
| |
| | | Table 1.6 Division of revenue |
| | | | | | | | | | | | | | | | |
R billion | | 2013/14 | | | 2014/15 | | | 2015/16 | | | 2016/17 | |
National allocations | | | 449.3 | | | | 489.4 | | | | 522.3 | | | | 553.0 | |
Provincial allocations | | | 414.9 | | | | 444.4 | | | | 477.6 | | | | 508.3 | |
Equitable share | | | 338.9 | | | | 362.5 | | | | 388.0 | | | | 412.0 | |
Conditional grants | | | 76.0 | | | | 82.0 | | | | 89.7 | | | | 96.2 | |
Local government allocations | | | 83.7 | | | | 90.8 | | | | 100.0 | | | | 105.2 | |
| | | | | | | | | | | | | | | | |
Total allocations | | | 947.9 | | | | 1 024.7 | | | | 1 099.9 | | | | 1 166.4 | |
| | | | | | | | | | | | | | | | |
Percentage shares | | | | | | | | | | | | | | | | |
National departments | | | 47.4 | % | | | 47.8 | % | | | 47.5 | % | | | 47.4 | % |
Provincial | | | 43.8 | % | | | 43.4 | % | | | 43.4 | % | | | 43.6 | % |
Local government allocations | | | 8.8 | % | | | 8.9 | % | | | 9.1 | % | | | 9.0 | % |
| | |
| |
| | | ¢ Conclusion Over two decades, South Africa has built a solid foundation on which to address its many challenges.
The country’s fiscal and economic policy frameworks were tested during the last five years by the global
economic crisis. Fiscal imbalances remain and growth is still below potential, but the economy has
weathered the storm. |
| |
| | | Over the past five years, government has laid the basis for a new and more inclusive growth path. The
NDP increasingly guides the allocation of public resources within a sustainable framework and provides
focus for urgent improvements in the quality of government services. |
| |
| | | With bold decisions, the economy can grow more rapidly. The platform for faster growth envisioned in
the NDP will enable the economy to sustain and expand progress over the next 20 years of freedom. |
12
2
Economic outlook
In brief
| • | | GDP growth is projected to increase from 1.8 per cent in 2013 to 3.5 per cent in 2016. |
| • | | The medium-term outlook is supported by investment in electricity and transport that will lift output constraints, an expected pick-up in private investment and low real interest rates. |
| • | | The stronger global recovery presents new opportunities to increase exports, provided that the domestic economy can raise productivity and competitiveness. |
| • | | The weaker rand exchange rate is a risk to the inflation outlook, but sustained real depreciation can increase export competitiveness. This will require monetary and fiscal choices to ensure low and stable inflation. |
| • | | In line with the National Development Plan (NDP), government continues to invest in economic infrastructure, and supports a range of microeconomic reforms to boost potential growth. |
| | |
| While moderate economic growth continues and the outlook improves over the next several years, the South African economy is performing below its potential. Over the period ahead, new power plants and transport infrastructure will lift constraints to output, a stronger global recovery will support exports, and growth in sub-Saharan Africa will promote expanded trade and investment. The macroeconomic framework is resilient, supported by healthy public finances. To grow the economy at a faster rate that can rapidly reduce unemployment and poverty requires bold decisions to increase competitiveness and innovation in a fast-changing world. | | South Africa needs to become more competitive and innovative in a fast-changing world economy |
| |
| Government has adopted the NDP as its framework for economic and social development. The plan’s success depends on partnerships between business, labour, government and civil society. The integrated actions proposed in the NDP will boost long-term growth and job creation. | | |
13
2014 BUDGET REVIEW
20 years of transforming the economy
Despite the significant development challenges that it continues to face, South Africa today is a wealthier society than it was in 1994, with greater access to economic opportunities and reduced levels of poverty.
Macroeconomic stability – anchored in prudent fiscal management, inflation targeting and a flexible exchange rate – has translated into declining interest rates, stable inflation, improving government finances, higher investment and exports, and rising GDP per person. Inflation, which averaged 14 per cent in the decade prior to 1994, fell to an average of 5.5 per cent between 2003 and 2013. Improved government finances contributed to a broad decline in borrowing costs across the economy.
South Africa has become integrated into the world economy. Other African and emerging economies account for a growing share of trade and investment. Large firms have access to capital and have expanded operations to other jurisdictions. Local equity and bond markets have drawn in large domestic and global capital flows, contributing to investments that have benefited the economy as a whole.
Black ownership of Johannesburg Stock Exchange (JSE) listed shares increased from 5 per cent in 1995 to 21 per cent in 2012. The percentage of executive managers who are black (both public and private sector) increased from 13 per cent in 2000 to 32 per cent in 2012, and senior managers who are black increased from 19 per cent in 2000 to 39 per cent in 2012. Africans now make up the majority of South Africa’s middle class.
Economic gains, 1994 – 2013
| | | | |
| | | 1994 | | 2013 |
GDP growth1 | | 0.8% | | 3.4% |
Ratio of exports to GDP1 | | 26.0% | | 29.7% |
Employment | | 9.3 million2 | | 15.2 million |
Consumer inflation1 | | 14.0% | | 5.5% |
JSE market capitalisation | | R0.92 trillion | | R10.6 trillion |
Gross gold and foreign reserves | | US$3.1 billion | | US$49.6 billion |
Prime lending rate at 1 January | | 15.25% | | 8.5% |
Tax revenue | | R113.8 billion | | R813.8 billion3 |
Registered taxpayers | | 1.7 million | | 13.7 million3 |
Poverty rate7 | | 41.1%4 | | 31.3%5 |
Number of people living in LSM 5-10 | | 16.7 million6 | | 28.8 million3 |
| 1. | Average over preceding decade 2. 1996 data 3. 2012 data 4. 1993 data 5. 2009 data 6. 2004 data 7. World Bank, based on R290 poverty line (2009 prices) |
Source: JSE, National Treasury, Reserve Bank, South African Audience
Research Foundation, South African Revenue Service, Statistics South Africa, World Bank
| | |
| | Revised economic outlook |
| |
| GDP growth is projected to rise from 2.7 per cent in 2014 to 3.5 per cent in 2016 | | GDP growth, which declined from 2.5 per cent in 2012 to 1.8 per cent in 2013, is projected to increase to 2.7 per cent in 2014, reaching 3.5 per cent in 2016. Public investment in infrastructure is expected to reduce bottlenecks in electricity and transport, and encourage private investment, while stronger employment growth will contribute to increased household consumption. |
| |
| | Moderate inflation and relatively low real interest rates will support economic activity. Exports should also benefit from a strengthening global recovery and regional growth. |
Table 2.1 Revised forecast, 2012 – 2016
| | | | | | | | | | | | | | | | | | | | |
| | | 2012 | | | 2013 | | | 2014 | | | 2015 | | | 2016 | |
Calendar year | | Actual | | | Estimate | | | Forecast | |
Real GDP growth | | | 2.5 | | | | 1.8 | | | | 2.7 | | | | 3.2 | | | | 3.5 | |
CPI inflation | | | 5.6 | | | | 5.7 | | | | 6.2 | | | | 5.9 | | | | 5.5 | |
Current account balance (% of GDP) | | | -5.2 | | | | -6.1 | | | | -5.9 | | | | -5.8 | | | | -5.5 | |
Source: Reserve Bank and National Treasury
14
CHAPTER 2: ECONOMIC OUTLOOK
| | |
| The International Monetary Fund (IMF) projects that global economic growth will increase from 3.7 per cent this year to 3.9 per cent in 2015. Economic activity in advanced economies has strengthened. The outlook for emerging markets remains positive, with projected economic growth of 5.1 per cent in 2014, up from 4.7 per cent in 2013. | | Signs of stronger global recovery, with 3.7 per cent growth projected this year |
| |
| The global outlook presents both opportunities and risks for South Africa. The recovery in advanced economies will translate into moderately higher demand for South African exports. Prices for South Africa’s main commodities have declined and the terms of trade – the country’s export prices compared with its import prices – have deteriorated, widening the current account deficit. Elections will take place in many major economies in 2014; uncertainty over outcomes may delay investment decisions and hinder international policy coordination. Short-term capital flow volatility is likely to continue, with consequences for the exchange rate, the current account and borrowing costs. | | |
Table 2.2 Annual percentage change in GDP and consumer price inflation in selected regions/countries, 2013 – 2015
| | | | | | | | | | | | | | | | | | | | | | | | |
| Region/country | | 2013 | | | 2014 | | | 2015 | | | 2013 | | | 2014 | | | 2015 | |
Percentage | | GDP projections1 | | | CPI projections2 | |
World | | | 3.0 | | | | 3.7 | | | | 3.9 | | | | 3.8 | | | | 3.8 | | | | 3.6 | |
Advanced economies | | | 1.3 | | | | 2.2 | | | | 2.3 | | | | 1.4 | | | | 1.8 | | | | 1.8 | |
US | | | 1.9 | | | | 2.8 | | | | 3.0 | | | | 1.4 | | | | 1.5 | | | | 1.8 | |
Euro area | | | -0.4 | | | | 1.0 | | | | 1.4 | | | | 1.5 | | | | 1.5 | | | | 1.4 | |
UK | | | 1.7 | | | | 2.4 | | | | 2.2 | | | | 2.7 | | | | 2.3 | | | | 2.0 | |
Japan | | | 1.7 | | | | 1.7 | | | | 1.0 | | | | 0.0 | | | | 2.9 | | | | 1.9 | |
Emerging markets and | | | 4.7 | | | | 5.1 | | | | 5.4 | | | | 6.2 | | | | 5.7 | | | | 5.2 | |
developing economies | | | | | | | | | | | | | | | | | | | | | | | | |
Brazil | | | 2.3 | | | | 2.3 | | | | 2.8 | | | | 6.3 | | | | 5.8 | | | | 5.3 | |
Russia | | | 1.5 | | | | 2.0 | | | | 2.5 | | | | 6.7 | | | | 5.7 | | | | 5.4 | |
India | | | 4.4 | | | | 5.4 | | | | 6.4 | | | | 10.9 | | | | 8.9 | | | | 7.5 | |
China | | | 7.7 | | | | 7.5 | | | | 7.3 | | | | 2.7 | | | | 3.0 | | | | 3.0 | |
Sub-Saharan Africa | | | 5.1 | | | | 6.1 | | | | 5.8 | | | | 6.9 | | | | 6.3 | | | | 5.7 | |
South Africa3 | | | 1.8 | | | | 2.7 | | | | 3.2 | | | | 5.7 | | | | 6.2 | | | | 5.9 | |
| 1. | IMF World Economic Outlook Update, January 2014 |
2. IMF World Economic Outlook, October 2013
3. National Treasury forecasts
| | |
| Emerging markets are expected to continue growing, but at a reduced pace that reflects significant adjustments to currency levels, capital inflows, current account and fiscal deficits, debt levels, and varying levels of business and consumer confidence. | | |
| |
| The longer-term trend remains a shift in the world economy, as developing countries account for a growing share of global trade and investment. Over the past 20 years, the share of emerging and developing economies in global GDP has increased from 18 per cent to 38 per cent and their share in total trade has risen from 28 per cent to 45 per cent. The present slowdown in some emerging markets generally reflects short-term factors. Over the long term, developing economies will continue to benefit from relatively low labour costs, youthful populations, rising productivity, further improvements in communication and transport, and growing middle classes. | | Developing countries account for a growing share of global trade and investment |
15
2014 BUDGET REVIEW
| | |
| South African economy continues to draw strength from emerging-market trends | | On balance, the South African economy continues to draw strength from emerging-market trends. Slowing growth in China, and its shift away from investment-led growth, may lower the prices of South Africa’s commodity exports. However, China’s shift towards greater consumption, along with regulatory reform in India and investment expansion in Africa, provides new opportunities for South African firms to export manufactured goods and services, and to strengthen regional linkages. |
| |
| | Advanced economies |
| |
| | United States – The US economy is expected to grow by 2.8 per cent in 2014, up from 1.9 per cent in 2013. Improving housing and labour markets provide a favourable backdrop for domestic demand growth. While unemployment has declined, the number of people who are no longer counted as part of the workforce has increased. The pace of monetary tightening is a risk to the outlook. |
| |
| Growth in Europe expected to improve marginally to 1 per cent in 2014 | | Europe – In the euro monetary area, South Africa’s second-largest market for non-mineral exports, growth is projected to improve marginally to 1 per cent in 2014. In the United Kingdom, GDP growth of 2.4 per cent is expected in 2014, up from 1.7 per cent in 2013. The recovery remains anaemic and uneven across Europe, with persistently high unemployment in France, Spain, Greece and Italy. The banking system remains undercapitalised, posing a risk to financial stability and the recovery. |
| |
| | Japan – Japan accounts for 6.6 per cent of South Africa’s exports. GDP growth reached 1.7 per cent in 2013 and is projected to remain at that level in 2014. Rising government debt could put pressure on the fiscus. |
| |
| | Developing economies |
| |
| Sub-Saharan Africa expected to grow by 6.1 per cent in 2014 | | Sub-Saharan Africa – This is expected to remain the second fastest growing region in economic terms, with growth of 6.1 per cent in 2014 and 5.8 per cent in 2015. The region recorded 16.2 per cent growth in net foreign direct investment in 2013, concentrated in natural resources and services. Over the next 10 years, the region’s real per capita income is expected to increase by over 30 per cent. The primary risks for the region relate to moderating commodity prices due to slower growth in China. |
| |
| | China – The Chinese economy, now the world’s second largest, continues to grow strongly, but at a reduced pace. GDP growth is projected at 7.7 per cent in 2013, 7.5 per cent in 2014 and 7.3 per cent in 2015. The model on which the country has relied for rapid economic growth has come under pressure owing to demographic shifts and rising demand for higher wages. A rebalancing of the economy from investment-led growth towards greater consumption is under way. High debt levels, rising borrowing costs and bank liquidity concerns are risks to the outlook. |
| |
| | India – GDP growth of 5.4 per cent is projected for 2014, up from 4.4 per cent in 2013. High inflation, rising interest rates, and continued market and capital flow volatility are risks to the outlook. |
| |
| | Brazil – The economy will benefit from improving export growth and strong public investment for the 2014 soccer World Cup and the 2016 |
16
CHAPTER 2: ECONOMIC OUTLOOK
| | |
| summer Olympics. GDP growth is projected at 2.3 per cent in 2014 and 2.8 per cent in 2015. Capital flow volatility and rising interest rates are risks to the outlook. | | |
Promoting intra-African trade and investment
Over the past 20 years, South Africa’s economic prospects have become increasingly intertwined with those of the African continent. Before 1994, economic sanctions prevented South African businesses from expanding into Africa. Today, South African investment creates jobs in destination countries and in the domestic economy, and is an important source of foreign exchange earnings and tax revenue.
South Africa has strengthened its ties with sub-Saharan Africa through improved transport, telecommunications, financial and diplomatic links. In banking, retail and cellular technology, South African firms are among the largest on the continent. Africa accounted for 12 per cent of South Africa’s dividend earnings in 2012, up from 2 per cent in 2002. South Africa is the second largest developing-country investor in Africa. The continent absorbs 28.2 per cent of South African exports, up from 22.6 per cent in 2002.
South African trade and investment with Africa
| | | | | | | | | | | | |
| | | 2002 | | | 2007 | | | 2012 | |
Annual investments into Africa (R billion) | | | 5.5 | | | | 12.6 | | | | 24.3 | |
Exports (% of SA total)1 | | | 22.6 | | | | 23.0 | | | | 28.2 | |
Dividend receipts from Africa (% of total) | | | 2.0 | | | | 11.5 | | | | 12.0 | |
| 1. | Including Southern African Customs Union region |
Source: Reserve Bank and South African Revenue Services
South Africa also plays a role in channelling global trade and investment into the region. In recent years, government has announced tax and financial-sector reforms to encourage greater investment into and trade with other African countries, and to promote South Africa as a hub for financial services. By the end of 2013, 17 African companies had bond and equity listings on the JSE, and Namibia listed a sovereign bond.
The National Treasury proposes additional reforms to expand trade and investment links with Africa. The reforms include creating “foreign member funds”, helping to create a domestic hub for the management of African funds, and extending the HoldCo regime, which will simplify investment into Africa. In addition, various administrative reforms will simplify cross-border transactions. Details of these reforms appear in Annexure W3, available at www.treasury.gov.za.
| | |
| Commodity prices | | |
| |
| Commodity prices declined in 2013 largely due to slower demand from emerging markets, particularly China, which accounts for over 40 per cent of world demand for base metals. The price of platinum fell by 10.7 per cent, and the prices of coal and iron slid by 5.5 per cent and 7.4 per cent respectively. The stronger recovery in advanced economies reduced the attractiveness of gold as a store of wealth, which led to a 28.1 per cent decline in the gold price. | | Commodity prices have declined, but should stabilise |
| |
| The commodity price outlook for South Africa is mixed. Platinum prices are likely to rise following the planned reduction in output in South Africa and higher industrial demand associated with tighter emission standards. Demand from India and China will support coal prices. Iron ore prices are projected to stabilise as a result of expansion by Australian and Brazilian companies, which will increase global supply. Expanded shale gas production should limit oil price increases. | | |
| |
| The depreciation of the rand has offset the negative effects of falling commodity prices on domestic mining companies. While commodity prices in US dollar terms have declined, rand-based prices increased by an average of 6.1 per cent in 2013. | | Depreciation of rand has helped domestic mining companies |
17
2014 BUDGET REVIEW
| | |
| | ¢ Capital flows, exchange rates and inflation |
| |
| Volatile capital flows have contributed to rand depreciation, putting upward pressure on inflation | | Volatile capital flows have contributed to a depreciation of the rand, putting upward pressure on inflation. A sharp reduction in capital inflows during 2013 reflected the general pullback from emerging markets, as well as domestic factors such as industrial action in mining and manufacturing, a decline in business and consumer confidence, and electricity shortages. The rand was also affected by a widening current account deficit. As in previous episodes of capital flow volatility, South Africa’s flexible exchange rate and the inflation-targeting framework have acted as shock absorbers, allowing the economy to adjust to external developments. |
| |
| | Capital flows |
| |
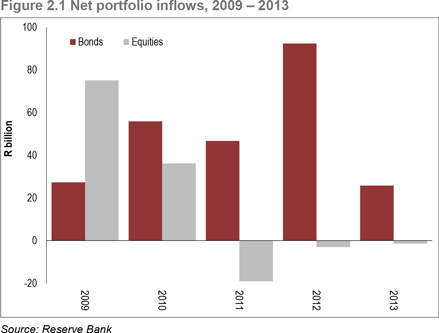
| South Africa’s net portfolio flows declined as US Federal Reserve reduced monetary stimulus | | Capital flows into emerging markets fell sharply after the May 2013 announcement by the US Federal Reserve that it would begin to reduce its asset-purchase programme. Emerging markets recorded outflows of over US$100 billion between June and December. The pace of outflows accelerated in January 2014 when the Fed announced a further reduction in its quantitative easing programme to US$65 billion per month. |
| |
| | South Africa’s net portfolio inflows fell to R24.3 billion in 2013, compared with R88.8 billion in 2012. Net bond inflows slowed to R25.8 billion in 2013 from R92.4 billion in 2012. |
| |
| |  |
| |
| Foreign direct investment remained stable in 2013 | | Net foreign direct investment in the first three quarters of 2013 was R29 billion, unchanged from its level during the same period in 2012. Direct investment was largely driven by international firms expanding through their domestic subsidiaries, but also reflected rising interest in renewable energy, automotive equipment and financial services. |
| |
| | Foreign capital flows are expected to remain volatile as capital markets adjust to higher interest rates in advanced economies. This will translate into exchange rate instability over the short term. |
18
CHAPTER 2: ECONOMIC OUTLOOK
| | |
| In January 2014, the Reserve Bank held total gross foreign exchange reserves of US$49.4 billion, equivalent to about 19 weeks of import cover. | | |
| |
| Exchange rates | | |
| |
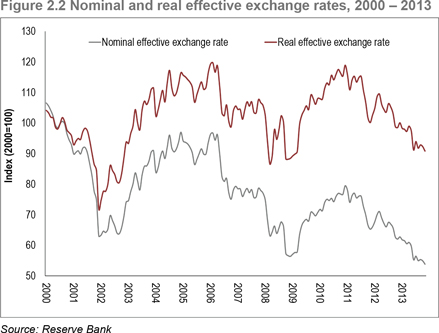
| In nominal terms, the rand experienced one of the largest depreciations among emerging market currencies in 2013, falling by 17.6 per cent against the US dollar. | | Rand depreciated by 17.6 per cent against US dollar in 2013 |
| |
 | | |
| |
| The real effective exchange rate depreciated by 9.3 per cent in the first 11 months of the year. | | |
| |
| In the short term, the weaker exchange rate poses a significant risk to the inflation outlook. The weaker rand will put upward pressure on the prices of imported capital equipment and machinery, intermediate goods, food and petrol, with knock-on effects across the economy. At the same time, as Figure 2.2 shows, the rand has become more competitive since 2011. A sustained real depreciation could provide a significant boost to export competitiveness. This will require monetary and fiscal choices that ensure low and stable inflation. | | Sustained real currency depreciation could boost export competitiveness |
| |
| Inflation | | |
| |
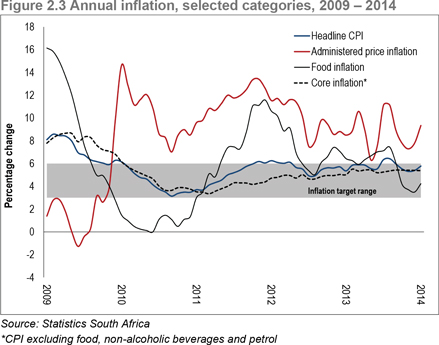
| Inflation, as measured by the consumer price index (CPI), increased marginally in 2013 to 5.7 per cent from 5.6 per cent in 2012. The inflation outlook has deteriorated since the Medium Term Budget Policy Statement was published in October 2013. This change is reflected in the Reserve Bank’s January 2014 decision to increase the repurchase (repo) rate by half a percentage point, to 5.5 per cent. | | Reserve Bank has raised repo rate in response to deteriorating inflation outlook |
19
2014 BUDGET REVIEW
| | |
| |  |
| |
| Inflation expected to exceed 3-6 per cent target band in 2014, declining in 2015 | | Despite modest economic growth, inflation is projected to exceed the upper limit of the 3-6 per cent target range, averaging 6.2 per cent in 2014 as the weaker rand translates into higher petrol and food prices, and puts pressure on wage demands and core inflation. Inflation is projected to decline to 5.9 per cent in 2015. |
| |
| | Although the pace of administered price inflation has slowed in the past two years, inflation for 11 of the 15 administered price components remains above 6 per cent, led by petrol, electricity and assessment rates. |
| |
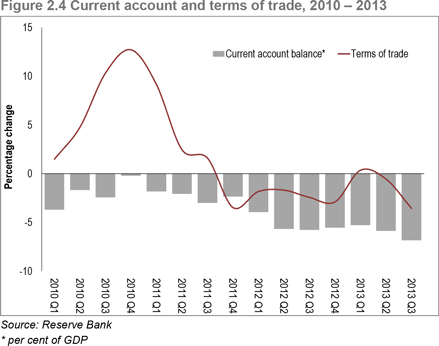
| | ¢ Current account and the terms of trade |
| |
| | The elevated current account deficit is a source of external vulnerability in the context of highly variable capital flows. |
| |
| |  |
20
CHAPTER 2: ECONOMIC OUTLOOK
| | |
| The current account deficit widened to 6.8 per cent in the third quarter of 2013, as the trade deficit grew. The revised trade deficit of 1.3 per cent of GDP for the whole of 2012 widened to 2.5 per cent of GDP in the first three quarters of 2013. Stronger export growth was offset by import growth. Along with a deterioration in the terms of trade, this put pressure on the current account. The current account deficit is projected to narrow from 6.1 per cent in 2013 to 5.5 per cent in 2016 as export growth improves. | | Current account deficit projected to narrow to 5.5 per cent in 2016 |
| |
| Import volumes recorded strong growth in 2013, led by machinery and appliances, and oil. Growth in imports is projected to rise from 5.3 per cent in 2014 to 7 per cent in 2016 as demand recovers. Export volumes increased by 3.2 per cent in the first nine months of 2013, compared with growth of only 0.4 per cent for the whole of 2012. The slow recovery is in line with the global recovery, but also reflects a challenging operational environment for the mining and manufacturing sectors. Africa absorbed 29 per cent of South Africa’s exports in 2013, followed by the European Union (EU) with 18 per cent. Export growth is expected to rise from 5.6 per cent in 2014 to 7 per cent in 2016. | | Import growth projected to reach 7 per cent in 2016 |
| |
| The deterioration in the terms of trade, largely driven by commodity price movements, has been a significant factor in widening the current account deficit. Given projected commodity price trends over the medium term, South Africa is unlikely to benefit from large terms of trade gains, which supported the sustainability of the current account in the past. | | No significant terms of trade gains expected over medium term |
Table 2.3 Composition of South Africa’s trade and trade performance, 2012 – 2013
| | | | | | | | | | | | | | | | | | | | | | | | | | | | | | | | |
| | | Share of total trade | | | Percentage change | | | Contribution to growth | |
| | | Exports | | | Imports | | | Exports | | | Imports | | | Exports | | | Imports | |
| | | 2013 | | | 2013 | | | 2012 | | | 2013 | | | 2012 | | | 2013 | |
Precious metals and stones | | | 21.5 | | | | 0.6 | | | | 7.1 | | | | -17.7 | | | | -2.9 | | | | 1.6 | | | | 0.0 | | | | -0.2 | |
Mineral products | | | 26.0 | | | | 22.6 | | | | 11.0 | | | | 14.4 | | | | 1.9 | | | | 2.9 | | | | 4.6 | | | | 3.3 | |
Base metals and steel | | | 13.0 | | | | 5.0 | | | | 13.5 | | | | 25.8 | | | | -0.7 | | | | 1.7 | | | | 0.6 | | | | 1.2 | |
Raw and processed food products | | | 9.2 | | | | 6.1 | | | | 28.6 | | | | 7.5 | | | | 0.6 | | | | 2.3 | | | | 1.4 | | | | 0.5 | |
Transport equipment | | | 9.3 | | | | 10.1 | | | | 13.1 | | | | 10.6 | | | | 1.0 | | | | 1.2 | | | | 0.9 | | | | 1.1 | |
Machinery and appliances | | | 8.1 | | | | 25.1 | | | | 10.3 | | | | 22.3 | | | | 0.6 | | | | 0.9 | | | | 3.0 | | | | 5.3 | |
Chemicals, plastics and rubber | | | 7.6 | | | | 12.9 | | | | 9.9 | | | | 17.1 | | | | 0.7 | | | | 0.8 | | | | 1.8 | | | | 2.2 | |
Pulp and paper products | | | 1.7 | | | | 1.4 | | | | 22.0 | | | | 20.5 | | | | -0.1 | | | | 0.3 | | | | 0.2 | | | | 0.3 | |
Other | | | 2.1 | | | | 4.4 | | | | 26.8 | | | | 19.6 | | | | 0.2 | | | | 0.5 | | | | 0.4 | | | | 0.8 | |
Miscellaneous manufactures | | | 0.5 | | | | 1.6 | | | | 4.6 | | | | 13.7 | | | | 0.0 | | | | 0.0 | | | | 0.4 | | | | 0.2 | |
Textiles, clothing and footwear | | | 1.0 | | | | 4.1 | | | | 21.6 | | | | 19.8 | | | | 0.1 | | | | 0.2 | | | | 0.5 | | | | 0.8 | |
Vehicle components | | | 0.0 | | | | 6.1 | | | | 154.2 | | | | 14.7 | | | | 0.0 | | | | 0.0 | | | | 1.0 | | | | 0.9 | |
| | | | | | | | | | | | | | | | | | | | | | | | | | | | | | | | |
Total | | | 100.0 | | | | 100.0 | | | | 12.4 | | | | 16.6 | | | | 1.4 | | | | 12.4 | | | | 14.7 | | | | 16.6 | |
| | | | | | | | | | | | | | | | | | | | | | | | | | | | | | | | |
Source: Quantec
| | |
| Southern African Customs Union (SACU) revenue payments remained at about 1 per cent of GDP during 2013, reflecting strong growth in nominal imports over the last two years. Over the medium term, South Africa will transfer R168.7 billion to its SACU partners under the terms of the current revenue-sharing arrangement. Government is working with Botswana, Lesotho, Namibia and Swaziland to ensure that a greater share of the common revenue pool is spent on investment and increasing the region’s production potential. | | |
21
2014 BUDGET REVIEW
| | |
| | ¢ Domestic outlook and real economy trends |
| |
| New electricity and transport infrastructure support improved outlook | | South Africa’s improved medium-term growth prospects are tied to an improving global outlook, strong economic growth in sub-Saharan Africa, and the release of production and transport constraints as major infrastructure becomes operational. Real GDP is projected to grow from 1.8 per cent in 2013 to 2.7 per cent in 2014, reaching 3.5 per cent by 2016. The outlook is subject to a number of risks, including those discussed in the global outlook section. Domestic risks include further delays to the introduction of new infrastructure, particularly additional electricity capacity; protracted labour disputes, which would maintain downward pressure on consumer and business confidence and have knock-on effects on the economy; and more pronounced inflationary pressures associated with the depreciation of the rand. Domestic expenditure |
| | Real gross domestic expenditure slowed in 2013 due to sluggish global and domestic conditions. Real growth in gross domestic expenditure is expected to pick up from 2.8 per cent in 2013 to 3.7 per cent in 2016 as household consumption and private investment accelerate. |
Table 2.4 Macroeconomic performance and projections, 2010 – 2016
| | | | | | | | | | | | | | | | | | | | | | | | | | | | |
| | | 2010 | | | 2011 | | | 2012 | | | 2013 | | | 2014 | | | 2015 | | | 2016 | |
Calendar year | | Actual | | | Estimate | | | Forecast | |
Percentage change | | | | | | | | | | | | | | | | | | | | | | | | | | | | |
Final household consumption | | | 4.4 | | | | 4.9 | | | | 3.5 | | | | 2.7 | | | | 2.8 | | | | 3.2 | | | | 3.4 | |
Final government consumption | | | 4.4 | | | | 4.3 | | | | 4.0 | | | | 2.5 | | | | 2.2 | | | | 2.3 | | | | 2.4 | |
Gross fixed capital formation | | | -2.1 | | | | 4.2 | | | | 4.4 | | | | 3.2 | | | | 4.2 | | | | 5.3 | | | | 6.0 | |
Gross domestic expenditure | | | 3.9 | | | | 4.6 | | | | 4.0 | | | | 2.8 | | | | 2.8 | | | | 3.4 | | | | 3.7 | |
Exports | | | 9.0 | | | | 6.8 | | | | 0.4 | | | | 4.8 | | | | 5.6 | | | | 6.3 | | | | 7.0 | |
Imports | | | 11.0 | | | | 10.0 | | | | 6.0 | | | | 7.3 | | | | 5.3 | | | | 6.1 | | | | 7.0 | |
Real GDP growth | | | 3.1 | | | | 3.6 | | | | 2.5 | | | | 1.8 | | | | 2.7 | | | | 3.2 | | | | 3.5 | |
| | | | | | | | | | | | | | | | | | | | | | | | | | | | |
GDP inflation | | | 7.7 | | | | 5.9 | | | | 4.5 | | | | 6.1 | | | | 6.4 | | | | 6.2 | | | | 5.9 | |
GDP at current prices (R billion) | | | 2 674 | | | | 2 933 | | | | 3 139 | | | | 3 391 | | | | 3 706 | | | | 4 063 | | | | 4 456 | |
| | | | | | | | | | | | | | | | | | | | | | | | | | | | |
CPI inflation | | | 4.3 | | | | 5.0 | | | | 5.6 | | | | 5.7 | | | | 6.2 | | | | 5.9 | | | | 5.5 | |
Current account balance (% of GDP) | | | -2.0 | | | | -2.3 | | | | -5.2 | | | | -6.1 | | | | -5.9 | | | | -5.8 | | | | -5.5 | |
| | | | | | | | | | | | | | | | | | | | | | | | | | | | |
Source: Reserve Bank and National Treasury
Table 2.5 Macroeconomic performance and projections, 2010/11 – 2016/17
| | | | | | | | | | | | | | | | | | | | | | | | | | | | |
| | | 2010/11 | | | 2011/12 | | | 2012/13 | | | 2013/14 | | | 2014/15 | | | 2015/16 | | | 2016/17 | |
Fiscal year | | Actual | | | Estimate | | | Forecast | |
Percentage change | | | | | | | | | | | | | | | | | | | | | | | | | | | | |
GDP at current prices (R billion) | | | 2 750 | | | | 2 982 | | | | 3 198 | | | | 3 465 | | | | 3 790 | | | | 4 151 | | | | 4 553 | |
Real GDP growth | | | 3.5 | | | | 3.3 | | | | 2.2 | | | | 2.0 | | | | 2.9 | | | | 3.3 | | | | 3.5 | |
GDP inflation | | | 8.1 | | | | 5.0 | | | | 4.9 | | | | 6.2 | | | | 6.3 | | | | 6.0 | | | | 5.9 | |
CPI inflation | | | 3.8 | | | | 5.6 | | | | 5.6 | | | | 5.8 | | | | 6.2 | | | | 5.7 | | | | 5.5 | |
Source: National Treasury
| | |
| | Household consumption |
| Household consumption growth forecast to improve as employment growth and consumer confidence improves | | Growth in household consumption expenditure moderated to an estimated 2.7 per cent in 2013, down from 3.5 per cent in 2012, reflecting slower growth in real household disposable income. Consumer confidence remained weak in line with slowing disposable income and muted employment gains. Household credit extension slowed from 9.9 per cent in |
22
CHAPTER 2: ECONOMIC OUTLOOK
| | |
| 2012 to 5.5 per cent growth in 2013 due to tighter lending criteria and impaired credit records. Household indebtedness remains high at 75.5 per cent of net disposable income, though it has declined from the high of 82.4 per cent in 2008. Spending growth on durables such as vehicles slowed, but remained stable for non-durables such as food. | | |
| |
| Growth in real household consumption expenditure is projected to increase from 2.7 per cent in 2013 to 3.4 per cent in 2016, supported by stronger employment growth and reduced household debt levels. | | |
Progress report on major infrastructure: delivering on the NDP
Government’s infrastructure programme promotes higher levels of economic growth and job creation in the medium term, and will boost long-term growth potential.
Further details of capital spending are provided in Chapter 5 (state-owned companies) and Chapter 7 (infrastructure in provinces and municipalities). Major projects reflected in Table 2.6, found later in this chapter, include the following:
Electricity
| • | | The first unit of the Medupi power station is expected to be completed towards the end of 2014. Eskom has scaled down its medium-term capital expenditure plans – though they remain significant – given a lower revenue forecast. |
| • | | Contracts for 47 renewable energy projects were concluded in 2012 and 2013, with most under construction. These are expected to add generation capacity of 2 459 MW between 2014 and 2016. The third procurement round is finalising another 1 457 MW of capacity from 17 projects with higher local content and lower costs. |
| • | | In 2013, through the Integrated National Electrification Programme, Eskom and government provided 200 000 households with electricity connections, constructed 350km of medium voltage lines, upgraded an additional 220km of lines, and upgraded 10 substations. |
| • | | A 75 MW solar plant in Kalkbut, Northern Cape, was connected to the grid in September 2013. In Cookhouse, Eastern Cape, Africa’s largest wind farm (135 MW) will be fully commissioned by May 2014. |
| • | | South Africa’s first baseload gas-fired power plant was recently commissioned by Sasol. Some of the plant’s 140 MW capacity will be fed into the national grid. This project is funded by Sasol. |
Transport
| • | | Transnet has increased capacity on its coal line, boosting annual capacity by 10 million tonnes to 81 million tonnes. In 2013, Transnet took delivery of 143 locomotives and has built or refurbished 1 944 wagons since 2012. |
| • | | Plans to expand the coal, iron ore and manganese lines are at an advanced stage of feasibility assessment. |
| • | | Seven new cranes were installed at the Durban container terminal, increasing efficiency by 27 per cent. |
| • | | The Passenger Rail Agency of South Africa refurbished 500 Metrorail coaches in 2013. |
| • | | The South African National Roads Agency Limited invested R137.4 billion over the period 2010/11–2013/14 to maintain and improve existing roads, and to develop new road infrastructure. |
| • | | Large metros are investing heavily in integrated public transport. Cape Town and Johannesburg have begun operating stations, depots, buses and dedicated bus lanes. Tshwane, Mbombela, Nelson Mandela Bay, eThekwini, Rustenburg and George have started constructing similar infrastructure. |
Water
Investments in bulk water infrastructure address both growing household demand and the needs of the mining, manufacturing and agricultural sectors, which are heavily reliant on water for production.
| • | | Government has spent over R8 billion on water resources and bulk water infrastructure in 2013/14. This includes expenditure on large projects such as the construction of the new Nwamitwa dam, raising the walls of the Tzaneen and Clanwilliam dams, developing the Mokolo and Crocodile River water augmentation project, and developing and upgrading water treatment facilities and bulk water infrastructure at various sites. |
| • | | Government’s dam safety rehabilitation project ensures the continued structural and operational safety of the 316 dams owned by the Department of Water Affairs. |
23
2014 BUDGET REVIEW
| | |
| | Investment |
| |
| Growth in real gross fixed capital formation expected to increase to 6 per cent in 2016 | | Growth in real gross fixed capital formation is expected to increase from 3.2 per cent in 2013 to 6 per cent in 2016 in line with the global and domestic outlook. Public corporations will continue to invest in large infrastructure projects, while private investment will be supported by relatively low real interest rates, reduced infrastructure bottlenecks and high capacity utilisation levels as economic conditions improve. |
| |
| | Real gross fixed-capital investment grew at an estimated 3.2 per cent in 2013, down from 4.4 per cent in 2012. A modest improvement in investment by public corporations was offset by lower growth in general government and private capital outlays. |
| |
| | Investment by state-owned companies stabilised in 2013 after recording strong growth of nearly 7.6 per cent in the second half of 2012. Capital expenditure by public corporations is expected to increase moderately over the medium term. General government’s investment growth accelerated to 9.7 per cent in the third quarter of 2013 as provincial and local governments upgraded public roads, and rolled out water and sanitation projects. Capital expenditure by general government is projected to grow by an annual average of about 6 per cent over the medium term. Over the next three years, public infrastructure and maintenance spending is projected to exceed R844 billion, as shown in Table 2.6. |
Table 2.6 Public-sector infrastructure expenditure, 2010/11 – 2016/17
| | | | | | | | | | | | | | | | | | | | | | | | | | | | |
| | | 2010/11 | | | 2011/12 | | | 2012/13 | | | 2013/14 | | | 2014/15 | | | 2015/16 | | | 2016/17 | |
R billion | | Outcomes | | | Estimates | |
Energy | | | 52.2 | | | | 67.1 | | | | 75.1 | | | | 80.6 | | | | 72.3 | | | | 65.5 | | | | 50.6 | |
Water and sanitation | | | 14.6 | | | | 19.2 | | | | 22.6 | | | | 32.4 | | | | 36.5 | | | | 36.9 | | | | 38.5 | |
Transport and logistics | | | 68.6 | | | | 70.1 | | | | 69.5 | | | | 78.6 | | | | 99.6 | | | | 120.0 | | | | 127.5 | |
Other economic services | | | 12.0 | | | | 11.5 | | | | 8.9 | | | | 13.0 | | | | 15.2 | | | | 14.2 | | | | 12.8 | |
Health | | | 6.7 | | | | 7.7 | | | | 9.7 | | | | 9.8 | | | | 10.5 | | | | 11.3 | | | | 11.6 | |
Education | | | 6.2 | | | | 7.8 | | | | 9.8 | | | | 12.1 | | | | 13.5 | | | | 13.6 | | | | 14.0 | |
Other social services | | | 12.8 | | | | 15.7 | | | | 10.7 | | | | 13.8 | | | | 12.5 | | | | 13.0 | | | | 15.9 | |
Justice and protection services | | | 3.8 | | | | 2.8 | | | | 4.4 | | | | 4.9 | | | | 4.9 | | | | 5.0 | | | | 6.5 | |
Central government services | | | 3.0 | | | | 6.5 | | | | 6.9 | | | | 7.3 | | | | 7.9 | | | | 8.4 | | | | 9.3 | |
| | | | | | | | | | | | | | | | | | | | | | | | | | | | |
Total | | | 180.0 | | | | 208.3 | | | | 217.7 | | | | 252.6 | | | | 272.9 | | | | 287.8 | | | | 286.6 | |
| | | | | | | | | | | | | | | | | | | | | | | | | | | | |
National departments | | | 7.2 | | | | 6.6 | | | | 9.6 | | | | 11.4 | | | | 14.1 | | | | 14.3 | | | | 16.7 | |
Provincial departments | | | 39.1 | | | | 43.4 | | | | 36.4 | | | | 41.8 | | | | 42.6 | | | | 45.5 | | | | 46.6 | |
Local government | | | 30.9 | | | | 33.2 | | | | 41.7 | | | | 55.2 | | | | 58.3 | | | | 61.8 | | | | 63.5 | |
Public entities1 | | | 9.4 | | | | 15.4 | | | | 14.1 | | | | 16.4 | | | | 21.5 | | | | 23.7 | | | | 24.4 | |
Public private partnerships | | | 7.3 | | | | 10.7 | | | | 2.6 | | | | 3.0 | | | | 3.1 | | | | 3.3 | | | | 3.5 | |
Public enterprises1 | | | 86.0 | | | | 98.9 | | | | 113.4 | | | | 124.8 | | | | 133.4 | | | | 139.1 | | | | 132.0 | |
| | | | | | | | | | | | | | | | | | | | | | | | | | | | |
Total | | | 180.0 | | | | 208.3 | | | | 217.7 | | | | 252.6 | | | | 272.9 | | | | 287.8 | | | | 286.6 | |
| | | | | | | | | | | | | | | | | | | | | | | | | | | | |
| 1. | Public entities are financed by capital transfers from the fiscus and public enterprises are financed from combination of own revenue, borrowings and private funding |
Source: National Treasury
| | |
| | Private-sector investment growth slowed to 3 per cent in the first three quarters of 2013, reflecting weak business confidence. Growth in mining and manufacturing slowed, while investment in the transport sector accelerated. |
24
CHAPTER 2: ECONOMIC OUTLOOK
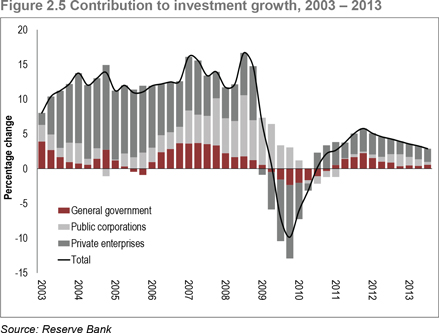
| | |
| |
| Trends in the real economy | | |
| |
| Growth in gross value added was 1.8 per cent in the first nine months of 2013, compared with 2.6 per cent over the same period in 2012. Growth was supported by favourable yields in agriculture, steady growth in financial and business services, telecommunications, transport and civil construction. Production stoppages related to strikes and maintenance in the mining, electricity and manufacturing sectors slowed growth. | | Agriculture, financial and business services, and telecommunications supported growth in gross value added |
Growth in the mining sector remained volatile in 2013 as industrial action, maintenance and other disruptions affected production. Output increased by 4 per cent in 2013, largely as a result of a strong fourth-quarter recovery. | |
| |
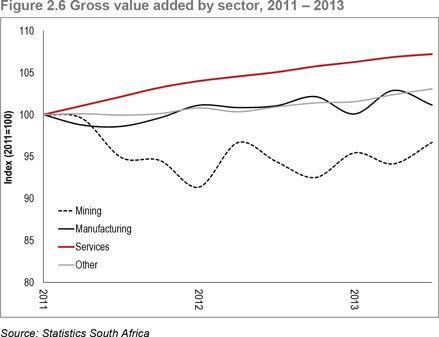
| | |
25
2014 BUDGET REVIEW
Promoting exports
According to the World Bank’s South Africa Economic Update 2013, the country’s export patterns reflect high levels of concentration found in the domestic economy. The top 5 per cent of exporters accounted for 90 per cent of exports in 2012, and concentration levels are higher than those of most peer economies. Recently, however, large exporters have become less competitive, leading to below-par performance given South Africa’s resources and level of development.
There are substantial opportunities to increase exports, particularly in sub-Saharan Africa. This region is now South Africa’s dominant market for non-mineral exports and a vital entry point for new exporters and smaller firms. Greater regional integration is important to expand and diversify the export base. Equally important is increasing the competitiveness of domestic-orientated firms and supply chains to encourage them to explore new markets.
Government has taken several steps to promote export potential:
| • | | Improved pricing at local ports to reduce transport costs and enhance competitiveness. The ports regulator maintained 2013/14 port tariffs at 2012/13 levels and decreased container export tariffs by 43 per cent. A new port tariff structure will be implemented gradually from 2014. |
| | |
Non-minerals goods and services exports, selected countries, 1995 – 2012 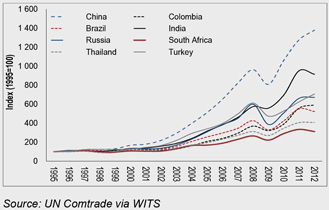
| | • Invested in infrastructure to reduce production and transport bottlenecks. • Promoted more competitive product markets. The 2013/14 Global Competitiveness Report by the World Economic Forum ranks South Africa eighth in the effectiveness of its anti-monopoly policy. • Put in place competitiveness initiatives in manufacturing, support for sectors such as the automotive sector, international marketing support, and incentives such as research and development tax breaks. Fiscal support for greater competitiveness and higher exports is discussed in more detail in Chapter 6. |
| | |
| | During 2014, wage negotiations will take place in the iron ore sector, with continuing negotiations at company level in the platinum sector. Unit labour costs in mining have increased by 34.2 per cent over the last three years. Pressure on profitability could deter investment and lead to the closure of marginal mines, resulting in further job losses. At the same time, the mining sector needs to address the social and economic conditions that have prompted mineworkers’ demands. |
| |
Manufacturing grew by 1.3 per cent in 2013 | | Manufacturing production struggled to gain momentum in 2013. Growth increased by 1.3 per cent as the sector struggled to overcome maintenance stoppages at a major steel mill and several oil refineries, and strikes in the motor vehicles and parts subsector. The food and beverages and the radio and television subsectors both recorded growth of 3.5 per cent, while the furniture and the motor vehicle and parts subsectors contracted. |
| |
| | Real value added in the agriculture, forestry and fishing sector grew by 2.9 per cent during the first three quarters of 2013 compared to the same period in 2012. The weaker rand, higher-than-expected yields and a high-quality crop supported expanded production in citrus fruit, grapes and apples. However, lower prices negatively affected summer crops and meat production in the first half of 2013. |
| |
| | The rest of the economy continued to grow in 2013 but at a slower pace than during 2012. The finance, insurance, real estate and business services sector remained a large contributor to growth, expanding by 2.4 per cent in the first three quarters of 2013. |
26
CHAPTER 2: ECONOMIC OUTLOOK
| | |
| A broader recovery in the economy and in business confidence depends largely on improving the operating environment in mining and manufacturing. Mining contracted on average by 0.5 per cent in each of the last three years, while manufacturing recorded average annual growth of only 1.8 per cent. Faster global growth, a reduction in supply-side infrastructure bottlenecks, resolution of major sticking points in labour relations, and improved business and consumer confidence will support a stronger recovery in the real economy over the medium term. | | Broader economic recovery
depends on improving the
operating environment in
mining and manufacturing |
Agriculture, economic growth and job creation
South African commercial agriculture is internationally competitive in a highly subsidised global market. Commercial farms have consolidated in line with global trends, becoming more mechanised and less labour intensive. Net farm income has increased by 32 per cent since 2006.
Agricultural exports in nominal terms have increased by 102 per cent since 2007 and South Africa enjoys relatively high shares of the global market for various fruits and other produce.
New markets are being developed: in 2012, 31 per cent of agricultural exports went to Africa and 30 per cent to the EU, partly as a result of the expansion of local retailers into Africa. Commercial agriculture contributes 6 per cent to export earnings. This has been achieved despite higher levels of subsidies provided to farmers in Brazil, Chile, China, the EU, India, Mexico, Russia and Turkey.
Smallholder farms, which are a potential source of job creation, continue to struggle with access to finance, agronomic challenges (such as disease management and seed quality), product quality and insufficient extension support.
Government has trebled its support for agriculture since 1996, focusing on smallholder farmers and subsistence producers. Despite this, smallholder production declined between 1998 and 2008 because the quality and coverage of support is insufficient. A report by Aliber and Hall estimates that 58 per cent of provincial agricultural support for smallholder farmers reaches at most 13 per cent of black farming households.* This shows the need for a shift from disaggregated support that reaches too few farmers to interventions focused on the entire production value chain.
Government’s proposed agricultural policy outlines how agriculture can be a major source of low-skilled employment and export growth. This requires a better balance between supporting small farmers (for example, through innovative ways of extending production and technical assistance) and ensuring commercial farmers are able to remain globally competitive.
*Aliber, M. and R. Hall, 2010, “Development of Evidence Based Policy Around Small-Scale farming”. A report prepared for the Presidential Programme to Support Pro-Poor Policy Development
| | |
| Labour market | | |
| |
| Unemployment is the most pressing challenge facing the country. The economy has created 5.9 million jobs since 1996 at an average annual growth rate of 2.9 per cent. The pace of job creation lags behind growth in the labour force, contributing to persistently high levels of joblessness. There are 4.8 million unemployed South Africans and another 2.2 million people, categorised as “discouraged”, who are not actively seeking work. The rate of unemployment declined to 24.1 per cent in the fourth quarter of 2013 from 24.5 per cent a year earlier as a result of job gains in the informal sector. | | 5.9 million jobs created
since 1996, but pace of job
creation lags behind
labour force growth |
| |
| Slow economic growth in 2013 hindered the pace of job creation in the formal non-agricultural sector. Between September 2012 and September 2013, about 14 000 jobs were created in this sector. Job losses in mining and manufacturing were offset by gains in the community, social and personal services sector. | | |
27
2014 BUDGET REVIEW
| | |
| Nominal wage settlements for 2013 averaged 7.9 per cent, compared with 7.6 per cent in 2012 | | In the year to September 2013, nominal unit labour costs increased by 4.9 per cent, while productivity recorded modest growth of 1.6 per cent. Nominal wage settlements for 2013 averaged 7.9 per cent, compared with 7.6 per cent in 2012. Wage growth in excess of productivity growth reduces competitiveness and encourages a shift towards more capital-intensive production techniques. |
| |
| | 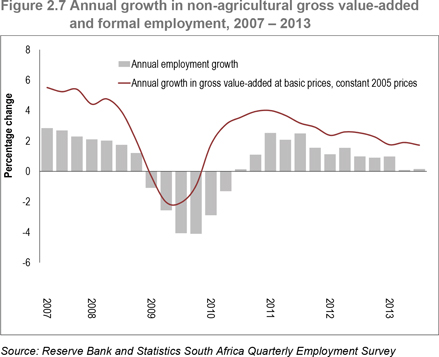
Moderate employment gains are expected over the next three years. The private sector will be the major contributor to job creation, while the public sector will continue to support growth through a range of initiatives. Over the long term, significant gains in jobs and income can only be attained by achieving higher rates of inclusive economic growth, expanding skills levels and maintaining a macroeconomic environment that encourages investment. How government supports job creation In addition to promoting policies that encourage private-sector investment and new hiring, government continues to support employment growth through various direct interventions: • Expanded Public Works Programme – The programme created 973 705 short- to medium-term jobs in 2012/13. The third phase aims to create 6 million similar jobs over the next five years. • Community Work Programme – The fastest-growing component of expanded public works guarantees participants two days of work a week, or eight days a month, with a strong focus on generating local economic activity. It provided guaranteed part-time employment to about 175 000 people in 2012/13. • National Rural Youth Service Corps – The programme offers rural youth a two-year skills programme. |
28
CHAPTER 2: ECONOMIC OUTLOOK
| | |
• Employment tax incentive – Launched in January 2014, the incentive subsidises the salaries of newly recruited workers aged between 18 and 29. This initiative should support a total of 240 000 jobs over the medium term. | | |
| |
• Jobs Fund – Launched in 2011 with the goal of co-financing projects to generate sustainable employment and catalyse economic activity. To date, projects supported by the fund have created 12 184 new jobs. Projects over the next three years will create 96 000 new, permanent jobs. | | |
| |
• National Youth Service Programme – Trains young people to be artisans for the built environment, while Vuk’uphile trains contractors in labour-intensive construction techniques. | | |
| |
• Skills development – A Department of Higher Education and Training white paper targets improved and expanded access to skills development and training, especially vocational training. In addition, employers are still eligible for tax incentives focused on learnership programmes and bursaries. | | |
| |
| Elements of the youth employment accord, supported by government, business, labour and communities, have been incorporated into existing programmes, while others are being developed. | | |
Microeconomic reforms to change the structure of the economy
The NDP identifies a number of microeconomic reforms needed to boost economic growth:
| • | | Reducing the cost of living for poor households and the costs of doing business. South Africa has made significant progress in anti-monopoly policy, as reflected in the 2013/14 Global Competitiveness Report by the World Economic Forum, which ranks the country eighth in this area. Recent actions by the competition authorities have reduced prices on the communications network. Interventions in the food and agricultural value chains, including milling, bread and grain storage, are likely to contribute to lower food price inflation. |
| • | | Support for small, medium and micro enterprises (SMMEs), entrepreneurs and business start-ups. The Small Enterprise Development Agency and the Small Enterprise Finance Agency provide support to small businesses. The Tax Review Committee is investigating the impact of the tax system on SMMEs. |
| • | | A greener and more sustainable economy. The Renewable Energy Programme is under way. The forthcoming carbon tax and progress toward cost-reflective electricity prices will support the shift to a sustainable economy. |
| • | | Support for local production and employment through government procurement. The Customised Sector Development Programme for state-owned enterprises sets minimum local content requirements for designated products. The Preferential Procurement Policy Framework Act (2000) is under review. |
| • | | Broadening and strengthening industrial development. In addition to sector support programmes, such as those in the motor industry, cross-cutting incentives include the Manufacturing Competitiveness Enhancement Programme, research and development programmes, support centres, skills training and the employment tax incentive. |
| | |
| While the medium-term economic outlook improves in response to a stronger global recovery, new infrastructure and growing trade with Africa, South Africa needs higher levels of growth to address the challenges of unemployment, poverty and inequality. | | |
| |
| Faster economic growth over the medium term requires bold decisions to change the structure of the economy to increase the level of competition and innovation, raise the level of savings, reduce the cost of transportation and communication, improve regional trade and integrate into global supply chains. | | |
29
2014 BUDGET REVIEW
| | |
| | Increasing cooperation between government, business and labour in implementing the NDP will help to realise faster economic growth and job creation. |
30
3
Fiscal policy
In brief
| • | | Fiscal policy ensures the health of the public finances by applying the principles of countercyclicality, debt sustainability and intergenerational fairness. |
| • | | Over the next three years, government will continue to finance real increases in spending that enhance the social wage, within an explicit expenditure ceiling. |
| • | | The consolidated budget deficit is expected to narrow from 4.0 per cent of GDP in 2013/14 to 2.8 per cent in the outer year, supporting a stabilisation of debt at 44.3 per cent of GDP. |
| • | | The composition of expenditure improves moderately over the medium term, with capital spending emerging as the fastest-growing area of non-interest spending. |
| | |
| ¢ Overview | | |
| |
| South Africa’s fiscal framework is grounded in a sustainable, countercyclical approach to managing revenue and expenditure. Over the medium term, government will balance continued support for economic recovery with fiscal consolidation. Key social and economic programmes will be maintained, complemented by efforts to improve value for money. Spending will be well contained over the medium-term expenditure framework (MTEF) period. | | Spending will remain well contained over the medium term |
| |
| Despite slower-than-expected GDP growth, the budget deficit is expected to narrow to 4.0 per cent in 2013/14 from 4.3 per cent in 2012/13. The reduction of the deficit is the combined result of government’s expenditure ceiling, strong revenue collection and underspending by national departments, provinces and public entities. As economic growth improves and spending limits stay in place, the budget deficit is projected to narrow to 2.8 per cent of GDP by 2016/17. | | |
31
2014 BUDGET REVIEW
Improving the health of public finances over 20 years of democracy
Since 1994, fiscal policy has helped stabilise and grow the economy.
The first democratic government was faced with strained fiscal accounts and a weak domestic economy. Gross national debt approached 50 per cent of GDP in 1995, while the deficit remained elevated at about 5 per cent of GDP. Real public investment had fallen to its lowest level in 30 years. To address these issues, government reduced expenditure growth and began to expand the tax base. The period from 1994 to 2000 represented a consolidation phase, as shown in the figure on the left. The resulting fall in debt and debt-service costs created the fiscal room for government to support growth and focus on its social mandate.
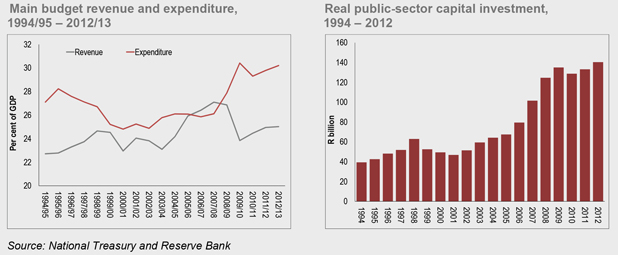
During the 2000s, fiscal policy was adjusted to increase public spending. As shown in the figure on the right, real public-sector capital investment grew sharply, helping to increase the economy’s long-term capacity. Robust economic growth and efforts to expand the tax base produced consistent revenue overruns. This improved the fiscal position, resulting in two successive years of budget surpluses in 2006/07 and 2007/08. Since the recession, government has used the fiscal space grown during the 2000s to support the economy, balancing the needs of growth and debt stabilisation.
A three-year budget framework was introduced in 1997/98. It allows government to express its medium-term policy objectives, and links budgeting choices more closely to the economic outlook. Through the MTEF, government releases extensive budget information to Parliament and the public. As a result of this commitment to budget transparency, South Africa has consistently ranked at or near the top of the Open Budget Index Survey since its inception in 2006.
Main budget fiscal indicators, 1994/95 – 2013/14
| | | | | | | | | | | | | | | | |
Percentage of GDP | | 1994/95 | | | 2000/01 | | | 2009/10 | | | 2013/14 | |
National revenue | | | 22.7 | | | | 23.0 | | | | 23.9 | | | | 25.6 | |
National non-interest expenditure | | | 22.4 | | | | 20.0 | | | | 28.1 | | | | 27.4 | |
Debt-service costs | | | 4.7 | | | | 4.9 | | | | 2.3 | | | | 2.9 | |
Budget balance | | | -4.4 | | | | -1.9 | | | | -6.6 | | | | -4.7 | |
National debt | | | 47.0 | | | | 41.7 | | | | 27.4 | | | | 39.7 | |
Source: Reserve Bank and National Treasury
| | |
| | ¢ Fiscal outlook |
| |
| Rising global interest rates, rand depreciation and weaker commodity prices have significant fiscal implications | | South Africa faces a challenging fiscal outlook in the years ahead. When the recession began in 2009, government was able to use the fiscal space built in preceding years to support the economy. Low international interest rates made it relatively cheap for government to finance its borrowing requirement. Moderate domestic inflation limited cost pressures on public-sector budgets and rising commodity prices supported government revenues. |
32
CHAPTER 3: FISCAL POLICY
| | |
Over the period ahead, South Africa confronts a new set of circumstances. While economic growth remains below potential, fiscal space has been eroded by rising debt. The changed environment has significant implications for the fiscus: | | Projected debt-service costs for 2014/15 are R5 billion higher than estimated in October 2013 |
• Rising global interest rates have pushed up the cost of servicing government debt. Projected debt-service costs for 2014/15 are R5 billion higher than estimated in October 2013. | |
| |
• The terms of trade deteriorated and are unlikely to improve over the medium term. A weaker outlook for commodity prices has contributed to a downward revision of estimated tax revenue in 2015/16. | | |
| |
• Rand depreciation has led to rising cost pressures. Compensation budgets, which are linked to inflation in the public-sector wage agreement, have been revised upwards. | | |
| |
In managing these pressures, the fiscal stance takes into consideration the principles of countercyclicality, debt sustainability and intergenerational fairness. In line with the October 2013 Medium Term Budget Policy Statement, government is committed to: | | Fiscal policy based on countercyclicality, debt sustainability and intergenerational fairness |
• Maintaining an explicit nominal expenditure ceiling, while preserving the value of the social wage. | |
• Reducing the budget deficit to stabilise debt. | |
• Improving the quality of spending and reducing waste. | |
Table 3.1 Consolidated fiscal framework, 2010/11 – 2016/17
| | | | | | | | | | | | | | | | | | | | | | | | | | | | |
| | | 2010/11 | | | 2011/12 | | | 2012/13 | | | 2013/14 | | | 2014/15 | | | 2015/16 | | | 2016/17 | |
R billion/percentage of GDP | | Outcome | | | Estimate | | | Medium-term estimates | |
Revenue | | | 762.9 | | | | 842.3 | | | | 909.3 | | | | 1 010.5 | | | | 1 099.2 | | | | 1 201.3 | | | | 1 324.7 | |
| | | 27.7 | % | | | 28.2 | % | | | 28.4 | % | | | 29.2 | % | | | 29.0 | % | | | 28.9 | % | | | 29.1 | % |
| | | | | | | | | | | | | | | | | | | | | | | | | | | | |
Non-interest expenditure | | | 804.6 | | | | 871.3 | | | | 951.7 | | | | 1 041.6 | | | | 1 131.1 | | | | 1 218.1 | | | | 1 306.5 | |
| | | 29.6 | % | | | 29.4 | % | | | 29.9 | % | | | 30.2 | % | | | 30.0 | % | | | 29.5 | % | | | 28.8 | % |
Interest payments | | | 75.3 | | | | 81.7 | | | | 93.5 | | | | 107.7 | | | | 121.2 | | | | 133.5 | | | | 145.1 | |
| | | 2.7 | % | | | 2.7 | % | | | 2.9 | % | | | 3.1 | % | | | 3.2 | % | | | 3.2 | % | | | 3.2 | % |
| | | | | | | | | | | | | | | | | | | | | | | | | | | | |
Expenditure | | | 879.9 | | | | 953.1 | | | | 1 045.2 | | | | 1 149.3 | | | | 1 252.3 | | | | 1 351.6 | | | | 1 451.6 | |
| | | 32.0 | % | | | 32.0 | % | | | 32.7 | % | | | 33.2 | % | | | 33.0 | % | | | 32.6 | % | | | 31.9 | % |
| | | | | | | | | | | | | | | | | | | | | | | | | | | | |
Budget balance | | | -117.1 | | | | -110.8 | | | | -135.9 | | | | -138.8 | | | | -153.1 | | | | -150.3 | | | | -126.9 | |
| | | -4.3 | % | | | -3.7 | % | | | -4.3 | % | | | -4.0 | % | | | -4.0 | % | | | -3.6 | % | | | -2.8 | % |
| | |
| Maintaining the expenditure ceiling | | |
| |
| Over the past decade, government spending has doubled in real terms, funding a large expansion of the social wage and capital investment. Government is committed to maintaining the value of core social expenditure programmes while increasing public investment in infrastructure within a sustainable framework. | | Maintaining the social wage and increasing capital investment in a sustainable manner |
| |
| The expenditure ceiling introduced in 2012 targets a nominal limit on main budget non-interest expenditure – the core spending over which government has direct legislative authority. The ceiling commits government to spending limits of R1.03 trillion in 2014/15, R1.11 trillion in 2015/16 and R1.18 trillion in 2016/17. Excluding interest payments, real spending grows at an annual average of 1.8 per cent over the MTEF period. | | |
33
2014 BUDGET REVIEW
Table 3.2 Main budget non-interest expenditure, 2010/11 – 2016/17
| | | | | | | | | | | | | | | | | | | | | | | | | | | | |
R million | | 2010/11 | | | 2011/12 | | | 2012/13 | | | 2013/14 | | | 2014/15 | | | 2015/16 | | | 2016/17 | |
2012 Budget Review | | | 738 914 | | | | 814 554 | | | | 879 977 | | | | 953 024 | | | | 1 030 539 | | | | — | | | | — | |
2012 MTBPS | | | — | | | | 811 586 | | | | 878 669 | | | | 953 024 | | | | 1 030 539 | | | | 1 118 991 | | | | — | |
2013 Budget Review | | | — | | | | — | | | | 878 642 | | | | 955 333 | | | | 1 029 262 | | | | 1 107 564 | | | | — | |
2013 MTBPS | | | — | | | | — | | | | — | | | | 949 109 | | | | 1 027 762 | | | | 1 106 064 | | | | 1 185 110 | |
2014 Budget Review | | | — | | | | — | | | | — | | | | 947 853 | | | | 1 027 662 | | | | 1 105 943 | | | | 1 184 424 | |
| | |
| Results of adopting spending limits are already evident in budget outcomes | | The results of adopting spending limits are already evident in budget outcomes. Expenditure growth has been substantially reduced. Higher-than-expected growth in some areas of spending – mainly compensation – has been funded through reprioritisation. During the mid-2000s, government added to previously announced expenditure baselines in each MTEF period. Typically, expenditure in the outer year of each period was 15 per cent higher than initial estimates. Since the introduction of the ceiling, expenditure outcomes have been at or below initial estimates. |
| |
| | 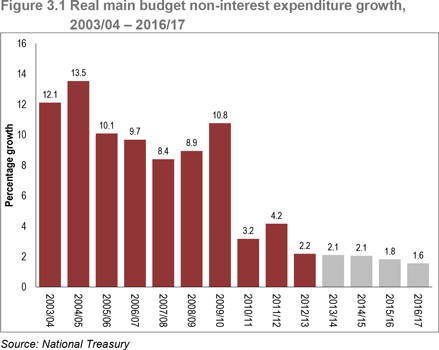 |
| |
| Nominal expenditure ceiling implies difficult trade-offs in an inflationary environment | | The nominal expenditure ceiling implies difficult trade-offs in an inflationary environment. If inflation exceeds current forecasts, the purchasing power of budgeted allocations will decline, while compensation budgets will automatically increase in terms of the current public-sector wage agreement. A faster economic recovery, however, would ease fiscal pressures and allow government to direct a greater share of resources towards service delivery. |
| |
| | Reducing the budget deficit |
| |
| Countercyclical response to downturn resulted in large budget deficit | | Between 2007 and 2009, the budget balance declined from a surplus of 1.7 per cent of GDP to a deficit of 6.3 per cent of GDP. As a result, South Africa’s debt-to-GDP ratio rose sharply. |
34
CHAPTER 3: FISCAL POLICY
| | |
| In subsequent years, the deficit has remained persistently elevated, as revenue and growth forecasts were repeatedly revised downwards. Government has responded by limiting expenditure growth, trimming departmental budgets and reducing the contingency reserve. | | |
| |
| As the economy begins to grow more rapidly and expenditure restraint is maintained, the deficit is projected to narrow from 4.0 per cent in the current year to 2.8 per cent of GDP by 2016/17. As a result, net debt is projected to stabilise at 44.3 per cent of GDP in 2016/17. | | Budget deficit to narrow
from 4.0 per cent of GDP
in current year to 2.8 per
cent of GDP by 2016/17 |
| |
| Improving the composition and efficiency of spending | | |
| |
| Slower wage bill growth and robust expansion of capital budgets will result in a moderate improvement in the composition of spending by 2016/17. The 2014 Budget also maintains tight control of goods and services budgets, which decline in real terms over the three-year spending period. Budget allocations have been revised to ensure that goods and services required for core areas of service delivery, such as educational materials and medical supplies, are protected. Expenditure on travel, catering, consultants and other administrative payments declines as a share of spending. | | Composition of expenditure
improves moderately over
medium term |
Table 3.3 Selected items of goods and services: national and provinces,
2010/11 – 2016/17
| | | | | | | | | | | | | | | | | | | | |
| | | 2010/11 | | | 2013/14 | | | 2016/17 | | | Average annual real
growth | |
Share of total goods and services | | Estimate | | | 2010/11 –
2013/14 | | | 2013/14 –
2016/17 | |
Travel and subsistence | | | 7.3 | % | | | 6.3 | % | | | 6.0 | % | | | -0.9 | % | | | -2.9 | % |
Catering, entertainment and venue rental | | | 1.4 | % | | | 1.5 | % | | | 1.3 | % | | | 6.1 | % | | | -5.7 | % |
Consultants | | | 10.4 | % | | | 9.6 | % | | | 8.5 | % | | | 1.2 | % | | | -5.5 | % |
Stationery and printing | | | 2.4 | % | | | 2.2 | % | | | 2.0 | % | | | 1.5 | % | | | -4.8 | % |
Administrative and operational payments | | | 14.3 | % | | | 14.4 | % | | | 14.0 | % | | | 4.2 | % | | | -2.4 | % |
| | | | | |
Medicine and medical supplies | | | 11.9 | % | | | 11.3 | % | | | 12.9 | % | | | 2.2 | % | | | 3.1 | % |
Learner and teacher support material | | | 2.5 | % | | | 2.7 | % | | | 3.3 | % | | | 7.6 | % | | | 5.2 | % |
Fuel, oil and gas (police vehicles) | | | 2.7 | % | | | 2.3 | % | | | 2.8 | % | | | -0.7 | % | | | 4.2 | % |
| | | | | | | | | | | | | | | | | | | | |
Total goods and services | | | | | | | | | | | | | | | 4.0 | % | | | -1.5 | % |
| | | | | | | | | | | | | | | | | | | | |
| | |
The National Treasury has taken several complementary steps to support spending efficiency. • Cost-containment measures announced by the Minister of Finance in October 2013 limit expenditure on conferences, travel, entertainment and other non-essential items. The measures were issued through a National Treasury instruction in January 2014. Departments will be audited on these measures in the preparation of annual financial statements. • The National Treasury, in partnership with the Department of Performance Monitoring and Evaluation, has launched a series of expenditure reviews. The reviews aim to provide greater understanding of performance and identify ways to improve value for money in housing, education and industrial policy. Initial findings will be released during 2014/15. | | |
35
2014 BUDGET REVIEW
| | |
| | • The National Treasury and its provincial counterparts are working together to identify inefficiencies and improve targeting of provincial expenditure. Initial findings are summarised in Chapter 7. • The Chief Procurement Officer is building a national system for the purchase of high-value goods and services commonly used across government. Reforms will simplify procurement procedures, strengthen accountability and improve government’s ability to detect corruption and maladministration. • Forthcoming regulations will strengthen the National Treasury’s oversight of public entities by requiring them to comply with stringent reporting requirements for expenditure, revenue and performance. |
| |
| | ¢ Fiscal framework |
| |
| 2013/14 budget deficit is estimated at 4.0 per cent of GDP, compared with 4.2 per cent projected in October 2013 | | The consolidated fiscal framework is summarised in Table 3.4. The 2013/14 budget deficit is estimated at 4.0 per cent of GDP, lower than the 4.2 per cent of GDP projected in the October 2013 Medium Term Budget Policy Statement. The narrower deficit is the result of stronger revenue growth and underspending by national departments, provinces and public entities. As economic growth and revenue collections gather pace over the three-year period, the deficit is projected to narrow to 2.8 per cent of GDP. |
Table 3.4 Consolidated operating and capital accounts, 2010/11 – 2016/17
| | | | | | | | | | | | | | | | | | | | | | | | | | | | |
| | | 2010/11 | | | 2011/12 | | | 2012/13 | | | 2013/14 | | | 2014/15 | | | 2015/16 | | | 2016/17 | |
R billion | | Outcome | | | Estimate | | | Medium-term estimates | |
Operating account | | | | | | | | | | | | | | | | | | | | | | | | | | | | |
Current revenue | | | 762.5 | | | | 842.0 | | | | 908.9 | | | | 1 010.3 | | | | 1 099.1 | | | | 1 201.1 | | | | 1 324.5 | |
Current payments | | | 756.4 | | | | 838.7 | | | | 920.7 | | | | 1 011.1 | | | | 1 093.8 | | | | 1 176.5 | | | | 1 254.2 | |
Compensation | | | 309.9 | | | | 346.0 | | | | 375.0 | | | | 411.3 | | | | 439.4 | | | | 468.7 | | | | 498.9 | |
Goods and services | | | 137.7 | | | | 153.5 | | | | 167.9 | | | | 180.0 | | | | 189.7 | | | | 199.6 | | | | 211.4 | |
Interest payments | | | 75.3 | | | | 81.7 | | | | 93.5 | | | | 107.7 | | | | 121.2 | | | | 133.5 | | | | 145.1 | |
Current transfers and subsidies | | | 233.5 | | | | 257.5 | | | | 284.4 | | | | 312.2 | | | | 343.5 | | | | 374.7 | | | | 398.7 | |
| | | | | | | | | | | | | | | | | | | | | | | | | | | | |
Current balance | | | 6.1 | | | | 3.3 | | | | -11.8 | | | | -0.9 | | | | 5.3 | | | | 24.7 | | | | 70.4 | |
Percentage of GDP | | | 0.2 | % | | | 0.1 | % | | | -0.4 | % | | | -0.0 | % | | | 0.1 | % | | | 0.6 | % | | | 1.5 | % |
| | | | | | | | | | | | | | | | | | | | | | | | | | | | |
Capital account | | | | | | | | | | | | | | | | | | | | | | | | | | | | |
Capital receipts | | | 0.4 | | | | 0.2 | | | | 0.3 | | | | 0.2 | | | | 0.2 | | | | 0.2 | | | | 0.2 | |
Capital payments | | | 56.0 | | | | 62.8 | | | | 67.1 | | | | 78.4 | | | | 91.3 | | | | 98.9 | | | | 105.9 | |
Capital transfers | | | 45.2 | | | | 48.5 | | | | 52.4 | | | | 55.9 | | | | 60.6 | | | | 66.9 | | | | 73.2 | |
| | | | | | | | | | | | | | | | | | | | | | | | | | | | |
Capital financing requirement1 | | | -100.8 | | | | -111.1 | | | | -119.2 | | | | -134.0 | | | | -151.7 | | | | -165.6 | | | | -179.0 | |
Percentage of GDP | | | -3.7 | % | | | -3.7 | % | | | -3.7 | % | | | -3.9 | % | | | -4.0 | % | | | -4.0 | % | | | -3.9 | % |
| | | | | | | | | | | | | | | | | | | | | | | | | | | | |
Financial transactions2 | | | 22.4 | | | | 3.0 | | | | 4.9 | | | | 3.9 | | | | 3.6 | | | | 3.3 | | | | 0.3 | |
Contingency reserve | | | — | | | | — | | | | — | | | | — | | | | 3.0 | | | | 6.0 | | | | 18.0 | |
| | | | | | | | | | | | | | | | | | | | | | | | | | | | |
Budget balance | | | -117.1 | | | | -110.8 | | | | -135.9 | | | | -138.8 | | | | -153.1 | | | | -150.3 | | | | -126.9 | |
Percentage of GDP | | | -4.3 | % | | | -3.7 | % | | | -4.3 | % | | | -4.0 | % | | | -4.0 | % | | | -3.6 | % | | | -2.8 | % |
| 1. | Includes payments for capital assets, receipts from the sale of capital assets and capital transfers |
| 2. | Transactions in financial assets and liabilities |
| | |
| | Consolidated current revenue for 2013/14 has been revised upwards by R11.4 billion since October 2013. While the economy has grown more slowly than projected in the 2013 Budget, tax revenue has performed well. The depreciation of the rand has boosted profits in some sectors, leading to buoyant corporate income tax receipts. Above-inflation wage settlements |
36
CHAPTER 3: FISCAL POLICY
| | |
| have sustained personal income tax and strong imports have boosted customs revenue. National Revenue Fund receipts (previously classified as extraordinary receipts) have also been revised upwards due to the effect of rand depreciation on dollar-denominated cash reserves. | | |
| |
| The factors driving revenue buoyancy in 2013/14 are not expected to persist, with revenue growth tracking GDP more closely over the medium term. Tax revenue estimates for 2015/16 have been revised downwards since the last budget and consolidated revenue remains flat at 29 per cent of GDP. | | Factors driving revenue buoyancy are not expected to persist |
| |
| Compensation accounts for 39.5 per cent of consolidated non-interest spending in 2013/14, down marginally from a high of 39.7 per cent in 2011/12. At national and provincial level, compensation budgets have increased by about R2 billion in each year of the framework to accommodate higher inflation forecasts. The wage bill grows by an average of 6.4 per cent over the next three years. | | |
| |
| Transfers and subsidies, which account for 29.9 per cent of consolidated non-interest spending, are forecast to grow at an annual average of 8.3 per cent over the MTEF period. Transfers to households – primarily social grants – account for most of this spending, averaging 9.8 per cent annual growth. The re-registration of social grant recipients has resulted in substantial savings on this item in 2013/14. Goods and services average 5.5 per cent growth. | | |
| |
| The current balance shows the gap between revenue and operational spending. A long-term current deficit is inadvisable, while a positive current balance enables government to finance capital expenditure from its own resources without drawing on private savings. Government is budgeting for a rising current surplus over the MTEF period. In the outer year of the fiscal framework, it grows to 1.5 per cent of GDP, financing about 40 per cent of government’s capital borrowing needs. | | Current balance improves over MTEF period, meaning government can finance capital expenditure from its own resources |
| |
| Capital spending is the fastest-growing component of non-interest expenditure over the three-year period, followed closely by capital transfers. Capital payments grow by a real annual average of 4.5 per cent over the medium term, driven by expenditure on education, transport and water infrastructure. Capital transfers increase by 3.4 per cent per year, mainly to finance urban settlements and public transport through grants to provincial and local government. The capital borrowing requirement will remain at about 4 per cent of GDP over the next three years. | | |
| |
| ¢ Elements of the consolidated budget | | |
| |
| The consolidated fiscal framework comprises the main budget, as well as spending by provinces, social security funds and public entities financed from their own revenue. (For more information, see the inside front cover of the Budget Review and Annexure B.) | | |
37
2014 BUDGET REVIEW
| | |
| | Main budget framework |
| |
| | The main budget framework summarises spending financed from the National Revenue Fund. Gross tax revenue paid into the fund is projected to increase from R899 billion in the current year to R1.21 trillion in 2016/17. |
| |
| Transfers to South Africa’s SACU partners expected to be R43.4 billion in 2013/14 | | In terms of the Southern African Customs Union (SACU) agreement, customs and excise duties are shared between South Africa, Botswana, Lesotho, Namibia and Swaziland. Transfers out of the National Revenue Fund to South Africa’s SACU partners increase from R43.4 billion in 2013/14 to R59.7 billion in 2016/17, reflecting higher customs revenue during the economic recovery. The decline in main budget revenue as a share of GDP in 2014/15 relative to 2013/14 is partly attributable to SACU transfers. |
Table 3.5 Main budget framework, 2010/11 – 2016/17
| | | | | | | | | | | | | | | | | | | | | | | | | | | | |
| | | 2010/11 | | | 2011/12 | | | 2012/13 | | | 2013/14 | | | 2014/15 | | | 2015/16 | | | 2016/17 | |
R billion/percentage of GDP | | Outcome | | | Revised
estimate | | | Medium-term estimates | |
Revenue | | | | | | | | | | | | | | | | | | | | | | | | | | | | |
Gross tax revenue after proposals | | | 674.2 | | | | 742.7 | | | | 813.8 | | | | 899.0 | | | | 993.7 | | | | 1 095.1 | | | | 1 208.7 | |
Non-tax revenue | | | 13.5 | | | | 19.2 | | | | 16.2 | | | | 18.8 | | | | 18.0 | | | | 18.7 | | | | 20.2 | |
SACU1 | | | -17.9 | | | | -21.8 | | | | -42.2 | | | | -43.4 | | | | -51.7 | | | | -57.3 | | | | -59.7 | |
National Revenue Fund receipts2 | | | 3.0 | | | | 5.2 | | | | 11.9 | | | | 11.8 | | | | 2.9 | | | | 1.6 | | | | 3.4 | |
| | | | | | | | | | | | | | | | | | | | | | | | | | | | |
Main budget revenue | | | 672.8 | | | | 745.3 | | | | 799.8 | | | | 886.2 | | | | 962.8 | | | | 1 058.1 | | | | 1 172.6 | |
| | | 24.5 | % | | | 25.0 | % | | | 25.0 | % | | | 25.6 | % | | | 25.4 | % | | | 25.5 | % | | | 25.8 | % |
| | | | | | | | | | | | | | | | | | | | | | | | | | | | |
Expenditure | | | | | | | | | | | | | | | | | | | | | | | | | | | | |
National departments | | | 356.0 | | | | 382.7 | | | | 412.7 | | | | 449.3 | | | | 489.4 | | | | 522.3 | | | | 553.0 | |
Provinces | | | 322.8 | | | | 362.5 | | | | 388.2 | | | | 414.9 | | | | 444.4 | | | | 477.6 | | | | 508.3 | |
Local government | | | 60.9 | | | | 68.3 | | | | 76.4 | | | | 83.7 | | | | 90.8 | | | | 100.0 | | | | 105.2 | |
| | | | | | | | | | | | | | | | | | | | | | | | | | | | |
Non-interest allocations | | | 739.8 | | | | 813.5 | | | | 877.4 | | | | 947.9 | | | | 1 024.7 | | | | 1 099.9 | | | | 1 166.4 | |
Debt-service costs | | | 66.2 | | | | 76.5 | | | | 88.1 | | | | 101.3 | | | | 114.9 | | | | 126.6 | | | | 139.2 | |
Contingency reserve | | | — | | | | — | | | | — | | | | — | | | | 3.0 | | | | 6.0 | | | | 18.0 | |
| | | | | | | | | | | | | | | | | | | | | | | | | | | | |
Main budget expenditure | | | 806.0 | | | | 889.9 | | | | 965.5 | | | | 1 049.1 | | | | 1 142.6 | | | | 1 232.6 | | | | 1 323.6 | |
| | | 29.3 | % | | | 29.8 | % | | | 30.2 | % | | | 30.3 | % | | | 30.1 | % | | | 29.7 | % | | | 29.1 | % |
| | | | | | | | | | | | | | | | | | | | | | | | | | | | |
Main budget balance | | | -133.2 | | | | -144.6 | | | | -165.7 | | | | -162.9 | | | | -179.8 | | | | -174.5 | | | | -151.0 | |
| | | -4.8 | % | | | -4.9 | % | | | -5.2 | % | | | -4.7 | % | | | -4.7 | % | | | -4.2 | % | | | -3.3 | % |
| | | | | | | | | | | | | | | | | | | | | | | | | | | | |
Primary balance | | | -2.4 | % | | | -2.3 | % | | | -2.4 | % | | | -1.8 | % | | | -1.7 | % | | | -1.2 | % | | | -0.3 | % |
| | | | | | | | | | | | | | | | | | | | | | | | | | | | |
| 1. | SACU payments and other adjustments |
| 2. | Previously classified as extraordinary payments |
| | |
| | The Constitution requires that nationally raised resources be shared between national, provincial and local government. Local government’s share of the division of revenue continues to grow more quickly than the provincial and national shares. This reflects increases in the local equitable share, largely to finance free basic water and electricity at municipal level. Conditional grants to provincial and local government have been revised downwards because spending capacity has not kept pace with budget allocations, leading to underspending, particularly on capital grants. The division of revenue is discussed in more detail in Chapter 7. |
38
CHAPTER 3: FISCAL POLICY
| | |
| The fastest-growing item of main budget expenditure is debt-service costs. Projected debt-service costs for 2014/15 have increased by R5 billion since the October 2013 Medium Term Budget Policy Statement. This reflects exchange rate depreciation, higher inflation and the increase in the Reserve Bank’s repurchase rate from 5.0 per cent to 5.5 per cent in January 2013. By 2016/17, R139.2 billion will be required for debt-service costs, accounting for more than 3 per cent of GDP. | | Fastest-growing item of
main budget expenditure is
debt-service costs |
| |
| Main budget spending will decline as a share of GDP from 30.3 per cent in 2013/14 to 29.1 per cent in 2016/17, leading to a projected main budget deficit of 3.3 per cent of GDP. The primary balance, which measures the difference between revenue and non-interest spending, is in deficit. The primary deficit narrows over the next three years, resulting in a stabilisation of the debt-to-GDP ratio. The borrowing requirement and financing strategy are discussed in detail in Chapter 5. | | Primary deficit narrows over
next three years, stabilising
debt-to-GDP ratio |
Table 3.6 Revisions to main budget revenue and expenditure estimates, 2013/14 – 2015/16
| | | | | | | | | | | | | | | | | | | | | | | | |
| | | 2013/14 | | | 2014/15 | | | 2015/16 | |
| | | 2013 | | | 2014 | | | 2013 | | | 2014 | | | 2013 | | | 2014 | |
R billion/percentage of GDP | | Budget | | | Budget | | | Budget | | | Budget | | | Budget | | | Budget | |
Revenue | | | | | | | | | | | | | | | | | | | | | | | | |
Gross tax revenue | | | 898.0 | | | | 899.0 | | | | 991.8 | | | | 993.7 | | | | 1 099.0 | | | | 1 095.1 | |
Non-tax revenue | | | 18.3 | | | | 18.8 | | | | 19.1 | | | | 18.0 | | | | 20.2 | | | | 18.7 | |
SACU1 | | | -43.4 | | | | -43.4 | | | | -43.0 | | | | -51.7 | | | | -48.5 | | | | -57.3 | |
National Revenue Fund receipts | | | 5.0 | | | | 11.8 | | | | 2.9 | | | | 2.9 | | | | 3.1 | | | | 1.6 | |
| | | | | | | | | | | | | | | | | | | | | | | | |
Main budget revenue | | | 878.0 | | | | 886.2 | | | | 970.8 | | | | 962.8 | | | | 1 073.8 | | | | 1 058.1 | |
Percentage of GDP | | | 24.9 | % | | | 25.6 | % | | | 25.0 | % | | | 25.4 | % | | | 25.1 | % | | | 25.5 | % |
| | | | | | | | | | | | | | | | | | | | | | | | |
Expenditure | | | | | | | | | | | | | | | | | | | | | | | | |
Current payments of which: | | | 271.6 | | | | 277.0 | | | | 291.2 | | | | 299.0 | | | | 309.9 | | | | 320.1 | |
Compensation of employees | | | 114.8 | | | | 116.1 | | | | 121.4 | | | | 123.5 | | | | 128.6 | | | | 130.6 | |
Debt-service costs | | | 99.7 | | | | 101.3 | | | | 108.7 | | | | 114.9 | | | | 118.2 | | | | 126.6 | |
Transfers and subsidies | | | 762.2 | | | | 755.8 | | | | 819.5 | | | | 819.3 | | | | 885.3 | | | | 884.5 | |
Payments for capital assets | | | 14.3 | | | | 12.4 | | | | 17.6 | | | | 17.7 | | | | 17.5 | | | | 18.6 | |
Payments for financial assets | | | 2.9 | | | | 3.9 | | | | 3.3 | | | | 3.6 | | | | 3.0 | | | | 3.3 | |
Contingency reserve | | | 4.0 | | | | — | | | | 6.5 | | | | 3.0 | | | | 10.0 | | | | 6.0 | |
| | | | | | | | | | | | | | | | | | | | | | | | |
Total expenditure | | | 1 055.1 | | | | 1 049.1 | | | | 1 138.0 | | | | 1 142.6 | | | | 1 225.7 | | | | 1 232.6 | |
Percentage of GDP | | | 30.0 | % | | | 30.3 | % | | | 29.3 | % | | | 30.1 | % | | | 28.7 | % | | | 29.7 | % |
| 1. | SACU payments and other adjustments |
Social security funds, public entities and provincial balances
| | |
| The main budget deficit is partly offset by the cash surpluses of social security funds, public entities and provincial governments. While government is borrowing to finance revenue shortfalls, these institutions are accumulating reserves. | | |
| |
| As detailed in Chapter 6, expenditure by the Unemployment Insurance Fund (UIF), the Road Accident Fund and the compensation funds are expected to grow strongly over the next three years as a result of policy changes, new hiring and additional offices. However, revenue performance has also improved significantly due to greater efficiency in revenue collection. Consequently, since the 2013 Budget, the estimated cash surpluses of social security funds in 2013/14 and 2014/15 have been revised up by about R3 billion. | | |
39
2014 BUDGET REVIEW
| | |
| Public entities are projected to run a combined surplus over next three years | | The projected cash balances of public entities have been revised upwards. While the 2013 Budget projected deficits, these entities are now expected to run a combined surplus over the MTEF period. |
| |
| | The revenue of the water-sector entities has been revised up to reflect improved collection and increased water sales. Capital spending plans have been revised down. Lower capital spending typically reflects mismatches between projected and actual spending, or the extension of projects over longer time frames. |
| |
| | Other major contributors to the surplus include higher allocations to the National Skills Fund, higher revenue accruing to the South African National Roads Agency Limited and slower capital spend by Sentech Limited. Goods and services and compensation budgets of several other public entities have been curtailed. |
Table 3.7 Consolidated budget balance, 2010/11 – 2016/17
| | | | | | | | | | | | | | | | | | | | | | | | | | | | |
R billion | | 2010/11 | | | 2011/12 | | | 2012/13 | | | 2013/14 | | | 2014/15 | | | 2015/16 | | | 2016/17 | |
Main budget balance | | | -133.2 | | | | -144.6 | | | | -165.7 | | | | -162.9 | | | | -179.8 | | | | -174.5 | | | | -151.0 | |
Social security funds | | | 10.8 | | | | 15.1 | | | | 17.8 | | | | 17.9 | | | | 15.2 | | | | 13.1 | | | | 15.1 | |
Public entities | | | 1.1 | | | | 13.0 | | | | 5.6 | | | | 1.7 | | | | 8.5 | | | | 7.0 | | | | 5.5 | |
Provinces | | | 4.6 | | | | 6.2 | | | | 6.6 | | | | 4.1 | | | | 3.0 | | | | 4.1 | | | | 3.5 | |
RDP Fund | | | -0.4 | | | | -0.5 | | | | -0.1 | | | | 0.4 | | | | — | | | | — | | | | — | |
| | | | | | | | | | | | | | | | | | | | | | | | | | | | |
Consolidated budget balance | | | -117.1 | | | | -110.8 | | | | -135.9 | | | | -138.8 | | | | -153.1 | | | | -150.3 | | | | -126.9 | |
| | | | | | | | | | | | | | | | | | | | | | | | | | | | |
| | |
| | Government’s expenditure ceiling is set at main budget level, but the cash flows of social security funds and public entities affect the consolidated deficit. Over the period ahead, the National Treasury will improve its financial oversight of these institutions, and new regulations will enable more accurate projections of the consolidated deficit. |
| |
| | Provincial surpluses remain high, but narrow moderately over the spending period ahead. Provincial underspending is estimated at R6.7 billion in 2013/14. Over the MTEF period, provinces have been asked to budget for surpluses to clear balances and accruals accumulated over several years. Gauteng is also budgeting for a surplus to repay the Gautrain loan. |
| |
| | ¢ Fiscal sustainability and risks |
| |
| A sustainable fiscal outlook, with debt stabilising in the outer year | | South Africa’s fiscal outlook is sustainable. Despite moderate economic growth, net national debt will stabilise as a share of GDP in 2016/17 and begin to decline thereafter. Broader public-sector sustainability is supported by a moderate stock of public debt, large social security fund surpluses, a fully funded government employee pension system and a narrowing public-sector borrowing requirement. Risks to the fiscal outlook include economic uncertainty and a new round of public-sector wage negotiations. |
40
CHAPTER 3: FISCAL POLICY
| | |
| National debt | | |
| |
| Government’s net debt as a share of GDP continues to grow, but is expected to level off at 44.3 per cent of GDP in 2016/17. Several factors underpin the sustainable debt position. | | |
| |
| Although global interest rates are expected to rise, domestic rates on new debt issuances remain low by historical standards. Government’s debt portfolio is well structured. Debt denominated in foreign currency is only about 10 per cent of the total, which limits the consequences of rand devaluation. A smooth maturity profile, together with an average term-to- maturity of above 13 years, means that the impact of short-term swings in capital markets can be absorbed over time. | | Government’s debt portfolio has a long-dated maturity structure and a low level of foreign currency liabilities |
| |
| Despite significant volatility over the last year, government’s borrowing programme has continued without interruption, with domestic investors taking advantage of global trends to increase their holdings of South African government paper. As debt stabilises, government is committed to rebuilding fiscal space by reducing the ratio of government debt to GDP. | | As debt stabilises, government is committed to rebuilding fiscal space |
| |
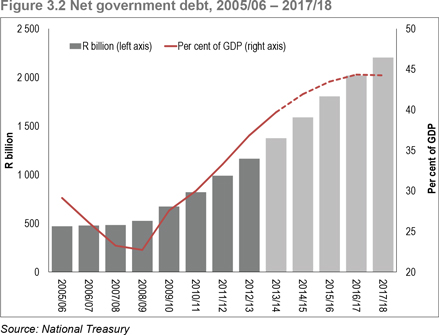 | | |
| |
| Public-sector borrowing | | |
| |
| Total public-sector debt – which includes state-owned companies and local government – was 57.3 per cent of GDP in 2012/13. While this figure is expected to increase, it will do so more slowly than in recent years. | | Total public-sector debt will grow more slowly over the medium term |
41
2014 BUDGET REVIEW
| | |
| |
| | | 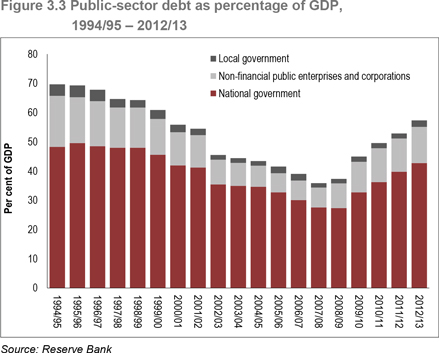 |
| |
| Public-sector borrowing requirement projected to narrow to 4.3 per cent of GDP in 2016/17 | | The public-sector borrowing requirement peaked in 2009/10 at 9.8 per cent of GDP and is estimated at R227.2 billion, or 6.6 per cent of GDP, in 2013/14. The borrowing requirement is projected to narrow to 4.3 per cent of GDP in 2016/17 as a result of the following factors: |
| | • | | The main budget deficit declines over the MTEF period and is offset by surpluses held by other institutions, resulting in a lower consolidated borrowing requirement. |
| | • | | Borrowing by state-owned companies is also projected to decline as a share of GDP, from 2.3 per cent in 2013/14 to 1.3 per cent of GDP in 2016/17. This reflects an increasing reliance on internally generated resources to finance capital spending. |
| | • | | Local government borrowing remains very low. Many local governments have weak balance sheets and have yet to develop reliable systems for collecting their own revenue, making them increasingly reliant on grants to fund capital expenditure. While several large cities are able to access capital markets, many are nearing their prudential debt limits. |
42
CHAPTER 3: FISCAL POLICY
Table 3.8 Public-sector borrowing requirement,1 2010/11 – 2016/17
| | | | | | | | | | | | | | | | | | | | | | | | | | | | |
| | | 2010/11 | | | 2011/12 | | | 2012/13 | | | 2013/14 | | | 2014/15 | | | 2015/16 | | | 2016/17 | |
R billion/percentage of GDP | | Outcome | | | Revised
estimate | | | Medium-term estimates | |
Main budget | | | 133.2 | | | | 144.6 | | | | 165.7 | | | | 162.9 | | | | 179.8 | | | | 174.5 | | | | 151.0 | |
Social security funds | | | -10.8 | | | | -15.1 | | | | -17.8 | | | | -17.9 | | | | -15.2 | | | | -13.1 | | | | -15.1 | |
Provinces | | | -4.6 | | | | -6.2 | | | | -6.6 | | | | -4.1 | | | | -3.0 | | | | -4.1 | | | | -3.5 | |
Public entities | | | -1.1 | | | | -13.0 | | | | -5.6 | | | | -1.7 | | | | -8.5 | | | | -7.0 | | | | -5.5 | |
RDP Fund | | | 0.4 | | | | 0.5 | | | | 0.1 | | | | -0.4 | | | | — | | | | — | | | | — | |
| | | | | | | | | | | | | | | | | | | | | | | | | | | | |
Consolidated government | | | 117.1 | | | | 110.8 | | | | 135.9 | | | | 138.8 | | | | 153.1 | | | | 150.3 | | | | 126.9 | |
| | | 4.3 | % | | | 3.7 | % | | | 4.3 | % | | | 4.0 | % | | | 4.0 | % | | | 3.6 | % | | | 2.8 | % |
Local authorities | | | 8.8 | | | | 5.8 | | | | 9.3 | | | | 9.7 | | | | 9.7 | | | | 10.2 | | | | 10.8 | |
| | | 0.3 | % | | | 0.2 | % | | | 0.3 | % | | | 0.3 | % | | | 0.3 | % | | | 0.2 | % | | | 0.2 | % |
State-owned companies2 | | | 47.5 | | | | 28.9 | | | | 65.2 | | | | 78.7 | | | | 68.8 | | | | 82.7 | | | | 57.7 | |
| | | 1.7 | % | | | 1.0 | % | | | 2.0 | % | | | 2.3 | % | | | 1.8 | % | | | 2.0 | % | | | 1.3 | % |
| | | | | | | | | | | | | | | | | | | | | | | | | | | | |
Borrowing requirement | | | 173.4 | | | | 145.5 | | | | 210.4 | | | | 227.2 | | | | 231.6 | | | | 243.2 | | | | 195.4 | |
| | | 6.3 | % | | | 4.9 | % | | | 6.6 | % | | | 6.6 | % | | | 6.1 | % | | | 5.9 | % | | | 4.3 | % |
| 1. | A negative number reflects a surplus and a positive number a deficit |
| 2. | South African National Roads Agency Limited and Trans-Caledon Tunnel Authority are included in consolidated government net borrowing |
| | |
| Public-sector sustainability | | |
| |
| Recent international experience shows that fiscal distress can originate from sources outside the main budget, such as public pension funds or state-owned companies. In many countries, demographic trends are also expected to strain social spending obligations in the years ahead. | | Social security and pension
funds, and state-owned
companies, are not sources
of fiscal vulnerability |
| |
| In South Africa’s case: | | |
| |
• Social security funds hold large surpluses, with the UIF projecting an accumulated surplus of R73 billion in 2013/14. | | |
| |
• The Government Employees Pension Fund has R1.4 trillion in assets under management; according to the fund’s actuaries, it is more than fully funded on a best-estimate basis. | | |
| |
• Infrastructure investments have led to a steady increase in the asset base of state-owned companies, from R450.1 billion in 2008/09 to R793.9 billion in 2012/13. | | |
| |
• South Africa’s private financial sector is well capitalised, and remains profitable and well regulated. | | |
| |
• Demographic trends are unlikely to place a large burden on current social policies, as shown in the box on social grant expenditure. | | |
| |
| Managing risks | | |
| |
| The risks to fiscal sustainability include economic uncertainty and pressures emanating from the government wage bill. | | |
| |
| Some risks associated with the economic outlook have partially materialised, as reflected in the inflation outlook and higher interest rates for new and existing debt. To some extent, higher interest payments would be offset by higher revenue as a result of inflated nominal GDP in an inflationary environment. A deterioration in the economic outlook, however, would require government to consider additional expenditure | | If inflation remains stable,
faster growth would enable
government to attain its
fiscal objectives earlier |
43
2014 BUDGET REVIEW
| | |
| | and revenue measures to ensure fiscal sustainability. Faster growth in the context of stable prices would enable government to attain its fiscal objectives earlier. |
|
Long-term sustainability of social grant expenditure The National Treasury has undertaken long-term modelling of government’s largest social expenditures. In 2012/13, government paid over R100 billion in cash grants to support more than 15 million South Africans. Social grant expenditure is expected to decline as a share of GDP over the next three years. Assuming there are no changes in eligibility criteria, uptake rates for the child support grant and the old age grant are projected to rise and then stabilise over the coming decade. In line with actuarial population forecasts, the total number of age-eligible children is set to level off over time, while the number of old age grant recipients will grow moderately. Over the past decade, social grant values have grown in line with consumer inflation. Assuming that this trend continues, and taking into account population trends, spending on social grants is projected to continue declining as a share of GDP, as shown in the figures below. |
|
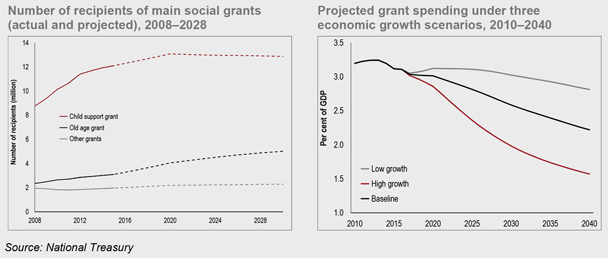
This finding holds true both in a baseline GDP growth scenario (3.5 per cent growth) and in a high growth scenario (5.0 per cent growth). In a low growth scenario (2.5 per cent), grant expenditure stabilises as a share of GDP. |
| |
| Higher-than-expected inflation to add to rising wage pressures | | The current public-sector wage agreement provides for annual cost-of-living adjustments of inflation plus 1 per cent. While growth in employee compensation has slowed over the past two years, higher-than-expected inflation would add to the wage bill. These pressures are being partially offset by declining headcount growth at national and provincial levels, as government increasingly operates within currently funded staffing levels. Government aims to maintain employee numbers at a constant level over the next three years, with exceptions to this policy requiring a compelling explanation. A further deterioration in the inflation outlook, however, would place additional pressure on the budget. A new round of wage talks will begin later this year on an agreement to take effect in 2015. The National Treasury and the Department of Public Service and Administration are working together to ensure that a fair and sustainable wage agreement is reached. |
| |
| | ¢ Conclusion |
| |
| | Government remains committed to countercyclical fiscal policy. The fiscal stance maintains an expenditure ceiling, supported by policies to improve spending efficiency. Together with an improving revenue outlook, fiscal policy balances sustainability with continued support to the economy. |
44
4
Revenue trends and tax proposals
In brief
| | • | | Over two decades South Africa has built a progressive tax system founded on the principles of equity, efficiency, simplicity, transparency and certainty. |
| | • | | Tax revenues have remained buoyant in 2013/14, and the revenue estimate presented in last year’s budget has been revised upwards by R1 billion to R899 billion. |
| | • | | Tax proposals for 2014/15 include personal income tax relief of R9.3 billion; steps to encourage enterprise development and household savings; measures to address acid mine drainage; and design adjustments to the proposed carbon tax. |
| | • | | The first report of the Tax Review Committee, which examines how the tax system affects small and medium enterprises, will soon be published for public comment. |
| | |
| South Africa’s tax system forms part of the foundation of the country’s public finances. The balance between the three major taxes – personal income tax, value-added tax (VAT) and corporate income tax – provides the basis for a tax system that responds flexibly and sustainably to the business cycle. | | South Africa’s tax system responds flexibly and sustainably to the business cycle |
While nominal total tax revenue declined from 27.6 per cent of GDP in 2007/08 to 24.4 per cent in 2009/10 as a result of the 2009 recession, tax revenue is expected to recover to 25.9 per cent of GDP in 2013/14, supported by strong growth in corporate income tax and customs duties. Nominal total tax revenues are estimated to grow at an average of 10.4 per cent per year over the medium term, reaching 26.5 per cent of GDP in 2016/17. | |
| |
| The tax policy framework has proven resilient in a period of global volatility, and compares favourably with international standards. Buoyant tax revenue collections, however, depend on improved tax compliance and strong economic growth, as outlined in the NDP. | | |
45
2014 BUDGET REVIEW
Two decades of building a progressive and fair tax system
Over 20 years of democracy, government has built a tax system based on the principles of:
| | • | | Equity. All residents should contribute to the fiscus in proportion to their ability to do so. |
| | • | | Efficiency. Taxes should be raised in a way that interferes minimally with economic decision-making. |
| | • | | Simplicity. To the degree possible, taxes should be easy to understand, and should be collected in a timely and convenient manner. |
| | • | | Transparency and certainty. The way taxes are calculated and collected should be certain, supported by transparent rules and procedures. |
The tax system raises revenue to deliver public services without placing too high a burden on businesses and individuals. Reforms have aimed to establish stable revenue streams, maintain a more equitable distribution of national resources, encourage investment and savings, and address market failures. These reforms have balanced the imperatives of equity and international competitiveness.
Total tax revenue, which amounted to R113.8 billion in 1994/95, grew to R813.8 billion in 2012/13. Over this period, nominal tax revenue grew sevenfold at a compound annual growth rate of 10.9 per cent, while nominal GDP grew at 10.4 per cent. As a percentage of GDP, total tax revenue has increased from 22 per cent in the 1980s to an average of 25 per cent in the democratic era. Revenue from corporate and personal income tax, and VAT, account for about 80 per cent of total tax revenue.
Nominal tax revenue collections, 1994/95 – 2012/13
| | | | | | | | | | | | | | | | | | | | | | | | | | | | | | | | |
| | | Individuals | | | Companies | | | Value-added tax | | | Total tax revenue | |
| | | R million | | | CAGR1 | | | R million | | | CAGR1 | | | R million | | | CAGR1 | | | R million | | | CAGR1 | |
1994/95 | | | 44 973 | | | | | | | | 13 591 | | | | | | | | 29 288 | | | | | | | | 113 775 | | | | | |
1999/00 | | | 85 884 | | | | 13.8 | | | | 20 972 | | | | 9.1 | | | | 48 377 | | | | 10.6 | | | | 201 266 | | | | 12.1 | |
2004/05 | | | 110 982 | | | | 5.3 | | | | 70 782 | | | | 27.5 | | | | 98 158 | | | | 15.2 | | | | 354 979 | | | | 12.0 | |
2008/09 | | | 195 146 | | | | 15.2 | | | | 165 539 | | | | 23.7 | | | | 154 343 | | | | 12.0 | | | | 625 100 | | | | 15.2 | |
2012/13 | | | 275 822 | | | | 9.0 | | | | 159 259 | | | | -1.0 | | | | 215 023 | | | | 8.6 | | | | 813 826 | | | | 6.8 | |
| 1. | Compound annual growth rate (percentage) |
From 1994 to 1999, revenue growth was largely supported by personal income tax, which constituted 41 per cent of total tax revenue by 1999/00. Corporate income tax revenue grew strongly between 2000/01 and 2008/09 in line with robust economic growth, the commodity boom and improved compliance.
During this period, government introduced efforts to expand the tax base – known as base broadening – including capital gains tax and measures to limit tax avoidance, reinforced by South African Revenue Service (SARS) administrative reforms to improve compliance. These measures allowed for a reduction in the headline corporate income tax rate from 40 to 28 per cent. Additional tax measures were introduced to enhance the competitive position of businesses and the economy, including incentives to support industrial policy, skills development, urban development zones, and research and development.
The top marginal personal income tax rate was reduced from 45 to 40 per cent, and personal income tax brackets and thresholds were increased to provide relief from inflation. The progressive nature of the personal income tax system ensures that those with higher incomes pay a larger share. The system’s fairness is undermined if individuals are able to structure their income to avoid income tax, and amendments to tax legislation over time have sought to curtail this possibility.
The tax system plays an important role in addressing market failures, as governments around the world look for a more effective combination of interventions (both regulations and taxes) to deal with challenges related to solid waste, water pollution, local air pollution and climate change.
| | |
| |
| | | ¢ Tax proposals |
| |
| Personal income tax relief of R9.3 billion | | Tax proposals for the 2014 Budget continue to prioritise economic growth, job creation and generating sufficient revenue to finance government spending in line with the National Development Plan (NDP) objectives of expanding the economy and reducing unemployment. |
| |
| | The main tax proposals include: |
| |
| | • Personal income tax relief of R9.3 billion |
| |
| | • Measures to encourage small enterprise development |
| |
| | • Clarity on valuation of company cars for fringe-benefit tax purposes |
| |
| | • Reforms to the tax treatment of the risk business of long-term insurers |
46
CHAPTER 4: REVENUE TRENDS AND TAX PROPOSALS
| | |
• Amending the rules for VAT input tax to combat gold smuggling | | |
| |
• Increases in fuel and excise taxes | | |
| |
• Measures to address acid mine drainage | | |
| |
• Adjustment of the proposed carbon tax and its alignment with desired emission-reduction outcomes to be identified by the Department of Environmental Affairs. | | |
| |
| Tax-free savings accounts will be implemented, creating a mechanism to increase household savings and support financial inclusion. The employment tax incentive, introduced at the beginning of 2014, will help unemployed youth gain skills and experience in the workplace. | | Employment tax incentive to help unemployed youth gain skills and experience |
| |
¢ Direct taxes: individuals | | |
| |
| Personal income tax relief | | |
| |
| To compensate for the effects of inflation, which pushes some individuals into higher tax brackets and reduces their purchasing power, the personal income tax brackets and rebates will be adjusted, providing individuals with R9.3 billion in personal income tax relief. Table 4.1 provides an overview of the adjusted brackets for 2014/15. | | Brackets and rebates adjusted to compensate for effects of inflation |
Table 4.1 Personal income tax rate and bracket adjustments, 2013/14 – 2014/15
| | | | | | |
| | | 2013/14 | | | | 2014/15 |
Taxable income (R) | | Rates of tax | | Taxable income (R) | | Rates of tax |
| R0 - R165 600 | | 18% of each R1 | | R0 - R174 550 | | 18% of each R1 |
| | | |
| R165 601 - R258 750 | | R29 808 + 25% of the amount above R165 600 | | R174 551 - R272 700 | | R31 419 + 25% of the amount above R174 550 |
| | | |
| R258 751 - R358 110 | | R53 096 + 30% of the amount above R258 750 | | R272 701 - R377 450 | | R55 957 + 30% of the amount above R272 700 |
| | | |
| R358 111 - R500 940 | | R82 904 + 35% of the amount above R358 110 | | R377 451 - R528 000 | | R87 382 + 35% of the amount above R377 450 |
| | | |
| R500 941 - R638 600 | | R132 894 + 38% of the amount above R500 940 | | R528 001 - R673 100 | | R140 074 + 38% of the amount above R528 000 |
| | | |
| R638 601 | | R185 205 + 40% of the amount above R638 600 | | R673 101 | | R195 212 + 40% of the amount above R673 100 |
| | | |
| Rebates | | | | Rebates | | |
Primary | | R12 080 | | Primary | | R12 726 |
Secondary | | R6 750 | | Secondary | | R7 110 |
Tertiary | | R2 250 | | Tertiary | | R2 367 |
| | | |
| Tax threshold | | | | Tax threshold | | |
Below age 65 | | R67 111 | | Below age 65 | | R70 700 |
Age 65 and over | | R104 611 | | Age 65 and over | | R110 200 |
Age 75 and over | | R117 111 | | Age 75 and over | | R123 350 |
| | |
| Table 4.2 shows how much tax is expected to be paid by individuals at different levels of taxable income for 2014/15. About 69 per cent of taxpayers have taxable incomes below R250 000 per year, accounting for about 36 per cent of all taxable income and contributing just under 17 per cent of personal income tax. This group will receive 39 per cent of the total amount of tax relief that arises from the increase in the rebates and income tax brackets. The top 2.4 per cent (about 154 000) of the estimated 6.4 million individual taxpayers will account for 30.7 per cent of personal income tax. Individuals in this bracket have taxable income greater than R1 million per year. | | About 69 per cent of taxpayers account for 36 per cent of all taxable income |
47
2014 BUDGET REVIEW
Table 4.2 Estimates of individual taxpayers and taxable income, 2014/15
| | | | | | | | | | | | | | | | | | | | | | | | | | | | | | | | | | | | | | | | |
| | | | | | | | | Income tax | | | | | | | |
| | | | | | | | | | | | | | | payable before | | | Personal income | | | Income tax | |
| | | Registered individuals | | | Taxable income | | | relief | | | tax relief | | | payable after relief | |
Taxable bracket | | Number | | | % | | | R million | | | % | | | R million | | | % | | | R million | | | % | | | R million | | | % | |
0 - R70 0001 | | | 8 835 791 | | | | | | | | 194 445 | | | | 11.5 | | | | 25 | | | | — | | | | 25 | | | | — | | | | — | | | | — | |
R70 001 - R150 000 | | | 2 758 078 | | | | 43.0 | | | | 288 161 | | | | 17.0 | | | | 18 092 | | | | 5.2 | | | | 1 740 | | | | 18.9 | | | | 16 351 | | | | 4.9 | |
R150 001 - R250 000 | | | 1 644 142 | | | | 25.6 | | | | 321 624 | | | | 19.0 | | | | 41 491 | | | | 12.0 | | | | 1 843 | | | | 20.0 | | | | 39 648 | | | | 11.8 | |
R250 001 - R350 000 | | | 852 656 | | | | 13.3 | | | | 250 125 | | | | 14.8 | | | | 43 789 | | | | 12.7 | | | | 1 557 | | | | 16.9 | | | | 42 232 | | | | 12.6 | |
R350 001 - R500 000 | | | 531 173 | | | | 8.3 | | | | 220 166 | | | | 13.0 | | | | 48 072 | | | | 13.9 | | | | 1 475 | | | | 16.0 | | | | 46 597 | | | | 13.9 | |
R500 001 - R750 000 | | | 346 123 | | | | 5.4 | | | | 208 636 | | | | 12.3 | | | | 55 303 | | | | 16.0 | | | | 1 335 | | | | 14.5 | | | | 53 969 | | | | 16.1 | |
R750 001 - R1 000 000 | | | 132 917 | | | | 2.1 | | | | 114 037 | | | | 6.7 | | | | 34 663 | | | | 10.0 | | | | 591 | | | | 6.4 | | | | 34 072 | | | | 10.1 | |
R1 000 001 + | | | 154 111 | | | | 2.4 | | | | 291 160 | | | | 17.2 | | | | 103 760 | | | | 30.1 | | | | 685 | | | | 7.4 | | | | 103 075 | | | | 30.7 | |
| | | | | | | | | | | | | | | | | | | | | | | | | | | | | | | | | | | | | | | | |
Total | | | 6 419 200 | | | | 100.0 | | | | 1 693 908 | | | | 100.0 | | | | 345 169 | | | | 100.0 | | | | 9 225 | | | | 100.0 | | | | 335 944 | | | | 100.0 | |
| | | | | | | | | | | | | | | | | | | | | | | | | | | | | | | | | | | | | | | | |
Grand total | | | 15 254 991 | | | | | | | | 1 888 353 | | | | | | | | 345 194 | | | | | | | | 9 250 | | | | | | | | 335 944 | | | | | |
| | | | | | | | | | | | | | | | | | | | | | | | | | | | | | | | | | | | | | | | |
| 1. | Registered individuals with taxable income below the income tax threshold |
| | |
| | | Medical tax credits |
| |
| | Monthly medical scheme contribution tax credits will be increased from R242 to R257 per month for the first two beneficiaries, and from R162 to R172 per month for each additional beneficiary, with effect from 1 March 2014. |
| |
| | Tax-preferred savings accounts |
| |
| Tax-preferred savings accounts will proceed | | Tax-preferred savings accounts, first mooted in the 2012 Budget Review as a measure to encourage household savings, will proceed. As previously announced, these accounts will have an initial annual contribution limit of R30 000, to be increased regularly in line with inflation, and a lifetime contribution limit of R500 000. The account will allow investments in bank deposits, collective investment schemes, exchange-traded funds and retail savings bonds. Eligible service providers will include banks, asset managers, life insurers and brokerages. |
| |
| | Retirement savings reforms |
| |
| | Reforms over the past two years have aimed to encourage more people to save for retirement and to preserve their savings throughout their working lives. A document that briefly describes the changes up to this point and sets out anticipated future reforms will soon be released. The proposals below support the broader package of retirement reforms, and are intended to make the system simpler and fairer. |
| |
| Retirement fund taxation reforms to provide additional relief and encourage saving | | Changes to the taxation of contributions to retirement funds in line with the Taxation Laws Amendment Act (2013) will provide additional relief to most retirement fund members and encourage them to save for retirement. Employer contributions are deemed to be a fringe benefit in the hands of the employee. Both employee and employer contributions will be deductible, up to a limit, for income-tax purposes by the employee. For defined benefit plans, the formula used to estimate the contribution amount was legislated in 2013. The methodology for calculating the formula will be detailed by way of regulation in 2014. In addition, the policy approach for the timing of accrual of retirement fund benefits will be reviewed to provide certainty and ease practical application. |
48
CHAPTER 4: REVENUE TRENDS AND TAX PROPOSALS
| | |
| Retirement fund lump-sum tax tables | | |
| |
| Lump-sum benefits are taxed according to two tables – pre-retirement withdrawals (mainly following resignations) and at retirement. The former has not been adjusted since its introduction in 2007, while the latter was adjusted once, in 2011. | | |
| |
| Tables 4.3 and 4.4 show proposed revisions to these tables, effective 1 March 2014. The taxable income brackets are increased by about 10 per cent. There is a larger increase in the bottom bracket for the retirement lump-sum table to avoid instances where lower-income workers may be required to pay tax on their lump sum, even though they did not benefit from a deduction due to their taxable income falling below the tax-free threshold. | | Adjustments to lump-sum tables |
| | | | | | |
Table 4.3 Pre-retirement lump-sum taxation, 2013/14 – 2014/15 |
| | | 2013/14 | | | | 2014/15 |
Taxable income (R) | | Rates of tax | | Taxable income (R) | | Rates of tax |
| R0 - R22 500 | | 0% of taxable income | | R0 - R25 000 | | 0% of taxable income |
| | | |
| R22 501 - R600 000 | | 18% of taxable income above R22 500 | | R25 001 - R660 000 | | 18% of taxable income above R25 000 |
| | | |
| R600 001 - R900 000 | | R103 950 + 27% of taxable income above R600 000 | | R660 001 - R990 000 | | R114 300 + 27% of taxable income above R660 000 |
| | | |
| R900 001 + | | R184 950 + 36% of taxable income above R900 000 | | R990 001 + | | R203 400 + 36% of taxable income above R990 000 |
Table 4.4 Retirement lump-sum taxation, 2013/14 – 2014/15
| | | | | | |
| | | 2013/14 | | | | 2014/15 |
Taxable income (R) | | Rates of tax | | Taxable income (R) | | Rates of tax |
| R0 - R315 000 | | 0% of taxable income | | R0 - R500 000 | | 0% of taxable income |
| | | |
| R315 001 - R630 000 | | 18% of taxable income above R315 000 | | R500 001 - R700 000 | | 18% of taxable income above R500 000 |
| | | |
| R630 001 - R945 000 | | R56 700 + 27% of taxable income above R630 000 | | R700 001 - R1 050 000 | | R36 000 + 27% of taxable income above R700 000 |
| | | |
| R945 001 + | | R141 750 + 36% of taxable income above R945 000 | | R1 050 001 + | | R130 500 + 36% of taxable income above R1 050 000 |
| | |
| Company car fringe benefits | | |
Use of a company car by an employee is a taxable fringe benefit based on the market value of the vehicle. However, car manufacturers that import vehicles calculate the fringe benefit at cost. To align the treatment of company car fringe benefits for all employees (whether or not they work for a vehicle manufacturer), government proposes that actual retail market value be used in all cases. This reform will be phased in over four years. Adjustments are also proposed to treat employees who bear the costs relating to fuel and the upkeep (maintenance, insurance and licence) of their company car in a more equitable manner. | | |
| |
¢ Direct taxes: businesses | | |
| |
| Philanthropic foundations | | |
| |
| The Income Tax Act (1962) provides a tax incentive for donations to qualifying public-benefit organisations, including philanthropic | | |
49
2014 BUDGET REVIEW
| | |
| | foundations. Such foundations aim to build up and maintain sufficient capital to provide financial support to worthy causes carried out by public- benefit organisations. The act requires philanthropic foundations to distribute up to 75 per cent of the money they generate within a year unless they can demonstrate to SARS that the funds accumulated will be used for specific qualifying purposes. This requirement affects the sustainability of foundations. Government proposes to relax this requirement while ensuring that foundations do distribute accumulated capital to worthy causes within a reasonable period. |
| |
| | Small and medium enterprise development |
| |
| Government wants to encourage entrepreneurship | | Entrepreneurship and business development are important building blocks for a growing, sustainable economy. Most developing economies have strong informal sectors that draw people into economic activity. South Africa’s informal sector is poorly developed given the country’s size and level of development. Moreover, the broader business environment is characterised by market concentration and relatively high profit margins. |
| |
| | Government aims to create an environment that supports both informal traders and entrepreneurs who seek to develop small businesses into larger enterprises. Policies are designed to promote the development of basic entrepreneurial skills and facilitate a greater degree of self-determination for those lacking formal opportunities. Red tape and bureaucracy are hindrances to doing business, especially for small and medium-sized firms. Government aims to streamline the regulatory regime. Proposed reforms would reduce compliance costs and facilitate access to equity finance. |
| |
| | Turnover tax regime for micro businesses |
| |
| Proposal that requirements for turnover tax regime should be simplified, with rates adjusted | | The turnover tax regime is targeted at businesses with an annual turnover of up to R1 million. Subject to public consultation, government accepts the recommendation of the Tax Review Committee that this regime should be retained, but that the requirements should be simplified, and thresholds and tax rates adjusted. The committee also proposes that turnover up to R335 000 should not be taxed (a zero tax rate) and the maximum tax rate should be reduced from the current 6 per cent to 5 per cent. Other suggestions include doing away with the requirement for businesses to opt in to the regime for three years and requiring annual, rather than biannual, tax returns. |
| |
| | Small business corporation tax relief |
| |
| Recommendation to replace tax regime for small business corporations with a tax compliance rebate | | The Tax Review Committee has concluded that the lower tax rates for small business corporations are not effective, do little to support the objective of small business growth and do not address tax compliance costs. The current regime provides tax relief to only 50 000 businesses and (in some instances) to professions not originally intended as beneficiaries. The committee recommends replacing the reduced tax rate regime with an annual refundable tax compliance rebate (subject to certain conditions). Government accepts this recommendation, subject to public consultation. |
50
CHAPTER 4: REVENUE TRENDS AND TAX PROPOSALS
Tax Review Committee to publish its first report in 2014
The Minister of Finance appointed the Tax Review Committee in July 2013. The committee, headed by Judge Dennis Davis, has a broad brief to investigate aspects of the tax system and make recommendations for possible reforms. The committee’s first interim report, which examines how the tax system affects small and medium-sized enterprises (SMEs), will be published for public comment soon.
Judge Davis summarises the committee’s progress as follows:
A report on small and medium enterprises was completed and delivered to the Minister of Finance in January 2014. The report was compiled after numerous representations from small business organisations and experts were carefully considered. It engages with the role of SMEs in the economy and examines their role as part of the National Development Plan. A series of recommendations have been made for consideration by the Minister.
A draft document containing the committee’s preliminary views on the appropriate normative framework for tax policy has been completed. It attempts to ground the discussion of an appropriate tax policy in solid data and best international practice. The aim is to strengthen tax policies that will be perceived to be ‘fair’ and help build social cohesion, while supporting inclusive growth.
The committee is looking into the effect of base erosion and profit shifting on the domestic tax base, the manner in which the tax system responds to increased cross-border activity and aggressive tax planning by multinational corporations. This includes consideration of transfer pricing, e-commerce, “treaty shopping” to reduce tax liability and the use of debt and hybrid instruments. These inquiries should be completed by June 2014.
Three further investigations have commenced. On value-added tax the committee is considering questions such as does the present system achieve a justifiable balance between direct and indirect taxes, what are its retrogressive effects, is the system efficient and what challenges are posed by e-commerce? A second area is a review of the current system of mining taxes. This will involve wide consultation with all relevant stakeholders. Third is the role of wealth taxes in the tax system, including the position of estate duty, its relationship with capital gains tax and the broader role of wealth taxes in a system aiming to balance efficiency and equity.
| | |
| Grant funding by non-business entities | | |
| |
| Lack of adequate commercial skills and access to funding are major factors influencing the success of many small and medium-sized businesses. To encourage equity investment in such enterprises on a commercial basis, funders investing through a venture capital company can claim a tax deduction on their investment. In addition, certain entities providing support and financial assistance to micro enterprises (classified as poor and needy) can obtain public-benefit organisation status. | | Small and medium-sized businesses hindered by lack of commercial skills and access to funding |
| |
| Some organisations, such as foundations, promote small enterprise development through grants. To support entrepreneurial development, government is considering options to provide tax relief to organisations involved in such activities. These options may include tax relief through the public-benefit organisation channel or a more dedicated tax provision. | | |
| |
| Tax treatment of grants | | |
| |
| Government proposes to make grants received by small and medium-sized enterprises tax exempt, regardless of the source of funds. The nature of such concessions will be considered, while taking care to prevent abuse of and avoid inconsistency within the tax system. | | |
| |
| Venture capital company regime | | |
| |
| The venture capital company tax regime aims to encourage investment into small businesses and junior mining companies. Since inception in 2008, uptake has been very limited, despite amendments in 2011. Following consultation with interested parties, government will propose one or more of the following amendments: | | Proposals to enhance flexibility of venture capital company regime |
51
2014 BUDGET REVIEW
| | |
| | • Making deductions permanent if investments are held for a certain period of time. • Allowing transferability of tax benefits when investors dispose of their holdings. • Increasing the total asset limit for qualifying investee companies from R20 million to R50 million, and from R300 million to R500 million in the case of junior mining companies. • Waiving capital gains tax on the disposal of assets, and expanding the permitted business forms. |
| |
| | Employment tax incentive |
| |
| Firms to be reimbursed when incentives exceed PAYE payable | | Government introduced the employment tax incentive on 1 January 2014 to help reduce youth unemployment. Currently, excess amounts can be set off against future PAYE liabilities. To enhance this incentive, SARS is developing a mechanism to reimburse firms in instances where the incentive exceeds PAYE payable. The refund system will become effective during the fourth quarter of 2014. |
| |
| | Government will monitor implementation of the incentive and may, if necessary, strengthen measures to protect workers from practices that abuse its intent. |
| |
| | Debt reduction rules |
| |
| | The Income Tax Act contains uniform rules covering the tax implications of debt reductions or cancellations. This system covers rules relating to ordinary revenue and capital gains. In terms of the new Companies Act (2008), creditors can vote to implement a business rescue plan, allowing a debt to be partially or fully discharged. This reduction or discharge can potentially result in a tax charge – circumventing the purpose of the business rescue concept by increasing the tax liability. Tax relief measures for companies undergoing business rescue and other forms of debt compromise will be considered. |
| |
| | Public-private partnerships |
| |
| Proposed relief to benefit private-sector participants in PPPs while maintaining state land ownership | | Government sometimes enters into public-private partnerships (PPPs) that involve making land available to private parties. These arrangements are designed to support public-sector infrastructure projects while maintaining state ownership of the land on which the project takes place. The Income Tax Act requires ownership of land before any depreciation can be claimed for improvements on that land. This stipulation does not take into account how depreciation or capital allowances may affect the viability of PPPs. Government proposes that relief be afforded to improve the financial viability of these projects. In addition, the requirement of land ownership limits the incentive for improvements in urban development zones and industrial policy projects. The merits of allowing deductions where the taxpayer is not the owner of the land will be considered. |
| |
| | Long-term insurance risk policies |
| |
| | Long-term insurers issue both risk and investment policies. Currently, all activities of long-term insurers are taxed in one of four funds – the individual policyholder fund, the company policyholder fund, the untaxed |
52
CHAPTER 4: REVENUE TRENDS AND TAX PROPOSALS
| | |
| policyholder fund and the corporate fund. Where profits are taxed in one of the two taxable policyholder funds, the insurer is taxed as a trustee of the policyholders, since profits attributable to policies will in future be paid to the policyholders “tax free”. | | |
| |
| Government proposes that profits from the risk business of an insurer be taxed in the corporate fund similar to the manner in which short-term insurers are taxed. This will ensure that the corporate fund, rather than one of the policyholder funds, will be taxed on the risk policy business and profits. Government will also review the fairness of the taxation of the individual policyholder fund, where a 30 per cent tax rate is applied, irrespective of the income level of policyholders. | | Proposals to modify taxation of long-term insurers |
| |
| Foreign reinsurance | | |
| |
| Some long-term insurers reinsure policyholder liabilities with non-resident reinsurers. Policyholders of the South African long-term insurer often elect the underlying offshore investments to which the growth on their policies will be linked. Returns earned on the investments held by the reinsurer and paid as reinsurance benefits are not taxed in South Africa because reinsurance premiums and claims are wholly disregarded in determining the tax liability. Government proposes that net returns from foreign reinsurance be included in the tax calculation of the insurer. | | Net returns from foreign reinsurance to be included in tax calculation of insurers |
| |
¢ Indirect tax proposals | | |
| |
| Excise duties on alcohol and tobacco | | |
| |
| The targeted tax burdens (excise duties plus VAT) expressed as a percentage of the weighted average retail selling price for wine, clear beer and spirits are 23, 35 and 48 per cent respectively. In line with these targets, government proposes to increase the excise duties on alcoholic beverages by between 6.2 per cent and 12 per cent in 2014. The specific excise duty rate for traditional African beer will remain unchanged. | | Excise duties on alcoholic beverages to increase by between 6.2 and 12 per cent in 2014 |
| |
| The targeted total consumption tax burden for tobacco products (excise duties plus VAT) is 52 per cent of the retail selling price of the most popular brand within each product category. Government proposes to maintain this benchmark by increasing the excise duties on tobacco products by between 2.5 and 9 per cent. The below-inflation (2.5 per cent) excise duty increase for pipe tobacco is due to the 2013 Budget excise adjustment for this category exceeding the targeted tax incidence. | | |
53
2014 BUDGET REVIEW
Table 4.5 Changes in specific excise duties, 2014/15
| | | | | | | | | | | | |
| | | Current excise | | Proposed excise | | Percentage change | |
Product | | duty rate | | duty rate | | Nominal | | | Real | |
| Malt beer | | R63.81 / litre of absolute alcohol (108.48c / average 340ml can) | | R68.92 / litre of absolute alcohol (117c / average 340ml can) | | | 8.0 | % | | | 1.8 | % |
| Traditional African beer | | 7.82c / litre | | 7.82c / litre | | | 0.0 | % | | | -6.2 | % |
| Traditional African beer powder | | 34.70c / kg | | 34.70c / kg | | | 0.0 | % | | | -6.2 | % |
| Unfortified wine | | R2.70 / litre | | R2.87 / litre | | | 6.2 | % | | | -0.0 | % |
| Fortified wine | | R4.85 / litre | | R5.21 / litre | | | 7.5 | % | | | 1.2 | % |
| Sparkling wine | | R8.28 / litre | | R9.11 / litre | | | 10.0 | % | | | 3.8 | % |
| Ciders and alcoholic fruit beverages | | R3.19 / litre (108.48c / average 340ml can) | | R3.45 / litre (117c / average 340ml can) | | | 8.1 | % | | | 1.9 | % |
| Spirits | | R122.80 / litre of absolute alcohol (R39.60 / 750ml bottle) | | R137.54 / litre of absolute alcohol (R44.36 / 750ml bottle) | | | 12.0 | % | | | 5.8 | % |
| Cigarettes | | R10.92 / 20 cigarettes | | R11.60 / 20 cigarettes | | | 6.2 | % | | | -0.0 | % |
| Cigarette tobacco | | R12.16 / 50g | | R13.03 / 50g | | | 7.2 | % | | | 0.9 | % |
| Pipe tobacco | | R3.54 / 25g | | R3.63 / 25g | | | 2.5 | % | | | -3.7 | % |
| Cigars | | R56.76 / 23g | | R61.87 / 23g | | | 9.0 | % | | | 2.8 | % |
| | |
| | Fuel taxes Increase in fuel levies Government proposes to limit the increase in the general fuel levy in line with inflation in 2014/15. The proposed increase of 12c/litre is less than the increase applied in 2013/14. The proposed increase for the Road Accident Fund levy of 8c/litre is equal to the adjustment in 2013/14. The effective date for both levies is 2 April 2014. |
Table 4.6 Total combined fuel taxes on petrol and diesel, 2012/13 – 2014/15
| | | | | | | | | | | | | | | | | | | | | | | | |
| | | 2012/13 | | | 2013/14 | | | 2014/15 | |
c / litre | | 93 Octane
petrol | | | Diesel | | | 93 Octane
petrol | | | Diesel | | | 93 Octane
petrol | | | Diesel | |
General fuel levy | | | 197.50 | | | | 182.50 | | | | 212.50 | | | | 197.50 | | | | 224.50 | | | | 209.50 | |
Road Accident Fund levy | | | 88.00 | | | | 88.00 | | | | 96.00 | | | | 96.00 | | | | 104.00 | | | | 104.00 | |
Customs and excise levy | | | 4.00 | | | | 4.00 | | | | 4.00 | | | | 4.00 | | | | 4.00 | | | | 4.00 | |
Illuminating paraffin marker | | | 0.00 | | | | 0.01 | | | | 0.00 | | | | 0.01 | | | | 0.00 | | | | 0.01 | |
| | | | | | | | | | | | | | | | | | | | | | | | |
Total | | | 289.50 | | | | 274.51 | | | | 312.50 | | | | 297.51 | | | | 332.50 | | | | 317.51 | |
Pump price: Gauteng (as in February)1 | | | 1 077.00 | | | | 1 026.69 | | | | 1 206.00 | | | | 1 129.17 | | | | 1 375.00 | | | | 1 311.35 | |
| | | | | | | | | | | | | | | | | | | | | | | | |
Taxes as percentage of pump price | | | 26.9 | % | | | 26.7 | % | | | 25.9 | % | | | 26.3 | % | | | 24.2 | % | | | 24.2 | % |
1. Diesel (0.05% sulphur) wholesale price (retail price not regulated)
| | |
| | Biofuels |
Biofuels production incentive planned to take effect in second half of 2015 | | A biofuels production incentive was announced in the 2013 Budget Review as an “infant industry” support mechanism. It is expected that the subsidy will take effect in the second half of 2015 and will work through the fuel levy. The exact levy will be determined once the cost structure and the point at which blending will occur have been decided. |
54
CHAPTER 4: REVENUE TRENDS AND TAX PROPOSALS
| | |
Diesel refunds | | |
| Government proposes to review the diesel refunds policy and administration system. Refunds in the electricity sector have grown more than anticipated, reducing net fuel tax revenues available to be shared between metropolitan municipalities. Amendments will also address equity issues, ensuring that some sectors do not benefit disproportionately from the system. | | |
| |
| Environmental taxes | | |
| |
Acid mine drainage | | |
| Regulatory and other measures have been put in place to address the serious environmental consequences of acid mine drainage. The benefit in addressing this harmful negative environmental consequence will accrue to society at large and mining companies operating in affected regions. To complement current efforts and ensure that the mining sector makes a fair contribution to continuing acid mine drainage expenses, consultations will be initiated with all interested parties on the best mechanism to use, such as an environmental levy or equivalent instrument. | | Measures to address acid mine drainage to be explored |
| |
| A comprehensive approach to climate change | | |
| |
At the 2009 Copenhagen climate-change talks, South Africa made a voluntary commitment to reduce greenhouse gas emissions from projected “business-as-usual levels” by 34 per cent in 2020 and 42 per cent in 2025, subject to certain conditions. The 2011 national climate-change response policy outlines a comprehensive package of measures to deal with both mitigation (reducing greenhouse gas emissions) and adaptation (ensuring climate-change resilience of public investments). The NDP notes the importance of creating a framework for the transition to an environmentally sustainable, low-carbon economy. A package of climate-change mitigation measures will include limiting future growth of greenhouse gas emissions and pricing carbon. The proposed carbon tax and incentives, such as the energy-efficiency tax incentive, will provide price signals to encourage the economy onto a path of low-carbon growth over the long term. Improved energy efficiency and lower energy intensity will help to reduce the carbon and capital intensity of the economy. | | South Africa committed to reducing greenhouse gas emissions |
| |
| Carbon tax | | |
| |
| Following public consultation, the National Treasury and the Department of Environmental Affairs agree on the need to align the design of the carbon tax and the proposed desired emission-reduction outcomes. To allow for this process and ensure adequate time for consultation on draft legislation, implementation of the carbon tax is postponed to 2016. | | Implementation of carbon tax is postponed to 2016 |
55
2014 BUDGET REVIEW
Addressing climate change and protecting households and businesses
The National Treasury published a Carbon Tax Policy Paper in May 2013. More than 100 written comments were received from a wide array of interested parties. Two public workshops were held and a number of bilateral meetings took place. Overall, the comments acknowledged the need for a carbon pricing mechanism to reduce greenhouse gas emissions and address climate change. Ninety-four per cent of respondents support the policy intent, and more than half are in favour of the carbon tax, with some suggesting changes to improve its effectiveness and minimise negative economic consequences.
Government intends to implement the carbon tax and reduce the electricity levy at the same time, with the net tax burden being low in the first five years of implementation, rising slowly thereafter and more steeply after 10 years. Following consultations, several adjustments to the policy package will be proposed:
| | • | | Reducing Eskom’s tax liability, with a credit for the renewable energy premium, limiting the potential effect of the tax on electricity prices. |
| | • | | Lowering the current electricity levy. |
| | • | | Addressing concerns about international competitiveness, including a formula to adjust the basic percentage tax-free threshold to reward overperformance. |
| | • | | Refining the research and development tax incentive to provide for related green technology. |
| | • | | Using firms’ carbon offsets to reduce their carbon tax liability by between 5 and 10 per cent of actual emissions, as outlined in the soon-to-be-published carbon offsets policy paper. |
| | • | | Minimising the effect on households by providing subsidies to install solar water geysers and improve public transport. |
| | • | | Using some of the revenue generated from the carbon tax to fund the energy-efficiency tax incentive, which began operating on 1 November 2013. |
| | • | | Aligning reporting and classification of greenhouse gas emissions for tax purposes with mandatory emissions reporting to the Department of Environmental Affairs. |
Government will take into account the range of factors mentioned above when finalising the design of the carbon tax to ensure that households and firms are not unnecessarily disadvantaged.
| | |
| | VAT amendments |
| | Second-hand goods – precious metals |
| Second-hand goods made from precious metals to be excluded from obtaining notional input tax | | A notional input tax is allowed when a VAT vendor acquires second-hand goods from a non-VAT vendor, allowing for the unlocking of part of the VAT on goods previously paid by final consumers as those goods re-enter the formal supply chain. Sales of certain gold coins are zero-rated for VAT. While the resale of gold jewellery by non-VAT vendors to VAT vendors should allow for the deduction of notional input VAT, in practice such jewellery is smelted along with gold coins and illegally acquired raw gold. This has created an enabling environment for fraudulent input tax deductions. Government proposes that second-hand goods made from precious metals be excluded from obtaining the notional input tax. |
| |
| | ¢ Revenue impact of tax proposals |
| |
| 2014 proposals expected to decrease total tax revenue by R5.6 billion | | Table 4.7 highlights the projected effect of tax proposals on revenue collection in 2014/15. The net result is expected to decrease total tax revenue by R5.6 billion. |
56
CHAPTER 4: REVENUE TRENDS AND TAX PROPOSALS
Table 4.7 Impact of tax proposals on 2014/15 revenue
| | | | | | | | |
R million | | Effect of tax proposals | |
Tax revenue (before tax proposals) | | | | | | | 999 225 | |
Non-tax revenue | | | | | | | 20 869 | |
Less: SACU payments | | | | | | | -51 738 | |
| | | | | | | | |
National budget revenue | | | | | | | 968 357 | |
Provinces, social security funds and selected public entities | | | | | | | 136 466 | |
| | | | | | | | |
Budget revenue (before tax proposals) | | | | | | | 1 104 823 | |
Budget 2014/15 proposals: | | | | | | | -5 575 | |
Taxes on individuals and companies | | | -10 250 | | | | | |
Personal income tax | | | -9 250 | | | | | |
Adjustment in personal tax rate structure | | | -9 250 | | | | | |
Business income tax | | | -1 000 | | | | | |
Employment tax incentive | | | -1 000 | | | | | |
Indirect taxes | | | 4 675 | | | | | |
Increase in general fuel levy | | | 2 565 | | | | | |
Increase in excise duties on tobacco products | | | 695 | | | | | |
Increase in alcoholic beverages | | | 1 415 | | | | | |
Tax revenue (after tax proposals) | | | | | | | 993 650 | |
| | | | | | | | |
Budget revenue (after tax proposals) | | | | | | | 1 099 248 | |
| | | | | | | | |
| | |
¢ Revenue trends | | |
Table 4.8 highlights budget projections and outcomes for the major tax instruments for 2012/13, and revised revenue estimates for 2013/14. Tables 2 and 3 in Annexure B show more detail on these trends. | | |
| Audited nominal total tax revenues for 2012/13 amounted to R813.8 billion – R71.2 billion or 9.6 per cent higher than revenue collected for 2011/12. Revenue growth was supported by a healthy performance of customs duties (14 per cent), VAT (12.6 per cent), the fuel levy (10.4 per cent) and personal income tax (10.2 per cent), while corporate income tax grew moderately (5.0 per cent). Lengthy mining strikes in the second half of 2012 resulted in lower corporate provisional tax payments for both mining and manufacturing in the second half of 2012/13. Compared to estimate at the time of the 2012 Budget, actual total tax revenue for 2012/13 was lower by R12.6 billion. | | |
| |
| Tax revenues have remained buoyant, and the revenue estimate for 2013/14 presented in last year’s budget has been revised upwards by R1 billion to R899 billion. The revised tax revenue estimate is R85.2 billion or 10.5 per cent higher than actual tax revenue in 2012/13, and R4 billion above the estimate presented in the October 2013 Medium Term Budget Policy Statement. | | Tax revenue of R899 billion estimated for 2013/14 |
57
2014 BUDGET REVIEW
Table 4.8 Budget estimates and revenue outcome, 2012/13 and 2013/14
| | | | | | | | | | | | | | | | | | | | | | | | | | | | |
| | | 2012/13 | | | 2013/14 | | | 2012/13 – | |
| | | | | | | | | 2013/14 % | |
R million | | Budget | | | Outcome | | | Deviation | | | Budget | | | Revised | | | Deviation | | | change1 | |
Taxes on income and profits | | | 475 729 | | | | 457 314 | | | | -18 416 | | | | 501 353 | | | | 505 475 | | | | 4 122 | | | | 10.5 | % |
Persons and individuals | | | 285 970 | | | | 275 822 | | | | -10 148 | | | | 306 188 | | | | 308 930 | | | | 2 742 | | | | 12.0 | % |
Companies | | | 167 839 | | | | 159 259 | | | | -8 579 | | | | 169 830 | | | | 176 965 | | | | 7 135 | | | | 11.1 | % |
Secondary tax on companies/Dividend withholding tax | | | 19 050 | | | | 19 739 | | | | 689 | | | | 22 930 | | | | 17 000 | | | | -5 930 | | | | -13.9 | % |
Other taxes on income and profits2 | | | 2 871 | | | | 2 494 | | | | -377 | | | | 2 405 | | | | 2 580 | | | | 175 | | | | 3.4 | % |
Taxes on payroll and workforce | | | 11 131 | | | | 11 378 | | | | 247 | | | | 12 403 | | | | 12 300 | | | | -103 | | | | 8.1 | % |
Taxes on property | | | 8 627 | | | | 8 645 | | | | 18 | | | | 9 070 | | | | 10 375 | | | | 1 305 | | | | 20.0 | % |
Domestic taxes on goods and services | | | 294 554 | | | | 296 921 | | | | 2 368 | | | | 333 344 | | | | 326 044 | | | | -7 300 | | | | 9.8 | % |
Value-added tax | | | 209 675 | | | | 215 023 | | | | 5 348 | | | | 242 990 | | | | 239 286 | | | | -3 704 | | | | 11.3 | % |
Specific excise duties | | | 28 772 | | | | 28 378 | | | | -395 | | | | 31 265 | | | | 28 943 | | | | -2 322 | | | | 2.0 | % |
Ad valorem excise duties | | | 2 000 | | | | 2 232 | | | | 232 | | | | 2 400 | | | | 2 402 | | | | 2 | | | | 7.6 | % |
General fuel levy | | | 42 776 | | | | 40 410 | | | | -2 365 | | | | 44 970 | | | | 43 300 | | | | -1 670 | | | | 7.2 | % |
Other domestic taxes on goods and services3 | | | 11 331 | | | | 10 878 | | | | -453 | | | | 11 719 | | | | 12 114 | | | | 395 | | | | 11.4 | % |
Taxes on international trade and transactions | | | 36 359 | | | | 39 549 | | | | 3 190 | | | | 41 834 | | | | 44 775 | | | | 2 941 | | | | 13.2 | % |
Customs duties | | | 36 160 | | | | 38 998 | | | | 2 838 | | | | 41 340 | | | | 44 500 | | | | 3 160 | | | | 14.1 | % |
Diamond export levy | | | 50 | | | | 55 | | | | 6 | | | | 56 | | | | 68 | | | | 13 | | | | 23.1 | % |
Miscellaneous customs and excise receipts | | | 150 | | | | 496 | | | | 346 | | | | 438 | | | | 206 | | | | -232 | | | | -58.4 | % |
Stamp duties and fees | | | — | | | | 0 | | | | 0 | | | | — | | | | 31 | | | | 31 | | | | — | |
State miscellaneous revenue4 | | | — | | | | 17 | | | | 17 | | | | — | | | | — | | | | — | | | | — | |
| | | | | | | | | | | | | | | | | | | | | | | | | | | | |
Total tax revenue | | | 826 401 | | | | 813 826 | | | | -12 575 | | | | 898 004 | | | | 899 000 | | | | 996 | | | | 10.5 | % |
Non-tax revenue5 of which: | | | 16 291 | | | | 28 087 | | | | 11 796 | | | | 23 328 | | | | 30 541 | | | | 7 213 | | | | 8.7 | % |
Mineral royalties | | | 6 510 | | | | 5 015 | | | | -1 495 | | | | 5 900 | | | | 6 500 | | | | 600 | | | | 29.6 | % |
Less: SACU6 payments | | | -42 151 | | | | -42 151 | | | | — | | | | -43 374 | | | | -43 374 | | | | — | | | | 2.9 | % |
| | | | | | | | | | | | | | | | | | | | | | | | | | | | |
Main budget revenue | | | 800 540 | | | | 799 762 | | | | -779 | | | | 877 958 | | | | 886 167 | | | | 8 209 | | | | 10.8 | % |
Provinces, social security funds and selected public entities | | | 105 489 | | | | 109 514 | | | | 4 025 | | | | 114 273 | | | | 124 322 | | | | 10 049 | | | | 13.5 | % |
| | | | | | | | | | | | | | | | | | | | | | | | | | | | |
Consolidated budget revenue | | | 906 029 | | | | 909 276 | | | | 3 246 | | | | 992 231 | | | | 1 010 489 | | | | 18 258 | | | | 11.1 | % |
| | | | | | | | | | | | | | | | | | | | | | | | | | | | |
| 1. | Percentage change between 2012/13 and 2013/14 revised estimate |
| 2. | Includes interest on overdue income tax, and small business tax amnesty levy |
| 3. | Includes turnover tax for small businesses, air departure tax, plastic bags levy, electricity levy, CO 2tax on motor vehicle emissions, incandescent light bulb levy and Universal Service Fund |
| 4. | Revenue received by SARS that could not be allocated to a specific tax instrument |
| 5. | Includes mineral royalties, mining leases, departmental revenue and sales of capital assets |
| 6. | Southern African Customs Union |
| | |
| | The marginal upward revision for 2013/14 compared to the 2013 Budget is the result of strong growth in corporate income tax and customs duty revenues, revised upwards by R7.1 billion and R3.2 billion respectively. This is the first time since the 2009 recession that nominal corporate income tax revenues will exceed the 2008/09 peak of R165.5 billion. Personal income tax has also been revised upwards by R2.7 billion compared with the 2013 Budget estimates. This positive performance has been offset by downward revisions in dividends tax revenue (R5.9 billion), VAT (R3.7 billon), the fuel levy (R1.7 billion) and excise duties (R2.3 billion). Fuel levy revenues have been revised downwards mainly due to increased diesel refunds. |
58
CHAPTER 4: REVENUE TRENDS AND TAX PROPOSALS
| | |
| Mineral royalties are expected to generate R6.5 billion, R600 million above the estimate. Non-tax revenue increased by R2.5 billion compared to the amount collected in 2012/13, and by R7.2 billion compared to the 2013 Budget estimate. Extraordinary revenue, consisting mainly of currency adjustments, was substantially underestimated at the time of the 2013 Budget. | | Mineral royalties are expected to generate R6.5 billion, R600 million above estimate |
| |
| Table 4.9 sets out actual revenue collections for 2010/11 to 2012/13, the revised estimate for 2013/14 and the medium-term estimates. Including tax proposals, tax revenue as a percentage of GDP is expected to increase from 25.9 per cent in 2013/14 to 26.5 per cent in 2016/17, below the 27.6 per cent peak of 2007/08. | | |
Table 4.9 Budget revenue, 2010/11 – 2016/17
| | | | | | | | | | | | | | | | | | | | | | | | | | | | |
| | | 2010/11 | | | 2011/12 | | | 2012/13 | | | 2013/14 | | | 2014/15 | | | 2015/16 | | | 2016/17 | |
R million | | Outcome | | | Revised | | | Medium-term estimates | |
Taxes on income and profits1 of which: | | | 379 941 | | | | 426 584 | | | | 457 314 | | | | 505 475 | | | | 556 951 | | | | 617 252 | | | | 684 841 | |
Personal income tax | | | 226 925 | | | | 250 400 | | | | 275 822 | | | | 308 930 | | | | 335 944 | | | | 372 359 | | | | 408 867 | |
Corporate income tax | | | 132 902 | | | | 151 627 | | | | 159 259 | | | | 176 965 | | | | 198 935 | | | | 220 783 | | | | 249 137 | |
Taxes on payroll and workforce | | | 8 652 | | | | 10 173 | | | | 11 378 | | | | 12 300 | | | | 13 440 | | | | 14 690 | | | | 16 140 | |
Taxes on property | | | 9 102 | | | | 7 817 | | | | 8 645 | | | | 10 375 | | | | 11 477 | | | | 12 546 | | | | 13 768 | |
Domestic taxes on goods and services of which: | | | 249 490 | | | | 263 950 | | | | 296 921 | | | | 326 044 | | | | 361 320 | | | | 393 970 | | | | 429 925 | |
Value-added tax | | | 183 571 | | | | 191 020 | | | | 215 023 | | | | 239 286 | | | | 267 160 | | | | 296 457 | | | | 328 696 | |
Taxes on international trade and transactions | | | 26 977 | | | | 34 121 | | | | 39 549 | | | | 44 775 | | | | 50 463 | | | | 56 641 | | | | 64 046 | |
Stamp duties and fees | | | 3 | | | | -3 | | | | 0 | | | | 31 | | | | — | | | | — | | | | — | |
State miscellaneous revenue2 | | | 17 | | | | 7 | | | | 17 | | | | — | | | | — | | | | — | | | | — | |
| | | | | | | | | | | | | | | | | | | | | | | | | | | | |
Tax revenue | | | 674 183 | | | | 742 650 | | | | 813 826 | | | | 899 000 | | | | 993 650 | | | | 1 095 100 | | | | 1 208 720 | |
Non-tax revenue3 of which: | | | 13 460 | | | | 19 193 | | | | 28 087 | | | | 30 541 | | | | 20 869 | | | | 20 316 | | | | 23 559 | |
Mineral and petroleum royalties | | | 3 555 | | | | 5 612 | | | | 5 015 | | | | 6 500 | | | | 7 167 | | | | 8 067 | | | | 9 107 | |
Less: SACU4 payments | | | -17 906 | | | | -21 760 | | | | -42 151 | | | | -43 374 | | | | -51 738 | | | | -57 298 | | | | -59 680 | |
| | | | | | | | | | | | | | | | | | | | | | | | | | | | |
Main budget revenue | | | 669 738 | | | | 740 083 | | | | 799 762 | | | | 886 167 | | | | 962 782 | | | | 1 058 117 | | | | 1 172 598 | |
Provinces, social security | | | 90 122 | | | | 96 971 | | | | 109 514 | | | | 124 322 | | | | 136 466 | | | | 143 202 | | | | 152 118 | |
funds and selected public entities | | | | | | | | | | | | | | | | | | | | | | | | | | | | |
| | | | | | | | | | | | | | | | | | | | | | | | | | | | |
Consolidated budget revenue | | | 759 859 | | | | 837 054 | | | | 909 276 | | | | 1 010 489 | | | | 1 099 248 | | | | 1 201 319 | | | | 1 324 716 | |
| | | | | | | | | | | | | | | | | | | | | | | | | | | | |
As percentage of GDP | | | | | | | | | | | | | | | | | | | | | | | | | | | | |
Tax revenue | | | 24.5 | % | | | 24.9 | % | | | 25.4 | % | | | 25.9 | % | | | 26.2 | % | | | 26.4 | % | | | 26.5 | % |
Budget revenue | | | 27.6 | % | | | 28.1 | % | | | 28.4 | % | | | 29.2 | % | | | 29.0 | % | | | 28.9 | % | | | 29.1 | % |
| | | | | | | | | | | | | | | | | | | | | | | | | | | | |
GDP (R billion) | | | 2 749.5 | | | | 2 981.8 | | | | 3 197.9 | | | | 3 464.9 | | | | 3 789.6 | | | | 4 150.5 | | | | 4 552.9 | |
Tax/GDP multiplier | | | 1.04 | | | | 1.20 | | | | 1.32 | | | | 1.25 | | | | 1.12 | | | | 1.07 | | | | 1.07 | |
| 1. | Also includes secondary tax on companies/dividend withholding tax and interest on overdue income tax and small business tax amnesty levy |
| 2. | Revenue received by SARS that could not be allocated to a specific tax instrument |
| 3. | Includes mineral royalties, mining leases, departmental revenue and sales of capital assets |
| 4. | Southern African Customs Union |
¢ Tax administration
| | |
• Over the next few months, a newly designed case sourcing system will be rolled out to improve internal efficiencies and compliance. | | |
| |
• Addressing non-compliance within the tobacco industry remains a priority. During 2013, 15 entities were identified as non-compliant with up to R1 billion worth of tobacco/cigarettes seized. Twelve criminal cases are being pursued. Consequences for non-compliance will result in withdrawal of licences and more inspections. | | |
59
2014 BUDGET REVIEW
| | |
| | • Non-compliance in the clothing, footwear and textiles sector has negatively affected market competitiveness and employment. During 2013, SARS detained 400 containers holding suspected contraband. |
| |
| | • The number of dogs and handlers trained to detect illegal and smuggled substances was nearly doubled over the past year and will be increased. |
| |
| | • Since electronic processing of customs declarations began in August 2013, goods valued at more than R1.7 trillion have been processed. High volume scanners will soon be introduced at the Durban and Cape Town ports. |
| |
| | Four-monthly VAT category |
| |
| Government proposes to eliminate the fourth-monthly VAT category | | This category of vendors was introduced in 2005 to assist small retailers. Vendors qualify if taxable supplies constitute R1.5 million or less during a 12-month period. Fewer than 1 000 vendors, with only R44 million output VAT and R23 million input VAT, were registered for this provision in 2012/13. Government proposes to eliminate this category and to bring registered vendors into the bimonthly VAT system. |
| |
| | Temporary write-off of disputed tax debt |
| |
| | Section 194 of the Tax Administration Act (2011) prevents SARS from temporarily writing off a debt while it is under dispute by a taxpayer. Government proposes to lift this prohibition. |
| |
| | VAT interest calculations |
| |
| | Under the VAT Act (1991), interest is charged on late VAT payments for a period in excess of the actual number of days between the due date and the date of payment. It is proposed that the interest rules under the Tax Administration Act (excluding monthly compounding) be activated for this category, ensuring that interest is imposed and paid on a fair basis. |
| |
| | ¢ Tax policy research projects |
| |
| | The following items are on the National Treasury’s research agenda over the next two fiscal years, with some research having already started: |
| |
| | • A study of effective tax rates for companies in different sectors, including a review of the effectiveness of some tax incentives. |
| |
| | • A review of the VAT zero-rating provision for housing subsidies to eliminate practical anomalies. VAT standard-rating of these grants is under consideration, with an equal increase in the value of the grant. |
| |
| | • A review of how educational services and public transport are treated for VAT purposes. |
| |
| | • A review of the sustainability of the local government fiscal framework. |
| |
| | • A review of the taxation of cooperatives. |
60
CHAPTER 4: REVENUE TRENDS AND TAX PROPOSALS
| | |
Annexure C Further details on some of the tax proposals, as well as tax proposals of a more technical nature, are provided in Annexure C. | | |
| |
| ¢ Conclusion | | |
| |
Over 20 years, South Africa has built a progressive tax system founded on the principles of equity, efficiency, simplicity, transparency, certainty and tax buoyancy. Taxation is a contract between the state and its citizens. The fairness of the tax system and effective use of tax revenues are the cornerstones of sound public finance and tax morale. The 2014 tax proposals and the tax reform agenda for the next few years aim to support a sustainable fiscal framework. | | The fairness of the tax system and effective use of tax revenues are the cornerstones of sound public finance |
61
2014 BUDGET REVIEW
This page was left blank intentionally.
62
5
Asset and liability management
In brief
| | • | | Government’s debt management policy has proven resilient in a highly volatile global environment. Prudent policy, and deep and liquid domestic capital markets, will continue to ensure that government is able to finance its borrowing requirement. |
| | • | | Net debt stock as a share of GDP is expected to be 39.7 per cent in 2013/14, peaking at 44.3 per cent by 2016/17 in line with countercyclical fiscal policy. |
| | • | | Debt-service costs will remain manageable, stabilising at 3.1 per cent of GDP in 2015/16. |
| | • | | Government’s debt position is sustainable, with a long-dated maturity structure and a low level of foreign currency liabilities. |
| | • | | In 2013, all major rating agencies affirmed South Africa’s investment-grade sovereign credit rating. |
| | • | | To ensure that the finances of state-owned companies are healthy and well managed, oversight will be strengthened through amendments to Treasury Regulations. |
¢ Overview
| | |
| Since the start of the global financial and economic crisis in 2008, government’s countercyclical fiscal policy and the fiscal space created in previous years have allowed for a widening budget deficit and higher levels of debt to increase infrastructure investment, continue funding social priorities and support the economy. | | Flexible debt management strategy minimises interest and repayment risk |
| |
| Government’s flexible debt management strategy ensures that additional borrowing minimises interest and repayment risks. These considerations are necessary to maintain a stable debt portfolio and avoid burdening the country with repayment obligations for many years to come, undermining the principle of intergenerational equity. | | |
| |
| South Africa’s borrowing strategy is sufficiently responsive to withstand long-term adjustments in global and domestic capital allocations and short term market shocks. This strategy was tested over the past year as the US Federal Reserve announced a slowdown in its large-scale bond-buying programme, triggering a global sell-off in emerging-market assets. In | | Borrowing strategy is sufficiently responsive to withstand long-term adjustments |
63
2014 BUDGET REVIEW
| | |
| | January 2014, non-resident investors were net sellers of R22.4 billion of South African government bonds. However, the financing programme has continued without interruption, with domestic investors taking the global sell-off as an opportunity to increase investments in South African government paper, highlighting the depth of the local bond market. |
| |
| Government’s borrowing requirement decreases to R151 billion in 2016/17 | | In 2013/14, government’s borrowing requirement will be R162.9 billion, R5.6 billion lower than projected in the October 2013 Medium Term Budget Policy Statement. It is projected to decrease to R151 billion in 2016/17. Although South Africa’s exposure to foreign currency denominated debt remains low, government will raise about US$1.5 billion a year over the medium term in global financial markets. |
| |
| Diverse debt portfolio, coupled with low coupon rates and declining issuance, helps contain debt-service costs | | Financing the borrowing requirement, in combination with inflation and currency devaluation, will increase government’s net loan debt from R1.4 trillion in 2013/14 (39.7 per cent of GDP) to R2 trillion by 2016/17 (44.3 per cent of GDP). The cost of servicing debt over the same period will increase from R101.3 billion (2.9 per cent of GDP) to R139.2 billion (3.1 per cent of GDP). While debt-service costs have risen as the volume of debt has increased, the effective interest rate paid on debt has fallen from 9.9 per cent in 2006/07 to 6.4 per cent in 2013/14. The diversity of the debt portfolio, coupled with low coupon rates and declining issuance over the medium term, will help keep debt-service costs at sustainable levels. |
| |
| Amendments to Treasury Regulations will strengthen oversight of state-owned companies | | State-owned companies play a central role in government’s infrastructure plans, with investments financed on the strength of their own balance sheets. The finances of these companies need to be healthy and well managed. Forthcoming amendments to Treasury Regulations will strengthen the oversight of state-owned companies. Accounting authorities will be required to submit quarterly capital spending reports to the National Treasury. To minimise risk exposure, state-owned companies that have been authorised to borrow, issue guarantees or enter into any transaction that may bind them to future financial commitments will be required to conclude a shareholder compact with their executive authority in consultation with the National Treasury. This chapter reviews developments in South Africa’s debt markets, the 2014/15 funding strategy, the composition of government’s debt portfolio, and the finances of state-owned companies and development finance institutions. |
64
CHAPTER 5: ASSET AND LIABILITY MANAGEMENT
Managing government debt in democratic South Africa
During 20 years of democracy, the management of government’s financial assets and liabilities has been transformed. Before 1994, there was no dedicated unit responsible for debt management, nor was there clear coordination between monetary and fiscal policy.
Government’s financing requirements were mainly covered by Treasury bills and fixed-rate bonds in the domestic market, with no access to borrowing in global markets. Government cash was not efficiently managed, which took a toll on the Reserve Bank’s monetary policy operations. Funding instruments were illiquid and markets underdeveloped, making it difficult and costly to raise financing. Government’s operations were characterised by a lack of transparency. Rising debt and debt-service costs constrained resources.
In 1994, the new government began developing a debt management strategy that would enable it to borrow sustainably at reasonable cost to support its development objectives. Government has worked to deepen the domestic debt markets, broaden its investor base, diversify its financing instruments, integrate cash and debt management, and coordinate monetary and fiscal policy.
Over time, South Africa has established itself as a credible global borrower, securing financing at competitive rates and establishing benchmarks for local firms to borrow abroad. Risk is prudently managed using benchmarks for domestic and foreign debt, and fixed and non-fixed rate debt. The maturity profile is smoothed through switch and buy-back programmes.
Debt management has contributed to broader policy objectives, including reversing the country’s foreign exchange reserves from a negative net position to current levels of about US$50 billion.
To enhance its creditworthiness, government has gradually increased oversight of borrowing by state-owned companies. Steps in this area include monitoring borrowing plans and debt-maturity profiles; compiling a treasury best-practice manual; approving borrowing limits; managing contingent liability exposure; and meeting regularly with the treasuries of these companies.
Over time, government’s approach resulted in improved global credit ratings. While sovereign ratings have been under pressure in recent years, South Africa’s ratings remain at investment grade.
¢ South African debt markets
Domestic bond market
| | |
| Short-term interest rates remained relatively stable in 2013, anchored by the Reserve Bank’s repurchase (repo) rate – the rate at which private banks borrow from the central bank. | | Short-term interest rates remained relatively stable in 2013, anchored by the repo rate |
Figure 5.1 Fixed-rate bond yield curve movement
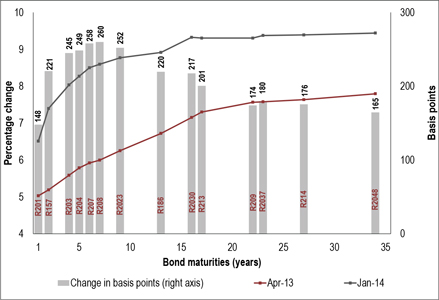
Source: Bloomberg
65
2014 BUDGET REVIEW
| | |
| | The repo rate stood at 5 per cent between July 2012 and January 2014. At the end of January 2014, the Reserve Bank increased the repo rate by 50 basis points to 5.5 per cent. |
| |
| Bond yields rose by more than 200 basis points since April 2013 | | Over and above the monetary policy adjustment, government bond yields have risen in line with international trends, in response to the US Federal Reserve’s intention to slow down its bond-buying programme. Since April 2013, South African government bond yields have increased by an average of more than 200 basis points, which has eroded the value of existing investments in bonds, and presented a buying opportunity for investors. |
Pullback from emerging market bonds
According to Emerging Portfolio Fund Research (EPFR), South Africa recorded US$382 million in capital outflows from bonds in 2013, down from US$3.8 billion in inflows recorded in 2012. This reflects the allocation decisions of the large US mutual and pension funds.
During the first quarter of 2013, emerging markets continued to receive strong capital inflows. The turning point came in May, when the US Federal Reserve announced its intention to reduce its monetary stimulus. On balance, US investors opted to retain their investments in South African bonds through 2013. Data from the beginning of 2014 shows a pattern of capital disinvestment affecting most emerging markets, due to concerns about continued tightening of US monetary policy, slower growth and rising external vulnerabilities in developing countries. According to preliminary EPFR estimates, South Africa experienced outflows of US$710 million in January 2014, accounting for 4.2 per cent of total emerging market outflows in that month.
| | |
Total bond outflows, 2013 | | Cumulative monthly bond flows, 2013 |
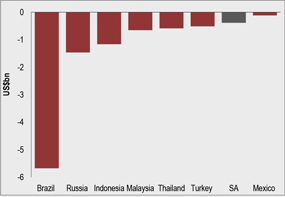 | | 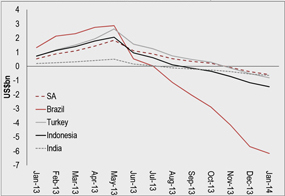 |
Source: Emerging Portfolio Fund Research
| | |
| |
| | International bond market |
| |
| Emerging markets raised US$474 billion in global markets despite volatility | | Short-term concerns about emerging market bonds grew during the second half of 2013. The announcement of a shift in US monetary policy saw the JP Morgan EMBI+ sovereign spread index, which measures the total return on dollar-denominated sovereign Eurobonds, widen from 265 basis points on 22 May 2013 to 389 basis points on 24 June 2013. Despite volatile market conditions, emerging-market debt issuers raised US$474 billion in 2013, up about 1 per cent from 2012. |
| |
| South Africa’s investment- grade sovereign credit rating affirmed in 2013 | | During 2013, major rating agencies affirmed South Africa’s investment- grade credit ratings. The country’s sound and predictable macroeconomic policies, independent constitutional institutions, deep local capital markets, strong banking sector, manageable public debt, low foreign currency exposure and flexible exchange rate continue to support investment-grade credit ratings. However, South Africa’s credit ratings continue to be constrained by a weak growth performance, high unemployment and wide income disparities, as well as low national savings and infrastructure bottlenecks that limit growth potential. |
66
CHAPTER 5: ASSET AND LIABILITY MANAGEMENT
¢ National government debt
| | |
| |
| When spending exceeds income, government incurs a budget deficit. The deficit is financed through borrowing in the domestic and international markets. These loans add to government’s overall debt, on which it pays interest. Government also takes into account its contingent financial obligations, such as commitments with uncertain payment dates or amounts, and guarantees, which result in expenditure when a specific event occurs. | | |
| |
| Financing the borrowing requirement | | |
| |
| National government’s borrowing requirement is the main budget balance, discussed in detail in Chapter 3. As Table 5.1 shows, the borrowing requirement is expected to amount to R162.9 billion in 2013/14, increasing to R179.8 billion in 2014/15 before declining to R151 billion in 2016/17. In addition, government will borrow R154.9 billion over the medium term to finance debt due (loan redemptions). The borrowing requirement is financed through loans made in the domestic and global markets and by using surplus cash. | | Main budget borrowing requirement of R179.8 billion in 2014/15 |
Table 5.1 Financing of national government borrowing requirement,1 2012/13 – 2016/17
| | | | | | | | | | | | | | | | | | | | | | | | |
| | | 2012/13 | | | 2013/14 | | | 2014/15 | | | 2015/16 | | | 2016/17 | |
R million | | Outcome | | | Budget | | | Revised | | | Medium-term estimates | |
Main budget balance2 | | | -165 734 | | | | -178 047 | | | | -162 942 | | | | -179 781 | | | | -174 473 | | | | -151 026 | |
Financing | | | | | | | | | | | | | | | | | | | | | | | | |
Domestic short-term loans (net) | | | 22 555 | | | | 23 000 | | | | 23 000 | | | | 23 000 | | | | 24 000 | | | | 26 000 | |
Treasury bills | | | 16 826 | | | | 24 103 | | | | 23 159 | | | | 23 000 | | | | 24 000 | | | | 26 000 | |
Corporation for Public Deposits | | | 5 729 | | | | -1 103 | | | | -159 | | | | — | | | | — | | | | — | |
Domestic long-term loans (net) | | | 125 768 | | | | 143 610 | | | | 148 993 | | | | 132 098 | | | | 135 356 | | | | 121 009 | |
Market loans (gross) | | | 161 554 | | | | 165 648 | | | | 170 648 | | | | 167 103 | | | | 165 075 | | | | 180 637 | |
Loans issued for switches3 | | | -3 848 | | | | -1 310 | | | | -1 135 | | | | — | | | | — | | | | — | |
Redemptions | | | -31 938 | | | | -20 728 | | | | -20 520 | | | | -35 005 | | | | -29 719 | | | | -59 628 | |
Foreign loans (net) | | | -11 622 | | | | -4 335 | | | | 380 | | | | 1 288 | | | | 12 205 | | | | 3 006 | |
Market loans (gross) | | | — | | | | 12 390 | | | | 19 619 | | | | 16 290 | | | | 15 780 | | | | 14 955 | |
Arms procurement loan agreements (gross) | | | 61 | | | | — | | | | — | | | | — | | | | — | | | | — | |
Redemptions (including revaluation of loans) | | | -11 683 | | | | -16 725 | | | | -19 239 | | | | -15 002 | | | | -3 575 | | | | -11 949 | |
Change in cash and other balances4 | | | 29 033 | | | | 15 772 | | | | -9 431 | | | | 23 395 | | | | 2 912 | | | | 1 011 | |
Cash balances | | | 27 224 | | | | 11 272 | | | | -18 809 | | | | 18 895 | | | | -1 588 | | | | -3 489 | |
Other balances5 | | | 1 809 | | | | 4 500 | | | | 9 378 | | | | 4 500 | | | | 4 500 | | | | 4 500 | |
| | | | | | | | | | | | | | | | | | | | | | | | |
Total | | | 165 734 | | | | 178 047 | | | | 162 942 | | | | 179 781 | | | | 174 473 | | | | 151 026 | |
| | | | | | | | | | | | | | | | | | | | | | | | |
| 1. | A longer time series is presented in Table 1 of Annexure B |
| 2. | A negative number reflects a deficit |
| 3. | Net of loans issued and redeemed in switch transactions |
| 4. | A negative change indicates an increase in cash balances |
| 5. | Net movement in national departments’ bank balances due to differences between funds requested and actual cash flows |
67
2014 BUDGET REVIEW
New classification of extraordinary transactions
The new consolidated fiscal framework was presented in the 2013 Medium Term Budget Policy Statement. Items previously classified as extraordinary receipts and payments are now brought into the budget framework as National Revenue Fund receipts and payments. The most significant elements of these transactions are valuation profits on foreign exchange transactions and premiums on loan transactions. These classifications are found in Tables 3 and 4 of Annexure B.
| | |
| | Domestic short-term borrowing |
| |
| Treasury bill issuance to be concentrated in long-term maturities | | Short-term borrowing consists of Treasury bill issuance and borrowing from the public sector through the Corporation for Public Deposits, into which provinces and some state-owned companies are required to invest their surplus cash. Over the medium term, net Treasury bill issuance is expected to average R24 billion per year. To reduce supply pressures in 91-day Treasury bills, issuance will be concentrated in longer-dated maturities. |
Table 5.2 Domestic short-term borrowing, 2013/14 – 2014/15
| | | | | | | | | | | | | | | | | | | | | | | | | | | | |
| | | | | | 2013/14 | | | | | | 2014/15 | | | 2013/14 | | | 2014/15 | |
| | | Opening | | | | | | Closing | | | | | | Closing | | | Weekly auction | |
R million | | balance | | | Net change | | | balance | | | Net change | | | balance | | | estimates | |
Corporation for public deposits | | | 18 985 | | | | -159 | | | | 18 826 | | | | — | | | | 18 826 | | | | — | | | | — | |
Treasury bills | | | 171 985 | | | | 23 159 | | | | 195 144 | | | | 23 000 | | | | 218 144 | | | | 7 770 | | | | 8 215 | |
91-day | | | 45 349 | | | | 460 | | | | 45 809 | | | | 2 096 | | | | 47 905 | | | | 3 685 | | | | 3 685 | |
182-day | | | 38 244 | | | | 4 114 | | | | 42 358 | | | | 3 922 | | | | 46 280 | | | | 1 665 | | | | 1 780 | |
273-day | | | 43 860 | | | | 5 393 | | | | 49 253 | | | | 7 297 | | | | 56 550 | | | | 1 300 | | | | 1 450 | |
364-day | | | 44 532 | | | | 13 192 | | | | 57 724 | | | | 9 685 | | | | 67 409 | | | | 1 120 | | | | 1 300 | |
| | | | | | | | | | | | | | | | | | | | | | | | | | | | |
Total | | | 190 970 | | | | 23 000 | | | | 213 970 | | | | 23 000 | | | | 236 970 | | | | | | | | | |
| | | | | | | | | | | | | | | | | | | | | | | | | | | | |
| | |
| | Domestic long-term borrowing |
| |
| Domestic long-term loan issuance R5 billion higher in 2013/14 | | Domestic long-term loans consist of fixed-rate bonds, inflation-linked bonds and retail bonds. In 2013/14, budgeted domestic long-term loan issuance increased by R5 billion to R170.6 billion. This increase was financed by higher-than-anticipated take-up of non-competitive fixed-rate bond auctions. |
Financing instruments
The main domestic instruments that government uses to raise financing are:
| | • | | Fixed-rate bonds, which offer a fixed rate of interest, known as the “coupon”, paid periodically during the life of the bond – usually twice a year. |
| | • | | Inflation-linked bonds, which provide investors with cover against inflation, adjust the principal according to changes in the inflation rate, and pay a fixed rate of interest on the adjusted principal. |
| | • | | Treasury bills, with maturities of less than a year, are issued at a discount, which represents the interest. |
| | • | | Cash, which can be drawn down, and borrowings from the Corporation for Public Deposits. |
Non-competitive government bond auctions
Domestic bonds are sold in weekly auctions. Both fixed-rate and inflation-linked bond auctions start with competitive bidding, where bidders propose a buying yield or rate. The highest bid offered is accepted for all successful bidders. In the case of fixed-rate bonds, competitive bidding is followed by a non-competitive bid auction, which gives successful bidders a 48-hour option to take up an additional 50 per cent of their competitive bid auction allocations at the yield at which the auction settled.
| | |
| | Fixed-rate bond issuance in 2013/14 was concentrated in longer maturities. The new fixed-rate bonds, R2030 (8 per cent; 2030) and R2037 (8.5 per cent; 2037) and inflation-linked bond I2046 (2.5 per cent; 2046) were well received. |
68
CHAPTER 5: ASSET AND LIABILITY MANAGEMENT
| | |
| In 2014/15, domestic long-term loan issuance will be R167.1 billion. The current weekly auction levels in domestic bonds are expected to be broadly maintained. The new fixed-rate bonds maturing in 2032 and 2044, announced in the 2013 Budget, will be introduced in 2014/15. The funding programme will continue to focus on minimising short-term refinancing risk, in line with the economic outlook over the short to medium term. | | Funding programme continues to minimise refinancing risk |
Table 5.3 Domestic long-term loan issuance, 2013/14
| | | | | | | | | | | | |
As of 31 January 2014 R million | | Cash value | | | Average yield
% | | | Outstanding
value | |
Fixed-rate1 | | | 110 131 | | | | 8.4 | | | | | |
R2023 (7.75%; 2023) | | | 25 061 | | | | 7.5 | | | | 46 973 | |
R186 (10.5%; 2025/26/27) | | | 6 953 | | | | 7.9 | | | | 138 420 | |
R2030 (8%; 2030) | | | 6 338 | | | | 8.9 | | | | 6 876 | |
R213 (7%; 2031) | | | 20 233 | | | | 8.4 | | | | 75 827 | |
R209 (6.25%; 2036) | | | 6 134 | | | | 8.1 | | | | 75 867 | |
R2037 (8.5%; 2037) | | | 14 298 | | | | 9.1 | | | | 15 152 | |
R214 (6.5%; 2041) | | | 12 447 | | | | 8.9 | | | | 67 553 | |
R2048 (8.75%; 2047/48/49) | | | 16 196 | | | | 9.0 | | | | 40 374 | |
Retail | | | 2 472 | | | | 6.9 | | | | 9 498 | |
Inflation-linked2 | | | 34 026 | | | | 2.1 | | | | | |
I2025 (2.0%; 2025) | | | 8 198 | | | | 1.6 | | | | 15 174 | |
R210 (2.6%; 2028) | | | 4 947 | | | | 2.2 | | | | 43 954 | |
I2038 (2.25%; 2038) | | | 8 289 | | | | 2.1 | | | | 17 837 | |
I2046 (2.5%; 2046) | | | 6 889 | | | | 2.4 | | | | 6 972 | |
I2050 (2.5%; 2049/50/51) | | | 5 652 | | | | 2.2 | | | | 16 569 | |
Retail | | | 51 | | | | 1.5 | | | | 194 | |
| | | | | | | | | | | | |
Total | | | 144 157 | | | | | | | | | |
| | | | | | | | | | | | |
| 1. | Includes non-competitive auction allocations of R20.1 billion |
| 2. | Outstanding value is revalued using the relevant reference consumer price index |
| | |
| |
| Issuance of domestic long-term loans will decrease to R165.1 billion in 2015/16 before increasing to R180.6 billion in 2016/17 due to higher bond redemptions. | | Domestic long-term loan issuance to reach R180.6 billion in 2016/17 |
The bond-switch programme mitigates refinancing risk – the risk that government will not be able to raise money to repay debt at any scheduled point, or will have to do so at a high cost. The programme eases pressures on targeted areas of the redemption profile by exchanging short-term forlong-term debt. Switch auctions in 2013/14 reduced 2014/15 loan redemptions by R10.6 billion, to R35 billion. | |
| |
| In 2016/17, and especially in the four years beyond the medium term, loan redemptions will increase sharply. To manage this refinancing risk, government will continue to exchange shorter-dated debt for longer-term debt as market conditions permit. Future switch auctions will be scheduled on an ad hoc basis, rather than being set out in a formal calendar, and there will no longer be pre-set targets. This will limit price manipulation and resulting market volatility. Government will also continue to draw from the strength of its cash balances to reduce dependence on switch programmes. | | Refinancing risk beyond the medium term managed through switch programme and accumulation of cash |
| |
| Since they were launched in 2004, government’s retail bonds have helped to promote household savings and finance the borrowing requirement. During 2013/14, investments in retail bonds amounted to R3 billion, of which R1.8 billion were reinvestments of maturing bonds and capitalised interest. A total of R9.7 billion is currently invested in these bonds. | | |
69
2014 BUDGET REVIEW
| | |
| New retail bond to be made accessible to community savings groups | | A new top-up retail bond product that allows regular deposits into existing investments will be introduced in 2014. The top-up retail bond will also be accessible to community savings groups, such as stokvels. Government, learning from experiences in the wholesale market, will also explore introducing a sukuk (Islamic) retail bond. The interest rates on retail bonds are shown in Table 5.4. |
| | | | | | | | | | | | |
Table 5.4 Interest rates on retail bonds, February 2014 | |
| Percentage | | Bond maturity | |
| Fixed-rate | | 2-year | | | 3-year | | | 5-year | |
| | | 7.00 | | | | 7.50 | | | | 8.00 | |
| | | |
| Inflation-linked | | 3-year | | | 5-year | | | 10-year | |
| | | 1.00 | | | | 1.25 | | | | 2.25 | |
| | |
| | Foreign borrowing |
| |
| | In September 2013, government raised R19.6 billion in global markets through the issuance of a 12-year, US$2 billion bond with a coupon rate of 5.875 per cent. The bond issue was nearly four times oversubscribed, reflecting South Africa’s credibility with international investors. |
| |
| Borrowing of US$1.5 billion a year in global markets | | Government minimises foreign currency debt to manage external vulnerabilities. Over the medium term, government intends to borrow about US$1.5 billion a year in global markets to maintain benchmarks in major currencies and to meet part of its foreign currency commitments. The balance of these commitments will be met from foreign currency purchases in the domestic market. To diversify funding, government will enter the sukuk market in 2014. Borrowing from export credit agencies will be considered to finance projects with large foreign exchange commitments. |
| |
| | Cash balances |
| |
| In 2014/15, cash balances will fall by R18.9 billion to finance part of borrowing requirement | | Government’s total cash, which consists of deposits in rands and US dollars held with commercial banks and the Reserve Bank, will total R186.4 billion by the end of 2013/14, decreasing to R167.5 billion in 2014/15 as cash is used to finance part of the borrowing requirement. Of government’s total cash balances in 2013/14, R125.6 billion are deposits made with the Reserve Bank to increase the level of official foreign exchange reserves and are not available to finance government expenditure. |
| |
| | The losses and profits on the foreign exchange activities of the Reserve Bank are accounted for on the Gold and Foreign Exchange Contingency Reserve Account. The balance on this government account is split into transactions with a cash flow and non-cash flow valuation impact. Due to the depreciation of the rand, valuation gains increased to R172 billion as of 31 December 2013, R69 billion higher than a year earlier, with R27 million in realised cash-flow losses to be settled by government. A longer time series is presented in Table 10 of Annexure B. |
70
CHAPTER 5: ASSET AND LIABILITY MANAGEMENT
Table 5.5 Change in cash balances, 2012/13 – 2016/17
| | | | | | | | | | | | | | | | | | | | | | | | |
| | | 2012/13 | | | 2013/14 | | | 2014/15 | | | 2015/16 | | | 2016/17 | |
R million | | Outcome | | | Budget | | | Revised | | | Medium-term estimates | |
Rand currency | | | | | | | | | | | | | | | | | | | | | | | | |
Opening balance | | | 130 450 | | | | 100 041 | | | | 103 774 | | | | 123 157 | | | | 107 157 | | | | 107 157 | |
Domestic funding | | | -6 946 | | | | 2 616 | | | | 25 546 | | | | -10 718 | | | | 748 | | | | 10 046 | |
Foreign exchange purchases1 | | | -19 730 | | | | — | | | | -6 163 | | | | -5 282 | | | | -748 | | | | -10 046 | |
Closing balance | | | 103 774 | | | | 102 657 | | | | 123 157 | | | | 107 157 | | | | 107 157 | | | | 107 157 | |
of which: | | | | | | | | | | | | | | | | | | | | | | | | |
Tax and loan accounts | | | 36 617 | | | | 35 500 | | | | 56 000 | | | | 40 000 | | | | 40 000 | | | | 40 000 | |
Sterilisation deposits 2 | | | 67 157 | | | | 67 157 | | | | 67 157 | | | | 67 157 | | | | 67 157 | | | | 67 157 | |
Change in rand cash balance3 | | | 26 676 | | | | -2 616 | | | | -19 383 | | | | 16 000 | | | | — | | | | — | |
(opening less closing balance) | | | | | | | | | | | | | | | | | | | | | | | | |
| | | | | | |
Foreign currency4 | | | | | | | | | | | | | | | | | | | | | | | | |
Opening balance | | | 64 376 | | | | 68 057 | | | | 63 828 | | | | 63 254 | | | | 60 359 | | | | 61 947 | |
Foreign exchange purchases1 | | | 19 730 | | | | — | | | | 6 163 | | | | 5 282 | | | | 748 | | | | 10 046 | |
Interest on foreign exchange balances | | | 856 | | | | 1 000 | | | | 393 | | | | 438 | | | | 433 | | | | 428 | |
International borrowing | | | — | | | | 12 390 | | | | 19 619 | | | | 16 290 | | | | 15 780 | | | | 14 955 | |
Foreign funding | | | -21 134 | | | | -27 278 | | | | -26 749 | | | | -24 905 | | | | -15 373 | | | | -21 940 | |
Closing balance | | | 63 828 | | | | 54 169 | | | | 63 254 | | | | 60 359 | | | | 61 947 | | | | 65 436 | |
US$ equivalent | | | 8 724 | | | | 7 524 | | | | 8 013 | | | | 7 522 | | | | 7 522 | | | | 7 527 | |
Change in foreign currency cash balance3 | | | 548 | | | | 13 888 | | | | 574 | | | | 2 895 | | | | -1 588 | | | | -3 489 | |
(opening less closing balance) | | | | | | | | | | | | | | | | | | | | | | | | |
Total change in cash balances3 | | | 27 224 | | | | 11 272 | | | | -18 809 | | | | 18 895 | | | | -1 588 | | | | -3 489 | |
| | | | | | | | | | | | | | | | | | | | | | | | |
Total closing cash balance | | | 167 602 | | | | 156 826 | | | | 186 411 | | | | 167 516 | | | | 169 104 | | | | 172 593 | |
| | | | | | | | | | | | | | | | | | | | | | | | |
| 1. | Foreign currency purchased in the spot market and obtained from the settlement of forward exchange contracts entered into by the Reserve Bank to sterilise sizable foreign direct investment flows |
| 2. | Deposits made with the Reserve Bank to increase the level of official foreign exchange reserves |
| 3. | A negative value indicates an increase in cash balances and a positive value indicates that cash is used to finance part of the borrowing requirement |
| 4. | Rand values at which foreign currency was purchased or borrowed |
Other elements of the debt portfolio
Government incurs debt to finance its borrowing requirement. Inflation and currency movements also affect the level of inflation-linked and foreign debt.
Table 5.6 Total national government debt,1 2010/11 – 2016/17
| | | | | | | | | | | | | | | | | | | | | | | | | | | | |
| | | 2010/11 | | | 2011/12 | | | 2012/13 | | | 2013/14 | | | 2014/15 | | | 2015/16 | | | 2016/17 | |
R billion | | | | | Outcome | | | | | | Estimate | | | Medium-term estimates | |
Total gross loan debt2 | | | 990.6 | | | | 1 187.8 | | | | 1 365.7 | | | | 1 586.4 | | | | 1 777.9 | | | | 1 990.9 | | | | 2 201.1 | |
Total net loan debt3 | | | 820.4 | | | | 989.7 | | | | 1 181.6 | | | | 1 375.5 | | | | 1 589.1 | | | | 1 804.6 | | | | 2 019.0 | |
| | | | | | | | | | | | | | | | | | | | | | | | | | | | |
As percentage of GDP: | | | | | | | | | | | | | | | | | | | | | | | | | | | | |
Total gross loan debt | | | 36.0 | | | | 39.8 | | | | 42.7 | | | | 45.8 | | | | 46.9 | | | | 48.0 | | | | 48.3 | |
Total net loan debt | | | 29.8 | | | | 33.2 | | | | 36.9 | | | | 39.7 | | | | 41.9 | | | | 43.5 | | | | 44.3 | |
Foreign debt as percentage of: | | | | | | | | | | | | | | | | | | | | | | | | | | | | |
Gross loan debt | | | 9.9 | | | | 9.8 | | | | 9.1 | | | | 9.3 | | | | 8.3 | | | | 7.8 | | | | 6.8 | |
Net loan debt | | | 4.8 | | | | 5.0 | | | | 3.7 | | | | 4.4 | | | | 4.1 | | | | 4.2 | | | | 3.7 | |
| 1. | A longer time series is presented in Table 10 of Annexure B |
| 2. | Forward estimates are based on projections of exchange and inflation rates |
| 3. | Net loan debt is calculated with due account of the cash balances of the National Revenue Fund (cash balances of government’s accounts with the Reserve Bank and commercial banks) |
| | |
Total loan debt | | |
| |
| Net loan debt, which consists of total domestic and foreign debt, less cash balances, is expected to be R1.4 trillion by the end of 2013/14. By 2016/17, loan debt is expected to increase to R2 trillion or 44.3 per cent of GDP. | | Net loan debt increasing to R2 trillion, 44.3 per cent of GDP in 2016/17 |
71
2014 BUDGET REVIEW
| | |
| | Debt-service costs |
| |
| Debt-service costs to stabilise at 3.1 per cent of GDP in 2015/16 | | The costs of servicing government debt are influenced by the volume of debt, new borrowing and market variables such as interest, inflation and exchange rates. In 2013/14, debt-service costs are expected to be R1.5 billion higher than the budget estimate, mainly due to the weakening of the rand and higher interest rates on short-term loans. Table 5.7 summarises trends and projections to 2016/17. Debt-service costs as a percentage of GDP are expected to stabilise at 3.1 per cent in 2015/16. |
Table 5.7 National government debt-service costs, 2012/13 – 2016/17
| | | | | | | | | | | | | | | | | | | | | | | | |
| | | 2012/13 | | | 2013/14 | | | 2014/15 | | | 2015/16 | | | 2016/17 | |
R million | | Outcome | | | Budget | | | Revised | | | Medium-term estimates | |
Domestic loans | | | 81 358 | | | | 92 596 | | | | 93 230 | | | | 106 212 | | | | 117 873 | | | | 130 154 | |
Short-term | | | 9 704 | | | | 10 971 | | | | 11 694 | | | | 14 818 | | | | 18 616 | | | | 20 788 | |
Long-term | | | 71 654 | | | | 81 625 | | | | 81 536 | | | | 91 394 | | | | 99 257 | | | | 109 366 | |
Foreign loans | | | 6 763 | | | | 7 145 | | | | 8 026 | | | | 8 689 | | | | 8 774 | | | | 9 047 | |
| | | | | | | | | | | | | | | | | | | | | | | | |
Total | | | 88 121 | | | | 99 741 | | | | 101 256 | | | | 114 901 | | | | 126 647 | | | | 139 201 | |
| | | | | | | | | | | | | | | | | | | | | | | | |
As percentage of: | | | | | | | | | | | | | | | | | | | | | | | | |
GDP | | | 2.8 | | | | 2.8 | | | | 2.9 | | | | 3.0 | | | | 3.1 | | | | 3.1 | |
Expenditure | | | 9.1 | | | | 9.4 | | | | 9.7 | | | | 10.1 | | | | 10.3 | | | | 10.5 | |
Revenue | | | 11.0 | | | | 11.4 | | | | 11.4 | | | | 11.9 | | | | 12.0 | | | | 11.9 | |
| | |
| | The effective interest rate of South Africa’s debt, measured by debt- service costs divided by the volume of debt, decreased from 9.9 per cent in 2006/07 to 6.4 per cent in 2013/14, and is expected to remain broadly at this level over the medium term. |
| |
| | Composition of loan debt |
| |
| | The average term-to-maturity of government bonds – the time remaining until a bond is repaid – is expected to increase from 12.6 years in 2012/13 to 13.2 years in 2013/14. The longer the average term-to-maturity, the more time government has to repay its debt obligations. The non-fixed rate debt component of the domestic debt portfolio stabilised at 35 per cent in 2013/14. |
| |
| Foreign debt exposure remains low at 9.3 per cent in 2013/14 | | Government’s gross exposure to loans raised in the international market will be 9.3 per cent of total debt in 2013/14, or 4.4 per cent in net terms after taking into account foreign exchange deposits of US$8 billion. Of total foreign loans, 79 per cent is denominated in US dollars, 11 per cent in euros and 4 per cent in yen. |
| |
| | Government maintains debt portfolio benchmarks to minimise and manage risk. Since the current benchmarks were established in 2000, the relative importance of risk factors has changed in line with macroeconomic, fiscal and financial market variables. Funding instruments have also become more diverse since 2000. |
72
CHAPTER 5: ASSET AND LIABILITY MANAGEMENT
Adjusting risk benchmarks in government’s debt portfolio
Following a review, the National Treasury proposes to modify its basket of strategic risk benchmarks. These changes will improve the management of refinancing, inflation and currency risk, as shown in the table below. The proposed benchmarks – some of which are new or have been updated – will be assessed and reported annually.
New risk benchmarks
| | |
Description | | Range or limit |
| Share of debt maturing within a year (including Treasury bills) | | Limit to 15% of total domestic debt Previous: inflation-linked bonds and Treasury bills not exceeding 30% of domestic debt |
| |
| Share of debt maturing in 5 years (fixed-rate and inflation- linked bonds) | | Limit to 25% of total domestic debt |
| |
| Average term-to-maturity of fixed-rate bonds and Treasury bills | | Range of 10-14 years |
| |
| Average term-to-maturity of inflation-linked bonds | | Range of 14-17 years |
| |
| Share of inflation-linked bonds as % of domestic debt | | Range of 20-25% Previous: inflation-linked bonds and Treasury bills not exceeding 30% of domestic debt |
| |
| Share of foreign currency debt as % of total debt | | Limit of 15% Previous: range of 20-25% |
Debt ownership
The ownership of government’s domestic bonds is shown in Table 5.8.
Table 5.8 Ownership of domestic government bonds, 2009 – 2013
| | | | | | | | | | | | | | | | | | | | |
Percentage of total | | 2009 | | | 2010 | | | 2011 | | | 2012 | | | 2013 | |
Non-residents | | | 13.8 | | | | 21.8 | | | | 29.1 | | | | 35.9 | | | | 36.4 | |
Residents | | | | | | | | | | | | | | | | | | | | |
Pension funds | | | 39.9 | | | | 36.5 | | | | 33.0 | | | | 29.8 | | | | 29.1 | |
Monetary institutions | | | 18.3 | | | | 17.7 | | | | 16.3 | | | | 17.0 | | | | 14.6 | |
Insurers | | | 12.4 | | | | 14.1 | | | | 11.6 | | | | 9.4 | | | | 8.6 | |
Other financial institutions | | | 13.2 | | | | 8.1 | | | | 8.0 | | | | 5.8 | | | | 8.2 | |
Other | | | 2.4 | | | | 1.8 | | | | 2.0 | | | | 2.1 | | | | 3.1 | |
Source: Share Transactions Totally Electronic Ltd
| | |
| Despite negative sentiment towards emerging markets in 2013, non- resident investors maintained their level of holdings in government bonds. As Table 5.8 shows, non-resident investors held 36.4 per cent of these bonds during 2013, compared with 29.1 per cent held by local pension funds. In January 2014, non-resident investors were net sellers of R22.4 billion in government bonds, and their overall holding dipped to 35.7 per cent of these bonds. Of inflation-linked bonds, local pension funds hold 63 per cent, while monetary institutions hold 17 per cent and non-resident investors 3 per cent. The maturity of fixed-rate bonds held bynon-resident investors is spread across the yield curve. | | Non-resident investors hold 35.7 per cent of domestic bonds |
| |
| Of the total amount of Treasury bills issued, 70 per cent is held by South Africa’s commercial banks, partly to meet their prescribed liquid asset requirements, and 3 per cent is held by non-resident investors. | | |
73
2014 BUDGET REVIEW
| | |
| | Provisions and contingent liabilities |
| |
| Net loan debt, provisions and contingent liabilities to amount to 54.8 per cent of GDP this year | | Provisions and contingent liability projections are shown in Table 5.9. Provisions are liabilities for which the payment date or amount is uncertain. The provisions for the multilateral institutions are the unpaid portion of government’s subscription to these institutions, which are payable on request. Contingent liabilities are obligations, such as government guarantees, that only result in expenditure when a specific event occurs. The National Treasury publishes detailed information on provisions and contingent liabilities in the Annual Consolidated Financial Statements of national departments. |
| |
| | As at 31 March 2014, net loan debt, provisions and contingent liabilities are expected to amount to 54.8 per cent of GDP, and are projected to reach 57.1 per cent of GDP by 31 March 2016, before falling to 56.7 per cent in 2016/17. This remains below the Southern African Development Community’s macroeconomic convergence target of 60 per cent of GDP, and compares favourably with many developed countries. |
| |
| | The National Treasury carefully monitors contingent liabilities and their potential impact on the fiscus. |
Table 5.9 Composition of provisions and contingent liabilities,1 2012/13 – 2016/17
| | | | | | | | | | | | | | | | | | | | |
| End of period | | 2012/13 | | | 2013/14 | | | 2014/15 | | | 2015/16 | | | 2016/17 | |
R billion | | Outcome | | | Estimate | | | Medium-term estimates | |
Net loan debt | | | 1 181.6 | | | | 1 375.5 | | | | 1 589.1 | | | | 1 804.6 | | | | 2 019.0 | |
Provisions | | | 116.2 | | | | 124.0 | | | | 146.4 | | | | 143.1 | | | | 137.4 | |
International Monetary Fund2 | | | 50.3 | | | | 52.4 | | | | 70.5 | | | | 68.3 | | | | 64.7 | |
International Bank for Reconstruction and Development2 | | | 15.9 | | | | 17.6 | | | | 18.8 | | | | 18.2 | | | | 17.3 | |
Multilateral Investment Guarantee Agency2 | | | 0.1 | | | | 0.1 | | | | 0.1 | | | | 0.1 | | | | 0.1 | |
African Development Bank2 | | | 32.7 | | | | 36.1 | | | | 38.6 | | | | 37.4 | | | | 35.5 | |
Development Bank of Southern Africa Limited3 | | | 4.8 | | | | 4.8 | | | | 4.8 | | | | 4.8 | | | | 4.8 | |
Government employee leave credits | | | 12.4 | | | | 13.0 | | | | 13.6 | | | | 14.3 | | | | 15.0 | |
Contingent liabilities | | | 369.8 | | | | 400.6 | | | | 420.8 | | | | 422.2 | | | | 424.1 | |
Guarantees | | | 180.2 | | | | 209.2 | | | | 229.2 | | | | 234.8 | | | | 241.5 | |
Post-retirement medical assistance | | | 65.3 | | | | 65.3 | | | | 65.3 | | | | 65.3 | | | | 65.3 | |
Road Accident Fund | | | 60.3 | | | | 55.9 | | | | 57.2 | | | | 56.6 | | | | 56.3 | |
Claims against government departments | | | 43.7 | | | | 43.7 | | | | 43.7 | | | | 43.7 | | | | 43.7 | |
Export Credit Insurance Corporation of SA Limited | | | 12.5 | | | | 18.3 | | | | 16.8 | | | | 12.9 | | | | 8.1 | |
Unemployment Insurance Fund | | | 3.2 | | | | 3.6 | | | | 4.0 | | | | 4.3 | | | | 4.6 | |
Other4 | | | 4.6 | | | | 4.6 | | | | 4.6 | | | | 4.6 | | | | 4.6 | |
| | | | | | | | | | | | | | | | | | | | |
Total | | | 1 667.6 | | | | 1 900.1 | | | | 2 156.3 | | | | 2 369.9 | | | | 2 580.5 | |
Percentage of GDP | | | 52.1 | | | | 54.8 | | | | 56.9 | | | | 57.1 | | | | 56.7 | |
| 1. | Medium-term forecasts of some figures are not available and are kept constant |
| 2. | Represents the unpaid portion of government’s subscription to these institutions |
| 3. | Represents callable capital provided for in terms of the Development Bank of Southern Africa Act |
| 4. | Represents a liability to Reserve Bank for old coinage in circulation and other unconfirmed balances by departments |
| | |
| | The major state-owned companies that hold guarantees are shown in Table 5.10. Details of guarantee commitments are set out in Table 11 of Annexure B. Fees of R152 million were received in 2013/14 on these guarantees. During 2013/14, no new guarantees were issued. Other developments include the following: |
| |
| | • The R5 billion guarantee previously provided to South African Airways (SAA) for two years was converted into a perpetual guarantee to enable the airline to remain a going concern. During the year, SAA raised R3.2 billion of funding against the guarantee. |
| |
| | • In 2012/13, South African Express (SAX) was granted a R539 million two-year guarantee. SAX secured a R300 million revolving loan facility for working capital under this guarantee, and is at an advanced stage of raising additional financing of R239 million. |
74
CHAPTER 5: ASSET AND LIABILITY MANAGEMENT
| | |
• The South African Broadcasting Corporation repaid the outstanding balance on the R1 billion guarantee loan raised in 2009/10 ahead of schedule and the guarantee was cancelled. | | |
| |
• After Denel’s three separate guarantees were consolidated into a R1.85 billion, five-year guarantee in 2012/13, Denel was able to raise debt through bonds and commercial paper. As a result, its long-term rating was upgraded to AAA. | | |
| |
Table 5.10 Guarantee exposure to major state-owned companies and development finance institutions,1 2012/13 – 2013/14 | | |
| | | | | | | | | | | | | | | | |
| Institution | | 2012/13 | | | 2013/14 | |
R billion | | Guarantee | | | Exposure2 | | | Guarantee | | | Exposure2 | |
Total | | | 467.5 | | | | 180.2 | | | | 466.2 | | | | 209.2 | |
of which: | | | | | | | | | | | | | | | | |
Eskom | | | 350.0 | | | | 103.5 | | | | 350.0 | | | | 122.3 | |
SANRAL | | | 38.7 | | | | 19.5 | | | | 38.7 | | | | 26.4 | |
Development Bank of Southern Africa | | | 29.6 | | | | 25.6 | | | | 29.6 | | | | 25.6 | |
Trans-Caledon Tunnel Authority | | | 25.5 | | | | 20.5 | | | | 25.5 | | | | 20.5 | |
South African Airways | | | 7.9 | | | | 2.2 | | | | 7.9 | | | | 4.9 | |
Transnet | | | 3.5 | | | | 3.8 | | | | 3.5 | | | | 3.8 | |
Denel | | | 1.9 | | | | 1.9 | | | | 1.9 | | | | 1.9 | |
Land Bank | | | 1.9 | | | | 0.9 | | | | 1.6 | | | | 1.1 | |
| 1. | A longer time series is presented in Table 11 of Annexure B |
| 2. | Includes accrued interest |
| | |
| |
| The National Treasury, together with the Department of Public Enterprises, actively monitors the performance of state-owned companies such as Denel, Eskom, SAA and SAX. These companies are required to submit monthly or quarterly reports according to their guarantee conditions. | | State-owned companies with government guarantees are required to submit regular reports |
| |
| ¢ State-owned companies | | |
| |
| Capital expenditure | | |
| |
| Medium-term capital expenditure by major state-owned companies is projected to reach R381.9 billion. Investments by Eskom, Transnet and the South African National Roads Agency Limited (SANRAL) account for 90 per cent of this amount. | | |
Table 5.11 Major state-owned companies’1 capital expenditure programmes, 2012/13 – 2016/17
| | | | | | | | | | | | | | | | | | | | | | | | |
| | | 2012/13 | | | 2013/14 | | | 2014/15 | | | 2015/16 | | | 2016/17 | |
R billion | | Outcome | | | Budget | | | Revised | | | Medium-term estimates | |
Capital expenditure | | | 109.9 | | | | 111.9 | | | | 107.1 | | | | 126.9 | | | | 131.8 | | | | 123.2 | |
of which: | | | | | | | | | | | | | | | | | | | | | | | | |
Eskom | | | 60.4 | | | | 61.9 | | | | 56.4 | | | | 59.5 | | | | 52.2 | | | | 40.0 | |
Transnet | | | 27.6 | | | | 28.6 | | | | 25.3 | | | | 41.3 | | | | 51.6 | | | | 55.0 | |
Central Energy Fund | | | 10.2 | | | | 4.9 | | | | 12.8 | | | | 4.9 | | | | 4.8 | | | | 3.8 | |
SANRAL(toll and non-toll) | | | 8.1 | | | | 8.3 | | | | 8.3 | | | | 11.9 | | | | 15.8 | | | | 17.0 | |
Trans-Caledon Tunnel Authority | | | 1.4 | | | | 3.6 | | | | 1.7 | | | | 4.8 | | | | 2.9 | | | | 2.7 | |
Other | | | 2.2 | | | | 4.6 | | | | 2.6 | | | | 4.5 | | | | 4.5 | | | | 4.7 | |
| 1. | State-owned companies listed in Schedule 2 of the PFMA (excluding development finance institutions) and including SANRAL |
75
2014 BUDGET REVIEW
| | |
| Eskom and Transnet spent a combined R88 billion in 2012/14 | | In delivering on their infrastructure commitments, state-owned companies have improved their performance, spending R109.9 billion of a budgeted R137.6 billion (79.9 per cent) in 2012/13, compared with R92.7 billion of a budgeted R131.7 billion (70 per cent) in 2011/12. Underspending was mainly the result of contractors not meeting targeted delivery schedules, labour unrest, poor weather, material shortages and engineering delays. Eskom and Transnet spent a combined R88 billion during this period, bringing state-owned companies’ total spending over the past three years to R284.3 billion. |
| |
| | Eskom’s infrastructure figures have been revised downwards over the medium term due to lower projected revenue. |
| |
| Asset base of state-owned companies increased to R793.9 billion at end of 2012/13 | | Infrastructure investments have led to a steady increase in the asset base of state-owned companies, from R450.1 billion in 2008/09 to R793.9 billion at the end of 2012/13. The net asset value of state-owned companies has increased to R252.2 billion in 2012/13, with Eskom and Transnet accounting for 77 per cent. In 2012/13, state-owned companies’ average return on equity slowed to 4 per cent, down from 7.6 per cent in the prior year, mainly due to lower earnings and higher operational costs at Eskom. |
| |
| | Table 5.12 Consolidated balance sheets of state-owned companies,1 2008/09 – 2012/13 |
| | | | | | | | | | | | | | | | | | | | |
R billion | | 2008/09 | | | 2009/10 | | | 2010/11 | | | 2011/12 | | | 2012/13 | |
Total assets | | | 450.1 | | | | 517.8 | | | | 639.4 | | | | 708.1 | | | | 793.9 | |
% growth in assets | | | 17.7 | | | | 15.0 | | | | 23.5 | | | | 10.7 | | | | 12.1 | |
Total liabilities | | | 290.6 | | | | 341.6 | | | | 442.9 | | | | 470.6 | | | | 541.7 | |
% growth in liabilities | | | 26.9 | | | | 17.6 | | | | 23.8 | | | | 11.1 | | | | 15.1 | |
Net asset value | | | 159.5 | | | | 176.2 | | | | 216.5 | | | | 237.5 | | | | 252.2 | |
% growth in asset value | | | 3.9 | | | | 10.5 | | | | 22.9 | | | | 9.7 | | | | 6.2 | |
% return on equity | | | -4.0 | | | | 3.8 | | | | 6.7 | | | | 7.6 | | | | 4.0 | |
| | |
| | |
| | 1. Major state-owned companies listed in Schedule 2 of the PFMA |
| | |
| | Funding plans |
| |
| | Over the next three years, 61.6 per cent or R235.3 billion of funding required for infrastructure development by state-owned companies is expected to be raised in debt markets, with the remainder coming from internally generated cash. Eskom and Transnet will account for the bulk of these borrowings. |
Table 5.13 Funding sources for state-owned companies, 2012/13 – 2016/17
| | | | | | | | | | | | | | | | | | | | | | | | |
| | | 2012/13 | | | 2013/14 | | | 2014/15 | | | 2015/16 | | | 2016/17 | |
R billion | | Outcome | | | Budget | | | Revised | | | Medium-term estimates | |
Domestic loans (gross) | | | 40.5 | | | | 40.5 | | | | 40.3 | | | | 51.6 | | | | 61.9 | | | | 50.3 | |
Short-term | | | 26.8 | | | | 18.9 | | | | 22.4 | | | | 32.9 | | | | 37.5 | | | | 25.1 | |
Long-term | | | 13.7 | | | | 21.6 | | | | 17.9 | | | | 18.7 | | | | 24.4 | | | | 25.2 | |
Foreign loans (gross) | | | 29.4 | | | | 21.0 | | | | 32.7 | | | | 25.1 | | | | 29.5 | | | | 16.9 | |
Long-term | | | 29.4 | | | | 21.0 | | | | 32.7 | | | | 25.1 | | | | 29.5 | | | | 16.9 | |
of which: | | | | | | | | | | | | | | | | | | | | | | | | |
Multilateral institutions | | | 16.8 | | | | 13.2 | | | | 10.1 | | | | 7.2 | | | | 6.5 | | | | 6.5 | |
Export credit agency financing | | | 4.3 | | | | 5.8 | | | | 4.7 | | | | 3.8 | | | | 9.1 | | | | 1.4 | |
| | | | | | | | | | | | | | | | | | | | | | | | |
Total | | | 69.9 | | | | 61.5 | | | | 73.0 | | | | 76.7 | | | | 91.4 | | | | 67.2 | |
| | | | | | | | | | | | | | | | | | | | | | | | |
As percentage of total: | | | | | | | | | | | | | | | | | | | | | | | | |
Domestic loans | | | 57.9 | | | | 65.9 | | | | 55.2 | | | | 67.3 | | | | 67.7 | | | | 74.9 | |
Foreign loans | | | 42.1 | | | | 34.1 | | | | 44.8 | | | | 32.7 | | | | 32.3 | | | | 25.1 | |
| | |
| | Revised borrowings in 2013/14 relate to Eskom’s higher borrowing in response to revised revenue estimates. |
76
CHAPTER 5: ASSET AND LIABILITY MANAGEMENT
| | |
| In 2014/15, an estimated 67.3 per cent of borrowing by state-owned companies will be sourced in the local market. To reduce borrowing costs and ease pressure on the domestic market, state-owned companies are encouraged to pursue funding opportunities with multilateral agencies that offer them favourable funding terms and conditions. | | |
| |
| ¢ Development finance institutions | | |
| |
| In 2014/15, the National Treasury will conduct a comprehensive review of the development finance system, including provincial institutions. The review will strengthen financial management and accountability, helping development finance institutions achieve their mandates more effectively. | | National Treasury to review development finance system in 2014/15 |
| | | | | | | | | | | | | | | | |
Table 5.14 Consolidated balance sheets of development finance institutions, 2012/13 – 2015/16 | |
| | | | |
| | | 2012/13 | | | 2013/14 | | | 2014/15 | | | 2015/16 | |
R billion | | Outcome | | | Estimate | | | Medium-term estimates | |
Total assets | | | 221.5 | | | | 223.3 | | | | 247.3 | | | | 274.5 | |
Total liabilities | | | 93.5 | | | | 103.7 | | | | 119.4 | | | | 137.3 | |
Development loans | | | 91.8 | | | | 113.4 | | | | 132.4 | | | | 152.5 | |
% growth in development loans | | | 11.8 | | | | 23.6 | | | | 16.8 | | | | 15.1 | |
| | |
| Five agencies – the Development Bank of Southern Africa (DBSA), the Industrial Development Corporation (IDC), the Land Bank, the National Empowerment Fund and the National Housing Finance Corporation – hold 99 per cent of development finance assets. The total asset base of development finance institutions is projected to grow by 24 per cent, from R221.5 billion in 2012/13 to R274.5 billion in 2015/16. The strong asset base supports 66 per cent growth in their combined loan book, from R91.8 billion in 2012/13 to R152.5 billion in 2015/16. | | Development finance asset base projected to grow by 24 per cent between 2012/13 and 2015/16 |
| |
| Development Bank of Southern Africa | | |
| |
| In 2012/13, the DBSA recorded growth of 3.1 per cent in total assets compared with the previous financial year. Total assets amounted to R53.9 billion, of which development loans made up R42.6 billion (or 79 per cent). These assets, spread across South Africa and other Southern African Development Community countries, are mainly in energy, roads and drainage, water and sanitation, and information and communication technology. In 2012/13, the DBSA achieved a 14 per cent increase in disbursements, amounting to R9.2 billion. However, loan approvals decreased by 26.9 per cent to R18.1 billion in the same period, mainly due to a DBSA restructuring process. | | |
Infrastructure investment: European Union to support project preparation
Under a financing agreement signed by government and the European Union (EU), the EU will make €100 million available to fund infrastructure investments in South Africa over the next three financial years.
The funding is intended to enhance sustainable economic growth and delivery of key services in South Africa and the region. This includes investments in energy, water and the environment, transport (rail, road, air and maritime), information and communication technology, and social infrastructure. The programme will focus on project preparation and building capacity. It will also support long-term loan finance through direct grants, interest rate subsidies or loan guarantees.
The DBSA has been appointed as the fund manager, overseen by an interdepartmental committee.
77
2014 BUDGET REVIEW
| | |
| | Land Bank |
| |
| Disbursements to emerging farmers increased to R247.5 million in 2012/13 | | The Land Bank’s net profit for 2012/13 amounted to R304.6 million, an increase of 89 per cent from the previous year. In 2012/13, the bank’s equity strengthened to R6.1 billion, growing by 9 per cent, mainly due to higher earnings. The asset base increased by 21 per cent to R30.8 billion, mainly due to loan book growth of 25 per cent in 2012/13. Disbursements to emerging farmers increased by R145.8 million, from R101.7 million in 2011/12 to R247.5 million in 2012/13. |
| |
| | Industrial Development Corporation |
| |
| | The IDC’s net profit in 2012/13 amounted to R1.9 billion, down 40 per cent from 2011/12, as a result of impairment losses on both equity investments (R705 million) and investments in associated companies and joint ventures (R466 million). Loan disbursements for industrial development grew by R16 billion, increasing by 91 per cent from R8.3 billion in 2011/12. |
| |
| | National Empowerment Fund |
| |
| National Empowerment Fund approved 135 transactions worth R1.3 billion in 2012/13 | | During 2012/13, the National Empowerment Fund’s asset base rose by 2.2 per cent to R5.4 billion. The fund has temporarily suspended new approvals subject to a review of the sustainability of its funding model. Despite funding constraints, the fund approved 135 transactions worth R1.3 billion in 2012/13, of which R946.5 million was disbursed to 87 black economic empowerment businesses. This constitutes the highest level of investment approvals and disbursements since its inception in 2004. |
| |
| | National Housing Finance Corporation |
| |
| | The National Housing Finance Corporation’s asset base increased by 5.3 per cent, from R3.4 billion in 2011/12 to R3.6 billion in 2012/13. Over the same period, the corporation’s disbursed loans amounting to R480 million, compared to R665 million in 2011/12. |
| |
| | ¢ Conclusion |
| |
| | Government’s debt management policy has proven resilient in a volatile environment. Prudent policy, in combination with deep and liquid domestic capital markets, will continue to ensure that government can finance its medium-term borrowing requirement. These policies will maintain a stable debt portfolio that will not undermine the principle of intergenerational equity. Strengthened oversight of state-owned companies will ensure that these entities are financially healthy and well managed. |
78
6
Medium-term expenditure plans
In brief
| • | | The 2014 Budget strikes a balance between continued real growth in expenditure and fiscal consolidation. |
| • | | Annual real growth in non-interest spending will average 1.9 per cent over the next three years. |
| • | | Resources will continue to be prioritised within the framework of the National Development Plan (NDP), and greater emphasis will be placed on improving performance, achieving value for money and containing costs across government. |
| • | | Social spending will remain the largest category of expenditure over the period ahead, and the allocations to education, infrastructure and job creation will grow in real terms. |
| • | | Government’s interventions to support South African industry are intended to move the economy towards a new growth trajectory. |
| | |
| The spending plans contained in the 2014 Budget build on the progress achieved over the past 20 years and give effect to government’s vision to 2030, as outlined in the NDP. The budget also reflects the challenging economic environment and the need for fiscal consolidation over the medium term. Government continues to budget within a spending ceiling that allows for moderate real growth in expenditure, while reducing the budget deficit over time. Over the period ahead, departments and agencies throughout government need to target spending on policies and programmes with the greatest developmental impact, and eliminate ineffective or wasteful expenditure. | | Budget gives effect to government’s 2030 vision, while maintaining expenditure ceiling |
| |
| The budget framework allows for average annual real growth in non-interest spending of 1.9 per cent over the 2014/15-2016/17 medium-term expenditure framework (MTEF) period. Over the past five years, non-interest expenditure has increased at an average annual rate of 4.3 per cent. At a time of prolonged global economic uncertainty and sluggish domestic performance, government has been able to expand social services, improve infrastructure delivery and invest in the productive economy. | | |
79
2014 BUDGET REVIEW
The 20-year evolution of public spending
There have been major changes in the scale, structure and focus of public spending over the past 20 years. This evolution reflects the commitment of successive governments to overcome the apartheid legacy, achieve universal access to public services, develop an inclusive economy and extend social assistance. It also reflects a commitment to transparent, accountable and responsive budgeting.
Between 1994 and 1998, public spending was channelled to the immediate challenges of the Reconstruction and Development Programme.
| | |
| Main categories of spending (per capita) | | Main categories of spending (per cent of GDP) |
| |
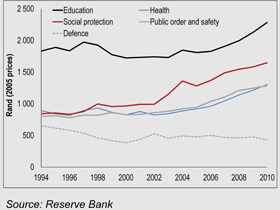 | | 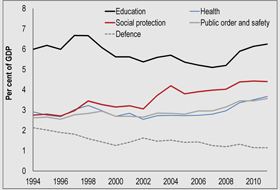 |
The figures above show the main areas of spending from 1994 to 2010; with the exception of defence, expenditure has grown across all categories since 2001. There has been a particularly large increase in social spending, including the introduction and expansion of the child support grant.
Government adopted a robust countercyclical response to the global financial crisis that began in 2008. Social grants were expanded, large numbers of teachers and nurses were hired, public employment programmes grew, and a range of industrial support programmes were introduced. There were strong increases in infrastructure investment by government and state-owned companies to relieve structural impediments to growth and generate short-term economic activity.
Public spending has grown from 27.5 per cent of GDP in 1994 to 30.1 per cent of GDP in 2013.
| | |
| Social spending remains largest component of government expenditure | | Over the period ahead, government will continue to increase the breadth and quality of services. Social spending – including social grants, education and health – will remain the largest component of government expenditure. There is strong growth in allocations to public employment programmes, particularly the Community Work Programme. Investment in infrastructure, with a specific focus on commuter rail services and water provision, also increases over the next three years, and there is sustained support for municipalities, as discussed in Chapter 7. Spending on economic and general public services, and defence, public order and safety, is expected to slow, reflecting the need to adjust resources to address spending pressures and priorities. |
| |
| Efficiency of procurement systems needs to be improved and waste eliminated | | Crucial to government’s success in meeting its developmental mandate is limiting the cost of service delivery. The efficiency of procurement systems needs to be improved and leakage eliminated. Government needs to negotiate fair value in contracting with private-sector partners. Departments need to operate within their current funded establishments. Achieving moderate, inflation-linked wage increases, combined with better control of departmental compensation budgets, will allow future budgets to provide for growth in defined priority professions. |
| |
| | To improve the quality of spending, the Department of Performance Monitoring and Evaluation is working to define performance indicators for each area of expenditure. This will help departments to ensure that their spending plans reflect NDP priorities. |
80
CHAPTER 6: MEDIUM-TERM EXPENDITURE PLANS
| ¢ | Consolidated government expenditure |
| | |
| Consolidated government expenditure information for the MTEF period is shown in Table 6.1. The estimates in this section cover spending across government, including provinces, public entities, and transfers of nationally raised revenue to municipalities. State-owned companies and spending financed by municipalities’ own revenue are excluded. | | |
| |
| In 2012/13, national expenditure amounted to R965.5 billion (including transfers to provinces and municipalities) out of a total adjusted appropriation of R971.5 billion. This represents underspending of 0.6 per cent, compared with a shortfall of 1.1 per cent in 2011/12. Spending on general public services was relatively low, mainly as a result of low capital spending by the Department of Public Works. Poor performance in addressing school infrastructure backlogs resulted in significant underspending on education, while institutional instability in the Community Work Programme affected spending in employment and social security. | | In 2012/13, underspending at national level was 0.6 per cent |
| |
| In October 2013, government reallocated resources and modified in-year spending plans through the Adjusted Estimates of National Expenditure. The function groups with the largest staff establishments received the greatest proportion of funds made available through this process to accommodate inflation-related and other salary adjustments. | | Inflation and other salary adjustments were a major factor in reallocations |
| |
| The allocation to the health and social protection function was reduced in response to savings accrued though the re-registration of social grant beneficiaries and slow spending on the national health grant. The allocations to science and technology, and employment and social security, were reduced in response to lower-than-expected disbursements from the Green Fund and the Jobs Fund. The allocation to economic services was reduced to reflect slow spending on special economic zones. | | |
| |
| Excluding debt-service costs, consolidated government expenditure is expected to be R1.05 trillion in 2013/14, rising to R1.31 trillion in 2016/17. This equates to nominal average annual growth of 7.8 per cent, compared with 8.8 per cent over the previous three years. Figure 6.1 shows nominal growth rates across the different categories of spending. Employment and social security will continue to grow strongly over the next three years, rising at an annual average rate of 13.1 per cent compared with 12.6 per cent over the previous three years. | | Strong growth in spending on employment and social security over MTEF period |
| |
| There is strong growth in expenditure on local government, housing and community amenities, while the allocations for education and health also grow in real terms, reflecting above-inflation increases in their salary bills. Spending on economic services, government administration and security will moderate after strong growth over the previous three years, and in line with programmes’ capacity to spend. | | |
81
2014 BUDGET REVIEW
Table 6.1 Consolidated government expenditure by function, 2013/14 – 2016/17
| | | | | | | | | | | | | | | | | | | | |
R million | | 2013/14 | | | 2014/15 | | | 2015/16 | | | 2016/17 | | | Average
annual MTEF
growth | |
| | Revised
estimate | | | Medium-term estimates | | |
| | | |
Defence, public order and safety | | | 154 518 | | | | 163 601 | | | | 172 707 | | | | 184 085 | | | | 6.0 | % |
Defence and state security | | | 45 208 | | | | 47 859 | | | | 50 613 | | | | 53 812 | | | | 6.0 | % |
Police services | | | 74 047 | | | | 78 132 | | | | 82 537 | | | | 88 005 | | | | 5.9 | % |
Law courts | | | 16 514 | | | | 17 888 | | | | 18 762 | | | | 20 187 | | | | 6.9 | % |
Prisons | | | 18 749 | | | | 19 722 | | | | 20 796 | | | | 22 081 | | | | 5.6 | % |
Economic infrastructure | | | 84 657 | | | | 92 805 | | | | 101 235 | | | | 105 032 | | | | 7.5 | % |
Communication | | | 3 939 | | | | 2 626 | | | | 3 263 | | | | 3 698 | | | | -2.1 | % |
Fuel and energy | | | 7 814 | | | | 8 572 | | | | 9 902 | | | | 10 811 | | | | 11.4 | % |
Transport | | | 72 904 | | | | 81 607 | | | | 88 070 | | | | 90 523 | | | | 7.5 | % |
Economic services | | | 47 929 | | | | 50 010 | | | | 52 463 | | | | 55 536 | | | | 5.0 | % |
Education and related functions | | | 240 538 | | | | 253 848 | | | | 274 480 | | | | 293 268 | | | | 6.8 | % |
Pre-school, primary and secondary education | | | 180 090 | | | | 190 730 | | | | 204 861 | | | | 217 570 | | | | 6.5 | % |
Post-school sector | | | 50 786 | | | | 52 493 | | | | 58 437 | | | | 63 463 | | | | 7.7 | % |
Arts, sport, recreation and culture | | | 9 662 | | | | 10 625 | | | | 11 182 | | | | 12 235 | | | | 8.2 | % |
Employment and social security | | | 47 890 | | | | 57 329 | | | | 64 078 | | | | 69 297 | | | | 13.1 | % |
General public services | | | 62 580 | | | | 65 095 | | | | 68 567 | | | | 74 088 | | | | 5.8 | % |
Health | | | 134 286 | | | | 145 708 | | | | 155 139 | | | | 164 798 | | | | 7.1 | % |
Local government, housing and community amenities | | | 127 222 | | | | 142 889 | | | | 155 526 | | | | 163 539 | | | | 8.7 | % |
Housing development | | | 29 229 | | | | 34 767 | | | | 37 577 | | | | 40 916 | | | | 11.9 | % |
Local government and community development | | | 73 932 | | | | 80 289 | | | | 87 710 | | | | 89 032 | | | | 6.4 | % |
Water supply | | | 24 061 | | | | 27 833 | | | | 30 238 | | | | 33 590 | | | | 11.8 | % |
Science and technology and environmental affairs | | | 17 484 | | | | 18 669 | | | | 20 122 | | | | 21 040 | | | | 6.4 | % |
Social protection | | | 130 933 | | | | 144 460 | | | | 154 649 | | | | 163 764 | | | | 7.7 | % |
| | | | | | | | | | | | | | | | | | | | |
Allocated expenditure | | | 1 048 040 | | | | 1 134 413 | | | | 1 218 965 | | | | 1 294 448 | | | | 7.3 | % |
Debt-service costs | | | 101 256 | | | | 114 901 | | | | 126 647 | | | | 139 201 | | | | 11.2 | % |
Contingency reserve | | | — | | | | 3 000 | | | | 6 000 | | | | 18 000 | | | | | |
| | | | | | | | | | | | | | | | | | | | |
Consolidated expenditure1 | | | 1 149 295 | | | | 1 252 314 | | | | 1 351 612 | | | | 1 451 648 | | | | 8.1 | % |
| | | | | | | | | | | | | | | | | | | | |
| 1. | Consisting of national, provincial, social security funds and selected public entities Refer to Annexure W2 for a detailed list of entities included |
| | |
| Reprioritisation, rather than new funds, will be the defining feature of budgeting over MTEF period | | To maintain the expenditure ceiling, additional allocations to priority areas and upward adjustments to the public-sector wage bill have been achieved through reprioritisation across departments. There has also been a drawdown on the contingency reserve. As a result, the contingency reserve for 2014/15 and 2015/16 has been reduced to R3 billion and R6 billion respectively, before rising to R18 billion in 2016/17. Over the next two years, this will limit government’s ability to accommodate unforeseeable and unavoidable expenditure and to fund emerging priorities; reprioritisation will be the defining feature of budgeting during this period. Reducing wasteful expenditure and cost controls across government will also make resources available for priority spending items. |
| |
| | Government continues to strive to shift the composition of spending away from consumption and towards productive investment. The wage bill, however, is affected by the higher inflation outlook. Public-sector salaries are linked to inflation: when prices rise, so too must the proportion of resources allocated to compensation. |
82
CHAPTER 6: MEDIUM-TERM EXPENDITURE PLANS
| | |
| This is reflected in the economic classification of the main spending increases over the MTEF period: | | |
| |
• R21.9 billion for compensation of employees as a result of higher inflation projections and salary adjustments for clerks, of which R11.7 billion is allocated to provinces and R10.2 billion to national government. | | |
| |
• R5.9 billion for spending on goods and services, including for accommodation leases, maintenance of aircraft by the South African Air Force, expanding employment programmes and a new vaccine for cervical cancer. | | |
| |
• R5.5 billion for infrastructure, including improvements to the railway network, the municipal human settlement capacity grant, the regional bulk infrastructure grant and to repair infrastructure damaged by natural disasters. | | |
| |
• R5.5 billion for transfers to households and institutions (including public entities) to increase social grants, expand antiretroviral treatment and subsidise the distribution of set-top boxes for the migration to digital broadcasting. | | |
Figure 6.1 Expenditure growth by function
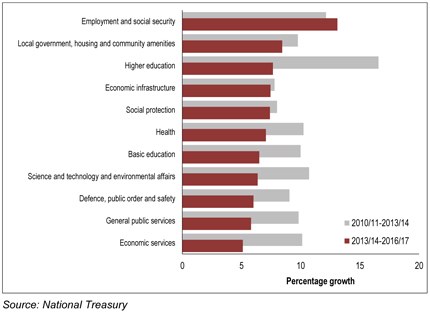
| | |
¢ Revised medium-term expenditure plans | | |
| |
| This section outlines the principal elements of the overall spending framework for the MTEF period. It is not a comprehensive account of government expenditure, but focuses on NDP priorities. Government’s expenditure plans for local government, housing, and community amenities are contained in Chapter 7. | | Discussion of expenditure plans focuses on NDP priorities |
83
2014 BUDGET REVIEW
| | |
| Full details of spending at main and consolidated budget levels can be found in Annexure B | | Comprehensive details of government spending at both the main budget and consolidated budget levels can be found in Annexure B. The Estimates of National Expenditure provides detailed information on the spending plans of national departments. The Explanatory Memorandum to the Division of Revenue describes transfers to provincial and local government. The spending plans of provinces are published within two weeks of the tabling of the national budget, while draft municipal budgets are tabled in local councils by the end of March. |
| | Contributing to more inclusive economic growth |
| |
| | Industrial policy |
| |
| Industrial Policy Action Plan aims to put economy on more labour-intensive path | | Government has adopted a multifaceted approach to broadening participation in the economy and enhancing the competitiveness of domestic producers. Many of these initiatives are part of the Industrial Policy Action Plan, which seeks to put the economy on a higher, more labour-intensive growth path. Its sector strategies include the Automotive Production and Development Programme, which subsidises international vehicle manufacturers to incorporate local producers into their supply chains, and the Clothing and Textile Competitiveness Programme, which aims to counter the effects of illegal imports and increase domestic producers’ participation in local and global markets. |
| |
| Manufacturing development incentives receive substantial budget support | | Table 6.2 identifies government’s main industrial policy initiatives. Manufacturing development incentives are allocated R10.3 billion over the next three years. Government also supports small, medium and micro enterprises (SMMEs) through entities such as the Small Enterprise Development Agency and the Small Enterprise Finance Agency. |
Table 6.2 Government support for industrial policy, 2013/14 – 2016/17
| | | | | | | | | | | | | | | | | | | | |
R million | | 2013/14 | | | 2014/15 | | | 2015/16 | | | 2016/17 | | | Total
2014/15 –
2016/17 | |
Funding for SMMEs across government | | | 2 243 | | | | 2 035 | | | | 2 295 | | | | 2 190 | | | | 6 520 | |
Provincial investment agencies | | | 1 586 | | | | 1 747 | | | | 1 813 | | | | 1 858 | | | | 5 418 | |
Science and technology support | | | 260 | | | | 305 | | | | 515 | | | | 542 | | | | 1 362 | |
Research and development: agriculture, minerals and health | | | 348 | | | | 440 | | | | 320 | | | | 337 | | | | 1 097 | |
Sub-programmes on Trade and Industry vote: | | | | | | | | | | | | | | | | | | | | |
Broadening participation development incentives | | | 367 | | | | 400 | | | | 400 | | | | 400 | | | | 1 200 | |
Service sector development incentives | | | 610 | | | | 570 | | | | 570 | | | | 610 | | | | 1 750 | |
Special economic zones | | | 888 | | | | 650 | | | | 1 200 | | | | 1 734 | | | | 3 584 | |
Critical infrastructure programme | | | 140 | | | | 190 | | | | 190 | | | | 190 | | | | 570 | |
Manufacturing development incentives | | | 3 019 | | | | 3 290 | | | | 3 425 | | | | 3 632 | | | | 10 347 | |
Export market and investment incentives | | | 219 | | | | 240 | | | | 240 | | | | 250 | | | | 730 | |
Clothing and textile incentive production incentive | | | 682 | | | | 723 | | | | 856 | | | | 901 | | | | 2 480 | |
| | | | | | | | | | | | | | | | | | | | |
Total | | | 10 362 | | | | 10 591 | | | | 11 824 | | | | 12 645 | | | | 35 059 | |
| | | | | | | | | | | | | | | | | | | | |
| | |
| | In addition to direct support to companies, government provides considerable indirect support in the form of tax expenditures. In 2011/12, the most recent year for which information is available, revenue foregone amounted to R2.4 billion for tax incentives and R19.9 billion for tariff expenditures. The latter relates principally to the R16.6 billion spent on the Automotive Production and Development Programme. Further details of tax expenditure can be found in Annexure C. |
84
CHAPTER 6: MEDIUM-TERM EXPENDITURE PLANS
| | |
| Government established the economic competitiveness and support package in 2011 with an allocation of R25 billion. Its purpose was to counter the effects of the global economic downturn on local companies. Over the next three years, this initiative will make R15.2 billion available to support a number of the programmes identified in Table 6.2 and to help businesses upgrade machinery and increase productivity. | | R15.2 billion for the economic competitiveness and support package over the next three years |
| |
| Over the MTEF period, special economic zones are allocated R3.6 billion to promote value-added exports and generate jobs in economically disadvantaged parts of the country. Preparatory work is under way to attract investors to the zones through tax incentives, infrastructure enhancements and other initiatives. | | |
| |
| Government is developing an agricultural policy to support the NDP’s target of creating 1 million jobs in agriculture by 2030. Expenditure over the medium term will focus on improving agricultural productivity. Over R7 billion will be spent on conditional grants to provinces to support about 435 000 subsistence and 54 500 smallholder farmers, and to improve agricultural extension services. Since April 2012, 200 farms have been recapitalised through government grants and 728 farmers have received training. Government aims to recapitalise 867 farms by 2016/17. | | R7 billion in conditional grants to support subsistence and smallholder farmers |
| |
| To boost domestic food production and reduce reliance on imports, the Fetsa Tlala initiative aims to bring an additional 1 million hectares into cultivation by 2019, creating 300 000 jobs. Meanwhile, the comprehensive agriculture support programme grant, which receives R1.6 billion per year over the medium term, works to increase farm output, especially for the beneficiaries of land reform. | | |
Transport and basic services infrastructure | | |
| |
| Over the three-year spending period, large investments by the Passenger Rail Agency of South Africa will significantly improve the efficiency and safety of train travel. The agency will spend R16.3 billion to upgrade Metrorail coaches, R1.1 billion to modernise 140 stations and R5.5 billion to buy locomotives. Signalling and telecommunication infrastructure and systems will receive investment of R3.6 billion. Improvements to urban bus systems are detailed in Chapter 7. | | More than R20 billion to be invested in passenger rail infrastructure over next three years |
| |
| To ensure that communities have access to basic amenities, improvements to bulk water infrastructure will be prioritised over the MTEF period and 830 000 households will be connected to electricity. In addition, there will be strong growth in the resources made available to local government to deliver water and improve sanitation, including eliminating bucket toilets. | | |
Job creation | | |
| |
| While broad-based economic growth remains the cornerstone of government’s approach to job creation, public employment programmes will also contribute directly to reducing joblessness. These initiatives play an important role in promoting economic activity among the unemployed, and fulfil a wide range of social, economic and environmental objectives. | | |
85
2014 BUDGET REVIEW
| | |
| Expanded Public Works Programme aims to create 6 million short- to medium-term jobs | | Government will launch the third phase of the Expanded Public Works Programme in April 2014. Over the next five years, it aims to create 6 million short- to medium-term jobs, up from just over 4 million in the elapsing five-year period. Table 6.3 shows the funding allocated to public employment programmes over the MTEF period. When provincial and municipal infrastructure funding are taken into account, the total funding for expanded public works is considerably higher than shown here. |
Table 6.3 Funding for employment programmes, 2010/11 – 2016/17
| | | | | | | | | | | | | | | | | | | | | | | | | | | | | | | | |
| | | 2010/11 | | | 2011/12 | | | 2012/13 | | | 2013/14 | | | 2014/15 | | | 2015/16 | | | 2016/17 | | | Average | |
R million | | Outcome | | | Revised
estimate | | | Medium-term estimates | | | annual
MTEF
growth | |
National | | | | | | | | | | | | | | | | | | | | | | | | | | | | | | | | |
Community Work Programme | | | 449 | | | | 624 | | | | 1 290 | | | | 1 731 | | | | 2 258 | | | | 2 505 | | | | 3 710 | | | | 28.9 | % |
Expanded Public Works | | | 206 | | | | 210 | | | | 237 | | | | 275 | | | | 262 | | | | 268 | | | | 291 | | | | 1.9 | % |
Programme management unit | | | | | | | | | | | | | | | | | | | | | | | | | | | | | | | | |
Non-state sector | | | 180 | | | | 154 | | | | 283 | | | | 438 | | | | 477 | | | | 485 | | | | 600 | | | | 11.1 | % |
Tourism programmes | | | 270 | | | | 301 | | | | 314 | | | | 306 | | | | 401 | | | | 594 | | | | 738 | | | | 34.1 | % |
Environmental programmes | | | 1 568 | | | | 1 977 | | | | 2 699 | | | | 2 857 | | | | 3 392 | | | | 3 519 | | | | 3 999 | | | | 11.9 | % |
Jobs Fund | | | — | | | | 272 | | | | 590 | | | | 1 258 | | | | 1 900 | | | | 1 318 | | | | 1 388 | | | | 3.3 | % |
National Rural Youth | | | 3 | | | | 96 | | | | 414 | | | | 509 | | | | 528 | | | | 543 | | | | 573 | | | | 4.0 | % |
Service Corps | | | | | | | | | | | | | | | | | | | | | | | | | | | | | | | | |
Provincial | | | | | | | | | | | | | | | | | | | | | | | | | | | | | | | | |
Incentive grant for provincial infrastructure | | | 182 | | | | 225 | | | | 293 | | | | 357 | | | | 349 | | | | 357 | | | | 412 | | | | 4.9 | % |
Incentive grant for social sector | | | 57 | | | | 200 | | | | 217 | | | | 258 | | | | 258 | | | | 268 | | | | 375 | | | | 13.3 | % |
Local government | | | | | | | | | | | | | | | | | | | | | | | | | | | | | | | | |
Incentive grant for municipal infrastructure | | | 280 | | | | 364 | | | | 662 | | | | 611 | | | | 632 | | | | 661 | | | | 696 | | | | 4.5 | % |
| | | | | | | | | | | | | | | | | | | | | | | | | | | | | | | | |
Total | | | 3 195 | | | | 4 424 | | | | 6 999 | | | | 8 600 | | | | 10 458 | | | | 10 517 | | | | 12 781 | | | | 14.1 | % |
| | | | | | | | | | | | | | | | | | | | | | | | | | | | | | | | |
| | |
| | The Community Work Programme will become the largest component of expanded public works over the medium term. Additional resources have been made available for the programme to achieve a presence in every municipality by 2016/17. There will be an emphasis on improving the quality of work so that participants are better able to move into the formal economy. There will also be a concerted effort to link employment programmes with initiatives to foster small enterprises and collectives. |
| |
| Environmental programmes are well funded and help protect natural resources | | Environmental programmes – principally Working for Water and Working on Fire – will also expand over the period ahead. These successful programmes have made a significant impact in protecting the country’s natural resources. |
86
CHAPTER 6: MEDIUM-TERM EXPENDITURE PLANS
Matching public-sector support with private-sector funding to create jobs
The Jobs Fund provides a model for tackling unemployment and promoting growth. It matches private-sector funding for projects that will generate sustainable jobs and catalyse economic activity.
The fund has supported initiatives ranging from agricultural projects working on market linkages in rural areas to emerging entrepreneurs in Johannesburg’s townships. With a strong focus on evaluation and learning, the fund has also started to generate lessons that can inform policy, particularly in the areas of business incubation and workplace-readiness training.
The fund has contracted 61 projects that will receive grant funding of R3.2 billion over the next three years. These projects are expected to create 96 102 permanent jobs and place 48 933 individuals into existing jobs by 2016. The fund concluded its third funding round in December 2013, when an additional 27 projects were approved. Over the MTEF period, the fund is allocated R4.6 billion.
| | |
| Government is also helping the private sector to create jobs through the employment tax incentive, which began in January 2014. The incentive subsidises the salaries of newly recruited workers aged between 18 and 29, who are paid in line with minimum wage requirements, for a maximum of two years. | | Employment tax incentive boosts prospects for young job seekers |
| |
| Health | | |
| |
| The bulk of health expenditure is channelled through provincial government, but over the MTEF period national health spending will grow at a higher rate. This reflects the centralisation of certain functions and the fact that the phased introduction of national health insurance (NHI) is funded principally through a grant controlled by the national department. | | National health insurance gives effect to NDP’s vision for health sector |
| |
| The implementation of NHI over a 14-year period gives effect to the NDP’s vision for a health sector that works for everyone. The Department of Health’s white paper for NHI and a financing paper by the National Treasury have been completed and will be tabled in Cabinet in the near future. Table 6.4 shows total health spending by the public sector, which amounts to R492.4 billion over the MTEF period. Medium-term allocations strengthen HIV/AIDS treatment, and support the rollout of new vaccines. These aspects of health expenditure are discussed in Chapter 7. | | |
Table 6.4 Public health expenditure,1 2010/11 – 2016/17
| | | | | | | | | | | | | | | | | | | | | | | | | | | | | | | | |
| | | 2010/11 | | | 2011/12 | | | 2012/13 | | | 2013/14 | | | 2014/15 | | | 2015/16 | | | 2016/17 | | | Average | |
R million | | Outcome | | | Revised
estimate | | | Medium-term estimates | | | annual
MTEF
growth | |
National department | | | 1 442 | | | | 1 809 | | | | 1 932 | | | | 2 297 | | | | 3 725 | | | | 3 731 | | | | 3 612 | | | | 16.3 | % |
Provincial departments | | | 95 148 | | | | 108 094 | | | | 118 334 | | | | 127 389 | | | | 137 068 | | | | 146 090 | | | | 155 496 | | | | 6.9 | % |
Defence | | | 3 150 | | | | 3 400 | | | | 3 460 | | | | 3 762 | | | | 3 849 | | | | 4 059 | | | | 4 325 | | | | 4.8 | % |
Correctional services | | | 508 | | | | 519 | | | | 584 | | | | 657 | | | | 694 | | | | 748 | | | | 780 | | | | 5.9 | % |
Local government (own revenue) | | | 1 865 | | | | 1 977 | | | | 2 096 | | | | 2 221 | | | | 2 355 | | | | 2 496 | | | | 2 628 | | | | 5.8 | % |
Public entities | | | 3 636 | | | | 3 249 | | | | 4 950 | | | | 4 601 | | | | 4 916 | | | | 5 318 | | | | 5 690 | | | | 7.3 | % |
Workmen’s compensation | | | 55 | | | | 148 | | | | 154 | | | | 221 | | | | 255 | | | | 260 | | | | 260 | | | | 5.6 | % |
Road Accident Fund | | | 768 | | | | 785 | | | | 1 138 | | | | 1 202 | | | | 1 267 | | | | 1 336 | | | | 1 406 | | | | 5.4 | % |
| | | | | | | | | | | | | | | | | | | | | | | | | | | | | | | | |
Total | | | 106 573 | | | | 119 982 | | | | 132 648 | | | | 142 350 | | | | 154 129 | | | | 164 039 | | | | 174 198 | | | | 7.0 | % |
Total as % of GDP | | | 3.9 | % | | | 4.0 | % | | | 4.1 | % | | | 4.1 | % | | | 4.1 | % | | | 4.0 | % | | | 3.8 | % | | | | |
| | | | | | | | | | | | | | | | | | | | | | | | | | | | | | | | |
| 1. | This table covers a broader range of public health spending than the consolidated figures in Table 6.1 |
| | |
| Government recognises that the health system needs to be strengthened as a precondition for NHI. The Office of Health Standards Compliance will | | |
87
2014 BUDGET REVIEW
| | |
| | be launched in 2014/15 as an independent public entity responsible for inspecting health facilities and improving the quality of health provision. The new office receives funding of R369.5 million over the medium term. |
NHI expenditure focuses on new financial arrangements and pilot innovations
The rollout of NHI is currently financed by two conditional grants: the nationally managed national health grant and the provincially managed national health insurance grant.
Within the NHI component of the national health grant, R1.2 billion is budgeted over the MTEF period to begin contracting with general practitioners, develop new reimbursement mechanisms for central hospitals and improve their revenue management. Spending on this component has been low in 2013/14 because of delays in reaching agreement on remuneration of general practitioners. The national health insurance grant receives a medium-term allocation of R221.9 million to strengthen district health structures, improve procurement and pilot innovations within targeted districts. A total of R18.1 billion is budgeted over the MTEF period for the infrastructure components of the two grants.
| | |
| | Education |
| |
| Higher compensation costs drive growth in education spending over MTEF period | | Education receives 20 per cent of consolidated government expenditure, significantly higher than any other category. Provincial education departments receive the majority of this funding to pay teachers’ salaries. To fund increased wage settlements resulting from the upward revision of inflation forecasts and to establish an occupation-specific dispensation for therapists, the education budget rises by an average of 7 per cent a year over the MTEF period. Table 6.5 shows total education spending. |
Table 6.5 Education expenditure, 2010/11 – 2016/17
| | | | | | | | | | | | | | | | | | | | | | | | | | | | | | | | |
| | | 2010/11 | | | 2011/12 | | | 2012/13 | | | 2013/14 | | | 2014/15 | | | 2015/16 | | | 2016/17 | | | Average | |
R million | | Outcome | | | Revised
estimate | | | Medium-term estimates | | | annual
MTEF
growth | |
Total education | | | 177 891 | | | | 202 615 | | | | 218 364 | | | | 240 538 | | | | 253 848 | | | | 274 480 | | | | 293 268 | | | | 6.8 | % |
Of which: | | | | | | | | | | | | | | | | | | | | | | | | | | | | | | | | |
Provincial compensation of employees | | | 111 050 | | | | 123 473 | | | | 131 266 | | | | 142 313 | | | | 149 500 | | | | 159 968 | | | | 169 321 | | | | 6.0 | % |
Post-school sector | | | 32 454 | | | | 40 282 | | | | 45 629 | | | | 50 786 | | | | 52 493 | | | | 58 437 | | | | 63 463 | | | | 7.7 | % |
School infrastructure backlogs grant | | | — | | | | 76 | | | | 860 | | | | 999 | | | | 2 939 | | | | 2 433 | | | | 2 611 | | | | 37.8 | % |
Education infrastructure grant | | | 3 163 | | | | 5 311 | | | | 5 802 | | | | 6 160 | | | | 6 929 | | | | 9 469 | | | | 10 038 | | | | 17.7 | % |
| | |
| | Access to free education has increased rapidly since government introduced no-fee schools in 2007. Today, 60 per cent of schools do not charge fees, up from 40 per cent five years ago. In 2007, 5 million learners had access to free education; by this year the number had risen to 8.8 million. In recent years, there has also been a notable increase in the number of children who attend Grade R. |
| |
| More than 400 schools to be rebuilt, and number of qualified teacher trainees increases | | The Department of Basic Education’s long-term plan to improve the quality of education, Schooling 2025, focuses on literacy, numeracy, science and languages. A total of 433 schools will be rebuilt over the medium term through the school infrastructure backlogs grant. The Funza Lushaka bursary scheme for students wanting to teach in public schools is intended to increase the number of better-qualified teachers; an estimated 3 262 graduates qualified in 2013 for placement in 2014, up from 2 396 placed in 2013. |
88
CHAPTER 6: MEDIUM-TERM EXPENDITURE PLANS
A partnership to improve the quality of education
The National Education Collaboration Trust is a partnership between government, business, labour and civil society launched in July 2013 to support implementation of the NDP and improve education outcomes. The trust has started by profiling 4 000 schools, serving about 2 million learners in eight education districts across five provinces. Next, it will bring in specialists to address specific needs, such as repairing infrastructure or improving teaching. The Department of Basic Education has an allocation of R111 million over the MTEF period for collaboration with the private sector, part of which will go to the trust. Provincial education departments are also supporting the initiative.
| | |
| Post-school education and training accounts for about 21 per cent of total education spending, with R78 billion allocated for university subsidies and R19 billion to National Student Financial Aid Scheme for bursaries and loans over the MTEF period. Funds are also provided for bursaries at universities and colleges through the sector education and training authorities and the National Skills Fund. The Department of Higher Education and Training is working with these institutions to improve throughput rates at universities and colleges. At present, a high percentage of students drop out; others fail to complete their courses within the allotted time frames. | | Money is set aside to pilot new administration of National Student Financial Aid Scheme |
| |
| The white paper for post-school education and training, released in 2013, is targeting the enrolment of 1.6 million students at universities and 2.5 million in further education and training colleges by 2030. | | |
Social infrastructure
Spending on social infrastructure – which includes health, education and community facilities – is projected to increase from R30 billion in 2012/13 to R43 billion in 2016/17. Priority will be given to eradicating school infrastructure backlogs, and refurbishing clinics and hospitals. The allocations for education and health account for more than 65 per cent of the social infrastructure budget.
| | |
| Social protection | | |
| |
| Social assistance is government’s most direct means of combating poverty. As shown in Table 6.6, spending on the social grant system is projected to rise from R118 billion in 2013/14 to R145 billion by 2016/17. Social grant expenditure will remain significant at over 3 per cent of GDP. There has been a substantial reduction in the cost of paying grants over the past five years, from an average of R32 per beneficiary per month to a fixed rate of R16.40 per beneficiary per month. | | About 15.8 million South Africans benefit from some form of social assistance |
Table 6.6 Social grant trends as a percentage of GDP, 2010/11 – 2016/17
| | | | | | | | | | | | | | | | | | | | | | | | | | | | |
| | | 2010/11 | | | 2011/12 | | | 2012/13 | | | 2013/14 | | | 2014/15 | | | 2015/16 | | | 2016/17 | |
R million | | Actual | | | Revised
estimate | | | Medium-term estimates | |
Grants | | | 87 493 | | | | 95 962 | | | | 103 899 | | | | 111 007 | | | | 120 952 | | | | 129 493 | | | | 137 556 | |
| | | | | | | |
Administration1 | | | 5 313 | | | | 5 358 | | | | 5 932 | | | | 6 975 | | | | 7 074 | | | | 7 320 | | | | 7 402 | |
| | | | | | | | | | | | | | | | | | | | | | | | | | | | |
Total | | | 92 806 | | | | 101 320 | | | | 109 830 | | | | 117 982 | | | | 128 026 | | | | 136 814 | | | | 144 958 | |
| | | | | | | |
Administration as % of total | | | 5.7 | % | | | 5.3 | % | | | 5.4 | % | | | 5.9 | % | | | 5.5 | % | | | 5.4 | % | | | 5.1 | % |
| | | | | | | |
Total as % of GDP | | | 3.4 | % | | | 3.4 | % | | | 3.4 | % | | | 3.4 | % | | | 3.4 | % | | | 3.3 | % | | | 3.2 | % |
| | | | | | | | | | | | | | | | | | | | | | | | | | | | |
| 1 | Includes SASSA, social security policy and appeals tribunal |
| | |
| Growth in social grant spending shown in Table 6.7 is driven by changes to the grant values and the number of people receiving the grants. The child support and old age grants are the two largest grant programmes, constituting about 75 per cent of total grant spending. | | |
89
2014 BUDGET REVIEW
Table 6.7 Social grants expenditure by type, 2010/11– 2016/17
| | | | | | | | | | | | | | | | | | | | | | | | | | | | | | | | |
| | | 2010/11 | | | 2011/12 | | | 2012/13 | | | 2013/14 | | | 2014/15 | | | 2015/16 | | | 2016/17 | | | Average | |
R million | | Actual | | | Revised
estimate | | | Medium-term estimates | | | annual
MTEF
growth | |
Type of grant | | | | | | | | | | | | | | | | | | | | | | | | | | | | | | | | |
Child support | | | 30 342 | | | | 34 319 | | | | 38 088 | | | | 40 029 | | | | 43 600 | | | | 46 098 | | | | 48 257 | | | | 6.4 | % |
Old age | | | 33 765 | | | | 37 131 | | | | 40 475 | | | | 44 767 | | | | 49 779 | | | | 54 138 | | | | 58 788 | | | | 9.5 | % |
Disability | | | 16 840 | | | | 17 375 | | | | 17 637 | | | | 18 034 | | | | 18 816 | | | | 19 942 | | | | 20 692 | | | | 4.7 | % |
Foster care | | | 4 616 | | | | 5 011 | | | | 5 335 | | | | 5 478 | | | | 5 974 | | | | 6 308 | | | | 6 618 | | | | 6.5 | % |
Care dependency | | | 1 586 | | | | 1 736 | | | | 1 877 | | | | 2 028 | | | | 2 251 | | | | 2 422 | | | | 2 594 | | | | 8.6 | % |
Grant-in-aid | | | 170 | | | | 204 | | | | 238 | | | | 249 | | | | 278 | | | | 305 | | | | 317 | | | | 8.4 | % |
Social relief of distress | | | 174 | | | | 185 | | | | 239 | | | | 422 | | | | 253 | | | | 280 | | | | 291 | | | | -11.7 | % |
| | | | | | | | | | | | | | | | | | | | | | | | | | | | | | | | |
Total | | | 87 493 | | | | 95 962 | | | | 103 889 | | | | 111 007 | | | | 120 952 | | | | 129 493 | | | | 137 556 | | | | 7.4 | % |
| | | | | | | | | | | | | | | | | | | | | | | | | | | | | | | | |
Source: Socpen system
| | | | | | | | |
| | Increases in social grant values for 2014/15 are shown in Table 6.8. All grants will increase at or slightly above projected consumer price inflation except the foster care grant, pending the development of a new dispensation for orphans. |
| |
| | Table 6.8 Social grant values, 2013/14 and 2014/15 |
| | | | | | | | | | | | |
Rand | | 2013/141 | | | 2014/152 | | | % Increase | |
State old age grant | | | 1 265 | | | | 1 350 | | | | 6.7 | % |
State old age grant, over 75s | | | 1 285 | | | | 1 370 | | | | 6.6 | % |
War veterans grant | | | 1 285 | | | | 1 370 | | | | 6.6 | % |
Disability grant | | | 1 265 | | | | 1 350 | | | | 6.7 | % |
Foster care grant | | | 800 | | | | 830 | | | | 3.8 | % |
Care dependency grant | | | 1 265 | | | | 1 350 | | | | 6.7 | % |
Child support grant (CSG) | | | 295 | | | | 315 | | | | 6.8 | % |
| | | | | | | | |
| | 1. Average grant value |
| | 2. The value of the CSG will rise to R310 in April and to R320 from October |
| |
| All grants but one increased at or slightly above projected inflation rate | | Over the past decade, the number of social-grant beneficiaries has doubled from 7.9 million in 2003/04 to 15.8 million in 2013/14, largely due to an expansion of the child support grant. As Table 6.9 shows, growth in grant recipients over the medium term remains moderate and in line with demographic trends. The means test threshold for the old age grant will be raised as an interim step towards phasing out the test. |
Re-registration tackles social grants fraud
During 2012 and 2013, all social grant beneficiaries were required to re-register with the South African Social Security Agency (SASSA). The process was intended to eliminate fraud and corruption in the social grant system and clean up the beneficiary database.
In August 2013, 340 000 old age and disability grants were cancelled because beneficiaries failed to re-register. In October 2013, 300 000 children were removed from the system because primary care givers failed to present the children on whose behalf they were claiming. From 1 April 2012 to 31 December 2013, 299 000 grants were voluntarily cancelled by ineligible beneficiaries and by the removal of beneficiaries who had not claimed their grants. The re-registration process included the collection of biometric information for all beneficiaries, including fingerprints and/or voiceprints. This will prevent fraudulent claims in the future.
90
CHAPTER 6: MEDIUM-TERM EXPENDITURE PLANS
Table 6.9 Social grants beneficiary numbers by type, 2010/11 – 2016/17
| | | | | | | | | | | | | | | | | | | | | | | | | | | | | | | | |
| | | 2010/11 | | | 2011/12 | | | 2012/13 | | | 2013/141 | | | 2014/15 | | | 2015/16 | | | 2016/17 | | | Average | |
Thousands | | Actual | | | Revised
estimate | | | Medium-term estimates | | | annual
MTEF
growth | |
Type of grant | | | | | | | | | | | | | | | | | | | | | | | | | | | | | | | | |
Child support | | | 10 154 | | | | 10 675 | | | | 11 213 | | | | 11 050 | | | | 11 194 | | | | 11 319 | | | | 11 392 | | | | 1.0 | % |
Old age | | | 2 648 | | | | 2 711 | | | | 2 846 | | | | 2 946 | | | | 3 074 | | | | 3 188 | | | | 3 308 | | | | 3.9 | % |
Disability | | | 1 212 | | | | 1 172 | | | | 1 154 | | | | 1 118 | | | | 1 116 | | | | 1 114 | | | | 1 113 | | | | -0.2 | % |
Foster care | | | 490 | | | | 518 | | | | 515 | | | | 519 | | | | 534 | | | | 549 | | | | 563 | | | | 2.7 | % |
Care dependency | | | 121 | | | | 122 | | | | 129 | | | | 132 | | | | 135 | | | | 139 | | | | 144 | | | | 2.8 | % |
| | | | | | | | | | | | | | | | | | | | | | | | | | | | | | | | |
Total | | | 14 625 | | | | 15 199 | | | | 15 857 | | | | 15 765 | | | | 16 052 | | | | 16 309 | | | | 16 520 | | | | 1.6 | % |
| | | | | | | | | | | | | | | | | | | | | | | | | | | | | | | | |
| 1. | Projected numbers at fiscal year end |
Source: Socpen system
| | |
| Workers, employers and motorists finance South Africa’s principal social security arrangements: the Unemployment Insurance Fund (UIF), the funds established under the Compensation Fund for Occupational Diseases and Injuries Act (1993) and the Road Accident Fund. Table 6.10 shows the revenues and expenditure of these funds over the MTEF period. | | Spending on social grants moderates over medium term, partly due to lower administrative costs |
| |
| Over the next three years, expenditure by the UIF is projected to grow strongly due to amendments to the Unemployment Insurance Act (2001) that will increase the level of benefits provided. The Road Accident Fund will also increase its claims payments, while the Compensation Fund expects to increase both its revenue collection and its claims payments as a result of progress in its turnaround strategy. The administrative costs of all the social security funds will increase significantly to recruit additional staff and expand their presence across the country. | | |
Table 6.10 Social security funds, 2010/11 – 2016/17
| | | | | | | | | | | | | | | | | | | | | | | | | | | | |
| | | 2010/11 | | | 2011/12 | | | 2012/13 | | | 2013/14 | | | 2014/15 | | | 2015/16 | | | 2016/17 | |
R million | | Outcome | | | Revised
estimate | | | Medium-term estimates | |
Unemployment Insurance Fund | | | | | | | | | | | | | | | | | | | | | | | | | | | | |
Revenue | | | 13 878 | | | | 15 206 | | | | 16 532 | | | | 20 254 | | | | 21 947 | | | | 23 664 | | | | 25 483 | |
Expenditure | | | 6 435 | | | | 6 780 | | | | 7 287 | | | | 9 207 | | | | 11 490 | | | | 14 485 | | | | 15 599 | |
Compensation funds | | | | | | | | | | | | | | | | | | | | | | | | | | | | |
Revenue | | | 6 919 | | | | 6 177 | | | | 9 041 | | | | 10 320 | | | | 10 919 | | | | 11 531 | | | | 12 162 | |
Expenditure | | | 4 032 | | | | 2 569 | | | | 2 383 | | | | 3 521 | | | | 4 530 | | | | 4 849 | | | | 5 158 | |
Road Accident Fund | | | | | | | | | | | | | | | | | | | | | | | | | | | | |
Revenue | | | 14 339 | | | | 16 472 | | | | 18 116 | | | | 20 361 | | | | 22 390 | | | | 24 384 | | | | 26 451 | |
Expenditure | | | 13 857 | | | | 13 364 | | | | 16 217 | | | | 20 262 | | | | 24 019 | | | | 27 155 | | | | 28 221 | |
| | | | | | | | | | | | | | | | | | | | | | | | | | | | |
Total revenue | | | 35 137 | | | | 37 855 | | | | 43 689 | | | | 50 935 | | | | 55 256 | | | | 59 580 | | | | 64 096 | |
Tax revenue | | | 30 334 | | | | 32 681 | | | | 37 975 | | | | 42 793 | | | | 46 286 | | | | 49 868 | | | | 53 552 | |
Non-tax revenue | | | 4 791 | | | | 5 135 | | | | 5 697 | | | | 8 124 | | | | 8 949 | | | | 9 690 | | | | 10 521 | |
Grants received | | | 12 | | | | 39 | | | | 17 | | | | 19 | | | | 20 | | | | 21 | | | | 23 | |
| | | | | | | | | | | | | | | | | | | | | | | | | | | | |
Total expenditure | | | 24 324 | | | | 22 713 | | | | 25 888 | | | | 32 990 | | | | 40 039 | | | | 46 489 | | | | 48 978 | |
Budget balance1 | | | 10 813 | | | | 15 142 | | | | 17 801 | | | | 17 945 | | | | 15 216 | | | | 13 090 | | | | 15 117 | |
| | | | | | | | | | | | | | | | | | | | | | | | | | | | |
| 1. | A positive number reflects a surplus and a negative number a deficit |
91
2014 BUDGET REVIEW
| | |
| | A capable developmental state |
| |
| National School of Government allocated R434 million to start operations | | As part of building the capable state envisioned in the NDP, government is replacing the Public Administration Leadership and Management Academy with a National School of Government. Over the three-year spending period, R434 million is allocated to the school. |
| |
| | For the next three years, the Department of Police will focus on skills development and management training. Police services will be made more accessible through infrastructure development; a rural safety strategy will be implemented; and the family, child and sexual offences unit will be strengthened. |
| |
| Transition to Smart ID cards will take place over six years | | The Department of Home Affairs launched the Smart ID card in July 2013 as part of a broader modernisation programme. The new card will replace the green barcoded ID book, which is susceptible to fraud. It will also help the department to remove fraudulent entries from the national population register and eradicate duplicate identity numbers. The transition from ID books to Smart IDs will take place over six years. The first two years will target pensioners and people who are receiving their first ID cards; both groups will receive the Smart ID card free of charge. Other citizens will be charged for the new cards, with costs similar to those of the current ID book. |
| |
| Support for African peacekeeping operations | | The Department of Defence will spend about R5 billion on peace-support operations over the medium term. South African troops are supporting peacekeeping operations in the Democratic Republic of the Congo and Sudan, and are participating in anti-piracy operations in the Mozambique Channel. A total of R1.5 billion is allocated for the maritime security strategy. |
| |
| | ¢ Conclusion |
| |
| | The spending plans for the MTEF period ahead prioritise the NDP. They also build on the successes that have been achieved since 1994 in developing a budget framework that is accountable, transparent and responsive to the needs of the country. Over the next three years, government will strike a balance between its commitment to fiscal consolidation and the need to increase spending on key areas to expand the economy’s long-term growth potential. This will be achieved through maintaining the expenditure ceiling, reprioritising resources to areas where they are most needed, eliminating wasteful expenditure and adopting rigorous cost-containment measures in every aspect of public spending. |
92
7
Provincial and local government
In brief
| • | | The 2014 division of revenue allocates 47.5 per cent of nationally raised revenue to national departments, 43.5 per cent to provinces and 9 per cent to municipalities. |
| • | | In addition to large baseline allocations over the medium-term expenditure framework (MTEF) period, further support is provided to roll out new vaccines, expand the antiretroviral programme, upgrade informal settlements, eradicate bucket sanitation, develop more integrated human settlements and fund inflation-linked provincial wage increases. |
| • | | In line with the goals of the National Development Plan (NDP), government is providing cities with incentives to change the way they plan infrastructure so that developments lead to more integrated, compact and efficient urban environments. |
| | |
¢ Overview | | |
| |
| Provincial and local governments play critical and complementary roles in eliminating poverty and reducing inequality. Provincial health, education and housing functions support the development of healthy communities, and lay the foundations for faster economic growth. Municipalities deliver basic services such as water, electricity, sanitation and solid waste removal. Both provinces and municipalities manage extensive public road networks, and support or provide public transport services. They also directly manage aspects of planning and regulatory systems that control land use, influence infrastructure rollout and facilitate economic activity. | | Provincial and local governments play critical roles in eliminating poverty and reducing inequality |
| |
| Over the past 20 years, there has been a broad expansion of access to public services. The 2014 Budget allocates 52.5 per cent of nationally raised resources to provinces and local government, and complements these allocations with measures to improve service-delivery capacity. In addition, provinces and municipalities raise their own revenue, which accounts respectively for 3 per cent and 73 per cent of their total revenue. | | |
93
2014 BUDGET REVIEW
The evolution of South Africa’s intergovernmental fiscal system
South Africa has made important strides in building its intergovernmental fiscal system over the past 20 years.
| • | | General budget and financial management reforms: Legislation, including the Public Finance Management Act (1999) and Municipal Finance Management Act (2003), modernised public financial management and enhanced transparency and accountability. |
| • | | Budget preparation: Government’s three-year medium-term expenditure framework (MTEF) provides greater certainty and promotes financial discipline in all three spheres of government. |
| • | | Budget implementation: Once a budget is adopted by the legislature, it becomes a law that all officials are required to implement, with limited opportunity for deviation. Departments are required to report on actual revenue and expenditure on a monthly and quarterly basis. Annual financial statements are audited and, along with monthly and quarterly reports, are available to the public. |
As with any system that is still maturing, some challenges remain.
| • | | Concurrent functions: National government’s role is to formulate policy, and develop norms and standards; provinces and municipalities are mainly responsible for implementation. In practice the lines of responsibility and accountability are often blurred. These challenges can be overcome through institutional frameworks that allow for greater coordination. |
| • | | Compliance: Gaps are evident in the system, with a high number of adverse audit outcomes, service-delivery failures due to underspending on infrastructure and maintenance, and escalating operating costs due to inadequate controls. Various initiatives are under way to address these gaps, including strengthening national oversight, expenditure reviews and financial management capacity development. |
| | |
| | The bulk of government’s infrastructure spending takes place in local and provincial government. Public services have not yet reached all South Africans, and in some areas, poor maintenance has resulted in either loss of services or deterioration in quality. Addressing these challenges is a priority in the 2014 Budget. |
| | ¢ Division of revenue |
| |
| Provinces and municipalities receive 52.5 per cent of the division of revenue | | The Constitution requires a division of nationally raised resources between national, provincial and local government. This is done through the Division of Revenue Bill, which is tabled with the national budget. Over the MTEF period ahead, national department allocations total 47.5 per cent of available funds after debt costs and the contingency reserve have been provided for, provincial allocations total 43.5 per cent and local government allocations total 9 per cent. |
| |
| | Provinces are responsible for social services like education, health and social development; economic functions like agriculture and roads; and provincial governance and administration which include the legislature, provincial treasury, local government and human settlements. |
| |
| | Local government is responsible for water and sanitation, electricity reticulation, refuse removal, storm water management and municipal transport and roads. Local government is also responsible for community services (such as parks, sport and recreation, municipal roads and street lighting). To reduce the cost of living for poor households, the provision of free or subsidised services is also paid for by local and provincial government. |
| |
| | Transfers to provinces and local government are made through the equitable share and conditional grants. The equitable shares are determined by formulas that take into account demographic and developmental factors. Conditional grants are designed to achieve specific objectives, and provinces and municipalities must fulfil certain conditions to receive them. |
94
CHAPTER 7: PROVINCIAL AND LOCAL GOVERNMENT
| | |
| Table 7.1 summarises the division of revenue for the 2014 Budget, taking into account the revenue-raising capacities and spending responsibilities of each level of government. | | |
Table 7.1 Division of nationally raised revenue, 2010/11 – 2016/17
| | | | | | | | | | | | | | | | | | | | | | | | | | | | |
| | | 2010/11 | | | 2011/12 | | | 2012/13 | | | 2013/14 | | | 2014/15 | | | 2015/16 | | | 2016/17 | |
R million | | Outcome | | | Revised
estimate | | | Medium-term estimates | |
Division of available funds | | | | | | | | | | | | | | | | | | | | | | | | | | | | |
National departments | | | 356 027 | | | | 382 712 | | | | 412 706 | | | | 449 251 | | | | 489 424 | | | | 522 257 | | | | 552 983 | |
of which: | | | | | | | | | | | | | | | | | | | | | | | | | | | | |
Indirect transfers to provinces | | | — | | | | 76 | | | | 860 | | | | 2 693 | | | | 5 413 | | | | 5 044 | | | | 4 127 | |
Indirect transfers to local government | | | 2 939 | | | | 2 770 | | | | 4 956 | | | | 5 697 | | | | 7 726 | | | | 9 467 | | | | 10 221 | |
Provinces | | | 322 822 | | | | 362 488 | | | | 388 238 | | | | 414 932 | | | | 444 423 | | | | 477 639 | | | | 508 254 | |
Equitable share | | | 265 139 | | | | 291 736 | | | | 313 016 | | | | 338 937 | | | | 362 468 | | | | 387 967 | | | | 412 039 | |
Conditional grants | | | 57 682 | | | | 70 753 | | | | 75 222 | | | | 75 995 | | | | 81 955 | | | | 89 672 | | | | 96 215 | |
Local government | | | 60 904 | | | | 68 251 | | | | 76 430 | | | | 83 670 | | | | 90 815 | | | | 100 047 | | | | 105 187 | |
Equitable share | | | 30 541 | | | | 33 173 | | | | 37 139 | | | | 39 789 | | | | 44 490 | | | | 50 208 | | | | 52 869 | |
Conditional grants | | | 22 821 | | | | 26 505 | | | | 30 251 | | | | 34 268 | | | | 36 135 | | | | 39 181 | | | | 41 094 | |
General fuel levy sharing with metropolitan municipalities | | | 7 542 | | | | 8 573 | | | | 9 040 | | | | 9 613 | | | | 10 190 | | | | 10 659 | | | | 11 224 | |
| | | | | | | | | | | | | | | | | | | | | | | | | | | | |
Non-interest allocations | | | 739 752 | | | | 813 451 | | | | 877 374 | | | | 947 853 | | | | 1 024 662 | | | | 1 099 943 | | | | 1 166 424 | |
Percentage increase | | | 7.2 | % | | | 10.0 | % | | | 7.9 | % | | | 8.0 | % | | | 8.1 | % | | | 7.3 | % | | | 6.0 | % |
| | | | | | | | | | | | | | | | | | | | | | | | | | | | |
Debt-service costs | | | 66 227 | | | | 76 460 | | | | 88 121 | | | | 101 256 | | | | 114 901 | | | | 126 647 | | | | 139 201 | |
Contingency reserve | | | — | | | | — | | | | — | | | | — | | | | 3 000 | | | | 6 000 | | | | 18 000 | |
| | | | | | | | | | | | | | | | | | | | | | | | | | | | |
Main budget expenditure | | | 805 979 | | | | 889 911 | | | | 965 496 | | | | 1 049 109 | | | | 1 142 562 | | | | 1 232 590 | | | | 1 323 624 | |
Percentage increase | | | 7.9 | % | | | 10.4 | % | | | 8.5 | % | | | 8.7 | % | | | 8.9 | % | | | 7.9 | % | | | 7.4 | % |
| | | | | | | | | | | | | | | | | | | | | | | | | | | | |
Percentage shares | | | | | | | | | | | | | | | | | | | | | | | | | | | | |
National departments | | | 48.1 | % | | | 47.0 | % | | | 47.0 | % | | | 47.4 | % | | | 47.8 | % | | | 47.5 | % | | | 47.4 | % |
Provinces | | | 43.6 | % | | | 44.6 | % | | | 44.2 | % | | | 43.8 | % | | | 43.4 | % | | | 43.4 | % | | | 43.6 | % |
Local government | | | 8.2 | % | | | 8.4 | % | | | 8.7 | % | | | 8.8 | % | | | 8.9 | % | | | 9.1 | % | | | 9.0 | % |
| | |
| In 2012/13, national expenditure amounted to R965.5 billion (including transfers to provinces and municipalities) out of a total adjusted appropriation of R971.5 billion. This represents underspending of 0.6 per cent compared with 1.1 per cent in 2011/12. Provincial government underspent its adjusted budget of R402.7 billion for 2012/13 by R7.5 billion (1.9 per cent), compared with underspending of R4.9 billion (1.3 per cent) in the previous year. Municipalities spent R19.4 billion or 84.6 per cent, of their infrastructure grants in the 2012/13 municipal financial year, up from 78.5 per cent in 2011/12. | | Provinces spent 98.1 per cent of their budgets; municipalities spent 84.6 per cent their infrastructure grants |
| |
| The Explanatory Memorandum to the Division of Revenue sets out the provincial and municipal allocations, details the equitable share formula and explains how the division takes into account the recommendations of the Financial and Fiscal Commission. The memorandum is available as Annexure W1 of the Budget Review on the National Treasury website (www.treasury.gov.za). | | |
95
2014 BUDGET REVIEW
| | |
| | ¢ Transfers to provinces |
| |
| Provinces account for 97 per cent of total government spending on health | | Provincial departments have limited revenue-raising powers, with 97 per cent of their spending financed through the division of revenue. Provinces account for 97 per cent of total government spending on health, 82 per cent of government spending on education and 11 per cent of government spending on social development. To finance these and other priorities, provincial governments are allocated 43.4 per cent of nationally raised revenue in 2014/15. |
| |
| | Table 7.2 Provincial equitable share, 2014/15 – 2016/17 |
| | | | | | | | | | | | |
R million | | 2014/15 | | | 2015/16 | | | 2016/17 | |
Eastern Cape | | | 52 154 | | | | 55 389 | | | | 57 876 | |
Free State | | | 20 883 | | | | 22 223 | | | | 23 158 | |
Gauteng | | | 68 673 | | | | 74 214 | | | | 80 244 | |
KwaZulu-Natal | | | 78 138 | | | | 83 348 | | | | 87 887 | |
Limpopo | | | 43 274 | | | | 46 109 | | | | 48 622 | |
Mpumalanga | | | 29 355 | | | | 31 449 | | | | 33 728 | |
Northern Cape | | | 9 652 | | | | 10 277 | | | | 10 941 | |
North West | | | 24 707 | | | | 26 528 | | | | 28 386 | |
Western Cape | | | 35 631 | | | | 38 431 | | | | 41 196 | |
| | | | | | | | | | | | |
Total | | | 362 468 | | | | 387 967 | | | | 412 039 | |
| | | | | | | | | | | | |
| | |
| | Health, education, and social development services account for over three- quarters of provincial spending. These are labour-intensive services and as a result, more than 60 per cent of provincial budgets are spent on compensation of employees. |
Reducing costs and increasing value for money
During 2013, the National Treasury and its provincial counterparts conducted joint expenditure reviews. The reviews identified areas where inefficient operations can be improved to increase value for money and ensure spending on policy priorities. The review process has shown that:
| • | | Efficiencies in the supply of learning and teaching support materials vary widely, underlining the need to adopt best practice across all provinces. |
| • | | Tracking and management of medicines is often poor. Improvements in this area would reduce waste by removing expired medicines from circulation and ensuring the availability of sufficient quantities of drugs. |
| • | | Better management of internal requisition procedures at hospitals and clinics would reduce unnecessary laboratory tests. |
| • | | High lease costs, poor management of rentals and the absence of reliable immovable asset registers in some provinces inflate property costs. |
| • | | Numerous development agencies duplicate the work of departments. The mandates of these corporations are often unclear and there is poor monitoring of public entities by most provincial treasuries. |
The Minister of Finance has written to the premiers and finance MECs to outline suggested improvements in each province. The initial results of these efforts should be seen when provinces table their 2014/15 budgets.
| | |
| Most additions to equitable share fund inflation-linked wage increases | | Table 7.3 shows conditional grants to provinces over the three-year spending period ahead. The largest component of transfers to provinces is the equitable share, accounting for 82 per cent of direct transfers. Over the next three years, the provincial equitable share is projected to grow by an average of 6.7 per cent a year. The 2014 MTEF adds R12 billion to the provincial equitable share baseline. Of this, R11.6 billion is for personnel adjustments to provide for the carry-through costs of higher-than- anticipated inflation on personnel budgets and the upgrade of clerical positions. |
96
CHAPTER 7: PROVINCIAL AND LOCAL GOVERNMENT
Table 7.3 Conditional grants to provinces, 2013/14 – 2016/17
| | | | | | | | | | | | | | | | | | | | |
R million | | 2013/14 | | | 2014/15 | | | 2015/16 | | | 2016/17 | | | MTEF total | |
Provincial equitable share | | | 338 937 | | | | 362 468 | | | | 387 967 | | | | 412 039 | | | | 1 162 474 | |
Direct conditional grants | | | 75 995 | | | | 81 955 | | | | 89 672 | | | | 96 215 | | | | 267 842 | |
Comprehensive agricultural support programme | | | 1 604 | | | | 1 861 | | | | 1 688 | | | | 1 757 | | | | 5 306 | |
Ilima/Letsema projects | | | 438 | | | | 461 | | | | 482 | | | | 507 | | | | 1 450 | |
Land care programme: poverty relief and infrastructure development | | | 109 | | | | 68 | | | | 68 | | | | 72 | | | | 208 | |
Community library services | | | 598 | | | | 1 016 | | | | 1 341 | | | | 1 412 | | | | 3 768 | |
Dinaledi schools | | | 109 | | | | 111 | | | | 116 | | | | 122 | | | | 350 | |
Education infrastructure | | | 6 160 | | | | 6 929 | | | | 9 469 | | | | 10 038 | | | | 26 436 | |
HIV and Aids (life skills education) | | | 204 | | | | 221 | | | | 226 | | | | 238 | | | | 686 | |
National school nutrition programme | | | 5 173 | | | | 5 462 | | | | 5 704 | | | | 6 006 | | | | 17 172 | |
Technical secondary schools recapitalisation | | | 190 | | | | 233 | | | | 244 | | | | 257 | | | | 735 | |
Occupational-specific dispensation for education sector therapists | | | — | | | | 213 | | | | 67 | | | | — | | | | 280 | |
Provincial disaster | | | 38 | | | | 197 | | | | 204 | | | | 215 | | | | 617 | |
Comprehensive HIV and Aids | | | 10 534 | | | | 12 311 | | | | 13 957 | | | | 15 697 | | | | 41 965 | |
Health facility revitalisation | | | 5 291 | | | | 5 240 | | | | 5 389 | | | | 5 652 | | | | 16 281 | |
Health professions training and development | | | 2 190 | | | | 2 322 | | | | 2 429 | | | | 2 557 | | | | 7 308 | |
National tertiary services | | | 9 620 | | | | 10 168 | | | | 10 636 | | | | 11 200 | | | | 32 004 | |
National health insurance | | | 51 | | | | 70 | | | | 74 | | | | 78 | | | | 222 | |
Further education and training colleges | | | 2 454 | | | | 2 631 | | | | 2 819 | | | | 2 974 | | | | 8 424 | |
Human settlements development | | | 17 028 | | | | 17 084 | | | | 18 533 | | | | 20 410 | | | | 56 027 | |
Expanded public works programme integrated grant for provinces | | | 357 | | | | 349 | | | | 357 | | | | 412 | | | | 1 117 | |
Social sector expanded public works programme incentive for provinces | | | 258 | | | | 258 | | | | 268 | | | | 375 | | | | 900 | |
Substance abuse treatment | | | — | | | | 29 | | | | 48 | | | | 48 | | | | 124 | |
Mass participation and sport development | | | 498 | | | | 526 | | | | 550 | | | | 579 | | | | 1 654 | |
Provincial roads maintenance | | | 8 538 | | | | 9 361 | | | | 9 952 | | | | 10 292 | | | | 29 606 | |
Public transport operations | | | 4 553 | | | | 4 833 | | | | 5 053 | | | | 5 318 | | | | 15 203 | |
| | | | | | | | | | | | | | | | | | | | |
Total direct transfers | | | 414 932 | | | | 444 423 | | | | 477 639 | | | | 508 254 | | | | 1 430 316 | |
| | | | | | | | | | | | | | | | | | | | |
Indirect transfers | | | 2 693 | | | | 5 413 | | | | 5 044 | | | | 4 127 | | | | 14 583 | |
| | | | | | | | | | | | | | | | | | | | |
School infrastructure backlogs | | | 1 956 | | | | 2 939 | | | | 2 433 | | | | 2 611 | | | | 7 982 | |
National health | | | 731 | | | | 1 575 | | | | 1 635 | | | | 1 516 | | | | 4 726 | |
2014 African Nations Championship health and medical services | | | 6 | | | | — | | | | — | | | | — | | | | — | |
Human settlements development | | | — | | | | 899 | | | | 975 | | | | — | | | | 1 875 | |
| | |
| Government’s expenditure ceiling means that small adjustments have been made to several grants to accommodate spending pressures, most of which relate to compensation of employees. National and provincial departments worked with the National Treasury to identify programmes and grants where such reductions would have the least impact on service delivery. Details of the changes to conditional grants are contained in Annexure W1. | | |
| |
| Provinces spend more than 40 per cent of their budgets on education services, which will amount to R597 billion over the next three years. Over the three-year spending period, R159.9 million is added to the further education and training colleges grant for the increased cost of compensation of employees due to higher-than-anticipated inflation. A new grant of R280 million will fund the costs of occupation-specific dispensation agreements for therapists in the education system. The latter grant will run for two years before being incorporated into the provincial equitable share. | | Provincial education budget of R597 billion over next three years |
97
2014 BUDGET REVIEW
| | |
| | Provinces spend more than 30 per cent of their budgets on health services, which will amount to R446 billion over the next three years. An additional R1 billion has been made available for the comprehensive HIV and AIDS grant in 2016/17 to expand antiretroviral treatment. A total of 2.5 million people are currently receiving antiretroviral treatment and some 500 000 are expected to join the programme in each of the next three years. The prevention of mother-to-child transmission programme has reduced transmission rates to 2 per cent; alongside new child vaccines, this has contributed to improvements in infant and child mortality. |
| |
| New vaccine to reduce cancer of the cervix to be rolled out | | An amount of R200 million per year is made available for the rollout of a new vaccine to reduce cancer of the cervix, which is the cause of 20 per cent of cancer deaths among South African women. These funds will be managed through an indirect grant in 2014/15 and 2015/16 and transferred through the provincial equitable share from 2016/17. The vaccine is expected to prevent about 2 500 deaths and 4 800 new cases per year. |
Reducing corruption in provinces
The Accountant-General has conducted numerous forensic investigations into alleged irregularities and financial misconduct in the public service. Similar capacity is being established in all provincial treasuries.
Examples of these efforts to date include the following:
| • | | In Limpopo, 27 forensic investigations have led to more than 300 cases being opened. Two heads of department and the director-general of the province were suspended, and 45 officials have been charged. |
| • | | In Free State, five officials were dismissed as a result of an illegal roads procurement scheme, six were suspended from the human settlements department and other investigations are under way. |
In provincial public works departments there are concerns about corruption, abuse and charging inflated prices for infrastructure projects. Provinces are taking actions to end such practices. In Mpumalanga and North West, heads of the human settlements and public works departments have been suspended and charged. In the Eastern Cape, public works officials have been suspended.
The National Treasury is working on two measures to reduce the scope for corruption. The first is a proposal to amend the Treasury regulations to ensure that procurement plans are completed and submitted to national departments for assessment and approval before funds are made available. The second is an initiative by the Chief Procurement Officer to help provinces review contracts, compile a standard pricing guideline and promote more transversal contracting to reduce the number of tenders being issued and points where decisions are made. This, in turn, will reduce opportunities for manipulating supply chain management.
The National Treasury provides assistance to individual departments that wish to conduct their own investigations, and participates in the work of the Anti-Corruption Task Team.
| | |
| | In collaboration with community organisations, provinces will spend R50 billion over the MTEF to provide social development services that directly benefit the most vulnerable members of society. Over the next three years, funds are added to the provincial equitable share to expand the reach of shelters for victims of gender-based violence. A new conditional grant is introduced to establish substance-abuse treatment centres in the four provinces that do not have such public facilities. |
| |
| Additional support to upgrade informal settlements in mining towns | | Over the next two years, R1.9 billion has also been set aside from the human settlements development grant to provinces to create an indirect grant to upgrade sanitation infrastructure. In addition, R180 million is added to the human settlements development grant to accelerate the upgrading of informal settlements in mining towns, on top of the R1.1 billion added for this purpose in the 2013 MTEF. |
98
CHAPTER 7: PROVINCIAL AND LOCAL GOVERNMENT
| | |
| Provincial departments of roads, transport and public works made capital investments amounting to R9.8 billion in 2012/13. Reforms to provincial conditional grants require the authorities to measure and record road conditions and usage. Accurate, up-to-date records will help target spending on high-use roads or those in need of maintenance. Over time, this approach should result in faster travel times and lower transport costs. | | Conditional grant encourages measurements of road usage and conditions |
| |
| National government will provide R15.2 billion over the three-year spending period to subsidise provincial bus lines that serve commuters and learners. This includes an additional R150 million to offset rising fuel and labour costs. Provinces also contribute to the costs of these services though their own funds, which provides an incentive to improve efficiency. | | |
| |
| Individual provinces also undertake local economic development projects. Provinces play a key role in supporting small farmers and beneficiaries of the land reform programme. In 2014/15, the Department of Agriculture will allocate 70 per cent of its largest conditional grant to provinces – the comprehensive agricultural support grant – to provide small farmers with crop and livestock support. | | Comprehensive agricultural support grant provides small farmers with crop and livestock support |
| |
| Over the three-year spending period ahead, provinces are allocated R147.6 billion through direct and indirect grants for infrastructure, mainly for health, education, roads and housing. | | |
Indirect grants play growing role in delivering infrastructure and services
An indirect grant allows a national department to perform a function (such as building infrastructure) on behalf of a province or municipality. No funds are transferred, but any infrastructure built is transferred to provincial or municipal ownership. Service-level agreements stipulate that the beneficiary must maintain the new facility.
Growth in indirect grants has accelerated markedly in recent years. This reflects government’s intention to ensure delivery takes place while it is developing more institutional capacity. As provinces and municipalities improve their ability to spend funds efficiently, indirect grants may be converted back to direct grants. Over the MTEF period, R1.3 billion is shifted from the provincial indirect national health grant to the direct health facility revitalisation grant.
Provinces
In 2014/15, R82 billion will be transferred to provinces through direct conditional grants and R5.4 billion will be spent on their behalf through indirect grants, most of which are for schools and health facilities. Indirect grants make up 6.2 per cent of grants to provinces, compared with 3.4 per cent in the previous year.
Local government
In 2014/15, R36.1 billion will be transferred to municipalities through direct conditional grants and R7.7 billion will be spent on their behalf through indirect grants. Indirect grants make up 17.6 per cent of conditional grants to municipalities, compared with 14.3 per cent in the previous year.
A number of municipal grants have had funds shifted to their indirect components, or have had new indirect grant components created over the spending period ahead:
| • | | R460 million is shifted from the direct integrated national electrification programme grant to its indirect component, implemented by Eskom. Funds were reduced from municipalities with weak past performance and the additions should enable Eskom to increase its rollout by 30 000 households. |
| • | | R3.3 billion is shifted into a new indirect component of the municipal water infrastructure grant through which the Department of Water Affairs will implement water supply projects. |
| • | | R132.8 million is shifted to the indirect component of the rural households infrastructure grant. |
| | |
| Weak planning is one of the main contributors to delays and underspending on infrastructure projects. Government is adopting a new approach, with stringent planning requirements for infrastructure grants in education and health. | | |
99
2014 BUDGET REVIEW
| | |
| Provinces need to bid for allocations using infrastructure management delivery system | | These changes follow a decade of building capacity in provincial departments of health, education and public works through the Infrastructure Delivery Improvement Programme. This initiative resulted in average spending improving from about 85 per cent in 2006 to 95 per cent in 2012 – a period during which provincial infrastructure budgets more than doubled. The programme also developed a system to manage infrastructure delivery based on international standards and customised for domestic use. Conditional grant reforms that took effect in 2013/14 require provinces to bid for allocations using the planning requirements set out in the new system. Provinces that do so will receive financial incentives. |
| |
| | ¢ Transfers to local government |
| |
| National transfers are particularly important for poor and rural municipalities | | Local government raises revenue in the form of charges and taxes, and as a result only 27 per cent of their spending is financed through the division of revenue. There are, however, significant disparities in municipal tax bases, and national transfers are particularly important for poor and rural municipalities. The country’s eight metropolitan municipalities have projected budgets totalling R196.9 billion in 2014/15, of which 17 per cent is funded through nationally raised revenue. In contrast, in the same year, the 70 most rural local municipalities have total projected budgets of R17.1 billion, 73 per cent of which is funded by national transfers. |
| |
| | The new local government equitable share formula supports municipalities with lower revenue-raising potential. As a result, over 50 per cent of 2014/15 allocations go to the more rural local and district municipalities. |
| |
| | Transfers to municipalities stabilise at about 9 per cent of the total division of revenue over the MTEF period, up from 3 per cent in 2000/01. Between 2000/01 and 2013/14, the equitable share for local government grew at an annual average rate of 22.9 per cent, and over the MTEF is projected to grow by 10.4 per cent. |
| |
| Substantial resources directed towards provision of water, sanitation and electricity | | To lower the costs of basic services, the local government equitable share allocates a subsidy of R293 per poor household per month. This amount supports the provision of free basic amounts of electricity, water, sanitation and refuse removal to the 59 per cent of households with a monthly income below R2 300. The equitable share, which totals R147.6 billion over the MTEF, also provides funds for administration and community services in municipalities that are unable to fund these from their own revenues. |
| |
| | Infrastructure |
| |
| | Of the R104.6 billion allocated to municipal infrastructure grants over the MTEF period, 44.4 per cent is allocated to metropolitan municipalities and 32.1 per cent to the 70 most rural local municipalities and the district municipalities that provide services in these rural areas. |
100
CHAPTER 7: PROVINCIAL AND LOCAL GOVERNMENT
Improving audit outcomes and reducing corruption in municipalities
Audit findings
Municipalities that receive unqualified audits (with or without findings) generally have good financial management practices in place. In 2011/12, 117 municipalities were in this category (42 per cent), while 9 received unqualified without any findings (often referred to as “clean audits”). In the latest audit findings (2012/13), 122 municipalities were in the unqualified audit category (44 per cent) and 20 municipalities received unqualified audits without findings.
While the latest audit outcomes exhibit marginal improvement, they also underline the need for continued improvement in municipal financial management.
The Auditor-General has identified two factors common to those municipalities that have improved their audit outcomes. First, where political and administrative leadership work together to implement and monitor internal controls, good governance is achievable. Second, identifying the processes and systems that directly affect audit findings allows financial managers to design successful direct interventions.
Reducing corruption
Over the past year, some municipalities have taken additional steps to root out fraud, theft and corruption. Examples include the following:
| • | | Buffalo City has improved its internal controls and fraud prevention techniques, and since December 2012 has dismissed eight officials. |
| • | | Johannesburg has developed a city-wide anti-corruption and anti-fraud strategy, leading to the arrest of 10 officials. |
| • | | eThekwini is conducting 125 internal investigations related to procurement fraud allegations, noncompliance with supply chain management regulations and financial misconduct by employees. |
| • | | Since January 2013, Mangaung Metropolitan Municipality has dismissed three employees for fraud. |
| | |
| While much has been achieved in the rollout of municipal infrastructure over the last decade, significant work remains to be done, both to eradicate backlogs in access to services, and to ensure that services are properly operated and maintained over the long term. | | |
| |
| In some areas, there has been widespread waste and inefficiency, or slow service delivery. In certain cases, provision of grant financing may have weakened incentives to obtain other financing. A review of the effectiveness of existing infrastructure grant structures is under way to determine how the system can be improved. This collaborative initiative involves the Financial and Fiscal Commission, the South African Local Government Association and the National Treasury, and will draw on extensive consultation with municipalities and relevant national departments. Proposed changes to infrastructure grants flowing from the review could be implemented from 2015/16. | | Review of existing grant structures is under way to improve performance |
| |
| This review will support the comprehensive reform of the municipal infrastructure conditional grant system. Some reforms have already been introduced to respond to the needs of different types of municipalities: | | Reforms have been introduced to respond to the needs of different types of municipalities |
• Grants targeted at metropolitan and larger urban municipalities include the urban settlements development grant, integrated city development grant, municipal human settlements capacity grant and public transport infrastructure grant. | |
| |
• Metropolitan and larger urban municipalities are expected to use a combination of grant funds and their own revenue to upgrade informal settlements. The urban settlements development grant, amounting to R32.2 billion over the MTEF period, is an integrated source of funding to upgrade urban informal settlements in the eight metropolitan municipalities. In addition to the funds made available through an indirect grant to provinces to provide for decent sanitation, conditions | | |
101
2014 BUDGET REVIEW
| | |
| | have been added to the municipal infrastructure grant and the urban settlements development grant to ensure that recipient municipalities eradicate bucket toilets. |
| |
| | • The neighbourhood development partnership grant funds projects in townships where historically underserved communities can be connected to the wider city economy through transport corridors. Working with municipalities, the partnership has completed 179 projects, with 81 under construction. Examples include the Bridge City precinct in eThekwini, Bara Central, and the Mitchells Plain central business district and transport interchange. In future, the portion of the grant targeted at rural municipalities will focus on 23 township nodes. |
Table 7.4 Infrastructure transfers to local government, 2010/11 – 2016/17
| | | | | | | | | | | | | | | | | | | | | | | | | | | | |
| | | 2010/11 | | | 2011/12 | | | 2012/13 | | | 2013/14 | | | 2014/15 | | | 2015/16 | | | 2016/17 | |
R million | | Outcome | | | Revised
estimate | | | Medium-term estimates | |
Equitable share and related | | | 30 541 | | | | 33 173 | | | | 37 139 | | | | 39 789 | | | | 44 490 | | | | 50 208 | | | | 52 869 | |
General fuel levy sharing with metros | | | 7 542 | | | | 8 573 | | | | 9 040 | | | | 9 613 | | | | 10 190 | | | | 10 659 | | | | 11 224 | |
Direct conditional grants | | | 22 822 | | | | 26 505 | | | | 30 251 | | | | 34 268 | | | | 36 135 | | | | 39 181 | | | | 41 094 | |
Municipal infrastructure | | | 9 704 | | | | 11 443 | | | | 13 879 | | | | 14 355 | | | | 14 684 | | | | 15 098 | | | | 15 767 | |
Municipal water infrastructure | | | — | | | | — | | | | — | | | | 403 | | | | 534 | | | | 1 380 | | | | 1 302 | |
Urban settlements development | | | 4 968 | | | | 6 267 | | | | 7 392 | | | | 9 077 | | | | 10 285 | | | | 10 655 | | | | 11 232 | |
Integrated national electrification programme | | | 1 033 | | | | 1 097 | | | | 1 151 | | | | 1 635 | | | | 1 105 | | | | 2 056 | | | | 2 165 | |
Public transport infrastructure | | | 3 700 | | | | 4 612 | | | | 4 884 | | | | 4 669 | | | | 4 968 | | | | 5 098 | | | | 5 104 | |
Neighbourhood development partnership | | | 832 | | | | 738 | | | | 578 | | | | 598 | | | | 591 | | | | 600 | | | | 632 | |
Integrated city development | | | — | | | | — | | | | — | | | | 40 | | | | 255 | | | | 266 | | | | 293 | |
Rural roads asset management systems | | | 10 | | | | 35 | | | | 37 | | | | 52 | | | | 75 | | | | 98 | | | | 103 | |
Rural households infrastructure | | | — | | | | — | | | | — | | | | 107 | | | | 48 | | | | 51 | | | | 125 | |
Municipal disaster recovery | | | 320 | | | | 450 | | | | — | | | | 118 | | | | 37 | | | | 22 | | | | — | |
Municipal systems improvement | | | 212 | | | | 220 | | | | 230 | | | | 240 | | | | 252 | | | | 261 | | | | 275 | |
Local government financial management | | | 365 | | | | 385 | | | | 403 | | | | 425 | | | | 449 | | | | 470 | | | | 495 | |
Municipal human settlements capacity | | | — | | | | — | | | | — | | | | — | | | | 300 | | | | 300 | | | | 300 | |
Public transport network operations | | | — | | | | — | | | | — | | | | 881 | | | | 903 | | | | 1 043 | | | | 1 362 | |
Other direct grants | | | 1 676 | | | | 1 257 | | | | 1 696 | | | | 1 668 | | | | 1 649 | | | | 1 783 | | | | 1 940 | |
| | | | | | | | | | | | | | | | | | | | | | | | | | | | |
Total direct transfers | | | 60 905 | | | | 68 251 | | | | 76 430 | | | | 83 670 | | | | 90 815 | | | | 100 047 | | | | 105 187 | |
| | | | | | | | | | | | | | | | | | | | | | | | | | | | |
Indirect transfers | | | 2 939 | | | | 2 770 | | | | 4 956 | | | | 5 697 | | | | 7 726 | | | | 9 467 | | | | 10 221 | |
Integrated national electrification programme | | | 1 720 | | | | 1 165 | | | | 1 879 | | | | 2 141 | | | | 2 948 | | | | 3 680 | | | | 3 875 | |
Neighbourhood development partnership | | | 50 | | | | 50 | | | | 80 | | | | 55 | | | | 58 | | | | 55 | | | | 52 | |
Regional bulk infrastructure | | | 851 | | | | 1 260 | | | | 2 523 | | | | 3 261 | | | | 3 987 | | | | 4 222 | | | | 4 624 | |
Municipal water infrastructure | | | — | | | | — | | | | — | | | | — | | | | 525 | | | | 1 292 | | | | 1 512 | |
Rural households infrastructure | | | 62 | | | | 78 | | | | 341 | | | | 101 | | | | 66 | | | | 67 | | | | — | |
Other indirect grants | | | 257 | | | | 217 | | | | 133 | | | | 139 | | | | 142 | | | | 151 | | | | 159 | |
102
CHAPTER 7: PROVINCIAL AND LOCAL GOVERNMENT
| | |
| Differentiating support to urban and rural municipalities was instrumental in reducing rural electricity backlogs by 42 per cent and cutting rural water backlogs by 27 per cent between 2001 and 2011. Rural areas continue to face the most significant service-delivery backlogs, and financing arrangements acknowledging this will continue over the MTEF period. | | Over 10 years rural electricity backlogs fell by 42 per cent and water backlogs by 27 per cent |
| |
| The municipal infrastructure grant, which totals R45.5 billion over the three-year spending period and is the largest conditional grant to municipalities, has a formula that targets infrastructure backlogs in poor communities. The formula explicitly targets the 23 priority districts covering more rural municipalities. As a result 77 per cent of municipal infrastructure grant allocations in 2014/15 target rural municipalities. | | |
| |
| Several other infrastructure grants to local government have allocation criteria that favour rural areas – such as the municipal water infrastructure grant (direct and indirect grant), the integrated national electrification programme grant (direct and indirect grant) and the rural households infrastructure grant (direct and indirect grant) and the rural roads asset management systems grant (direct grant). A further R934 million has been added to the indirect regional bulk infrastructure grant over the MTEF period to accelerate provision of bulk water services. | | A range of infrastructure grants have allocation criteria that favour rural areas |
| |
| Building capacity in local government | | |
| |
| The 2014 Budget contributes to the NDP’s vision of building a capable state at local government level through various capacity-building programmes that support rural municipalities (urban municipalities are discussed in the next section). Over the 2014 MTEF more than R3.9 billion is allocated for this purpose: | | |
| |
• R2.6 billion in capacity-building conditional grants, mainly allocated to rural municipalities. | | |
| |
• R857.5 million for the Municipal Infrastructure Support Agency, which provides training and technical assistance. | | |
| |
• R405.4 million for the Municipal Financial Management Improvement Programme. | | |
| |
• R25 million to build capacity in 13 rural municipalities that receive the indirect component of the rural households infrastructure grant. | | |
| |
| To be effective, these resources need to be accompanied by political and administrative commitments to develop more capable institutions focused on service delivery, and to eliminate waste and corruption. | | |
| |
¢ Coordinated planning in the urban environment | | |
| |
| Since 1994, South Africa has experienced a wave of migration from the countryside to the cities. Urban areas are now home to just over 60 per cent of the population and account for nearly 80 per cent of GDP. | | |
| |
| South Africa’s cities face profound development challenges. Sprawling, highly polarised cities impose significant costs, limit opportunities for poor households to benefit from economic opportunities and public services, and retard community development. Well-planned urban development can boost economic activity, reduce the environmental consequences of sprawl and overcome inherited spatial distortions that marginalise poor communities. Over the next three years, national government and municipalities are working to accelerate this long-term shift in management of the urban landscape. | | Government and municipalities are working to accelerate a long-term shift in urban planning |
103
2014 BUDGET REVIEW
| | |
| | Cities fund more than 80 per cent of their spending from their own revenue. There are, however, large conditional grants available to cities for investments that contribute to transforming spatial dynamics and leveraging the growth opportunities that arise from more functional communities. The 2014 Budget supports these initiatives. While it will take decades to fully transform South Africa’s cities, the coordinated planning required to do so is beginning over the next three years. |
| |
| NDP recommends that responsibility for housing should shift to municipal level | | To improve coordination of urban programmes and establish clearer lines of accountability, the NDP recommends that responsibility for housing should shift to municipal level, where human settlement planning takes place. Government has agreed to develop planning and implementation capacity in municipal government. To this end, a municipal human settlements capacity grant is introduced from 2014/15. |
Investing to build productive, inclusive cities
The Cities Support Programme helps metropolitan municipalities to coordinate public investment in infrastructure, housing and transport to build more inclusive, productive and sustainable cities.
All metros are implementing major programmes to overcome dominant spatial patterns. Investment plans focus on defined areas. In Johannesburg, for example, “corridors of freedom” have been identified along major transport routes to link major commercial and residential nodes.
These corridors will be the focus of investments in bus rapid transit systems, funded through the public transport infrastructure grant. Transport investments will be complemented by direct investment in high-density residential housing stock, modified land use controls to enable higher-density private residential and business developments, and investments in bulk infrastructure. Community amenities such as libraries, police stations, clinics and other amenities are also part of the programme.
The Cities Support Programme will work with municipalities to maximise the opportunities arising from these investments. A project preparation facility to be introduced with the support of the Development Bank of Southern Africa will help cities build a pipeline of well-designed and catalytic projects.
| | |
| | A priority is to ensure that large, low-income communities on the urban edge are better connected to centres of economic and social activity through investment in transport and development corridors. This process will be speeded up as the urban housing and public transport functions are devolved to cities. |
| |
| | In 2013/14 government introduced the integrated city development grant. It provides a financial incentive for metropolitan municipalities to concentrate infrastructure funds to develop more compact urban environments. The grant receives an additional R356 million, bringing its total value to R814 million over the MTEF period. |
| |
| To receive integrated city development grant, municipalities must submit built environment plans | | From 2014/15, built environment performance plans will be a requirement for receiving the integrated city development grant. These performance plans support better coordination of investment and enhance the alignment of projects funded through various national grants. The built environment performance plans can help establish planning and funding certainty beyond municipal political cycles. |
| |
| | ¢ Conclusion |
| |
| | Over the past 20 years, government has overseen a large expansion of public health care, education, housing, and basic services such as water, |
104
CHAPTER 7: PROVINCIAL AND LOCAL GOVERNMENT
| | |
| electricity, sanitation and solid waste removal. Despite these achievements, much still needs to be done to eliminate poverty and reduce inequality. Weaknesses in capacity and performance are most pronounced in historically disadvantaged areas, where state intervention is most needed to improve people’s quality of life. | | |
| |
| South Africa can realise the goals of the NDP by drawing on the energies of its people, growing an inclusive economy, building capabilities, enhancing the capacity of the state, and promoting leadership and partnerships throughout society. The division of revenue for the next three years promotes these objectives. | | Division of revenue for next three years supports NDP objectives |
105
2014 BUDGET REVIEW
This page was left blank intentionally.
106
ANNEXURES
Three annexures are available on the National Treasury website (www.treasury.gov.za):
| • | | Annexure W1: Explanatory memorandum to the division of revenue |
| • | | Annexure W2: Structure of the government accounts |
| • | | Annexure W3: Strengthening trade and investment links with Africa |
107
2014 BUDGET REVIEW
108
A
Report of the Minister of Finance to Parliament
Section 7(4) of the Money Bills Amendment Procedure and Related Matters Act (2009, the act) prescribes that the Minister of Finance (the Minister) must submit a report to Parliament at the time of the budget explaining how the Division of Revenue Bill and the national budget give effect to, or the reasons for not taking into account, the recommendations contained in:
| • | | Budgetary review and recommendation reports submitted by committees of the National Assembly in terms of section 5 of the act. |
| • | | Reports on the fiscal framework proposed in the Medium Term Budget Policy Statement (MTBPS) submitted by the finance committees in terms of section 6 of the act. |
| • | | Reports on the proposed division of revenue and the conditional grant allocation to provinces and local governments set out in the MTBPS submitted by the appropriations committees in terms of section 6 of the act. |
| ¢ | Budgetary review and recommendation reports |
Section 5 of the act sets out a procedure to be followed by the National Assembly, through its committees, for assessing the performance of each national department before it introduces the national budget. This procedure provides for committees to prepare budgetary review and recommendation reports, which:
| • | | Must provide an assessment of the department’s service delivery performance given available resources. |
| • | | Must provide an assessment of the effectiveness and efficiency of the department’s use and forward allocation of available resources. |
| • | | May include recommendations on the forward use of resources. |
109
2014 BUDGET REVIEW
At the time of tabling the annual budget, the Minister is required to explain how the budget gives effect to these recommendations, or why they have not been taken into account.
The budgetary review and recommendation reports were tabled by the relevant portfolio committees in October and November 2013. Due to the large number of reports, a separate document will be tabled in Parliament with detailed responses to the portfolio committees’ recommendations. In many cases, however, the different committees have made the same recommendations to a number of departments. These overarching concerns are summarised below.
General issues
| • | | Recruitment and retention of skilled persons |
| • | | The urgent need to fill vacant posts, especially at senior management level and in critical or priority positions |
| • | | Departments should institute indicators and targets that are SMART – specific, measurable, achievable, realistic and time-bound |
| • | | Performance targets should be aligned with budgets and organisational structures |
| • | | Stricter adherence to the Public Finance Management Act (1999) and National Treasury regulations |
| • | | Supply chain management needs to be improved |
| • | | Departments must address concerns raised by the Auditor-General |
| • | | Improved cooperation across government |
| • | | Fraudulent or unethical behaviour should be eradicated |
| • | | Staff should be made accountable for unauthorised, irregular, fruitless or wasteful expenditure |
| • | | Departments’ objectives must be aligned with the National Development Plan |
| • | | Internal audit functions and governance structures should be adequately capacitated |
| • | | The funding arrangements of government entities should be reviewed |
| • | | Financial management must be improved and unqualified audits ensured |
| • | | Policies should be developed for the procurement, use and monitoring of consultants |
| • | | Information and communications technology should be upgraded |
| • | | Issues raised in previous budgetary review and recommendation reports should be addressed |
| • | | Performance agreements should be in place for staff at all departments |
| • | | Mechanisms are needed to monitor and evaluate government programmes. |
A number of committees also recommended that additional budget allocations be made available for certain programmes, sub-programmes or other budget items. Where these recommendations are supported by the relevant departments when weighed against other priorities, they will be taken into account in future budget discussions.
The following section comprises the Minister of Finance’s response to the other committee reports. In cases where different reports make the same recommendations, these are not repeated.
| ¢ | Recommendations of the Standing Committee on Appropriations on the 2013 MTBPS |
Education infrastructure
The National Treasury, in conjunction with the Department of Basic Education, should develop systems and mechanisms targeted specifically at enhancing the performance of schools infrastructure programmes such as the Accelerated Schools Infrastructure Development Initiative.
110
ANNEXURE A: REPORT OF THE MINISTER OF FINANCE TO PARLIAMENT
The National Treasury is supporting the national Department of Basic Education to improve infrastructure delivery in the sector through the Infrastructure Delivery Improvement Programme (IDIP). The IDIP supports the development of management systems and the building of human-resource capacity to enhance infrastructure delivery. The Department of Basic Education is a strategic partner of the programme and it has received technical assistance. The IDIP is in the design stage of its fourth phase. It is engaging with the department on the most appropriate support mechanisms needed to sustainably enhance delivery and capacity within its infrastructure delivery system.
Further education and training colleges
The National Treasury should develop and implement mechanisms to ensure that baseline funding requirements are in place for the successful transfer of the further education and training colleges function to the Department of Higher Education and Training.
The National Treasury agrees that baseline funding needs to be in place to ensure the successful transfer of the further education and training colleges from provinces to the Department of Higher Education and Training. This requires agreement between the nine provinces and national government on the shifting of funds, staff and assets, as well as formal consultation with the Financial and Fiscal Commission. Since 2010, the National Treasury has made extensive support available to the Department of Higher Education and Training, including through the Technical Assistance Unit, which completed a diagnostic report on the function shift. The National Treasury has also helped create a new conditional grant to ring-fence part of the funding for the function and has facilitated discussions with provincial treasuries through the Technical Committee on Finance.
A special committee, including provincial treasuries, will be established in 2014 to work with the heads of the Education Committee and the Council of Education Ministers to provide executive stewardship of the full funding shift of further education and training colleges on 1 April 2015 and adult education and training functions on 1 April 2016.
Expenditure reviews and grants
The National Treasury’s announced programme of expenditure reviews include an assessment of the performance of direct versus indirect conditional grants.
The National Treasury and the Department of Performance Monitoring and Evaluation are conducting a programme of expenditure reviews to examine spending in different sectors. Indirect grants that form part of a sector’s funding will be examined as part of the expenditure reviews. The National Treasury is also managing the review of all infrastructure grants to local government. This will include a review of the relative performance of different forms of grants, including direct and indirect grants.
Service quality in employment programmes
The National Treasury develops and incorporates spending conditions in respect of the Community Work Programme and other employment programmes that stipulate minimum standards of service quality for those non-governmental organisations and service providers implementing the programmes.
Using non-governmental organisations and other service providers to implement projects that fall within the Expanded Public Works Programme (such as the Community Work Programme) is an important part of the delivery model for public employment programmes, but it requires careful and constant oversight by the responsible departments. The National Treasury works on this and all other implementation issues with the Department of Public Works, the Department of Cooperative Governance and other departments involved with the Expanded Public Works Programme.
111
2014 BUDGET REVIEW
Quarterly expenditure reports
The National Treasury, in consultation with the Department of Performance Monitoring and Evaluation, includes performance on pre-determined objectives in its quarterly expenditure reports submitted to the Standing Committee on Appropriations.
The National Treasury is committed to evaluating the impact of government expenditure and recognises the need to further develop existing methodologies for doing so. Where the impact of government interventions can only be measured after some years, the link between performance and quarterly expenditure information is tenuous. Moreover, the collection of performance information is typically more complicated than that of financial data, which means that there is often a lag between the two that makes it hard to reconcile them on a quarterly basis. Where possible, the current reports discuss the purpose and impact of the expenditure, but the primary function of the quarterly expenditure reports is to provide a detailed breakdown of appropriated funds, and to clarify how they are being spent throughout the year.
Devolving human settlements
The Ministers of Finance and Human Settlements develop and implement a capacity enhancement and support initiative specifically aimed at the successful devolvement of the human settlements function to the six metropolitan municipalities.
The 2014 Budget includes a new conditional grant to fund the development of capacity to administer housing programmes in the six metropolitan municipalities assigned this function. The municipal human settlements capacity grant has an allocation of R900 million over the 2014 medium-term expenditure framework (MTEF) period and will be administered by the Department of Human Settlements.
| ¢ | Recommendations of the Standing Committee on Appropriations on the Adjustments Appropriation Bill |
Underspending and service delivery
The National Treasury should develop systems and mechanisms targeted specifically at ensuring that projected underspending does not compromise the service delivery performance targets.
Projected underspending figures published with the budget are estimates of the funds that are unlikely to be spent before the end of a financial year. Common reasons for this underspending include delays in departments’ work schedules due to, for example, adverse weather conditions, or the late submission of invoices. Departmental budgets are not reduced by these estimates, which means that departments can still access these funds should service delivery catch up with the original spending targets. The National Treasury examines departmental monthly and quarterly actual and projected spending data on an ongoing basis through its in-year monitoring system.
Rural households infrastructure grant
The National Treasury should consider re-scheduling the rural households infrastructure grant from a direct to an indirect grant.
The rural households infrastructure grant funds the construction of on-site sanitation facilities in rural areas where reticulated sewerage is not viable. Following engagements between the National Treasury and the Department of Human Settlements about how the performance of this programme can be improved, the 2014 Division of Revenue Bill includes both direct and indirect allocations for this programme. About 60 per cent of the grant will be an indirect grant through which the Department of
112
ANNEXURE A: REPORT OF THE MINISTER OF FINANCE TO PARLIAMENT
Human Settlements will install infrastructure in weaker municipalities, while 40 per cent will be transferred as a direct grant to municipalities with better capacity to implement projects. The Department of Human Settlements will also be responsible for developing capacity in municipalities receiving the indirect grant so that they can implement projects themselves in future. This approach will ensure skills transfer and create an incentive for municipalities to improve their performance.
Emergency Call Centre
The Minister of Finance should engage with the Minister of Communications on the appropriate budget for the 112 Emergency Call Centre project given the persistent shifting of funds away from the project.
Following a bilateral meeting, the two ministers noted the consistent underspending on the 112 Emergency Call Centre and agreed that its funding should be reprioritised towards the Digital Migration Strategy and broadband planning. These two programmes place significant pressure on the department’s budget.
| ¢ | Recommendations of the Select Committee on Appropriations on the Division of Revenue Amendment Bill |
Costs of the public service
The escalating costs of compensation of public service employees and funds spent on consultants need to be brought under control as there is no correlation between these costs and the provision of services to the poorest of the poor and underspending.
The National Treasury agrees with the committee. Spending on compensation of employees and consultants increased by an annual average of 12.6 per cent between 2008/09 and 2012/13, largely due to the introduction of the occupation-specific dispensation, higher wage settlements and a strong increase in public service employment during the economic downturn. Over the 2013 MTEF, expenditure on compensation of employees and consultants is expected to increase by an annual average of 6.2 per cent. However, as a percentage of total expenditure, spending on consultants and employees will fall from 35.4 per cent in 2012/13 to 34 per cent in 2015/16, while spending on other classes of expenditure will increase 1.1 per cent faster on average. The National Treasury will put mechanisms in place to monitor deployment of and spending on consultants to ensure that value for money is realised in this area.
Grant designs
Grant designs, capacity, monitoring and evaluation in government departments need to be improved on a continuous basis to ensure effective and efficient spending.
This recommendation is supported. The National Treasury provides extensive support for grant design and monitoring. Departments that are considering a new grant are provided with technical guidance on how to design, manage and monitor conditional grants. For existing grants, annual workshops on the Division of Revenue Act are held with all national transferring officers to discuss changes to the act, how the different provisions work, and what levers are available to grant managers to carry out their mandates. The National Treasury meets with national departments every quarter to review performance and assist departments with compliance issues. It also conducts annual training sessions with provinces and national departments on how to compile a business plan. National departments have committed substantial resources within their departments to the administration and monitoring of conditional grants.
113
2014 BUDGET REVIEW
Proper costing of business plans
The business plans and strategic plans of departments should be properly costed. Departments should refrain from budgeting for programmes that they know they may not be able to roll out, as these funds could be allocated to other government functions. The National Treasury should ensure that there is compliance with credible budgeting within the various spheres of government.
Government’s annual budget processes are intended to ensure that all new plans are properly costed and that sufficient funds are available to sustain them before they are included in the budgets. The use of three-year MTEF budgeting at all levels of government means that projects must be budgeted for over a multi-year period and not just as a once-off appropriation. Government agrees that these principles should be applied rigorously during budget processes in all three spheres.
Roll-overs
The National Treasury should ensure that, when roll-overs are approved, there are also plans and capacity to spend the roll-over funds in addition to current allocations.
The roll-over of funds from one financial year to another is generally permitted to allow departments to complete activities that they originally planned to finish before year-end, but were unable to do so due to unforeseen circumstances. The undertakings typically funded by the roll-over of funds are close to completion at the start of the financial year. Requests for the roll-over of funds are submitted to the National Treasury. The request’s evaluation takes into account several factors, such as the department’s current and historical spending performance, and whether the expenditure can be financed within the department’s current budget. In the case of an institution with a poor spending performance history, roll-over funds are usually either not recommended, or recommended with the condition that the National Treasury will monitor departmental expenditure levels before making a final recommendation as to whether the roll-over should be approved or not. The National Treasury has provided guidance to municipalities on the roll-over processes and has instituted measures to give certainty that funds would be correctly used, including evidence that work on relevant projects has started and the submission of progress reports.
Withholding of funds
The National Treasury should ensure that withholding of funds is used as a last resort when all efforts (to support and enforce compliance) have been exhausted. Government should ensure that action is taken against officials when withholding of funds is due to non-compliance or dereliction of duty.
The National Treasury agrees with this recommendation. The Division of Revenue Act asserts that the National Treasury and the national transferring officer should follow certain processes before funds are withheld. Government engages with provinces and municipalities, giving them the opportunity to present their position and indicate remedial actions implemented to prevent reoccurrence. It should be noted that conditional grants are only withheld subsequent to an extensive consultation process between the National Treasury, the national transferring officer and the province or municipality.
Failure to spend
The National Treasury should ensure that failure to spend is not regarded as savings since this might encourage underspending in some cases.
The National Treasury undertakes to use the term “savings” only when referring to situations in which the planned outcomes are achieved at a lower cost than originally budgeted for. Situations where there is a failure to spend is called underspending. When the latter occurs, the National Treasury provides support to improve the performance of the programme. Where this is unsuccessful, consideration may be given to reprioritising some of the unspent funds towards other areas.
114
ANNEXURE A: REPORT OF THE MINISTER OF FINANCE TO PARLIAMENT
Conditional grant for municipal restructuring
A transitional conditional grant should be made available for the 2014/15 and 2015/16 financial years to municipalities that will be impacted by the re-demarcations to be introduced from the next municipal elections, to enable these municipalities to undertake the necessary preparatory work towards this restructuring.
The Municipal Demarcation Board has indicated that several municipalities will be merged after the 2016 local government elections. National and provincial governments have a responsibility to help municipalities manage this technically complex process successfully, with minimum disruptions for residents. In the two provinces most affected by mergers (Gauteng and KwaZulu-Natal), the provincial governments are already working with the affected municipalities to help them plan for the mergers. At a national level, the response is being coordinated by the Department of Cooperative Governance and a forum has been set up, chaired by the department, with representatives from the National Treasury and the South African Local Government Association. This team will examine the issues involved and make recommendations on further support needed, including whether specific financial support needs to be given to some or all of these municipalities to assist them with the costs of these mergers.
| ¢ | Recommendations of the Select Committee on Appropriations on the proposed Division of Revenue and the conditional grant allocations to provincial and local spheres of government as contained in the 2013 MTBPS |
Value for money
Government should ensure that growth in expenditure translates into a better life for all so there is value for the money spent.
As in previous budget processes, the 2014 MTEF budget process sought greater efficiencies to ensure that service delivery remains protected and that more is achieved with the current level of financial resources. The 2014 Budget publications provide comprehensive information on how budget resources are generated and how institutions plan to spend these resources, including what service delivery will result from this spending, to demonstrate how value for money will be achieved. In addition, any funding allocated through an Appropriation Act is subject to the provisions of the act itself, which states that funds need to be spent in accordance with the purposes specified. Spending is also subject to the provisions of the Public Finance Management Act, through which the accounting officer of a department, trading entity or constitutional institution is charged with ensuring the effective, efficient, economical and transparent use of the resources of the department, trading entity or constitutional institution at all times. Departments are continually tasked with assessing the aim, purpose and effectiveness of programmes and public entities, and whether outcomes and outputs can be attained at a lower cost.
Spheres of government
National and provincial spheres of government should, in terms of section 154 of the Constitution, continue to support and strengthen municipalities to manage their own affairs and also fulfil their constitutional mandates.
In fulfilling these requirements, government has institutionalised a number of programmes to support municipalities in discharging their own mandates. The National Treasury, in consultation with all provincial treasuries and the Department of Cooperative Governance, has developed programmes to monitor municipal financial performance and help municipalities focus on critical factors in financial management, governance, transparency and accountability. Capacity-building initiatives include the following:
| • | | The municipal systems improvement grant provides funding to all non-metropolitan municipalities to help them implement their local government turnaround strategies. |
115
2014 BUDGET REVIEW
| • | | The local government finance management grant funds the modernisation of financial management and implementation of the Municipal Finance Management Act (MFMA) (2003). |
| • | | The infrastructure skills development grant, introduced in 2012, places interns with technical skills in well-capacitated municipalities for a two-year period. They then complete their internship at municipalities that are struggling to attract skilled labour. |
| • | | The municipal finance improvement programme focuses on capacity building in various financial management disciplines and attempts to address gaps in the implementation of the MFMA. |
| • | | The city support programme responds to requests from metropolitan municipalities for an integrated programme of assistance to address challenges in transforming their built environments. Although this programme is coordinated nationally, cities are seen as the drivers and the City Budget Forum is the institutional arrangement for the cities’ participation and engagement. |
Payment schedules
The National Treasury should, where applicable, stipulate payment schedules when the Division of Revenue Bill for 2014/15 is presented.
Although it is possible to provide high-level details of the payment dates (contained in the conditional grant frameworks that form part of the annual Division of Revenue Bill, which is presented to Parliament), it is not possible to provide detailed payment schedules for each grant when the bill is presented to Parliament. Grant allocations to provinces and municipalities are contained within the voted funds of national departments and require detailed planning with the chief financial officer of each department, the programme managers who are responsible for each grant, the provincial and municipal receiving officers, their chief financial officers and each programme manager. Cash flow planning takes place after the tabling of the Budget, because any submissions made before that will likely be of poor quality and not agreed to by all stakeholders. The National Treasury notes the recommendation and would be able to provide reliable payment schedules to the committee on or before 31 March for provincial transfers and on or before 30 June for municipal transfers.
Unfunded mandates
To avoid incidences of unfunded mandates and challenges with accountability, allocation of funds should follow functions and capacity to perform such functions should be ascertained before devolution of such functions.
The principle that funds follow functions is one of the most important components of the intergovernmental fiscal system. The Financial and Fiscal Commission Act (1997) enshrines this principle in law and sets out the steps that must be taken to ensure that any function shift is accompanied by a fair transfer of resources. In summary, the act requires that the Minister of Finance must first agree to any function shift before it is submitted to the Financial and Fiscal Commission for an independent assessment of its impact and the adequacy of financial transfers proposed to accompany the function shift. If these steps are not followed then a function shift is legally invalid.
Ensuring that the government sphere taking over the function has the appropriate capacity requires careful planning, because it is difficult and expensive to build capacity for a function before an organisation has the legal responsibility for it. A phased approach to functional transfers can help with this, as can capacity and financial support. In the case of the devolution of the human settlements function to six metropolitan municipalities, the importance of this recommendation is recognised in the decision to provide these cities with a municipal human settlements capacity grant from 2014/15 to fund their operational costs in building capacity to administer the function.
116
ANNEXURE A: REPORT OF THE MINISTER OF FINANCE TO PARLIAMENT
Support for municipalities
The National Treasury, in terms of its legal obligations and in collaboration with provincial treasuries, should continue to monitor and support municipalities to ensure that they budget adequately for infrastructure repairs and maintenance.
Over the past six years, the National Treasury has established two annual strategic engagements with the 17 municipalities whose finances it monitors directly: a mid-year budget and performance review, and a budget benchmarking exercise to assess budgets, financial management and service delivery performance. The municipalities that take part account for over 70 per cent of total municipal budgets. Provincial treasuries replicate the same engagements with the municipalities they are responsible for monitoring. Among other things, these engagements aim to determine whether municipalities have budgeted adequately for repairs and maintenance. The recommended ratio is currently 8 per cent of total operating expenditure.
In the 2011 Local Government Budgets and Expenditure Review, the National Treasury highlighted the magnitude of repairs and maintenance and renewal backlogs that exist in municipal infrastructure, particularly electricity, water reticulation, sewerage, storm water and roads systems. These backlogs are affecting the financial sustainability of municipalities, the reliability and quality of their services, and their contribution to economic growth.
Provincial infrastructure
The National Treasury should ensure that, at the provincial sphere, allocation of funds follows functions relating to maintenance, repairs and replacement of infrastructure.
The National Treasury and sector departments have undertaken extensive work to ensure that provinces are capacitated to map the infrastructure delivery cycle, which includes planning and making provision for infrastructure maintenance, repairs and replacement. The reforms being introduced to the health and education infrastructure grant systems are intended to achieve better value for money from investment in provincial infrastructure by institutionalising proper planning, budgeting and delivery of infrastructure.
Provincial expenditure
The National Treasury should monitor and support provincial treasuries to improve on their projections and expenditure controls.
The National Treasury monitors and supports provincial treasuries to, among others, improve their projections and expenditure controls. Annual budget benchmarking exercises take place between the National Treasury and each provincial treasury to assess the budget, financial management and service delivery performance information of the province. The National Treasury also provides individualised support to provincial treasuries through in-year monitoring of budget performance. Technical and political feedback on provincial budget performance is also provided in various forums, such as the Technical Committee for Finance and the Budget Council.
Grant reductions
The National Treasury should ensure that the reduction of allocations to certain grants does not compromise service delivery.
The decision to reduce conditional grant allocations is primarily informed by persistent underspending on these grants. As part of the National Treasury’s oversight role towards provinces and municipalities, it regularly monitors expenditure on conditional grant allocations. In cases where provinces and municipalities underperform, the National Treasury takes appropriate steps, including channelling funds to areas where they are urgently required. This is one of the measures that the National Treasury has established to remedy fragmented service delivery in some provinces and municipalities.
117
2014 BUDGET REVIEW
| ¢ | Recommendations of the Standing Committee on Finance on the 2013 Revised Fiscal Framework |
Education headcount project
The National Treasury should assess value for money, efficiency and effectiveness of all education-related investment. Such assessment should include roll out of headcount project piloted in Limpopo Province to the rest of the country.
The National Treasury agrees that the headcount project piloted in Limpopo should be extended to other provinces to assess value for money, efficiency and effectiveness of education spending. The phased rollout to other provinces has already started.
Alignment with the National Development Plan
The National Treasury should assist with the implementation of the National Development Plan, and ensure that the departments align their strategic plans, annual performance plans, sector plans, delivery agreements and budgets with the priorities and strategic objectives articulated in the National Development Plan.
This recommendation is strongly supported by the National Treasury, which is already working with departments to ensure that the objectives of the National Development Plan inform their strategic plans.
Regulatory environment
One of the factors that led to South Africa’s economic growth lagging that of the emerging market economies could be the regulatory environment. The National Treasury should consider using a regulatory impact assessment mechanism to better assess the impact of regulation on small, medium and micro enterprises.
The National Treasury and the Presidency worked together to implement regulatory impact assessments from 2007 until 2009, when this responsibility was taken over primarily by the Cabinet Office in the Presidency, with the National Treasury providing technical support where necessary. In 2010, the Economic Development Department became responsible for economic impact assessments of policy. Although the National Treasury remains committed to limiting the unnecessary regulatory burden on small, medium and micro enterprises, it must work within its mandate, which does not include the right to request impact assessments from line departments. That mandate is currently held by the Cabinet Office.
African growth
The National Treasury should engage Business Unity South Africa in analysing the studies made that contrasts the key drivers of economic growth in Africa. Furthermore, there is a greater need for interventions in terms of taking investment opportunities in the African continent.
The National Treasury agrees with this recommendation and will seek a meeting with Business Unity South Africa in the near future. Annexure W3 of the Budget Review, entitled “Strengthening trade and investment links with Africa”, contains information regarding South Africa’s investment strategy for the African continent.
118
ANNEXURE A: REPORT OF THE MINISTER OF FINANCE TO PARLIAMENT
Cost-containment measures
Government, through the National Treasury, should within the next two months provide clear mechanisms that will be used in dealing with the planned cost-containment measures, add more measures where necessary and adapt the further announced ones when practically necessary.
The National Treasury Instruction 01 of 2013/14, which took effect on 1 January 2014, provides details of the cost-containment measures to be adopted by all departments, constitutional institutions and public entities.
The Jobs Fund
The National Treasury should provide Parliament with progress made with regards to the R9 billion Jobs Fund allocation for the employment creation programme launched by the Minister of Finance on 7 June 2011.
Since its inception, the Jobs Fund has run three calls for proposals, with the third call currently being finalised. Over the first two calls for proposals, 66 projects were approved with a total grant value of R3.48 billion. With the leveraged funds from project partners, the total value of job creation projects approved by the Jobs Fund stands at over R6.1 billion.
During the contracting process, targets for each project are agreed and finalised in line with the Jobs Fund’s six programme indicators against which every project must report. The current portfolio of contracted projects targets the creation of 96 102 new, permanent jobs over the next three years. These are jobs that would not have existed without the Jobs Fund intervention. In addition, projects will place 48 933 individuals into existing, vacant jobs by providing training and placement services.
The ability to leverage funding from project partners and the innovative nature of many of the Jobs Fund initiatives has resulted in relatively low average grant costs to create a new, permanent job. This currently stands at R34 862.
Contingency reserve
The National Treasury should report to the House on the approach to the allocation of the contingency reserve in the light of the allocation of the full R4 billion reserve in this year’s MTBPS.
Government allocates a contingency reserve to fund unforeseen and unavoidable spending pressures not included in the baseline. Following an analysis, which confirmed that unforeseen and unavoidable expenditure adjustments averaged R4 billion over the past five years, the decision was made to reduce the contingency reserve. Given government’s commitment to maintain spending within previously announced limits, additional allocations are financed by drawdowns on the contingency reserve and savings realised in existing departmental budgets. Of the R4 billion contingency reserve in 2013/14, R2.4 billion was used to finance salary adjustments. The remainder of the contingency reserve was used to finance roll-overs, and unforeseen or unavoidable additions.
Budget deficit measure
The National Treasury should submit to the House a report on the recalibration of the budget deficit measure and include a comparison of the approach in other countries.
The International Monetary Fund’s Government Finance Statistics manual (2001) requires that extraordinary receipts and payments are reported above the line, which means that they should be brought into the budget framework. This approach is used by many developed and emerging market economies. In line with this global standard, the South African government has brought extraordinary receipts and payments into the budget framework. This category includes receipts related to transactions
119
2014 BUDGET REVIEW
on loans and similar items with a direct effect on the borrowing requirement. As Table A.1 shows, the inclusion of extraordinary receipts and payments in the budget framework results in a narrower budget deficit in 2013/14. It also means that there is no longer a difference between the main budget deficit and the borrowing requirement.
Extraordinary transactions and the budget deficit, 2010/11 – 2016/17
| | | | | | | | | | | | | | | | | | | | | | | | | | | | |
R billion | | 2010/11 | | | 2011/12 | | | 2012/13 | | | 2013/14 | | | 2014/15 | | | 2015/16 | | | 2016/17 | |
Budget deficit excluding extraordinary transactions | | | -120.9 | | | | -117.4 | | | | -150.4 | | | | -151.1 | | | | -155.9 | | | | -151.9 | | | | -130.3 | |
| | | | | | | |
Percentage of GDP | | | -4.4 | % | | | -3.9 | % | | | -4.7 | % | | | -4.4 | % | | | -4.1 | % | | | -3.7 | % | | | -2.9 | % |
| | | | | | | | | | | | | | | | | | | | | | | | | | | | |
Extraordinary receipts | | | 3.0 | | | | 5.2 | | | | 11.9 | | | | 11.8 | | | | 2.9 | | | | 1.6 | | | | 3.4 | |
| | | | | | | |
Extraordinary payments | | | -0.8 | | | | -1.4 | | | | -2.6 | | | | -0.5 | | | | 0.0 | | | | 0.0 | | | | 0.0 | |
| | | | | | | | | | | | | | | | | | | | | | | | | | | | |
Budget deficit including extraordinary transactions | | | -117.1 | | | | -110.8 | | | | -135.9 | | | | -138.8 | | | | -153.1 | | | | -150.3 | | | | -126.9 | |
| | | | | | | |
Percentage of GDP | | | -4.3 | % | | | -3.7 | % | | | -4.3 | % | | | -4.0 | % | | | -4.0 | % | | | -3.6 | % | | | -2.8 | % |
120
B
Statistical tables
| 1 | Main budget: revenue, expenditure, budget balance and financing, 2007/08 to 2016/17 |
| 2 | Main budget: estimates of national revenue – summary of revenue, 1996/97 to 2016/17 |
| 3 | Main budget: estimates of national revenue – detailed classification of revenue, 2010/11 to 2016/17 |
| 4 | Main budget: expenditure defrayed from the National Revenue Fund by vote, 2010/11 to 2016/17 |
| 5 | Consolidated national, provincial and social security funds expenditure: economic classification, 2010/11 to 2016/17 |
| 6 | Consolidated national, provincial and social security funds expenditure: functional classification, 2010/11 to 2016/17 |
| 7 | Consolidated government revenue and expenditure: economic classification, 2010/11 to 2016/17 |
| 8 | Consolidated government expenditure: functional classification, 2010/11 to 2016/17 |
| 9 | Consolidated government revenue, expenditure and financing, 2010/11 to 2016/17 |
| 10 | Total debt of government, 1989/90 to 2016/17 |
| 11 | Financial guarantees: amounts drawn on government guarantees, 2010/11 to 2013/14 |
General remarks
This annexure presents details of the main budget, consolidated national and provincial expenditure, consolidated government expenditure, the borrowing requirement and financing government debt, as well as financial guarantees.
The tables presented in this annexure are categorised according to government levels, from the main budget to the consolidated government account. The main budget consists of receipts of the National Revenue Fund, expenditure either voted by Parliament or allocated by statutory appropriation and the financing of the deficit. It is the national budget, including transfers to other spheres of government as appropriated. The consolidated national, provincial and social security funds consists of the main (national), the provincial and the social security funds’ budgets or expenditure. These budgets are aggregated and then the transfers between the three spheres are netted out to arrive at a total consolidated expenditure. Consolidated government revenue, expenditure and financing includes national, provincial and social security funds, the Reconstruction and Development Programme (RDP) Fund and national public entities. The latter category is also referred to as the consolidated budget.
While government revenues are concentrated at national level, a large proportion of expenditure has shifted towards the provincial sphere since 1994. Equitable share transfers to the nine provinces are included as a statutory commitment of government on the National Treasury Vote, while the local
121
2014 BUDGET REVIEW
government equitable share is appropriated on the vote of the Department of Cooperative Governance and Traditional Affairs. The consolidated government account consists of all the activities of national government, which includes existing and newly listed public entities. The consolidation also includes several business enterprises of national government.
More than 70 per cent of total national expenditure on the 2014/15 main budget consists of transfer payments to other levels of general government, which means that economic and functional classifications of national budget expenditure are not comprehensive. For purposes of analysis, it would be preferable to present economic and functional classifications of general government expenditure, but this would require information on expenditure at all levels of general government and on its financing through revenue, balances brought forward and transfer payments (mainly from the national budget). This information is not readily available for local government, and it is therefore currently not possible to present consolidated general government finances that include this sphere of government. Historical data on general government finances are, however, published by the Reserve Bank in its Quarterly Bulletin and by Statistics South Africa.
Change in recording of extraordinary receipts and payments in the budget tables
As indicated in the 2013 Medium Term Budget Policy Statement (MTBPS), the consolidated government accounts will be presented in a new format in future. This more transparent format presents core budget information in line with the International Monetary Fund’s Government Finance Statistics manual (2001). It provides details of operating activities, capital and infrastructure investment, as well as transactions in financial assets and liabilities. It also includes all government transactions in the calculation of the budget balance. Previously, extraordinary receipts and payments were added to the budget deficit to calculate government’s net borrowing requirement. In the new format, there is no longer a difference between the budget balance and the net borrowing requirement. The reference to these transactions has also been changed to National Revenue Fund receipts and payments.
Treatment of foreign grants to the RDP Fund
Before 1999/00, foreign grants were paid to the National Revenue Fund and expenditure was included in departmental appropriations. From 1999/00 onwards, no foreign grants for RDP-related purposes have been included in national departments’ appropriations. All international technical assistance and other RDP-related grants are paid to the RDP Fund account, which is separated from government accounts. Departments incur expenditure on RDP-related projects by direct requisitions from this account. However, disbursements of foreign grants and technical assistance are included in the consolidated national and provincial expenditure estimates in Tables 5 and 6, and in the consolidated government expenditure in Table 7.
Adjustments due to transactions in government debt
As part of the state’s active management of its debt portfolio, government bonds are repurchased or switched into new bonds. In the process, government may make a capital profit, which is a book entry change in the bond discount. As such, capital profit does not represent actual cash flow and is regarded as a “book profit”, lowering the outstanding debt.
A premium may also be accrued, or payable, in managing the debt portfolio or when entering into new loans. Under the new format, premiums paid and/or received are included as National Revenue Fund receipts and payments, and no longer as extraordinary payments and/or extraordinary receipts.
Sources of information
The information in Tables 1 to 10 on national and provincial government and public entity finances is obtained from the following sources:
| • | | Reports of the Auditor-General on the Appropriation and Miscellaneous Accounts |
122
ANNEXURE B: STATISTICAL TABLES
| • | | Printed estimates of revenue and expenditure for the national and provincial budgets |
| • | | The Development Bank of Southern Africa (DBSA) |
| • | | The South African Revenue Service (SARS) |
| • | | Monthly press releases of the National Treasury, published in terms of section 32 of the Public Finance Management Act (1999). |
Main budget: revenue, expenditure, budget balance and financing (Table 1)
Table 1 summarises the main budget balances since 2007/08 and medium-term estimates to 2016/17. To be in line with the economic reporting format introduced in 2004/05, the revenue classification has been amended to show departmental sales of capital assets separately. These were previously included in non-tax current revenue.
Repayments of loans and advances, which were previously shown as negative expenditure, have been reclassified as revenue. Given that revenue increased and expenditure decreased with the same amount, the national budget deficit is unaffected.
Appropriations by vote are divided into current payments, transfers and subsidies, payments for capital assets and payments for financial assets. Both current and capital transfers are included in transfers and subsidies, in line with the requirements of the economic reporting format.
The size of the deficit figures presented in this table differ from those presented in budgets before 1995/96, as a number of items that were previously regarded as “below-the-line” expenditure have been included in total expenditure. In addition, revaluations of foreign loan obligations are now excluded from expenditure, in keeping with international practice.
Under the item “financing”, domestic short-term loans include the net of transactions in Treasury bills and borrowing from the Corporation for Public Deposits. Long-term loans include all transactions in government bonds and foreign loans (new loan issues, repayments on maturity, buy-backs, switches and reverse purchase transactions).
Loans issued for switches represent the settlement of extraordinary items and the net of bonds issued due to switches.
Main budget: estimates of national revenue (Tables 2 and 3)
Table 2 presents a summary of revenue and the details are set out in Table 3. Main budget revenue collections are recorded on an adjusted cash basis as the revenue is recorded in the ledgers of SARS. Tax revenue is classified according to standard international categories and departmental receipts according to the requirements of the economic reporting format.
In Table 3, a large amount of data cannot be reclassified to align with the economic reporting format because departments capture these transactions within their ledgers as miscellaneous receipts.
Main budget: expenditure defrayed from the National Revenue Fund by vote (Table 4)
Table 4 contains estimates of expenditure on national budget votes for the period 2010/11 to 2016/17. In 2013/14, amounts appropriated in the main budget, the adjusted estimates and preliminary estimates of spending on each vote are shown. Following the 2009 elections, a number of new departments were created; some functions were shifted between departments and some existing departments were renamed. Historical data has been adjusted to account for function shifts between departments. As a result, the figures presented for some departments may differ from their financial statements. Total expenditure, however, is not influenced by these changes.
123
2014 BUDGET REVIEW
Consolidated national, provincial and social security funds expenditure (Tables 5 and 6)
Tables 5 and 6 show the economic and functional classification of payments for consolidated national and provincial government and the social security funds, including the Unemployment Insurance Fund, the Road Accident Fund and the Compensation Funds. The national expenditure figures are for the 2014 Budget. Provincial expenditure estimates are preliminary because their budgets are tabled after the national budget. These estimates are based on preliminary information provided by the provinces and are subject to change before being tabled in provincial legislatures.
The National Treasury introduced a new economic classification in the 2004 Budget that brought budget reporting in line with international best practice. Further changes were introduced on 1 April 2008 to improve the standard chart of accounts. This was the culmination of work on various initiatives to improve financial data, such as the infrastructure reporting process and improvement to item classification, and took into account lessons learnt from data observations over the previous four years. The chart will be refined in 2014/15 to improve the quality of the data.
The functional classification
The functional classification in this annexure is aligned to the Classification of Functions of Government as set out in the Government Finance Statistics manual, which differs from the categories used in budgets before 2009. Since then, classification has been presented at a more detailed level, which means that departmental programmes that were allocated to one function can be disaggregated to more than one function due to the availability of more detailed financial information. The historical data published in these tables has been reclassified accordingly. Chapter 6 of the Budget Review, which sets out the medium-term expenditure framework, outlines the budget allocations across these function groups.
To support this approach, data at programme and entity level is aggregated into spending categories, which provides for a higher level of aggregation than in the functional classification. For example, in the functional classification in Annexure B, science and technology activities are included in individual functions, while in Chapter 6 these are grouped together as a separate category. The fiscal statistics are an outcome of the budget process and can only be used as a guide to categorise expenditure for budgeting purposes. They are not used as a framework for presenting budget allocations.
Some of the most important differences between the key spending categories presented in Chapter 6 and the more detailed functional classification presented in the statistical tables are as follows:
| • | | Science and technology – This category groups together various science-related activities. For example, the expenditure estimates of the Medical Research Council, included in the health function in Annexure B, are presented as part of this spending category. |
| • | | Recreation and culture – This category includes the expenditure estimates of the National Lotteries Distribution Trust, because a major portion of its expenditure is allocated to recreational and cultural activities. However, in the statistical tables in Annexure B, a more detailed functional breakdown of the trust’s expenditure is allocated to various functions. |
| • | | Economic services and environmental protection – This excludes economic infrastructure, which is identified as a separate spending category, and includes environmental protection. Estimates relating to communication, transport, and fuel and energy have been included in the economic infrastructure spending category. Environmental-protection public entities involved in science and technology activities (like the South African Weather Service) are included in the science and technology group, while in Annexure B they are classified within the economic services and environmental protection function. |
| • | | Health – Payments made to nursing colleges are included in the health spending category, but classified as an education function in Annexure B. The Medical Research Council is also excluded from the health function because it falls under science and technology for budget preparation. |
124
ANNEXURE B: STATISTICAL TABLES
| • | | Defence – Military health services is included in the defence spending category for budget preparation, but classified as a health function in Annexure B. |
| • | | Local government, housing and community amenities – Includes contributions to the South African Local Government Association and the Municipal Demarcation Board, classified as general public services in the statistical tables. |
| • | | General public services – In the budget’s key spending categories, transfers made to international organisations are classified within the category of the paying department. In Annexure B, they are classified under general public services. |
Consolidated government revenue and expenditure (Tables 7 and 8)
Tables 7 and 8 show the economic and functional classification of payments for the consolidated government budget. This consists of the consolidated national, provincial and social security figures presented in Tables 5 and 6, combined with entities forming part of the general government sector, as well as some government business enterprises.
The government budget consolidation includes all entities controlled and mainly financed by government revenue, where such revenue is defined as either taxes, levies and administrative or service fees prescribed by government, or direct budgetary support in the form of transfer payments. This consolidation also includes a number of government business enterprises, based on the principle that they either sell most of their goods and services produced to government institutions or departments at regulated prices, and are therefore not businesses in the true sense of the word, or they are directly involved in infrastructure financing and development.
Accordingly, state-owned entities are broadly identified as one of the following:
| • | | Enterprises that sell mainly to government departments or institutions, have no clear competitors and whose prices are therefore not clearly market related. |
| • | | Science councils that conduct research or fulfil a regulatory or advisory function, where regulatory or administration fees are determined by government. |
| • | | Government-regulated businesses that are primarily financed by a dedicated tax, administration fee or levy, the level of which is dictated by government, or that are directly involved in the maintenance or extension of critical infrastructure. |
To present consolidated accounts, all units must adopt the same accounting standards and policies. The format of the accounts, terminology used, classification, transaction coverage and accounting base (cash or accrual) must be the same. In this respect, the consolidated government budget is prepared on the adjusted cash basis of accounting. This is not strictly comparable to the financial information published in the consolidated financial statements, which has two components – a consolidation of departments using the modified cash basis of accounting and a separate consolidation of public entities that apply the accrual basis of accounting.
In the consolidated government budget, the accrual data of public entities is converted into cash. This involves adjusting the data presented in the statement of financial performance with changes that are due to non-cash transactions. These adjustments are based on all relevant changes in balances on the statement of financial position, which once removed from the statement of financial performance results in the presentation of only the cash receipts and payments for the accounting period.
Once the data has been converted into a comparable set of numbers, a consolidated account can be produced. This involves the elimination of all transactions that occur between the units that are being consolidated. A transaction of one unit is matched with the same transaction as recorded for the second unit and both transactions are eliminated from the consolidation. For example, if a public entity sells a service to a government department and data for the two units is being consolidated, neither the sale nor the purchase of the service is reported. In this way, only transactions between government and non-government entities are recorded, without inflating total government revenue as a result of internal transactions.
125
2014 BUDGET REVIEW
In the consolidation process, all intra-entity transactions must be eliminated. However, in the accounting systems of government and many of its agencies, not all intra-entity transactions are identifiable, complicating the consolidation process. Therefore, in preparing the consolidated government budget, only identifiable intra-entity transactions have been eliminated. These broadly include:
| • | | Transactions involving transfers from one government unit to another, including transfers made by national departments to public entities and transfers between public entities (such as Water Trading Entity transfers to water boards). |
| • | | Purchases of goods and services from other government units included in the consolidation (such as transactions between the Trans-Caledon Tunnel Authority, water boards and the Water Trading Entity). |
This process is not yet comprehensive. As data collection and recording procedures for transactions improve, additional intra-entity transactions will be identified and removed from the consolidated government budget.
In the 2014 Budget, a total of 169 national and provincial departments and 192 entities are included in the consolidated government budget. The National Treasury is committed to presenting a full consolidation of the whole of general government. This implies that the consolidated account presented in this budget must still be extended to include local government accounts. A process has been initiated and initial data sets for local government have been published in the Local Government Budgets and Expenditure Review. However, considerable work remains to align this data with the consolidated account, after which it will be included in the consolidation.
A discussion on the consolidation procedures, as well as a detailed list of all entities included in the consolidation, is available in Annexure W2 of the Budget Review on the National Treasury website: www.treasury.gov.za.
Consolidated government revenue, expenditure and financing (Table 9)
Table 9 presents the new format of the government account, which distinguishes between government’s operating activities and its plans to invest in capital and infrastructure.
The balance on the operating account shows the outcome of government’s operating activities, which is a measure of the cost of ongoing operations. It is calculated as the difference between current revenue and current expenditure, and the resulting balance shows how much government must borrow to run its operations. The current balance demonstrates the sustainability of government operations.
Capital investment activities are presented in the capital account. Government’s capital financing requirement is the outcome of this account, which is calculated as the difference between capital revenue and capital expenditure. This account will mainly be in deficit due to continuous investment in infrastructure and substantial capital outlays.
Total debt of government (Table 10)
Table 10 shows the major components of government debt. Net total loan debt consists of total domestic and foreign debt less the cash balances of the National Revenue Fund. Realised profits and losses on the Gold and Foreign Exchange Contingency Reserve Account are also disclosed. The projections for 2013/14 to 2016/17 are based on national budget data.
Financial guarantees: amounts drawn on government guarantees (Table 11)
The national government furnishes guarantees to various institutions that will only realise as liabilities to government if these institutions are unable to meet their commitments. It is not possible to predict the
126
ANNEXURE B: STATISTICAL TABLES
portion of these guarantees that will realise as liabilities, and they are therefore disclosed as contingent liabilities in the national government’s consolidated financial information. Amounts drawn in respect of guarantees and interest on these amounts, if guaranteed, are disclosed.
127
2014 BUDGET REVIEW
| | | | | | | | | | | | | | | | | | | | | | | | | | | | |
Table 1 Main budget: Revenue, expenditure, budget balance and financing 1) | | | | | | | | | | | | | | | | | | | | | |
| | | | | | 2007/08 | | | 2008/09 | | | 2009/10 | | | 2010/11 | | | 2011/12 | | | 2012/13 | |
R million | | | | | Actual outcome | | | Preliminary outcome | |
Main budget revenue | | | | | | | | | | | | | | | | | | | | | | | | | | | | |
Current revenue | | | | | | | 559 267.5 | | | | 607 867.5 | | | | 578 691.1 | | | | 668 489.7 | | | | 735 418.9 | | | | 786 080.4 | |
Tax revenue (gross) | | | 2) | | | | 572 814.6 | | | | 625 100.2 | | | | 598 705.4 | | | | 674 183.1 | | | | 742 649.7 | | | | 813 825.8 | |
Less: SACU payments | | | | | | | -24 712.6 | | | | -28 920.6 | | | | -27 915.4 | | | | -14 991.3 | | | | -21 760.0 | | | | -42 151.3 | |
Other adjustment | | | 3) | | | | — | | | | — | | | | — | | | | -2 914.4 | | | | — | | | | — | |
Non-tax revenue (departmental receipts) | | | 4) | | | | 11 165.5 | | | | 11 687.9 | | | | 7 901.1 | | | | 12 212.3 | | | | 14 529.2 | | | | 14 405.8 | |
Financial transactions in assets and liabilities | | | 5) | | | | 3 146.7 | | | | 9 000.5 | | | | 7 385.7 | | | | 4 226.3 | | | | 9 758.5 | | | | 13 587.0 | |
Sales of capital assets | | | | | | | 230.2 | | | | 131.2 | | | | 36.3 | | | | 35.4 | | | | 114.7 | | | | 94.3 | |
| | | | | | | | | | | | | | | | | | | | | | | | | | | | |
Total revenue | | | | | | | 562 644.4 | | | | 616 999.2 | | | | 586 113.1 | | | | 672 751.5 | | | | 745 292.2 | | | | 799 761.7 | |
Main budget expenditure | | | | | | | | | | | | | | | | | | | | | | | | | | | | |
Direct charges against the National Revenue Fund | | | | | | | 232 418.2 | | | | 269 616.9 | | | | 311 484.4 | | | | 350 386.7 | | | | 390 580.9 | | | | 426 909.6 | |
Debt-service costs | | | 6) | | | | 52 877.1 | | | | 54 393.7 | | | | 57 129.2 | | | | 66 226.8 | | | | 76 460.0 | | | | 88 121.1 | |
Provincial equitable share | | | | | | | 171 053.7 | | | | 201 795.6 | | | | 236 890.8 | | | | 265 139.4 | | | | 291 735.5 | | | | 313 015.8 | |
General fuel levy sharing with metropolitan municipalities | | | | | | | — | | | | — | | | | 6 800.1 | | | | 7 542.4 | | | | 8 573.1 | | | | 9 039.7 | |
Skills levy and SETAs | | | | | | | 6 284.3 | | | | 7 234.1 | | | | 7 815.6 | | | | 8 379.3 | | | | 10 025.3 | | | | 11 694.5 | |
Other | | | 7) | | | | 2 203.2 | | | | 6 193.4 | | | | 2 848.7 | | | | 3 098.8 | | | | 3 787.0 | | | | 5 038.5 | |
Appropriated by vote | | | | | | | 309 800.8 | | | | 370 620.6 | | | | 436 383.5 | | | | 455 592.4 | | | | 499 330.6 | | | | 538 586.0 | |
Current payments | | | 8) | | | | 87 084.5 | | | | 101 323.1 | | | | 114 745.6 | | | | 128 898.6 | | | | 142 697.4 | | | | 153 960.4 | |
Transfers and subsidies | | | 9) | | | | 214 591.9 | | | | 249 672.6 | | | | 279 020.7 | | | | 294 049.0 | | | | 343 175.4 | | | | 368 592.2 | |
Payments for capital assets | | | 10) | | | | 7 018.5 | | | | 8 652.1 | | | | 9 453.9 | | | | 11 406.9 | | | | 12 043.4 | | | | 13 996.0 | |
Payments for financial assets | | | 11) | | | | 1 105.9 | | | | 10 972.6 | | | | 33 163.3 | | | | 21 237.9 | | | | 1 414.4 | | | | 2 037.4 | |
Plus: unallocated funds | | | | | | | — | | | | — | | | | — | | | | — | | | | — | | | | — | |
Contingency reserve | | | | | | | — | | | | — | | | | — | | | | — | | | | — | | | | — | |
| | | | | | | | | | | | | | | | | | | | | | | | | | | | |
Total expenditure | | | | | | | 542 219.0 | | | | 640 237.4 | | | | 747 868.0 | | | | 805 979.1 | | | | 889 911.5 | | | | 965 495.6 | |
| | | | | | | | | | | | | | | | | | | | | | | | | | | | |
Main budget balance | | | | | | | 20 425.4 | | | | -23 238.3 | | | | -161 754.9 | | | | -133 227.7 | | | | -144 619.3 | | | | -165 733.9 | |
Percentage of GDP | | | | | | | 1.0 | % | | | -1.0 | % | | | -6.6 | % | | | -4.8 | % | | | -4.9 | % | | | -5.2 | % |
| | | | | | | | | | | | | | | | | | | | | | | | | | | | |
Financing | | | | | | | | | | | | | | | | | | | | | | | | | | | | |
Change in loan liabilities | | | | | | | | | | | | | | | | | | | | | | | | | | | | |
Domestic short-term loans (net) | | | | | | | 5 672.9 | | | | 12 225.1 | | | | 49 770.3 | | | | 34 893.0 | | | | 18 724.6 | | | | 22 555.0 | |
Domestic long-term loans (net) | | | | | | | -2 448.2 | | | | 23 059.0 | | | | 118 855.8 | | | | 136 849.8 | | | | 138 500.8 | | | | 125 767.8 | |
Market loans | | | | | | | 25 453.1 | | | | 44 301.4 | | | | 132 794.3 | | | | 150 292.0 | | | | 154 860.9 | | | | 161 554.2 | |
Loans issued for switches | | | | | | | 1 367.1 | | | | -1 947.1 | | | | -399.4 | | | | 93.4 | | | | -753.0 | | | | -3 848.3 | |
Redemptions | | | | | | | -29 268.4 | | | | -19 295.3 | | | | -13 539.1 | | | | -13 535.6 | | | | -15 607.1 | | | | -31 938.1 | |
Foreign loans (net) | | | | | | | -4 745.4 | | | | -3 954.4 | | | | 23 257.5 | | | | 2 839.6 | | | | 9 135.3 | | | | -11 622.0 | |
Market loans | | | | | | | -1 568.0 | | | | — | | | | 30 872.4 | | | | 5 151.1 | | | | 12 025.2 | | | | — | |
Arms procurement loan agreements | | | | | | | 2 426.5 | | | | 3 057.3 | | | | 800.0 | | | | 470.4 | | | | 569.4 | | | | 60.6 | |
World Bank loans | | | | | | | 20.0 | | | | 1.4 | | | | — | | | | — | | | | — | | | | — | |
Redemptions (including revaluation of loans) | | | 12) | | | | -5 623.9 | | | | -7 013.1 | | | | -8 414.9 | | | | -2 781.9 | | | | -3 459.3 | | | | -11 682.6 | |
Change in cash and other balances (- increase) | | | | | | | -18 904.7 | | | | -8 091.4 | | | | -30 128.7 | | | | -41 354.7 | | | | -21 741.4 | | | | 29 033.1 | |
| | | | | | | | | | | | | | | | | | | | | | | | | | | | |
Total financing (net) | | | | | | | -20 425.4 | | | | 23 238.3 | | | | 161 754.9 | | | | 133 227.7 | | | | 144 619.3 | | | | 165 733.9 | |
| | | | | | | | | | | | | | | | | | | | | | | | | | | | |
GDP | | | | | | | 2 075 414 | | | | 2 296 571 | | | | 2 456 628 | | | | 2 749 533 | | | | 2 981 828 | | | | 3 197 878 | |
| | | | | | | | | | | | | | | | | | | | | | | | | | | | |
National Revenue Fund transactions | | | 13) | | | | | | | | | | | | | | | | | | | | | | | | | |
National Revenue Fund receipts | | | | | | | 1 849.8 | | | | 8 203.4 | | | | 6 428.6 | | | | 3 013.9 | | | | 5 209.2 | | | | 11 921.2 | |
National Revenue Fund payments | | | | | | | -775.6 | | | | -4 284.1 | | | | -671.2 | | | | -838.6 | | | | -1 388.3 | | | | -2 587.2 | |
| | | | | | | | | | | | | | | | | | | | | | | | | | | | |
Net | | | | | | | 1 074.2 | | | | 3 919.3 | | | | 5 757.4 | | | | 2 175.3 | | | | 3 820.9 | | | | 9 334.0 | |
| | | | | | | | | | | | | | | | | | | | | | | | | | | | |
| 1) | This table summarises revenue, expenditure and the main budget balance since 2007/08. As available data is incomplete, the estimates are not fully consistent with other sources, such as the government finance statistics series of the Reserve Bank. |
| 2) | Mining leases and ownership has been reclassified as non-tax revenue (rent on land). Historical numbers have been adjusted for comparative purposes. |
| 3) | Payment to Southern African Customs Union partners in respect of a previous error in calculation of the 1969 agreement. |
| 4) | Excludes sales of capital assets, discount and revaluation of foreign loan repayments. |
| 5) | Includes National Revenue Fund receipts (previously classified as extraordinary receipts). |
| 6) | Includes interest, cost of raising loans and management cost but excludes discount on the issue of new government debt instruments and the revaluation of foreign loan repayments. |
| 7) | Includes direct appropriations in respect of the salaries of the President, Deputy President, judges, magistrates, members of Parliament, and National Revenue Fund payments (previously classified as extraordinary payments). |
128
ANNEXURE B: STATISTICAL TABLES
| | | | | | | | | | | | | | | | | | | | | | | | | | | | |
| | | | | | | | | | | | | | | | | | | | | | | | | | | | Table 1 Main budget: Revenue, expenditure,
budget balance and financing 1) |
| | | | | |
| 2013/14 | | | 2014/15 | | | 2015/16 | | | 2016/17 | | | | | | |
Budget
estimate | | | Revised
estimate | | | Deviation | | | Medium-term estimates | | | | | | R million |
| | | | | | | | | | | | | | | | | | | | | | | | | | | | Main budget revenue |
| | 868 582.7 | | | | 872 221.4 | | | | 3 638.7 | | | | 958 143.5 | | | | 1 058 045.6 | | | | 1 172 523.2 | | | | | | | Current revenue |
| | 898 003.9 | | | | 899 000.0 | | | | 996.1 | | | | 993 650.0 | | | | 1 095 100.0 | | | | 1 208 720.0 | | | | 2) | | | Tax revenue (gross) |
| | -43 374.3 | | | | -43 374.4 | | | | -0.0 | | | | -51 737.7 | | | | -57 298.2 | | | | -59 680.3 | | | | | | | Less: SACU payments |
| | — | | | | — | | | | — | | | | — | | | | — | | | | — | | | | 3) | | | Other adjustment |
| | 13 953.2 | | | | 16 595.8 | | | | 2 642.6 | | | | 16 231.1 | | | | 20 243.9 | | | | 23 483.5 | | | | 4) | | | Non-tax revenue (departmental receipts) |
| | 9 309.5 | | | | 13 878.5 | | | | 4 569.0 | | | | 4 571.3 | | | | — | | | | — | | | | 5) | | | Financial transactions in assets and liabilities |
| | 65.7 | | | | 66.8 | | | | 1.1 | | | | 66.9 | | | | 71.8 | | | | 75.0 | | | | | | | Sales of capital assets |
| | | | | | | | | | | | | | | | | | | | | | | | | | | | |
| | 877 957.9 | | | | 886 166.6 | | | | 8 208.7 | | | | 962 781.8 | | | | 1 058 117.4 | | | | 1 172 598.3 | | | | | | | Total revenue |
| | | | | | | | | | | | | | | | | | | | | | | | | | | | Main budget expenditure |
| | 463 292.5 | | | | 465 620.3 | | | | 2 327.8 | | | | 504 213.0 | | | | 543 325.3 | | | | 582 143.6 | | | | | | | Direct charges against the National Revenue Fund |
| | 99 741.4 | | | | 101 255.9 | | | | 1 514.4 | | | | 114 900.5 | | | | 126 646.8 | | | | 139 200.6 | | | | 6) | | | Debt-service costs |
| | 337 572.4 | | | | 338 936.8 | | | | 1 364.4 | | | | 362 468.1 | | | | 387 967.5 | | | | 412 038.8 | | | | | | | Provincial equitable share |
| | 9 613.4 | | | | 9 613.4 | | | | — | | | | 10 190.2 | | | | 10 658.9 | | | | 11 223.8 | | | | | | | General fuel levy sharing with metropolitan municipalities |
| | 12 403.0 | | | | 12 300.0 | | | | -103.0 | | | | 13 440.0 | | | | 14 690.0 | | | | 16 140.0 | | | | | | | Skills levy and SETAs |
| | 3 962.3 | | | | 3 514.3 | | | | -448.0 | | | | 3 214.2 | | | | 3 362.1 | | | | 3 540.3 | | | | 7) | | | Other |
| | 588 682.1 | | | | 583 488.6 | | | | -5 193.5 | | | | 635 349.4 | | | | 683 265.0 | | | | 723 480.8 | | | | | | | Appropriated by vote |
| | 168 448.8 | | | | 172 755.3 | | | | 4 306.5 | | | | 180 857.0 | | | | 190 136.3 | | | | 203 847.3 | | | | 8) | | | Current payments |
| | 402 794.2 | | | | 394 920.7 | | | | -7 873.4 | | | | 433 232.8 | | | | 471 207.4 | | | | 500 014.0 | | | | 9) | | | Transfers and subsidies |
| | 14 257.1 | | | | 12 414.9 | | | | -1 842.2 | | | | 17 689.1 | | | | 18 600.8 | | | | 19 316.7 | | | | 10) | | | Payments for capital assets |
| | 3 182.0 | | | | 3 397.6 | | | | 215.6 | | | | 3 570.5 | | | | 3 320.4 | | | | 302.8 | | | | 11) | | | Payments for financial assets |
| | 30.0 | | | | — | | | | -30.0 | | | | — | | | | — | | | | — | | | | | | | Plus: unallocated funds |
| | 4 000.0 | | | | — | | | | -4 000.0 | | | | 3 000.0 | | | | 6 000.0 | | | | 18 000.0 | | | | | | | Contingency reserve |
| | | | | | | | | | | | | | | | | | | | | | | | | | | | |
| | 1 056 004.6 | | | | 1 049 108.9 | | | | -6 895.7 | | | | 1 142 562.4 | | | | 1 232 590.3 | | | | 1 323 624.3 | | | | | | | Total expenditure |
| | | | | | | | | | | | | | | | | | | | | | | | | | | | |
| | -178 046.7 | | | | -162 942.3 | | | | 15 104.4 | | | | -179 780.6 | | | | -174 472.9 | | | | -151 026.1 | | | | | | | Main budget balance |
| | -5.1% | | | | -4.7 | % | | | 0.4 | % | | | -4.7 | % | | | -4.2 | % | | | -3.3 | % | | | | | | Percentage of GDP |
| | | | | | | | | | | | | | | | | | | | | | | | | | | | |
| | | | | | | | | | | | | | | | | | | | | | | | | | | | Financing |
| | | | | | | | | | | | | | | | | | | | | | | | | | | | Change in loan liabilities |
| | 23 000.0 | | | | 23 000.0 | | | | — | | | | 23 000.0 | | | | 24 000.0 | | | | 26 000.0 | | | | | | | Domestic short-term loans (net) |
| | 143 610.0 | | | | 148 993.2 | | | | 5 383.2 | | | | 132 097.6 | | | | 135 355.9 | | | | 121 009.1 | | | | | | | Domestic long-term loans (net) |
| | 165 648.0 | | | | 170 648.5 | | | | 5 000.5 | | | | 167 102.5 | | | | 165 075.3 | | | | 180 637.1 | | | | | | | Market loans |
| | -1 310.0 | | | | -1 135.3 | | | | 174.7 | | | | — | | | | — | | | | — | | | | | | | Loans issued for switches |
| | -20 728.0 | | | | -20 520.0 | | | | 208.0 | | | | -35 004.9 | | | | -29 719.4 | | | | -59 628.0 | | | | | | | Redemptions |
| | -4 335.0 | | | | 380.0 | | | | 4 715.0 | | | | 1 288.0 | | | | 12 205.0 | | | | 3 006.0 | | | | | | | Foreign loans (net) |
| | 12 390.0 | | | | 19 619.0 | | | | 7 229.0 | | | | 16 290.0 | | | | 15 780.0 | | | | 14 955.0 | | | | | | | Market loans |
| | — | | | | — | | | | — | | | | — | | | | — | | | | — | | | | | | | Arms procurement loan agreements |
| | — | | | | — | | | | — | | | | — | | | | — | | | | — | | | | | | | World Bank loans |
| | -16 725.0 | | | | -19 239.0 | | | | -2 514.0 | | | | -15 002.0 | | | | -3 575.0 | | | | -11 949.0 | | | | 12) | | | Redemptions (including revaluation of loans) |
| | 15 771.7 | | | | -9 430.9 | | | | -25 202.6 | | | | 23 395.0 | | | | 2 912.0 | | | | 1 011.0 | | | | | | | Change in cash and other balances (- increase) |
| | | | | | | | | | | | | | | | | | | | | | | | | | | | |
| | 178 046.7 | | | | 162 942.3 | | | | -15 104.4 | | | | 179 780.6 | | | | 174 472.9 | | | | 151 026.1 | | | | | | | Total financing (net) |
| | | | | | | | | | | | | | | | | | | | | | | | | | | | |
| | 3 520 268 | | | | 3 464 883 | | | | -55 386 | | | | 3 789 630 | | | | 4 150 507 | | | | 4 552 868 | | | | | | | GDP |
| | | | | | | | | | | | | | | | | | | | | | | | | | | | |
| | | | | | | | | | | | | | | | | | | | | | | | | 13) | | | National Revenue Fund transactions |
| | 4 992.0 | | | | 11 789.7 | | | | 6 797.7 | | | | 2 850.0 | | | | 1 600.0 | | | | 3 400.0 | | | | | | | National Revenue Fund receipts |
| | -930.0 | | | | -482.0 | | | | 448.0 | | | | — | | | | — | | | | — | | | | | | | National Revenue Fund payments |
| | | | | | | | | | | | | | | | | | | | | | | | | | | | |
| | 4 062.0 | | | | 11 307.7 | | | | 7 245.7 | | | | 2 850.0 | | | | 1 600.0 | | | | 3 400.0 | | | | | | | Net |
| | | | | | | | | | | | | | | | | | | | | | | | | | | | |
| 8) | Includes compensation of employees, payments for goods and services, interest and rent on land. Payment for medical benefits to former employees has been moved to transfers. |
| 9) | Includes current and capital transfers and subsidies to business, households, foreign countries and other levels and funds of general government. |
| 10) | Includes acquisition and own account construction of new assets and the cost of upgrading, improving and extending to existing capital assets. |
| 11) | Consists mainly of lending to public corporations or making equity investments in them for policy purposes. Previously included in transfers and subsidies. |
| 12) | Revaluation estimates are based on National Treasury’s projection of exchange rates. |
| 13) | National Revenue Fund payments include premiums paid on loan transactions and revaluation adjustments when utilising foreign exchange deposits. |
National Revenue Fund receipts include proceeds from the sale of state assets, premiums received on loan transactions and revaluation adjustments when utilising foreign exchange deposits.
129
2014 BUDGET REVIEW
Table 2
Main budget: estimates of national revenue
Summary of revenue 1)
| | | | | | | | | | | | | | | | | | | | | | | | | | | | | | | | |
R million | | | | | 1996/97 | | | 1997/98 | | | 1998/99 | | | 1999/00 | | | 2000/01 | | | 2001/02 | | | 2002/03 | |
Taxes on income and profits | | | | | | | 82 876.1 | | | | 95 003.6 | | | | 108 021.5 | | | | 116 148.9 | | | | 126 145.2 | | | | 147 310.4 | | | | 164 565.9 | |
Persons and individuals | | | | | | | 59 519.8 | | | | 68 342.4 | | | | 77 733.9 | | | | 85 883.8 | | | | 86 478.0 | | | | 90 389.5 | | | | 94 336.7 | |
Gold mines | | | | | | | 507.7 | | | | 332.5 | | | | 188.6 | | | | — | | | | — | | | | — | | | | — | |
Other mines | | | | | | | 1 341.6 | | | | 1 349.4 | | | | 1 946.1 | | | | — | | | | — | | | | — | | | | — | |
Companies | | | | | | | 16 985.0 | | | | 19 696.4 | | | | 20 388.0 | | | | 20 971.6 | | | | 29 491.8 | | | | 42 354.5 | | | | 55 745.1 | |
Secondary tax on companies/Dividend tax | | | | | | | 1 337.9 | | | | 1 446.4 | | | | 1 930.8 | | | | 3 149.9 | | | | 4 031.3 | | | | 7 162.7 | | | | 6 325.6 | |
Tax on retirement funds | | | | | | | 2 565.5 | | | | 3 229.7 | | | | 5 098.8 | | | | 5 330.4 | | | | 5 219.8 | | | | 6 190.6 | | | | 6 989.7 | |
Other | | | 1) | | | | 618.6 | | | | 606.8 | | | | 735.3 | | | | 813.1 | | | | 924.3 | | | | 1 213.1 | | | | 1 169.0 | |
Taxes on payroll and workforce | | | | | | | — | | | | — | | | | — | | | | 0.1 | | | | 1 257.4 | | | | 2 717.3 | | | | 3 352.1 | |
Skills development levy | | | 2) | | | | — | | | | — | | | | — | | | | 0.1 | | | | 1 257.4 | | | | 2 717.3 | | | | 3 352.1 | |
Taxes on property | | | | | | | 2 359.3 | | | | 2 618.4 | | | | 2 830.4 | | | | 3 808.4 | | | | 3 978.8 | | | | 4 628.3 | | | | 5 084.6 | |
Donations tax | | | | | | | 46.7 | | | | 17.7 | | | | 9.1 | | | | 15.2 | | | | 32.1 | | | | 20.6 | | | | 17.7 | |
Estate duty | | | | | | | 181.8 | | | | 302.6 | | | | 256.4 | | | | 304.2 | | | | 442.7 | | | | 481.9 | | | | 432.7 | |
Securities transfer tax | | | 3) | | | | 397.3 | | | | 442.3 | | | | 721.1 | | | | 1 090.4 | | | | 1 102.1 | | | | 1 212.8 | | | | 1 205.2 | |
Transfer duties | | | | | | | 1 733.5 | | | | 1 855.8 | | | | 1 565.4 | | | | 1 821.6 | | | | 2 401.9 | | | | 2 913.0 | | | | 3 429.0 | |
Demutualisation charge | | | | | | | — | | | | — | | | | 278.5 | | | | 577.0 | | | | — | | | | — | | | | — | |
Domestic taxes on goods and services | | | | | | | 53 572.9 | | | | 60 619.0 | | | | 66 213.2 | | | | 72 184.7 | | | | 78 877.5 | | | | 86 885.1 | | | | 97 311.5 | |
Value-added tax | | | 4) | | | | 35 902.9 | | | | 40 095.6 | | | | 43 985.4 | | | | 48 376.8 | | | | 54 455.2 | | | | 61 056.6 | | | | 70 149.9 | |
Specific excise duties | | | | | | | 5 912.4 | | | | 7 425.8 | | | | 8 052.8 | | | | 8 886.1 | | | | 9 126.6 | | | | 9 797.2 | | | | 10 422.6 | |
Ad valorem excise duties | | | | | | | 718.7 | | | | 581.6 | | | | 518.9 | | | | 584.3 | | | | 693.9 | | | | 776.1 | | | | 1 050.2 | |
General fuel levy | | | | | | | 10 391.6 | | | | 12 091.2 | | | | 13 640.0 | | | | 14 289.8 | | | | 14 495.3 | | | | 14 923.2 | | | | 15 333.8 | |
Air departure tax | | | | | | | — | | | | — | | | | — | | | | — | | | | 85.8 | | | | 296.4 | | | | 324.8 | |
Other | | | 5) | | | | 647.2 | | | | 424.8 | | | | 16.0 | | | | 47.6 | | | | 20.7 | | | | 35.5 | | | | 30.3 | |
Taxes on international trade and transactions | | | | | | | 7 200.5 | | | | 5 638.6 | | | | 6 052.5 | | | | 6 778.1 | | | | 8 226.6 | | | | 8 680.1 | | | | 9 619.8 | |
Customs duties | | | | | | | 6 518.0 | | | | 6 055.7 | | | | 5 985.7 | | | | 6 517.8 | | | | 7 853.6 | | | | 8 632.2 | | | | 9 330.7 | |
Import surcharges | | | | | | | -5.9 | | | | -1.4 | | | | 1.6 | | | | 0.4 | | | | 0.0 | | | | 0.5 | | | | 0.0 | |
Other | | | 6) | | | | 688.4 | | | | -415.7 | | | | 65.2 | | | | 259.9 | | | | 372.9 | | | | 47.5 | | | | 289.1 | |
| | | | | | | | |
Stamp duties and fees | | | | | | | 1 202.4 | | | | 1 483.8 | | | | 1 489.0 | | | | 1 618.9 | | | | 1 561.6 | | | | 1 767.2 | | | | 1 572.4 | |
State miscellaneous revenue | | | 7) | | | | 121.2 | | | | -36.0 | | | | 179.3 | | | | 727.0 | | | | 72.0 | | | | 306.7 | | | | 433.0 | |
| | | | | | | | | | | | | | | | | | | | | | | | | | | | | | | | |
TOTAL TAX REVENUE (gross) | | | | | | | 147 332.3 | | | | 165 327.4 | | | | 184 785.9 | | | | 201 265.9 | | | | 220 119.1 | | | | 252 295.0 | | | | 281 939.3 | |
Non-tax revenue | | | 8) | | | | 5 152.1 | | | | 6 246.7 | | | | 7 553.8 | | | | 11 332.1 | | | | 6 852.4 | | | | 8 331.4 | | | | 12 995.7 | |
Less: SACU payments | | | 9) | | | | -4 362.7 | | | | -5 237.2 | | | | -5 576.7 | | | | -7 197.3 | | | | -8 396.1 | | | | -8 204.8 | | | | -8 259.4 | |
| | | | | | | | | | | | | | | | | | | | | | | | | | | | | | | | |
TOTAL MAIN BUDGET REVENUE | | | | | | | 148 121.8 | | | | 166 337.0 | | | | 186 763.0 | | | | 205 400.7 | | | | 218 575.4 | | | | 252 421.5 | | | | 286 675.6 | |
| | | | | | | | | | | | | | | | | | | | | | | | | | | | | | | | |
Current revenue | | | | | | | 148 107.0 | | | | 166 318.5 | | | | 186 736.2 | | | | 205 359.0 | | | | 218 531.9 | | | | 252 417.4 | | | | 286 617.8 | |
Direct taxes | | | | | | | 83 104.6 | | | | 95 323.9 | | | | 108 565.5 | | | | 117 045.3 | | | | 127 877.4 | | | | 150 530.1 | | | | 168 368.4 | |
Indirect taxes | | | | | | | 64 106.6 | | | | 70 039.5 | | | | 76 041.1 | | | | 83 493.7 | | | | 92 169.7 | | | | 101 458.2 | | | | 113 137.9 | |
State miscellaneous revenue | | | | | | | 121.2 | | | | -36.0 | | | | 179.3 | | | | 727.0 | | | | 72.0 | | | | 306.7 | | | | 433.0 | |
Non-tax revenue (excluding sales of capital assets) | | | 11) | | | | 5 137.3 | | | | 6 228.3 | | | | 7 526.9 | | | | 11 290.4 | | | | 6 808.9 | | | | 8 327.2 | | | | 12 937.9 | |
Less: SACU payments | | | | | | | -4 362.7 | | | | -5 237.2 | | | | -5 576.7 | | | | -7 197.3 | | | | -8 396.1 | | | | -8 204.8 | | | | -8 259.4 | |
Sales of capital assets | | | | | | | 14.7 | | | | 18.4 | | | | 26.9 | | | | 41.7 | | | | 43.5 | | | | 4.2 | | | | 57.8 | |
| | | | | | | | | | | | | | | | | | | | | | | | | | | | | | | | |
National Revenue Fund receipts | | | 12) | | | | 1 629.4 | | | | 2 947.4 | | | | 2 757.6 | | | | 7 238.3 | | | | 2 983.5 | | | | 4 159.1 | | | | 8 167.9 | |
| | | | | | | | | | | | | | | | | | | | | | | | | | | | | | | | |
| 1) | Includes interest on overdue income tax, non-resident shareholders’ tax (prior to 1999/00), non-residents’ tax on interest (prior to 1999/00), undistributed profits tax (prior to 1999/00) and small business tax amnesty (in 2006/07, 2007/08 and 2008/09). |
| 2) | Levy on payroll dedicated to skills development. |
| 3) | The securities transfer tax replaced the uncertificated securities tax from 1 July 2008. The uncertificated securities tax replaced the marketable securities tax from 1 June 1999. |
| 4) | The value-added tax (VAT) replaced the general sales tax in September 1991. |
| 5) | Includes plastic bag levy (from 2004/05), Universal Service Fund (from 1998/99), Human Resources Fund and Universal Service Agency (in 1998/99 and 1999/00), levies on financial services (up to 2004/05) and carbon dioxide motor vehicle emissions tax (from 2010/11). Mining leases and ownership has been reclassified as non-tax revenue. The historical years from 1998/99 have been adjusted for comparative purposes. |
130
ANNEXURE B: STATISTICAL TABLES
| | | | | | | | | | | | | | | | | | | | | | | | | | | | | | | | |
| | | | | | | | | | | | | | | | | | | | | | | | | | | | | | | | Table 2 Main budget: estimates of national revenue Summary of revenue 1) |
| | | | | | | | |
| 2003/04 | | | 2004/05 | | | 2005/06 | | | 2006/07 | | | 2007/08 | | | 2008/09 | | | 2009/10 | | | | | | |
| Actual collections | | | | | | R million |
| | 171 962.8 | | | | 195 219.1 | | | | 230 803.6 | | | | 279 990.5 | | | | 332 058.3 | | | | 383 482.7 | | | | 359 044.8 | | | | | | | Taxes on income and profits |
| | 98 495.1 | | | | 110 981.9 | | | | 125 645.3 | | | | 140 578.3 | | | | 168 774.4 | | | | 195 145.7 | | | | 205 145.0 | | | | | | | Persons and individuals |
| | — | | | | — | | | | — | | | | — | | | | — | | | | — | | | | — | | | | | | | Gold mines |
| | — | | | | — | | | | — | | | | — | | | | — | | | | — | | | | — | | | | | | | Other mines |
| | 60 880.8 | | | | 70 781.9 | | | | 86 160.8 | | | | 118 998.6 | | | | 140 119.8 | | | | 165 539.0 | | | | 134 883.4 | | | | | | | Companies |
| | 6 132.9 | | | | 7 487.1 | | | | 12 277.6 | | | | 15 291.4 | | | | 20 585.4 | | | | 20 017.6 | | | | 15 467.8 | | | | | | | Secondary tax on companies/Dividend tax |
| | 4 897.7 | | | | 4 406.1 | | | | 4 783.1 | | | | 3 190.5 | | | | 285.4 | | | | 143.3 | | | | 42.7 | | | | | | | Tax on retirement funds |
| | 1 556.3 | | | | 1 562.2 | | | | 1 936.7 | | | | 1 931.7 | | | | 2 293.3 | | | | 2 637.2 | | | | 3 505.9 | | | | 1) | | | Other |
| | 3 896.4 | | | | 4 443.3 | | | | 4 872.0 | | | | 5 597.4 | | | | 6 330.9 | | | | 7 327.5 | | | | 7 804.8 | | | | | | | Taxes on payroll and workforce |
| | 3 896.4 | | | | 4 443.3 | | | | 4 872.0 | | | | 5 597.4 | | | | 6 330.9 | | | | 7 327.5 | | | | 7 804.8 | | | | 2) | | | Skills development levy |
| | 6 707.5 | | | | 9 012.6 | | | | 11 137.5 | | | | 10 332.3 | | | | 11 883.9 | | | | 9 477.1 | | | | 8 826.4 | | | | | | | Taxes on property |
| | 17.1 | | | | 25.2 | | | | 29.5 | | | | 47.0 | | | | 27.6 | | | | 125.0 | | | | 60.1 | | | | | | | Donations tax |
| | 417.1 | | | | 506.9 | | | | 624.7 | | | | 747.4 | | | | 691.0 | | | | 756.7 | | | | 759.3 | | | | | | | Estate duty |
| | 1 101.1 | | | | 1 365.9 | | | | 1 973.4 | | | | 2 763.9 | | | | 3 757.1 | | | | 3 664.5 | | | | 3 324.0 | | | | 3) | | | Securities transfer tax |
| | 5 172.1 | | | | 7 114.6 | | | | 8 510.0 | | | | 6 774.0 | | | | 7 408.2 | | | | 4 930.9 | | | | 4 683.0 | | | | | | | Transfer duties |
| | — | | | | — | | | | — | | | | — | | | | — | | | | — | | | | — | | | | | | | Demutualisation charge |
| | 110 108.6 | | | | 131 980.6 | | | | 151 223.7 | | | | 174 671.4 | | | | 194 690.3 | | | | 201 416.0 | | | | 203 666.8 | | | | | | | Domestic taxes on goods and services |
| | 80 681.8 | | | | 98 157.9 | | | | 114 351.6 | | | | 134 462.6 | | | | 150 442.8 | | | | 154 343.1 | | | | 147 941.3 | | | | 4) | | | Value-added tax |
| | 11 364.6 | | | | 13 066.7 | | | | 14 546.5 | | | | 16 369.5 | | | | 18 218.4 | | | | 20 184.5 | | | | 21 289.3 | | | | | | | Specific excise duties |
| | 1 016.2 | | | | 1 015.2 | | | | 1 157.3 | | | | 1 282.7 | | | | 1 480.5 | | | | 1 169.5 | | | | 1 275.9 | | | | | | | Ad valorem excise duties |
| | 16 652.4 | | | | 19 190.4 | | | | 20 506.7 | | | | 21 844.6 | | | | 23 740.5 | | | | 24 883.8 | | | | 28 832.5 | | | | | | | General fuel levy |
| | 367.2 | | | | 412.2 | | | | 458.2 | | | | 484.8 | | | | 540.6 | | | | 549.4 | | | | 580.3 | | | | | | | Air departure tax |
| | 26.5 | | | | 138.3 | | | | 203.4 | | | | 227.2 | | | | 267.5 | | | | 285.7 | | | | 405.7 | | | | 5) | | | Other |
| | 8 414.3 | | | | 13 286.5 | | | | 18 201.9 | | | | 24 002.2 | | | | 27 081.9 | | | | 22 852.4 | | | | 19 318.9 | | | | | | | Taxes on international trade and transactions |
| | 8 479.4 | | | | 12 888.4 | | | | 18 303.5 | | | | 23 697.0 | | | | 26 469.9 | | | | 22 751.0 | | | | 19 577.1 | | | | | | | Customs duties |
| | — | | | | — | | | | — | | | | — | | | | — | | | | — | | | | — | | | | | | | Import surcharges |
| | -65.1 | | | | 398.1 | | | | -101.6 | | | | 305.2 | | | | 612.0 | | | | 101.4 | | | | -258.3 | | | | 6) | | | Other |
| | 1 360.1 | | | | 1 167.7 | | | | 792.8 | | | | 615.7 | | | | 557.1 | | | | 571.8 | | | | 49.5 | | | | | | | Stamp duties and fees |
| | -7.1 | | | | -130.9 | | | | 164.2 | | | | 339.2 | | | | 212.2 | | | | -27.4 | | | | -5.7 | | | | 7) | | | State miscellaneous revenue |
| | | | | | | | | | | | | | | | | | | | | | | | | | | | | | | | |
| | 302 442.6 | | | | 354 978.8 | | | | 417 195.7 | | | | 495 548.6 | | | | 572 814.6 | | | | 625 100.2 | | | | 598 705.4 | | | | | | | TOTAL TAX REVENUE (gross) |
| | 8 309.5 | | | | 8 695.4 | | | | 15 602.3 | | | | 14 281.4 | | | | 14 542.4 | | | | 20 819.6 | | | | 15 323.1 | | | | 8) | | | Non-tax revenue |
| | -9 722.7 | | | | -13 327.8 | | | | -14 144.9 | | | | -25 194.9 | | | | -24 712.6 | | | | -28 920.6 | | | | -27 915.4 | | | | 9) | | | Less: SACU payments |
| | | | | | | | | | | | | | | | | | | | | | | | | | | | | | | | |
| | 301 029.4 | | | | 350 346.5 | | | | 418 653.1 | | | | 484 635.1 | | | | 562 644.4 | | | | 616 999.2 | | | | 586 113.1 | | | | | | | TOTAL MAIN BUDGET REVENUE |
| | | | | | | | | | | | | | | | | | | | | | | | | | | | | | | | |
| | 301 012.9 | | | | 350 316.3 | | | | 418 573.8 | | | | 484 596.3 | | | | 562 414.2 | | | | 616 868.0 | | | | 586 076.8 | | | | | | | Current revenue |
| | 176 293.5 | | | | 200 194.5 | | | | 236 329.7 | | | | 286 382.4 | | | | 339 107.8 | | | | 391 691.9 | | | | 367 669.0 | | | | | | | Direct taxes |
| | 126 156.1 | | | | 154 915.3 | | | | 180 701.8 | | | | 208 827.1 | | | | 233 494.6 | | | | 233 435.6 | | | | 231 042.1 | | | | | | | Indirect taxes |
| | -7.1 | | | | -130.9 | | | | 164.2 | | | | 339.2 | | | | 212.2 | | | | -27.4 | | | | -5.7 | | | | | | | State miscellaneous revenue |
| | 8 293.0 | | | | 8 665.2 | | | | 15 523.0 | | | | 14 242.6 | | | | 14 312.2 | | | | 20 688.4 | | | | 15 286.8 | | | | 11) | | | Non-tax revenue (excluding sales of capital assets) |
| | -9 722.7 | | | | -13 327.8 | | | | -14 144.9 | | | | -25 194.9 | | | | -24 712.6 | | | | -28 920.6 | | | | -27 915.4 | | | | | | | Less: SACU payments |
| | 16.5 | | | | 30.2 | | | | 79.3 | | | | 38.8 | | | | 230.2 | | | | 131.2 | | | | 36.3 | | | | | | | Sales of capital assets |
| | | | | | | | | | | | | | | | | | | | | | | | | | | | | | | | |
| | 1 598.2 | | | | 2 492.0 | | | | 6 905.2 | | | | 3 438.1 | | | | 1 849.8 | | | | 8 203.4 | | | | 6 428.6 | | | | 12) | | | National Revenue Fund receipts |
| | | | | | | | | | | | | | | | | | | | | | | | | | | | | | | | |
| 6) | Includes miscellaneous customs and excise receipts, ordinary levy (up to 2004/05) and diamond export duties. |
| 7) | Includes revenue received by SARS that could not be allocated to a specific revenue type. |
| 8) | Includes sales of goods and services, fines, penalties and forfeits, interest, dividends and rent on land (including mineral and petroleum royalties), sales of capital assets as well as transactions in financial assets and liabilities. |
| 9) | Payments in terms of SACU agreements. |
| 10) | Payment to SACU partners in respect of a previous error in calculation of the 1969 agreement. |
| 11) | Excludes sales of capital assets. |
| 12) | Previosuly classified as extraordinary revenue, includes sales of strategic fuel stocks, proceeds from sales of state assets and certain other receipts are, by law, paid into the National Revenue Fund. |
131
2014 BUDGET REVIEW
Table 2
Main budget: estimates of national revenue
Summary of revenue 1)
| | | | | | | | | | | | | | | | | | | | | | | | | | | | | | | | |
| | | | | | 2010/11 | | | 2011/12 | | | 2012/13 | | | 2013/14 | | | 2014/15 | |
| | | | | | Actual
collections | | | Revised
estimates | | | % change
on actual
2012/13 | | | Budget estimates | |
| | | | | | | | | Before | | | After | |
R million | | | | | | | | tax proposals | |
Taxes on income and profits | | | | | | | 379 941.2 | | | | 426 583.7 | | | | 457 313.8 | | | | 505 474.7 | | | | 10.5 | % | | | 567 200.7 | | | | 556 950.7 | |
Persons and individuals | | | | | | | 226 925.0 | | | | 250 399.6 | | | | 275 821.6 | | | | 308 929.6 | | | | 12.0 | % | | | 346 194.0 | | | | 335 944.0 | |
Companies | | | | | | | 132 901.7 | | | | 151 626.7 | | | | 159 259.2 | | | | 176 965.1 | | | | 11.1 | % | | | 198 935.0 | | | | 198 935.0 | |
Secondary tax on companies/Dividend tax | | | | | | | 17 178.2 | | | | 21 965.4 | | | | 19 738.7 | | | | 17 000.0 | | | | -13.9 | % | | | 19 249.9 | | | | 19 249.9 | |
Tax on retirement funds | | | | | | | 2.8 | | | | 6.7 | | | | 0.2 | | | | — | | | | -100.0 | % | | | — | | | | — | |
Other | | | 1) | | | | 2 933.6 | | | | 2 585.3 | | | | 2 494.1 | | | | 2 580.0 | | | | 3.4 | % | | | 2 821.8 | | | | 2 821.8 | |
Taxes on payroll and workforce | | | | | | | 8 652.3 | | | | 10 173.1 | | | | 11 378.5 | | | | 12 299.9 | | | | 8.1 | % | | | 13 440.0 | | | | 13 440.0 | |
Skills development levy | | | 2) | | | | 8 652.3 | | | | 10 173.1 | | | | 11 378.5 | | | | 12 299.9 | | | | 8.1 | % | | | 13 440.0 | | | | 13 440.0 | |
Taxes on property | | | | | | | 9 102.3 | | | | 7 817.5 | | | | 8 645.2 | | | | 10 375.3 | | | | 20.0 | % | | | 11 476.7 | | | | 11 476.7 | |
Donations tax | | | | | | | 64.6 | | | | 52.7 | | | | 82.1 | | | | 112.1 | | | | 36.5 | % | | | 122.6 | | | | 122.6 | |
Estate duty | | | | | | | 782.3 | | | | 1 045.2 | | | | 1 013.0 | | | | 1 130.9 | | | | 11.6 | % | | | 1 236.9 | | | | 1 236.9 | |
Securities transfer tax | | | 3) | | | | 2 932.9 | | | | 2 886.1 | | | | 3 271.9 | | | | 3 653.3 | | | | 11.7 | % | | | 4 065.7 | | | | 4 065.7 | |
Transfer duties | | | | | | | 5 322.5 | | | | 3 833.6 | | | | 4 278.3 | | | | 5 479.0 | | | | 28.1 | % | | | 6 051.5 | | | | 6 051.5 | |
Domestic taxes on goods and services | | | | | | | 249 490.4 | | | | 263 949.9 | | | | 296 921.5 | | | | 326 044.2 | | | | 9.8 | % | | | 356 644.6 | | | | 361 319.6 | |
Value-added tax | | | 4) | | | | 183 571.4 | | | | 191 020.2 | | | | 215 023.0 | | | | 239 286.2 | | | | 11.3 | % | | | 267 160.0 | | | | 267 160.0 | |
Specific excise duties | | | | | | | 22 967.6 | | | | 25 411.1 | | | | 28 377.7 | | | | 28 942.7 | | | | 2.0 | % | | | 28 969.8 | | | | 31 079.8 | |
Ad valorem excise duties | | | | | | | 1 596.2 | | | | 1 828.3 | | | | 2 231.9 | | | | 2 401.5 | | | | 7.6 | % | | | 2 622.6 | | | | 2 622.6 | |
General fuel levy | | | | | | | 34 417.6 | | | | 36 602.3 | | | | 40 410.4 | | | | 43 300.0 | | | | 7.2 | % | | | 44 951.6 | | | | 47 516.6 | |
Air departure tax | | | | | | | 647.8 | | | | 762.4 | | �� | | 873.1 | | | | 890.1 | | | | 1.9 | % | | | 973.5 | | | | 973.5 | |
Electricity levy | | | | | | | 4 996.4 | | | | 6 429.7 | | | | 7 983.9 | | | | 9 125.5 | | | | 14.3 | % | | | 9 789.3 | | | | 9 789.3 | |
Other | | | 5) | | | | 1 293.3 | | | | 1 895.8 | | | | 2 021.4 | | | | 2 098.1 | | | | 3.8 | % | | | 2 177.8 | | | | 2 177.8 | |
Taxes on international trade and transactions | | | | | | | 26 977.1 | | | | 34 121.0 | | | | 39 549.1 | | | | 44 774.6 | | | | 13.2 | % | | | 50 463.0 | | | | 50 463.0 | |
Customs duties | | | | | | | 26 637.4 | | | | 34 197.9 | | | | 38 997.9 | | | | 44 500.1 | | | | 14.1 | % | | | 50 300.4 | | | | 50 300.4 | |
Other | | | 6) | | | | 339.7 | | | | -76.9 | | | | 551.2 | | | | 274.5 | | | | -50.2 | % | | | 162.6 | | | | 162.6 | |
Stamp duties and fees | | | | | | | 3.1 | | | | -2.9 | | | | 0.5 | | | | 31.4 | | | | 6 258.1 | % | | | — | | | | — | |
State miscellaneous revenue | | | 7) | | | | 16.7 | | | | 7.4 | | | | 17.2 | | | | — | | | | — | | | | — | | | | — | |
| | | | | | | | | | | | | | | | | | | | | | | | | | | | | | | | |
TOTAL TAX REVENUE (gross) | | | | | | | 674 183.1 | | | | 742 649.7 | | | | 813 825.8 | | | | 899 000.0 | | | | 10.5 | % | | | 999 225.0 | | | | 993 650.0 | |
Non-tax revenue | | | 8) | | | | 16 474.0 | | | | 24 402.5 | | | | 28 087.1 | | | | 30 541.0 | | | | 8.7 | % | | | 20 869.4 | | | | 20 869.4 | |
Less: SACU payments | | | 9) | | | | -14 991.3 | | | | -21 760.0 | | | | -42 151.3 | | | | -43 374.4 | | | | 2.9 | % | | | -51 737.7 | | | | -51 737.7 | |
Other adjustment | | | 10) | | | | -2 914.4 | | | | — | | | | — | | | | — | | | | — | | | | — | | | | — | |
| | | | | | | | | | | | | | | | | | | | | | | | | | | | | | | | |
TOTAL MAIN BUDGET REVENUE | | | | | | | 672 751.5 | | | | 745 292.2 | | | | 799 761.7 | | | | 886 166.6 | | | | 10.8 | % | | | 968 356.8 | | | | 962 781.8 | |
| | | | | | | | | | | | | | | | | | | | | | | | | | | | | | | | |
Current revenue | | | | | | | 672 716.0 | | | | 745 177.5 | | | | 799 667.4 | | | | 886 099.9 | | | | 10.8 | % | | | 968 289.9 | | | | 962 714.9 | |
Direct taxes | | | | | | | 389 440.5 | | | | 437 854.7 | | | | 469 787.4 | | | | 519 017.6 | | | | 10.5 | % | | | 582 000.2 | | | | 571 750.2 | |
Indirect taxes | | | | | | | 284 726.0 | | | | 304 787.6 | | | | 344 021.2 | | | | 379 982.4 | | | | 10.5 | % | | | 417 224.9 | | | | 421 899.9 | |
State miscellaneous revenue | | | | | | | 16.7 | | | | 7.4 | | | | 17.2 | | | | — | | | | -100.0 | % | | | — | | | | — | |
Non-tax revenue (excluding sales of capital assets) | | | 11) | | | | 16 438.5 | | | | 24 287.7 | | | | 27 992.9 | | | | 30 474.2 | | | | 8.9 | % | | | 20 802.5 | | | | 20 802.5 | |
Less: SACU payments | | | | | | | -17 905.7 | | | | -21 760.0 | | | | -42 151.3 | | | | -43 374.4 | | | | 2.9 | % | | | -51 737.7 | | | | -51 737.7 | |
Sales of capital assets | | | | | | | 35.4 | | | | 114.7 | | | | 94.3 | | | | 66.8 | | | | -29.2 | % | | | 66.9 | | | | 66.9 | |
| | | | | | | | | | | | | | | | | | | | | | | | | | | | | | | | |
National Revenue Fund receipts | | | 12) | | | | 3 013.9 | | | | 5 209.2 | | | | 11 921.2 | | | | 11 789.7 | | | | -1.1 | % | | | 2 850.0 | | | | 2 850.0 | |
| | | | | | | | | | | | | | | | | | | | | | | | | | | | | | | | |
| 1) | Includes interest on overdue income tax, non-resident shareholders’ tax (prior to 1999/00), non-residents’ tax on interest (prior to 1999/00), undistributed profits tax (prior to 1999/00) and small business tax amnesty (in 2006/07, 2007/08 and 2008/09). |
| 2) | Levy on payroll dedicated to skills development. |
| 3) | The securities transfer tax replaced the uncertificated securities tax from 1 July 2008. The uncertificated securities tax replaced the marketable securities tax from 1 June 1999. |
| 4) | The value-added tax (VAT) replaced the general sales tax in September 1991. |
| 5) | Includes plastic bag levy (from 2004/05), Universal Service Fund (from 1998/99), Human Resources Fund and Universal Service Agency (in 1998/99 and 1999/00), levies on financial services (up to 2004/05) and carbon dioxide motor vehicle emissions tax (from 2010/11). Mining leases and ownership has been reclassified as non-tax revenue. The historical years from 1998/99 have been adjusted for comparative purposes. |
132
ANNEXURE B: STATISTICAL TABLES
| | | | | | | | | | | | | | | | | | | | | | | | | | | | |
| | | | | | | | | | | | | | | | | | | | | | | | | | | | Table 2 Main budget: estimates of national revenue Summary of revenue 1) |
| | | | |
| 2014/15 | | | 2015/16 | | | 2016/17 | | | | | | |
% change
on revised
2013/14 | | | % of
total budget
revenue | | | Estimates | | | % change
after tax proposals
2014/15 | | | Estimates | | | % change
on
2015/16 | | | | | | R million |
| | 10.2% | | | | 57.8 | % | | | 617 251.8 | | | | 10.8 | % | | | 684 841.2 | | | | 11.0 | % | | | | | | Taxes on income and profits |
| | 8.7% | | | | 34.9 | % | | | 372 359.2 | | | | 10.8 | % | | | 408 866.6 | | | | 9.8 | % | | | | | | Persons and individuals |
| | 12.4% | | | | 20.7 | % | | | 220 783.1 | | | | 11.0 | % | | | 249 136.9 | | | | 12.8 | % | | | | | | Companies |
| | 13.2% | | | | 2.0 | % | | | 21 019.0 | | | | 9.2 | % | | | 23 447.6 | | | | 11.6 | % | | | | | | Secondary tax on companies/Dividend tax |
| | — | | | | — | | | | — | | | | — | | | | — | | | | — | | | | | | | Tax on retirement funds |
| | 9.4% | | | | 0.3 | % | | | 3 090.5 | | | | 9.5 | % | | | 3 390.1 | | | | 9.7 | % | | | 1) | | | Other |
| | 9.3% | | | | 1.4 | % | | | 14 690.0 | | | | 9.3 | % | | | 16 140.0 | | | | 9.9 | % | | | | | | Taxes on payroll and workforce |
| | 9.3% | | | | 1.4 | % | | | 14 690.0 | | | | 9.3 | % | | | 16 140.0 | | | | 9.9 | % | | | 2) | | | Skills development levy |
| | 10.6% | | | | 1.2 | % | | | 12 546.4 | | | | 9.3 | % | | | 13 768.1 | | | | 9.7 | % | | | | | | Taxes on property |
| | 9.4% | | | | 0.0 | % | | | 134.2 | | | | 9.5 | % | | | 147.2 | | | | 9.7 | % | | | | | | Donations tax |
| | 9.4% | | | | 0.1 | % | | | 1 354.7 | | | | 9.5 | % | | | 1 486.0 | | | | 9.7 | % | | | | | | Estate duty |
| | 11.3% | | | | 0.4 | % | | | 4 452.9 | | | | 9.5 | % | | | 4 884.6 | | | | 9.7 | % | | | 3) | | | Securities transfer tax |
| | 10.4% | | | | 0.6 | % | | | 6 604.5 | | | | 9.1 | % | | | 7 250.3 | | | | 9.8 | % | | | | | | Transfer duties |
| | 10.8% | | | | 37.5 | % | | | 393 970.4 | | | | 9.0 | % | | | 429 925.0 | | | | 9.1 | % | | | | | | Domestic taxes on goods and services |
| | 11.6% | | | | 27.7 | % | | | 296 456.6 | | | | 11.0 | % | | | 328 696.0 | | | | 10.9 | % | | | 4) | | | Value-added tax |
| | 7.4% | | | | 3.2 | % | | | 32 105.5 | | | | 3.3 | % | | | 33 243.4 | | | | 3.5 | % | | | | | | Specific excise duties |
| | 9.2% | | | | 0.3 | % | | | 2 868.3 | | | | 9.4 | % | | | 3 142.4 | | | | 9.6 | % | | | | | | Ad valorem excise duties |
| | 9.7% | | | | 4.9 | % | | | 49 090.9 | | | | 3.3 | % | | | 50 830.8 | | | | 3.5 | % | | | | | | General fuel levy |
| | 9.4% | | | | 0.1 | % | | | 1 066.2 | | | | 9.5 | % | | | 1 169.6 | | | | 9.7 | % | | | | | | Air departure tax |
| | 7.3% | | | | 1.0 | % | | | 10 113.7 | | | | 3.3 | % | | | 10 472.1 | | | | 3.5 | % | | | | | | Electricity levy |
| | 3.8% | | | | 0.2 | % | | | 2 269.2 | | | | 4.2 | % | | | 2 370.7 | | | | 4.5 | % | | | 5) | | | Other |
| | 12.7% | | | | 5.2 | % | | | 56 641.5 | | | | 12.2 | % | | | 64 045.7 | | | | 13.1 | % | | | | | | Taxes on international trade and transactions |
| | 13.0% | | | | 5.2 | % | | | 56 521.0 | | | | 12.4 | % | | | 63 995.3 | | | | 13.2 | % | | | | | | Customs duties |
| | -40.8% | | | | 0.0 | % | | | 120.5 | | | | -25.9 | % | | | 50.4 | | | | -58.2 | % | | | 6) | | | Other |
| | — | | | | — | | | | — | | | | — | | | | — | | | | — | | | | | | | Stamp duties and fees |
| | — | | | | — | | | | — | | | | — | | | | — | | | | — | | | | 7) | | | State miscellaneous revenue |
| | | | | | | | | | | | | | | | | | | | | | | | | | | | |
| | 10.5% | | | | 103.2 | % | | | 1 095 100.0 | | | | 10.2 | % | | | 1 208 720.0 | | | | 10.4 | % | | | | | | TOTAL TAX REVENUE (gross) |
| | | | | | | |
| | -31.7% | | | | 2.2 | % | | | 20 315.6 | | | | -2.7 | % | | | 23 558.5 | | | | 16.0 | % | | | 8) | | | Non-tax revenue |
| | 19.3% | | | | -5.4 | % | | | -57 298.2 | | | | 10.7 | % | | | -59 680.3 | | | | 4.2 | % | | | 9) | | | Less: SACU payments |
| | — | | | | — | | | | — | | | | — | | | | — | | | | — | | | | 10) | | | Other adjustment |
| | | | | | | | | | | | | | | | | | | | | | | | | | | | |
| | 8.6% | | | | 100.0 | % | | | 1 058 117.4 | | | | 9.9 | % | | | 1 172 598.3 | | | | 10.8 | % | | | | | | TOTAL MAIN BUDGET REVENUE |
| | | | | | | | | | | | | | | | | | | | | | | | | | | | |
| | 8.6% | | | | 100.0 | % | | | 1 058 045.6 | | | | 9.9 | % | | | 1 172 523.2 | | | | 10.8 | % | | | | | | Current revenue |
| | 10.2% | | | | 59.4 | % | | | 633 430.7 | | | | 10.8 | % | | | 702 614.5 | | | | 10.9 | % | | | | | | Direct taxes |
| | 11.0% | | | | 43.8 | % | | | 461 669.3 | | | | 9.4 | % | | | 506 105.5 | | | | 9.6 | % | | | | | | Indirect taxes |
| | — | | | | — | | | | — | | | | — | | | | — | | | | — | | | | | | | State miscellaneous revenue |
| | -31.7% | | | | 2.2 | % | | | 20 243.9 | | | | -2.7 | % | | | 23 483.5 | | | | 16.0 | % | | | 11) | | | Non-tax revenue (excluding sales of capital assets) |
| | 19.3% | | | | -5.4 | % | | | -57 298.2 | | | | 10.7 | % | | | -59 680.3 | | | | 4.2 | % | | | | | | Less: SACU payments |
| | 0.2% | | | | 0.0 | % | | | 71.8 | | | | 7.3 | % | | | 75.0 | | | | 4.5 | % | | | | | | Sales of capital assets |
| | | | | | | | | | | | | | | | | | | | | | | | | | | | |
| | — | | | | 0.3 | % | | | 1 600.0 | | | | -43.9 | % | | | 3 400.0 | | | | 112.5 | % | | | 12) | | | National Revenue Fund receipts |
| | | | | | | | | | | | | | | | | | | | | | | | | | | | |
| 6) | Includes miscellaneous customs and excise receipts, ordinary levy (up to 2004/05) and diamond export duties. |
| 7) | Includes revenue received by SARS that could not be allocated to a specific revenue type. |
| 8) | Includes sales of goods and services, fines, penalties and forfeits, interest, dividends and rent on land (including mineral and petroleum royalties), sales of capital assets as well as transactions in financial assets and liabilities. |
| 9) | Payments in terms of SACU agreements. |
| 10) | Payment to SACU partners in respect of a previous error in calculation of the 1969 agreement. |
| 11) | Excludes sales of capital assets. |
| 12) | Previosuly classified as extraordinary revenue, includes sales of strategic fuel stocks, proceeds from sales of state assets and certain other receipts are, by law, paid into the National Revenue Fund. |
133
2014 BUDGET REVIEW
Table 3
Main budget: estimates of national revenue
Detailed classification of revenue
| | | | | | | | | | | | | | | | | | | | | | | | | | | | |
| | | | | | 2010/11 | | | 2011/12 | | | 2012/13 | |
R thousands | | | | | Actual
collections | | | Before
tax proposals | | | After
tax proposals | | | Revised
estimate | | | Actual
collection | |
Taxes on income and profits | | | | | | | 379 941 233 | | | | 426 583 730 | | | | 486 379 255 | | | | 475 729 255 | | | | 453 521 614 | | | | 457 313 835 | |
Income tax on persons and individuals | | | | | | | 226 925 026 | | | | 250 399 638 | | | | 295 769 650 | | | | 285 969 650 | | | | 274 020 092 | | | | 275 821 599 | |
Tax on corporate income | | | | | | | | | | | | | | | | | | | | | | | | | | | | |
Companies | | | | | | | 132 901 680 | | | | 151 626 676 | | | | 166 738 600 | | | | 167 838 600 | | | | 156 350 000 | | | | 159 259 228 | |
Secondary tax on companies/dividend tax | | | | | | | 17 178 189 | | | | 21 965 409 | | | | 21 000 000 | | | | 19 050 000 | | | | 21 000 000 | | | | 19 738 709 | |
Tax on retirement funds | | | | | | | 2 772 | | | | 6 665 | | | | — | | | | — | | | | — | | | | 159 | |
Other | | | | | | | | | | | | | | | | | | | | | | | | | | | | |
Interest on overdue income tax | | | | | | | 2 904 485 | | | | 2 585 012 | | | | 2 871 005 | | | | 2 871 005 | | | | 2 151 523 | | | | 2 493 543 | |
Small business tax amnesty | | | | | | | 29 080 | | | | 330 | | | | — | | | | — | | | | — | | | | 597 | |
Taxes on payroll and workforce | | | | | | | 8 652 340 | | | | 10 173 133 | | | | 11 131 211 | | | | 11 131 211 | | | | 11 400 000 | | | | 11 378 478 | |
Skills development levy | | | | | | | 8 652 340 | | | | 10 173 133 | | | | 11 131 211 | | | | 11 131 211 | | | | 11 400 000 | | | | 11 378 478 | |
Taxes on property | | | | | | | 9 102 302 | | | | 7 817 499 | | | | 8 627 127 | | | | 8 627 127 | | | | 8 200 060 | | | | 8 645 211 | |
Estate, inheritance and gift taxes | | | | | | | | | | | | | | | | | | | | | | | | | | | | |
Donations tax | | | | | | | 64 584 | | | | 52 657 | | | | 55 105 | | | | 55 105 | | | | 79 885 | | | | 82 101 | |
Estate duty | | | | | | | 782 325 | | | | 1 045 163 | | | | 1 220 731 | | | | 1 220 731 | | | | 820 175 | | | | 1 012 978 | |
Taxes on financial and capital transactions | | | | | | | | | | | | | | | | | | | | | | | | | | | | |
Securities transfer tax | | | 1) | | | | 2 932 906 | | | | 2 886 114 | | | | 3 104 972 | | | | 3 104 972 | | | | 3 200 000 | | | | 3 271 855 | |
Transfer duties | | | | | | | 5 322 487 | | | | 3 833 565 | | | | 4 246 319 | | | | 4 246 319 | | | | 4 100 000 | | | | 4 278 277 | |
Domestic taxes on goods and services | | | | | | | 249 490 373 | | | | 263 949 858 | | | | 286 212 004 | | | | 294 554 203 | | | | 298 935 231 | | | | 296 921 469 | |
Value-added tax | | | | | | | | | | | | | | | | | | | | | | | | | | | | |
Domestic VAT | | | | | | | 205 028 786 | | | | 220 215 115 | | | | 253 356 154 | | | | 253 356 154 | | | | 243 000 000 | | | | 242 416 471 | |
Import VAT | | | | | | | 82 188 621 | | | | 101 812 696 | | | | 112 572 760 | | | | 112 572 760 | | | | 112 000 000 | | | | 111 426 923 | |
Refunds | | | | | | | -103 645 967 | | | | -131 007 613 | | | | -156 254 063 | | | | -156 254 063 | | | | -138 000 000 | | | | -138 820 359 | |
Specific excise duties | | | | | | | | | | | | | | | | | | | | | | | | | | | | |
Beer | | | | | | | 7 006 915 | | | | 7 602 586 | | | | 7 934 824 | | | | 8 476 896 | | | | 8 252 288 | | | | 8 444 749 | |
Sorghum beer and sorghum flour | | | | | | | 35 959 | | | | 33 743 | | | | 38 281 | | | | 40 896 | | | | 35 750 | | | | 26 363 | |
Wine and other fermented beverages | | | | | | | 1 494 710 | | | | 1 875 112 | | | | 1 803 041 | | | | 1 926 217 | | | | 1 929 290 | | | | 2 053 458 | |
Spirits | | | | | | | 2 831 005 | | | | 3 399 456 | | | | 3 471 249 | | | | 3 708 389 | | | | 3 810 199 | | | | 4 257 562 | |
Cigarettes and cigarette tobacco | | | | | | | 9 367 944 | | | | 10 172 151 | | | | 10 984 624 | | | | 11 735 044 | | | | 11 460 139 | | | | 10 978 223 | |
Pipe tobacco and cigars | | | | | | | 485 745 | | | | 628 820 | | | | 745 992 | | | | 796 955 | | | | 710 660 | | | | 637 863 | |
Petroleum products | | | 2) | | | | 917 927 | | | | 924 433 | | | | 1 026 259 | | | | 1 096 369 | | | | 1 042 587 | | | | 929 222 | |
Revenue from neighbouring countries | | | 3) | | | | 827 409 | | | | 774 847 | | | | 928 251 | | | | 991 665 | | | | 1 119 259 | | | | 1 050 271 | |
Ad valorem excise duties | | | | | | | 1 596 229 | | | | 1 828 347 | | | | 1 999 920 | | | | 1 999 920 | | | | 2 189 711 | | | | 2 231 941 | |
General fuel levy | | | | | | | 34 417 577 | | | | 36 602 263 | | | | 38 258 220 | | | | 42 775 510 | | | | 40 500 000 | | | | 40 410 389 | |
Taxes on use of goods or permission to use goods or to perform activities | | | | | | | | | | | | | | | | | | | | | | | | | | | | |
Air passenger tax | | | | | | | 647 810 | | | | 762 416 | | | | 750 298 | | | | 750 298 | | | | 920 300 | | | | 873 060 | |
Plastic bags levy | | | | | | | 258 222 | | | | 53 832 | | | | 149 725 | | | | 149 725 | | | | 160 462 | | | | 150 817 | |
Electricity levy | | | | | | | 4 996 366 | | | | 6 429 721 | | | | 6 616 470 | | | | 8 601 470 | | | | 7 900 000 | | | | 7 983 940 | |
Incandescent light bulb levy | | | | | | | 151 083 | | | | 143 787 | | | | 110 000 | | | | 110 000 | | | | 129 817 | | | | 136 792 | |
CO2 tax - motor vehicle emissions | | | | | | | 625 891 | | | | 1 617 353 | | | | 1 610 000 | | | | 1 610 000 | | | | 1 570 016 | | | | 1 567 382 | |
Turnover tax for micro businesses | | | | | | | 2 802 | | | | 5 703 | | | | 10 000 | | | | 10 000 | | | | 4 686 | | | | 11 319 | |
Other | | | | | | | | | | | | | | | | | | | | | | | | | | | | |
Universal Service Fund | | | | | | | 255 341 | | | | 75 089 | | | | 100 000 | | | | 100 000 | | | | 200 068 | | | | 155 084 | |
Taxes on international trade and transactions | | | | | | | 26 977 132 | | | | 34 120 983 | | | | 36 359 673 | | | | 36 359 265 | | | | 38 093 426 | | | | 39 549 121 | |
Import duties | | | | | | | | | | | | | | | | | | | | | | | | | | | | |
Customs duties | | | | | | | 26 637 438 | | | | 34 197 901 | | | | 36 160 000 | | | | 36 160 000 | | | | 37 640 215 | | | | 38 997 933 | |
Other | | | | | | | | | | | | | | | | | | | | | | | | | | | | |
Miscellaneous customs and excise receipts | | | | | | | 269 304 | | | | -141 146 | | | | 150 000 | | | | 149 592 | | | | 399 834 | | | | 495 813 | |
Diamond export levy | | | | | | | 70 390 | | | | 64 229 | | | | 49 673 | | | | 49 673 | | | | 53 376 | | | | 55 375 | |
Other taxes | | | | | | | 3 069 | | | | -2 894 | | | | — | | | | — | | | | — | | | | 494 | |
Stamp duties and fees | | | | | | | 3 069 | | | | -2 894 | | | | — | | | | — | | | | — | | | | 494 | |
State miscellaneous revenue | | | 4) | | | | 16 698 | | | | 7 403 | | | | — | | | | — | | | | — | | | | 17 206 | |
| | | | | | | | | | | | | | | | | | | | | | | | | | | | |
TOTAL TAX REVENUE (gross) | | | | | | | 674 183 147 | | | | 742 649 713 | | | | 828 709 270 | | | | 826 401 062 | | | | 810 150 332 | | | | 813 825 815 | |
| | | | | | | | | | | | | | | | | | | | | | | | | | | | |
Less: SACU payments | | | 5) | | | | -17 905 679 | | | | -21 759 964 | | | | -42 151 276 | | | | -42 151 276 | | | | -42 151 276 | | | | -42 151 276 | |
Payments in terms of Customs Union agreements
(sec. 51(2) of Act 91 of 1964) | | | | | | | -14 991 309 | | | | -21 759 964 | | | | -42 151 276 | | | | -42 151 276 | | | | -42 151 276 | | | | -42 151 276 | |
Other adjustment | | | 6) | | | | -2 914 370 | | | | — | | | | — | | | | — | | | | — | | | | — | |
| | | | | | | | | | | | | | | | | | | | | | | | | | | | |
TOTAL TAX REVENUE (net of SACU payments) | | | | | | | 656 277 467 | | | | 720 889 749 | | | | 786 557 994 | | | | 784 249 786 | | | | 767 999 056 | | | | 771 674 539 | |
| | | | | | | | | | | | | | | | | | | | | | | | | | | | |
| 1) | The securities transfer tax replaced the uncertificated securities tax from 1 July 2008. |
| 2) | Specific excise duties on petrol, distillate fuel, residual fuel and base oil. |
134
ANNEXURE B: STATISTICAL TABLES
| | | | | | | | | | | | | | | | | | | | | | | | | | |
| | | | | | | | | | | | | | | | | | | | | | | | | | Table 3 Main budget: estimates of national revenue Detailed classification of revenue |
| | | |
| 2013/14 | | | 2014/15 | | | | | |
| Budget estimates | | | | | | % change on | | | | | | | | |
| Before | | | After | | | Revised | | | 2012/13 | | | Before | | | After | | | | | |
| tax proposals | | | estimate | | | actual | | | tax proposals | | | | | R thousands |
| | 509 595 117 | | | | 501 353 117 | | | | 505 474 658 | | | | 10.5 | % | | | 567 200 678 | | | | 556 950 678 | | | | | Taxes on income and profits |
| | 313 570 000 | | | | 306 188 000 | | | | 308 929 567 | | | | 12.0 | % | | | 346 193 993 | | | | 335 943 993 | | | | | Income tax on persons and individuals |
| | | | | | | | | | | | | | | | | | | | | | | | | | Tax on corporate income |
| | 170 690 004 | | | | 169 830 004 | | | | 176 965 091 | | | | 11.1 | % | | | 198 935 012 | | | | 198 935 012 | | | | | Companies |
| | 22 930 000 | | | | 22 930 000 | | | | 17 000 000 | | | | -13.9 | % | | | 19 249 861 | | | | 19 249 861 | | | | | Secondary tax on companies/dividend tax |
| | — | | | | — | | | | — | | | | -100.0 | % | | | — | | | | — | | | | | Tax on retirement funds |
| | | | | | | | | | | | | | | | | | | | | | | | | | Other |
| | 2 405 113 | | | | 2 405 113 | | | | 2 580 000 | | | | 3.5 | % | | | 2 821 812 | | | | 2 821 812 | | | | | Interest on overdue income tax |
| | — | | | | — | | | | — | | | | -100.0 | % | | | — | | | | — | | | | | Small business tax amnesty |
| | 12 403 000 | | | | 12 403 000 | | | | 12 299 914 | | | | 8.1 | % | | | 13 440 000 | | | | 13 440 000 | | | | | Taxes on payroll and workforce |
| | 12 403 000 | | | | 12 403 000 | | | | 12 299 914 | | | | 8.1 | % | | | 13 440 000 | | | | 13 440 000 | | | | | Skills development levy |
| | 9 070 000 | | | | 9 070 000 | | | | 10 375 309 | | | | 20.0 | % | | | 11 476 740 | | | | 11 476 740 | | | | | Taxes on property |
| | | | | | | | | | | | | | | | | | | | | | | | | | Estate, inheritance and gift taxes |
| | 90 000 | | | | 90 000 | | | | 112 057 | | | | 36.5 | % | | | 122 559 | | | | 122 559 | | | | | Donations tax |
| | 900 000 | | | | 900 000 | | | | 1 130 930 | | | | 11.6 | % | | | 1 236 927 | | | | 1 236 927 | | | | | Estate duty |
| | | | | | | | | | | | | | | | | | | | | | | | | | Taxes on financial and capital transactions |
| | 3 490 000 | | | | 3 490 000 | | | | 3 653 314 | | | | 11.7 | % | | | 4 065 723 | | | | 4 065 723 | | | 1) | | Securities transfer tax |
| | 4 590 000 | | | | 4 590 000 | | | | 5 479 008 | | | | 28.1 | % | | | 6 051 530 | | | | 6 051 530 | | | | | Transfer duties |
| | 327 513 673 | | | | 333 344 041 | | | | 326 044 162 | | | | 9.8 | % | | | 356 644 595 | | | | 361 319 595 | | | | | Domestic taxes on goods and services |
| | | | | | | | | | | | | | | | | | | | | | | | | | Value-added tax |
| | 272 104 000 | | | | 272 104 000 | | | | 262 804 129 | | | | 8.4 | % | | | 290 899 006 | | | | 290 899 006 | | | | | Domestic VAT |
| | 125 414 000 | | | | 125 414 000 | | | | 129 530 167 | | | | 16.2 | % | | | 151 659 162 | | | | 151 659 162 | | | | | Import VAT |
| | -154 528 000 | | | | -154 528 000 | | | | -153 048 071 | | | | 10.2 | % | | | -175 398 124 | | | | -175 398 124 | | | | | Refunds |
| | | | | | | | | | | | | | | | | | | | | | | | | | Specific excise duties |
| | 8 496 662 | | | | 9 172 709 | | | | 9 272 899 | | | | 9.8 | % | | | 9 260 423 | | | | 10 032 556 | | | | | Beer |
| | 36 809 | | | | 36 809 | | | | 10 443 | | | | -60.4 | % | | | 8 554 | | | | 8 554 | | | | | Sorghum beer and sorghum flour |
| | 1 986 422 | | | | 2 150 010 | | | | 2 297 308 | | | | 11.9 | % | | | 2 329 294 | | | | 2 507 571 | | | | | Wine and other fermented beverages |
| | 3 923 030 | | | | 4 333 663 | | | | 3 406 992 | | | | -20.0 | % | | | 3 269 473 | | | | 3 734 063 | | | | | Spirits |
| | 11 799 507 | | | | 12 538 090 | | | | 11 460 871 | | | | 4.4 | % | | | 11 573 227 | | | | 12 223 953 | | | | | Cigarettes and cigarette tobacco |
| | 731 705 | | | | 807 854 | | | | 488 311 | | | | -23.4 | % | | | 448 919 | | | | 493 194 | | | | | Pipe tobacco and cigars |
| | 1 073 461 | | | | 1 073 461 | | | | 932 330 | | | | 0.3 | % | | | 941 653 | | | | 941 653 | | | 2) | | Petroleum products |
| | 1 152 403 | | | | 1 152 403 | | | | 1 073 521 | | | | 128.7 | % | | | 1 138 247 | | | | 1 138 247 | | | 3) | | Revenue from neighbouring countries |
| | 2 400 000 | | | | 2 400 000 | | | | 2 401 519 | | | | 1 840.0 | % | | | 2 622 603 | | | | 2 622 603 | | | | | Ad valorem excise duties |
| | 41 700 000 | | | | 44 970 000 | | | | 43 300 000 | | | | — | | | | 44 951 564 | | | | 47 516 564 | | | | | General fuel levy |
| | | | | | | | | | | | | | | | | | | | | | | | | | Taxes on use of goods or permission to use goods or to perform activities |
| | 950 000 | | | | 950 000 | | | | 890 069 | | | | 1.9 | % | | | 973 491 | | | | 973 491 | | | | | Air passenger tax |
| | 170 000 | | | | 260 000 | | | | 209 234 | | | | 38.7 | % | | | 233 258 | | | | 233 258 | | | | | Plastic bags levy |
| | 8 130 000 | | | | 8 130 000 | | | | 9 125 545 | | | | 14.3 | % | | | 9 789 314 | | | | 9 789 314 | | | | | Electricity levy |
| | 133 673 | | | | 183 673 | | | | 108 938 | | | | -20.4 | % | | | 112 087 | | | | 112 087 | | | | | Incandescent light bulb levy |
| | 1 620 000 | | | | 1 975 368 | | | | 1 636 848 | | | | 4.4 | % | | | 1 684 160 | | | | 1 684 160 | | | | | CO2 tax - motor vehicle emissions |
| | 10 000 | | | | 10 000 | | | | 16 038 | | | | 41.7 | % | | | 17 541 | | | | 17 541 | | | | | Turnover tax for micro businesses |
| | | | | | | | | | | | | | | | | | | | | | | | | | Other |
| | 210 000 | | | | 210 000 | | | | 127 070 | | | | -18.1 | % | | | 130 742 | | | | 130 742 | | | | | Universal Service Fund |
| | 41 833 712 | | | | 41 833 712 | | | | 44 774 576 | | | | 13.2 | % | | | 50 463 020 | | | | 50 463 020 | | | | | Taxes on international trade and transactions |
| | | | | | | | | | | | | | | | | | | | | | | | | | Import duties |
| | 41 340 000 | | | | 41 340 000 | | | | 44 500 067 | | | | 14.1 | % | | | 50 300 410 | | | | 50 300 410 | | | | | Customs duties |
| | | | | | | | | | | | | | | | | | | | | | | | | | Other |
| | 438 162 | | | | 438 162 | | | | 206 353 | | | | -58.4 | % | | | 81 845 | | | | 81 845 | | | | | Miscellaneous customs and excise receipts |
| | 55 550 | | | | 55 550 | | | | 68 156 | | | | 23.1 | % | | | 80 765 | | | | 80 765 | | | | | Diamond export levy |
| | — | | | | — | | | | 31 381 | | | | 6 258.1 | % | | | — | | | | — | | | | | Other taxes |
| | — | | | | — | | | | 31 381 | | | | 6 258.1 | % | | | — | | | | — | | | | | Stamp duties and fees |
| | — | | | | — | | | | — | | | | -100.0 | % | | | — | | | | — | | | 4) | | State miscellaneous revenue |
| | | | | | | | | | | | | | | | | | | | | | | | | | |
| | 900 415 502 | | | | 898 003 870 | | | | 899 000 000 | | | | 10.5 | % | | | 999 225 032 | | | | 993 650 032 | | | | | TOTAL TAX REVENUE (gross) |
| | | | | | | | | | | | | | | | | | | | | | | | | | |
| | -43 374 338 | | | | -43 374 338 | | | | -43 374 384 | | | | 2.9 | % | | | -51 737 656 | | | | -51 737 656 | | | 5) | | Less: SACU payments |
| | | | | | | | | | | | | | | | | | | | | | | | | | Payments in terms of Customs Union agreements |
| | -43 374 338 | | | | -43 374 338 | | | | -43 374 384 | | | | 2.9 | % | | | -51 737 656 | | | | -51 737 656 | | | | | (sec.51(2) of Act 91 of 1964) |
| | — | | | | — | | | | — | | | | — | | | | — | | | | — | | | 6) | | Other adjustment |
| | | | | | | | | | | | | | | | | | | | | | | | | | |
| | 857 041 164 | | | | 854 629 532 | | | | 855 625 616 | | | | 10.9 | % | | | 947 487 375 | | | | 941 912 375 | | | | | TOTAL TAX REVENUE (net of SACU payments) |
| | | | | | | | | | | | | | | | | | | | | | | | | | |
| 3) | Excise duties that are collected by Botswana, Lesotho, Namibia and Swaziland. |
| 4) | Revenue received by SARS in respect of taxation that could not be allocated to specific revenue types. |
| 5) | Payments in terms of SACU agreements. |
135
2014 BUDGET REVIEW
Table 3
Main budget: estimates of national revenue
Detailed classification of revenue
| | | | | | | | | | | | | | | | | | | | | | | | | | | | |
| | | | | | 2010/11 | | | 2011/12 | | | 2012/13 | |
R thousands | | | | | Actual
collections | | | Before
tax proposals | | | After tax
proposals | | | Revised
estimate | | | Actual
collection | |
TOTAL TAX REVENUE (net of SACU payments) | | | | | | | 656 277 467 | | | | 720 889 749 | | | | 786 557 994 | | | | 784 249 786 | | | | 767 999 056 | | | | 771 674 539 | |
| | | | | | | | | | | | | | | | | | | | | | | | | | | | |
Sales of goods and services other than capital assets | | | | | | | 2 334 548 | | | | 2 894 042 | | | | 2 408 056 | | | | 2 408 056 | | | | 2 112 578 | | | | 2 620 530 | |
Sales of goods and services produced by departments | | | | | | | | | | | | | | | | | | | | | | | | | | | | |
Sales by market establishments | | | 7) | | | | 43 791 | | | | 54 466 | | | | 43 194 | | | | 43 194 | | | | 161 647 | | | | 53 191 | |
Administrative fees | | | | | | | 1 691 144 | | | | 2 194 810 | | | | 1 727 650 | | | | 1 727 650 | | | | 1 332 472 | | | | 1 877 132 | |
Other sales | | | | | | | 578 107 | | | | 626 597 | | | | 606 150 | | | | 606 150 | | | | 595 744 | | | | 674 578 | |
Sales of scrap, waste, arms and other used current goods | | | | | | | 21 506 | | | | 18 169 | | | | 31 063 | | | | 31 063 | | | | 22 715 | | | | 15 629 | |
Transfers received | | | | | | | 250 895 | | | | 360 296 | | | | 168 561 | | | | 168 561 | | | | 280 407 | | | | 571 490 | |
Fines, penalties and forfeits | | | | | | | 1 457 092 | | | | 934 175 | | | | 951 887 | | | | 951 887 | | | | 864 565 | | | | 992 518 | |
Interest, dividends and rent on land | | | | | | | 8 169 730 | | | | 10 340 657 | | | | 10 673 670 | | | | 10 673 670 | | | | 10 152 489 | | | | 10 221 277 | |
Interest | | | | | | | | | | | | | | | | | | | | | | | | | | | | |
Cash and cash equivalents | | | | | | | 123 241 | | | | 233 616 | | | | 79 178 | | | | 79 178 | | | | 110 933 | | | | 110 933 | |
Interest on loan | | | | | | | — | | | | — | | | | — | | | | — | | | | — | | | | — | |
Exchequer investments | | | | | | | 2 400 884 | | | | 1 790 784 | | | | 2 305 000 | | | | 2 305 000 | | | | 3 137 000 | | | | 3 113 765 | |
Dividends | | | | | | | | | | | | | | | | | | | | | | | | | | | | |
Airports Company South Africa | | | | | | | — | | | | — | | | | — | | | | — | | | | — | | | | — | |
South African Special Risks Insurance Association | | | | | | | 153 299 | | | | — | | | | 135 981 | | | | 135 981 | | | | 135 981 | | | | — | |
Vodacom | | | | | | | 735 018 | | | | 1 118 057 | | | | 1 174 065 | | | | 1 174 065 | | | | 1 666 721 | | | | 1 666 721 | |
Industrial Development Corporation | | | | | | | — | | | | — | | | | 101 124 | | | | 101 124 | | | | 50 000 | | | | — | |
Reserve Bank (National Treasury) | | | | | | | — | | | | 126 656 | | | | — | | | | — | | | | — | | | | 156 900 | |
Telkom | | | | | | | 258 810 | | | | 300 219 | | | | 315 230 | | | | 315 230 | | | | — | | | | — | |
Public Investment Corporation | | | | | | | — | | | | — | | | | — | | | | — | | | | — | | | | — | |
Other | | | | | | | 50 000 | | | | 50 000 | | | | | | | | | | | | — | | | | 50 106 | |
Rent on land | | | | | | | | | | | | | | | | | | | | | | | | | | | | |
Mineral and petroleum royalties | | | 8) | | | | 3 554 722 | | | | 5 611 539 | | | | 6 510 000 | | | | 6 510 000 | | | | 5 000 000 | | | | 5 015 037 | |
Mining leases and ownership | | | 9) | | | | 860 238 | | | | 79 732 | | | | — | | | | — | | | | — | | | | 11 107 | |
Royalties, prospecting fees and surface rental | | | 10) | | | | 21 744 | | | | 89 193 | | | | — | | | | — | | | | — | | | | 87 001 | |
Land rent | | | | | | | 11 774 | | | | 6 054 | | | | 53 092 | | | | 53 092 | | | | 51 854 | | | | 9 707 | |
Sales of capital assets | | | | | | | 35 448 | | | | 114 745 | | | | 64 294 | | | | 64 294 | | | | 91 076 | | | | 94 294 | |
Financial transactions in assets and liabilities | | | 11) | | | | 4 226 273 | | | | 9 758 546 | | | | 2 024 496 | | | | 2 024 496 | | | | 12 018 181 | | | | 13 587 036 | |
| | | | | | | | | | | | | | | | | | | | | | | | | | | | |
TOTAL NON-TAX REVENUE | | | 12) | | | | 16 473 986 | | | | 24 402 461 | | | | 16 290 964 | | | | 16 290 964 | | | | 25 519 296 | | | | 28 087 145 | |
| | | | | | | | | | | | | | | | | | | | | | | | | | | | |
TOTAL MAIN BUDGET REVENUE | | | | | | | 672 751 453 | | | | 745 292 210 | | | | 802 848 959 | | | | 800 540 750 | | | | 793 518 351 | | | | 799 761 684 | |
| | | | | | | | | | | | | | | | | | | | | | | | | | | | |
National Revenue Fund receipts | | | | | | | 3 013 914 | | | | 5 209 227 | | | | 1 200 000 | | | | 1 200 000 | | | | 11 044 117 | | | | 11 921 228 | |
Revaluation profits on foreign currency transactions | | | | | | | 86 524 | | | | 640 938 | | | | | | | | | | | | 100 000 | | | | 939 005 | |
Premiums on loan transactions | | | | | | | 1 689 646 | | | | 3 483 031 | | | | 1 200 000 | | | | 1 200 000 | | | | 10 500 000 | | | | 10 541 967 | |
Liquidation of South African Special Risks Insurance Association investment | | | | | | | 150 000 | | | | 227 987 | | | | | | | | | | | | 50 000 | | | | 50 000 | |
Saambou Bank curatorship | | | | | | | 20 000 | | | | 30 000 | | | | | | | | | | | | | | | | — | |
Profits on the gold and foreign exchange contingency reserve account | | | | | | | — | | | | 794 283 | | | | | | | | | | | | — | | | | — | |
Equalisation Fund account transfer | | | | | | | 700 000 | | | | — | | | | | | | | | | | | — | | | | — | |
Other | | | | | | | 1 235 | | | | 24 712 | | | | | | | | | | | | 6 499 | | | | 2 638 | |
Special dividends from Telkom | | | | | | | 362 333 | | | | — | | | | | | | | | | | | — | | | | — | |
Surplus cash from Independent Communications Authority of South Africa | | | | | | | 4 176 | | | | 8 276 | | | | | | | | | | | | — | | | | — | |
2010 FIFA close-up project | | | | | | | — | | | | — | | | | | | | | | | | | — | | | | — | |
Electricity Distribution Industry Holding Company | | | | | | | — | | | | — | | | | | | | | | | | | 387 618 | | | | 387 618 | |
| 6) | Payment to SACU partners in respect of a previous error in calculation of the 1969 agreement. |
| 7) | New item introduced on the standard chart of accounts from 2008/09. |
| 8) | Mineral royalties imposed on the transfer of mineral resources in terms of the Mineral and Petroleum Resources Royalty Act (2008), which came into operation on 1 May 2009. |
| 9) | Mining leases and ownership has been reclassified as non-tax revenue. The historical years from 1998/99 have been adjusted for comparative purposes. |
| 10) | Royalties, prospecting fees and surface rental collected by the Department of Minerals and Energy. |
136
ANNEXURE B: STATISTICAL TABLES
| | | | | | | | | | | | | | | | | | | | | | | | | | | | |
| | | | | | | | | | | | | | | | | | | | | | | | | | | | Table 3 Main budget: estimates of national revenue Detailed classification of revenue |
| | | |
| 2013/14 | | | 2014/15 | | | | | | |
| Budget estimates | | | | | | % change on | | | | | | | | | | | | |
| Before | | | After | | | Revised | | | 2012/13 | | | Before | | | After | | | | | | |
| tax proposals | | | estimate | | | actual | | | tax proposals | | | | | | R thousands |
| | 857 041 164 | | | | 854 629 532 | | | | 855 625 616 | | | | 10.9 | % | | | 947 487 375 | | | | 941 912 375 | | | | | | | TOTAL TAX REVENUE (net of SACU payments) |
| | | | | | | | | | | | | | | | | | | | | | | | | | | | |
| | 2 071 628 | | | | 2 071 628 | | | | 3 124 638 | | | | 19.2 | % | | | 2 721 087 | | | | 2 721 087 | | | | | | | Sales of goods and services other than capital assets |
| | | | | | | | | | | | | | | | | | | | | | | | | | | | Sales of goods and services produced by departments |
| | 44 767 | | | | 44 767 | | | | 50 505 | | | | -5.0 | % | | | 52 859 | | | | 52 859 | | | | 7) | | | Sales by market establishments |
| | 1 338 706 | | | | 1 338 706 | | | | 2 389 336 | | | | 27.3 | % | | | 1 981 629 | | | | 1 981 629 | | | | | | | Administrative fees |
| | 657 666 | | | | 657 666 | | | | 652 316 | | | | -3.3 | % | | | 655 436 | | | | 655 436 | | | | | | | Other sales |
| | 30 489 | | | | 30 489 | | | | 32 481 | | | | 107.8 | % | | | 31 163 | | | | 31 163 | | | | | | | Sales of scrap, waste, arms and other used current goods |
| | 171 207 | | | | 171 207 | | | | 171 939 | | | | -69.9 | % | | | 174 635 | | | | 174 635 | | | | | | | Transfers received |
| | 1 103 517 | | | | 1 103 517 | | | | 2 348 314 | | | | 136.6 | % | | | 1 257 552 | | | | 1 257 552 | | | | | | | Fines, penalties and forfeits |
| | 10 606 858 | | | | 10 606 858 | | | | 10 950 894 | | | | 7.1 | % | | | 12 077 856 | | | | 12 077 856 | | | | | | | Interest, dividends and rent on land |
| | | | | | | | | | | | | | | | | | | | | | | | | | | | Interest |
| | 78 877 | | | | 78 877 | | | | 1 725 554 | | | | 1 455.5 | % | | | 1 473 621 | | | | 1 473 621 | | | | | | | Cash and cash equivalents |
| | 681 000 | | | | 681 000 | | | | 320 000 | | | | — | | | | 711 000 | | | | 711 000 | | | | | | | Interest on loan |
| | 1 700 000 | | | | 1 700 000 | | | | 100 000 | | | | -96.8 | % | | | 110 000 | | | | 110 000 | | | | | | | Exchequer investments |
| | | | | | | | | | | | | | | | | | | | | | | | | | | | Dividends |
| | — | | | | — | | | | — | | | | — | | | | — | | | | — | | | | | | | Airports Company South Africa |
| | 142 639 | | | | 142 639 | | | | 119 694 | | | | — | | | | 119 777 | | | | 119 777 | | | | | | | South African Special Risks Insurance Association |
| | 1 666 721 | | | | 1 666 721 | | | | 1 708 130 | | | | 2.5 | % | | | 1 666 721 | | | | 1 666 721 | | | | | | | Vodacom |
| | 50 000 | | | | 50 000 | | | | — | | | | — | | | | — | | | | — | | | | | | | Industrial Development Corporation |
| | — | | | | — | | | | 86 909 | | | | -44.6 | % | | | 70 000 | | | | 70 000 | | | | | | | Reserve Bank (National Treasury) |
| | | | | | | | | — | | | | — | | | | 347 541 | | | | 347 541 | | | | | | | Telkom |
| | 330 991 | | | | 330 991 | | | | — | | | | — | | | | — | | | | — | | | | | | | Public Investment Corporation |
| | | | | | | | | 51 948 | | | | | | | | 52 046 | | | | 52 046 | | | | | | | Other |
| | | | | | | | | | | | | | | | | | | | | | | | | | | | Rent on land |
| | 5 900 000 | | | | 5 900 000 | | | | 6 500 000 | | | | 29.6 | % | | | 7 166 790 | | | | 7 166 790 | | | | 8) | | | Mineral and petroleum royalties |
| | — | | | | — | | | | 46 078 | | | | -47.0 | % | | | 49 303 | | | | 49 303 | | | | 9) | | | Mining leases and ownership |
| | — | | | | — | | | | — | | | | -100.0 | % | | | — | | | | — | | | | 10) | | | Royalties, prospecting fees and surface rental |
| | 56 630 | | | | 56 630 | | | | 12 581 | | | | 29.6 | % | | | 11 057 | | | | 11 057 | | | | | | | Land rent |
| | 65 695 | | | | 65 695 | | | | 66 765 | | | | -29.2 | % | | | 66 905 | | | | 66 905 | | | | | | | Sales of capital assets |
| | 9 309 487 | | | | 9 309 487 | | | | 13 878 456 | | | | 2.1 | % | | | 4 571 347 | | | | 4 571 347 | | | | 11) | | | Financial transactions in assets and liabilities |
| | | | | | | | | | | | | | | | | | | | | | | | | | | | |
| | 23 328 392 | | | | 23 328 392 | | | | 30 541 006 | | | | 8.7 | % | | | 20 869 382 | | | | 20 869 382 | | | | | | | TOTAL NON-TAX REVENUE |
| | | | | | | | | | | | | | | | | | | | | | | | | | | | |
| | 880 369 556 | | | | 877 957 924 | | | | 886 166 622 | | | | 10.8 | % | | | 968 356 757 | | | | 962 781 757 | | | | | | | TOTAL MAIN BUDGET REVENUE |
| | | | | | | | | | | | | | | | | | | | | | | | | | | | |
| | 4 992 000 | | | | 4 992 000 | | | | 11 789 675 | | | | | | | | 2 850 000 | | | | 2 850 000 | | | | | | | National Revenue Fund receipts |
| | 252 000 | | | | 252 000 | | | | 5 664 542 | | | | | | | | 2 850 000 | | | | 2 850 000 | | | | | | | Revaluation profits on foreign currency transactions |
| | 4 740 000 | | | | 4 740 000 | | | | 5 615 035 | | | | | | | | — | | | | — | | | | | | | Premiums on loan transactions |
| | | | | | | | | 75 000 | | | | | | | | — | | | | — | | | | | | | Liquidation of South African Special Risks Insurance Association investment |
| | | | | | | | | — | | | | | | | | — | | | | — | | | | | | | Saambou Bank curatorship |
| | | | | | | | | — | | | | | | | | — | | | | — | | | | | | | Profits on the gold and foreign exchange contingency reserve account |
| | | | | | | | | — | | | | | | | | — | | | | — | | | | | | | Equalisation Fund account transfer |
| | | | | | | | | 7 743 | | | | | | | | — | | | | — | | | | | | | Other |
| | | | | | | | | — | | | | | | | | — | | | | — | | | | | | | Special dividends from Telkom |
| | | | | | | | | 8 795 | | | | | | | | — | | | | — | | | | | | | Surplus cash from Independent Communications Authority of South Africa |
| | | | | | | | | 381 560 | | | | | | | | — | | | | — | | | | | | | 2010 FIFA close-up project |
| | | | | | | | | 37 000 | | | | | | | | — | | | | — | | | | | | | Electricity Distribution Industry Holding Company |
| 11) | Includes recoveries of loans and advances. |
| 12) | Includes National Revenue Fund receipts previously accounted for separately. |
137
2014 BUDGET REVIEW
Table 4
Main budget: expenditure defrayed from the
National Revenue Fund by vote
| | | | | | | | | | | | | | | | | | | | | | | | |
| | | | | | 2010/11 | | | 2011/12 | |
| | | | | | Expenditure | | | of which | | | Expenditure | | | of which | |
R million | | | | | on budget
vote
outcome | | | transfers
to
provinces 1) | | | transfers to
local
government 2) | | | on budget
vote
outcome | | | transfers
to
provinces 1) | |
| The Presidency | | | | | | | 958.7 | | | | — | | | | — | | | | 979.1 | | | | — | |
| Parliament | | | | | | | 1 198.9 | | | | — | | | | — | | | | 1 214.8 | | | | — | |
| Cooperative Governance and Traditional Affairs | | | | | | | 41 821.4 | | | | 214.4 | | | | 40 456.9 | | | | 46 221.6 | | | | 15.1 | |
of which: local government equitable share | | | | | | | — | | | | — | | | | 30 540.6 | | | | — | | | | — | |
| Home Affairs | | | | | | | 6 619.8 | | | | — | | | | — | | | | 5 752.5 | | | | — | |
| International Relations and Cooperation | | | | | | | 4 417.2 | | | | — | | | | — | | | | 5 021.8 | | | | — | |
| Performance Monitoring and Evaluation | | | | | | | 47.3 | | | | — | | | | — | | | | 95.6 | | | | — | |
| Public Works | | | | | | | 6 615.1 | | | | 2 104.3 | | | | 279.6 | | | | 7 061.4 | | | | 2 229.0 | |
| Women, Children and People with Disabilities | | | | | | | 109.9 | | | | — | | | | — | | | | 165.9 | | | | — | |
| Government Communication and Information System | | | | | | | 352.2 | | | | — | | | | — | | | | 343.6 | | | | — | |
| National Treasury | | | | | | | 38 226.2 | | | | — | | | | 1 196.4 | | | | 21 362.0 | | | | 1 089.7 | |
| Public Enterprises | | | | | | | 540.0 | | | | — | | | | — | | | | 346.1 | | | | — | |
| Public Service and Administration | | | | | | | 628.2 | | | | — | | | | — | | | | 645.5 | | | | — | |
| Statistics South Africa | | | | | | | 1 694.9 | | | | — | | | | — | | | | 3 674.4 | | | | — | |
| Arts and Culture | | | | | | | 2 248.8 | | | | 462.4 | | | | — | | | | 2 405.8 | | | | 569.9 | |
| Basic Education | | | | | | | 8 677.9 | | | | 7 078.6 | | | | — | | | | 12 900.9 | | | | 10 357.7 | |
| Health | | | | | | | 22 520.3 | | | | 21 042.0 | | | | — | | | | 25 712.8 | | | | 24 034.8 | |
| Higher Education and Training | | | | | | | 23 752.4 | | | | 3 804.0 | | | | — | | | | 28 281.7 | | | | 4 375.3 | |
| Labour | | | | | | | 1 826.3 | | | | — | | | | — | | | | 2 007.1 | | | | — | |
| Social Development | | | | | | | 94 031.0 | | | | — | | | | — | | | | 103 139.2 | | | | — | |
| Sport and Recreation South Africa | | | | | | | 1 252.0 | | | | 426.4 | | | | 512.6 | | | | 810.6 | | | | 452.0 | |
| Correctional Services | | | | | | | 14 698.8 | | | | — | | | | — | | | | 16 276.8 | | | | — | |
| Defence and Military Veterans | | | | | | | 30 442.4 | | | | — | | | | — | | | | 34 331.4 | | | | — | |
| Independent Police Investigative Directorate | | | | | | | 128.4 | | | | — | | | | — | | | | 153.5 | | | | — | |
| Justice and Constitutional Development | | | | | | | 10 586.8 | | | | — | | | | — | | | | 11 470.4 | | | | — | |
| Police | | | | | | | 53 529.7 | | | | — | | | | — | | | | 57 933.1 | | | | — | |
| Agriculture, Forestry and Fisheries | | | | | | | 3 830.0 | | | | 1 125.7 | | | | — | | | | 4 905.3 | | | | 1 651.7 | |
| Communications | | | | | | | 1 426.5 | | | | — | | | | — | | | | 1 792.0 | | | | — | |
| Economic Development | | | | | | | 400.7 | | | | — | | | | — | | | | 577.6 | | | | — | |
| Energy | | | | | | | 5 505.4 | | | | — | | | | 1 253.4 | | | | 6 174.3 | | | | — | |
| Environmental Affairs | | | | | | | 3 300.1 | | | | — | | | | — | | | | 4 131.5 | | | | — | |
| Human Settlements | | | | | | | 18 916.5 | | | | 13 032.1 | | | | 4 968.0 | | | | 22 598.9 | | | | 15 121.5 | |
| Mineral Resources | | | | | | | 994.7 | | | | — | | | | — | | | | 1 029.4 | | | | — | |
| Rural Development and Land Reform | | | | | | | 7 122.9 | | | | — | | | | — | | | | 7 997.7 | | | | — | |
| Science and Technology | | | | | | | 4 051.9 | | | | — | | | | — | | | | 4 403.5 | | | | — | |
| Tourism | | | | | | | 1 143.5 | | | | — | | | | — | | | | 1 250.2 | | | | — | |
| Trade and Industry | | | | | | | 5 796.7 | | | | — | | | | — | | | | 6 801.0 | | | | — | |
| Transport | | | | | | | 29 155.1 | | | | 8 392.5 | | | | 3 709.9 | | | | 41 196.5 | | | | 10 855.9 | |
| Water Affairs | | | | | | | 7 023.7 | | | | — | | | | 984.6 | | | | 8 164.9 | | | | — | |
| | | | | | | | | | | | | | | | | | | | | | | | |
| Total appropriation by vote | | | | | | | 455 592.4 | | | | 57 682.4 | | | | 53 361.3 | | | | 499 330.6 | | | | 70 752.7 | |
| Direct charges against the National Revenue Fund | | | | | | | | | | | | | | | | | | | | | | | | |
| President’s salary (The Presidency) | | | | | | | 4.0 | | | | — | | | | — | | | | 4.0 | | | | — | |
| Members’ remuneration (Parliament) | | | | | | | 346.0 | | | | — | | | | — | | | | 357.6 | | | | — | |
| Debt-service costs (National Treasury) | | | | | | | 66 226.8 | | | | — | | | | — | | | | 76 460.0 | | | | — | |
| Provincial equitable share (National Treasury) | | | 4) | | | | 265 139.4 | | | | 265 139.4 | | | | — | | | | 291 735.5 | | | | 291 735.5 | |
General fuel levy sharing with metropolitan municipalities (National Treasury) | | | | | | | 7 542.4 | | | | — | | | | 7 542.4 | | | | 8 573.1 | | | | — | |
| National Revenue Fund payments (National Treasury) | | | | | | | 838.6 | | | | — | | | | — | | | | 1 388.3 | | | | — | |
of which: | | | | | | | | | | | | | | | | | | | | | | | | |
Defrayal of the gold and foreign exchange contingency reserve account losses | | | | | | | 172.8 | | | | — | | | | — | | | | 940.1 | | | | — | |
Revaluation losses on foreign currency transactions | | | | | | | 439.1 | | | | — | | | | — | | | | 448.2 | | | | — | |
Premiums on loan transactions | | | | | | | 226.7 | | | | — | | | | — | | | | — | | | | — | |
| Skills levy and SETAs (Higher Education and Training) | | | | | | | 8 379.3 | | | | — | | | | — | | | | 10 025.3 | | | | — | |
| Judges’ and magistrates’ salaries (Justice and Constitutional Development) | | | | | | | 1 910.2 | | | | — | | | | — | | | | 2 037.1 | | | | — | |
| | | | | | | | | | | | | | | | | | | | | | | | |
| Total direct charges against the National Revenue Fund | | | | | | | 350 386.7 | | | | 265 139.4 | | | | 7 542.4 | | | | 390 580.9 | | | | 291 735.5 | |
| Unallocated | | | | | | | — | | | | — | | | | — | | | | — | | | | — | |
| Contingency reserve | | | | | | | — | | | | — | | | | — | | | | — | | | | — | |
| Projected underspending | | | | | | | — | | | | — | | | | — | | | | — | | | | — | |
| Local government repayment to the National Revenue Fund | | | | | | | — | | | | — | | | | — | | | | — | | | | — | |
| | | | | | | | | | | | | | | | | | | | | | | | |
| Main budget expenditure | | | | | | | 805 979.1 | | | | 322 821.8 | | | | 60 903.7 | | | | 889 911.5 | | | | 362 488.2 | |
| | | | | | | | | | | | | | | | | | | | | | | | |
| 1) | Includes provincial equitable share and conditional grants allocated to provinces. |
| 2) | Includes local government equitable share and conditional grants allocated to local government as well as general fuel levy sharing with metropolitan municipalities. |
138
ANNEXURE B: STATISTICAL TABLES
| | | | | | | | | | | | | | | | | | | | | | | | | | | | |
| | | | | | | | | | | | | | | | | | | | | | | | | | | | Table 4 Main budget: expenditure defrayed from the National Revenue Fund by vote |
| | | | |
| 2011/12 | | | 2012/13 | | | 2013/14 | | | | | | |
| of which | | | Expenditure | | | of which | | | | | | | | | | | | |
transfers
to local
government 2) | | | on budget
vote
outcome | | | transfers
to
provinces 1) | | | transfers
to local
government 2) | | | Budget
estimate 3) | | | Adjusted
appro-
priation | | | | | | R million |
| | — | | | | 982.1 | | | | — | | | | — | | | | 1 092.9 | | | | 1 092.9 | | | | | | | The Presidency |
| | — | | | | 1 297.9 | | | | — | | | | — | | | | 1 419.4 | | | | 1 419.4 | | | | | | | Parliament |
| | 44 869.1 | | | | 53 434.4 | | | | 0.9 | | | | 51 321.9 | | | | 58 252.7 | | | | 58 458.9 | | | | | | | Cooperative Governance and Traditional Affairs |
| | 33 173.2 | | | | — | | | | — | | | | 37 139.5 | | | | — | | | | — | | | | | | | of which: local government equitable share |
| | — | | | | 5 513.5 | | | | — | | | | — | | | | 6 567.8 | | | | 6 994.7 | | | | | | | Home Affairs |
| | — | | | | 5 185.1 | | | | — | | | | — | | | | 5 548.4 | | | | 5 754.6 | | | | | | | International Relations and Cooperation |
| | — | | | | 160.2 | | | | — | | | | — | | | | 192.7 | | | | 192.7 | | | | | | | Performance Monitoring and Evaluation |
| | 363.9 | | | | 7 203.9 | | | | 2 308.4 | | | | 661.5 | | | | 6 170.0 | | | | 6 175.3 | | | | | | | Public Works |
| | — | | | | 179.9 | | | | — | | | | — | | | | 198.3 | | | | 198.3 | | | | | | | Women, Children and People with Disabilities |
| | — | | | | 397.2 | | | | — | | | | — | | | | 396.7 | | | | 437.2 | | | | | | | Government Communication and Information System |
| | 1 162.0 | | | | 21 019.0 | | | | — | | | | 1 056.3 | | | | 25 556.0 | | | | 25 232.3 | | | | | | | National Treasury |
| | — | | | | 1 367.0 | | | | — | | | | — | | | | 236.9 | | | | 294.1 | | | | | | | Public Enterprises |
| | — | | | | 703.7 | | | | — | | | | — | | | | 816.4 | | | | 829.7 | | | | | | | Public Service and Administration |
| | — | | | | 1 761.7 | | | | — | | | | — | | | | 1 737.7 | | | | 1 741.6 | | | | | | | Statistics South Africa |
| | — | | | | 2 656.5 | | | | 564.6 | | | | — | | | | 2 914.8 | | | | 2 914.8 | | | | | | | Arts and Culture |
| | — | | | | 14 885.9 | | | | 11 205.9 | | | | — | | | | 17 591.9 | | | | 17 619.3 | | | | | | | Basic Education |
| | — | | | | 27 898.9 | | | | 26 071.7 | | | | — | | | | 30 706.7 | | | | 30 528.2 | | | | | | | Health |
| | — | | | | 31 582.4 | | | | 4 844.6 | | | | — | | | | 34 322.4 | | | | 34 333.9 | | | | | | | Higher Education and Training |
| | — | | | | 2 034.6 | | | | — | | | | — | | | | 2 415.2 | | | | 2 445.2 | | | | | | | Labour |
| | — | | | | 111 115.6 | | | | — | | | | — | | | | 120 491.6 | | | | 118 511.6 | | | | | | | Social Development |
| | — | | | | 1 054.1 | | | | 469.6 | | | | 123.1 | | | | 1 073.5 | | | | 1 073.5 | | | | | | | Sport and Recreation South Africa |
| | — | | | | 17 313.6 | | | | — | | | | — | | | | 18 748.1 | | | | 18 748.5 | | | | | | | Correctional Services |
| | — | | | | 37 702.2 | | | | — | | | | — | | | | 40 243.3 | | | | 40 658.2 | | | | | | | Defence and Military Veterans |
| | — | | | | 171.4 | | | | — | | | | — | | | | 217.0 | | | | 217.0 | | | | | | | Independent Police Investigative Directorate |
| | — | | | | 12 911.2 | | | | — | | | | — | | | | 14 134.2 | | | | 14 206.5 | | | | | | | Justice and Constitutional Development |
| | — | | | | 63 156.6 | | | | — | | | | — | | | | 67 917.1 | | | | 68 791.4 | | | | | | | Police |
| | — | | | | 5 813.2 | | | | 2 062.4 | | | | — | | | | 6 178.0 | | | | 6 182.3 | | | | | | | Agriculture, Forestry and Fisheries |
| | — | | | | 1 651.2 | | | | — | | | | — | | | | 2 043.9 | | | | 2 372.1 | | | | | | | Communications |
| | — | | | | 673.5 | | | | — | | | | — | | | | 771.5 | | | | 771.5 | | | | | | | Economic Development |
| | 1 376.6 | | | | 6 659.0 | | | | — | | | | 1 351.4 | | | | 6 598.2 | | | | 6 503.2 | | | | | | | Energy |
| | — | | | | 4 942.7 | | | | — | | | | — | | | | 5 431.2 | | | | 5 206.8 | | | | | | | Environmental Affairs |
| | 6 267.0 | | | | 24 463.3 | | | | 15 395.0 | | | | 7 392.2 | | | | 28 110.5 | | | | 28 255.5 | | | | | | | Human Settlements |
| | — | | | | 1 173.6 | | | | — | | | | — | | | | 1 393.8 | | | | 1 393.8 | | | | | | | Mineral Resources |
| | — | | | | 8 919.6 | | | | — | | | | — | | | | 9 459.7 | | | | 9 459.7 | | | | | | | Rural Development and Land Reform |
| | — | | | | 4 973.3 | | | | — | | | | — | | | | 6 198.2 | | | | 6 198.2 | | | | | | | Science and Technology |
| | — | | | | 1 372.0 | | | | — | | | | — | | | | 1 500.6 | | | | 1 520.6 | | | | | | | Tourism |
| | — | | | | 8 286.4 | | | | — | | | | — | | | | 9 572.6 | | | | 9 515.6 | | | | | | | Trade and Industry |
| | 4 647.1 | | | | 39 328.2 | | | | 12 299.1 | | | | 4 921.7 | | | | 42 275.3 | | | | 42 401.7 | | | | | | | Transport |
| | 992.3 | | | | 8 641.5 | | | | — | | | | 562.4 | | | | 10 187.0 | | | | 10 375.6 | | | | | | | Water Affairs |
| | | | | | | | | | | | | | | | | | | | | | | | | | | | |
| | 59 678.1 | | | | 538 586.0 | | | | 75 222.2 | | | | 67 390.7 | | | | 588 682.1 | | | | 589 026.4 | | | | | | | Total appropriation by vote |
| | | | | | | | | | | | | | | | | | | | | | | | | | | | Direct charges against the National Revenue Fund |
| | — | | | | 2.6 | | | | — | | | | — | | | | 2.8 | | | | 2.8 | | | | | | | President’s salary (The Presidency) |
| | — | | | | 389.1 | | | | — | | | | — | | | | 453.8 | | | | 453.8 | | | | | | | Members’ remuneration (Parliament) |
| | — | | | | 88 121.1 | | | | — | | | | — | | | | 99 741.4 | | | | 100 484.5 | | | | | | | Debt-service costs (National Treasury) |
| | — | | | | 313 015.8 | | | | 313 015.8 | | | | — | | | | 337 572.4 | | | | 338 936.8 | | | | 4) | | | Provincial equitable share (National Treasury) |
| | 8 573.1 | | | | 9 039.7 | | | | — | | | | 9 039.7 | | | | 9 613.4 | | | | 9 613.4 | | | | | | | General fuel levy sharing with metropolitan municipalities (National Treasury) |
| | — | | | | 2 587.2 | | | | — | | | | — | | | | 930.0 | | | | 200.0 | | | | | | | National Revenue Fund payments (National Treasury) |
| | | | | | | | | | | | | | | | | | | | | | | | | | | | of which: |
| | — | | | | 152.5 | | | | — | | | | — | | | | — | | | | 28.0 | | | | | | | Defrayal of the gold and foreign exchange contingency reserve account losses |
| | — | | | | 263.1 | | | | — | | | | — | | | | — | | | | — | | | | | | | Revaluation losses on foreign currency transactions |
| | — | | | | 2 171.6 | | | | — | | | | — | | | | 930.0 | | | | 172.0 | | | | | | | Premiums on loan transactions |
| | — | | | | 11 694.5 | | | | — | | | | — | | | | 12 403.0 | | | | 12 300.0 | | | | | | | Skills levy and SETAs (Higher Education and Training) |
| | — | | | | 2 059.6 | | | | — | | | | — | | | | 2 575.7 | | | | 2 575.7 | | | | | | | Judges’ and magistrates’ salaries (Justice and Constitutional Development) |
| | | | | | | | | | | | | | | | | | | | | | | | | | | | |
| | 8 573.1 | | | | 426 909.6 | | | | 313 015.8 | | | | 9 039.7 | | | | 463 292.5 | | | | 464 567.0 | | | | | | | Total direct charges against the National Revenue Fund |
| | — | | | | — | | | | — | | | | — | | | | 30.0 | | | | — | | | | | | | Unallocated |
| | — | | | | — | | | | — | | | | — | | | | 4 000.0 | | | | — | | | | | | | Contingency reserve |
| | — | | | | — | | | | — | | | | — | | | | — | | | | -3 500.0 | | | | | | | Projected underspending |
| | — | | | | — | | | | — | | | | — | | | | — | | | | -500.0 | | | | | | | Local government repayment to the National Revenue Fund |
| | | | | | | | | | | | | | | | | | | | | | | | | | | | |
| | 68 251.2 | | | | 965 495.6 | | | | 388 238.0 | | | | 76 430.4 | | | | 1 056 004.6 | | | | 1 049 593.4 | | | | | | | Main budget expenditure |
| | | | | | | | | | | | | | | | | | | | �� | | | | | | | | |
| 3) | Budget estimate adjusted for function shifts. |
| 4) | Provincial equitable share, excluding conditional grants to provinces. |
139
2014 BUDGET REVIEW
Table 4
Main budget: expenditure defrayed from the
National Revenue Fund by vote
| | | | | | | | | | | | | | | | | | | | | | | | | | | | |
| | | | | | 2013/14 | | | 2014/15 | |
| | | | | | | | | of which | | | | | | of which | |
R million | | | | | Projected
vote
outturn | | | transfers
to
provinces 1) | | | transfers
to local
government 2) | | | Budget
estimate | | | transfers
to
provinces 1) | | | transfers
to local
government 2) | |
The Presidency | | | | | | | 1 092.9 | | | | — | | | | — | | | | 1 177.8 | | | | — | | | | — | |
Parliament | | | | | | | 1 419.4 | | | | — | | | | — | | | | 1 508.2 | | | | — | | | | — | |
Cooperative Governance and Traditional Affairs | | | | | | | 57 402.9 | | | | 38.1 | | | | 54 748.7 | | | | 63 212.7 | | | | 197.4 | | | | 59 827.0 | |
of which: local government equitable share | | | | | | | — | | | | — | | | | 39 789.0 | | | | — | | | | — | | | | 44 490.1 | |
Home Affairs | | | | | | | 6 994.7 | | | | — | | | | — | | | | 6 623.7 | | | | — | | | | — | |
International Relations and Cooperation | | | | | | | 5 754.6 | | | | — | | | | — | | | | 5 754.3 | | | | — | | | | — | |
Performance Monitoring and Evaluation | | | | | | | 192.7 | | | | — | | | | — | | | | 208.2 | | | | — | | | | — | |
Public Works | | | | | | | 6 025.3 | | | | 614.5 | | | | 611.3 | | | | 6 121.3 | | | | 606.9 | | | | 594.6 | |
Women, Children and People with Disabilities | | | | | | | 198.3 | | | | — | | | | — | | | | 218.5 | | | | — | | | | — | |
Government Communication and Information System | | | | | | | 437.2 | | | | — | | | | — | | | | 413.1 | | | | — | | | | — | |
National Treasury | | | | | | | 25 191.8 | | | | — | | | | 1 161.3 | | | | 27 265.0 | | | | — | | | | 1 399.7 | |
Public Enterprises | | | | | | | 294.1 | | | | — | | | | — | | | | 259.8 | | | | — | | | | — | |
Public Service and Administration | | | | | | | 829.7 | | | | — | | | | — | | | | 875.1 | | | | — | | | | — | |
Statistics South Africa | | | | | | | 1 741.6 | | | | — | | | | — | | | | 2 242.5 | | | | — | | | | — | |
Arts and Culture | | | | | | | 2 775.3 | | | | 597.8 | | | | — | | | | 3 524.7 | | | | 1 016.2 | | | | — | |
Basic Education | | | | | | | 16 117.9 | | | | 11 836.5 | | | | — | | | | 19 680.1 | | | | 13 169.5 | | | | — | |
Health | | | | | | | 30 128.2 | | | | 27 686.4 | | | | — | | | | 33 955.5 | | | | 30 111.3 | | | | — | |
Higher Education and Training | | | | | | | 34 328.0 | | | | 2 454.2 | | | | — | | | | 36 866.7 | | | | 2 631.3 | | | | — | |
Labour | | | | | | | 2 445.2 | | | | — | | | | — | | | | 2 527.3 | | | | — | | | | — | |
Social Development | | | | | | | 117 811.6 | | | | — | | | | — | | | | 128 799.4 | | | | 29.0 | | | | — | |
Sport and Recreation South Africa | | | | | | | 1 047.0 | | | | 497.6 | | | | 120.0 | | | | 970.4 | | | | 525.6 | | | | — | |
Correctional Services | | | | | | | 18 748.5 | | | | — | | | | — | | | | 19 721.1 | | | | — | | | | — | |
Defence and Military Veterans | | | | | | | 40 658.2 | | | | — | | | | — | | | | 42 831.2 | | | | — | | | | — | |
Independent Police Investigative Directorate | | | | | | | 217.0 | | | | — | | | | — | | | | 234.7 | | | | — | | | | — | |
Justice and Constitutional Development | | | | | | | 13 856.5 | | | | — | | | | — | | | | 15 161.9 | | | | — | | | | — | |
Police | | | | | | | 68 791.4 | | | | — | | | | — | | | | 72 507.2 | | | | — | | | | — | |
Agriculture, Forestry and Fisheries | | | | | | | 6 182.3 | | | | 2 151.8 | | | | — | | | | 6 692.4 | | | | 2 389.1 | | | | — | |
Communications | | | | | | | 2 369.1 | | | | — | | | | — | | | | 1 593.4 | | | | — | | | | — | |
Economic Development | | | | | | | 771.5 | | | | — | | | | — | | | | 696.9 | | | | — | | | | — | |
Energy | | | | | | | 6 487.2 | | | | — | | | | 1 815.5 | | | | 7 415.6 | | | | — | | | | 1 241.6 | |
Environmental Affairs | | | | | | | 5 206.8 | | | | — | | | | — | | | | 5 668.4 | | | | — | | | | — | |
Human Settlements | | | | | | | 28 205.5 | | | | 17 028.3 | | | | 9 183.6 | | | | 30 521.4 | | | | 17 084.4 | | | | 10 632.3 | |
Mineral Resources | | | | | | | 1 369.4 | | | | — | | | | — | | | | 1 471.3 | | | | — | | | | — | |
Rural Development and Land Reform | | | | | | | 9 459.7 | | | | — | | | | — | | | | 9 455.3 | | | | — | | | | — | |
Science and Technology | | | | | | | 6 198.2 | | | | — | | | | — | | | | 6 470.2 | | | | — | | | | — | |
Tourism | | | | | | | 1 520.6 | | | | — | | | | — | | | | 1 662.1 | | | | — | | | | — | |
Trade and Industry | | | | | | | 9 442.8 | | | | — | | | | — | | | | 9 835.0 | | | | — | | | | — | |
Transport | | | | | | | 41 879.9 | | | | 13 090.3 | | | | 5 602.2 | | | | 48 726.5 | | | | 14 194.2 | | | | 5 946.1 | |
Water Affairs | | | | | | | 9 895.6 | | | | — | | | | 813.9 | | | | 12 480.3 | | | | — | | | | 983.7 | |
| | | | | | �� | | | | | | | | | | | | | | | | | | | | | | |
Total appropriation by vote | | | | | | | 583 488.6 | | | | 75 995.4 | | | | 74 056.5 | | | | 635 349.4 | | | | 81 955.0 | | | | 80 625.0 | |
Direct charges against the National Revenue Fund | | | | | | | | | | | | | | | | | | | | | | | | | | | | |
President’s salary (The Presidency) | | | | | | | 2.8 | | | | — | | | | — | | | | 3.0 | | | | — | | | | — | |
Members’ remuneration (Parliament) | | | | | | | 453.8 | | | | — | | | | — | | | | 481.0 | | | | — | | | | — | |
Debt-service costs (National Treasury) | | | | | | | 101 255.9 | | | | — | | | | — | | | | 114 900.5 | | | | — | | | | — | |
Provincial equitable share (National Treasury) | | | 4) | | | | 338 936.8 | | | | 338 936.8 | | | | — | | | | 362 468.1 | | | | 362 468.1 | | | | — | |
General fuel levy sharing with metropolitan municipalities (National Treasury) | | | | | | | 9 613.4 | | | | — | | | | 9 613.4 | | | | 10 190.2 | | | | — | | | | 10 190.2 | |
National Revenue Fund payments (National Treasury) | | | | | | | 482.0 | | | | — | | | | — | | | | — | | | | — | | | | — | |
of which: | | | | | | | | | | | | | | | | | | | | | | | | | | | | |
Defrayal of the gold and foreign exchange contingency reserve account losses | | | | | | | 28.1 | | | | — | | | | — | | | | — | | | | — | | | | — | |
Revaluation losses on foreign currency transactions | | | | | | | — | | | | — | | | | — | | | | — | | | | — | | | | — | |
Premiums on loan transactions | | | | | | | 453.9 | | | | — | | | | — | | | | — | | | | — | | | | — | |
Skills levy and SETAs (Higher Education and Training) | | | | | | | 12 300.0 | | | | — | | | | — | | | | 13 440.0 | | | | — | | | | — | |
Judges’ and magistrates’ salaries (Justice and Constitutional Development) | | | | | | | 2 575.7 | | | | — | | | | — | | | | 2 730.3 | | | | — | | | | — | |
| | | | | | | | | | | | | | | | | | | | | | | | | | | | |
Total direct charges against the National Revenue Fund | | | | | | | 465 620.3 | | | | 338 936.8 | | | | 9 613.4 | | | | 504 213.0 | | | | 362 468.1 | | | | 10 190.2 | |
Unallocated | | | | | | | — | | | | — | | | | — | | | | — | | | | — | | | | — | |
Contingency reserve | | | | | | | — | | | | — | | | | — | | | | 3 000.0 | | | | — | | | | — | |
Projected underspending | | | | | | | — | | | | — | | | | — | | | | — | | | | — | | | | — | |
Local government repayment to the National Revenue Fund | | | | | | | — | | | | — | | | | — | | | | — | | | | — | | | | — | |
| | | | | | | | | | | | | | | | | | | | | | | | | | | | |
Main budget expenditure | | | | | | | 1 049 108.9 | | | | 414 932.2 | | | | 83 669.9 | | | | 1 142 562.4 | | | | 444 423.1 | | | | 90 815.1 | |
| | | | | | | | | | | | | | | | | | | | | | | | | | | | |
| 1) | Includes provincial equitable share and conditional grants allocated to provinces. |
| 2) | Includes local government equitable share and conditional grants allocated to local government as well as general fuel levy sharing with metropolitan municipalities. |
140
ANNEXURE B: STATISTICAL TABLES
| | | | | | | | | | | | | | | | | | | | | | | | | | |
| | | | | | | | | | | | | | | | | | | | | | | | | | Table 4 Main budget: expenditure defrayed from the National Revenue Fund by vote |
| | | |
| 2015/16 | | | 2016/17 | | | | | |
| | | | of which | | | | | | of which | | | | | |
Budget
estimate | | | transfers
to
provinces 1) | | | transfers
to local
government 2) | | | Budget
estimate | | | transfers
to
provinces 1) | | | transfers
to local
government 2) | | | | | R million |
| | 1 228.8 | | | | — | | | | — | | | | 1 307.1 | | | | — | | | | — | | | | | The Presidency |
| | 1 594.3 | | | | — | | | | — | | | | 1 688.2 | | | | — | | | | — | | | | | Parliament |
| | 69 640.7 | | | | 204.3 | | | | 65 965.1 | | | | 74 252.3 | | | | 215.2 | | | | 69 306.8 | | | | | Cooperative Governance and Traditional Affairs |
| | — | | | | — | | | | 50 207.7 | | | | — | | | | — | | | | 52 868.7 | | | | | of which: local government equitable share |
| | 6 560.8 | | | | — | | | | — | | | | 7 406.5 | | | | — | | | | — | | | | | Home Affairs |
| | 6 033.9 | | | | — | | | | — | | | | 6 410.7 | | | | — | | | | — | | | | | International Relations and Cooperation |
| | 219.7 | | | | — | | | | — | | | | 232.7 | | | | — | | | | — | | | | | Performance Monitoring and Evaluation |
| | 6 545.3 | | | | 624.1 | | | | 619.0 | | | | 7 139.2 | | | | 786.5 | | | | 706.0 | | | | | Public Works |
| | 230.2 | | | | — | | | | — | | | | 243.6 | | | | — | | | | — | | | | | Women, Children and People with Disabilities |
| | 430.8 | | | | — | | | | — | | | | 456.4 | | | | — | | | | — | | | | | Government Communication and Information System |
| | 27 520.5 | | | | — | | | | 1 465.0 | | | | 25 939.8 | | | | — | | | | 1 558.2 | | | | | National Treasury |
| | 279.3 | | | | — | | | | — | | | | 285.6 | | | | — | | | | — | | | | | Public Enterprises |
| | 876.8 | | | | — | | | | — | | | | 929.3 | | | | — | | | | — | | | | | Public Service and Administration |
| | 2 183.9 | | | | — | | | | — | | | | 2 149.6 | | | | — | | | | — | | | | | Statistics South Africa |
| | 3 971.8 | | | | 1 340.6 | | | | — | | | | 4 185.2 | | | | 1 411.6 | | | | — | | | | | Arts and Culture |
| | 21 890.2 | | | | 15 827.0 | | | | — | | | | 23 097.5 | | | | 16 662.0 | | | | — | | | | | Basic Education |
| | 36 631.3 | | | | 32 484.4 | | | | — | | | | 39 387.7 | | | | 35 183.9 | | | | — | | | | | Health |
| | 39 650.0 | | | | 2 818.6 | | | | — | | | | 41 783.2 | | | | 2 974.0 | | | | — | | | | | Higher Education and Training |
| | 2 678.4 | | | | — | | | | — | | | | 3 048.1 | | | | — | | | | — | | | | | Labour |
| | 137 660.1 | | | | 47.5 | | | | — | | | | 146 158.4 | | | | 47.5 | | | | — | | | | | Social Development |
| | 1 015.8 | | | | 549.8 | | | | — | | | | 1 072.2 | | | | 579.0 | | | | — | | | | | Sport and Recreation South Africa |
| | 20 795.3 | | | | — | | | | — | | | | 22 080.9 | | | | — | | | | — | | | | | Correctional Services |
| | 45 301.3 | | | | — | | | | — | | | | 48 180.5 | | | | — | | | | — | | | | | Defence and Military Veterans |
| | 247.2 | | | | — | | | | — | | | | 262.3 | | | | — | | | | — | | | | | Independent Police Investigative Directorate |
| | 15 914.8 | | | | — | | | | — | | | | 17 163.8 | | | | — | | | | — | | | | | Justice and Constitutional Development |
| | 76 541.3 | | | | — | | | | — | | | | 81 682.9 | | | | — | | | | — | | | | | Police |
| | 6 621.2 | | | | 2 238.1 | | | | — | | | | 6 674.2 | | | | 2 336.1 | | | | — | | | | | Agriculture, Forestry and Fisheries |
| | 1 887.5 | | | | — | | | | — | | | | 2 074.8 | | | | — | | | | — | | | | | Communications |
| | 885.4 | | | | — | | | | — | | | | 717.3 | | | | — | | | | — | | | | | Economic Development |
| | 7 988.6 | | | | — | | | �� | 2 244.4 | | | | 8 384.9 | | | | — | | | | 2 368.9 | | | | | Energy |
| | 5 980.3 | | | | — | | | | — | | | | 6 559.5 | | | | — | | | | — | | | | | Environmental Affairs |
| | 32 842.4 | | | | 18 532.6 | | | | 11 005.8 | | | | 34 452.6 | | | | 20 409.6 | | | | 11 656.5 | | | | | Human Settlements |
| | 1 599.2 | | | | — | | | | — | | | | 1 664.1 | | | | — | | | | — | | | | | Mineral Resources |
| | 9 574.5 | | | | — | | | | — | | | | 10 673.3 | | | | — | | | | — | | | | | Rural Development and Land Reform |
| | 7 554.3 | | | | — | | | | — | | | | 7 634.8 | | | | — | | | | — | | | | | Science and Technology |
| | 1 863.2 | | | | — | | | | — | | | | 2 076.4 | | | | — | | | | — | | | | | Tourism |
| | 10 927.7 | | | | — | | | | — | | | | 11 983.5 | | | | — | | | | — | | | | | Trade and Industry |
| | 53 814.0 | | | | 15 005.0 | | | | 6 238.7 | | | | 56 842.0 | | | | 15 609.8 | | | | 6 569.3 | | | | | Transport |
| | 16 084.2 | | | | — | | | | 1 850.4 | | | | 17 199.9 | | | | — | | | | 1 797.2 | | | | | Water Affairs |
| | | | | | | | | | | | | | | | | | | | | | | | | | |
| | 683 265.0 | | | | 89 671.9 | | | | 89 388.3 | | | | 723 480.8 | | | | 96 215.0 | | | | 93 962.8 | | | | | Total appropriation by vote |
| | | | | | | | | | | | | | | | | | | | | | | | | | Direct charges against the National Revenue Fund |
| | 3.1 | | | | — | | | | — | | | | 3.3 | | | | — | | | | — | | | | | President’s salary (The Presidency) |
| | 503.1 | | | | — | | | | — | | | | 529.8 | | | | — | | | | — | | | | | Members’ remuneration (Parliament) |
| | 126 646.8 | | | | — | | | | — | | | | 139 200.6 | | | | — | | | | — | | | | | Debt-service costs (National Treasury) |
| | 387 967.5 | | | | 387 967.5 | | | | — | | | | 412 038.8 | | | | 412 038.8 | | | | — | | | 4) | | Provincial equitable share (National Treasury) |
| | 10 658.9 | | | | — | | | | 10 658.9 | | | | 11 223.8 | | | | — | | | | 11 223.8 | | | | | General fuel levy sharing with metropolitan municipalities (National Treasury) |
| | — | | | | — | | | | — | | | | — | | | | — | | | | — | | | | | National Revenue Fund payments (National Treasury) |
| | | | | | | | | | | | | | | | | | | | | | | | | | of which: |
| | — | | | | — | | | | — | | | | — | | | | — | | | | — | | | | | Defrayal of the gold and foreign exchange contingency reserve account losses |
| | — | | | | — | | | | — | | | | — | | | | — | | | | — | | | | | Revaluation losses on foreign currency transactions |
| | — | | | | — | | | | — | | | | — | | | | — | | | | — | | | | | Premiums on loan transactions |
| | 14 690.0 | | | | — | | | | — | | | | 16 140.0 | | | | — | | | | — | | | | | Skills levy and SETAs (Higher Education and Training) |
| | 2 855.9 | | | | — | | | | — | | | | 3 007.2 | | | | — | | | | — | | | | | Judges’ and magistrates’ salaries (Justice and Constitutional Development) |
| | | | | | | | | | | | | | | | | | | | | | | | | | |
| | 543 325.3 | | | | 387 967.5 | | | | 10 658.9 | | | | 582 143.6 | | | | 412 038.8 | | | | 11 223.8 | | | | | Total direct charges against the National Revenue Fund |
| | — | | | | — | | | | — | | | | — | | | | — | | | | — | | | | | Unallocated |
| | 6 000.0 | | | | — | | | | — | | | | 18 000.0 | | | | — | | | | — | | | | | Contingency reserve |
| | — | | | | — | | | | — | | | | — | | | | — | | | | — | | | | | Projected underspending |
| | — | | | | — | | | | — | | | | — | | | | — | | | | — | | | | | Local government repayment to the National Revenue Fund |
| | | | | | | | | | | | | | | | | | | | | | | | | | |
| | 1 232 590.3 | | | | 477 639.3 | | | | 100 047.2 | | | | 1 323 624.3 | | | | 508 253.8 | | | | 105 186.6 | | | | | Main budget expenditure |
| | | | | | | | | | | | | | | | | | | | | | | | | | |
| 3) | Budget estimate adjusted for function shifts. |
| 4) | Provincial equitable share excluding conditional grants to provinces. |
141
2014 BUDGET REVIEW
Table 5
Consolidated national, provincial and social security
funds expenditure: economic classification 1)
| | | | | | | | | | | | | | | | | | | | | | | | | | | | | | | | |
| | | | | | 2010/11 | | | 2011/12 | | | 2012/13 | | | 2013/14 | |
R million | | | | | Outcome | | | % of
total | | | Outcome | | | % of
total | | | Outcome | | | % of
total | | | Revised
estimate | |
Current payments | | | | | | | 458 299.6 | | | | 54.6 | % | | | 512 602.4 | | | | 55.6 | % | | | 558 280.9 | | | | 55.7 | % | | | 612 107.7 | |
Compensation of employees | | | | | | | 281 651.2 | | | | 33.6 | % | | | 314 711.0 | | | | 34.1 | % | | | 341 079.0 | | | | 34.0 | % | | | 373 861.3 | |
Goods and services | | | | | | | 109 970.0 | | | | 13.1 | % | | | 121 249.5 | | | | 13.1 | % | | | 128 937.0 | | | | 12.9 | % | | | 136 869.2 | |
Interest and rent on land | | | | | | | 66 678.4 | | | | 7.9 | % | | | 76 641.9 | | | | 8.3 | % | | | 88 264.9 | | | | 8.8 | % | | | 101 377.3 | |
Transfers and subsidies | | | | | | | 323 881.5 | | | | 38.6 | % | | | 365 293.5 | | | | 39.6 | % | | | 394 034.5 | | | | 39.3 | % | | | 425 341.3 | |
Provinces and municipalities | | | | | | | 65 173.0 | | | | 7.8 | % | | | 72 183.8 | | | | 7.8 | % | | | 81 183.9 | | | | 8.1 | % | | | 88 659.1 | |
of which: local government share | | | 2) | | | | 53 361.3 | | | | 6.4 | % | | | 59 678.1 | | | | 6.5 | % | | | 67 390.7 | | | | 6.7 | % | | | 74 056.5 | |
Departmental agencies and accounts | | | | | | | 64 152.1 | | | | 7.6 | % | | | 80 134.6 | | | | 8.7 | % | | | 81 395.6 | | | | 8.1 | % | | | 87 188.7 | |
Higher education institutions | | | | | | | 17 869.0 | | | | 2.1 | % | | | 19 721.8 | | | | 2.1 | % | | | 21 290.2 | | | | 2.1 | % | | | 22 555.2 | |
Foreign governments and international organisations | | | | | | | 1 234.5 | | | | 0.1 | % | | | 1 313.8 | | | | 0.1 | % | | | 1 400.6 | | | | 0.1 | % | | | 1 952.5 | |
Public corporations and private enterprises | | | | | | | 25 623.8 | | | | 3.1 | % | | | 28 563.8 | | | | 3.1 | % | | | 31 353.5 | | | | 3.1 | % | | | 32 184.3 | |
Public corporations | | | | | | | 21 474.9 | | | | 2.6 | % | | | 22 825.0 | | | | 2.5 | % | | | 24 823.9 | | | | 2.5 | % | | | 24 589.2 | |
Subsidies on products and production | | | | | | | 9 982.9 | | | | 1.2 | % | | | 10 175.1 | | | | 1.1 | % | | | 11 413.7 | | | | 1.1 | % | | | 10 906.5 | |
Other transfers | | | | | | | 11 492.0 | | | | 1.4 | % | | | 12 649.8 | | | | 1.4 | % | | | 13 410.1 | | | | 1.3 | % | | | 13 682.7 | |
Private enterprises | | | | | | | 4 148.9 | | | | 0.5 | % | | | 5 738.8 | | | | 0.6 | % | | | 6 529.7 | | | | 0.7 | % | | | 7 595.1 | |
Subsidies on products and production | | | | | | | 1 412.8 | | | | 0.2 | % | | | 2 332.1 | | | | 0.3 | % | | | 3 216.1 | | | | 0.3 | % | | | 3 839.7 | |
Other transfers | | | | | | | 2 736.1 | | | | 0.3 | % | | | 3 406.7 | | | | 0.4 | % | | | 3 313.6 | | | | 0.3 | % | | | 3 755.4 | |
Non-profit institutions | | | | | | | 17 695.7 | | | | 2.1 | % | | | 21 021.0 | | | | 2.3 | % | | | 22 301.3 | | | | 2.2 | % | | | 26 621.2 | |
Households | | | | | | | 132 133.4 | | | | 15.7 | % | | | 142 354.7 | | | | 15.4 | % | | | 155 109.4 | | | | 15.5 | % | | | 166 180.2 | |
Social benefits | | | | | | | 112 004.8 | | | | 13.3 | % | | | 120 669.0 | | | | 13.1 | % | | | 131 605.7 | | | | 13.1 | % | | | 143 695.7 | |
Other transfers to households | | | | | | | 20 128.6 | | | | 2.4 | % | | | 21 685.8 | | | | 2.4 | % | | | 23 503.7 | | | | 2.3 | % | | | 22 484.5 | |
Payments for capital assets | | | | | | | 34 428.2 | | | | 4.1 | % | | | 41 464.5 | | | | 4.5 | % | | | 44 486.5 | | | | 4.4 | % | | | 42 119.2 | |
Buildings and other fixed structures | | | | | | | 25 705.3 | | | | 3.1 | % | | | 31 764.3 | | | | 3.4 | % | | | 34 921.5 | | | | 3.5 | % | | | 35 340.5 | |
Buildings | | | | | | | 15 949.1 | | | | 1.9 | % | | | 19 001.4 | | | | 2.1 | % | | | 18 812.0 | | | | 1.9 | % | | | 18 296.6 | |
Other fixed structures | | | | | | | 9 756.2 | | | | 1.2 | % | | | 12 762.9 | | | | 1.4 | % | | | 16 109.6 | | | | 1.6 | % | | | 17 043.9 | |
Machinery and equipment | | | | | | | 7 316.2 | | | | 0.9 | % | | | 8 817.0 | | | | 1.0 | % | | | 8 934.6 | | | | 0.9 | % | | | 6 261.9 | |
Transport equipment | | | | | | | 2 608.3 | | | | 0.3 | % | | | 3 171.2 | | | | 0.3 | % | | | 3 054.6 | | | | 0.3 | % | | | 1 857.2 | |
Other machinery and equipment | | | | | | | 4 708.0 | | | | 0.6 | % | | | 5 645.8 | | | | 0.6 | % | | | 5 880.0 | | | | 0.6 | % | | | 4 404.7 | |
Land and sub-soil assets | | | | | | | 854.4 | | | | 0.1 | % | | | 195.6 | | | | 0.0 | % | | | 173.1 | | | | 0.0 | % | | | 96.8 | |
Software and other intangible assets | | | | | | | 531.9 | | | | 0.1 | % | | | 656.5 | | | | 0.1 | % | | | 392.2 | | | | 0.0 | % | | | 368.6 | |
Other assets | | | 3) | | | | 20.4 | | | | 0.0 | % | | | 31.0 | | | | 0.0 | % | | | 65.0 | | | | 0.0 | % | | | 51.4 | |
Payments for financial assets | | | 4) | | | | 22 437.8 | | | | 2.7 | % | | | 3 047.7 | | | | 0.3 | % | | | 4 940.1 | | | | 0.5 | % | | | 3 904.4 | |
| | | | | | | | | | | | | | | | | | | | | | | | | | | | | | | | |
Subtotal: votes and direct charges | | | | | | | 839 047.2 | | | | 100 | % | | | 922 408.1 | | | | 100 | % | | | 1 001 742.0 | | | | 100 | % | | | 1 083 472.7 | |
Plus: | | | | | | | | | | | | | | | | | | | | | | | | | | | | | | | | |
Contingency reserve | | | | | | | — | | | | — | | | | — | | | | — | | | | — | | | | — | | | | — | |
Unallocated | | | | | | | | | | | | | | | | | | | | | | | | | | | | | | | | |
| | | | | | | | | | | | | | | | | | | | | | | | | | | | | | | | |
Total consolidated expenditure | | | | | | | 839 047.2 | | | | 100 | % | | | 922 408.1 | | | | 100 | % | | | 1 001 742.0 | | | | 100 | % | | | 1 083 472.7 | |
| | | | | | | | | | | | | | | | | | | | | | | | | | | | | | | | |
| 1) | These figures were estimated by the National Treasury and may differ from data published by Statistics South Africa and the Reserve Bank. The numbers in this table are not strictly comparable to those published in previous years due to the reclassification of expenditure items for previous years. Data for the previous years has been adjusted accordingly. |
| 2) | Includes equitable share and conditional grants to local government. |
142
ANNEXURE B: STATISTICAL TABLES
| | | | | | | | | | | | | | | | | | | | | | | | | | | | | | | | |
| | | | | | | | | | | | | | | | | | | | | | | | | | | | | | | | Table 5 Consolidated national, provincial and social security funds expenditure: economic classification 1) |
| | | | | |
| | | | 2014/15 | | | 2015/16 | | | 2016/17 | | | | | | |
% of
total | | | Budget
estimate | | | % of
total | | | Budget
estimate | | | % of
total | | | Budget
estimate | | | % of
total | | | | | | R million |
| | 56.5% | | | | 662 739.2 | | | | 55.8 | % | | | 713 912.0 | | | | 55.3 | % | | | 765 596.8 | | | | 55.0 | % | | | | | | Current payments |
| | 34.5% | | | | 398 388.4 | | | | 33.6 | % | | | 424 994.5 | | | | 32.9 | % | | | 452 286.8 | | | | 32.5 | % | | | | | | Compensation of employees |
| | 12.6% | | | | 149 368.5 | | | | 12.6 | % | | | 162 186.5 | | | | 12.6 | % | | | 174 024.5 | | | | 12.5 | % | | | | | | Goods and services |
| | 9.4% | | | | 114 982.4 | | | | 9.7 | % | | | 126 730.9 | | | | 9.8 | % | | | 139 285.4 | | | | 10.0 | % | | | | | | Interest and rent on land |
| | 39.3% | | | | 469 306.2 | | | | 39.5 | % | | | 514 469.5 | | | | 39.9 | % | | | 548 719.0 | | | | 39.4 | % | | | | | | Transfers and subsidies |
| | 8.2% | | | | 95 191.5 | | | | 8.0 | % | | | 105 382.1 | | | | 8.2 | % | | | 111 570.0 | | | | 8.0 | % | | | | | | Provinces and municipalities |
| | 6.8% | | | | 80 625.0 | | | | 6.8 | % | | | 89 388.3 | | | | 6.9 | % | | | 93 962.8 | | | | 6.7 | % | | | 2) | | | of which: local government share |
| | 8.0% | | | | 93 197.1 | | | | 7.9 | % | | | 100 988.7 | | | | 7.8 | % | | | 107 438.7 | | | | 7.7 | % | | | | | | Departmental agencies and accounts |
| | 2.1% | | | | 24 324.3 | | | | 2.0 | % | | | 26 414.7 | | | | 2.0 | % | | | 27 807.0 | | | | 2.0 | % | | | | | | Higher education institutions |
| | 0.2% | | | | 1 670.7 | | | | 0.1 | % | | | 1 765.4 | | | | 0.1 | % | | | 1 858.5 | | | | 0.1 | % | | | | | | Foreign governments and international organisations |
| | 3.0% | | | | 39 703.7 | | | | 3.3 | % | | | 44 555.6 | | | | 3.5 | % | | | 46 926.5 | | | | 3.4 | % | | | | | | Public corporations and private enterprises |
| | 2.3% | | | | 31 535.9 | | | | 2.7 | % | | | 35 026.4 | | | | 2.7 | % | | | 36 491.6 | | | | 2.6 | % | | | | | | Public corporations |
| | 1.0% | | | | 12 752.4 | | | | 1.1 | % | | | 12 719.7 | | | | 1.0 | % | | | 13 732.8 | | | | 1.0 | % | | | | | | Subsidies on products and production |
| | 1.3% | | | | 18 783.5 | | | | 1.6 | % | | | 22 306.6 | | | | 1.7 | % | | | 22 758.8 | | | | 1.6 | % | | | | | | Other transfers |
| | 0.7% | | | | 8 167.8 | | | | 0.7 | % | | | 9 529.2 | | | | 0.7 | % | | | 10 434.9 | | | | 0.7 | % | | | | | | Private enterprises |
| | 0.4% | | | | 4 169.4 | | | | 0.4 | % | | | 5 361.4 | | | | 0.4 | % | | | 6 149.7 | | | | 0.4 | % | | | | | | Subsidies on products and production |
| | 0.3% | | | | 3 998.4 | | | | 0.3 | % | | | 4 167.8 | | | | 0.3 | % | | | 4 285.2 | | | | 0.3 | % | | | | | | Other transfers |
| | 2.5% | | | | 28 634.8 | | | | 2.4 | % | | | 30 130.9 | | | | 2.3 | % | | | 31 569.3 | | | | 2.3 | % | | | | | | Non-profit institutions |
| | 15.3% | | | | 186 584.2 | | | | 15.7 | % | | | 205 232.2 | | | | 15.9 | % | | | 221 549.1 | | | | 15.9 | % | | | | | | Households |
| | 13.3% | | | | 160 712.5 | | | | 13.5 | % | | | 175 655.0 | | | | 13.6 | % | | | 186 073.3 | | | | 13.4 | % | | | | | | Social benefits |
| | 2.1% | | | | 25 871.6 | | | | 2.2 | % | | | 29 577.2 | | | | 2.3 | % | | | 35 475.8 | | | | 2.5 | % | | | | | | Other transfers to households |
| | 3.9% | | | | 48 346.0 | | | | 4.1 | % | | | 52 183.6 | | | | 4.0 | % | | | 60 027.0 | | | | 4.3 | % | | | | | | Payments for capital assets |
| | 3.3% | | | | 40 716.7 | | | | 3.4 | % | | | 44 039.3 | | | | 3.4 | % | | | 50 517.7 | | | | 3.6 | % | | | | | | Buildings and other fixed structures |
| | 1.7% | | | | 23 304.1 | | | | 2.0 | % | | | 27 328.9 | | | | 2.1 | % | | | 29 711.5 | | | | 2.1 | % | | | | | | Buildings |
| | 1.6% | | | | 17 412.6 | | | | 1.5 | % | | | 16 710.4 | | | | 1.3 | % | | | 20 806.2 | | | | 1.5 | % | | | | | | Other fixed structures |
| | 0.6% | | | | 7 210.8 | | | | 0.6 | % | | | 7 722.2 | | | | 0.6 | % | | | 9 050.5 | | | | 0.6 | % | | | | | | Machinery and equipment |
| | 0.2% | | | | 2 083.0 | | | | 0.2 | % | | | 2 534.8 | | | | 0.2 | % | | | 3 165.4 | | | | 0.2 | % | | | | | | Transport equipment |
| | 0.4% | | | | 5 127.8 | | | | 0.4 | % | | | 5 187.4 | | | | 0.4 | % | | | 5 885.1 | | | | 0.4 | % | | | | | | Other machinery and equipment |
| | 0.0% | | | | 32.8 | | | | 0.0 | % | | | 63.1 | | | | 0.0 | % | | | 65.6 | | | | 0.0 | % | | | | | | Land and sub-soil assets |
| | 0.0% | | | | 325.0 | | | | 0.0 | % | | | 288.7 | | | | 0.0 | % | | | 318.2 | | | | 0.0 | % | | | | | | Software and other intangible assets |
| | 0.0% | | | | 60.8 | | | | 0.0 | % | | | 70.3 | | | | 0.0 | % | | | 74.9 | | | | 0.0 | % | | | 3) | | | Other assets |
| | 0.4% | | | | 3 585.5 | | | | 0.3 | % | | | 3 335.0 | | | | 0.3 | % | | | 308.0 | | | | 0.0 | % | | | | | | Payments for financial assets |
| | | | | | | | | | | | | | | | | | | | | | | | | | | | | | | | |
| | 100% | | | | 1 183 977.0 | | | | 99.7 | % | | | 1 283 900.1 | | | | 99.5 | % | | | 1 374 650.9 | | | | 98.7 | % | | | | | | Subtotal: votes and direct charges |
| | | | | | | | | | | | | | | | | | | | | | | | | | | | | | | | Plus: |
| | — | | | | 3 000.0 | | | | 0.3 | % | | | 6 000.0 | | | | 0.5 | % | | | 18 000.0 | | | | 1.3 | % | | | | | | Contingency reserve |
| | | | | | | | | | | | | | | | | | | | | | | | | | | | | | | | Unallocated |
| | | | | | | | | | | | | | | | | | | | | | | | | | | | | | | | |
| | 100% | | | | 1 186 977.0 | | | | 100 | % | | | 1 289 900.1 | | | | 100 | % | | | 1 392 650.9 | | | | 100 | % | | | | | | Total consolidated expenditure |
| | | | | | | | | | | | | | | | | | | | | | | | | | | | | | | | |
| 3) | Includes biological, heritage and specialised military assets. |
| 4) | Includes National Revenue Fund payments previously accounted for separately. |
143
2014 BUDGET REVIEW
Table 6
Consolidated national, provincial and social security
funds expenditure: functional classification 1)
| | | | | | | | | | | | | | | | | | | | | | | | | | | | | | | | |
| | | | | | 2010/11 | | | 2011/12 | | | 2012/13 | | | 2013/14 | |
R million | | | | | Estimated
outcome | | | % of
total | | | Estimated
outcome | | | % of
total | | | Estimated
outcome | | | % of
total | | | Revised
estimate | |
General public services | | | 2) | | | | 119 296.04 | | | | 14.2 | % | | | 135 399.73 | | | | 14.7 | % | | | 151 608.71 | | | | 15.1 | % | | | 168 543.76 | |
of which: debt-service costs | | | | | | | 66 226.8 | | | | 7.9 | % | | | 76 460.0 | | | | 8.3 | % | | | 88 121.1 | | | | 8.8 | % | | | 101 255.9 | |
Defence | | | | | | | 30 578.8 | | | | 3.6 | % | | | 34 530.3 | | | | 3.7 | % | | | 38 007.0 | | | | 3.8 | % | | | 40 401.5 | |
Public order and safety | | | | | | | 84 638.6 | | | | 10.1 | % | | | 91 779.6 | | | | 10.0 | % | | | 99 803.9 | | | | 10.0 | % | | | 108 995.3 | |
Police services | | | | | | | 57 774.0 | | | | 6.9 | % | | | 62 289.1 | | | | 6.8 | % | | | 67 867.9 | | | | 6.8 | % | | | 74 235.6 | |
Law courts | | | | | | | 12 682.9 | | | | 1.5 | % | | | 13 737.8 | | | | 1.5 | % | | | 15 212.6 | | | | 1.5 | % | | | 16 676.0 | |
Prisons | | | | | | | 14 181.7 | | | | 1.7 | % | | | 15 752.7 | | | | 1.7 | % | | | 16 723.4 | | | | 1.7 | % | | | 18 083.7 | |
Economic affairs | | | | | | | 108 206.2 | | | | 12.9 | % | | | 102 274.8 | | | | 11.1 | % | | | 105 445.7 | | | | 10.5 | % | | | 108 622.4 | |
General economic, commercial, and labour affairs | | | | | | | 16 123.8 | | | | 1.9 | % | | | 16 893.2 | | | | 1.8 | % | | | 18 165.9 | | | | 1.8 | % | | | 18 153.5 | |
Agriculture, forestry, fishing and hunting | | | | | | | 14 941.4 | | | | 1.8 | % | | | 16 171.9 | | | | 1.8 | % | | | 17 057.7 | | | | 1.7 | % | | | 16 779.3 | |
Fuel and energy | | | | | | | 23 984.0 | | | | 2.9 | % | | | 4 534.9 | | | | 0.5 | % | | | 4 946.1 | | | | 0.5 | % | | | 6 288.9 | |
Mining, manufacturing and construction | | | | | | | 2 134.3 | | | | 0.3 | % | | | 1 793.1 | | | | 0.2 | % | | | 3 090.5 | | | | 0.3 | % | | | 2 210.9 | |
Transport | | | | | | | 46 919.8 | | | | 5.6 | % | | | 57 937.4 | | | | 6.3 | % | | | 56 237.3 | | | | 5.6 | % | | | 57 864.9 | |
Communication | | | | | | | 1 117.4 | | | | 0.1 | % | | | 1 631.9 | | | | 0.2 | % | | | 1 409.3 | | | | 0.1 | % | | | 2 154.6 | |
Other industries | | | | | | | 1 654.5 | | | | 0.2 | % | | | 1 661.7 | | | | 0.2 | % | | | 2 278.9 | | | | 0.2 | % | | | 2 445.5 | |
Economic affairs not elsewhere classified | | | | | | | 1 331.0 | | | | 0.2 | % | | | 1 650.7 | | | | 0.2 | % | | | 2 259.9 | | | | 0.2 | % | | | 2 724.9 | |
Environmental protection | | | | | | | 3 408.3 | | | | 0.4 | % | | | 4 111.5 | | | | 0.4 | % | | | 5 362.8 | | | | 0.5 | % | | | 4 877.9 | |
Housing and community amenities | | | | | | | 81 744.9 | | | | 9.7 | % | | | 93 113.4 | | | | 10.1 | % | | | 103 405.5 | | | | 10.3 | % | | | 110 544.5 | |
Housing development | | | | | | | 20 646.0 | | | | 2.5 | % | | | 24 011.3 | | | | 2.6 | % | | | 26 822.3 | | | | 2.7 | % | | | 27 519.7 | |
Community development | | | | | | | 53 878.4 | | | | 6.4 | % | | | 60 640.5 | | | | 6.6 | % | | | 67 637.4 | | | | 6.8 | % | | | 75 986.3 | |
Water supply | | | | | | | 7 096.2 | | | | 0.8 | % | | | 8 351.0 | | | | 0.9 | % | | | 8 775.8 | | | | 0.9 | % | | | 6 831.5 | |
Housing and community amenities not elsewhere classified | | | | | | | 124.3 | | | | 0.0 | % | | | 110.6 | | | | 0.0 | % | | | 170.1 | | | | 0.0 | % | | | 207.1 | |
Health | | | | | | | 101 743.7 | | | | 12.1 | % | | | 115 714.3 | | | | 12.5 | % | | | 126 887.3 | | | | 12.7 | % | | | 136 494.9 | |
Recreation and culture | | | | | | | 6 989.8 | | | | 0.8 | % | | | 7 140.8 | | | | 0.8 | % | | | 7 448.3 | | | | 0.7 | % | | | 8 131.2 | |
Education | | | | | | | 171 723.9 | | | | 20.5 | % | | | 197 778.8 | | | | 21.4 | % | | | 211 724.6 | | | | 21.1 | % | | | 229 801.8 | |
Social protection | | | | | | | 130 717.0 | | | | 15.6 | % | | | 140 565.0 | | | | 15.2 | % | | | 152 048.2 | | | | 15.2 | % | | | 167 059.5 | |
| | | | | | | | | | | | | | | | | | | | | | | | | | | | | | | | |
Subtotal: votes and direct charges | | | | | | | 839 047.2 | | | | 100 | % | | | 922 408.1 | | | | 100 | % | | | 1 001 742.0 | | | | 100 | % | | | 1 083 472.7 | |
Plus: | | | | | | | | | | | | | | | | | | | | | | | | | | | | | | | | |
Contingency reserve | | | | | | | — | | | | | | | | — | | | | | | | | — | | | | | | | | — | |
Unallocated | | | | | | | | | | | | | | | | | | | | | | | | | | | | | | | | |
| | | | | | | | | | | | | | | | | | | | | | | | | | | | | | | | |
Total consolidated expenditure | | | | | | | 839 047.2 | | | | | | | | 922 408.1 | | | | | | | | 1 001 742.0 | | | | | | | | 1 083 472.7 | |
| | | | | | | | | | | | | | | | | | | | | | | | | | | | | | | | |
| 1) | These figures were estimated by the National Treasury and may differ from data published by Statistics South Africa. The numbers in this table are not strictly comparable to those published in previous years due to the allocation of some of the unallocable expenditure for previous years. Data for the previous years has been adjusted accordingly. |
144
ANNEXURE B: STATISTICAL TABLES
| | | | | | | | | | | | | | | | | | | | | | | | | | | | | | |
| | | | | | | | | | | | | | | | | | | | | | | | | | | | | | Table 6 Consolidated national, provincial and social security funds expenditure: functional classification 1) |
| | | | | |
| | | | 2014/15 | | | 2015/16 | | | 2016/17 | | | | | |
% of
total | | | Budget
estimate | | | % of
total | | | Budget
estimate | | | % of
total | | | Budget
estimate | | | % of
total | | | | | R million |
| | 15.6 | % | | | 186 790.91 | | | | 15.8 | % | | | 203 868.47 | | | | 15.9 | % | | | 223 896.41 | | | | 16.3 | % | | 2) | | General public services |
| | 9.3 | % | | | 114 900.5 | | | | 9.7 | % | | | 126 646.8 | | | | 9.9 | % | | | 139 200.6 | | | | 10.1 | % | | | | of which: debt-service costs |
| | 3.7 | % | | | 43 115.1 | | | | 3.6 | % | | | 45 537.2 | | | | 3.5 | % | | | 48 359.5 | | | | 3.5 | % | | | | Defence |
| | 10.1 | % | | | 115 314.6 | | | | 9.7 | % | | | 121 627.2 | | | | 9.5 | % | | | 129 764.4 | | | | 9.4 | % | | | | Public order and safety |
| | 6.9 | % | | | 78 127.9 | | | | 6.6 | % | | | 82 536.0 | | | | 6.4 | % | | | 88 011.4 | | | | 6.4 | % | | | | Police services |
| | 1.5 | % | | | 18 167.5 | | | | 1.5 | % | | | 19 052.8 | | | | 1.5 | % | | | 20 461.3 | | | | 1.5 | % | | | | Law courts |
| | 1.7 | % | | | 19 019.2 | | | | 1.6 | % | | | 20 038.4 | | | | 1.6 | % | | | 21 291.7 | | | | 1.5 | % | | | | Prisons |
| | 10.0 | % | | | 120 624.6 | | | | 10.2 | % | | | 129 263.3 | | | | 10.1 | % | | | 139 703.4 | | | | 10.2 | % | | | | Economic affairs |
| | 1.7 | % | | | 19 422.0 | | | | 1.6 | % | | | 20 652.5 | | | | 1.6 | % | | | 21 590.4 | | | | 1.6 | % | | | | General economic, commercial, and labour affairs |
| | 1.5 | % | | | 17 880.2 | | | | 1.5 | % | | | 18 176.5 | | | | 1.4 | % | | | 19 235.9 | | | | 1.4 | % | | | | Agriculture, forestry, fishing and hunting |
| | 0.6 | % | | | 7 065.7 | | | | 0.6 | % | | | 7 696.9 | | | | 0.6 | % | | | 8 123.3 | | | | 0.6 | % | | | | Fuel and energy |
| | 0.2 | % | | | 2 253.7 | | | | 0.2 | % | | | 3 206.4 | | | | 0.2 | % | | | 3 443.4 | | | | 0.3 | % | | | | Mining, manufacturing and construction |
| | 5.3 | % | | | 66 063.6 | | | | 5.6 | % | | | 71 561.2 | | | | 5.6 | % | | | 79 151.6 | | | | 5.8 | % | | | | Transport |
| | 0.2 | % | | | 1 398.1 | | | | 0.1 | % | | | 1 697.7 | | | | 0.1 | % | | | 1 866.2 | | | | 0.1 | % | | | | Communication |
| | 0.2 | % | | | 2 516.4 | | | | 0.2 | % | | | 2 677.0 | | | | 0.2 | % | | | 2 818.1 | | | | 0.2 | % | | | | Other industries |
| | 0.3 | % | | | 4 025.0 | | | | 0.3 | % | | | 3 595.1 | | | | 0.3 | % | | | 3 474.6 | | | | 0.3 | % | | | | Economic affairs not elsewhere classified |
| | 0.5 | % | | | 5 179.8 | | | | 0.4 | % | | | 5 487.1 | | | | 0.4 | % | | | 5 709.7 | | | | 0.4 | % | | | | Environmental protection |
| | 10.2 | % | | | 124 082.0 | | | | 10.5 | % | | | 141 390.9 | | | | 11.0 | % | | | 149 774.2 | | | | 10.9 | % | | | | Housing and community amenities |
| | 2.5 | % | | | 32 580.0 | | | | 2.8 | % | | | 35 985.8 | | | | 2.8 | % | | | 39 375.3 | | | | 2.9 | % | | | | Housing development |
| | 7.0 | % | | | 81 939.1 | | | | 6.9 | % | | | 89 500.2 | | | | 7.0 | % | | | 92 109.5 | | | | 6.7 | % | | | | Community development |
| | 0.6 | % | | | 9 332.4 | | | | 0.8 | % | | | 15 666.1 | | | | 1.2 | % | | | 18 036.8 | | | | 1.3 | % | | | | Water supply |
| | 0.0 | % | | | 230.7 | | | | 0.0 | % | | | 238.9 | | | | 0.0 | % | | | 252.7 | | | | 0.0 | % | | | | Housing and community amenities not elsewhere classified |
| | 12.6 | % | | | 147 834.2 | | | | 12.5 | % | | | 157 346.7 | | | | 12.3 | % | | | 166 884.8 | | | | 12.1 | % | | | | Health |
| | 0.8 | % | | | 9 238.1 | | | | 0.8 | % | | | 10 330.8 | | | | 0.8 | % | | | 11 478.2 | | | | 0.8 | % | | | | Recreation and culture |
| | 21.2 | % | | | 243 824.4 | | | | 20.6 | % | | | 264 371.2 | | | | 20.6 | % | | | 282 394.0 | | | | 20.5 | % | | | | Education |
| | 15.4 | % | | | 187 973.3 | | | | 15.9 | % | | | 204 677.2 | | | | 15.9 | % | | | 216 686.2 | | | | 15.8 | % | | | | Social protection |
| | | | | | | | | | | | | | | | | | | | | | | | | | | | | | |
| | 100 | % | | | 1 183 977.0 | | | | 100 | % | | | 1 283 900.1 | | | | 100 | % | | | 1 374 650.9 | | | | 100 | % | | | | Subtotal: votes and direct charges |
| | | | | | | | | | | | | | | | | | | | | | | | | | | | | | Plus: |
| | | | | 3 000.0 | | | | | | | | 6 000.0 | | | | | | | | 18 000.0 | | | | | | | | | Contingency reserve |
| | | | | | | | | | | | | | | | | | | | | | | | | | | | | | Unallocated |
| | | | | | | | | | | | | | | | | | | | | | | | | | | | | | |
| | | | | 1 186 977.0 | | | | | | | | 1 289 900.1 | | | | | | | | 1 392 650.9 | | | | | | | | | Total consolidated expenditure |
| | | | | | | | | | | | | | | | | | | | | | | | | | | | | | |
| 2) | Mainly general administration, cost of raising loans and unallocable capital expenditure as well as National Revenue Fund payments previously accounted for separately. |
145
2014 BUDGET REVIEW
Table 7
Consolidated government revenue and expenditure:
Economic classification 1)
| | | | | | | | | | | | | | | | | | | | | | | | | | | | | | | | |
| | | | | | 2010/11 | | | 2011/12 | | | 2012/13 | | | 2013/14 | |
R million | | | | | Outcome | | | % of
total | | | Outcome | | | % of
total | | | Outcome | | | % of
total | | | Revised
estimate | |
Revenue | | | | | | | | | | | | | | | | | | | | | | | | | | | | | | | | |
Current revenue | | | | | | | 762 506.2 | | | | 100.0 | % | | | 842 022.7 | | | | 100.0 | % | | | 908 926.6 | | | | 100.0 | % | | | 1 010 282.1 | |
Tax revenue (net of SACU) | | | | | | | 693 347.0 | | | | 90.9 | % | | | 761 297.3 | | | | 90.4 | % | | | 818 130.3 | | | | 90.0 | % | | | 907 381.1 | |
Non-tax revenue | | | 2) | | | | 69 159.3 | | | | 9.1 | % | | | 80 725.5 | | | | 9.6 | % | | | 90 796.2 | | | | 10.0 | % | | | 102 901.0 | |
Sales of capital assets | | | | | | | 367.1 | | | | 0.0 | % | | | 240.5 | | | | 0.0 | % | | | 349.2 | | | | 0.0 | % | | | 206.8 | |
| | | | | | | | | | | | | | | | | | | | | | | | | | | | | | | | |
Total revenue | | | | | | | 762 873.4 | | | | 100.0 | % | | | 842 263.3 | | | | 100.0 | % | | | 909 275.8 | | | | 100.0 | % | | | 1 010 488.9 | |
Expenditure | | | | | | | | | | | | | | | | | | | | | | | | | | | | | | | | |
Economic classification | | | | | | | | | | | | | | | | | | | | | | | | | | | | | | | | |
Current payments | | | | | | | 522 853.7 | | | | 59.4 | % | | | 581 147.1 | | | | 61.0 | % | | | 636 382.2 | | | | 60.9 | % | | | 698 891.8 | |
Compensation of employees | | | | | | | 309 862.2 | | | | 35.2 | % | | | 345 979.2 | | | | 36.3 | % | | | 374 977.2 | | | | 35.9 | % | | | 411 254.4 | |
Goods and services | | | | | | | 137 693.1 | | | | 15.6 | % | | | 153 460.6 | | | | 16.1 | % | | | 167 938.2 | | | | 16.1 | % | | | 179 956.0 | |
Interest and rent on land | | | | | | | 75 298.4 | | | | 8.6 | % | | | 81 707.3 | | | | 8.6 | % | | | 93 466.9 | | | | 8.9 | % | | | 107 681.4 | |
Transfers and subsidies | | | | | | | 278 699.2 | | | | 31.7 | % | | | 306 069.8 | | | | 32.1 | % | | | 336 747.8 | | | | 32.2 | % | | | 368 145.4 | |
Provinces and municipalities | | | | | | | 67 096.2 | | | | 7.6 | % | | | 74 485.8 | | | | 7.8 | % | | | 83 630.0 | | | | 8.0 | % | | | 92 035.3 | |
Departmental agencies and accounts | | | | | | | 17 087.9 | | | | 1.9 | % | | | 19 448.4 | | | | 2.0 | % | | | 20 958.9 | | | | 2.0 | % | | | 20 466.9 | |
Higher education institutions | | | | | | | 17 895.1 | | | | 2.0 | % | | | 19 741.7 | | | | 2.1 | % | | | 22 099.2 | | | | 2.1 | % | | | 23 542.8 | |
Foreign governments and international organisations | | | | | | | 1 234.5 | | | | 0.1 | % | | | 1 553.6 | | | | 0.2 | % | | | 1 894.3 | | | | 0.2 | % | | | 2 446.2 | |
Public corporations and private enterprises | | | | | | | 18 178.3 | | | | 2.1 | % | | | 20 571.1 | | | | 2.2 | % | | | 23 765.6 | | | | 2.3 | % | | | 25 777.7 | |
Non-profit institutions | | | | | | | 21 301.9 | | | | 2.4 | % | | | 23 119.7 | | | | 2.4 | % | | | 24 135.8 | | | | 2.3 | % | | | 28 474.9 | |
Households | | | | | | | 135 905.2 | | | | 15.4 | % | | | 147 149.4 | | | | 15.4 | % | | | 160 264.0 | | | | 15.3 | % | | | 175 401.6 | |
Payments for capital assets | | | | | | | 55 956.7 | | | | 6.4 | % | | | 62 788.4 | | | | 6.6 | % | | | 67 141.5 | | | | 6.4 | % | | | 78 353.8 | |
Buildings and other fixed structures | | | | | | | 42 438.4 | | | | 4.8 | % | | | 46 148.3 | | | | 4.8 | % | | | 50 385.8 | | | | 4.8 | % | | | 59 033.7 | |
Machinery and equipment | | | | | | | 9 954.2 | | | | 1.1 | % | | | 12 834.1 | | | | 1.3 | % | | | 13 434.4 | | | | 1.3 | % | | | 15 517.0 | |
Land and sub-soil assets | | | | | | | 2 168.3 | | | | 0.2 | % | | | 2 532.5 | | | | 0.3 | % | | | 1 819.0 | | | | 0.2 | % | | | 1 744.1 | |
Software and other intangible assets | | | | | | | 1 244.7 | | | | 0.1 | % | | | 1 213.8 | | | | 0.1 | % | | | 1 426.0 | | | | 0.1 | % | | | 2 002.9 | |
Other assets | | | 3) | | | | 151.1 | | | | 0.0 | % | | | 59.7 | | | | 0.0 | % | | | 76.2 | | | | 0.0 | % | | | 56.1 | |
Payments for financial assets | | | 4) | | | | 22 437.8 | | | | 2.5 | % | | | 3 047.7 | | | | 0.3 | % | | | 4 940.1 | | | | 0.5 | % | | | 3 904.4 | |
| | | | | | | | | | | | | | | | | | | | | | | | | | | | | | | | |
Subtotal: economic classification | | | | | | | 879 947.4 | | | | 100 | % | | | 953 053.0 | | | | 100.0 | % | | | 1 045 211.7 | | | | 100.0 | % | | | 1 149 295.5 | |
Contingency reserve | | | | | | | — | | | | | | | | — | | | | | | | | — | | | | | | | | — | |
| | | | | | | | | | | | | | | | | | | | | | | | | | | | | | | | |
Total consolidated expenditure | | | | | | | 879 947.4 | | | | | | | | 953 053.0 | | | | | | | | 1 045 211.7 | | | | | | | | 1 149 295.5 | |
| | | | | | | | | | | | | | | | | | | | | | | | | | | | | | | | |
Budget balance | | | | | | | -117 074.1 | | | | | | | | -110 789.7 | | | | | | | | -135 935.9 | | | | | | | | -138 806.7 | |
Percentage of GDP | | | | | | | -4.3 | % | | | | | | | -3.7 | % | | | | | | | -4.3 | % | | | | | | | -4.0 | % |
| | | | | | | | | | | | | | | | | | | | | | | | | | | | | | | | |
Financing | | | | | | | | | | | | | | | | | | | | | | | | | | | | | | | | |
Change in loan liabilities | | | | | | | | | | | | | | | | | | | | | | | | | | | | | | | | |
Domestic short- and long-term loans (net) | | | | | | | 178 116.5 | | | | | | | | 156 722.2 | | | | | | | | 143 719.6 | | | | | | | | 171 640.4 | |
Foreign loans (net) | | | | | | | 2 817.1 | | | | | | | | 11 472.3 | | | | | | | | -10 523.3 | | | | | | | | 1 013.3 | |
Change in cash and other balances (- increase) | | | | | | | -63 859.5 | | | | | | | | -57 404.8 | | | | | | | | 2 739.5 | | | | | | | | -33 847.0 | |
Borrowing requirement (net) | | | | | | | 117 074.1 | | | | | | | | 110 789.7 | | | | | | | | 135 935.9 | | | | | | | | 138 806.7 | |
GDP | | | | | | | 2 749 533.0 | | | | | | | | 2 981 828.0 | | | | | | | | 3 197 878.0 | | | | | | | | 3 464 882.6 | |
| 1) | Consisting of national and provincial government, social security funds and public entities. Refer to Annexure W2 for a detailed list of entities included. In some cases figures were estimated by the National Treasury and may differ from data published by Statistics South Africa and the Reserve Bank. |
| 2) | Includes National Revenue Fund receipts previously accounted for separately. |
146
ANNEXURE B: STATISTICAL TABLES
| | | | | | | | | | | | | | | | | | | | | | | | | | | | | | |
| | | | | | | | | | | | | | | | | | | | | | | | | | | | | | Table 7 Consolidated government revenue and expenditure: Economic classification 1) |
| | | | | |
2013/14 | | 2014/15 | | | 2015/16 | | | 2016/17 | | | | | | |
% of
total | | Budget
estimate | | | % of
total | | | Budget
estimate | | | % of
total | | | Budget
estimate | | | % of
total | | | | | | R million |
| | | | | | | | | | | | | | | | | | | | | | | | | | | | | | Revenue |
| 100.0% | | | 1 099 083.4 | | | | 100.0 | % | | | 1 201 147.9 | | | | 100.0 | % | | | 1 324 534.7 | | | | 100.0 | % | | | | | | Current revenue |
| 89.8% | | | 997 665.2 | | | | 90.8 | % | | | 1 097 731.6 | | | | 91.4 | % | | | 1 213 174.9 | | | | 91.6 | % | | | | | | Tax revenue (net of SACU) |
| 10.2% | | | 101 418.2 | | | | 9.2 | % | | | 103 416.3 | | | | 8.6 | % | | | 111 359.8 | | | | 8.4 | % | | | | | | Non-tax revenue |
| 0.0% | | | 164.4 | | | | 0.0 | % | | | 171.4 | | | | 0.0 | % | | | 180.9 | | | | 0.0 | % | | | | | | Sales of capital assets |
| | | | | | | | | | | | | | | | | | | | | | | | | | | | | | |
| 100.0% | | | 1 099 247.8 | | | | 100.0 | % | | | 1 201 319.3 | | | | 100.0 | % | | | 1 324 715.5 | | | | 100.0 | % | | | | | | Total revenue |
| | | | | | | | | | | | | | | | | | | | | | | | | | | | | | Expenditure |
| | | | | | | | | | | | | | | | | | | | | | | | | | | | | | Economic classification |
| 60.8% | | | 750 309.1 | | | | 60.1 | % | | | 801 828.5 | | | | 59.6 | % | | | 855 431.4 | | | | 59.7 | % | | | | | | Current payments |
| 35.8% | | | 439 388.4 | | | | 35.2 | % | | | 468 700.4 | | | | 34.8 | % | | | 498 914.4 | | | | 34.8 | % | | | | | | Compensation of employees |
| 15.7% | | | 189 712.5 | | | | 15.2 | % | | | 199 645.0 | | | | 14.8 | % | | | 211 379.2 | | | | 14.7 | % | | | | | | Goods and services |
| 9.4% | | | 121 208.2 | | | | 9.7 | % | | | 133 483.1 | | | | 9.9 | % | | | 145 137.7 | | | | 10.1 | % | | | | | | Interest and rent on land |
| 32.0% | | | 404 115.5 | | | | 32.3 | % | | | 441 582.5 | | | | 32.8 | % | | | 471 971.6 | | | | 32.9 | % | | | | | | Transfers and subsidies |
| 8.0% | | | 97 726.7 | | | | 7.8 | % | | | 108 386.3 | | | | 8.1 | % | | | 115 192.5 | | | | 8.0 | % | | | | | | Provinces and municipalities |
| 1.8% | | | 23 445.3 | | | | 1.9 | % | | | 26 265.8 | | | | 2.0 | % | | | 27 445.4 | | | | 1.9 | % | | | | | | Departmental agencies and accounts |
| 2.0% | | | 25 697.4 | | | | 2.1 | % | | | 27 240.6 | | | | 2.0 | % | | | 29 275.8 | | | | 2.0 | % | | | | | | Higher education institutions |
| 0.2% | | | 2 164.4 | | | | 0.2 | % | | | 2 259.1 | | | | 0.2 | % | | | 2 352.2 | | | | 0.2 | % | | | | | | Foreign governments and international organisations |
| 2.2% | | | 28 916.0 | | | | 2.3 | % | | | 30 761.1 | | | | 2.3 | % | | | 32 743.9 | | | | 2.3 | % | | | | | | Public corporations and private enterprises |
| 2.5% | | | 29 906.4 | | | | 2.4 | % | | | 31 381.9 | | | | 2.3 | % | | | 32 789.7 | | | | 2.3 | % | | | | | | Non-profit institutions |
| 15.3% | | | 196 259.2 | | | | 15.7 | % | | | 215 287.8 | | | | 16.0 | % | | | 232 172.2 | | | | 16.2 | % | | | | | | Households |
| 6.8% | | | 91 303.8 | | | | 7.3 | % | | | 98 866.1 | | | | 7.3 | % | | | 105 937.3 | | | | 7.4 | % | | | | | | Payments for capital assets |
| 5.1% | | | 71 327.3 | | | | 5.7 | % | | | 77 435.5 | | | | 5.8 | % | | | 82 931.9 | | | | 5.8 | % | | | | | | Buildings and other fixed structures |
| 1.4% | | | 16 629.2 | | | | 1.3 | % | | | 18 345.9 | | | | 1.4 | % | | | 20 004.6 | | | | 1.4 | % | | | | | | Machinery and equipment |
| 0.2% | | | 1 456.0 | | | | 0.1 | % | | | 1 524.1 | | | | 0.1 | % | | | 1 777.2 | | | | 0.1 | % | | | | | | Land and sub-soil assets |
| 0.2% | | | 1 825.9 | | | | 0.1 | % | | | 1 485.3 | | | | 0.1 | % | | | 1 146.7 | | | | 0.1 | % | | | | | | Software and other intangible assets |
| 0.0% | | | 65.5 | | | | 0.0 | % | | | 75.4 | | | | 0.0 | % | | | 76.9 | | | | 0.0 | % | | | 2) | | | Other assets |
| 0.3% | | | 3 585.5 | | | | 0.3 | % | | | 3 335.0 | | | | 0.2 | % | | | 308.0 | | | | 0.0 | % | | | | | | Payments for financial assets |
| | | | | | | | | | | | | | | | | | | | | | | | | | | | | | |
| 100.0% | | | 1 249 314.0 | | | | 100.0 | % | | | 1 345 612.2 | | | | 100.0 | % | | | 1 433 648.3 | | | | 100.0 | % | | | | | | Subtotal: economic classification |
| | | 3 000.0 | | | | | | | | 6 000.0 | | | | | | | | 18 000.0 | | | | | | | | | | | Contingency reserve |
| | | | | | | | | | | | | | | | | | | | | | | | | | | | | | |
| | | 1 252 314.0 | | | | | | | | 1 351 612.2 | | | | | | | | 1 451 648.3 | | | | | | | | | | | Total consolidated expenditure |
| | | | | | | | | | | | | | | | | | | | | | | | | | | | | | |
| | | -153 066.1 | | | | | | | | -150 292.9 | | | | | | | | -126 932.7 | | | | | | | | | | | Budget balance |
| | | -4.0 | % | | | | | | | -3.6 | % | | | | | | | -2.8 | % | | | | | | | | | | Percentage of GDP |
| | | | | | | | | | | | | | | | | | | | | | | | | | | | | | |
| | | | | | | | | | | | | | | | | | | | | | | | | | | | | | Financing |
| | | | | | | | | | | | | | | | | | | | | | | | | | | | | | Change in loan liabilities |
| | | 156 786.1 | | | | | | | | 160 403.9 | | | | | | | | 145 681.0 | | | | | | | | | | | Domestic short- and long-term loans (net) |
| | | 3 423.1 | | | | | | | | 11 201.0 | | | | | | | | 1 871.4 | | | | | | | | | | | Foreign loans (net) |
| | | -7 143.0 | | | | | | | | -21 311.9 | | | | | | | | -20 619.7 | | | | | | | | | | | Change in cash and other balances (- increase) |
| | | 153 066.1 | | | | | | | | 150 292.9 | | | | | | | | 126 932.7 | | | | | | | | | | | Borrowing requirement (net) |
| | | 3 789 630.3 | | | | | | | | 4 150 506.8 | | | | | | | | 4 552 868.0 | | | | | | | | | | | GDP |
| 3) | Includes biological, heritage and specialised military assets. |
| 4) | Includes extraordinary payments previously accounted for separately. |
147
2014 BUDGET REVIEW
| | | | | | | | | | | | | | | | | | | | | | | | | | | | | | | | |
Table 8 Consolidated government expenditure: functional classification 1) | | | | | | | | | | | | | | | | | | | | | | | | | | | | | | | | |
| | | | | | 2010/11 | | | 2011/12 | | | 2012/13 | | | 2013/14 | |
R million | | | | | Outcome | | | % of
total | | | Outcome | | | % of
total | | | Outcome | | | % of
total | | | Revised
estimate | |
General public services | | | 2 | ) | | | 122 282.9 | | | | 13.9 | % | | | 141 279.0 | | | | 14.8 | % | | | 158 927.3 | | | | 15.2 | % | | | 182 687.1 | |
of which: debt-service costs | | | | | | | 66 226.8 | | | | 7.5 | % | | | 76 460.0 | | | | 8.0 | % | | | 88 121.1 | | | | 8.4 | % | | | 101 255.9 | |
| | | | | | | | |
Defence | | | | | | | 30 825.1 | | | | 3.5 | % | | | 34 283.4 | | | | 3.6 | % | | | 37 851.0 | | | | 3.6 | % | | | 41 156.3 | |
| | | | | | | | |
Public order and safety | | | | | | | 84 767.5 | | | | 9.6 | % | | | 91 916.8 | | | | 9.6 | % | | | 99 905.9 | | | | 9.6 | % | | | 109 198.2 | |
Police services | | | | | | | 57 732.5 | | | | 6.6 | % | | | 62 307.1 | | | | 6.5 | % | | | 67 869.2 | | | | 6.5 | % | | | 74 251.8 | |
Law courts | | | | | | | 12 744.5 | | | | 1.4 | % | | | 13 746.0 | | | | 1.4 | % | | | 15 196.2 | | | | 1.5 | % | | | 16 735.2 | |
Prisons | | | | | | | 14 181.7 | | | | 1.6 | % | | | 15 752.7 | | | | 1.7 | % | | | 16 723.4 | | | | 1.6 | % | | | 18 083.7 | |
Public order and safety not elsewhere classified | | | | | | | 108.7 | | | | 0.0 | % | | | 111.0 | | | | 0.0 | % | | | 117.1 | | | | 0.0 | % | | | 127.5 | |
| | | | | | | | |
Economic affairs | | | | | | | 129 436.1 | | | | 14.7 | % | | | 113 807.7 | | | | 11.9 | % | | | 124 633.9 | | | | 11.9 | % | | | 133 415.9 | |
General economic, commercial, and labour affairs | | | | | | | 21 391.1 | | | | 2.4 | % | | | 20 729.7 | | | | 2.2 | % | | | 21 984.3 | | | | 2.1 | % | | | 22 783.7 | |
Agriculture, forestry, fishing and hunting | | | | | | | 15 658.9 | | | | 1.8 | % | | | 16 897.7 | | | | 1.8 | % | | | 17 330.2 | | | | 1.7 | % | | | 18 043.0 | |
Fuel and energy | | | | | | | 25 801.8 | | | | 2.9 | % | | | 6 382.9 | | | | 0.7 | % | | | 7 114.5 | | | | 0.7 | % | | | 8 498.4 | |
Mining, manufacturing and construction | | | | | | | 3 069.2 | | | | 0.3 | % | | | 2 369.1 | | | | 0.2 | % | | | 3 644.9 | | | | 0.3 | % | | | 3 034.9 | |
Transport | | | | | | | 59 014.5 | | | | 6.7 | % | | | 62 309.1 | | | | 6.5 | % | | | 68 131.3 | | | | 6.5 | % | | | 71 988.2 | |
Communication | | | | | | | 1 741.1 | | | | 0.2 | % | | | 2 116.2 | | | | 0.2 | % | | | 2 409.6 | | | | 0.2 | % | | | 3 724.8 | |
Other industries | | | | | | | 1 795.0 | | | | 0.2 | % | | | 1 896.6 | | | | 0.2 | % | | | 2 252.3 | | | | 0.2 | % | | | 2 588.8 | |
Economic affairs not elsewhere classified | | | | | | | 964.7 | | | | 0.1 | % | | | 1 106.5 | | | | 0.1 | % | | | 1 766.8 | | | | 0.2 | % | | | 2 754.2 | |
| | | | | | | | |
Environmental protection | | | | | | | 4 989.8 | | | | 0.6 | % | | | 5 969.0 | | | | 0.6 | % | | | 7 127.8 | | | | 0.7 | % | | | 5 696.0 | |
| | | | | | | | |
Housing and community amenities | | | | | | | 96 498.2 | | | | 11.0 | % | | | 104 794.0 | | | | 11.0 | % | | | 117 227.4 | | | | 11.2 | % | | | 130 157.0 | |
Housing development | | | | | | | 21 292.0 | | | | 2.4 | % | | | 25 005.1 | | | | 2.6 | % | | | 28 349.3 | | | | 2.7 | % | | | 29 171.1 | |
Community development | | | | | | | 54 646.3 | | | | 6.2 | % | | | 61 356.5 | | | | 6.4 | % | | | 68 485.4 | | | | 6.6 | % | | | 77 110.5 | |
Water supply | | | | | | | 20 438.0 | | | | 2.3 | % | | | 18 321.9 | | | | 1.9 | % | | | 20 223.8 | | | | 1.9 | % | | | 23 668.3 | |
Housing and community amenities not elsewhere classified | | | | | | | 121.8 | | | | 0.0 | % | | | 110.6 | | | | 0.0 | % | | | 168.7 | | | | 0.0 | % | | | 207.1 | |
| | | | | | | | |
Health | | | | | | | 102 738.2 | | | | 11.7 | % | | | 115 844.2 | | | | 12.2 | % | | | 127 890.0 | | | | 12.2 | % | | | 137 502.2 | |
| | | | | | | | |
Recreation and culture | | | | | | | 7 227.3 | | | | 0.8 | % | | | 7 356.2 | | | | 0.8 | % | | | 7 720.0 | | | | 0.7 | % | | | 8 495.4 | |
| | | | | | | | |
Education | | | | | | | 170 846.3 | | | | 19.4 | % | | | 197 960.9 | | | | 20.8 | % | | | 212 316.5 | | | | 20.3 | % | | | 233 672.3 | |
| | | | | | | | |
Social protection | | | | | | | 130 336.0 | | | | 14.8 | % | | | 139 841.7 | | | | 14.7 | % | | | 151 612.0 | | | | 14.5 | % | | | 167 315.0 | |
| | | | | | | | | | | | | | | | | | | | | | | | | | | | | | | | |
Subtotal: functional classification | | | | | | | 879 947.4 | | | | 100 | % | | | 953 053.0 | | | | 100 | % | | | 1 045 211.7 | | | | 100 | % | | | 1 149 295.5 | |
| | | | | | | | |
Plus: | | | | | | | | | | | | | | | | | | | | | | | | | | | | | | | | |
Contingency reserve | | | | | | | — | | | | | | | | — | | | | | | | | — | | | | | | | | — | |
Unallocated | | | | | | | | | | | | | | | | | | | | | | | | | | | | | | | | |
| | | | | | | | | | | | | | | | | | | | | | | | | | | | | | | | |
Total consolidated expenditure | | | | | | | 879 947.4 | | | | | | | | 953 053.0 | | | | | | | | 1 045 211.7 | | | | | | | | 1 149 295.5 | |
| | | | | | | | | | | | | | | | | | | | | | | | | | | | | | | | |
| 1) | Consisting of national and provincial government, social security funds and public entities. Refer to Annexure W2 for a detailed list of entities included. In some cases figures were estimated by the National Treasury and may differ from data published by Statistics South Africa and the Reserve Bank. |
148
ANNEXURE B: STATISTICAL TABLES
| | | | | | | | | | | | | | | | | | | | | | | | | | | | | | | | |
| | | | | | | | | | | | | | | | Table 8 Consolidated government expenditure: functional classification 1) |
2013/14 | | | 2014/15 | | | 2015/16 | | | 2016/17 | | | | | | |
% of
total | | | Budget
estimate | | | % of
total | | | Budget
estimate | | | % of
total | | | Budget
estimate | | | % of
total | | | | | | R million |
| | | | | | | | | | | | | | | | | | | | | | | | | | | | | | | | |
| | 15.9% | | | | 200 607.2 | | | | 16.1 | % | | | 217 497.4 | | | | 16.2 | % | | | 236 953.5 | | | | 16.5 | % | | | 2 | ) | | General public services |
| | 8.8% | | | | 114 900.5 | | | | 9.2 | % | | | 126 646.8 | | | | 9.4 | % | | | 139 200.6 | | | | 9.7 | % | | | | | | of which: debt-service costs |
| | | | | | | | |
| | 3.6% | | | | 43 765.6 | | | | 3.5 | % | | | 46 288.2 | | | | 3.4 | % | | | 49 194.6 | | | | 3.4 | % | | | | | | Defence |
| | | | | | | | |
| | 9.5% | | | | 115 491.2 | | | | 9.2 | % | | | 121 816.0 | | | | 9.1 | % | | | 129 972.4 | | | | 9.1 | % | | | | | | Public order and safety |
| | 6.5% | | | | 78 137.6 | | | | 6.3 | % | | | 82 544.7 | | | | 6.1 | % | | | 88 026.6 | | | | 6.1 | % | | | | | | Police services |
| | 1.5% | | | | 18 165.9 | | | | 1.5 | % | | | 19 053.1 | | | | 1.4 | % | | | 20 462.2 | | | | 1.4 | % | | | | | | Law courts |
| | 1.6% | | | | 19 019.2 | | | | 1.5 | % | | | 20 038.4 | | | | 1.5 | % | | | 21 291.7 | | | | 1.5 | % | | | | | | Prisons |
| | 0.0% | | | | 168.5 | | | | 0.0 | % | | | 179.7 | | | | 0.0 | % | | | 191.8 | | | | 0.0 | % | | | | | | Public order and safety not elsewhere classified |
| | | | | | | | |
| | 11.6% | | | | 145 081.0 | | | | 11.6 | % | | | 155 514.9 | | | | 11.6 | % | | | 162 153.6 | | | | 11.3 | % | | | | | | Economic affairs |
| | 2.0% | | | | 23 846.3 | | | | 1.9 | % | | | 25 284.0 | | | | 1.9 | % | | | 26 530.3 | | | | 1.9 | % | | | | | | General economic, commercial, and labour affairs |
| | 1.6% | | | | 18 515.7 | | | | 1.5 | % | | | 18 833.1 | | | | 1.4 | % | | | 19 931.0 | | | | 1.4 | % | | | | | | Agriculture, forestry, fishing and hunting |
| | 0.7% | | | | 9 442.5 | | | | 0.8 | % | | | 10 427.4 | | | | 0.8 | % | | | 11 418.7 | | | | 0.8 | % | | | | | | Fuel and energy |
| | 0.3% | | | | 3 107.7 | | | | 0.2 | % | | | 4 052.9 | | | | 0.3 | % | | | 4 280.5 | | | | 0.3 | % | | | | | | Mining, manufacturing and construction |
| | 6.3% | | | | 81 431.6 | | | | 6.5 | % | | | 87 655.8 | | | | 6.5 | % | | | 90 415.7 | | | | 6.3 | % | | | | | | Transport |
| | 0.3% | | | | 2 436.0 | | | | 0.2 | % | | | 3 065.2 | | | | 0.2 | % | | | 3 489.7 | | | | 0.2 | % | | | | | | Communication |
| | 0.2% | | | | 2 662.3 | | | | 0.2 | % | | | 2 866.8 | | | | 0.2 | % | | | 3 017.9 | | | | 0.2 | % | | | | | | Other industries |
| | 0.2% | | | | 3 638.9 | | | | 0.3 | % | | | 3 329.7 | | | | 0.2 | % | | | 3 069.9 | | | | 0.2 | % | | | | | | Economic affairs not elsewhere classified |
| | | | | | | | |
| | 0.5% | | | | 6 042.4 | | | | 0.5 | % | | | 6 291.6 | | | | 0.5 | % | | | 6 742.1 | | | | 0.5 | % | | | | | | Environmental protection |
| | | | | | | | |
| | 11.3% | | | | 145 142.2 | | | | 11.6 | % | | | 157 849.4 | | | | 11.7 | % | | | 167 200.3 | | | | 11.7 | % | | | | | | Housing and community amenities |
| | 2.5% | | | | 34 538.8 | | | | 2.8 | % | | | 37 323.2 | | | | 2.8 | % | | | 40 670.8 | | | | 2.8 | % | | | | | | Housing development |
| | 6.7% | | | | 83 107.5 | | | | 6.7 | % | | | 90 711.2 | | | | 6.7 | % | | | 93 384.4 | | | | 6.5 | % | | | | | | Community development |
| | 2.1% | | | | 27 265.3 | | | | 2.2 | % | | | 29 576.1 | | | | 2.2 | % | | | 32 892.3 | | | | 2.3 | % | | | | | | Water supply |
| | 0.0% | | | | 230.7 | | | | 0.0 | % | | | 238.9 | | | | 0.0 | % | | | 252.7 | | | | 0.0 | % | | | | | | Housing and community amenities not elsewhere classified |
| | | | | | | | |
| | 12.0% | | | | 148 803.1 | | | | 11.9 | % | | | 158 415.6 | | | | 11.8 | % | | | 168 348.8 | | | | 11.7 | % | | | | | | Health |
| | | | | | | | |
| | 0.7% | | | | 9 515.5 | | | | 0.8 | % | | | 10 577.0 | | | | 0.8 | % | | | 11 680.4 | | | | 0.8 | % | | | | | | Recreation and culture |
| | | | | | | | |
| | 20.3% | | | | 246 790.5 | | | | 19.8 | % | | | 266 503.3 | | | | 19.8 | % | | | 284 622.1 | | | | 19.9 | % | | | | | | Education |
| | | | | | | | |
| | 14.6% | | | | 188 075.2 | | | | 15.1 | % | | | 204 858.9 | | | | 15.2 | % | | | 216 780.7 | | | | 15.1 | % | | | | | | Social protection |
| | | | | | | | | | | | | | | | | | | | | | | | | | | | | | | | |
| | | | | | | | |
| | 100% | | | | 1 249 314.0 | | | | 100 | % | | | 1 345 612.2 | | | | 100 | % | | | 1 433 648.3 | | | | 100 | % | | | | | | Subtotal: functional classification |
| | | | | | | | |
| | | | | | | | | | | | | | | | | | | | | | | | | | | | | | | | Plus: |
| | | | | 3 000.0 | | | | | | | | 6 000.0 | | | | | | | | 18 000.0 | | | | | | | | | | | Contingency reserve |
| | | | | | | | | | | | | | | | | | | | | | | | | | | | | | | | Unallocated |
| | | | | | | | | | | | | | | | | | | | | | | | | | | | | | | | |
| | | | | 1 252 314.0 | | | | | | | | 1 351 612.2 | | | | | | | | 1 451 648.3 | | | | | | | | | | | Total consolidated expenditure |
| | | | | | | | | | | | | | | | | | | | | | | | | | | | | | | | |
| 2) | Mainly general administration, cost of raising loans and unallocable capital expenditure as well as National Revenue Fund payments previously accounted for separately. |
149
2014 BUDGET REVIEW
Table 9
Consolidated government revenue, expenditure and financing
| | | | | | | | | | | | | | | | |
| | | 2010/11 | | | 2011/12 | | | 2012/13 | | | 2013/14 | |
| | | Outcome | | | Outcome | | | Outcome | | | Revised
estimate | |
R million | | | | | | | | | | | | |
Operating account | | | | | | | | | | | | | | | | |
Current receipts | | | 762 506.2 | | | | 842 022.7 | | | | 908 926.6 | | | | 1 010 282.1 | |
Tax receipts (net of SACU transfers) | | | 693 347.0 | | | | 761 297.3 | | | | 818 130.3 | | | | 907 381.1 | |
Non-tax receipts (including departmental receipts) | | | 64 591.0 | | | | 74 039.5 | | | | 84 167.7 | | | | 97 022.6 | |
Transfers received | | | 4 568.3 | | | | 6 685.9 | | | | 6 628.6 | | | | 5 878.4 | |
| | | | |
Current payments | | | 756 373.0 | | | | 838 676.9 | | | | 920 747.3 | | | | 1 011 141.6 | |
Compensation of employees | | | 309 862.2 | | | | 345 979.2 | | | | 374 977.2 | | | | 411 254.4 | |
Goods and services | | | 137 693.1 | | | | 153 460.6 | | | | 167 938.2 | | | | 179 956.0 | |
Interest and rent on land | | | 75 298.4 | | | | 81 707.3 | | | | 93 466.9 | | | | 107 681.4 | |
Transfers and subsidies | | | 233 519.3 | | | | 257 529.8 | | | | 284 365.0 | | | | 312 249.7 | |
| | | | |
Current balance | | | 6 133.2 | | | | 3 345.8 | | | | -11 820.7 | | | | -859.5 | |
Percentage of GDP | | | 0.2 | % | | | 0.1 | % | | | -0.4 | % | | | 0.0 | % |
| | | | |
Capital account | | | | | | | | | | | | | | | | |
Capital receipts | | | 367.1 | | | | 240.5 | | | | 349.2 | | | | 206.8 | |
Transfers and subsidies | | | 45 180.0 | | | | 48 540.0 | | | | 52 382.8 | | | | 55 895.7 | |
Payments for capital assets | | | 55 956.7 | | | | 62 788.4 | | | | 67 141.5 | | | | 78 353.8 | |
| | | | |
Capital financing requirement | | | -100 769.5 | | | | -111 087.9 | | | | -119 175.1 | | | | -134 042.6 | |
Percentage of GDP | | | -3.7 | % | | | -3.7 | % | | | -3.7 | % | | | -3.9 | % |
| | | | |
Transactions in financial assets and liabilities | | | 22 437.8 | | | | 3 047.7 | | | | 4 940.1 | | | | 3 904.4 | |
| | | | |
Contingency reserve | | | — ` | | | | — | | | | — | | | | — | |
Unallocated | | | | | | | | | | | | | | | | |
Budget balance | | | -117 074.1 | | | | -110 789.7 | | | | -135 935.9 | | | | -138 806.7 | |
Percentage of GDP | | | -4.3 | % | | | -3.7 | % | | | -4.3 | % | | | -4.0 | % |
| | | | |
Primary balance | | | -41 775.7 | | | | -29 082.4 | | | | -42 469.0 | | | | -31 125.2 | |
Percentage of GDP | | | -1.5 | % | | | -1.0 | % | | | -1.3 | % | | | -0.9 | % |
| | | | |
Financing | | | | | | | | | | | | | | | | |
Change in loan liabilities | | | | | | | | | | | | | | | | |
| | | | |
Domestic short- and long-term loans (net) | | | 178 116.5 | | | | 156 722.2 | | | | 143 719.6 | | | | 171 640.4 | |
| | | | |
Foreign loans (net) | | | 2 817.1 | | | | 11 472.3 | | | | -10 523.3 | | | | 1 013.3 | |
| | | | |
Change in cash and other balances (-increase) | | | -63 859.5 | | | | -57 404.8 | | | | 2 739.5 | | | | -33 847.0 | |
| | | | |
Borrowing requirement (net) | | | 117 074.1 | | | | 110 789.7 | | | | 135 935.9 | | | | 138 806.7 | |
| | | | |
GDP | | | 2 749 533.0 | | | | 2 981 828.0 | | | | 3 197 878.0 | | | | 3 464 882.6 | |
150
ANNEXURE B: STATISTICAL TABLES
| | | | | | | | | | | | |
| | | | | | | | | | Table 9 Consolidated government revenue, expenditure and financing |
| 2014/15 | | | 2015/16 | | | 2016/17 | | | |
Budget
estimate | | | Budget
estimate | | | Budget
estimate | | | R million |
| | | | | | | | | | | | Operating account |
| | 1 099 083.4 | | | | 1 201 147.9 | | | | 1 324 534.7 | | | Current receipts |
| | 997 665.2 | | | | 1 097 731.6 | | | | 1 213 174.9 | | | Tax receipts (net of SACU transfers) |
| | 93 922.2 | | | | 96 745.6 | | | | 105 956.4 | | | Non-tax receipts (including departmental receipts) |
| | 7 496.0 | | | | 6 670.7 | | | | 5 403.4 | | | Transfers received |
| | | |
| | 1 093 818.0 | | | | 1 176 489.1 | | | | 1 254 156.0 | | | Current payments |
| | 439 388.4 | | | | 468 700.4 | | | | 498 914.4 | | | Compensation of employees |
| | 189 712.5 | | | | 199 645.0 | | | | 211 379.2 | | | Goods and services |
| | 121 208.2 | | | | 133 483.1 | | | | 145 137.7 | | | Interest and rent on land |
| | 343 508.9 | | | | 374 660.6 | | | | 398 724.7 | | | Transfers and subsidies |
| | | |
| | 5 265.4 | | | | 24 658.8 | | | | 70 378.6 | | | Current balance |
| | 0.1 | % | | | 0.6 | % | | | 1.5 | % | | Percentage of GDP |
| | | |
| | | | | | | | | | | | Capital account |
| | 164.4 | | | | 171.4 | | | | 180.9 | | | Capital receipts |
| | 60 606.6 | | | | 66 921.9 | | | | 73 246.9 | | | Transfers and subsidies |
| | 91 303.8 | | | | 98 866.1 | | | | 105 937.3 | | | Payments for capital assets |
| | | |
| | -151 746.0 | | | | -165 616.7 | | | | -179 003.3 | | | Capital financing requirement |
| | -4.0 | % | | | -4.0 | % | | | -3.9 | % | | Percentage of GDP |
| | | |
| | 3 585.5 | | | | 3 335.0 | | | | 308.0 | | | Transactions in financial assets and liabilities |
| | | |
| | 3 000.0 | | | | 6 000.0 | | | | 18 000.0 | | | Contingency reserve |
| | | | | | | | | | | | Unallocated |
| | -153 066.1 | | | | -150 292.9 | | | | -126 932.7 | | | Budget balance |
| | -4.0 | % | | | -3.6 | % | | | -2.8 | % | | Percentage of GDP |
| | | |
| | -31 858.0 | | | | -16 809.9 | | | | 18 205.0 | | | Primary balance |
| | -0.8 | % | | | -0.4 | % | | | 0.4 | % | | Percentage of GDP |
| | | |
| | | | | | | | | | | | Financing |
| | | | | | | | | | | | Change in loan liabilities |
| | | |
| | 156 786.1 | | | | 160 403.9 | | | | 145 681.0 | | | Domestic short- and long-term loans (net) |
| | | |
| | 3 423.1 | | | | 11 201.0 | | | | 1 871.4 | | | Foreign loans (net) |
| | | |
| | -7 143.0 | | | | -21 311.9 | | | | -20 619.7 | | | Change in cash and other balances (- increase) |
| | | |
| | 153 066.1 | | | | 150 292.9 | | | | 126 932.7 | | | Borrowing requirement (net) |
| | | |
| | 3 789 630.3 | | | | 4 150 506.8 | | | | 4 552 868.0 | | | GDP |
151
2014 BUDGET REVIEW
Table 10
Total debt of government 1)
| | | | | | | | | | | | | | | | | | | | | | | | | | | | | | | | |
| | | | | | 1989/90 | | | 1990/91 | | | 1991/92 | | | 1992/93 | | | 1993/94 | | | 1994/95 | | | 1995/96 | |
R million | | | | | | | | | | | | | | | | | | | | | | | | |
| | | | | | | | |
Domestic debt | | | | | | | | | | | | | | | | | | | | | | | | | | | | | | | | |
Marketable | | | | | | | 72 923 | | | | 85 546 | | | | 104 646 | | | | 138 681 | | | | 181 460 | | | | 225 662 | | | | 263 844 | |
Government bonds | | | | | | | 71 026 | | | | 82 824 | | | | 100 662 | | | | 132 853 | | | | 174 892 | | | | 210 191 | | | | 248 877 | |
Treasury bills | | | | | | | 1 897 | | | | 2 722 | | | | 3 984 | | | | 5 828 | | | | 6 568 | | | | 7 018 | | | | 10 700 | |
Bridging bonds | | | | | | | — | | | | — | | | | — | | | | — | | | | — | | | | 8 453 | | | | 4 267 | |
Non-marketable | | | 3) | | | | 6 883 | | | | 7 989 | | | | 6 520 | | | | 4 703 | | | | 3 310 | | | | 5 705 | | | | 4 700 | |
| | | | | | | | |
Gross loan debt | | | | | | | 79 806 | | | | 93 535 | | | | 111 166 | | | | 143 384 | | | | 184 770 | | | | 231 367 | | | | 268 544 | |
Cash balances | | | 4) | | | | -11 181 | | | | -8 524 | | | | -9 762 | | | | -4 750 | | | | -4 591 | | | | -6 665 | | | | -8 630 | |
Net loan debt | | | | | | | 68 625 | | | | 85 011 | | | | 101 404 | | | | 138 634 | | | | 180 179 | | | | 224 702 | | | | 259 914 | |
| | | | | | | | | | | | | | | | | | | | | | | | | | | | | | | | |
| | | | | | | | |
Foreign debt | | | | | | | | | | | | | | | | | | | | | | | | | | | | | | | | |
Gross loan debt | | | 5) | | | | 2 090 | | | | 1 770 | | | | 2 940 | | | | 2 348 | | | | 5 201 | | | | 8 784 | | | | 10 944 | |
Cash balances | | | 4) | | | | — | | | | — | | | | — | | | | — | | | | — | | | | — | | | | — | |
Net loan debt | | | | | | | 2 090 | | | | 1 770 | | | | 2 940 | | | | 2 348 | | | | 5 201 | | | | 8 784 | | | | 10 944 | |
| | | | | | | | | | | | | | | | | | | | | | | | | | | | | | | | |
| | | | | | | | |
Gross loan debt | | | | | | | 81 896 | | | | 95 305 | | | | 114 106 | | | | 145 732 | | | | 189 971 | | | | 240 151 | | | | 279 488 | |
Net loan debt | | | | | | | 70 715 | | | | 86 781 | | | | 104 344 | | | | 140 982 | | | | 185 380 | | | | 233 486 | | | | 270 858 | |
| | | | | | | | | | | | | | | | | | | | | | | | | | | | | | | | |
| | | | | | | | |
Gold and foreign exchange contingency reserve account | | | 6) | | | | 14 140 | | | | 10 351 | | | | 12 508 | | | | 8 934 | | | | 2 190 | | | | 4 147 | | | | — | |
| | | | | | | | | | | | | | | | | | | | | | | | | | | | | | | | |
| | | | | | | | |
Composition of gross debt (excluding deduction of cash balances) | | | | | | | | | | | | | | | | | | | | | | | | | | | | | | | | |
Marketable domestic debt | | | | | | | 89.0 | % | | | 89.8 | % | | | 91.7 | % | | | 95.2 | % | | | 95.5 | % | | | 94.0 | % | | | 94.4 | % |
Government bonds | | | | | | | 86.7 | % | | | 86.9 | % | | | 88.2 | % | | | 91.2 | % | | | 92.1 | % | | | 87.5 | % | | | 89.0 | % |
Treasury bills | | | | | | | 2.3 | % | | | 2.9 | % | | | 3.5 | % | | | 4.0 | % | | | 3.5 | % | | | 2.9 | % | | | 3.8 | % |
Bridging bonds | | | | | | | 0.0 | % | | | 0.0 | % | | | 0.0 | % | | | 0.0 | % | | | 0.0 | % | | | 3.5 | % | | | 1.5 | % |
Non-marketable domestic debt | | | 3) | | | | 8.4 | % | | | 8.4 | % | | | 5.7 | % | | | 3.2 | % | | | 1.7 | % | | | 2.4 | % | | | 1.7 | % |
| | | | | | | | | | | | | | | | | | | | | | | | | | | | | | | | |
| | | | | | | | |
Domestic debt | | | | | | | 97.4 | % | | | 98.1 | % | | | 97.4 | % | | | 98.4 | % | | | 97.3 | % | | | 96.3 | % | | | 96.1 | % |
Foreign debt | | | 5) | | | | 2.6 | % | | | 1.9 | % | | | 2.6 | % | | | 1.6 | % | | | 2.7 | % | | | 3.7 | % | | | 3.9 | % |
| | | | | | | | |
Total as percentage of GDP | | | | | | | | | | | | | | | | | | | | | | | | | | | | | | | | |
Gross domestic debt | | | | | | | 30.6 | % | | | 31.2 | % | | | 32.3 | % | | | 37.5 | % | | | 41.8 | % | | | 46.5 | % | | | 47.6 | % |
Net domestic debt | | | | | | | 26.3 | % | | | 28.4 | % | | | 29.5 | % | | | 36.2 | % | | | 40.8 | % | | | 45.2 | % | | | 46.1 | % |
Gross foreign debt | | | | | | | 0.8 | % | | | 0.6 | % | | | 0.9 | % | | | 0.6 | % | | | 1.2 | % | | | 1.8 | % | | | 1.9 | % |
Net foreign debt | | | | | | | 0.8 | % | | | 0.6 | % | | | 0.9 | % | | | 0.6 | % | | | 1.2 | % | | | 1.8 | % | | | 1.9 | % |
Gross loan debt | | | | | | | 31.4 | % | | | 31.8 | % | | | 33.2 | % | | | 38.1 | % | | | 43.0 | % | | | 48.3 | % | | | 49.5 | % |
Net loan debt | | | | | | | 27.1 | % | | | 29.0 | % | | | 30.3 | % | | | 36.8 | % | | | 41.9 | % | | | 47.0 | % | | | 48.0 | % |
| 1) | Debt of the central government, excluding extra-budgetary institutions and social security funds. |
| 2) | As projected at the end of January 2014. |
| 3) | Includes non-marketable Treasury bills, retail bonds, loan levies, former regional authorities and Namibian loans. |
| 4) | Bank balances of the National Revenue Fund (balances of government’s accounts with the Reserve Bank and commercial banks). Bank balances in foreign currencies are revaluated using forward estimates of exchange rates. |
152
ANNEXURE B: STATISTICAL TABLES
| | | | | | | | | | | | | | | | | | | | | | | | | | | | | | |
| | | | | | | | | | | | | | | | | | | | | | | | | | | | | | Table 10 Total debt of government 1) |
| 1996/97 | | | 1997/98 | | | 1998/99 | | | 1999/00 | | | 2000/01 | | | 2001/02 | | | 2002/03 | | | | | |
| | | | | | | | | | | | | | | | | | | | | | | | R million |
| | | | | | | | | | | | | | | | | | | | | | | | | | | | | | Domestic debt |
| | 290 424 | | | | 318 773 | | | | 344 938 | | | | 354 706 | | | | 365 231 | | | | 349 415 | | | | 350 870 | | | | | Marketable |
| | 276 124 | | | | 301 488 | | | | 325 938 | | | | 332 706 | | | | 339 731 | | | | 331 505 | | | | 328 820 | | | | | Government bonds |
| | 14 300 | | | | 17 285 | | | | 19 000 | | | | 22 000 | | | | 25 500 | | | | 17 910 | | | | 22 050 | | | | | Treasury bills |
| | — | | | | — | | | | — | | | | — | | | | — | | | | — | | | | — | | | | | Bridging bonds |
| | 6 421 | | | | 2 778 | | | | 2 013 | | | | 998 | | | | 2 382 | | | | 2 030 | | | | 1 910 | | | 3) | | Non-marketable |
| | | | | | | | |
| | 296 845 | | | | 321 551 | | | | 346 951 | | | | 355 704 | | | | 367 613 | | | | 351 445 | | | | 352 780 | | | | | Gross loan debt |
| | -2 757 | | | | -4 798 | | | | -5 166 | | | | -7 285 | | | | -2 650 | | | | -6 549 | | | | -9 730 | | | 4) | | Cash balances |
| | 294 088 | | | | 316 753 | | | | 341 785 | | | | 348 419 | | | | 364 963 | | | | 344 896 | | | | 343 050 | | | | | Net loan debt |
| | | | | | | | | | | | | | | | | | | | | | | | | | | | | | |
| | | | | | | | |
| | | | | | | | | | | | | | | | | | | | | | | | | | | | | | Foreign debt |
| | 11 394 | | | | 14 560 | | | | 16 276 | | | | 25 799 | | | | 31 938 | | | | 82 009 | | | | 74 286 | | | 5) | | Gross loan debt |
| | — | | | | — | | | | — | | | | — | | | | — | | | | — | | | | — | | | 4) | | Cash balances |
| | 11 394 | | | | 14 560 | | | | 16 276 | | | | 25 799 | | | | 31 938 | | | | 82 009 | | | | 74 286 | | | | | Net loan debt |
| | | | | | | | | | | | | | | | | | | | | | | | | | | | | | |
| | | | | | | | |
| | 308 239 | | | | 336 111 | | | | 363 227 | | | | 381 503 | | | | 399 551 | | | | 433 454 | | | | 427 066 | | | | | Gross loan debt |
| | 305 482 | | | | 331 313 | | | | 358 061 | | | | 374 218 | | | | 396 901 | | | | 426 905 | | | | 417 336 | | | | | Net loan debt |
| | | | | | | | | | | | | | | | | | | | | | | | | | | | | | |
| | | | | | | | |
| | 2 169 | | | | 73 | | | | 14 431 | | | | 9 200 | | | | 18 170 | | | | 28 024 | | | | 36 577 | | | 6) | | Gold and foreign exchange contingency reserve account |
| | | | | | | | | | | | | | | | | | | | | | | | | | | | | | |
| | | | | | | | | | | | | | | | | | | | | | | | | | | | | | Composition of gross debt (excluding deduction of cash balances) |
| | 94.2 | % | | | 94.8 | % | | | 95.0 | % | | | 93.0 | % | | | 91.4 | % | | | 80.6 | % | | | 82.2 | % | | | | Marketable domestic debt |
| | 89.6 | % | | | 89.7 | % | | | 89.7 | % | | | 87.2 | % | | | 85.0 | % | | | 76.5 | % | | | 77.0 | % | | | | Government bonds |
| | 4.6 | % | | | 5.1 | % | | | 5.2 | % | | | 5.8 | % | | | 6.4 | % | | | 4.1 | % | | | 5.2 | % | | | | Treasury bills |
| | 0.0 | % | | | 0.0 | % | | | 0.0 | % | | | 0.0 | % | | | 0.0 | % | | | 0.0 | % | | | 0.0 | % | | | | Bridging bonds |
| | 2.1 | % | | | 0.8 | % | | | 0.6 | % | | | 0.3 | % | | | 0.6 | % | | | 0.5 | % | | | 0.4 | % | | 3) | | Non-marketable domestic debt |
| | | | | | | | | | | | | | | | | | | | | | | | | | | | | | |
| | | | | | | | |
| | 96.3 | % | | | 95.7 | % | | | 95.5 | % | | | 93.2 | % | | | 92.0 | % | | | 81.1 | % | | | 82.6 | % | | | | Domestic debt |
| | 3.7 | % | | | 4.3 | % | | | 4.5 | % | | | 6.8 | % | | | 8.0 | % | | | 18.9 | % | | | 17.4 | % | | 5) | | Foreign debt |
| | | | | | | | | | | | | | | | | | | | | | | | | | | | | | |
| | | | | | | | | | | | | | | | | | | | | | | | | | | | | | Total as percentage of GDP |
| | 46.7 | % | | | 45.9 | % | | | 45.8 | % | | | 42.5 | % | | | 38.6 | % | | | 33.5 | % | | | 29.3 | % | | | | Gross domestic debt |
| | 46.3 | % | | | 45.3 | % | | | 45.1 | % | | | 41.6 | % | | | 38.3 | % | | | 32.9 | % | | | 28.5 | % | | | | Net domestic debt |
| | 1.8 | % | | | 2.1 | % | | | 2.1 | % | | | 3.1 | % | | | 3.4 | % | | | 7.8 | % | | | 6.2 | % | | | | Gross foreign debt |
| | 1.8 | % | | | 2.1 | % | | | 2.1 | % | | | 3.1 | % | | | 3.4 | % | | | 7.8 | % | | | 6.2 | % | | | | Net foreign debt |
| | 48.5 | % | | | 48.0 | % | | | 48.0 | % | | | 45.6 | % | | | 42.0 | % | | | 41.3 | % | | | 35.5 | % | | | | Gross loan debt |
| | 48.1 | % | | | 47.3 | % | | | 47.3 | % | | | 44.7 | % | | | 41.7 | % | | | 40.7 | % | | | 34.7 | % | | | | Net loan debt |
| 5) | Valued at appropriate foreign exchange rates up to 31 March 2013 as at the end of each period. Forward estimates are based on exchange rates prevailing at 31 January 2014, projected to depreciate in line with inflation differentials. |
| 6) | The balance on the gold and foreign exchange contingency reserve account on 31 March 2014 represents an estimated balance on the account. No provision for any profits or losses on this account has been made for subsequent years. A negative balance indicates a profit and a positive balance a loss. |
153
2014 BUDGET REVIEW
Table 10
Total debt of government 1)
| | | | | | | | | | | | | | | | | | | | | | | | | | | | | | | | |
| | | | | | 2003/04 | | | 2004/05 | | | 2005/06 | | | 2006/07 | | | 2007/08 | | | 2008/09 | | | 2009/10 | |
R million | | | | | | | | | | | | | | | | | | | | | | | | |
| | | | | | | | |
Domestic debt | | | | | | | | | | | | | | | | | | | | | | | | | | | | | | | | |
Marketable | | | | | | | 388 300 | | | | 428 593 | | | | 457 780 | | | | 467 864 | | | | 478 265 | | | | 527 751 | | | | 700 532 | |
Government bonds | | | | | | | 359 700 | | | | 394 143 | | | | 417 380 | | | | 422 064 | | | | 426 415 | | | | 462 751 | | | | 585 992 | |
Treasury bills | | | | | | | 28 600 | | | | 34 450 | | | | 40 400 | | | | 45 800 | | | | 51 850 | | | | 65 000 | | | | 114 540 | |
Bridging bonds | | | | | | | — | | | | — | | | | — | | | | — | | | | — | | | | — | | | | — | |
Non-marketable | | | 3) | | | | 1 999 | | | | 3 498 | | | | 3 699 | | | | 3 238 | | | | 2 555 | | | | 1 956 | | | | 4 943 | |
| | | | | | | | |
Gross loan debt | | | | | | | 390 299 | | | | 432 091 | | | | 461 479 | | | | 471 102 | | | | 480 821 | | | | 529 707 | | | | 705 475 | |
Cash balances | | | 4) | | | | -12 669 | | | | -30 870 | | | | -58 187 | | | | -75 315 | | | | -93 809 | | | | -101 349 | | | | -106 550 | |
Net loan debt | | | | | | | 377 630 | | | | 401 221 | | | | 403 292 | | | | 395 787 | | | | 387 012 | | | | 428 358 | | | | 598 925 | |
| | | | | | | | | | | | | | | | | | | | | | | | | | | | | | | | |
| | | | | | | | |
Foreign debt | | | | | | | | | | | | | | | | | | | | | | | | | | | | | | | | |
Gross loan debt | | | 5) | | | | 64 670 | | | | 69 405 | | | | 66 846 | | | | 82 581 | | | | 96 218 | | | | 97 268 | | | | 99 454 | |
Cash balances | | | 4) | | | | — | | | | — | | | | — | | | | — | | | | — | | | | — | | | | -25 339 | |
Net loan debt | | | | | | | 64 670 | | | | 69 405 | | | | 66 846 | | | | 82 581 | | | | 96 218 | | | | 97 268 | | | | 74 115 | |
| | | | | | | | | | | | | | | | | | | | | | | | | | | | | | | | |
| | | | | | | | |
Gross loan debt | | | | | | | 454 969 | | | | 501 496 | | | | 528 325 | | | | 553 683 | | | | 577 039 | | | | 626 975 | | | | 804 929 | |
Net loan debt | | | | | | | 442 300 | | | | 470 626 | | | | 470 138 | | | | 478 368 | | | | 483 230 | | | | 525 626 | | | | 673 040 | |
| | | | | | | | | | | | | | | | | | | | | | | | | | | | | | | | |
| | | | | | | | |
Gold and foreign exchange contingency reserve account | | | 6) | | | | 18 036 | | | | 5 292 | | | | -1 751 | | | | -28 514 | | | | -72 189 | | | | -101 585 | | | | -35 618 | |
| | | | | | | | | | | | | | | | | | | | | | | | | | | | | | | | |
| | | | | | | | |
Composition of gross debt (excluding deduction of cash balances) | | | | | | | | | | | | | | | | | | | | | | | | | | | | | | | | |
Marketable domestic debt | | | | | | | 85.3 | % | | | 85.5 | % | | | 86.6 | % | | | 84.5 | % | | | 82.9 | % | | | 84.2 | % | | | 87.0 | % |
Government bonds | | | | | | | 79.1 | % | | | 78.6 | % | | | 79.0 | % | | | 76.2 | % | | | 73.9 | % | | | 73.8 | % | | | 72.8 | % |
Treasury bills | | | | | | | 6.3 | % | | | 6.9 | % | | | 7.6 | % | | | 8.3 | % | | | 9.0 | % | | | 10.4 | % | | | 14.2 | % |
Bridging bonds | | | | | | | 0.0 | % | | | 0.0 | % | | | 0.0 | % | | | 0.0 | % | | | 0.0 | % | | | 0.0 | % | | | 0.0 | % |
Non-marketable domestic debt | | | 3) | | | | 0.4 | % | | | 0.7 | % | | | 0.7 | % | | | 0.6 | % | | | 0.4 | % | | | 0.3 | % | | | 0.6 | % |
| | | | | | | | | | | | | | | | | | | | | | | | | | | | | | | | |
| | | | | | | | |
Domestic debt | | | | | | | 85.8 | % | | | 86.2 | % | | | 87.3 | % | | | 85.1 | % | | | 83.3 | % | | | 84.5 | % | | | 87.6 | % |
Foreign debt | | | 5) | | | | 14.2 | % | | | 13.8 | % | | | 12.7 | % | | | 14.9 | % | | | 16.7 | % | | | 15.5 | % | | | 12.4 | % |
| | | | | | | | | | | | | | | | | | | | | | | | | | | | | | | | |
| | | | | | | | |
Total as percentage of GDP | | | | | | | | | | | | | | | | | | | | | | | | | | | | | | | | |
Gross domestic debt | | | | | | | 29.9 | % | | | 29.8 | % | | | 28.6 | % | | | 25.7 | % | | | 23.2 | % | | | 23.1 | % | | | 28.7 | % |
Net domestic debt | | | | | | | 29.0 | % | | | 27.7 | % | | | 25.0 | % | | | 21.6 | % | | | 18.6 | % | | | 18.7 | % | | | 24.4 | % |
Gross foreign debt | | | | | | | 5.0 | % | | | 4.8 | % | | | 4.1 | % | | | 4.5 | % | | | 4.6 | % | | | 4.2 | % | | | 4.0 | % |
Net foreign debt | | | | | | | 5.0 | % | | | 4.8 | % | | | 4.1 | % | | | 4.5 | % | | | 4.6 | % | | | 4.2 | % | | | 3.0 | % |
Gross loan debt | | | | | | | 34.9 | % | | | 34.6 | % | | | 32.7 | % | | | 30.2 | % | | | 27.8 | % | | | 27.3 | % | | | 32.8 | % |
Net loan debt | | | | | | | 33.9 | % | | | 32.5 | % | | | 29.1 | % | | | 26.1 | % | | | 23.3 | % | | | 22.9 | % | | | 27.4 | % |
| 1) | Debt of the central government, excluding extra-budgetary institutions and social security funds. |
| 2) | As projected at the end of January 2014. |
| 3) | Includes non-marketable Treasury bills, retail bonds, loan levies, former regional authorities and Namibian loans. |
| 4) | Bank balances of the National Revenue Fund (balances of government’s accounts with the Reserve Bank and commercial banks). Bank balances in foreign currencies are revaluated using forward estimates of exchange rates. |
154
ANNEXURE B: STATISTICAL TABLES
| | | | | | | | | | | | | | | | | | | | | | | | | | | | | | |
| | | | | | | | | | | | | | | | | | | | | | | | | | | | | | Table 10 Total debt of government 1) |
| 2010/11 | | | 2011/12 | | | 2012/13 | | | 2013/14 2) | | | 2014/15 | | | 2015/16 | | | 2016/17 | | | | | |
| | | | | | | | | | | | | | | | | | | | | | | | R million |
| | | | | | | | | | | | | | | | | | | | | | | | | | | | | | Domestic debt |
| | 869 588 | | | | 1 045 415 | | | | 1 210 834 | | | | 1 409 243 | | | | 1 600 612 | | | | 1 805 909 | | | | 2 021 222 | | | | | Marketable |
| | 733 438 | | | | 890 256 | | | | 1 038 849 | | | | 1 214 258 | | | | 1 382 627 | | | | 1 563 924 | | | | 1 753 237 | | | | | Government bonds |
| | 136 150 | | | | 155 159 | | | | 171 985 | | | | 194 985 | | | | 217 985 | | | | 241 985 | | | | 267 985 | | | | | Treasury bills |
| | — | | | | — | | | | — | | | | — | | | | — | | | | — | | | | — | | | | | Bridging bonds |
| | 23 133 | | | | 25 524 | | | | 30 300 | | | | 29 409 | | | | 30 044 | | | | 30 248 | | | | 30 081 | | | 3) | | Non-marketable |
| | | | | | | | |
| | 892 721 | | | | 1 070 939 | | | | 1 241 134 | | | | 1 438 652 | | | | 1 630 656 | | | | 1 836 157 | | | | 2 051 303 | | | | | Gross loan debt |
| | -111 413 | | | | -130 450 | | | | -103 774 | | | | -123 157 | | | | -107 157 | | | | -107 157 | | | | -107 157 | | | 4) | | Cash balances |
| | 781 308 | | | | 940 489 | | | | 1 137 360 | | | | 1 315 495 | | | | 1 523 499 | | | | 1 729 000 | | | | 1 944 146 | | | | | Net loan debt |
| | | | | | | | | | | | | | | | | | | | | | | | | | | | | | |
| | | | | | | | |
| | | | | | | | | | | | | | | | | | | | | | | | | | | | | | Foreign debt |
| | 97 851 | | | | 116 851 | | | | 124 555 | | | | 147 785 | | | | 147 249 | | | | 154 697 | | | | 149 809 | | | 5) | | Gross loan debt |
| | -58 750 | | | | -67 609 | | | | -80 308 | | | | -87 737 | | | | -81 691 | | | | -79 133 | | | | -74 995 | | | 4) | | Cash balances |
| | 39 101 | | | | 49 242 | | | | 44 247 | | | | 60 048 | | | | 65 558 | | | | 75 564 | | | | 74 814 | | | | | Net loan debt |
| | | | | | | | | | | | | | | | | | | | | | | | | | | | | | |
| | | | | | | | |
| | 990 572 | | | | 1 187 790 | | | | 1 365 689 | | | | 1 586 437 | | | | 1 777 905 | | | | 1 990 854 | | | | 2 201 113 | | | | | Gross loan debt |
| | 820 409 | | | | 989 731 | | | | 1 181 607 | | | | 1 375 543 | | | | 1 589 057 | | | | 1 804 564 | | | | 2 018 961 | | | | | Net loan debt |
| | | | | | | | | | | | | | | | | | | | | | | | | | | | | | |
| | | | | | | | |
| | -28 283 | | | | -67 655 | | | | -125 552 | | | | -171 224 | | | | -171 224 | | | | -171 224 | | | | -171 224 | | | 6) | | Gold and foreign exchange contingency reserve account |
| | | | | | | | | | | | | | | | | | | | | | | | | | | | | | |
| | | | | | | | | | | | | | | | | | | | | | | | | | | | | | Composition of gross debt (excluding deduction of cash balances) |
| | 87.8 | % | | | 88.0 | % | | | 88.7 | % | | | 88.8 | % | | | 90.0 | % | | | 90.7 | % | | | 91.8 | % | | | | Marketable domestic debt |
| | 74.0 | % | | | 75.0 | % | | | 76.1 | % | | | 76.5 | % | | | 77.8 | % | | | 78.6 | % | | | 79.7 | % | | | | Government bonds |
| | 13.7 | % | | | 13.1 | % | | | 12.6 | % | | | 12.3 | % | | | 12.3 | % | | | 12.2 | % | | | 12.2 | % | | | | Treasury bills |
| | 0.0 | % | | | 0.0 | % | | | 0.0 | % | | | 0.0 | % | | | 0.0 | % | | | 0.0 | % | | | 0.0 | % | | | | Bridging bonds |
| | 2.3 | % | | | 2.1 | % | | | 2.2 | % | | | 1.9 | % | | | 1.7 | % | | | 1.5 | % | | | 1.4 | % | | 3) | | Non-marketable domestic debt |
| | | | | | | | | | | | | | | | | | | | | | | | | | | | | | |
| | | | | | | | |
| | 90.1 | % | | | 90.2 | % | | | 90.9 | % | | | 90.7 | % | | | 91.7 | % | | | 92.2 | % | | | 93.2 | % | | | | Domestic debt |
| | 9.9 | % | | | 9.8 | % | | | 9.1 | % | | | 9.3 | % | | | 8.3 | % | | | 7.8 | % | | | 6.8 | % | | 5) | | Foreign debt |
| | | | | | | | | | | | | | | | | | | | | | | | | | | | | | |
| | | | | | | | | | | | | | | | | | | | | | | | | | | | | | Total as percentage of GDP |
| | 32.5 | % | | | 35.9 | % | | | 38.8 | % | | | 41.5 | % | | | 43.0 | % | | | 44.2 | % | | | 45.1 | % | | | | Gross domestic debt |
| | 28.4 | % | | | 31.5 | % | | | 35.6 | % | | | 38.0 | % | | | 40.2 | % | | | 41.7 | % | | | 42.7 | % | | | | Net domestic debt |
| | 3.6 | % | | | 3.9 | % | | | 3.9 | % | | | 4.3 | % | | | 3.9 | % | | | 3.7 | % | | | 3.3 | % | | | | Gross foreign debt |
| | 1.4 | % | | | 1.7 | % | | | 1.4 | % | | | 1.7 | % | | | 1.7 | % | | | 1.8 | % | | | 1.6 | % | | | | Net foreign debt |
| | 36.0 | % | | | 39.8 | % | | | 42.7 | % | | | 45.8 | % | | | 46.9 | % | | | 48.0 | % | | | 48.3 | % | | | | Gross loan debt |
| | 29.8 | % | | | 33.2 | % | | | 36.9 | % | | | 39.7 | % | | | 41.9 | % | | | 43.5 | % | | | 44.3 | % | | | | Net loan debt |
| 5) | Valued at appropriate foreign exchange rates up to 31 March 2013 as at the end of each period. Forward estimates are based on exchange rates prevailing at 31 January 2014, projected to depreciate in line with inflation differentials. |
| 6) | The balance on the gold and foreign exchange contingency reserve account on 31 March 2014 represents an estimated balance on the account. No provision for any profits or losses on this account has been made for subsequent years. A negative balance indicates a profit and a positive balance a loss. |
155
2014 BUDGET REVIEW
Table 11
Financial guarantees:
Amounts drawn on government guarantees
| | | | | | | | | | | | | | | | | | | | | | | | |
| | | 2010/11 | | | 2011/12 | |
| | | Domestic | | | Foreign | | | Total | | | Domestic | | | Foreign | | | Total | |
R million | | | | | | | | | | | | | | | | | | |
General government sector | | | 294 | | | | — | | | | 294 | | | | 224 | | | | — | | | | 224 | |
| | | | | | |
Central government | | | 294 | | | | — | | | | 294 | | | | 224 | | | | — | | | | 224 | |
| | | | | | |
Former regional authorities | | | 154 | | | | — | | | | 154 | | | | 138 | | | | — | | | | 138 | |
Guarantee scheme for housing loans to employees | | | 104 | | | | — | | | | 104 | | | | 64 | | | | — | | | | 64 | |
Guarantee scheme for motor vehicles - senior officials | | | 3 | | | | — | | | | 3 | | | | 2 | | | | — | | | | 2 | |
Universities and technikons | | | 33 | | | | — | | | | 33 | | | | 20 | | | | — | | | | 20 | |
| | | | | | |
State-owned companies | | | 127 321 | | | | 21 891 | | | | 149 212 | | | | 126 583 | | | | 27 023 | | | | 153 606 | |
| | | | | | |
Non-financial | | | 110 371 | | | | 10 638 | | | | 121 009 | | | | 110 383 | | | | 16 023 | | | | 126 406 | |
| | | | | | |
Denel | | | 1 850 | | | | — | | | | 1 850 | | | | 1 850 | | | | — | | | | 1 850 | |
Eskom | | | 60 662 | | | | 6 395 | | | | 67 057 | | | | 65 367 | | | | 11 863 | | | | 77 230 | |
Irrigation boards | | | 44 | | | | — | | | | 44 | | | | 48 | | | | — | | | | 48 | |
Kalahari East Water Board | | | 16 | | | | — | | | | 16 | | | | 15 | | | | — | | | | 15 | |
Komati Basin Water Authority | | | 1 340 | | | | — | | | | 1 340 | | | | 1 247 | | | | — | | | | 1 247 | |
Lesotho Highlands Development Authority | | | 2 | | | | 225 | | | | 227 | | | | 1 | | | | 170 | | | | 171 | |
Nuclear Energy Corporation of South Africa | | | 20 | | | | — | | | | 20 | | | | 20 | | | | — | | | | 20 | |
Passenger Rail Agency of South Africa | | | 468 | | | | — | | | | 468 | | | | 264 | | | | — | | | | 264 | |
South African Airways | | | 1 916 | | | | — | | | | 1 916 | | | | 1 300 | | | | — | | | | 1 300 | |
South African Broadcasting Corporation | | | 1 000 | | | | — | | | | 1 000 | | | | 889 | | | | — | | | | 889 | |
South African Express | | | — | | | | — | | | | — | | | | — | | | | — | | | | — | |
South African National Roads Agency Limited | | | 18 605 | | | | — | | | | 18 605 | | | | 19 426 | | | | — | | | | 19 426 | |
Telkom South Africa | | | — | | | | 90 | | | | 90 | | | | — | | | | 85 | | | | 85 | |
Trans-Caledon Tunnel Authority | | | 18 317 | | | | 172 | | | | 18 489 | | | | 19 738 | | | | 148 | | | | 19 886 | |
Transnet | | | 6 131 | | | | 3 756 | | | | 9 887 | | | | 218 | | | | 3 757 | | | | 3 975 | |
| | | | | | |
Financial | | | 16 950 | | | | 11 253 | | | | 28 203 | | | | 16 200 | | | | 11 000 | | | | 27 200 | |
| | | | | | |
Development Bank of Southern Africa | | | 15 200 | | | | 10 513 | | | | 25 713 | | | | 15 200 | | | | 10 354 | | | | 25 554 | |
Industrial Development Corporation of South Africa | | | — | | | | 740 | | | | 740 | | | | — | | | | 646 | | | | 646 | |
Land Bank | | | 1 750 | | | | — | | | | 1 750 | | | | 1 000 | | | | — | | | | 1 000 | |
South African Reserve Bank | | | — | | | | — | | | | — | | | | — | | | | — | | | | — | |
| | | | | | |
Private sector | | | 94 | | | | — | | | | 94 | | | | 94 | | | | — | | | | 94 | |
| | | | | | |
Agricultural cooperatives | | | 94 | | | | — | | | | 94 | | | | 94 | | | | — | | | | 94 | |
| | | | | | | | | | | | | | | | | | | | | | | | |
| | | | | | |
Total | | | 127 709 | | | | 21 891 | | | | 149 600 | | | | 126 901 | | | | 27 023 | | | | 153 924 | |
| | | | | | | | | | | | | | | | | | | | | | | | |
| 1) | As projected at the end of December 2013. |
156
ANNEXURE B: STATISTICAL TABLES
| | | | | | | | | | | | | | | | | | | | | | | | |
| | | | | | | Table 11 Financial guarantees: Amounts drawn on government guarantees |
| 2012/13 | | | 2013/14 1) | | | |
| Domestic | | | Foreign | | | Total | | | Domestic | | | Foreign | | | Total | | | |
| | | | | | | | | | | | | | | | | | | | | | | | R million |
| | | | | | |
| | 181 | | | | — | | | | 181 | | | | 181 | | | | — | | | | 181 | | | General government sector |
| | | | | | |
| | 181 | | | | — | | | | 181 | | | | 181 | | | | — | | | | 181 | | | Central government |
| | | | | | |
| | 124 | | | | — | | | | 124 | | | | 124 | | | | — | | | | 124 | | | Former regional authorities |
| | 46 | | | | — | | | | 46 | | | | 46 | | | | — | | | | 46 | | | Guarantee scheme for housing loans to employees |
| | 1 | | | | — | | | | 1 | | | | 1 | | | | — | | | | 1 | | | Guarantee scheme for motor vehicles - senior officials |
| | 10 | | | | — | | | | 10 | | | | 10 | | | | — | | | | 10 | | | Universities and technikons |
| | | | | | |
| | 140 701 | | | | 39 265 | | | | 179 966 | | | | 159 264 | | | | 49 647 | | | | 208 911 | | | State-owned companies |
| | | | | | |
| | 124 701 | | | | 28 393 | | | | 153 094 | | | | 143 564 | | | | 38 275 | | | | 181 839 | | | Non-financial |
| | | | | | |
| | 1 850 | | | | — | | | | 1 850 | | | | 1 850 | | | | — | | | | 1 850 | | | Denel |
| | 79 231 | | | | 24 292 | | | | 103 523 | | | | 88 159 | | | | 34 174 | | | | 122 333 | | | Eskom |
| | 46 | | | | — | | | | 46 | | | | 46 | | | | — | | | | 46 | | | Irrigation boards |
| | 6 | | | | — | | | | 6 | | | | 6 | | | | — | | | | 6 | | | Kalahari East Water Board |
| | 1 190 | | | | — | | | | 1 190 | | | | 1 190 | | | | — | | | | 1 190 | | | Komati Basin Water Authority |
| | 1 | | | | 131 | | | | 132 | | | | 1 | | | | 131 | | | | 132 | | | Lesotho Highlands Development Authority |
| | 20 | | | | — | | | | 20 | | | | 20 | | | | — | | | | 20 | | | Nuclear Energy Corporation of South Africa |
| | 133 | | | | — | | | | 133 | | | | 133 | | | | — | | | | 133 | | | Passenger Rail Agency of South Africa |
| | 2 238 | | | | — | | | | 2 238 | | | | 4 932 | | | | — | | | | 4 932 | | | South African Airways |
| | 167 | | | | — | | | | 167 | | | | — | | | | — | | | | — | | | South African Broadcasting Corporation |
| | — | | | | — | | | | — | | | | 539 | | | | — | | | | 539 | | | South African Express |
| | 19 482 | | | | — | | | | 19 482 | | | | 26 351 | | | | — | | | | 26 351 | | | South African National Roads Agency Limited |
| | — | | | | 90 | | | | 90 | | | | — | | | | 90 | | | | 90 | | | Telkom South Africa |
| | 20 337 | | | | 123 | | | | 20 460 | | | | 20 337 | | | | 123 | | | | 20 460 | | | Trans-Caledon Tunnel Authority |
| | — | | | | 3 757 | | | | 3 757 | | | | — | | | | 3 757 | | | | 3 757 | | | Transnet |
| | | | | | |
| | 16 000 | | | | 10 872 | | | | 26 872 | | | | 15 700 | | | | 11 372 | | | | 27 072 | | | Financial |
| | | | | | |
| | 15 200 | | | | 10 297 | | | | 25 497 | | | | 15 200 | | | | 10 297 | | | | 25 497 | | | Development Bank of Southern Africa |
| | — | | | | 575 | | | | 575 | | | | — | | | | 575 | | | | 575 | | | Industrial Development Corporation of South Africa |
| | 800 | | | | — | | | | 800 | | | | 500 | | | | 500 | | | | 1 000 | | | Land Bank |
| | — | | | | — | | | | — | | | | — | | | | — | | | | — | | | South African Reserve Bank |
| | | | | | |
| | 93 | | | | — | | | | 93 | | | | 93 | | | | — | | | | 93 | | | Private sector |
| | | | | | |
| | 93 | | | | — | | | | 93 | | | | 93 | | | | — | | | | 93 | | | Agricultural cooperatives |
| | | | | | | | | | | | | | | | | | | | | | | | |
| | 140 975 | | | | 39 265 | | | | 180 240 | | | | 159 538 | | | | 49 647 | | | | 209 185 | | | Total |
| | | | | | | | | | | | | | | | | | | | | | | | |
157
2014 BUDGET REVIEW
This page was left blank intentionally.
158
C
Miscellaneous tax amendments
This annexure should be read with Chapter 4 of the Budget Review. It provides further details on some of the chapter’s proposals, as well as tax proposals to clarify current legislation or proposals of a more technical nature.
| ¢ | | Tax expenditure statement: February 2014 |
Introduction
Tax expenditures are provisions in tax legislation that reduce the amount of tax revenue that could otherwise have been realised. Tax expenditures can be defined as deviations from the benchmark of a standard tax legislative framework.
This statement is the fourth summary of tax expenditure estimates. Table C.2 details the 2014 tax expenditure statement, indicating an estimate of just over R108 billion in 2011/12 or 14.6 per cent of total gross tax revenue. Tax expenditure estimates reported in the previous statements may have changed due to availability of more recent data, updated assumptions and other corrections.
Major changes to tax expenditure
Anomalies have been discovered in the way data pertaining to customs and excise duties was previously presented. The 2013 tax expenditure estimates for duties associated with the Motor Industry Development Programme (MIDP), textiles and clothing, furniture and fixtures, and other customs (goods manufactured for exports, television monitors and agricultural goods) for 2009/10 should have been for 2010/11. This has been rectified. In addition, the substantial increases in tax expenditure previously reported for MIDP and other customs for 2010/11 was an overestimate.
In some instances, the value of goods was included as tax expenditure instead of the actual duty value attached to those goods. This has been corrected.
With the exception of the major changes mentioned above, all other adjustments are due to the level of assessment approaching 100 per cent for years up to and including 2010/11. For the outer year (2011/12), some amounts are lower than for 2010/11 – this is due to a lower level of assessment at the time the data was extracted for this exercise.
159
2014 BUDGET REVIEW
VAT relief on fuel sales
Because petrol, diesel and illuminating paraffin are zero-rated for value-added tax (VAT) purposes, the resulting difference from a standard rating, when used by final consumers, is regarded as tax expenditure. It was assumed that 20 per cent of petrol sales was used for business purposes (by VAT vendors) and would have qualified to claim input VAT. For diesel, it was assumed that 90 per cent of sales was used for business purposes and would have qualified for input VAT.
Average national diesel, petrol and paraffin prices are shown below.
Table C.1 National average price and quantity of fuel sold (million litres)
| | | | | | | | | | | | | | | | | | | | | | | | | | | | | | | | | | | | | | | | |
| | | 2008 | | | 2009 | | | 2010 | | | 2011 | | | 2012 | |
Fuel type | | Price
(Rand/l) | | | Quantity | | | Price
(Rand/l) | | | Quantity | | | Price
(Rand/l) | | | Quantity | | | Price
(Rand/l) | | | Quantity | | | Price
(Rand/l) | | | Quantity | |
Diesel | | | 6.7 | | | | 9 976 | | | | 9.0 | | | | 9 914 | | | | 6.7 | | | | 9 570 | | | | 7.7 | | | | 10 333 | | | | 9.7 | | | | 11 291 | |
Petrol | | | 7.1 | | | | 11 531 | | | | 8.6 | | | | 11 055 | | | | 7.6 | | | | 11 319 | | | | 8.4 | | | | 11 541 | | | | 10.3 | | | | 11 972 | |
Paraffin | | | 5.2 | | | | 694 | | | | 7.1 | | | | 506 | | | | 4.8 | | | | 776 | | | | 5.4 | | | | 482 | | | | 7.3 | | | | 576 | |
Estimates of tax expenditure
The following table summarises tax expenditure in terms of the Income Tax Act (1962), the VAT Act (1991) and the Customs and Excise Act (1964).
160
ANNEXURE C: MISCELLANEOUS TAX AMENDMENTS
Table C.2 Tax expenditure estimates (R million)
| | | | | | | | | | | | | | | | |
| | | 2008/09 | | | 2009/10 | | | 2010/11 | | | 2011/12 | |
Personal income tax | | | | | | | | | | | | | | | | |
Pension and retirement annuity contributions1 | | | 15 818 | | | | 18 123 | | | | 21 983 | | | | 24 189 | |
Pension contributions – employees | | | 5 879 | | | | 6 834 | | | | 7 777 | | | | 8 563 | |
Pension contributions – employers | | | 6 612 | | | | 7 685 | | | | 10 033 | | | | 11 046 | |
Retirement annuity | | | 3 327 | | | | 3 605 | | | | 4 173 | | | | 4 581 | |
Medical | | | 10 483 | | | | 12 224 | | | | 14 970 | | | | 16 729 | |
Medical contributions & deductions – employees | | | 5 825 | | | | 6 904 | | | | 14 970 | | | | 16 729 | |
Medical contributions – employers 2 | | | 4 657 | | | | 5 320 | | | | – | | | | – | |
Interest exemptions | | | 1 649 | | | | 2 214 | | | | 2 089 | | | | 1 845 | |
Secondary rebate (65 years and older) | | | 1 426 | | | | 1 436 | | | | 1 719 | | | | 1 066 | |
Donations | | | 106 | | | | 113 | | | | 134 | | | | 169 | |
Capital gains tax (annual exclusion) | | | 85 | | | | 63 | | | | 68 | | | | 96 | |
| | | | | | | | | | | | | | | | |
Total personal income tax | | | 29 567 | | | | 34 173 | | | | 40 963 | | | | 44 095 | |
| | | | | | | | | | | | | | | | |
| | | | |
Corporate income tax | | | | | | | | | | | | | | | | |
Small business corporation tax savings | | | 1 298 | | | | 1 346 | | | | 1 412 | | | | 1 278 | |
Reduced headline rate | | | 1 277 | | | | 1 328 | | | | 1 392 | | | | 1 261 | |
Section 12E depreciation allowance | | | 20 | | | | 18 | | | | 21 | | | | 17 | |
Research and development | | | 594 | | | | 727 | | | | 685 | | | | 241 | |
Learnership allowances | | | 403 | | | | 646 | | | | 670 | | | | 420 | |
Strategic industrial policy3 | | | 61 | | | | 215 | | | | 138 | | | | 374 | |
Film incentive | | | 280 | | | | 180 | | | | 287 | | | | 1 | |
Urban development zones | | | 159 | | | | 239 | | | | 364 | | | | 176 | |
| | | | | | | | | | | | | | | | |
Total corporate income tax | | | 2 795 | | | | 3 353 | | | | 3 557 | | | | 2 490 | |
| | | | | | | | | | | | | | | | |
| | | | |
Value-added tax Zero-rated supplies | | | | | | | | | | | | | | | | |
19 basic food items4 | | | 13 907 | | | | 14 606 | | | | 15 962 | | | | 17 415 | |
Petrol5 | | | 10 524 | | | | 9 463 | | | | 10 845 | | | | 13 797 | |
Diesel5 | | | 1 249 | | | | 918 | | | | 1 107 | | | | 1 532 | |
Paraffin5 | | | 520 | | | | 356 | | | | 367 | | | | 585 | |
Municipal property rates | | | 3 921 | | | | 3 969 | | | | 6 029 | | | | 7 564 | |
Reduced inclusion rate for “commercial” accommodation | | | 138 | | | | 151 | | | | 156 | | | | 175 | |
Subtotal zero-rated supplies | | | 30 258 | | | | 29 462 | | | | 34 466 | | | | 41 068 | |
| | | | | | | | | | | | | | | | |
Exempt supplies (public transport & education) | | | 832 | | | | 922 | | | | 1 001 | | | | 1 079 | |
| | | | | | | | | | | | | | | | |
| | | | |
Customs duties and excise | | | | | | | | | | | | | | | | |
Motor vehicles (MIDP, including IRCCs)6 | | | 16 169 | | | | 12 089 | | | | 12 673 | | | | 16 306 | |
Textile and clothing (duty credits – DCCs)6 | | | 1 828 | | | | 2 024 | | | | 2 230 | | | | 860 | |
Furniture and fixtures | | | 166 | | | | 128 | | | | 153 | | | | 150 | |
Other customs7 | | | 1 140 | | | | 1 230 | | | | 787 | | | | 847 | |
Diesel refund (mining, agriculture and fishing) | | | 1 242 | | | | 1 295 | | | | 1 283 | | | | 1 756 | |
Total customs and excise | | | 20 545 | | | | 16 766 | | | | 17 126 | | | | 19 919 | |
| | | | | | | | | | | | | | | | |
Total tax expenditure | | | 83 996 | | | | 84 676 | | | | 97 113 | | | | 108 651 | |
| | | | | | | | | | | | | | | | |
Tax expenditure as % of total gross tax revenue | | | 13.4 | % | | | 14.1 | % | | | 14.4 | % | | | 14.6 | % |
Total gross tax revenue | | | 625 100 | | | | 598 705 | | | | 674 183 | | | | 742 650 | |
| | | | | | | | | | | | | | | | |
Tax expenditure as % of GDP | | | 4.0 | % | | | 3.7 | % | | | 4.0 | % | | | 4.0 | % |
| | | | | | | | | | | | | | | | |
| 1. | Some of this tax expenditure is recouped when amounts are withdrawn as either a lump sum or an annuity. |
| 2. | Employer contributions are assumed to be equivalent to employee deductions for 2008/09-2009/10; tax-free fringe benefit for employer contributions was removed effective 1 March 2012 (2010/11). |
| 3. | Tax expenditure for all years is attributable to allowances under the s12G Strategic Industrial Policy (s12I came into effect in 2010, however, no tax expenditure is recorded for 2011/12 because production started in 2012/13). |
| 4. | VAT relief in respect of basic food items based on an independent study, as well as 2010/11 income and expenditure survey data. |
| 5. | Based on fuel volumes and average retail selling prices. |
| 6. | MIDP = Motor Industry Development Programme, IRCC = import rebate credit certificate, DCC = duty credit certificates. |
| 7. | Goods manufactured exclusively for exports, television monitors and agricultural goods exempted. |
161
2014 BUDGET REVIEW
The primary rebate has been increased to R12 726 per year for all individuals. The secondary rebate, which applies to individuals aged 65 years and over, is increased to R7 110 per year. The third rebate, which applies to individuals aged 75 years and over, is increased to R2 367 per year. The threshold below which individuals are not liable for personal income tax is increased to R70 700 of taxable income per year for those below the age of 65, R110 200 per year for those aged 65 to 74, and R123 350 for individuals aged 75 and over. The rates for the 2013/14 tax year and the proposed rates for 2014/15 are set out in Table C.3.
Table C.3 Personal income tax rate and bracket adjustments, 2013/14 – 2014/15
| | | | | | |
| 2013/14 | | 2014/15 |
Taxable income (R) | | Rates of tax | | Taxable income (R) | | Rates of tax |
R0 - R165 600 | | 18% of each R1 | | R0 - R174 550 | | 18% of each R1 |
R165 601 - R258 750 | | R29 808 + 25% of the | | R174 551 - R272 700 | | R31 419 + 25% of the |
| | amount above R165 600 | | | | amount above R174 550 |
R258 751 - R358 110 | | R53 096 + 30% of the | | R272 701 - R377 450 | | R55 957 + 30% of the |
| | amount above R258 750 | | | | amount above R272 700 |
R358 111 - R500 940 | | R82 904 + 35% of the | | R377 451 - R528 000 | | R87 382 + 35% of the |
| | amount above R358 110 | | | | amount above R377 450 |
R500 941 - R638 600 | | R132 894 + 38% of the | | R528 001 - R673 100 | | R140 074 + 38% of the |
| | amount above R500 940 | | | | amount above R528 000 |
R638 601 | | R185 205 + 40% of the | | R673 101 | | R195 212 + 40% of the |
| | amount above R638 600 | | | | amount above R673 100 |
Rebates | | | | Rebates | | |
Primary | | R12 080 | | Primary | | R12 726 |
Secondary | | R6 750 | | Secondary | | R7 110 |
Tertiary | | R2 250 | | Tertiary | | R2 367 |
| | | |
Tax threshold | | | | Tax threshold | | |
Below age 65 | | R67 111 | | Below age 65 | | R70 700 |
Age 65 and over | | R104 611 | | Age 65 and over | | R110 200 |
Age 75 and over | | R117 111 | | Age 75 and over | | R123 350 |
The proposed tax schedule in Table C.3 compensates individuals for the effect of inflation on income tax liabilities and results in reduced tax liability for all taxpayers. These tax reductions are set out in tables C.4, C.5 and C.6. The average tax rates (tax as a percentage of taxable income) for individuals are illustrated in figures C.1, C.2 and C.3.
162
ANNEXURE C: MISCELLANEOUS TAX AMENDMENTS
Table C.4 Income tax payable, 2014/15 (taxpayers below age 65)
| | | | | | | | | | | | | | | | |
| Taxable income | | 2013/14 rates | | | Proposed rates | | | Tax reduction | | | % | |
(Rands) | | (Rands) | | | (Rands) | | | (Rands) | | | reduction | |
75 000 | | | 1 420 | | | | 774 | | | | -646 | | | | -45.5 | % |
80 000 | | | 2 320 | | | | 1 674 | | | | -646 | | | | -27.8 | % |
85 000 | | | 3 220 | | | | 2 574 | | | | -646 | | | | -20.1 | % |
90 000 | | | 4 120 | | | | 3 474 | | | | -646 | | | | -15.7 | % |
100 000 | | | 5 920 | | | | 5 274 | | | | -646 | | | | -10.9 | % |
120 000 | | | 9 520 | | | | 8 874 | | | | -646 | | | | -6.8 | % |
150 000 | | | 14 920 | | | | 14 274 | | | | -646 | | | | -4.3 | % |
200 000 | | | 26 328 | | | | 25 056 | | | | -1 273 | | | | -4.8 | % |
250 000 | | | 38 828 | | | | 37 556 | | | | -1 273 | | | | -3.3 | % |
300 000 | | | 53 391 | | | | 51 421 | | | | -1 970 | | | | -3.7 | % |
400 000 | | | 85 486 | | | | 82 549 | | | | -2 937 | | | | -3.4 | % |
500 000 | | | 120 486 | | | | 117 549 | | | | -2 937 | | | | -2.4 | % |
750 000 | | | 217 685 | | | | 213 246 | | | | -4 439 | | | | -2.0 | % |
1 000 000 | | | 317 685 | | | | 313 246 | | | | -4 439 | | | | -1.4 | % |
Figure C.1 Average tax rates for taxpayers below age 65
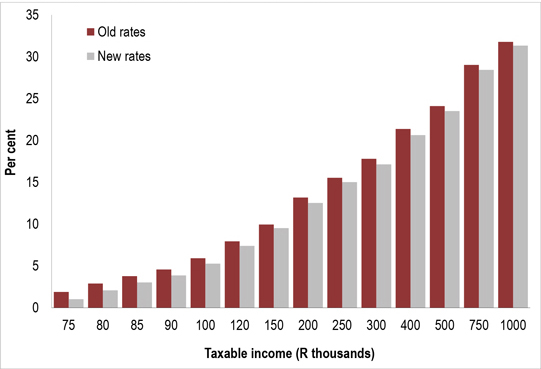
163
2014 BUDGET REVIEW
Table C.5 Income tax payable, 2014/15 (taxpayers age 65 to 74)
| | | | | | | | | | | | | | | | |
| Taxable income | | 2013/14 rates | | | Proposed rates | | | Tax reduction | | | % | |
(Rands) | | (Rands) | | | (Rands) | | | (Rands) | | | reduction | |
120 000 | | | 2 770 | | | | 1 764 | | | | -1 006 | | | | -36.3 | % |
150 000 | | | 8 170 | | | | 7 164 | | | | -1 006 | | | | -12.3 | % |
200 000 | | | 19 578 | | | | 17 946 | | | | -1 633 | | | | -8.3 | % |
250 000 | | | 32 078 | | | | 30 446 | | | | -1 633 | | | | -5.1 | % |
300 000 | | | 46 641 | | | | 44 311 | | | | -2 330 | | | | -5.0 | % |
400 000 | | | 78 736 | | | | 75 439 | | | | -3 297 | | | | -4.2 | % |
500 000 | | | 113 736 | | | | 110 439 | | | | -3 297 | | | | -2.9 | % |
750 000 | | | 210 935 | | | | 206 136 | | | | -4 799 | | | | -2.3 | % |
1 000 000 | | | 310 935 | | | | 306 136 | | | | -4 799 | | | | -1.5 | % |
Figure C.2 Average tax rates for taxpayers age 65 to 74
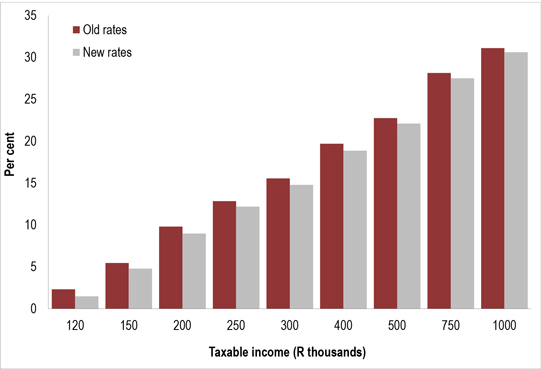
164
ANNEXURE C: MISCELLANEOUS TAX AMENDMENTS
Table C.6 Income tax payable, 2014/15 (taxpayers age 75 and over)
| | | | | | | | | | | | | | | | |
| Taxable income | | 2013/14 rates | | | Proposed rates | | | Tax reduction | | | % | |
(Rands) | | (Rands) | | | (Rands) | | | (Rands) | | | reduction | |
150 000 | | | 5 920 | | | | 4 797 | | | | -1 123 | | | | -19.0 | % |
200 000 | | | 17 328 | | | | 15 579 | | | | -1 750 | | | | -10.1 | % |
250 000 | | | 29 828 | | | | 28 079 | | | | -1 750 | | | | -5.9 | % |
300 000 | | | 44 391 | | | | 41 944 | | | | -2 447 | | | | -5.5 | % |
400 000 | | | 76 486 | | | | 73 072 | | | | -3 414 | | | | -4.5 | % |
500 000 | | | 111 486 | | | | 108 072 | | | | -3 414 | | | | -3.1 | % |
750 000 | | | 208 685 | | | | 203 769 | | | | -4 916 | | | | -2.4 | % |
1 000 000 | | | 308 685 | | | | 303 769 | | | | -4 916 | | | | -1.6 | % |
Figure C.3 Average tax rates for taxpayers age 75 and over
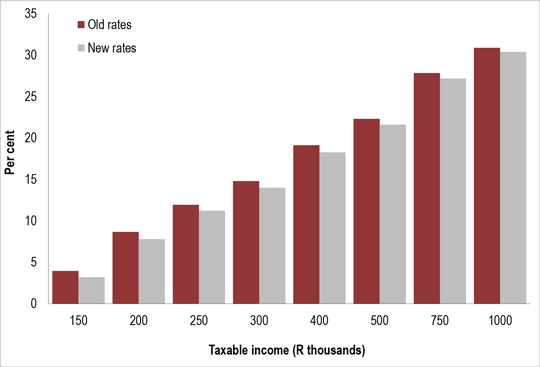
It is proposed that the customs and excise duties in the Customs and Excise Act (schedule 1, part 2 of section A) be amended with effect from 26 February 2014 to the extent shown in Table C.7.
165
2014 BUDGET REVIEW
Table C.7 Specific excise duties, 2013/14 – 2014/15
| | | | | | | | |
Tariff item | | Tariff
subheading | | Article description | | 2013/14
Rate of excise
duty | | 2014/15
Rate of excise
duty |
| 104.00 | | | | PREPARED FOODSTUFFS; BEVERAGES, SPIRITS AND VINEGAR; TOBACCO | | | | |
| 104.01 | | 19.01 | | Malt extract; food preparations of flour, groats, meal, starch or malt extract, not containing cocoa or containing less than 40 per cent by mass of cocoa calculated on a totally defatted basis, not elsewhere specified or included; food preparations of goods of headings 04.01 to 04.04, not containing cocoa or containing less than 5 per cent by mass of cocoa calculated on a totally defatted basis not elsewhere specified or included: | | | | |
| 104.01.10 | | 1901.90.20 | | Traditional African beer powder as defined in Additional Note 1 to Chapter 19 | | 34.7c/kg | | 34.7c/kg |
| 104.10 | | 22.03 | | Beer made from malt: | | | | |
| 104.10.10 | | 2203.00.05 | | Traditional African beer as defined in Additional Note 1 to Chapter 22 | | 7.82c/li | | 7.82c/li |
| 104.10.20 | | 2203.00.90 | | Other | | R63.81/li aa | | R68.92/li aa |
| 104.15 | | 22.04 | | Wine of fresh grapes, including fortified wines; grape must (excluding that of heading 20.09): | | | | |
| 104.15.01 | | 2204.10 | | Sparkling wine | | R8.28/li | | R9.11/li |
| 104.15 | | 2204.21 | | In containers holding 2 li or less: | | | | |
| 104.15 | | 2204.21.4 | | Unfortified wine: | | | | |
| 104.15.03 | | 2204.21.41 | | With an alcoholic strength of at least 6.5 per cent by volume but not exceeding 16.5 per cent by volume | | R2.70/li | | R2.87/li |
| 104.15.04 | | 2204.21.42 | | Other | | R122.80/li aa | | R137.54/li aa |
| 104.15 | | 2204.21.5 | | Fortified wine: | | | | |
| 104.15.05 | | 2204.21.51 | | With an alcoholic strength of at least 15 per cent by volume but not exceeding 22 per cent by volume | | R4.85/li | | R5.21/li |
| 104.15.06 | | 2204.21.52 | | Other | | R122.80/li aa | | R137.54/li aa |
| 104.15 | | 2204.29 | | Other: | | | | |
| 104.15 | | 2204.29.4 | | Unfortified wine: | | | | |
| 104.15.07 | | 2204.29.41 | | With an alcoholic strength of at least 6.5 per cent by volume but not exceeding 16.5 per cent by volume | | R2.70/li | | R2.87/li |
| 104.15.08 | | 2204.29.42 | | Other | | R122.80/li aa | | R137.54/li aa |
| 104.15 | | 2204.29.5 | | Fortified wine: | | | | |
| 104.15.09 | | 2204.29.51 | | With an alcoholic strength of at least 15 per cent by volume but not exceeding 22 per cent by volume | | R4.85/li | | R5.21/li |
| 104.15.10 | | 2204.29.52 | | Other | | R122.80/li aa | | R137.54/li aa |
| 104.16 | | 22.05 | | Vermouth and other wine of fresh grapes flavoured with plants or aromatic substances: | | | | |
| 104.16 | | 2205.10 | | In containers holding 2 li or less: | | | | |
| 104.16.01 | | 2205.10.10 | | Sparkling | | R8.28/li | | R9.11/li |
| 104.16 | | 2205.10.2 | | Unfortified: | | | | |
| 104.16.03 | | 2205.10.21 | | With an alcoholic strength of at least 6.5 per cent by volume but not exceeding 15 per cent by volume | | R2.70/li | | R2.87/li |
| 104.16.04 | | 2205.10.22 | | Other | | R122.80/li aa | | R137.54/li aa |
| 104.16 | | 2205.10.3 | | Fortified: | | | | |
| 104.16.05 | | 2205.10.31 | | With an alcoholic strength of at least 15 per cent by volume but not exceeding 22 per cent by volume | | R4.85/li | | R5.21/li |
| 104.16.06 | | 2205.10.32 | | Other | | R122.80/li aa | | R137.54/li aa |
| 104.16 | | 2205.90 | | Other: | | | | |
| 104.16 | | 2205.90.2 | | Unfortified: | | | | |
| 104.16.09 | | 2205.90.21 | | With an alcoholic strength of at least 6.5 per cent by volume but not exceeding 15 per cent by volume | | R2.70/li | | R2.87/li |
| 104.16.10 | | 2205.90.22 | | Other | | R122.80/li aa | | R137.54/li aa |
166
ANNEXURE C: MISCELLANEOUS TAX AMENDMENTS
| | | | | | | | |
Table C.7 Specific excise duties, 2013/14 – 2014/15 (continued) | | |
Tariff item | | Tariff
subheading | | Article description | | 2013/14
Rate of excise
duty | | 2014/15
Rate of excise
duty |
104.16 | | 2205.90.3 | | Fortified: | | | | |
| 104.16.11 | | 2205.90.31 | | With an alcoholic strength of at least 15 per cent by volume but not exceeding 22 per cent by volume | | R4.85/li | | R5.21/li |
| 104.16.12 | | 2205.90.32 | | Other | | R122.80/li aa | | R137.54/li aa |
| 104.17 | | 22.06 | | Other fermented beverages (for example, cider, perry and mead); mixtures of fermented beverages and mixtures of fermented beverages and non-alcoholic beverages, not elsewhere specified or included: | | | | |
| 104.17.03 | | 2206.00.05 | | Sparkling fruit beverages and sparkling mead | | R8.28/li | | R9.11/li |
| 104.17.05 | | 2206.00.15 | | Traditional African beer as defined in Additional Note 1 to Chapter 22 | | 7.82c/li | | 7.82c/li |
| 104.17.07 | | 2206.00.17 | | Other fermented beverages, unfortified, with an alcoholic strength of less than 2.5 per cent by volume | | R63.81/li aa | | R68.92/li aa |
| 104.17.15 | | 2206.00.81 | | Other fermented apple or pear beverages, unfortified, with an alcoholic strength of at least 2.5 per cent by volume but not exceeding 15 per cent by volume | | R3.19/li | | R3.45c/li |
| 104.17.16 | | 2206.00.82 | | Other fermented fruit beverages and mead beverages, including mixtures of fermented beverages derived from the fermentation of fruit or honey, unfortified, with an alcoholic strength of at least 2.5 per cent by volume but not exceeding 15 per cent by volume | | R3.19/li | | R3.45c/li |
| 104.17.17 | | 2206.00.83 | | Other fermented apple or pear beverages, fortified, with an alcoholic strength of at least 15 per cent by volume but not exceeding 23 per cent by volume | | R50.16/li aa | | R56.19/li aa |
| 104.17.21 | | 2206.00.84 | | Other fermented fruit beverages and mead beverages including mixtures of fermented beverages derived from the fermentation of fruit or honey, fortified, with an alcoholic strength of at least 15 per cent by volume but not exceeding 23 per cent by volume | | R50.16/li aa | | R56.19/li aa |
| 104.17.22 | | 2206.00.85 | | Other mixtures of fermented fruit beverages or mead beverages and non-alcoholic beverages, unfortified, with an alcoholic strength of at least 2.5 per cent by volume but not exceeding 15 per cent by volume | | R3.19/li | | R3.45/li |
| 104.17.25 | | 2206.00.87 | | Other mixtures of fermented fruit beverages or mead beverages and non-alcoholic beverages, fortified , with an alcoholic strength of at least 15 per cent by volume but not exceeding 23 per cent by volume | | R50.16/li aa | | R56.19/li aa |
| 104.17.90 | | 2206.00.90 | | Other | | R63.81/li aa | | R68.92/li aa |
| 104.21 | | 22.07 | | Undenatured ethyl alcohol of an alcoholic strength by volume of 80 per cent volume or higher; ethyl alcohol and other spirits, denatured, of any strength: | | | | |
| 104.21.01 | | 2207.10 | | Undenatured ethyl alcohol of an alcoholic strength by volume of 80 per cent volume or higher | | R122.80/li aa | | R137.54/li aa |
| 104.21.03 | | 2207.20 | | Ethyl alcohol and other spirits, denatured of any strength | | R122.80/li aa | | R137.54/li aa |
| 104.23 | | 22.08 | | Undenatured ethyl alcohol of an alcoholic strength by volume of less than 80 per cent volume; spirits, liqueurs and other spirituous beverages: | | | | |
| 104.23 | | 2208.20 | | Spirits obtained by distilling grape wine or grape marc: | | | | |
| 104.23.01 | | 2208.20.10 | | In containers holding 2 li or less | | R122.80/li aa | | R137.54/li aa |
| 104.23.03 | | 2208.20.90 | | Other | | R122.80/li aa | | R137.54/li aa |
| 104.23 | | 2208.30 | | Whiskies: | | | | |
| 104.23.05 | | 2208.30.10 | | In containers holding 2 li or less | | R122.80/li aa | | R137.54/li aa |
| 104.23.07 | | 2208.30.90 | | Other | | R122.80/li aa | | R137.54/li aa |
| 104.23 | | 2208.40 | | Rum and other spirits obtained by distilling fermented sugarcane products: | | | | |
| 104.23.09 | | 2208.40.10 | | In containers holding 2 li or less | | R122.80/li aa | | R137.54/li aa |
| 104.23.11 | | 2208.40.90 | | Other | | R122.80/li aa | | R137.54/li aa |
167
2014 BUDGET REVIEW
| | | | | | | | |
| Table C.7 Specific excise duties, 2013/14 – 2014/15 (continued) |
Tariff item | | Tariff
subheading | | Article description | | 2013/14
Rate of excise
duty | | 2014/15
Rate of excise
duty |
| 104.23 | | 2208.50 | | Gin and Geneva: | | | | |
| 104.23.13 | | 2208.50.10 | | In containers holding 2 li or less | | R122.80/li aa | | R137.54/li aa |
| 104.23.15 | | 2208.50.90 | | Other | | R122.80/li aa | | R137.54/li aa |
| 104.23 | | 2208.60 | | Vodka: | | | | |
| 104.23.17 | | 2208.60.10 | | In containers holding 2 li or less | | R122.80/li aa | | R137.54/li aa |
| 104.23.19 | | 2208.60.90 | | Other | | R122.80/li aa | | R137.54/li aa |
| 104.23 | | 2208.70 | | Liqueurs and cordials: | | | | |
| 104.23 | | 2208.70.2 | | In containers holding 2 li or less: | | | | |
| 104.23.21 | | 2208.70.21 | | With an alcoholic strength by volume exceeding 15 per cent by volume but not exceeding 23 per cent by volume | | R50.16/li aa | | R56.19/li aa |
| 104.23.22 | | 2208.70.22 | | Other | | R122.80/li aa | | R137.54/li aa |
| 104.23 | | 2208.70.9 | | Other: | | | | |
| 104.23.23 | | 2208.70.91 | | With an alcoholic strength by volume exceeding 15 per cent by volume but not exceeding 23 per cent by volume | | R50.16/li aa | | R56.19/li aa |
| 104.23.24 | | 2208.70.92 | | Other | | R122.80/li aa | | R137.54/li aa |
| 104.23 | | 2208.90 | | Other: | | | | |
| 104.23 | | 2208.90.2 | | In containers holding 2 li or less: | | | | |
| 104.23.25 | | 2208.90.21 | | With an alcoholic strength by volume exceeding 15 per cent by volume but not exceeding 23 per cent by volume | | R50.16/li aa | | R56.19/li aa |
| 104.23.26 | | 2208.90.22 | | Other | | R122.80/li aa | | R137.54/li aa |
| 104.23 | | 2208.90.9 | | Other: | | | | |
| 104.23.27 | | 2208.90.91 | | With an alcoholic strength by volume exceeding 15 per cent by volume but not exceeding 23 per cent by volume | | R50.16/li aa | | R56.19/li aa |
| 104.23.28 | | 2208.90.92 | | Other | | R122.80/li aa | | R137.54/li aa |
| 104.30 | | 24.02 | | Cigars, cheroots, cigarillos and cigarettes, of tobacco or of tobacco substitutes: | | | | |
| 104.30 | | 2402.10 | | Cigars, cheroots and cigarillos containing tobacco: | | | | |
| 104.30.01 | | 2402.10.10 | | Imported from Switzerland | | R2 467.83/kg
net | | R2 690.00/kg
net |
| 104.30.03 | | 2402.10.90 | | Other | | R2 467.83/kg
net | | R2 690.00/kg
net |
| 104.30 | | 2402.20 | | Cigarettes containing tobacco: | | | | |
| 104.30.05 | | 2402.20.10 | | Imported from Switzerland | | R5.46/10
cigarettes | | R5.80/10
cigarettes |
| 104.30.07 | | 2402.20.90 | | Other | | R5.46/10
cigarettes | | R5.80/10
cigarettes |
| 104.30 | | 2402.90.1 | | Cigars, cheroots and cigarillos of tobacco substitutes: | | | | |
| 104.30.09 | | 2402.90.12 | | Imported from Switzerland | | R2 467.83/kg
net | | R2 690.00/kg
net |
| 104.30.11 | | 2402.90.14 | | Other | | R2 467.83/kg
net | | R2 690.00/kg
net |
| 104.30 | | 2402.90.2 | | Cigarettes of tobacco substitutes: | | | | |
| 104.30.13 | | 2402.90.22 | | Imported from Switzerland | | R5.46/10
cigarettes | | R5.80/10
cigarettes |
| 104.30.15 | | 2402.90.24 | | Other | | R5.46/10
cigarettes | | R5.80/10
cigarettes |
| 104.35 | | 24.03 | | Other manufactured tobacco and manufactured tobacco substitutes; “homogenised” or “reconstituted” tobacco; tobacco extracts and essences: | | | | |
| 104.35 | | 2403.1 | | Smoking tobacco, whether or not containing tobacco substitutes in any proportion: | | | | |
| 104.35.01 | | 2403.11 | | Water pipe tobacco specified in Subheading Note 1 to Chapter 24 | | R141.60/kg net | | R145.20/kg net |
168
ANNEXURE C: MISCELLANEOUS TAX AMENDMENTS
| | | | | | | | |
| Table C.7 Specific excise duties, 2013/14 – 2014/15 (continued) | | |
Tariff item | | Tariff
subheading | | Article description | | 2013/14
Rate of excise
duty | | 2014/15
Rate of excise
duty |
| 104.35 | | 2403.19 | | Other: | | | | |
| 104.35.02 | | 2403.19.10 | | Pipe tobacco, in immediate packings of a content of less than 5kg | | R141.60/kg net | | R145.20/kg net |
| 104.35.03 | | 2403.19.20 | | Other pipe tobacco | | R141.60/kg net | | R145.20/kg net |
| 104.35.05 | | 2403.19.30 | | Cigarette tobacco | | R243.20/kg | | R260.60/kg |
| 104.35 | | 2403.99 | | Other: | | | | |
| 104.35.07 | | 2403.99.30 | | Other cigarette tobacco substitutes | | R243.20/kg | | R260.60/kg |
| 104.35.09 | | 2403.99.40 | | Other pipe tobacco substitutes | | R141.60/kg net | | R145.20/kg net |
Other fermented beverages under tariff heading 22.06
Budget 2013 introduced changes to tariff heading 22.06 to align the excise duty rate structure for fruit fermented alcoholic beverages with the requirements of the Liquor Products Act (1989). As a result, fermented alcoholic beverages that are not mainly derived from fruit will be included in the “other” tariff band. The intention was to increase the excise duty rate of this band to the highest excise rate – the full spirits rate – from February 2014 onwards. However, after further consultation it is proposed that this increase be postponed to Budget 2015. The possibility of providing for grain fermented alcoholic beverages will also be explored.
Excise duties
Alcoholic beverages tariff classification for excise duty purposes: Liquor manufacturers may currently request tariff determinations from SARS to obtain certainty on the appropriate tariff classification and excise duty rate applicable to their products. These voluntary applications for tariff determinations will in future be made compulsory to ensure that all alcoholic beverages are over time accurately and consistently classified. Any new alcoholic product or modification in the production process or alteration in the recipe of an existing liquor product will be subject to a compulsory SARS tariff determination. Proof of compliance with the requirements of the Liquor Products Act will also have to be submitted to promote harmonisation with agricultural legislation. These compulsory tariff determinations will be phased in to ease its administrative burden.
| ¢ | Miscellaneous tax amendments |
Miscellaneous tax amendments proposed for the upcoming tax legislative cycle are set out below.
Individuals, employment and savings
Personal insurance policies: The tax treatment of life and disability premiums and policy proceeds was aligned in 2013, with effect from 1 March 2015. The premiums will not be deductible and the policy proceeds will be tax free. However, the wording prohibiting the deduction of the premium for tax purposes does not cover all circumstances, which may allow providers to argue that certain structured products fall outside the ambit of the legislation. It is proposed that the wording be clarified so that premiums paid on all personal insurance policies not be allowed as a deduction against income, and that the policy proceeds from such policies are tax free.
The “loss” requirement for keyperson policies: “Keyperson” refers to a person who is key to the success of a business. In 2011, the tax regime for keyperson policies was changed to allow the taxpayer to elect a deduction for the premium on incurral and taxable policy proceeds or to accept the default non-deductible premium with tax-free policy proceeds. Most employers opted to accept the default option. One of the requirements for an employer policy on a keyperson to qualify for the election is that the
169
2014 BUDGET REVIEW
employer must be insured against any loss due to the death, disablement or severe illness of an employee or director. The policy will therefore not qualify if it protects the employer against, not a business loss, but a contingent liability such as the repayment of a loan should the employee or director die before the loan is repaid. A deduction relating to the cession of that policy contradicts the policy intent. It is proposed that the wording relating to the policy cession be deleted to confirm that an insurance policy will not qualify if it is not intended to insure the employer against a loss suffered as a result of the death, disablement or severe illness of an employee or director.
Employer-provided residential accommodation: The value of the fringe benefit for employer-provided accommodation is determined in relation to the “rental value” representing the value of the use of the accommodation. Depending on the circumstances in which the employer provided the accommodation, different methods are used to calculate the rental value. It is either calculated according to a specific formula using the income of the employee, known as the “remuneration proxy”, and the period that the employee used the accommodation; the aggregate of the total rentals payable and other associated costs; or the portion of the accommodation costs borne by the employer that pertains to the use by the employee. It is proposed that the valuation of the fringe benefit resulting from employer-provided accommodation be reviewed. As a first step, the focus will be on accommodation rented from an unconnected third party, and shared accommodation.
Should the actual value of the use of the accommodation be less than the calculated rental value, the employer may apply for a tax directive from SARS for a lower amount. In instances where the employer provides rental accommodation sourced from a third party to an inbound expat employee, the calculated rental value is often higher than the actual value. As a result, employers often apply for a tax directive to ensure that the employee is taxed as a fringe benefit on the actual (market) value of the use of the accommodation. It is proposed that if employer-provided accommodation is rented by the employer from an unconnected third party, the value of the fringe benefit should be the cost to the employer in providing the accommodation.
In addition, there is no apportionment available where employees share employer-provided accommodation. It is proposed that a form of apportionment be considered.
Cross-border retirement saving: South African residents working abroad and foreign residents working in South Africa regularly contribute to local and foreign pension funds. With overall retirement reform now in effect, cross-border pension issues need to be reconsidered. Given the complexity of the issues involved, it is proposed that the review take place over two years, with extensive consultation.
On a related matter, certain provisions in the Income Tax Act refer to “pension” or to “pensions or an annuity”. The wording excludes lump sum retirement fund benefit pay-outs. It is proposed that the provisions be amended to apply equally to annuities and lump sums.
Alignment between the Unemployment Insurance Act (2001) and the Unemployment Insurance Contributions Act (2002): The Unemployment Insurance Amendment Bill (2013) proposes that the Unemployment Insurance Act be amended to extend unemployment insurance benefits to learners in learnership training, civil servants and foreign workers in South Africa. It is proposed that the Unemployment Insurance Contributions Act be aligned with the amended legislation where required. It is not envisaged that civil servants will contribute towards the Unemployment Insurance Fund. However, the fiscus will make funds available to the Unemployment Insurance Fund to cover the cost of government workers that become eligible to claim from the fund.
Business (general)
Refinancing of third-party backed shares: The third-party backed shares anti-avoidance rule concerns preference shares with dividend yields backed by third parties. The dividend yield of third-party backed shares is treated as ordinary revenue. This anti-avoidance rule also applies to the refinancing of third-party backed shares. However, there are certain exceptions to this rule – it does not apply if the preference shares are used to fund equity share acquisitions in operating companies, because the net
170
ANNEXURE C: MISCELLANEOUS TAX AMENDMENTS
impact of the funding is generally neutral to the fiscus. This is also common in the case of preference share funding for black economic empowerment (BEE). Refinancing of third-party backed shares originally used to fund equity acquisitions in operating companies is not covered under the exceptions. Because there is no policy rationale for excluding refinancing in structures covered under the exceptions to the rule, it is proposed that the refinancing of qualifying transactions be allowed.
Third-party backed shares used to acquire equity shares in exploration companies: The third-party backed shares anti-avoidance rule does not apply if the funds derived from preference shares are used to acquire equity shares in an operating company. An operating company conducts continuous business activities that result in the provision of goods and services for consideration. Exploration companies do not meet the requirement of operating companies because their business activities do not result in the provision of goods and services for consideration. As a result, preference shares issued to acquire equity shares in an exploration company (usually by BEE parties) fall foul of the rules. It is proposed that exploration companies be specifically included in the definition of “operating company”.
Limited pledges in respect of third-party backed shares: Preference share funders often require limited pledges, especially when funding certain company acquisition transactions. In these cases, the funder requires a pledge of the shares associated with the deal, without requiring any further enforcement rights or obligations. For the third-party backed shares anti-avoidance rule not to apply, a shareholder of the acquiring company (i.e. the preference share issuer) pledging its shares must hold at least 20 per cent of the equity shares in the preference share issuer. However, many of the acquiring company equity shareholders in these cases hold less (directly or indirectly) than 20 per cent in the underlying operating company. As a result, the funder bears all the risk because the value of the preference shares depends on the underlying operating company. It is proposed that the third-party backed shares anti-avoidance rule should not apply where the security provided to the funder is limited to equity shares held by acquiring company equity shareholders directly or indirectly in the underlying operating company.
Limited interest deductions for reorganisation and acquisition transactions: This rule was introduced to reduce the significant risk to the economy and the fiscus emanating from the use of excessive debt for funding company acquisitions. The rule uses a percentage of an amount calculated for tax purposes representing earnings before interest, tax, depreciation and amortisation (EBITDA) to limit interest deductions used in reorganisation and acquisition transactions. Certain unintended anomalies in the application and impact of these rules have been identified. For example, the taxpayer’s adjusted taxable income for the tax year preceding the transaction is not taken into account in determining the limitation, and the limitation percentage is only adjusted when the average repurchase rate exceeds a level of 10 per cent, not 8 per cent. It is proposed that these anomalies be addressed.
In addition, the formula used to calculate the limitation of the interest deduction currently takes assessed losses carried forward from previous years into account. This results in a further limitation on the base from which the overall limitation is calculated. It is proposed that the interest deduction limitation calculation should not take assessed losses brought forward from previous years into account.
Dividends tax refinements: An anomaly has been identified concerning the operation of the refund mechanism for non-cash dividends. It is proposed that new provisions addressing this anomaly be introduced.
Contributed tax capital roll-over for deferred shares: Contributed tax capital is a notional amount derived from contributions made to a company as consideration for its issue of shares. It is reduced by any amount that is subsequently transferred by the company back to one or more shareholders (commonly known as capital distribution).
Contributed tax capital roll-overs are permitted where shares are transferred in certain reorganisation transactions. The law also provides for roll-over treatment in instances where shares of a certain class are converted or substituted for shares of another class.
171
2014 BUDGET REVIEW
Deferred shares are issued at a premium and converted to ordinary shares once a company has achieved certain milestones. Roll-over treatment does not apply to deferred shares. As a result, the contributed tax capital on deferred shares will be lost because the class of shares to which it relates differs from the class of shares after conversion. This type of conversion was not considered when the concept of contributed tax capital was introduced. It is proposed that roll-over relief be granted when deferred shares are converted to ordinary shares.
Business (financial institutions)
Excluding policies issued by an insurer from the provision dealing with the incurral and accrual of interest on instruments (section 24J of the Income Tax Act): Insurance companies issue policies, such as endowment policies and smoothed or stable bonus products that have a guaranteed value for policyholders. These types of products may inadvertently be treated as instruments in terms of section 24J, which was never the intention. It is proposed that these policies be excluded from the scope of the interest accrual rules.
REITs (real estate investment trusts): One of the tests determining whether a company is a property company refers to the percentage value of the assets attributable to immovable property, as reflected in its financial statements in accordance with the Companies Act. However, the act does not apply to foreign companies. To rectify this, financial statements in line with international financial reporting standards prepared for foreign property companies will be taken into account.
Business (incentives)
Further refinements to the oil and gas incentive: An oil and gas company holding an exploration or production right may assign all of its fiscal stability rights to another oil and gas company. Oil and gas companies may wish to enter into a joint venture and only assign a portion of the fiscal stability rights so that both parties are covered by the original fiscal stability agreement. It is proposed that part-assignments of fiscal stability rights be allowed.
Research and development tax incentive – clinical trials: A recent amendment to the Income Tax Act aims to make the first three phases of clinical trials eligible for the research and development tax incentive. However, further amendments will be made to address a barrier to this objective. Recent amendments also led to unintended consequences for entities funding research and development activities carried out by another party. These anomalies will be removed and both proposals will apply retrospectively of 1 January 2014.
Depreciation allowances for transmitting electronic communications: Government will review the conditions under which and the period over which depreciation allowances are claimable for lines or cables used to transmit electronic communications.
Environmental conservation: The incentive for land owners to enter into an agreement with government to declare land as a nature reserve or a national park will be streamlined. A proposal is under consideration to delink this incentive from the provisions of section 18A of the Income Tax Act and allow for a straight line deduction of the adjusted value of the land – at the time of entering into the agreement – over a period of 25 years.
International
Secondary adjustment for transfer pricing: Applying the secondary adjustment in the form of a deemed loan is an administrative burden, both for the taxpayer and SARS.
The accounting treatment of the deemed loan’s repayment and interest is difficult, because there is no legal obligation to repay the loan. It is recommended that the transfer pricing provision be amended to state that the secondary adjustment is deemed to be a dividend or capital contribution depending on the facts and circumstances.
172
ANNEXURE C: MISCELLANEOUS TAX AMENDMENTS
Foreign dividends of controlled foreign companies owned by individuals: If a resident individual’s controlled foreign company receives a taxable foreign dividend, the effective tax rate on the dividend is 21 per cent. It is proposed that the ratio be changed to reflect the fact that an individual, not a company, is taxed with reference to the foreign dividend.
High tax exemption for controlled foreign companies: The structure of section 9D of the Income Tax Act, which attributes the net income of a controlled foreign company, requires a high foreign tax exemption to be tested before certain amounts can be excluded. The high tax exemption involves a hypothetical South African tax calculation based on the transactions of a controlled foreign company as if it had been a South African tax resident. If the actual foreign tax is at least 75 per cent of the hypothetical South African tax, then no amount under section 9D is taxed in the hands of the South African resident controlling the foreign company.
In the case of a South African resident company that owns many foreign companies, it is cumbersome to establish whether the high tax exemption applies if most of the income of the controlled foreign companies is attributable to a foreign business establishment. It is proposed that an option be provided to deem the net income of a controlled foreign company to be nil if either the high tax or the foreign business establishment test, when applied to aggregate taxable amounts, is met.
Currency of reacquisition of assets of individuals ceasing to be resident: A person who ceases to be a resident is subject to a deemed disposal and reacquisition of shares in a property company owning property in South Africa. However, it is not clear in which currency the shares reacquisition takes place. This has an effect on the tax calculation when the shares are sold or otherwise disposed of by the non-resident. It is proposed that this should be clarified.
Fishing vessels registered in South Africa: In 2013, a new tax regime for international shipping was introduced. The rule providing for an allowance for repairs to ships has inadvertently been deleted. Reinstatement of this provision from the date of its repeal (12 December 2013) is proposed.
Value-added tax
Going concerns: VAT legislation and an accompanying interpretation note (number 57) on the VAT treatment when a going concern is sold require clarification. The legislation requires the supply to be made to a registered vendor. According to the interpretation note, the recipient must agree that at the effective date it will be a vendor. The legislation will be amended to remove the uncertainty regarding whether a person must be a vendor before the acquisition of the going concern.
Documentation: The customs modernisation programme has eliminated the need for paper-based documents to be generated and issued to taxpayers. The documents that are legally required will be aligned with the modernised customs processes and procedures.
Tax invoices, debit and credit notes: A supplier, being a registered vendor (the principal), is required to issue a tax invoice within 21 days of the date of the supply. This time limit will be extended to agents. However, there is no specific time limit in which the credit or debit note must be issued. The legislation will be amended to set a time limit.
Agents: There is uncertainty as to which documentation is acceptable as proof of payment to entitle a vendor to deduct input tax in respect of VAT paid on the importation of goods. Clarity will be provided on which documentation is acceptable.
Contract prices: A supplier of goods or services is able to recover from the recipient an amount of VAT “imposed” on the supply after the agreement is concluded. The legislation will be amended to exclude suppliers who failed to register as VAT vendors.
Bargaining councils: Goods and services provided by a bargaining council to its members, based on membership contributions, are exempt from VAT. This will be amended to include the supply of administration services for which the bargaining council receives a separate fee (the interest that it is entitled to in terms of the main collective agreement).
173
2014 BUDGET REVIEW
Zero-rating of goods for agricultural, pastoral or other farming purposes: The VAT Act provides for zero-rating where the supply of goods are used or consumed for agricultural, pastoral or other farming purposes. This concession was intended to provide cash-flow relief to the agricultural sector. However, evidence suggests that some suppliers entered into transactions to obtain fraudulent input tax deductions. This zero-rating provision will be reviewed in consultation with relevant stakeholders for possible replacement with VAT at the standard rate.
VAT treatment of legal tender or money: Money issued by the Reserve Bank is exempt from VAT. The definition of money or legal tender in the context of this exemption will be reviewed, taking into account that the printing of money is subject to VAT at the standard rate. The zero-rating of the supply of legal tender or money is under consideration.
Customs
Protection of trade information: SARS has a responsibility to protect the merchandise trade information that it receives from travellers and traders. In the absence of the Protection of Personal Information Bill being implemented, it is proposed that the Customs and Excise Act be amended to provide for such data protection. Section 101B of the Customs and Excise Act relating to travellers is already aligned with the anticipated requirements of the Protection of Personal Information Bill, but additional measures are needed to similarly address traders and cargo.
Technical corrections
In addition to the amendments described above, the 2014 tax legislation will effect various technical corrections, which mainly cover inconsequential items – typing errors, grammar, punctuation, numbering, misplaced cross-references, updating and removing obsolete provisions, removing superfluous text, and incorporating regulations and commonly accepted interpretations into formal law. Technical corrections also include changes to effective dates and the proper coordination of transitional tax changes.
A final set of technical corrections relates to modifications that account for practical implementation of the tax law. Although tax amendments go through an intensive comment and review process, new issues arise once the law is applied (including obvious omissions and ambiguities). These issues typically arise when returns are prepared for the first time after legislation is applied. Technical corrections of this nature are almost exclusively limited to recent legislative changes.
174
D
Summary of Budget
175
Summary of the national budget
| | | | | | | | | | | | | | | | | | | | |
| | | 2013/14 | | | 2014/15 | | | 2015/16 | | | 2016/17 | |
R million | | Budget
estimate | | | Revised
estimate | | | Budget
estimate | | | Medium-term estimates | |
REVENUE | | | | | | | | | | | | | | | | | | | | |
| | | | | |
Estimate of revenue before tax proposals | | | | | | | | | | | 968 357 | | | | | | | | | |
| | | | | |
Budget 2014/15 proposals: | | | | | | | | | | | | | | | | | | | | |
| | | | | |
Taxes on individuals and companies | | | | | | | | | | | -10 250 | | | | | | | | | |
| | | | | |
Personal income tax | | | | | | | | | | | -9 250 | | | | | | | | | |
Adjustment in personal tax rate structure | | | | | | | | | | | -9 250 | | | | | | | | | |
Business income tax | | | | | | | | | | | -1 000 | | | | | | | | | |
Employment tax incentive | | | | | | | | | | | -1 000 | | | | | | | | | |
| | | | | |
Indirect taxes | | | | | | | | | | | 4 675 | | | | | | | | | |
Increase in general fuel levy | | | | | | | | | | | 2 565 | | | | | | | | | |
Increase in excise duties on tobacco products | | | | | | | | | | | 695 | | | | | | | | | |
Increase in alcoholic beverages | | | | | | | | | | | 1 415 | | | | | | | | | |
| | | | | | | | | | | | | | | | | | | | |
Estimate of revenue after tax proposals | | | 877 958 | | | | 886 167 | | | | 962 782 | | | | 1 058 117 | | | | 1 172 598 | |
Percentage change from previous year | | | | | | | | | | | 8.6 | % | | | 9.9 | % | | | 10.8 | % |
| | | | | | | | | | | | | | | | | | | | |
| | | | | |
EXPENDITURE | | | | | | | | | | | | | | | | | | | | |
| | | | | |
Direct charges against the National Revenue Fund | | | 463 293 | | | | 465 620 | | | | 504 213 | | | | 543 325 | | | | 582 144 | |
| | | | | |
Debt-service costs | | | 99 741 | | | | 101 256 | | | | 114 901 | | | | 126 647 | | | | 139 201 | |
Provincial equitable share | | | 337 572 | | | | 338 937 | | | | 362 468 | | | | 387 967 | | | | 412 039 | |
General fuel levy sharing with metropolitan municipalities | | | 9 613 | | | | 9 613 | | | | 10 190 | | | | 10 659 | | | | 11 224 | |
Skills levy and sector education and training authorities | | | 12 403 | | | | 12 300 | | | | 13 440 | | | | 14 690 | | | | 16 140 | |
Other 1) | | | 3 962 | | | | 3 514 | | | | 3 214 | | | | 3 362 | | | | 3 540 | |
| | | | | |
Appropriated by vote | | | 588 682 | | | | 583 489 | | | | 635 349 | | | | 683 265 | | | | 723 481 | |
Current payments | | | 168 449 | | | | 172 755 | | | | 180 857 | | | | 190 136 | | | | 203 847 | |
Transfers and subsidies | | | 402 794 | | | | 394 921 | | | | 433 233 | | | | 471 207 | | | | 500 014 | |
Payments for capital assets | | | 14 257 | | | | 12 415 | | | | 17 689 | | | | 18 601 | | | | 19 317 | |
Payments for financial assets | | | 3 182 | | | | 3 398 | | | | 3 571 | | | | 3 320 | | | | 303 | |
Plus: | | | | | | | | | | | | | | | | | | | | |
Unallocated funds | | | 30 | | | | — | | | | — | | | | — | | | | — | |
Contingency reserve | | | 4 000 | | | | — | | | | 3 000 | | | | 6 000 | | | | 18 000 | |
| | | | | | | | | | | | | | | | | | | | |
Estimate of national expenditure | | | 1 056 005 | | | | 1 049 109 | | | | 1 142 562 | | | | 1 232 590 | | | | 1 323 624 | |
Percentage change from previous year | | | | | | | | | | | 8.9 | % | | | 7.9 | % | | | 7.4 | % |
| | | | | | | | | | | | | | | | | | | | |
2013 Budget estimate of expenditure | | | | | | | 1 056 005 | | | | 1 137 981 | | | | 1 225 727 | | | | | |
Increase / decrease (-) | | | | | | | -6 896 | | | | 4 582 | | | | 6 863 | | | | | |
| | | | | | | | | | | | | | | | | | | | |
Gross domestic product | | | 3 520 268 | | | | 3 464 883 | | | | 3 789 630 | | | | 4 150 507 | | | | 4 552 868 | |
| | | | | | | | | | | | | | | | | | | | |
| 1) | Includes direct appropriations in respect of the salaries of the President, Deputy President, judges, magistrates, members of Parliament, and National Revenue Fund payments (previously classified as extraordinary payments) |
Summary of the consolidated budget
| | | | | | | | | | | | | | | | | | | | |
| | | 2013/14 | | | 2014/15 | | | 2015/16 | | | 2016/17 | |
R million | | Budget
estimate | | | Revised
estimate | | | Budget
estimate | | | Medium-term estimates | |
National budget revenue 1) | | | 877 958 | | | | 886 167 | | | | 962 782 | | | | 1 058 117 | | | | 1 172 598 | |
| | | | | |
Revenue of provinces, social security funds and public entities | | | 112 752 | | | | 124 322 | | | | 136 466 | | | | 143 202 | | | | 152 118 | |
| | | | | | | | | | | | | | | | | | | | |
Consolidated budget revenue 2) | | | 990 710 | | | | 1 010 489 | | | | 1 099 248 | | | | 1 201 319 | | | | 1 324 716 | |
| | | | | | | | | | | | | | | | | | | | |
National budget expenditure 1) | | | 1 056 005 | | | | 1 049 109 | | | | 1 142 562 | | | | 1 232 590 | | | | 1 323 624 | |
| | | | | |
Expenditure of provinces, social security funds and public entities | | | 94 315 | | | | 100 187 | | | | 109 752 | | | | 119 022 | | | | 128 024 | |
| | | | | | | | | | | | | | | | | | | | |
Consolidated budget expenditure 2) | | | 1 150 320 | | | | 1 149 295 | | | | 1 252 314 | | | | 1 351 612 | | | | 1 451 648 | |
| | | | | | | | | | | | | | | | | | | | |
Consolidated budget balance | | | -159 609 | | | | -138 807 | | | | -153 066 | | | | -150 293 | | | | -126 933 | |
Percentage of GDP | | | -4.5 | % | | | -4.0 | % | | | -4.0 | % | | | -3.6 | % | | | -2.8 | % |
| | | | | | | | | | | | | | | | | | | | |
FINANCING | | | | | | | | | | | | | | | | | | | | |
| | | | | |
Domestic loans (net) | | | 169 837 | | | | 171 640 | | | | 156 786 | | | | 160 404 | | | | 145 681 | |
| | | | | |
Foreign loans (net) | | | -3 318 | | | | 1 013 | | | | 3 423 | | | | 11 201 | | | | 1 871 | |
| | | | | |
Change in cash and other balances | | | -6 910 | | | | -33 847 | | | | -7 143 | | | | -21 312 | | | | -20 620 | |
| | | | | | | | | | | | | | | | | | | | |
Total financing (net) | | | 159 609 | | | | 138 807 | | | | 153 066 | | | | 150 293 | | | | 126 933 | |
| | | | | | | | | | | | | | | | | | | | |
| 1) | Transfers to provinces, social security funds and public entities presented as part of the national budget |
| 2) | Flows between national, provincial, social security funds and public entities are netted out |
E
Glossary
| | |
| Accounting officer | | The public servant in a department who is accountable to Parliament for financial management, usually the director-general or head of the department. |
| |
| Accrual | | An accounting convention by which payments and receipts are recorded as they occur, even if no cash flow takes place. |
| |
| Acquisition debt | | Debt used to purchase shares or assets. |
| |
| Ad valorem duties | | Duties levied on commodities as a certain percentage of their value. |
| |
| Adjustments estimate | | Presentation to Parliament of the amendments to be made to the appropriations voted in the main budget for the year. |
| |
| Administered prices | | Prices set outside ordinary market processes through administrative decisions by government, a public entity or a regulator. |
| |
| Allocated expenditure | | The part of the national budget that can be divided between the national, provincial and local spheres of government, after interest and the contingency reserve have been taken into account. |
| |
| Amortisation | | The repayment of a loan by instalments over the duration of the loan. |
| |
| Appropriation | | The approval by Parliament of spending from the National Revenue Fund, or by a provincial legislature from a provincial revenue fund. |
| |
| Artificial debt | | A “loan” that is presented as debt but is in effect equity. Often used in tax avoidance or tax evasion. |
| |
| Asset price bubble | | A condition occurring when prices for a category of assets rise above the level justified by economic fundamentals. |
| |
| Asset swap | | An arrangement in which financial institutions exchange a portfolio of South African shares and securities for a portfolio of foreign shares and securities. |
| |
| Balance of payments | | A summary statement of all the international transactions of the residents of a country with the rest of the world over a particular period of time. |
178
2014 BUDGET REVIEW
| | |
| |
| Basel III | | Reforms developed by the Basel Committee on Banking Supervision to strengthen the regulation, supervision and risk management of the banking sector. |
| |
| Baseline | | The initial allocations used during the budget process, derived from the previous year’s forward estimates. |
| |
| Basis point | | One hundredth of one per cent. |
| |
| Bond | | A certificate of debt issued by a government or corporation guaranteeing payment of the original investment plus interest by a specified future date. |
| |
| Bond premium | | Amount by which the purchase price of a bond is greater than its par value. |
| |
| Bond spread | | The difference in yield between two bonds. |
| |
| Budget balance | | The difference between budgeted expenditure and budgeted revenue. If expenditure exceeds revenue, the budget is in deficit. If the reverse is true, it is in surplus. |
| |
| Capital adequacy | | A measure of a financial institution’s capital, expressed as a percentage of its credit exposure. |
| |
| Capital asset | | Property of any kind, including assets that are movable or immovable, tangible or intangible, fixed or circulating, but excluding trading stock held for the purpose of realising a financial or economic return. |
| |
| Capital expenditure | | Spending on assets such as buildings, land, infrastructure and equipment. |
| |
| Capital flow | | A flow of investments in or out of the country. |
| |
| Capital formation | | A measure of the net increase in the country’s total stock of capital goods, after allowing for depreciation. |
| |
| Capital gains tax | | Tax levied on the income realised from the disposal of a capital asset by a taxpayer. A capital gain is the excess of the selling price over the purchase price of the capital asset. |
| |
| Capital goods | | Durable goods used over a period of time for the production of other goods. See also intermediate goods. |
| |
| Capital-output ratio | | The amount of capital employed to produce a certain level of output. |
| |
| Carbon tax | | An environmental tax on emissions of carbon dioxide (CO2). |
| |
| Category A, B and C municipalities | | Municipal categories established by the Constitution: Category A, or metropolitan municipalities; Category B, or local municipalities; and Category C, or district municipalities. |
| |
| Clean development mechanism | | An initiative developed under the Kyoto Protocol that allows emission- reduction projects in developing countries to earn certified emission- reduction credits, each equivalent to one ton of CO2. These credits can be traded and sold, and used to meet emission-reduction targets. |
179
ANNEXURE E: GLOSSARY
| | |
| Collective bargaining | | Negotiations between employees and employers on procedures and rules to cover conditions of work and rates of pay. |
| |
| Conditional grants | | Allocations of money from one sphere of government to another, conditional on certain services being delivered or on compliance with specified requirements. |
| |
| Connected person debt/credit | | Debt or credit granted by a person/entity to a connected person/entity. In the case of a holding company, for example, a subsidiary company would be a connected person. |
| |
| Consolidated general government | | National, provincial and local government, as well as extra-budgetary government institutions and social security funds. |
| |
| Consolidated government expenditure | | Total expenditure by national and provincial government, social security funds and selected public entities, including transfers and subsidies to municipalities, businesses and other entities. |
| |
| Consumer price index (CPI) | | The measure of inflation based on prices in a basket of goods and services. |
| |
| Consumption expenditure | | Expenditure on goods and services, including salaries, which are used up within a short period of time, usually a year. |
| |
| Contingency reserve | | An amount set aside, but not allocated in advance, to accommodate changes to the economic environment and to meet unforeseeable spending pressures. |
| |
| Contingent liability | | A government obligation, such as a guarantee, that will only result in expenditure upon the occurrence of a specific event. |
| |
| Controlled foreign entity | | A foreign business in which South Africans hold a greater than 50 per cent interest, usually of the share capital of a company. |
| |
| Corporatisation | | The transformation of state-owned enterprises into commercial entities, subject to commercial legal requirements and governance structures, while retaining state ownership. |
| |
| Cost-push inflation | | Inflation that is caused by an increase in production costs, such as wages or oil prices. |
| |
| Countercyclical fiscal policy | | Policy that has the opposite effect on economic activity to that caused by the business cycle, such as slowing spending growth in a boom period and accelerating spending in a recession. |
| |
| Coupon (bond) | | The periodic interest payment made to bondholders during the life of the bond. The interest is usually paid twice a year. |
| |
| Credit rating | | An indicator of the risk of default by a borrower or the riskiness of a financial instrument. |
| |
| Crowding-in | | An increase in private investment through the income-raising effect of government spending financed by deficits. |
| |
| Crowding-out | | A fall in private investment or consumption as a result of increased government expenditure financed through borrowing, thereby competing for loanable funds and raising the interest rate, which curtails private investment and consumption spending. |
180
2014 BUDGET REVIEW
| | |
| Current account (of the balance of payments) | | The difference between total imports and total exports, also taking into account service payments and receipts, interest, dividends and transfers. The current account can be in deficit or surplus. See also trade balance. |
| |
| Current balance | | The difference between revenue and current expenditure, which consists of compensation of employees, goods and services, and interest and rent on land. |
| |
| Current expenditure | | Government expenditure on salaries and goods and services, such as rent, maintenance and interest payments. See also consumption expenditure. |
| |
| Customs duties | | Tax levied on imported goods. |
| |
| Debenture | | An unsecured loan backed by general credit rather than by specified assets. |
| |
| Debt-service costs | | The cost of interest on government debt and other costs directly associated with borrowing. |
| |
| Debt switching | | The exchange of bonds to manage refinancing risk or improve tradability. |
| |
| Deleveraging | | The reduction of debt previously used to increase the potential return of an investment. |
| |
| Depreciation (capital) | | A reduction in the value of fixed capital as a result of wear and tear or redundancy. |
| |
| Depreciation (exchange rate) | | A reduction in the external value of a currency. |
| |
| Derivative financial instrument | | A financial asset that derives its value from an underlying asset, which may be a physical asset such as gold, or a financial asset such as a government bond. |
| |
| Designated countries | | Foreign countries from which income may be exempt from South African tax under certain circumstances. See also double tax agreement. |
| |
| Development finance institutions | | State agencies that aim to meet the credit needs of riskier but socially and economically desirable projects that are beyond the acceptance limits of commercial banks. |
| |
| Direct taxes | | Taxes charged on taxable income or capital of individuals and legal entities. |
| |
| Disposable income | | Total income by households less all taxes and employee contributions. |
| |
| Dissaving | | An excess of current expenditure, including the depreciation of fixed capital, over current income. |
| |
| Dividend | | A distribution of a portion of a company’s earnings to a class of its shareholders. |
| |
| Dividend withholding tax | | A tax on dividends that is subtracted and withheld by a company or intermediary before the net dividend is paid to the shareholder. |
| |
| Division of revenue | | The allocation of funds between spheres of government, as required by the Constitution. See also equitable share. |
181
ANNEXURE E: GLOSSARY
| | |
| Domestic demand | | The total level of spending in an economy, including imports but excluding exports. |
| |
| Double tax agreement | | An agreement between two countries to prevent income that is taxed in one country from being taxed in the other as well. See also designated countries. |
| |
| Economically active population | | The part of the population that is of working age and is either employed or seeking work. |
| |
| Economic cost | | The cost of an alternative that must be forgone to pursue a certain action. In other words, the benefits that could have been received by taking an alternative action. |
| |
| Economic growth | | An increase in the total amount of output, income and spending in the economy. |
| |
| Economic rents | | The difference between the return made by a factor of production (capital or labour) and the return necessary to keep the factor in its current occupation. For example, a firm making excess profits is earning economic rent. |
| |
| Effective tax rate | | Actual tax liability (or a reasonable estimate thereof) expressed as a percentage of a pre-tax income base rather than as a percentage of taxable income, i.e. tax rates that take into account not only the statutory or nominal tax rate, but also other aspects of the tax system (for example, allowable deductions), which determine the tax liability. |
| |
| Emerging economies | | A name given by international investors to middle-income economies. |
| |
| Employment coefficient | | The ratio of employment growth to economic growth. |
| |
| Equalisation Fund levy | | A dedicated fuel levy used to subsidise the local synthetic fuel industry. It is also used to smooth the impact of fluctuations in the international oil price (and exchange rate) on the domestic fuel price. |
| |
| Equitable share | | The allocation of revenue to the national, provincial and local spheres of government as required by the Constitution. See also division of revenue. |
| |
| Equity finance | | Raising money by selling shares of stock to investors, who receive an ownership interest in return. |
| |
| Exchange control | | Rules that regulate the flow of currency out of South Africa, or restrict the amount of foreign assets held by South African individuals and companies. |
| |
| Exchange-traded funds | | Funds that track indexes, commodities or baskets of assets, and trade like stocks. |
| |
| Excise duties | | Taxes on the manufacture or sale of certain domestic or imported products. Excise duties are usually charged on products such as alcoholic beverages, tobacco and petroleum. |
| |
| Extra-budgetary institutions | | Public entities not directly funded from the fiscus. |
182
2014 BUDGET REVIEW
| | |
| Financial account | | A statement of all financial transactions between the nation and the rest of the world, including portfolio and fixed investment flows and movements in foreign reserves. |
| |
| Financial and Fiscal Commission (FFC) | | An independent body established by the Constitution to make recommendations to Parliament and provincial legislatures about financial issues affecting the three spheres of government. |
| |
| Financial Services Board | | An independent institution established by statute that regulates insurers, intermediaries, retirement funds, friendly societies, unit trust schemes, management companies and financial markets. |
| |
| Financial Stability Board | | An international body made up of representatives of financial authorities and institutions, and central banks. It proposes regulatory, supervisory and other policies in the interest of financial stability. |
| |
| Financial year | | The 12 months according to which companies and organisations budget and account. See also fiscal year. |
| |
| Fiscal consolidation | | Policy aimed at reducing government deficits and debt accumulation. |
| |
| Fiscal incidence | | The combined overall economic impact that fiscal policy has on the economy. |
| |
| Fiscal policy | | Policy on taxation, public spending and borrowing by the government. |
| |
| Fiscal space | | The ability of government’s budget to provide additional resources for a desired programme without jeopardising fiscal or debt sustainability. |
| |
| Fiscal year | | The 12 months on which government budgets are based, beginning 1 April and ending 31 March of the subsequent calendar year. |
| |
| Fixed-income bond | | A bond that pays a specific interest rate. |
| |
| Fixed investment/capital formation | | Spending on buildings, machinery and equipment contributing to production capacity in the economy. See also gross fixed capital formation. |
| |
| Floating rate notes | | A bond on which the interest rate is reset periodically in line with a money market reference rate. |
| |
| Flow-through vehicles | | A vehicle, such as a trust, where income earned is treated as income of the vehicle’s beneficiaries. |
| |
| Foreign currency swaps | | The exchange of principal and/or interest payments in one currency for those in another. |
| |
| Foreign direct investment (FDI) | | The acquisition of a controlling interest by governments, institutions or individuals of a business in another country. |
| |
| Forward book | | The total amount of contracts for the future exchange of foreign currency entered into by the Reserve Bank at any given point in time. |
| |
| Forward cover | | Transactions involving an agreed exchange rate at which foreign currency will be purchased or sold at a future date. |
183
ANNEXURE E: GLOSSARY
| | |
| Forward markets | | Markets in which currencies, commodities or securities are bought and sold at agreed prices for delivery at specified future dates. |
| |
| Fringe benefit | | A benefit supplementing an employee’s wages or salary, such as medical insurance, company cars, housing allowances and pension schemes. |
| |
| Fuel levy | | An excise tax on liquid fuels. |
| |
| Function shift | | The movement of a function from one departmental vote or sphere of government to another. |
| |
| Funded pension arrangements | | A pension scheme in which expected future benefits are funded in advance and as entitlement accrues. |
| |
| Gold and foreign exchange reserves | | Reserves held by the Reserve Bank to meet foreign exchange obligations and to maintain liquidity in the presence of external shocks. |
| |
| Government debt | | The total amount of money owed by the government as a consequence of its borrowing in the past. |
| |
| Green paper | | A policy document intended for public discussion. |
| |
| Gross borrowing requirement | | The sum of the main budget balance, extraordinary receipts and payments (referred to as National Revenue Fund receipts and payments), and maturing debt. The amount is funded through domestic short- and long- term loans, foreign loans and changes in cash balances. |
| |
| Gross domestic product (GDP) | | A measure of the total national output, income and expenditure in the economy. GDP per head is the simplest overall measure of welfare, although it does not take account of the distribution of income, nor of goods and services that are produced outside the market economy, such as work within the household. |
| |
| Gross domestic product inflation | | A measure of the total increase in prices in the whole economy. Unlike CPI inflation, GDP inflation includes price increases in goods that are exported and intermediate goods such as machines, but excludes imported goods. |
| |
| Gross fixed capital formation | | The addition to a country’s fixed capital stock during a specific period, before provision for depreciation. |
| |
| Gross value added | | The value of output less intermediate consumption. It is also a measure of the contribution to the economy made by an industry or sector. |
| |
| Hedging | | An action taken by a buyer or seller to protect income against changes in prices, interest rates or exchange rates. |
| |
| Horizontal equity | | A principle in taxation that holds that similarly situated taxpayers should face a similar tax treatment or tax burden, i.e. taxpayers with the same amount of income or capital should be accorded equal treatment. |
| |
| Impaired advances | | Loans or advances that may not be collected in full. |
184
2014 BUDGET REVIEW
| | |
| Import parity pricing | | When a firm sells goods locally at the price customers would pay if they were to import the same goods from another country. |
| |
| Inclusion rate | | The portion of the net capital gain derived from the disposal of an asset that will be taxed at the applicable rate. |
| |
| Industrial development zone | | Designated sites linked to an international air or sea port, supported by incentives to encourage investment in export-orientated manufacturing and job creation. |
| |
| Inflation | | An increase in the general level of prices. |
| |
| Inflation targeting | | A monetary policy framework intended to achieve price stability over a certain period of time. |
| |
| Intermediate goods | | Goods produced to be used as inputs in the production of final goods. |
| |
| Inventories | | Stocks of goods held by firms. An increase in inventories reflects an excess of output relative to spending over a period. |
| |
| Labour intensity | | The relative amount of labour used to produce a unit of output. |
| |
| Liquidity | | The ease with which assets can be bought and sold. |
| |
| Liquidity requirements | | The amount of liquid or freely convertible assets that banks are required to hold relative to their liabilities, for prudential and regulatory purposes. |
| |
| Lump-sum benefit | | A one-time payment for the total or partial value of an asset, usually received in place of recurring smaller payments. |
| |
| M3 | | The broadest definition of money supply in South Africa, including notes and coins, demand and fixed deposits, and credit. |
| |
| Macroeconomics | | The branch of economics that deals with the whole economy – including issues such as growth, inflation, unemployment and the balance of payments. |
| |
| Marginal income tax rate | | The rate of tax on an incremental unit of income. |
| |
| Marginal lending rate | | A penalty rate of interest charged by the Reserve Bank for lending to financial institutions in the money market in excess of the daily liquidity provided to the money market at the repurchase rate. See also repurchase agreements. |
| |
| Marketable securities | | Tradable financial securities listed with a securities exchange. |
| |
| Means test | | A method for determining whether someone qualifies for state assistance. |
| |
| Medium Term Expenditure Committee (MTEC) | | The technical committee responsible for evaluating the medium-term expenditure framework budget submissions of national departments and making recommendations to the Minister of Finance regarding allocations to national departments. |
185
ANNEXURE E: GLOSSARY
| | |
| Medium-term expenditure framework (MTEF) | | The three-year spending plans of national and provincial governments, published at the time of the Budget. |
| |
| Microeconomics | | The branch of economics that deals with the behaviour of individual firms, consumers and sectors. |
| |
| Ministers’ Committee on the Budget | | The political committee that considers key policy and budgetary issues that pertain to the budget process before they are tabled in Cabinet. |
| |
| Monetary policy | | Policy concerning total money supply, exchange rates and the general level of interest rates. |
| |
| Money supply | | The total stock of money in an economy. |
| |
| National budget | | The projected revenue and expenditures that flow through the National Revenue Fund. It does not include spending by provinces or local government from their own revenues. |
| |
| National Development Plan | | A planning framework prepared by the National Planning Commission that aims to eliminate poverty and reduce inequality by 2030. |
| |
| National Revenue Fund | | The consolidated account of the national government into which all taxes, fees and charges collected by SARS and departmental revenue must be paid. |
| |
| Negotiable certificate of deposit | | Short-term deposit instruments issued by banks, at a variable interest rate, for a fixed period. |
| |
| Net borrowing requirement | | The sum of the main budget balance, extraordinary receipts and extraordinary payments (referred to as National Revenue Fund receipts and payments). Deficits increase the borrowing requirement; surpluses reduce the requirement. |
| |
| Net exports | | Exports less imports. |
| |
| Net open foreign currency position | | Gold and foreign exchange reserves minus oversold forward book. The figure is expressed in dollars. |
| |
| Net trade | | The difference between the value of exports and the value of imports. |
| |
| Nominal exchange rates | | The current rate of exchange between the rand and foreign currencies. The “effective” exchange rate is a trade-weighted average of the rates of exchange with other currencies. |
| |
| Nominal wage | | The return, or wage, to employees at the current price level. |
| |
| Non-competitive bond | | A bond purchased through a non-competitive bid auction, in which an investor agrees to purchase a certain number of securities at the average price of all competitive bids over a given period of time. |
| |
| Non-financial public enterprises | | Government-owned or controlled organisations that deliver goods and non- financial services, trading as business enterprises, such as Eskom or Transnet. |
186
2014 BUDGET REVIEW
| | |
| Non-interest expenditure | | Total expenditure by government less debt-service costs. |
| |
| Non-tax revenue | | Income received by government as a result of administrative charges, licences, fees, sales of goods and services, and so on. |
| |
| Occupation-specific salary dispensation | | Revised salary structures unique to identified occupations in the public service, including doctors, nurses and teachers. |
| |
| Opportunity cost | | The value of that which must be given up to achieve or acquire something. It is represented by the next highest valued alternative use of a resource. |
| |
| Organisation for Economic Cooperation and Development (OECD) | | An organisation of 34 mainly industrialised member countries. South Africa is not a member. |
| |
| Outputs | | Goods and services delivered by government. |
| |
| PAYE | | The pay-as-you-earn (PAYE) system of income tax withholding requires employers to deduct income tax, and in some cases, the employees’ portion of social benefit taxes, from each paycheque delivered to employees. |
| |
| Payroll tax | | Tax an employer withholds and/or pays on behalf of employees based on employee wages or salaries. |
| |
| Policy reserve | | Additional money in the fiscus to fund new and crucial priorities. |
| |
| Portfolio investment | | Investment in financial assets such as stocks and bonds. |
| |
| Potential growth | | The fastest growth an economy can sustain without increasing inflation. |
| |
| Presidential Infrastructure Coordinating Commission (PICC) | | A commission established by Cabinet to develop, review and coordinate a 20-year infrastructure plan. |
| |
| Price discovery | | The process of determining the price level of a commodity or asset based on supply and demand factors. |
| |
| Primary deficit/surplus | | The difference between total revenue and non-interest expenditure. When revenue exceeds non-interest expenditure there is a surplus. |
| |
| Primary sector | | The agricultural and mining sectors of the economy. |
| |
| Private-sector credit extension | | Credit provided to the private sector. This includes all loans, credit cards and leases. |
| |
| Privatisation | | The full or partial sale of state-owned enterprises to private individuals or companies. |
| |
| Producer price inflation (PPI) | | Price increases measured by the producer price index – a measure of the prices paid based mainly on producers’ published price lists. |
| |
| Productivity | | A measure of the amount of output generated from every unit of input. Typically used to measure changes in labour efficiency. |
187
ANNEXURE E: GLOSSARY
| | |
| Profit shifting | | The allocation of income and expenses between related corporations or branches of the same legal entity to reduce overall tax liability. |
| |
| Public-benefit organisations (PBOs) | | Organisations that are mainly funded by donations from the public and other institutions, which engage in social activities to meet the needs of the general public. |
| |
| Public entities | | Companies, agencies, funds and accounts that are fully or partly owned by government or public authorities and are regulated by law. |
| |
| Public Finance Management Act (PFMA) | | The act regulating financial management of national and provincial government, including the efficiency and effectiveness of public expenditure and the responsibilities of those engaging with government financial management. |
| |
| Public goods | | Goods and services that would not be fully provided in a pure free-market system and are largely provided by government. |
| |
| Public Investment Corporation (PIC) | | A government-owned investment management company that invests funds on behalf of public-sector entities. Its largest client is the Government Employees Pension Fund. |
| |
| Public-private partnerships (PPPs) | | A contractual arrangement whereby a private party performs part of a government function and assumes the associated risks. In return, the private party receives a fee according to predefined performance criteria. |
| |
| Public sector | | National government, provincial government, local government, extra- budgetary governmental institutions, social security funds and non- financial public enterprises. |
| |
| Public-sector borrowing requirement | | The consolidated cash borrowing requirement of general government and non-financial public enterprises. |
| |
| Purchasing managers’ index (PMI) | | A composite index measuring the change in manufacturing activity compared with the previous month. An index value of 50 indicates no change in activity, a value above 50 indicates increased activity and a value below 50 indicates decreased activity. |
| |
| Quantitative easing | | A measure used by central banks to stimulate economic growth when interest rates are near zero by increasing money supply. |
| |
| Rating agency | | A company that evaluates the ability of countries or other borrowers to honour their debt obligations. Credit ratings are used by international investors as indications of sovereign risk. See also credit rating. |
| |
| Real effective exchange rate | | A measure of the rate of exchange of the rand relative to a trade-weighted average of South Africa’s trading partners’ currencies, adjusted for price trends in South Africa and the countries included. |
| |
| Real exchange rate | | The level of the exchange rate taking account of inflation differences. |
188
2014 BUDGET REVIEW
| | |
| Real expenditure | | Expenditure measured in constant prices, i.e. after taking account of inflation. |
| |
| Real interest rate | | The level of interest after taking account of inflation. |
| |
| Real wage | | The return, or wage, to employees, measured at a constant price level. |
| |
| Recapitalisation | | Injection of funds into a company or entity to aid liquidity, either as a loan or in return for equity. |
| |
| Recession | | A period in which national output and income decline. A recession is usually defined as two consecutive quarters of negative growth. |
| |
| Redemption | | The return of an investor’s principal in a fixed-income security, such as a preferred stock or bond. |
| |
| Regional integration | | An economic policy intended to boost economic activity in a geographical area extending beyond one country. |
| |
| Remuneration | | The costs of personnel, including salaries, housing allowances, car allowances and other benefits received by personnel. |
| |
| Repurchase agreements | | Short-term contracts between the Reserve Bank and private banks in the money market to sell specified amounts of money at an interest rate determined by daily auction. |
| |
| Repurchase (repo) rate | | The rate at which the Reserve Bank lends to commercial banks. |
| |
| Reserves (foreign exchange) | | Holdings of foreign exchange, either by the Reserve Bank only or by the Reserve Bank and domestic banking institutions. |
| |
| Residence-based income tax system | | A tax system in which the worldwide income accruing to a resident of a country is subject to the taxes of that country. |
| |
| Revaluation gain/loss | | The difference between the value of a foreign currency deposit from the original (historic) rate to execution of a trade based on the spot rate. |
| |
| Risk premium | | A return that compensates for uncertainty. |
| |
| Saving | | The difference between income and spending. |
| |
| Seasonally adjusted and annualised | | Removal of seasonal volatility (monthly or quarterly) from a time series. This provides a measure of the underlying trend in the data. |
| |
| Secondary rebate | | A rebate from income tax, in addition to the primary rebate, that is available to taxpayers aged 65 years and older. |
| |
| Secondary sector | | The part of the economy concerned with the manufacture of goods. |
| |
| Secondary tax on companies (STC) | | Tax on dividends declared by a company, calculated at the rate of 10 per cent of the net amount of dividends declared. This was discontinued in 2012 and replaced with a 15 per cent dividend withholding tax. |
| |
| Section 21 company | | Non-profit entities registered in terms of Section 21 of the Companies Act. |
189
ANNEXURE E: GLOSSARY
| | |
| Sector education and training authorities | | Institutions funded through employer training levies, responsible for learnership programmes and implementing strategic sector skills plans. |
| |
| Secured debt instruments | | Debt backed or secured by collateral to reduce the risk of lending. |
| |
| Service and transfer payments | | Services involve transactions of non-tangible commodities, while transfers are unrequited transactions that do not generate a counter-economic value (for example, gifts and grants). |
| |
| Skills development levy | | A payroll tax designed to finance training initiatives, in terms of the skills development strategy. |
| |
| Social infrastructure | | Infrastructure that supports social services. |
| |
| Social wage | | Social benefits available to all individuals, funded wholly or partly by the state. |
| |
| Source-based income tax system | | A system in which income is taxed in the country where the income originates. |
| |
| Southern African Customs Union (SACU) agreement | | An agreement that allows for the unrestricted flow of goods and services, and the sharing of customs and excise revenue, between South Africa, Botswana, Namibia, Lesotho and Swaziland. |
| |
| Southern African Development Community (SADC) | | A regional intergovernmental organisation that promotes collaboration, economic integration and technical cooperation throughout southern Africa. |
| |
| Sovereign debt | | Debt issued by a government. |
| |
| Sovereign debt rating | | An assessment of the likelihood that a government will default on its debt obligations. |
| |
| Specific excise duty | | A tax on each unit of output or sale of a good, unrelated to the value of a good. |
| |
| Standing appropriations | | Government’s expenditure obligations that do not require a vote or statutory provision, including contractual guarantee commitments and international agreements. |
| |
| Statutory appropriations | | Amounts appropriated to be spent in terms of statutes and not requiring appropriation by vote. |
| |
| Sterilisation | | Action taken by the Reserve Bank to neutralise excess cash created in the money market when purchasing foreign currency. |
| |
| Structural budget balance | | A representation of what government revenue and expenditure would be if output were at its potential level, with cyclical variations stripped out. |
| |
| Switch auction | | An auction to exchange bonds to manage refinancing risk or improve tradability. |
190
2014 BUDGET REVIEW
| | |
| Syndicated loan | | A large loan in which a group of banks work together to provide funds, which they solicit from their clients for the borrower. |
| |
| Tax amnesty | | A period allowed by tax authorities during which taxpayers who are outside the tax net, but should be registered for tax purposes, can register for tax without incurring penalties. |
| |
| Tax avoidance | | When individuals or businesses legitimately use provisions in the tax law to reduce their tax liability. |
| |
| Tax base | | The aggregate value of income, sales or transactions on which particular taxes are levied. |
| |
| Tax evasion | | When individuals or businesses illegally reduce their tax liability. |
| |
| Tax gap | | A measure of tax evasion that emerges from comparing the tax liability or tax base declared to the tax authorities with the tax liability or tax base calculated from other sources. |
| |
| Tax incentives | | Specific provisions in the tax code that provide favourable tax treatment to individuals and businesses to encourage specific behaviour or activities. |
| |
| Tax incidence | | The final distribution of the burden of tax. Statutory incidence defines where the law requires a tax to be levied. Economic incidence refers to those who experience a decrease in real income as a result of the imposition of a tax. |
| |
| Tax loopholes | | Unintended weaknesses in the legal provisions of the tax system used by taxpayers to avoid paying tax liability. |
| |
| Tax-to-GDP ratio | | For public finance comparison purposes, a country’s tax burden, or tax-to- GDP ratio, is computed by taking the total tax payments for a particular fiscal year as a fraction or percentage of the GDP for that year. |
| |
| Term-to-maturity | | The time between issuance and expiry. |
| |
| Terms of trade | | An index measuring the ratio of a country’s export prices relative to its import prices. |
| |
| Tertiary sector | | The part of the economy concerned with the provision of services. |
| |
| Total factor productivity | | An index used to measure the efficiency of all inputs that contribute to the production process. |
| |
| Trade balance | | The monetary record of a country’s net imports and exports of physical merchandise. See also current account. |
| |
| Trade regime | | The system of tariffs, quotas and quantitative restrictions applied to protect domestic industries, together with subsidies and incentives used to promote international trade. |
| |
| Trademark | | A legal right pointing distinctly to the origin or ownership of merchandise to which it is applied and legally reserved for the exclusive use of the owner as maker or seller. |
191
ANNEXURE E: GLOSSARY
| | |
| Trade-weighted rand | | The value of the rand pegged to or expressed relative to a market basket of selected foreign currencies. |
| |
| Treasury committee | | The Cabinet committee that evaluates all requests for additional funds for unavoidable and unforeseen expenditure during a financial year. |
| |
| Trend GDP growth | | The theoretical level of GDP growth determined by the full utilisation of all factors of production (land, labour and capital). Growth above the trend rate results in macroeconomic imbalances such as rising inflation or a weakening of the current account. Increases in trend GDP growth are achieved through capital formation, growth in employment and/or technological development. |
| |
| Unallocated reserves | | Potential expenditure provision not allocated to a particular use. It mainly consists of the contingency reserve and amounts of money left unallocated by provinces. |
| |
| Unemployment (broad definition) | | All those of working age who are unemployed, including those actively seeking employment and discouraged worker seekers. |
| |
| Unemployment (official definition) | | Those of working age, who are unemployed and actively seeking work (excludes discouraged work seekers). |
| |
| Unit labour cost | | The cost of labour per unit of output, calculated by dividing average wages by productivity (output per worker per hour). |
| |
| Unsecured debt instruments | | Debt not backed or secured by collateral to reduce the risk of lending. |
| |
| Unsecured lending | | A loan that is not backed or secured by any type of collateral to reduce the lender’s risk. |
| |
| User charge | | Payments made in exchange for direct benefits accrued, for example, road toll fees. |
| |
| Vertical division | | The division of revenue between spheres of government. |
| |
| Vertical equity | | A doctrine in taxation that holds that differently situated taxpayers should be treated differently in terms of income tax provisions – i.e. taxpayers with more income and/or capital should pay more tax. |
| |
| Virement | | The transfer of resources from one programme to another within the same department during a financial year. |
| |
| Vote | | An appropriation voted by Parliament. |
| |
| Withholding tax | | Tax on income deducted at source. Withholding taxes are widely used in respect of dividends, interest and royalties. |
| |
| Yield | | A financial return or interest paid to buyers of government bonds. The yield/rate of return on bonds takes into account the total annual interest payments, the purchase price, the redemption value and the amount of time remaining until maturity. |
| |
| Yield curve | | A graph showing the relationship between the yield on bonds of the same credit quality but different maturity at a given point in time. |
192
W1
Website annexure to the 2014 Budget Review
Explanatory memorandum to the division of revenue
¢ Background
Section 214(1) of the Constitution requires that every year a Division of Revenue Act determine the equitable division of nationally raised revenue between national government, the nine provinces and 278 municipalities. This process takes into account the powers and functions assigned to each sphere of government. The division of revenue process fosters transparency and is at the heart of constitutional cooperative governance.
The Intergovernmental Fiscal Relations Act (1997) prescribes the process for determining the equitable sharing and allocation of nationally raised revenue. Sections 9 and 10(4) of the act set out the consultation process to be followed with the Financial and Fiscal Commission (FFC), including considering recommendations made regarding the division of revenue.
This explanatory memorandum to the 2014 Division of Revenue Bill fulfils the requirement set out in section 10(5) of the Intergovernmental Fiscal Relations Act that the bill be accompanied by an explanatory memorandum detailing how it takes account of the matters listed in sections 214(2)(a) to (j) of the Constitution, government’s response to the FFC’s recommendations, and any assumptions and formulas used in arriving at the respective divisions among provinces and municipalities. This explanatory memorandum has six sections: Part 1 lists the factors that inform the division of resources between national, provincial and local government.
| | • | | Part 2 describes the 2014 division of revenue. |
| | • | | Part 3 sets out how the FFC’s recommendations on the 2014 division of revenue have been taken into account. |
| | • | | Part 4 explains the formula and criteria for the division of the provincial equitable share and conditional grants among provinces. |
1
2014 BUDGET REVIEW
| | • | | Part 5 sets out the formula and criteria for the division of the local government equitable share and conditional grants among municipalities. |
| | • | | Part 6 summarises issues that will form part of subsequent reviews of provincial and local government fiscal frameworks. |
The Division of Revenue Bill and its underlying allocations are the result of extensive consultation between national, provincial and local government. The Budget Council deliberated on the matters discussed in this memorandum at several meetings during the year. The approach to local government allocations was discussed with organised local government at technical meetings with the South African Local Government Association (SALGA), culminating in meetings of the Budget Forum (Budget Council plus SALGA). An extended Cabinet meeting involving ministers, provincial premiers and the SALGA chairperson was held on 4 October 2013. The division of revenue, and the government priorities that underpin it, was agreed for the next three years.
¢ Part 1: Constitutional considerations
Section 214 of the Constitution requires that the annual Division of Revenue Act be enacted only after factors in sub-sections (2)(a) to (j) of the Constitution are taken into account. These include national interest, debt provision, the needs of national government and emergencies, resource allocation for basic services and developmental needs, fiscal capacity and efficiency of provincial and local government, reduction of economic disparities, and promotion of stability and predictability. The constitutional principles taken into account in deciding on the division of revenue are briefly noted below.
National interest and the division of resources
The national interest is encapsulated by those governance goals that benefit the nation as a whole. The National Development Plan, endorsed by Cabinet in November 2012, sets out a long-term vision for the country’s development. This is complemented by the strategic integrated projects overseen by the Presidential Infrastructure Coordinating Council and the 12 priority outcomes adopted by Cabinet in 2010. In the 2013 Medium Term Budget Policy Statement, the Minister of Finance outlined how the resources available to government over the 2014 medium-term expenditure framework (MTEF) would be allocated to help achieve these goals. Chapter 4 of the 2013 Medium Term Budget Policy Statement and Chapter 7 of the 2014 Budget Review provide a detailed analysis of how funds have been allocated based on these priorities. The frameworks for each conditional grant allocated as part of the division of revenue also note how the grant is linked to the 12 priority outcomes.
Provision for debt costs
The resources shared between national, provincial and local government include proceeds from national government borrowing used to fund public spending. National government provides for the resulting debt costs to protect the country’s integrity and credit reputation. A more detailed discussion can be found in Chapter 5 of the 2014 Budget Review.
National government’s needs and interests
The Constitution assigns exclusive and concurrent powers and functions to each sphere of government. National government is exclusively responsible for functions that serve the national interest and are best centralised. National and provincial government have concurrent responsibility for a range of functions. Provincial and local government receive equitable shares and conditional grants to enable them to provide basic services and perform their functions. Changes have been made to various national transfers to provincial and local government to improve their efficiency, effectiveness and alignment with national strategic objectives.
2
ANNEXURE W1: EXPLANATORY MEMORANDUM TO THE DIVISION OF REVENUE
Provincial and local government basic services
Provinces and municipalities are assigned key service delivery functions such as education, health, social development, housing, roads, and provision of electricity, water and municipal infrastructure. They have significant autonomy to allocate resources to meet basic needs and respond to provincial and local priorities, while giving effect to national objectives. The division of revenue provides equitable shares to provinces and local government. This year’s division of revenue allocates additional resources to provinces to provide for the carry-through effects of public-sector wage increases due to higher-than-anticipated inflation. Funds are also added to the provincial fiscal framework to construct facilities for the treatment of substance abuse, roll out a new vaccine for the human papillomavirus, accelerate housing programmes in mining towns and repair infrastructure damaged by floods. Transfers to local government have grown significantly in recent years, providing municipalities with greater resources to deliver basic services. This is in addition to local government’s substantial own-revenue-raising powers. In the 2014 division of revenue, additional resources have been made available to accelerate the rollout of bulk water and sanitation infrastructure, build capacity for cities to manage the development of human settlements, and to incentivise the planning and development of more integrated and efficient urban spaces.
Fiscal capacity and efficiency
National government has primary revenue-raising powers. Provinces have limited revenue-raising capacity and the resources required to deliver provincial functions do not lend themselves to self-funding or cost recovery. Municipalities finance most of their expenditure through property rates, user charges and fees. However, rural municipalities raise significantly less revenue than larger urban and metropolitan municipalities. Due to their limited revenue-raising potential and their responsibility to implement government priorities, provinces receive a larger share of nationally raised revenue than local government. Local government’s portion has significantly increased over the last few years and will continue to grow over the medium term. The mechanisms for allocating funds to provinces and municipalities are continuously reviewed to improve their efficiency. The provincial equitable share formula was reviewed in 2010 and the recommendations were implemented in 2011. In 2013, the formula was updated with 2011 Census data, reflecting significant changes in the distribution of demand for services between provinces. A new approach to the funding of provincial infrastructure is being implemented to promote better planning and implementation, and to improve efficiency in the delivery of health and education infrastructure. A review of the local government equitable share was completed during 2012 and a new formula is being phased in from 2013/14 to 2017/18 (details of the formula are provided in part 5 of this annexure).
Developmental needs
Developmental needs are accounted for at two levels. First, in the determination of the division of revenue, which explains the continued commitment to grow the provincial and local government shares of nationally raised revenue, and second, in the determination of the division within each sphere through the formulas used for dividing national transfers among municipalities and provinces. Developmental needs are encapsulated in the equitable share formulas for provincial and local government and in specific conditional grants. In particular, various infrastructure grants and growing capital budgets aim to boost the economic and social development of provinces and municipalities.
Economic disparities
The equitable share and infrastructure grant formulas are redistributive towards poorer provinces and municipalities. Government is investing in economic infrastructure (such as roads) and social infrastructure (such as schools, hospitals and clinics) to stimulate economic development, create jobs, and address economic and social disparities.
3
2014 BUDGET REVIEW
Obligations in terms of national legislation
The Constitution confers autonomy on provincial governments and municipalities to determine priorities and allocate budgets. National government is responsible for policy development, national mandates, setting national norms and standards for provincial and municipal functions, and monitoring implementation for concurrent functions. The 2014 MTEF and division of revenue provide additional funding for higher-than-anticipated wage costs, increases in the cost of provincial bus services, and to accelerate the provision of housing, water and sanitation. These allocations are in addition to obligations funded through existing provincial and local government baseline allocations.
Predictability and stability
Provincial and local government equitable share allocations are based on estimates of nationally raised revenue. If this revenue falls short of the estimates within a given year, the equitable shares of provinces and local government will not be adjusted downwards. Allocations are assured (voted, legislated and guaranteed) for the first year and are transferred according to a payment schedule. To contribute to longer-term predictability and stability, estimates for a further two years are published with the annual proposal for appropriations. Adjusted estimates as a result of changes to data underpinning the equitable share formulas and revisions to the formulas are phased in to ensure minimal disruption.
Flexibility in responding to emergencies
Government has a contingency reserve that provides a cushion for emergencies and unforeseeable events. In addition, two conditional grants for disasters allow for the swift allocation and transfer of funds to affected provinces and municipalities in the immediate aftermath of a declared disaster. Sections 16 and 25 of the Public Finance Management Act (1999) make specific provision for the allocation of funds to deal with emergency situations. Section 30(2) deals with adjustment allocations for unforeseeable and unavoidable expenditure. Section 29 of the Municipal Finance Management Act (2003) allows a municipal mayor to authorise unforeseeable and unavoidable expenditure in an emergency.
¢ Part 2: The 2014 division of revenue
Expenditure in the 2014 MTEF will remain within the bounds set out in the 2013 Budget. National and provincial departments implemented savings measures and reprioritised spending to make additional resources available to fund government priorities in the 2014 Budget.
Excluding debt-service costs and the contingency reserve, allocated expenditure shared between the three spheres amounts to R1.1 trillion, R1.2 trillion and R1.3 trillion over each of the MTEF years. These allocations take into account government’s spending priorities, the revenue-raising capacity and responsibilities of each sphere, and input from various intergovernmental forums and the FFC. The provincial and local equitable share formulas are designed to ensure fair, stable and predictable revenue shares, and to address economic and fiscal disparities.
Government’s policy priorities for the 2014 MTEF
Government has adopted a policy of changing the composition of spending to focus on promoting economic development, investing in infrastructure, creating jobs and enhancing local government capacity.
Following the saving exercise mentioned above, additional resources are allocated to provinces to:
| | • | | Subsidise the carry-through costs of higher-than-projected inflation on wage agreements |
| | • | | Construct facilities for the treatment of substance abuse |
| | • | | Roll out a new vaccine for the human papillomavirus |
| | • | | Accelerate housing programmes in mining towns |
| | • | | Repair infrastructure damaged by floods |
4
ANNEXURE W1: EXPLANATORY MEMORANDUM TO THE DIVISION OF REVENUE
| | • | | Cover the increased costs of provincial bus services. |
Local government allocations receive additional funds to:
| | • | | Accelerate the provision of bulk water and sanitation |
| | • | | Promote more integrated and efficient cities |
| | • | | Build capacity for the development of human settlements. |
Funding for the eradication of bucket sanitation has been prioritised within existing allocations to municipalities and a new indirect component of the human settlements development grant to provinces will also fund this priority.
Table W1.1 shows how additional allocations are distributed to priority areas across national, provincial and local government over the MTEF period.
Table W1.1 2014 Budget priorities – additional MTEF allocations, 2014/15 – 2016/17
| | | | | | | | | | | | | | | | |
R million | | 2014/15 | | | 2015/16 | | | 2016/17 | | | Total | |
Provincial departments: Compensation of employees cost pressures | | | 2 738 | | | | 4 347 | | | | 4 964 | | | | 12 049 | |
National departments: Compensation of employees cost pressures | | | 1 317 | | | | 1 798 | | | | 2 199 | | | | 5 314 | |
Defence and Military Veterans: Improving operational capability of South African Air Force | | | 342 | | | | 387 | | | | 555 | | | | 1 284 | |
Transport: Procurement of railway rolling stock | | | 348 | | | | 338 | | | | 410 | | | | 1 096 | |
Cooperative Governance and Traditional Affairs: Community Work Programme | | | — | | | | — | | | | 1 072 | | | | 1 072 | |
Human Settlements: Municipal human settlements capacity grant | | | 300 | | | | 300 | | | | 300 | | | | 900 | |
Water Affairs: Regional bulk infrastructure grant, to accelerate the delivery of bulk water and sanitation | | | — | | | | 350 | | | | 500 | | | | 850 | |
Justice and Constitutional Development: Increased accommodation costs | | | 200 | | | | 210 | | | | 310 | | | | 720 | |
Communications: Provision of set-top boxes, antennae and installation in 5 million households | | | — | | | | 300 | | | | 400 | | | | 700 | |
Water Affairs: Construction of Umzimvubu Dam and bulk water scheme | | | — | | | | 264 | | | | 430 | | | | 694 | |
Statistics SA: New head office accommodation | | | 282 | | | | 135 | | | | — | | | | 417 | |
Transport: Rehabilitation of road infrastructure destroyed by natural disasters | | | 235 | | | | 178 | | | | — | | | | 414 | |
Health: Introduction of new vaccine for cervical cancer | | | 200 | | | | 200 | | | | — | | | | 400 | |
National Treasury: Integrated city development grant | | | 105 | | | | 116 | | | | 135 | | | | 356 | |
Human Settlements: Repair of housing infrastructure damaged by disasters | | | 185 | | | | 141 | | | | — | | | | 326 | |
Defence: Military Health Services: medical equipment and supplies | | | 100 | | | | 100 | | | | 100 | | | | 300 | |
Environmental Affairs: Green Fund, to support the transition to a green economy | | | 250 | | | | — | | | | — | | | | 250 | |
Agriculture, Forestry and Fisheries: Repair of farm infrastructure damaged by natural disasters | | | 196 | | | | 14 | | | | — | | | | 209 | |
Home Affairs: Rescheduling of information technology system modernisation projects | | | — | | | | — | | | | 200 | | | | 200 | |
Provincial Health: Provision of the cervical cancer vaccine by provincial governments | | | — | | | | — | | | | 200 | | | | 200 | |
Energy: South African Nuclear Energy Corporation, upgrading of the Safari-1 nuclear reactor, research and development | | | 190 | | | | — | | | | — | | | | 190 | |
Human Settlements: Informal settlement upgrading in mining towns | | | 180 | | | | — | | | | — | | | | 180 | |
| | | | | | | | | | | | | | | | |
Total | | | 7 168 | | | | 9 178 | | | | 11 775 | | | | 28 120 | |
| | | | | | | | | | | | | | | | |
5
2014 BUDGET REVIEW
The fiscal framework
Table W1.2 presents the medium-term macroeconomic forecasts for the 2014 Budget. It sets out the growth assumptions and fiscal policy targets on which the fiscal framework is based.
Table W1.2 Medium-term macroeconomic assumptions, 2013/14 – 2016/17
| | | | | | | | | | | | | | | | | | | | | | | | | | | | |
| | | 2013/14 | | | 2014/15 | | | 2015/16 | | | 2016/17 | |
| | | 2013 | | | 2014 | | | 2013 | | | 2014 | | | 2013 | | | 2014 | | | 2014 | |
R billion | | Budget | | | Budget | | | Budget | | | Budget | | | Budget | | | Budget | | | Budget | |
Gross domestic product | | | 3 520.3 | | | | 3 464.9 | | | | 3 880.4 | | | | 3 789.6 | | | | 4 270.8 | | | | 4 150.5 | | | | 4 552.9 | |
Real GDP growth | | | 3.0 | % | | | 2.0 | % | | | 3.6 | % | | | 2.9 | % | | | 3.8 | % | | | 3.3 | % | | | 3.5 | % |
GDP inflation | | | 6.5 | % | | | 6.2 | % | | | 6.4 | % | | | 6.3 | % | | | 6.0 | % | | | 6.0 | % | | | 5.9 | % |
National budget framework | | | | | | | | | | | | | | | | | | | | | | | | | | | | |
Revenue | | | 873.0 | | | | 886.2 | | | | 967.9 | | | | 962.8 | | | | 1 070.7 | | | | 1 058.1 | | | | 1 172.6 | |
Percentage of GDP | | | 24.8 | % | | | 25.6 | % | | | 24.9 | % | | | 25.4 | % | | | 25.1 | % | | | 25.5 | % | | | 25.8 | % |
Expenditure | | | 1 055.1 | | | | 1 049.1 | | | | 1 138.0 | | | | 1 142.6 | | | | 1 225.7 | | | | 1 232.6 | | | | 1 323.6 | |
Percentage of GDP | | | 30.0 | % | | | 30.3 | % | | | 29.3 | % | | | 30.1 | % | | | 28.7 | % | | | 29.7 | % | | | 29.1 | % |
Main budget balance1 | | | -182.1 | | | | -162.9 | | | | -170.1 | | | | -179.8 | | | | -155.0 | | | | -174.5 | | | | -151.0 | |
Percentage of GDP | | | -5.2 | % | | | -4.7 | % | | | -4.4 | % | | | -4.7 | % | | | -3.6 | % | | | -4.2 | % | | | -3.3 | % |
| 1. | A positive number reflects a surplus and a negative number a deficit |
Table W1.3 sets out the division of revenue for the 2014 MTEF period after accounting for new policy priorities.
Table W1.3 Division of nationally raised revenue, 2010/11 – 2016/17
| | | | | | | | | | | | | | | | | | | | | | | | | | | | |
| | | 2010/11 | | | 2011/12 | | | 2012/13 | | | 2013/14 | | | 2014/15 | | | 2015/16 | | | 2016/17 | |
| | | | | | | | | | | | Revised | | | | |
R million | | Outcome | | | estimate | | | Medium-term estimates | |
Division of available funds | | | | | | | | | | | | | | | | | | | | | | | | | | | | |
National departments | | | 356 027 | | | | 382 712 | | | | 412 706 | | | | 449 251 | | | | 489 424 | | | | 522 257 | | | | 552 983 | |
of which: | | | | | | | | | | | | | | | | | | | | | | | | | | | | |
Indirect transfers to provinces | | | — | | | | 76 | | | | 860 | | | | 2 693 | | | | 5 413 | | | | 5 044 | | | | 4 127 | |
Indirect transfers to local government | | | 2 939 | | | | 2 770 | | | | 4 956 | | | | 5 697 | | | | 7 726 | | | | 9 467 | | | | 10 221 | |
Provinces | | | 322 822 | | | | 362 488 | | | | 388 238 | | | | 414 932 | | | | 444 423 | | | | 477 639 | | | | 508 254 | |
Equitable share | | | 265 139 | | | | 291 736 | | | | 313 016 | | | | 338 937 | | | | 362 468 | | | | 387 967 | | | | 412 039 | |
Conditional grants | | | 57 682 | | | | 70 753 | | | | 75 222 | | | | 75 995 | | | | 81 955 | | | | 89 672 | | | | 96 215 | |
Local government | | | 60 904 | | | | 68 251 | | | | 76 430 | | | | 83 670 | | | | 90 815 | | | | 100 047 | | | | 105 187 | |
Equitable share | | | 30 541 | | | | 33 173 | | | | 37 139 | | | | 39 789 | | | | 44 490 | | | | 50 208 | | | | 52 869 | |
Conditional grants | | | 22 821 | | | | 26 505 | | | | 30 251 | | | | 34 268 | | | | 36 135 | | | | 39 181 | | | | 41 094 | |
General fuel levy sharing with metropolitan municipalities | | | 7 542 | | | | 8 573 | | | | 9 040 | | | | 9 613 | | | | 10 190 | | | | 10 659 | | | | 11 224 | |
| | | | | | | | | | | | | | | | | | | | | | | | | | | | |
Non-interest allocations | | | 739 752 | | | | 813 451 | | | | 877 374 | | | | 947 853 | | | | 1 024 662 | | | | 1 099 943 | | | | 1 166 424 | |
Percentage increase | | | 7.2 | % | | | 10.0 | % | | | 7.9 | % | | | 8.0 | % | | | 8.1 | % | | | 7.3 | % | | | 6.0 | % |
| | | | | | | | | | | | | | | | | | | | | | | | | | | | |
Debt-service costs | | | 66 227 | | | | 76 460 | | | | 88 121 | | | | 101 256 | | | | 114 901 | | | | 126 647 | | | | 139 201 | |
Contingency reserve | | | — | | | | — | | | | — | | | | — | | | | 3 000 | | | | 6 000 | | | | 18 000 | |
| | | | | | | | | | | | | | | | | | | | | | | | | | | | |
Main budget expenditure | | | 805 979 | | | | 889 911 | | | | 965 496 | | | | 1 049 109 | | | | 1 142 562 | | | | 1 232 590 | | | | 1 323 624 | |
Percentage increase | | | 7.9 | % | | | 10.4 | % | | | 8.5 | % | | | 8.7 | % | | | 8.9 | % | | | 7.9 | % | | | 7.4 | % |
| | | | | | | | | | | | | | | | | | | | | | | | | | | | |
Percentage shares | | | | | | | | | | | | | | | | | | | | | | | | | | | | |
National departments | | | 48.1 | % | | | 47.0 | % | | | 47.0 | % | | | 47.4 | % | | | 47.8 | % | | | 47.5 | % | | | 47.4 | % |
Provinces | | | 43.6 | % | | | 44.6 | % | | | 44.2 | % | | | 43.8 | % | | | 43.4 | % | | | 43.4 | % | | | 43.6 | % |
Local government | | | 8.2 | % | | | 8.4 | % | | | 8.7 | % | | | 8.8 | % | | | 8.9 | % | | | 9.1 | % | | | 9.0 | % |
| | | | | | | | | | | | | | | | | | | | | | | | | | | | |
Table W1.4 shows how additional resources are divided. The new focus areas and additional allocations are accommodated by shifting savings towards priorities.
6
ANNEXURE W1: EXPLANATORY MEMORANDUM TO THE DIVISION OF REVENUE
Table W1.4 Changes over baseline,1 2014/15 – 2016/17
| | | | | | | | | | | | |
R million | | 2014/15 | | | 2015/16 | | | 2016/17 | |
National departments | | | -32 | | | | 551 | | | | 5 113 | |
Provinces | | | 2 696 | | | | 3 250 | | | | 4 861 | |
Local government | | | -764 | | | | -1 422 | | | | -1 660 | |
| | | | | | | | | | | | |
Allocated expenditure | | | 1 900 | | | | 2 379 | | | | 8 314 | |
| | | | | | | | | | | | |
| 1. | Excludes shifting of savings towards priorities over the MTEF |
Table W1.5 sets out schedule 1 of the Division of Revenue Bill, which reflects the legal division of revenue between national, provincial and local government. In this division, the national share includes all conditional grants to provinces and local government in line with section 214(1) of the Constitution, and the allocations for each sphere reflect equitable shares only.
Table W1.5 Schedule 1 of the Division of Revenue Bill, 2014/15 – 2016/17
| | | | | | | | | | | | |
| | | 2014/15 | | | 2015/16 | | | 2016/17 | |
| | | Column A | | | Column B | |
R million | | Allocation | | | Forward estimates | |
National1, 2 | | | 735 604 | | | | 794 415 | | | | 858 717 | |
Provincial | | | 362 468 | | | | 387 967 | | | | 412 039 | |
Local | | | 44 490 | | | | 50 208 | | | | 52 869 | |
| | | | | | | | | | | | |
Total | | | 1 142 562 | | | | 1 232 590 | | | | 1 323 624 | |
| | | | | | | | | | | | |
| 1. | National share includes conditional grants to provinces and local government, general fuel levy sharing with metropolitan municipalities, debt-service costs and the contingency reserve |
| 2. | Direct charges for the provincial equitable share are netted out |
The 2014 Budget Review sets out in detail how constitutional issues and government’s priorities are taken into account in the 2014 division of revenue. It describes economic and fiscal policy considerations, revenue issues, debt and financing considerations, and expenditure plans. Chapter 7 focuses on provincial and local government financing.
¢ Part 3: Response to the recommendations of the FFC
Section 9 of the Intergovernmental Fiscal Relations Act (1997) requires the FFC to make recommendations regarding:
| | a) | “An equitable division of revenue raised nationally, among the national, provincial and local spheres of government; |
| | b) | the determination of each province’s equitable share in the provincial share of that revenue; and |
| | c) | any other allocations to provinces, local government or municipalities from the national government’s share of that revenue, and any conditions on which those allocations should be made.” |
The act requires that the FFC table these recommendations at least 10 months before the start of each financial year. The FFC tabled its Submission for the Division of Revenue 2014/15 to Parliament in May 2013. These recommendations are divided into 13 chapters, which cover three main areas: national levers for inclusive growth in a post-crisis fiscal response; provincial fiscal levers – state capability and performance; and local government levers – collaborative governance for effective and sustainable municipalities.
Section 214 of the Constitution requires that the FFC’s recommendations be considered before tabling the division of revenue. Section 10 of the Intergovernmental Fiscal Relations Act requires that the Minister of Finance table a Division of Revenue Bill with the annual budget in the National Assembly. The bill must be accompanied by an explanatory memorandum setting out how government has taken into account the FFC’s recommendations when determining the division of revenue. This part of the explanatory memorandum complies with the requirement.
7
2014 BUDGET REVIEW
The FFC’s recommendations can be divided into three categories:
| | • | | Recommendations that apply directly to the division of revenue |
| | • | | Recommendations that indirectly apply to issues related to the division of revenue |
| | • | | Recommendations that do not relate to the division of revenue. |
Government responses to the first and second categories are provided below. Recommendations that do not apply to the division of revenue are being considered and dealt with through alternative processes.
Recommendations that apply directly to the division of revenue
Chapter 1: Budget consolidation in South Africa: balancing growth and socioeconomic rights
Moderate the growth in public-sector wage expenditure
The FFC recommends that, “Government continues its efforts to moderate the growth in expenditure components such as the public-sector wage bill (which constitutes some 60 per cent of government expenditure), as decreases in government expenditure increase the probability of a successful fiscal consolidation in South Africa. More effort must be made to improve the effectiveness of public finances, through greater and more rigorous oversight to ensure the elimination of fruitless, wasteful and unauthorised expenditure, and corrupt practices in managing public finances.”
Government response
This recommendation deals with two different issues. The moderation of the wage bill is about the broad public-sector remuneration policy, whereas improving the effectiveness of public finances (in respect of fruitless, wasteful, unauthorised expenditure and corrupt practices) is an issue of accountability, governance and legal compliance.
Moderating the public-sector wage bill requires the management of employee remuneration policies (wage increases, allowances and so on) and staff numbers. The former is governed by the Department of Public Service and Administration. Government recognises that there is dualism in this area and has raised the issue in the FFC’s presence both in Parliament and in other executive forums (the Technical Committee on Finance and the Budget Council). Government is working to address this issue. In terms of staff numbers, accounting officers and the executive authority are responsible for ensuring that people are not recruited where there is no pre-authorised budget to pay their salaries, and that budgets are not increased to cater for staff growth at the expense of other service delivery areas. Government has proposed the development of a management framework for this aspect of personnel management, and has initiated a project for personnel costing and modelling to help departments plan for personnel requirements and reduce the financial impact.
Government is committed to improving the effectiveness of public spending. The cost containment measures announced in the 2013 Medium Term Budget Policy Statement are being implemented through new guidelines issued by the National Treasury. Financial monitoring systems are being continuously improved across government, including through the design of a standard chart of accounts for local government. These improvements provide managers, oversight bodies and the public with the information they need to hold government accountable for the way public funds are spent.
Chapter 3: Funding of the South African further education and training sector
Funding further education and training colleges
The FFC recommends that, “The funding model for the further education and training sector after the function shift ensures that: baseline funding does not perpetuate past underfunding of the function in certain provinces; additional allocations are used to achieve a more equitable funding regime across the provinces; and ongoing infrastructure development and maintenance are provided for.”
8
ANNEXURE W1: EXPLANATORY MEMORANDUM TO THE DIVISION OF REVENUE
Government response
In 2012, the Department of Higher Education and Training developed a comprehensive turnaround strategy for all 50 further education and training colleges. The strategy, which is being implemented, aims to systematically address the colleges’ key challenges to achieve sustainable improvements in the quality of teaching and learning. The strategy uses individual assessments and tailored interventions to respond to the specific strengths and weaknesses of each college. The Department of Higher Education and Training is solving immediate problems while laying out a developmental agenda that will be sustained beyond 2030. The coordination and implementation of the strategy is important and will drive annual operational plans, budgets and priorities. A portion of the cost per course will cover ongoing maintenance and infrastructure development. Large-scale infrastructure development will require additional funding, if available.
Chapter 5: Evolution of conditional grants
Consulting the FFC when planning for conditional grants
The FFC recommends that, “The section in the Division of Revenue Act dealing with preparation for the next financial year is reviewed to make consultation with the commission mandatory when planning for conditional grants for the forthcoming year. This would assist departments with grant design, especially in the case of new grants, phased-out grants, and material redesign of existing grants.”
Government response
The consultation processes between the FFC and national government on the annual budget is prescribed in the Intergovernmental Fiscal Relations Act and not the annual Division of Revenue Act. Government, however, welcomes the commission’s offer to provide assistance to national departments. Given the tight timeframes involved in planning for the annual Division of Revenue Bill, government recommends that the FFC focus on assisting departments with the design of new grants, redesigning grants and grants that need to be phased out, as these are the areas where the commission’s advice can be of most value. The National Treasury will refer individual departments considering major changes to conditional grants to the FFC for consultations and advice.
This initiative will complement the well-established practice of extensive consultation between government and the FFC on matters relating to the division of revenue. These consultations include the National Treasury consulting the commission on proposed changes to the division of revenue before announcements are made in the Medium Term Budget Policy Statement and the Budget Speech; the FFC’s participation in the Budget Forum, Budget Council and Technical Committee on Finance meetings; sharing draft conditional grant frameworks with the FFC for comments; and the commission’s inclusion in review initiatives, such as the review of the local government equitable share undertaken in 2012 and the review of local government infrastructure grants currently under way.
Reviewing the efficacy of conditional grants
The FFC recommends that, “The efficacy of conditional grants is reviewed, specifically in relation to the necessity and purpose of some of the grants, criteria for allocations, targeting, reporting on non-financial data, performance, and value for money.”
Government response
Government agrees on the importance of assessing the effectiveness of conditional grants. Government assesses grant performance and effectiveness on an ongoing basis and makes changes where necessary in the annual Division of Revenue Act and the grant frameworks gazetted in terms of that act.
In addition, government also conducts periodic reviews of the conditional grant system. In the explanatory memorandum to the 2013 Division of Revenue, government announced a review of the local government infrastructure grant system. This review is under way and includes a number of stakeholders in its working group and steering committee, including the FFC. The review will also involve extensive consultation with affected sectors and municipalities. Consultative reviews of systems as complex as the local government infrastructure grant system take time to complete and are therefore done periodically rather than continuously.
9
2014 BUDGET REVIEW
New measures have also been introduced to improve the effectiveness of conditional grants. For example, years of experience with the Infrastructure Delivery Improvement Programme have demonstrated that one of the biggest obstacles to the successful implementation of infrastructure projects in provinces is weak planning. As a result, a new infrastructure grant allocation mechanism has been introduced that requires provinces to begin submitting draft plans two years before project implementation. More details on progress in implementing these reforms can be found in part 6 of this annexure.
Recommendations that indirectly apply to the division of revenue
Chapter 5: Evolution of conditional grants
Capacity building in transferring national departments
The FFC recommends that, “National Treasury builds the capacity of transferring national departments for the effective grant design, monitoring and evaluation to ensure that guidelines are adhered to.”
Government response
Government agrees on the importance of appropriate capacity to manage conditional grants. The National Treasury provides technical guidance to national departments on how to design, manage and monitor conditional grants. Departments considering establishing a new grant are able to consult with National Treasury officials and are provided with guidance and templates for the grant application process. Annual workshops on the Division of Revenue Act are held with all national transferring officers to discuss changes to the act, how the different provisions in the act work, and what levers are available to grant managers to carry out their mandates. The National Treasury also conducts annual training sessions with provinces and national departments on how to compile a business plan using a generic template. The National Treasury meets with national departments each quarter to review performance and assist departments with Division of Revenue Act compliance issues. Although the National Treasury offers guidance and training, national departments are responsible for devising their own capacity-building strategies and ensuring that suitably qualified staff are assigned to tasks relating to conditional grants.
Chapter 6: Assessing and improving the fiscal performance of provinces
Establishing a provincial fiscal performance framework
The FFC proposes that, “National and provincial treasuries put in place an agreed-upon measurement and assessment framework for fiscal performance against which provinces are evaluated. The assessment framework must: a) take into account various factors that capture fiscal performance holistically, including services burden, expenditure efficiency, and funding and delivery norms; b) incorporate information from internal audit reports and serve as an early warning system to complement section 32 reports and National Treasury benchmarking exercises; c) provide for monitoring and disclosure of key fiscal performance indicators of provincial departments, particularly when deviation (as defined by the Public Finance Management Act) from a healthy fiscal trajectory is prolonged; and d) provide for monitoring of expenditure benchmarks against which key provincial expenditure items are regularly evaluated and reported by provincial accounting officers.”
Government response
Government agrees that frameworks for fiscal performance are critical. In this regard, expenditure reviews are being conducted (short term within the National Treasury and long term in a joint project with the Department of Performance Monitoring and Evaluation), as well as the public expenditure and financial accountability assessments in provinces. A planning and performance management framework is in place, with annual guidelines that are produced by the National Treasury and used by departments. A quarterly performance reporting system has been implemented to complete the financial reporting system for all
10
ANNEXURE W1: EXPLANATORY MEMORANDUM TO THE DIVISION OF REVENUE
departments. Each sector develops norms for its specific delivery requirements (for example, school funding and feeding norms), which feed into the department’s budgeting and planning. The section 32 report is a summary output of the early warning system and does not necessarily contain all the details available in that system. The report’s high-level content presents information in a way that can be accessed and used by a broad audience. Internal audit reports cannot serve as an early warning system because they only become available after the event in question has occurred. In addition, even though they are available earlier than the Auditor-General’s report, they are still available much later than the information from the existing monthly warning system. The FFC has previously been invited to assess the National Treasury’s early warning system and this invitation is still open.
Mandatory expenditure reviews by provincial treasuries
The FFC recommends that, “Provincial treasuries must carry out mandatory expenditure reviews (overseen by National Treasury and the Department of Performance Monitoring and Evaluation in the Presidency) after every MTEF cycle, specifically focusing on composition, efficiency, economy and effectiveness of expenditure, as well as access to services and realignment of spending with programme objectives and delivery targets.”
Government response
The largest and most significant provincial programmes are concurrent functions driven by national policies. As a result, reviews of the composition of expenditure should be a nationally driven process, working in conjunction with provinces. The National Treasury and the Department of Performance Monitoring and Evaluation are conducting expenditure reviews during 2013/14 and 2014/15. Provincial treasuries have instituted expenditure reviews in their respective provinces. The framework for strategic planning and annual performance planning has aligned spending with service delivery, programme objectives and delivery targets in both provincial and national government. Government acknowledges that sector indicators, definitions, plans and reports need to be improved, which is an ongoing process. The relevant service delivery sectors must take direct ownership and responsibility for managing and improving their programme performance.
Chapter 7: Managing the provincial wage bill to contain fiscal stress
An appropriate balance between wage and non-wage components of provincial budgets for social spending
The FFC recommends that, “A transition over the medium to long term is required, towards a more appropriate balance between the wage and non-wage components of provincial budgets for social spending (starting with education and health). This should be in the form of national sector departments setting a norm or ratio of frontline versus administrative staff to total expenditure per sector and/or by specific occupational categories, and developing accurate and up-to-date management information systems to monitor employee compensation expenditure against those norms.”
Government response
Government supports the recommendations relating to the transition towards a more appropriate balance between the wage and non-wage components of provincial budgets for social spending. This transition must be systematic – the estimates should be informed by the staffing norms and not the other way around. For example, the health sector itself should recommend the scenarios to determine the ratio of administration staff in head offices or facilities to the number of doctors and nurses. This work is under way. After this, a collaborative effort between treasuries and health departments must take place to determine what is affordable.
11
2014 BUDGET REVIEW
Chapter 9: Effective intergovernmental planning and budgeting for better outcomes
Budget process reforms for collective responsibility for delivery agreement outcomes
The FFC recommends that, “National Treasury and the Department of Performance Monitoring and Evaluation introduce budget process reforms necessary for reconciling the collective responsibility for delivery agreement outcomes and the individual department-focused budget-bidding process by: a) realigning the budget process along service delivery agreements such that Medium-Term Expenditure Committee hearings are conducted at an outcome level, where applicable, rather than the current sectoral, individual institutional approach; and b) directly linking resource allocation to realistic, measurable and limited performance targets per outcome. Programme expenditure reviews must be undertaken at the end of each targeting period.”
Government response
The budget process explicitly incorporates the outcomes approach. This is evident in the introduction of a functional approach to budgeting from the 2011 Budget onwards, which shifted the focus from administrative units and clusters to government’s objectives, irrespective of which unit or department the related function falls under. The budget process, including Medium-Term Expenditure Committee deliberations, allows for efficient budget allocations and for specific focus on achieving identified national outcomes. National and provincial departments, and in some cases specific individual departmental programmes, and public entities are grouped according to their functions. The function groups that institutions and programmes are classified under support the outcomes approach because allocations are based on government objectives or functions, rather than individual departments.
In the annual estimates of national expenditure and provincial estimates, departments provide information on the outcomes to which all the programme performance indicators contribute. In their annual performance plans, national and provincial departments report on both financial and non-financial performance, and how budgets contribute to the achievement of targets. Conditional grant frameworks also identify which outcomes the grant contributes towards. Outputs and other indicators and the targets of the national outcomes are also incorporated into departmental planning documents.
Reorienting conditional grant incentives to reward successful delivery
The FFC recommends that, “In order to incentivise collaboration, government consolidates and reorients existing conditional grant incentives to reward successful achievement of delivery targets/outcomes rather than specific, individual, department-specific programme objectives.”
Government response
The conditional grant system includes a wide range of grants for a variety of objectives. As such, it encompasses several different approaches and cannot adopt a “one-size-fits-all” system. However, government is committed to improving the incentives where appropriate. In the 2013 division of revenue, changes to the way health and education infrastructure grants are allocated to provinces created strong incentives for provinces to improve their planning. A new integrated city development grant introduces incentives for developing more integrated and efficient cities. The review of local government infrastructure grants that is under way may also deliver changes to grants in line with the FFC’s recommendation (though the outcomes of the review cannot be known at this stage).
Chapter 10: Improving the performance of municipalities through incentive-based grants
Performance-based grants
The FFC recommends that, “Performance-based grants are based on principles and guidelines. The following principles should guide the design of performance-based grants: a) incentives should have sufficient monetary value to motivate desired behaviours by municipalities; b) incentive and performance indicators should be periodically revised and renegotiated between national government and municipalities; c) performance measures should capture performance unambiguously and be within the
12
ANNEXURE W1: EXPLANATORY MEMORANDUM TO THE DIVISION OF REVENUE
control and influence of the municipalities; d) performance incentives and associated performance measures should be evaluated at regular and scheduled intervals, and allow time for learning from each cycle; e) incentives should be achievable and evaluated within the specified timeframe; f) the transferring officials and the municipality should be sufficiently capacitated to understand the purpose and impact of incentives; and g) incentives should be tailor-made to suit specific situations.”
Government response
Government appreciates the FFC’s work in proposing these principles and guidelines, and will consider them in the design of future incentive grants. Grants will be designed on a case-by-case basis and the appropriateness of each of these proposed principles will be considered for each grant.
An incentive-based transfer system could improve service delivery in municipalities with adequate institutional and fiscal capacity. This is premised on the fact that socioeconomic circumstances and institutional capacities of various municipalities in South Africa differ greatly. It is therefore highly likely that the best-performing municipalities would consistently benefit from this initiative. A number of municipalities find it difficult to use the municipal infrastructure grant allocations for basic services, which indicates that there are underlying challenges that need urgent attention. To redress this situation, government has implemented capacity building and support programmes to accelerate infrastructure delivery in local government.
With regard to revision of the grant framework, existing mechanisms are in place to ensure that allocations are incremental or demand-driven, and tailor-made to suit the objectives of all sectors in South Africa. Government agrees with the FFC that transferring officers need to be capacitated to address the skills gap in a number of sectors.
Although government agrees with most of the recommendations on monitoring and evaluation, it should be noted that government is currently crafting guidelines for outlining performance indicators. These guidelines are for metropolitan municipalities, and will be rolled out to secondary and local municipalities at a later stage. The indicators take cognisance of the fact that municipalities differ in institutional, social, economic and political context. Indicators can perform a valuable role in clarifying long-term goals, guiding municipal actions to achieve them, measuring their progress over time and rewarding good performance. Indicators are also important for national government to account for the effective use of taxpayer funding.
Sufficient awareness of the nature of performance-based grants
The FFC recommends that, “The National Treasury and Department of Cooperative Governance ensure that there is sufficient awareness of the nature of performance-based grants, the value of incentives, relevant indicators, assessment criteria and potential benefits thereof, and how potential implementation risks could be managed.”
Government response
Government agrees that if any new incentive or performance-based grants are introduced, national government must ensure that municipalities understand how the grants are allocated and what performance is expected of them to earn more from the grant. The National Treasury will ensure that the allocation criteria are set out clearly in the grant framework gazetted in terms of the Division of Revenue Act, but it is the responsibility of the department managing and transferring the grant to distribute guidelines on the grant and if necessary to hold workshops with receiving officers on how a grant works.
Chapter 13: A collaborative effort to enhance revenue generation in rural municipalities
Linking grant funding for municipalities in rural areas to capacity-building initiatives
The FFC recommends that, “National and provincial governments ensure that grant funding to rural municipalities is linked to capacity-building initiatives and structured assistance, so that systems are built to improve the municipality’s ability to collect revenues due and increase the quality of spending.”
13
2014 BUDGET REVIEW
Government response
Government provides extensive capacity support to rural municipalities through a range of programmes, including the financial management grant, the municipal systems improvement grant, the Municipal Finance Improvement Programme, the infrastructure skills development grant and the Municipal Infrastructure Support Agency. These programmes target various aspects of local capacity, including revenue management and infrastructure spending. In some cases, capacity is built through resource allocations, while in others capacity is built through technical, hands-on transfer of skills or through formal competency training programmes. This differentiated approach to capacity building cannot always be linked to specific grant transfers. However, government strives to ensure that every municipality with capacity problems receives appropriate support. As part of this effort, the Municipal Infrastructure Support Agency is working to ensure that municipalities with high levels of underspending on capital grants receive support to improve their planning and capital spending.
The Municipal Finance Improvement Programme is designed to ensure that all disciplines related to the Municipal Finance Management Act are addressed through technical assistance placed at the municipality. Support is directed towards revenue management and collections, and budgeting. The programme transfers skills and experience to municipal officials. Although municipalities receive support to address gaps in their budget and treasury offices by identifying critical posts, filling these is a matter that municipal councils must prioritise. Rural municipalities need to develop new strategies to attract and retain skills, for example, by recruiting retired individuals and using shared services models more extensively.
¢ Part 4: Provincial allocations
Sections 214 and 227 of the Constitution require that an equitable share of nationally raised revenue be allocated to provincial government to enable it to provide basic services and perform its allocated functions.
A total of R10.8 billion is added to the provincial baseline over the next three years. The provincial equitable share baselines are revised upwards by R12 billion, while direct conditional grant allocations are reduced by R1.2 billion over the MTEF period due to reprioritisations. National transfers to provinces increase from R414.9 billion in 2013/14 to R444.4 billion in 2014/15. Over the MTEF period, provincial transfers will grow at an average annual rate of 7 per cent to R508.3 billion in 2016/17.
Table W1.6 sets out the total transfers to provinces for 2014/15, which amount to R444.4 billion. A total of R362.5 billion is allocated to the provincial equitable share and R82 billion to conditional grants, which includes an unallocated R197.4 million for the provincial disaster grant, but excludes indirect transfers of R5.4 billion.
Table W1.6 Total transfers to provinces, 2014/15
| | | | | | | | | | | | |
| | | Equitable | | | Conditional | | | Total | |
R million | | share | | | grants | | | transfers | |
Eastern Cape | | | 52 154 | | | | 9 846 | | | | 62 000 | |
Free State | | | 20 883 | | | | 6 158 | | | | 27 041 | |
Gauteng | | | 68 673 | | | | 16 935 | | | | 85 608 | |
KwaZulu-Natal | | | 78 138 | | | | 15 941 | | | | 94 080 | |
Limpopo | | | 43 274 | | | | 7 580 | | | | 50 854 | |
Mpumalanga | | | 29 355 | | | | 6 352 | | | | 35 707 | |
Northern Cape | | | 9 652 | | | | 3 406 | | | | 13 057 | |
North West | | | 24 707 | | | | 5 621 | | | | 30 328 | |
Western Cape | | | 35 631 | | | | 9 917 | | | | 45 549 | |
Unallocated | | | — | | | | 197 | | | | 197 | |
| | | | | | | | | | | | |
Total | | | 362 468 | | | | 81 955 | | | | 444 423 | |
| | | | | | | | | | | | |
14
ANNEXURE W1: EXPLANATORY MEMORANDUM TO THE DIVISION OF REVENUE
The provincial equitable share
The equitable share is the main source of revenue for meeting provincial expenditure responsibilities. The proposed revisions of R2.5 billion in 2014/15, R4.3 billion in 2015/16 and R5.1 billion in 2016/17 bring the equitable share allocations to R362.5 billion, R388 billion and R412 billion respectively for each year of the MTEF. These revisions result in the provincial equitable share increasing by 6.9 per cent between 2013/14 and 2014/15, and growing at an average annual rate of 6.7 per cent over the MTEF period. These equitable share amounts include R2.2 billion in 2014/15 and R2.3 billion in 2015/16, which were previously part of the devolution of property rate funds grant. This grant will be fully phased into the provincial equitable share from 2016/17.
Policy priorities underpinning equitable share revisions
The revisions to baseline equitable share allocations provide for personnel and policy adjustments to fund urgent government priorities identified in health and social development. The personnel adjustments provide for the carry-through costs of higher-than-anticipated inflation on personnel budgets, the upgrade of clerical positions in all sectors and the costs of occupation-specific dispensation agreements for therapists in the education sector. A total of R11.6 billion is added to the provincial equitable share over the 2014 MTEF for these personnel-related costs. Policy-related adjustments to the provincial equitable share amount to R350 million over the MTEF period. A total of R50 million is added per year to provide shelters for victims of gender-based violence and R200 million is added in 2016/17 for the rollout of the human papillomavirus vaccine (the Department of Health will roll out the vaccine through an indirect grant in 2014/15 and 2015/16).
The equitable share formula
The provincial equitable share formula is reviewed and updated with new data annually. For the 2014 MTEF, the formula has been updated with data from the 2013 mid-year population estimates published by Statistics South Africa; the 2013 preliminary data published by the Department of Basic Education on school enrolment; data from the 2012 General Household Survey for medical aid coverage; and data from the health sector and the Risk Equalisation Fund for the risk-adjusted capitation index. Because the formula is largely population-driven, the allocations capture shifts in population across provinces, which leads to changes in the relative demand for public services across these areas. The impact of these updates on the provincial equitable share is phased in over three years (2014/15 to 2016/17).
Provision for 2011 Census impact
The provincial equitable share formula was updated with 2011 Census data in 2013/14. The incorporation of new Census data for the first time in a decade resulted in significant changes. To give provinces time to adjust to their new allocations, the Census updates were phased in over three years and R4.2 billion was added as a “top-up” for provinces with declining shares over the 2013 MTEF period. As Table W1.7 shows, R1.5 billion in 2014/15 and R2.1 billion in 2015/16 of these “top-up” funds will be transferred during the 2014 MTEF.
15
2014 BUDGET REVIEW
Table W1.7 Cushioning for 2011 Census impact on provinces with declining shares in the 2014 MTEF
| | | | | | | | | | | | |
| | | 2014/15 | | | 2015/16 | | | 2016/17 | |
R thousand | | Medium-term estimates | |
Eastern Cape | | | 421 166 | | | | 685 628 | | | | — | |
Free State | | | 78 350 | | | | 171 261 | | | | — | |
Gauteng | | | — | | | | — | | | | — | |
KwaZulu-Natal | | | 656 600 | | | | 773 075 | | | | — | |
Limpopo | | | 297 127 | | | | 487 036 | | | | — | |
Mpumalanga | | | — | | | | — | | | | — | |
Northern Cape | | | — | | | | — | | | | — | |
North West | | | — | | | | — | | | | — | |
Western Cape | | | — | | | | — | | | | — | |
| | | | | | | | | | | | |
Total | | | 1 453 243 | | | | 2 117 000 | | | | — | |
| | | | | | | | | | | | |
From 2016/17, the provincial equitable share will be allocated solely through the formula, with no additions to support provinces with declining shares. Provinces must use the “top-up” support provided between 2013/14 and 2015/16 to adjust to their new baselines. Provinces may choose to retain some of the “top-up” funds allocated in 2015/16 to cover the costs of adjusting to their new baselines that will be incurred in 2016/17.
Phasing in the formula
To mitigate the impact of annual data updates on provincial equitable shares, the new shares are phased in over the three-year MTEF. An amended phase-in mechanism is being introduced in the 2014 MTEF to ensure that the weighted share of the provincial equitable share allocated to each province over the MTEF period closely follows the indicative shares for each year published in the previous MTEF.
The equitable share formula data is updated every year and a new target share for each province is calculated, which is shown in Table W1.8. The phase-in mechanism provides a smooth path towards achieving these weighted shares by the third year of the MTEF. It takes the difference between the target weighted share for each province at the end of the MTEF and the indicative allocation for 2014/15 that was published in the 2013 MTEF and closes the gap between these shares by a third in each year of the 2014 MTEF. As a result, one-third of the impact of the data updates is implemented in 2014/15, two-thirds in the indicative allocations for 2015/16 and the updates are fully implemented in the indicative allocations for 2016/17.
16
ANNEXURE W1: EXPLANATORY MEMORANDUM TO THE DIVISION OF REVENUE
Table W1.8 Implementation of the equitable share weights, 2014/15 – 2016/17
| | | | | | | | | | | | | | | | |
| | | 2014/15 | | | 2014/15 | | | 2015/16 | | | 2016/17 | |
| | | Indicative | | | | |
| | | weighted | | | | | | | | | | |
| | | shares from | | | 2014 MTEF weighted shares | |
Percentage | | 2013 MTEF | | | 3-year phasing | |
Eastern Cape | | | 14.5 | % | | | 14.4 | % | | | 14.2 | % | | | 14.0 | % |
Free State | | | 5.8 | % | | | 5.7 | % | | | 5.7 | % | | | 5.6 | % |
Gauteng | | | 18.8 | % | | | 19.1 | % | | | 19.3 | % | | | 19.5 | % |
KwaZulu-Natal | | | 21.5 | % | | | 21.5 | % | | | 21.4 | % | | | 21.3 | % |
Limpopo | | | 12.0 | % | | | 12.0 | % | | | 11.9 | % | | | 11.8 | % |
Mpumalanga | | | 8.1 | % | | | 8.1 | % | | | 8.2 | % | | | 8.2 | % |
Northern Cape | | | 2.7 | % | | | 2.7 | % | | | 2.7 | % | | | 2.7 | % |
North West | | | 6.8 | % | | | 6.8 | % | | | 6.9 | % | | | 6.9 | % |
Western Cape | | | 9.7 | % | | | 9.8 | % | | | 9.9 | % | | | 10.0 | % |
| | | | | | | | | | | | | | | | |
Total | | | 100.0 | % | | | 100.0 | % | | | 100.0 | % | | | 100.0 | % |
| | | | | | | | | | | | | | | | |
In previous MTEF periods, the previous year’s weighted shares (for example, 2013/14 shares for the 2014 MTEF) were used as the starting point for the phase-in mechanism. By using the indicative allocations for the first year of the new MTEF (2014/15) instead, the revised phase-in mechanism follows the indicative shares set out in the previous MTEF more closely and reduces the likelihood of any temporary anomalies in a province’s phase-in path (such as a decrease in its share in one year despite a consistently upward trend over the MTEF period).
Summary of the formula’s structure
The formula, shown in Table W1.9 below, consists of six components that capture the relative demand for services between provinces and take into account specific provincial circumstances. The formula’s components are neither indicative budgets nor guidelines as to how much should be spent on functions in each province or by provinces collectively. Rather, the education and health components are weighted broadly in line with historical expenditure patterns to indicate relative need. Provincial executive councils have discretion regarding the determination of departmental allocations for each function, taking into account the priorities that underpin the division of revenue.
Table W1.9 Distributing the equitable shares by province, 2014 MTEF
| | | | | | | | | | | | | | | | | | | | | | | | | | | | |
| | | Education
48% | | | Health
27% | | | Basic share
16% | | | Poverty
3% | | | Economic
activity
1% | | | Institu-
tional
5% | | | Weighted
average
100% | |
Eastern Cape | | | 15.2 | % | | | 13.4 | % | | | 12.5 | % | | | 16.1 | % | | | 7.5 | % | | | 11.1 | % | | | 14.0 | % |
Free State | | | 5.3 | % | | | 5.4 | % | | | 5.2 | % | | | 5.3 | % | | | 5.3 | % | | | 11.1 | % | | | 5.6 | % |
Gauteng | | | 17.5 | % | | | 21.5 | % | | | 24.0 | % | | | 17.2 | % | | | 34.5 | % | | | 11.1 | % | | | 19.5 | % |
KwaZulu-Natal | | | 22.6 | % | | | 22.0 | % | | | 19.7 | % | | | 22.2 | % | | | 15.7 | % | | | 11.1 | % | | | 21.3 | % |
Limpopo | | | 13.1 | % | | | 10.4 | % | | | 10.4 | % | | | 13.6 | % | | | 7.1 | % | | | 11.1 | % | | | 11.8 | % |
Mpumalanga | | | 8.5 | % | | | 7.3 | % | | | 7.8 | % | | | 9.1 | % | | | 7.0 | % | | | 11.1 | % | | | 8.2 | % |
Northern Cape | | | 2.3 | % | | | 2.1 | % | | | 2.2 | % | | | 2.2 | % | | | 2.2 | % | | | 11.1 | % | | | 2.7 | % |
North West | | | 6.5 | % | | | 6.8 | % | | | 6.8 | % | | | 8.1 | % | | | 6.5 | % | | | 11.1 | % | | | 6.9 | % |
Western Cape | | | 9.0 | % | | | 11.1 | % | | | 11.4 | % | | | 6.2 | % | | | 14.2 | % | | | 11.1 | % | | | 10.0 | % |
| | | | | | | | | | | | | | | | | | | | | | | | | | | | |
Total | | | 100.0 | % | | | 100.0 | % | | | 100.0 | % | | | 100.0 | % | | | 100.0 | % | | | 100.0 | % | | | 100.0 | % |
| | | | | | | | | | | | | | | | | | | | | | | | | | | | |
17
2014 BUDGET REVIEW
Full impact of data updates on the provincial equitable share
Table W1.10 shows the full impact of the data updates on the provincial equitable share per province. It compares the target shares for the 2013 and 2014 MTEF periods.
Table W1.10 Full impact of data updates on the equitable share
| | | | | | | | | | | | |
| | | 2013 MTEF | | | 2014 MTEF | | | Difference | |
Eastern Cape | | | 14.2 | % | | | 14.0 | % | | | -0.11 | % |
Free State | | | 5.6 | % | | | 5.6 | % | | | -0.02 | % |
Gauteng | | | 19.4 | % | | | 19.5 | % | | | 0.04 | % |
KwaZulu-Natal | | | 21.3 | % | | | 21.3 | % | | | 0.02 | % |
Limpopo | | | 11.8 | % | | | 11.8 | % | | | 0.01 | % |
Mpumalanga | | | 8.2 | % | | | 8.2 | % | | | 0.02 | % |
Northern Cape | | | 2.7 | % | | | 2.7 | % | | | -0.04 | % |
North West | | | 6.9 | % | | | 6.9 | % | | | 0.04 | % |
Western Cape | | | 10.0 | % | | | 10.0 | % | | | 0.05 | % |
| | | | | | | | | | | | |
Total | | | 100.0 | % | | | 100.0 | % | | | — | |
| | | | | | | | | | | | |
For the 2014 Budget, the formula components are set out as follows:
| | • | | An education component (48 per cent) based on the size of the school-age population (ages 5 to 17) and the number of learners (Grade R to 12) enrolled in public ordinary schools. |
| | • | | A health component (27 per cent) based on the risk profile of each province and its health system case load. |
| | • | | A basic component (16 per cent) derived from each province’s share of the national population. |
| | • | | An institutional component (5 per cent) divided equally between the provinces. |
| | • | | A poverty component (3 per cent) based on income data. This component reinforces the redistributive bias of the formula. |
| | • | | An economic output component (1 per cent) based on GDP-R data. GDP-R is a measure of regional gross domestic product produced by Statistics South Africa. |
Education component (48 per cent)
The education component uses the school-age population (5 to 17 years), based on the 2011 Census, and enrolment data drawn from the 2013 School Realities Survey conducted by the Department of Basic Education. Each of these elements is assigned a weight of 50 per cent.
Table W1.11 shows the impact of updating the education component with new enrolment data on the education component shares.
18
ANNEXURE W1: EXPLANATORY MEMORANDUM TO THE DIVISION OF REVENUE
Table W1.11 Impact of changes in school enrolment on the education component share
| | | | | | | | | | | | | | | | | | | | | | | | | | | | |
| | | | | | School enrolment | | | Changes in | | | Weighted average | | | Difference
in weighted | |
| | | Age cohort 5 –17 | | | 2012 | | | 2013 | | | enrolment | | | 2013 MTEF | | | 2014 MTEF | | | average | |
Eastern Cape | | | 1 856 317 | | | | 1 938 837 | | | | 1 927 081 | | | | -11 756 | | | | 15.3 | % | | | 15.2 | % | | | -0.09 | % |
Free State | | | 657 489 | | | | 660 966 | | | | 663 312 | | | | 2 346 | | | | 5.3 | % | | | 5.3 | % | | | -0.00 | % |
Gauteng | | | 2 231 793 | | | | 2 062 526 | | | | 2 116 391 | | | | 53 865 | | | | 17.3 | % | | | 17.5 | % | | | 0.17 | % |
KwaZulu-Natal | | | 2 758 594 | | | | 2 866 369 | | | | 2 857 959 | | | | -8 410 | | | | 22.7 | % | | | 22.6 | % | | | -0.10 | % |
Limpopo | | | 1 536 294 | | | | 1 714 518 | | | | 1 713 696 | | | | -822 | | | | 13.1 | % | | | 13.1 | % | | | -0.04 | % |
Mpumalanga | | | 1 053 846 | | | | 1 051 356 | | | | 1 049 995 | | | | -1 361 | | | | 8.5 | % | | | 8.5 | % | | | -0.03 | % |
Northern Cape | | | 288 839 | | | | 276 420 | | | | 281 500 | | | | 5 080 | | | | 2.3 | % | | | 2.3 | % | | | 0.01 | % |
North West | | | 824 724 | | | | 774 615 | | | | 787 470 | | | | 12 855 | | | | 6.5 | % | | | 6.5 | % | | | 0.03 | % |
Western Cape | | | 1 174 625 | | | | 1 034 392 | | | | 1 048 883 | | | | 14 491 | | | | 8.9 | % | | | 9.0 | % | | | 0.04 | % |
| | | | | | | | | | | | | | | | | | | | | | | | | | | | |
Total | | | 12 382 521 | | | | 12 379 999 | | | | 12 446 287 | | | | 66 288 | | | | 100.0 | % | | | 100.0 | % | | | — | |
| | | | | | | | | | | | | | | | | | | | | | | | | | | | |
Health component (27 per cent)
The health component uses a risk-adjusted capitation index based on the Risk Equalisation Fund and output data from public hospitals to estimate each province’s share of the health component. These methods work together to balance needs (risk-adjusted capitation) and demands (output component).
The health component is presented in three parts below. Table W1.12 shows the shares of the risk-adjusted component, which accounts for 75 per cent of the health component.
Table W1.12 Risk-adjusted sub-component shares
| | | | | | | | | | | | | | | | | | | | | | | | | | | | |
| | | Mid-year
population
estimates | | | Insured
population | | | Risk-
adjusted
index | | | Weighted | | | Risk-adjusted shares | | | | |
Thousand | | 2013 | | | 2012 | | | 2013 | | | population | | | 2013 | | | 2014 | | | Change | |
Eastern Cape | | | 6 620 | | | | 10.9 | % | | | 96.9 | % | | | 5 713 | | | | 13.0 | % | | | 13.1 | % | | | 0.10 | % |
Free State | | | 2 753 | | | | 18.1 | % | | | 103.3 | % | | | 2 328 | | | | 5.4 | % | | | 5.4 | % | | | -0.08 | % |
Gauteng | | | 12 728 | | | | 29.0 | % | | | 105.4 | % | | | 9 527 | | | | 22.7 | % | | | 21.9 | % | | | -0.82 | % |
KwaZulu-Natal | | | 10 457 | | | | 12.3 | % | | | 98.9 | % | | | 9 070 | | | | 20.6 | % | | | 20.9 | % | | | 0.30 | % |
Limpopo | | | 5 518 | | | | 8.0 | % | | | 91.6 | % | | | 4 652 | | | | 10.6 | % | | | 10.7 | % | | | 0.09 | % |
Mpumalanga | | | 4 128 | | | | 14.5 | % | | | 95.7 | % | | | 3 378 | | | | 7.6 | % | | | 7.8 | % | | | 0.13 | % |
Northern Cape | | | 1 163 | | | | 18.9 | % | | | 100.7 | % | | | 949 | | | | 2.3 | % | | | 2.2 | % | | | -0.13 | % |
North West | | | 3 598 | | | | 14.1 | % | | | 102.2 | % | | | 3 159 | | | | 7.2 | % | | | 7.3 | % | | | 0.11 | % |
Western Cape | | | 6 017 | | | | 25.2 | % | | | 104.0 | % | | | 4 682 | | | | 10.5 | % | | | 10.8 | % | | | 0.30 | % |
| | | | | | | | | | | | | | | | | | | | | | | | | | | | |
Total | | | 52 982 | | | | | | | | | | | | 43 459 | | | | 100.0 | % | | | 100.0 | % | | | — | |
| | | | | | | | | | | | | | | | | | | | | | | | | | | | |
The risk-adjusted sub-component estimates a weighted population in each province using the risk-adjusted capitation index, which is calculated using data from the Council for Medical Schemes’ Risk Equalisation Fund. The percentage of the population with medical aid insurance, based on the 2012 General Household Survey, is deducted from the 2013 mid-year population estimates to estimate the uninsured population per province. The risk-adjusted index, which is an index of the health risk profile of each province, is applied to this uninsured population to estimate the weighted population. Each province’s share of this weighted population is used to estimate their share of the risk-adjusted sub-component. Table W1.12 shows the change in this sub-component between 2013 and 2014.
19
2014 BUDGET REVIEW
The output sub-component, which is updated with 2011/12 and 2012/13 data obtained from the District Health Information Services, is shown in Table W1.13 below.
Table W1.13 Output sub-component shares
| | | | | | | | | | | | | | | | | | | | | | | | | | | | | | | | |
| | | | | | Primary healthcare | | | | | | Hospital workload | |
| | | | | | visits | | | | | | patient-day equivalents | |
| | | 2011/12 | | | 2012/13 | | | Average | | | Share | | | 2011/12 | | | 2012/13 | | | Average | | | Share | |
Eastern Cape | | | 18 255 | | | | 17 716 | | | | 17 986 | | | | 14.1 | % | | | 4 550 | | | | 4 373 | | | | 4 461 | | | | 14.2 | % |
Free State | | | 7 175 | | | | 7 473 | | | | 7 324 | | | | 5.7 | % | | | 1 741 | | | | 1 810 | | | | 1 776 | | | | 5.7 | % |
Gauteng | | | 22 309 | | | | 23 053 | | | | 22 681 | | | | 17.7 | % | | | 6 556 | | | | 6 578 | | | | 6 567 | | | | 20.9 | % |
KwaZulu-Natal | | | 29 139 | | | | 31 013 | | | | 30 076 | | | | 23.5 | % | | | 8 133 | | | | 8 061 | | | | 8 097 | | | | 25.8 | % |
Limpopo | | | 14 696 | | | | 14 330 | | | | 14 513 | | | | 11.4 | % | | | 2 868 | | | | 2 888 | | | | 2 878 | | | | 9.2 | % |
Mpumalanga | | | 8 760 | | | | 9 046 | | | | 8 903 | | | | 7.0 | % | | | 1 724 | | | | 1 812 | | | | 1 768 | | | | 5.6 | % |
Northern Cape | | | 3 338 | | | | 3 409 | | | | 3 373 | | | | 2.6 | % | | | 449 | | | | 471 | | | | 460 | | | | 1.5 | % |
North West | | | 7 867 | | | | 7 872 | | | | 7 870 | | | | 6.2 | % | | | 1 551 | | | | 1 570 | | | | 1 560 | | | | 5.0 | % |
Western Cape | | | 15 431 | | | | 14 728 | | | | 15 079 | | | | 11.8 | % | | | 3 759 | | | | 3 869 | | | | 3 814 | | | | 12.2 | % |
| | | | | | | | | | | | | | | | | | | | | | | | | | | | | | | | |
Total | | | 126 970 | | | | 128 639 | | | | 127 804 | | | | 100.0 | % | | | 31 331 | | | | 31 431 | | | | 31 381 | | | | 100.0 | % |
| | | | | | | | | | | | | | | | | | | | | | | | | | | | | | | | |
The output sub-component uses patient load data from the District Health Information Services. The average number of visits at primary healthcare clinics in 2011/12 and 2012/13 is calculated. Each province’s average is used to estimate their share of this part of the output component, making up 5 per cent of the health component. For hospitals, each province’s share of the total patient-day equivalents from public hospitals in 2011/12 and 2012/13 is used to estimate their share of this part of the output sub-component, making up 20 per cent of the health component. In total, the output component is 25 per cent of the health component.
Table W1.14 shows the updated health component shares for the 2014 MTEF.
Table W1.14 Health component weighted shares
| | | | | | | | | | | | | | | | | | | | | | | | |
| | | Risk- | | | Primary | | | Hospital | | | | | | | |
| | | adjusted | | | health care | | | component | | | Weighted shares | | | | |
Weight | | 75.0% | | | 5.0% | | | 20.0% | | | 2013 | | | 2014 | | | Change | |
Eastern Cape | | | 13.1 | % | | | 14.1 | % | | | 14.2 | % | | | 13.5 | % | | | 13.4 | % | | | -0.11 | % |
Free State | | | 5.4 | % | | | 5.7 | % | | | 5.7 | % | | | 5.4 | % | | | 5.4 | % | | | -0.00 | % |
Gauteng | | | 21.9 | % | | | 17.7 | % | | | 20.9 | % | | | 21.9 | % | | | 21.5 | % | | | -0.41 | % |
KwaZulu-Natal | | | 20.9 | % | | | 23.5 | % | | | 25.8 | % | | | 21.7 | % | | | 22.0 | % | | | 0.32 | % |
Limpopo | | | 10.7 | % | | | 11.4 | % | | | 9.2 | % | | | 10.3 | % | | | 10.4 | % | | | 0.11 | % |
Mpumalanga | | | 7.8 | % | | | 7.0 | % | | | 5.6 | % | | | 7.2 | % | | | 7.3 | % | | | 0.13 | % |
Northern Cape | | | 2.2 | % | | | 2.6 | % | | | 1.5 | % | | | 2.2 | % | | | 2.1 | % | | | -0.15 | % |
North West | | | 7.3 | % | | | 6.2 | % | | | 5.0 | % | | | 6.7 | % | | | 6.8 | % | | | 0.07 | % |
Western Cape | | | 10.8 | % | | | 11.8 | % | | | 12.2 | % | | | 11.1 | % | | | 11.1 | % | | | 0.03 | % |
| | | | | | | | | | | | | | | | | | | | | | | | |
Total | | | 100.0 | % | | | 100.0 | % | | | 100.0 | % | | | 100.0 | % | | | 100.0 | % | | | — | |
| | | | | | | | | | | | | | | | | | | | | | | | |
Basic component (16 per cent)
The basic component is derived from the proportion of each province’s share of the national population. This component constitutes 16 per cent of the total equitable share. For the 2014 MTEF, population data is drawn from the 2013 Mid-Year Population Estimates produced by Statistics South Africa. Table W1.15 shows the impact on the basic component’s revised weighted shares.
20
ANNEXURE W1: EXPLANATORY MEMORANDUM TO THE DIVISION OF REVENUE
Table W1.15 Impact of the changes in population on the basic component shares
| | | | | | | | | | | | | | | | | | | | | | | | | | | | |
| | | | | | Mid-year | | | | | | | | | | | | | |
| | | 2011 | | | population | | | | | | % | | | | | | | |
| | | Census | | | estimates | | | Population | | | population | | | Basic component shares | | | | |
| | | Population | | | 2013 | | | change | | | change | | | 2013 MTEF | | | 2014 MTEF | | | Change | |
Eastern Cape | | | 6 562 053 | | | | 6 620 100 | | | | 58 047 | | | | 0.9 | % | | | 12.7 | % | | | 12.5 | % | | | -0.18 | % |
Free State | | | 2 745 590 | | | | 2 753 200 | | | | 7 610 | | | | 0.3 | % | | | 5.3 | % | | | 5.2 | % | | | -0.11 | % |
Gauteng | | | 12 272 263 | | | | 12 728 400 | | | | 456 137 | | | | 3.7 | % | | | 23.7 | % | | | 24.0 | % | | | 0.32 | % |
KwaZulu-Natal | | | 10 267 300 | | | | 10 456 900 | | | | 189 600 | | | | 1.8 | % | | | 19.8 | % | | | 19.7 | % | | | -0.10 | % |
Limpopo | | | 5 404 868 | | | | 5 518 000 | | | | 113 132 | | | | 2.1 | % | | | 10.4 | % | | | 10.4 | % | | | -0.03 | % |
Mpumalanga | | | 4 039 939 | | | | 4 128 000 | | | | 88 061 | | | | 2.2 | % | | | 7.8 | % | | | 7.8 | % | | | -0.01 | % |
Northern Cape | | | 1 145 861 | | | | 1 162 900 | | | | 17 039 | | | | 1.5 | % | | | 2.2 | % | | | 2.2 | % | | | -0.02 | % |
North West | | | 3 509 953 | | | | 3 597 600 | | | | 87 647 | | | | 2.5 | % | | | 6.8 | % | | | 6.8 | % | | | 0.01 | % |
Western Cape | | | 5 822 734 | | | | 6 016 900 | | | | 194 166 | | | | 3.3 | % | | | 11.2 | % | | | 11.4 | % | | | 0.11 | % |
| | | | | | | | | | | | | | | | | | | | | | | | | | | | |
Total | | | 51 770 561 | | | | 52 982 000 | | | | 1 211 439 | | | | 2.3 | % | | | 100.0 | % | | | 100.0 | % | | | — | |
| | | | | | | | | | | | | | | | | | | | | | | | | | | | |
Institutional component (5 per cent)
The institutional component recognises that some costs associated with running a provincial government and providing services are not directly related to the size of a province’s population or the other factors included in other components. It is therefore distributed equally between provinces. It constitutes 5 per cent of the total equitable share, of which each province receives 11.1 per cent. This component benefits provinces with smaller populations, especially the Northern Cape and the North West, because the allocation per person for these provinces is much higher in this component.
Poverty component (3 per cent)
The poverty component introduces a redistributive element to the formula and is assigned a weight of 3 per cent. The poor population includes people who fall in the lowest 40 per cent of household incomes in the 2010/11 Income and Expenditure Survey. The estimated size of the poor population in each province is calculated by multiplying the proportion in that province that fall into the poorest 40 per cent of South African households by the population figure for the province from the 2013 Mid-Year Population Estimates. Table W1.16 shows the proportion of poor in each province from the Income and Expenditure Survey, the 2013 Mid-Year Population Estimates and the weighted share of the poverty component per province.
21
2014 BUDGET REVIEW
Table W1.16 Comparison of current and new poverty component weighted shares
| | | | | | | | | | | | | | | | | | | | | | | | | | | | | | | | |
| | | Income | | | Current (2013 MTEF) | | | New (2014 MTEF) | | | | |
Thousand | | and
Expenditure
Survey
2010/11 | | | 2011
Census
population | | | Poor
population | | | Weighted
shares | | | Mid-year
population
estimates
2013 | | | Poor
population | | | Weighted
shares | | | Difference in
weighted
shares | |
Eastern Cape | | | 52.0 | % | | | 6 562 | | | | 3 414 | | | | 16.3 | % | | | 6 620 | | | | 3 445 | | | | 16.1 | % | | | -0.20 | % |
Free State | | | 41.4 | % | | | 2 746 | | | | 1 137 | | | | 5.4 | % | | | 2 753 | | | | 1 140 | | | | 5.3 | % | | | -0.10 | % |
Gauteng | | | 28.9 | % | | | 12 272 | | | | 3 543 | | | | 16.9 | % | | | 12 728 | | | | 3 675 | | | | 17.2 | % | | | 0.26 | % |
KwaZulu-Natal | | | 45.3 | % | | | 10 267 | | | | 4 652 | | | | 22.2 | % | | | 10 457 | | | | 4 738 | | | | 22.2 | % | | | -0.06 | % |
Limpopo | | | 52.9 | % | | | 5 405 | | | | 2 857 | | | | 13.6 | % | | | 5 518 | | | | 2 917 | | | | 13.6 | % | | | -0.00 | % |
Mpumalanga | | | 47.3 | % | | | 4 040 | | | | 1 909 | | | | 9.1 | % | | | 4 128 | | | | 1 951 | | | | 9.1 | % | | | 0.01 | % |
Northern Cape | | | 40.8 | % | | | 1 146 | | | | 467 | | | | 2.2 | % | | | 1 163 | | | | 474 | | | | 2.2 | % | | | -0.01 | % |
North West | | | 47.9 | % | | | 3 510 | | | | 1 681 | | | | 8.0 | % | | | 3 598 | | | | 1 723 | | | | 8.1 | % | | | 0.03 | % |
Western Cape | | | 21.9 | % | | | 5 823 | | | | 1 273 | | | | 6.1 | % | | | 6 017 | | | | 1 316 | | | | 6.2 | % | | | 0.07 | % |
| | | | | | | | | | | | | | | | | | | | | | | | | | | | | | | | |
Total | | | | | | | 51 771 | | | | 20 933 | | | | 100.0 | % | | | 52 982 | | | | 21 377 | | | | 100.0 | % | | | — | |
| | | | | | | | | | | | | | | | | | | | | | | | | | | | | | | | |
Economic activity component (1 per cent)
The economic activity component is a proxy for provincial tax capacity and expenditure assignments. Given that these assignments are a relatively small proportion of provincial budgets, the component is assigned a weight of 1 per cent. For the 2014 MTEF, 2011 GDP-R data is used. Table W1.17 shows the weighted shares of the economic activity component.
Table W1.17 Current and new economic activity component weighted shares
| | | | | | | | | | | | | | | | | | | | |
| | | Current (2013 MTEF) | | | New (2014 MTEF) | | | Difference in | |
| | | GDP-R, 2010
(R million) | | | Weighted
shares | | | GDP-R, 2011
(R million) | | | Weighted
shares | | | weighted
shares | |
Eastern Cape | | | 203 993 | | | | 7.7 | % | | | 219 170 | | | | 7.5 | % | | | -0.15 | % |
Free State | | | 145 405 | | | | 5.5 | % | | | 153 284 | | | | 5.3 | % | | | -0.21 | % |
Gauteng | | | 897 553 | | | | 33.7 | % | | | 1 005 795 | | | | 34.5 | % | | | 0.75 | % |
KwaZulu-Natal | | | 420 647 | | | | 15.8 | % | | | 458 841 | | | | 15.7 | % | | | -0.08 | % |
Limpopo | | | 191 934 | | | | 7.2 | % | | | 207 308 | | | | 7.1 | % | | | -0.11 | % |
Mpumalanga | | | 187 367 | | | | 7.0 | % | | | 205 600 | | | | 7.0 | % | | | 0.01 | % |
Northern Cape | | | 61 175 | | | | 2.3 | % | | | 65 259 | | | | 2.2 | % | | | -0.06 | % |
North West | | | 177 075 | | | | 6.7 | % | | | 189 047 | | | | 6.5 | % | | | -0.17 | % |
Western Cape | | | 376 284 | | | | 14.1 | % | | | 413 235 | | | | 14.2 | % | | | 0.03 | % |
| | | | | | | | | | | | | | | | | | | | |
Total | | | 2 661 433 | | | | 100.0 | % | | | 2 917 539 | | | | 100.0 | % | | | — | |
| | | | | | | | | | | | | | | | | | | | |
Phasing of conditional grant into the provincial equitable share
The devolution of property rate funds grant will be fully phased into the provincial equitable share by 2016/17. The grant was introduced to enable provinces to take over the responsibility of paying rates and municipal charges on properties that were administered by national government on their behalf. Progress in ensuring that all provinces have records of their properties and liabilities for municipal rates means that there is no longer a need for a separate conditional grant. A grant phase-out report detailing this progress was submitted to Parliament in February 2013. From 2013/14 to 2015/16, provinces receive the same amounts they would have received from the grant, but these will be transferred as part of the equitable share and not as a separate conditional grant. From 2016/17, these funds will be allocated through the provincial equitable share formula.
22
ANNEXURE W1: EXPLANATORY MEMORANDUM TO THE DIVISION OF REVENUE
Conditional grants to provinces
There are four types of provincial conditional grants. Schedule 4A sets out general grants that supplement various programmes partly funded by provinces, such as infrastructure and central hospitals. Transfer and spending accountability arrangements differ, as more than one national or provincial department may be responsible for different outputs. Schedule 5A grants fund specific responsibilities and programmes implemented by provinces. Schedule 6A grants provide allocations-in-kind through which a national department implements projects in provinces. A schedule 7A grant provides for the swift allocation and transfer of funds to a province to help it deal with a disaster.
Changes to conditional grants
Given the challenging economic environment and fiscal constraints, government decided to reduce some underspending grants to fund key priorities. As a result, the baselines of certain conditional grants have been revised downward. However, because most of the reduced grants have a history of underspending, the impact of these reductions on service delivery should be minimised. Table W1.18 shows the revisions made to provincial conditional grants to make resources available for government priorities, and to provide for technical, policy and inflation adjustments.
23
2014 BUDGET REVIEW
Table W1.18 Revisions to conditional grant baseline allocations, 2014/15 – 2016/17
| | | | | | | | | | | | | | | | |
R million | | 2014/15 | | | 2015/16 | | | 2016/17 | | | 2014 MTEF | |
Technical revisions | | | — | | | | — | | | | — | | | | — | |
Direct transfers | | | -399 | | | | -575 | | | | 400 | | | | -575 | |
Health facility revitalisation | | | 500 | | | | 400 | | | | 400 | | | | 1 300 | |
Human settlements development | | | -899 | | | | -975 | | | | — | | | | -1 875 | |
Indirect transfers | | | 399 | | | | 575 | | | | -400 | | | | 575 | |
National health | | | -500 | | | | -400 | | | | -400 | | | | -1 300 | |
Human settlements development | | | 899 | | | | 975 | | | | — | | | | 1 875 | |
| | | | | | | | | | | | | | | | |
Additions to baseline | | | 1 373 | | | | 798 | | | | 1 251 | | | | 3 421 | |
Direct transfers | | | 1 173 | | | | 598 | | | | 1 251 | | | | 3 021 | |
Comprehensive agricultural support programme | | | 196 | | | | 14 | | | | — | | | | 209 | |
Education infrastructure | | | 53 | | | | 40 | | | | — | | | | 92 | |
Health facility revitalisation | | | 1 | | | | 1 | | | | — | | | | 2 | |
Comprehensive HIV and Aids | | | — | | | | — | | | | 1 000 | | | | 1 000 | |
Further education and training colleges | | | 31 | | | | 60 | | | | 69 | | | | 160 | |
Human settlements development | | | 365 | | | | 141 | | | | — | | | | 506 | |
Expanded public works programme integrated grant for provinces | | | — | | | | — | | | | 10 | | | | 10 | |
Social sector expanded public works programme incentive for provinces | | | — | | | | — | | | | 74 | | | | 74 | |
Provincial roads maintenance | | | 235 | | | | 178 | | | | — | | | | 414 | |
Occupational-specific dispensation therapists | | | 213 | | | | 67 | | | | — | | | | 280 | |
Substance abuse treatment | | | 29 | | | | 48 | | | | 48 | | | | 124 | |
Public transport operations | | | 50 | | | | 50 | | | | 50 | | | | 150 | |
Indirect transfers | | | 200 | | | | 200 | | | | — | | | | 400 | |
National health grant | | | 200 | | | | 200 | | | | — | | | | 400 | |
| | | | | | | | | | | | | | | | |
Reductions to baseline | | | -1 077 | | | | -1 807 | | | | -1 675 | | | | -4 559 | |
Direct transfers | | | -621 | | | | -1 043 | | | | -935 | | | | -2 599 | |
Comprehensive agricultural support programme | | | — | | | | -67 | | | | -77 | | | | -144 | |
Land care programme: poverty relief and infrastructure development | | | — | | | | -3 | | | | -3 | | | | -6 | |
Expanded public works programme integrated grant for provinces | | | -22 | | | | -25 | | | | — | | | | -47 | |
Social sector expanded public works programme incentive for provinces | | | -15 | | | | -18 | | | | — | | | | -33 | |
Human settlements development | | | -300 | | | | -300 | | | | -300 | | | | -900 | |
Education infrastructure | | | -284 | | | | -630 | | | | -555 | | | | -1 469 | |
Indirect transfers | | | -456 | | | | -764 | | | | -741 | | | | -1 960 | |
National health | | | -225 | | | | -285 | | | | -285 | | | | -794 | |
School infrastructure backlogs | | | -231 | | | | -479 | | | | -456 | | | | -1 166 | |
| | | | | | | | | | | | | | | | |
Net change to provincial allocations | | | 295 | | | | -1 009 | | | | -425 | | | | -1 138 | |
| | | | | | | | | | | | | | | | |
After accounting for the reductions and shifts from provincial direct conditional grants, net revisions to direct conditional grant baseline allocations consist of an addition of R152.3 million in 2014/15, a reduction of R1 billion in 2015/16 and an addition of R716 million in 2016/17, or a net decrease of R152 million over the MTEF period. This brings the new direct conditional grant baselines to R82 billion in 2014/15, R89.7 billion in 2015/16 and R96.2 billion in 2016/17.
Table W1.19 provides a summary of conditional grants by sector for the 2014 MTEF. More detailed information, including the framework and allocation criteria for each grant, is provided in Annexure W2 of the 2014 Division of Revenue Bill. The frameworks provide the conditions for each grant, the outputs expected, the allocation criteria used for dividing each grant between provinces and a summary of the grant’s audited outcomes for 2012/13.
24
ANNEXURE W1: EXPLANATORY MEMORANDUM TO THE DIVISION OF REVENUE
Table W1.19 Conditional grants to provinces, 2013/14 – 2016/17
| | | | | | | | | | | | | | | | | | | | |
R million | | 2013/14 | | | 2014/15 | | | 2015/16 | | | 2016/17 | | | MTEF total | |
Agriculture, Forestry and Fisheries | | | 2 152 | | | | 2 389 | | | | 2 238 | | | | 2 336 | | | | 6 963 | |
Comprehensive agricultural support programme | | | 1 604 | | | | 1 861 | | | | 1 688 | | | | 1 757 | | | | 5 306 | |
Ilima/Letsema projects | | | 438 | | | | 461 | | | | 482 | | | | 507 | | | | 1 450 | |
Land care programme: poverty relief and infrastructure development | | | 109 | | | | 68 | | | | 68 | | | | 72 | | | | 208 | |
Arts and Culture | | | 598 | | | | 1 016 | | | | 1 341 | | | | 1 412 | | | | 3 768 | |
Community library services | | | 598 | | | | 1 016 | | | | 1 341 | | | | 1 412 | | | | 3 768 | |
Basic Education | | | 11 836 | | | | 13 170 | | | | 15 827 | | | | 16 662 | | | | 45 659 | |
Dinaledi schools | | | 109 | | | | 111 | | | | 116 | | | | 122 | | | | 350 | |
Education infrastructure | | | 6 160 | | | | 6 929 | | | | 9 469 | | | | 10 038 | | | | 26 436 | |
HIV and Aids (life skills education) | | | 204 | | | | 221 | | | | 226 | | | | 238 | | | | 686 | |
National school nutrition programme | | | 5 173 | | | | 5 462 | | | | 5 704 | | | | 6 006 | | | | 17 172 | |
Technical secondary schools recapitalisation | | | 190 | | | | 233 | | | | 244 | | | | 257 | | | | 735 | |
Occupational-specific dispensation for education sector therapists | | | — | | | | 213 | | | | 67 | | | | — | | | | 280 | |
Cooperative Governance and Traditional Affairs | | | 38 | | | | 197 | | | | 204 | | | | 215 | | | | 617 | |
Provincial disaster | | | 38 | | | | 197 | | | | 204 | | | | 215 | | | | 617 | |
Health | | | 27 686 | | | | 30 111 | | | | 32 484 | | | | 35 184 | | | | 97 780 | |
Comprehensive HIV and Aids | | | 10 534 | | | | 12 311 | | | | 13 957 | | | | 15 697 | | | | 41 965 | |
Health facility revitalisation | | | 5 291 | | | | 5 240 | | | | 5 389 | | | | 5 652 | | | | 16 281 | |
Health professions training and development | | | 2 190 | | | | 2 322 | | | | 2 429 | | | | 2 557 | | | | 7 308 | |
National tertiary services | | | 9 620 | | | | 10 168 | | | | 10 636 | | | | 11 200 | | | | 32 004 | |
National health insurance | | | 51 | | | | 70 | | | | 74 | | | | 78 | | | | 222 | |
Higher Education and Training | | | 2 454 | | | | 2 631 | | | | 2 819 | | | | 2 974 | | | | 8 424 | |
Further education and training colleges | | | 2 454 | | | | 2 631 | | | | 2 819 | | | | 2 974 | | | | 8 424 | |
Human Settlements | | | 17 028 | | | | 17 084 | | | | 18 533 | | | | 20 410 | | | | 56 027 | |
Human settlements development | | | 17 028 | | | | 17 084 | | | | 18 533 | | | | 20 410 | | | | 56 027 | |
Public Works | | | 614 | | | | 607 | | | | 624 | | | | 786 | | | | 2 017 | |
Expanded public works programme integrated grant for provinces | | | 357 | | | | 349 | | | | 357 | | | | 412 | | | | 1 117 | |
Social sector expanded public works programme incentive for provinces | | | 258 | | | | 258 | | | | 268 | | | | 375 | | | | 900 | |
Social Development | | | — | | | | 29 | | | | 48 | | | | 48 | | | | 124 | |
Substance abuse treatment | | | — | | | | 29 | | | | 48 | | | | 48 | | | | 124 | |
Sport and Recreation South Africa | | | 498 | | | | 526 | | | | 550 | | | | 579 | | | | 1 654 | |
Mass participation and sport development | | | 498 | | | | 526 | | | | 550 | | | | 579 | | | | 1 654 | |
Transport | | | 13 090 | | | | 14 194 | | | | 15 005 | | | | 15 610 | | | | 44 809 | |
Provincial roads maintenance | | | 8 538 | | | | 9 361 | | | | 9 952 | | | | 10 292 | | | | 29 606 | |
Public transport operations | | | 4 553 | | | | 4 833 | | | | 5 053 | | | | 5 318 | | | | 15 203 | |
| | | | | | | | | | | | | | | | | | | | |
Total direct conditional grants | | | 75 995 | | | | 81 955 | | | | 89 672 | | | | 96 215 | | | | 267 842 | |
| | | | | | | | | | | | | | | | | | | | |
Indirect transfers | | | 2 693 | | | | 5 413 | | | | 5 044 | | | | 4 127 | | | | 14 583 | |
Basic Education | | | 1 956 | | | | 2 939 | | | | 2 433 | | | | 2 611 | | | | 7 982 | |
School infrastructure backlogs | | | 1 956 | | | | 2 939 | | | | 2 433 | | | | 2 611 | | | | 7 982 | |
Health | | | 737 | | | | 1 575 | | | | 1 635 | | | | 1 516 | | | | 4 726 | |
National health | | | 731 | | | | 1 575 | | | | 1 635 | | | | 1 516 | | | | 4 726 | |
2014 African Nations Championship: health and medical services | | | 6 | | | | — | | | | — | | | | — | | | | — | |
Human Settlements | | | — | | | | 899 | | | | 975 | | | | — | | | | 1 875 | |
Human settlements development | | | — | | | | 899 | | | | 975 | | | | — | | | | 1 875 | |
| | | | | | | | | | | | | | | | | | | | |
25
2014 BUDGET REVIEW
Agriculture grants
The comprehensive agricultural support programme aims to support newly established and emerging farmers, in particular subsistence, smallholder and previously disadvantaged farmers. From 2014/15, 70 per cent of the grant will be allocated to the production of livestock and crops. The grant also aims to expand farm infrastructure and provide support for dipping, fencing and rehabilitating viable irrigation schemes. Allocations in 2014/15 and 2015/16 include R507.4 million for the repair of flood damage to agricultural infrastructure. The grant amounts to R5.3 billion over the 2014 MTEF period.
The land care programme grant: poverty relief and infrastructure development aims to improve productivity and the sustainable use of natural resources. Provinces are also encouraged to use this grant to create jobs through the Expanded Public Works Programme. Over the medium term, R207.5 million is allocated to this grant.
The Ilima/Letsema projects grant aims to boost food production by helping previously disadvantaged farming communities. After the Department of Agriculture, Forestry and Fisheries has tested the new approach, it will make this grant subject to the standard operating procedure for farmer support. This grant is allocated R1.4 billion over the MTEF period.
Arts and culture grant
The community library services grant, administered by the Department of Arts and Culture, aims to help South Africans access knowledge and information so that their socioeconomic situation can be improved. The grant is allocated to the relevant provincial department and administered by that department or through a service-level agreement with municipalities. At least 20 per cent of the funds added to this grant in the 2013 MTEF must be used to set up dual service points in collaboration with provincial departments of basic education. Dual service points are libraries for both schools and the general public. The rest of the additional funding must be used to shift the libraries function between provinces and municipalities. The total grant amounts to R3.8 billion over the next three years.
Basic education grants
The education infrastructure grant is used by provinces to construct, maintain and refurbish education infrastructure and schools. The grant totals R26.4 billion over the MTEF period, which includes R92.4 million previously allocated for the 2014 MTEF to repair school infrastructure damaged by floods. The infrastructure conditional grants are being reformed and incentives will be introduced to promote improved performance. This grant, together with the health facility revitalisation grant, will be the first grants to form part of this new approach. The reforms require provinces to meet certain prerequisites and have their infrastructure plans approved before they can receive allocations. The full amounts available for this grant in 2015/16 and 2016/17 have not been indicatively allocated per province because not all provinces have met these requirements. The remaining funds for the outer years of the MTEF are reflected as unallocated. Further details on these reforms are discussed in part 6 of this annexure.
The national school nutrition programme seeks to improve the nutrition of poor school children, enhance active learning capacity and improve attendance in schools. It provides a free daily meal to pupils in the poorest 60 per cent of schools (quintile 1 to 3). This grant is allocated R17.2 billion over the MTEF period.
The technical secondary schools recapitalisation grant provides for equipment and facilities in technical high schools. This grant has been extended to 2016/17 to address the growing need to recapitalise technical schools identified in provincial needs assessments. This grant is allocated R734.9 million over the 2014 MTEF period.
The Dinaledi schools grant, started in 2011/12, supports Dinaledi schools to improve the quality of learner performance in mathematics, physical science, life sciences and English as a first additional language. Dinaledi schools are schools in disadvantaged communities that perform well in mathematics and physical science. The grant is allocated R349.9 million over the MTEF period.
26
ANNEXURE W1: EXPLANATORY MEMORANDUM TO THE DIVISION OF REVENUE
The HIV and Aids (life skills education) programme grant provides for life skills training, and sexuality and HIV/AIDS education in primary and secondary schools. It is fully integrated into the school system, with learner and teacher support materials provided for Grade 1 to 9. This grant is allocated R685.8 million over the MTEF period.
The school infrastructure backlogs grant is an indirect grant to provinces that was introduced in 2011 as a temporary, high-impact grant. The national Department of Basic Education uses this grant to build and upgrade schools on behalf of provinces to address inappropriate structures and access to basic services. The grant is allocated R8 billion over the 2014 MTEF period.
The occupational-specific dispensation for education sector therapists grant provides funds for provinces to implement the occupation-specific dispensation agreement for therapists, counsellors and psychologists in the education sector. The grant is allocated for two years (2014/15 and 2015/16) while back-pay is being funded and new remuneration levels are normalised. From 2016/17, the funds will be allocated as part of the provincial equitable share. The grant has been allocated R280 million over the MTEF period.
Cooperative governance grant
The provincial disaster grant is administered by the National Disaster Management Centre in the Department of Cooperative Governance as an unallocated grant to provincial government at the start of the financial year. The grant allows for an immediate (in-year) release of funds to be disbursed by the centre after a disaster is declared, without the need for the transfers to first be gazetted. Over the MTEF period, R616.9 million is available for disbursement through this grant.
Health grants
The national tertiary services grant provides strategic funding to enable provinces to plan, modernise and transform tertiary hospital service delivery in line with national policy objectives. The grant operates in 26 hospitals across the nine provinces, concentrated in the urban areas of Gauteng and the Western Cape. These provinces receive the largest shares of the grant as they provide the largest proportion of high-level, sophisticated services for the benefit of the country’s health sector. This grant is allocated R32 billion over the MTEF period.
The health facility revitalisation grant funds the construction and maintenance of health infrastructure. This grant was created in 2013/14 through the merger of three previous grants: the health infrastructure grant, the hospital revitalisation grant and the nursing colleges and schools grant. In 2013/14, the grant had separate ring-fenced components corresponding to the previous grants that it replaced. From 2014/15, these components fall away, giving even greater flexibility to provinces to shift funds between projects during the year so that delays in one project do not result in underspending on the grant as a whole. The grant funds a wide range of health infrastructure projects, including large projects to modernise hospital infrastructure and equipment, general maintenance and infrastructure projects at smaller hospitals and the refurbishment and upgrading of nursing colleges and schools.
In the 2014 MTEF, R1.3 billion is added to this grant from the national health grant (an indirect grant) to enable provinces to accelerate and complete infrastructure projects under way. This grant also forms part of the reforms to provincial infrastructure grants that affect the education infrastructure grant. As detailed above, the reforms require provinces to meet certain prerequisites and have their infrastructure plans approved before they can receive allocations. The full amounts available for this grant in 2015/16 and 2016/17 have not been indicatively allocated per province because not all provinces have met these requirements. The remaining funds for the outer years of the MTEF are reflected as unallocated. The grant is allocated R16.3 billion over the MTEF period.
The health professions training and development grant funds the training of health professionals, and the development and recruitment of medical specialists. It enables the shifting of teaching activities from central to regional and district hospitals. The grant is allocated R7.3 billion over the medium term.
27
2014 BUDGET REVIEW
The comprehensive HIV and Aids grant enables the health sector respond to HIV/AIDS. It supports prevention programmes and specific interventions, including voluntary counselling and testing, prevention of mother-to-child transmission, post-exposure prophylaxis, antiretroviral treatment and home-based care. In addition to substantial increases to this grant and the provincial equitable share over the previous four MTEF periods, R1 billion is added to the grant in 2016/17 to cover the increased antiretroviral treatment take-up rate. This brings the baseline over the MTEF period to R42 billion.
The national health insurance grant funds the national health insurance pilots introduced in 2012/13, which aim to strengthen primary healthcare for the implementation of national health insurance. Ten districts have been selected as pilot sites to test interventions that aim to strengthen health systems and improve performance. Over the 2014 MTEF period, the grant has been allocated R221.9 million. This grant is complemented by the national health insurance window within the national health grant.
The national health grant is an indirect grant introduced in 2013/14, which is spent by the Department of Health on behalf of provinces. The grant has three components, one to support infrastructure projects, a second to support the national health insurance scheme pilot sites and a third to support the rollout of the human papillomavirus vaccine. The infrastructure component will be used to accelerate construction, maintenance, upgrading and rehabilitation of new and existing health infrastructure, and to supplement expenditure on infrastructure delivered through public-private partnerships. The second component will be used to contract general practitioners from the private sector for national health insurance sites. It will also support 10 central hospitals to strengthen their patient information systems and develop and pilot alternative hospital reimbursement tools. The human papillomavirus vaccine component is allocated for two years (2014/15 and 2015/16), and will be used to support provincial health departments with the rollout of this vaccine. Funds for the vaccine have been added to the provincial equitable share in 2016/17. The grant is allocated R4.7 billion over the MTEF period.
Higher education and training grant
The further education and training colleges grant was introduced in 2010/11 to protect provincial spending on these colleges while the legislative processes required to shift this function to national government are completed. From 2013/14, a portion of the grant was transferred directly to colleges as a subsidy from the Department of Higher Education and Training. An amount of R159.9 million has been added for the carry-through cost of increased employee compensation over the MTEF period. The total allocations are R2.6 billion in 2014/15, R2.8 billion in 2015/16 and R3 billion in 2016/17, bringing the total value of this grant to R8.4 billion over the MTEF period.
Human settlements grant
The human settlements development grant seeks to establish habitable, stable and sustainable human settlements in which all citizens have access to social and economic amenities. The formula used to allocate the grant was reviewed during 2013 and a revised formula will be introduced from 2014/15 to ensure closer alignment between provincial allocations and the number of households with inadequate housing in each province. The new formula will be phased in over two years (2014/15 and 2015/16) to give provinces time to adjust to their new allocations.
Funds have also been added to the human settlements development grant to accelerate the upgrading of informal settlements in mining towns. A total of R2.4 billion is allocated over the 2014 MTEF period to 21 such towns in six provinces with significant informal settlement challenges and where a high proportion of their economic activity is based on the natural resources sector. A total of R325 million is also allocated over the MTEF period to repair infrastructure damaged by floods.
Government has prioritised the eradication of bucket sanitation systems. Amounts of R899.2 million in 2014/15 and R975.4 million in 2015/16 have been shifted into a new indirect version of the human settlements development grant so that the Department of Human Settlements can complete infrastructure on behalf of provinces. This indirect grant will focus on improving sanitation in areas where housing projects did not adequately provide for decent sanitation systems.
28
ANNEXURE W1: EXPLANATORY MEMORANDUM TO THE DIVISION OF REVENUE
The human settlements function is due to be assigned to six metropolitan municipalities in 2014, in line with government’s Outcome 8 target. When a municipality is assigned the function, all further human settlements development grant allocations for that city will be transferred directly to the municipality instead of the province. The grant’s allocation totals R56 billion over the 2014 MTEF period.
Public works grants
The expanded public works programme integrated grant for provinces was revised in 2012 to be a schedule 5A grant. Allocations are now made available upfront based on meeting job targets in the preceding financial year rather than the in-year performance measures used previously. Transfers depend on provincial departments reporting on jobs created through the Expanded Public Works Programme and implementing labour-intensive projects. This grant is allocated R1.1 billion over the MTEF period.
The social sector expanded public works programme incentive grant for provinces rewards provinces for creating jobs in the preceding financial year in the areas of home-based care, early childhood development, adult literacy and numeracy, community safety and security, and sports programmes. The grant’s allocation model has been amended to provide greater incentives for provincial departments to participate in the Expanded Public Works Programme and to measure the performance of each province relative to its peers and provide additional incentives to those that perform well. The revised model will be implemented from the 2014 MTEF onwards. This grant is allocated R900.2 million over the MTEF period.
Social development grant
The substance abuse treatment grant is a new grant administered by the Department of Social Development. It will run for three years before it is incorporated into the provincial equitable share. This grant aims to strengthen the harm-reduction programme by building public substance abuse treatment facilities in the four provinces that do not already have such facilities: Eastern Cape, Free State, Northern Cape and North West. The grant has been allocated R124 million over the 2014 MTEF period.
Sport and recreation South Africa grant
The mass participation and sport development grant aims to increase and sustain mass participation in sport and recreational activities in provinces, with greater emphasis on provincial and district academies. This grant is allocated R1.7 billion over the MTEF period.
Transport grants
The public transport operations grant subsidises commuter bus services. It supports provinces to ensure that contractual obligations are met and services are efficiently provided. The public transport contracting and regulatory functions may be assigned to certain metropolitan municipalities during 2014/15. If this takes place, funds for this grant will be transferred directly to the assigned municipality. The grant is allocated R15.2 billion over the MTEF period.
The provincial roads maintenance grant consists of three components. The largest component enables provinces to expand their maintenance activities. The other components allow provinces to repair roads damaged by floods and rehabilitate roads that are heavily used in support of electricity production. Grant allocations are determined using a new formula based on provincial road networks, road traffic and weather conditions. These factors reflect the different costs of maintaining road networks in each province. The grant requires provinces to follow best practices for planning and to use and regularly update road asset management systems. From 2015/16, the grant will be based on performance. The model’s indicators – vehicle operating costs and remaining asset lifespan – have been finalised and the performance component will inform future grant allocations. The total allocation for the MTEF is R29.6 billion. This includes allocations of R602.3 million and R178.4 million in the first two years of the 2014 MTEF for the repair of infrastructure damaged by floods. In addition, R803 million in 2014/15 and R840 million in 2015/16 has been allocated to repair roads that are heavily used in support of electricity production.
29
2014 BUDGET REVIEW
¢ Part 5: Local government fiscal framework and allocations
The local government fiscal framework responds to the constitutional assignment of powers and functions to this sphere of government. The framework refers to all resources available to municipalities to meet their expenditure responsibilities. National transfers account for a relatively small proportion of the local government fiscal framework, with the majority of local government revenues being raised by municipalities themselves through their substantial revenue-raising powers, including property rates and service charges. However, the proportion of revenue coming from transfers and own revenues varies dramatically across municipalities, with poor rural municipalities receiving most of their revenue from transfers, while urban municipalities raise the majority of their own revenues. This differentiation in the way municipalities are funded will continue in the period ahead.
The 2013 division of revenue saw several major changes to the local government fiscal framework, including the introduction of a new formula for the local government equitable share, several new conditional grants and the use of updated data from the 2011 Census in allocating the municipal infrastructure grant. As several of these changes are still being phased in over the next few years, fewer changes are proposed in the 2014 MTEF. A review of local government conditional grants for infrastructure (discussed in part 6 of this annexure) is also likely to result in further changes in future years.
This section outlines the transfers made to local government and how these funds are distributed between municipalities. Funds raised by national government are transferred to municipalities through conditional and unconditional grants. National transfers to municipalities are published to enable them to plan fully for their 2014/15 budgets, and to promote better accountability and transparency by ensuring that all national allocations are included in municipal budgets.
Changes to local government allocations
After accounting for all reductions and additions, direct transfers to local government decrease by a net amount of R3.8 billion in the 2014 MTEF. Indirect transfers to local government (allocations spent by national departments on behalf of municipalities) increase by R2.3 billion over the MTEF period, bringing the total decrease in local government allocations to R1.6 billion.
Changes to individual conditional grants are discussed in more detail below, including a new conditional grant to fund capacity in cities to manage the development of human settlements. The human settlements and public transport functions may be assigned to selected metropolitan municipalities during 2014/15. This will result in the funds for these functions – currently allocated to provinces and described in part 4 of this annexure – being transferred directly to affected municipalities.
Government’s commitment to the expenditure limits set out in the 2013 Budget means that some items have to be reduced to make funding available for national priorities. As a result, the baselines of several conditional grants have been revised downward. Because these revisions are made to grants with a history of underspending, the impact on service delivery is minimised. Table W1.20 shows the reductions made to local government conditional grants to make resources available, as well as the technical revisions and additions to local government allocations over the 2014 MTEF period. No reductions were made to the local government equitable share.
30
ANNEXURE W1: EXPLANATORY MEMORANDUM TO THE DIVISION OF REVENUE
Table W1.20 Revisions to direct and indirect transfers to local government, 2014/15 – 2016/17
| | | | | | | | | | | | | | | | |
R million | | 2014/15 | | | 2015/16 | | | 2016/17 | | | 2014 MTEF
Total
revisions | |
Technical adjustments | | | -580 | | | | -1 000 | | | | -1 000 | | | | -2 580 | |
Direct transfers | | | -1 050 | | | | -1 359 | | | | -1 512 | | | | -3 921 | |
Municipal water infrastructure | | | -525 | | | | -1 292 | | | | -1 512 | | | | -3 328 | |
Integrated national electrification programme | | | -460 | | | | — | | | | — | | | | -460 | |
Public transport infrastructure | | | -158 | | | | -181 | | | | -455 | | | | -794 | |
Public transport network operations | | | 158 | | | | 181 | | | | 455 | | | | 794 | |
Rural households infrastructure | | | -66 | | | | -67 | | | | — | | | | -133 | |
Indirect transfers | | | 470 | | | | 359 | | | | 512 | | | | 1 341 | |
Municipal water infrastructure | | | 525 | | | | 1 292 | | | | 1 512 | | | | 3 328 | |
Integrated national electrification programme | | | 460 | | | | — | | | | — | | | | 460 | |
Rural households infrastructure | | | 66 | | | | 67 | | | | — | | | | 133 | |
Regional bulk infrastructure | | | -580 | | | | -1 000 | | | | -1 000 | | | | -2 580 | |
| | | | | | | | | | | | | | | | |
Additions to baselines | | | 526 | | | | 788 | | | | 945 | | | | 2 259 | |
Direct transfers | | | 442 | | | | 438 | | | | 445 | | | | 1 325 | |
Integrated city development | | | 105 | | | | 116 | | | | 135 | | | | 356 | |
Municipal disaster recovery | | | 37 | | | | 22 | | | | — | | | | 59 | |
Municipal human settlements capacity | | | 300 | | | | 300 | | | | 300 | | | | 900 | |
Expanded public works programme integrated grant for municipalities | | | — | | | | — | | | | 10 | | | | 10 | |
Indirect transfers | | | 84 | | | | 350 | | | | 500 | | | | 934 | |
Regional bulk infrastructure | | | 84 | | | | 350 | | | | 500 | | | | 934 | |
| | | | | | | | | | | | | | | | |
Reductions to baseline | | | -156 | | | | -501 | | | | -594 | | | | -1 251 | |
Direct transfers | | | -156 | | | | -501 | | | | -594 | | | | -1 251 | |
Municipal infrastructure | | | — | | | | -350 | | | | -500 | | | | -850 | |
Urban settlements development | | | -50 | | | | -45 | | | | -35 | | | | -130 | |
Expanded public works programme integrated grant for municipalities | | | -38 | | | | -42 | | | | — | | | | -80 | |
Infrastructure skills development | | | -50 | | | | -50 | | | | -50 | | | | -150 | |
Energy efficiency and demand-side management | | | -19 | | | | -14 | | | | -9 | | | | -41 | |
| | | | | | | | | | | | | | | | |
Net change to local government allocations | | | -210 | | | | -713 | | | | -649 | | | | -1 572 | |
| | | | | | | | | | | | | | | | |
Transfers to local government
Over the 2014 MTEF period, R296 billion will be transferred directly to local government and a further R27.4 billion has been allocated to indirect grants. Direct transfers to local government in 2014/15 account for 8.9 per cent of national government’s non-interest expenditure. When indirect transfers are added to this, total spending on local government rises to 9.5 per cent of national non-interest expenditure. The value of direct transfers to local government grows at an average annual rate of 7.9 per cent over the MTEF period, which is above projected inflation.
31
2014 BUDGET REVIEW
Table W1.21 Transfers to local government, 2010/11 – 2016/17
| | | | | | | | | | | | | | | | | | | | | | | | | | | | |
| | | 2010/11 | | | 2011/12 | | | 2012/13 | | | 2013/14 | | | 2014/15 | | | 2015/16 | | | 2016/17 | |
| | | | | | | | | | | | Revised | | | | |
R million | | Outcome | | | estimate | | | Medium-term estimates | |
Direct transfers | | | 60 905 | | | | 68 251 | | | | 76 430 | | | | 83 670 | | | | 90 815 | | | | 100 047 | | | | 105 187 | |
Equitable share and related | | | 30 541 | | | | 33 173 | | | | 37 139 | | | | 39 789 | | | | 44 490 | | | | 50 208 | | | | 52 869 | |
Equitable share formula1 | | | 26 761 | | | | 29 289 | | | | 32 747 | | | | 35 093 | | | | 39 410 | | | | 44 895 | | | | 47 282 | |
RSC levy replacement | | | 3 492 | | | | 3 544 | | | | 3 733 | | | | 3 930 | | | | 4 146 | | | | 4 337 | | | | 4 567 | |
Support for councillor remuneration and ward committees | | | 288 | | | | 340 | | | | 659 | | | | 766 | | | | 935 | | | | 976 | | | | 1 020 | |
General fuel levy sharing with metros | | | 7 542 | | | | 8 573 | | | | 9 040 | | | | 9 613 | | | | 10 190 | | | | 10 659 | | | | 11 224 | |
Conditional grants | | | 22 822 | | | | 26 505 | | | | 30 251 | | | | 34 268 | | | | 36 135 | | | | 39 181 | | | | 41 094 | |
Infrastructure | | | 20 871 | | | | 24 643 | | | | 27 923 | | | | 31 053 | | | | 32 582 | | | | 35 324 | | | | 36 722 | |
Capacity building and other | | | 1 951 | | | | 1 862 | | | | 2 329 | | | | 3 214 | | | | 3 553 | | | | 3 857 | | | | 4 372 | |
Indirect transfers | | | 2 939 | | | | 2 770 | | | | 4 956 | | | | 5 697 | | | | 7 726 | | | | 9 467 | | | | 10 221 | |
Infrastructure | | | 2 682 | | | | 2 553 | | | | 4 823 | | | | 5 558 | | | | 7 584 | | | | 9 316 | | | | 10 062 | |
Capacity building and other | | | 257 | | | | 217 | | | | 133 | | | | 139 | | | | 142 | | | | 151 | | | | 159 | |
| | | | | | | | | | | | | | | | | | | | | | | | | | | | |
Total | | | 63 844 | | | | 71 021 | | | | 81 386 | | | | 89 367 | | | | 98 541 | | | | 109 514 | | | | 115 408 | |
| | | | | | | | | | | | | | | | | | | | | | | | | | | | |
| 1. | Outcome figures for the equitable share reflect amounts transferred after funds have been withheld to offset underspending by municipalities on conditional grants |
The local government equitable share
In terms of section 227 of the Constitution, local government is entitled to an equitable share of nationally raised revenue to enable it to provide basic services and perform its allocated functions. The local government equitable share is an unconditional transfer that supplements the revenue that municipalities can raise themselves (including property rates and service charges). The equitable share provides funding for municipalities to deliver free basic services to poor households and subsidises the cost of administration and other core services for those municipalities that have the least potential to cover these costs from their own revenues.
Over the 2014 MTEF period, the local government equitable share, including the RSC/JSB levies replacement grant and special support for councillor remuneration and ward committees, is worth R147.6 billion – R44.5 billion in 2014/15, R50.2 billion in 2015/16 and R52.9 billion in 2016/17.
Formula for allocating the local government equitable share
The share of national revenue allocated to local government through the equitable share is determined in the national budget process and endorsed by Cabinet (the vertical division). Local government’s equitable share is divided among the country’s 278 municipalities using a formula (the horizontal division) to ensure objectivity.
A new formula for the local government equitable share was introduced in 2013/14, following a review of the previous formula by the National Treasury, the Department of Cooperative Governance and SALGA, in partnership with the FFC and Statistics South Africa. The new formula is based on data from the 2011 Census, which resulted in major changes to some allocations. As a result, new allocations are being phased in over a five year period, ending in 2017/18.
The principles and objectives of the local government equitable share formula were set out in detail in the Explanatory Memorandum to the 2013 Division of Revenue.
Structure of the local government equitable share formula
The formula uses demographics and other data to determine each municipality’s share of the local government equitable share. It has three parts, made up of five components:
32
ANNEXURE W1: EXPLANATORY MEMORANDUM TO THE DIVISION OF REVENUE
| | • | | The first part of the formula consists of the basic services component, which provides for the cost of free basic services for poor households. |
| | • | | The second part enables municipalities with limited own resources to afford basic administrative and governance capacity, and perform core municipal functions. It does this through three components: |
| | • | | The institutional component provides a subsidy for basic municipal administrative costs. |
| | • | | The community services component provides funds for core municipal services not included under basic services. |
| | • | | The revenue adjustment factor ensures that funds from this part of the formula are only provided to municipalities with limited potential to raise their own revenue. Municipalities that are least able to fund these costs from their own revenues should receive the most funding. |
| | • | | The third part of the formula provides predictability and stability through a correction and stabilisation factor, which ensures that all of the formula’s guarantees can be met. |
Each of these components is described in detail in the subsections that follow. The formula’s structure is summarised in the box below.
Structure of the local government equitable share formula
LGES = BS + (I + CS)xRA ± C
where
LGES is the local government equitable share
BS is the basic services component
I is the institutional component
CS is the community services component
RA is the revenue adjustment factor
C is the correction and stabilisation factor
The basic services component
This component helps municipalities provide free basic water, sanitation, electricity and refuse removal services to households that fall below an affordability threshold. Municipalities prefer the formula’s affordability measure (used to determine how many households should be targeted for free basic services) to be based on the level of two state old age pensions. When the 2011 Census was conducted, the state old age pension was worth R1 140 per month, which means that two old age pensions were worth R2 280 per month. A monthly household income of R2 300 per month (in 2011) has therefore been used to define the formula’s affordability threshold. Statistics South Africa has calculated that 59 per cent of all households in South Africa fall below this income threshold. This threshold is not an official poverty line or a required level to be used by municipalities in their own indigence policies – if municipalities choose to provide fewer households with free basic services than they are funded for through the local government equitable share, then their budget documentation should clearly set out why they have made this choice and how they have consulted with their community during their budget process.
To account for the growth in households each year, the number of households per municipality is updated annually based on the growth in households reflected in each province in the General Household Survey conducted by Statistics South Africa. To account for the likelihood that municipalities within a province will grow at different rates, the growth rate of each municipality is based on the rate it experienced in the period between the 2001 and 2011 Censuses. However, the total number of households per province is rebalanced to match the provincial total in the General Household Survey. Statistics South Africa has advised the National Treasury that in the absence of official municipal level household estimates, this is a credible method of estimating the household numbers per municipality needed for the formula. Statistics South Africa is researching possible methods for producing municipal-level data estimates. These estimates may be used to inform equitable share allocations in future.
33
2014 BUDGET REVIEW
The basic services component provides a subsidy of R293 per month in 2014/15 for the cost of providing basic services to each of these households. The subsidy includes funding for the provision of free basic water (6 kilolitres per poor household per month), energy (50 kilowatt-hours per month) and sanitation and refuse (based on service levels defined by national policy). The monthly amount provided for each service is detailed in Table W1.22 and includes an allocation of 10 per cent for service maintenance costs.
Table W1.22 Amounts per basic service allocated through the local government equitable share
| | | | | | | | | | | | | | | | |
| | | Allocation per household below
affordability threshold | | | Total allocation | |
| | | (Rands) | | | per service | |
| | | Operations | | | Maintenance | | | Total | | | (R millions) | |
Energy | | | 54.20 | | | | 6.02 | | | | 60.22 | | | | 6 289 | |
Water | | | 83.78 | | | | 9.31 | | | | 93.09 | | | | 9 722 | |
Sanitation | | | 68.40 | | | | 7.60 | | | | 76.00 | | | | 7 937 | |
Refuse | | | 57.34 | | | | 6.37 | | | | 63.71 | | | | 6 654 | |
| | | | | | | | | | | | | | | | |
Total basic services | | | 263.72 | | | | 29.30 | | | | 293.03 | | | | 30 603 | |
| | | | | | | | | | | | | | | | |
The formula uses the fairest estimates of the average costs of providing each service that could be derived from available information. More details of how the costs were estimated can be found in the discussion paper on the proposed structure of the new local government equitable share formula (available at: http://mfma.treasury.gov.za/Media_Releases/LGESDiscussions/Pages/default.aspx).
The per household allocation for each of the basic services in Table W1.22 is updated annually based on the following:
| | • | | The electricity cost estimate is made up of bulk and other costs. Bulk costs are updated based on the multi-year price determination approved by the National Energy Regulator of South Africa and other costs are updated based on the National Treasury’s inflation projections. |
| | • | | The water cost estimate is also made up of bulk and other costs. Bulk costs are updated based on the weighted average increase in bulk tariffs charged by water boards (although not all municipalities purchase bulk water from water boards, their price increases serve as a proxy for the cost increases for all municipalities). Other costs are updated based on the National Treasury’s inflation projections. |
| | • | | The costs for sanitation and refuse are updated based on the National Treasury’s inflation projections. |
The allocations for each service for 2015/16 and 2016/17 are based on forward projections of the cost factors described above.
The basic services component allocation to each municipality is calculated by multiplying the monthly subsidy per household by the updated number of households below the affordability threshold in each municipal area.
The basic services component
BS = basic services subsidy x number of poor households
Funding for each basic service is allocated to the municipality (metro, district or local) that is authorised to provide that service. If another municipality provides a service on behalf of the authorised municipality, it should transfer funds to the provider in terms of section 28 of the Division of Revenue Act. The basic services component is worth R30.6 billion in 2014/15 and accounts for 77.7 per cent of the value of the local government equitable share.
34
ANNEXURE W1: EXPLANATORY MEMORANDUM TO THE DIVISION OF REVENUE
The institutional component
To provide basic services to households, municipalities need to be able to run a basic administration. Most municipalities should be able to fund the majority of their administration costs through own revenues, but because poor households will not be able to contribute, the equitable share includes an institutional support component to help meet some of these costs. Because this component should support municipalities with limited own-revenue-raising abilities, a revenue adjustment factor is applied to ensure that a larger proportion of the allocation is received by municipalities with less potential to raise their own revenue. The revenue adjustment factor is described in more detail later in this annexure.
This component consists of a base allocation of R5.3 million, which goes to every municipality, and an additional amount that is based on the number of council seats in each municipality. This reflects the relative size of a municipality’s administration and is not intended to fund the costs of councillors only (the number of seats recognised for the formula is determined by the Minister of Cooperative Governance and Traditional Affairs for elections and composition). The base component acknowledges that there are some fixed costs that all municipalities face.
The institutional component
I = base allocation + [allocation per councillor * number of council seats]
The institutional component accounts for 8.9 per cent of the equitable share formula and is worth R3.5 billion in 2014/15. This component is also complemented by special support for councillor remuneration in poor municipalities, which is not part of the equitable share formula (described in more detail later).
The community services component
This component funds services that benefit communities rather than individual households (which are provided for in the basic services component). It includes funding for municipal health services, fire services, municipal roads, cemeteries, planning, storm water management, street lighting and parks. To ensure this component assists municipalities with limited own-revenue-raising abilities, a revenue adjustment factor is applied so that a larger proportion of the allocation is received by municipalities with less potential to raise their own revenue. The revenue adjustment factor is described in more detail later in this annexure.
The allocation for this component is split between district and local municipalities, because both provide community services. In 2014/15, the allocation to district and metropolitan municipalities for municipal health and related services is R7.39 per household per month. The component’s remaining funds are allocated to local and metropolitan municipalities based on the number of households in each municipality.
The community services component
CS = [municipal health and related services allocation x number of households] + [other services allocation x number of households]
The community services component accounts for 13.4 per cent of the equitable share formula and is worth R5.3 billion in 2014/15.
The revenue adjustment factor
The Constitution gives local government substantial own-revenue-raising powers (particularly through property rates and surcharges on services). Municipalities are expected to fund most of their own administrative costs and cross-subsidise some services for indigent residents. Given the varied levels of poverty across South Africa, the formula does not expect all municipalities to be able to generate similar amounts of own revenue. A revenue adjustment factor is applied to the institutional and community services components of the formula to ensure that these funds assist municipalities that are least likely to be able to fund these functions from their own revenues.
35
2014 BUDGET REVIEW
To account for the varying fiscal capacities of municipalities, this component is based on a per capita index using the following factors from the 2011 Census:
��
| | • | | Total income of all individuals/households in a municipality (as a measure of economic activity and earning) |
| | • | | Reported property values |
| | • | | Number of households on traditional land |
| | • | | Proportion of poor households as a percentage of the total number of households in the municipality. |
Based on this index, municipalities were ranked according to their per capita revenue-raising potential. The top 10 per cent of municipalities have a revenue adjustment factor of zero, which means that they receive no allocation from the institutional and community services components. The 25 per cent of municipalities with the lowest scores have a revenue adjustment factor of 100 per cent, which means that they receive their full allocation from the institutional and community services components. Municipalities between the bottom 25 per cent and top 10 per cent have a revenue adjustment factor applied on a sliding scale, so that those with higher per capita revenue-raising potential receive a lower revenue adjustment factor and those with less potential receive a larger revenue adjustment factor.
The revenue adjustment factor is not based on the actual revenues municipalities collect. This component therefore does not create any perverse incentive for municipalities to under-collect potential own revenues to receive a higher equitable share.
Because district municipalities do not collect own revenues from property rates, the revenue adjustment factor applied to these municipalities is based on the RSC/JSB levies replacement grant allocations. This grant replaces a source of own revenue previously collected by district municipalities. It is still treated as an own-revenue source in many respects. Similar to the revenue adjustment factor for local and metropolitan municipalities, the factor applied to district municipalities is based on their per capita RSC/JSB levies replacement grant allocations. District municipalities are given revenue adjustment factors on a sliding scale – those with a higher per capita RSC/JSB levies replacement grant allocation receive a lower revenue adjustment factor and those with lower allocations receive a larger revenue adjustment factor.
Correction and stabilisation factor
Providing municipalities with predictable and stable equitable allocations is one of the principles of the equitable share formula. Indicative allocations are published for the second and third years of the MTEF period to ensure predictability. To provide stability for municipal planning, while giving national government flexibility to account for overall budget constraints and amend the formula, municipalities are guaranteed to receive at least 90 per cent of the indicative allocation for the middle year of the MTEF.
The new equitable share formula and the updated 2011 Census data used in the formula mean that some municipalities experience large changes in their equitable share allocations. To smooth the impact of these changes and give municipalities time to adjust (both for municipalities with increasing and decreasing allocations), the new allocations are being phased in over five years, from 2013/14 to 2017/18. For municipalities with smaller allocations under the new formula, the phase-in mechanism measures the difference between the municipality’s old and new allocations and closes this gap by 20 per cent each year. This means that in the first year, a municipality only experienced a change equivalent to 20 per cent of the gap between their allocations under the old and new formulas, in the second year (2014/15) they will experience a 40 per cent change, and so on, until in the fifth year their allocation is determined entirely through the new formula.
36
ANNEXURE W1: EXPLANATORY MEMORANDUM TO THE DIVISION OF REVENUE
To provide for this phase-in approach, while staying within the limits of the equitable share, municipalities with larger allocations will also have their increases phased in over five years. The total top-up amount needed to fund the phasing in for municipalities with declining allocations is calculated and deducted from those that do not require a top-up in proportion to their “surplus”. This means that municipalities with larger allocations will have some of those gains delayed over the phase-in period.
Ensuring the formula balances
The formula is structured to ensure that all of the available funds are allocated. It automatically determines the value of the allocation per council seat in the institutional component and the allocation per household for other services in the community services component to ensure that it balances. The basic services component is determined by the number of poor households per municipality and the estimated cost of free basic services, so it cannot be manipulated. This means that the balancing of the formula to the available resources must take place in the second part of the formula, which includes the institutional and community services components.
Potential future refinements to the formula
Although the local government equitable share formula has been through extensive consultations and technical work, national government is still working with stakeholders to improve the formula. Areas of work include:
| | • | | Exploring the introduction of factors to account for costs related to the size of the land area served and settlement types in municipalities. |
| | • | | Developing differentiated costing variables to take account of the different costs of services in different circumstances. Both SALGA and the FFC are conducting research projects that could provide the basis for calculating such variables in future. |
| | • | | Exploring the creation of separate sub-components for fire services and municipal health services within the community services component. This would enhance transparency in allocations, although funds for the fire services function would need to be allocated to the municipality (district or local) authorised for this function within a specific area. This component therefore depends on the compilation and maintenance of a credible and comprehensive database on the assignment of the fire services function. The National Disaster Management Centre under the Department of Cooperative Governance is compiling this database. |
Government is committed to considering all proposed refinements to the formula, but another full review is not envisaged until the current formula has been fully phased in.
Details of new allocations
In addition to the three-year formula allocations published in the Division of Revenue Bill, estimates of municipal allocations over the remaining four years of the phase-in period will be provided on the National Treasury’s website. This will enable municipalities to see the full impact of the new formula once it is phased in. To promote transparency, details of each component’s allocation and a summary version of the formula will also be published (available at:
http://mfma.treasury.gov.za/Media_Releases/LGESDiscussion s/Pages/default.aspx).
37
2014 BUDGET REVIEW
Other unconditional allocations
RSC/JSB levies replacement grant
Before 2006, district municipalities raised levies on local businesses through an RSC or JSB levy. This source of revenue was replaced in 2006/07 with the RSC/JSB levies replacement grant, which was allocated to all district and metropolitan municipalities based on the amounts they had previously collected through the levies (the RSC/JSB levies replacement grant for metropolitan municipalities has since been replaced by the sharing of the general fuel levy). The value of the grant increases every year. In 2014/15, the grant increases by 9 per cent a year for district municipalities authorised for water and sanitation and 3 per cent for unauthorised district municipalities. The different rates recognise the various service delivery responsibilities of these district municipalities.
Special support for councillor remuneration and ward committees
Councillors’ salaries are subsidised in poor municipalities. The total value of the support provided in 2014/15 is R934.6 million, calculated separately to the local government equitable share and in addition to the funding for governance costs provided in the institutional component. The level of support for each municipality is determined by the classification system used in the Government Gazette, which determines the upper limits of salaries, allowances and benefits of different members of municipal councils. The gazette, published annually by the Minister of Cooperative Governance and Traditional Affairs, classifies municipal councils into six grades based on their total income and population size. Special support is provided to the lowest three grades of municipal councils (the smallest and poorest municipalities). All subsidy levels are based on the gazetted upper maximum levels for part-time councillors. The gazette issued on 29 January 2014 includes a shift to the use of 2011 Census data in determining the grades of municipal councils. Because it takes time for municipalities to calculate their grades and confirm these with provincial Members of the Executive Council for local government, the municipal grades used for allocations in 2014/15 do not account for these updates. The National Treasury, together with the Department of Cooperative Governance, will examine the impact of the use of Census 2011 data on municipal grades before determining the 2015/16 allocations for councillor remuneration. Each municipality in grades 1 to 3 receives an allocation to provide stipends of R500 per month to 10 members of each ward committee in their municipality. Each municipality’s allocation for this special support is published in the appendices to the Division of Revenue Bill.
Conditional grants to local government
National government allocates funds to local government through a variety of conditional grants. These grants fall into two main groups: infrastructure and capacity building. The total value of conditional grants directly transferred to local government increases from R36.1 billion in 2014/15 to R39.2 billion in 2015/16 and R41.1 billion in 2016/17.
Infrastructure conditional grants to local government
National transfers for infrastructure, including indirect or in-kind allocations to entities executing specific projects in municipalities, amount to R131.6 billion over the 2014 MTEF period.
38
ANNEXURE W1: EXPLANATORY MEMORANDUM TO THE DIVISION OF REVENUE
Table W1.23 Infrastructure transfers to local government, 2010/11 – 2016/17
| | | | | | | | | | | | | | | | | | | | | | | | | | | | |
| | | 2010/11 | | | 2011/12 | | | 2012/13 | | | 2013/14 | | | 2014/15 | | | 2015/16 | | | 2016/17 | |
| | | | | | Revised | | | | |
R million | | Outcome | | | estimate | | | Medium-term estimates | |
Direct transfers | | | 20 871 | | | | 24 643 | | | | 27 923 | | | | 31 053 | | | | 32 582 | | | | 35 324 | | | | 36 722 | |
Municipal infrastructure | | | 9 704 | | | | 11 443 | | | | 13 879 | | | | 14 355 | | | | 14 684 | | | | 15 098 | | | | 15 767 | |
Municipal water infrastructure | | | — | | | | — | | | | — | | | | 403 | | | | 534 | | | | 1 380 | | | | 1 302 | |
Urban settlements development | | | 4 968 | | | | 6 267 | | | | 7 392 | | | | 9 077 | | | | 10 285 | | | | 10 655 | | | | 11 232 | |
Integrated national electrification programme | | | 1 033 | | | | 1 097 | | | | 1 151 | | | | 1 635 | | | | 1 105 | | | | 2 056 | | | | 2 165 | |
Public transport infrastructure | | | 3 700 | | | | 4 612 | | | | 4 884 | | | | 4 669 | | | | 4 968 | | | | 5 098 | | | | 5 104 | |
Neighbourhood development partnership | | | 832 | | | | 738 | | | | 578 | | | | 598 | | | | 591 | | | | 600 | | | | 632 | |
Integrated city development | | | — | | | | — | | | | — | | | | 40 | | | | 255 | | | | 266 | | | | 293 | |
2010 FIFA World Cup stadiums development | | | 302 | | | | — | | | | — | | | | — | | | | — | | | | — | | | | — | |
Rural roads asset management systems | | | 10 | | | | 35 | | | | 37 | | | | 52 | | | | 75 | | | | 98 | | | | 103 | |
Rural households infrastructure | | | — | | | | — | | | | — | | | | 107 | | | | 48 | | | | 51 | | | | 125 | |
Municipal disaster recovery | | | 320 | | | | 450 | | | | — | | | | 118 | | | | 37 | | | | 22 | | | | — | |
| | | | | | | | | | | | | | | | | | | | | | | | | | | | |
Indirect transfers | | | 2 682 | | | | 2 553 | | | | 4 823 | | | | 5 558 | | | | 7 584 | | | | 9 316 | | | | 10 062 | |
| | | | | | | | | | | | | | | | | | | | | | | | | | | | |
Integrated national electrification programme | | | 1 720 | | | | 1 165 | | | | 1 879 | | | | 2 141 | | | | 2 948 | | | | 3 680 | | | | 3 875 | |
Neighbourhood development partnership | | | 50 | | | | 50 | | | | 80 | | | | 55 | | | | 58 | | | | 55 | | | | 52 | |
Regional bulk infrastructure | | | 851 | | | | 1 260 | | | | 2 523 | | | | 3 261 | | | | 3 987 | | | | 4 222 | | | | 4 624 | |
Municipal water infrastructure | | | — | | | | — | | | | — | | | | — | | | | 525 | | | | 1 292 | | | | 1 512 | |
Rural households infrastructure | | | 62 | | | | 78 | | | | 341 | | | | 101 | | | | 66 | | | | 67 | | | | — | |
| | | | | | | | | | | | | | | | | | | | | | | | | | | | |
Total | | | 23 553 | | | | 27 196 | | | | 32 746 | | | | 36 611 | | | | 40 165 | | | | 44 639 | | | | 46 784 | |
| | | | | | | | | | | | | | | | | | | | | | | | | | | | |
Municipal infrastructure grant
The largest infrastructure transfer is made through the municipal infrastructure grant, which supports government’s aim to expand service delivery and alleviate poverty. The grant funds the provision of infrastructure for basic services, roads and social infrastructure for poor households in all non-metropolitan municipalities. The total allocations for this grant increase to R14.7 billion in 2014/15, R15.1 billion in 2015/16 and R15.8 billion in 2016/17.
The municipal infrastructure grant is allocated through a formula with a vertical and horizontal division. The vertical division allocates resources between sectors and the horizontal division takes account of poverty, backlogs, and municipal powers and functions in allocating funds to municipalities. The five main components of the formula are described in the box below. A minimum allocation of R5 million ensures that a reasonable allocation is made to small municipalities.
Municipal infrastructure grant = C + B + P + E + N
| | |
| C | | Constant to ensure increased minimum allocation for small municipalities (this allocation is made to all municipalities) |
| |
| B | | Basic residential infrastructure (proportional allocations for water supply and sanitation, roads and other services such as street lighting and solid waste removal) |
| |
| P | | Public municipal service infrastructure (ring-fenced for municipal sport infrastructure) |
| |
| E | | Allocation for social institutions and micro-enterprises infrastructure |
| |
| N | | Allocation to the 23 priority districts identified by government |
39
2014 BUDGET REVIEW
For the 2014 MTEF, the municipal infrastructure grant allocation formula uses data from the 2011 Census. Allocations for basic services sub-components are based on the proportion of the national backlog for that service in each municipality. Other components are based on the proportion of the country’s poor households located in each municipality. Table W1.24 sets out the proportion of the grant accounted for by each component of the grant formula. The C-component provides a R5 million base to all municipalities receiving municipal infrastructure grant allocations.
Table W1.24 Municipal infrastructure grant allocations per sector
| | | | | | | | | | | | |
| | | | | | Proportion of
municipal
infrastructure
grant per
sector | | | Value of
component
2014/15
(R millions) | |
Municipal infrastructure grant (formula) | | Component
weights | | | |
B-component | | | 75.0 | % | | | | | | | 10 086 | |
Water and sanitation | | | 72.0 | % | | | 54.0 | % | | | 7 262 | |
Roads | | | 23.0 | % | | | 17.3 | % | | | 2 320 | |
Other | | | 5.0 | % | | | 3.8 | % | | | 504 | |
P-component | | | 15.0 | % | | | | | | | 2 017 | |
Sports | | | 100.0 | % | | | 15.0 | % | | | 2 017 | |
E-component | | | 5.0 | % | | | 5.0 | % | | | 672 | |
N-component | | | 5.0 | % | | | 5.0 | % | | | 672 | |
| | | | | | | | | | | | |
Constant | | | | | | | | | | | 1 235 | |
| | | | | | | | | | | | |
Total | | | | | | | | | | | 14 684 | |
| | | | | | | | | | | | |
Since 2011/12, the P-component (15 per cent of the grant) has been ring-fenced for municipal sport and recreation infrastructure. This continues in the 2014 MTEF.
The municipal infrastructure grant has been reduced by R350 million in 2015/16 and R500 million in 2016/17, less than 2.3 per cent and 3.1 per cent of the value of the grant in each respective year. These funds are added to the regional bulk infrastructure grant, allowing more resources to be invested in the bulk water and sanitation infrastructure needed for future household connections funded through the municipal infrastructure grant.
Government has prioritised the eradication of bucket sanitation systems. Although substantial funds are already available for the upgrading of sanitation infrastructure through the municipal infrastructure grant, these funds have not always been prioritised towards bucket eradication at a local level. To ensure this national priority is also prioritised in municipalities, conditions will be added to the grant to require municipalities with many households served by bucket systems to prioritise sanitation upgrades. If municipalities fail to make this a priority or are unable to implement projects, funds may be converted to an indirect grant for national government to provide infrastructure on behalf of the municipality.
Urban settlements development grant
The urban settlements development grant is an integrated source of funding to upgrade urban informal settlements in the eight metropolitan municipalities. The grant is allocated as a supplementary grant to cities (schedule 4 of the Division of Revenue Act), which means that municipalities are expected to use a combination of grant funds and their own revenue to upgrade informal settlements. Cities report their progress on these projects against the targets set in their service delivery and budget implementation plans. The grant has been reduced by R50 million in 2014/15, R45 million in 2015/16 and R35 million in 2016/17. These reductions – of less than 0.5 per cent of the total grant allocation in any year – will be used to fund other priorities in urban development. The urban settlements development grant is allocated a total of R32.2 billion over the 2014 MTEF period.
40
ANNEXURE W1: EXPLANATORY MEMORANDUM TO THE DIVISION OF REVENUE
To accelerate the eradication of bucket sanitation backlogs, conditions will be added to the urban settlements development grant to require metropolitan municipalities to prioritise this commitment in metropolitan municipalities that still use bucket systems. If municipalities fail to make this a priority or are unable to implement projects, funds may be converted to an indirect grant for national government to provide infrastructure on behalf of the municipality.
Municipal water infrastructure grant
This grant was introduced in 2013/14 to accelerate the delivery of clean water to communities that do not have access to basic water services. The grant, administered by the Department of Water Affairs, provides funding for various projects, including the construction of new infrastructure and the refurbishment and extension of existing water schemes. Although this grant was implemented in 2013/14 as a direct grant (schedule 5B to the Division of Revenue Act), in the 2014 MTEF it will have both a direct and indirect grant component (schedule 6B to the Division of Revenue Act). In areas where municipalities have the capacity to implement projects themselves, funds will be transferred through a direct grant. In other areas, the Department of Water Affairs will implement projects on behalf of municipalities through an indirect grant. The direct and indirect grants have a total allocation of R6.5 billion over the 2014 MTEF period.
The public transport infrastructure grant
The public transport infrastructure grant is administered by the Department of Transport. This grant was previously the public transport infrastructure and systems grant. The operational portion of the previous grant has been separated as the public transport network operations grant since 2013/14, meaning that the infrastructure grant will only fund capital expenditure. The grant aims to help cities create new and improve existing public transport and non-motorised transport infrastructure. This includes the provision of infrastructure for bus rapid transit systems. The grant has an allocation of R15.2 billion over the 2014 MTEF period.
The rural roads asset management systems grant
The rural roads asset management systems grant is administered by the Department of Transport to improve rural road infrastructure. The grant funds the collection of data on the condition and usage of rural roads in line with the Road Infrastructure Strategic Framework for South Africa. This data will guide investments to maintain and improve these roads. Rural district municipalities are funded to collect data on the condition and usage of all the municipal roads in their area so that the spending of infrastructure funds (from the municipal infrastructure grant and elsewhere) can be properly planned to maximise their impact. Over the 2014 MTEF period, this grant will be extended to all district municipalities. The grant has an allocation of R275.9 million over this period.
The rural households infrastructure grant
The rural households infrastructure grant funds the provision of on-site solutions for sanitation services for rural households where piped infrastructure is not feasible. This grant was implemented as a direct grant in 2013/14, but from 2014/15 the grant will have both direct and indirect components. In areas where municipalities have the capacity to implement projects themselves, funds will be transferred through the direct grant. In other areas, the national Department of Human Settlements will implement projects on behalf of municipalities through an indirect grant. The grant has an allocation of R356.1 million over the 2014 MTEF period.
The neighbourhood development partnership grant
The neighbourhood development partnership grant is administered by the National Treasury and has two components in the 2014 MTEF. One focuses on urban areas and the other focuses on towns and rural areas. The urban component supports and facilitates the development of urban network plans to create a platform for third-party public and private investment to improve the quality of life in township urban hubs. Projects in towns and rural areas will be implemented in conjunction with the Department of Rural Development to support catalytic projects in these areas. The grant has an allocation of R2 billion over the MTEF period, which consists of R1.8 billion for the capital (direct) grant and R165.3 million for the technical assistance (indirect) grant.
41
2014 BUDGET REVIEW
Integrated cities development grant
In its second year, this grant provides a financial incentive for metropolitan municipalities to integrate and focus their use of all available infrastructure investment and regulatory instruments to achieve a more compact and efficient urban spatial form. Cities are required to submit built environment performance plans for this grant. The plan provides a brief strategic overview of a city’s plans for the built environment, with a focus on the infrastructure grants that form part of the capital budget. The plan should show how the municipality will ensure alignment between its different grant-funded programmes and how it will address related policy and regulatory matters. From 2014/15, all projects funded by sector-specific infrastructure grants, including the urban settlements development grant, the public transport infrastructure grant, the neighbourhood development partnership grant and the integrated national electrification programme grant, must form part of a metropolitan municipality’s built environment performance plan. This grant receives additional funding of R356 million over the 2014 MTEF period, bringing the total value of the grant to R814 million.
The integrated national electrification programme
To sustain progress in connecting poor households to electricity, government will spend R15.8 billion over the next three years on the national electrification programme. Of this, municipalities will spend R5.3 billion and Eskom will spend R10.5 billion on behalf of municipalities through an indirect grant. This programme has been instrumental in providing 85 per cent of all households with access to electricity, as reported in the 2011 Census.
The regional bulk infrastructure grant
This grant supplements the financing of the social component of regional bulk water and sanitation infrastructure. It targets projects that cut across several municipalities or are large bulk projects within one municipality. The grant funds the bulk infrastructure needed to provide reticulated water and sanitation services to individual households. It may also be used to appoint service providers to carry out feasibility studies, related planning or management studies for infrastructure projects. The grant is allocated additional funding of R934 million over the 2014 MTEF period to accelerate the implementation of projects. An amount of R2.6 billion is shifted out of this grant over the 2014 MTEF period to fund water boards’ construction of bulk infrastructure. These projects still form part of the Department of Water Affairs’ larger programme of subsidising the construction of regional bulk infrastructure for water and sanitation, so the funds are used to achieve the same objective. However, because the infrastructure will be owned and operated by water boards, it cannot be classified as an indirect transfer to municipalities. This brings the total value of the grant to R12.8 billion over the 2014 MTEF period.
Municipal disaster recovery grant
The municipal disaster recovery grant was introduced in the 2013 Division of Revenue Amendment Bill. This grant, administered by the National Disaster Management Centre in the Department of Cooperative Governance, is used to rehabilitate and reconstruct municipal infrastructure damaged by disasters. Over the 2014 MTEF period, R59.1 million is made available to repair infrastructure damaged by floods that took place in 2012 and 2013.
Capacity-building grants and other current transfers
Capacity-building grants help to develop municipalities’ management, planning, technical, budgeting and financial management skills. The expanded public works programme integrated grant for municipalities promotes increased labour intensity in municipalities and the water services operating subsidy grant supports national water schemes that are being transferred to municipalities. A total of R12.2 billion is allocated to direct and indirect capacity-building grants and other current transfers to local government over the 2014 MTEF period.
42
ANNEXURE W1: EXPLANATORY MEMORANDUM TO THE DIVISION OF REVENUE
Table W1.25 Capacity building and other current transfers to local government, 2010/11 – 2016/17
| | | | | | | | | | | | | | | | | | | | | | | | | | | | |
| | | 2010/11 | | | 2011/12 | | | 2012/13 | | | 2013/14 | | | 2014/15 | | | 2015/16 | | | 2016/17 | |
| | | | | | Revised | | | | |
R million | | Outcome | | | estimate | | | Medium-term estimates | |
Direct transfers | | | 1 951 | | | | 1 862 | | | | 2 329 | | | | 3 214 | | | | 3 553 | | | | 3 857 | | | | 4 372 | |
Municipal systems improvement | | | 212 | | | | 220 | | | | 230 | | | | 240 | | | | 252 | | | | 261 | | | | 275 | |
Local government financial management | | | 365 | | | | 385 | | | | 403 | | | | 425 | | | | 449 | | | | 470 | | | | 495 | |
Municipal human settlements capacity | | | — | | | �� | — | | | | — | | | | — | | | | 300 | | | | 300 | | | | 300 | |
Public transport network operations | | | — | | | | — | | | | — | | | | 881 | | | | 903 | | | | 1 043 | | | | 1 362 | |
2010 FIFA World Cup host city operating | | | 210 | | | | — | | | | — | | | | — | | | | — | | | | — | | | | — | |
2013 African Cup of Nations host city operating | | | — | | | | — | | | | 123 | | | | — | | | | — | | | | — | | | | — | |
2014 African Nations Championship host city operating | | | — | | | | — | | | | — | | | | 120 | | | | — | | | | — | | | | — | |
Water services operating subsidy | | | 664 | | | | 542 | | | | 562 | | | | 411 | | | | 450 | | | | 470 | | | | 495 | |
Expanded public works programme integrated grant for municipalities | | | 280 | | | | 364 | | | | 662 | | | | 611 | | | | 595 | | | | 619 | | | | 706 | |
Infrastructure skills development | | | — | | | | 39 | | | | 75 | | | | 99 | | | | 104 | | | | 129 | | | | 139 | |
Energy efficiency and demand-side management | | | 220 | | | | 280 | | | | 200 | | | | 181 | | | | 137 | | | | 188 | | | | 204 | |
Municipal disaster | | | — | | | | 32 | | | | 73 | | | | 247 | | | | 364 | | | | 376 | | | | 396 | |
| | | | | | | | | | | | | | | | | | | | | | | | | | | | |
Indirect transfers | | | 257 | | | | 217 | | | | 133 | | | | 139 | | | | 142 | | | | 151 | | | | 159 | |
| | | | | | | | | | | | | | | | | | | | | | | | | | | | |
Energy efficiency and demand-side management | | | 109 | | | | 119 | | | | — | | | | — | | | | — | | | | — | | | | — | |
Water services operating subsidy | | | 148 | | | | 98 | | | | 133 | | | | 139 | | | | 142 | | | | 151 | | | | 159 | |
| | | | | | | | | | | | | | | | | | | | | | | | | | | | |
Total | | | 2 208 | | | | 2 079 | | | | 2 461 | | | | 3 353 | | | | 3 695 | | | | 4 008 | | | | 4 531 | |
| | | | | | | | | | | | | | | | | | | | | | | | | | | | |
Municipal human settlements capacity grant
This new grant, administered by the Department of Human Settlements, funds capacity for the development of human settlements in the six metropolitan municipalities targeted for assignment of the housing function in 2014. This grant has been allocated R300 million in 2014/15, R300 million in 2015/16 and R300 million in 2016/17.
Financial management grant
The financial management grant, managed by the National Treasury, funds the placement of financial management interns and the modernisation of financial management systems. This includes building in-house municipal capacity to implement multi-year budgeting, linking integrated development plans to budgets and producing quality and timely in-year and annual reports. The grant supports municipalities in the implementation of the Municipal Finance Management Act. Total allocations for the financial management grant amount to R1.4 billion over the 2014 MTEF period.
The public transport network operations grant
The public transport network operations grant subsidises the operational costs of public transport systems built through the public transport infrastructure grant. Previously, both grants formed part of the public transport infrastructure and systems grant. This grant has been split into separate infrastructure and operational grants to provide more transparency on what is being funded and to provide cities with greater certainty about the levels of operational funding they will receive to support their new public transport networks. The public transport network operations grant is allocated R3.3 billion over the 2014 MTEF period.
43
2014 BUDGET REVIEW
Infrastructure skills development grant
The infrastructure skills development grant, now in its third year, develops capacity within municipalities by creating a sustainable pool of young professionals with technical skills related to municipal services, such as water, electricity and town planning. The grant places interns in municipalities, so they can complete the requirements of the relevant statutory council/professional body within their respective built environment fields. The interns can be hired by any municipality at the end of their internship. The grant has an allocation of R372.4 million over the 2014 MTEF period.
Municipal systems improvement grant
The municipal systems improvement grant helps municipalities perform their functions and stabilise institutional and governance systems, as required in the Municipal Systems Act (2000) and related legislation. The grant is administered by the Department of Cooperative Governance and is allocated R788.1 million over the MTEF period.
Expanded public works programme integrated grant for municipalities
This grant promotes the use of labour-intensive methods in delivering municipal infrastructure and services. The grant is allocated through a formula based on past performance, which creates an incentive for municipalities. The formula has an extra weighting to give bigger allocations to poor, rural municipalities. The grant has an allocation of R1.9 billion over the 2014 MTEF period.
The energy efficiency and demand-side management grant
The energy efficiency and demand-side management grant was introduced to address load shedding in 2008. It funds selected municipalities to implement energy-efficiency projects, with a focus on public lighting and energy-efficient municipal infrastructure. In the 2014 MTEF, the Department of Energy will monitor and verify grant-funded projects to ensure greater consistency in the procurement of accredited verification services. The grant is allocated R529 million over the MTEF period.
The water services operating subsidy
The water services operating subsidy is a grant with schedule 5B (direct) and schedule 6B (in-kind) components to fund water schemes. The direct grant funds the refurbishment and upgrading of schemes, while the indirect grant funds the costs of staff that have not been transferred to municipalities. In the 2014 MTEF, R1.9 billion is allocated for the water services operating subsidy (direct and indirect transfers). It is a transitional grant that is expected to continue until 2016/17, subject to review by the National Treasury and the Department of Water Affairs.
Municipal disaster grant
The municipal disaster grant, introduced in the 2011 MTEF, is administered by the National Disaster Management Centre in the Department of Cooperative Governance as an unallocated grant to local government. The centre is able to disburse disaster-response funds immediately – without the need for the transfers to be gazetted first. Over the 2014 MTEF period, this grant is allocated R1.1 billion.
44
ANNEXURE W1: EXPLANATORY MEMORANDUM TO THE DIVISION OF REVENUE
¢ Part 6: Future work on provincial and municipal fiscal frameworks
Provincial infrastructure transfers
Reforms to the health and education infrastructure transfers to provinces began to be implemented in 2013/14. These reforms aim to address planning and procurement failures in infrastructure delivery by introducing incentives, which will promote good infrastructure delivery management system practices and complement existing capacity support programmes.
From 2015/16, provinces will only be eligible to receive allocations for the health facility revitalisation grant and the education infrastructure grant if they meet certain planning criteria. Provinces are now required to bid for their infrastructure grant allocations two years in advance (during 2013/14, provinces submitted bids for their 2015/16 allocations). A set of bidding prerequisites and criteria are used to evaluate bids. Unsuccessful bids are not funded and those allocations are pooled in an unallocated fund, for which provinces with successful bids can apply. The 2013 Division of Revenue Act required provinces to complete and submit plans and bids during 2013/14 as part of the first approval process. The 2014 Division of Revenue Bill outlines the requirements for the second approval process, which will determine the final allocations in 2015/16.
Approval processes
There are two approval processes before a final allocation is made. First, provinces are required to submit an asset management plan, an infrastructure programme management plan and a supporting construction procurement strategy. In the second approval process, conducted for the first time during 2014/15, successful departments will prepare project proposals and longer-term asset management plans. These will be assessed to confirm each province’s allocation (confirmed by an allocation letter from the National Treasury). The province will then be instructed to proceed with tender procedures.
After the second approval, the application process for the year is complete. Allocations may still be withdrawn if there is non-compliance, irregularities or material deviation from original submissions. Funds that remain unallocated at the end of this approval process can be allocated to provinces that are ready to implement additional projects. These projects, which would already be in the approval process but proposed for subsequent years, would be brought forward.
During the year in which funds are spent, measures will be put in place to ensure that if a province is not spending at the planned rate, it will not receive further transfers until it has spent the funds already transferred. Options will also be explored to shift unspent funds to projects where they can be spent during the year.
Progress to date
This process is being implemented for the first time to determine allocations for the health facility revitalisation grant and the education infrastructure grant for 2015/16. Departments that have not complied with the submission requirements of the 2013 Division of Revenue Act will only be allocated funds for existing projects in 2015/16, and not for any new projects. This reflects the principle of using performance-based allocations that these reforms promote. The baseline allocations per province will be reflected in the 2014 Division of Revenue Bill as partially unallocated for 2015/16 and fully unallocated for 2016/17. These allocations will be finalised after the second approval process during 2014.
During 2014/15, provinces will also submit applications for the first part of the approval process to determine their grant allocations for 2016/17.
Local government infrastructure transfers
Infrastructure grants account for 40 per cent of transfers to local government and amount to over R40 billion in 2014/15 alone, following substantial real growth in recent years. Many of these grants are the government’s primary mechanisms for funding infrastructure and essential services such as water,
45
2014 BUDGET REVIEW
sanitation, electricity and roads. The consistent growth in allocations reflects government’s prioritisation of these services. However, the 2011 Census revealed that despite improvements in access to services, the pace of these improvements does not always reflect the large increases in allocations over the past decade.
The local government infrastructure grant system is being reviewed to investigate the efficiency and effectiveness of these grants. The review stems from the 2011 Census data and calls for reform across government and by other stakeholders. For example, the FFC has raised concerns about the proliferation of grants, parliamentary committees have issued caution over the frequent underspending on infrastructure grants, and sector departments and municipalities have raised the issue of funding gaps in the grant system.
This review of local government infrastructure grants was announced in the 2013 Budget and the Budget Forum endorsed its terms of reference in October 2013. The National Treasury is leading the review in collaboration with the Department of Cooperative Governance, the Department of Performance, Monitoring and Evaluation, the FFC and SALGA through a working group and steering committee. In addition, extensive plans are in place for municipal consultation through workshops and online questionnaires in early 2014. National sector departments will also be consulted. Using these inputs from national and municipal stakeholders, in addition to extensive data analysis and research into domestic and international literature, an evidence base is being built to inform policy decisions regarding changes to the grant system. The current structure’s development was ad hoc in its approach, resulting in many different grants with various overlapping responsibilities. It is envisaged that this collaborative and research-based process will introduce a clear grant system structure.
By October 2014, the review’s working group and steering committee will condense the analysis and evidence into a set of recommendations to be presented to the Budget Forum. These proposals should set out how to improve the efficiency and effectiveness of the infrastructure grant system, but no conclusions can be pre-empted or ruled out before the necessary objective analysis is conducted. Recommendations could involve, for example, the merging of current grants, changes in the administration of grants, or reforms to the Division of Revenue Act. After the Budget Forum and Cabinet have made changes and given approval, the review’s recommendations will be communicated clearly to all stakeholders before they are implemented, starting in the 2015 Budget.
Municipal taxation
The national framework for municipal taxation powers is determined by section 229 of the Constitution, which empowers municipalities to impose a property tax and surcharges on fees for municipal services, subject to national regulation. However, in exercising their revenue-raising powers, it is important that municipalities do not materially or unreasonably prejudice national economic policies and economic activities across municipal boundaries.
The Municipal Property Rates Act (2004) and the Municipal Fiscal Powers and Functions Act (2007) regulate municipal fiscal powers and functions.
Municipal Property Rates Act
The Municipal Property Rates Act regulates the power of municipalities to impose rates on properties. The Department of Cooperative Governance administers the act, monitoring municipalities’ compliance with the act and its regulatory framework periodically, and guiding non-compliant municipalities to comply with the provisions of the act and its regulations. The department introduced the Municipal Property Rates Amendment Bill to Parliament in September 2013 to strengthen the regulatory, monitoring and reporting provisions of the act, which in turn will improve its implementation and minimise legal ambiguities. As at February 2014, Parliament has already received public submissions on the bill, held public hearings and considered the bill.
Development charges
A development charge is a once-off infrastructure access fee imposed on a land owner as a condition of approval of a land development that will substantially increase the use of or need for municipal infrastructure engineering services. There is currently no legislation that adequately defines development charges and recognises their unique character as a multi-sector and upfront infrastructure charge.
46
ANNEXURE W1: EXPLANATORY MEMORANDUM TO THE DIVISION OF REVENUE
The National Treasury is amending the Municipal Fiscal Powers and Functions Act to incorporate the regulation of development charges. A national draft policy framework that will give expression to the implementation of development charges has been developed and consultations with various stakeholders are under way.
Sharing of the general fuel levy
The sharing of the general fuel levy is a direct charge that is formalised annually through the Government Gazette under schedule 1 of the Taxation Laws Amendment Act (2009). It was introduced in 2009/10 as a permanent replacement to the former RSC and JSB levies for metropolitan municipalities, in addition to the VAT reforms introduced in 2006. District municipalities still receive the RSC/JSB levies replacement grant.
The allocation to each city for the sharing of the general fuel levy is based on fuel sales. To determine the actual fuel sales in a metropolitan municipality, the fuel sales figures from the Department of Energy have been adjusted to account for overlapping magisterial district boundaries using population statistics from the 2011 Census.
Several concerns have been raised by metropolitan municipalities since the introduction of the sharing of the general fuel levy. First, changes in the volume of fuel sales from one year to another can result in significant changes to municipal allocations, making it difficult for cities to budget for revenue from this source over the medium term. From 2014/15, a new phase-in approach will be introduced for the levy’s outer year allocations. This will enhance stability, allowing metropolitan municipalities to budget for revenue from the sharing of the general fuel levy over the medium term.
Second, cities have raised concerns about the long-term incentive effects of sharing a revenue source based on fuel consumption, when cities are mandated to encourage the use of public transport. The National Treasury is reviewing its own sources of revenue for metropolitan municipalities to explore options that complement and/or replace some existing own sources of revenue, including the sharing of the general fuel levy.
47