Exhibit 99.E


© South African Reserve Bank
All rights reserved. No part of this publication may be reproduced, stored in a retrieval system, or transmitted in any form or by any means, electronic, mechanical, photocopying, recording or otherwise, without fully acknowledging the Quarterly Bulletin of the South African Reserve Bank as the source. The contents of this publication are intended for general information only and are not intended to serve as financial or other advice. While every precaution is taken to ensure the accuracy of information, the South African Reserve Bank shall not be liable to any person for inaccurate information or opinions contained in this publication.
| | | | |
Enquiries relating to this Bulletin should be addressed to: | | | | |
| |
Head: Research Department | | | | |
South African Reserve Bank | | | | |
P O Box 427 | | | | |
Pretoria 0001 | | | | |
Tel. +27 12 313-3668/3676 | | | | |
| |
http://www.reservebank.co.za | | | ISSN 0038-2620 | |
| | |
 | | Quarterly Bulletin September 2014 |
Contents
Quarterly Economic Review
| | | | |
Introduction | | | 1 | |
Domestic economic developments | | | 4 | |
Domestic output | | | 4 | |
Real gross domestic expenditure | | | 8 | |
Factor income | | | 14 | |
Gross saving | | | 15 | |
Employment | | | 16 | |
Labour cost and productivity | | | 21 | |
Prices | | | 23 | |
Foreign trade and payments | | | 31 | |
International economic developments | | | 31 | |
Current account | | | 34 | |
Financial account | | | 40 | |
Foreign debt | | | 42 | |
International reserves and liquidity | | | 45 | |
Exchange rates | | | 46 | |
Monetary developments, interest rates and financial markets | | | 49 | |
Money supply | | | 49 | |
Credit extension | | | 52 | |
Interest rates and yields | | | 55 | |
Money market | | | 60 | |
Bond market | | | 62 | |
Share market | | | 65 | |
Market for exchange-traded derivatives | | | 66 | |
Real-estate market | | | 67 | |
Non-bank financial intermediaries | | | 68 | |
Flow of funds | | | 69 | |
Public finance | | | 71 | |
Non-financial public-sector borrowing requirement | | | 71 | |
Budget comparable analysis of national government finance | | | 74 | |
| |
Statement issued by Gill Marcus, Governor of the South African Reserve Bank | | | | |
| |
Statement of the Monetary Policy Committee 17 July 2014 | | | 81 | |
| |
Note | | | | |
| |
A brief preview of the forthcoming revision of South Africa’s national accounts and balance-of-payments statistics | | | 86 | |
| |
Notes to tables | | | 90 | |
| |
Statistical tables | | | | |
| |
Contents | | | S–0 | |
Statistical tables | | | S–2 | |
Key information | | | S–144 | |
| | |
| Quarterly Bulletin September 2014 | | |


Quarterly Economic Review
Introduction
The global recovery remained uneven and fragile in the first half of 2014, with monetary policies in key economies continuing to support economic activity despite the gradual downscaling of quantitative easing in the United States (US). Overall activity in both developed and emerging-market economies regained momentum in the second quarter of 2014 as conditions improved following the weak first quarter that was induced by temporary obstructions to growth. Activity in the US picked up as the extreme weather conditions encountered in the first quarter normalised, while growth in China responded positively to a mini-stimulus package. Expectations for economic growth in 2014 in sub-Saharan Africa continued to be relatively upbeat. However, activity in Japan contracted following the introduction of a higher rate of sales tax while persistent weak growth and declining inflation in the euro area prompted the European Central Bank (ECB) to further loosen its monetary policy stance by reducing its main refinancing rate by 10 basis points to 0,15 per cent in June 2014.
The international prices of South African export commodities on average declined somewhat in the second quarter of 2014. While the price of crude oil fluctuated higher up to June 2014, driven by concerns about the geopolitical tension in Iraq and the Russian–Ukrainian crisis, the price subsequently receded as oil supply remained robust whereas estimates for global oil demand were revised downwards. Global inflation remained well contained although it was higher in the emerging economies than in the advanced economies.
Following the negative growth rate recorded in the first quarter of 2014, the South African economy escaped a further contraction in the second quarter as real domestic production rose at an annualised rate of 0,6 per cent. This barely positive growth rate was extremely disappointing given the country’s development needs, and was mainly brought about by the drawn-out industrial action in the platinum-mining subsector which started on 23 January 2014 and only came to an end five months later. The strike activity, which resulted in a sharp contraction in mining output in the first quarter of the year, led to a further but less drastic decline in real mining production in the second quarter of 2014 as the real output of platinum group metals registered a pronounced decline. Given the backward and forward linkages of the mining sector, real value added by and utilisation of capacity in the manufacturing sector also declined in the second quarter of the year. The subdued conditions extended to the electricity sector, where weakness in demand was amplified by a relatively mild winter and a higher real price of electricity. By contrast, the agricultural sector registered stronger growth in real output over the period, supported by a bumper maize crop.
In the services industries, the pace of increase in real value added recorded in the first quarter of 2014 was maintained in the second quarter. A decline in activity in the commerce sector and slower growth in the real value added by the financial services sector were fully offset by firmer growth in the transport and general government services sectors in the second quarter of the year.
Real gross domestic expenditure lost some of its earlier momentum in the second quarter of 2014. Growth in real final consumption expenditure by households decelerated further in the second quarter of the year, consistent with the deceleration in the real disposable income of the household sector as industrial action detracted from striking workers’ earnings. The slower growth in household spending was particularly evident in expenditure on durable and semi-durable goods and on services; the pace of increase in real spending on non-durable goods accelerated over the period.
As household consumption expenditure decelerated slightly more than disposable income, and given the subdued home-loan activity, the ratio of household debt to disposable income declined somewhat further in the second quarter of 2014. At the same time the household sector’s net wealth rose firmly over the period, driven mainly by brisk increases in share prices.
| | |
| Quarterly Bulletin September 2014 | | |


Growth in general government’s real final consumption expenditure accelerated slightly in the second quarter of 2014, partly on account of additional expenditure incurred with the national and provincial elections held in May.
Against a background of industrial action and strife, growth in real fixed capital expenditure decelerated abruptly in the second quarter of 2014 to a barely positive rate of increase. Real capital outlays by both private business enterprises and public corporations declined over the period, but those by general government accelerated. In the private sector, most industries reduced their capital outlays, but the most pronounced declines were registered in the mining, trade, construction, transport and personal services sectors. These declines were partially offset by higher capital outlays in the manufacturing sector. Public corporations in the electricity and transport subsectors reduced their real capital spending somewhat compared with the preceding quarter. At the same time, however, general government raised its level of capital spending as all three levels of government prioritised infrastructure provision.
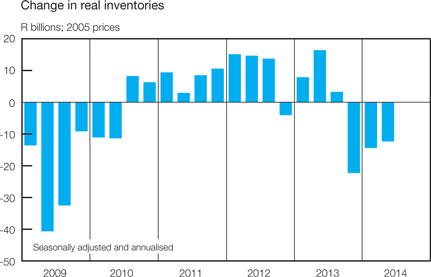
Real inventory holdings registered a further decline in the second quarter of 2014, with the mining sector in particular working down stock levels in order to continue supplying markets despite the industrial action. The pace of destocking was somewhat slower than in the preceding quarter.
South Africa’s export performance in the second quarter of 2014 was inhibited by the prolonged industrial action, logistical and energy constraints, a moderation in global demand, and a decline in some commodity prices. The value of merchandise imports also contracted over the period, but to a lesser extent. The larger trade deficit coincided with a widening in the shortfall on the services, income and current transfer account with the rest of the world as South African institutions made higher net income payments to non-resident investors. With both sub-accounts deteriorating, the current-account deficit widened substantially to 6,2 per cent of gross domestic product in the second quarter of 2014, from 4,5 per cent in the first quarter of the year.
The deficit in the second quarter was financed through a combination of direct, portfolio and, to a lesser extent, other investment flows. Inward foreign direct investment was concentrated in manufacturing and telecommunication enterprises while portfolio investment consisted mainly of the net acquisition of government debt securities by non-residents and, to a somewhat lesser extent, of equities. A small decline in the official gross gold and other foreign-exchange reserves in the second quarter of 2014 was offset by reserve increases in July and August 2014. The nominal effective exchange rate of the rand fluctuated broadly sideways in the period from the end of March 2014 to the end of August, notwithstanding industrial action and a downward rerating of South Africa’s long-term sovereign debt.
Employment trends reflected the generally subdued growth in economic activity. Enterprise-surveyed employment in the formal non-agricultural sector rose somewhat over the most recently available four quarters to the first quarter of 2014, but all the job creation took place in the public sector. Household-surveyed employment statistics suggest more vigorous increases in employment in the year to the second quarter of 2014.
The number of workdays lost to industrial action have escalated since the beginning of 2014. Average wage settlements increased moderately over the past year although a number of high-profile settlements were in double-digit territory. Allowing for productivity improvements, unit labour cost increases recently decelerated to less than 6 per cent – the upper limit of the inflation target range. However, industrial action and restructuring in the workplace make it necessary to interpret such statistics with circumspection.
Twelve-month consumer price inflation gained momentum and exceeded 6 per cent most recently, pushed higher by the prices of especially petrol, food and education. Most measures of underlying inflation edged higher over the past year. Given the risk of inflation remaining above the target range for a protracted period, the Monetary Policy Committee (MPC) at its July 2014 meeting decided to raise the repurchase rate by 25 basis points to 5,75 per cent per annum. That followed an earlier increase from 5,00 per cent to 5,50 per cent, announced in January 2014.
| | |
| | | Quarterly Bulletin September 2014 |
The domestic financial markets continued to be characterised by orderly conditions and adequate liquidity in the second quarter of 2014 and the subsequent two months. The broad money supply continued to register subdued growth. However, growth in bank advances to the domestic private sector recorded a moderate acceleration in the first seven months of 2014 – notably in the advances to companies, not to individuals, since the household sector’s unsecured borrowing ran out of steam. Growth in mortgage advances, though still subdued, inched slightly higher, while some other indicators of property-market activity registered an improvement.
Share prices rose to successive record highs over the past year, supported by companies’ earnings growth and constrained alternative investment opportunities.
Fiscal policy continued to provide support to the economic recovery: the public-sector borrowing requirement amounted to 4,6 per cent of gross domestic product in April–June 2014, slightly higher than a year earlier. Both general government and the non-financial public corporations continued to incur more expenditure than their current revenue as they aligned their infrastructure and other programmes with the targets set out in the National Development Plan (NDP). In the most recent quarter, however, general government raised its share of the borrowing requirement whereas public corporations decreased theirs.
| | |
| Quarterly Bulletin September 2014 | | |

Domestic economic developments
Domestic output1
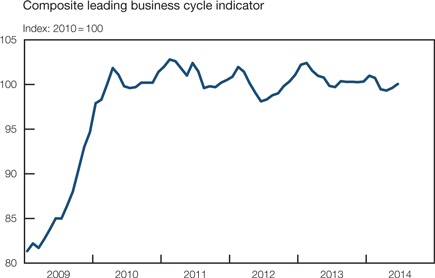
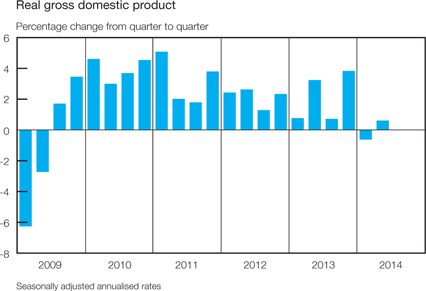
Following a contraction in real domestic economic activity at an annualised rate of 0,6 per cent in the first quarter of 2014, real economic growth turned positive in the second quarter, with output expanding at a rate of 0,6 per cent. The real value added by the goods-producing sectors of the economy declined further in the second quarter of 2014, whereas the real value added by the services sector expanded at a pace broadly similar to that registered in the first quarter. Recent movements in the composite leading business cycle indicator suggest a continuation of the modest pace of output growth in the domestic economy.
Despite the contraction in the first quarter of 2014, the level of real gross domestic production in the first half of 2014 was still 1,3 per cent higher than in the corresponding period in 2013. Excluding the primary sector, growth in real gross domestic product accelerated from an annualised rate of 0,7 per cent in the first quarter of 2014 to 1,2 per cent in the second quarter.
| | |
| | | Quarterly Bulletin September 2014 |
The decline in the real value added by the primary sector moderated substantially from an annualised 17,2 per cent in the first quarter of 2014 to 5,1 per cent in the second quarter. The real value added by the agricultural sector gained further momentum while the real output of the mining sector declined at a much slower pace in the second quarter.
Growth in the real value added by the agricultural sector accelerated from an annualised rate of 2,5 per cent in the first quarter of 2014 to 4,9 per cent in the second quarter. The expansion largely reflected firm growth in field crop production, particularly maize, following favourable weather conditions in the first quarter of 2014. Livestock production also improved over the period.
Real gross domestic product
Percentage change at seasonally adjusted annualised rates
| | | | | | | | | | | | | | | | | | | | | | | | | | | | |
| | | 2013 | | | 2014 | |
| Sector | | 1st qr | | | 2nd qr | | | 3rd qr | | | 4th qr | | | Year | | | 1st qr | | | 2nd qr | |
Primary sector | | | 7,5 | | | | -4,7 | | | | 8,9 | | | | 12,8 | | | | 2,9 | | | | -17,2 | | | | -5,1 | |
Agriculture | | | -4,4 | | | | -3,0 | | | | 3,6 | | | | 6,4 | | | | 2,3 | | | | 2,5 | | | | 4,9 | |
Mining | | | 13,4 | | | | -5,4 | | | | 11,4 | | | | 15,7 | | | | 3,1 | | | | -24,7 | | | | -9,4 | |
Secondary sector | | | -5,9 | | | | 9,6 | | | | -4,5 | | | | 9,2 | | | | 1,0 | | | | -2,7 | | | | -0,9 | |
Manufacturing | | | -7,9 | | | | 11,7 | | | | -6,6 | | | | 12,3 | | | | 0,8 | | | | -4,4 | | | | -2,1 | |
Tertiary sector | | | 2,0 | | | | 2,2 | | | | 1,3 | | | | 1,5 | | | | 2,0 | | | | 1,8 | | | | 1,8 | |
Non-primary sector | | | 0,0 | | | | 4,0 | | | | -0,1 | | | | 3,3 | | | | 1,8 | | | | 0,7 | | | | 1,2 | |
Total | | | 0,8 | | | | 3,2 | | | | 0,7 | | | | 3,8 | | | | 1,9 | | | | -0,6 | | | | 0,6 | |
The Crop Estimate Liaison Committee has estimated the size of the expected maize crop for the 2013/14 production season to be roughly 14,0 million tons, that is 21,1 per cent more than the 11,8 million tons harvested in the 2012/13 production season and close to the previous record high of 14,4 million tons harvested in 1981.
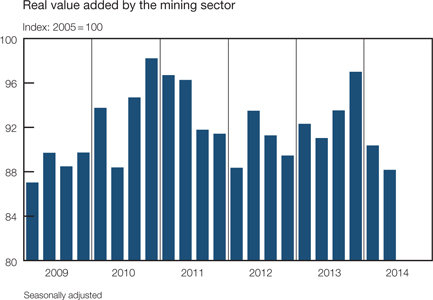
Mining production contracted further in the second quarter of 2014 although at a much slower pace than in the preceding quarter. Owing largely to the five-month labour strike in the platinum-mining sector, the real output of the mining sector shrank at an annualised rate of 9,4 per cent in the second quarter of 2014 following a marked contraction of 24,7 per cent in the first quarter. Apart from a pronounced decline in the real output of platinum group metals, the production of gold also receded in the second quarter of 2014. Gold-mining production was adversely affected by an increase in safety-related production stoppages, but these production losses were partly neutralised by a recovery in the production of iron ore following operational difficulties experienced at a prominent iron-ore mine in 2013 and early 2014. Overall, mining production subtracted 0,4 of a percentage point from total economic growth in the second quarter of 2014 after subtracting 1,3 percentage points in the first quarter of the year.
Industrial action in the platinum-mining sector, which lasted from 23 January 2014 to 24 June 2014, turned out to be the longest and most costly in the history of South Africa. Industry sources have estimated the loss in platinum production at 424 000 ounces; a further 16 000 ounces were lost during the start-up of operations due to medical and safety measures and procedures that the affected platinum mines had to adhere to. The platinum-mining sector was further affected by a loss of roughly 44 000 ounces over the period due to the consolidation of mining activities following the restructuring in the industry in 2013.
| | |
| Quarterly Bulletin September 2014 | | |


In the secondary sector, real output contracted at an annualised rate of 0,9 per cent in the second quarter of 2014 following a decline of 2,7 per cent in the preceding quarter. In the second quarter, the pace of decline in manufacturing slowed considerably, alongside a broadly unchanged rate of growth in the real value added by the construction sector; real output of the electricity, gas and water sector, however, contracted over the period.
Following a quarter-to-quarter annualised decline of 4,4 per cent in the first quarter of 2014, real manufacturing output shrank at a rate of 2,1 per cent in the second quarter, thereby subtracting 0,3 of a percentage point from the overall rate of growth over the period. With business confidence weak and demand sluggish in the second quarter, real output declined in the subsectors producing petroleum and chemical products; glass and non-metallic mineral products; textiles and clothing; electrical machinery; and motor vehicles and parts. These decreases were partially countered by higher production of wood and wood products; basic iron and steel, non-ferrous metal products and machinery; and radio, television and communication apparatus and professional equipment.
The decline in the real value added by the motor vehicles, parts and accessories and other transport equipment subsector reflected, in part, the adverse impact of the platinum strike in reducing supplies of locally manufactured goods to the motor vehicle manufacturing industry. Apart from the spill-over effects unsettling the supply of chemical products, building materials and machinery, production volumes were also affected by subdued domestic demand in a low business confidence environment.
Despite the slower pace of decline in the real value added by the manufacturing sector in the second quarter of 2014, the level of real manufacturing output was still 0,8 per cent lower than in the corresponding period in 2013. Consistent with the lower level of production, capacity utilisation in the manufacturing sector edged lower, from 82,1 per cent in the first quarter of 2014 to 80,6 per cent in the second quarter, with respondents indicating sluggish demand as the most important reason for the decline.
| | |
| | | Quarterly Bulletin September 2014 |
Having increased at an annualised rate of 0,1 per cent in the first quarter of 2014, the real value added by the sector supplying electricity, gas and water contracted at a rate of 0,7 per cent in the second quarter. This decline was mainly evident in the electricity-generating sector, reflecting the effect on demand of a relatively moderate winter and cumulatively higher real electricity prices alongside electricity supply constraints exacerbated by scheduled maintenance and unplanned power outages. Incidences of unplanned outages during the quarter stemmed from a fire and an explosion at two different power stations while planned maintenance involved the refuelling of Koeberg Unit 2 during the period. The domestic supply of electricity was augmented by higher electricity imports following the reparation of the transmission line from the Cahora Bassa hydroelectric scheme in May 2014.
Real economic activity in the construction sector sustained its relatively firm performance in the second quarter of 2014. The real value added by the construction sector advanced at an annualised rate of 5,0 per cent in the second quarter of 2014 following an increase of 4,9 per cent in the preceding quarter. Capital expenditure by public corporations was well supported by increased civil construction activity in the run-up to the national and provincial elections in the second quarter of 2014. By contrast, private sector construction activity dwindled on account of weak business conditions in the country. Capital spending on residential and non-residential building projects moderated over the same period.
The pace of increase in real value added by the tertiary sector was maintained at an annualised rate of 1,8 per cent in both the first and the second quarters of 2014. A decline in trade activity and slower growth in the real value added by the financial services sector were fully offset by firmer growth in the transport and general government services sectors over the period.
The real output of the commerce sector declined at an annualised rate of 0,2 per cent in the second quarter of 2014 following an increase of 2,1 per cent in the preceding quarter. Retailers and wholesalers suffered a setback as rising input costs, higher prices and a lustreless pace of increase in the real disposable income of households affected consumer spending. By contrast, the real value added by the motor-trade subsector advanced, albeit from a low base in the first quarter of 2014. Apart from an increase in domestic demand, the motor-trade subsector also benefited from increased foreign demand.
Growth in the real value added by the transport, storage and communication sector accelerated notably from 1,7 per cent in the first quarter of 2014 to 4,0 per cent in the second quarter. The higher growth was mainly evident in the land transport subsector following increases in both freight and passenger transportation over the period. Freight transportation advanced from a relatively low base in the first quarter of 2014 following a decrease in mining production and subsequent transportation of these products. Conversely, growth in the telecommunications subsector continued to benefit from a steady increase in the number of subscribers and the higher demand for data, aided by price competition between service providers.
Growth in the real value added by the finance, insurance, real-estate and business services sector slowed to an annualised rate of 1,5 per cent in the second quarter of 2014 following an increase of 2,0 per cent in the first quarter. The somewhat slower growth could be explained by reduced activity in the domestic securities market as trading activity on the JSE Limited (JSE) lost some momentum. The real output of the banking sector, however, increased in the second quarter of 2014.
The real value added by general government increased at annualised rates of 1,7 per cent and 2,9 per cent in the first and second quarters of 2014 respectively. The increase in real value added in the second quarters could largely be attributed to additional workers that were temporarily employed to assist with the national and provincial elections in May 2014.
| | |
| Quarterly Bulletin September 2014 | | |


Real gross domestic expenditure
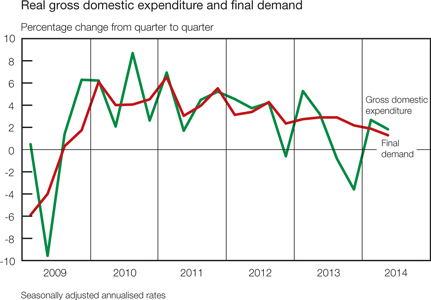
Growth in real gross domestic expenditure slowed from an annualised rate of 2,7 per cent in the first quarter of 2014 to 1,8 per cent in the second quarter. The slower growth resulted from a deceleration in real final demand; a moderation in real final consumption expenditure by households and real gross fixed capital formation more than neutralised a slower de-accumulation in real inventory holdings and an acceleration in final consumption expenditure by general government over the period.
Real final consumption expenditure by households and the change in real inventory investment made the largest contributions to growth in real gross domestic product in the second quarter of 2014 – together adding 1,4 percentage points to total economic growth. Real net exports subtracted 1,3 percentage points from growth over the period.
Contribution of expenditure components to growth in real gross domestic product
Percentage points
| | | | | | | | | | | | | | | | | | | | | | | | | | | | |
| | | 2013 | | | 2014 | |
| Component | | 1st qr | | | 2nd qr | | | 3rd qr | | | 4th qr | | | Year | | | 1st qr | | | 2nd qr | |
Final consumption expenditure | | | | | | | | | | | | | | | | | | | | | | | | | | | | |
Households | | | 1,6 | | | | 1,6 | | | | 1,4 | | | | 1,3 | | | | 1,7 | | | | 1,2 | | | | 1,0 | |
General government | | | 0,6 | | | | 0,4 | | | | 0,3 | | | | 0,4 | | | | 0,5 | | | | 0,3 | | | | 0,3 | |
Gross fixed capital formation | | | 0,7 | | | | 1,1 | | | | 1,4 | | | | 0,6 | | | | 0,9 | | | | 0,5 | | | | 0,1 | |
Change in inventories | | | 2,4 | | | | 1,7 | | | | -2,6 | | | | -5,2 | | | | -0,4 | | | | 1,6 | | | | 0,4 | |
Net exports | | | -4,8 | | | | -0,2 | | | | 1,6 | | | | 7,8 | | | | -0,5 | | | | -3,4 | | | | -1,3 | |
Residual | | | 0,2 | | | | -1,4 | | | | -1,4 | | | | -1,2 | | | | -0,3 | | | | -0,8 | | | | 0,1 | |
Gross domestic product | | | 0,8 | | | | 3,2 | | | | 0,7 | | | | 3,8 | | | | 1,9 | | | | -0,6 | | | | 0,6 | |
| | |
| | | Quarterly Bulletin September 2014 |
Real gross domestic expenditure
Percentage change at seasonally adjusted annualised rates
| | | | | | | | | | | | | | | | | | | | | | | | | | | | |
| | | 2013 | | | 2014 | |
| Component | | 1st qr | | | 2nd qr | | | 3rd qr | | | 4th qr | | | Year | | | 1st qr | | | 2nd qr | |
Final consumption expenditure | | | | | | | | | | | | | | | | | | | | | | | | | | | | |
Households | | | 2,4 | | | | 2,5 | | | | 2,1 | | | | 2,0 | | | | 2,6 | | | | 1,8 | | | | 1,5 | |
General government | | | 2,8 | | | | 1,7 | | | | 1,5 | | | | 2,0 | | | | 2,4 | | | | 1,4 | | | | 1,6 | |
Gross fixed capital formation | | | 3,8 | | | | 5,6 | | | | 7,0 | | | | 3,1 | | | | 4,7 | | | | 2,6 | | | | 0,5 | |
Domestic final demand | | | 2,7 | | | | 2,9 | | | | 2,9 | | | | 2,2 | | | | 2,9 | | | | 1,9 | | | | 1,3 | |
Change in inventories (R billions)* | | | 7,9 | | | | 16,4 | | | | 3,3 | | | | -22,3 | | | | 1,3 | | | | -14,4 | | | | -12,3 | |
Gross domestic expenditure | | | 5,3 | | | | 3,2 | | | | -0,8 | | | | -3,6 | | | | 2,2 | | | | 2,7 | | | | 1,8 | |
Real final consumption expenditure by households slowed for the fourth consecutive quarter in the second quarter of 2014. Real spending by households increased at an annualised rate of 1,5 per cent in the second quarter of 2014, having advanced at a rate of 1,8 per cent in the first quarter. This slower pace of spending was consistent with a moderation in growth in the disposable income of households. The slower growth in household spending was particularly evident in the slower pace of expenditure on durable and semi-durable goods and on services, whereas spending on non-durable goods accelerated over the period.
Real final consumption expenditure by households
Percentage change at seasonally adjusted annualised rates
| | | | | | | | | | | | | | | | | | | | | | | | | | | | |
| | | 2013 | | | 2014 | |
| Category | | 1st qr | | | 2nd qr | | | 3rd qr | | | 4th qr | | | Year | | | 1st qr | | | 2nd qr | |
Durable goods | | | 5,9 | | | | 12,6 | | | | 9,4 | | | | 6,9 | | | | 7,9 | | | | 2,8 | | | | 1,4 | |
Semi-durable goods | | | 7,6 | | | | 8,5 | | | | 7,1 | | | | 3,1 | | | | 6,7 | | | | 6,1 | | | | 2,0 | |
Non-durable goods | | | 2,4 | | | | 2,7 | | | | 0,5 | | | | 0,2 | | | | 2,2 | | | | -0,4 | | | | 0,7 | |
Services | | | 0,1 | | | | -2,1 | | | | 0,1 | | | | 1,7 | | | | 0,3 | | | | 2,2 | | | | 2,0 | |
Total | | | 2,4 | | | | 2,5 | | | | 2,1 | | | | 2,0 | | | | 2,6 | | | | 1,8 | | | | 1,5 | |
| | |
| Quarterly Bulletin September 2014 | | |


Household spending on durable goods lost further momentum in the second quarter of 2014 as real outlays slowed from an annualised rate of 2,8 per cent in the first quarter to 1,4 per cent in the second quarter. Expenditure on recreational and entertainment goods decelerated significantly in the second quarter, offsetting increased spending on furniture and appliances, and transport and computer equipment. As a result of the relatively weak external value of the rand, the declining trend in the prices of certain components of recreational and entertainment goods was arrested; in many instances, prices registered increases for the first time since the second quarter of 2009. The slower pace of spending on recreational and entertainment goods coincided with a deceleration in credit extended to the household sector. In the category for transport equipment, the decrease in expenditure on new motor vehicles was outdone by the household sector’s sustained appetite for used vehicles. The lower purchases of motor vehicles in the second quarter of 2014 were corroborated by slower growth in instalment loans, accounting for the bulk of loans utilised for the acquisition of motor vehicles. Furthermore, an increasing number of consumers extended the monthly redemption schedule for the financing of both new and used motor vehicles.
According to the First National Bank/Bureau for Economic Research (FNB/BER) Consumer Confidence Index, an increasing number of consumers continued to postpone the purchases of durable goods in anticipation of further increases in interest rates as well as escalating consumer price inflation. In addition, the subdued pace of spending on durable goods could be ascribed to low consumer confidence levels, high levels of consumer indebtedness, increases in energy and transport costs, and weak employment prospects for the remainder of the year.
Having expanded briskly at an annualised rate of 6,1 per cent in the first quarter of 2014, spending on semi-durable goods slowed to a rate of 2,0 per cent in the second quarter. Growth in household expenditure on motorcar tyres, parts and accessories receded while spending on clothing and footwear moderated over the period.
Subsequent to a decline of 0,4 per cent in the first quarter of 2014, household spending on non-durable goods increased at an annualised rate of 0,7 per cent in the second quarter. The increase could mainly be ascribed to higher spending on food, beverages and tobacco; household consumer goods; petroleum products; and medical and pharmaceutical products. By contrast, household spending on fuel and power declined over the period.
Real spending on services, constituting the largest part of total consumption expenditure by households, maintained its underlying momentum and increased at annualised rates of 2,2 per cent and 2,0 per cent in the first and second quarters of 2014 respectively. Higher real outlays on rent, household services, transport and communication services as well as miscellaneous services were partly countered by lower expenditure on medical services.
Growth in income from accommodation, restaurant and bar sales across all accommodation categories increased over the period, suggesting that the increased number of foreign tourists to South Africa had partly boosted domestic retail sales. The tourism industry continued to benefit from competitive holiday packages being offered, made possible in part by the depreciation in the exchange value of the rand. New regulations regarding the issuance of visa permits that were implemented in May 2014 could, however, temporarily delay the arrival of foreign tourists.
Following an increase of 1,7 per cent in the first quarter of 2014, growth in the real disposable income of households moderated to 1,3 per cent in the second quarter. As growth in nominal disposable income outpaced growth in household debt, the ratio of household debt to disposable income edged lower from 74,4 per cent in the first quarter of 2014 to 73,5 per cent in the second quarter. The cost of servicing household debt remained fairly low at 7,9 per cent of household disposable income in both the first and the second quarters of 2014.
A moderation in the pace of increase in the value of the housing stock during the second quarter of 2014 was largely offset by firm increases in the value of households’ equity holdings, resulting in an improvement in the net wealth of households and in the ratio of net wealth to disposable income in the second quarter of 2014.
| | |
| | | Quarterly Bulletin September 2014 |
Real final consumption expenditure by general government advanced at an annualised rate of 1,6 per cent in the second quarter of 2014 following an increase of 1,4 per cent in the first quarter. The faster pace of increase could be attributed to an increase in real compensation of employees and spending on non-wage goods and services; additional salaries and other expenses were mainly associated with the national and provincial elections in May 2014. Higher government spending on non-wage goods and services in the second quarter of 2014 reflected government’s commitment to improve the quality of the education and health systems. The level of real government spending in the first half of 2014 was 1,6 per cent higher than in the corresponding period in 2013.
Growth in real gross fixed capital formation lost further momentum, decelerating from an annualised rate of 2,6 per cent in the first quarter of 2014 to 0,5 per cent in the second quarter. Discouragingly, capital outlays by both private business enterprises (which constitute the bulk of total capital investment) and public corporations declined over the period. By contrast, growth in real fixed capital spending by general government accelerated at the same time.
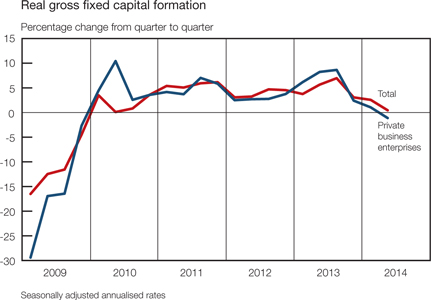
Real gross fixed capital formation by private business enterprises declined at a rate of 1,1 per cent in the second quarter of 2014. This contraction could be ascribed to lower capital outlays by most private-sector industries although more pronounced declines were registered in the mining, trade, construction, transport and personal services sectors. These declines were partially offset by higher capital outlays in the manufacturing sector. While capital outlays in most mining subsectors were relatively subdued, substantially lower capital spending in the platinum group metals industry weighed on aggregate capital investment in the mining sector. The decrease in capital spending by the construction sector could in part be explained by the low levels of business confidence being experienced in the country.
The Independent Power Producers Procurement Programme continued to gain momentum in the second quarter of 2014. Capital investment on construction works by these producers accelerated as a growing number of projects progressed towards completion during the period. In addition, the Square Kilometre Array project assembled its first antenna in the second quarter of 2014, thereby contributing to the increased construction work activity by private business enterprises over the period.
| | |
| Quarterly Bulletin September 2014 | | |


Real gross fixed capital formation
Percentage change at seasonally adjusted annualised rates
| | | | | | | | | | | | | | | | | | | | | | | | | | | | |
| | | 2013 | | | 2014 | |
| Sector | | 1st qr | | | 2nd qr | | | 3rd qr | | | 4th qr | | | Year | | | 1st qr | | | 2nd qr | |
Private business enterprises | | | 6,2 | | | | 8,2 | | | | 8,6 | | | | 2,4 | | | | 5,5 | | | | 1,0 | | | | -1,1 | |
Public corporations | | | -1,6 | | | | 0,1 | | | | 0,4 | | | | 0,8 | | | | 3,1 | | | | 6,0 | | | | -0,7 | |
General government | | | 1,5 | | | | 2,6 | | | | 9,0 | | | | 9,2 | | | | 3,5 | | | | 4,6 | | | | 8,9 | |
Total | | | 3,8 | | | | 5,6 | | | | 7,0 | | | | 3,1 | | | | 4,7 | | | | 2,6 | | | | 0,5 | |
Following an increase of 6,0 per cent in the first quarter of 2014, real fixed capital expenditure by public corporations declined at a rate of 0,7 per cent in the second quarter reflecting lower capital outlays by the electricity and transport subsectors. Eskom reduced its spending on construction works on ongoing projects compared with the first quarter of 2014. Capital outlays by Transnet on locomotives and wagons, as part of its expansion project on rail, were also tapered over the period. The South African National Roads Agency Limited (SANRAL) continued with the upgrading, strengthening, improvement and building of new facilities, although at a substantially slower pace.
Growth in real capital expenditure by general government accelerated from an annualised rate of 4,6 per cent in the first quarter of 2014 to 8,9 per cent in the second quarter. The faster pace of increase in real gross fixed capital expenditure by general government could be attributed to firm levels of capital spending by all three levels of government. Capital spending by general government focused on water supply and water treatment facilities, the building and refurbishing of schools, hospitals and other healthcare facilities, and the construction of mainly electrical substations. Spending on public works, roads and transport also featured prominently in government spending programmes over the period.
Box 1: The Infrastructure Development Act
The Infrastructure Development Act No. 23 of 2014 was signed into law by the President of South Africa on 30 May 2014, and became operational on 10 July 2014. The Act has been adopted to facilitate and co-ordinate public infrastructure development, to ensure that infrastructure development is given priority, to promote the development goals of the state through infrastructure development, and to improve the management of infrastructure during all life-cycle phases.
The Act also establishes the co-ordination structures of the Presidential Infrastructure Coordinating Commission (PICC), which ensures that all three spheres of government are part of the PICC and that all the main executive authorities across the public sector meet on a regular basis to drive the implementation of infrastructure development plans.
In establishing the PICC and its subsidiary structures as legally defined organs of the state, the Act endeavours to address the lack of co-ordination across the state to ensure common priorities and the management of trade-offs around infrastructure projects, to ensure a sufficiently strong level of public investment, and to improve capacity for managing all phases involved in the development of infrastructure.
Through the Act, the PICC acquired powers to expropriate land in line with the Constitution of South Africa and other relevant laws. The PICC is responsible for developing and maintaining the National Infrastructure Plan, which sets priorities and secures alignment across state agencies around infrastructure. The PICC is also required to assess the impact of infrastructure projects on economic and social development and inclusion. The structures of the PICC include representatives of local and provincial government, a Management Committee that is similarly representative but able to meet more often, and a secretariat, which is chaired by the Minister of Economic Development and is composed of ministers and deputy ministers. The requirements and stipulations of the Act, if successfully implemented, will contribute to enhanced levels of infrastructure development in the country.
| | |
| | | Quarterly Bulletin September 2014 |
The Act empowers the PICC Council to designate Strategic Integrated Projects (SIPs), which essentially incorporate several linked projects through the National Infrastructure Plan. This approach should increase co-ordination and prove advantageous in terms of a shared drive towards the completion of projects. It requires all agencies of the state to align their infrastructure plans with the SIPs. For a project to be classified as an SIP, it should be included in the National Infrastructure Plan, be of significant economic or social importance to the country or a province, and be above a certain rand value as set by the Minister of Economic Development. This approach should ensure that a proper evaluation is done before a project is classified as an SIP.
The Act will set time frames for the approval of regulatory decisions affecting the implementation of infrastructure projects. Instead of sequential approval processes, the Act provides for processes to run concurrently wherever possible to ensure that the state works to a common deadline and that this time frame provides for the incorporation of public consultation processes. The Act:
| • | | establishes in law the co-ordination structures of the PICC. This is done to ensure that all three spheres of government are part of the commission and that all the main executive authorities across the public sector are mandated to meet on a regular basis to drive the implementation of infrastructure. |
| • | | provides for SIPs that bring together a number of catalytic projects which together make up the National Infrastructure Plan. These allow for better integration of connected projects and improved monitoring of implementation. |
| • | | sets time frames for the approval of regulatory decisions affecting the implementation of infrastructure projects. Instead of sequential approval processes, it provides for processes to run concurrently wherever possible. This ensures that the state works to a common deadline and that this time frame provides for public consultation processes. |
| • | | sets out processes of co-ordination that require regulatory authorities and cross-cutting departments to work closely together through steering committees for each SIP which will co-ordinate efforts to speed up the implementation of infrastructure construction and completion. |
| • | | provides for the PICC to expropriate land required for infrastructure development but subjects these powers to the Constitution of South Africa and any Act of Parliament specifically dealing with expropriation which is passed by Parliament after the Act came into law. |
| • | | sets out the mechanism through which developmental targets can be set for each major infrastructure project, covering areas such as youth employment targets, greening the economy, skills development and broad-based empowerment. |
The Act does not change the responsibilities of accounting officers or authorities, and does not change the route for fiscal flows. Line departments and public entities will continue to receive money for specific infrastructure projects, and they will remain accountable to Parliament for the spending of these funds.
The National Development Plan, which led to the promulgation of the Infrastructure Development Act, setting the framework for the PICC implies that, for the first time since 1994, South Africa has established a clear policy basis from which infrastructure development can be undertaken. Government’s allocation of R1,5 trillion to infrastructure projects over the next five years is a critical step in clearing the backlog and underspending on critical infrastructure projects that South Africa urgently requires. If this investment is to yield effective results, rapid progress has to be made in converting the policy frameworks and legislation embedded in the New Growth Path, the National Development Plan and the Infrastructure Development Act into tangible projects to be implemented expeditiously.
Real inventory de-accumulation slowed marginally from R14,4 billion in the first quarter of 2014 to R12,3 billion in the second quarter. This slower pace of destocking was largely due to an accumulation of inventories in the electricity, gas and water as well as commerce sectors, while inventories in the mining sector continued to decline, albeit at a slower pace.
| | |
| Quarterly Bulletin September 2014 | | |


The accumulation of inventories in the electricity subsector in the second quarter of 2014 resulted primarily from an increase in the stocks of coal. With less electricity being produced at coal-powered plants in the second quarter of 2014 following subdued demand, increased market participation by key industrial customers and the growing availability of wind, gas and solar power, less coal was needed over the period. In the mining sector, the level of inventories at platinum mines in particular declined further over the period as these mining companies tried to fulfil export obligations as far as possible. However, the extent of the decline was moderated by an accumulation of iron-ore inventories made possible by higher production and lower sales volumes of this metal.
Stock levels in the commerce sector rose due to a build-up of agricultural stocks-in-trade, particularly maize and sunflower seeds. Industry sources expect that the maize crop for the current production year could be the largest in 33 years, with the harvested maize initially added to stocks-in-trade before being consumed or exported.
The level of industrial and commercial inventories as a percentage of non-agricultural gross domestic product edged higher, from 13,2 per cent in the first quarter of 2014 to 13,3 per cent in the second quarter.
Factor income
Year-on-year growth in total nominal factor income slowed from 7,3 per cent in the first quarter of 2014 to 6,4 per cent in the second quarter. The slightly lower growth resulted from weaker growth in both the gross operating surpluses of business enterprises and the total remuneration of employees over the period.
Measured over four quarters, growth in the total compensation of employees slowed from 7,2 per cent in the first quarter of 2014 to 6,5 per cent in the second quarter. The moderation in growth in salaries and wages could primarily be attributed to a slower pace of increase in the remuneration paid to employees in general government. In addition, remuneration in the mining sector contracted again in the second quarter of 2014 due to the no-work-no-pay principle during strikes, exacerbated by job losses in the industry following the closure of unprofitable shafts. However, the share of total remuneration of employees to total factor income increased from 51,9 per cent in the first quarter of 2014 to 53,0 per cent in the second quarter. In addition, the average wage settlement rate inched higher to 8,0 per cent in the second quarter of 2014 compared with 7,9 per cent recorded for the same period in 2013.
| | |
| | | Quarterly Bulletin September 2014 |
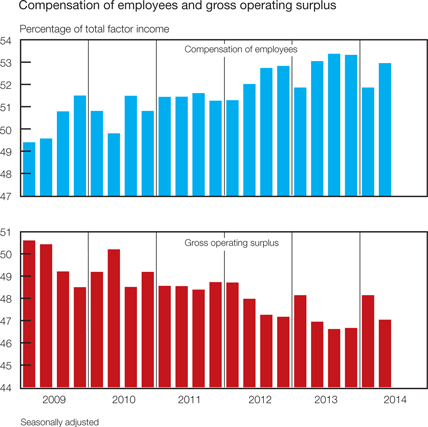
Alongside input cost pressures and above-inflation wage increases, the pace of increase in the total gross operating surplus of business enterprises, measured over four quarters, decelerated from 7,4 per cent in the first quarter of 2014 to 6,3 per cent in the second quarter. Although slower growth was evident in most sectors of the economy, it was most pronounced in the mining and finance sectors. Platinum-mining companies suffered significant losses in revenue and profits as the protracted industrial action weighed on activity in the subsector over the period. As a result, the gross operating surplus relative to total factor income decreased from 48,1 per cent in the first quarter of 2014 to 47,0 per cent in the second quarter.
Gross saving
South Africa’s national saving ratio or gross saving as a percentage of gross domestic product decreased from 14,6 per cent in the first quarter of 2014 to 13,2 per cent in the second quarter. Lower levels of saving by the corporate sector and general government, combined with a stable saving ratio for the household sector, resulted in the deterioration in the national saving performance over the period. The moderation in the saving ratio gave rise to an increase in the country’s dependency on foreign capital to finance gross capital formation. The foreign financing ratio subsequently increased from 23,6 per cent in the first quarter of 2014 to 32,0 per cent in the second quarter.
Gross saving by the corporate sector relative to gross domestic product decreased from 14,9 per cent in the first quarter of 2014 to 13,8 per cent in the second quarter. The moderation in the saving ratio followed increased year-on-year growth in dividend payments of 11,9 per cent while corporate tax payments advanced at a rate of 9,1 per cent in the second quarter.
Gross dissaving by general government rose from 1,9 per cent of gross domestic product in the first quarter of 2014 to 2,2 per cent in the second quarter. Growth in government income moderated mainly on account of slightly lower growth in tax revenues, especially from customs duties.
| | |
| Quarterly Bulletin September 2014 | | |


The gross saving rate of the household sector remained unchanged at 1,6 per cent in the first and second quarters of 2014 as private consumption expenditure remained broadly in step with households’ disposable income.
Employment
Notwithstanding the marginal contraction in real output in the South African economy in the first quarter of 2014 and a severely strained labour relations environment, formal non-agricultural employment increased somewhat over the period, entirely due to employment gains in the public sector. According to the Quarterly Employment Statistics (QES) survey published by Statistics South Africa (Stats SA), the number of people formally employed in the non-agricultural sector of the economy increased by 1,8 per cent on a seasonally adjusted and annualised basis in the first quarter of 2014, representing 38 500 additional job opportunities.2 This brought the level of formal non-agricultural employment to almost 8,52 million in the first quarter of 2014, for the first time surpassing the level reached at the previous peak in the employment cycle in the third quarter of 2008.
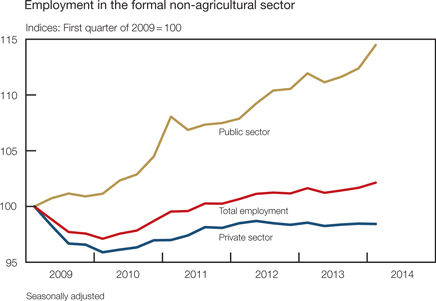
The pickup in formal non-agricultural employment in the first quarter of 2014 resulted from a marked acceleration in public-sector employment to an annualised rate of 7,7 per cent, as an additional 40 300 employment opportunities were created in the quarter. Apart from a decrease in employment at public-sector enterprises, all other public-sector tiers recorded employment gains. In particular, employment at local government level increased notably by some 28 400 job opportunities – largely related to government’s expanded public works programme.
Disappointingly, private-sector employment decreased by 1 800 job opportunities in the first quarter of 2014. Job losses during this quarter occurred in the gold-mining sector (recording the highest rate of decline); the private transport, storage and communication sector; the non-gold mining sector; and the manufacturing sector. Conversely, jobs were created in the construction sector (which registered the strongest pace); the private community, social and personal services sector; the finance, insurance, real-estate and business services sector; and the trade, catering and accommodation services sector.
| | |
| | | Quarterly Bulletin September 2014 |
Change in enterprise-surveyed formal non-agricultural employment by sector*
| | | | | | | | | | | | | | | | | | | | | | | | | | | | | | | | |
| | | Change over
one quarter | | | Change over four | | | | | | | |
| Sector | | 2013 | | | 2014 | | | quarters to
1st qr 2014 | | | Cumulative job
losses (-) gains (+) | |
| | 2nd qr | | | 3rd qr | | | 4th qr | | | 1st qr | | | Number | | | Per
cent | | | 4th qr
2008 to
1st qr 2010 | | | 2nd qr
2010 to
1st qr 2014 | |
Finance, insurance, real-estate and business services | | | 1 900 | | | | 4 000 | | | | 400 | | | | 6 600 | | | | 12 900 | | | | 0,7 | | | | -182 200 | | | | 112 000 | |
Manufacturing | | | -4 000 | | | | 600 | | | | 4 600 | | | | -3 400 | | | | -2 100 | | | | -0,2 | | | | -113 000 | | | | -40 900 | |
Trade, catering and accommodation services | | | -4 400 | | | | 5 600 | | | | 6 300 | | | | 3 000 | | | | 10 600 | | | | 0,6 | | | | -76 300 | | | | 69 400 | |
Construction | | | -4 600 | | | | -1 700 | | | | -7 500 | | | | 5 100 | | | | -8 500 | | | | -2,0 | | | | -48 300 | | | | 5 300 | |
Total mining | | | -4 100 | | | | -3 900 | | | | -8 300 | | | | -12 600 | | | | -28 900 | | | | -5,6 | | | | -40 700 | | | | 4 900 | |
Gold mining | | | -3 900 | | | | -5 800 | | | | -4 700 | | | | -5 200 | | | | -19 600 | | | | -14,2 | | | | -9 600 | | | | -40 900 | |
Other mining | | | -200 | | | | 1 900 | | | | -3 500 | | | | -7 400 | | | | -9 300 | | | | -2,5 | | | | -31 100 | | | | 35 900 | |
Private transport, storage and communication services | | | -1 300 | | | | -1 100 | | | | 1 400 | | | | -5 200 | | | | -6 200 | | | | -2,4 | | | | -2 000 | | | | -3 600 | |
Community, social and personal services | | | -2 800 | | | | 4 700 | | | | 8 200 | | | | 4 700 | | | | 14 800 | | | | 3,5 | | | | 13 400 | | | | 25 700 | |
Total private sector | | | -19 100 | | | | 8 200 | | | | 5 300 | | | | -1 800 | | | | -7 400 | | | | -0,1 | | | | -449 100 | | | | 162 900 | |
National departments | | | -2 500 | | | | -700 | | | | 1 600 | | | | 900 | | | | -700 | | | | -0,1 | | | | -2 500 | | | | 44 000 | |
Provinces | | | 9 000 | | | | 5 500 | | | | 1 900 | | | | 15 800 | | | | 32 200 | | | | 3,0 | | | | 51 600 | | | | 109 600 | |
Local governments | | | 3 300 | | | | 3 000 | | | | 8 200 | | | | 28 400 | | | | 42 900 | | | | 15,9 | | | | 15 200 | | | | 72 400 | |
Public transport, storage and communication services | | | -2 900 | | | | 600 | | | | -200 | | | | 2 200 | | | | -300 | | | | -0,2 | | | | -4 900 | | | | 17 800 | |
Other public-sector enterprises including electricity | | | -22 200 | | | | 1 100 | | | | 3 000 | | | | -7 000 | | | | -25 000 | | | | -11,1 | | | | -6 900 | | | | 13 000 | |
Total public sector | | | -15 300 | | | | 9 600 | | | | 14 500 | | | | 40 300 | | | | 49 100 | | | | 2,3 | | | | 52 500 | | | | 256 900 | |
Grand total | | | -34 400 | | | | 17 800 | | | | 19 800 | | | | 38 500 | | | | 41 700 | | | | 0,5 | | | | -396 600 | | | | 419 900 | |
| * | Components may not add to totals due to rounding |
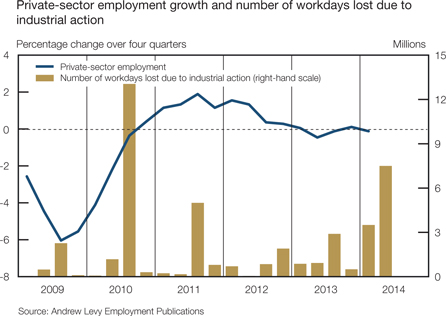
Employment creation in the domestic private sector has been sluggish since the 2008/09 economic recession. In fact, the table above shows that of the 449 100 private-sector jobs lost during the recession, only 162 900 – roughly 36 per cent – were recovered up to the first quarter of 2014. Although the private sector’s ability to create employment has been hampered by a number of factors (such as weak economic growth, low business and investor confidence, and electricity supply constraints) these factors have undoubtedly been exacerbated by South Africa’s adversarial labour relations environment in recent years. The first graph on the next page shows private-sector employment growth alongside the number of workdays lost due to industrial action. The number of workdays lost has risen steadily since the second half of 2011 while private-sector employment growth has moderated notably over the period. Apart from impeding employment growth, the turbulent labour relations environment has damaged investor confidence and probably contributed to the recent downgrade of South Africa’s sovereign credit rating by an international credit-rating agency.
| | |
| Quarterly Bulletin September 2014 | | |


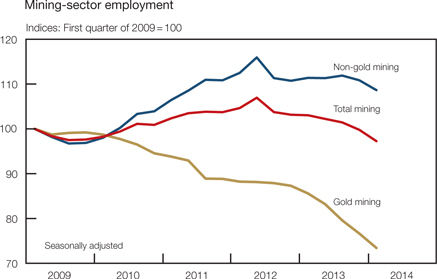
Following the Marikana tragedy in August 2012, employment in the mining sector decreased for seven consecutive quarters up to the first quarter of 2014. Roughly 48 400 employment opportunities were lost in this sector between the third quarter of 2012 and the first quarter of 2014, – reflecting the destruction of 9,1 per cent of total mining-sector employment. Labour paring was most pronounced in the gold-mining sector over this period, but nevertheless also occurred in the non-gold mining sector. The pace of job shedding accelerated in both the gold-mining and the non-gold mining sectors in the first quarter of 2014, amid the protracted platinum-mining strike. After 103 days, the strike – the longest in South African history – was eventually terminated at the end of June 2014. It could take years before workers recover the wages they had forgone during the five-month strike, particularly in light of the final wage settlement not differing materially from offers made in the first few weeks of the strike. Furthermore, restructuring by some large platinum producers following the strike could result in further job losses in coming quarters. The antagonistic labour relations environment, coupled with the depth of many South African mines and the associated rise in overall cost pressures, could boost the pace of mechanisation in the mining sector over the next few years, particularly at new-generation mines.
| | |
| | | Quarterly Bulletin September 2014 |
While employment levels in the manufacturing sector are still below those recorded before the 2008/09 recession, the pace of job shedding appears to have bottomed out over the past two years. However, following two successive quarters of moderate employment growth, manufacturing employment decreased again by 1,2 per cent in the first quarter of 2014 as manufacturing output and confidence were dented by the lengthy industrial action in the platinum sector. Furthermore, from early July 2014 – only a few days after the protracted platinum-mining strike ended – the National Union of Metalworkers of South Africa (NUMSA) embarked on a month-long countrywide strike involving more than 200 000 workers in the steel and engineering industry.
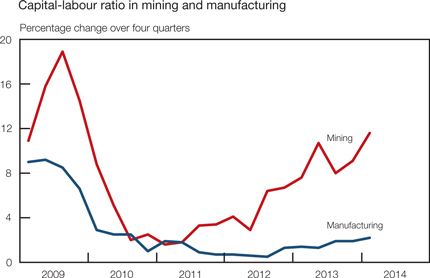
Business confidence in manufacturing, as reported in the Manufacturing Survey of the BER, fell sharply from 41 index points in the first quarter of 2014 to 25 in the second quarter – its lowest level since the start of the cyclical upswing in September 2009. Most of the underlying activity indicators deteriorated sharply, with the domestic demand and output indicators falling to levels last reported in the wake of the 2009 recession, while employment indicators remained subdued in the second quarter of 2014. The sharp drop in sentiment in the manufacturing sector was most likely exacerbated by the labour unrest in the platinum-mining sector as well as the looming NUMSA strike, which most manufacturers would have anticipated at the time of the second-quarter survey. The month-long NUMSA strike, which was characterised by numerous incidents of intimidation, violence and vandalism, was resolved at the end of July when the union signed a new three-year wage agreement with the Steel and Engineering Industries Federation of South Africa (SEIFSA), representing larger companies. However, citing unaffordability, the agreement was not signed by the National Employers’ Association of South Africa (NEASA), representing around 3 000 small- and medium-sized manufacturers. Some employers have indicated that the recent industrial action and resultant high wage increases could bring about further job losses and increased mechanisation in the manufacturing sector. The accompanying graph shows year-on-year growth in the capital-labour ratio in the mining and manufacturing sectors, with the capital intensity of both sectors rising in recent years.
Employment levels increased somewhat in the services sectors of the economy in recent quarters. Employment growth in the finance, insurance, real-estate and business services sector accelerated to 1,4 per cent in the first quarter of 2014, following three successive quarters of fairly muted employment gains. Similarly, employment in the trade, catering and accommodation services sector increased marginally by 0,7 per cent in the first quarter of 2014 – its third successive quarterly increase. The BER’s Retail Survey for the second quarter of 2014 showed
| | |
| Quarterly Bulletin September 2014 | | |


that business confidence among retailers had improved from 39 index points in the first quarter of 2014 to 49 in the second quarter, despite underlying indices suggesting that business conditions in the trade sector remained tough.
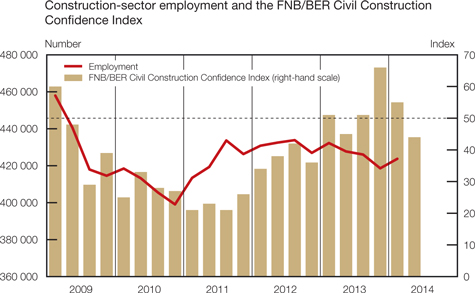
Notwithstanding uncertain employment prospects in the construction sector, the sector increased its job complement by 5,0 per cent in the first quarter of 2014, following three successive quarters of labour paring. Having fallen by 11 index points to 55 in the first quarter of 2014, the FNB/BER Civil Confidence Index shed a further 11 points to 44 in the second quarter of 2014. Confidence levels receded despite a marked increase in construction activity, with the mismatch between activity and confidence likely due to the spread of construction work which seemed concentrated among only a few firms and provinces. The drawn-out strike in the platinum-mining sector and weak economic growth prospects may also have made respondents more concerned about the current business environment. The FNB/BER Building Confidence Index fell below the key 50-index mark in the first quarter of 2014, decreasing by 11 index points to 41 in the second quarter of 2014. According to the BER, the decline in building confidence was largely due to a sharp decline in the confidence levels of manufacturers of building material, reflecting weaker domestic demand. The lower confidence levels were corroborated by a decrease in the real value of building plans passed in the second quarter of 2014.
According to the Quarterly Labour Force Survey (QLFS) conducted by Stats SA, the number of persons employed in South Africa increased by 39 000 from the first quarter of 2014 to the second quarter, raising the total level of employment to 15,09 million persons. Although total employment increased by 403 000 in the year to the second quarter of 2014, the year-on-year growth rate nevertheless moderated further from 3,4 per cent in the first quarter of 2014 to 2,7 per cent in the second quarter. The majority of employment opportunities was created in the formal non-agricultural sector of the economy and by private households, recording increases of 381 000 and 75 000 respectively in the year to the second quarter of 2014. Only 19 000 additional people were employed in the informal sector, while the agriculture, hunting, forestry and fishing sector shed a further 73 000 employment opportunities over the same period. Employment in this sector had decreased for five consecutive quarters up to the second quarter of 2014, with a cumulative 94 000 jobs lost, representing a reduction in employment of 12,3 per cent over the period.
| | |
| | | Quarterly Bulletin September 2014 |
Disconcertingly, the number of unemployed persons increased by a further 87 000 from the first quarter of 2014 to the second quarter, bringing the total number of unemployed South Africans to 5,15 million – its highest level since the inception of the QLFS in the first quarter of 2008. Consequently, the official unemployment rate edged up further to 25,5 per cent in the second quarter of 2014 from 25,3 per cent a year earlier and 25,2 per cent in the preceding quarter. The seasonally adjusted unemployment rate also rose marginally, from 25,0 per cent in the first quarter of 2014 to 25,2 per cent in the second quarter. The youth unemployment rate receded somewhat, from 53,2 per cent in the first quarter of 2014 to a still high 51,8 per cent in the second quarter.

Labour cost and productivity
The year-on-year pace of increase in nominal remuneration per worker in the formal non-agricultural sector of the economy decelerated notably from 7,7 per cent in the fourth quarter of 2013 to 6,1 per cent in the first quarter of 2014, entirely due to a marked slowdown in private-sector remuneration growth. Growth in real salaries and wages per worker in the formal non-agricultural sector of the economy accordingly moderated from 1,9 per cent in the year to the fourth quarter of 2013 to only 0,1 per cent in the year to the first quarter of 2014.
Private-sector remuneration per worker increased at a rate of 6,2 per cent in the year to the first quarter of 2014, notably slower than the rate of increase of 8,7 per cent recorded in the fourth quarter of 2013. Although remuneration growth slowed in all the private subsectors, the slowdown was most pronounced in the mining sector where the year-on-year rate slowed from 11,6 per cent in the fourth quarter of 2013 to 0,8 per cent in the first quarter of 2014. Growth in salaries and wages per worker in the gold-mining sector decelerated from 23,2 per cent to 11,3 per cent, while remuneration growth in the non-gold mining sector slowed from 7,8 per cent to -2,7 per cent over the same period, largely due to the majority of platinum-mining workers not being remunerated for the duration of the protracted labour strike while still being counted as employees. The highest wage increases per worker were recorded in the gold-mining sector (11,3 per cent); the trade, catering and accommodation services sector (9,4 per cent); the manufacturing sector (7,2 per cent); and the finance, insurance, real-estate and business services sector (6,6 per cent).
| | |
| Quarterly Bulletin September 2014 | | |


Public-sector remuneration growth quickened marginally from 5,2 per cent in the year to the fourth quarter of 2013 to 5,3 per cent in the year to the first quarter of 2014. The highest year-on-year increase in public-sector remuneration per worker in the first quarter of 2014 was recorded by public enterprises (15,1 per cent), followed by provinces (5,3 per cent) and national departments (3,8 per cent).
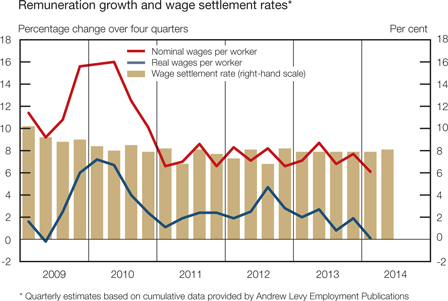
According to Andrew Levy Employment Publications, the average wage settlement rate in collective bargaining agreements amounted to 8,0 per cent in the first half of 2014, marginally up from 7,9 per cent in the year 2013 as a whole. Disconcertingly, the number of workdays lost due to strike action rose notably from 1,8 million in the first half of 2013 to 7,5 million in the first half of 2014. The marked increase was largely due to the prolonged strike in the platinum-mining sector, which alone resulted in 7,2 million workdays lost. The countrywide NUMSA strike could furthermore add significantly to the number of workdays lost in the third quarter of 2014, considering that it lasted a month and involved roughly three times the number of workers that were involved in the recent platinum-mining strike.
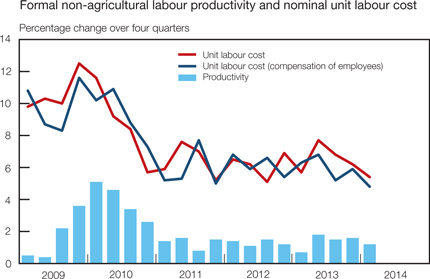
Year-on-year growth in labour productivity decelerated from 1,6 per cent in the fourth quarter of 2013 to 1,2 per cent in the first quarter of 2014 as employment growth remained unchanged while output growth moderated notably in the year to the first quarter of 2014. However, nominal remuneration growth slowed more than output growth in the year to the first quarter of 2014, resulting in nominal unit labour cost in the formal non-agricultural sector of the economy decelerating from 5,9 per cent in the fourth quarter of 2013 to 4,8 per cent in the first quarter of 2014. Similarly, labour productivity growth in the manufacturing sector slowed from 1,2 per cent in the fourth quarter of 2013 to 0,6 per cent in the first quarter of 2014, and nominal unit labour cost in this sector moderated from 7,1 per cent to 6,5 per cent over the same period.
| | |
| | | Quarterly Bulletin September 2014 |
Prices
Despite lacklustre output growth, domestic inflationary pressures intensified further in recent months, largely due to an acceleration in petrol and food price inflation and broader exchange rate pass-through to producer and consumer prices. Encouragingly, however, producer price inflation has moderated somewhat since April 2014. Headline twelve-month consumer price inflation accelerated gradually to its highest level since July 2009 when it amounted to 6,6 per cent in both May and June 2014, before moderating to 6,3 per cent in July,3 thereby breaching the upper limit of the inflation target range of 6 per cent for a fourth successive month.
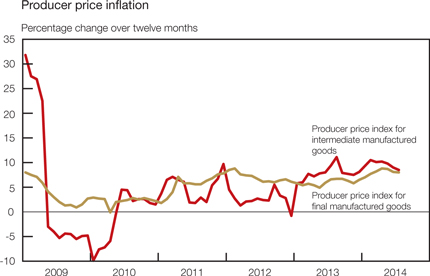
Most measures of producer price inflation accelerated sharply in the opening months of 2014 before moderating towards the middle months of the year. Producer price inflation for intermediate manufactured goods accelerated to 10,5 per cent in February 2014 but slowed gradually thereafter to 8,5 per cent in July as price inflation moderated across a fairly broad spectrum of intermediate manufactured goods. Similarly, producer price inflation for final manufactured goods accelerated to 8,8 per cent in April 2014 as price inflation accelerated across most subcategories. It subsequently moderated to 8,0 per cent in July 2014 on account of a slower pace of increase in the prices of food products, electrical machinery and transport equipment.
| | |
| Quarterly Bulletin September 2014 | | |


Despite fairly subdued increases in international commodity prices, producer price inflation for mining products quickened from -0,2 per cent in October 2013 to 6,6 per cent in April 2014, affected mainly by the depreciation in the exchange value of the rand. Producer price inflation for mining commodities slowed thereafter to 5,8 per cent in June. Likewise, producer price inflation for agriculture, forestry and fishing products accelerated to 11,7 per cent in March 2014 before moderating to 3,9 per cent in July. Over the same period, producer price inflation for electricity and water also moderated from 14,6 per cent to 7,8 per cent due to a slower pace of increase in both electricity and water prices. The deceleration in all measures of producer price inflation in recent months could possibly be indicative of the diminishing impact and partial reversal of the depreciation in the exchange value of the rand.
Owing in part to the steady depreciation in the exchange value of the rand up to the end of January 2014, the twelve-month rate of increase in the unit value index for imported commodities4 accelerated to 21,0 per cent in January 2014 and roughly maintained the pace of increase in the ensuing five months. Price increases for imported commodities were fairly pervasive among the various subcategories, with the main contributors to the annual increase of 21,5 per cent in June 2014 being textile products, coke oven and other refined petroleum products, pharmaceutical and other chemical products, machinery for mining, quarrying and construction as well as radio, television and communication equipment and apparatus.
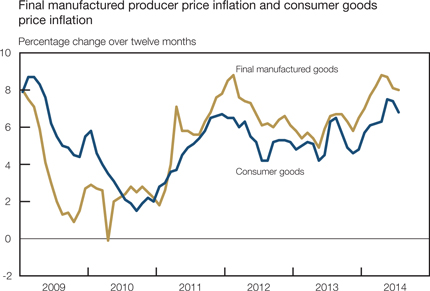
Subsequent to the acceleration in producer price inflation, headline consumer price inflation quickened from a recent low of 5,3 per cent in November 2013 to 6,6 per cent in May and June 2014, before moderating to 6,3 per cent in July. This acceleration could largely be attributed to consumer goods price inflation which accelerated from 4,6 per cent in November 2013 to 7,4 per cent in June 2014; non-durable goods price inflation in particular quickened from 5,4 per cent to 8,4 per cent over the period due to higher food and petrol prices. In addition, further exchange rate pass-through gave rise to an acceleration in semi-durable goods price inflation from 2,9 per cent in October 2013 to 5,1 per cent in July 2014, and in durable goods price inflation from 1,9 per cent to 4,6 per cent over the same period. In particular, price inflation for clothing and footwear quickened to 5,2 per cent in July 2014 while that for new vehicles accelerated to 7,8 per cent in June 2014 – its highest level in almost five years – before slowing to 7,4 per cent in July.
| | |
| | | Quarterly Bulletin September 2014 |
Consumer services price inflation remained sticky at the upper limit of the inflation target range; accelerating gradually from 5,7 per cent in February 2014 to 6,0 per cent in both June and July. The marginal pickup in consumer services price inflation in recent months resulted primarily from a quickening in price inflation for housing and utilities, household content and services, restaurants and hotels as well as health and transport insurance services. Conversely, price inflation for communication services moderated further to -0,9 per cent in July 2014. Thus far, the recent marked acceleration in consumer goods price inflation does not appear to have spilled over to consumer services price inflation.
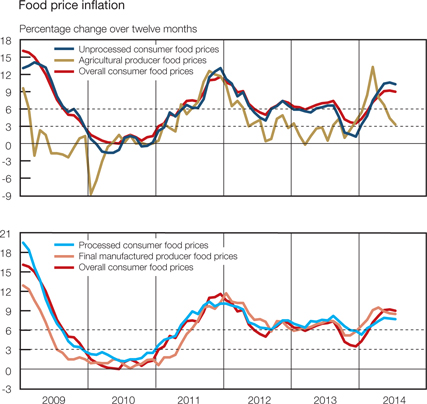
Notwithstanding an environment of slowing global food price inflation, the recent acceleration in domestic inflation could largely be ascribed to a build-up of domestic food price pressure. Agricultural producer price inflation accelerated notably from 1,0 per cent in October 2013 to 13,3 per cent in March 2014 as price inflation quickened among a broad spectrum of agricultural commodities. In particular, producer price inflation for cereals and crops accelerated sharply to 27,6 per cent in February 2014 as domestic maize prices rose significantly on account of drought conditions in the North West Province and fears of maize inventory depletion. Producer price inflation for live animals responded with a slight lag, accelerating to 8,9 per cent in May 2014 on account of rising feed costs and farmers restocking their herds following the drought. Encouragingly, agricultural producer price inflation moderated to 3,9 per cent in July 2014, largely due to a significantly slower pace of increase in the prices of cereals and crops as it became clear that the maize crop would be of near-record size. Producer food prices at the manufactured level responded to higher agricultural producer food prices with a slight lag, accelerating from 5,2 per cent in November 2013 to 9,5 per cent in April 2014, slowing somewhat to 8,5 per cent in July. The upward trend in final manufactured producer food price inflation was fairly pervasive among the various food subcategories.
| | |
| Quarterly Bulletin September 2014 | | |


The acceleration in agricultural producer food price inflation led to a quickening in unprocessed consumer food price inflation from 1,2 per cent in December 2013 to 10,6 per cent in June 2014. Similarly, processed consumer food price inflation picked up pace and amounted to 7,9 per cent in May 2014 on account of the acceleration in final manufactured producer food price inflation. Accordingly, overall consumer food price inflation accelerated markedly from 3,5 per cent in December 2013 to 9,2 per cent in June 2014 – the highest rate of increase in 28 months. The faster pace of increase in consumer food prices was broad-based among the various consumer food subcategories as seven of the nine food categories – with a combined weight of 94 per cent in the consumer food price basket – registered twelve-month rates of increase in excess of the upper limit of the inflation target range in June 2014. Consumer food price inflation moderated marginally to 9,0 per cent in July 2014, suggesting that consumer food price inflation was nearing a peak as falling agricultural commodity prices were expected to be passed on to consumers.
Consumer food prices
Percentage change over twelve months
| | | | | | | | | | | | | | | | |
| | | Weights | | | 2014 | |
| | | | May | | | Jun | | | Jul | |
Bread and cereals | | | 3,55 | | | | 10,1 | | | | 10,5 | | | | 8,7 | |
Meat | | | 4,56 | | | | 8,2 | | | | 8,7 | | | | 8,7 | |
Fish | | | 0,37 | | | | 8,1 | | | | 8,3 | | | | 8,0 | |
Milk, cheese and eggs | | | 1,74 | | | | 9,9 | | | | 10,1 | | | | 11,7 | |
Oils and fats | | | 0,55 | | | | 4,2 | | | | 3,3 | | | | 2,7 | |
Fruit | | | 0,23 | | | | 5,7 | | | | 1,5 | | | | 2,3 | |
Vegetables | | | 1,61 | | | | 13,3 | | | | 12,3 | | | | 11,8 | |
Sugar, sweets and desserts | | | 0,65 | | | | 6,4 | | | | 6,3 | | | | 7,7 | |
Other foods | | | 0,94 | | | | 8,1 | | | | 7,1 | | | | 8,6 | |
All food items | | | 14,20 | | | | 9,1 | | | | 9,2 | | | | 9,0 | |
Following a pickup in the opening months of 2014, the international food price index (denominated in US dollar) of the Food and Agriculture Organization (FAO) receded in the four months to July, largely due to a marked decrease in cereal and vegetable oil prices. As a result, international food prices were 1,7 per cent lower in July 2014 than a year earlier. At the same time, the international cereals price index decreased notably due to falling maize and wheat prices reflecting, inter alia, favourable weather conditions, good supply prospects for 2014/15 and diminishing concerns over disruptions of shipments from Ukraine. Encouragingly, international cereals prices remained 16,6 per cent below their level twelve months earlier, suggesting muted international food price pressure on domestic food price inflation in the months ahead.
Box 2: Recent maize and wheat price dynamics and their effect on expected food price inflation outcomes
Changes in domestic food prices have often been one of the principle drivers of South African inflation outcomes, not least due to food’s fairly large weighting of 14,20 per cent in the overall consumer price index. The two main subcategories within the consumer food price basket are meat as well as bread and cereals, together accounting for 57 per cent of the overall consumer food price basket, with weightings of 4,56 per cent and 3,55 per cent respectively. In turn, within the bread and cereals subcategory, bread products have a fairly large weighting of 1,75 per cent while that of maize meal amounts to only 0,68 per cent. Thus, since wheat is the main ingredient in the production of bread products, changes in wheat prices have a larger impact on the outcome of measured consumer price inflation than maize prices do, given the higher weight of bread products relative to maize products in the consumer food price basket.
| | |
| | | Quarterly Bulletin September 2014 |
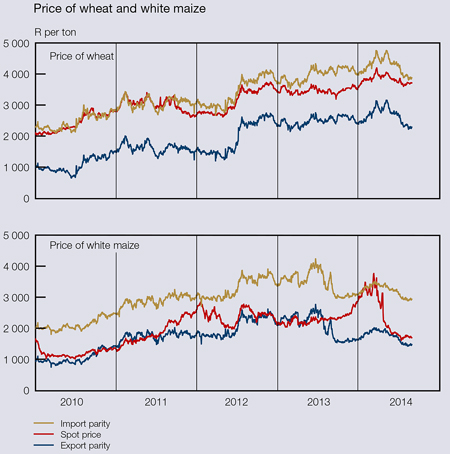
In South Africa, white maize is generally used for the production of maize meal for human consumption while yellow maize is primarily used as animal feed. Domestic maize prices are determined by a combination of factors, including international maize prices and the size of the domestic maize crop. While international maize prices receded during the latter half of 2013, the spot price of domestic white maize increased markedly from R2 163 per ton on 2 July 2013 to R3 765 per ton on 11 March 2014 – an increase of 74 per cent – on account of drought conditions in the North West Province. The domestic spot price of wheat followed international wheat prices higher, increasing from R3 301 per ton on 23 September 2013 to R4 195 per ton on 24 March 2014 – an increase of 27 per cent. The rise in domestic maize and wheat prices resulted in a marked acceleration in agricultural producer price inflation for cereals and other crops, from -8,2 per cent in August 2013 to 27,6 per cent in February 2014. These price increases were passed on to consumers, with consumer price inflation for bread and cereals subsequently quickening from 4,3 per cent in December 2013 to 10,5 per cent in June 2014.
Fortunately, concerns related to the initial expectation of a poor 2014 domestic maize crop following drought conditions were allayed by repeated increases in crop forecasts for both white and yellow maize by the Department of Agriculture’s Crop Estimates Committee between the first estimate in February 2014 and the sixth estimate in July. According to the Committee’s latest forecast, the domestic maize crop in 2014 is expected to be around 14,017 million tons, that is 18,7 per cent more than the final crop in 2013 of 11,811 million tons. Consequently, the spot price of domestic white maize declined notably, by around 55 per cent, to roughly R1 700 per ton in August 2014. In addition, international wheat prices receded in recent months as initial fears of possible wheat supply disruptions from Ukraine subsided. Although the spot price of domestic wheat followed suit, it decreased only by around 13 per cent but continued to approximate the import parity price level, reflecting the fact that South Africa remains a net importer of wheat, a situation that is expected by industry experts to become more acute in coming years. On 29 July 2014, the Committee announced that the preliminary estimate for the area cultivated for wheat was 484 000 hectares, the smallest area planted to wheat on record.
| | |
| Quarterly Bulletin September 2014 | | |


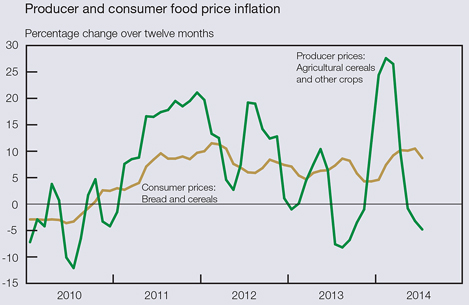
The decrease in the spot price of domestic maize and wheat in recent months resulted in a marked deceleration in agricultural producer price inflation for cereals and other crops: to -4,8 per cent in July 2014. The benefits of the decrease in agricultural commodity prices are expected to be passed on to consumers in the months ahead. However, given the relatively large weight of wheat products relative to maize products in the bread and cereals category of the consumer food price basket, coupled with the fact that the domestic wheat price should remain close to its import parity price level in the months ahead, the moderation in consumer food price inflation is expected to be less pronounced than that in agricultural producer food price inflation.
Subsequent to a period of fairly stable underlying inflationary pressures in the latter half of 2013, most measures of underlying inflation accelerated somewhat towards the upper limit of the inflation target range in the first half of 2014. Subtracting the impact of the more volatile food and petrol prices from the calculation of targeted headline consumer price inflation, underlying inflation remained unchanged at 5,4 per cent for the six consecutive months up to January 2014 before quickening to reach 5,9 per cent in July. Similarly, when further excluding the impact of electricity prices from the calculation of targeted headline consumer price inflation, the resultant underlying measure of inflation remained unchanged at 5,3 per cent for the six consecutive months up to February 2014 before accelerating gradually to 5,7 per cent in July.
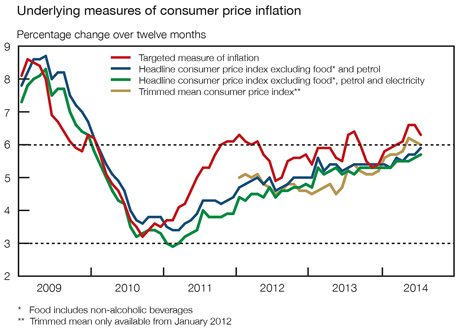
| | |
| | | Quarterly Bulletin September 2014 |
In addition, trimmed mean consumer price inflation accelerated from 5,6 per cent in January 2014 to 6,2 per cent in May, before receding somewhat to 6,0 per cent in July. The recent acceleration in the underlying measures of consumer price inflation largely reflected the lagged effect of broader exchange rate pass-through to consumer price inflation following the depreciation in the exchange rate of the rand in 2013 and early 2014.
An analysis of price changes based on the classification of individual consumption by purpose (COICOP) categories shows that in July 2014 consumer price inflation accelerated in six of the twelve COICOP categories, moderated in four categories and remained unchanged in two categories. The twelve-month rates of increase in five of the COICOP categories exceeded the upper limit of the inflation target range of 6 per cent in July 2014, while six categories recorded price increases within the inflation target range and one category registered a rate of change below the lower limit of 3 per cent of the inflation target range, as shown in the accompanying table.
Headline consumer price inflation in COICOP categories
Percentage change over twelve months
| | | | | | | | | | | | | | | | |
| | | Weights | | | 2014 | |
| | | | May | | | Jun | | | Jul | |
Food and non-alcoholic beverages | | | 15,41 | | | | 8,8 | | | | 8,8 | | | | 8,8 | |
Alcoholic beverages and tobacco | | | 5,43 | | | | 5,2 | | | | 5,6 | | | | 5,8 | |
Clothing and footwear | | | 4,07 | | | | 5,4 | | | | 5,1 | | | | 5,2 | |
Housing and utilities | | | 24,52 | | | | 5,7 | | | | 5,8 | | | | 5,9 | |
Household content, maintenance and equipment | | | 4,79 | | | | 3,7 | | | | 4,0 | | | | 3,9 | |
Health | | | 1,46 | | | | 4,6 | | | | 5,4 | | | | 5,8 | |
Transport | | | 16,43 | | | | 8,9 | | | | 8,6 | | | | 6,9 | |
Communication | | | 2,63 | | | | -0,5 | | | | -1,1 | | | | -1,4 | |
Recreation and culture | | | 4,09 | | | | 2,7 | | | | 2,6 | | | | 3,2 | |
Education | | | 2,95 | | | | 8,7 | | | | 8,7 | | | | 8,7 | |
Restaurants and hotels | | | 3,50 | | | | 8,3 | | | | 8,4 | | | | 8,2 | |
Miscellaneous goods and services | | | 14,72 | | | | 6,8 | | | | 6,9 | | | | 7,1 | |
All items headline consumer price index | | | 100,00 | | | | 6,6 | | | | 6,6 | | | | 6,3 | |
The recent movements in administered price inflation could largely be attributed to changes in domestic petrol prices. As such, administered price inflation accelerated from 7,4 per cent in April 2014 to 8,9 per cent in May, largely due to a quickening in petrol price inflation from 9,1 per cent to 14,3 per cent over the same period. Despite an increase of 31 cents per litre in the inland price of 95-octane petrol in July 2014, year-on-year petrol price inflation nevertheless moderated to 8,3 per cent due to favourable base effects as the inland price of 95-octane petrol increased by 84 cents per litre in July 2013. Consequently, administered price inflation decelerated to 7,0 per cent in July 2014. When excluding the effect of petrol prices from the calculation of administered prices, this rate of increase has been decelerating gradually since the middle of 2009, amounting to 6,4 per cent in July 2014. The gradual moderation in this measure of administered price inflation resulted largely from a protracted slowdown in electricity price inflation. When further excluding electricity prices from the calculation, the rate of increase in administered prices also decelerated in recent months, from 6,9 per cent in January 2014 to 6,0 per cent in July. On 30 July 2014, the National Energy Regulator of South Africa (NERSA) granted Eskom the recovery of R7,8 billion of the Regulatory Clearing Account (RCA) balance for the second Multi-Year Price Determination. Eskom had initially applied for the recovery of a cumulative RCA balance of R18,4 billion. The RCA recovery will result in an additional electricity tariff increase to be implemented from 1 April 2015, over and above the 8,0 per cent already approved by NERSA under the third Multi-Year Price Determination, thereby adding to the domestic inflationary pressures in 2015/16.
| | |
| Quarterly Bulletin September 2014 | | |


Despite the recent acceleration in consumer price inflation, inflation expectations as reflected in the Inflation Expectations Survey conducted by the BER remained anchored at the upper end of the target band: the average inflation expectations of financial analysts, business representatives and trade union representatives for 2014 and 2015 remained unchanged at 6,1 per cent in the second quarter of 2014. Financial analysts expected inflation to moderate from 6,2 per cent in 2014 to 5,7 per cent in 2015 and further to 5,4 per cent in 2016. Trade union representatives expected inflation to remain unchanged at around 6 per cent over the whole forecast period. In contrast, business representatives expected inflation to accelerate gradually from 6,2 per cent in 2014 to 6,4 per cent in 2016. Over a five-year horizon, financial analysts continued to expect inflation to average about 5,5 per cent while business representatives still expected inflation to average 6,5 per cent. In contrast, labour union representatives reversed their five-year forecast from 6,1 per cent to 6,5 per cent. Household inflation expectations for the next twelve months declined for the second successive quarter, from 6,9 per cent in the fourth quarter of 2013 to 6,7 per cent in the first quarter of 2014 and 6,3 per cent in the second quarter – the lowest level since the first quarter of 2012.
Headline consumer price inflation expectations
Per cent, as surveyed in the second quarter of 2014
| | | | | | | | | | | | | | | | |
| Average inflation expected for: | | Financial
analysts | | | Business
representatives | | | Trade union
representatives | | | All surveyed
participants | |
2014 | | | 6,2 | | | | 6,2 | | | | 6,0 | | | | 6,1 | |
2015 | | | 5,7 | | | | 6,3 | | | | 6,1 | | | | 6,1 | |
2016 | | | 5,4 | | | | 6,4 | | | | 6,1 | | | | 5,9 | |
Source: Bureau for Economic Research, Stellenbosch University
| | |
| | | Quarterly Bulletin September 2014 |
Foreign trade and payments
International economic developments
Global economic activity rebounded in the second quarter of 2014, expanding at an annualised rate of 3,0 per cent, following subdued growth of 2,0 per cent in the first quarter. The weak global economic performance in the first quarter of 2014 was partly attributable to temporary factors, including adverse weather conditions and a depletion of inventories in the United States (US). Economic growth in China also slowed in response to policy measures aimed at reining in excessive credit expansion. Despite the improvement in the second quarter of 2014, the global recovery remains vulnerable to geopolitical tensions, particularly between Russia and the West concerning Ukraine, the civil war in Syria, the insurgency in Iraq and the conflict in Gaza. In the July 2014 World Economic Outlook Update, the International Monetary Fund (IMF) downgraded its global growth forecast for 2014 by 0,3 percentage points to 3,4 per cent, but left its growth projection for 2015 unchanged at 4,0 per cent.
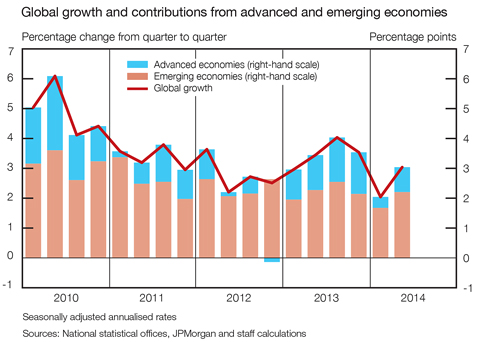
After contracting at an annualised rate of 2,1 per cent in the first quarter of 2014, real output in the US recovered rapidly in the second quarter and increased at a rate of 4,2 per cent. This marked turnaround in growth mainly reflected positive contributions from inventory investment, private consumption expenditure, especially on durable goods, as well as exports. Labour market conditions continued to improve during the first seven months of 2014. The US unemployment rate declined to 6,2 per cent in July 2014, almost 4 percentage points below its peak in October 2009 – on average, more than 200 000 new jobs per month were created in the year to July 2014. The Federal Open Market Committee (FOMC) decided at its March 2014 meeting to replace the numerical threshold for unemployment with a qualitative approach in order to determine how long the federal funds rate should be kept at its current low level. This assessment takes into account a wide range of indicators, including broader measures of labour market conditions (such as wage growth and the duration of unemployment). The FOMC remains optimistic that the strength of the US economic recovery will continue to support employment growth, and announced in July 2014 the sixth US$10 billion reduction in quantitative easing. The latest decision reduced monthly asset purchases to US$25 billion.
| | |
| Quarterly Bulletin September 2014 | | |


The modest economic recovery in the euro area stalled in the second quarter of 2014, registering a pace of 0,2 per cent following annualised growth of 0,8 per cent in the preceding quarter. Growth remained subdued in most countries in the region, while output contracted in Germany, Italy and France. Inflation in the euro area slowed to 0,3 per cent in August 2014, the lowest since October 2009. Weak growth and declining inflation in the euro area have prompted the European Central Bank (ECB) to further loosen its monetary policy stance by reducing its main refinancing rate by 10 basis points to 0,15 per cent in June 2014. In addition, the ECB announced a series of measures (including targeted longer-term refinancing operations and a negative deposit rate) to support bank lending to the real economy in the euro area.
Real economic activity in Japan contracted at an annualised rate of 6,8 per cent in the second quarter of 2014 following the exceptional growth of 6,1 per cent in the preceding quarter. The contraction in the second quarter was caused by a sharp decline in household consumption after strong pre-emptive buying in the first three months of the year in anticipation of an increase in sales tax from 5 to 8 per cent in April 2014. The Bank of Japan had introduced a policy of quantitative and qualitative monetary easing in April 2013 to anchor inflation at 2 per cent. After experiencing deflation for more than a decade, inflation reached 3,6 per cent in June 2014. However, excluding the direct effect of the increase in sales tax, the Bank of Japan estimated consumer price inflation amounted to 1,3 per cent in the year to June 2014.
Real output in the United Kingdom (UK) increased at a rate of 3,2 per cent in the second quarter of 2014, its level finally exceeding the pre-crisis peak reached in the first quarter of 2008. The economic recovery has been relatively slow compared with that of other major advanced economies and previous UK recoveries as it took 25 quarters to return to the 2008 pre-downturn peak. Consumer price inflation decelerated to 1,6 per cent in July 2014 despite the strong economic recovery. The Bank of England maintained its Bank Rate at a record low of 0,50 per cent in August 2014, although two of the nine members of the Monetary Policy Committee had voted to increase interest rates.
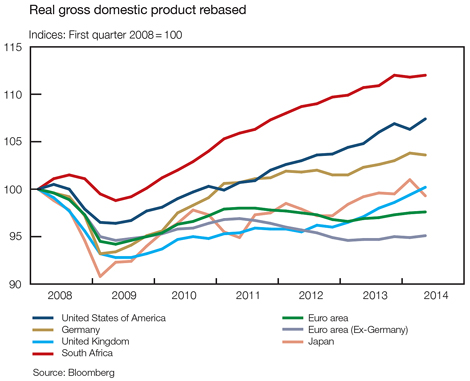
Following subdued growth in the first quarter of 2014, growth in emerging-market economies accelerated to an annualised rate of 4,9 per cent in the second quarter. This faster pace of increase was largely due to stronger growth in emerging and developing Asian economies.
| | |
| | | Quarterly Bulletin September 2014 |
China recorded economic growth at a rate of 7,7 per cent in the second quarter of 2014, owing mainly to the mini-stimulus package that had been announced in March 2014 to address weak growth. The package included increased spending on railway construction, the upgrading of housing for low-income households and tax relief for struggling small businesses. China is on track again to achieve its 7,5 per cent growth target for 2014. Real output growth in India bottomed out in the fourth quarter of 2013 and accelerated further to 6,8 per cent in the second quarter of 2014. Growth was supported by improved business sentiment following the national elections, offsetting the unfavourable effects of an extreme monsoon on agricultural output. Although consumer price inflation remained elevated at 8,0 per cent in July 2014, it was significantly lower than the average of 10,1 per cent registered in 2013. Inflationary pressures caused Malaysia and the Philippines to increase their policy rates by 25 basis points to 3,25 per cent and 5,75 per cent respectively in July 2014.
Real output growth in emerging Europe remained subdued as escalating geopolitical tensions between Russia and a number of other countries adversely affected economic conditions in the region. Both the US and the European Union imposed broad economic sanctions against Russia over its actions in Ukraine. The Russian government, however, retaliated by banning or limiting food and agricultural imports from countries that had imposed sanctions against Russia. Consumer prices in the region increased slightly in recent months. Inflation in Turkey accelerated to 9,7 per cent in May 2014 before moderating to 9,3 per cent in July. By contrast, Hungary experienced deflation in the second quarter of 2014. Consumer prices in Poland also declined in July 2014. Monetary policy was tightened in Russia (75 basis points) but has been eased in Hungary (250 basis points) since the start of the year. The Turkish central bank has eased monetary policy, reversing some of the 550 basis points increase in January 2014.
Economic activity in Latin America accelerated marginally in the second quarter of 2014 due to stronger growth in Mexico. The central bank of Mexico unexpectedly lowered its benchmark interest rate by 50 basis points to a record low of 3,0 per cent in June 2014, following sluggish growth in the first quarter. However, Argentina fell into a technical recession in the first quarter of 2014, with not much of an improvement expected in the second quarter. In July 2014, the country defaulted for the second time this century (the first time being in 2001) on the repayment of its restructured bonds, increasing the likelihood that it will be isolated from further participation in global capital markets. Brazil also fell into recession in the second quarter of 2014, with inflation stubbornly above the midpoint of the central bank’s 4,5 per cent target. Tight financial conditions and weak business and consumer confidence were holding back investment and slowing consumption expenditure. The monetary policy tightening cycle has paused with the policy rate having risen to 11,0 per cent in April 2014, 350 basis points higher in less than a year. In Chile, anchored inflation expectations have permitted further easing of monetary policy to bolster growth despite currency depreciation in the context of a substantial current-account deficit. Overall, Latin American economies are at risk from declining commodity prices and less-favourable financing conditions.
Headline inflation continued to accelerate in several African economies. Ghana recorded inflation of 15,3 per cent in July 2014, the second highest in the region. Malawi registered consumer price inflation of 22,5 per cent in June 2014. Several African central banks adjusted their policy rates in recent months. Ghana and Egypt both increased their policy rates by 100 basis points to 19,0 per cent and 9,25 per cent respectively, whereas Namibia increased its policy rate by a cumulative 50 basis points to 6,0 per cent. Meanwhile, Malawi and Uganda reduced their policy rates to 22,5 per cent and 11,0 per cent respectively.
The volume of world trade increased at an annualised rate of 0,9 per cent in the three months to May 2014 compared with a contraction of 1,5 per cent in the preceding three-month period. The turnaround can be ascribed to a marked increase in the export volumes of both emerging-market and advanced economies.
| | |
| Quarterly Bulletin September 2014 | | |


The price of Brent crude oil was relatively stable at US$106–US$111 per barrel over the past few months before increasing to a nine-month high of US$115 per barrel in June 2014. The increase was mostly driven by concerns about possible disruptions of oil supplies following geopolitical tension in Iraq and the Russian–Ukrainian crisis. However, price changes reversed course as Iraq’s oil production remained unaffected despite the ongoing unrest in the country and Libya resumed oil exports after almost a year. While global oil demand increased marginally in the second quarter of 2014, the 2014 estimate for global oil demand has been revised downwards by the International Energy Agency (IEA) on weaker-than-expected economic data. Crude oil prices briefly declined at the end of August below US$100 per barrel for the first time since May 2013 after the IEA downgraded its outlook for oil demand. Brent crude oil future contracts for delivery in the fourth quarter of 2014 traded on 1 September 2014 at around US$103 per barrel.
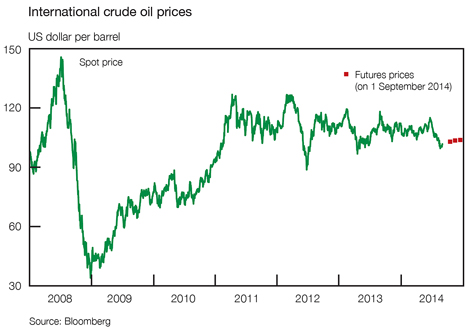
Current account5
Structural impediments coupled with prolonged industrial action, a moderation in global demand and declining commodity prices severely dented South Africa’s export performance in the second quarter of 2014. The value of merchandise imports also contracted over the period but to a lesser extent, with the result that the deficit on the trade account of the balance of payments widened from R75 billion in the first quarter of 2014 to R101 billion in the second quarter. As a ratio of gross domestic product, the trade deficit deteriorated from 2,1 per cent to 2,8 per cent over the same period.
Balance of payments on current account
| | | | | | | | | | | | | | | | | | | | | | | | |
| R billions, seasonally adjusted and annualised | | | | | | | | | | | | | | | | | | |
| | |
| | | 2013 | | | 2014 | |
| | | 2nd qr | | | 3rd qr | | | 4th qr | | | Year | | | 1st qr | | | 2nd qr | |
Merchandise exports | | | 826 | | | | 885 | | | | 901 | | | | 854 | | | | 967 | | | | 905 | |
Net gold exports | | | 70 | | | | 63 | | | | 56 | | | | 64 | | | | 51 | | | | 59 | |
Merchandise imports | | | -983 | | | | -1 039 | | | | -1 002 | | | | -991 | | | | -1 092 | | | | -1 065 | |
Trade balance | | | -87 | | | | -91 | | | | -45 | | | | -74 | | | | -75 | | | | -101 | |
Net service, income and current transfer payments | | | -120 | | | | -125 | | | | -134 | | | | -124 | | | | -86 | | | | -121 | |
Balance on current account | | | -207 | | | | -216 | | | | -179 | | | | -197 | | | | -161 | | | | -222 | |
As percentage of gross domestic product | | | -6,2 | | | | -6,4 | | | | -5,1 | | | | -5,8 | | | | -4,5 | | | | -6,2 | |
Components may not add up to totals due to rounding
| | |
| | | Quarterly Bulletin September 2014 |
The larger trade deficit in the second quarter of 2014 coincided with a widening in the shortfall on the services, income and current transfer account with the rest of the world. The shortfall advanced from R86 billion in the first quarter of 2014 to R121 billion in the second quarter mainly due to higher net income payments to non-resident investors. As a result of the simultaneous deterioration in the trade and services, income and current transfer account of the balance of payments, the current-account deficit widened substantially from 4,5 per cent of gross domestic product in the first quarter of 2014 to 6,2 per cent in the second quarter.
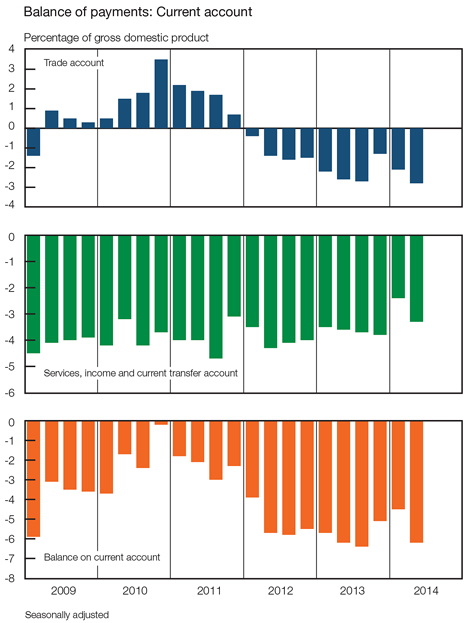
The weaker export performance in the second quarter of 2014 can be ascribed to a decrease in both the volume and prices of merchandise exports. Having increased for five consecutive quarters, the volume of merchandise exports (excluding gold) contracted by 4,4 per cent in the second quarter of 2014, strongly influenced by lower production in the platinum-mining sector following prolonged labour strike action from late in January 2014 until late June. Apart from the decrease in platinum group metal exports, notable declines were also registered in the quantities of ferro-manganese and coal exports. In addition to lower supply, export volumes were also weighed down by lower demand from trading partner countries in Asia, more in particular China, India, Thailand and Malaysia.
| | |
| Quarterly Bulletin September 2014 | | |


The value of merchandise exports destined for Europe declined notably in the second quarter of 2014 as the impact of industrial action in the platinum-mining sector spilled over to several domestic manufacturing sub-sectors. Vehicle exports shrank visibly in the second quarter of 2014 due to, among other factors, the high number of public holidays over the Easter period and the upgrading of a vehicle manufacturing plant. The launch of a new model range in June 2014 is expected to boost vehicle exports in the near future.
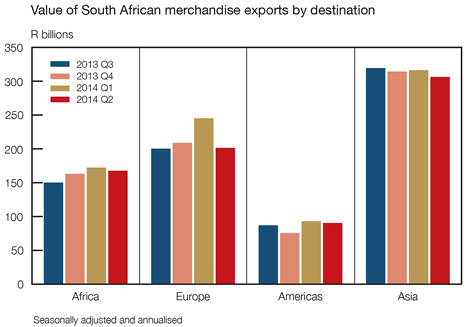
The average US dollar price of South African produced non-gold commodities, which has been trending downwards since the second quarter of 2013, receded by a further 2,1 per cent in the second quarter of 2014. Meaningful declines were registered in the prices of, inter alia, coal, copper and iron ore. The price of iron ore dropped by no less than 14,8 per cent in the second quarter of 2014, largely driven by an apparent oversupply of iron ore on international markets originating from Australia. Copper prices receded in part on concerns about the Chinese authorities’ investigation into commodity-backed financing. By contrast, the international prices of nickel and platinum edged higher, with the former supported by supply concerns amid the moratorium on the export of unprocessed ore by the Indonesian authorities. Owing to the steady
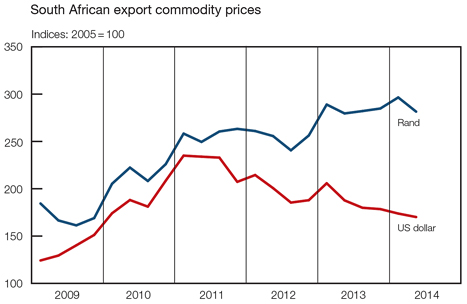
| | |
| | | Quarterly Bulletin September 2014 |
performance of the exchange rate of the rand, the rand price of merchandise exports contracted by roughly 2,2 per cent in the second quarter of 2014. The contraction in the rand price and volume of merchandise exports in the second quarter of 2014 gave rise to a decrease of 6,4 per cent in the export earnings of South African exporters.
The export proceeds of South African gold producers surged by 16,8 per cent in the second quarter of 2014, underpinned by a 20,3 per cent increase in the physical quantity of net gold exports. The marked volume increase reflected to an important extent the partial depletion of gold inventory holdings accumulated during preceding periods. The average fixing price of gold on the London market fell by 0,4 per cent from US$1 293 per fine ounce in the first quarter of 2014 to US$1 289 per fine ounce in the second quarter. The strengthening in the external value of the rand, however, caused the average realised rand price of gold to decrease by 3,0 per cent over the period. In July 2014, the average fixing price of gold on the London market rose to US$1 312 per fine ounce influenced, in part, by increased political tension between Russia and Ukraine and in Libya.
After bouncing back in the first quarter of 2014, the volume of merchandise imports contracted by 1,2 per cent in the second quarter as both crude oil and non-oil imports declined. The decline of roughly 6,0 per cent in the physical quantity of crude oil imports over the period can largely be explained by maintenance work done to a single buoy mooring facility. Notwithstanding this contraction, the volume of crude oil imports in the second quarter of 2014 still exceeded the quarterly averages recorded in 2013. As a ratio of total merchandise imports, the volume of crude oil imports increased to 8,4 per cent in the second quarter of 2014 compared with quarterly averages of 7,5 per cent in 2013.
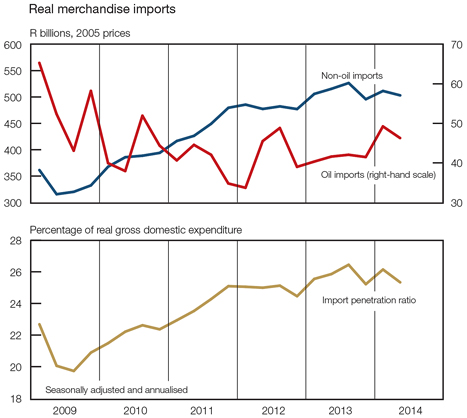
The volume of non-oil merchandise imports receded by about 0,7 per cent from the first to the second quarter of 2014, weighed down by lower domestic demand for base metals and articles of base metals as well as machinery and electrical equipment. Base metals imports advanced in
| | |
| Quarterly Bulletin September 2014 | | |


the first quarter of 2014 partly prompted by the strike in the platinum industry and the concomitant shortage of base metal products during the period. The volume of imported machinery and electrical equipment – especially wind-powered generating sets – declined temporarily in the second quarter of 2014. The imports of vehicles and transport equipment also receded over the same period. Relative to gross domestic expenditure, the total volume of merchandise imports dropped from 26,1 per cent in the first quarter of 2014 to 25,7 per cent in the second quarter.
The strengthening in the external value of the rand in the second quarter of 2014 was sufficient to offset the moderate increase in the international price of crude oil and other non-oil imports, resulting in a decline of 1,3 per cent in the rand price of merchandise imports. Growth in the foreign wholesale prices of most of South Africa’s main trading-partner countries remained well contained over the period. As a result, the value of imported goods shrank by 2,5 per cent in the second quarter of 2014.
Having narrowed meaningfully from the fourth quarter of 2013 to the first quarter of 2014, the deficit on the services, income and current-transfer account widened notably by R35 billion or 40 per cent in the second quarter. As a ratio of gross domestic product the deficit deteriorated from 2,4 per cent in the first quarter of 2014 to 3,4 per cent in the second quarter – still somewhat below the long-term average of 4 per cent. The widening of the deficit during the second quarter was predominantly shaped by the absence of the extraordinarily large dividend inflows recorded in the first quarter of 2014 alongside a moderate increase in gross dividend payments to non-resident investors.
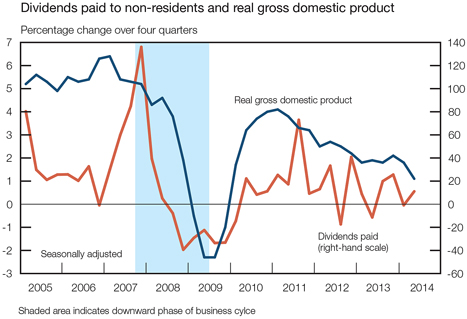
Despite a moderate increase in gross dividend payments to the rest of the world in the second quarter of 2014, the growth in dividend declarations (measured over a period of four quarters) continued to reflect subdued profit distributions, partially reflecting the lacklustre economic performance since the second half of 2011.
Moreover, net current transfer payments to members of the South African Customs Union (SACU) increased further in the second quarter of 2014, indicative of the earlier increase in the intra-SACU imports. Relative to gross domestic product, net current transfer payments rose from 0,8 per cent in the first quarter of 2014 to 1,0 per cent in the second quarter.
| | |
| | | Quarterly Bulletin September 2014 |
Net payments for services decreased due to lower gross payments for transportation and a decline in net payments for ‘other services’.
South Africa’s terms of trade, which moved broadly sideways in the first quarter of 2014, deteriorated marginally in the second quarter of 2014 as the prices of merchandise exports of goods and services declined at a faster pace relative to that of merchandise imports.
Box 3: The impact of disease outbreaks on tourism
The outbreak of the highly contagious Ebola hemorrhagic fever (Ebola) in three West-African countries, namely Guinea, Liberia and Sierra Leone in the opening months of 2014 is of serious concern as more than a thousand people have already died after having contracted this disease. The disease has since spread to Nigeria. The current outbreak is perceived to be the deadliest since the Ebola virus first emerged in 1976. In an effort to contain the spread of the deadly disease, far-reaching measures have been put in place. These measures include, inter alia, the closing of schools and borders, the banning of public meetings and quarantining certain labourers. The World Health Organisation (WHO) has subsequently also declared the situation a global health emergency. These measures have already had a severe knock-on effect on various economic fronts. For instance, marked increases of as much as 40 per cent have already occurred in the prices of certain food products, aggravated by a shortage of food supplies. In some instances, mainly driven by sentiment and perceptions, local agricultural produce such as bananas originating from these countries was rejected on international markets, leading to severe strains being placed on West-African economies. This has also led to the disruption of markets and a further loss of confidence in the region.
The precautionary measures that have already been taken will inevitably restrict the movement of people and goods across borders as some airlines have already discontinued flights to certain West-African countries, also affecting tourism to and from these countries. South Africa may also be affected by the decline in tourism as roughly 72 per cent of non-residents who visited the country between 2010 and 2013 originated from Africa. Even though tourists from the West-African region represent, on average, only about 2 per cent of tourists from Africa (the SADC region accounts for almost 97 per cent), firm growth was recorded from this region between 2011 and 2013 (see accompanying graph). Preliminary indications of a contraction in tourism from the West-African region may already be evident from lower growth in tourism numbers when comparing the first couple of months of 2014 with the corresponding period in 2013. This development accentuates the seriousness of the situation and its possible wider repercussions.
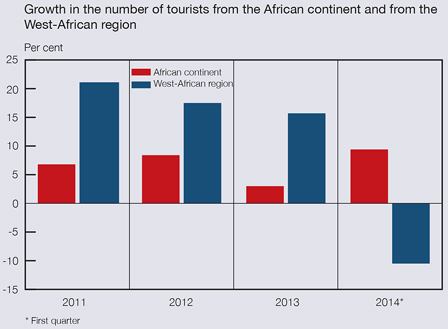
| | |
| Quarterly Bulletin September 2014 | | |


Financial account
Since the commencement of the tapering of bond purchases by the Federal Reserve in late 2013, a number of emerging-market economies, including South Africa, experienced heightened volatility in financial and foreign-exchange markets as international investors reconsidered their exposure to assets in these markets. In addition, international credit rating agencies downgraded the sovereign credit rating of the long-term foreign currency-denominated debt of some emerging-market economies in the first half of 2014. Notwithstanding these developments, the financial account of South Africa’s balance of payments proved to be fairly resilient, recording a net inflow of foreign capital to the value of R43,2 billion in the second quarter of 2014, a magnitude almost similar to that recorded in the first quarter.
Net financial transactions not related to reserves
R billions
| | | | | | | | | | | | | | | | | | | | | | | | |
| | | 2013 | | | 2014 | |
| | | 2nd qr | | | 3rd qr | | | 4th qr | | | Year | | | 1st qr | | | 2nd qr | |
Change in liabilities | | | | | | | | | | | | | | | | | | | | | | | | |
Direct investment | | | 16,6 | | | | 47,4 | | | | 4,1 | | | | 79,1 | | | | 8,0 | | | | 24,6 | |
Portfolio investment | | | 1,8 | | | | 55,6 | | | | -8,2 | | | | 71,0 | | | | 12,3 | | | | 27,4 | |
Other investment | | | -0,4 | | | | -6,4 | | | | 32,1 | | | | 49,8 | | | | 37,9 | | | | 4,7 | |
Change in assets | | | | | | | | | | | | | | | | | | | | | | | | |
Direct investment | | | -10,4 | | | | -29,2 | | | | -8,4 | | | | -54,2 | | | | -5,4 | | | | -12,7 | |
Portfolio investment | | | -6,4 | | | | -5,5 | | | | 6,3 | | | | -11,5 | | | | -8,9 | | | | -11,2 | |
Other investment | | | 4,6 | | | | 7,6 | | | | 2,0 | | | | 4,4 | | | | -26,1 | | | | -2,1 | |
Total financial transactions* | | | 34,5 | | | | 79,9 | | | | 35,9 | | | | 201,6 | | | | 39,0 | | | | 43,2 | |
Financial transactions as ratio of gross domestic product | | | 4,1 | | | | 9,3 | | | | 4,1 | | | | 6,0 | | | | 4,5 | | | | 4,8 | |
| * | Including unrecorded transactions |
The inward movement of capital in the second quarter of 2014 largely reflected portfolio investment flows. Net portfolio inflows amounted to R16,2 billion in the second quarter of 2014 as opposed to a rather small inflow of R3,4 billion in the first quarter of 2014 and an outflow of R1,9 billion in the fourth quarter of 2013. Direct investment, on a net basis, recorded an inflow of capital to the value of R11,9 billion in the second quarter of 2014, while other investment registered net inflows of R2,6 billion. As a ratio of gross domestic product, the balance on the financial account amounted to 4,8 per cent in the second quarter of 2014 compared with a ratio of 4,5 per cent recorded in the first quarter.
Foreign-owned assets in South Africa
Foreign direct investment into South Africa recorded an inflow of R24,6 billion in the second quarter of 2014, more than triple the inflow of R8,0 billion registered in the first quarter. The inward movement of capital mainly reflected the further acquisition of equity investment in domestic enterprises as well as loan finance extended by foreign parent companies to domestic subsidiaries in the manufacturing and telecommunication sectors.
Increased stability in global financial markets alongside favourable interest rate differentials between advanced and developing economies enticed non-resident portfolio investors, who reduced their exposure to South African issued portfolio assets in the fourth quarter of 2013, to expand their holdings of South African equity and debt securities in the first half of 2014. Portfolio investment into South Africa recorded a second consecutive quarterly inflow of R27,4 billion in the second quarter of 2014 following an inflow of R12,3 billion in the first quarter. Non-resident
| | |
| | | Quarterly Bulletin September 2014 |
investors largely stepped up their acquisition of government debt securities in the second quarter of 2014, thereby fully neutralising sizeable redemptions of international bonds by the private and public sectors over the period. On a net basis, foreign investment in domestic debt securities amounted to R18,1 billion in the second quarter of 2014, while R9,3 billion was invested in equity securities over the period.
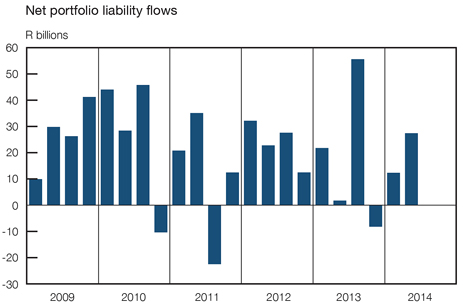
After having registered a sizeable inflow of R37,9 billion in the first quarter of 2014, other investment inflows receded to R4,7 billion in the second quarter. The smaller inflow of capital can largely be attributed to the redemption of maturing loans previously extended to the domestic banking sector under repurchase agreements as well as the repayment of some of its outstanding foreign currency-denominated loan obligations. These repayments were offset by an increase in non-resident deposits with the domestic banking sector in the second quarter of 2014.
South African-owned assets abroad
South African entities continued to accumulate direct investment assets in the rest of the world in the second quarter of 2014. Outward direct investment flows amounted to R12,7 billion over the period following an outflow of R5,4 billion in the preceding quarter. A significant portion of these outward investments can be attributed to large South African multinational companies expanding their footprints on the African continent in sectors such as the electronic media, health care and financial services.
Outward portfolio investment flows accelerated from R8,9 billion in the first quarter of 2014 to R11,2 billion in the second quarter. The appetite of domestic institutional investors to further diversify investment portfolios was probably influenced by better growth prospects abroad and reduced volatility in the exchange value of the rand.
The outward movement of other investment capital shrank to R2,1 billion in the second quarter of 2014 compared with an outflow of R26,1 billion in the first quarter. The smaller outflow of capital mainly reflected a moderation in the pace of foreign asset accumulation by the domestic banking sector.
| | |
| Quarterly Bulletin September 2014 | | |


Foreign debt
South Africa’s gross external debt increased from US$136,5 billion at the end of December 2013 to US$138,5 billion at the end of March 2014, primarily due to an increase in long-term foreign-currency denominated loans extended to the domestic banking sector over the period. The inflow of capital was amplified by the issuance of a Swiss franc bond by a domestic bank. Borrowing activity of other sectors remained fairly muted over the period. South Africa’s short-term foreign currency-denominated debt (i.e. debt with an original maturity of less than one year and other longer-term foreign currency-denominated debt maturing within the next twelve months) accounted for 43,8 per cent of total foreign currency-denominated debt at the end of March 2014. This was a slightly more favourable ratio than the 44,4 per cent recorded at the end of December 2013.
The country’s rand-denominated debt, expressed in US dollar, edged marginally higher to US$75,6 billion at the end of March 2014 compared with US$75,3 billion at the end of December 2013 largely due to an increase in foreign bank loans extended to the domestic banking sector under repurchase agreements. This increase was partially countered by a decline in the value of non-residents’ holdings of domestic rand-denominated bonds following an increase in yields which resulted in a decline in the market value of these bonds. Relative to the country’s total external debt, rand-denominated debt advanced from roughly 50 per cent at the end of June 2010 to 55 per cent at the end of March 2014.
Foreign debt of South Africa
US$ billions at end of period
| | | | | | | | | | | | | | | | | | | | |
| | | 2013 | | | 2014 | |
| | | 1st qr | | | 2nd qr | | | 3rd qr | | | 4th qr | | | 1st qr | |
Foreign currency-denominated debt | | | 58,5 | | | | 57,1 | | | | 60,0 | | | | 61,2 | | | | 62,9 | |
Bonds | | | 20,4 | | | | 18,5 | | | | 21,6 | | | | 21,8 | | | | 22,0 | |
Other | | | 38,1 | | | | 38,6 | | | | 38,4 | | | | 39,4 | | | | 40,9 | |
Public sector | | | 9,1 | | | | 9,4 | | | | 9,6 | | | | 9,1 | | | | 9,1 | |
Monetary sector | | | 12,9 | | | | 11,7 | | | | 10,4 | | | | 12,1 | | | | 13,5 | |
Non-monetary private sector | | | 16,1 | | | | 17,5 | | | | 18,4 | | | | 18,3 | | | | 18,3 | |
Rand-denominated debt | | | 81,6 | | | | 72,8 | | | | 76,1 | | | | 75,3 | | | | 75,6 | |
Bonds | | | 45,9 | | | | 39,7 | | | | 42,3 | | | | 41,1 | | | | 40,1 | |
Other | | | 35,7 | | | | 33,1 | | | | 33,8 | | | | 34,2 | | | | 35,5 | |
Total foreign debt | | | 140,1 | | | | 129,9 | | | | 136,1 | | | | 136,5 | | | | 138,5 | |
As percentage of gross domestic product | | | 37,3 | | | | 35,3 | | | | 38,0 | | | | 38,9 | | | | 40,7 | |
As percentage of total export earnings | | | 118,5 | | | | 111,0 | | | | 117,0 | | | | 117,8 | | | | 120,1 | |
Expressed in rand terms, South Africa’s external debt advanced from R1 429 billion at the end of December 2013 to R1 467 billion at the end of March 2014. The increase in the country’s external debt obligations caused the ratio of total external debt to gross domestic product to increase from 38,9 per cent at the end of December 2013 to 40,7 per cent at the end of March 2014. Likewise, the ratio of external debt to export proceeds rose from 117,8 per cent to 120,1 per cent over the same period.
| | |
| | | Quarterly Bulletin September 2014 |
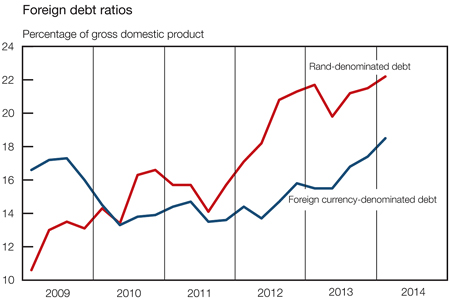
Box 4: Recent credit ratings on long-term foreign currency-denominated debt
During the second quarter of 2014, Standard & Poor’s downgraded South Africa’s long-term foreign currency-denominated debt by one notch to BBB-, while Fitch revised its outlook for the country’s long-term foreign currency-denominated debt, namely BBB, from stable to negative. The decisions of the rating agencies were prompted by concerns regarding the country’s weak economic growth outlook amid labour unrest, and persistent budget and current-account deficits. Moody’s previously amended the country’s Baa1 rating outlook to negative in November 2011.
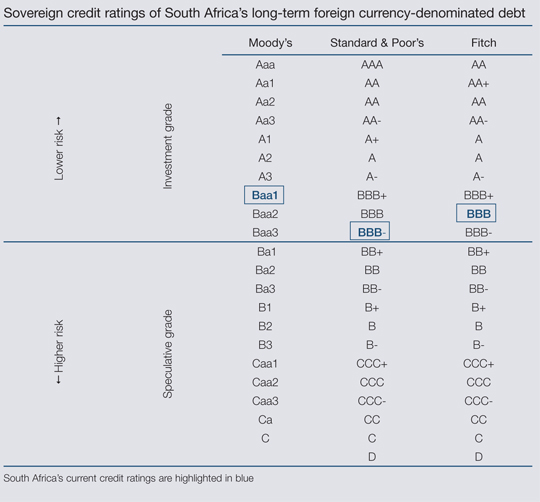
| | |
| Quarterly Bulletin September 2014 | | |


During the first half of 2014, Standard & Poor’s also downgraded the ratings on long-term foreign currency-denominated debt of Brazil and Russia from BBB to BBB- on concerns of heightened tension between Western countries and Russia and slower growth in Brazil. South Africa’s sovereign debt rating is still classified as investment grade similar to that of Brazil, India and Russia, and higher than that of Indonesia, Hungary and Turkey which are classified as speculative grade by Standard & Poor’s.
Standard & Poor’s ratings of long-term foreign-currency sovereign debt of emerging markets
| | | | |
| | | End-July 2014 | | End-December
2013 |
China | | AA- | | AA- |
Chile | | AA- | | AA- |
South Korea | | A+ | | A+ |
Poland | | A- | | A- |
Thailand | | BBB+ | | BBB+ |
Mexico | | BBB+ | | BBB+ |
South Africa | | BBB- | | BBB |
Russia | | BBB- | | BBB |
Brazil | | BBB- | | BBB |
India | | BBB- | | BBB- |
Indonesia | | BB+ | | BB+ |
Hungary | | BB | | BB |
Turkey | | BB+ | | BB+ |
Countries downgraded by Standard & Poor’s in 2014 are highlighted in blue
Source: countryeconomy.com
It is natural for a country’s cost of borrowing to be affected by a change in its credit rating. However, other factors such as the state of financial markets, the level of bond yields with similar maturity as well as the maturity date could affect the cost (coupon rate) of the bond issued. The sovereign debt ratings are used as benchmarks for the pricing of international bonds issued by companies in other sectors of the economy. Following the downgrade in June 2014, South Africa successfully issued two international bonds, denominated in dollar and euro, in July. The 30-year US dollar-denominated bond issued by government was priced at a coupon rate of 5,375 per cent representing a spread of 220 basis points above the 30-year US Treasury’s benchmark bond. The current pricing of 5,375 per cent is, nonetheless slightly more costly than that of Brazil’s long-term dollar-denominated debt issued at 5 per cent and expectedly cheaper than Turkey’s issued at 6,625 per cent. The previous issuance by South Africa was in September 2013 at a coupon rate of 5,875 per cent amid uncertainty in financial markets on the path of the US Federal Reserve’s tapering strategy. The 12-year euro bond was priced at a coupon rate of 3,75 per cent, representing a spread of 225 basis points above the 12-year euro swap rate. The table below illustrates the cost of borrowing for selected emerging-market economies during the last few months of 2013 and the first seven months of 2014.
Selected issuances of US dollar-denominated bonds by emerging-market economies
| | | | | | | | | | | | | | | | | | | | | | | | | | | | | | | | |
| | | Date of
issue | | | Amount
(US$
billions) | | | Coupon
rate | | | Maturity
date | | | Date of
issue | | | Amount
(US$
billions) | | | Coupon
rate | | | Maturity
date | |
South Korea | | | Jun-14 | | | | 1,0 | | | | 4,125 | | | | Jan-45 | | | | Sep-13 | | | | 1,0 | | | | 3,875 | | | | Sep-23 | |
South Africa | | | Jul-14 | | | | 1,0 | | | | 5,375 | | | | Jul-44 | | | | Sep-13 | | | | 2,0 | | | | 5,875 | | | | Feb-25 | |
Brazil | | | Jul-14 | | | | 3,5 | | | | 5 | | | | Jan-45 | | | | Oct-13 | | | | 3,2 | | | | 4,25 | | | | Jan-25 | |
Turkey | | | Feb-14 | | | | 1,5 | | | | 6,625 | | | | Feb-45 | | | | Oct-13 | | | | 1,25 | | | | 4,557 | | | | Oct-18 | |
Source: cbonds.com
| | |
| | | Quarterly Bulletin September 2014 |
International reserves and liquidity
South Africa’s overall balance-of-payments position (i.e., the change in the country’s net international reserves due to balance-of-payments transactions) declined by a further R10,0 billion in the second quarter of 2014, following a decline of R4,7 billion in the first quarter.
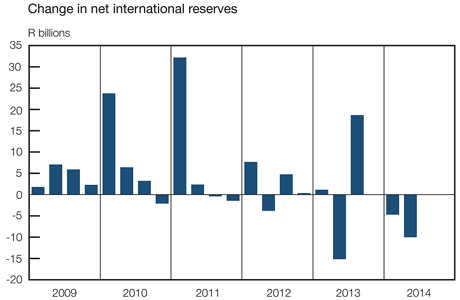
Measured in US dollars, the value of South Africa’s gross gold and other foreign reserves (i.e., the international reserves of the Bank before accounting for reserve-related liabilities) decreased from US$49,5 billion at the end of March 2014 to US$48,6 billion at the end of June, mainly due to the repayment of some of the government’s foreign debt obligations. At the end of August 2014 the country’s gross international reserves rose to US$49,8 billion, lifted by deposits from the proceeds of international bond issues by the government over the period. The level of import cover (i.e., the value of gross international reserves relative to the value of imports of goods, services and income payments) remained unchanged at 19,5 weeks from the end of March 2014 to the end of June. South Africa’s international liquidity position deteriorated from US$45,0 billion at the end of March 2014 to US$44,8 billion at the end of June and to US$44,2 billion at the end of August. This decline mainly reflected foreign-exchange swaps maturing over the period.
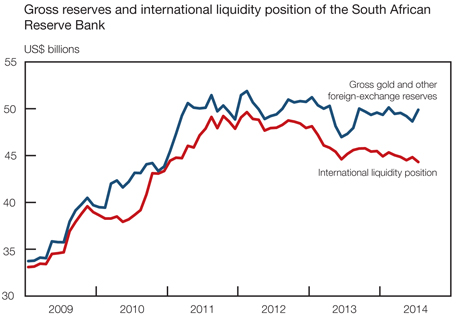
| | |
| Quarterly Bulletin September 2014 | | |


Box 5: The establishment of a BRICS Development Bank
In pursuit of rebalancing the global financial order and in reshaping the Western dominance in the international financial system, the BRICS countries (Brazil, Russia, India, China and South Africa) launched a Development Bank with a capital base of US$50 billion in July 2014. In addition, a joint US$100 billion fund was established known as the ‘Contingent Reserve Arrangement’. The BRICS Development Bank aims to fund infrastructure development projects in developing countries while the Contingent Reserve Arrangement is earmarked to support member countries in alleviating short-term balance-of-payments liquidity pressures. The Contingent Reserve Arrangement will be funded by China (US$41 billion), India, Brazil and Russia (US$18 billion each) and South Africa (US$5 billion).
The contribution was agreed upon taking into account the level of each country’s international reserves. In the event of a balance-of-payments crisis, China will be eligible to withdraw up to a half of its contribution while South Africa may apply for double its contribution. India, Russia and Brazil, on the other hand, will be eligible for an amount equivalent to their contribution.
Gross foreign exchange and gold reserves of BRICS countries
US$ billions
| | | | | | | | | | | | |
| | | 31 Dec 2013 | | | 31 Mar 2014 | | | 30 Jun 2014 | |
Brazil | | | 358,8 | | | | 363,9 | | | | 373,5 | |
India | | | 293,9 | | | | 304,2 | | | | 315,8 | |
China | | | 3820,0 | | | | 3950,0 | | | | 3990,0 | |
Russia | | | 509.6 | | | | 486,1 | | | | 478,3 | |
South Africa | | | 49,6 | | | | 49,5 | | | | 48,6 | |
Exchange rates
Investor sentiment towards emerging-market economies and in particular South Africa has improved somewhat towards the end of the first quarter of 2014 as some previously pressing issues changed nature and lowered the perceived risks associated with emerging-market assets. A large part of the second quarter of 2014 was marked by a strengthening in the currencies of many emerging-market economies amid apparent more stable global financial markets and indications that the Chinese authorities are committed to boosting economic activity in China. The ongoing efforts to boost the economic recovery in the euro area in the second quarter of 2014 furthermore buoyed the currencies of many emerging-market economies over the period. The extent of the recovery in some emerging-market currencies is shown in the accompanying graph, indicating that the South African rand has not recovered to the same extent as some of the other emerging-market currencies in the second quarter of 2014.
Exchange rates of the rand
Percentage change
| | | | | | | | | | | | | | | | |
| | | 30 Sep 2013
to
31 Dec 2013 | | | 31 Dec 2013
to
31 Mar 2014 | | | 31 Mar 2014
to
30 Jun 2014 | | | 30 Jun 2014
to
29 Aug 2014 | |
Weighted average* | | | -3,9 | | | | -0,8 | | | | -0,4 | | | | 1,4 | |
Euro | | | -5,4 | | | | -1,1 | | | | 0,7 | | | | 3,7 | |
US dollar | | | -3,5 | | | | -1,2 | | | | -0,2 | | | | 0,1 | |
Chinese yuan | | | -4,6 | | | | 1,4 | | | | -0,4 | | | | -0,9 | |
British pound | | | -5,7 | | | | -1,9 | | | | -2,5 | | | | 2,7 | |
Japanese yen | | | 3,5 | | | | -3,2 | | | | -1,7 | | | | 2,6 | |
| * | Against a basket of 20 currencies |
| | |
| | | Quarterly Bulletin September 2014 |
The nominal effective exchange rate of the rand declined, on balance, by 0,4 per cent in the second quarter of 2014, compared with a decline of 0,8 per cent in the first quarter of 2014. Within the second quarter, the nominal effective exchange rate of the rand increased, on balance, by 0,4 per cent and 1,4 per cent in April and May 2014 respectively before declining by 2,1 per cent in June amid the downgrade of the country’s sovereign rating to BBB- by Standard & Poor’s. At the same time, Fitch revised the outlook for the country from stable to negative, based on the disappointing high and sustained unemployment rate, ongoing industrial action and the announcement that the country’s gross domestic product had contracted in the first quarter of 2014.
In July and August 2014, however, the rand regained some vigour against major currencies supported by a rise in the policy rate, the announcement of the end of the strike in the manufacturing sector and the weaker-than-expected economic data from the US.
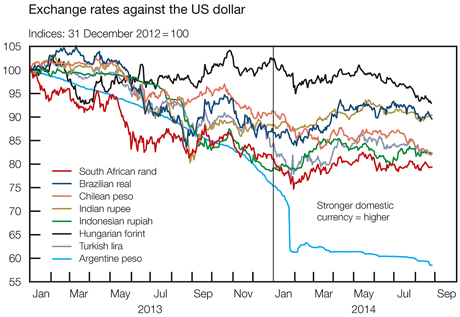
The real effective exchange rate of the rand increased by 0,2 per cent over the twelve months to June 2014.
The average net daily turnover in the domestic market for foreign exchange decreased by 2,6 per cent from US$25,4 billion in the first quarter of 2014 to US$24,8 billion in the second quarter largely due to a decline in the average net daily turnover in the rand market. Turnover in the rand market fell from US$20,4 billion in the first quarter of 2014 to US$19,5 billion in the second quarter, while turnover in the market for third currencies receded only marginally from US$5,2 billion to US$5,0 billion over the same period. The quarterly decrease in turnover in the rand market could be explained by decreases of 11,4 per cent, 3,9 per cent, and 3,4 per cent in forward, swap and spot transactions respectively. Swap transactions constituted, on average, 77 per cent of the net average daily turnover in the rand market in the second quarter of 2014, with non-resident participants accounting for 63,2 per cent of swap transactions.
| | |
| Quarterly Bulletin September 2014 | | |


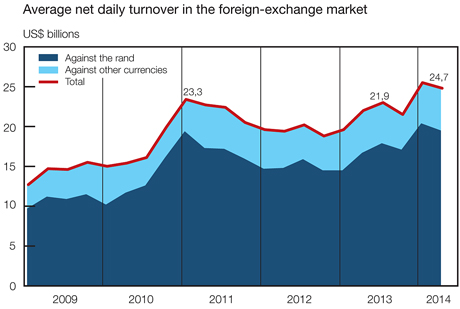
| | |
| | | Quarterly Bulletin September 2014 |
Monetary developments, interest rates and financial markets
Money supply
After a lacklustre performance in the second half of 2013, growth in the broadly defined money supply (M3) maintained a relatively upbeat trend during the first half of 2014. This was especially evident in the annualised quarter-to-quarter6 growth in M3, which recovered from a low of 2,0 per cent in the fourth quarter of 2013 to 16,5 per cent in the second quarter of 2014, reaching its highest level since the second quarter of 2008. The recovery in the first half of 2014 was underpinned by strong growth in deposits of both the household and corporate sectors, especially financial companies. Factors which probably supported growing deposit holdings during the period included:
| • | | a build-up in precautionary balances in the wake of labour disruptions; |
| • | | a rise in foreign currency-denominated deposit holdings partly boosted by the depreciation in the exchange value of the rand; |
| • | | an environment of rising interest rates in a setting where almost all deposits are interest-bearing; |
| • | | rising real expenditure and inflation; and |
| • | | positive wealth effects mainly arising from the upward trend in share prices. |
Twelve-month growth in M3 initially slowed from the peak of 10,0 per cent in April 2013 to 5,9 per cent in February 2014. Subsequently, growth in M3 picked up to 7,9 per cent in March, with some moderation to 7,3 per cent in June and 6,9 per cent in July 2014.
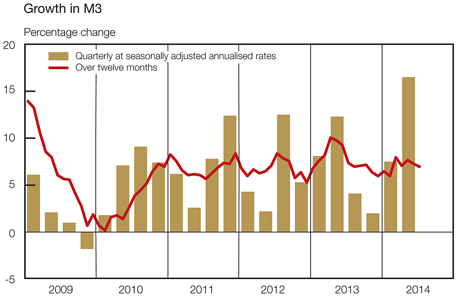
Analysed by maturity, twelve-month growth in cash, cheque and demand deposits (M1) consistently exceeded that of M3 during 2013 and the first seven months of 2014, reaching a peak of 16,1 per cent in March 2014 before it decelerated to 10,1 per cent in July. The peak in March was exacerbated by base effects due to differences in first-quarter public holidays for 2013 and 2014. The resilience in demand deposits during the past two years and the preference for liquidity may indicate investors’ unwillingness to lock in deposit interest rates over the long term at or close to the bottom of the interest rate cycle. This is also confirmed by weak and declining growth in long-term deposits which tempered overall growth in M3 since the second half of 2013. Twelve-month growth in the long-term deposit category fell below zero in August
| | |
| Quarterly Bulletin September 2014 | | |


2013 and declined further to a low of -9,7 per cent in February 2014. Growth in this category recovered in subsequent months, probably partly boosted by increases in the policy rate. In July 2014 growth in long-term deposits came to -1,1 per cent.

Overall, M3 money supply rose by R42,2 billion in the second quarter of 2014, substantially less than the increase of R79,2 billion recorded in the first quarter of 2014 and also lower than the increase of R52,8 billion recorded in the second quarter of the previous year. The deposit holdings of the corporate sector rose by R23,0 billion during the second quarter of 2014 as financial companies increased their deposit holdings considerably while non-financial companies drew down their deposit holdings. At the same time, the household sector increased its deposit holdings by R19,2 billion, double the amount recorded in the first quarter but nonetheless below the increase of R19,8 billion recorded in the second quarter of 2013.
M3 holdings of households and companies
| | | | | | | | | | | | | | | | | | | | | | | | |
| | | Quarterly change
(R billions) | | | Percentage holdings of
total M3 deposits | |
| | | 2013 | | | 2014 | | | 2013 | | | 2014 | |
| | | 4th qr | | | 1st qr | | | 2nd qr | | | 4th qr | | | 1st qr | | | 2nd qr | |
Households | | | 24,0 | | | | 9,8 | | | | 19,2 | | | | 29,9 | | | | 29,4 | | | | 29,6 | |
Companies | | | -18,5 | | | | 69,4 | | | | 23,0 | | | | 70,1 | | | | 70,6 | | | | 70,4 | |
Of which: Financial | | | -46,8 | | | | 31,1 | | | | 46,4 | | | | 39,8 | | | | 39,8 | | | | 41,0 | |
Non-financial | | | 28,3 | | | | 38,2 | | | | -23,4 | | | | 30,3 | | | | 30,8 | | | | 29,4 | |
Total M3 deposits | | | 5,6 | | | | 79,2 | | | | 42,2 | | | | 100,0 | | | | 100,0 | | | | 100,0 | |
Measured over twelve months, growth in the deposit holdings of the household sector regained some momentum to average marginally above 10 per cent during the first six months of 2014, up from average growth of 8,9 per cent recorded in 2013. In July 2014, growth in household deposits increased somewhat to 10,2 per cent. Deposit growth of the corporate sector as a whole remained somewhat subdued but increased from a recent low of 3,9 per cent in February 2014 to 6,7 per cent in May and 5,5 per cent in July.
| | |
| | | Quarterly Bulletin September 2014 |
The deposit holdings of financial companies generally comprise around 40 per cent of total deposits. During the seven months to July 2014 the growth in deposits of financial companies far exceeded that of non-financial companies. However, year-on-year growth in the deposit holdings of financial companies remained modest, falling below that of non-financial companies.

In a statistical sense, the rise in M3 during the second quarter of 2014 was mainly attributable to an increase in claims on the private sector, predominantly brought about by continued growth in other loans and advances extended to the corporate sector. Net claims on the government sector rose in the second quarter when the increase in holdings of government securities by the banking sector exceeded the increase in government deposits. Net foreign assets decreased as the decline in banks’ foreign assets exceeded the decline in their foreign liabilities, while net other assets and liabilities also recorded a marginal decrease.
Statistical counterparts of change in M3
R billions
| | | | | | | | | | | | | | | | |
| | | 2013 | | | 2014 | |
| | | 3rd qr | | | 4th qr | | | 1st qr | | | 2nd qr | |
Net foreign assets | | | 48,9 | | | | -3,9 | | | | -3,3 | | | | -1,4 | |
Net claims on the government sector | | | -10,1 | | | | 7,6 | | | | -0,7 | | | | 5,9 | |
Claims on the private sector | | | 46,5 | | | | 34,9 | | | | 96,4 | | | | 38,6 | |
Net other assets and liabilities | | | -34,0 | | | | -33,1 | | | | -13,3 | | | | -0,9 | |
Total change in M3 | | | 51,3 | | | | 5,6 | | | | 79,2 | | | | 42,2 | |
The income velocity of circulation of M3 rose from 1,36 in the second quarter of 2013 to 1,40 in the fourth quarter, when growth in money supply fell below that of nominal gross domestic product. Velocity then moved sideways in the first quarter of 2014, with a slight decline to 1,35 in the second quarter. The relatively subdued changes in the income velocity during the past three years suggest that growth in money supply generally kept pace with growth in nominal gross domestic product. In a historical context, velocity has remained below the long-term average of 1,50 recorded since 2000, which implies a subdued demand for money within a relatively constrained economic growth environment.
| | |
| Quarterly Bulletin September 2014 | | |


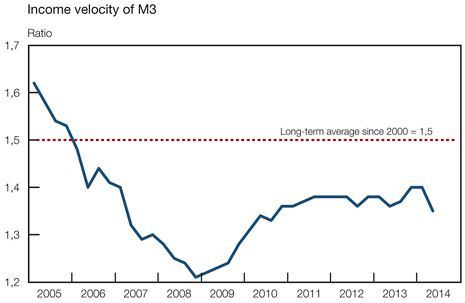
Credit extension
Following a deceleration in the latter part of 2013, growth in total loans and advances extended to the private sector accelerated during the first half of 2014. The uptick in credit growth could largely be attributed to a revival in the demand for credit by the corporate sector, while growth in credit extension to households lost further momentum. After ending 2013 at a two-year low of 6,3 per cent, the year-on-year growth in banks’ total loans and advances extended to the private sector recovered to 8,6 per cent in February 2014 and fluctuated around this level until June, held back by fragile consumer confidence, subdued domestic and global economic conditions, weak employment growth and still-high pre-existing debt levels. In July growth accelerated somewhat to 9,7 per cent.
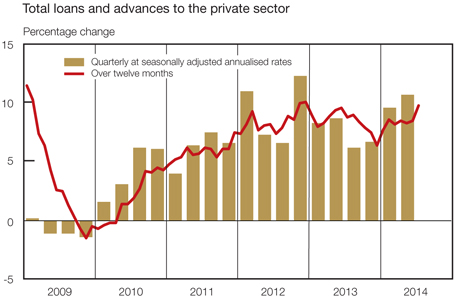
Total loans and advances to the private sector expanded by R122,2 billion in the first six months of 2014, substantially higher than the R68,4 billion recorded in the first half of 2013. The buoyant growth was also reflected in the quarter-to-quarter7 growth rate which picked up from 6,7 per cent in the final quarter of 2013 to 9,6 per cent and 10,7 per cent in the first and second quarters
| | |
| | | Quarterly Bulletin September 2014 |
of 2014 respectively. Despite the uptick in aggregate credit extension, household borrowing remained subdued with relatively weak expansion across the various categories of credit. This was consistent with sluggish growth in household consumption expenditure and indicates the financial strain experienced by highly indebted households amid constrained income growth.
Composition of total loans and advances by type of credit
| | | | | | | | | | | | | | | | | | | | | | | | |
| Type of credit | | Quarterly change
(R billions) | | | Percentage
of total
loans and advances* | |
| | | 2013 | | | 2014 | | | 2014 | |
| | | 2nd qr | | | 3rd qr | | | 4th qr | | | 1st qr | | | 2nd qr | | | 2nd qr | |
Household sector | | | | | | | | | | | | | | | | | | | | | | | | |
Instalment sale credit and leasing finance | | | 4,1 | | | | 7,0 | | | | 7,2 | | | | 3,3 | | | | 2,6 | | | | 9,3 | |
Mortgage advances | | | 5,4 | | | | 4,8 | | | | 2,3 | | | | 6,1 | | | | 6,0 | | | | 32,1 | |
Other loans and advances | | | 5,5 | | | | 1,1 | | | | 7,6 | | | | 8,3 | | | | 1,1 | | | | 12,9 | |
Overdrafts | | | -0,6 | | | | 1,3 | | | | 1,0 | | | | 3,4 | | | | -2,1 | | | | 1,4 | |
General loans | | | 3,3 | | | | -2,6 | | | | 3,6 | | | | 2,6 | | | | 0,3 | | | | 7,9 | |
Credit card advances | | | 2,8 | | | | 2,4 | | | | 3,0 | | | | 2,3 | | | | 2,9 | | | | 3,6 | |
Total loans and advances to the household sector | | | 15,1 | | | | 12,8 | | | | 17,1 | | | | 17,7 | | | | 9,7 | | | | 54,2 | |
Corporate sector | | | | | | | | | | | | | | | | | | | | | | | | |
Instalment sale credit and leasing finance | | | 5,9 | | | | 3,9 | | | | 2,4 | | | | 2,1 | | | | 2,8 | | | | 4,1 | |
Mortgage advances | | | 1,5 | | | | 6,1 | | | | -1,0 | | | | 6,0 | | | | 6,7 | | | | 12,2 | |
Other loans and advances | | | 7,2 | | | | 18,5 | | | | 17,3 | | | | 57,0 | | | | 20,1 | | | | 29,5 | |
Overdrafts | | | 3,1 | | | | -2,0 | | | | 4,5 | | | | 9,0 | | | | 8,7 | | | | 5,2 | |
General loans | | | 3,9 | | | | 20,4 | | | | 11,8 | | | | 47,8 | | | | 10,9 | | | | 24,1 | |
Credit cards advances | | | 0,2 | | | | 0,1 | | | | 1,1 | | | | 0,2 | | | | 0,5 | | | | 0,2 | |
Total loans and advances to the corporate sector | | | 14,6 | | | | 28,6 | | | | 18,7 | | | | 65,1 | | | | 29,6 | | | | 45,8 | |
Total loans and advances to the private sector | | | 29,7 | | | | 41,4 | | | | 35,8 | | | | 82,9 | | | | 39,3 | | | | 100,0 | |
| * | Expressed as percentage of outstanding balances of total loans and advances (excluding investments and bills discounted) |
Other loans and advances, which consist of general loans, bank overdrafts and credit card advances, maintained their role as the dominant driver of credit extension in the first six months of 2014, while growth in the asset-backed categories remained relatively subdued.
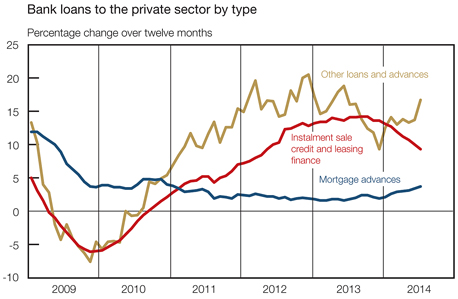
| | |
| Quarterly Bulletin September 2014 | | |


Other loans and advances grew by R86,6 billion over the first six months of 2014, more than double the R40,7 billion increase recorded during the same period of 2013. The corporate sector’s contribution to this acceleration increased to 89 per cent in the first half of 2014, compared to 57 per cent over the same period a year earlier. By contrast, the household sector plummeted from 43 per cent to 11 per cent during the same period. General loans to the corporate sector constituted the bulk of the increase, while general loans to households continued to recede. Year-on-year growth in the category for other loans and advances rebounded from a low of 9,3 per cent in December 2013 to 13,7 per cent in June 2014 and further to 16,7 per cent in July.
In the wake of the 2009 recession, the composition of the uptake of credit by households underwent a structural change, driven by the uptake of general loans and instalment sale credit. Before 2009, credit uptake was dominated by mortgage advances which, on average, comprised more than 70 per cent of growth in loans and advances. However, the robust growth in general loans and advances to the household sector, of which unsecured lending represents the majority share, started slowing towards the end of 2012 and decelerated notably during 2013 and the first two quarters of 2014. Twelve-month growth in general loans to households decelerated from a high of 30,1 per cent in January 2013 to a low of 0,2 per cent in July 2014, the lowest rate of growth since June 2003. The deterioration in this credit category reflects not only greater caution on the part of lenders in an attempt to limit credit impairments and improve risk profiles, but also continued financial pressure experienced by highly indebted households amid constrained income growth and – in instances of strike activity – loss of income and weak employment prospects.
Mortgage advances, the largest component of total loans and advances, rose by R25 billion in the first six months of 2014, well above the R8 billion increase recorded over the same period in the preceding year. The gradual improvement in mortgage advances is evident from the rising trend in advances applied for, granted and paid out since April 2013. Twelve-month growth remained modest at 3,7 per cent in July 2014, but this nonetheless represented its highest rate of growth since January 2011. Elevated capital repayments on mortgage advances have partly been contributing to the moderate growth in net new mortgage advances over the past three years, but they have been moderating during the first seven months of 2014, given the recent increases in the interest rate.
The rate of expansion in instalment sale credit and leasing finance, which represents mainly the financing of new and second-hand vehicles, started slowing gradually during the course of 2013 and moderated further in the first seven months of 2014. Twelve-month growth declined from a recent high of 14,2 per cent in October 2013 to 9,3 per cent in July 2014, as passenger vehicle sales declined. Exchange rate-induced vehicle price increases, upward pressure on interest rates and generally lacklustre economic conditions are some of the factors contributing to the slower vehicle sales; while the recent strike in the steel and engineering industry could further harm investment sentiment and impact on the future production and export of vehicles.
The corporate sector’s reliance on bank-intermediated funding edged higher in the first half of 2014 and exceeded credit extended to the household sector by a considerable margin. Growth in credit extension to the corporate sector gained momentum on account of brisk increases in general loans, extended to both financial and non-financial companies.
Growth in the corporate sector’s demand for credit accelerated from 7,4 per cent in December 2013 to 17,0 per cent in July 2014 – the highest annual growth rate since September 2008. The recovery in loans and advances extended to the corporate sector was partly boosted by the renewable energy initiative of government. When credit is categorised by economic sector, the electricity supply and financial intermediation sector dominated growth, supported by the manufacturing, real-estate and agricultural sectors. While growth in loans and advances to the corporate sector may continue to show some resilience given the prevailing low interest rate environment, an uncertain economic outlook and weak business confidence may temper the uptake of credit by private-sector companies over the short term.
| | |
| | | Quarterly Bulletin September 2014 |
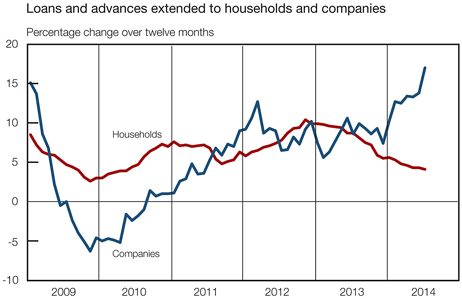
Twelve-month growth in credit extension to the household sector receded to 4,1 per cent in July 2014 – its lowest level since May 2010 – alongside slower growth across most categories of credit, especially general (unsecured) loans. The depressed level of household credit extension was probably exacerbated by weak employment growth, rising consumer price inflation and the recent increases in interest rates which raised borrowing costs.
The recent amendment to the National Credit Act, No. 34 of 2005 (the National Credit Act), may impact on credit extension to the household sector in months to come. On 1 April 2014, the Minister of Trade and Industry announced the implementation of an amendment to the National Credit Act requiring registered credit bureaus to remove adverse customer information when a consumer repays outstanding debt. The legislation aims to combat the discriminatory practice of disqualifying job seekers because of adverse credit profiles, and to improve credit provision to those who have repaid outstanding debt. Rating agencies have, however, warned against the unintended consequence of credit providers issuing fewer loans due to less data available for pricing in the extra risk.
The review of the National Credit Act also highlighted other significant gaps in the credit market. As a result, on 20 May 2014, the President signed into law the National Credit Amendment Act, No. 19 of 2014 (the National Credit Amendment Act), to deal more effectively with reckless lending. Subsequently, the Department of Trade and Industry published draft regulations in August 2014, containing affordability assessment regulations which provide criteria that credit providers must adhere to before extending credit to consumers.
Interest rates and yields
The Monetary Policy Committee (MPC) decided to raise the repurchase rate by 25 basis points to 5,75 per cent at its meeting in July 2014. The increase occurred despite a backdrop of deteriorating economic growth exacerbated by protracted strike action in the mining and manufacturing sectors. However, inflation had risen above the upper end of the target range, influenced primarily by exchange rate depreciation and rising food prices, while recent wage demands and settlements considerably in excess of inflation and productivity growth added to the upside risk to the inflation outlook. Cognisant of the fact that the inflation pressures did not reflect excess demand conditions in the economy, the MPC was, however, mindful of the possibility of second-round effects of supply-side shocks and therefore decided to tighten the policy stance. For the full statement, see page 81 of this Quarterly Bulletin.
| | |
| Quarterly Bulletin September 2014 | | |


After rising sharply during the first quarter of 2014 alongside the January increase in the repurchase rate and a weakening in the exchange value of the rand, money-market rates displayed relatively limited volatility during the second quarter. Market rates stabilised when the exchange value of the rand improved and the Bank decided to keep the repurchase rate unchanged at the MPC meeting in May 2014. The benchmark three-month Johannesburg Interbank Average Rate (Jibar) recorded a modest increase of 10 basis points from 5,73 per cent on 1 April 2014 to 5,83 per cent on 30 June 2014. The rate then rose by a further 13 basis points immediately after the MPC had decided to raise the repurchase rate by 25 basis points in July and thereafter increased moderately to 6,11 per cent on 29 August 2014. The twelve-month Jibar rose by 40 basis points from 6,83 per cent on 10 April 2014 to a high of 7,23 per cent on 25 August 2014. By 29 August, the rate had decreased to 7,20 per cent but continued to reflect a deterioration in inflation expectations emanating from the decline in the exchange rate of the rand.
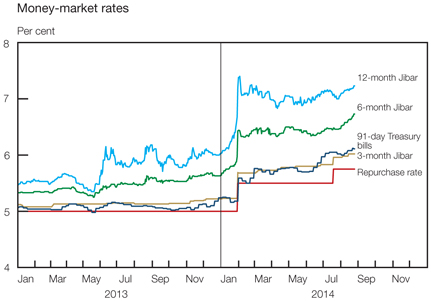
The tender rate on 91-day Treasury bills recorded a 31 basis points increase from 5,66 per cent on 1 April 2014 to 5,97 per cent on 30 June. By 4 July, the rate started trending above 6 per cent, reaching its highest level in nearly four years as investors had already started discounting the possibility of an increase in the repurchase rate at the MPC meeting in July. On 29 August, the rate stood at 6,01 per cent.
Funding conditions in the South African overnight interbank market remained largely accommodative during the second quarter of 2014. However, the implied rate on one-day rand funding in the foreign-exchange market (overnight FX rate) displayed a noticeable increase in volatility from mid-May 2014 alongside expectations of rising interest rates and generally tighter liquidity conditions in the foreign-exchange market, especially around month-ends. The rate fluctuated between 5,39 per cent and 6,42 per cent during the second quarter of 2014 and stood at 5,46 per cent on 29 August.
After increasing in January 2014, the South African Benchmark Overnight Rate (Sabor) on deposits held steady in the second quarter of 2014, with only mild fluctuations recorded. The rate increased by 20 basis points on 18 July alongside the increase in the repurchase rate and fluctuated sideways thereafter, recording 5,64 per cent on 29 August. The spread between the Sabor and the prevailing repurchase rate has been narrowing since early 2013, halving over the past twelve months. The narrowing between these rates can mainly be attributed to Basel III
| | |
| | | Quarterly Bulletin September 2014 |
requirements, which have been forcing banks to become more competitive for cash in overnight, short- and medium-term deposits. This was evident from the higher rates banks were willing to pay for overnight funding from their top 20 clients, which are included in the Sabor calculation.
After trending lower from January 2014, rates on forward rate agreements (FRAs) rose again during April and most of May 2014. The rates were influenced by both domestic and international developments, including the strike in the platinum sector, a weaker domestic currency and geopolitical tension in Ukraine. However, the increase in FRA rates quickly reversed when market participants reduced their expectations of the pace and extent of interest-rate tightening after the MPC had decided to keep the repurchase rate unchanged at its May meeting. The 9x12-month FRA rate initially declined from a recent high of 6,94 per cent on 23 April 2014 to 6,59 per cent on 23 May. The rate then fluctuated higher but declined when the 25 basis points rise in the policy rate in July was lower than expected. On 29 August, the rate stood at 6,57 per cent. The 3x6-month FRA rate recorded a 30 basis points increase from 5,97 per cent on 8 April to 6,27 per cent on 30 June before edging lower to 6,10 per cent soon after the July MPC decision had been announced. The 3x6-month FRA rate stood at 6,24 per cent on 29 August 2014 and continues to indicate that investors remain cautious in the wake of rising domestic inflation pressures.
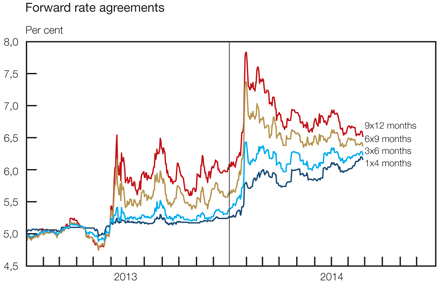
The prime lending rate and predominant rate on mortgage loans increased to 9,25 per cent following the decision of the MPC to raise the repurchase rate by 25 basis points at its meeting in July 2014. Other deposit and lending rates generally followed the changes in the policy rate during the first seven months of 2014.
The Department of Justice and Correctional Services changed the prescribed rate of interest under the Prescribed Rate of Interest Act, 1975 (Act No. 55 of 1975) on 1 August 2014 for the first time since October 1993. This Act provides for the calculation and payment of interest on certain judgement debts. The prescribed rate of interest was adjusted lower from 15,5 per cent to 9 per cent per annum.
The remarks in May 2013 by the US Federal Reserve regarding the possible phasing out of stimulus measures gave rise to higher international bond yields, depreciation in the exchange value of the rand and an upsurge in South African bond yields. Thereafter the release of higher-than-expected inflation outcomes, the sell-off of local bonds by non-residents, the start of actual tapering by the US Federal Reserve and the onset of the platinum-mining strike gave further impetus to the rising trend in bond yields. For example, the daily average yield on the R186 government bond increased by 227 basis points from 3 May 2013 to 31 January 2014.
| | |
| Quarterly Bulletin September 2014 | | |


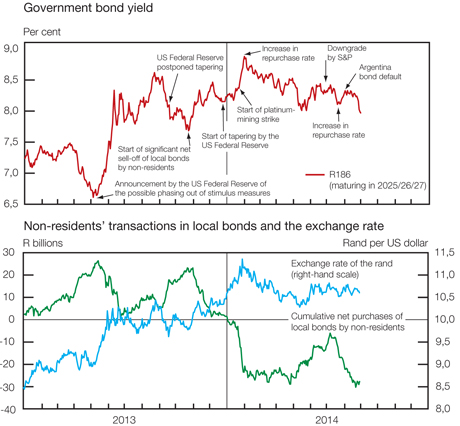
Sentiment in the bond market subsequently improved, mainly supported by a partial recovery in the exchange value of the rand and a rise in demand for domestic bonds by non-residents as volatility in emerging-market securities seemed more contained. However, in June 2014 bond yields once more rose in response to the depreciation in the exchange value of the rand and intensifying concerns regarding possible interest rate increases against the backdrop of continuously higher levels of inflation. Also contributing to higher bond yields were the bond defaults in Argentina and the downgrade of South Africa’s sovereign credit rating by one rating agency and revision of the outlook from stable to negative by another, partly reflecting expectations of lacklustre growth. Analysts expect the nominal bond yield to increase by around 50 basis points from its current level to the end of 2014, alongside a continuation of above-target inflation outcomes.
Box 6: Credit ratings and bond yields
A number of credit rating agencies specialise in the evaluation of the credit risk attached to sovereign and corporate debt. The first table on the next page shows how the yields on US dollar-denominated government bonds vary along with the sovereign credit ratings of those countries with a sovereign credit rating broadly similar to South Africa, as rated by Standard & Poor’s Rating Services, one of the prominent rating agencies. Bonds rated BBB- or higher are indicated as ‘investment grade’, while the bonds rated below that level are indicated as ‘non-investment grade’ or ‘speculative grade’.
South Africa’s sovereign credit rating was downgraded to BBB- in June 2014, which is considered the lowest investment grade rating. Considering the bond yields of countries with credit ratings close to that of South Africa, the relationship between yields and sovereign credit ratings is not purely linear. However, although bond yields vary across countries within a rating band as various other factors such as liquidity come into play, average bond yields move progressively higher as credit ratings become less favourable. The average bond yield for countries with a BBB rating was 10 basis points higher than the average BBB+ yield, with a further 19 basis points increase in the average bond yield for countries with
| | |
| | | Quarterly Bulletin September 2014 |
a BBB- rating. Going from BBB- to the highest speculative grade rating of BB+ involves a further 26 basis points increase. Lastly, the average bond yield for the BB rating was 44 basis points higher than the average bond yield for countries with a BB+ rating. The differentials reported here relate to yields on a specific day only; some variation may be expected over time.
Average yield on US dollar-denominated sovereign bonds by rating category, 20 August 2014
| | | | | | |
| Standard & Poor’s rating | | Average yield
Per cent* | | | Remarks |
BBB+ | | | 3,78 | | | Investment grade |
BBB | | | 3,88 | | | Investment grade |
BBB- | | | 4,07 | | | Lowest investment grade.
South Africa currently
falls in this rating
category |
BB+ | | | 4,33 | | | Highest speculative grade |
BB | | | 4,77 | | | Speculative grade |
The individual country data underpinning the calculated average yields are reflected in the table below.
Country detail: A selection of yields on US dollar-denominated sovereign bonds, 20 August 2014
| | | | | | |
| Country | | Bond yield
Per cent* | | | Standard &
Poor’s rating** |
Mexico | | | 3,27 | | | BBB+ |
Peru | | | 3,65 | | | BBB+ |
Aruba | | | 4,42 | | | BBB+ |
Italy | | | 3,29 | | | BBB |
Philippines | | | 3,36 | | | BBB |
Colombia | | | 3,51 | | | BBB |
Panama | | | 3,88 | | | BBB |
Bahrain | | | 4,35 | | | BBB |
Bahamas | | | 4,86 | | | BBB |
Uruguay | | | 3,71 | | | BBB- |
Romania | | | 3,86 | | | BBB- |
Brazil | | | 3,87 | | | BBB- |
Iceland | | | 3,89 | | | BBB- |
Morocco | | | 4,13 | | | BBB- |
South Africa | | | 4,24 | | | BBB- |
Russia | | | 4,81 | | | BBB- |
Indonesia | | | 4,17 | | | BB+ |
Turkey | | | 4,49 | | | BB+ |
Guatemala | | | 4,28 | | | BB |
Paraguay | | | 4,37 | | | BB |
Portugal | | | 4,94 | | | BB |
Croatia | | | 5,04 | | | BB |
Costa Rica | | | 5,22 | | | BB |
| * | Rates on US dollar-denominated bonds in the 8-to-11-years maturity range |
| ** | Red = non-investment grade |
Source: Bloomberg
| | |
| Quarterly Bulletin September 2014 | | |

Alongside the developments that affected the bond market, the yield curve moved generally lower across most maturities from the beginning of February 2014 to August. Rates at the extreme short end of the yield curve moved higher following the increase in the repurchase rate in July 2014. Therefore the yield gap, measured as the difference between yields at the extreme long and short ends of the curve, narrowed from 406 basis points on 3 February 2014 to 302 basis points on 29 August.
The currency risk premium8 widened from 341 basis points in January 2014 to 367 basis points in July, as the yield on dollar-denominated bonds decreased more pronouncedly than the yield on rand-denominated bonds. The improvement in the bond market was also evident in the narrowing of the sovereign risk premium on South African government US dollar-denominated bonds in the eight-year maturity range trading in international markets from an average of 200 basis points in February 2014 to 155 basis points in July. As investors’ sentiment towards debt instruments of emerging markets continued to improve, the JPMorgan Emerging Markets Bond Index Plus (EMBI+)9 yield spread above US government bonds narrowed to 283 basis points in July 2014, from a high of 399 basis points in January 2014.
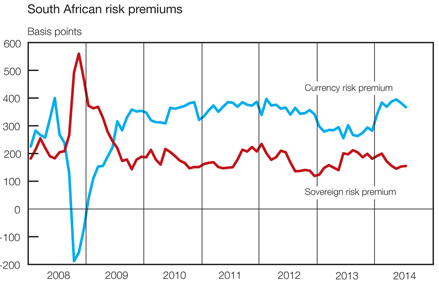
Money market
Money-market conditions remained fairly stable during the second quarter of 2014. During that quarter, the actual daily liquidity requirement of private-sector banks fluctuated within the relatively broad range of R13,7 billion to R43,7 billion, and on average amounted to R26,9 billion. The liquidity requirement nevertheless trended higher, consistent with the money-market strategy of the Bank announced in August 2013 which provided for the trends in notes and coin in circulation as well as in banks’ required cash reserve deposits with the Bank to be reflected in the liquidity requirement. The accompanying graph illustrates this relationship.
During the second quarter of 2014, liquidity to the net amount of R5,8 billion was drained from the money market, compared to a net injection of R2,7 billion recorded in the same quarter of 2013. On balance, changes in the amount of notes and coin in circulation outside the Bank as well as banks’ required cash reserve deposits cumulatively tightened money-market liquidity by R5,7 billion during the second quarter and by further R6,8 billion in July 2014.
| | |
| | | Quarterly Bulletin September 2014 |
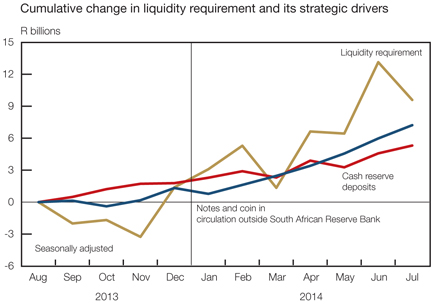
Money-market liquidity flows
R billions (easing + tightening –)
| | | | | | | | | | | | |
| | | 2014 | |
| | | Jan–Mar | | | Apr–Jun | | | Jul | |
Notes and coin in circulation | | | 11,7 | | | | -1,7 | | | | -2,5 | |
Change in cash reserve accounts | | | 1,9 | | | | -4,0 | | | | -4,3 | |
Money-market effect of SARB* foreign-exchange transactions in spot market | | | -1,9 | | | | -0,3 | | | | 0,0 | |
Government deposits with SARB** | | | -6,2 | | | | -4,0 | | | | -1,3 | |
Use of liquidity management instruments | | | -9,1 | | | | 4,1 | | | | 0,5 | |
Reverse repurchase transactions | | | -0,2 | | | | -0,1 | | | | 0,6 | |
SARB debentures | | | -3,1 | | | | 1,5 | | | | -1,6 | |
Forward position (swaps) | | | -2,3 | | | | 4,0 | | | | 1,3 | |
Corporation for Public Deposits call deposits with SARB | | | -3,5 | | | | -1,3 | | | | 0,2 | |
Other items net | | | 2,4 | | | | 0,1 | | | | 0,3 | |
Liquidity provided to banking system | | | -1,2 | | | | -5,8 | | | | -7,3 | |
| * | SARB: South African Reserve Bank |
| ** | Change in government deposits due to the settlement of maturing foreign-exchange swaps |
The Bank utilised its liquidity management instruments to partly offset the factors that had impacted on money-market liquidity conditions, injecting R4,1 billion worth of liquidity into the market during the second quarter of 2014. A further R0,5 billion was injected in July 2014.
During the second quarter of 2014, spot sales of foreign exchange amounted to R0,3 billion, thereby contracting money-market liquidity. During the same period, maturing swaps of R4,0 billion, previously entered into on behalf of National Treasury, had an expansionary impact on the money market. To fund these maturing swaps government deposits were withdrawn from the Tax-and-Loan Accounts at commercial banks and placed with the Bank.
| | |
| Quarterly Bulletin September 2014 | | |


The accompanying graph provides a summary of the outstanding balances of selected liquidity management instruments.
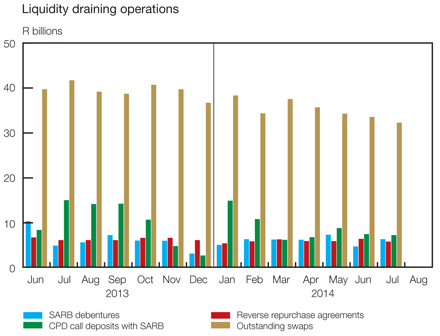
Capital redemption payments and scheduled coupon interest payments on various government bonds amounting to R17,5 billion were effected from the government tax and loan accounts during the second quarter of 2014, with R53,0 million of this amount accruing to the bond portfolio of the Bank.
Bond market
Growth in the domestic primary bond market was mostly driven by the public sector’s sustained brisk demand for funds. The public sector recorded net issues of R120 billion in the first seven months of 2014, compared with net issues of R96 billion in the corresponding period of 2013. National government raised R104 billion of the total net issues by the public sector. As announced in the Budget Review 2014, the National Treasury launched two new fixed-income government bonds, namely the R2032 in June 2014 and the R2044 in July. The R2032 bond will mature on 31 March 2032, while the R2044 bond is a split-maturity bond, similar to the R153 and R157 bonds, with a maturity date of 31 January 2043/44/45. Public sector bond issuances were also supplemented by two municipal bond issuances thus far in 2014.
The National Treasury raised a further R18 billion through the issuances of two new bonds in the international capital markets in July 2014, forming part of its 2014/15 financing programme. The National Treasury issued a US$1 billion 30-year bond with a coupon rate of 5,375 per cent. It also issued a €500 million 12-year bond at a coupon rate of 3,75 per cent.
Short-term funding by the private sector in the form of commercial paper dwindled thus far in 2014, giving rise to net redemptions of commercial paper amounting to R12 billion. However, net bond issuances by the private sector of R24 billion in the first seven months of 2014 were somewhat higher than the net issues of R18 billion recorded over the same period of 2013. The total nominal value of debt securities listed on the JSE increased by R145 billion thus far in 2014, bringing the outstanding nominal amount to R2,0 trillion at the end of July.
| | |
| | | Quarterly Bulletin September 2014 |
The corporate bond market remains an important source of funds for a wide range of private-sector and parastatal issuers, with rising amounts of corporate debt in issue. However, growth in the corporate bond market lost some of its momentum in recent years, as the nominal amount in issue, which rose by 19 per cent in 2012, increased by only 9 per cent in 2013 and 6 per cent in the first seven months of 2014. In July 2014 banks accounted for 39 per cent of the amount in issue in the corporate bond market, followed by non-financial parastatals at 30 per cent. Seven years earlier, in July 2007, securitisation issuances dominated at 39 per cent before the financial crisis. Of the non-financial corporate bond amount in issue, parastatals were responsible for 75 per cent in July 2014, funding their infrastructure spending in line with government policy.
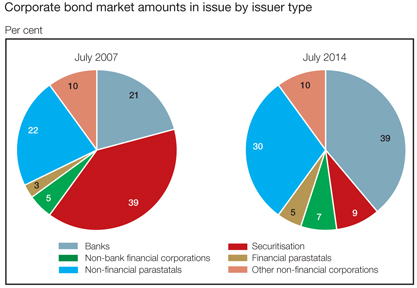
Turnover in the secondary bond market remained less buoyant in the first seven months of 2014, when compared with the previous three years, alongside lower volumes traded and on average higher bond yields. The daily average nominal turnover of R78 billion traded per day in the first seven months of 2014 was 9 per cent lower than the value traded in the corresponding period of 2013. As a result the annualised liquidity ratio, measured as the nominal value of bonds traded relative to the nominal amount in issue, averaged 10 times per annum in the first seven months of 2014, less than the nearly 13 times per annum recorded over the same period of 2013. The R157 government bond remained the most liquid government bond traded in the first seven months of 2014, followed by the R186 bond.
| | |
| Quarterly Bulletin September 2014 | | |


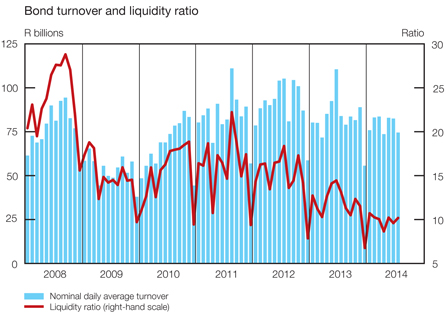
The issuance of rand-denominated bonds by foreign borrowers in the European bond markets remained strong in the first seven months of 2014, while that in the Japanese Uridashi bond market continued to diminish. In the Japanese Uridashi bond market the scheduled redemptions exceeded new issues by R1,8 billion in the first seven months of 2014. However, these net redemptions were much less than the redemptions registered in the corresponding period of 2013. Consequently, the combined net issuance in both markets came to almost R14 billion in the seven months to July 2014, which were fourfold the net issues in the corresponding period of 2013.
Rand-denominated bonds issued in international bond markets, January to July
R millions
| | | | | | | | | | | | | | | | | | | | | | | | |
| | | Eurorand | | | Uridashi | | | Total | |
| | | 2013 | | | 2014 | | | 2013 | | | 2014 | | | 2013 | | | 2014 | |
Issues | | | 12 729 | | | | 17 725 | | | | 6 683 | | | | 489 | | | | 19 412 | | | | 18 214 | |
Redemptions | | | 3 760 | | | | 2 285 | | | | 12 316 | | | | 2 269 | | | | 16 076 | | | | 4 554 | |
Net | | | 8 969 | | | | 15 440 | | | | -5 634 | | | | -1 780 | | | | 3 336 | | | | 13 660 | |
Non-residents held no less than 38 per cent of South African government bonds at the end of July 2014, but maintained a less-than-proportionate impact on turnover in the domestic secondary bond market with an average participation rate of 11 per cent in the first seven months of 2014. Exchange-reported net sales of domestic bonds by non-residents amounted to R25 billion in the first quarter of 2014, switching to net purchases of R9,5 billion in the second quarter. Following renewed net sales in July, non-residents’ cumulative net sales in the domestic secondary bond market amounted to R20 billion in the first seven months of 2014.
| | |
| | | Quarterly Bulletin September 2014 |
Share market
Notwithstanding the deterioration in domestic growth and fragile economic outlook, the upward trajectory in share prices contributed to robust capital-raising activity. Equity capital raised by companies listed on the JSE in the domestic and international primary share markets amounted to R113 billion in the seven months to July 2014 – some 108 per cent higher than the amount raised in the corresponding period of 2013. Capital raised in the second quarter of 2014 at R55 billion was the highest since the all-time quarterly high in the fourth quarter of 2005. The strong trend in capital raised thus far in 2014 was underpinned by companies in the industrial sector which accounted for 42 per cent of the total equity capital raised. In the first seven months of 2014 the most prominent method of raising capital was the waiver of pre-emptive rights where shares were issued for cash to the general market or specific investors, simply for operational expansion or to take advantage of opportunities presented by market conditions.
Secondary share market indicators benefited from soaring share prices. The market capitalisation of the JSE increased by 35 per cent from July 2013 to an all-time high of R12 trillion in July 2014. Despite some lower volumes traded thus far in 2014, the daily average turnover in the secondary share market amounted to R16 billion traded per day in both 2013 and the first seven months of 2014. A slightly smaller number of companies were listed on the JSE, as delistings exceeded new listings thus far in 2014.
After recording exchange-reported net sales of R27 billion in the fourth quarter of 2013, non-residents demonstrated stronger participation in the domestic secondary share market in 2014 with an average participation rate10 of 19 per cent. Against the background of a fairly depreciated exchange value of the rand, non-residents increased their holdings of domestic shares by R7,6 billion in the first quarter of 2014 and by a further R8,7 billion in the second quarter, contributing to cumulative net purchases of R18 billion in the first seven months of 2014 – nearly in line with the net purchases of R22 billion recorded in the corresponding period of 2013. The portion of domestic shares held by non-residents has remained around 20 per cent.
Together with low expected volatility in the equity market as measured by the South African Volatility Index, domestic share prices continued to reach successive record highs in 2014. For example, the FTSE/JSE All-Share Price Index (Alsi) increased by 38 per cent from a recent low of 37 802 index points on 17 April 2013 to reach an all-time high of 52 242 index points on 29 July 2014, driven by higher international share prices and mainly supported by the strong performance of resources and industrial shares. Subsequently, the Alsi tracked global equity markets lower, declining by 2 per cent to 50 959 index points on 29 August, as a result of, among other things, some profit-taking after the recent strong rallies, Argentina defaulting on its debt and the concerns regarding the strength of the euro area’s economic recovery. Domestic share prices moved in tandem with developed markets as depicted by the MSCI World Index, while the performance of the MSCI Emerging Markets Index was more subdued, dragged down by countries such as Russia where share prices have been generally declining since 2011.
| | |
| Quarterly Bulletin September 2014 | | |


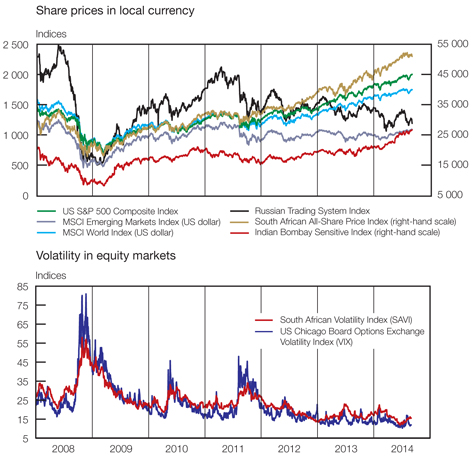
Market for exchange-traded derivatives
Trading activity in commodity futures and options contracts on the Commodity Derivatives Market of the JSE during the first seven months of 2014 was 2 per cent lower than in the corresponding period of 2013. The downward trend in domestic grain prices since March 2014 was in line
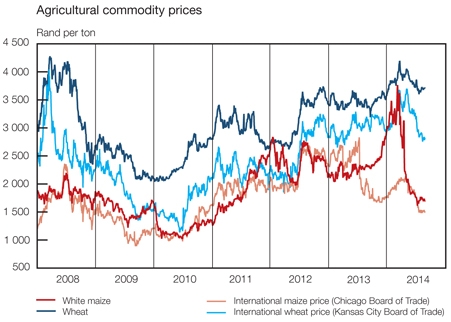
| | |
| | | Quarterly Bulletin September 2014 |
with lower international grain prices, as good harvesting conditions both locally and internationally gave rise to projections of increased global production as released in the US World Agricultural Supply and Demand Estimates report.
The total number of contracts traded on the JSE’s Interest Rate Derivatives Market (IRM) increased by 19 per cent, while those on the Currency Derivatives Market increased by 28 per cent in the first seven months of 2014 compared with the corresponding period of 2013. Currency derivative contract holders continued to hedge against adverse currency movements, particularly the rand/dollar exchange rate. Thus far in 2014, the bulk of the trading activity and value traded on the IRM was concentrated in futures on long-term government bonds, along with the longer-term risk exposure on these bonds. The JSE listed the first Can-Do Interest Rate (CANDOIR) futures contract in April 2014, which operates similar to the Currency Can-Do products previously introduced. The Can-Do contracts provide investors with greater flexibility and diversified trading strategies, thereby reducing their exposure to risk. Turnover in all derivatives traded on the JSE during the first seven months of 2014 is shown in the table below.
Derivatives turnover on the JSE, January to July 2014
| | | | | | | | |
| Type of derivative | | Value
(R billions) | | | Change over
one year
(Per cent) | |
Equity | | | 3 218 | | | | 14 | |
Warrants | | | 0,4 | | | | 33 | |
Commodity | | | 314 | | | | 4 | |
Interest rate | | | 383 | | | | 5 | |
Currency | | | 300 | | | | 56 | |
Real-estate market
Inflation in house prices remained moderate, but slightly above consumer price inflation in the first seven months of 2014. The deteriorating macro-economic environment in 2014 negatively affected buying patterns, transaction volumes and price growth. Against this background, nominal house
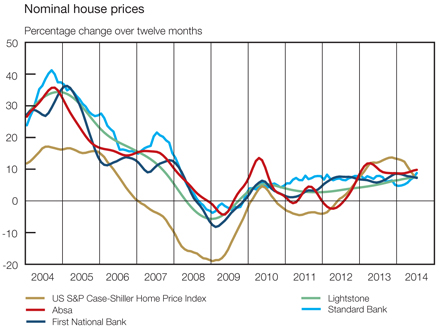
| | |
| Quarterly Bulletin September 2014 | | |


price inflation remained in single digits in the first seven months of 2014, tracking subdued employment and income growth, and the increases in the repurchase rate. However, the average time residential properties remained on the market declined further from 13,6 weeks in the first quarter of 2014 to 11,6 weeks in the second quarter. The year-on-year rate of changes in South African property prices were broadly in line with the trend in changes in US property prices.
In the commercial property market some of the A-grade central business district office rentals improved in recent quarters, especially in Johannesburg, despite still high office vacancy rates. The strongest year-on-year growth in industrial rentals was recorded in Durban. Flat rental increases in South Africa remained modest, in line with lacklustre economic activity.
Non-bank financial intermediaries
The balance sheet of non-bank financial institutions11 continued to benefit from sustained strength in the equity market and higher investment flows in the second quarter of 2014. Total assets of these institutions increased by 4 per cent from the first quarter of 2014 to R7,4 trillion in the second quarter; this represented an increase of 17 per cent from the second quarter of 2013. Expressed as a percentage of gross domestic product, the total assets of these intermediaries increased by 18 percentage points from the second quarter of 2013 to 207 per cent in the second quarter of 2014. Underpinned by higher equity market revaluations, the asset base of longer-term contractual saving vehicles (insurers and pension funds) increased by 3 per cent from the first quarter of 2014 to R5,1 trillion in the second quarter. Spurred by an increase in non-money market funds, the total assets of unit trusts increased by 6 per cent to R1,8 trillion over the same period.
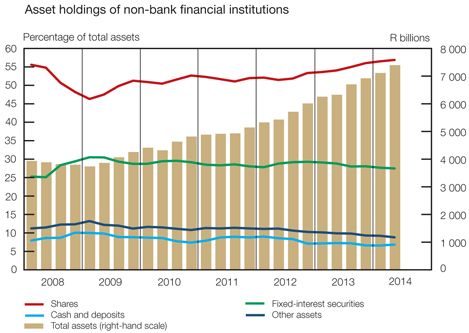
Bolstered by higher domestic and international share prices, holdings of shares by non-bank financial institutions increased slightly from the first quarter of 2014 to 57 per cent of total assets in the second quarter – the highest since the third quarter of 2007. The increase in equity portfolio was, among other things, precipitated by low risk aversion in financial markets and relatively low returns offered on alternative asset classes. New inflows to institutional investors were mostly channelled to equity and bond portfolios in the second quarter of 2014. However, unit trusts invested about R21 billion in money-market funds in the second quarter of 2014, after registering consecutive net outflows from the fourth quarter of 2013.
| | |
| | | Quarterly Bulletin September 2014 |
Funds invested in cash and deposits as a percentage of total assets increased moderately from the first quarter of 2014 to 7 per cent in the second quarter. The increase in cash holdings by non-bank financial institutions occurred despite a low real interest rate environment. By contrast, the ratio of holdings of fixed-interest securities by these institutions to their total assets fell slightly by 1 percentage point from the first quarter of 2014 to 27 per cent in the second quarter, amidst higher inflation. Total loans extended by these intermediaries to households and companies remained unchanged at 6 per cent of total assets in the first and second quarters of 2014.
The positive wealth effects associated with the increase in financial assets of non-bank financial intermediaries in the first half of 2014 will probably support households’ balance sheets. Furthermore, new investment by these intermediaries will support economic activity.
The National Treasury released alternative measures to replace the Insurance Laws Amendment Bill, 2013, which was not passed and lapsed with the Parliament’s term. The Bill was meant to amend the existing Long-term Insurance Act, 1998 (No. 52 of 1998) and Short-term Insurance Act, 1998 (No. 53 of 1998) by introducing insurance group supervision and address regulatory gaps in adherence to international financial regulatory principles and standards in respect of insurance, among others. It was announced that interim measures such as the use of Board Notice and the Financial Sector Regulation Bill (Twin Peaks Bill) will be used to give effect to the intention of the Insurance Laws Amendment Bill.
The National Treasury and the Financial Services Board released for public comment on 11 July 2014 the proposed amendments to insurance binder regulations issued under the Short-term and Long-term Insurance Acts. The regulations govern the manner in which insurers outsource binder functions, which refer to the authority granted to an underwriting manager or intermediary to enter into, vary or renew a policy on behalf of an insurer, or to settle claims on behalf of an insurer. The proposed amendments strengthen the existing regulations and enhance policyholder protection through, among others, clarifying the definition of an associate and underwriting manager and what constitutes matters incidental to binder functions.
Flow of funds
The domestic economy’s indebtedness to the foreign sector increased further in the first quarter of 2014 as the non-resident sector’s net investment flows amounted to R44 billion, somewhat higher than the R36 billion recorded in the fourth quarter of 2013. The sustained overall inflow of capital in the first quarter of 2014 mainly reflected the acquisition of equity securities of R6,1 billion, loan finance to domestic institutions of R58 billion and an increase in debt security holdings of R3,4 billion. Uncertainty regarding the US Federal Reserve’s tapering of its asset purchase programme continued to increase risk aversion towards emerging-market economies as investors persistently assesed their investment portfolios.
Despite the subdued domestic economic performance, slow pace of employment creation, labour disruptions in some industries and rising cost pressures, financial intermediaries’ total flows in the first quarter of 2014 amounted to R265 billion, compared with R190 billion registered in the fourth quarter of 2013. Financial intermediaries recorded an increase of R71 billion in loans issued over the period. The non-financial corporate sector’s use of bank-intermediated funding increased in the period under review, rising more briskly than credit extended to the household sector. The robustness of the equity market continued to cause further reallocation of funds out of cash to other portfolios. Intermediation through equity securities was elevated at R88 billion, though lower than in the fourth quarter of 2013. Fixed-interest security holdings increased by R102 billion with monetary authority and Public Investment Corporation being the main holders of debt securities.
| | |
| Quarterly Bulletin September 2014 | | |


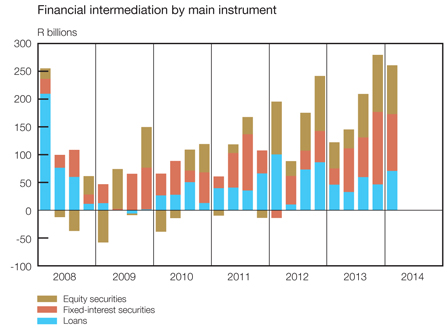
The general government sector continued to raise capital in the bond market in the first quarter of 2014. Funds were largely used to finance capital spending on the expansion and maintenance of road and transport facilities. A total of R30 billion was spent on infrastructure, of which R15 billion capital expenditure was used by local government to respond to the demand for basic services and for the Bus Rapid Transit (BRT) infrastructure project. The general government sector narrowed its financing deficit moderately to R38 billion in the period under review. This shortfall was financed through issuances of long-term and short-term government bonds of R20 billion and Treasury bills amounting to R4,9 billion. The liquid domestic financial market allowed government to secure funding from investors to fund the budget deficit at a reasonable cost.
The non-financial corporate business enterprises sector recorded a surplus position of R1,0 billion in the first quarter of 2014. The acquisition of capital goods by public non-financial businesses amounting to R35 billion mainly consisted of machinery and equipment, upgrades on roads and freight rail, and port terminal capacity expansion projects. Over the same period, non-financial corporates increased their cash holdings by R95 billion, issued R94 billion worth of shares and took up loans amounting to R67 billion.
The household sector ended the first quarter of 2014 with a wider deficit position of R31 billion, which was an increase from the fourth quarter deficit of R4,6 billion. The subdued economic conditions somewhat constrained the take-up of loans and advances by households, in a setting of persistent over-indebtedness of numerous households, loss of income due to industrial action and the rising cost of living. On the other side of the balance sheet, household bank deposits and interest in retirement and life funds rose by a combined R27 billion over the same period.
| | |
| | | Quarterly Bulletin September 2014 |
Public finance12
Non-financial public-sector borrowing requirement13
In the first quarter of fiscal 2014/15, the non-financial public-sector borrowing requirement amounted to R41,3 billion or R3,4 billion higher than in the first quarter of the previous fiscal year. The higher non-financial public-sector borrowing requirement resulted from a higher cash deficit registered by the consolidated general government, driven mainly by a significant increase in local government deficits. The non-financial public enterprises and corporations recorded a lower cash deficit in the current quarter relative to the same quarter in 2013/14.
Non-financial public-sector borrowing requirement
R billions
| | | | | | | | |
| Level of government | | Apr–Jun 2013* | | | Apr–Jun 2014* | |
Consolidated general government | | | 17,7 | | | | 23,5 | |
National government | | | 27,2 | | | | 27,6 | |
Extra-budgetary institutions | | | -2,0 | | | | -2,8 | |
Social security funds | | | -4,3 | | | | -2,8 | |
Provincial governments | | | -7,7 | | | | -7,5 | |
Local governments | | | 4,6 | | | | 9,1 | |
Non-financial public enterprises and corporations | | | 20,2 | | | | 17,7 | |
Total** | | | 37,9 | ** | | | 41,3 | ** |
As percentage of gross domestic product | | | 4,5 | | | | 4,6 | |
| ** | Components may not add up to totals due to rounding |
As a percentage of gross domestic product, the non-financial public-sector borrowing requirement amounted to 4,6 per cent in the first quarter of fiscal 2014/15, slightly higher than the ratio of 4,5 per cent recorded in the same period a year earlier.
In the April–June quarter of 2014, the borrowing requirement of the consolidated general government amounted to R23,5 billion or R5,8 billion more than in the same period a year ago. As a ratio of gross domestic product, the consolidated general government borrowing requirement amounted to 2,6 per cent in the first quarter of fiscal 2014/15, compared with 2,1 per cent recorded in the same period a year earlier.
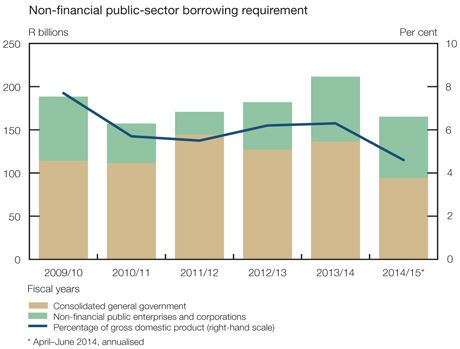
| | |
| Quarterly Bulletin September 2014 | | |

The financial activities of the non-financial public enterprises and corporations, resulted in an estimated borrowing requirement of R17,7 billion in the first quarter of fiscal 2014/15 – some R2,4 billion less than the borrowing requirement recorded in the same period a year earlier. The narrowing cash deficit could be attributed to growth in total receipts, which outpaced the modest growth in total expenditure. Net investment in non-financial assets amounted to R24,5 billion in the first three months of fiscal 2014/15 or 0,5 per cent less than in the same period of the previous fiscal year. Despite this slight decline, the level of infrastructure-related spending by major state-owned enterprises remained in firm territory. The Budget Review 2014 indicated that infrastructure spending by these public sector units would cumulatively reach R382 billion over the three-year planning period. The public sector continued investing on a large scale to provide water, transport, electricity, telecommunications and other infrastructure.
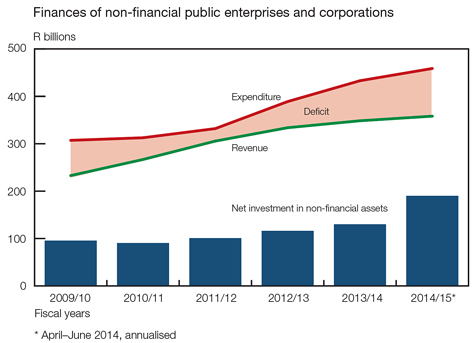
In the April–June quarter of fiscal 2014/15, national government cash receipts from operating activities amounted to R234 billion or 9,5 per cent more than in the first quarter of fiscal 2013/14. Firm collections in most major tax categories contributed to the rise in cash receipts.
National government cash payments for operating activities recorded a year-on-year rate of increase of 8,6 per cent, amounting to R260 billion in the first three months of fiscal 2014/15. Grants to other levels of government accounted for 57,6 per cent of total expenses, recording an increase of 12,4 per cent year on year. The bulk of these grants was transfers to provincial governments in the form of equitable share transfers and conditional grants. Net cash flow from operating activities along with net investment in non-financial assets resulted in a cash deficit of R27,6 billion in April–June 2014, some R0,5 billion more than the deficit recorded in the same quarter a year earlier.
For the period under review, provincial governments’ financial activities resulted in a cash surplus of R7,5 billion, some R0,3 billion less than the cash surplus recorded in April–June 2013. The Budget Review 2014 projected that this level of government would record a cash deficit of R3,0 billion for 2014/15 as a whole.
Total provincial government revenue amounted to R115 billion in the first quarter of fiscal 2014/15, representing a year-on-year rate of increase of 8,5 per cent. This increase could be attributed to higher grants from national government, which included equitable share transfers
| | |
| | | Quarterly Bulletin September 2014 |
and conditional grants earmarked for specific purposes totalling R111 billion. In the April–June quarter of fiscal 2014/15, total expenditure – cash payments for operating activities together with net investment in non-financial assets – amounted to R107 billion or 9,4 per cent more than in the same period of the previous fiscal year. Growth in expenditure was driven mainly by an increase in provincial governments’ net investment in non-financial assets, purchases of goods and services, and compensation of employees.
Reflecting provincial governments’ cash surplus in the period under review, their deposits with the Corporation for Public Deposits increased from R13,1 billion at the end of March 2014 to R20,6 billion at end of June 2014. At the same time, their deposits with private banks increased from R10,5 billion to R13,9 billion while their overall indebtedness to banks decreased from R1,8 billion to R1,1 billion over the same period.
During the April–June quarter of 2014, the financial statistics of local governments indicated a cash deficit of R9,1 billion, almost double the deficit recorded in the same period of the prior year. This deterioration could be attributed to an increase in total expenditure driven by a significant increase in the net investment in non-financial assets.
In the first three months of fiscal 2014/15, local authorities continued to increase their activity in the bond market as the Ekurhuleni metropolitan municipality returned to the bond market for the first time since 2011 with an issuance of R0,8 billion, while the City of Johannesburg issued a bond of R1,5 billion. These funding activities contributed to the total outstanding marketable bonds of local governments increasing to R18,3 billion at the end of June 2014, from R16,1 billion at the end of March 2014.
Box 7: Local government audit results
The Auditor-General’s 2012/13 report on local governments comprising 319 audited institutions (8 metropolitan cities, 44 district municipalities, 226 local municipalities and 41 municipal entities) showed on aggregate, a slight improvement in the audit outcomes. Thirty entities, or 9 per cent of the total, achieved a clean audit with unqualified financial statements. While this was an improvement when compared with the 5 per cent obtained in 2011/12, it clearly indicates that much further work needs to be done.
In respect of 2012/13, 138 institutions had unqualified financial statements with findings of some inadequacies, 84 had qualified statements with findings, and 67 had an adverse opinion or disclaimer with findings.
The three most common causes of poor audit outcomes were identified as:
| • | | a slow response by the political leadership in addressing the causes of poor audit outcomes; |
| • | | a lack of consequences for poor performance and transgressions; and |
| • | | key positions being vacant or key officials lacking appropriate competencies. |
It was reported that both the Minister of Finance and the Minister of Cooperative Governance and Traditional Affairs would take firm corrective actions to proactively address the shortcomings of financial management in local government.
Preliminary estimates indicate that extra-budgetary institutions14 recorded a cash surplus of R2,8 billion in the first quarter of fiscal 2014/15, higher than the cash surplus recorded in the same period of the previous year. The cash surplus was driven primarily by grants from national government, amounting to R38,5 billion, which boosted cash receipts. The major recipients of national government transfers to national extra-budgetary institutions were:
| • | | the National Student Financial Aid Scheme, with grants used for the provision of loans and bursaries to disadvantaged students at higher education institutions as well as further education and training colleges; |
| | |
| Quarterly Bulletin September 2014 | | |


| • | | the South African Revenue Service, with transfers used to finance the rolling out of improved computer systems serving importers and exporters and the strengthening of border control and risk management in customs offices; and |
| • | | the South African Social Security Agency, using the funds for the administration, management and payment of social assistance grants. |
Social security funds recorded a cash surplus of R2,8 billion in the first quarter of the current fiscal year – significantly lower than the cash surplus of R4,3 billion recorded in the first quarter of the previous fiscal year. This decrease in the cash surplus could be attributed to an increase in social benefits paid out, which amounted to R9,0 billion in the April–June quarter of 2014 compared with R6,0 billion recorded in the same period a year earlier.
Budget comparable analysis of national government finance
In the first quarter of fiscal 2014/15, national government expenditure recorded a year-on-year rate of increase of 7,9 per cent, amounting to R253 billion. The Budget Review 2014 projected that national government expenditure would increase by 9,0 per cent year on year to total R1 139 billion in fiscal 2014/15. National government expenditure as a ratio of gross domestic product amounted to 28,4 per cent in April–June 2014, compared with 28,0 per cent recorded in the same quarter of the previous fiscal year.
National government expenditure in fiscal 2014/15
| | | | | | | | | | | | | | | | |
| | | Originally budgeted: | | | Actual | |
| | | Full 2014/15 | | | Apr–Jun 2014 | |
| Expenditure item | | | | | | |
| | | R billions | | | Percentage
change* | | | R billions | | | Percentage
change* | |
Voted amounts | | | 631,8 | | | | 8,9 | | | | 138,6 | | | | 8,8 | |
Current payments | | | 181,0 | | | | 6,0 | | | | 39,7 | | | | 3,9 | |
Transfers and subsidies | | | 433,1 | | | | 9,5 | | | | 97,5 | | | | 10,9 | |
Payments for capital assets | | | 17,7 | | | | 26,2 | | | | 1,5 | | | | 15,8 | |
Statutory amounts | | | 507,2 | | | | 9,1 | | | | 114,8 | | | | 6,8 | |
Of which: Interest on debt | | | 114,8 | | | | 13,6 | | | | 20,2 | | | | 3,8 | |
Total expenditure | | | 1 139,0 | | | | 9,0 | | | | 253,4 | | | | 7,9 | |
| * | Fiscal 2013/14 to fiscal 2014/15 |
Higher government spending was recorded in all the main categories, with transfers and subsidies recording the strongest increase in the quarter under review.
The 3,9 per cent year-on-year rate of increase in current payments was driven by the Justice, Crime Prevention and Security cluster, with the departments of Defence and Military Veterans and Police accounting for 58,4 per cent of government’s total current payments.
Transfers and subsidies recorded a solid year-on-year rate of increase of 10,9 per cent in April–June 2014 when compared with the same period a year earlier. Higher transfers and subsidies could be attributed to an increase in spending by the departments responsible for education, health and social services within the Social Services cluster; this cluster accounted for 46,0 per cent of total voted expenditure. Higher spending by the departments responsible for education was mainly to improve the quality of learning in basic education schools and to provide financial support to universities, the national institutions of higher education and the National Student Financial Aid Scheme. Spending by the Department of Social Development was geared to cater for increases in the values of the grants and in the number of grant beneficiaries. The Old Age and Child Support Grants are the two largest grant programmes constituting about 75 per cent of total grant spending. The Budget Review 2014 projected that the beneficiaries of the two grants would increase at an average rate of about 5,0 per cent per annum over the medium term period.
| | |
| | | Quarterly Bulletin September 2014 |
Further transfers and subsidies flowed from the Department of Transport to the South African National Roads Agency for non-toll and coal haulage networks, and to provinces through the provincial road maintenance grant.
In the first quarter of fiscal 2014/15, interest paid on national government debt totalled R20,2 billion, representing an increase of 3,8 per cent when compared with April–June 2013. Interest payments were originally budgeted to increase by 13,6 per cent to amount to R115 billion in fiscal 2014/15. Equitable share transfers to provinces, the main source of provincial revenue, amounted to R90,6 billion in April–June 2014, some 7,4 per cent more than in the same quarter a year earlier. The Budget Review 2014 projected that this spending category would increase by 6,9 per cent to amount to R362 billion, which accounts for 31,8 per cent of total budgeted spending for fiscal 2014/15.
The February 2014 Budget made provision for R10,2 billion to be paid from the National Revenue Fund to metropolitan municipalities as their share of the general fuel levy. These funds were meant to boost metropolitan municipalities’ budgets for road and transportation infrastructure, premised on the link between fuel sales and road usage. In the first quarter of fiscal 2014/15, no payment was transferred to metros from the National Revenue Fund as their new budget cycle only starts in July.
After accounting for cash-flow adjustments,15 national government’s cash-flow expenditure in April–June 2014 totalled R248 billion or 5,7 per cent less than in the same period a year earlier. A significant amount in expenditure falling due at the end of March 2013 was only paid out in April 2013, bolstering the base level of cash-flow expenditure in the April–June quarter of 2013, alongside timing differences.
Revenue of national government amounted to R217 billion in April–June 2014, or 7,3 per cent higher than in the corresponding period of the previous fiscal year. As a ratio of gross domestic product, national government revenue equalled 24,4 per cent in the first three months of fiscal 2014/15 – slightly higher than the ratio of 24,2 per cent recorded in the same quarter a year earlier. According to the Budget Review 2014, national government revenue was expected to rise by 9,3 per cent to total R963 billion in fiscal 2014/15 as a whole.
National government revenue in fiscal 2014/15
| | | | | | | | | | | | | | | | |
| | | Originally budgeted: | | | Actual | |
| | | Full 2014/15 | | | Apr–Jun 2014 | |
| Revenue source | | | | | | |
| | | R billions | | | Percentage
change* | | | R billions | | | Percentage
change* | |
Taxes on income, profits and capital gains | | | 557,0 | | | | 9,7 | | | | 134,8 | | | | 9,2 | |
Income tax on individuals | | | 335,9 | | | | 8,1 | | | | 77,4 | | | | 8,8 | |
Income tax on companies | | | 198,9 | | | | 10,8 | | | | 51,3 | | | | 8,4 | |
Payroll taxes | | | 13,4 | | | | 7,7 | | | | 3,0 | | | | 7,6 | |
Taxes on property | | | 11,5 | | | | 9,4 | | | | 2,9 | | | | 8,9 | |
Taxes on goods and services | | | 361,2 | | | | 11,4 | | | | 72,7 | | | | 8,9 | |
Value-added tax (VAT) | | | 267,2 | | | | 12,4 | | | | 51,9 | | | | 10,1 | |
Domestic VAT | | | 290,9 | | | | 10,4 | | | | 69,0 | | | | 12,0 | |
Import VAT | | | 151,7 | | | | 15,6 | | | | 24,1 | | | | 1,7 | |
Taxes on international trade and transactions | | | 50,5 | | | | 12,6 | | | | 7,8 | | | | -5,0 | |
Other revenue | | | 21,0 | | | | -15,3 | | | | 9,1 | | | | -3,8 | |
Less: SACU** payments | | | 51,7 | | | | 19,3 | | | | 12,9 | | | | 19,3 | |
Total revenue | | | 962,8 | | | | 9,3 | | | | 217,3 | | | | 7,3 | |
| * | Fiscal 2013/14 to fiscal 2014/15 |
| ** | Southern African Customs Union |
| | |
| Quarterly Bulletin September 2014 | | |


The increase in national government revenue in the quarter under review was driven by higher collections in most major tax categories – with value-added tax (VAT) registering the strongest increase, rising at a double-digit year-on-year pace.
Taxes on income, profits and capital gains recorded a robust increase of 9,2 per cent in the first quarter of fiscal 2014/15 when compared with the first three months of fiscal 2013/14. Proceeds from this tax category were boosted by brisk collections in personal income tax, corporate income tax and withholding tax on dividends. Personal income tax increased as a result of above-inflation salary increases, boosted by bonus payouts. Higher receipts from corporate income tax stemmed from an increase in provisional payments by the banks and the manufacturing sector. Collections from withholding tax on dividends recorded a buoyant year-on-year rate of increase, in part resulting from exchange rate boosted earnings from abroad and companies managing their increasing cash reserves, accumulated due to a reduction in investment of profits earned, by returning more of these funds to shareholders through dividend payouts.
In April–June 2014 taxes on property recorded a firm increase, owing to higher collections of transfer duties, which outperformed the marginal decline recorded in security transfer tax. Higher collections of transfer duties reflected the recovery in real-estate market activity.
Collections from taxes on goods and services increased notably in the first quarter of the current fiscal year, due to solid collections of VAT and other excise duties. Buoyant growth from the finance, wholesale and retail trade as well as manufacturing sectors boosted domestic VAT. Import VAT rose very little as imports lost momentum. VAT refunds increased by 8,0 per cent year on year, owing to among other things increasing stock levels, higher capital expenditure and increasing costs for vendors supplying zero-rated services in the various sectors.
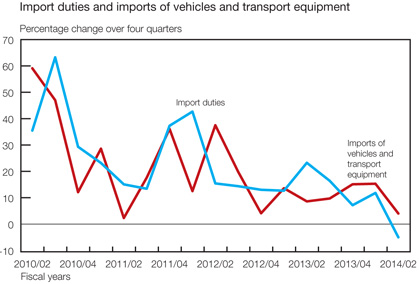
Taxes on international trade and transactions declined marginally, largely resulting from a contraction in imports of vehicles. In April–June 2014, Southern African Customs Union (SACU) payments reflected a year-on-year rate of increase of 19,3 per cent, consistent with the Budget Review 2014 projection that transfers to the SACU partner countries would amount to R51,7 billion in fiscal 2014/15.
After taking into account cash-flow transactions, cash-flow revenue of national government totalled R218 billion in April–June 2014 – some 7,5 per cent more than in the first quarter of fiscal 2013/14.
| | |
| | | Quarterly Bulletin September 2014 |
Netting national government revenue and expenditure yielded a cash-book deficit of R36 billion in the first quarter of the current fiscal year. This cash-book deficit was R3,7 billion more than the cash-book deficit recorded in April–June 2013 as growth in national government expenditure outperformed the increase in revenue. Relative to gross domestic product, the cash-book deficit was 4,1 per cent in the April–June quarter of 2014/15 compared with a deficit of 3,9 per cent recorded a year earlier. The Budget Review 2014 projected that the cash-book deficit would amount to R176 billion or 4,6 per cent of gross domestic product for fiscal 2014/15 as a whole.
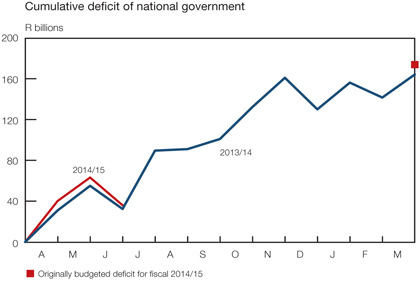
The primary balance16 is a good indicator of the current fiscal effort and fiscal sustainability of a country. In the first quarter of fiscal 2014/15, the primary deficit of national government amounted to R15,9 billion or 1,8 per cent of gross domestic product. This could be measured against a primary deficit of R13,0 billion, or 1,5 per cent as a ratio of gross domestic product, recorded in April–June 2013.
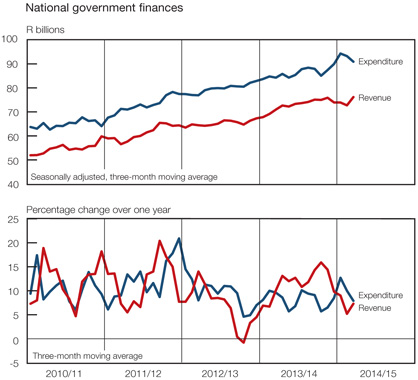
| | |
| Quarterly Bulletin September 2014 | | |


When netting the national government cash-flow revenue and expenditure, the cash-flow deficit totalled R29,5 billion in the first three months of fiscal 2014/15. This was considerably lower than the cash-flow deficit recorded in the previous fiscal year. Included in the deficit were extraordinary receipts of R3,3 billion recorded in the first quarter of the current fiscal year. There were negligible extraordinary payments during the first quarter of 2014. After taking into account the cost on revaluation of foreign debt at maturity, the net borrowing requirement of national government amounted to R34,0 billion – much lower than the net borrowing requirement recorded in the first quarter of the preceding fiscal year.
National government financing in fiscal 2014/15
R billions
| | | | | | | | | | | | |
| Item or instrument | | Originally
budgeted
2014/151 | | | Actual
Apr–Jun
2014 | | | Actual
Apr–Jun
2013 | |
Deficit | | | 176,2 | | | | 29,5 | | | | 59,7 | 2 |
Plus: Cost/profit on revaluation of foreign debt at redemption3 | | | 5,9 | | | | 4,5 | | | | 4,7 | |
Net borrowing requirement | | | 182,1 | | | | 34,0 | | | | 64,4 | |
Treasury bills | | | 23,0 | | | | 8,2 | | | | 20,2 | |
Domestic government bonds | | | 128,5 | | | | 36,8 | | | | 36,1 | |
Foreign bonds and loans | | | 7,2 | | | | -7,5 | | | | -11,8 | |
Change in available cash balances4 | | | 23,4 | | | | -3,6 | | | | 19,9 | |
Total net financing5 | | | 182,1 | | | | 34,0 | | | | 64,4 | |
| 5 | Components may not add up to totals due to rounding |
In the April–June quarter of fiscal 2014/15, the net borrowing requirement was financed domestically through the issuance of Treasury bills (including short-term loans from the Corporation for Public Deposits) and government bonds. National government was able to secure funding domestically as the appetite for domestic debt instruments remained satisfactory. However, it should be kept in mind that some of these domestic debt instruments are held by non-residents. Net inflation-linked bond issues worth R19,9 billion were recorded in the first quarter of fiscal 2014/15, bringing the outstanding balance for these instruments to R319 billion at the end of June 2014. These bonds accounted for 25,0 per cent of total domestic marketable bonds. In April–June 2014, RSA Government Retail Savings Bonds recorded net redemptions to the value of R0,1 billion. The non-monetary private sector and the Public Investment Corporation (PIC) continued to be the main holders of domestic marketable bonds.
The National Treasury launched a new fixed-income bond in June 2014. The R2032 bond was named after its year of maturity, with a coupon rate of 8,25 per cent. Short-term domestic debt instruments were sold at an average interest rate of 6,1 per cent, whilst domestic government bonds were attained at an average interest rate of 8,9 per cent per annum in the April–June quarter of 2014. Between March and June 2014 the average outstanding maturity of national government’s domestic marketable bonds increased slightly from 154 months to 156 months.
Foreign bonds and loans recorded net redemptions to the value of R7,5 billion in the first quarter of fiscal 2014/15. On 2 June 2014, the TY2/83 US dollar-denominated bond with a coupon rate of 6,5 per cent was redeemed for R10,5 billion. The average remaining maturity of the foreign marketable bonds of national government lengthened from 95 months as at 31 March 2014 to 101 months at the end of June. This increase in maturity emanated from foreign debt valued at prevailing foreign-exchange rates outpacing the value of foreign debt at historical exchange rates.
| | |
| | | Quarterly Bulletin September 2014 |
Funding activities of national government increased its available cash balances by R3,6 billion in April–June 2014. The cash balances of national government with commercial banks amounted to R65 billion and those with the Bank to R133 billion as at 30 June 2014.
The issuance of Treasury bills and government bonds continued to increase, which contributed to the rise in domestic debt of national government. Between March and June 2014, domestic debt increased from R1 441 billion to R1 508 billion. Government’s total debt portfolio continued to consist mainly of domestic debt instruments.
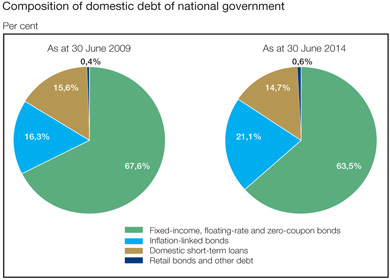
Foreign debt of national government declined from R144 billion as at 31 March 2014 to R132 billion at the end of June, owing to large redemptions recorded in the first three months of the current fiscal year. These redemptions exceeded the revaluation effects arising from the depreciation of the rand against major currencies.
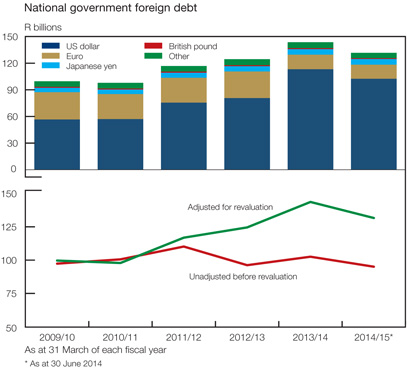
| | |
| Quarterly Bulletin September 2014 | | |


Total gross loan debt of national government, inclusive of domestic and foreign debt, increased from R1 585 billion to R1 640 billion between March and June 2014. As a ratio of gross domestic product, total gross loan debt rose from 45,9 per cent to 46,8 per cent during the period under review. The Budget Review 2014 envisaged that total gross loan debt would total R1 778 billion or 46,9 per cent of gross domestic product at the end of fiscal 2014/15.
| | |
| | | Quarterly Bulletin September 2014 |
Statement of the Monetary Policy Committee
17 July 2014
Issued by Gill Marcus, Governor of the South African Reserve Bank, at a meeting of the Monetary Policy Committee in Pretoria
Since the previous meeting of the Monetary Policy Committee (MPC), the economic growth outlook has deteriorated against the backdrop of protracted strike action in the mining and manufacturing sectors. The economy contracted in the first quarter of 2014, and the growth outlook for the rest of the year remains subdued amid low business confidence. Compounding the MPC’s policy dilemma, inflation has breached the upper end of the target range, driven primarily by the exchange rate depreciation and rising food prices, while a possible wage-price spiral resulting from recent wage settlements and wage demands considerably in excess of inflation and productivity growth have added to the upside risk to the inflation outlook.
The year-on-year inflation rate as measured by the consumer price index (CPI) for all urban areas measured 6,6 per cent in May, up from 6,0 per cent and 6,1 2 per cent in March and April 2014 respectively. The main driver of this marked acceleration was food and non-alcoholic beverage price inflation which measured 8,8 per cent in May compared with 7,0 per cent and 7,8 per cent in the previous two months respectively. This category contributed 1,3 percentage points to the headline CPI outcome, compared with a recent low of 0,5 percentage points in December 2013. The categories of food, housing utilities and transport together accounted for 4,2 percentage points of the inflation outcome in May, compared with 3,7 percentage points in the previous month. The transport index increased at an annual rate of 8,9 per cent, from 6,8 per cent in April, despite a 15 cents per litre decline in the petrol price in May. Core inflation, which excludes food, petrol and electricity, remained unchanged at 5,5 per cent for the third consecutive month. Administered price inflation excluding petrol was unchanged from the previous month at 6,5 per cent. The headline producer price inflation for final manufactured goods moderated slightly from 8,8 per cent in April to 8,7 per cent in May, driven in part by lower agricultural product inflation.
The marginal improvement in the Bank’s forecast of headline inflation at the previous meeting has been more or less reversed, as recent food price developments surprised on the upside. Inflation is now expected to average 6,3 per cent in 2014, compared with 6,2 per cent previously, with the quarterly peak of 6,6 per cent (previously 6,5 per cent) still expected in the fourth quarter, following a slight moderation in the third quarter. The forecast average inflation for 2015 increased to 5,9 per cent from 5,8 per cent, while the forecast for 2016 increased marginally to 5,6 per cent, and to 5,5 per cent in the final quarter of that year. Inflation is still expected to return to within the target band during the second quarter of 2015 provided that there are no further shocks to the system, particularly from possible higher tariff increases being granted to Eskom by the National Energy Regulator of South Africa (Nersa) from 2015.
The forecast for core inflation is unchanged. This measure is expected to average 5,6 per cent and 5,7 per cent in 2014 and 2015 respectively, moderating to 5,5 per cent in 2016, with the moderate upward pressure coming from the lagged effects of the exchange rate depreciation rather than evidence of strong domestic demand pressures. As before, the MPC sees the risks to the headline inflation forecast to be skewed to the upside.
Inflation expectations as reflected in the survey conducted by the Bureau for Economic Research (BER) at Stellenbosch University have remained anchored at the upper end of the target band. The average inflation expectation of analysts, business people and trade union officials for this year and next year has remained unchanged for six consecutive quarters at 6,1 per cent for both years, declining to 5,9 per cent in 2016. Within these categories, the largest change was by business people for 2016, where expectations increased from 6,2 per cent in the previous survey to 6,4 per cent. However, their expectation for 2015 moderated slightly. Inflation expectations of households for 2014 declined from 6,7 per cent in the first quarter to 6,3 per cent in the second quarter.
| | |
| Quarterly Bulletin September 2014 | | |


The Reuters survey of inflation expectations of economic analysts conducted in May remained more or less unchanged since the previous survey, with a slight upward shift. The outcome of the survey shows a divergence of views among analysts as to whether inflation will peak in the second or fourth quarter of 2014. On average, the expectation is for inflation to peak in the second quarter, at an average of 6,4 per cent, and to return to within the target range in the first quarter of 2015. According to the survey, annual inflation is expected to average 6,2 per cent in 2014, and 5,7 per cent and 5,5 per cent in the subsequent two years respectively.
The global economy continues to exhibit mixed signals regarding the economic growth outlook. Since the previous meeting of the MPC, consensus forecasts for growth in 2014 have been revised downwards for the United States (US) and the eurozone, but those for Japan and the United Kingdom (UK) have been revised upwards. The earlier optimism that the US would grow at around 3 per cent in 2014 has been moderated following the 2,9 per cent annualised contraction in the first quarter, partly as a result of severe weather conditions and a decline in expenditure on health care. Most analysts now expect US growth to be closer to 2 per cent. This weaker growth is despite larger-than-expected improvements in the unemployment rate. The outlook for the eurozone has also deteriorated, following weak industrial output in Germany in May, and slowing growth in France and Italy. Real output in Japan is expected to contract in the second quarter following the surge in expenditure in the first quarter in advance of the increase of consumption taxes. The UK recovery, however, appears to be sustained with growth of around 3 per cent expected in 2014.
The outlook for emerging markets remains relatively subdued, but some emerging Asian economies have benefited from stronger US growth. The Chinese economy is expected to grow by just under 7,5 per cent in 2014, although concerns about the shadow banking system remain. Subdued growth is expected in a number of emerging markets, including Brazil, Russia, Thailand and Argentina.
Global financial-market developments remain dominated by expectations of changes in monetary policy in the advanced economies, amid concerns that the current low interest rate and low volatility environment may encourage excessive risk taking and asset price bubbles. By contrast to a number of emerging-market economies, inflation remains benign in the advanced economies, although the risk of deflation in the eurozone persists. The UK is expected to be the first advanced economy to raise interest rates, but at a moderate pace, while the US is generally not expected to begin the process of normalisation before the third quarter of 2015. However, the tapering of bond purchases by the US Federal Reserve (Fed) is expected to continue at a steady pace. This process is fully discounted in the markets, and is expected to be completed later this year.
By contrast, the European Central Bank (ECB) has recently announced a range of new monetary policy measures aimed at stimulating the economy through encouraging bank lending and preventing deflation, while Japanese monetary policy is expected to remain highly stimulatory for some time. Since the previous meeting of the MPC, a number of countries have reduced their policy rates, including the eurozone, Sweden, Mexico, Hungary and Turkey, while the tightening cycle continued in New Zealand.
The exchange rate of the rand continues to pose an upside risk to the inflation outlook. Having appreciated to a level of R10,29 against the US dollar soon after the previous MPC meeting, the rand exchange rate followed a depreciating trend, reaching a new trading range of between R10,60 and R10,80 since the beginning of June. Since the previous meeting, the rand has depreciated by 2,6 per cent on a trade-weighted basis. The appreciation of the rand in May was in response to more benign global factors as market participants absorbed the forward guidance provided by the central banks in the advanced economies. This contributed to lower risk aversion and renewed flows to emerging markets in general. Since the previous meeting, non-resident net purchases of bonds and equities have amounted to R7,2 billion, and R44,2 billion since the beginning of February.
Despite these inflows, since early June the rand has largely decoupled from its emerging-market peers, and depreciated relative to most currencies, as it reacted to deteriorating domestic
| | |
| | | Quarterly Bulletin September 2014 |
fundamentals. These included the negative gross domestic product (GDP) growth rate, the adverse reports from the ratings agencies, and the protracted nature of the platinum and metal workers’ strikes. The impact of the platinum-sector strikes on exports began to be felt in April and May, and it is estimated that during these two months the value of platinum group metals (PGM) exports was around R20 billion lower than during the first quarter. This is likely to put pressure on the current account of the balance of payments in the second quarter, following a narrowing of the deficit in the first quarter to 4,5 per cent of GDP.
South Africa’s growth outlook has deteriorated since the previous meeting of the MPC, compounded by continued labour disruptions. Following a contraction of 0,6 per cent in the first quarter, the outlook for the second quarter is expected to be positive but subdued, particularly in the light of weak mining and manufacturing data in May. The Bank’s latest forecast, which assumes a speedy resolution of the metal workers’ strike, sees growth in 2014 at 1,7 per cent, compared with 2,1 per cent previously and 2,8 per cent at the beginning of the year. Growth forecasts for the coming two calendar years have been reduced to 2,9 per cent and 3,2 per cent, from 3,1 per cent and 3,4 per cent respectively. The Rand Merchant Bank (RMB)/BER Business Confidence Index remained low and unchanged at 41 index points in the second quarter of 2014, with a sharp decline particularly evident among manufacturers. The Bank’s leading indicator of economic activity declined moderately, reflecting subdued growth expectations.
The weak business confidence is mirrored in the 2,6 per cent growth in gross fixed capital formation in the first quarter of 2014. Growth in fixed investment by the private sector, which accounts for about two thirds of gross fixed capital formation, weakened further, from 2,4 per cent in the fourth quarter of 2013 to 1,0 per cent in the first quarter of 2014.
The mining sector contracted by an annualised 24,7 per cent in the first quarter of 2014, and although mainly driven by the strike-induced decline in PGM output, the contraction was fairly broad-based across the sector. Despite a higher-than-expected performance in April, the data for May show that the outlook for the second quarter is also bleak. In May the physical volume of mining output declined by (a non-annualised) 3,1 per cent on a month-to-month basis, and by 5,6 per cent on a three-month-to-three-month basis, with PGM output declining by 34,1 per cent. While the strike is over and miners are returning to work, PGM production is not expected to normalise for some time, and possible shaft closures could reduce the longer-term potential of the sector.
The manufacturing-sector performance in the first two months of the second quarter has also been disappointing, following the 4,4 per cent contraction in the first quarter. In May manufacturing output declined by 3,7 per cent on a year-on-year basis, and by 2,0 per cent on a three-month-on-three-month basis. The sector was negatively impacted by electricity supply constraints and the platinum-sector strike, while the current strike by metal workers is likely to undermine the outlook for the third quarter. The Kagiso Purchasing Managers’ Index (PMI) registered a slight improvement in June, measuring 46,6 index points, but has remained below the neutral 50 index point level for three consecutive months.
Trends in employment growth are indicative of the weak private-sector investment. Although formal non-agricultural employment increased for the third consecutive quarter in the first quarter of 2014, all the gains were in the public sector. While overall employment increased by 42 000 jobs in the year to the end of March, 49 000 jobs were created in the public sector while the private sector shed jobs, particularly in the mining sector where almost 29 000 jobs were lost.
Final consumption expenditure by households remains the main driver of GDP growth, but with a declining contribution of 1,2 percentage points in the first quarter of 2014. Growth in household consumption expenditure, which measured 2,6 per cent in 2013, declined to 1,8 per cent in the first quarter of 2014, with a marked moderation in the growth of expenditure on durable goods and a contraction in spending on non-durable goods. Real retail sales growth contracted by 0,8 per cent on a three-month-to-three-month basis in May, and increased at a month-to-month rate of 0,8 per cent. Domestic motor vehicle sales declined by 2,3 per cent on a year-on-year basis, but increased by 4,7 per cent on a month-to-month basis in June. Despite these weak
| | |
| Quarterly Bulletin September 2014 | | |


trends, consumer confidence surprised on the upside in the second quarter, with the FNB/BER Consumer Confidence Index increasing from -6 to 4 index points, although respondents do not deem the present time as appropriate to buy durable goods.
Growth over twelve months in total loans and advances to the private sector measured 8,2 per cent in May 2014, but the divergent trends in bank credit extended to households and the corporate sector have continued. Growth in credit extended to the corporate sector has been steadily increasing since the beginning of the year, measuring 13,3 per cent in May, due in part to renewable energy contracts. By contrast, growth in credit extended to the private sector has continued to trend downwards, to measure 4,3 per cent in May. Twelve-month growth in general loans to households, mainly unsecured lending, declined to 2,8 per cent in May; its lowest growth since February 2005. Mortgage credit extension remained within the 2 to 3 per cent range observed since January 2013, and instalment sale credit and leasing finance also continued to moderate from growth rates of around 13 per cent in the second half of 2013 to 8,6 per cent in May. These credit extension trends to households reflect a combination of weakening household consumption expenditure and stricter bank lending criteria for unsecured loans in particular. Household debt to disposable income remains elevated, but declined marginally to 74,5 per cent in the first quarter of 2014.
The trend in wage settlements poses an upside risk to the inflation outlook, and these pressures are likely to intensify in the current difficult labour relations environment. According to Andrew Levy Employment Publications, the average wage settlement rate in collective bargaining agreements increased from 7,9 per cent in the first quarter of 2014 to 8,1 per cent in the second quarter. However, increases over four quarters in nominal unit labour costs in the formal non-agricultural sector declined from 5,9 per cent in the fourth quarter of 2013 to 4,8 per cent in the first quarter of 2014. The MPC is concerned that recent wage settlements in the mining sector and current demands in the metals sector could set a precedent for wage demands more generally. Unless accompanied by higher productivity, such settlements could generate a wage-price spiral, and are also likely to have a negative impact on employment trends. While the focus has generally been on wage demands, there is an imperative for attention to also be paid to excessive salaries and bonuses of management and executives.
Food prices have been one of the main drivers of inflation since the beginning of the year and have generally surprised on the upside in recent months. There are, however, some tentative indications that we may be near the peak: in May manufactured food producer price inflation moderated for the first time since October 2013 and measured 8,9 per cent, down from 9,5 per cent in April. Agricultural producer price inflation declined from a recent peak of 13,3 per cent in March to 6,7 per cent in May reflecting in part the sharp decline in maize prices to export parity price levels. Prices of cereals and other crops declined by 0,8 per cent in May, having reached a recent peak of 27,6 per cent in February. Global food price pressures are also benign, with the year-on-year inflation rates as reflected in the Food and Agriculture Organization (FAO) food price index being negative for twelve consecutive months. Apart from weather-related risks, the overall trend in food prices will remain highly sensitive to exchange rate developments.
Despite recent geopolitical risks, particularly in Ukraine and Iraq, international oil prices have remained relatively stable. Apart from a brief spike to a level of around US$115 per barrel in June, the price of Brent crude oil has generally traded in a range of US$105 and US$110 per barrel, and is currently at around US$105 per barrel. Domestic petrol prices have therefore been driven primarily by exchange rate changes. Following the appreciation of the rand in April, the petrol price was reduced by a total of 37 cents per litre in May and June, but this was largely reversed in July when the price increased by 31 cents per litre. If the current trends persist, a further small increase in the petrol price can be expected in August.
The MPC remains concerned about weak growth, the widening output gap and the negative employment outlook. The strike in the platinum sector contributed to the downward revision of the growth forecast, and the latest forecast has not factored in the possibility of a protracted work stoppage by the metal workers, which would potentially have much wider ramifications because of the direct linkages to other sectors of the economy. This weak growth outlook, however, is not something that monetary policy can ameliorate.
| | |
| | | Quarterly Bulletin September 2014 |
The MPC is also increasingly concerned about the inflation outlook and the further upside risks to the forecast. Although the exchange rate remains a key factor in this regard, the possibility of a wage-price spiral, should wage settlements well in excess of inflation and productivity growth become an economy-wide norm, has increased. Although the inflation trajectory has not deteriorated markedly since the previous meeting, upside risks have increased, and it is expected to remain uncomfortably close to the upper end of the target range when it does eventually return to within the target. The upside risk factors make this trajectory highly vulnerable to any significant changes in inflation pressures.
Although inflation expectations have remained relatively anchored, should inflation persist outside the target band, these expectations risk becoming dislodged.
The MPC is, however, cognisant of the fact that the inflation pressures do not reflect excess demand conditions in the economy. Household consumption expenditure remains weak and credit extension to households is contracting in real terms. However, we do have to be mindful of second-round effects of supply-side shocks.
The MPC faces an increasingly difficult dilemma of rising inflation and slowing growth. The core mandate of the Bank remains price stability but, at the same time in achieving this mandate, we have to be mindful of the impact of our actions on economic growth and tread a fine line between acting effectively to address the inflation objective while not undermining growth unduly.
The MPC has decided to continue on its gradual normalisation path and raise the repurchase rate by 25 basis points to 5,75 per cent per annum, effective from Friday, 18 July. Given the expected inflation trajectory, the real repurchase rate remains slightly negative and well below its longer-term neutral level. The monetary policy stance remains supportive of the domestic economy and, as before, any future moves will be gradual and highly data-dependent.
We would like to reiterate that monetary policy should not be seen as the growth engine of the economy. The sources of the below-par growth performance are largely outside the realms of monetary policy. In the short term, an improvement in the interaction and relationships between management and labour is essential to foster a climate of trust and confidence, and get South Africa back to work. Given that the key headwinds preventing a return to trend growth are structural, there is an urgent need to implement necessary structural reforms, as envisaged in the National Development Plan, in order to achieve higher and more inclusive growth.
| | |
| Quarterly Bulletin September 2014 | | |


A brief preview of the forthcoming revision of South Africa’s national accounts and balance-of-payments statistics
by S S Walters
Introduction
The development of markets and the emergence of new products continuously promote changes in global economic processes. In keeping with the dissemination of relevant and reliable information within these continually changing environments, statistical systems have to adjust accordingly. The latest editions of the System of National Accounts (the 2008 SNA) and the Balance of Payments and International Investment Position Manual, Sixth Edition (BPM6) provide an international macroeconomic statistical standard for this purpose. This note provides a brief overview of some of the changes that will affect South Africa’s national accounts and balance of payments statistics following the partial implementation of the 2008 SNA and BPM6 at the end of 2014.
In addition to the conceptual, methodological and classification changes proposed by these international manuals, the December 2014 Quarterly Bulletin of the South African Reserve Bank (the Bank) will also reflect the outcome of other major statistical revisions resulting from, inter alia, the five-yearly benchmarking and rebasing of national accounts statistics conducted jointly by the Bank and Statistics South Africa (Stats SA).
Background
The United Nations (UN), the European Commission, the International Monetary Fund (IMF), the World Bank and the Organisation for Economic Co-operation and Development (OECD) jointly released the 2008 SNA in 2009, officially substituting the 1993 SNA compiled under the auspices of the same organisations. The SNA is an internationally agreed, standard, macroeconomic framework for the measurement of economic activity. In accordance with strict accounting conventions, the framework facilitates the compilation of a comprehensive, consistent and integrated set of macroeconomic accounts. National accounts statistics compiled in accordance with the guidelines of the SNA are used for economic analysis, research and policy formulation as they reflect not only changes in the economic landscape but also advances in methodological research, data sources and compilation methods.
The latest edition of the SNA does not differ materially from the 1993 SNA. The main thrust of the 2008 SNA is to elaborate on those aspects of economic activity that have become more prevalent in recent years, simultaneously enhancing the international comparability of national accounts statistics. Owing to resource constraints and the lack of timely, reliable and accurate data in some instances, South Africa has opted to phase in the recommendations of the 2008 SNA. Subject to data availability, further revisions (albeit of reduced scope) will be introduced at a later stage. Users of national accounts statistics will, however, be notified in advance of future changes.
The major changes resulting from the implementation of the 2008 SNA towards the end of 2014 will include the following:
| • | | Research and development (R&D): Expenditure on R&D plays a key role in economies as it increases knowledge, encourages the development of new products, and assists in enhancing production processes. Capital outlays on R&D are similar to investment in capital assets such as machinery and equipment, transport equipment as well as computers and related equipment, as the benefits accrue mainly over time. In the 2008 SNA, R&D is recognised as a capital asset (an intellectual property product) with associated investment flows and capital consumption charges. |
| | |
| | | Quarterly Bulletin September 2014 |
| | In the 1993 SNA, spending on R&D was treated as intermediate consumption. Intermediate goods and services are, however, used only once whereas capital assets are used continuously in production processes. Even though the 1993 SNA acknowledged that spending on R&D comprised essentially investment activity, it was retained as intermediate consumption due to measurement difficulties, including distinguishing R&D activities from other activities in production processes, valuing R&D assets, and depreciating R&D capital to derive appropriate net stock values. |
| • | | Information and communications technology (ICT) equipment and computer software: With regard to gross fixed capital formation, the 2008 SNA recommends that ICT equipment and computer software be shown separately. The category ‘Computer software’ should furthermore be modified to include databases. However, due to a lack of data, not all databases storing data for longer than a year will be included under the category ‘Computer software and databases’. |
| • | | Capitalisation of military weapon systems: The 2008 SNA recommends that spending on military weapon systems – including vehicles and other equipment such as warships, submarines, military aircraft, tanks and missile carriers – be treated as gross fixed capital formation in the national accounts. Expenditure on military weapon systems is currently classified as government consumption expenditure. Investment in the non-residential structures of the Department of Defence, including military bases and airports, already forms part of fixed investment. It is furthermore recommended that single-use weapons (such as ammunition, missiles, rockets and bombs) be treated as inventories. |
| • | | Financial intermediation services indirectly measured (FISIM): The 2008 SNA proposes that FISIM be refined to also include non-bank financial intermediaries. At present, FISIM applies only to loans and deposits extended by or deposited with the domestic banking sector. |
Other methodological changes that will affect national accounts statistics include the following:
| • | | The capitalisation of low-cost housing will be revisited starting from the early 1990s. These assets will be incorporated into the balance sheets of the household sector. |
| • | | The depreciation period of dwellings will be aligned to international best practice, affecting the consumption of fixed assets. |
| • | | Capital expenditure on mineral exploration will be reclassified and shown separately as gross fixed capital formation. These outlays are currently classified as construction works. |
| • | | The compilation of the real output of non-life insurance services will be synchronised with the methodology proposed in the 2008 SNA; the treatment of reinsurance and direct insurance services will also be aligned. |
Balance of payments and the international investment position
The BPM6 serves as the standard international framework for the compilation of statistics on balance-of-payments transactions and international investment positions between an economy and the rest of the world. The manual, which is consistent with the 2008 SNA, explains concepts, definitions, classifications and conventions for the compilation of balance-of-payments statistics and international investment position data, and enhances data comparability within the broader national accounting statistical framework.
| | |
| Quarterly Bulletin September 2014 | | |


The introduction of BPM6 involves a comprehensive exercise adjusting a wide range of statistical processes. As in the case of national accounts statistics, the December 2014 Quarterly Bulletin of the Bank will reflect a number of conceptual and presentational changes alongside a longer-term revision of transactions with the rest of the world. These changes will affect all the sub-accounts of the balance of payments. As with the national accounts, the main thrust of the previous manual is retained; the changes to be made are mainly refinements.
Trade in goods
| • | | Re-exports: These are merchandise goods produced in other economies, imported into South Africa, and thereafter exported again without significant transformation or value added. BPM6 recommends that re-exports be shown as supplementary information. In South Africa’s case, these transactions relate primarily to intra-trade between South Africa and some of its neighbouring countries (Botswana, Lesotho, Namibia and Swaziland). |
| • | | Merchanting: The purchase of goods from a non-resident party and the resale of the same goods to another non-resident party without crossing the borders of the home economy is known as merchanting. In BPM5, the previous edition of the manual, profit margins were included in the services account of the balance of payments, but according to BPM6, profit margins should be reflected in the trade account as ‘Net exports of goods under merchanting’. |
| • | | Migrants’ personal effects: In contrast to BPM5 which recommended that migrants’ personal effects be treated as merchandise transactions, BPM6 recommends that the transfer of migrants’ personal effects no longer be included in general merchandise or anywhere else in the international accounts. |
| • | | Manufacturing services: The processing, assembling and packaging performed on goods owned by non-resident parties will, according to BPM6, be treated as a service fee. In BPM5, a change of ownership was imputed, which resulted in transactions in merchandise trade: the goods were deemed to be imported and then exported again by the domestic party performing the processing, assembling and packaging. |
| • | | Maintenance and repair services: In BPM6, maintenance and repair services performed on goods owned by non-residents are reclassified from ‘Trade in goods’ to ‘Trade in services’. |
Trade in services
| • | | International trade in ‘Other services’: This category will be expanded to show a more comprehensive breakdown of trade in ‘Other services’ alongside definitional changes affecting some of the categories. The information will be disseminated on an annual basis. The detailed components will include: |
| | • | | manufacturing services on physical inputs owned by others; |
| | • | | maintenance and repair services performed on movable goods, not included elsewhere; |
| | • | | financial and insurance services; |
| | • | | charges for the use of intellectual property; |
| | • | | telecommunications, computer and information services; |
| | • | | personal, cultural and recreational services; and |
| | • | | other business and miscellaneous services, including: |
| | • | | advertising and market research services; and |
| | • | | architectural, engineering and other technical services. |
| | |
| | | Quarterly Bulletin September 2014 |
Financial account
| • | | The analytical presentation of the financial account of the balance of payments, which reflects transactions in financial assets and liabilities between residents of South Africa and non-residents, will be modified by renaming and restructuring the classification of assets and liabilities. The modifications, as recommended by BPM6, will affect the functional investment categories as well as reserve assets. |
| • | | The sign convention used in the financial account of the balance of payments will be aligned to that of the international investment position. With the use of new terminology, ‘Net acquisition of financial assets’ and ‘Net incurrence of liabilities’ instead of ‘Credits’ and ‘Debits’, a plus sign in the financial account of the balance of payments will reflect an increase in South Africa’s foreign assets while a minus sign will denote a decrease in its foreign assets. (An increase in financial liabilities will still be indicated by a plus sign and a decline in liabilities by a minus sign.) |
| • | | Transactions in financial derivatives will be shown as a separate functional category in the financial account of the balance of payments. |
| • | | A separate functional category will be created for reserve assets in the financial account. |
| • | | Allocations of Special Drawing Rights (SDRs) will be recorded as an increase in gross reserve assets and an accompanying increase in long-term liabilities in the balance of payments and the international investment position. |
| • | | All of the above-noted changes to the financial account of the balance of payments will be carried through to the international investment position. |
Conclusion
The envisaged changes to the national accounts and balance of payments statistics by the end of 2014 reflect the continuous endeavours of the Bank and Stats SA to improve the quality of official statistics and keep abreast of international best practice. Refinements made to time-series data will retain the main thrust of previous macroeconomic statistical frameworks.
| | |
| Quarterly Bulletin September 2014 | | |


Notes to tables
Corporation for Public Deposits: Liabilities and assets Tables S–4 and S–5
Amendments to reporting standards and other reporting changes were adopted with the release of the March 2014 annual financial statements of the Corporation for Public Deposits (CPD). Among other things, loans made to depositors were included under Loans and advances, as required by the International Accounting Standard (IAS) 32, Financial Instruments: Presentation. Previously, these loans were offset against deposit accounts.
For comparison purposes, data on central and provincial government deposits (on page S–4) were revised historically from March 2011. Similarly, a new column for loans and advances to government was added (on page S–5).
Loans are advanced as part of national government’s Inter-Governmental Cash Coordination (IGCC) arrangement in terms of which some state-owned entities and treasuries of provincial governments deposit excess funds with the CPD to form a pool of funds from the public sector. National and provincial treasuries are allowed to borrow money from the IGCC pool of funds. National Treasury guarantees that the deposits are made available to depositors on demand.
Mutual banks and the Postbank: Liabilities and assets Table S–15
A comprehensive review of all term, saving and transactional accounts provided by the Postbank necessitated a revision of historical data. Subsequently, the data on Postbank deposits and Postbank claims on the private sector were updated and revised as from January 2008. The Postbank forms part of the consolidated monetary sector, and the revisions had a minor impact on the monetary aggregates.
Balance of payments – Tables S–80 and S–81
Current account of the balance of payments – Table S–82
The trade balance has been added to these tables as a memorandum item.
| | |
| | | Quarterly Bulletin September 2014 |