EXHIBIT 99.D
DESCRIPTION OF THE REPUBLIC OF SOUTH AFRICA
DATED December 4, 2015
INCORPORATION OF DOCUMENTS BY REFERENCE
This document is an exhibit to the Republic of South Africa’s Annual Report on Form 18-K under the Exchange Act of 1934 for the fiscal year ended March 31, 2015. All amendments to such Annual Report on Form 18-K/A filed by South Africa following the date hereof shall be incorporated by reference into this document. Any statement contained in a document, all or a portion of which is incorporated or deemed to be incorporated by reference herein, shall be deemed to be modified or superseded for purposes of this document to the extent that a statement contained herein or in any other subsequently filed document that also is or is deemed to be incorporated by reference herein modified or supersedes such statement. Any statement so modified or superseded shall not be deemed, except as so modified or superseded, to constitute a part of this document.
1
TABLE OF CONTENTS
| | | | |
SUMMARY INFORMATION | | | 3 | |
| |
INTRODUCTION | | | 5 | |
| |
REPUBLIC OF SOUTH AFRICA | | | 7 | |
Area and Population | | | 8 | |
Government and Political Parties | | | 8 | |
Legal System | | | 14 | |
Broad-Based Black Political Empowerment | | | 14 | |
Land Reform | | | 16 | |
Mining Industry Reform | | | 17 | |
Crime Prevention | | | 23 | |
International Relations | | | 27 | |
Development Finance Institutions (DFIs) | | | 30 | |
Public Health | | | 31 | |
| |
THE SOUTH AFRICAN ECONOMY | | | 35 | |
Overview | | | 35 | |
Implementing the National Development Plan 2030: The Medium-Term Strategic Framework | | | 36 | |
GDP | | | 37 | |
GDE | | | 40 | |
Principal Sectors of the Economy | | | 43 | |
Informal Sector of the Economy | | | 64 | |
Employment and Trade Unions | | | 65 | |
Prices and Wages | | | 71 | |
| |
MONETARY AND FINANCIAL SYSTEM | | | 73 | |
The SARB | | | 73 | |
Monetary Policy | | | 74 | |
Financial System Stability | | | 79 | |
Regulation of the Financial Sector | | | 79 | |
Financial Sector Charter | | | 85 | |
Credit Allocation | | | 86 | |
Capital Markets | | | 89 | |
Exchange Controls | | | 92 | |
Gold and Foreign Exchange Contingency Reserve Account (GFECRA) | | | 97 | |
| |
THE EXTERNAL SECTOR OF THE ECONOMY | | | 99 | |
Foreign Trade | | | 99 | |
Balance of Payments | |
| 103
|
|
Current Account | |
| 105
|
|
Financial Account | |
| 106
|
|
Reserves and Exchange Rates | |
| 110
|
|
Change in Reserves | |
| 112
|
|
| |
PUBLIC FINANCE | | | 113 | |
Background | | | 119 | |
The Budget Process | | | 120 | |
MTBPS | | | 120 | |
2015-2016 National Budget and Consolidated Budgets | | | 122 | |
Taxation | | | 126 | |
Revenue | | | 131 | |
Financing | | | 132 | |
Public Enterprises | | | 133 | |
| |
NATIONAL GOVERNMENT DEBT | | | 144 | |
General | | | 144 | |
Summary of Internal National Government Debt | | | 145 | |
Summary of External National Government Debt | | | 145 | |
Guaranteed Debt | | | 146 | |
Debt Service Costs | | | 147 | |
Debt Record | | | 148 | |
Tables and Supplementary Information | | | 149 | |
2
In this document, the government of the Republic of South Africa is referred to as the “National Government,” “the Government” or the “South African Government”. The currency of the Republic of South Africa (South Africa) is the South African Rand. In this document, all amounts are expressed in South African Rand (R or Rand) or U.S. Dollars (US$, $ or Dollars), except as otherwise specified. See “The External Sector of the Economy—Reserves and Exchange Rates” for the average rates for the Rand against the Dollar for each of the years 2009 through 2014 and for the 11-month period ended November 30, 2015. On December 3, 2015, the exchange rate, as reported by the South African Reserve Bank (SARB), was R14.3328 per Dollar (or 0.0697 U.S. cents per Rand).
The Republic’s fiscal year begins on April 1 and ends on March 31. For example, the 2015 fiscal year refers to the fiscal year beginning April 1, 2014 and ending March 31, 2015. Economic data presented in this description is presented on a calendar year basis unless reference is made to the relevant fiscal year or the fiscal year is otherwise indicated by the context. For example, economic data referring to the “first quarter” of 2015 refers to data as at, or for the three months ended, June 30, 2015. Economic data referring to the “first three months” of 2015, by contrast, refers to data as at, or for the three months ended, March 31, 2015.
Unless otherwise indicated, references to gross domestic product (GDP) are to real GDP, calculated using constant prices in order to adjust for inflation (with 2010 as a base year), and % changes in GDP refer to changes as compared to the previous year or the same quarter of the previous year, unless otherwise indicated.
Unless otherwise stated herein, references in this description to the 2015-2016 Budget are to the 2015-2016 National Budget as released in February 2015 and not as amended by the Medium-Term Budget Policy Statement (MTBPS) released on October 22, 2015. References to the 2015-2016 Consolidated Budget, which includes the 2015-2016 National Budget as part thereof, shall be construed accordingly.
Some figures included in this document have been subject to rounding adjustments. As a result, sum totals of data presented in this document may not precisely equate to the arithmetic sum of the data being totaled.
SUMMARY INFORMATION
The following summary tables do not purport to be complete and are qualified in their entirety by the more detailed information appearing elsewhere in this document.
The following tables set forth certain summary statistics about the economy of South Africa, public finance and debt of the National Government for the periods indicated.
3
| | | | | | | | | | | | | | | | | | | | | | | | |
| | | As of and for the year ended December 31, | | | As of and for
the six months
ended June 30,(1) | |
| | | 2010 | | | 2011 | | | 2012 | | | 2013 | | | 2014 | | | 2015 | |
| | | Rand (million) (except percentages) | |
The Economy | | | | | | | | | | | | | | | | | | | | | | | | |
Gross Domestic Product (GDP) | | | | | | | | | | | | | | | | | | | | | | | | |
Nominal GDP(2) | | | 2,748,008 | | | | 3,024,950 | | | | 3,262,542 | | | | 3,534,326 | | | | 3,796,462 | | | | 3,942,919 | (3) |
Real GDP(4) | | | 2,748,008 | | | | 2,836,286 | | | | 2,899,248 | | | | 2,963,389 | | | | 3,008,576 | | | | 3,045,469 | (3) |
Real % change from prior year | | | 3.0 | % | | | 3.2 | % | | | 2.2 | % | | | 2.2 | % | | | 1.5 | % | | | 1.8 | % |
Change in per capita earnings (%)(5) | | | 3.4 | % | | | 2.9 | % | | | 0.5 | % | | | (0.4 | )% | | | (0.3 | )% | | | N/A | |
Total merchandise exports | | | 68,856 | | | | 794,743 | | | | 825,025 | | | | 932,588 | | | | 1,003,826 | | | | 502,593 | (6) |
Unemployment rate (%) | | | 24.9 | % | | | 24.80 | % | | | 24.9 | % | | | 24.7 | % | | | 25.1 | % | | | 25.5 | %(7) |
Balance of trade (Rand billion) (13) | | | 59.7 | | | | 51.0 | | | | (31.5 | ) | | | (68.3 | ) | | | (68.6 | ) | | | (14.3 | )(6) |
Balance of payments | | | | | | | | | | | | | | | | | | | | | | | | |
Current account | | | (41.245 | ) | | | (65,287 | ) | | | (161,704 | ) | | | (203,774 | ) | | | (206,644 | ) | | | (71,229 | )(6) |
Financial account | | | 56,128 | | | | 65,896 | | | | 173,245 | | | | 130,403 | | | | 155,809 | (7) | | | 36,695 | (6) |
Change in gross gold and other foreign reserves | | | (24,075 | ) | | | (107,193 | ) | | | 33,123 | | | | 89,247 | | | | 48,335 | | | | 2,686 | (6) |
Rand/Dollar exchange rate (average) | | | 7.32 | | | | 7.25 | | | | 8.21 | | | | 9.65 | | | | 10.84 | | | | 12.45 | (8) |
Consumer prices (2012/12=100) | | | 88.2 | | | | 92.6 | | | | 97.8 | | | | 103.4 | | | | 109.7 | | | | 113.6 | (9) |
Producer prices (2012/12=100))(14) | | | N/A | | | | N/A | | | | 100 | | | | 106 | | | | 113.9 | | | | 116.7 | (9) |
Average monthly yields for listed National Government debt securities 5-10 yrs | | | 7.41 | | | | 8.01 | | | | 6.50 | | | | 7.73 | | | | 7.39 | | | | 7.96 | |
Average monthly yields for listed National Government debt securities > 10 yrs | | | 8.38 | | | | 8.51 | | | | 7.37 | | | | 8.32 | | | | 7.84 | | | | 8.33 | |
| | | | | | | | | | | | | | | | | | | | | | | | | | | | |
| | | As of and for the fiscal year ended March 31, | |
| | | 2010 | | | 2011 | | | 2012 | | | 2013 | | | 2014 | | | 2015(11) | | | 2016(12) | |
Main Government Revenue | | | 586,113.1 | | | | 672,751.5 | | | | 745,292.2 | | | | 799,761.7 | | | | 887,265.1 | | | | 963,560.6 | | | | 1,070,664.5 | |
% of GDP(2) | | | 23.8 | % | | | 27.7 | % | | | 28.2 | % | | | 28.4 | % | | | 29.2 | % | | | 28.4 | % | | | 29.8 | % |
Main Government Expenditure | | | 747,868 | | | | 805,979.1 | | | | 889,911.5 | | | | 965,495.6 | | | | 1,047,758.6 | | | | 1,131,951.8 | | | | 1,246,929.6 | |
% of GDP(2) | | | 30.5 | % | | | 32.0 | % | | | 32.0 | % | | | 32.7 | % | | | 33.2 | % | | | 32.0 | % | | | 33.6 | % |
Main Budget Deficit | | | (161,754.9 | ) | | | (133,227.7 | ) | | | (144,619.3 | ) | | | (165,733.9 | ) | | | (160,493 | ) | | | (168,391.2 | ) | | | (176,266 | ) |
% of GDP(2) | | | (6.3 | )% | | | (4.7 | )% | | | (4.7 | )% | | | (5.0 | )% | | | (4.4 | )% | | | (4.4 | )% | | | (4.3 | )% |
Net borrowing requirement | | | (161,754.9 | ) | | | (133,227.7 | ) | | | (144,620.2 | ) | | | (165,353.3 | ) | | | (160,498.7 | ) | | | (168,391.2 | ) | | | (176,265.2 | ) |
Change in cash and other balances(10) | | | (30,128.7 | ) | | | (41,354.7 | ) | | | (21,741.4 | ) | | | 29,033.1 | | | | (12,346.4 | ) | | | (6,548.8 | ) | | | 8,857.2 | |
Notes:—
N/A = not available
| (1) | First half of 2015, seasonally adjusted and annualized. |
4
| (3) | Estimate for first half of 2015, seasonally adjusted and annualized. |
| (4) | At constant 2010 prices. |
| (5) | Real growth rate in per capita earnings, at constant 2010 prices. |
| (6) | Estimates to June 30, 2015. |
| (7) | Quarterly Labour Force Survey (QLFS) as of September 30, 2015. |
| (8) | Rand/Dollar rates are averages for the period through July 2015. |
| (9) | As of July 30, 2015. Calculated based on the average values over the seven months. |
| (10) | The total debt of National Government (net) is calculated with due account of the bank balances of the National Revenue Fund (balances of National Government’s accounts with the SARB and the Tax and Loans Accounts with commercial banks). |
| (11) | Final outcome for fiscal year 2015, as reflected in the MTBPS (October 2015). |
| (12) | Estimates as revised and reflected in the MTBPS (October 2015). |
| (13) | Total Trade figures from 2013 onwards includes trade with Botswana, Lesotho, Namibia and Swaziland (BLNS countries). |
| (14) | Due to a rebasing in 2012, figures prior to 2012 are not available. |
Source: South African National Treasury, SARB and Statistics SA (Stats SA).
The estimates included in this Annual Report are based on the 1993 System of National Accounts (SNA) published by the United Nations in cooperation with other international organizations. This means that the methodology, concepts and classifications are in accordance with the latest guidelines of an internationally agreed system of national accounts. The estimates of real GDP are expressed in terms of a 2010 base year. Revision of the estimates for all components of the national accounts is done from time to time based on the availability of data.
Statistics South Africa (Stats SA), who compiles the expenditure side of national accounts, has rebased certain GDP estimates in the Statistical Release, P0441, Gross Domestic Product, Third Quarter 2014 dated November 25, 2014 in terms of a 2010 base year.
INTRODUCTION
South Africa has been an established constitutional democracy since 1994, when it held its first fully democratic national elections. The South African economy is diverse and supported by a well-developed legal system and a sophisticated financial system. The major strengths of the South African economy are its services and manufacturing sectors, its strong physical and economic infrastructure and its abundant natural resources, including gold, platinum metals and coal.
The country’s fifth fully democratic national elections took place in May 2014, and saw the ruling African National Congress (ANC) maintaining its significant majority in Parliament. A number of minority parties make up the balance of the seats presently held in the National Assembly, including the National Freedom Party (NFP, six seats), United Democratic Movement (UDM, four seats), the Freedom Front Plus (VF Plus, four seats), the African Independent Congress (AIC, three seats), the Pan African Congress (PAC, one seat), and the African People’s Convention (APC, one seat). The Azanian People’s Organisation (AZAPO), the United Christian Democratic Party (UCPC) and the Minority Front (MF) all lost their seats in the National Assembly due to their failure to meet the minimum vote threshold. Municipal elections will take place in 2016.
The world economy is experiencing a lengthy period of low growth. Growth in developing economies has moderated in response to lower commodity prices, subdued domestic demand and reduced capital inflows. Growth in some developed economies has offset this slowdown. The South African government has taken two key steps to adapt to this low-growth world. It has identified the broad structural reforms needed to put the economy on a much higher growth path and it has sought to reduce South Africa’s vulnerability by implementing fiscal policy measures to maintain the health of the public finances.
The Government’s economic agenda is based on the principle that prudent macroeconomic policies provide an important anchor for stability in today’s turbulent global environment. Sustainable fiscal policy protects the social gains made since 1994. A resilient, flexible financial system helps the economy adjust to rapid change. The National Development Plan (NDP) lays the basis for much-needed economic and policy reforms to establish a platform for faster growth. Creating work and improving education to eliminate poverty and build a more equitable society are at the heart of long-term reforms set out in the NDP.
Nevertheless, economic conditions remained challenging for South Africa. The 2015 MTBPS estimates that South Africa’s economic performance has deteriorated over the past several years. Electricity constraints, weak business confidence and low household demand have limited growth. GDP is expected to grow by 1.5% in 2015, same as in 2014, rising marginally to 1.7% in 2016 and 2.6% in 2017.
5
Electricity supply is expected to constrain growth through 2016 by limiting output and dampening business and consumer confidence. Goverment’s plan to reduce electricity shortages has made progress, with the first unit of Eskom Medupi power station commencing operations, adding 800 MW of energy to the national grid. Government has sought to stabilize Eskom’s financial position with an R23 billion equity investment financed from the sale of Vodacom shares.
Given the weak economic outlook, proposals for additional taxes—which are essential to fund government’s ambition policy agendas—will be approached with caution. Over the medium term, the Government expects to continue to explore reforms that promote an efficient and progressive tax system, taking into account the recommendations of the Davis Tax Committee that was established in July 2013. The committee has published reports on small business taxation, value-added tax (VAT), base erosion and profit shifting, estate duty and mining taxation. A report on the role of the tax system in supporting inclusive growth, employment, equity and fiscal sustainability has also been published.
Despite weak economic growth over the past five years, revenue collection has consistently outpaced economic expansion. While nominal GDP growth has averaged 8.6% over the past five years, tax revenue has averaged 10.5% growth during the same period. Gross tax revenue for 2014/15 came in R7.3 billion above projections in the 2015 budget but has been revised downward by R7.6 billion in 2015/16. The downward revision was attributed to the weak performance of corporate income tax collections due to the steep decline in commodity prices and slowdown in economic activity. In total, lower growth has resulted in a downward revision of R35 billion to gross tax revenue projections between 2015/16 and 2017/18.
Domestic inflation is lower, largely as a result of declining oil prices. The Rand’s depreciation, however, poses some risk to the inflation outlook. Consumer price index (CPI) inflation eased to 4.6% over the first eight months of 2015, from 6.1% in 2014. Core inflation, which represents the long-run trend of the price levels and excludes temporary shocks, was unchanged at 5.7% over the same period.
Government is maintaining the fiscal course that was announced in 2014/15. Spending limits will remain in place to support sustainable public finances that are not overburdened by debt and interest payments. The ratio of government debt to GDP is expected to stabilize. The main budget deficit is projected to stabilize at 3.5% of GDP over the medium term, with the consolidated deficit declining to 3%. The expenditure ceiling set in the 2015 budget remains in place. Spending pressure, including higher wage bill, have been accommodated within the contingency reserves and departmental baselines.
6
In the three months ended September 30, 2015, quarterly changes reflected an increase in the number of people employed (by 171,000 to 15,828,000) and an increase in unemployment (by 188,000 to 5,418,000). This resulted in a slight increase in the unemployment rate from 25.0% in the three months ended June 30, 2015 to 25.5% in the three months ended September 30, 2015. Increases in non-agricultural employment were observed in both the formal and informal sectors (10,930,000 and 2,721,000, respectively). Employment increased by 28,000 people in the agricultural sector, while a decrease of 110,000 was observed in private households. The quarterly decrease of 200,000 among the economically inactive population was driven by an increase in discouraged job-seekers (208,000).
MAP OF THE REPUBLIC OF SOUTH AFRICA
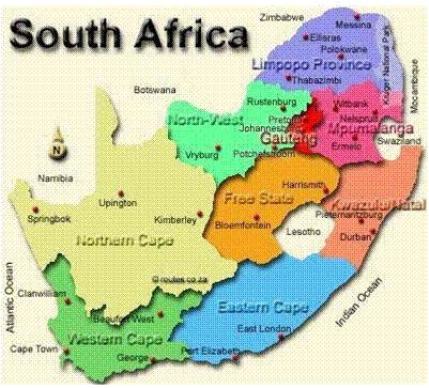
REPUBLIC OF SOUTH AFRICA
Area and Population
South Africa is situated on the southern tip of the African continent, with the Atlantic Ocean to the west and the Indian Ocean to the east. The north of the country shares common borders with Namibia, Botswana and Zimbabwe and, to the north east, the country shares a border with Mozambique. South Africa also shares common borders with the kingdoms of Lesotho and Swaziland. The total surface area of South Africa is approximately 1,219,090 square kilometers, with over 3,000 kilometers of coastline.
7
South Africa comprises nine provinces, which are the Eastern Cape, Free State, Gauteng, KwaZulu-Natal, Limpopo, Mpumalanga, Northern Cape, North West and Western Cape Provinces.
In the former racial classification that formed the basis for the apartheid system, “Black” referred to persons of original African indigenous origin, “Asian” to persons of Asian origin, “White” to persons of Caucasian ethnic origin and “Colored” to persons of mixed race. While the National Government no longer makes any unfair discrimination based on race, the country’s history of racial division and racial and ethnic differences continues to have social and economic significance. This is because social and economic policies are judged partly by their ability to address disparities and discrimination and to equalize opportunities. Therefore, in this document, reference to such racially classified statistics is made occasionally to illustrate those disparities.
South Africa’s population is approximately 55 million as at June 30, 2015, of which 28.1 million, representing 51% of the population, are female. Approximately 80.5 % are African, 8.8% are Colored, 2.5% are Indian/Asian and 8.3% are White (source: Stats SA Mid-year population estimate 2015). The most densely populated parts of South Africa are the four major industrialized areas: the Pretoria/Witwatersrand/Vereeniging area of Gauteng (which includes Johannesburg), the Durban/Pinetown/Pietermaritzburg area of KwaZulu-Natal, the Cape Peninsula area of the Western Cape (which includes Cape Town) and the Port Elizabeth/Uitenhage area of the Eastern Cape.
Stats SA estimates the average life expectancy in South Africa for females to be 72.7 years, and for males to be 65.2 years. However, it should be noted that life expectation estimates vary, primarily due to differences in assumptions about the rapidity with which the HIV epidemic will spread and the morbidity and mortality of the disease (see “— Public Health — HIV, AIDS and Tuberculosis (TB)”).
South Africa has a diverse population consisting of Afrikaans and English-speaking Whites, Asians (including Indians), Coloreds, Khoi, Nguni, San, Sotho-Tswana, Tsonga, Venda and persons that have immigrated to South Africa from across the globe. By virtue of the country’s diversity, South Africa has 11 official languages, namely Afrikaans, English, isiNdebele, isiXhosa, isiZulu, Sepedi, Sesotho, Setswana, siSwati, Tshivenda and Xitsonga. According to the results of the census conducted in 2011, isiZulu is the mother tongue of 22.6% of the population, followed by isiXhosa at 15.9%, Sepedi at 9.1%, Afrikaans at 7.9%, and English and Setswana at 8.2% each. IsiNdebele is the least spoken language in South Africa, at 1.5% (source: Census 2011).
Government and Political Parties
Constitution
Following the repeal of apartheid legislation, South Africa held its first fully democratic national election in 1994. The final Constitution was adopted in 1996 and phased-in between 1997 and 1999. South Africa’s Constitution is hailed as one of the most progressive in the world and enjoys high acclaim internationally. The Constitution states that South Africa is “founded on a commitment to achieve equality, to promote and protect human dignity and to advance human rights and freedoms”. The Constitution enshrines the principles of supremacy of the rule of law, universal adult suffrage, regular elections and multi-party democracy. The Bill of Rights contained in Chapter 2 of the Constitution is one of the world’s broadest, guaranteeing freedom of speech, movement and political activity, and providing persons accused of crimes with many legal protections including the right to a speedy trial and the right to remain silent. The Bill of Rights also enshrines the right to access to adequate housing, food, water, education and healthcare, and prohibits discrimination on the basis of race, gender, sexual orientation, age, pregnancy or marital status.
The Constitution provides for the separation of powers among the legislative, executive and judicial branches of the National Government. Under the Constitution, the bicameral Parliament, in which the legislative authority of the National Government is vested, is comprised of a National Assembly and a National Council of Provinces.
8
The National Assembly consists of no fewer than 350 and no more than 400 members elected on the basis of proportional representation pursuant to which political parties receive seats in proportion to the votes cast for the parties concerned. Of the 400 seats in the National Assembly, approximately 200 seats are selected from provincial lists, with a fixed number allocated to each province. The remaining seats are filled from national lists to ensure proportionality in accordance with the total number of votes cast for each party in the national election.
The National Council of Provinces consists of 90 members (namely 54 permanent members and 36 special delegates). Each of the nine provincial legislatures elects ten representatives.
The Constitution provides for national elections every five years and places all elections and referendums in the country for all three spheres of government (national, provincial and local) under the control of the Independent Electoral Commission (IEC). The most recent national and provincial elections were held in May 2014 and municipal elections will take place in 2016.
Each province has its own executive authority, the premier. The premiers are elected by each Provincial legislature from among its members. The powers of the premier are exercised in consultation with a provincial executive council, which is constituted in a manner similar to the Cabinet in the National Government. The provinces exercise limited power on a national level, principally through their representatives in the National Council of Provinces, and also through their power to block Parliamentary action affecting the constitutional position and status of the provinces.
Political Parties
The ANC, which was founded in 1912 and which led the struggle against apartheid, is the ruling party in eight of the nine South African provinces, and the most influential party in South Africa in terms of the size of its electoral constituency support. Following the May 2014 elections, the ANC occupies 249 of the National Assembly’s 400 seats. Every five years the ANC holds a National Conference, which is its highest decision-making body and which decides the policies of the ANC, adopts proposed constitutional amendments and elects the National Executive Committee. At its 53rd National Conference, held in Mangaung, Free State Province from December 16-20, 2012, the ANC re-elected the current President of South Africa, Jacob Zuma, as president of the ANC, and Cyril Ramaphosa as his deputy. The 80-member National Executive Committee, which is the party’s highest decision-making body between conferences, was also elected at the National Conference.
The ANC Youth League (ANCYL), under the former leadership of Julius Malema and its principal spokesperson, Floyd Shivambu, made a number of public statements calling for the nationalization of mines and mining assets. The ANCYL also advocated for the nationalization of banks and the expropriation of agricultural land without compensation. Various ANC officials responded by stating that nationalization is neither government nor ANC policy.
Mr. Malema was suspended from the ANC for five years in November 2011 after the disciplinary committee found him guilty of bringing the party into disrepute and sowing division in the party ranks.
Consequently, Mr. Malema launched the Economic Freedom Fighters (EFF) party in 2013 with himself as its leader. The launch of the EFF marked the second launch of a new political party during 2013. In February 2013, former World Bank Managing Director and anti-apartheid activist Dr. Mamphela Ramphele announced the launch of Agang SA. In the May 2014 elections, the EFF won 25 seats in the National Assembly, while Agang SA won two seats.
9
The Democratic Alliance (DA), founded in 2000 and currently led by Mmusi Maimane, serves as the official opposition in the National Assembly. In the 2009 elections, the DA won 67 of the 400 seats in the National Assembly, and following the 2014 national and provincial elections, now holds 89 seats.
On August 15, 2010, the DA and the Independent Democrats announced that the two parties had ratified a memorandum of understanding, paving the way for complete integration by 2014. The memorandum of understanding made provision for Independent Democrat members of the National Assembly and Provincial Legislatures to hold dual membership until the next national and provincial elections in 2014. As of the May 2014 elections, all remaining dual members of the Independent Democrats became members of the DA as per the memorandum of understanding.
On November 10, 2008, a faction of the ANC broke away from the party and launched a new political party, called the Congress of the People (COPE), led by former ANC chief whip and Defence Minister Mosiuoa Lekota and former Gauteng Premier Mbhazima Shilowa. COPE won 30 seats in the National Assembly following the April 2009 elections. Since then, there has been a protracted leadership dispute between Mr Lekota and Mr Shilowa. The South Gauteng High Court validated Mr Lekota as the rightful head of COPE in a ruling handed down in October 2013, however, Mr Shilowa has indicated that he is likely to continue to challenge for a position within COPE through the courts. COPE currently holds three seats in the National Assembly.
The Inkatha Freedom Party (IFP) was founded in 1975. In 2009, the IFP won 218 seats in the National Assembly, decreasing to ten seats in May 2014 elections. In the May 2011 municipal elections, the IFP was unable to lodge the required documentation in time to contest the local government election in Umzumbe, an IFP stronghold. This culminated in an urgent application to the Constitutional Court, the result of which was an affirmation by the Constitutional Court of the Electoral Commission’s view that the IFP could not contest the election in Umzumbe. The current leader of the IFP is Chief Mangosuthu Buthelezi.
Following the May 2014 elections, a number of minority parties make up the balance of the seats presently held in the National Assembly, including the National Freedom Party (NFP, six seats), United Democratic Movement (UDM, four seats), the Freedom Front Plus (VF Plus, four seats), the African Independent Congress (AIC, three seats), the Pan African Congress (PAC, one seat), and the African Peoples Convention (APC, one seat). the Azanian People’s Organisation (AZAPO), The United Christian Democratic Party (UCPC) and the Minority Front (MF) all lost their seats in the National Assembly due to their failure to meet the minimum threshold in votes.
Presidential Developments
Following the June 1999 elections, Thabo Mbeki of the ANC succeeded Nelson Mandela as President and continued to serve as President following the 2004 elections. Phumzile Mlambo-Ngcuka, who had been serving in the Cabinet as Minister of Minerals and Energy, was appointed as the first female Deputy President of South Africa in July 2005, replacing Deputy President Jacob Zuma who was released from his duties by the then President Thabo Mbeki following allegations of corruption. On September 20, 2006, the charges of corruption against Jacob Zuma were struck from the court roll because the state was not ready to proceed with its case. The National Prosecuting Authority (NPA) attempted to recharge Jacob Zuma, but the Pietermaritzburg High Court ruled on September 12, 2008 that the decision to prosecute Jacob Zuma on corruption, racketeering and tax evasion charges was procedurally invalid.
In September 2008, the ANC recalled Thabo Mbeki from office before his term expired. The ANC stated that the decision had been made in light of a High Court judgment which suggested executive meddling in the decision to prosecute Jacob Zuma. On September 21, 2008 Thabo Mbeki tendered his resignation, which became effective on September 25, 2008.
Following Thabo Mbeki’s resignation, the National Assembly voted by secret ballot to determine which of two nominees (that of the ANC and that of the DA) would fill the vacant office of president. Kgalema Motlanthe, of the ANC, captured the majority of the votes and was sworn in as South Africa’s President on September 25, 2008, with Baleka Mbete, also of the ANC, appointed as his deputy. On May 9, 2009 Jacob Zuma was inaugurated as President, with Kgalema Motlanthe as his deputy.
10
On January 12, 2009, the Supreme Court of Appeal (SCA) held that the Pietermaritzburg High Court had erred in its ruling regarding the declaration that the decision of the NPA to prosecute Jacob Zuma was invalid. The matter was taken on appeal to the Constitutional Court and was set to be heard on May 12, 2009, however, on April 6, 2009, the NPA announced that it had dropped the corruption charges against Jacob Zuma, citing political interference in the legal process. The circumstances surrounding the NPA’s decision to drop the charges have been called into question by the DA and political action groups including Freedom Under the Law, and a court challenge was brought requiring the release by the NPA of records relating to the decision. A review application was filed by the DA, and in 2015, the NPA filed its papers arguing that President Zuma was charged with corruption almost immediately after being elected as ANC leader, in order to stop then President Thabo Mbeki from being recalled. The matter has not proceeded further since then.
During 2013, Public Protector Thuli Madonsela conducted an investigation into a more than R200 million security upgrade of President Zuma’s home in Nkandla, KwaZulu-Natal. The Public Protector released the conclusions of the investigation in a report dated March 19, 2014. Amongst the Public Protector’s findings was that certain of the upgrades installed by the Department of Public Works in the President’s Nkandla home resulted in an unlawful misappropriation of public funds. The report directed the President to submit comments to the report to the National Assembly within 14 days and the President responded on April 2, 2014 that he had directed the Special Investigating Unit to examine the security upgrades and would make a further report to the National Assembly following conclusion of the Special Investigating Unit’s probe. The President has since commented on the Public Protector’s report and the Special Investigating Unit has finalized its report. The National Assembly convened an ad hoc committee to consider the Public Protector’s report as well as all other reports on Nkandla. The ad hoc committee released its findings on November 13, 2014. The report absolved President Zuma from responsibility for the abuse of funds on his Nkandla home and left it to the Cabinet to rule whether refurbishments at Nkandla were legitimate security measures, and to the President to decide who should be held responsible for excesses. The President tasked the Minister of Police, Mr. Nkosinathi Nhleko, with the task of investigating who should be held responsible for repayment of the money spent on President Zuma’s Nkandla home. In May 2015, Minister Nhleko released his report which found that the President did not have to repay money for the upgrades at his home because all the features, including the swimming pool, were for the President’s security. The report was submitted for tabling in Parliament. Parliament set up an ad hoc committee to consider Minister Nhleko’s report. The ad hoc committee endorsed Minister Nhleko’s finding and its report was tabled in Parliament in August 2015 when it was adopted.
On October 8, 2015, the Supreme Court of Appeal (SCA) handed down a significant judgment relating to the powers of the Public Protector. The judgment was in an appeal by the South African Broadcast Corporation (SABC), the Minister of Communications and, the Chief Operating Officer of the SABC, against the decision of the Western Cape High Court to suspend the Chief Operating Officer of the SABC. The main issue addressed in the judgment was whether recommendations by the Public Protector have to be implemented. The court held that, as the primary watchdog of the Government, the recommendations of the Public Protector have to be implemented because if the recommendations are ignored, it strips the office of all power. The SCA held that only a court can review the findings and recommendations of the Public Protector. The same issue will be considered by the Constitutional Court on February 9, 2016, when it will decide on the application by the EFF to force President Jacob Zuma to comply with the recommendation by the Public Protector to repay the public funds spent on his Nkandla homestead.
2014 National and Provincial Elections
In May 2014, approximately 25 million South Africans registered to vote in the national and provincial elections, compared to the approximately 23 million people registered to vote in April 2009.
The IEC approved the candidate lists of 42 political parties that contested the national and provincial elections. Of these parties, 29 political parties were registered to contest the national election for the National Assembly. 13 political parties were registered to contest all nine provincial legislatures, 29 political parties applied to contest only some provinces.
11
According to IEC data, a total of 18 million South Africans cast their votes in the elections on May 7, 2014. The May 2014 elections were considered fair, transparent and credible by the IEC. The official general election results were announced on May 10, 2014. The ruling ANC won the elections, receiving 62% of the votes cast in respect of the national elections. The DA remained the official opposition of the ANC, with 22% of the votes, and the EFF came in third with 6% of the votes.
The table below sets out the National and Provincial Assembly seats secured by political parties following the May 2014 general elections.
| | | | | | | | | | | | | | | | |
| | | Number of seats in
National Assembly | | | Proportional
Representation seats | |
Political Party | | | | | | | | | | | | | | | | |
ANC | | | 249 | | | | 62.15 | % | | | 118 | | | | 59.0 | % |
DA | | | 89 | | | | 22.23 | % | | | 45 | | | | 22.5 | % |
EFF | | | 25 | | | | 6.35 | % | | | 11 | | | | 5.5 | % |
IFP | | | 10 | | | | 2.4 | % | | | 5 | | | | 2.5 | % |
NFP | | | 6 | | | | 1.57 | % | | | 3 | | | | 1.5 | % |
UDM | | | 4 | | | | 1 | % | | | 2 | | | | 1.0 | % |
VF PLUS | | | 4 | | | | 0.9 | % | | | 3 | | | | 1.5 | % |
COPE | | | 3 | | | | 0.67 | % | | | 3 | | | | 1.5 | % |
ACDP | | | 3 | | | | 0.57 | % | | | 3 | | | | 1.5 | % |
AIC | | | 3 | | | | 0.53 | % | | | 3 | | | | 1.5 | % |
AGANG SA | | | 2 | | | | 0.28 | % | | | 2 | | | | 1.0 | % |
PAC | | | 1 | | | | 0.21 | % | | | 1 | | | | 0.5 | % |
APC | | | 1 | | | | 0.17 | % | | | 1 | | | | 0.5 | % |
| | | | | | | | | | | | | | | | |
Total | | | 400 | | | | 100.0 | % | | | 200 | | | | 100.0 | % |
| | | | | | | | | | | | | | | | |
Source: IEC.
On May 24, 2014, following the ANC’s victory in the elections, Jacob Zuma was inaugurated as the fourth democratically elected President of the Republic, with Cyril Ramaphosa as his deputy.
2011 Municipal Elections
Municipal elections are held every five years. The 2011 municipal elections were held on May 18, 2011 at which 13.66 million South Africans voted. This was the highest voter turnout since the first municipal elections following the reorganization of municipalities in 2000. Before the 2011 elections, the ANC had control of a majority of municipalities in each province, including the Western Cape Province. In the 2011 elections, the DA won a majority (57.08%) of the votes in the Western Cape Province. In the Nelson Mandela Bay municipality, the ANC also obtained a majority of votes. Although the DA increased its presence in the Northern Cape (to 22.27%), the ANC won control of the province as a whole (at 63.57%).
COPE, the NFP and the IFP also tried to improve their standings but failed to obtain control of any municipalities. Various smaller parties contested the elections, but made no significant impact.
The end results of the 2011 municipal elections were that, of 35,235,914 votes cast, the ANC won 63.65% of the votes, the DA won 21.97%, the IFP won 3.94%, the NFP won 2.58% and COPE won 2.33%. Each of the remaining parties contesting the elections obtained results below 1%.
Zuma Administration
The Constitution provides for a Cabinet consisting predominantly of members of the National Assembly, who retain their seats while in the Cabinet. Cabinet portfolios are allocated by the President. The Cabinet generally operates by consensus rather than by voting.
12
On May 25, 2014, President Zuma announced his Cabinet, which consisted of 35 ministers who are members of Parliament, in addition to the President and the Deputy President, as well as some structural changes to the National Government. Some departments were split, others combined and new departments were created. President Zuma also announced that the National Planning Commission (NPC) as well as the Performance Monitoring and Evaluation Ministries in the Presidency had been combined into one Ministry to harmonize the planning and monitoring functions. On March 15, 2015, Mr. Collins Chabane, the Minister of Public Service & Administration, passed away in a motor vehicle collision, and Nathi Mthethwa, the Minister of Arts and Culture, was appointed as the Acting Minister of Public Service & Administration. On September 22, 2015, President Zuma announced a reshuffle of the Cabinet in order to permanently fill the position of Minister of Public Service & Administration. The following replacements were made:
| | • | | Public Service and Administration Minister, Mr. Collins Chabane, was replaced by the former Minister of Mineral Resources, Ngoako Ramatlhodi. |
| | • | | Mineral Resources Minister, Mr. Ramatlhodi was replaced by Mr. Mosebenzi Zwane, former MEC for economic, small business development and environmental affairs of the Free State province. |
The NPC released a diagnostic report on June 9, 2011 that aims to identify the main challenges confronting the country and to examine the underlying causes of such problems. The diagnostic report is not a plan; it provides the basis for a plan.
The diagnostic report covers the following topics:
| | • | | institutions and governance. |
On November 11, 2011, the NPC released its vision statement for 2030 (Vision 2030), as well as a National Development Plan (NDP 2030) for the Cabinet’s consideration. The NDP 2030 focuses on key priority areas and identifies nine primary challenges: high unemployment, poor education outcomes, a high disease burden, divided communities, uneven public service performance, settlement patterns that marginalize the poor, corruption, an overly resource-intensive economy and crumbling infrastructure.
The key areas of focus for the NDP 2030 are:
| | • | | enhanced capabilities and an active citizenry; |
| | • | | growth, investment and employment; |
| | • | | rising standards of education and a healthy population; |
| | • | | an effective and capable government; |
| | • | | collaborations between the private and public sectors; and |
| | • | | leadership from all sectors of society. |
13
Legal System
The South African legal system is based upon Roman-Dutch law and incorporates certain elements of English law, subject to the Bill of Rights contained in the Constitution. Judicial authority in South Africa is vested in the courts, which are established pursuant to the Constitution. The Constitution is the supreme law of the land and no other law can supersede the provisions of the Constitution. The Constitutional Court has jurisdiction as the court of final instance over all matters relating to the interpretation, protection and enforcement of the terms of the Constitution and is the court of first instance on matters such as those concerning the constitutionality of an Act of Parliament referred to it by a member of the National Assembly. Decisions of the Constitutional Court are binding upon all persons and upon all legislative, executive and judicial organs of state. Matters not falling within the jurisdiction of the Constitutional Court fall within the jurisdiction of the Supreme Court, which consists of the Supreme Court of Appeal and various High Courts. Judgments of the Supreme Court of Appeal are binding on all courts of a lower order, including the High Courts, and judgments of the High Courts are binding on the lower courts within their respective areas of jurisdiction.
The Chief Justice and the Deputy Chief Justice of the Constitutional Court are appointed by the President in consultation with the Judicial Service Commission (JSC) and the leaders of parties represented in the National Assembly. The Judge President and Deputy President of the Supreme Court of Appeal are appointed by the President after consulting with the JSC only. The remaining judges of the Constitutional Court, the Supreme Court of Appeal and the High Courts are appointed by the President on the advice of the JSC.
Former Chief Justice Sandile Ngcobo retired on August 12, 2011 and was replaced by the new Chief Justice, Mogoeng Mogoeng, on September 8, 2011. Prior to his retirement, President Zuma had extended Chief Justice Ngcobo’s term of office. However, this decision was declared unconstitutional by the Constitutional Court, which held that the section of the Judges’ Remuneration and Conditions of Employment Act, which the President relied on to extend the term of office, was unconstitutional. The appointment of Mogoeng Mogoeng to the position of Chief Justice ahead of Deputy Chief Justice Dikgang Moseneke was controversial and prompted public scrutiny of the JSC and the consultation process. Chief Justice Mogoeng Mogoeng’s appointment was confirmed after an intensive two-day televised interview before the JSC, chaired by Deputy Chief Justice Moseneke.
Broad-Based Black Economic Empowerment
Broad-Based Black Economic Empowerment (BBBEE) is a core tenet of the National Government’s initiative to address the economic exclusion of historically disadvantaged South Africans by encouraging the redistribution of wealth and opportunities to historically disadvantaged persons. As part of this initiative, the National Government enacted the Broad-Based Black Economic Empowerment Act, 2003 (Act No. 53 of 2003) (BBBEE Act), which came into effect in April 2004. For purposes of the BBBEE Act, “black people” is a generic term which means Africans, coloreds and Indians. On June 18, 2008, the High Court of South Africa ordered that South African Chinese persons (who are South African citizens or would have obtained citizenship but for the previously applicable discriminatory laws) be included within the ambit of the BBBEE Act. The BBBEE Act aims to facilitate BBBEE and promote economic transformation by: incentivizing meaningful participation by black people in the economy; changing the racial composition of ownership and management structures in enterprises; promoting investment programmes that lead to BBBEE; enabling access to economic activities, infrastructure and skills for black women and rural and local communities; increasing the extent to which workers, communities and cooperatives own and manage enterprises; and promoting access to finance for black economic empowerment (BEE).
In 2013, amendments to the BBBEE Act were introduced. These, together with the Codes change the current BBBEE framework and are the result of the Government’s intention to promote and implement BBBEE. Government policy has to date been based on the principle that the manner in which a firm applies BBBEE is to be decided by the individual firm having regard to its own business needs with the BBBEE framework providing a methodology for measuring the BBBEE rating of the firm. The new BBBEE framework introduces penalties in certain circumstances, which is an important departure from previous Government policy.
The Department of Trade and Industry (DTI), empowered by the BBBEE Act, has issued the BBBEE Codes of Good Practice on Black Economic Empowerment (the Codes). The Codes, which were promulgated in February 2007, require that every organ of national and local government and every public entity must, as far as is reasonably possible, apply best BEE practices in issuing licenses, implementing procurement policies, determining qualification criteria for the sale of state-owned enterprises and
14
developing criteria for entering into public private partnerships. The Codes set out general principles for measuring ownership and management control, preferential procurement, employment equity, skills development, enterprise development and socio-economic development, including special guidance for qualifying small enterprises. The Codes also provide guidance on fronting practices, BEE verification, the recognition of contributions toward BEE of multinationals, and the treatment of public entities and other enterprises wholly-owned by organs of state. The Codes are subject to review by the Minister of Finance in 2017.
Multinational Companies
The Codes have given multinational companies flexibility in the manner in which they can implement the Codes, should they wish to do so. A multinational company trading in South Africa can retain sole ownership of its South African subsidiary, provided that alternative measures to broaden economic participation by black people, in terms of the Codes, are exercised. This retention of ownership by a multinational over its South African subsidiary can be achieved by implementation of “equity equivalent” programs which must be pre-approved by the Minister of the DTI as well as the ministry of the industry in which the relevant multinational enterprise operates. Such equity equivalent programs focus on skills transfer, empowerment of SMME businesses and broader socio-economic empowerment projects.
Public Entities and State Agencies
The BBBEE Act places a legal obligation on state agencies to contribute to BBBEE, including when developing and implementing their preferential procurement policies. The Preferential Procurement Policy Framework Act, 2000 (Act No. 5 of 2000) (PPPFA) was promulgated as a result of Section 217 of the Constitution, which states that all spheres of government must have a mechanism in place that would bring about categories of preference in allocation of contracts when procuring goods and services to advance historically disadvantaged individuals (HDIs). In December 2006, when the Codes were approved for gazetting, Cabinet gave the DTI and the National Treasury a mandate to amend the PPPFA to advance the objectives of the BBBEE Act. The draft amended PPPFA was gazetted for public comment on August 20, 2009. On June 8, 2011, the Minister of Finance gazetted new regulations in terms of the PPPFA which became applicable to all organs of state and public entities as of December 7, 2011, except selected “major public entities” and certain national and provincial government business enterprises set out in the Public Finance Management Act, 1999 (Act No. 1 of 1999) (PFMA), which are exempted until December 7, 2012. In terms of the new regulations, the BBBEE contributorship level of an enterprise (calculated with reference to the Codes) will account for up to 20% of the scorecard in respect of all tenders valued between R30,000 and R1,000,000 and up to 10% of the scorecard in respect of tenders exceeding R1,000,000.
Private Sector
Although the BBBEE Act and Codes do not impose legal obligations on firms to comply with BBBEE targets, a firm’s BBBEE status is an important factor affecting its ability to successfully tender for Government and public entity tenders and (in certain sectors like mining and gaming) to obtain licenses. The amendments introduced in 2013 impose penalties in certain circumstances. Private sector clients also increasingly require their suppliers to have a minimum BBBEE rating in order to boost their own BBBEE ratings. BBBEE is accordingly an important factor to be taken into account by any firm conducting business in South Africa.
The BBBEE Act provides for the DTI to publish and promote any transformation charter (for later development into industry codes) for a particular sector of the economy, provided that charter (or code) is developed by the major stakeholders in that sector and advances the objectives of the BBBEE Act. These charters/codes set out a blueprint and timeline for the transformation of the relevant economic sectors. Examples include the Agri-BEE Charter, the Marketing, Advertising and Communication Sector Charter, the Integrated Transport Sector Codes, the Forest Sector Code, the Construction Sector Code, the Tourism Sector Code, the Chartered Accountancy Sector Code, the Property Sector Charter and the Information and Communication Technology (ICT) Code. Other charters are being developed and draft versions thereof have been released, including the draft Financial Sector Code.
Some of the biggest challenges facing the National Government in relation to the implementation of BBBEE include educating the South African public on the objectives, opportunities and perceptions relating to BBBEE, providing certainty as to the requirements of BBBEE, ensuring that the objectives of BBBEE are properly adhered to and encouraging investment in South Africa that advances BBBEE and promotes economic and social transformation.
15
Land Reform
Land reform in South Africa is a complex issue, due to both the apartheid era legacy of dispossessing black South Africans of their land and to the current development challenges. Through the judicial framework process and the Constitution’s protection of private property rights, the National Government seeks to facilitate the equitable transfer of land to South Africans who were previously dispossessed of their land as a result of the land dispossession policies of the previous regime in South Africa.
The White Paper on Land Affairs of 1997 is a land reform strategy that focuses on restitution, redistribution and land tenure reform. Restitution involves either returning land or providing alternative compensation to persons who have been dispossessed of their land; redistribution encourages the acquisition of land by disadvantaged South Africans (with the aid of government grants); and land tenure reform aims to create a unified and secure system of landholding.
The Department of Rural Development and Land Reform had previously set 2014 as the deadline for achieving land reform in South Africa through the redistribution of 30% of white-owned commercial agricultural land to those previously dispossessed of such land. Section 25 of the Constitution provides that property may only be expropriated subject to compensation that is either agreed by those affected or decided or approved by a court. The National Government has been committed to executing its land reform strategy to uphold this constitutional principle.
In June 2007, the National Policy Conference of the ANC resolved that it was necessary to develop a detailed strategy in order to meet the 30% target. Pursuant to this, the Department of Public Works released a policy document on the expropriation of land and other property in the public interest or for public purposes. The policy document had two main objectives: (1) to enable the state to use expropriation as a means to affect land reform and (2) to align the Expropriation Act of 1975 with the Constitution. To achieve these goals, the Expropriation Bill was presented before Parliament on April 11, 2008, and was published for public comment after certification of the bill. On August 27, 2008, the Portfolio Committee on Public Works withdrew the bill until further notice, stating that more time was needed to ensure consultation with a wide variety of stakeholders. The National Government abandoned the 30% target in 2013. The focus is now on ensuring that all land reform farms are 100% productive. According to the Department of Rural Development and Land Reform, approximately 7.4 million hectares of land have been transferred to disadvantaged South Africans under the restitution and redistribution program; the initial 30% target was 24.6 million hectares.
The implementation of the land restitution and land reform programs are supported through allocations to the Department. Expenditure grew from R8.9 billion in 2012 to R9.5 billion in 2014, mainly due to the increase in land reform and restitution grants, and is expected to increase to R11.5 billion by 2019. The Commission on Restitution of Land Rights has developed a strategic plan to finalize the remaining claims that addresses issues such as price negotiation, untraceable claimants, disputes and jurisdiction. A total of 9,149 claims from the first round of restitution, which ended in 1998, remain unsettled. The Department of Rural Development and Land Reform is in the process of verifying all outstanding claims. The department provided R36 million for 2015/2016, 2016/17 and 2017/18 for the establishment of a Valuer-General office which establishes prices for the farms redistributed as part of the land reform. The Restitution of Land Rights Amendment Act of 2014 extends the lodgment of land claims for five years, from July 1, 2014 to June 30, 2019.
In response to the slow pace of land redistribution, many commercial farmers and farming organizations have elected to drive reform themselves by establishing transformation programs, which aim to preserve and enhance agricultural productivity. A partnership between government, farming organizations, communities, financiers and experts is required as promoted by the 50/50 policy under which farm workers own 50% of the farms.
16
The National Government is also currently investigating policy options with regards to foreign ownership of South African land and its effect on the National Government’s ability to meet its Constitutional duties to effectively deliver on land reform. The policy options recommend that where land has been earmarked for reform, restitution or integrated human settlement, National Government approval is required for the sale of that land to foreign nationals.
Significant strides have been made in the area of land reform:
| | • | | as at March 31, 2015, 1,459 farms had been recapitalized; |
| | • | | the Department of Rural Development and Land Reform employed 15,781 youths under the National Rural Youth Services Corps program. |
Mining Industry Reform
Mining in South Africa has historically been undertaken largely by the private sector. As of January 2014, there were 1,699 registered mines and quarries in South Africa. The most important mining houses in South Africa include Anglo American plc, De Beers Corporation, African Mineral Limited, BHP Billiton SA, Gold Fields Limited, Impala Platinum Holdings Limited, Lonmin plc, Kumba Iron Ore Limited, Exxaro Limited, Xstrata plc and Harmony Gold Limited. These corporations, together with their affiliates, are responsible for the majority of the gold, diamond, uranium, zinc, lead, platinum, chrome, iron ore, coal and silver production in South Africa.
| | • | | Gross fixed capital formation in the mining industry increased significantly under the Mineral and Petroleum Resources Development Act No 28 of 2002 (MPRDA), from R18 billion in 2004 to R79 billion in 2013 (source: South African Reserve Bank). |
| | • | | Foreign direct investment in the mining industry grew considerably, from R112 billion in 2004 to R429 billion in 2012 (source: South African Reserve Bank). |
| | • | | Employment in the mining industry grew from 448,909 in 2004 to 495,000 in 2014. |
| | • | | Mining contribution to GDP decreased from R245 billion in 2004 to R225 billion in 2014. |
The Mineral and Petroleum Resources Development Act (MPRDA) and the Mining Charter
The National Government enacted the MPRDA in 2002. The MPRDA, which came into effect on May 1, 2004, together with the implementation of the Broad-Based Socio-Economic Empowerment Charter for the South African Mining Industry published on August 13, 2004 (the Mining Charter), recognizes the state’s sovereignty and custodianship over the country’s mineral resources. The MPRDA also provides for equitable access to mineral resources, expansion of opportunities for HDIs (including women-led entities) and promotes economic growth, employment and socio-economic welfare, and security of tenure. The Department of Mineral Resources (DMR), which is responsible for administering the MPRDA, is currently in the advanced stage of reviewing the MPRDA with a view to streamlining mining regulation in South Africa to optimize the contribution of the sector to national development priorities such as energy security and beneficiation and providing further clarity around such issues as the transfer, amendment, suspension and partitioning of rights. Among other things, the MPRDA Amendments Bill aims “to provide for the regulation of associated minerals, partitioning of rights and enhanced provisions relating to the regulation of the mining industry through beneficiation of minerals or mineral products.” The MPRDA amendments were tabled in Parliament in May 2013. The amendment bill was approved by the Parliamentary Portfolio Committee, the National Assembly and the National Council of Provinces in March 2014 and was sent back to the Parliament for consideration in January 2015. The Department received an additional R42 million over the medium term towards enforcing compliance with the MPRDA.
17
The Minister of Mineral Resources (previously the Minister of Minerals and Energy) is the competent authority for granting prospecting and mining licenses. In granting rights to HDIs, the DMR’s objective for fiscal year 2014 was to grant 200 such licenses, 101 of which have been granted as of September 30, 2014.
An online mineral resources administration system, the South African Mineral Resources Administration System (SAMRAD), was launched in April 2011 to process mining license applications, which enables the monitoring of the status and improves overall quality of license applications. The SAMRAD was further strengthened with the upgrading and rollout of software in the 2014 fiscal year, which enables the public to view spatial data and produce shapefiles making the SAMRAD more user friendly, and ensures enhancement of the spatial planning function within government.
The DMR is also responsible for managing environmental impacts from mining-related activities, and by the end of September 2014, had conducted 1,111 environmental inspections out of a target of 1,700 inspections. The Department of Environmental Affairs has transferred some of the functions of the National Environmental Management Act related to mining activities to the DMR, which means the DMR would be the competent authority for environmental impact assessments from the mines and would also be responsible for developing tools and systems for mine environmental management and reporting. The DMR is currently developing measures to streamline the licensing process relating to mining environmental issues to improve turnaround times.
The vision of the Mining Charter is to create a globally competitive mining industry that reflects a non-racial South Africa and draws on the human and financial resources of, and offers real benefits to, all South Africans. The Minister of Mineral Resources, the Chamber of Mines and the National Union of Mineworkers signed the stakeholders’ declaration on strategy for the sustainable growth and meaningful transformation of South Africa’s mining industry on June 30, 2010. The Mining Charter was reviewed after its first five years, as agreed by its signatories. The result of the review was the 2010 amendment to the Mining Charter, which reaffirmed the 2014 targets of the Mining Charter (the Revised Mining Charter).
The requirement under the Mining Charter for mining entities to achieve a 26% ownership by Historically Disadvantaged South Africans (HDSA) of mining assets by the year 2014 was retained. According to the Chamber of Mines, this target has been achieved, but conversations about broader transformations in the mining industry remain ongoing between the DMR and the Chamber. Amendments to the Mining Charter in the Revised Mining Charter include, amongst other things, the requirement by mining companies to: (i) facilitate local beneficiation of mineral commodities; (ii) procure a minimum of 40% of capital goods, 70% of services and 50% of consumer goods from HDSA suppliers by 2014 (these targets are exclusive of non-discretionary procurement expenditure); (iii) ensure that multinational suppliers of capital goods contribute a minimum of 0.5% of annual income generated from South African mining companies towards the socio-economic development of South African communities via a social development fund beginning in 2010; (iv) achieve a minimum of 40% HDSA demographic representation by 2014 at all levels of management; (v) invest up to 5% of annual payroll in essential skills development activities; and (vi) implement measures to improve housing and living standards for mineworkers by converting or upgrading mineworkers’ hostels into family units, attaining an occupancy rate of one person per room and facilitating home ownership options for all mineworkers in consultation with organized labor, all of which must be achieved by 2014. In addition, mining companies are required to monitor and evaluate their compliance to the Revised Mining Charter and must submit annual compliance reports to the DMR.
The Scorecard for the Broad-Based Socio-Economic Empowerment Charter for the South African Mining Industry attached to the Revised Mining Charter (the Scorecard) makes provision for a phased-in approach for compliance with the above targets over the five-year period ending in 2014. For measurement purposes, the Scorecard allocates various weightings to the different elements of the Revised Mining Charter. Failure to comply with the provisions of the Revised Mining Charter will amount to a breach of the MPRDA and may result in the cancellation or suspension of a mining company’s existing mining and/or prospecting rights.
18
The DMR initiated a process of evaluating the progress on the implementation of the Mining Charter during the 2014 fiscal year, the findings of which will constitute a critical input to the review process. The findings of the report were released in May 2015.
In 2008, the Mineral and Petroleum Resources Development Amendment Act was passed to do the following:
| | • | | transfer environmental regulation of mines to the Minister of Environmental Affairs and Tourism; |
| | • | | deal with challenges of implementing the MPRDA; |
| | • | | implement technical improvements to the MPRDA to improve efficiency in the management of the country’s mineral resources; |
| | • | | improve the handling of residue stockpiles and residue deposits; and |
| | • | | streamline the process of obtaining ministerial approval for cessions, transfers and encumbrances of rights aimed at promoting and protecting new entrants into the mining industry and of facilitating economic development. |
The MPRDA Amendments Bill was referred back to Parliament in January 2015 after the former Mineral Resource Minister, Ngoako Ramatlhodi, requested it, initially on the basis that the preparation of the bill through Parliament had been unconstitutional.
The MPRDA Amendment Act is yet to come into force. The DMR is currently looking at further possible amendments to the MPRDA to reinforce its objectives, to promote investment in the mining sector and to improve the system of granting rights.
A mineral beneficiation strategy was adopted by Cabinet in July 2011, focusing on five strategic value chains: iron and steel, energy commodities, jewelry fabrication, autocatalytic converters and diesel particulate filters, and pigment and titanium metal production. The purpose of the strategy is to outline a framework for the orderly development of the country’s mineral value chains, enabling South Africa to develop its mineral wealth to its full potential and to the benefit of the entire population. Its vision is to advance economic development in South Africa through the optimization of linkages in the mineral value chain, facilitate economic diversification, create jobs and promote industrialization. It aims to expedite South Africa’s move towards a knowledge-based economy and contribute to GDP growth through increased mineral value added per capita. The strategy is designed to align with South Africa’s national industrialization program and aims to create jobs in an economically diverse and environmentally sustainable manner, increase South Africa’s competitiveness and expand its industrial knowledge base.
Following the adoption of the mineral beneficiation strategy, the DMR tabled two of the five pilot value chains (iron and steel and energy) as outlined in the strategy, which were approved by Cabinet in October 2011. The DMR is working on the development of a beneficiation strategy framework which will include the five pilot value chains outlined in the beneficiation strategy. The framework outlines a set of enablers that are intended to bring about the orderly development of mineral value chains domestically and represents an opportunity for South Africa to catalyze industrialisation and contribute towards economic growth.
In 2009, the DMR published the national strategy for the management and rehabilitation of derelict and ownerless mines in South Africa, which aims to guide the management of mining legacies, with the dual purpose of rendering mines productive and environmentally safe. It proposes a course of action for the state to discharge its responsibility regarding constitutional environmental rights as contemplated in section 24 of the Constitution. The implementation of the strategy will continue, with annual updates of the
19
estimated state liability for the rehabilitation of derelict and ownerless mines being completed by actuarial scientists commissioned by the DMR. The DMR rehabilitated 28 mine sites in the period ended March 31, 2014, which contributed to the creation of 284 jobs. Job creation is a key requirement for all projects as it addresses some of the priorities of the NDP. The rehabilitation program has a positive impact on communities, resulting in economic growth through locally sourced labor and material, and improved health and wellbeing of communities. Furthermore, it reduces human and animal exposure to asbestos fibres from historical asbestos mine sites. The management and implementation of the rehabilitation of derelict and ownerless mines project received an additional allocation of R5 million in 2014/15 for 11 dangerous mine holdings that required immediate attention, bringing the total investment for this project to R89 million over the medium term. The DMR aims to rehabilitate 150 derelict and ownerless mines in the MTEF period to limit the flow of acid mine water into the environment, keeping abreast with the Government’s 2014-2019 medium-term strategic framework (MTSF) for the period for the protection and enhancement of environmental assets and natural resources.
Other Mining Industry Initiatives and Legislation
The Mineral and Petroleum Resources Royalty Act of 2008 (the Royalty Act) is aimed at ensuring that the country benefits from the exploitation of its mineral resources by imposing a resource rent on holders of rights. It also seeks to stimulate investment in the sector by addressing potential investors’ need for regulatory certainty. The Royalty Act recognizes that mineral resources are non-renewable and are part of the common heritage of all South Africans, and thus imposes a royalty on the extraction and transfer of mineral resources. The Schedules to the Royalty Act set out the classification of the mineral resources and their corresponding royalty rate. The Royalty Act was passed by the National Assembly on August 21, 2008 and the National Council of Provinces on September 23, 2008. The Royalty Act was assented to by the President on November 24, 2008 and came into force in stages between November 1, 2009 and March 1, 2010.
In addition, in 1999, the National Government launched an organization called the South African Women in Mining Association, with a focus on assisting informal mining groups in obtaining mining rights, running mining businesses and promoting female empowerment in the mining sector in accordance with the provisions of the Mining Charter. This initiative was followed by the launch in 2007 of the Youth in Energy and Mining (YEM), a program aimed at young people with an interest in the mining and energy sectors. YEM seeks to promote skills development, procurement, beneficiation enterprise development and small scale mining.
There has been an increase in the number of women participating in the mining sector since 1994. All stakeholders need to ensure that effective interventions are implemented to prevent intimidation of women in mining, whilst more attention should also be given to the health and safety of women in the sector.
The mining industry has also established the Mining Industry Growth, Development and Empowerment Task Team (MIGDETT) to help manage the negative effects of the global economic crisis and to save jobs, as well as to position the industry for growth and transformation in the medium to long term. Membership of MIGDETT includes the mining industry, the National Government, organized labor and other stakeholders.
Health and safety standards within the industry are governed by the Mine Health and Safety Act (Act 29 of 1996) (MHSA). Mining safety continues to be an area of concern as on average there are approximately 125 mine worker fatalities annually. These fatalities are partially attributable to a lack of stringent safety measures. Land slide accidents remain the largest cause of fatalities, followed by transportation and machinery accidents. During 2011, consultations took place to consider amendments to the MHSA. The proposed amendments are designed to strengthen enforcement, simplify the administrative system for the issuing of fines, reinforce offences and penalties, and remove ambiguities in certain definitions and expressions in the MHSA, and promote consistency with other laws, particularly the MPRDA. The MHSA draft amendments were tabled to Cabinet for approval for publication in the government gazette
20
and public consultation in November 2013. DMR has engaged in enhanced geoscience research and development, promoted mineral beneficiation and mine health and safety policy development and continued promotion and regulation of the diamond and precious metals industries. As part of a strategy for enhancing state participation in the mining industry, the Cabinet approved the establishment of the African Exploration Mining and Finance Corporation (AEMFC) to serve as the nucleus of a newly established state-owned mining company.
Successful implementation by the DMR of its development strategy for the mining sector requires stakeholder engagement to address current infrastructure, workforce skill development, and regulatory constraints, as well as to encourage exploration and research and development. As discussed in greater detail, below, under “The South African Economy—Mining and Quarrying”, a significant challenge for the DMR and industry stakeholders is the repairing of industrial relations following wildcat strikes initially sparked by the death of 40 mine workers during an August 2012 strike at the Lonmin mine in Marikana which then led to on and off strikes throughout parts of 2012 and 2013. The most significant strike in 2014 was the six-month strike in the platinum sector in the first half of 2014. A draft framework agreement for a sustainable mining industry was entered into by organized labour, organized business and government on June 14, 2013. The aim of the framework agreement was to promote stability in labour relations and ensure the sustainability of the mining sector. In September 2015, another mining pact was entered into between mining companies, unions and the government to limit the extent of adverse operating conditions on potential job losses going forward. In November 2015, a Mining Phakisa brought together business, labour and government to identify priorities to achieve the objectives of increasing mining exploration, investment, production, sustainability and transformation of the industry.
In September 2012, the Cabinet approved the moratorium on the acceptance and processing of applications to explore shale gas, allowing normal exploration (excluding the actual hydraulic fracturing) to proceed under the existing regulatory framework.
The approval was granted with some of the following recommendations:
| | • | | Allowing normal exploration (excluding the actual hydraulic fracturing) to proceed under the existing regulatory framework. Licensing should take into consideration the State’s developmental objectives and environmental protection requirements; |
| | • | | The augmentation of the current regulatory framework. The establishment of the appropriate regulations, controls and co-ordination systems is expected to take six to 12 months; |
| | • | | Collaboration by the Ministers of Science and Technology and of Mineral Resources in developing mechanisms for the co-existence of the astronomy research projects and the exploration for an possible extraction of shale gas in the Karoo; |
| | • | | Once all the preceding actions have been completed, the authorization of hydraulic fracturing under strict supervision of the monitoring committee. In the event of any unacceptable outcomes, the process may be halted; |
The DMR developed and published the technical regulations for shale gas development in the Government Gazette for public comments which was tabled for Cabinet approval in October 2013. The regulations place particular emphasis on unconventional extractive mechanisms for gas in the Karoo Basin and are also aimed at ensuring the developments are executed in a socially and environmentally safe manner to address concerns of communities as well as other interested and affected stakeholders. The final technical regulations, published in 2014, are intended to establish an orderly exploration of the shale gas potential in a manner that protects the water and environment and coexists with other key program of government, such as the Square Kilometer Array (SKA).
21
A Communications Strategy for Shale Gas Development in South Africa was tabled for Cabinet approval in September 2014 to inform and educate the South African populace and stakeholders about the inherent potential of shale gas exploration and exploitation. In addition to enforcement activities such as inspections, the Department will conduct research and advocacy work on hydraulic fracturing in preparation for licensing shale gas exploration and for monitoring compliance with the regulations once the exploration starts. The Department received an additional R108 million over the 2014/15 MTEF period for this work. Shale gas exploration is expected to contribute to economic growth and job creation, and five applications are in the final stages of considerations.
22
Crime Prevention
The criminal justice system (CJS) continued to implement the 2014-2019 MTSF objectives for the government to ensure that all people in South Africa are and feel safe. Progress has been made in a number of areas and initiatives are continuously being reviewed with a view to realize full effectiveness.
In order to ensure stability in the country the Justice Crime Prevention and Security (JCPS) Cluster has continued to initiate measures aimed, amongst others, to decrease serious crime and corruption, improve the efficiency of the CJS, enhance border management and protect the integrity of identity documentation. An Inter-Ministerial Committee on Immigration was established following attacks on foreign nationals in April 2015. This was enhanced by the implementation of Operation Fiela which was an interdepartmental and multi-disciplinary initiative that targeted crime hotspots around the country. From April 1, 2015 to June 30, 2015, a total of 9,968 arrests were made primarily for possession of drugs, undocumented immigration, illegal dealing in liquor, and assault. Screening of foreign nationals another key component of Operation Fiela, and out of 6,781 individuals awaiting deportation that were screened from April to July 2015, 1,694 were linked to crimes committed in the Republic of South Africa. In total, 15,396 of foreign nationals who were in South Africa illegally were repatriated to their home countries between April and July 2015.
The implementation of the National Cybersecurity Policy Framework 2012 continues and to date, a number of related policy documents have been developed which include the National Cybersecurity Policy, National Critical Infrastructure Policy and the Cybercrime Policy. Furthermore, as part of the legislative reforms, the Cybercrimes and Cybersecurity Bill 2015 has been submitted for public consultation in 2015. The bill aims to introduce measures which are directed at combating cybercrimes and to establish structures, such as the Cyber Security Centre and the National Cyber Center, that would be dealing with cybersecurity, as envisaged by the NDP. Furthermore, the bill will regulate the identification and declaration of the National Critical Information Infrastructure and measures to protect the Information Infrastructures.
To further enhance border security and management, the Government has made significant progress in establishing a Border Management Agency. The draft Border Management Agency Bill has been published for public comment in 2015.
In support of the establishment of a resilient anti-corruption mechanism, South Africa is in the process of developing a coherent and holistic anti-corruption policy framework. An Inter-Ministerial Committee on Prevention and Combating of Corruption was established in July 2014 to coordinate and oversee the work of institutions responsible for combating corruption. This role was expanded during 2014/15 to operationalize government’s anti-corruption agenda and make corruption a national priority. In order to curb corruption and misconduct within the police service, the Independent Police Investigative Directorate (IPID) is mandated to investigate allegations of police misconduct and make the necessary recommendations to SAPS, for disciplinary action, or to the National Prosecuting Authority, for prosecution. In 2014/15, SAPS implemented 978 out of the 1,000 recommendations submitted to it by IPID.
The current compilation of an interdepartmental implementation plan of the CJS Seven Point Plan first introduced in 2007 is expected to pull together and concisely define all the efforts towards improving the efficiency of the CJS and implementation of the CJS Seven Point Plan. The implementation of the Seven Point Plan across the value chain is an on-going process including short, medium and longer term activities. Achievements since 2007 include the development of protocols to improve count performance, improvement of CSS processes, such as finger printing, improvement of case flow management, and the development of Judicial Standards and Norms.
23
After the Prevention and Combating of Trafficking in Persons Act (2013) was passed into law, a Trafficking in Persons Inter-Sectoral Task team was established, a national strategic plan for trafficking in persons was finalized and the legislative provisions relating to trafficking have come into operation in August 2015.
A process to establish an integrated and seamless national CJS information system and implement a programme of modernisation of the CJS is underway across participating departments. A number of new or improved departmental systems have been introduced and valuable information has become available to the CJS for monitoring purposes Such as the 28 Key Performance Indicators dashboard, which is used to measure the performance of the CJS using real production data to inform effective decision-making. The indicators include: incident response time, crime scene response time, initial case investigation time, case acceptance rate, investigator case load, repeat suspect rate, case investigation certification time, adjudication time, rate of alternative sentencing utilization among others. Some of the solutions are at pilot stage and once they have been fully rolled out, the efficiency and effectiveness of the criminal justice system is expected to improve.
24
South African Police Service
The NDP vision read together with outcome 3 of the MTSF, on ensuring that all people in South Africa are and feel safe, calls for the demilitarization and professionalization of the police service. In 2014/15, the department’s work was therefore positioned towards the achievement of these objectives.
As part of the SAPS’ ongoing work to professionalize the police service, the following broad interventions were implemented by the department in 2014/15 and are expected to continue over the medium term: establishing relations with research and academic institutions on curriculum development and research areas for the policing sector, including capacitating the department’s research institute; inclusion of the police code of conduct in the department’s disciplinary regulations, performance appraisals and basic training program; conducting marketing campaigns to attract young graduates to the police service; streamlining the process for dealing with disciplinary cases in the department; and launching of the community-based recruitment and selection strategy, which seeks to ensure that communities participate in recruiting police officers from their communities.
Demilitarization of the police service remains one of the department’s key strategic focus areas. With the ever growing number of public protests in South Africa, in 2014/15 the department’s capabilities in ensuring domestic stability amidst the increasing number of violent public protests were strengthened. In this regard, the department provided policing services during public protests within the guidelines that accept the citizens’ right to protest peacefully. Accordingly, of the 14,470 protests in 2014/15, 12,451 were peaceful. In addition to ensuring that all public protests are undertaken peacefully, the department provides policing services during national and international events held in the country as part of its endeavor to ensure domestic stability. Over the last few years, the department has successfully managed and coordinated 83 international, national and local operations, 65 sporting and recreational events, as well as nine Cabinet-approved major events.
Over the medium term, the department will implement the following interventions towards demilitarization of the police service: develop self-discipline and leadership programs for its staff, provide appropriate training and equipment to members to deal with public order policing, re-capacitate the public order policing environment and procure new fit-for-purpose equipment, develop change and transformation programs, and undertake advocacy campaigns regarding the Police Code of Conduct.
25
Justice and Constitutional Development
To ensure that confidence is restored in the justice system and judicial administration is improved, the Constitution Seventeenth Amendment Act (2013) and Superior Courts Act (2013) came into effect and provide for institutional judicial reforms. These Acts affirm the Chief Justice as the head of the judiciary, whose responsibilities include developing court administration policy, norms and standards for the exercise of judicial functions of all courts.
In line with the use of technology in order to improve efficiency, the department continued to implement the electronic funds transfer (ETF) system in courts for maintenance payments. So far, this system has been successfully introduced in 392 courts countrywide, resulting in 98% of maintenance payments being made through the EFT system. This saves the beneficiaries time and transportation costs, as well as reducing the risks of theft in courts. Furthermore, the benefit of using technology in courts is evident in the use of the audio-visual remand (AVR) procedure that links magistrates courts to correctional detention centers via CCTV technology. As at the end of the 2014/15 financial year, 10,019 criminal cases were remanded using AVR systems at 47 magistrates courts and 21 correctional facilities. This has resulted in the reduction of costs and the risks associated with detainees being transported from correctional facilities to courts.
During the 2015/16 financial year, the department tabled the Justice Administered Fund Bill (2015) before Parliament. The aim of the bill is to establish a Justice Administered Fund to regulate the management, control, investment and utilization of money on behalf of third parties, including funds received under maintenance orders and money received as bail. Once the bill becomes law, its implementation is expected to enhance the organizational efficiency and transform justice services by creating a legislative framework for Third Party Funds.
As a result of the implementation of the Promotion of Equality and Prevention of Unfair Discrimination Act (2000), the department designated all the magistrates courts as Equality courts. This has improved access to justice, as the public can lodge complaints of unfair discrimination at the magistrates courts nearest to their community. Between 2013/14 and 2014/15, cases filed in these courts increased from 612 to 844. Of these, hate speech, harassment and unfair discrimination were most common.
Other key legislation that has been passed includes the Protection of Information Act (2014). The aim of the Act is to give effect to the constitutional right to privacy by safeguarding personal information when processed by a responsible party. Furthermore, the Act will regulate the manner in which personal information may be processed, by establishing conditions, in harmony with international standards, that prescribe the minimum threshold requirements for the lawful processing of personal information, provide persons with rights and remedies to protect their personal information from processing that is not in accordance with the Act and to establish measures, including the establishment of an Information Regulator to promote, enforce and fulfil the rights protected by the Act.
Correctional Services
During 2014/15, the Department of Correctional Services (DCS) continued to play a crucial role in steering the administration of correctional services on behalf of the country. In particular, DCS contributed to delivery of a key aim of the MTSF by: (a) increasing the number of offenders who participate in rehabilitation programs; (b) reducing the number of escapes; and (c) increasing the percentage of probationers without violations. Furthermore the department remained committed to placing humane and safe detention at the core of service delivery.
The DCS plans to implement initiatives that include: (a) the Policy on the Provision of Palliative Care in order to provide guidelines on the prevention of palliative care in the department by the different internal and external stakeholders; (b) the Policy on Correctional Sentence Plans and programs for offenders incarcerated for 24 months and less (which is driven by offender statistical profiles showing that re-offending is higher among offenders incarcerated for 24 months and less); and (c) the Policy on Electronic Monitoring (EM), to provide a uniform directive on the placement of persons under EM and to enhance common understanding in the interpretation of the supervision and monitoring prescripts by officials. The electronic monitoring system has already been introduced to help in managing population levels in correctional facilities. The system is also used as a measure of affirming the safety of communities, and reducing recidivism. For the period ending March 31, 2015, 604 persons were tagged. Other strategies
26
implemented to manage overcrowding included: (a) strengthening of diversion programs for alternative sentencing; (b) creating additional bed spaces; (c) improved management of the parole system; (d) successful reintegration of offenders into society; and most importantly (e) the reduction of re-offending by increasing the success of rehabilitation in a participatory, holistic and integrated manner.
To enhance the rehabilitation of offenders the department has increased the number of Further Education and Training (FET) full-time correctional schools from one in 2009 to 14 in 2014. The proportion of offenders who participate in training and further education programs increased from 22.1% in 2013/14 to 85% in 2014/15. Furthermore, there has been an improvement in the percentage of offenders with correctional sentence plans from 64% in 2013/14 to 68.3% in 2014/15.
Correctional spending over the next five years will be focused towards increasing participation in rehabilitation programs and strengthening the system of community corrections, in order to enhance the social functioning and reintegration of offenders into the community in line with the recommendation of the NDP.
International Relations
Having emerged from the international isolation of the apartheid era, South Africa has become a leading international actor. Its principal foreign policy objective is to promote a better South Africa and contribute to the development of a better and safer Africa in a better world.
United Nations
South Africa is one of 51 founding members of the United Nations (UN) in 1945. South Africa was re-admitted to the UN in 1994 following the country’s expulsion by the UN General Assembly in November 12, 1974 as opposition to apartheid at the time. Twelve years after re-admittance, South Africa was elected to serve as a non-permanent member of the UN Security Council during the period 2007-2008, and South Africa began its second term as a non-permanent member of the UN’s Security Council for the period 2011-2012 on January 1, 2011.
South Africa is amongst 14 new countries that were elected to be part of the UN Human Rights Council from 2014 to 2016 on November 12, 2013. The UN Human Rights Council is responsible for strengthening the promotion and protection of human rights around the world. South Africa previously served as a founding member of the Human Rights Council for two consecutive terms from 2006 to 2010. Other countries represented by the 47-member body are, namely: France, Macedonia, Maldives, Mexico, Morocco, Namibia, Britain, China, Russia, Cuba, Saudi Arabia, Algeria and Vietnam.
South Africa remains a member of the UN General Assembly to the 47-Member Economic and Social Council of the United Nations (ECOSOC). ECOSOC is a premier organ of the United Nations responsible for economic and social development matters of the world.
International Monetary Fund
With the first fully democratic national elections in 1994, South Africa regained the full rights and obligations of membership of the IMF and the World Bank and its affiliated agencies.
South Africa is a founding member of the IMF and has always been in good standing with full access to technical and financial assistance from the institution. As at October 30, 2015, South Africa’s quota in the IMF is SDR1,868.5 million (equivalent to US$2,610.1 million); and its 19,422 votes account for 0.77% of the total number of votes. South Africa’s current financial position in the IMF reflects no borrowing from the IMF.
South Africa has committed US$2 billion to strengthen the IMF’s resources at the G20 Leaders Summit in Los Cabos, Mexico in June 2012. The commitment is in addition to South Africa’s existing contributions to the IMF’s quota resources. Also, South Africa is one of 40 participants that have ratified the IMF’s expanded and amended New Arrangements to Borrow (NAB), to which South Africa committed SDR340 million (US$474.9 million). South Africa transferred net loans totalling SDR36.7 million to the NAB as at September 30, 2015.
27
In addition to calls for NAB transfers, South Africa has received separate calls for quota funding from the IMF as a member of the Financial Transactions Plan (FTP) since April 2013. The overall maximum amount of resources that South Africa could be expected to contribute to IMF lending under the FTP is limited to its quota share. South Africa’s quota-based contribution to the IMF consists of Rand resources and promissory notes.
South Africa also contributes funds to the Poverty Reduction and Growth Trust (PGRT), the IMF’s instrument for financial support to low-income countries (LICs). In addition, South Africa contributed its distribution in windfall gold sales profits earmarked by the IMF’s Executive Board for the PGRT, effective October 22, 2013.
World Bank
South Africa is the founding member of the World Bank Group, which comprises the International Bank for Reconstruction and Development (IBRD), the International Development Association (IDA), the International Finance Corporation (IFC) and the Multilateral Investment Guarantee Agency.
Following 2010 governance reforms agreed to by World Bank Governors, South Africa’s voting power in the IBRD stands at 0.83%. South Africa contributed a total of US$27.2 million to the IBRD recapitalization through the General Capital Increase to be paid over six years (2011-2016). The recapitalization was to strengthen the balance sheet of the IBRD as part of the World Bank Group’s response to the global financial crisis.
Cooperation between South Africa and the World Bank is based on a Country Partnership Strategy (CPS). A new CPS is now in place for the period 2014-2017. The implementation of the partnership agreement will be guided by three pillars based on the key objectives of the National Development 2030. Thus it will focus on reducing inequality through the urban program, health and financial exclusion; promoting investments through energy, private investments and environment programmes; and strengthening institutions in basic education and asset, debt and risk management programs. A notable achievement under the previous CPS has been the World Bank’s financing for US$3.75 billion loan of the Medupi power station to produce 4,800 megawatts of dry-cooled coal fired energy.
During the fiscal year 2015, the Multilateral Investment Guarantee Agency (MIGA) provided an $800 million guarantee to Eskom to cover for a risk of the non-payment by the government of South Africa. Eskom plans to use this guarantee to access a syndicated loan from the private investors to continue with its current capital expenditure programme. The period of the guarantee is up to 15 years.
Since its inception, South Africa has been the only African country to participate as a donor in the International Development Association (IDA), the World Bank’s concessional lending window. In 2014, IDA 17 replenishment negotiations were concluded and South Africa pledged a total contribution of R272 million for the 2015-17 lending window.
South Africa joined the private investment arm of the World Bank, the International Finance Corporation (IFC) in 1957—one year after the IFC’s foundation. The total Investments committed by IFC in 2014 for South Africa amounted to US$201 million. Furthermore, South Africa partners with the IFC in delivering technical and advisory assistance to organizations in South Africa and the region, with the aim of reducing poverty through private sector growth.
General Agreement on Tariffs and Trade
South Africa is a founding member of the General Agreement on Tariffs and Trade (GATT), participated in the Uruguay Round of Multilateral Trade Negotiations and acceded to the Marrakesh Agreement that established the World Trade Organization (WTO) in 1994. It is also part of the generalised system of preferences of Canada, the European Union (EU), Japan, Norway, Russia, Switzerland, Turkey and the U.S. In October 1999, South Africa signed an Agreement on Trade, Development and Cooperation, known as the European Trade Agreement, with the EU so as to consolidate strategic links between South Africa and its largest trade and investment partner. South Africa’s bilateral trading relationship with the EU was elevated to a higher level following the commencement of full implementation of the South Africa EU Trade and Development and Cooperation Agreement, which took effect in May 2004.
28
Organization for Economic Cooperation and Development
South Africa enjoys a strong partnership with the Organization for Economic Cooperation and Development (OECD) and participates in numerous programs and committees. Cooperation is most developed in the areas of competition, tax administration, anti-corruption, science and technology innovation, agriculture, tourism, statistics, public debt management and bond market, and economic assessment. South Africa is a signatory to the Convention on Combating Bribery of Foreign Public Officials in International Business Transactions, and mutual acceptance of data. South Africa plays a leading role in the region in the area of tax administration and has played a key role in the establishment of the African Tax Administrators Forum, an initiative aimed at enhancing the capacity and capability of African tax administrators and domestic resource mobilization in general.
Group of 20 (G20)
South Africa is a member of the Group of 20 which has been meeting regularly since 1999 to discuss and collaborate on global economic policy coordination. The G20 brings together the major advanced and emerging market economies, which together represent around 85.0% of global GDP, 75.0% of global trade and two-thirds of the world’s population. As the only permanent African country member in the G20, South Africa often champions development issues specific to emerging market and developing economies (EMDEs). In addition, South Africa continues to engage with African Representatives, the African Union (AU) and the New Partnership for Africa’s Development (Nepad) in the G20.
South Africa is also a member of the Financial Stability Board (FSB), a structure responsible for setting standards and monitoring the progress of financial regulation globally. South Africa is an early adaptor of FSB recommendations to strengthen domestic and global financial regulation.
BRICS
South Africa became a member of BRICS in December 2010 and has participated in all subsequent summits since. On July 15, 2014, at the Sixth BRICS Summit held in Fortaleza, Brazil, BRICS leaders signed the Treaty Establishing the Contingent Reserve Arrangement (CRA), and the Inter-governmental Agreement and Articles of Agreement establishing the New Development Bank (NDB). The CRA will have an initial size of US$100 billion, and each country’s individual commitments to the CRA will be as follows: China (US$41 billion); Brazil, India, and Russia (US$18 billion each); and South Africa (US$5 billion). The NDB shall have an initial authorized capital of US$100 billion. The initial subscribed capital shall be US$50 billion, equally shared among founding members. The first chair of the Board of Governors will be from Russia, the first chair of the Board of Directors from Brazil, and the first President of the Bank from India. The headquarters of the Bank will be located in Shanghai. The New Development Bank Africa Regional Centre shall be established in South Africa concurrently with the headquarters.
Commonwealth
In 1994, South Africa re-joined the Commonwealth, from which it had been obliged to withdraw shortly after it became a Republic in 1961. In the Commonwealth, South Africa’s participation is limited to promoting economic, social and cultural cooperation and enhancing democracy through the Commonwealth Heads of States and Ministers’ meetings.
29
Development Finance Institutions (DFIs)
South Africa has seven national DFIs which are state-owned and which report to their respective National Government shareholder departments. They do so by providing funds related to a variety of development-associated objectives such as job creation, provision of low-cost housing, agricultural development, small and medium enterprise development and industrial and infrastructure development.
DFIs are funded through a mixture of National Government funds, such as grants, guarantees, borrowings and state income. Currently only two DFIs, the Development Bank of Southern Africa (DBSA) and the Industrial Development Corporation (IDC) are permitted to operate and invest outside the borders of South Africa. The DBSA’s mandate was extended to beyond the South African Development Community (SADC) in 2014 through the amendment of the DBSA Act.
The financial position of the DFIs as of March 31, 2015 is as follows:
| | • | | DFIs total assets amounted to R244 billion. |
| | • | | 99.5% (R 243 billion) of these total assets are held by major DFIs: DBSA, IDC, Land Bank, National Empowerment Fund & National Housing Finance Corporation (NHFC). |
| | • | | The DFIs total development resources (development loans and equity) amount to R182 billions. Of these resources, 66% (R120 billion) is channeled towards development lending, and 34% (R62 billion) is in equity investments. |
| | • | | DBSA’s development lending to its total assets is at 80% (R50 billion), Land Bank at 90% (R33.3 billion) and NHFC at 59% (R1.8 billion). |
| | • | | DBSA and Land Bank constitute the highest development lending of all DFIs, 47% (R57 billion) and 31% (R37 billion) respectively. |
| | • | | The resources that IDC deployed to development amount to R80 billion which consists of 72% (R57 billion) of equity investments and 28% (R22 billion) development lending. |
DFIs are governed by, amongst others, the Public Finance Management Act of 1999 (PFMA) and their own individual legislation and regulations. The National Government has emphasized that DFIs need to operate on a financially stable basis and be guided by the National Development Plan and several sectorial government development policies. Currently the Government is in the process of reviewing South Africa’s development finance system in an effort to develop a coordinated approach for government-wide DFI policy.
30
Public Health
South Africa has a well-established health sector and spends approximately 8.5% of its GDP on health care. Private sector facilities are of world class standard while some of the public sector facilities need improvements. There are over 4,000 public health facilities, including approximately 400 hospitals throughout the country. Public sector institutions are expected to be progressively strengthened as the National Health Insurance (NHI) program is implemented. Minister of Health Dr Aaron Motsoaledi, a medical doctor, was appointed in 2009, and subsequently a number of improvements have been achieved in the health sector.
Interventions to strengthen the public sector and improve the quality and the service delivery aspect are underway. The primary health care reengineering program, the tertiary hospitals infrastructure upgrading, the Ideal Clinics initiative and the NHI pilot program are some of these interventions aimed at improving public sector care. The re-engineering strategy rests on four legs: district clinical specialist teams (DCST), the integrated school health program (ISHP), ward-based primary health care outreach teams (WBPHCOT), and contracting and purchasing of services from health professionals (primarily GPs). Other matters under consideration are the alignment of the procurement of medicines by bulk buying to enable cheaper prices and the direct delivery of medicines and medical supplies. Mortality rates have begun to decline— infant mortality has significantly declined from 37 deaths per 1,000 live births in 2010 to 29 in 2013. According to Stats SA’s 2015 mid-year population estimates, life expectancy at birth has now reached 60.6 years for men and 64.3 years for women.
Governance and Oversight
The Department of Health continues to play an active oversight role in the health sector, formulating policies, designing guidelines and monitoring their implementation in both the private and public sectors. Recent policies and guidelines include:
| | • | | The establishment of the Office of Health Standards Compliance as a public entity in 2014/15 to accomplish adherence to norms and standards by all health facilities through inspections and certification of public and private health establishments. |
| | • | | The White Paper on the NHI is at an advanced stage and is expected to be released to the public in the coming months. |
| | • | | The National Strategic Plan for HIV, STIs and TB 2012-2016 was launched in 2012 and significant progress has been made. |
| | • | | The HIV/AIDs treatment guidelines published in December 2014 came into effect in January 2015. According to these guidelines, the threshold for initiation of antiretroviral treatment (ART) was raised from 350 cells/mm3 to 500 cells/mm3. This is in an effort to achieve the UNAIDS 90-90-90 targets by 2030: that 90% of people living with HIV know their status, 90% of those that know their status are initiated on ART and that 90% of those receiving treatment have suppressed viral loads. |
| | • | | In recognition of the emerging non-communicable diseases epidemic in South Africa, the National Department of Health published the Strategic Plan for the Prevention and Control of Non-Communicable Diseases 2013-17. |
Service Delivery
The number of people on ART more than doubled from 1,462,527 in March 2011 to 3,103,902 as March 31, 2015, and the Nurse Initiated Management of Antiretroviral Therapy (NIMART) program was launched which has expanded access to antiretroviral drugs (ARVs).
31
Human Resources for Health
| | • | | The public sector has roughly 309,000 employees and there are over 19,000 employed doctors and over 136,000 nurses. |
| | • | | Health personnel numbers have increased by 80,578 over the past ten years, but have stabilized over the past five years as a result of cost containment measures and budgetary constraints. |
| | • | | In order to address the shortage of human resources in the rollout of ART, the Human Resources for Health Strategy incorporates task shifting (the delegation of tasks performed by physicians to staff with lower-level qualifications). |
Medical products and technologies
| | • | | GeneXpert®, a new molecular test for TB, was introduced in the public sector, and in 2014/15 the TB treatment success rate was 82.5% as compared to 68% five years earlier |
| | • | | Introduction of dual and triple therapy has significantly reduced the mother-to-child HIV transmission rate to 1.5% in 2014/15 and continues to decline; |
| | • | | Pneumococcal and rotavirus vaccines are being offered to all South African children to protect against pneumonia and diarrhea, respectively; |
| | • | | The human papilloma virus (HPV) vaccine was introduced in 2014/15 to protect Grade 4 girls against cancer of the cervix at a later stage in life. In 2014/15, 91.3% of all Grade 4 girls received the first dose of the vaccine; |
| | • | | A new fixed dose combination ARV drug (i.e. patients take a single pill per day instead of several different pills) is being offered in the public health sector with the intention to improve treatment compliance. |
Health Funding
The public sector is tax funded through a progressive taxation system while the private sector patients mainly use medical health insurance with some out of pocket payments. Public health spending was approximately R162 billion in the 2014/15 fiscal year (including the school nutrition program and training of medical professionals), slightly less than private health spending (R167 billion). Evidence-based resource allocation is being implemented in the area of HIV/AIDs with the Investment Case being utilized to guide budget allocation for HIV/AIDs programs in the MTEF.
HIV, AIDS and TB
The socio-economic impact of the HIV and AIDS epidemic on South Africa is significant and the National Government has made the curtailment and treatment of this disease a high priority. This, along with the treatment and prevention of TB, is part of a multi-pronged strategy to improve public health services which also includes hospital revitalization, increasing the numbers of public health workers and the introduction of new-generation child vaccines as well as improved infectious and non-communicable disease control programs.
Stats SA has estimated that, as of June 30, 2015, 6.19 million or 11.2% of the population was living with HIV in South Africa. According to the Human Sciences Research Council (HSRC), HIV incidence (the number of new infections) in the 15-49 age group declined from 2.2% in the period from 2002 to 2005 to 1.9% in the period from 2008 to 2012. An estimated 16.6% of this population is HIV positive. The highest prevalence rates are found in the public sector pre-natal groups. Pre-natal surveys do suggest, however, that national prevalence rates are leveling off, and the rate was estimated at 29.5% in both the 2011 and 2012 surveys. Prevalence rates among antenatal clients in public facilities vary substantially throughout provinces, with KwaZulu-Natal (37.4%) being the highest and Western Cape (16.9%) the lowest, according to the 2012 National Antenatal Sentinel HIV & Syphilis Prevalence Survey in South Africa. Variations also exist within districts in provinces. The HIV incidence rate is declining due to prevention interventions and an increase in access to treatment, which is primarily attributed to a recent increase in the number of facilities providing ART.
32
The primary goal of the HIV/AIDS strategy in South Africa is to meet the 90-90-90 targets, discussed above. Minister Motsoaledi announced the adoption of the UNAIDS 90/90/90 HIV and AIDS targets in 2015. To meet these targets, spending on HIV and AIDS has grown rapidly to approximately R27.4 billion per annum (including foreign donor contributions) in 2014/15, of which R12.3 billion came from the HIV and AIDS conditional grants. By the end of the 2014/15 financial year, approximately 3.1 million people were on ART in South Africa.
HIV/AIDS treatment guidelines were also revised in January 2015. According to the new guidelines all HIV-positive pregnant women can initiate lifetime ART regardless of their CD4 count and all HIV-positive patients are eligible to initiate ART at CD4 count < 500.There is some recent evidence that widespread treatment is beginning to improve national mortality and life expectancy indicators.
Currently all public health facilities offer voluntary counseling and testing services, which is a marked improvement from the 64% rate in 2005. The Health Ministry is also embarking on large scale HIV counseling and testing programme with 9.6 million tests performed in public sector in 2014/15 and over 712 million condoms distributed in 2014/15. In addition, medical male circumcision (MMC) has been proven to reduce risk of infection and more than 1.7 million MMCs have been conducted since the inception of the programme in 2010/11.
The epidemics of TB and HIV are linked, with a 70% co-infection rate in South Africa. The high overall prevalence of HIV in South Africa has thus contributed to an increasing incidence of active TB. South Africa has experienced a steady increase in the number of TB infections. There has also been an increase in Multi Drug Resistant TB (MDR TB) and Extremely Drug Resistant TB (XDR TB), although together these variants constitute less than 1% of TB infections. The recent introduction of GeneXpert® has significantly improved the diagnosis of MDR and XDR TB cases. To combat TB, more resources have been allocated through the Conditional HIV/TB grant commencing in 2016/17.
Child health
National immunization coverage of the core package of vaccines for under one year–olds was 84% in 2013. Provisions have been made for a mass national vaccination campaign to reduce the incidence of measles and to introduce new generation child vaccines to prevent pneumonia and diarrhea. The Department of Health has also introduced a series of interventions to reduce maternal and child morbidity and mortality. Recent progress in preventing mother-to-child HIV transmission (dual and triple prophylaxis) will assist in reducing child mortality. Child nutrition is improving partly due to the availability of social grants (over 15 million South Africans are monthly recipients, mainly children and elderly). The number of children under five years of age diagnosed with severe malnutrition in public facilities has decreased significantly from 64,718 in 2003 to 22,313 in 2013. School feeding schemes are available to all school children at selected primary and secondary schools.
National Health Insurance (NHI)
NHI is one of the ten key priorities of the health sector’s Program of Action. The objective of NHI is to ensure universal health coverage by putting in place necessary financing and health service delivery mechanisms that would enable the creation of an efficient, equitable and sustainable health care system in South Africa. It is expected to be implemented in phases over a 14-year period starting in 2012. The first phase focuses on strengthening the public health sector, particularly the improvement of primary health care services in rural areas and under-served communities. In addition, an expanded program of hospital construction and revitalization has begun. The department is preparing for the establishment of a National Health Insurance Fund (NHIF), which would purchase healthcare services from a mix of public and private providers. It is envisaged that in the early stages NHIF will purchase primary health care services, including HIV and AIDS services. In preparation for the full implementation of NHI, work in pilot districts has already started with fast tracking infrastructure delivery in the pilot districts, setting up district health teams and improving access to medicines through the Central Chronic Medicine Dispensing and Distribution (CCMDD) program. The CCMDD project has been established through public private partnerships to alleviate the burden of service provision in the public sector while improving service delivery. Further, the National Department of Health has initiated a process of developing and testing Diagnosis Related Groups (DRG) as an alternative reimbursement tool for hospitals.
33
In addition, changes have been made to the equitable share formula in order to allow for a more comprehensive health component, including subcomponents for primary health care and hospital utilization. A conditional grant was created in fiscal year 2013/14 to test purchasing reforms in the context of NHI. To date the pilot districts have contracted 256 GPs in the NHI pilot districts. The National Treasury has prepared a discussion document on financing aspects of NHI. The paper will be incorporated into the NHI White Paper that is expected to be released for public comment in the coming months.
Office of Health Standards Compliance (OHSC)
An important reform is the establishment of the OHSC as a public entity in 2014/15. OHSC promotes quality in the health sector by measuring and benchmarking public and private health facilities’ quality and performance against a set of norms and standards. The OHSC will be responsible for ensuring that standards are met in all public and private health facilities in South Africa. The OHSC’s functions include: inspecting and certifying health establishments that comply with prescribed norms and standards, withdrawing certification, investigating complaints relating to the national health system, monitoring indicators of risk as an early warning system relating to serious breaches of norms and standards and reporting any breaches to the Minister, and identifying areas for action by a national or provincial department of health.
HPV vaccine
In response to the growing incidence of cervical cancer in South Africa, the Minister of Health announced that the HPV vaccine (which prevents the virus that causes cervical cancer) would be provided to Grade 4 (9-10 year old) girls in all public and special schools. It is administered in two doses through two campaigns per year. First dose coverage of HPV was 91.3% in the 2014/15 financial year.
South African Health Products Regulatory Authority (SAHPRA)
The Medicines Control Council (MCC) of South Africa is a statutory entity that is responsible for ensuring the medicines on the market are safe, effective and of high quality. It licenses drug manufacturers, assesses new and generic medicine applications and oversees clinical trials. The National Department of Health intends to replace the current MCC with a new public entity called SAHPRA. Plans for this change are already at an advanced stage.
34
The proposed SAHPRA is expected to improve health products regulation in the following key ways:
| | • | | Strengthened in-house evaluation capacity leading to improved medicine registration turn-around times. Currently there is an over-reliance on outside evaluators which slows down the registration process considerably; |
| | • | | Electronic submission and evaluation system will replace the paper-based system; |
| | • | | SAHPRA seeks to utilise harmonization agreements regionally and globally such as agreements with the U.S. FDA and Swissmedic to speed up the registration process; and |
| | • | | SAHPRA also proposes to add complimentary medicines and medical devices including diagnostics to the list of regulated items. |
THE SOUTH AFRICAN ECONOMY
Overview
South Africa has the most developed economy in Sub-Saharan Africa in terms of total GDP, and accounted for almost 21% of the aggregate GDP of Sub-Saharan Africa during 2014 (source: IMF, World Economic Outlook Database, April 2015). Stable economic policies, healthy public finances and resilient financial institutions pursued steadily over the past 20 years have underpinned long-term economic expansion.
South Africa’s economic performance weakened in the first half of 2015 owing to electricity constraints, falling private investment, weak confidence and declining commodity prices. Economic growth is expected to rise gradually over the medium term, reaching 2.8% by 2018. The improving outlook is expected to be supported by easing infrastructure constraints alongside improved confidence and higher demand from major trading partners. To ensure public finances are sustainable whilst still supporting investment and poverty reduction, the Government’s central fiscal objective is to stabilize the growth of debt as a share of GDP, through continued revenue growth and adherence to the planned expenditure ceiling. A long-term fiscal policy guideline has been proposed to link expenditure and GDP growth.
South Africa is resource rich. It is the world’s largest producer of platinum and chromium and holds the world’s largest known reserves of manganese, platinum group metals, chromium, vanadium and alumino-silicates. The economy includes fast growing and sophisticated finance, wholesale and retail trade, catering and accommodation sectors, as well as a developed manufacturing sector. Financial markets are liquid and both equities and government bonds have been actively traded by domestic and international investors. The World Economic Forum Global Competitiveness Report 2015/16 ranks South Africa 12th out of 144 countries for financial market development, whilst the 2015 UNCTAD World Investment Report noted that South Africa was the largest recipient of foreign direct investment in Africa.
South Africa has a robust regulatory environment, openness to trade, a floating exchange rate, a credible inflation targeting regime, developed capital markets and an attractive position as a gateway to Africa. With the most developed industrial and financial capabilities on the African continent, South Africa plays an important role in regional policies, markets, finance and infrastructure. Outwardly oriented South African companies are among the largest sources of foreign direct investment in Africa and the country’s development finance institutions are playing an increasing role in the funding of regional infrastructure investments. According to the UNCTAD’s World Investment Report 2015, South Africa’s outward FDI to the rest of the continent totaled US$6.9 billion in 2014, 4.3% higher than in 2013. In July 2015, BRICS, of which South Africa is a member, launched the New Development Bank (NDB) which will finance infrastructure projects in developing countries. The establishment of this bank will further strengthen economic ties between South Africa, Brazil, Russia, India and China.
The legacy of apartheid era politics and economics is still felt today. The Gini coefficient, which is a measure of economic inequality where 0 indicates no inequality and 1 absolute inequality, was equal to 0.69 for South Africa in 2011, among the highest in the world (South Africa’s 2013 MDG report to UN). The poor are better off in absolute terms under South Africa’s new constitutional dispensation, thanks in large part to government’s social spending. The World Bank’s fiscal incidence study (2014) estimates that South Africa’s fiscal policy reduces the Gini coefficient by almost a quarter. However, income inequality remains high even after progressive fiscal policy, due to high unemployment.
35
Unemployment, and youth unemployment in particular, remains a critical challenge. Only 43.8% of the adult population (ages 15 to 64) works either in the formal or informal sector. Although formal sector non-agricultural employment surpassed the levels of employment last seen prior to the global financial crisis of 2008, gains have not kept pace with the growth of the working age population, leaving a structural employment backlog. Youth unemployment is particularly high: currently the unemployment rate for 15-34 year olds is nearly 65%, with young people below the age of 25 accounting for nearly 25% of the unemployed.
Patterns of unemployment reflect the effects of the apartheid system on income, settlements and education: as of September 30, 2015, unemployment among the economically active white population was 5.9%, whereas the unemployment rate among the economically active black population was 28.8%. Unemployment is higher for the less educated, women and individuals from more rural provinces. The impact of slowing economic growth on employment has been felt by these vulnerable groups more: between September 2008 and September 2015, the unemployment rate of black South Africans between the ages of 15 and 64 increased from 27.4% to 28.8%, even as the labor force participation rate fell (59.6% in March 2008 to 58.8% as at September 30, 2015).
South Africa needs to achieve higher levels of inclusive growth that raises employment and reduces inequality. The NDP 2030 outlines a set of structural reforms to eliminate poverty, raise growth and enhance competitiveness over the long term. It was widely canvassed and endorsed by the South African public prior to its adoption by Cabinet in September 2012. The plan aims to reduce the costs of living and of doing business, resulting in improved consumer and business confidence, rising levels of private investment, and higher growth and employment.
Implementing the National Development Plan 2030: the Medium-Term Strategic Framework
The Government’s MTSF provides the first five-year policy framework to bring the 2030 vision of the NDP into reality. The MTSF aims to improve policy coherence, alignment and coordination across government. It identifies employment, education and enhancing the capacity of the state as core policy objectives. It highlights the need for partnerships between a capable developmental state, a thriving business sector and a strong civil society. Importantly, the priorities of the five-year MTSF are financed within the prevailing three-year medium-term expenditure framework.
MTSF priorities for structural reform include:
| | • | | Building the capacity of the public sector, particularly at local government level, through the “back-to-basics” approach, focused on improving service delivery, accountability and financial management. |
| | • | | Reshaping South Africa’s urban environment through integrated spatial planning and an expansion of the municipal debt market. |
| | • | | Improving the quality of the education system, starting with greater attention to human resources management and annual assessment of learners to benchmark progress. |
| | • | | Enhancing dispute-resolution mechanisms in industrial relations. |
| | • | | Strengthening competition policy. |
| | • | | Enacting immigration reform to enable people with skills to work in South Africa more easily. |
As the MTSF points out, achieving a higher developmental trajectory and building a more equitable society will require a strong social compact. Government, business and labor need to work together to improve public services, revive investment and boost growth. Therefore there is a need to encourage greater private sector investment and to improve the state’s capacity to monitor, implement and manage projects.
The continued implementation of the NDP through the MTSF lays out the basis for the much-needed economic and policy reforms to establish a platform for faster growth. Government has prioritized the reduction of constraints to growth by improving electricity supply, reforming the governance of state-owned entities, improving labor relations, and improving policy coordination, certainty and
36
implementation. Efforts to boost investment in infrastructure to relieve bottlenecks (particularly in electricity, ports and telecommunication) and encourage greater investment in cities continue, with more than R800 billion (US$60 billion) in investment spending planned over the medium term. The government is promoting regional infrastructure and cooperation, and promoting black ownership of productive industrial assets, as well as reviewing the incentives that government is providing to support business.
Constrained electricity supply remains the single largest drag on economic activity, estimated by the government to cost close to one percentage point of annual GDP growth. For the nine months ended September 30, 2015, progress has been made in stabilising electricity supply, promoting measures to manage demand and contracting additional supply from the private sector. The first unit of the Medupi power station was fully commissioned in August 2015, adding 794 MW to the national grid. Once the Koeberg power station returns from planned maintenance in December 2015, there will be an expected additional 900 MW available to the grid. The Sere wind farm added 100 MW of capacity in February 2015. The Majuba plant has been returned to service and work to repair the damaged boiler at the Duvha plant is in progress. Eskom has been taking steps to improve the efficiency of its maintenance program.
The Government encourages private sector investment through the active promotion of private-public partnerships, particularly to bolster energy supply through the Renewable Energy program. Other reforms include the establishment of investment agencies, continued relaxation of exchange controls, and the Presidential Business Working Group, which creates a platform for engagement to tackle practical obstacles to investment. South Africa has undertaken a number of reforms to position itself as a hub for investments into the rest of Africa, including the introduction of the Holding Company Regime, which provides flexibility to South African companies seeking to expand and grow into the rest of Africa, and the International Headquarter Company regime, which enables offshore firms to leverage South Africa’s infrastructure to invest in the rest of the continent. Foreign currency reforms encourage African listings and investments into Africa, to reduce the cost of doing business and promote intra-Africa investment.
To support investment by state–owned entities (SOEs), a new funding framework to distinguish between commercial and developmental mandates and more regular financial reporting to government has been proposed. Funding in the medium term will be contingent on restructuring and strong government oversight. Capital investment will have to be financed through sale of non-strategic state assets.
Public service delivery outcomes are expected to be bolstered by efforts to tackle corruption. Financial accounting and control systems are being strengthened. The National Treasury, working with the Department of Planning, Monitoring and Evaluation in the Presidency, intends to make greater use of expenditure reviews and evaluations in the allocation of resources. Procurement reforms have already begun to make tender awards more transparent and less susceptible to corruption, and are expected to achieve savings. The Office of the Chief Procurement Officer has been established to centralise oversight of public procurement. Local service delivery is being supported by reforming the local grant system, as well as providing national government support to municipalities through project preparation facilities to help municipalities prepare plans that are ready for implementation and the infrastructure delivery management system from provinces to large cities.
GDP
Following the financial crisis (which induced a 1.5% contraction in real GDP growth in 2009), GDP growth rebounded to over 3% in 2010 and 2011. However, growth subsequently decelerated to 2.2% in 2012 and 2013, and softened further to 1.5% in 2014. Real GDP growth averaged 3.3% between 1994 and 2011, and 5.2% between 2004 and 2007.
The economy grew 1.8% in the first half of 2015 as drought conditions stifled agricultural output and electricity supply constraints weighed on mining and manufacturing output. These factors outweighed a recovery in demand from advanced economy trading partners. Structural rigidities such as electricity supply challenges, skills shortages and transport constraints have limited the upside to growth afforded by improving external demand and a weaker currency.
37
After slowing from 4.9% in 2011 to 1.4% in 2014, household consumption growth improved to 1.6% in the first half of 2015 as lower inflation boosted real disposable income growth, countering the impact of elevated debt levels, higher interest rates, and low employment and credit growth.
Private sector investment contracted 3.4% in 2014, its first contraction since the onset of the financial crisis, and has remained subdued in the first half of 2015, contracting by 0.1%. Low growth has reduced business confidence. At the same time, public sector gross fixed-capital formation remains comparatively resilient, growing 3.3% during the first half of 2015, as strong infrastructure spending by general government offset moderating growth in state-owned companies’ investment.
Strong growth in exports buoyed GDP growth in the first half of 2015, with exports growing 9.7% from 2.6% in 2014 on the back of improving export demand from Europe, Japan and Australasia as well as the effects of the Rand depreciation. Combined with relatively slower growth in imports and improving terms of trade, the current account deficit narrowed to 3.9% of GDP in the first half of 2015 from 5.4% in 2014.
The primary and secondary sectors weighed on growth in the first half of 2015. Severe drought conditions impacted field crops and horticultural products markedly. Drought conditions are expected to continue into 2016. Growth in the mining sector improved to 5.8% in the first half of 2015, as platinum group metal production rebounded from the impact of crippling strikes in 2014.
Electricity supply constraints continued to dampen the manufacturing sector, which grew 0.1% in 2015 following stagnation in 2014. Lower production output of petrochemicals and iron and steel products offset an improvement in the automotive sector. Growth in the construction sector bore the brunt of declining sentiment and worsening building activity, moderating to 1.9% in the first half of 2015 following a five-year high growth rate of 2.9% in 2014. Growth in the tertiary industries continued to slow, despite improved growth in the financial, real estate and business services sector.
In its 2015 MTBPS, the National Treasury forecasts real GDP to grow by 1.5% in 2015—the same rate recorded for 2014—and 1.7% in 2016. Electricity supply is expected to remain a binding constraint through 2016, limiting output and dampening business and consumer confidence. Easing electricity, transport and telecommunications infrastructure constraints, alongside improved confidence and higher demand from major trading partners, are expected to boost GDP growth to 2.8% in 2018.
External risks to this forecast include a further slowdown in the global economy (especially among South Africa’s main trading partners), higher oil prices, lower export commodity prices and increased financial market volatility resulting in capital outflows. Electricity supply shortages pose the largest domestic risk to growth. South Africa’s longer-term economic prospects will hinge how successful interventions to boost growth are coordinated and implemented as per the MTSF.
The 2015 MTBPS communicates the Government’s central fiscal objective over the medium term of stabilising the growth of public debt as a share of GDP, so as not to hamper expenditure towards key economic and social objectives. It further proposes a long-term fiscal policy guideline linking public expenditure and GDP growth. Public expenditure on non-essential goods and services will continue to decline in real terms.
Interventions to alleviate the constraints to growth include:
| | • | | Augmenting energy supply capacity via private sector investment, as well as public and private partnerships in renewable energy. |
| | • | | Policy certainty and coordination is expected to be bolstered by the work of the Department of Planning Monitoring and Evaluation in The Presidency. In addition, to promote greater policy coordination and curb implementation risks or unintended consequences, all future legislation and regulations as from September 1, 2015 will be subject to a socio-economic impact assessment prior to being passed. |
| | • | | The Government has prioritised stability in labor relations. In 2014, labor-related work stoppages reduced growth by at least 0.6%. The Commission for Conciliation, Mediation and Arbitration is taking an active role in settling disputes, and has cut the duration of arbitration proceedings by more than 75% since 2003. A National Economic Development and Labour Council task team is working to address the disruption of the economy caused by large, protracted strikes, and discussing a minimum wage. In September 2015, parties to the mining framework agreement declared their intention to limit job losses. |
38
These efforts will be complemented by critical longer-term structural reforms, which include:
| | • | | Continued investment in water, electricity, rail and telecommunications infrastructure to increase electricity generation capacity, lower logistics costs and improve competitiveness. |
| | • | | Reforms of state-owned companies. |
| | • | | Promotion of greater regional integration, particularly in Southern Africa as well as the rest of the African continent, so as to remove impediments to regional growth and bolster trade in goods and services. |
| | • | | Supporting business through varying business support incentives offered by government, while also committing to review these incentives to adequately assess their impacts on economic growth, productivity, competitiveness, trade and employment. |
The following tables show nominal and real GDP and expenditures for the periods indicated.
GDP Summary
| | | | | | | | | | | | | | | | | | | | | | | | |
| | | As of and for the year ended December 31, | | | As of and for the
six-month period
ended June 30, | |
| | | 2010 | | | 2011 | | | 2012 | | | 2013 | | | 2014 | | | 2015(1) | |
Nominal GDP (millions of Rand) at market prices | | | 2,748,008 | | | | 3,024,950 | | | | 3,262,542 | | | | 3,534,326 | | | | 3,796,462 | | | | 3,942,919 | |
Real GDP (millions of Rand) at 2010 prices | | | 2,748,008 | | | | 2,836,286 | | | | 2,899,248 | | | | 2,963,389 | | | | 3,008,576 | | | | 3,045,469 | |
Real GDP Growth (percentages) | | | 3.0 | | | | 3.2 | | | | 2.2 | | | | 2.2 | | | | 1.5 | | | | 1.8 | |
Population (million) | | | 50.0 | | | | 50.6 | | | | n/a | | | | 53.0 | | | | 54.0 | | | | 55.0 | |
Per Capita GDP (nominal) | | | 53,823 | | | | 58,584 | | | | 62,463 | | | | 66,845 | | | | 70,898 | | | | n/a | |
Per Capita GDP (real) | | | 53,823 | | | | 54,930 | | | | 55,508 | | | | 56,047 | | | | 56,185 | | | | n/a | |
Note:
| (1) | First half of 2015, seasonally adjusted and annualized. |
Sources: SARB and Stats SA
| | | | | | | | | | | | | | | | | | | | | | | | |
| | | As of and for the year ended December 31, | | | As of and for the
six-month period ended
June 30, | |
| | | 2010 | | | 2011 | | | 2012 | | | 2013 | | | 2014 | | | 2015(3) | |
Rand (million) | | | | | | | | | | | | | | | | | | | | |
Real GDP at market prices | | | 2,748,008 | | | | 2,836,286 | | | | 2,899,248 | | | | 2,963,389 | | | | 3,008,576 | | | | 3,045,469 | |
Add: Imports of goods and services | | | 752,233 | | | | 831,476 | | | | 881,760 | | | | 897,806 | | | | 893,100 | | | | 936,702 | |
Total supply of goods and services | | | 3,500,241 | | | | 3,667,762 | | | | 3,781,008 | | | | 3,861,195 | | | | 3,901,676 | | | | 3,982,170 | |
Less: Exports of goods and services | | | 786,349 | | | | 820,508 | | | | 821,414 | | | | 859,079 | | | | 881,504 | | | | 954,808 | |
Total goods and services available for domestic expenditure | | | 2,713,892 | | | | 2,847,254 | | | | 2,959,594 | | | | 3,002,116 | | | | 3,020,172 | | | | 3,027,362 | |
Domestic Expenditure | | | | | | | | | | | | | | | | | | | | |
Final consumption expenditure by households | | | 1,621,836 | | | | 1,701,007 | | | | 1,758,568 | | | | 1,809,592 | | | | 1,834,136 | | | | 1,857,394 | |
Final consumption expenditure by general government(1) | | | 555,912 | | | | 565,451 | | | | 584,766 | | | | 603,920 | | | | 615,567 | | | | 615,939 | |
39
| | | | | | | | | | | | | | | | | | | | | | | | |
| | | As of and for the year ended December 31, | | | As of and for the
six-month period ended
June 30, | |
| | | 2010 | | | 2011 | | | 2012 | | | 2013 | | | 2014 | | | 2015(3) | |
Total Final consumption expenditure | | | 2,177,748 | | | | 2,266,458 | | | | 2,343,334 | | | | 2,413,512 | | | | 2,449,703 | | | | 2,473,333 | |
Gross fixed capital formation | | | 529,431 | | | | 559,738 | | | | 579,916 | | | | 624,127 | | | | 621,715 | | | | 627,932 | |
Change in inventories | | | 6,787 | | | | 26,345 | | | | 36,623 | | | | 1,890 | | | | 396 | | | | -15,046 | |
Residual item(2) | | | -74 | | | | -5,287 | | | | -279 | | | | -37,413 | | | | -51,642 | | | | -58,855 | |
Total gross domestic expenditure | | | 2,713,892 | | | | 2,847,254 | | | | 2,959,594 | | | | 3,002,116 | | | | 3,020,172 | | | | 3,027,364 | |
Real GDP (at 2010 prices) | | | 2,748,008 | | | | 2,836,286 | | | | 2,899,248 | | | | 2,963,389 | | | | 3,008,576 | | | | 3,045,469 | |
Notes:—
| (1) | Consumption expenditure by general government includes current expenditure on salaries and wages and on goods and other services of a non-capital nature of the general departments (not business enterprises) of the National Government authorities, provincial government authorities, local government authorities and extra-budgetary institutions. |
| (2) | Represents the difference between the calculation of GDP according to the expenditure and production method. |
| (3) | First half of 2015, seasonally adjusted and annualized. |
Source: SARB and Stats SA.
GDP and Expenditures as Percentage of Real GDP (at constant 2010 prices)
| | | | | | | | | | | | | | | | | | | | | | | | |
| | | As of and for the year ended December 31, | | | As of and for the
six-month period
ended June 30, | |
| | | 2010 | | | 2011 | | | 2012 | | | 2013 | | | 2014 | | | 2015(3) | |
Real GDP at market prices | | | 100 | | | | 100 | | | | 100 | | | | 100 | | | | 100 | | | | 100 | |
Add: Imports of goods and services | | | 27.4 | | | | 29.3 | | | | 30.4 | | | | 30.3 | | | | 29.7 | | | | 30.8 | |
Total supply of goods and services | | | 127.4 | | | | 129.3 | | | | 130.4 | | | | 130.3 | | | | 129.7 | | | | 130.8 | |
Less: Exports of goods and services | | | 28.6 | | | | 28.9 | | | | 28.3 | | | | 29.0 | | | | 29.3 | | | | 31.4 | |
Total goods and services available for domestic expenditure | | | 98.8 | | | | 100.4 | | | | 102.1 | | | | 101.3 | | | | 100.4 | | | | 99.4 | |
Domestic Expenditure | | | | | | | | | | | | | | | | | | | | | | | | |
Final consumption expenditure by households | | | 59.0 | | | | 60.0 | | | | 60.7 | | | | 61.1 | | | | 61.0 | | | | 61.0 | |
Final consumption expenditure by general government(1) | | | 20.2 | | | | 19.9 | | | | 20.2 | | | | 20.4 | | | | 20.5 | | | | 20.2 | |
Total Final consumption expenditure | | | 79.2 | | | | 79.9 | | | | 80.8 | | | | 81.4 | | | | 81.4 | | | | 81.2 | |
Gross fixed capital formation | | | 19.3 | | | | 19.7 | | | | 20.0 | | | | 21.1 | | | | 20.7 | | | | 20.6 | |
Change in inventories | | | 0.2 | | | | 0.9 | | | | 1.3 | | | | 0.1 | | | | 0.0 | | | | -0.5 | |
Residual item(2) | | | -0.0 | | | | -0.2 | | | | -0.0 | | | | -1.3 | | | | -1.7 | | | | -1.9 | |
Total gross domestic expenditure | | | 98.8 | | | | 100.4 | | | | 102.1 | | | | 101.3 | | | | 100.4 | | | | 99.4 | |
Notes: —
| (1) | Consumption expenditure by general government includes current expenditure on salaries and wages and on goods and other services of a non-capital nature of the general departments (not business enterprises) of public authorities. Public authorities include National Government authorities, provincial government authorities, local government authorities and extra-budgetary institutions. |
| (2) | Represents the difference between the calculation of GDP according to the expenditure and production methods. |
| (3) | First half of 2015, seasonally adjusted and annualized. |
Sources: SARB and Stats SA
Gross Domestic Expenditure (GDE)
Following the global financial crisis, average annual growth in GDE slowed from an average annual rate of 5.4% between 2000 and 2007 to 2.9% between 2010 and 2014. GDE reached just 0.7% in the first half of 2015, weighed by slowing investment and household consumption growth. Slowing disposable income and credit growth, weak consumer confidence and lacklustre employment growth dampened household spending growth. After having provided countercyclical support to the economy during the financial crisis, growth in government consumption slowed to 1.9% in 2014, a third of its peak of 5.8% in 2008, and 0.4% in the first half of 2015. Growth momentum in gross fixed capital formation, after having steadily risen between 2010 and 2013, fell as private sector investment contracted.
40
Household expenditure made up 61% of real GDP in the first half of 2015, matching levels of the preceding three years. Seasonally adjusted and annualized growth in real household disposable income averaged 1.9% in the first half of 2015 after growing 1.5% in 2014 as a whole, driven by inflation (in turn driven by weaker oil prices) and steady growth in employee compensation.
The overall recovery in household expenditure in 2015 was not uniform across spending categories. Growth in household spending on durable goods continued to slow down from the very high levels of 16.5% in 2010 (this highly cyclical category of spending coming off a very low base of a 15.1% contraction in 2009), to low single-digit growth of 5.3% in 2014 and 3.1% in the first half of 2015, weighed in particular by falling vehicle sales. New motor vehicle sales are down 4.5% in the year to October 2015, with slowing installment sales credit, the exchange rate related rise in prices and weak consumer confidence contributing to this slowdown. Growth in real expenditure on non-durable goods benefited from lower-than-expected food and fuel inflation, rebounding to 1.2% after having declined to a five-year low of 0.8% in 2014.
Semi-durable goods expenditure grew 3% in the first half of 2015 from 3.2% in 2014, supported by competitive pricing of clothing and footwear. Real expenditure by households on services registered a broad-based improvement to 1.3% in the first half of 2015 following growth slowing to 0.5% in 2014.
Growth in credit extension to households averaged 3.6% over the first nine months of 2015, from an average of 4.3% in 2014, despite improving growth of household mortgages and unsecured personal loans. Growth in unsecured personal loans to households improved to an average 4.5% in the first nine months of 2015 from an average of 3.0% in 2014. Growth remains well below its peak growth rate of 35.5% in 2011, as the market has adjusted to lower growth and employment prospects, as well as regulatory changes. Mortgages extended to households continued to grow albeit slowly, at an average of 2.8% over the first nine months of 2015 from an average of 2.4% in 2014. Installment sales credit growth has continued to soften, retreating to single digit growth of 4.8% over the first nine months of 2015 from 9.8% in 2014. Persistently high debt levels, rising interest rates and moderating real disposable income growth are anticipated to limit household credit growth going forward.
The ratio of household debt to disposable income remains rooted around the 78% mark over the preceding six quarters, but below the record peak of 88.8% in the first quarter of 2008. The household debt ratio improved somewhat to 77.8% in the second quarter of 2015 from 78.3% in 2014. Debt service costs amounted to 9.4% of disposable income in the first half of 2015, up from 9.1% in 2014, in line with rising policy rates beginning in January 2014. They remain lower than the peak of 14.4% in 2008.
The implementation of the published regulations on the Removal of Adverse Consumer Credit Information and Information Relating to Paid Up Judgments resulted in the proportion of credit-active consumers with adverse listings falling from 15.4% in the fourth quarter of 2013 to 0% in the first quarter of 2014. This contributed to the overall share of credit-active consumers with impaired credit records decreasing to 44.2% in the first quarter of 2014 from 48.1% in the final quarter of 2013. However, measures of consumer creditworthiness have subsequently normalized. The share of consumers with impaired credit records reached 45.1% in the second quarter of 2015, slightly above pre-amnesty levels, and the share of consumers with adverse listings reaching 13.5%, slightly below pre-amnesty levels.
The household gross saving ratio has remained at 0.2% of GDP since the third quarter of 2014, with growth of nominal disposable income and household consumption expenditure moving more or less in tandem over the period. On a net basis, taking into account depreciation, household savings were negative at -2.3% of disposable income in the first half of 2015. Households have been dissaving since 2006.
Real gross fixed capital formation comprised 20.4% of GDP in the second half of 2015, with this ratio continuing on a modest upward trajectory after dipping to 18.7% in 2011. It remains below the peak of 23.5% in 2008 but above the average of the 1990s of 17.5%. Growth in gross fixed capital formation has varied notably since the onset of the financial crisis, ranging from as low as -6.7% in 2009 to as high as 7.6% in 2013. Growth has averaged 1% between 2009 and 2015, from an average growth rate of 9.2% per year between 2000 and 2008. The moderation was due to reduced private sector investment growth and a slowdown in public sector growth from rates that were elevated in the build-up to the 2010 World Cup. Private sector investment constitutes around 63% of total investment spending in real terms.
41
Following a contraction of 3.4% in 2014, private sector investment contracted 0.1% in the first half of 2015. After having contracted by 0.5% in 2014 in the midst of crippling strike activity, growth in manufacturing investment rebounded to 3.2% in the first half of 2015. Conversely, mining investment contracted 2.0% in the first half of 2015 after rising 1.9% in 2014, against a backdrop of lower global commodity prices and weaker demand from China. Investment in the utilities sector contracted a sharp 7.9% in the first half of 2015 following a 6.1% contraction in 2014, as build delays at Eskom offset the sharp rise in private electricity investment expenditure as part of the Renewable Energy Independent Power Producer Procurement Program.
Public sector investment grew 3.3% in the first half of 2015 from 5.4% in 2014 as spending by general government rose 6.4% in the first half of 2015 from 10.3% in 2014. Investment by state-owned enterprises grew 0.6% in the first half of 2015, after growing by 1.6% in 2014 as a whole. The community, social and personal services sector also saw investment growth ease to 5.5% in the first half of 2015 from 10.9% in 2014, in line with the broader slowing in public sector investment.
Aggregate inventory investment declined notably by R38.9 billion in the second quarter of 2015, subtracting 6.2 percentage points to second quarter GDP. Falling inventories were prominent in the mining (particularly platinum) and manufacturing (reflecting falling crude oil imports) sectors, as stockpiles were drawn down to meet demand. The ratio of industrial and commercial inventories to GDP averaged 13.8% in the first half of 2015, largely unchanged from 2013 and 2014 levels of 14.0%, but well below the recent peak of 15.8% in 2007.
Government expenditure growth moderated to 0.4% in the first half of 2015 from 3.3% and 1.9% in 2013 and 2014, respectively. Slowing government consumption followed resignations en masse by civil servants when the Government announced its intention to introduce regulations to compel the mandatory preservation of pension and provident funds accumulate by state employees. The regulations were misunderstood by the public to be restricting all access for members to retirement savings.
National Treasury anticipates growth in real government expenditure to rise to 1.6% in 2016 before tapering to 1.1% in 2018, in line with the Government’s efforts to curb spending on non-essential goods and services. Real consumption expenditure by general government increased at a strong average annual rate of 4.8% between 2001 and 2009, resulting in public sector spending as a proportion of GDP rising from an average of 22.5% in 2001 to 27.7% in 2009. Public consumption growth in excess of GDP growth saw this ratio once again rise to 27.2% in the first half of 2015, after having moderated to 26.5% in 2012.
Annual growth in total nominal factor income rose from 4.2% in the first quarter of 2015 to 4.8% in the second quarter, as growth in gross operating surpluses improved. Growth in the total compensation of employees decelerated from 7.7% in the first quarter of 2015 to 7.5% in the second quarter, with moderating compensation growth in the trade, finance, real estate and business services sectors offsetting the acceleration in compensation in general government. The share of total remuneration of employees to total factor income rose slightly from 52.8% in the first quarter of 2015 to 53.0% in the second quarter. Compensation growth remains comparatively constrained, off the double-digit average growth rate of 10.5% in the 2000s and the peak of 13.9% in 2007.
Annual growth in aggregate gross operating surplus accelerated to 2.1% in the second quarter of 2015 from 0.5% in the first quarter. This improvement stemmed largely from improving gross operating surpluses in the construction and finance, real estate and business services sectors that offset weak or declining gross operating surpluses in other industries. The share of gross operating surplus to total factor income declined slightly from 47.2% in the first quarter of 2015 to 47.0% in the second quarter. Growth in gross operating surpluses remains under pressure, averaging 7.1% between 2010 and 2014 from averaging 13.1% in the 2000s.
42
Principal Sectors of the Economy
The following two tables set forth real gross value added and the percentage increase in gross value added for the periods indicated.
Real Gross Value Added by Sector
(at constant 2010 prices)
| | | | | | | | | | | | | | | | | | | | | | | | | | | | |
| | | As of and for the year ended December 31, | | | Percentage
contribution | |
| | | 2010 | | | 2011 | | | 2012 | | | 2013 | | | 2014 | | | 2015(1) | | | in 2015(1) | |
Agriculture, forestry and fishing | | | 65,605 | | | | 66,464 | | | | 66,861 | | | | 67,880 | | | | 71,659 | | | | 68,798 | | | | 2.5 | |
Mining and quarrying | | | 230,350 | | | | 228,645 | | | | 221,972 | | | | 230,908 | | | | 227,260 | | | | 237,642 | | | | 8.6 | |
Manufacturing | | | 358,699 | | | | 369,261 | | | | 376,126 | | | | 378,933 | | | | 379,089 | | | | 378,750 | | | | 13.7 | |
Electricity, gas and water | | | 67,940 | | | | 68,879 | | | | 68,801 | | | | 68,375 | | | | 67,765 | | | | 67,565 | | | | 2.4 | |
Construction | | | 95,453 | | | | 95,809 | | | | 97,804 | | | | 100,468 | | | | 103,358 | | | | 104,702 | | | | 3.8 | |
Wholesale and retail trade, catering and accommodation | | | 370,581 | | | | 384,768 | | | | 398,585 | | | | 405,983 | | | | 411,083 | | | | 413,515 | | | | 15.0 | |
Transport, storage and communication | | | 229,499 | | | | 236,439 | | | | 242,233 | | | | 247,062 | | | | 252,648 | | | | 256,076 | | | | 9.3 | |
Finance, insurance, real estate & business services | | | 523,526 | | | | 544,997 | | | | 561,079 | | | | 578,127 | | | | 591,019 | | | | 604,667 | | | | 21.9 | |
General government services | | | 404,647 | | | | 422,695 | | | | 437,734 | | | | 451,214 | | | | 464,911 | | | | 467,719 | | | | 16.9 | |
Personal services | | | 148,561 | | | | 152,163 | | | | 155,295 | | | | 158,167 | | | | 160,411 | | | | 161,703 | | | | 5.9 | |
Gross value added at basic prices | | | 2,494,860 | | | | 2,570,121 | | | | 2,626,489 | | | | 2,687,117 | | | | 2,729,203 | | | | 2,761,137 | | | | 100.0 | |
Note:—
| (1) | The seasonally adjusted first half of 2015 |
Source: Stats SA.
Percentage Growth in Real Gross Value Added by Sector
(at constant 2010 prices)
| | | | | | | | | | | | | | | | | | | | | | | | |
| | | For the year ended December 31, | | | As of and for the
six-month period
ended June 30, | |
| | | 2010 | | | 2011 | | | 2012 | | | 2013 | | | 2014 | | | 2015 (1) | |
Agriculture, forestry and fishing | | | -0.3 | | | | 1.3 | | | | 0.6 | | | | 1.5 | | | | 5.6 | | | | -2.1 | |
Mining and quarrying | | | 5.3 | | | | -0.7 | | | | -2.9 | | | | 4.0 | | | | -1.6 | | | | 5.8 | |
Manufacturing | | | 5.9 | | | | 2.9 | | | | 1.9 | | | | 0.7 | | | | 0.0 | | | | 0.1 | |
Electricity, gas and water | | | 2.4 | | | | 1.4 | | | | -0.1 | | | | -0.6 | | | | -0.9 | | | | -0.4 | |
Construction | | | 0.7 | | | | 0.4 | | | | 2.1 | | | | 2.7 | | | | 2.9 | | | | 1.9 | |
Wholesale and retail trade, catering and accommodation | | | 4.4 | | | | 3.8 | | | | 3.6 | | | | 1.9 | | | | 1.3 | | | | 1.0 | |
Transport, storage and communication | | | 1.7 | | | | 3.0 | | | | 2.5 | | | | 2.0 | | | | 2.3 | | | | 2.1 | |
Finance, insurance, real estate & business services | | | 1.2 | | | | 4.1 | | | | 3.0 | | | | 3.0 | | | | 2.2 | | | | 2.9 | |
General government services | | | 2.7 | | | | 4.5 | | | | 3.6 | | | | 3.1 | | | | 3.0 | | | | 1.2 | |
Personal services | | | 0.4 | | | | 2.4 | | | | 2.1 | | | | 1.8 | | | | 1.4 | | | | 1.1 | |
Gross value added at basic prices | | | 2.9 | | | | 3.0 | | | | 2.2 | | | | 2.3 | | | | 1.6 | | | | 1.7 | |
Note:—
| (1) | The seasonally adjusted first half of 2015 compared to the first half of 2014. |
Source: Stats SA.
43
Finance, Insurance, Real Estate and Business Services
The finance, insurance, real estate and business services sector includes all monetary, financial and insurance institutions and retirement funds, as well as real estate, law, accounting, auditing, data processing and other business services, such as labor brokers. Also included in this sector are renting and leasing of agricultural, mining, manufacturing, construction, office and other machinery and equipment. This sector is the largest in the South African economy by GVA, accounting for 20% of the total economy.
This sector is the largest in the South African economy by GVA, accounting for 20% of the total economy.
Real value added by the finance, insurance, real estate and business services sector grew 2.9% in the first half of 2015 compared to 2.4% in the first half of 2014 and 2.2% for 2014 as a whole. The sector’s contribution to growth in overall gross domestic production accordingly rose from 0.5% in 2014 to 0.7% in the first half of 2015.
According to the Quarterly Employment Statistics (QES) surveys published by Stats SA, which surveys enterprises registered for income tax, the finance, insurance, real estate and business services sectors employed 1,987,000 persons in the quarter ended December 2014 and 1,985,000 persons in the second quarter of 2015—roughly 22% of the total workforce.
South Africa has a well-developed financial services sector—one of the largest among emerging market economies—with sophisticated banking, bond and insurance markets which have been key strengths in the country’s economic development. The World Economic Forum Global Competitiveness Report 2015 ranks South Africa 12th overall out of 144 countries for financial market development. This high ranking is underpinned by South Africa ranking second in respect of regulation of securities exchanges and legal rights, sixth for the availability of financial services and financing through local equity market and eighth for soundness of the banks.
The financial services sector is highly concentrated, with four banks (Barclays Africa Group Limited, The Standard Bank of South Africa Limited, FirstRand Bank Limited and Nedbank Limited), and three insurance companies (Sanlam Limited, Old Mutual South Africa Limited and Liberty Life Limited), dominating the financial services and insurance industry. See “Monetary and Financial System—Structure of the Banking Industry.”
South African banks are well regulated, have sophisticated liquidity management systems, and limited reliance on funding in foreign currency. South African regulators have tended to be conservative, maintaining capital adequacy ratios in excess of global standards such as Basel 2.5 and Basel III. The banking sector remained adequately capitalized at 14.3% as of September 30, 2015, despite the implementation of the higher capital requirements of the Basel III framework from January 2013. The sector’s common equity Tier 1 (CET1) capital-adequacy ratio was 11.1% (well in excess of Basel III’s 7% requirement) in June 2015 as compared to 11.4% in December 2014.
Total assets of South Africa’s banks amounted to R4.4 trillion as of June 2015, up 10.2% from the preceding year. The four largest banks in South Africa accounted for approximately 83% of total assets. Gross loans and advances, the biggest component of banking assets, rose by 8.9% from R3.2 trillion in June 2013 to R3.4 trillion in June 2015. This growth can be attributed to increases in foreign currency-denominated loans, specialized lending, and lease and installment debtors. As growth in household credit has moderated, total credit extension has been supported by stronger lending to corporates. The banking sector’s profitability ratios have been stable, with the cost-to-income ratio increasing from 53.7% in 2013 to 54.2% in 2014 and the return on equity unchanged from 2013 levels at 14.7% in 2014.
In line with an increase in gross loans and advances, the total value of new credit granted increased by 4.8% in June 2015 and the number of credit agreements rose by 10.3%. The rejection rate fell marginally to 56% in June 2015 from 58.3% in June 2014. Banks have, over the past years, tightened their lending criteria on the back of rising bad debts, high household indebtedness and lower disposable income growth. Growth in credit extended to households has been hovering below 5% in the first half of 2014. Growth in unsecured lending (mainly personal loans), having reached almost 40% year-on-year growth in 2011, has slowed quite significantly especially since the beginning of 2013. Growth in unsecured lending picked up to 6% year-on-year in June 2015 from 2.9% in June 2014 (the lower growth percentage largely reflecting the high base starting point following the 40% increase in 2011).
44
In 2014, the Reserve Bank acted to forestall contagion of the broader banking system, and the Minister of Finance placed African Bank under curatorship. Rising consumer default rates during the first half of 2014 disproportionately affected African Bank, which accounted for 2% of banking assets, due to its business model, which included a concentrated set of products and income streams and a lack of transactional banking services. The restructuring, which involves the private sector, is proceeding. The Government has not provided any funds to bail out the bank, but has provided a R7 billion backstop to the Reserve Bank in line with international practice. It is unlikely that the Reserve Bank will draw on this facility, and no costs to the taxpayer are expected. The failure of African Bank saw Moody’s downgrade South Africa’s four big banks, Standard Bank, FirstRand, Nedbank and Absa, by one notch, while Capitec’s credit rating was cut by two notches. African Bank remains under curatorship and has been granted an approval to set up a “Good Bank” with its remaining assets.
Despite the challenging operating environment characterized by high levels of unemployment, low GDP growth rates, energy constraints, continued Rand deterioration and industrial action, short term insurers remain resilient. Net premiums grew by 11% in 2014 from 6% in 2013 while growth in the first half of 2015 came in at 17%, compared to the same period last year. The loss ratio, as a percentage of net earned premiums, improved to 53% in the six months to June 2015 from 60% the same period last year. Management expenses, as a percentage of net written premiums, fell marginally from 24% in the first half of 2013 to 23% in the first half of 2015 mainly due to the implementation of new regulation such as Solvency Assessment and Management, Treating Customers Fairly and Binder Regulation.
Long-term insurers recorded an annual growth of 2% in net premiums in 2014 from 20% in 2013 as the number of new policies issued declined by 6% in 2014. Insurers are not only pursuing new business but are also focusing on quality. The ratio of individual lapse as a percentage of the number of new policies issued jumped to 76% in 2014 from 54% the previous year, thus showing that consumers are under pressure. In 2014, long-term insurers benefited from the strong stock market performance, with the JSE All Share Index 16.5% higher than in 2013.
Government is continuing work to strengthen the financial sector in line with a series of reforms announced in the 2011 paper “A safer financial sector to serve South Africa better.” In 2014, draft regulations for over-the-counter derivatives, credit agreements, hedge funds and insurance were released. Substantial progress has been made with retirement reforms. The final draft of legislation to implement a “twin-peaks” model of financial regulation was tabled in Parliament on October 27, 2015 and will go through the parliamentary processes before the President signs it into law.
The Promotion and Protection of Investment Bill was tabled in Parliament on July 28, 2015, following an extensive public consultation process. The bill seeks to promote investments and clarify the level of protection that an investor may expect in the Republic of South Africa and ensure that South Africa remains open to foreign investment. The bill also aims to confirm the Government’s right to pursue constitutionally-driven national development objectives and recognizes the right of governments to regulate in the public interest. In addition, it seeks to promote a balance between the rights and obligations of investors, and provides clarity for the standards of protection applied to investment.
Manufacturing
Manufacturing is South Africa’s second largest sector, constituting approximately 12.5% of GDP in 2014. Approximately 56% of production is concentrated in upstream sectors such as metal products, wood processing, and petrochemicals. The remainder is focused on consumer-orientated sub-sectors such as food and beverages, motor vehicles, and furniture—a sign of diversification. The sector is a large job creator, providing employment for approximately 1.13 million people or 13% of total employment (Stats SA QES, 2Q2015).
45
The importance of the manufacturing sector is reflected in the level of support it receives from government. The government’s support for the manufacturing sector is guided by the National Industrial Policy Framework and the Industrial Policy Action Plan (an annually published action plan focusing on a three-year rolling period). The most recent IPAP (IPAP 2014/15 – 2016/17) focuses on supporting advanced manufacturing (e.g. advanced materials and aerospace) along midstream and downstream processing activities, sector—specific support, exports promotion, the green economy, and local procurement—particularly for black economic empowerment. Producers are able to obtain grants for marketing of exports, tax relief for capital expenditure and R&D, funding for small business development, business incubation, assistance for critical infrastructure, funding for job creation, and funding through sector-specific support programs (for example automobiles and clothing and textiles). Local manufacturers are also supported through preferential procurement policies, and the designation of several sectors for local procurement.
Since the recession, manufacturing gross value added has recovered steadily, growing at approximately 2.7% annually between 2010 and 2012. However, growth slowed to 1.4% in 2013 and the sector contracted by 1.4% in 2014 reflecting supply shocks, labor unrest and weak domestic demand. Growth has made a marginal recovery in 2015 (up 0.3% as at August 2015), although electricity constraints remain a major constraint to growth in the sector. Electricity demand side management initiatives are assisting in limiting the impacts of electricity supply constraints on producers.
Production was volatile in 2014 but has been more stable in 2015. The main driver of growth has been the food and beverage sector, which grew by 2.3% for the year to August 2015. However, in other sub-sectors, the combination of subdued demand, low commodity process and electricity constraints continued to place pressure on growth.
Gross fixed capital formation in manufacturing has grown at an annual average rate of 8.5% from the first half of 2010 to the first half of 2015. Capacity utilization of large manufacturers stands at 80-82%, where it has been since mid-2010, somewhat below the mid-80% utilization rates experienced between 2005 and 2008. According to the most recent survey, capacity utilization in July 2015 was 80.7%, mainly due to insufficient demand (accounting for 11.0% of unused capacity) and a shortage of raw materials (accounting for 2.0% of unused capacity).
The relatively weaker currency, improved demand in Europe, greater export potential into other SADC countries, higher levels of investment into manufacturing and government support through incentives and local procurement targets should help lift production over time.
46
Composition of Manufacturing Sector Growth
| | | | | | | | | | | | |
| | | Weights | | | Year-to-date growth* | |
| | | | 2014 | | | 2015 | |
Petrochemicals | | | 25.1 | % | | | -3.9 | | | | -1.2 | |
Food & beverage | | | 22.1 | % | | | -0.7 | | | | 2.3 | |
Metals products | | | 20.3 | % | | | -1.4 | | | | -1.2 | |
Wood & paper | | | 10.2 | % | | | -8.2 | | | | 0.0 | |
Motor vehicles & parts | | | 7.9 | % | | | 1.0 | | | | 7.9 | |
Glass & non-metallic | | | 4.9 | % | | | -2.4 | | | | -2.5 | |
Clothing & textiles | | | 3.5 | % | | | 3.4 | | | | 0.5 | |
Furniture | | | 3.2 | % | | | 0.8 | | | | -7.7 | |
Electrical machinery | | | 2.4 | % | | | -6.2 | | | | 5.3 | |
Radio & TV | | | 1.1 | % | | | -4.5 | | | | -9.3 | |
Total | | | 100.0 | % | | | -1.4 | | | | 0.3 | |
Source: StatsSA
| * | captures growth from January to August |
Manufacturing exports have grown by 6.5% in the first eight months of 2015 compared against the same period in 2014, supported by strong export growth in chemicals, vehicles, wood, textiles and glass. While Europe remains an important destination for manufactured products, SADC and the rest of Africa offer the greatest export growth potential. In recent years there has been particularly strong growth of exports of manufactured products to Southern African Development Community countries.
Petroleum Products, Chemicals, Rubber and Plastic
The petrochemicals sub-sector is the largest in manufacturing, forming approximately 25.1% of manufacturing output according to the most recent StatsSA large sample survey (based on 2010 data). The 2005 survey estimated petrochemicals formed 22.1% of output.
This is one of the few sub-sectors where output is higher than pre-crises levels, supported in particular by large investments in chemicals and pharmaceuticals. The largest export market for the sub-sector is SADC, which makes up 30.9% of exports, followed by the EU, which accounts for 15.3% of total exports.
Production in this sub-sector contracted by 1.2% in the eight months ending August 31, 2015, up from a contraction of 3.9% over the same period in 2014 and substantially lower than the 1.2% achieved in 2013. Electricity shortages in the first half of 2015 had significant negative effects on the sub-sector.
Food, Beverages and Tobacco
The food sub-sector includes processed foods, dairy products, oils, sugar and animal feeds. The beverages sector includes distilleries, wineries and the carbonated drinks industry. This sub-sector accounts for approximately 22.1% of manufacturing production. SADC forms South Africa’s major export market, accounting for 36.7% of exports. The EU represents 26.5% of exports, with the U.S. accounting for 3.8%.
The food and beverages sub-sector has grown by 2.3% in 2015 (year-to-date growth until August) and continues to be the fastest growing manufacturing sub-sector over the period. Strong export growth of 21% year-to-date, mainly to SADC and Asia, has supported the expansion.
Basic Iron and Steel, Non-ferrous Metal Products, Metal Products and Machinery
The metal products sub-sector comprises the working of metal, including structural metal products, engines and turbines, agricultural machinery, and electrical industrial machinery. This sector forms approximately 20% of total manufacturing output, but is a large generator of exports – 27% of total manufacturing exports (23% of all South African exports) in 2014 were base metals and steel products.
The operating environment in 2015 has been difficult. Production fell by 1.8% in the first eight months of 2015 .The sector was hit hard by low commodity prices, rising electricity costs, disruptions in electricity supply and steep import competition coupled with subdued domestic demand.
47
Despite the economic slowdown, the European Union remains the sub-sector’s largest export market, accounting for 17% of metal exports in 2012. Asia and Africa also form major trading partners, as the SADC accounted for 21% of exports.
Wood and Paper; Publishing and Printing
This sub-sector’s performance has been volatile in 2015 recording 7.4% quarter-on-quarter growth in the second quarter of 2015 following a sharp contraction of 10.8% in the first quarter. The cumulative effect is that the sub-sector recorded 0% growth for the year to August 30, 2015. This sub-sector contracted by 0.1% in 2014 and 0.2% in 2013.
Wood and paper accounts for 5% of total manufactured exports, delivered primarily to the SADC region (22.4%); China (10.6%) and Japan (10.3%) are also important markets.
Motor Vehicles, Parts and Accessories and Other Transport Equipment
The sector includes the manufacture of motor vehicles, ships and boats, railway locomotives and rolling stock, and transport equipment parts and accessories. Europe and the U.S. are the major export markets, accounting for 28.8% and 27.6% of exports respectively. Exports to the SADC formed 10.8% of export markets in 2012, up from 8% in 2011.
Production for the first eight months of 2015 was 7.9% lower compared to the same period in 2014 despite subdued domestic demand owing to weak income growth, higher petrol prices, and above-inflation increases in the prices of new motor vehicles.
The motor industry accounts for the bulk of support available within the manufacturing industry, with an estimated value of incentives of R22 billion in 2011/2012 in tax and custom incentives. The Automotive Production Development Program (ADPD) replaced the Motor Industry Development Program in 2013 and will extend to 2020. Both these programs are comprehensive, covering investment grants, tariff protection and import rebates. Part of the ADPD, the Automotive Investment Scheme (AIS), has already resulted in increased investment in the sub-sector. Between July 2009 and end-2012, the AIS is estimated to have resulted in planned investments of R13.6 billion – mainly from automotive assemblers, but also by component companies. This strong investment has continued: between April 2013 and December 2013, 22 projects were approved, amounting to an estimated R6.2 billion of investment.
Textiles, Clothing and Leather Goods
This sector comprises the manufacturing of clothing by cutting and sewing fabrics, leather, fur, plastic, rubber and other materials, and textiles production using wool, cotton and synthetic fibers. SADC is the biggest export destination (31.4% in 2012), and is also a fast growing market – SADC share has increased from 24% in 2010. The European market, however, remains crucial to the sector (30.6%).
Production of textiles and clothing grew by 0.5% in the first eight months of 2015. The sub-sector has been struggling to recover after the recession and has been declining in size, but seems to be on-track to register growth for the first time since 2013. However, real Rand depreciation since late 2011 has helped the sector considerably, with exports of textiles and footwear increasing by 11% in the first eight months of 2015. Substantial government support through the Clothing and Textile Competitiveness Program, launched in March 2010, has also had a positive impact. The support program provides grant funding for investment in new machinery and equipment, interest subsidies for working capital, and support for clustering. The program had a budget of R723 million for 2014/15 and replaced the Duty Credit Certificates scheme which was available to the sub-sector.
48
Furniture
The furniture sector has contracted by 7.7% over the first eight months of 2015 following growth of 3.3% in 2014. The sub-sector faces strong competition from imports and low domestic demand as over-indebted households rebalance their portfolios. International demand, particularly from the EU, also remains low. The EU is by far the largest importer of these products, accounting for 67% of exports in 2012. There is some potential upside for furniture production given the weaker Rand and the expansion of retailers into SADC countries – which make up the most of the other exports, approximately 22%.
Electrical Machinery and Apparatus
The manufacturing of electric motors and generators, electricity distribution and control systems, insulated wire and cable, and lights and lighting equipment are included in this sector. This sector expanded by 5.3% in the first eight months of 2015, following a contraction of 1.8% in 2014. SADC is the main export destination of electrical machinery products, accounting for 50.9% of exports in 2012. Europe (11.6%) and the U.S. (6.1%) are also important destinations.
Wholesale and Retail Trade, Catering and Accommodation
This sector comprises wholesale and retail trade and allied services, catering and accommodation services and motor trade and repair services. Activities include the resale of new and used goods and the rendering of repair services.
Growth in the real value added by the sector decelerated to 1.3% in 2014 from a post-crisis high of 4.4% in 2011. Preliminary data indicates that growth in 2015 has improved, but remains well below the post-crisis peak. Weak employment and real disposable income growth alongside low levels of consumer confidence and sluggish growth in credit extension continue to depress demand. This is especially evident in the motor trade sub-sector, where growth has contracted: passenger vehicle sales declined by 1.9% year-on-year in the first eight months of 2015 when compared to the same period in 2014.
Despite the adverse trading conditions in the sector, employment in the sector has remained relatively resilient. According to the QES, the wholesale and retail trade, catering and accommodation sector employed 1,845,000 people in the first half of 2015, an increase of 0.7% year-on-year.
Wholesale and Retail Trade
The wholesale and retail trade sector is the third largest sector in South Africa, measured by value added. In the second quarter of 2015, it contributed 13.6% to GDP and accounted for 20% of formal sector employment.
This sector was one of the hardest hit by the economic downturn. In 2009, the value of sales in real terms fell to its lowest level since 2005. Although retail sales recovered to 4.5% in 2012, the recovery was short-lived, decelerating to 2.0% in 2014. Momentum picked up in 2015 with annual growth in the first eight months to August coming in at 3.2%. Much of the gain in momentum has been concentrated in hardware, paint and glass as well as clothing and textiles and general dealers. By contrast, the wholesale sector’s growth is down from a high of 8.3% in 2012 to 2.2% year-on-year for the first eight months of 2015. Consumer confidence remains low and is expected to constrain overall sector growth.
The wholesale and retail trade sub-sectors remain highly concentrated with four dominant retailers in the market. Competition is nevertheless vigorous among the major chain stores, driving rationalization and reduced costs throughout the distribution chain. The traditional role of wholesalers has been undermined by the emergence of large chain stores and retailers with significant financial power and purchasing strength. Despite allegations of market abuse by consumer groups and unions, the Competition Commission has not found evidence of anti-competitive or collusive behavior.
49
South African wholesalers and retailers have further expanded their operations by establishing distribution and logistical networks in other African countries, particularly Botswana, Mozambique, Zambia, Nigeria, Angola and Ghana.
Catering and Accommodation Services
When including the linkages of the tourism sector to the rest of the economy, this sub-sector contributed 9.4% to GDP and created over 1.4 million jobs in 2014 (according the Department of Tourism). The sector is expected to play a significant role in employment creation over forecast horizon of the NDP.
Domestic tourists contributed R26.8 billion to the economy in 2014, up from R24.3 billion in 2013. According to the data collected by the Department of Home Affairs (DHA), 4,195,456 travelers (arrivals and departures) passed through South African ports of entry in December 2014. Of the total, 1,263,363 were South African residents and 2,932,093 were foreign travelers. Tourism has recorded strong growth in recent years, with growth of 6.6% year-on-year in 2014, 4.7% year-on-year in 2013, 10.2% year-on-year in 2012 and 3.3% year-on-year in 2011. However, growth in 2015 is expected to be lower given the 2.0% year-on-year decline in tourism activity in the first half of 2015 compared to the first half of 2014. The decline was largely the result of new visa laws which came into effect in 2015; these laws are currently being reviewed by the Cabinet.
Tourists from overseas were from Europe (67.3%); North America (14.7%); Asia (7.7%); Australasia (6.7%); Central and South America (2.4%); and the Middle East (1.2%) in December 2014. Within Africa, 7,668 were from West Africa, 6,664 from East and Central Africa and 999 from North Africa. According to the Department of Tourism, South Africa has a very high repeat visitor rate (e.g. 53% from Europe). There were 481,766 same-day visitors and 934,699 tourists in December 2014. The volume of same-day visitors between November and December 2014 increased by 13.1%. According to StatsSA, the arrival data showed that 89.4% came by air, while 10.1% came by road.
Transport and Storage
South Africa’s modern and extensive transport and logistics system plays an important role in the national regional economy, transporting freight for export and domestic use, as well as enabling the movement of people within and between cities and rural areas. The transport system comprises airports, sea ports, roads, rail and public transport networks.
Transportation in South Africa is coordinated by the Department of Transport, which determines policy and sets guidelines for the industry. The Department of Transport is also responsible for overseeing regulation of the sector through a number of regulatory bodies including the Ports Regulator, the Regulatory Committee (for Aviation), Railway Safety Regulator (RSR) and the South African Civil Aviation Authority (SACAA).
Transnet, the horizontally integrated state-owned company, plays a central role in freight transportation through its rail, port and pipeline operations. Intercity passenger land transportation is provided by PRASA. SANRAL is responsible for the upgrading and expansion of the national road system whilst provincial and municipal governments are responsible for secondary roads.
The road transport industry dominates the freight transport market, mainly due to its flexibility. Approximately 80% of all freight transport, 75% of all commuter transport and 95% of all other passenger travel in South Africa takes place by road. Income from land freight transportation declined by 2.8% in the three months ended July 2015 compared with the three months ended July 2014. The main contributors to this were the declines in primary mining and quarrying products, related to the production constraints in the mining sector.
SANRAL is responsible for planning, designing and constructing national roads. It is also charged with raising the financing required to develop and manage the road network and non-current assets. The national road system connects all the major centers in the country to each other and to neighboring countries. The South African road network comprises approximately 750,000 kilometers of roads. The South African national road network consists of 21,403 kilometers of roads. South Africa has the longest road network of any country in Africa.
50
The toll-road network comprises about 19% (3,120 kilometers) of the national road grid. SANRAL manages some 1,832 kilometers of these toll roads. About 1,288 km of the tolled sections of national roads have been concessioned to private companies to develop, operate and maintain. Government has indicated that the roads under SANRAL’s jurisdiction may increase by a further 13,597 kilometers over time. During 2014/15, 1,670km of provincial roads were declared national roads. To continue the expansion and maintenance of the comprehensive national road network, SANRAL will continue the selective expansion of toll roads. New roads will be funded through the user-pay principle with electronic tolling, if feasible. This will relieve congestion and enhance traffic flow around major metropolitan areas. SANRAL spent R7.2 billion in 2014/15 to maintain and improve existing roads, and to develop new road infrastructure.
While air freight may only account for 0.5% of the tonnage of global trade with the rest of the world, in value terms it makes up around 35% of the total. Around 325,000 tonnes of freight travelled to, from and within South Africa by air in 2013. The ten international routes accounted for approximately one-third of this total. In total over 33 million passengers arrive or depart from South African airports each year.
The commercial airport infrastructure in South Africa consists primarily of nine airports which are owned and operated on a commercial basis by the Airports Company of South Africa Limited (ACSA). The Department of Transport is responsible for overseeing the state’s stake in ACSA. South Africa’s three major international airports (Johannesburg’s OR Tambo, Cape Town International and Durban’s King Shaka) are the highest ranked airports in Africa and respectively ranked 24th, 26th, and 28th in the 2015 World Airport Awards. According to ACSA’s 2014 Annual Report, it plans to invest R7.7 billion in capital expenditure between 2015 and 2017.
South African Airways (SAA) is a wholly state-owned company which, due to ongoing financial difficulties, has been supported by government guarantees amounting to R14.4 billion, of which R11.4 billion has been used so far. The airline is implementing its Long-term Turn-around Strategy to reduce costs and become more efficient. SAA’s core business is the movement of people and goods by air. The Group operates a dual-brand airline model, with SAA as its premium brand and the low cost carrier, Mango, targeting price sensitive markets. SAA provides regular services between South Africa and Australia, Europe, the Far East, the Middle East, South America and the United States. SAA became the first airline in Africa to join the Star Alliance Group in April 2006.
Transnet, a public company wholly-owned by the Government, is the custodian of rail, ports and pipelines, responsible for delivering reliable freight transport and handling services. Transnet has five operating divisions: Transnet Freight Rail (transporting bulk and containerized freight), Transnet Rail Engineering (refurbishment, conversion, upgrades and manufacturing of rail related rolling stock), Transnet National Ports Authority (port infrastructure and marine services), Transnet Port Terminals (cargo terminal operations) and Transnet Pipelines (petroleum and gas pipeline business). The company is overseen by the Department of Public Enterprises. Group revenue increased by 8% to R61.1 billion according to the 2015 Annual Report.
The national and local railway network consists of approximately 20,824 kilometers of track and is divided into ten geographical areas under the control of Transnet Freight Rail (TFR). TFR moves heavy haul and bulk commodities over long distances and accounts for 62% of total Transnet revenue. The division also provides the network for long distance passenger rail agency as well as haulage capacity for other private passenger services. The Rail Engineering (RE) division consists of nine businesses, namely wagon, locomotive, coach, rolling stock equipment, rotating machines, wheels, auxiliary foundry and port equipment maintenance.
Transnet National Ports Authority (National Ports Authority) operates as a landlord port authority, managing, controlling and administering the South African port system on behalf of the state. The National Ports Authority owns and manages the eight ports within South Africa and its tariffs are regulated by the National Ports Regulator. Approximately 98% of South Africa’s exports are conveyed by sea. Transnet Pipelines owns and operates South Africa’s 3,800 kilometers of strategic petroleum and gas pipeline infrastructure, with the objective of ensuring security of supply of petroleum products to the inland market.
51
The pipeline network is responsible for the transport of more than 85% of refined fuel and gas products. The business is regulated by the National Energy Regulator of South Africa (Nersa).
In 2015, Transnet revised its seven-year rolling capital expenditure program up to R336.6 billion. Half of this expenditure will go towards its freight rail division. In comparison with the original capital expenditure strategy in 2012, emphasis has partially moved away from containers to bulk products and the development of the Liquefied Natural Gas Terminal at Ngqura. This is in line with the requirements of the government’s oceans economy strategy (Operation Phakisa). At the same time, the proportion of the projected investment in rail has increased with the anticipated investment in a manganese line. In 2013, Transnet released a Private Sector Participation (PSP) Policy. Bulk commodities, intermodal, general freight services, multi-purpose terminal development, regional integration, non-core projects and Operation Phakisa initiatives have been identified as PSP projects.
The Government has placed a strong emphasis on increasing public transportation availability, in line with the NDP. According to StatsSA, the use patterns of public transport have changed significantly between 2003 and 2013, with general increases in the percentage of households who used taxis (from 59.0% to 69.0%), buses (16.6% to 20.2%) and trains (5.7% to 9.9%). Bus Rapid Transport (BRT) systems provide a mechanism for implementing public transportation networks that operate on exclusive lanes and incorporate current bus and minibus operators. Large metros are investing heavily in integrated public transport. Cape Town and Johannesburg have begun operating stations, depots, buses and dedicated bus lanes. Tshwane, Mbombela, Nelson Mandela Bay, eThekwini, Rustenburg and George have started constructing similar infrastructure. Government also is seeking to modernize the private provision of transport to increase safety.
The Passenger Rail Agency of South Africa (PRASA) was established in 2009, following the Cabinet’s approval of the consolidation of passenger rail entities, in a bid to provide better mobility and accessibility to transport. PRASA is the parent company of Metrorail (commuter rail services); Shosholoza Meyl (long distance passenger rail services); Autopax (long distance bus services); PRASA Corporate Real Estate Solutions (facilities management); PRASA Technical (rolling stock upgrade, maintenance, depot and fleet management); and Intersite Asset Investments (property portfolio and asset investments). PRASA embarked on a comprehensive program to improve rail safety and revive rail transport as a viable public transport alternative. Prasa is planning to invest R175 billion in new infrastructure over the next ten years and of this, PRASA expects it will spend R51 billion to procure 600 trains. A total of 580 of these trains will be manufactured in South Africa.
To reduce the traffic and speed up commute times between Johannesburg and Pretoria, the National Government co-funded the R32 billion Gautrain Rapid Rail Link. This project has linked Johannesburg, Tshwane and the Oliver Tambo International Airport through high-speed rail services since August 2011. It now ferries between 50,000 and 60,000 passengers per day. Following this success, the Gautrain Management Agency, which operates the rapid rail link, has proposed seven new routes along identified “high-mobility corridors” in South Africa’s busiest province. The feasibility study is due to be completed in 2016.
Communications
The communications sub-sector consists of postal services and telecommunications services.
Fixed line services are dominated by Telkom SA Limited (Telkom)1, in which the government has a 39.8% stake, although there is also a second national fixed-line operator – Neotel.2 There are five licensed mobile operators: Vodacom, MTN, Cell-C, Virgin Mobile and Telkom Mobile. The Government sold its 13.91% stake in Vodacom this year. The telecoms sector has seen quite a few developments in 2015, with many firms attempting to reduce operational costs and increase prices due to a combination of a weak economic climate, increased network investment costs and lower mobile termination rates reducing service revenues. Despite these challenges, investment is ongoing. Cell C plans to invest R8 billion over the next three years to develop a long-term evolution (LTE) network. Meanwhile, Vodacom and MTN plan to outlay R8 billion and R10 billion, respectively, to improve the quality and capacity of their respective 2G and 3G networks and to establish LTE sites. In September 2015, Telkom physically separated its wholesale fixed-line internet access division from its retail and mobile divisions, to form Openserve. Openserve intends to provide one million homes with fiber access by 2018.
| 1 | The major shareholders of Telkom are (i) the National Government, with a direct holding of 39.8% and (ii) Public Investment Corporation, with a direct holding of 10.9%. The remaining 47.3% of Telkom’s issued shares are in free float. Telkom is listed on the Johannesburg Stock Exchange (JSE). For the financial year ended March 31, 2015 Telkom’s Group operating revenue was R32.400 billion (R31.905 billion in 2014) and profit after tax was R3.256 billion (3.203 billion in 2014). It is one of the largest companies in South Africa and together with its subsidiaries and joint ventures forms one of the largest communications services providers on the African continent. Telkom provides international direct dial telephone services to approximately 230 international destinations. Direct circuit relationships have been established with approximately 70 administrations worldwide. |
| 2 | The Telecommunications Amendment Act of 2004 was introduced to amend the Telecommunications Act of 1996 and to make provision for the introduction of a second national fixed-line operator to compete with the then state monopolist Telkom. In September 2006, Neotel entered the market and competes on most of the services that Telkom provides. |
52
South African telecommunications companies have been quick to identify growth opportunities in other African countries, supporting regional integration efforts. Locally, cuts in mobile termination rates by the regulator initiated a price war amongst service providers in 2014. Due to delays in spectrum allocation, consolidation has become a way for companies to access additional spectrum to further roll-out LTE. The Competition Tribunal approved MTN’s acquisition of a 51% stake in internet service provider Afrihost and conditionally approved Telkom’s purchase of Business Connexion. Vodacom’s R7 billion acquisition of Neotel has been approved with conditions by the telecommunications regulator and has also received provisional approval from the Competition Commission, which is currently seeking responses from the company’s rivals.
In December 2013, the Minister of Telecommunications and Postal Services published South Africa’s broadband policy and in 2014, it published its ICT Policy Review paper. The broadband policy sets out a framework which aims to help in achieving high quality universal broadband access at affordable prices by 2030. In 2008, the Minister of Communication approved the Broadcasting Digital Migration Policy which created the framework for switch-over from analogue to digital. The digital signal was switched on this year, and the dual-illumination period (where both the digital and analogue signal are transmitted) is expected to last about two years.
Cellular telephony is among the fastest-growing sub-sectors of the South African economy. The Telecommunications Amendment Act of 1997 enabled various telecommunication facilities, including interconnection and roaming, and required two telecommunications providers to share and make available facilities and utilities for one another. Mobile number portability allows customers to switch networks without changing numbers. Call termination rates were reduced by ICASA from R0.89 in 2011 to R0.20 in 2014. The call termination rate reductions are ICASA’s first and only tariff setting intervention completed in terms of the ECA Act.
The South African Post Office Limited (SAPO) is responsible for postal services through the Postal Act and the Postal Services Act 1998. SAPO was established on October 1, 1991 as a public company in terms of the Companies Act, 61 of 1973. The government of South Africa is the sole shareholder and is represented by the Minister of Telecommunications and Postal Services. SAPO has a retail post office infrastructure of 2,486 service points which deliver postal, courier, financial and PostBank services. SAPO was granted a license to operate as South Africa’s postal services provider in 2001. The license is valid for a period of 25 years and is reviewed every three years with the next review in 2014. SAPO has the exclusive mandate to conduct certain postal services under the Postal Services Act of 1998.
Mining and Quarrying
The mining sector made up 7.5% of total GDP in 2014 in real terms. The contraction in employment tapered off into the second quarter of 2015, with 490,000 people employed, representing a 0.2% decline from a year ago. Although the sector’s importance to the South African economy has been declining over the long term, it remains an important earner of export revenues. Mineral export sales (including precious metals, base metals, basic iron and steel and basic non-ferrous metals) accounted for approximately 53% of total export revenues in 2014.
53
In the first half of 2015, South Africa’s mining sector was under significant pressure due to a combination of domestic and global factors. However, a rebound in the platinum group metals sector following strike disruptions in 2014 provided support to the sector’s performance in the first half of 2015. Real value added in the mining sector expanded by 5.5% year-on-year in the first half of 2015, following an overall contraction of 1.6% in 2014 compared to 2013. On a seasonally adjusted quarterly basis, the sector contracted 6.8% in the second quarter of 2015, following an expansion of 10.2% in the first quarter.
Low commodity prices, weak global demand, especially in China and Europe (China accounts for about 40% of industrial market demand), and a supply glut in the iron ore and coal sub-sectors have had a major impact on the sector. This is likely to exacerbate the current challenges associated with supply-side constraints, such as the availability of electricity and access to transport infrastructure. By the end of the first half of 2015, iron ore and thermal coal prices had fallen by approximately 64% and 51%, respectively, since the start of 2011. Gold and platinum prices are also down sharply and have been mostly flat since 2013. In the first half of 2015, the average price of gold, platinum, iron ore and coal declined by approximately 7%, 19%, 46% and 20%, respectively, compared to the prior year period. In response to the global mineral supply glut and slowing global demand, particularly from China, producers have started to scale back production, consolidate operations and diversify production in certain instances. In volume terms, total mining production contracted by 1.4% in 2014, following an expansion of 3.7% in 2013, largely as a result of a five-month long strike in the platinum sector during the first half of the year. In the first half of 2015, mining production increased 7.5% compared to the prior year period due to the normalization of platinum operations—platinum group metals production increased by 37.9% in the first half of 2015 compared to the same period a year ago.
Although the importance of the gold sector is declining relative to platinum, coal and iron ore, it remains an important contributor to the South African economy. In 2014, South Africa’s gold sector produced around 5% of global output, contributed R1.6 billion in taxes, employed 119,705 people, paid remuneration to employees of R23.4 billion and was a significant contributor to private sector infrastructure and social investment (the latter in the form of employee housing and accommodation, training and development and local economic development). Production in the gold sector continued to decline in the first half of 2015, falling 7.2% compared to the same period in 2014. The decline in gold output is related to structural factors including decreasing ore quality, deepening mine pits, which have raised the risks of gold mining, and rising costs (mainly labor and electricity). Wage negotiations in the gold sector (with the exception of one producer) concluded in October 2015 following four months of negotiations, with minimal strike action incurred.
South African mineral sales decreased by 0.3% in 2014 to R396 billion following an expansion of 9.2% in 2013. In the first half of 2015, mineral sales continued to decrease by 1.3% compared to the first half of 2015. To a certain extent, the depreciation of the Rand since 2012 has shielded South African mining companies against weaker commodity prices.
South Africa’s coal exports, mostly along a heavy-heal line between Mpumalanga and the Richard’s Bay Coal Terminal (RBCT), contributed R106 billion to total mineral sales in 2014. The RBCT has a design capacity of 91 million tons per annum (mtpa) with plans to expand this to 110mtpa and the current rail capacity is around 72mtpa. Transnet plans to expand this to 81mtpa by the end of 2018, and eventually to 97mtpa. In recent years, Transnet has increased capacity on the rail line from 68.5mtpa in 2012 and 70.8mtpa in 2013. Due to the absence of a heavy-haul line linking the Limpopo coal fields to Mpumalanga, Transnet and Exxaro are planning a public-private partnership to increase line capacity to 23mtpa from 5mtpa.
South Africa’s iron ore exports, mostly along a heavy-haul line between the Northern Cape and the port of Saldanha, contributed R59 billion to total mineral sales in 2014. The current capacity of the port is around 57mtpa and line capacity is around 60mtpa. Transnet plans to increase rail capacity to 82.5mtpa by 2018 (and eventually to 105mtpa). Some iron ore producers believe that line capacity can be further increased by 8 to 10mtpa through gains in operational efficiencies alone.
54
South Africa’s manganese exports contributed R16 billion to total mineral sales in 2014. South Africa currently exports 7.5mtpa of manganese (5mtpa on rail and remainder on trucks through the Port Elizabeth and Durban ports). Transnet believes that unconstrained manganese production capacity across current and potential new mines is estimated at 49mtpa. Transnet plans to create capacity of 7 to 14mtpa by 2020 and 16mtpa by 2023 along a new line between the Northern Cape and the port of Ngqura.
Domestic electricity supply constraints and tariff increases are a major challenge for the sector. The mining sector is the most reliant of all the major sectors of the economy on electricity as an input, although there are some exceptions: surface mining activities such as coal and iron ore have relatively low exposure to electricity costs, because they rely more on diesel than electricity.
Mining is the sector most vulnerable to electricity price increases as producers are not able to pass on increased electricity costs. Within the sector, gold mining firms are the most vulnerable to increasing electricity prices because of very electricity intensive deep mining operations. At the beneficiation level, such as steel production, electricity price increases have had severe negative consequences on firms’ competitiveness (with the exception of industries relying essentially on gas, such as catalytic converter producers).
Policy uncertainty, mainly in two areas, is affecting investor confidence in the sector. Firstly, the MPRDA Amendment Bill remains unfinalized. This has significant implications for investment in oil and gas exploration (both offshore and fracking) as well as general investment in the mining sector due to uncertainty related to developmental pricing of minerals to support beneficiation. Secondly, uncertainty remains around specific implications of the Mining Charter and differences between the Department of Mineral Resources (DMR) and the Chamber of Mines on the “once empowered, always empowered principle”. The matter is currently with the courts (brought by the Chamber of Mines) where a determination on whether past empowerment deals (where BEE shareholders have since exited from the deal), will be counted towards the mining sector’s requirement of 26% empowerment.
Following concerns that the mining regulatory framework was inhibiting investment, the Minister of Mineral Resources announced measures to reduce regulatory uncertainty in the mining industry and root out corruption in the awarding of mining licenses. Since September 1, 2010, in an effort to improve transparency in the licensing process, the DMR now places information on the status of exploration and mining licenses on its website. In addition, issuance of prospecting rights, which was previously done at regional offices, is only issued from the head office. This aims to reduce graft and inconsistent application of the law. Senior management has also been deployed to regional offices to strengthen leadership and oversight.
In the NDP 2030, the Government identifies mining as one of the key sectors for the acceleration of domestic industrialization and the acceleration of job creation. A number of binding constraints to growth that require policy intervention have been identified, including rail and port infrastructure, the stability of energy supply, skills constraints, a poor regulatory framework and policy uncertainty.
A review of the Mining Sector Strategy will begin in 2015/16 and the Mining Charter Compliance Review will be completed during 2015. Consultations on this process are still ongoing. Draft regulations for shale gas exploration have been completed and stakeholder consultations will begin once the shale gas communication strategy is finalized.
55
The Government set up the Framework Agreement for a Sustainable Mining Industry in July 2013 in an effort to overcome the challenges faced by the mining sector. The action plan aims to ensure the rule of law, peace and stability; strengthen labor relations; improve living and working conditions of mineworkers; and provide short, medium and long-term measures to support growth and stability in the sector. A mining pact entered into between industry, unions and the government to limit the extent of adverse operating conditions on potential job losses going forward was signed in September 2015. A Mining Phakisa in November 2015 has enabled business, labor and government to identify priorities to achieve the objectives of increasing mining exploration, investment, production, and ensuring sustainability and transformation of the industry.
South Africa is endowed with substantial mineral resources, and further downstream and upstream beneficiation has been identified as a major stimulant to drive the country’s industrialization plan. As part of the NDP, the government is working towards creating a suitable environment for downstream minerals beneficiation. In June 2011, the Cabinet approved a ten commodity beneficiation strategy. The ten selected commodities are gold, platinum, diamond, iron-ore, chromium, manganese, vanadium, nickel and titanium, with coal and uranium bracketed together. The Minerals Beneficiation Action Plan (MBAP) has been incorporated into the 2015/16 Industrial Policy Action Plan (IPAP) which seeks to ensure that South Africa adds more value to its mineral wealth. The MBAP seeks to advance local value-addition across five mineral value-chains, namely, iron-ore and steel, PGMs, polymers, titanium and mining inputs. The IDC has approved funding of R247 million to improve downstream processes for iron-ore and steel, diamond, platinum and titanium. The Resources Capital Goods Development Program (RCGDP) interim report was approved in April 2015. This aims to stimulate and expand the mining capital goods sub-sector given the relatively large local and regional market for mining supplies. Platinum Power Fuel Cell, which is a joint project between the DTI and energy specialist Mitochondria, installed the first 100kW base-load platinum fuel cell, which runs on natural gas, at the Chamber of Mines in Johannesburg. Engagements are underway with leading fuel cell original equipment manufacturers to establish manufacturing plants in South Africa to expand the PGM beneficiation.
56
The following table sets forth mineral production and sales for the periods indicated.
Mineral Production
| | | | | | | | | | | | | | | | |
| Year | | Index of Production
Volume Including
Gold(1) | | | Index of Production
Volume Excluding
Gold(1) | | | Total Value of
Mineral Sales
Including Gold(2) | | | Total Value of
Mineral Sales
Excluding Gold(2) | |
2004 | | | 109.3 | | | | 99.6 | | | | 125,057.8 | | | | 95,728.1 | |
2005 | | | 110.6 | | | | 104.0 | | | | 142,817.9 | | | | 118,216.7 | |
2006 | | | 109.2 | | | | 104.1 | | | | 193,589.5 | | | | 157,184.9 | |
2007 | | | 108.2 | | | | 104.2 | | | | 224,437.7 | | | | 185,401.1 | |
2008 | | | 102.1 | | | | 100.2 | | | | 300,714.5 | | | | 254,722.3 | |
2009 | | | 95.3 | | | | 93.7 | | | | 241,364.6 | | | | 192,668.9 | |
2010 | | | 100 | | | | 100 | | | | 300,292.5 | | | | 247,199.2 | |
2011 | | | 99.1 | | | | 99.9 | | | | 370,280.7 | | | | 301,389.3 | |
2012 | | | 96 | | | | 99.6 | | | | 364,117.3 | | | | 287,292.7 | |
2013 | | | 99.5 | | | | 103.4 | | | | 397,677.9 | | | | 327,691.0 | |
2014 | | | 98.1 | | | | 102.8 | | | | 396,426.4 | | | | 333,113.6 | |
2015(3) | | | 100.3 | | | | 107.7 | | | | 194,267.4 | | | | 164,959.9 | |
Notes: —
| (2) | Rand million, through June 30, 2015. |
| (3) | Rand million, through June 30, 2015. |
Source: Stats SA.
Agriculture, Forestry and Fishing
Agriculture
South Africa has 12 million hectares of arable land, which represents approximately 10% of the country’s total land area, of which around 22% comprises high-potential arable land. Rainfall is unreliable and the country as a whole is subject to severe periodic droughts, such as in 2015. Yet South Africa remains a net food exporter and is a major exporter to the Southern African region, mainly due to the sector’s relative maturity and global competitiveness. Agricultural exports have increased by approximately 55% since 2007. The Department of Agriculture, Forestry and Fisheries (DAFF) suggests that commercial farmers produce approximately 95% of the country’s formal marketed agricultural produce. The Commercial Agricultural Census estimated that there were 39,966 commercial farming units in operation in 2007, down from 45,818 in 2002. A widely held view is that there are now about 37,000 commercial farmers in South Africa. According to the QLFS, total employment in the agriculture sector increased by 3.2% to 897,000 in the second quarter of 2015 from 869,000 in the first quarter, based on the new Master Sample that is based on the 2011 census data.
There are a number of farming regions that vary by climate, natural vegetation, type of soil and type of farming practiced. Agricultural activities range from intensive crop production and mixed farming in winter rainfall and high summer rainfall areas, to cattle farming in the bushveld and sheep farming in the more arid regions. Production under irrigation takes place on approximately 1.5 million hectares (3.2 million acres), which can be expanded by at least 500,000 hectares through better use of existing water resources and investment in new water schemes according to the NDP. Agricultural companies such as ZZ2, Karsten, Westfalia and AFGRI are well-established in the sector and have existed since the 1960s.
57
The agriculture, forestry and fishing sector made up 2.4% of total GDP in 2014 in real terms, having declined from 3.4% in 1994 due to faster growth in manufacturing and services. Real value added in the sector contracted 5.6% in the first half of 2015 compared to the same period in 2014. The contraction was driven by decreased production in summer field crops, sugar cane and wheat, due to drought conditions in the Free State, North West, Kwa-Zulu Natal and Western Cape provinces. The 2014/15 maize harvest is estimated to be 17.4% smaller compared to the record harvest in 2014 which has already increased imports, particularly of yellow maize used in the animal feed industry. Domestic maize prices have risen substantially as a result of the reduced harvest size and expectations of increased maize imports relative to the prior season, which will place upward pressure on domestic food prices going forward, as higher maize input prices pass through the value chain.
Historically, exports of processed agricultural products have outweighed exports of unprocessed agricultural products. However, in recent years, exports of fruit and vegetables have outperformed processed food products despite the latter receiving much greater amounts of government support in the form of incentives to upgrade machinery and equipment. Horticultural exports (such as grapes, citrus and nuts) are becoming increasingly important as a share of total agricultural output, replacing grains such as maize and wheat. South Africa enjoys relatively high shares of the global market for primary agricultural products such as oranges (12%), grapefruit (10%), plums (8%), greasy wool (8%), pears (6%), tree nuts (6%), fresh grapes (6%) and lemons (5%). Agricultural exports (including animal products, vegetable products, fats and oils, and prepared foodstuffs) totaled about R106 billion in 2014, representing a 14.7% increase from the 2013 value of R92.4 billion.
The New Growth Path (NGP) and NDP policy frameworks identify the agriculture sector as a key driver of job creation and will introduce measures to support growth of commercial farming and smallholder schemes with comprehensive support around infrastructure, marketing, extension services and finance. The NDP, in particular, characterizes the sector as having the potential to create job opportunities for 300,000 households in smallholder schemes and 145,000 jobs in agro-processing by 2020. The President’s nine-point action plan includes the revitalization of the agro-processing value chain and outcome 4 of the MTSF has a specific focus on addressing spatial imbalances in economic opportunities through expanded employment in agriculture. Several agro-processing schemes of various sizes are either under construction or development across various provinces. These include the R10 million Taung Agro-Hub currently under construction in the North West and the memorandum of understanding and funding agreement concluded in Kwa-Zulu Natal for 693 hectares of sugar production to expand small scale grower production in communal areas.
Agriculture is a high-risk business, with access to finance remaining a key challenge for farmers, particularly emerging farmers. A number of platforms therefore exist to improve farmers’ access to finance. These include the Land Bank, the Industrial Development Corporation (IDC) and the Micro-Agricultural Financial Institutions of South Africa (MAFISA). Following financial breakdown in 2008, the Land Bank has stabilized its financial position and will increase its developmental lending to emerging farmers over the medium term. At the same time, the IDC is targeting the agricultural sector through its R10-billion Gro-E Scheme, and the number of farmers awarded production loans under MAFISA increased from 5,310 in fiscal year 2011/12 to 4,176 in fiscal year 2012/13. The DAFF targeted 6,000 small-holder and subsistence farmers to be receiving MAFISA loans in fiscal year 2013/14 and 7,000 in fiscal year 2014/15.
The Integrated Growth and Development Plan 2012 (IGDP) has been developed by DAFF to provide a long-term strategy for the agriculture, forestry and fisheries sectors. Its aim is to provide a coordinated implementation framework linking the three sectors. The high-level responses offered in the IGDP have been translated into the Agriculture Policy Action Plan (APAP), which is the implementation arm of the IGDP. The Cabinet approved the five-year Agriculture, Forestry and Fisheries Strategic Framework, a strategic response to the NDP, and APAP in 2015. The framework sets out the key challenges faced by the three sectors and proposes interventions in four areas, namely equity and transformation; equitable growth and competitiveness; environmental sustainability; and governance. The broad objectives of APAP are to promote labor absorption and broaden market participation, and strategic interventions aimed at increasing value-chain efficiencies and competitiveness, focusing on selected sub-sectors and their value chains. The strategy and action plan will be updated on an annual basis.
58
Forestry
The forestry sector accounts for approximately 1% of GDP. It employs approximately 165,900 people of which approximately 66,000 are directly involved in forestry operations. There are approximately 534,000 hectares of indigenous or natural forests in the country which occur mainly along the southern and eastern escarpment, the coastal belt and in sheltered kloofs or ravines. There has been an increase in the use of natural forests as sources of medicine, building material, fuel and food. It is estimated that around 80% of South Africa’s population still use medicinal plants, most of which are sourced from natural forests. There are a further 1.3 million hectares of plantation forests occupying approximately 1.1% of the country’s land area.
South Africa now has a detailed inventory of all its natural forests, which are not commercially utilized extensively for forest products, but which are very important in supporting communities in subsistence needs and which also provide unique eco-tourism opportunities. These forests represent 24 broad forest types. The natural forests protected areas system, which was completed for all forests in 2004, will guide the setting aside and re-demarcation of natural forests into protected areas. South Africa also has extensive woodland (deciduous fire-climax wooded areas as opposed to evergreen natural forests) areas throughout about 29 million hectares of the country, of which approximately three quarters is privately owned.
DAFF plans to transfer the management and control of all state-owned indigenous forests, primarily to provincial government departments or national and provincial conservation agencies such as South African National Parks, SANParks, which will manage about 97,000 hectares of state forest land in the southern Cape and Tsitsikamma areas.
The Forestry 2030 Roadmap aims to achieve the effective and sustainable development of all forestry resources in South Africa. It serves as the guiding policy of the forestry sector. The Forestry BBBEE Charter, which was launched at the Forestry Indaba in April 2005, was gazetted in June 2009. The vision of the Charter is that of an inclusive and equitable forestry sector, in which black women and men fully participate and that is characterized by the sustainable use of resources, sustainable growth, international competitiveness and profitability for all its participants and a forestry sector that contributes meaningfully to poverty eradication, job creation, rural development and economic value-adding activities in the country. Under the Charter, the National Government aims to process about 15,000 hectares per year until 2019 to get a net increase in forestry of about 10,000 hectares per year.
Fishing
South Africa’s industrial fisheries are widely regarded as being among the best managed in the world. The commercial fishing industry, which includes fish, molluscs, seaweed and shellfish, contributes approximately 0.1% to GDP and directly employs about 27,000 people while another 81,000 find employment in fish processing, transporting of fish products and boat building. Marine life that is not harvested, such as whales, dolphins and seabirds, is increasingly recognized as a valuable resource for nature-based tourism. The South African fishing industry, which was once concentrated in the hands of a few, largely white-owned companies, has undergone intensive transformation over the past ten years. Transformation has taken place in a very short space of time, without compromising the principle of sustainable utilization that is fundamental to the management of fisheries.
The Integrated Coastal Management Act of 2008 replaced the Seashore Act of 1935 and the Dumping at Sea Control Act of 1980, and introduces a comprehensive national system for planning and managing South Africa’s valuable coastal areas. The Integrated Coastal Management Act declares the seashore, coastal waters (including estuaries) and South Africa’s territorial seas to be coastal public property. It therefore also requires the state to act as the trustee of coastal public property. The primary objective of the national government’s fisheries policy, as outlined in the Marine Living Resources Act of 1998, is the improvement of impoverished coastal communities through increased access to, and sustainable development of marine resources.
59
DAFF has also identified the aquaculture sub-sector as having the potential to increase the sector’s value-add and increase its employment potential, particularly for poor coastal communities. The Ocean’s Phakisa, which aims to facilitate the implementation of the NDP, identifies four priority areas to unlock South Africa’s coastal and oceanic economic potential, namely: marine transport and manufacturing; offshore oil and gas; aquaculture; and marine protection services and ocean governance. Several significant developments are taking place to expand the ocean sector’s contribution to economic growth and job creation over the medium to long term. The rehabilitation, upgrade and redevelopment of some small harbors as well as the identification and proclamation of new harbors and their integration with national coastal projects has been initiated. Amendments to the Environmental Impact Assessment and Biodiversity Regulations will reduce the timeframes for the implementation of aquaculture projects, while an Inter-Departmental Authorisations Committee has been established in order to streamline application and authorization processes. To address issues of tenure security, the Department of Public Works has awarded the first five leases to aquaculture companies in the harbors that they will be operating in, with more long-term leases for projects expected to be awarded in the coming months following approvals of applications through DAFF. A draft Oceans Management Bill was finalized in 2015 to provide an overarching, integrated governance framework for the sustainable growth of the ocean economy. Finally, the legal drafting of the regulations and declaration notices for the 21 Offshore Marine Protected Areas has been completed and consultations with relevant stakeholders have been conducted.
Electricity, Gas and Water
South Africa generates two-thirds of Africa’s electricity. More than 85% of South Africa’s electricity is coal-generated. Koeberg, a large nuclear station near Cape Town, provides about 5% of capacity. A further 5% is provided by hydro-electric and pumped storage schemes.
Generation of electricity in South Africa is currently dominated by Eskom, the national wholly state-owned utility, which also owns and operates the national electricity grid. The company supplies about 95% of South Africa’s electricity. It is regulated by the National Energy Regulator of South Africa (NERSA), which is also mandated to regulate electricity departments of local authorities as well as the piped-gas and petroleum pipeline sectors.
During the first half of 2015, supply remained severely constrained, with frequent rotational load curtailment to manage the supply shortfall arising from Eskom’s installed capacity being taken offline for scheduled or unplanned maintenance. Generation capacity and growth of the sector will remain constrained over the medium term given supply challenges, but strategies implemented by the government are expected to help support the sector.
In the short to medium term, South Africa’s increased power needs will be met by two new coal-fired power stations, Medupi and Kusile. The projects have been financed by a mix of higher electricity tariffs, debt issued by Eskom, backed by a government guarantee, and loans from multilateral development banks. Unit 6 of Medupi power station entered full commercial operation in August 2015, adding an additional 794 MW permanent supply to the national grid.
As of October 2015, 92 projects have been selected as part of the Renewable Energy Independent Power Producer Procurement Program (REIPPPP), representing R193 billion in private sector investment and 6,327 MW of additional capacity to the national grid. The Minister of Energy has recently issued a determination to procure another 6,300 MW through the REIPPPP – which is expected to boost electricity capacity by 17,000 MW by 2022. The Government is also expanding the independent power producer programme to include other generation technologies and NERSA has approved 1,350 MW of short-term power-purchase contracts in 2015/16. An additional 2,500 MW of coal, 3,126 MW of gas, 1,800 MW of co-generation and 2,609 MW of imported hydro power generation capacity is expected to be connected to the grid between 2020 and 2025.
60
Electricity tariffs have been increasing at levels above inflation since 2008 to reach cost reflectivity. In February 2013, NERSA granted Eskom yearly increases of 8% for the period from 2013/14 to 2017/18. However, Eskom is facing a R225 billion shortfall over the MTEF. In July 2015, the Government sold its 13.91% share of Vodacom, the mobile services provider, to finance a R23 billion allocation to Eskom to address its funding shortfall. In 2015, NERSA rejected Eskom’s bid to increase the 2015/16 electricity tariff to 25.3% for failing to meet various technical requirements. Instead, electricity tariffs increased by 12.7% from July 2015 based on previously approved applications. NERSA however indicated that it remains open to Eskom submitting either an application for adjustments allowed for in the Multi Year Price Determination (MYPD) methodology, or, alternatively, a new application for the period April 1, 2016 to March 31, 2019. The Government has also targeted the recovery of unpaid municipal bills as a way to support Eskom’s financial recovery, compelling defaulting municipalities to enter into repayment arrangements.
Over the longer term, South Africa’s envisaged energy generation and transmission needs and provision are outlined in the Department of Energy’s Integrated Resources Plan (IRP) and Integrated Energy Plan (IEP). The IEP, covering the time between 2010 and 2050, is designed to guide future energy infrastructure investment and policy. The IRP seeks to diversify the energy mix in South Africa to include gas, imports, nuclear, biomass, and renewable, as well as use to the existing coal resources more efficiently and in a more environmentally friendly manner. The IRP aims to create an additional 42.6 GW of total capacity by 2030: 17.8 GW from renewable, 9.6 GW from nuclear, 6.3 GW from coal and the remainder from other generation sources. This mix should help South Africa to meet its commitments to climate change imperatives such as the Copenhagen Accord. As announced in the 2015 MTBPS, the National Treasury has allocated R200 million to the Department of Energy for preparatory work to consider the costs, benefits and risks of building four more nuclear power stations in South Africa.
Oil and Gas
The wholesale and retail markets for petroleum products in South Africa are subject to a set of government controls. The Government regulates wholesale margins and controls the retail price of petrol. The petrol retail price is fixed on a monthly basis, but varies each month with respect to global crude oil prices, the Rand/Dollar exchange rate and taxes. The administration of the pricing regulation is done by the Central Energy Fund on behalf of the DOE.
South Africa has very limited oil reserves. Approximately 60% of its crude oil requirements are met by imports from the Middle East and Africa.
PetroSA is a subsidiary of the Central Energy Fund (CEF) and is the National Oil Company (NOC) of South Africa. CEF is wholly-owned by the State and reports to the Minister of Energy. PetroSA’s flagship operation and main contributor to its revenue is its Gas to Liquid (GTL) plant located in Mossel Bay. The Mossel Bay plant is the third largest out of the five such plants globally and is capable of producing a crude oil equivalent of 45,000 barrels per day.
South Africa continues to support efforts to enhance the exploration of mineral resources, especially energy sources. According to 2015 data from the Department of Energy, South Africa’s recoverable gas resources are approximately 9 Trillion Cubic Feet (TCF) offshore through conventional drilling, 9 TCF in shale in the Karoo Basin, out of a potential 120 TCF resource, and around 1.5 TCF from coal bed methane. The Government aims to procure 3,126MW of power from gas in the period between 2019 and 2025 as a way to diversify its energy mix away from an over-reliance on coal-fired power plants.
The South African government has identified the ocean’s economy as a source of significant potential growth and launched an Ocean’s Economy Phakisa—the first of a series of initiatives adopting the Malaysian government’s “Big Fast Results Methodology” which brings stakeholders together to identify reforms and enable effective strategic planning. The goal of the offshore oil and gas exploration component of the Ocean’s Phakisa is the drilling of 30 exploration wells in ten years, to produce 370,000 barrels of oil and gas per day. Environmental authorization has been given for the Burgan Fuel Storage facility in the port of Cape Town.
61
Recently, the Department of Environmental Affairs has issued an environmental authorization for Shell, giving it permission to drill up to two offshore exploration wells in the northern portion of the license area, off South Africa’s west coast. The Department of Energy’s request for information about potential bidders for independent gas-fired power producers, which closed in July 2015, attracted about 200 submissions.
The finalisation of the MRPD Amendment Bill, currently in the Parliamentary process, is designed to assist South Africa to accelerate offshore oil and gas exploration. According to the Department of Energy, because the IRP 2013 policy did not sufficiently take into consideration all fuel sources, such as gas, it will be amended by the second quarter of 2016. In addition, the Department of Energy’s Gas Utilisation Master Plan (GUMP) has been developed, but has yet to be released for public comment. The plan provides a framework for investment in gas infrastructure and sketches the future role of gas in the electricity, transport, domestic, commercial and industrial sectors.
Water
South Africa is largely a semi-arid and water scarce country with a mean annual rainfall of 490mm, half the world average. South Africa’s inland water resources include 22 major rivers, 165 large dams, more than 4,000 medium and small dams on public and private land and hundreds of small rivers.
The Department of Water and Sanitation (DWS) is the government department with the mandate to regulate the water sector nationally, develop national policy, standards and guidelines, and provide targeted support and information management. The DWS also gives strategic direction for water resources management in the National Water Resource Strategy (NWRS), which provides the framework for the protection, use, development, conservation, management and control of water resources for South Africa, as well as the framework within which water must be managed at catchment level, in defined water management areas.
The DWS is in the process of reviewing the raw water pricing strategy, infrastructure funding model and economic regulation of the sector. The 2013 review of the Raw Water Pricing Strategy addressed the issue of water scarcity and how to best use water pricing as a tool for driving more efficient water-use without having a negative effect on small-scale or under-resourced water users.
South Africa has met the Millennium Development Goals of halving the population without access to water and sanitation. In 1994, only about 59% of South Africa’s population had access to water supply infrastructure—as of March 2012, the number rose to 94.7%. Similarly, access to basic sanitation services increased from 49% in 1994 to 79% in 2010. In order to ensure that the needs of the water-stressed Gauteng region, the economic hub of South Africa, continue to be met, Phase Two of the Lesotho Highlands Water project, which will now include a pumped storage scheme, was launched in March 2014. The Lesotho Highlands Water project is developed in partnership between Lesotho and South Africa, under a treaty signed in 1986, and comprises a system of several large dams and tunnels throughout Lesotho and South Africa. The current phase of the project, the second out of four, is expected to increase the annual transfer to South Africa’s Vaal River system from 10 to 15 billion cubic meters by 2024. This phase, which is expected to cost R17 billion, includes the construction of the Polihali Dam, a tunnel and related developments, as well as a pump storage scheme which will generate 1,200 MW.
Over the MTEF, funding has been allocated to 229 water and infrastructure sanitation projects. These include 21 projects with a total cost of more than R1 billion. There are 60 large projects and 148 small projects mainly funded through the regional bulk infrastructure grant, which has allocated R15.1 billlion over the MTEF. This funding will also finance the construction of 76 regional bulk schemes to be completed over the next three years.
While substantial progress has been made in reducing the backlog in the provision of basic water and sanitation services, greater focus is now being placed on regulating the quality of water. In 2008, the DWA introduced a system of incentive-based regulation which is aimed at assessing the quality of water within various municipalities and municipal systems in line with international best practice. The system was defined by two programs: the Blue Drop Certification Program for drinking water quality management regulation and the Green Drop Certification Program for wastewater quality management regulation.
South Africa’s drinking water quality matches best international practice and follows the guidelines set out by the World Health Organization. The latest version of the Green Drop Report (2013) indicated that 41% of the 914 water supply systems assessed require attention. Similarly, 55% (or 821) waste-water treatment works require serious and urgent refurbishment.
62
The South African government has launched a wide ranging ten-year program to address water supply and sanitation backlogs affecting under-serviced households. Improvements to bulk water infrastructure has been prioritized and the resources made available to local government to deliver water and improve sanitation (including eliminating bucket toilets) will grow strongly. Initiatives are expected to fast-track the issuing of water licenses, expand the water system capacity, speed up build programs, address backlog projects and rehabilitate and upgrade existing water and sanitation infrastructure across the country.
Construction
The construction sector accounts for 3.8% of total GVA and a similar percentage of total employment. The rebound in the construction sector recorded in the second half of 2014 lost momentum in the first half of 2015. Growth in real value added by the sector had maintained a modest upward trend, improving to 2.9% in 2014, from 2.7% in 2013 and 2.0% in 2012, but decelerated to 1.9% year-on-year in the first half of 2015. These growth rates are well below the peak of 15% observed in 2007. Employment in the construction sector contracted by 4.4% year-on-year in the first half of 2015, following a contraction of 0.4% in 2014.
Adverse economic conditions continue to depress demand in the sector. Composite building plans completed increased by 4.0% year-on-year in the first half of 2015, led by growth in the residential sector, where building plans completed rose by 4.4% year-on-year. The non-residential sector, however, contracted by 13.7% year-on-year and additions and alterations contracted by 2.4% year-on-year in the first half of 2015 as private sector investment decelerated. Although building plans passed—an indication of possible pipeline activity—increased by 11.7% year-on-year in the same period, weak household disposable income growth, and low consumer and building confidence levels are expected to weigh on growth in residential building construction.
Public infrastructure spending is budgeted at R813 billion over the next three years, which should assist stimulating growth in civil construction. Despite the overall slowdown in investment brought about by the weakness in private sector investment, public corporations and general government increased their capital outlays on infrastructure projects relating to road networks, energy, water, transportation and education in the first half of 2015. Continued improvements in the ability of provincial and local government entities to reach their infrastructure spending targets will be critical in this regard, and the Government is taking action to improve its capability to plan and implement infrastructure projects. The Budget Review 2015 allocated 20% of this spend on energy and 42% will be spent on transport and logistics. Other economic services, which include spending on agriculture and environmental infrastructure, will get 5% of the allocated amount. Water and sanitation is allocated 14% of the total budget.
Building Construction
Building construction comprises the activities of general contractors engaged in the building, alteration, repair or demolition of buildings. Subcontractors appointed to perform work such as painting, plumbing, electrical installation, bricklaying and other related work are also included in this sector. Enterprises operating in this sector vary from large building contractors to many smaller contractors and subcontractors. Major inputs to this sector are non-metallic mineral products, electrical machinery and basic iron and steel. Although its contribution to GDP is relatively low, this sector is labor-intensive and utilizes mainly semi-skilled or unskilled labor.
The National Government has implemented a housing subsidy policy, tender procedures and contract procurement policies that are directed towards facilitating the growth of the emerging construction sector.
The Housing Accord in 1994 established procedures to ensure the delivery of 350,000 low-cost houses per year, with a goal of delivering one million houses by 1999. To date, over three million housing units have been delivered since 1994, although there is an estimated backlog of 2.1 million houses remaining. According to the 2015 Estimates of National Expenditure, it is projected that an additional 66,655 houses will be completed in fiscal year 2015, 103,983 houses in fiscal year 2016 and 113,588 houses in fiscal year
63
2017. The government will implement the human settlements reforms in the MTEF with the aim of ensuring that poor households have adequate housing in better living environments, to support the development of a functional and equitable residential property market, and to improve institutional capacity and coordination for better spatial targeting.
Civil Engineering
Civil engineering includes contractors primarily engaged in construction work such as airports, dams, electricity networks, harbors, pipelines, railway lines and roads. The demand for labor consists mainly of production workers and artisans (unskilled and semi-skilled workers).
The civil engineering sector provides most of its own raw materials, but also uses non-metallic mineral products, iron and steel.
The civil construction industry is characterized by a high degree of economic concentration. The Construction Charter, which took effect from June 6, 2009, aims to involve historically disadvantaged individuals and smaller businesses in construction activities. The Construction Industry Development Board (CIDB) has developed standards and procedures for government tenders which are intended to help simplify tender procedures, particularly for small construction contractors.
This sector’s share of production is very sensitive to cyclical economic activity, with almost three-quarters of the domestic demand for the sector’s output generated by domestic fixed investment. In the face of weakened private activity, improved investment by the general government and public corporations has proved helpful in keeping the sub-sector afloat. However, delays in projects undertaken by public corporations and capacity issues constraining project implementation at the local and provincial government levels have constrained growth. In response to concerns around capacity issues, the Government has instituted various capacity-building initiatives, such as the Infrastructure Delivery Improvement Program (IDIP), the infrastructure skills development grant and the municipal infrastructure support agency. Over the medium term, R452.7 million in the Infrastructure Development Support subprogram is projected to be spent to deploy 36 long-term technical assistants to train provincial officials on the infrastructure delivery management toolkit. In addition, the Cabinet has established the Presidential Infrastructure Coordinating Commission (PICC) in 2011, which integrates and coordinates long-term infrastructure builds, raising the level of investment spending and contributing to industrial and regional development.
Informal Sector of the Economy
With neither the public or formal private sectors able to create enough jobs for the expanding labor force, the informal sector represents an alternative source of jobs or self-employment for rural areas, newly urbanized or formally unemployed. The informal sector’s share of GDP was estimated at 5.9 % in 2013. This sector employs approximately 2.7 million people (excluding agriculture and domestic service) and, as of September 30, 2015, accounted for 17% of total employment.
Informal enterprises encompass a very wide range of activities, such as the production of marketable products, the distribution of merchandise and the provision of services. Informal enterprises also mobilize capital at a grass-roots level for the provision of dwellings and community-based services. The businesses in this sector typically operate at a low level of organization and on a small scale, with little or no division between labor and capital. Given the informal sector operates outside the legislated labor environment, employment tends to be casual, based on kinship or personal and social relations rather than on contractual arrangements with formal guarantees.
64
Employment and Trade Unions
Employment
Employment remains one of the key challenges for the South African economy. Faster growth is required over an extended period of time to significantly increase labor absorption, reduce high unemployment and achieve a more equitable distribution of income.
Employment growth has not been fast enough to absorb the increasing labour force and the structural backlog of unemployment. Since the end of 2010—the trough of the employment downturn—to June 30, 20154 the labor force has grown by 14%. The labour force participation rate increased by 3.1 percentage points to 58.1% over the same period. Over 40% of the population are not economically active. The official (narrow) unemployment rate increased from 23.9% in December 2010 to 25% in June 2015, while the broad unemployment rate (which includes discouraged workers) has hovered around 32%. This has meant an increase in the unemployed by 862,000, and discouraged by 258,000. In comparison, employment has grown by 12%, or 1.8 million employees. Employment growth has been high in agriculture and the informal sectors, growing by 27%5 and 15%, respectively, for the same period.
Total employment per sector
| | | | | | | | | | | | | | | | |
| Total formal and informal employment per sector | | Total employed | | | As a percentage | | | Change since December | | | Average growth
per year since | |
| as at June 30, 2015 | | (thousands) | | | of total | | | 2010 (thousands) | | | December 2010 | |
Mining | | | 446 | | | | 3 | % | | | 125 | | | | 7 | % |
Manufacturing | | | 1756 | | | | 11 | % | | | -133 | | | | -1 | % |
Utilities | | | 136 | | | | 1 | % | | | 40 | | | | 8 | % |
Construction | | | 1401 | | | | 9 | % | | | 286 | | | | 5 | % |
Trade | | | 3119 | | | | 20 | % | | | -7 | | | | 0 | % |
Transport | | | 922 | | | | 6 | % | | | 117 | | | | 3 | % |
Financial Services | | | 2164 | | | | 14 | % | | | 464 | | | | 5 | % |
Community | | | 3548 | | | | 23 | % | | | 563 | | | | 3 | % |
Agriculture | | | 869 | | | | 6 | % | | | 220 | | | | 6 | % |
Private households | | | 1292 | | | | 8 | % | | | 80 | | | | 1 | % |
Other | | | 4 | | | | 0 | % | | | 3 | | | | 98 | % |
Total | | | 15657 | | | | 100 | % | | | 1758 | | | | 2 | % |
Source: QLFS, Stats SA
Formal non-agricultural employment has been the main source of employment, with the private sector representing 77% of employment. A quarter of the jobs created since the end of 2010 to June 30, 2015 have been in the government sector. Fiscal constraints are likely to inhibit further growth in government employment. The Government’s fiscal consolidation objectives have been made more challenging by the recently concluded wage settlement in the public sector, which reached 10.1%. In order to meet fiscal targets, the settlement was funded through a combination of drawing down on the contingency reserve, reprioritizing, within existing baselines reducing headcount, withdrawal of funds from vacant positions, amongst other measures. The 2015 MTEF had included significant unallocated resources intended to finance new policy initiatives in the MTSF. However, as a result of the 2015 public-sector wage settlement, the bulk of these resources will be shifted towards public wage increases rather than new initiatives or for other development. Over the MTEF, the budget shortfall associated with the wage settlement is at least R62 billion higher than the originally forecasted compensation budget, assuming that CPI inflation is in line with projections at the time of the 2015 Budget. Departments are now expected to adjust their spending plans, and the budgets for vacant posts will now be required to compensate existing employees. To the extent that these measures to do not suffice in covering the shortfall, the rest will come from contingency reserves.
Mining and manufacturing sectors have reduced their workforces by 3% between 2010 and 2015. Over two-thirds of the country’s total job losses have been in the manufacturing sector, while restructuring in the mining sector has led to recent announcements of possible retrenchments. However, there has been strong employment growth in the
| 4 | All figures relating to labor market statistics, such as unemployment, labor force participation, are from the Quarterly Labor Force Survey, which is a household survey. All statistics relating to formal non-agriculture formal employment are from the Quarterly Employment Survey, which is based on a payroll sample from firms, and is deemed more reliable for sector employment figures. Starting in January 2015, the estimates are based on a new master sample affecting comparability with previous periods. |
| 5 | This change may be overstated due to change in the sampling technique in the Quarterly Labor Force Survey starting in January 2015, which was not retrospectively applied. Thus changes should be interpreted with care. |
65
wholesale and trade sector, and the financial services sector. The wholesale and trade sector currently employs over 20% of the workforce, and has increased by almost 10% in the last five-and-a-half years. Financial services employment has also increased by 5% since December 2010.
The following table sets forth the change in formal, non-agricultural, formal employment and the percentage of registered unemployed people for the periods indicated.
| | | | | | | | | | | | | | | | | | | | | | | | | | | | | | | | |
| | | For the year ended December 31, | | | | | | | |
| | | 2008 | | | 2009 | | | 2010 | | | 2011 | | | 2012 | | | 2013 | | | 2014 | | | 2015(1) | |
Employment (% change on prior year)(2) | | | | | | | | | | | | | | | | | | | | | | | | | | | | | | | | |
Public Sector(2) | | | 4.7 | | | | 3 | | | | 2 | | | | 4.7 | | | | 1.9 | | | | 2.3 | | | | 4.2 | | | | -4.4 | |
Private Sector(2) | | | 1.2 | | | | -4.5 | | | | -1.4 | | | | 1.6 | | | | 1.1 | | | | -0.1 | | | | -1 | | | | 1 | |
Total | | | 1.9 | | | | -2.9 | | | | -0.6 | | | | 2.3 | | | | 1.3 | | | | 0.5 | | | | 0.2 | | | | -0.4 | |
Official Unemployment(3) (%) | | | 22.5 | | | | 23.7 | | | | 24.9 | | | | 24.8 | | | | 24.9 | | | | 24.7 | | | | 25.1 | | | | 26.4 | |
Notes: —
| (1) | Three months ended March 31, 2015. |
| (2) | Employment in the formal non-agricultural sectors |
| (3) | QLFS as at June 30, 2015. Starting in January 2015, the estimates are based on a new master sample, which impacts comparability with previous periods. |
Source: Stats SA
The National Government has placed job creation and skills development at the heart of its policies, by promoting an environment that is conducive to private sector growth and investment, with future legislation and regulation being subject to a socioeconomic impact assessment before being passed, and microeconomic reform as well as by directly impacting on employment levels through public sector hiring and targeted job-creation programs.
To support job creation for young people, on January 1, 2014, the National Treasury launched the Employment Tax Incentive which reduces the employers’ costs of hiring young people. Total claims for the employment tax incentive amounted to R3.9 billion since the start of the program until July 31, 2015. According to the monthly returns, over this time the incentive has been claimed by 36,616 unique employers. Initial estimates suggest the bulk of the claims come from the wholesale and retail, financial and business services, manufacturing and agricultural sectors. Evidence-based evaluation of the employment tax incentive will be concluded during 2016, as sufficient data becomes available. For the first year of the incentive, it was estimated to have been claimed for at least 254,000 workers.
The Employment Public Works Program (EPWP) (including the Community Works Program) is designed to provide poverty and income relief and has created over one million jobs in 2014/15. To help meet the target of creating over six million work opportunities, the Government has committed R6.8 billion over the MTEF to EPWP.
The Department of Labor is also developing its Employment Services South Africa system, which placed 15,570 work-seekers in registered vacancies in 2013/14. However, placement is severely hampered by a skills mismatch.
66
More broadly, the National Government has strengthened small business financial and advisory support, drawing on both public and private sector capacity, given their importance for job creation and continues to provide significant support for education. In the 2014 State of the Nation Address, President Jacob Zuma established a Department of Small Businesses Development (SBD) to provide extensive support to small business and cooperatives. Areas of focus include support for township economies jointly with Economic Development departments and the implementation of the entrepreneurship programme through centres for entrepreneurship (such as innovation and entrepreneurship hubs) based in all nine provinces.
Education, skills, employment and unemployment
There is a positive correlation between skills levels (as proxied by educational attainment) and employment. Individuals with lower skills levels represent the majority of the unemployed. For the six months to June 30, 2015, narrow unemployment stood at 32.2% for workers with less than complete secondary education, while it falls to 25.6% for workers with completed secondary education and 11.5% for workers with technical or academic qualifications beyond secondary education.
Education
Education is one of the National Government’s priority areas. This prioritization is reflected in the total government expenditure on education—at 19.5% of consolidated government expenditure in fiscal year 2015/16, South Africa’s total expenditure on education lies in the upper part of the 15% to 20% threshold as set by the Education for All initiative in 2008.
The NDP aims to ensure that the education system has clear linkages between schools, FET colleges, universities and other education and training providers. There should also be clear linkages between education and training and the world of work. The Department of Basic Education supports education in schools and the Department of Higher Education and Training (DHET) is dedicated to intermediate and high-level skills development at post-school level, which includes Further Education and Training (FET) Colleges, higher education institutions and the skills development agencies (Sector Education and Training Authorities and the National Skills Fund).
According to Education Statistics 2013, published in March 2015 by the Department of Basic Education, the South African education system had 12.9 million students, 447,149 educators and 30,027 schools, of which 1,584 were independent schools. With enrolment and gender parity virtually achieved, particularly at primary school level where the gross enrolment ratio is 96 for girls and 101 for boys, the focus is on improving the quality of education, rather than access. Improving learner performance in literacy and numeracy is central to the overall improvement in education outcomes at all levels.
There is recognition that performance in mathematics and science needs to be substantially improved. In 2004, the National Government introduced the Dinaledi Schools, which channel additional resources to 500 disadvantaged schools to increase the quality of education and student performance with regards to mathematics and science. Dinaledi Schools are provided with additional learner and teacher support materials as well as teacher development and support. In 2011, 54% of Dinaledi students studying mathematics achieved high level scores and 63% of students studying science achieved high level scores. A dedicated funding stream for Dinaledi Schools in the form of a conditional grant was introduced in fiscal year 2011 with an initial allocation of R70 million, increasing to R116 million in fiscal year 2015, to further strengthen this program. This grant was replaced by a Maths, Science and Technology grant in 2015/16 which expanded the scope to include Technology and it is not limited to Dinaledi schools anymore. The initial allocation of R347 million in 2015/16 increases to R385 million in 2017/18.
To address the impact of poverty on educational opportunities, a “no-fee schools” policy was introduced in 2007 that ensured that the poorest 40% did not have to pay school fees. According to the 2014 Budget Review, 60% of schools do not charge fees, up from 40% five years ago. These “no-fee schools” receive additional resources to provide the necessary learner and teacher support materials. In 2007, five million learners had access to free education, which, by 2014, had risen to 8.8 million.
67
Another key poverty–alleviation program is the National School Nutrition Program (NSNP), which provided daily meals to 9.2 million learners (71.8% of total learners) in the 2012/13 financial year. The NSNP is funded by means of a conditional grant, and is allocated R18.0 billion between 2015/16 and 2017/18, with the aim of enhancing the learning capacity of poor students by providing them with a nutritious meal every school day.
A safe and secure learning environment is a critical element to improving the quality of learning and teaching. Schools are expected to meet minimum norms and standards for school infrastructure by 2016. To this end, the school infrastructure backlogs grant and the education infrastructure grant to provinces are allocated R37 billion between 2015/16 and 2017/18. This complements funds already in the baselines of provincial education departments for school infrastructure.
Access to university education has steadily increased, with enrollment up from 837,776 in 2009 to 983,698 in 2013 academic year. One of the key outputs identified under this priority outcome is to specifically increase the number of science, engineering and technology graduates because of the contribution that these graduates can make to the economic growth that the country seeks. Additional grant funding is provided to those universities that are able to increase enrollment and graduation numbers in these key areas.
FET Colleges are also recognized as primary sites for skills development. Quality is also a concern at these colleges and the DHET has committed to implement measures that aim to address poor performance at these FET Colleges. For example, the White Paper on Post-School Education and Training indicated that the Quality Councils and the new South African Institute for Vocational and Continuing Education and Training (SAIVCET) will monitor and evaluate the quality of education in these colleges. The Sector Education and Training Authorities (SETAs) and the National Skills Fund, the key workplace skills development agencies, intend to spend R51.9 billion between 2015/16 and 2017/18 on a range of skills development programs.
Urgent reform of the financing of higher education—and particularly university education—will take place over the medium term, initiated by a freeze on student fee increases recently announced by the President. In order to ensure that the poor are also able to access opportunities at universities and FET Colleges, a total of R33.2 billion will be made available over the MTEF for poor learners to access programs at these institutions through the National Student Financial Aid Scheme.
Trade Unions and Labor Disputes
The Labour Relations Act promotes collective bargaining through, among other things, protecting organizational rights for unions and the right to strike. Trade union representation is an accepted fact of industrial practice in South Africa. Almost all sectors of the economy, including the public service, have representative unions which engage employers over issues affecting their workforce.
Union density serves as an indication of the strength and potential influence of unions in the economy. South Africa’s union density is quite high. Although the number of registered trade unions initially increased from 248 in the mid-1990s to about 500 in calendar year 2004, it has declined over the last few years. As at October, 2015 the number of registered trade unions was 184.
Most trade unions in South Africa are organized in federations, of which there were approximately 23 affiliated to the Department of Labour as at the time of the most recently available information. The largest federation is the Congress of South African Trade Unions (COSATU), which had 20 affiliates and approximately 2.2 million members as of 2012. However, following the official expulsion of the National Union of Metal Workers South Africa (NUMSA), this number has reduced by 350,000. COSATU includes the National Union of Mineworkers, the South African Clothing and Textile Workers Union, the Food and Allied Workers Union and the National Education, Health and Allied Workers Union. Other significant federations include the Federation of Unions of South Africa and the National Council of Trade Unions. Federations are not required by law to register, so it is difficult to accurately estimate the total number of federations, trade unions or the total membership of all of South Africa’s trade unions.
The Labor Relations Act of 1995 (Labour Relations Act) promotes collective bargaining through, among other things, protecting organizational rights for unions and the right to strike. The right to strike is contingent on the exhaustion of dispute procedures and on the condition that the industry does not provide essential services. The Labour Relations Act also establishes a framework for the formation of bargaining councils to determine matters within the public sector and each industrial sector, the criteria for which are to be established by the National Economic Development and Labour Council. When employers and employees cannot agree on the formation of a bargaining council, a statutory council may be formed. In addition, the Labour Relations Act sets out the procedures for instituting legal strikes, introduces special requirements for the use of secondary strikes, picketing, protest action and replacement labor and protects an employer’s right to have recourse to lockout. The Labour Relations Act also introduces workplace forums to promote ongoing dialogue between workers and management and simplifies the procedures for the registration of unions.
68
The Labour Relations Act permits the use of privately negotiated dispute resolution procedures and also encourages a centralized dispute resolution mechanism. The Commission for Conciliation, Mediation and Arbitration (CCMA) is responsible for attempting to resolve industrial disputes through conciliation and mediation. If these attempts fail, the CCMA may determine the dispute by arbitration or the parties may refer the dispute to the Labour Court unless it falls into the categories that must be resolved finally by arbitration and may not be referred to the Labour Court. The Labour Court is comprised of both trial and appellate divisions and, together with the High Court of South Africa and Supreme Court of Appeals, has jurisdiction over all matters referred to it under the Labour Relations Act.
Amendments to the Labour Relations Act adopted in 1998 enhanced the institutional functioning of the CCMA by ameliorating the case flow, phasing out the industrial court (the forerunner of the Labour Court) and improving the efficiency of bargaining councils. These amendments also established new levels for minimum conditions of employment in respect of working hours, leave and the employment of minors. Legislation also provides mechanisms to set minimum wages and to provide flexibility in employment circumstances in order to meet the variable needs of individuals and employers. Further amendments to the Labour Relations Act were enacted in August 2002 and provide for, among other things, improved collective bargaining practices, amendments to trade union registration procedures, changes in workday and overtime allocations and due process in the event of dismissals.
The Labour Relations Amendment Act in 2014 gave legal power to the CCMA to approach negotiation parties to assist in resolving issues. It is expected that this will help avoid disruptions to the economy. The CCMA has already demonstrated success in this regard, and has cut the duration of arbitration proceedings by more than 75 per cent since 2003. The CCMA was heavily involved in the private security sector negotiations since violent strikes in 2005/06, which has avoided industrial action in its wage negotiations this year.
The following table shows the number of man-days lost as a result of strikes and work stoppages for the periods indicated.
Man-Days Lost to Strikes and Work Stoppages
| | | | |
| Year | | Number of Man-Days Lost | |
2004 | | | 1,100,000 | |
2005 | | | 2,300,000 | |
2006 | | | 2,900,000 | |
2007 | | | 12,900,000 | |
2008 | | | 991,000 | |
2009 | | | 2,900,000 | |
2010 | | | 14,600,000 | |
2011 | | | 6,200,000 | |
2012 | | | 3,500,000 | |
2013 | | | 5,200,000 | |
2014 | | | 11,600,000 | |
2015(1) | | | 176,000 | |
Note: —
Source: The Wage Settlement Survey Quarterly Report, Andrew Levy Employment Publications.
69
Industrial action is well below 2010 levels. The number of working days lost fell to 176,000 for the six months ended June 30, 2015, from 7.5 million for the same period in 2014 and below a historic ten-year average of 6.3 million working days. Most industrial action in 2015 was short-lived or company specific. This comes off the back of the five-month platinum strike in 2014. The major strike trigger was wages, accounting for 49% of working days lost and 46% of the number of strikes in June 2015. Wage negotiations in the gold and coal sector were settled quickly, with minimal strike action. Coal sector workers of one union went on strike for one week, while a sector-wide strike in gold was averted through company-level agreements.
Labor Legislation
Since 1994, significant legislation has been adopted designed to improve labor relations, the quality of employment, skills development and employment equality. South African labor legislation promotes equity in employment and prohibits discrimination in the workplace on the grounds of race, gender, sex, pregnancy, marital status, family responsibility, ethnic or social origin, color, sexual orientation, age, disability, religion, HIV status, conscience, belief, political opinion, culture, language or birth.
To realize these objectives, legislation requires all employers to take steps to end unfair discriminatory practices and policies. In addition, legislation mandates designated employers to prepare and implement employment equity plans and to report to the Department of Labour on their progress in ending unfair discriminatory practices and in promoting equity.
Post-1994, the following acts were promulgated to govern labor market activity and these include:
| | • | | the Compensation for Occupational Injuries and Diseases Act of 1993, which regulates safety and health matters in the workplace; |
| | • | | the Labour Relations Act of 1995, which applies to all workers and employees and aims to promote economic development, social justice, labor peace and democracy in the workplace. It affords workers protection in line with international standards; |
| | • | | Basic Conditions of Employment Act of 1997, which applies to all workers and regulates leave, working hours, employment contracts, deductions, pay slips and termination; |
| | • | | the Employment Equity Act of 1998, which protects workers and job seekers against unfair discrimination and provides a framework for the implementation of affirmative action; |
| | • | | the Skills Development Act of 1998 and Skills Development Levies Act of 1999, which aims to develop the skills in the South African labor force as well as outlines how employers should contribute to the NSF; |
70
| | • | | the Unemployment Insurance Act of 2001 and Unemployment Insurance Contribution Act of 2002 outlines the security available to workers when they become unemployed as well as how to contribute to the UIF Contribution Fund; and |
| | • | | The Employment Services Act of 2014 came into effect in August 2015. It provides for the creation of a Public Employment Service, and will provide state assistance to unemployed job seekers. Assistance will take the form of improved matching and placement of work seekers with opportunities, as well as through training. This act repeals the Employment Services provisions contained in the Skills Development Act. |
The Department of Labour has enacted amendments to the Basic Conditions of Employment Act, Employment Equity Act and Labour Relations Act to update and improve legislation periodically. The amendments to the Labour Relations Act deal with two main issues. First, offering more protection to non-standard employment (temporary workers, fixed and part-time contract workers). Temporary work is extended to three months to allow for genuine temporary work. For a fixed term contract beyond three months, the worker is entitled to be treated equally to a permanent employee. Both the employment service providers and their clients have joint and several liability for non-compliance. There must also be sufficient justification for fixed contract rather than absorbing workers into the permanent workforce. Part-time workers should also be treated on the whole not less favourably than comparable full-time employees, including access to training and skills development. Second, the amendments seek to enable a better dialogue in difficult wage negotiations and reduce the likelihood of disputes disrupting the economy; the CCMA is given legal power to approach negotiating parties to assist in resolution.
The amendments to the Basic Conditions of Employment Act include: the extension of the scope of the prohibition and regulation of work by children; empowering the Minister of Labour to regulate a broader range of matters in sectoral determinations (minimum wages for sectors where workers are particularly vulnerable); simplifying the Department of Labour’s ability to take enforcement steps against non-compliant employers (and to access the Labour Court for this purpose); and increasing penalties and maximum sentences for non-compliance.
The amendments to the Employment Equity Act clarified who qualifies as a member of the “designated groups”, and reduced the number of factors considered when assessing compliance, as well as increased the penalties for non-compliance. Regulations published under the Act provide good practice for determining equal pay for work of equal value.
Benefits
Although the National Government has not established a comprehensive welfare system of the type found in many industrialized countries, it does maintain a variety of social benefit schemes relating to, among other things, compensation for occupational injuries and diseases, occupational health and safety, unemployment insurance, old age, disability and survivor benefits, child support grants, unemployment, sickness and maternity benefits, worker injury benefits and various health care benefits targeted to certain persons. Other programs provide for a developmental social welfare program to ensure, among other things, delivery of benefits to the poorest South Africans and improved social insurance. These programs are funded largely from budgetary allocations and through improved efficiency of delivery of services, subsidies or payments. South Africa is considering the introduction of a comprehensive social security system.
Prices and Wages
Consumer inflation moderated from 6.6% year-on-year in June 2014 to a trough of 3.9% in February 2015 but has increased to 4.6% in September 2015. The slowdown in inflation was driven by declines in the oil price and food inflation. Since June 2014 the price of Brent crude oil has fallen by more than 50%, leading to transport deflation. Food inflation slowed for ten consecutive months from August 2014 before reaching its lowest point of 4.3% in June 2015. This was driven by lower global food prices, subdued agricultural producer prices and favorable base effects. For the first nine months of 2015, inflation has averaged 4.5%, lower than the 6.1% average of 2014 and 5.8% in 2013. Core inflation, which represents the long-run trend of the price level and excludes temporary shocks, was unchanged at 5.7% over the same period. Most upward pressure in core inflation has been generated by utilities, medical aid and education. In contrast, administered prices continued on their downtrend from double-digit levels in mid-2013, averaging just 0.8% in the first nine months of 2015. This has been led primarily by lower petrol costs.
Upward pressure on food, petrol and electricity inflation is, however, expected to push CPI inflation above the 6% target ceiling in the first half of 2016. The forecast takes into account a 12.7% per year increase in electricity prices. Upside risks to the inflation forecast also revolve around further exchange rate depreciation, the extent to which businesses can continue to absorb higher input costs from the weaker Rand and electricity price increases.
71
Producer price inflation for final manufactured goods has decreased from 7.5% in 2014 to 3.3% in the first nine months of 2015 as a result of lower food and petrol pressures.
Growth in average nominal remuneration per worker in the formal non-agricultural sectors of the economy amounted to 7.6% in 2014, and to 7.7% through the first half of 2015.
Increases in average remuneration per worker in the private sector moderated to 6.8% and public sector accelerated to 10.6% through the first half of 2015. The year-on-year rate of increase in the nominal remuneration per worker in the formal non-agricultural sector of the economy accelerated from 6.2% in the first quarter 2015 to 9.2% in the second quarter of 2015. This acceleration resulted from private-sector wage growth, which rose from a moderated 5.7% in the first quarter of 2015 to 8.0% in the second quarter of 2015. Public sector wages grew faster to 13.5% in the second quarter of 2015, from 7.8% in the first quarter of 2015.
Nominal remuneration increases remained above the upper limit of the inflation target range in: the wholesale, retail and trade sector (7.3%), the mining sector (22%), utilities (6.6%), construction (7.4%), transport (6.1%), financial (7.6%), and the community, social and personal services sector (12.3%). Remuneration growth was within the target range in the manufacturing sector (5.1%) year-on-year to the second quarter of 2015.
According to Andrew Levy Employment Publications, the average level of settlement for the six months ending June 30, 2015 was 7.8% compared with 8% at the end of June 2014 and the overall average of 8.1% in 2014.
Productivity growth increased to 3.3% in the second quarter of 2015 on a year-on-year basis. The increase in labor productivity ticked from -0.4% in June 2014 to 1.5% in the last quarter of 2014 and to 2.44% in the first quarter of 2014. Average wage settlements of 7.8% in the first six months to June 2015 were higher than average CPI inflation of 4.6% between January and May 2015. High wage settlements may have reduced the incentive of companies to create new jobs. In the past, employment growth has been associated with strong GDP growth and moderate growth in real earnings (see table below).
Prices and Wages
| | | | | | | | | | | | | | | | | | | | | | | | | | | | | | | | |
| | | | | | | | | As of | |
| | | For the year ended December 31, | | | | | | | | | | | | September | |
| | | 2008(5) | | | 2009(5) | | | 2010(5) | | | 2011(5) | | | 2012 | | | 2013 | | | 2014 | | | 2015 (3) | |
Consumer Prices(1) | | | 78.9 | | | | 84.6 | | | | 88.2 | | | | 92.6 | | | | 97.8 | | | | 103.4 | | | | 109.7 | | | | 114.1 | |
Percentage change from prior year | | | 9.90 | % | | | 7.10 | % | | | 4.30 | % | | | 5.00 | % | | | 5.70 | % | | | 5.80 | % | | | 6.10 | % | | | 4.50 | % |
Production Prices(4) | | | | | | | | | | | | | | | | | | | 100 | | | | 107.9 | | | | 116.7 | | | | 117.1 | |
Percentage change from prior year | | | | | | | | | | | | | | | | | | | | | | | 6.00 | % | | | 7.50 | % | | | 3.30 | % |
Remuneration per worker | | | | | | | | | | | | | | | | | | | | | | | | | | | | | | | | |
At current prices | | | 12.80 | % | | | 11.80 | % | | | 13.50 | % | | | 7.20 | % | | | 7.60 | % | | | 7.20 | % | | | 6.50 | % | | | 7.1 | %(2) |
At constant prices | | | 2.50 | % | | | 3.20 | % | | | 6.40 | % | | | 1.00 | % | | | 1.80 | % | | | 1.50 | % | | | 0.90 | % | | | 4.1 | %(2) |
Notes: —
| (2) | Year on year change Q1 2015 to Q1 2014. |
| (3) | The average values over the first nine months. |
| (5) | Due to a rebasing of the numbers in 2012, certain figures prior to 2012 are not available. |
Source: SARB
72
MONETARY AND FINANCIAL SYSTEM
The South African financial system consists of banks and non-bank financial institutions such as investment funds, portfolio management companies, securities investment firms, insurance companies, development funding institutions and pension funds.
The South African Reserve Bank (SARB)
The SARB is the central bank of South Africa, with its head office in Pretoria and branches in Bloemfontein, Cape Town, Durban, East London, Johannesburg, Port Elizabeth and Pretoria North. The Constitution established the SARB as an independent central bank, subject only to acts of Parliament and to regular consultation with the Minister of Finance. The principal responsibilities of the SARB include: formulating and implementing monetary policy; issuing banknotes and coins; acting as banker to the National Government; acting as a bank to banks licensed under the Banks Act of 1990; providing facilities for the clearing and settlement of claims between banks; acting as custodian of the country’s gold and other foreign reserves; acting as a lender of last resort; conducting open-market operations; supervising banks; supervising large primary, secondary and tertiary co-operative banks that collect, process and interpret economic statistics and related information; and formulating and implementing exchange rate policies in cooperation with the Minister of Finance and the National Treasury. See “ — Regulation of the Financial Sector” below.
Unlike many other central banks, shares in the SARB are held privately, with no shares held by the National Government. The SARB was listed on the JSE from its inception in 1921 until May 2002, when it was de-listed. Currently, approximately 630 shareholders, including companies, institutions and individuals, hold SARB shares. No single shareholder may hold more than R10,000 in nominal value of the SARB’s shares. Dividends are paid to shareholders out of net profits at a rate of 10% per annum of the nominal value of the shares. After certain provisions, 10% of the SARB’s surplus in any year is paid into a reserve fund, and the balance is paid to the National Government.
The SARB is managed by a 15-member board of directors. The Governor and three Deputy Governors of the SARB are appointed by the President for five-year terms. Of the remaining ten directors, four are appointed by the President, with the remaining six elected by the SARB’s shareholders, two of whom represent the interests of commerce and finance, two of whom represent industry, one of whom represents labor, one of whom represents mining and one of whom represents agriculture. These directors hold office for a period of three years. The Governor has a vote on the board of directors and an additional vote to be used only in the event of a tie. The National Government therefore appoints persons controlling most of the effective votes to the board of directors of the SARB.
President Zuma appointed Mr. Lesetja Kganyago as Governor of the SARB with effect from November 9, 2014. Mr. Kganyago has extensive knowledge of the SARB, having served as a Deputy Governor from 2011 to 2014. In addition, he served as director-general of National Treasury from 2004 to 2011. Mr. Kganyago is well regarded for his knowledge and expertise of the South African and global financial systems.
73
The South African Reserve Bank Act was amended in 2010 (through Amendment Act No. 4 of 2010) to provide mechanisms to ensure that shareholders contribute to the functioning of the SARB without adversely influencing the SARB’s decision-making capabilities through group or block formations.
Monetary Policy
The main objective of the SARB’s monetary policy has been the pursuit of price stability. This policy contributes to the broader macroeconomic policies of the National Government by creating a stable financial environment and improving the standard of living of all inhabitants of the country. The SARB does not have fixed exchange rate targets and allows the Rand to float freely against international currencies.
In 2000, an inflation-targeting monetary framework replaced the SARB’s previous approach to monetary policy-making. The previous approach involved the public announcement of guidelines for growth of the money supply in general, supplemented by regular, wide-ranging assessments of economic conditions and reports on the outlook for inflation. The current inflation-targeting framework is a broad-based strategy for achieving price stability, centered on an analysis of price developments, and is characterised by the announcement of a numerical target for the inflation rate that is to be achieved over a specified period of time. In light of the weakening relationship between money growth and nominal income growth, monetary policy decisions are guided by the deviation of the expected rate of increase in headline CPI from a specified target range. An important factor in determining monetary policy is the forecast generated by the SARB’s macroeconomic models, although monetary policy is not decided mechanically according to the forecast of economic developments. In the application of inflation-targeting as a monetary policy framework, allowance is made for the price effects of serious supply shocks, such as changes in the international price of crude oil, higher food prices resulting from unfavorable weather conditions and inordinate changes in the international exchange value of the Rand. The current inflation target is 3-6%.
Having plateaued at 12% from early June to early December 2008, the repurchase rate was reduced by 50 basis points to 11.5% in December 2008, and by a further 450 basis points to 7.0% by August 2009, remaining at that level until February 2010. Although cost-push pressures in the economy continued to pose risks to the inflation outlook, the MPC decided to keep the monetary policy stance unchanged because the risks to inflation outlook appeared to be fairly evenly balanced. The frequency of meetings for most of 2009 changed from bi-monthly to monthly (excluding July 2009) in order to monitor and respond appropriately to the rapidly changing economic environment. However, in the first meeting under the newly appointed Governor Gill Marcus in November 2009, the MPC decided to revert back to its policy of meeting every alternate month, as the global economic environment appeared to have stabilised.
Amid concerns about increased downside risks to the domestic economic outlook emanating from the uncertain global economic environment, the MPC again reduced the repurchase rate by 50 basis points in March and September 2010, bringing the rate to 6%. At the November 2010 MPC meeting, the repurchase rate was reduced further by 50 basis points to 5.5%. The decision to lower the repurchase rate stemmed from relative improvement in the inflation outlook, which continued to be supported by weak, though recovering, domestic demand conditions, the appreciating exchange rate of the Rand and a persistent negative output gap. Administered price developments and the possible impact of high wage settlements continue to be viewed as potential threats to the inflation outlook.
At the July 2012 meeting of the MPC, the repurchase rate was lowered by 50 basis points to 5.0% with effect from July 20, 2012. The decision to cut the repurchase rate was brought about by concerns over continued sluggishness in the domestic economy, aggravated by the protracted problems in the euro area and possible knock-on effects to the domestic economy. The MPC viewed the more accommodative policy stance to be appropriate under prevailing economic conditions, as it was consistent with the Bank’s price stability mandate and conducive to encouraging growth and domestic investment. Due to weak global and domestic growth conditions, the MPC kept the repurchase rate unchanged up to December 2013. In January 2014, the repurchase rate was raised from 5% to 5.5%, the first upward adjustment since June 2008, marking the beginning of an interest rate tightening cycle. The policy change occurred against the backdrop of deterioration in the inflation forecast, which showed an extended breach of the upper target band starting in the second quarter of 2014. The primary cause of the deteriorating outlook was Rand depreciation, lower commodity prices and changing monetary conditions resulting from quantitative easing by the US Federal Reserve. The monetary policy stance remained supportive of domestic economic conditions. Rising inflation and the upside risks to the inflation outlook, furthermore influenced by a possible wage-price spiral resulting from wage settlements and demands prompted the decision to raise interest rates.
74
At the July 2014 meeting the MPC decided to raise the repurchase rate by 25 basis points to 5.75%. The urgent need to implement necessary structural reforms, in order to achieve higher and more inclusive growth, as envisaged in the NDP was accentuated. In 2015, the global environment was dominated by heightened uncertainty related to the debt crisis in Greece and the sharp decline in equity prices in China. At the same time, the risks associated with financial market volatility related to the timing of the first increase in the US policy rate persisted. Domestically, the growth outlook remained weak with both the supply and demand sides constrained. As the inflation outlook deteriorated and upside risks posed by a weaker exchange rate increased, the MPC decided to continue on its path of gradual policy normalization and increased the repurchase rate on two occasions in 2015 – by 25 basis points to 6.0% from July 24, 2015 and by a further 25 basis points with effect from November 20, 2015.
Year-on-year CPI inflation slowed from 6.6% in June 2014 to 3.9% in February 2015, before accelerating gradually to 5.0% in July 2015. CPI inflation then moderated somewhat to 4.6% in August and September 2015. However, consumer price inflation is expected to accelerate towards year-end on account of petrol price related base effects and a quickening in food price inflation following severe drought conditions. At the September 2015 MPC meeting, the SARB’s inflation forecast for 2015 was lowered to 4.7%, while the expected average for 2016 was lifted marginally to 6.2%. The forecast for 2017 was for a deceleration in headline CPI inflation to 5.8%.
In its role of implementing monetary policy, the SARB monitors and influences conditions in the South African money and credit markets and affects interest rates, growth in lending and growth of deposits. The SARB uses open market operations to determine the amount of liquidity available to banks on a weekly basis in repurchase transactions. The interest rate for such repurchase transactions is set by the SARB’s MPC and has a significant impact on all short-term interest rates in the economy. The monetary policy stance is decided at the bi-monthly meetings of the MPC. There exists, however, a continuous process of review that takes new information and developments into consideration.
Open market operations entail the buying and selling of securities by the SARB in the open market in order to regulate the conditions in the money market or the level and pattern of interest rates. By injecting or absorbing funds through purchases and sales of securities, the SARB may increase or decrease liquidity in the banking system. Although these transactions are primarily undertaken to achieve long-term monetary objectives, a further objective may be to stabilise temporary money-market fluctuations. Currently, nine primary dealers make markets in government paper, five of which are domestic banks and four of which are international banks. Since its appointment of primary dealers in 1998, the SARB no longer acts as agent for the National Government in buying or selling its securities. The SARB may purchase and sell National Government securities for the SARB’s own account, providing it with an effective means of influencing money market liquidity. Other techniques used by the SARB to influence liquidity include purchasing securities outright, varying the amount of National Government bills offered at tender each week, allocating National Government deposits between the SARB and private banks, issuing SARB debentures and entering into foreign exchange swaps with banks.
During 2004 the SARB conducted a review of its money-markets operations, which were last reviewed in September 2001. As a result, on May 25, 2005, following extensive consultations with market participants, the SARB implemented several changes to its refinancing operations with three aims: to streamline the SARB’s refinancing operations to make them simpler and more transparent; to encourage banks to take more responsibility for managing their own individual liquidity needs in the market; and to promote a more active money market in South Africa. These changes include, among other things, the announcement of an estimate of the average daily market liquidity requirement by the SARB and the estimated range within which the daily requirement is expected to fluctuate in the coming week on the Wednesday morning prior to the main weekly repurchase auction, and the introduction of standing facilities (previously referred to as final clearing or reverse repurchase tenders) at a spread of 50 basis points above or below the prevailing repurchase rate to accommodate banks with short or long liquidity positions.
However, the central feature of the SARB’s operational arrangements—the conduct of repurchase auctions on Wednesdays, with one-week maturity at a repurchase rate fixed at the level announced by the MPC—remains unchanged.
75
Before the introduction of the changes to the SARB’s refinancing operations, the accommodation amount provided at the main weekly repurchase auction was stable at around R13 billion, which was also the approximate level of the average daily liquidity requirement of the private sector banks. Thereafter, the amounts on offer at the weekly main refinancing auctions varied, with generally higher levels around month-end and lower levels towards the middle of the month. In order to even out the banks’ end-of-day positions, standing facilities and cash reserve accounts were utilised.
Following the evening-out of the oversold forward foreign exchange book in February 2004, the SARB continued to increase its foreign exchange reserves through the measured buying of foreign exchange from the market, thereby creating Rand liquidity. The banks’ required cash reserve balances with the SARB rose considerably in September 2004, as vault cash was no longer allowed as part of qualifying cash reserves due to the phase-out of vault cash concessions, which started in September 2001.
The outstanding amount and composition of interest-bearing instruments utilised by the SARB were changed to drain liquidity from the money market. Debentures with a 56-day maturity were first issued on December 1, 2004, and 56-day reverse repurchase transactions were first conducted on March 24, 2005.
The outstanding amount of South African Government bonds in the SARB monetary policy portfolio has declined over the years and currently amounts to R7.5 billion as at September 2015. This followed an agreement between the National Treasury and the SARB on October 20, 2003, which allowed the SARB to restructure and shorten the average maturity of interest-bearing government bonds held in its monetary policy portfolio by conducting cash-neutral auctions.
The following table sets forth the rate at which the SARB provided liquidity to banks as of each month-end indicated.
Repurchase Transaction Rate
| | | | |
| 2014 | | (%) | |
January | | | 5.50 | |
February | | | 5.50 | |
March | | | 5.50 | |
April | | | 5.50 | |
May | | | 5.50 | |
June | | | 5.50 | |
July | | | 5.75 | |
August | | | 5.75 | |
September | | | 5.75 | |
October | | | 5.75 | |
November | | | 5.75 | |
December | | | 5.75 | |
| |
| 2015 | | (%) | |
January | | | 5.75 | |
February | | | 5.75 | |
March | | | 5.75 | |
April | | | 5.75 | |
May | | | 5.75 | |
June | | | 5.75 | |
July | | | 6.00 | |
August | | | 6.00 | |
September | | | 6.00 | |
October | | | 6.00 | |
November | | | 6.25 | |
76
Source: SARB.
In May 2007, the SARB began to accept certain parastatal bonds in its repurchase auctions, thereby extending the range of securities which may be used as collateral in the refinancing system. This included a selection of bonds included in the All Bond Index, as determined by the Bond Exchange of South Africa Limited (BESA), excluding those issued by commercial banks. The added securities do not qualify as liquid assets in terms of the Banks Act. The table below lists the assets which were added as eligible collateral. However, at the end of August 2010, the SARB implemented certain changes to its monetary policy operational procedures, including the phasing out of parastatal bonds included in the All Bond Index as eligible collateral in the SARB’s refinancing operations. As a result, with effect from March 1, 2011, these bonds were no longer accepted as collateral.
Additional securities accepted in repurchase auctions
Rand denominated
| | |
| Assets previously and still included as eligible collateral | | Assets which were added from May 23,
2007 but which were phased out with effect
from March 1, 2010 |
Government bonds | | DBSA (DV07) |
Land Bank bills | | Eskom Holdings Ltd. (ES09, E170, ES33) |
Separate trading of registered interest and principal of securities (STRIPS) | | SANRAL (SZ25) |
SARB debentures | | Transnet Ltd. (T011) |
Treasury bills | | Trans-Caledon Tunnel Authority (WS03, WS04) |
Source: SARB.
In August 2010, further changes to the monetary policy operational procedures of the SARB were made. These included the use of longer-term foreign exchange swaps with maturities of up to 12 months as an instrument to manage money market liquidity more effectively. The consequence of conducting longer-term foreign exchange swap transactions to drain liquidity from the market is that the SARB reflects an overbought forward position on its monthly releases of official gold and foreign exchange reserves. In addition, the estimated ranges of the weekly liquidity requirement were discounted and the spread between the rates for standing facilities and the repurchase rate was widened from 50 basis points to 100 basis points below and above the prevailing repurchase rate.
The following table sets forth the money supply (M1A, M1, M2 and M3) of South Africa during the periods indicated.
Money Supply
| | | | | | | | | | | | | | | | | | | | | | | | |
| | | As of December 31, | | | As of Sep 30, 2015 | |
| | | 2010 | | | 2011 | | | 2012 | | | 2013 | | | 2014 | | |
| | | Rand (million) | |
Coin and banknotes in circulation | | | 65,079 | | | | 75,396 | | | | 81,042 | | | | 87,014 | | | | 94,193 | | | | 95,466 | |
Check and transmission deposits | | | 407,536 | | | | 437,068 | | | | 495,991 | | | | 549,323 | | | | 589,602 | | | | 631,872 | |
Total: M1A(1) | | | 472,615 | | | | 512,464 | | | | 577,033 | | | | 636,337 | | | | 683,795 | | | | 727,338 | |
Other demand deposits(2) | | | 390,260 | | | | 434,806 | | | | 458,109 | | | | 495,702 | | | | 557,477 | | | | 626,484 | |
77
| | | | | | | | | | | | | | | | | | | | | | | | |
| | | As of December 31, | | | As of Sep 30, 2015 | |
| | | 2010 | | | 2011 | | | 2012 | | | 2013 | | | 2014 | | |
| | | Rand (million) | |
Total: M1(3) | | | 862,876 | | | | 947,269 | | | | 1,035,142 | | | | 1,132,039 | | | | 1,241,272 | | | | 1,353,821 | |
Other short- and medium-term deposits(4) | | | 815,542 | | | | 851,662 | | | | 833,908 | | | | 917,655 | | | | 985,272 | | | | 1,032,515 | |
Total: M2(5) | | | 1,678,417 | | | | 1,798,932 | | | | 1,869,050 | | | | 2,049,694 | | | | 2,226,544 | | | | 2,386,337 | |
Long-term deposits(6) | | | 405,785 | | | | 457,796 | | | | 504,390 | | | | 462,557 | | | | 467,355 | | | | 545,132 | |
Total: M3(7) | | | 2,084,202 | | | | 2,256,727 | | | | 2,373,439 | | | | 2,512,251 | | | | 2,693,899 | | | | 2,931,469 | |
Notes: —
| (1) | Notes and coins in circulation plus check and transmission deposits of the domestic private sector with monetary institutions. |
| (2) | Demand deposits (other than check and transmission deposits) of the domestic private sector with monetary institutions. |
| (3) | M1A plus other demand deposits held by the domestic private sector. |
| (4) | Short-term deposits (other than demand deposits) and medium-term deposits (including all savings deposits) of the domestic private sector with monetary institutions, including savings deposits with and savings bank certificates issued by the Postbank (a division of the SAPO). |
| (5) | M1 plus other short-term and medium-term deposits held by the domestic private sector. |
| (6) | Long-term deposits of the domestic private sector with monetary institutions, including national saving certificates issued by the Postbank. |
| (7) | M2 plus long-term deposits held by the domestic private sector. |
Source: SARB.
Since the introduction of inflation-targeting monetary framework, growth in the most broadly defined money supply (M3) has not been used as an intermediate target for monetary policy purposes. Nevertheless, money supply and credit may provide useful information about prospective spending plans and inflationary pressures.
The Basel II capital-adequacy framework and the accompanying regulatory reforms were implemented in January 2008. In the time leading up to the implementation date, banks refined their information and technology systems for the classification and reporting of balance sheet items. Improved classification caused some discontinuities in a few subcategories of the monetary and credit aggregates, but these were limited. In line with the requirements of Basel II, the South African banking sector remains well capitalised. The “tier one” capital adequacy ratio stood at 12.1% in August 2011. Total capital adequacy currently stands at 14.3% such that the South African banks meet the minimum capital adequacy requirements. The implementation of the Basel III framework in South Africa is based on a phased-in approach which commenced on January 1, 2013 and will continue up to 2018, in line with the timelines determined by the Basel Committee. The Basel III Liquidity Coverage Ratio has been implemented from January 1, 2015, while the Net Stable Funding Ratio will be effective from January 1, 2018.
Year-on-year growth in M3 accelerated from a record low of 0.1% in February 2010 to 10.0% in April 2013, signaling a turnaround in the decelerating growth that commenced in 2008, and persisted throughout 2009. The growth rate thereafter fluctuated broadly between 5.8% and 10.2% until September 2015, with recent growth rates surpassing 8.0% since April 2015. During the four years to June 2014, year-on-year growth in M3 generally fell below that of nominal GDP, but this trend started to reverse towards the end of 2014 and into 2015 as sluggish activity and lower commodity prices weighed on the level of nominal value added in the economy. The firmer growth in M3 deposits was underpinned by growth in deposits of both the household and corporate sectors and can partly be ascribed to rising interest rates, accelerating inflation and moderately rising real final demand, combined with a build-up in precautionary balances by asset managers in the wake of renewed financial market volatility. The depreciation of the Rand in recent months also resulted in an upward revaluation of foreign-currency deposits included in M3. On a quarterly seasonally adjusted and annualized basis, growth in M3 reached a most recent high of 17.4% in the second quarter of 2015, before slowing to 7.6% in the third quarter. Growth in other short- and medium-term deposits, together with check, transmission and other demand deposits underpinned the bulk of the increase in the growth in M3 during the third quarter of 2015, while long-term deposits also continued to recover alongside the rising interest rate environment.
78
Financial System Stability
The SARB regards the achievement and maintenance of price stability as its primary goal. A necessary parallel objective to this is financial system stability, without which monetary policy cannot be effectively implemented. To pursue the maintenance of financially stable conditions and contain systemic risk, the SARB continuously assesses the stability and efficiency of the key components of the financial system and formulates and reviews policies for intervention and crisis resolution. In 1999, the SARB established a Financial Stability Committee with the specific mandate to strive to enhance financial stability by continuously assessing the stability and efficiency of the financial system, formulating and reviewing appropriate policies for intervention and crisis resolution, and strengthening the key components of the financial system. A Financial Stability Department was established within the SARB with effect from August 1, 2001 to help monitor the stability of the financial system as a whole by identifying inherent weaknesses and the build-up of risks that may result in financial system disturbances. Central to the SARB’s increased focus on, and contribution to, the financial stability discourse, a semi-annual Financial Stability Review is published that covers both a quantitative and qualitative assessment of the strength and weakness of the South African financial system.
A cross-sectoral body was created in 2002 to facilitate cooperation in identifying threats to the stability of the South African financial sector and in proposing and obtaining approval for appropriate plans, mechanisms and structures to mitigate such threats. This body creates a coordinated network of contingency planning contacts throughout the financial services industry, and has the capacity to act as a crisis management team to deal with tactical situations affecting one or more firms. It also facilitates cooperation between key financial sector institutions and regulators in times of catastrophic events or disasters through business continuity planning, which serves to better protect staff, facilitate recovery and sustain both a stable financial market and consumer confidence.
Regulation of the Financial Sector
Since 1994, South Africa has made a dedicated effort to deregulate the financial sector. The new market-based approach to regulation relies heavily on the use of strengthened corporate governance and accountability principles, enhanced disclosure systems, and market discipline as an incentive to compliance. Although increased deregulation has encouraged both competition and innovation, it has simultaneously demanded heightened supervision, more explicit market integrity and strengthened consumer protection mechanisms.
The two main regulatory authorities, the Financial Services Board (FSB) and the SARB, apply measures to secure the financial soundness of the financial system of South Africa as a whole. The regulatory instruments that they use include entry and other standard requirements, ownership constraints, fit and proper persons tests, limitations on certain activities, jurisdictional constraints, pricing constraints and operational constraints (such as capital and liquidity requirements and trading capacity requirements). Domestic regulation and supervision requirements also incorporate international standards. South African financial institutions must comply with all relevant Basel capital adequacy and liquidity principles and standards. Basel II (developed by the Basel Committee on Banking Supervision and endorsed by central bank governors and the heads of bank supervisory authorities in the G-10 countries) was implemented in South Africa in January 2008, in accordance with the Basel Committee timeframe. Since the commencement of the sub-prime and financial market crisis, the oversight body of the Basel Committee announced a substantial strengthening of existing capital requirements and the introduction of new global capital and liquidity standards, sometimes referred to as Basel 2.5 and Basel III. The Basel Committee on Banking Supervision required that Basel 2.5 be implemented by January 2012. The Minister of Finance approved the SARB Bank Supervision Department’s amended regulations, which were implemented in accordance with the internationally agreed timelines. The phase-in period for the Basel III requirements began on January 1, 2013 and is anticipated to last through 2019. South Africa is already in compliance with the capital requirements of Basel III and will continue to comply with all the other related requirements within the stipulated timeline. South African financial institutions must also comply with the financial reporting and disclosure standards incorporated in the international accounting standards, adopted by the International Organisation of Securities Commissions. The various financial markets, financial institutions and financial instruments are regulated by a series of general, specific and enabling legislation.
South Africa is as a member of the G-20, the Financial Stability Board, the Basel Committee for Banking Supervision and a number of other international regulatory bodies. In line with this, South Africa is committed to implementing a program of financial services reform in line with other G-20 jurisdictions. As evidenced in recent IMF Financial Stability Assessments and Financial Stability Board peer reviews, South Africa is making steady progress in ensuring that its financial system is appropriately regulated. The two main regulatory authorities, the Financial Services Board (FSB) and the SARB, apply measures to secure the financial soundness of the financial system of South Africa as a whole. The regulatory instruments that they use include entry and other standard requirements, ownership constraints, fit and proper persons tests, limitations on certain activities, jurisdictional constraints, pricing constraints and operational constraints (such as capital and liquidity requirements and trading capacity requirements). Domestic supervision also incorporates international standards. South African financial institutions must comply fully with the majority of the Basel capital adequacy principles and standards.
In banking regulation, the phase-in period for the Basel III requirements began on January 1, 2013 and is anticipated to last through to January 2019. South Africa is already in compliance with the capital requirements of Basel III and aims to meet the other requirements within the stipulated timeline. South African financial institutions must also comply with the financial reporting and disclosure standards incorporated in the international accounting standards, adopted by the International Organisation of Securities Commissions. The various financial markets, financial institutions and financial instruments are regulated by a series of general, specific and enabling legislation.
This follows the implementation of Basel II in January 2008, and “Basel 2.5” in January 2012. The Minister of Finance approved the SARB Bank Supervision Department’s amended regulations, which were implemented before the deadline.
79
Legislation enacted in 1998 provides for an independent competition authority, comprising an investigative division and an adjudicative division with broad powers to, among other things, issue compliance orders and interdicts, levy fines, impose structural remedies such as divestitures and prohibit mergers. The legislation also provides for a right of appeal to a specially-constituted judicial authority. In the majority of cases, the adjudicative divisions have sole jurisdiction over competition matters. Amendments to the legislation enacted in 1999 require pre-merger notification in particular cases.
The Companies Act of 1973 was repealed and replaced with the Companies Act of 2008, which became effective on May 1, 2011. The Companies and Intellectual Property Commission is the regulatory organ charged with the administration and enforcement of the Companies Act of 2008. The Office of the Registrar of Banks forms part of the SARB and conducts the supervision of banks. The FSB regulates the financial markets for equity, debt and derivative securities, as well as non-bank financial institutions registered under specific legislation. Advisory committees serve the various offices and boards, and a Policy Board for Financial Services and Regulation coordinates the institutional and functional aspects of regulation. Appeal boards are provided for if and when they are needed, but responsibility for regulation remains with the Minister of Finance.
Recent legislative and regulatory initiatives coming into force since 2000 include the following:
| | • | | As of January 2008, South African registered banks were required to comply with Basel II. The Banks Act was thus substantially amended to comply with the principles of Basel II. The Banks Amendment Act of 2007 was assented to by the President of the Republic of South Africa and published in November 2007. Following the sub-prime and financial market crisis, the oversight body of the Basel Committee announced a substantial strengthening of existing capital requirements and the introduction of global capital standards, in the form of Basel 2.5 and Basel III. The phase-in period for these further requirements began on January 1, 2012. |
| | • | | Since the publication of the South African National Payment System Framework and Strategy document in 1995, major payment system milestones have been achieved and all major domestic risk-reduction objectives have been met. This framework and strategy document contained a ten-year vision up to 2004. The main objective of the new framework and strategy document, known as Vision 2010, is to provide high-level strategic guidance for the payment system up to 2010. By September 2011, most of the strategic objectives contained in Vision 2010 were met. However, the SARB realised that several of the strategies, fundamental principles and critical success factors contained in Vision 2010 continue to be relevant. Although the South African payment system was unaffected by the global financial crisis, the SARB used the many new initiatives in the international regulatory environment that resulted from these events, as well as the recommendations relating to the national payment system (NPS) contained in the Banking Enquiry Report, published in 2008, to review, refine and adjust Vision 2010 for future developments to create a vision and strategy for 2015. The updated framework and strategy document is referred to as Vision 2015. |
80
| | • | | The JSE demutualised in July 2005 and listed in June 2006, allowing it to operate as a company with share capital. This put the JSE on par with its international competitors, the majority of which had already been demutualised and converted to companies. In February 2009, the majority of the shareholders of BESA accepted an offer by the JSE to acquire BESA. In June 2009, the JSE and BESA merged. BESA has now been fully integrated into the JSE and currently forms part of the JSE’s Interest Rate and Currency Market. The JSE published new Debt Listing Requirements in 2011 which apply in relation to the listing of government and corporate bonds on the JSE’s Interest Rate and Currency Market. A new set of rules of conduct has also been published (the Interest Rate and Currency Rules). It is expected that the merger will realise, among other things, benefits of greater liquidity, reduction of costs through economies of scale and better risk management for users of a single exchange. |
| | • | | The DTI commenced the process of reviewing the corporate laws in South Africa in fiscal year 2006 so as to bring the South African corporate law framework closer to full compliance with international standards and best practices, provide the necessary protection to all corporate stakeholders, maximise the opportunities for companies to attract capital and stimulate economic growth. The Companies Act of 2008 was passed by the national legislature, assented to by the then President of the Republic of South Africa, Kgalema Motlanthe and published on April 9, 2009. The Companies Act of 2008 entered into effect on May 1, 2011. The Companies Act of 2008 replaced the existing Companies Act of 1973 and some of its significant changes include provisions for the facilitation of business rescue proceedings in respect of companies in financial distress and the reduction of the regulatory burdens placed on small and medium enterprises. |
| | • | | The Competition Amendment Act of 2009 was enacted in August 2009 and amends the Competition Act of 1998, through the introduction of provisions dealing with concurrent jurisdictions of industry regulators, complex monopolies and market inquiries. |
| | • | | The Consumer Protection Act of 2008 provides for a consumer protection regime designed to promote and advance the social and economic welfare of consumers. The Consumer Protection Act came into effect on March 1, 2011. |
| | • | | The revised King Code and Report on Corporate Governance for South Africa (King III Code) was launched on September 1, 2009 and came into effect on March 1, 2010, replacing its predecessor, King II Code and Report on Corporate Governance (King II Code). King III Code sets out various corporate governance guidelines and principles applicable to listed companies, financial institutions, and public sector enterprises, agencies and government departments (compliance with King III Code is mandatory for listed companies). The review of King II Code was prompted by changes in international governance trends and the reform of South Africa’s company laws with the promulgation of the New Companies Act. |
| | • | | In July 2010, the Bank Supervision Department of the SARB released the proposed draft Banks Amendment Bill. The purpose of the proposed bill is to align the provisions of the existing Banks Act of 1990 with the New Companies Act as well as to ensure that the legal framework for the regulation and supervision of banks and bank-controlling companies is based on international standards and best practice. The Banks Amendment Bill was tabled in Parliament during the second half of 2012 and was subjected to debate and interrogation in both the Standing Committee on Finance of the National Assembly and the National Council of Provinces. After being approved by the relevant Parliamentary committees, the President assented to the bill after which it was published as the Banks Amendment Act, 2013 (Act No. 22 of 2013) by Notice No. 992 in Government Gazette No. 37144 on 10 December 2013. Most recently, the Banks Amendment Bill was tabled earlier in 2015, and was published as the Banks Amendment Act, 3 of 2015 in June 2015. |
| | • | | Regulation 28, issued in terms of section 36 of the Pension Funds Act of 1956, governs the asset-spreading requirements of retirement funds. An amended version of Regulation 28 was approved by the Minister in March 2011. The new Regulation 28 takes into account a significantly changed financial sector and enhances member protection. The effective date of the new Regulation 28 was July 1, 2011, subject to a six month transition period until December 31, 2011 to enable funds to adjust their monitoring and reporting systems, as well as their investments. The new Regulation 28 covers many asset classes (such as hedge funds, private equity investments and derivatives) which were not otherwise covered by previous regulation relating to pension funds. |
81
| | • | | The National Treasury is exploring options to promote entry into the banking sector as South Africa’s highly concentrated banking sector may compromise the level of competition needed to bring about efficiency improvements and greater access to financial services. |
| | • | | In June 2015, the Banks Amendment Act 2015 was enacted to amend the Banks Act 1990. The Act aims to enhance the curatorship of banks in order to make the financial sector safer and protect depositors. The Act enhances the powers of the curator of a bank while under curatorship by expanding the basis on which a curator of a bank may dispose of all or part of the bank providing for: |
| | • | | Allowing for the creation of a good bank outside the existing corporate entity; |
| | • | | facilitation of the transfer of all or part of a bank’s business to a successor entity; |
| | • | | a disposal pursuant to a transfer under section 54 of the Banks Act; and |
| | • | | facilitation of the implementation of the above steps by the curator. |
| | • | | In August 2015, the National Treasury and SARB released a discussion paper intended to solicit public comment and to serve as a basis for further industry discussions in preparation for the drafting of a special resolution bill for systematically important financial institutions. The paper provides key proposals for strengthening South Africa’s resolution framework to manage failures of financial institutions in a manner that will mitigate any negative impact on domestic financial stability and minimize macroeconomic costs. |
| | • | | In October 2015, the Financial Intelligence Amendment Bill was tabled in parliament. The Bill seeks to strengthen the commitment to combatting financial crimes and address the gaps identified in the Financial Action Task Force and the IMF’s Financial Assessment Programme Technical Note on AML/CFT for South Africa in December 2014. |
| | • | | On June 25, 2015, the Department of Trade and Industry released a notice titled Draft Review of limitations on fees and interest rates for public comment. The notice proposes new caps on fees and interest rates applicable to credit agreements falling under the National Credit Act 34 of 2005. The biggest change relates to unsecured credit agreements, where the proposed cap is reduced to 24.8% from 32.7%. These proposals affect banks and insurers, which provide credit to the domestic market. The caps aim to protect consumers from unscrupulous lending practices and over-indebtedness. However, the credit providers have warned against the unintended consequences of these proposals, which include credit rationing and an increase in the number of banks introducing credit life insurance policies to circumvent lower interest rate caps. |
Financial markets such as the foreign exchange market and the money market are not regulated by specific legislation but are subject to general legislation such as the Currency and Exchanges Act and accompanying regulation by agencies such as the SARB. Institutions currently not required to register under any particular legislation are not subject to specific regulation. However, it is expected that all individuals and firms conducting an investment business will in future be required to comply with certain minimum requirements in respect of disclosure and capital adequacy. These individuals and firms will also be required to adhere to a strict and coherent code of business conduct imposed to strengthen supervision.
82
The Minister of Finance released, together with the 2011 Budget, a comprehensive discussion document titled ‘A Safer Financial Sector to serve South Africa better’, which put forward a range of proposals to strengthen the financial regulatory system in South Africa. The Minister of Finance requested a review of any gaps or weaknesses in the current financial regulatory system, as well as recommendations arising from a recent financial sector assessment conducted by the IMF. In October 2015, the Financial Sector Regulation Bill, 2015 (the “twin peak” legislation) was tabled in Parliament. The following proposals are included in the draft bill.
| | • | | Move to twin peaks regulatory structure. South Africa is undergoing regulatory and structural changes through Twin Peaks. The Financial Services Regulation (FSR) Bill will establish new authorities under the Twin Peaks model, namely the Prudential Authority (PA) that will be established within the SARB, responsible for financial soundness of financial safety and soundness of financial institutions, and the Financial Sector Conduct Authority (FSCA), replacing the current Financial Services Board, responsible for market conduct and consumer protection. The SARB will continue its role to oversee financial stability within the set policy framework. The second draft of the Financial Services Regulation (FSR) Bill was released in December 2014 for public comments and tabled in Parliament in October 2015. It is anticipated that the Bill will come into effect in 2016. The bill provides for a wider range of powers, in particular giving financial stability powers to SARB and giving the PA and the FSCA the authority to issue standards for financial institutions; |
| | • | | Macro prudential approach to supervision. The economic crisis demonstrated the need to develop an approach that focuses on the risks in relation to the entire financial sector, rather than only the risks pertaining to individual institutions. The SARB is the lead institution in this regard and will be taking appropriate steps to strengthen financial stability. In addition, the Financial Sector Regulation Bill gives the SARB a formal financial stability mandate and establishes the Financial Stability Oversight Committee. Moreover, the SARB, FSB and the National Treasury have recently published a Resolution Framework policy paper aimed at establishing a framework for the resolution of all banks and systematically important financial institutions. The Resolution Framework also proposes the introduction of a depositor guarantee scheme and assigns to the SARB the responsibility of a Resolution Authority as envisaged by the FSB’s Key Attributes for Effective Resolution Regimes; |
| | • | | Establishing a Council of Financial Regulators. One of the key proposals to strengthen the financial regulatory system is to create a Council of Financial Regulators, chaired by the National Treasury. All regulatory agencies in the financial sector will form part of the Council. It will promote coordination and the sharing of information between regulators, particularly in the case of diversified financial services conglomerates; |
| | • | | Prudential regulation of banking and insurance. Basel III has tightened the prudential supervision of banks by imposing stricter capital requirements and introducing liquidity and leverage ratios. Similar requirements will also pertain to insurance–the FSB has introduced draft legislation for a revised prudential regime for insurers, based on Solvency II, to ensure that regulation of the South African insurance sector remains in line with international best practice; |
| | • | | Improving the domestic regulatory system and entrenching operational independence. Regulators should be operationally independent when licensing and supervising the financial sector. A number of initiatives are planned to improve the accountability and governance of domestic financial regulators. Policy will still be the responsibility of the National Government, which will determine the framework within which domestic regulators will operate; |
| | • | | Market conduct. The National Government will strengthen market conduct regulation, particularly in retail banking and insurance. The 2008 report of the Banking Enquiry Panel set up by the Competition Commission set out a number of recommendations to lower banking charges and improve transparency in pricing, which the National Treasury and the SARB are currently facilitating. The treating customers fairly initiative from the FSB is an important step in strengthening market conduct objectives in the financial sector—the National Treasury has published a Market Conduct Framework Policy Document, as a pre-cursor to the introduction of the Conduct of Financial Institutions Bill; |
83
| | • | | Expanding the scope of regulation. Many activities, such as over-the-counter derivative trading, hedge funds and credit rating agencies previously fell outside the regulatory framework. In line with South Africa’s international commitments, new legislation has been and will continue to be introduced to regulate such activities in a way that strengthens and promotes the stability of the financial system. This includes the replacement of the Securities Services Act with a Financial Markets Act, which came into operation in June 2013, and the Credit Rating Services Act, which was signed into law in January 2013. The Financial Markets Act provisions addressed clearing, sanctions for market abuse, and conflicts of interest posed by financial market infrastructures. Improvements in governance in other sectors posing systemic risks, such as the payment system, are also being considered; |
| | • | | Furthermore, in June 2015 the second draft of the Financial Markets Act regulations were released for comment. These regulations cater for the regulatory framework for the over-the-counter derivatives markets in alignment to the G-20 commitments made by South Africa at the Pittsburgh Summit in 2009. It is expected that the regulations will come into effect in 2016; and |
| | • | | Broadening access to financial services for all. The National Treasury is planning a number of new interventions to ensure the accessibility of financial services to a greater reach of people. This includes taking forward the Financial Sector Charter process, supporting the development of Cooperative Banks and providing mechanisms for increased competition in the formal banking arena through dedicated banks and the introduction of deposit insurance. |
Structure of the Banking Industry
At the end of financial year 2014, 16 banks, three mutual banks and 14 local branches of foreign banks were registered with the Office of the Registrar of Banks. In addition, 40 foreign banks had authorised representative offices in South Africa.
The four largest banking groups dominating the South African banking sector are ABSA Bank Limited, the Standard Bank of South Africa Limited, FirstRand Bank Limited and Nedbank Limited, and constituted 82.4% of total banking-sector assets at the end of September 2015. The four largest banks offer a wide range of services to both individual and corporate customers at branches across all nine provinces.
The South African banking system remained profitable and adequately capitalized throughout 2014 and into 2015. The total stock of outstanding loans and advances in the banking sector increased by 10.2% to R3,537 billion as at September 30, 2015 from R3,208 billion as at September 30, 2014. The capital adequacy ratio for the banking sector was 14.3% in September 2015, exceeding the 10% minimum capital adequacy requirement and therefore reflecting adequate systemic capitalization. The banking sector’s capital consists mainly of share capital and reserves (the highest loss-absorbing capital types).
Total banking-sector assets increased from R4,121 billion at the end of September 2014 to R4,617 billion at the end of September 2015, representing a 12% increase. The increase in total banking-sector assets is largely attributable to an increase in loans and advances, investment and trading securities as well as derivative financial instruments.
Impaired advances to gross loans and advances, a key indicator of credit risk, has declined marginally to 3.2% in September 2015 compared to 3.4% in September 2014.
84
Financial Sector Charter
In August 2002, the financial sector voluntarily committed itself to developing a charter to address historical sector imbalances, particularly with reference to human resource development, broadening economic participation and access to financial services. Thereafter, key industry stakeholders came together to develop the Financial Sector Charter, which was launched by the industry and the Minister of Finance in October 2003. The Financial Sector Charter was built around a central vision of promoting a transformed, vibrant and globally-competitive financial sector that reflects the socioeconomic demographics of South Africa and contributes to the establishment of an equitable society by effectively providing accessible financial services to black people and directing investment into targeted areas in the economy.
The Financial Sector Charter established sector transformation goals, emphasising targets for human resource development, procurement and enterprise development, access to financial services and ownership transfer. In order to provide access to financial services, the country’s four major retail banks–ABSA, FirstRand, Nedbank and Standard Bank–as well as the Postbank, launched the Mzansi account in October 2004. Mzansi is a low-cost national bank account aimed at ensuring that those falling within the lower socio-economic groups have access to first-order retail banking products that would provide them with entry-level banking services. There have been approximately 6 million Mzansi accounts opened, 4.5 million of which were opened by South Africa’s four major commercial banks. It is estimated that 72% of these were first-time accounts. Major banks have since de-emphasised Mzansi and are promoting their own branded low-income accounts. The percentage of adult South Africans who use banking services has improved from 51% as at June 30, 2006 to 75% as at June 30, 2013.
In addition, the financial sector committed to ensuring that 80% of the population in lower income groups has access to full-service banking points of presence within at least 15 kilometres of every poor South African and cash-withdrawal points of presence such as automatic teller machines within at least 10 kilometres. By December 2010 91.6% of poor households had access to points of presence of banks and Postbank within 10 kilometres of their home. This percentage was 84.7% if only the big four banks are considered.
In addition, a framework has been developed for extending R42 billion in housing finance on favourable terms to households largely excluded from the mortgage market until now. The Financial Sector Charter Council’s (Council) 2008 Annual review (the most recent review that has been completed) indicates that as at December 31, 2008, the financial sector originated over R45.7 billion in low-income housing loans.
One of the principal sector transformation goals of the Financial Sector Charter relates to targets of ownership transfer. The Financial Sector Charter required that each financial institution must transfer 25% ownership to historically disadvantaged South Africans, including 10% through direct ownership transfers, by 2010. As of the end of 2008, the average direct ownership percentage of historically disadvantaged South Africans was 23.3%.
Through the Financial Sector Charter, over R200 billion has been invested in the South African economy since 2005. The financial sector has also invested over R101 billion through B-BBEE financing in other sectors of the economy, including vendor-financed ownership deals in the financial sector itself.
In 2007 a process of alignment of the Charter to the Codes of Good Practice (CoGP) was initiated by the FSC Council. It was widely anticipated that the FSC would be gazetted as a Sector Code in 2008 during the transitional period for aligning existing charters with the CoGP and converting them into sector codes. This conversion did not take place as Financial Sector Charter participants could not reach agreement on certain aspects of the alignment. Agreement was finally reached in 2012 which culminated with the gazetting of the Financial Sector Code (FS Code) under section 9 of the B-BBEE Act in December of that year.
85
In the same year that the FSC Code was gazetted, the BEE Advisory Council also developed key recommendations on areas that needed refinement to address the risk of fronting and other loopholes that allowed companies to game the system. These recommendations culminated in the gazetting of the revised CoGP in October 2013 and the B-BBEE Amendment Act in January 2014.
Similar to the alignment process that the sector undertook between 2007 and 2012, the sector is now in the process of realigning the current FS Code with the revised CoGP. The revised FS Code is scheduled to be finalised before the end of the transitional period, namely October 31, 2015. During the period 2009 to 2012, because the Charter had no legal standing in terms of the B-BBEE Act, the sector reverted to reporting under the CoGP scorecard. The FSC Council released a 2013 annual review report which marks the first year that the sector reported under the newly gazetted FSC Code.
The number of banks that reported, foreign and local, hold more than 90% of the R3,843 billion assets held by the South African banking sector as at December 2013. Similarly with long-term assurers, asset and CIS managers, entities that reported contribute about 87% of the R5,305 billion assets held by the combined industries and together they also hold a 92% share of market. These trends apply in the short-term insurance industry as well.
While the industry‘s average ownership score is now at 25.30% and exceeds target, the sector lags behind on black women representation and net value, which measures the extent to which the shareholding is free of debt. These shortcomings resulted in the sector achieving an average score that is 65% of target.
Credit Allocation
Growth in total loans and advances extended to the private sector by the banking sector slowed considerably from the middle of 2007 and reached an annual record low of negative 1.6% in November 2009, as lending and borrowing conditions became unfavorable. The repurchase rate increased by a cumulative 500 basis points from mid-2006 to mid-2008. The tightening in monetary policy increased the debt-service costs for an already-indebted private sector. Lending standards for the household sector were also raised in accordance with the National Credit Act, while recently household balance sheets began to be undermined by stagnant real estate prices and increasingly volatile financial markets. Consumer purchasing power was furthermore eroded by inflation. The deteriorating economic climate was evident in weakening business and consumer confidence. Annual growth in installment sale and leasing finance as well as other loans and advances decelerated and recorded negative rates for the greater part of 2009 and 2010. As indicated below, credit exposure of the public sector is small in comparison to that of the private sector.
Tentative evidence of a recovery in credit extension emerged towards the end of 2009 when year-on-year growth in total loans and advances picked up from a nadir of minus 1.6% in November and gained further momentum thereafter to reach a recent high of 10% in December 2012. During this period the repurchase rate declined by a cumulative 700 basis points from late 2008 to July 2012.
Growth in total loans and advances averaged around 8.3% and 8.4% in 2013 and 2014 respectively, before slowing down to a more subdued 7.5 % in September 2015. Fragile consumer confidence and subdued domestic and global economic conditions, further supported by weak employment prospects, restrained growth in credit extension. However, credit growth remained underpinned by demand from the corporate sector while demand from the household sector gradually weakened. Debt servicing cost also increased as the repurchase rate increased by a cumulative 100 basis points between late 2013 and July 2015. Growth in the category other loans and advances, which consists of general loans, bank overdrafts and credit card advances, recovered from negative rates recorded in 2010 to a recent high of 20.5% in December 2012. Growth in other loans and advances then gradually declined to growth rates close to 10% in the three months up to September 2015 when growth in general unsecured loans to households moderated. However, due to healthy demand from the corporate sector, growth in other loans and advances maintained its role as the dominant driver of credit extension during 2014 and the first nine months of 2015.
86
Growth in mortgage advances, which remained positive during the economic downturn, fluctuated between 1.6% and 2.6% between August 2011 and December 2013, consistent with the sluggish levels of activity observed in the residential and commercial property sectors. Mortgage advances made up approximately 54% of total loans and advances in 2010, but this share gradually dwindled to about 43% in 2015 as it lost ground to the high-growth categories of instalment sale credit and general loans. However, growth over 12 months in mortgage advances gradually recovered in 2014 and 2015 to reach 6.0% in September 2015. The recovery in mortgage advances has been skewed towards commercial property, although growth in mortgage advances on residential property also gained pace. The rate of expansion in instalment sale credit and leasing finance, which mainly represents the financing of vehicles, reached a peak of 14.2% towards the end of 2013 but subsequently lost momentum, amounting to 3.8% in September 2015 as vehicle sales declined. The following table sets out the distribution of gross credit exposure per asset class at the end of September 2015.
Percentage distribution of total credit extended (as of September 30, 2015)
| | | | |
| | | Percentage distribution of total
gross credit exposure of banks | |
| | | % | |
Corporate exposure | | | 36.3 | |
Public sector entities | | | 1.7 | |
Local government and municipalities | | | 0.6 | |
Sovereign (including central government and central bank) | | | 7.9 | |
Banks | | | 15.6 | |
Securities firms | | | 2.8 | |
Retail exposure | | | 34.4 | |
Securitisation exposure | | | 0.7 | |
Source: SARB
Total loans and advances to the domestic private sector consist of installment sale credit, leasing finance, mortgage advances, overdrafts, credit card and general advances. The first three categories are referred to as asset-backed credit, while the last three categories together are referred to as other loans and advances.
The National Credit Act was fully implemented on June 1, 2007, with the aim of facilitating access to credit while preventing over-indebtedness and reckless lending in the credit market.
The following table sets out the sectorial distribution of gross credit exposure at the end of September 2015.
Sectorial of bank gross credit exposure as of September 30, 2015
| | | | | | | | |
| Sectorial distribution of credit | | Rand (billion) | | | As a percentage of total
credit | |
Agriculture, hunting, forestry and fishing | | | 94.5 | | | | 1.7 | |
Mining and quarrying | | | 210.1 | | | | 3.8 | |
Manufacturing | | | 261.0 | | | | 4.7 | |
Electricity | | | 102.1 | | | | 1.8 | |
Construction | | | 73.7 | | | | 1.3 | |
Wholesale, retail trade and accommodation | | | 288.1 | | | | 5.2 | |
87
| | | | | | | | |
| Sectorial distribution of credit | | Rand (billion) | | | As a percentage of total
credit | |
Transport and communication | | | 170.8 | | | | 3.1 | |
Financial intermediation and insurance | | | 1,456.4 | | | | 26.3 | |
Real estate | | | 401.8 | | | | 7.3 | |
Business services | | | 188.2 | | | | 3.4 | |
Community, social and personal services | | | 369.2 | | | | 6.7 | |
Private households | | | 1616.6 | | | | 29.2 | |
Other | | | 301.1 | | | | 5.4 | |
Total | | | 5,533.6 | | | | 100.00 | |
The following table sets out the geographical distribution of gross credit exposure as of September 30, 2015.
| | | | | | | | |
| Geographical distribution of credit | | Rand (billion) | | | As a percentage of total
credit | |
South Africa | | | 4781.8 | | | | 86.4 | |
Other African countries | | | 135.3 | | | | 2.4 | |
Europe | | | 437.4 | | | | 7.9 | |
Asia | | | 65.6 | | | | 1.2 | |
North America | | | 83.3 | | | | 1.5 | |
South America | | | 12.5 | | | | 0.2 | |
Other | | | 17.6 | | | | 0.3 | |
Total | | | 5,533.6 | | | | 100.00 | |
88
Capital Markets
The JSE was established in 1887 and is South Africa’s only licensed exchange for all securities. The JSE is governed externally by South African legislation and internally by its own rules and regulations. The JSE listed itself on June 5, 2006. The listing included a proposal regarding the implementation of a B-BBEE initiative. In February 2011, the JSE launched the Black Economic Empowerment (BEE) Board, offering a facility for BEE-compliant parties to list and trade BEE scheme shares. Only one BEE share scheme has thus far been listed.
The introduction of the Johannesburg Equities Trading system (JET), an electronic, automated and central order-driven system, culminated in the closure of the trading floor in 1996. Subsequently, the trading system and real-time information dissemination system (InfoWiz) of the London Stock Exchange (LSE), replaced JET in May 2002. In 2007, the JSE and the LSE both moved onto the LSE’s new trading platform, TradElectTM. JSE members connected to JSE TradElectTM and InfoWiz through a hub at the JSE in South Africa. In July 2012, the JSE moved its equity market trading activity onto Millennium ExchangeTM after concluding a licence agreement with technology solutions provider MillenniumIT. Consequently, the JSE’s trading system relocated from London to Johannesburg.
In November 2013, the JSE implemented a trading and information system upgrade by introducing two new trading sessions. The Closing Price Publication (CPP) session facilitates the publication of official closing prices and is applicable to all segments. The Closing Price Cross (CPX) session facilitates the submission and continuous matching of eligible orders at the published closing price in the central order book.
In June 2003, the JSE announced the first alternative “exchange” in Africa that would list small-and medium-sized companies, specifically targeting B-BBEE and junior mining companies. The Alternative Exchange (AltX) opened in October 2003 and runs parallel to the main exchange, with separate listings requirements and reduced fees. As of September 30, 2015, 60 companies were listed on AltX with a market capitalisation of R33.9 billion.
The South African Futures Exchange (SAFEX) is the forum for trading futures and options contracts. The JSE acquired SAFEX in August 2001 and merged it into the JSE as the Equity Derivatives Market and the Commodity Derivatives Market. Colloquially, the term “SAFEX” is still used to refer to the JSE’s derivatives market. In February 2005, the JSE launched Yield-X, which is the platform for trading of all interest rate-related and currency derivative products. Subsequent to the BESA merger, Yield-X has been collapsed into the JSE’s Interest Rate and Currency Derivatives Markets.
Regulation of insider trading is vested in the FSB, which has extensive surveillance and detection capability and was established in partnership with the JSE. The JSE published a revised booklet on Insider trading and other market abuses in August 2013. The purpose of this booklet is to bring together the various acts, requirements and relevant corporate governance guidelines that have a bearing on preventing market abuse.
Since 1995, the JSE has permitted limited liability corporate memberships and has phased out citizenship requirements for members of the JSE. Several banks, both domestic and international, have acquired or established stock-brokering businesses as members of the JSE. Stockbrokers are required to meet stringent capital adequacy requirements and to keep client funds in trust accounts separate from the stockbroker’s own funds. The Stock Exchange Guarantee Fund was established to protect investors and may be used to discharge certain liabilities of members relating to the buying and selling of securities.
Since 1999, companies have been permitted to buy back their own shares and are required to disclose security interests, directors’ pensions and compensation, and in the case of public companies, to appoint a secretary. Legislation restricts objectionable advertising and canvassing relating to securities.
In 2009, the requirement for auditors of listed companies to register with the JSE was changed to a system of accreditation, and registration for the purpose of providing audit and advisory services is now administered by the IRBA. In June 2010, The JSE introduced an online financial reporting portal called the ‘eXtensible Business Reporting Language’ to enable companies to file their financial reports according to a global electronic reporting standard. In July 2010, the JSE implemented a dark pool block-trading system, Block X, which aims to ensure that large share trades do not have an impact on prices. In the 2011 MTBPS, the Minister of Finance announced that all inward-listed shares on the JSE will henceforth be classified as domestic assets and are eligible for inclusion in the JSE indices.
89
The JSE implemented a methodology change to the FTSE/JSE Africa Index Series with effect from March 15, 2013, in line with a global change to index methodology applied by the FTSE Group. The indices are now constructed with individual share prices weighted according to actual free float rounded up to the next 1%, rather than with a banded free float.
Pursuant to the amalgamation of the BESA and the JSE in June 2009, it has been resolved that the trading platforms of the two interest rate markets operated by the JSE, namely the Yield-X market and the BESA market, will be integrated in 2011. As a result, the old BESA BTB system was decommissioned and the reporting of bond transactions migrated onto the JSE Nutron platform on May 9, 2011. The rules and directives covering the integrated markets (Yield-X and BESA) known as the ‘JSE Interest Rate and Currency (IRC) rules and directives’ also came into effect on May 9, 2011, thus repealing the old rules and directives previously applicable to the BESA market.
The JSE closed its Africa Board in May 2012 when the two remaining listings were incorporated into the main board.
On March 25, 2013, the JSE published additional listing requirements which make provision for the listing of a special purpose acquisition company (SPAC). The JSE also published amendments to its listing requirements on December 3, 2013 to introduce Hybrid Financial Instruments, which have characteristics of both debt and equity securities. Various amendments were made to the JSE listing requirements with effect from September 30, 2014. These spanned a wide range, from enhanced responsibility of sponsors in relation to listing applications to extending the period within which directors have to report dealings in securities from 24 hours to three business days and creating a fast-track listing process for international companies wishing to have a secondary listing on the JSE.
The JSE launched its high-technology colocation centre in May 2014. The facility allows for fast trading and market data access for all JSE markets, the deployment of new trading strategies, cost saving for JSE clients and improved risk mitigation.
While Share Transactions Totally Electronic (Strate) has been the only central securities depository since its inception in 1999, the FSB has granted Granite Central Securities Depository a financial market infrastructure licence to operate as such a depository in August 2015. The licence mandate is for bonds and money-market instruments.
The following table sets forth the market capitalisation and number of companies listed on the equity market of the JSE as well as the trading volumes and values for the period indicated.
JSE
| | | | | | | | | | | | | | | | | | | | | | | | |
| | | As of December 31, | | | As of
September 30, | |
| | | 2010 | | | 2011 | | | 2012 | | | 2013 | | | 2014 | | | 2015 | |
Market capitalisation(1) | | | 6,698.7 | | | | 6,908.5 | | | | 8,383.6 | | | | 10,626.2 | | | | 11,505.0 | | | | 11,428.9 | |
Trading volume(2) | | | 71,252 | | | | 71,464 | | | | 61,844 | | | | 63,892 | | | | 61,735 | | | | 53,278 | |
Trading values(3) | | | 2,990,123 | | | | 3,286,828 | | | | 3,431,584 | | | | 3,981,618 | | | | 4,050,044 | | | | 3,687,795 | |
Listed companies(4) | | | 407 | | | | 406 | | | | 402 | | | | 389 | | | | 391 | | | | 388 | |
Notes: —
| (1) | In billions of Rand at end of period. |
90
| (2) | In millions of shares traded. |
| (4) | Actual figures at the end of period. |
Source: JSE.
According to the World Federation of Exchanges, the JSE was the 17th largest stock exchange in the world, in terms of market capitalisation, as of August 31, 2015.
The market capitalisation of the JSE at the end of September 2015 was R11,428.9 billion. In the first nine months of 2015, the total value of share capital raised by companies listed on the JSE was R176 billion, an increase of R49.5 billion compared with the first nine months of 2014. Turnover of shares listed on the JSE amounted to R4,050.0 billion in 2014 and R3,687.8 billion in the first nine months of 2015 (32% of market capitalisation as of September 30, 2015). Approximately 58 foreign companies which have their primary listing on other exchanges maintain a secondary listing on the JSE, such as Anglo American Plc and Old Mutual Plc. New listings in recent months include New Frontier Properties Limited, Choppies Enterprises Limited and South32 Limited. Non-residents made net purchases of local shares amounting to R35.6 billion in the first nine months of 2015, as compared with net purchases of R27.1 billion in the corresponding period of 2014. On average, non-resident participation in the secondary share market of the JSE has accounted for 19% of the value of all shares traded in the nine months to September 2015. Annualised liquidity on the JSE increased from 33.7% in September 2014 to 43% in September 2015, while the closing value of the All-Share Price Index on the JSE increased by 1.5% over the same period. In the nine months to September 30, 2015, there were 12 de-listings bringing the total number of de-listings since 1999 to 653 as compared to only 373 new listings, of which nine new listings were registered in the nine months to September 30, 2015.
The main index charting the performance of the JSE is the FTSE/JSE Africa All-Share Price Index. At September 30, 2015, the FTSE/JSE All-Share Price Index included 165 companies and accounted for approximately 59% of the market capitalisation of the JSE. As at September 30, 2015, the ten largest companies by market capitalisation represented approximately 53% of total market capitalisation.
The nominal value of turnover in the bond market in the nine months to September 30, 2015 was approximately R17,079 billion. The turnover in the secondary bond market in 2014 was R19,167 billion, compared with R20,616 billion in 2013 and R22,786 billion in 2012. Non-residents’ net sales of South African bonds amounted to R14.4 billion in the first nine months of 2015, compared with net sales of R43.3 billion in the corresponding period of 2014. The non-resident participation rate in the domestic secondary bond market increased from 10% in 2013 to 11% in 2014, before declining to an average of 9% in the first nine months of 2015.
Derivative instruments are traded either on an over-the-counter basis or on an exchange. The Equity and Commodity Derivatives Markets of the JSE, together with the Interest Rate and Currency Derivatives Markets are responsible for trade in all futures contracts and options on futures. SAFEX Clearing Company (Pty) Limited (Safcom) is the clearing house for SAFEX and also provides compliance, surveillance and other exchange services. SAFEX introduced commodity futures in South Africa in July 1995, Rand-Dollar futures in May 1997, and individual equity futures in February 1999. On June 18, 2007, the JSE began trading in various foreign currency derivatives. The financial market infrastructure was modernised in 2008 through the replacement by the JSE of its 15-year-old derivatives system with a multiple instrument online trading system, Nutron.
Safcom achieved a global standard of risk management by complying with the CPSS-IOSCO principles for financial market infrastructures, which was published by the Bank for International Settlements in December 2012. In March 2013, Safcom announced the promulgation of further rules relating to the establishment of a derivatives market default fund. A phased approach was used by the JSE from the end of January 2014 to introduce a new methodology for determining contract level Initial Margin Requirements
91
for equity derivatives. As trading activity in the Equity Derivatives Market increased in the first nine months of 2015, turnover was also higher compared with the corresponding period in 2014. While trade in single-stock contracts (including IDX products) accounted for 3% of total turnover by value in the first nine months of 2015, they accounted for 46% of total number of contracts traded. Turnover in commodity futures and options contracts increased by 41% in the nine months to September 2015, compared with the same period in 2014, along with generally higher domestic grain prices. Turnover in derivatives traded on the JSE for the first nine months of 2015 is indicated in the accompanying table.
Derivatives turnover on the JSE, January to September 2015
| | | | | | | | |
| | | Value | | | Change over one year | |
| | | Rand (billions) | | | Percentage | |
Equity derivatives | | | 5,025 | | | | 15 | |
Warrants | | | 0.4 | | | | -12 | |
Commodity derivatives | | | 536 | | | | 41 | |
Interest rate derivatives | | | 540 | | | | 11 | |
Currency derivatives | | | 429 | | | | 12 | |
Source: JSE.
Exchange Controls
South African law provides for exchange controls, which, among other things, restrict the outward flow of capital from South Africa, the Kingdoms of Lesotho and Swaziland and the Republic of Namibia, known as the common monetary area (CMA). The Exchange Control Regulations are applied throughout the CMA and regulate transactions involving South African residents, including companies and institutional investors. The basic purpose of the Exchange Control Regulations is to mitigate the negative effects caused by a decline of foreign capital reserves in South Africa, which could result in the devaluation of the Rand. The National Government has, however, committed itself to gradually relaxing exchange controls. On November 1, 2010 the Exchange Control Voluntary Disclosure Programme was implemented for a period of 12 months. The primary objective was to encourage applicants to disclose their contraventions and to provide them with a window of opportunity to regularise any contraventions of the Exchange Control Regulations.
The SARB, on behalf of the Minister of Finance, administers South Africa’s exchange control regulations. It is assisted by a number of banking institutions that have been appointed by the Minister of Finance as Authorised Dealers in foreign exchange (Authorised Dealers) and/or Authorised Dealers in foreign exchange with limited authority (ADLAs). Such banking institutions undertake foreign exchange transactions for their own account with their clients, subject to conditions established by the SARB. Until 1995, control over non-residents’ capital transactions was based mainly on the Financial Rand System, which was reintroduced in 1985 at the time of the proclamation of the debt standstill. In March 1995, the National Government abolished the Financial Rand System and the resulting dual exchange rate. No capital controls are, therefore, applied to non-residents, who may freely invest in and disinvest from South Africa. This applies to portfolio investment as well as foreign direct investment into South Africa.
Since the abolition of the Financial Rand System in 1995, South Africa has had a unitary exchange rate that applies to both current and capital transactions between residents and non-residents. As discussed below, South African residents still face certain restrictions. However, these restrictions have gradually been eased to foster macroeconomic stability, a stronger balance of payments and financial sector development. The proposed strategy going forward is characterised by a fundamental shift from a system where a substantial fraction of cross-border transactions are subject to restrictions, approvals and administrative requirements to a more open regime where transactions are generally permitted with a narrow set of regulations targeted at specific national interests, macroeconomic and financial risks.
92
The broad principles for exchange control reforms are as follows:
| | • | | Support the overarching strategy for increasing investment and growth; |
| | • | | Reflect a fundamental shift in the approach to regulation; |
| | • | | Recognise the different objectives that are supported by exchange controls (e.g. contributing to systemic stability; supporting prudential regulation of financial institutions; protecting the tax base; and supporting the prevention of financial crime); |
| | • | | Address the distortions created by exchange controls; |
| | • | | Holistic approach and taking into account interactions between institutions and individuals, residents and non-residents; and |
| | • | | Proportionate reporting requirements. |
93
The present exchange control system in South Africa is used primarily to control movements of capital by South African residents. In order to ensure that capital transfers are not disguised as current payments, controls and limits are placed on transfers of a current nature, such as the single discretionary allowance of up to R1 million per annum that may be apportioned for travel for vacation and business purposes, study allowances, donations to missionaries, maintenance transfers, monetary gifts/loans to non-residents and residents temporary abroad, alimony and child support payments, wedding expenses and special occasions and foreign capital allowance (without the requirement to obtain a Tax Clearance Certificate). In addition, private individuals may invest up to R10 million per calendar year for any purpose outside the CMA, provided that the individual is over the age of 18 years and subject to obtaining a Tax Clearance Certificate, which is issued by the South African Revenue Service.
Furthermore, in order to eliminate the bias against residents, the South African Reserve Bank’s Financial Surveillance Department will consider investments by residents in excess of the R10 million foreign capital allowance, subject to certain conditions, such as tax compliance and annual reporting.
The Minister of Finance also announced the removal of controls on emigrants’ blocked assets. South African emigrants were previously allowed to remit up to R10 million per single person or R20 million per family unit upon emigration. Emigrants can now transfer the allowance per calendar year and emigrants can also apply to the Financial Surveillance Department for the transfer of all their assets without any exit levy applying to free those assets, provided their tax obligations were met.
With effect from October 2004, limits on foreign direct investments by South African corporates were abolished. Dividends declared by offshore subsidiaries of South African companies after October 26, 2004 may be retained offshore. Foreign dividends repatriated to South Africa after October 26, 2004 may be retransferred offshore again at any time for any purpose. Corporates are allowed, on application, to transfer funds from South Africa for each new and approved foreign investment outside the CMA. Authorised Dealers administer the directives and guidelines on foreign direct investments under R500 million. Application to the SARB’s Financial Surveillance Department for prior approval of a foreign investment is still required for foreign direct investments over R500 million. These applications, which permit the SARB to monitor the level of foreign investment, are considered on merit and are granted if South African exchange control authorities believe the investments would be of long-term economic benefit to South Africa and at least 10% of the foreign target entity’s voting rights must be obtained. The SARB reserves the right to stagger capital outflows relating to very large foreign investments to manage any potential impact on the foreign exchange market. In order to reduce the administrative costs and procedures of doing business for corporates, the Minister of Finance, in the 2011 MTBPS, allowed corporates to be able to top up capital in their offshore business from South Africa, provided the additional funding is authorised within the same calendar year in which the original investment was approved and as long as they remain within the annual limit of R500 million. South African corporates are also allowed to make bona fide new outward foreign direct investments outside their current line of business.
South African companies are generally permitted to undertake international expansion and the policy stance is to encourage growth into the rest of Africa. There are no limits on the use of domestic capital for funding investment, although administrative and reporting conditions remain in place and investments above R1 billion per year require approval. The HoldCo regime introduced in 2013 provides local companies with a structure for managing their multinational operations without restrictions. Listed companies may transfer up to R2 billion per year into approved HoldCos; unlisted companies may transfer up to R1 billion, subject to transparency requirements. Listed companies can further apply to the Reserve Bank to transfer additional amounts, subject to demonstrated benefits for South Africa.
In the 2009 MTBPS, reforms to reduce red tape on business transactions were announced. The prohibition on SADC loop structures was abolished and recently, in the 2011 MTBPS, the Minister of Finance announced that transactions which result in ‘loop’ structures not exceeding a threshold of 10% - 20% equity, and/or voting rights, whichever is higher, in the foreign target entity, will be processed by Authorised Dealers without the need for prior approvals.
94
In the 2010 MTBPS, the Minister of Finance announced measures to encourage global diversification from a domestic base by using South Africa as a gateway to Africa. In this regard, from January 1, 2010, qualifying internationally headquartered companies are allowed to raise and deploy capital offshore without the need to obtain exchange control approval, subject to reporting requirements. With effect from November 2012, the shares and/or debt of a headquarter company may be listed on the JSE Limited or be held directly or indirectly by a shareholder with shares or debt listed on the JSE Limited.
The 3:1 ratio applicable to local financial assistance in respect of affected persons was withdrawn. The 1:1 ratio remains applicable for the acquisition of residential properties and any other financial transactions (such as portfolio investments, securities lending, hedging and repurchase agreements, among others) by non-residents and affected persons. Local financial assistance made available to emigrants also remains subject to the 1:1 ratio.
Authorised Dealers are allowed to approve the granting of credit terms in respect of exports only for periods not exceeding six months, with an extension of a further six months in certain circumstances without reference to the SARB. In an endeavor to reduce barriers to trade, the Minister allowed corporates to do advance payments for capital goods for up to 100% of ex-factory cost of goods to be imported not exceeding a total value of R10 million. Payments for importation of capital goods in excess of R10 million may only be provided up to 50% of the ex-factory cost of the goods to be imported. Furthermore, corporates are allowed to cover forward (using forward exchange contracts) up to 75% of budgeted import commitments or export accruals in respect of the forthcoming financial year without an application to the SARB. The R250,000 limit on advance payments for permissible imports, other than capital goods, was removed and South African companies are allowed to open foreign bank accounts for permissible purposes without prior approval, subject to reporting obligations.
South African companies involved in international trade are permitted to operate a single customer foreign currency (CFC) account for both the trade and services and use it for a wider variety of permissible transactions. This reduced the transaction costs associated with multi CFC accounts and their restricted use.
Corporates engaged in exportation and importation have been permitted to offset costs of imports against proceeds from exports within a specified period over a CFC account. The requirement that companies must convert foreign exchange credited to a CFC account to Rand within 180 days was removed. South African companies are, however, still required to repatriate export proceeds to South Africa.
Various measures aimed at easing certain of the country’s remaining exchange control regulations became effective in the late 1990s. The measures included abolishing most of the remaining quantitative limits on current account transactions; permitting South African institutions to invest funds abroad; permitting trading of Rand-dollar futures contracts on SAFEX, with participation initially restricted to individuals and institutional investors; and relaxing the application of local borrowings limits to foreign-controlled South African companies.
Retirement funds and underwritten policies of long-term insurers are permitted, without prior SARB approval, to invest up to 25% of their total retail assets under management in foreign assets and an additional 5% in Africa. Collective investment scheme management companies, investment managers registered as institutional investors for exchange control purposes and investment-linked businesses of long-term insurers are permitted to invest up to 35% of their total retail assets under management in foreign assets and an additional 5% in Africa.
The macro-prudential limit for Authorised Dealers was introduced in 2010 and enabled Authorised Dealers to acquire direct and indirect foreign exposure of up to a macro-prudential limit of 25% of their total liabilities excluding total shareholders’ equity.
In the 2013 Budget Speech, the Minister of Finance announced that Authorised Dealers may invest an additional 5% of their total liabilities, excluding total shareholders’ equity, for expansion into Africa, in addition to the current macro-prudential limit of 25%.
95
Foreign companies, governments and institutions are permitted to list equity, bond and derivative instruments on South Africa’s securities exchanges. Furthermore, South African private individuals, corporates, trusts and partnerships are permitted to invest without restrictions in approved inward-listed instruments on South African exchanges.
In the 2011 MTBPS, the Minister of Finance announced further significant reforms of inward listings in order to promote the development of the South African capital markets. The Minister announced that all listed shares on the JSE, traded and settled in Rand, will be classified as domestic assets for the purpose of trading on the JSE and inclusion in its indices. This new dispensation does not affect companies currently classified as domestic, which have a primary listing on a foreign exchange (e.g. the ‘London 5’), which will continue to be included in the indices on the current basis. This initiative is meant to improve South Africa’s position as a financial gateway into Africa. However, in order to balance between capital market growth and development and the objective of managing exposure to foreign risk, prudential institutions would still be required to report their foreign exposure to regulatory authorities.
These changes also herald a shift in the regulatory regime from control measures to prudential regulation.
96
The restrictions on South African companies and other entities to participate in foreign inward-listed securities on the JSE, including participation in the Rand futures, were removed. These changes enable South African companies, trusts, partnerships and banks to manage their foreign exposure, since they were permitted to participate in Rand futures market on the JSE without restrictions. These changes allow companies to diversify and hedge their currency exposure, which support macroeconomic stability, reduce exchange-rate volatility and deepen domestic financial markets. This dispensation was also extended to investment in inward-listed (foreign) instruments on the JSE and the Bond Market of the JSE.
Furthermore, the Minister of Finance allowed the JSE Limited to offer to non-resident and qualifying South African and other CMA corporate entities directly and actively involved in the agricultural grain industry, Zambian referenced grain derivative contracts for trading and settlement in USD.
To promote SA further as a hub for regional investments, since February 27, 2013 listed entities on the JSE Limited were allowed to establish one subsidiary in South Africa to hold African and offshore operations, which will be granted certain tax and foreign exchange dispensations.
In an effort to promote competition and reduce the cost of remittances to neighboring and other countries, ownership restrictions on international participation in Authorised Dealers in foreign exchange with limited authority (ADLAs) (i.e., foreign exchange bureaus) were removed. In addition to this, the requirement for money remittance agencies to partner with existing Authorised Dealers in order to do remittance work will no longer be obligatory.
Gold and Foreign Exchange Contingency Reserve Account (GFECRA)
GFECRA reflects the Rand currency and gold price valuation profits and losses on all transactions which the SARB had entered into in terms of the SARB Act on behalf of the National Treasury. The GFECRA comprises credit and debit balances on three different accounts: a gold price adjustment account (GPAA); a foreign exchange adjustment account (FEAA); and a forward exchange contracts adjustment account (FECAA).
The GPAA reflects any valuation profit or loss on the gold held by the SARB. The volume of the gold holdings has been fairly static over the past decade at around four million fine ounces. The FEAA account reflects any profit or loss on assets of the SARB denominated in currencies other than the Rand as a result of depreciation or appreciation, as the case may be, of the Rand against the currency of such assets. In terms of the SARB Act, the SARB can calculate an exchange commission on all foreign exchange transactions conducted on behalf of the National Treasury. This commission or exchange margin is also reflected in the FEAA.
The FECAA reflects profits or losses on any forward exchange contract entered into by the SARB, valuation profits and losses on foreign exchange liabilities of the SARB, and any profit or loss due to changes in the value of the Rand against the currency of the United States on certain agreements for the reinsurance of export contracts. Since early 1997, the SARB has terminated the extension of forward cover with respect to future external commitments.
During the 1980s and 1990s, the SARB intervened in the foreign exchange market via the forward book. This policy was abandoned in August 1998. Currently, the SARB purchases foreign exchange from the Authorised Dealers to accumulate reserves when market conditions allow. However, the SARB does not intervene in the foreign exchange market with a view to influence the value of the Rand.
Prior to calendar year 2002, upon the agreement of the Minister of Finance and the Governor of the SARB, the balance of the GFECRA could be reduced through the National Government to the SARB by the issuance of zero-coupon bonds convertible into interest-bearing bonds in situations where the SARB wants to use the bonds in its open market operations. With respect to the GFECRA balance on March 31, 2002, and in accordance with the Gold and Foreign Exchange Contingency Reserve Defrayal Act, the National Treasury settled the negative balance amounting to R28.0 billion in four tranches, partly in cash and partly in bonds, over a four-year period that commenced in 2003. The National Treasury paid the final tranche of the outstanding balance of R28 billion in April 2005.
97
In calendar year 2005, a new settlement methodology for the settlement of the GFECRA balances was agreed between the National Treasury and the SARB, whereby the balance on the GFECRA as of March 31 each year is split into transactions with a cash flow (money-market liquidity) impact and a non-cash flow (revaluation) component. Valuation gains and losses are not settled, but reflected either as an asset or liability on the financial statements of the two institutions. Therefore, only transactions with a cash flow impact are settled. The outstanding balance to be settled accumulates interest at the prevailing repurchase rate. The gross gold and foreign exchange reserves decreased to US$46.1 billion at the end of September 2015, down from US$49.1 billion a year earlier. This decline is mainly as a result of a decline in the U.S. dollar gold price, the appreciation of the U.S. dollar against other major currencies and the normal foreign exchange transactions of SARB, mostly on behalf of the National Treasury.
As at March 31, 2014, the GFECRA showed a positive balance of R177.9 billion which represents net valuation gains of R177.8 billion and cash flow losses of R68 million. These cash flow losses were settled on June 6, 2014. As at March 31, 2015, the GFECRA balance had increased to R203.4 billion, mainly due to the depreciation of the Rand over the period. Cash flow losses to be settled by the National Government amounted to R153 million for the year to March 31, 2015. This balance was settled on April 10, 2015.
The negative net open foreign currency position of the SARB amounted to US$23.2 billion in September 1998 which then changed from negative to positive in May 2003. The net open foreign currency position, which is now referred to as the International Liquidity Position, reflected a positive balance of US$43.3 billion at the end of September 2014, declining to US$41.2 billion as at September 30, 2015.
In February 2004, the SARB balanced its previously oversold forward foreign exchange book, eliminating a key source of external vulnerability and pressure on money market operations. With a reduced need for the sterilization of excess liquidity arising from maturing forward contracts, the SARB has normalized its money market activities and has been able to increase the official net international reserves of the country. The SARB currently has an overbought (positive) forward foreign exchange book amounting to US$2.2 billion as at September 30, 2015.
98
THE EXTERNAL SECTOR OF THE ECONOMY
Foreign Trade
The following table sets forth South Africa’s balance of trade for the periods indicated.
Balance of Trade
| | | | |
| Year | | Balance of Trade
Rand (billion) | |
2010 | | | 59.7 | |
2011 | | | 51.0 | |
2012 | | | -31.5 | |
2013 | | | -68.3 | |
2014 | | | -68.6 | |
2015 | | | -14.3 | |
The following table presents a breakdown of South Africa’s balance of trade by sector for the periods indicated.
Foreign Trade
| | | | | | | | | | | | | | | | | | | | | | | | |
| | | Year ended December 31, Rand (billion) | |
| Sector | | 2010 | | | 2011 | | | 2012 | | | 2013 | | | 2014 | | | 20151 | |
Exports | | | | | | | | | | | | | | | | | | | | | | | | |
Total merchandise exports | | | 654.4 | | | | 772.5 | | | | 801.5 | | | | 906.1 | | | | 961.8 | | | | 748.1 | |
Agriculture, forestry & fishing | | | 35.0 | | | | 40.2 | | | | 43.0 | | | | 54.1 | | | | 62.6 | | | | 56.2 | |
Total: Mining | | | 139.9 | | | | 190.8 | | | | 202.2 | | | | 234.4 | | | | 235.7 | | | | 162.9 | |
Coal mining | | | 40.4 | | | | 54.6 | | | | 55.2 | | | | 56.3 | | | | 56.0 | | | | 45.8 | |
Gold & uranium ore mining | | | 0.0 | | | | 0.0 | | | | 0.0 | | | | 0.0 | | | | 0.0 | | | | 0.0 | |
Other mining | | | 99.5 | | | | 136.2 | | | | 147.0 | | | | 178.1 | | | | 179.7 | | | | 117.1 | |
Total: Manufacturing | | | 435.2 | | | | 495.6 | | | | 500.1 | | | | 558.1 | | | | 618.1 | | | | 470.0 | |
Food | | | 14.9 | | | | 14.9 | | | | 17.3 | | | | 21.3 | | | | 24.9 | | | | 18.0 | |
Beverages | | | 9.5 | | | | 9.8 | | | | 10.5 | | | | 13.9 | | | | 15.2 | | | | 11.3 | |
Tobacco | | | 2.4 | | | | 2.3 | | | | 2.8 | | | | 2.7 | | | | 2.7 | | | | 2.0 | |
Textiles | | | 7.9 | | | | 9.4 | | | | 10.2 | | | | 12.1 | | | | 13.2 | | | | 10.3 | |
Wearing apparel | | | 2.7 | | | | 3.2 | | | | 3.4 | | | | 4.1 | | | | 4.6 | | | | 3.7 | |
Leather & leather products | | | 0.4 | | | | 0.5 | | | | 0.5 | | | | 0.6 | | | | 0.9 | | | | 0.8 | |
Footwear | | | 1.5 | | | | 1.7 | | | | 1.9 | | | | 2.3 | | | | 2.6 | | | | 1.9 | |
Wood & wood products | | | 3.8 | | | | 3.9 | | | | 3.9 | | | | 4.4 | | | | 5.6 | | | | 4.7 | |
Paper & paper products | | | 12.1 | | | | 13.6 | | | | 12.2 | | | | 13.8 | | | | 16.8 | | | | 13.2 | |
Printing, publishing & recorded media | | | 1.2 | | | | 1.2 | | | | 1.0 | | | | 1.1 | | | | 1.2 | | | | 0.8 | |
99
| | | | | | | | | | | | | | | | | | | | | | | | |
| | | Year ended December 31, Rand (billion) | |
| Sector | | 2010 | | | 2011 | | | 2012 | | | 2013 | | | 2014 | | | 20151 | |
Coke & refined petroleum products | | | 11.8 | | | | 13.8 | | | | 18.7 | | | | 17.5 | | | | 21.3 | | | | 17.6 | |
Basic chemicals | | | 24.5 | | | | 28.9 | | | | 30.7 | | | | 33.3 | | | | 37.0 | | | | 28.1 | |
Other chemicals | | | 7.9 | | | | 9.2 | | | | 10.4 | | | | 12.6 | | | | 13.9 | | | | 10.7 | |
Rubber products | | | 3.7 | | | | 5.0 | | | | 5.4 | | | | 5.6 | | | | 5.8 | | | | 4.2 | |
Plastic products | | | 8.8 | | | | 10.1 | | | | 12.8 | | | | 14.0 | | | | 16.9 | | | | 11.2 | |
Glass & glass products | | | 1.0 | | | | 1.0 | | | | 1.0 | | | | 1.9 | | | | 2.0 | | | | 1.5 | |
Non-metallic minerals | | | 1.8 | | | | 2.2 | | | | 2.1 | | | | 2.4 | | | | 2.4 | | | | 1.8 | |
Basic iron & steel | | | 60.2 | | | | 60.7 | | | | 56.6 | | | | 61.3 | | | | 75.2 | | | | 54.1 | |
Basic non-ferrous metals | | | 151.3 | | | | 176.0 | | | | 154.4 | | | | 170.0 | | | | 185.6 | | | | 120.6 | |
Metal products excluding machinery | | | 8.8 | | | | 9.3 | | | | 11.5 | | | | 11.2 | | | | 19.2 | | | | 11.7 | |
Machinery & equipment | | | 32.5 | | | | 40.9 | | | | 43.9 | | | | 48.5 | | | | 64.6 | | | | 49.1 | |
Electrical machinery | | | 5.1 | | | | 6.7 | | | | 7.5 | | | | 8.3 | | | | 23.6 | | | | 17.4 | |
Television, radio & communication equipment | | | 2.8 | | | | 3.4 | | | | 3.4 | | | | 4.7 | | | | 3.5 | | | | 2.3 | |
Professional & scientific equipment | | | 2.9 | | | | 3.6 | | | | 4.5 | | | | 4.3 | | | | 4.3 | | | | 2.5 | |
Motor vehicles, parts & accessories | | | 50.5 | | | | 56.5 | | | | 63.9 | | | | 71.5 | | | | 89.7 | | | | 70.6 | |
Other transport equipment | | | 2.3 | | | | 4.6 | | | | 4.2 | | | | 5.4 | | | | 6.8 | | | | 4.6 | |
Furniture | | | 3.9 | | | | 3.2 | | | | 2.8 | | | | 2.8 | | | | 5.6 | | | | 4.0 | |
Other industries | | | 15.7 | | | | 20.2 | | | | 23.0 | | | | 27.2 | | | | 30.4 | | | | 28.3 | |
Electricity, gas & steam | | | 1.0 | | | | 1.5 | | | | 2.0 | | | | 2.7 | | | | 2.7 | | | | 1.7 | |
Undefined | | | 0.5 | | | | 1.2 | | | | 1.2 | | | | 1.4 | | | | 2.2 | | | | 2.7 | |
Imports | | | | | | | | | | | | | | | | | | | | | | | | |
Total merchandise imports | | | 607.0 | | | | 742.7 | | | | 854.4 | | | | 991.2 | | | | 1082.9 | | | | 807.7 | |
Agriculture, forestry & fishing | | | 8.7 | | | | 12.4 | | | | 13.2 | | | | 13.0 | | | | 40.5 | | | | 33.7 | |
Total: Mining | | | 89.3 | | | | 113.4 | | | | 139.7 | | | | 153.3 | | | | 257.0 | | | | 134.0 | |
Coal mining | | | 0.4 | | | | 1.8 | | | | 1.1 | | | | 2.6 | | | | 5.6 | | | | 3.4 | |
Gold & uranium ore mining | | | 0.0 | | | | 0.0 | | | | 0.0 | | | | 0.0 | | | | 0.0 | | | | 0.0 | |
Other mining | | | 88.9 | | | | 111.6 | | | | 138.6 | | | | 150.7 | | | | 251.4 | | | | 130.6 | |
Total: Manufacturing | | | 485.9 | | | | 598.1 | | | | 678.1 | | | | 630.6 | | | | 630.6 | | | | 403.6 | |
Food | | | 24.5 | | | | 30.5 | | | | 38.3 | | | | 41.4 | | | | 21.4 | | | | 16.8 | |
Beverages | | | 3.3 | | | | 3.9 | | | | 4.6 | | | | 5.8 | | | | 5.9 | | | | 4.4 | |
Tobacco | | | 0.4 | | | | 0.3 | | | | 0.5 | | | | 0.6 | | | | 2.1 | | | | 1.6 | |
Textiles | | | 7.2 | | | | 8.6 | | | | 9.3 | | | | 10.6 | | | | 34.9 | | | | 29.5 | |
Wearing apparel | | | 10.2 | | | | 11.4 | | | | 13.5 | | | | 17.1 | | | | 18.7 | | | | 15.9 | |
Leather & leather products | | | 2.1 | | | | 2.4 | | | | 2.6 | | | | 3.2 | | | | 2.9 | | | | 2.3 | |
Footwear | | | 5.2 | | | | 6.7 | | | | 7.8 | | | | 9.3 | | | | 11.7 | | | | 10.0 | |
Wood & wood products | | | 2.2 | | | | 2.6 | | | | 2.9 | | | | 3.3 | | | | 4.6 | | | | 3.8 | |
Paper & paper products | | | 7.3 | | | | 8.0 | | | | 8.7 | | | | 10.6 | | | | 12.6 | | | | 9.9 | |
Printing, publishing & recorded media | | | 2.2 | | | | 2.3 | | | | 2.7 | | | | 3.1 | | | | 2.9 | | | | 1.9 | |
Coke & refined petroleum products | | | 29.6 | | | | 46.8 | | | | 53.0 | | | | 65.3 | | | | 73.3 | | | | 60.2 | |
Basic chemicals | | | 28.6 | | | | 36.1 | | | | 40.0 | | | | 45.2 | | | | 65.2 | | | | 54.3 | |
Other chemicals | | | 36.6 | | | | 40.7 | | | | 47.6 | | | | 55.6 | | | | 37.2 | | | | 17.6 | |
Rubber products | | | 7.0 | | | | 8.4 | | | | 10.0 | | | | 12.0 | | | | 14.4 | | | | 10.9 | |
Plastic products | | | 7.0 | | | | 8.4 | | | | 9.7 | | | | 11.8 | | | | 27.8 | | | | 22.2 | |
Glass & glass products | | | 1.9 | | | | 2.1 | | | | 2.3 | | | | 2.5 | | | | 2.9 | | | | 2.6 | |
Non-metallic minerals | | | 6.2 | | | | 6.9 | | | | 7.4 | | | | 8.8 | | | | 10.1 | | | | 8.6 | |
Basic iron & steel | | | 9.8 | | | | 13.4 | | | | 14.0 | | | | 20.2 | | | | 13.6 | | | | 12.4 | |
Basic non-ferrous metals | | | 10.7 | | | | 12.4 | | | | 13.7 | | | | 16.3 | | | | 18.3 | | | | 13.5 | |
Metal products excluding machinery | | | 11.6 | | | | 13.9 | | | | 15.4 | | | | 19.5 | | | | 22.8 | | | | 19.0 | |
Machinery & equipment | | | 88.2 | | | | 114.6 | | | | 135.3 | | | | 150.7 | | | | 144.4 | | | | 112.5 | |
Electrical machinery | | | 19.8 | | | | 21.7 | | | | 26.9 | | | | 39.4 | | | | 41.4 | | | | 33.7 | |
Television, radio & communication equipment | | | 35.7 | | | | 37.9 | | | | 38.6 | | | | 52.5 | | | | 57.3 | | | | 47.8 | |
Professional & scientific equipment | | | 16.6 | | | | 19.5 | | | | 21.4 | | | | 25.8 | | | | 27.8 | | | | 17.3 | |
100
| | | | | | | | | | | | | | | | | | | | | | | | |
| | | Year ended December 31, Rand (billion) | |
| Sector | | 2010 | | | 2011 | | | 2012 | | | 2013 | | | 2014 | | | 20151 | |
Motor vehicles, parts & accessories | | | 86.6 | | | | 104.6 | | | | 118.0 | | | | 140.0 | | | | 88.9 | | | | 67.0 | |
Other transport equipment | | | 13.3 | | | | 20.1 | | | | 16.6 | | | | 13.5 | | | | 13.5 | | | | 9.4 | |
Furniture | | | 3.6 | | | | 3.9 | | | | 4.6 | | | | 5.3 | | | | 8.3 | | | | 7.1 | |
Other industries | | | 8.5 | | | | 9.9 | | | | 12.8 | | | | 13.5 | | | | 14.2 | | | | 11.7 | |
Electricity, gas & steam | | | 1.6 | | | | 1.7 | | | | 1.6 | | | | 1.5 | | | | 1.8 | | | | 1.0 | |
Undefined | | | 0.6 | | | | 0.7 | | | | 0.7 | | | | 0.7 | | | | 1.1 | | | | 1.7 | |
Exports
South Africa’s exports to developed economies still consists mainly of mineral products, chemical products and base metals while the composition of exports to Africa consists mainly machinery & appliances, vehicles & parts and other manufactured goods. Since 2012, the fastest growing markets for South African exports have been Africa and Asia, with exports to these two continents accounting for almost 60% of total exports.
The value of exports increased by 5.5% in the first nine months of 2015 compared with the same period in 2014, supported by strong growth in exports of vehicles (30.2% year-on-year), precious metals (20.0% year-on-year), stone & glass (13.1% year-on-year) and wood products (14.1% year-on-year). The high export growth in precious metals reflects a recovery in the production of gold and platinum which were adversely affected by strike activity in the first half of 2014. In contrast, exports of mineral products and iron & steel declined by 7.5% and 2.7%, respectively, owing to weak demand from Asia, particularly China.
Improving economic prospects in advanced economies combined with sustained weakness in the Rand underpinned domestic exports, despite declining commodity prices and a slowdown in emerging market economies. Furthermore, trade and financial links with sub-Saharan Africa continue to grow, providing opportunities for South African firms to expand into the continent. The uneven global recovery as well as structural changes across economies meant that South Africa has had to diversify its export basket over time in order to help reduce its external vulnerabilities whilst at the same time taking advantages of the opportunities presented by economies growing at a faster pace.
In the first nine months of 2015, exports to the United States grew by 15.6% and to the EU by 10.0% owing to a pickup in economic activity. Exports to China, Japan and the SADC fell by 4.1%, 1.7% and 1.9%, respectively. Exports to China were weighed down by decreased demand for minerals and metal products, while Japan’s economy was on the brink of recession. Exports to Asia as a whole fell by 2.3% as many of the Asian economies have close trade ties with China, which has inevitably affected their growth.
Asia remains the largest recipient of South Africa’s goods, accounting for 29.2% of total exports in the nine months to September 2015, marginally higher than Africa’s share of 28.8%. Exports to Asia totaled R218 billion while those to Africa totaled R216 billion year to September. Exports to these two regions have over time outpaced exports to the EU, which now account for only 23.7% of South Africa’s total exports as compared to 43% in the mid-1990s. BRIC members also account for a significant share of South Africa’s exports, with 15.5% of exports destined for these economies in the first nine months of 2015. The US accounts for 7.4% of total domestic exports, also reflecting a declining trending.
Imports
In the first nine months of 2015, imports posted modest growth of 0.6% compared to the same period last year, weighed by a sharp contraction in imports of mineral products (-30.1% year-on-year) and precious metals (-34.0% year-on-year). The decline in mineral products imports mainly reflects the 44.6% drop in imports of petroleum and crude products. Import categories that posted strong growth in the nine months to September 2015 relative to the same period in 2013 were live animal products (26.7%), iron & steel (22.6%), equipment components (19.2%) and textiles (13.5%).
101
Current Account Deficit
South Africa’ South Africa’s current account deficit improved to 3.9% of GDP in the first half of 2015, lower than the 5.4% recorded in 2014. The improvement mainly reflects the improvement in the trade deficit, itself the result of higher export volumes and a lower oil import bill. Lower net income payments due to higher dividend receipts also reduced the current account deficit.
South Africa’s Commitment to the WTO
South Africa is a founding member of the General Agreement of Trade and Tariffs (GATT) and has been an active participant for decades in the various GATT rounds of multilateral trade negotiations. In line with the need to open up the economy and increase competition in the economy, South Africa has liberalized most sectors of the economy since the 1990s.
South Africa has phased out support measures and subsidies inconsistent with the principles expressed in the GATT. This encourages South African industries to improve their competitiveness in domestic and foreign markets, while at the same time benefiting from cost reductions, supply side support measures and reduced import duties of trading partner countries that were negotiated in the Uruguay Round, as well as from certain market access preferences that have been granted to South Africa by Canada, the EU, Japan, Norway, Russia, Switzerland and the U.S..
South Africa enjoys beneficial trade agreements with a number of countries, both multilateral and bilateral. It enjoys preferential treatment under the African Growth and Opportunity Act when trading with the United States.
In Africa, South Africa has a number of free trade agreements with African countries. These include Botswana, Namibia, Lesotho and Namibia, under the auspices of the Southern African Customs Union. South Africa is also an important member of the SADC, which, amongst other things, allows for preferential trading access to Zimbabwe. It is anticipated that the Tripartite Free Trade Agreement between the SADC, COMESA and EAC will help to facilitate market access and increased trade within the continent.
South Africa also has an agreement with the EU to export most of its goods duty free under the Trade Development and Cooperation Agreement and is in the process of negotiating a new trade agreement and a new economic partnership agreement. China, India and Brazil are also important markets for South Africa. Thus South Africa has strengthened diplomatic ties and trade cooperation with these countries.
Geographic Distribution of Trade
The following table sets forth the distribution of South Africa’s exports and imports of merchandise for the periods indicated.
Distribution of Merchandise Trade
| | | | | | | | | | | | | | | | | | | | | | | | |
| | | 2010 | | | 2011 | | | 2012 | | | 2013 | | | 2014 | | | 2015(1) | |
| | | (Rand billions) | |
Exports | | | | | | | | | | | | | | | | | | | | | | | | |
China | | | 58.6 | | | | 85.3 | | | | 81.1 | | | | 109.4 | | | | 94.7 | | | | 70.3 | |
Not allocated | | | 66.0 | | | | 79.7 | | | | 76.8 | | | | 67.1 | | | | 54.7 | | | | 45.9 | |
US | | | 51.5 | | | | 59.6 | | | | 61.6 | | | | 65.3 | | | | 67.5 | | | | 55.6 | |
Japan | | | 46.3 | | | | 55.3 | | | | 44.3 | | | | 52.9 | | | | 52.9 | | | | 36.6 | |
Germany | | | 42.7 | | | | 43.2 | | | | 38.0 | | | | 42.0 | | | | 48.7 | | | | 51.2 | |
India | | | 22.2 | | | | 24.3 | | | | 30.1 | | | | 28.0 | | | | 40.8 | | | | 31.0 | |
UK | | | 26.4 | | | | 28.7 | | | | 27.1 | | | | 31.7 | | | | 36.9 | | | | 31.6 | |
Netherlands | | | 17.2 | | | | 21.5 | | | | 24.7 | | | | 30.0 | | | | 31.5 | | | | 20.0 | |
Zambia | | | 11.4 | | | | 16.2 | | | | 20.1 | | | | 24.6 | | | | 27.0 | | | | 20.0 | |
Zimbabwe | | | 15.1 | | | | 17.1 | | | | 18.9 | | | | 22.3 | | | | 23.7 | | | | 17.3 | |
Mozambique | | | 13.9 | | | | 17.2 | | | | 18.9 | | | | 26.6 | | | | 31.0 | | | | 21.2 | |
Imports | | | | | | | | | | | | | | | | | | | | | | | | |
China | | | 84.1 | | | | 103.1 | | | | 120.1 | | | | 154.5 | | | | 167.6 | | | | 143.7 | |
Germany | | | 66.1 | | | | 77.3 | | | | 84.0 | | | | 103.2 | | | | 108.6 | | | | 93.1 | |
Saudi Arabia | | | 23.7 | | | | 32.3 | | | | 64.6 | | | | 77.4 | | | | 77.3 | | | | 25.4 | |
US | | | 41.9 | | | | 58.4 | | | | 61.2 | | | | 63.4 | | | | 71.4 | | | | 56.5 | |
Japan | | | 31.0 | | | | 34.5 | | | | 37.9 | | | | 39.3 | | | | 41.0 | | | | 30.5 | |
India | | | 20.7 | | | | 29.2 | | | | 37.6 | | | | 51.9 | | | | 49.4 | | | | 41.6 | |
Nigeria | | | 16.1 | | | | 22.7 | | | | 30.5 | | | | 35.0 | | | | 55.7 | | | | 29.0 | |
UK | | | 22.1 | | | | 29.1 | | | | 28.9 | | | | 32.8 | | | | 35.4 | | | | 25.9 | |
Angola | | | 14.6 | | | | 11.5 | | | | 23.0 | | | | 18.9 | | | | 21.8 | | | | 12.5 | |
Thailand | | | 13.4 | | | | 16.5 | | | | 22.2 | | | | 26.6 | | | | 25.8 | | | | 20.0 | |
Italy | | | 14.7 | | | | 19.6 | | | | 21.1 | | | | 25.9 | | | | 28.6 | | | | 20.9 | |
Note:—
| (1) | Through September 30, 2015. |
| Source: | www.quantec.co.za. |
102
Balance of Payments (1)
The following table sets forth the balance of payments for South Africa for the periods indicated.
| | | | | | | | | | | | | | | | | | | | | | | | |
| | | For the year ended December 31 | | | For the six
months ended
| |
| | | 2010 | | | 2011 | | | 2012 | | | 2013 | | | 2014 | | | June 30 2015 | |
| | | (Rand millions) | |
Current account | | | | | | | | | | | | | | | | | | | | |
Merchandise exports (f.o.b.)(2) | | | 609,357 | | | | 719,445 | | | | 753,975 | | | | 868,701 | | | | 941,171 | | | | 470,453 | |
Net gold exports(3) | | | 59,499 | | | | 75,298 | | | | 71,050 | | | | 63,887 | | | | 62,655 | | | | 32,140 | |
Service receipts | | | 117,493 | | | | 126,185 | | | | 144,789 | | | | 162,183 | | | | 182,814 | | | | 92,717 | |
Income receipts | | | 34,099 | | | | 38,118 | | | | 48,501 | | | | 64,441 | | | | 82,235 | | | | 61,441 | |
Less: Merchandise imports (f.o.b)(2) | | | 609,112 | | | | 743,756 | | | | 856,570 | | | | 1,000,929 | | | | 1,072,464 | | | | 516,887 | |
Less: Payments for services | | | 143,121 | | | | 150,929 | | | | 155,243 | | | | 174,162 | | | | 184,828 | | | | 96,112 | |
Less: Income payments | | | 92,698 | | | | 115,449 | | | | 136,837 | | | | 157,229 | | | | 183,779 | | | | 97,779 | |
Current transfers (net receipts (+))(4) | | | -16,762 | | | | -14,199 | | | | -31,369 | | | | -30,666 | | | | -34,448 | | | | -17,202 | |
Balance on current account | | | -41,245 | | | | -65,287 | | | | -161,704 | | | | -203,774 | | | | -206,644 | | | | -71,229 | |
Capital transfer account (net receipts (+)) | | | 225 | | | | 241 | | | | 239 | | | | 243 | | | | 236 | | | | 120 | |
103
| | | | | | | | | | | | | | | | | | | | | | | | |
| | | | | | For the six months ended June | |
| | | 2010 | | | 2011 | | | 2012 | | | 2013 | | | 2014 | | | 2015 | |
| Financial account | | | | | | | | | | | | | | | | | | | | | | | | |
Net direct investment (Inflow (+)/outflow (-))(4) | | | 27,171 | | | | 32,673 | | | | 12,900 | | | | 15,942 | | | | -13,297 | | | | -27,411 | |
Net incurrence of liabilities(5) | | | 26,617 | | | | 30,808 | | | | 37,428 | | | | 80,138 | | | | 61,994 | | | | -16,152 | |
Net acquisition of financial assets(6) | | | 554 | | | | 1,865 | | | | -24,528 | | | | -64,196 | | | | -75,291 | | | | -11,259 | |
Net portfolio investment (Inflow (+)/outflow (-)) | | | 74,502 | | | | 32,625 | | | | 84,098 | | | | 57,978 | | | | 49,494 | | | | 78,707 | |
Net incurrence of liabilities | | | 107,876 | | | | 86,394 | | | | 117,706 | | | | 69,490 | | | | 73,748 | | | | 94,022 | |
Equity and investment fund shares | | | 42,213 | | | | -26,577 | | | | -5,239 | | | | 8,377 | | | | 26,826 | | | | 71,496 | |
Debt securities | | | 65,663 | | | | 112,971 | | | | 122,945 | | | | 61,113 | | | | 46,922 | | | | 22,526 | |
Net acquisition of financial assets | | | -33,374 | | | | -53,769 | | | | -33,608 | | | | -11,512 | | | | -24,254 | | | | -15,315 | |
Equity and investment fund shares | | | -22,842 | | | | -37,290 | | | | -21,015 | | | | -10,578 | | | | -14,721 | | | | -10,530 | |
Debt securities | | | -10,532 | | | | -16,479 | | | | -12,593 | | | | -934 | | | | -9,533 | | | | -4,785 | |
Net financial derivatives (Inflow (+)/outflow (-)) | | | 0 | | | | 13,139 | | | | 14,378 | | | | 7,478 | | | | 16,409 | | | | -2,803 | |
Net incurrence of liabilities | | | 0 | | | | -245,062 | | | | -213,869 | | | | -188,354 | | | | -194,842 | | | | -146,944 | |
Net acquisition of financial assets | | | 0 | | | | 258,201 | | | | 228,247 | | | | 195,832 | | | | 211,251 | | | | 144,141 | |
Net other investment (Inflow (+)/outflow (-)) | | | -14,238 | | | | 20,162 | | | | 70,824 | | | | 53,663 | | | | 119,805 | | | | -25,472 | |
Liabilities | | | 7,899 | | | | 34,040 | | | | 69,735 | | | | 50,412 | | | | 146,569 | | | | 9,249 | |
Assets | | | -22,137 | | | | -13,878 | | | | 1,089 | | | | 3,251 | | | | -26,764 | | | | -34,721 | |
Reserve assets (Increase (-)/decrease (+))(7) | | | -31,307 | | | | -32,703 | | | | -8,955 | | | | -4,658 | | | | -16,602 | | | | 13,674 | |
Balance on financial account | | | 56,128 | | | | 65,896 | | | | 173,245 | | | | 130,403 | | | | 155,809 | | | | 36,695 | |
Memo item: Balance on financial account excluding reserve assets | | | 87,435 | | | | 98,599 | | | | 182,200 | | | | 135,061 | | | | 172,411 | | | | 23,021 | |
Unrecorded transactions(8) | | | -15,108 | | | | -850 | | | | -11,780 | | | | 73,128 | | | | 50,599 | | | | 34,414 | |
Memo item: Balance on financial account excluding reserve assets including unrecorded transactions | | | 72,327 | | | | 97,749 | | | | 170,420 | | | | 208,189 | | | | 223,010 | | | | 57,435 | |
Notes:—
| 1. | Data for the previous four years are preliminary and subject to revision. |
| 2. | Published customs figures adjusted for balance-of-payments purposes. |
| 3. | Commodity gold. Before 1981 net gold exports comprised net foreign sales of gold plus changes in gold holdings of the South African Reserve Bank and other banking institutions. |
| 4. | A net incurrence of liabilities (inflow of capital) is indicated by a positive (+) sign. A net disposal of liabilities (outflow of capital) is indicated by a negative (-) sign. A net acquisition of assets (outflow of capital) is indicated by a negative (-) sign. A net disposal of assets (inflow of capital) is indicated by a positive (+) sign. |
| 5. | Investment by foreigners in undertakings in South Africa in which they have individually or collectively in the case of affiliated organisations or persons at least 10 per cent of the voting rights. |
| 6. | Investment by South African residents in undertakings abroad in which they have at least 10 per cent of the voting rights. |
| 7. | Foreign-currency liabilities of the Reserve Bank with non-resident institutions and loans from the IMF are included in the calculation of reserve assets. An increase in reserve assets is indicated by a negative (-) sign and a decrease is indicated by a positive (+) sign. |
| 8. | Transactions on the current, capital transfer and financial accounts. |
Source: SARB.
104
Current Account
South Africa’s trade patterns and volumes changed notably during the past decade. These changes were brought about by, among other factors, uneven growth performance of the country’s most important trading-partner countries in the aftermath of the most recent recession, substantial infrastructure development projects and a number of trade agreements concluded to promote international trade.
Notwithstanding various policy measures to enhance external competitiveness, to promote trade, and to raise the country’s growth performance, the South African economy has become more dependent on surplus saving from the rest of the world to finance the much-needed increase in gross fixed capital formation. The country’s import penetration ratio (i.e., the extent to which the country relies on merchandise imports to satisfy domestic expenditure) increased sharply between 2003 and 2008 before receding temporarily in 2009. Subsequently, this ratio regained its upward momentum and almost reached the peak of 2008 in the first half of 2015.
Owing to stronger growth in import volumes surpassing that of merchandise exports, the trade balance switched from a surplus in 2003 to a deficit in subsequent years up to 2008. The trade balance temporarily switched back to a surplus from 2009 to 2011 due to lower domestic demand before moving into a deficit in 2012 and the subsequent years. During this period, the relatively slower growth in the volume of merchandise exports was partly countered by favourable terms of trade, which trended upward from 2001 to 2011. Since 2012, however, the terms of trade has been weakening before moving broadly sideways from 2014 to the first half of 2015.
The value of merchandise exports advanced steadily from 2003 up to the first half of 2015 with a brief interruption in 2009. The increase in export proceeds could largely be attributed to higher Rand prices of merchandise exports along with a slower increase in export volumes over the period. Notwithstanding the dwindling volume of net gold exports, domestic gold producers benefited from a surge in the international price of gold since 2006. Further to demand and supply conditions, the price of gold benefited during the past few years from the ongoing uncertainty in global financial markets, as well as geopolitical tensions. The price of gold on the London market, which averaged US$310 per fine ounce in 2002, rose steadily to US$1,668 per fine ounce in 2012, before recording declines in the next two years. In Rand terms, the price of gold advanced for the most part at an even faster pace due to the depreciation in the exchange value of the Rand over the period, declining marginally in 2013 before increasing slightly again in 2014. The upward trend in the US-dollar price of gold, however, lost momentum in late 2012 and recorded declines in the next two years, partly due to the expectations of less buoyant global demand and lower inflation.
105
Owing mainly to strong domestic demand, the value of merchandise imports increased at a steady pace during the period of 2010 to 2014 after having contracted by no less than 24.5% in 2009. Although manufactured goods remained the largest component of merchandise imports in value terms, it declined as a ratio of total merchandise imports, from 73.9% in 2003 to roughly 67% in 2012 and the subsequent two years. The three main subcategories of manufactured imports, which jointly account for roughly 75% of the total import value of manufactured goods, are machinery and electrical equipment, vehicles and transport equipment, and chemical products.
The deficit on the services, income and current transfer account of the balance of payments widened by 1.9% in 2014. Large increments in dividend receipts during 2012 and 2013 cushioned the shortfall from deteriorating further. Dividend receipts displayed sturdy annual growth rates of around 51% in both years which signaled a pick-up in global economic activity alongside a weaker exchange rate of the Rand. Contrary to the benefit of dividend receipts, dividend payments continued to escalate further during 2014—the level in the fourth quarter exceeded an all-time high mark attained in 2007. The rise in gross dividend payments can partly be attributed to liquidity requirements of parent companies residing abroad.
Higher receipts pertaining to financial and insurance services as well as other business and miscellaneous services resulted in a marginal improvement in net payments for “other services”. Moderate net purchases of Rand-denominated government debt contributed to interest payments improving from 27% in 2013 to 16.3% in 2014. Furthermore, travel receipts continued to grow while travel payments remained relatively unchanged.
The absence of the extraordinary large dividend receipts in the second quarter of 2015 together with a decline in travel receipts caused the deficit of the overall account to widen from R117 billion in the first quarter to R138 billion in the second quarter. Net payments for “other services” were contained somewhat as gross payments to non-residents for technical-related services contracted.
Financial Account
Sentiment in global financial markets in 2011 and the first half of 2012 was dominated by uncertainty about the outcome of the sovereign debt crisis in the eurozone. Furthermore, the second half of 2011 was characterised by the downgrading of the sovereign debt of the U.S., Japan and Italy, and negotiations about the bailout of, and adherence to austerity measures by, some peripheral countries in the eurozone. Simultaneously, the banking system in Europe continued to remain fragile, inhibiting liquidity and restricting bank lending to the real economy. As a result, capital flows from advanced economies to emerging-market economies shrank considerably in the second half of 2011. In addition, tension in the Middle East and the subsequent rise in international crude oil prices raised concerns about the prospects for global economic growth. The annual cumulative capital inflows into South Africa were higher in 2011 than those recorded in 2010 as a whole. The total financial flows amounted to R131.2 billion in 2011. In the first half of 2012, the inflows on the financial account including unrecorded transactions amounted to R98.5 billion despite the downgrading of the sovereign debt of six European countries and certain Spanish banks in May.
The South African economy continued to attract foreign capital inflows during the first half of 2013. Including unrecorded transactions, the net inward movement of capital amounted to R94.9 billion in the first half of 2013. This sizeable inflow of foreign capital occurred mainly in the first quarter against the backdrop of interest rate differentials with the mature economies which continued to favour South Africa. When the U.S. Federal Reserve indicated in the second quarter of 2013 that it could start tapering its accommodative monetary policy measures by slowing asset purchases towards the end of the year, it negatively influenced capital flows into emerging-market debt securities. The negative sentiment among foreign investors partly arose from uncertainty regarding the pace at which monetary stimulus measures would be reduced as well as the extent to which these policy actions could weaken growth in emerging-market economies. Net capital inflows into South Africa slowed in the second quarter of 2013 as a result of lower-than-expected first-quarter economic growth data, exchange-rate volatility and a decline in commodity prices.
106
Since the commencement of the tapering of bond purchases by the Federal Reserve in late 2013, a number of emerging-market economies, including South Africa, experienced heightened volatility in financial and foreign-exchange markets as international investors reconsidered their exposure to assets in these markets. In addition, international credit rating agencies downgraded the sovereign credit rating of the long-term foreign currency-denominated debt of some emerging market economies in the first half of 2014. Notwithstanding these developments, the financial account of South Africa’s balance of payments proved to be fairly resilient, recording a net inflow of foreign capital to the value of R43.2 billion in the second quarter of 2014, a magnitude almost similar to that recorded in the first quarter.
Global financial markets continued to be volatile in the second quarter of 2015, affected by various factors and characterised by phases of alternating ‘risk-off’ and ‘risk-on’ trading sprees. Among the factors influencing sentiment were the continued strengthening of the US economy along with expectations of an imminent interest rate increase in the second half of 2015, the intensifying Greek debt crisis, the slump in the Chinese stock market as well as the further weakening of commodity prices. Domestically, relatively sluggish economic growth in the first half of 2015 amid ongoing electricity-supply disruptions and other structural impediments dampened international investors’ sentiment towards acquiring domestic financial assets. After having registered a capital inflow of R33.1 billion in the first quarter of 2015, the financial account of the balance of payments (including reserve assets but excluding unrecorded transactions) recorded a much smaller inflow of R3.6 billion in the second quarter. A significant outflow of capital was evident in the other investment category, despite the continuing injection of liquidity in Europe and Japan. However, on a net basis, direct and especially portfolio investment registered capital inflows in the second quarter of 2015.
The following table sets forth capital movements into and out of South Africa for the periods indicated.
Financial account (1)
| | | | | | | | | | | | | | | | | | | | | | | | |
| Rand (million) | | | | | For the six
months ended
June | |
| | | 2010 | | | 2011 | | | 2012 | | | 2013 | | | 2014 | | | 2015 | |
Net incurrence of liabilities2 | | | | | | | | | | | | | | | | | | | | | | | | |
Direct investment3 | | | 26,617 | | | | 30,808 | | | | 37,428 | | | | 80,138 | | | | 61,994 | | | | -16,152 | |
Public corporations | | | 0 | | | | 0 | | | | 0 | | | | 0 | | | | 0 | | | | 0 | |
Banking sector | | | -335 | | | | -305 | | | | 1,970 | | | | 20,160 | | | | 1,121 | | | | 905 | |
Private sector | | | 26,952 | | | | 31,113 | | | | 35,458 | | | | 59,978 | | | | 60,873 | | | | -17,057 | |
Portfolio investment | | | 107,876 | | | | 86,394 | | | | 117,706 | | | | 69,490 | | | | 73,748 | | | | 94,022 | |
Monetary authorities | | | 0 | | | | 0 | | | | 0 | | | | 0 | | | | 0 | | | | 0 | |
Public authorities | | | 60,239 | | | | 86,337 | | | | 118,611 | | | | 61,489 | | | | 51,563 | | | | 6,411 | |
Public corporations | | | 7,790 | | | | 24,323 | | | | 8,906 | | | | 8,320 | | | | 2,613 | | | | 15,256 | |
Banking sector | | | 4,070 | | | | -2,627 | | | | -4,221 | | | | 2,979 | | | | 7,309 | | | | 6,133 | |
Private sector | | | 35,777 | | | | -21,639 | | | | -5,590 | | | | -3,298 | | | | 12,263 | | | | 66,222 | |
Financial derivatives | | | 0 | | | | -245,062 | | | | -213,869 | | | | -188,354 | | | | -194,842 | | | | -146,944 | |
Banking sector | | | 0 | | | | -245,062 | | | | -213,869 | | | | -188,354 | | | | -194,842 | | | | -146,944 | |
Other investment | | | 7,899 | | | | 34,040 | | | | 69,735 | | | | 50,412 | | | | 146,569 | | | | 9,249 | |
107
| | | | | | | | | | | | | | | | | | | | | | | | |
Monetary authorities4 | | | 621 | | | | 549 | | | | 1,646 | | | | 953 | | | | 4,483 | | | | 1,594 | |
Public authorities | | | -2,320 | | | | -2,929 | | | | -3,646 | | | | -1,763 | | | | -4,210 | | | | -1,890 | |
Public corporations | | | 12,145 | | | | 16,647 | | | | 20,004 | | | | 12,765 | | | | 16,832 | | | | 6,090 | |
Banking sector | | | 6,701 | | | | 1,355 | | | | 45,060 | | | | 16,964 | | | | 122,811 | | | | -15,072 | |
Private sector | | | -9,248 | | | | 18,418 | | | | 6,671 | | | | 21,493 | | | | 6,653 | | | | 18,527 | |
Special Drawing Rights | | | 0 | | | | 0 | | | | 0 | | | | 0 | | | | 0 | | | | 0 | |
Net acquisition of financial assets5 | | | | | | | | | | | | | | | | | | | | | | | | |
Direct investment6 | | | 554 | | | | 1,865 | | | | -24,528 | | | | -64,196 | | | | -75,291 | | | | -11,259 | |
Public corporations | | | -1,008 | | | | -131 | | | | 0 | | | | -110 | | | | 0 | | | | 0 | |
Banking sector | | | 12 | | | | -164 | | | | -117 | | | | 28 | | | | 11 | | | | 18 | |
Private sector | | | 1,550 | | | | 2,160 | | | | -24,411 | | | | -64,114 | | | | -75,302 | | | | -11,277 | |
Portfolio investment | | | -33,374 | | | | -53,769 | | | | -33,608 | | | | -11,512 | | | | -24,254 | | | | -15,315 | |
Public corporations | | | 0 | | | | 0 | | | | 0 | | | | 0 | | | | 0 | | | | 0 | |
Banking sector | | | -5,244 | | | | 4,294 | | | | -245 | | | | 13,608 | | | | 4,697 | | | | -3,251 | |
Private sector | | | -28,130 | | | | -58,063 | | | | -33,363 | | | | -25,120 | | | | -28,951 | | | | -12,064 | |
Financial derivatives | | | 0 | | | | 258,201 | | | | 228,247 | | | | 195,832 | | | | 211,251 | | | | 144,141 | |
Banking sector | | | 0 | | | | 258,201 | | | | 228,247 | | | | 195,832 | | | | 211,251 | | | | 144,141 | |
Other investment | | | -22,137 | | | | -13,878 | | | | 1,089 | | | | 3,251 | | | | -26,764 | | | | -34,721 | |
Monetary authorities7 | | | -1 | | | | 6 | | | | 0 | | | | 0 | | | | 0 | | | | 0 | |
Public authorities | | | 1,786 | | | | 1,981 | | | | 1,659 | | | | 0 | | | | 0 | | | | 0 | |
Public corporations | | | -517 | | | | -2,425 | | | | -187 | | | | -3,895 | | | | 1,284 | | | | -1,254 | |
Banking sector | | | -29,584 | | | | -5,081 | | | | 9,832 | | | | 14,216 | | | | -14,659 | | | | -23,132 | |
Private sector | | | 6,179 | | | | -8,359 | | | | -10,215 | | | | -7,070 | | | | -13,389 | | | | -10,335 | |
Reserve assets8 | | | -31,307 | | | | -32,703 | | | | -8,955 | | | | -4,658 | | | | -16,602 | | | | 13,674 | |
Notes: —
| 1. | Identified capital movements. |
| 2. | A net incurrence of liabilities (inflow of capital) is indicated by a positive (+) sign. A net disposal of liabilities (outflow of capital) is indicated by a negative (-) sign. |
| 3. | Investment by foreigners in undertakings in South Africa in which they have individually or collectively in the case of affiliated organisations or persons at least 10 per cent of the voting rights. |
| 4. | These transactions comprise the liabilities of the South African Reserve Bank and the Corporation for Public Deposits. |
| 5. | A net acquisition of financial assets (outflow of capital) is indicated by a negative (-) sign. A net disposal of financial assets (inflow of capital) is indicated by a positive (+) sign. |
| 6. | Investment by South African residents in undertakings abroad in which they individually or collectively in the case of affiliated organisations or persons have at least 10% of the voting rights. |
108
| 7. | Including the long-term assets of the South African Reserve Bank and the Corporation for Public Deposits. |
| 8. | Foreign-currency liabilities of the Reserve Bank with non-resident institutions and loans from the IMF are included in the calculation of reserve assets. An increase in reserve assets is indicated by a negative (-) sign and a decrease is indicated by a positive (+) sign. |
Source: SARB.
The following table sets forth total foreign direct investment by South African entities and total foreign direct investment in South Africa by foreign entities for the periods indicated. Data beyond 2013 is not yet available.
Foreign Direct Investment
| | | | | | | | | | | | | | | | | | | | |
| | | 2009 | | | 2010 | | | 2011 | | | 2012 | | | 2013 | |
| | | Rand (million) | |
South African foreign direct investment | | | | | | | | | | | | | | | | | | | | |
Europe | | | 195,067 | | | | 229,767 | | | | 368,858 | | | | 429,369 | | | | 495,681 | |
Africa | | | 120,080 | | | | 126,776 | | | | 185,518 | | | | 200,407 | | | | 232,292 | |
Americas | | | 51,354 | | | | 48,994 | | | | 72,082 | | | | 84,249 | | | | 103,572 | |
Asia | | | 129,238 | | | | 122,242 | | | | 127,313 | | | | 200,619 | | | | 478,849 | |
Oceania | | | 22,907 | | | | 24,153 | | | | 36,475 | | | | 35,586 | | | | 39,359 | |
Other | | | 138 | | | | 138 | | | | 27 | | | | 27 | | | | 102 | |
Total | | | 518,784 | | | | 552,070 | | | | 790,273 | | | | 950,257 | | | | 1,349,855 | |
Foreign direct investment in South Africa | | | | | | | | | | | | | | | | | | | | |
Europe | | | 550,652 | | | | 762,690 | | | | 929,414 | | | | 1,085,479 | | | | 1,252,027 | |
Americas | | | 103,803 | | | | 121,603 | | | | 115,807 | | | | 132,882 | | | | 135,534 | |
Asia | | | 762,690 | | | | 929,414 | | | | 1,015,324 | | | | 115,919 | | | | 143,558 | |
Africa | | | 121,603 | | | | 115,807 | | | | 129,522 | | | | 42,670 | | | | 45,575 | |
Oceania | | | 96,041 | | | | 99,572 | | | | 98,119 | | | | 12,602 | | | | 18,371 | |
Other | | | 195 | | | | 202 | | | | 469 | | | | 470 | | | | 695 | |
Total | | | 1,023,982 | | | | 1,190,799 | | | | 1,297,901 | | | | 1,390,022 | | | | 1,575,760 | |
Source: SARB.
South Africa’s gross external debt decreased marginally from US$145.1 billion at the end of December 2014 to US$144.4 billion at the end of March 2015; this was the first decline to be recorded since June 2013. The country’s outstanding debt decreased mainly due to the repayment of foreign currency-denominated short-term debt obligations by the domestic banking sector and valuation adjustments following the strengthening of the US dollar against most major currencies. Expressed in Rand terms, the country’s external debt advanced from R1,679 billion at the end of December 2014 to R1,762 billion at the end of March 2015.
Foreign currency-denominated debt decreased from US$67.5 billion at the end of the fourth quarter of 2014 to US$67.0 billion at the end of the first quarter of 2015, despite the issuance of a US$1.25 billion bond by a parastatal over the period. South African parastatals have been active in issuing international bonds to raise funding for infrastructural projects.
Relative to the country’s total foreign currency-denominated debt, the ratio of short-term foreign currency-denominated debt (i.e. debt with an original maturity of less than one year and longer-term foreign currency-denominated debt maturing within the next twelve months) deteriorated from 46.7 per cent at the end of December 2014 to 47.0 per cent at the end of March 2015.
109
Foreign Currency-Denominated Debt of South Africa(1)
| | | | | | | | | | | | | | | | | | | | | | | | |
| | | As of December 31, | | | As of
March 31, | |
| | | 2010 | | | 2011 | | | 2012 | | | 2013 | | | 2014 | | | 2015 | |
| | | Rand (million)(2) | |
Foreign-currency-denominated debt | | | | | | | | | | | | | | | | | | | | | | | | |
Public sector | | | 43,310 | | | | 62,014 | | | | 76,482 | | | | 94,584 | | | | 95,040 | | | | 88,696 | |
Monetary sector(3) | | | 68,118 | | | | 80,595 | | | | 117,323 | | | | 126,772 | | | | 212,425 | | | | 216,316 | |
Non-monetary private sector | | | 114,653 | | | | 133,916 | | | | 134,045 | | | | 191,513 | | | | 210,377 | | | | 223,723 | |
Bearer bonds and notes | | | 109,044 | | | | 169,883 | | | | 185,330 | | | | 227,710 | | | | 262,833 | | | | 288,320 | |
Long-term loans | | | — | | | | — | | | | — | | | | — | | | | — | | | | — | |
Total foreign-currency-denominated debt | | | 335,125 | | | | 446,408 | | | | 513,180 | | | | 640,579 | | | | 780,675 | | | | 817,055 | |
Notes: —
| (1) | Excluding blocked Rand accounts, ordinary and non-redeemable preference shares, quoted domestic debentures and quoted domestic loan stock. |
| (2) | Valued at middle-market exchange rates as of the end of period. |
| (3) | Including lending to other sectors. |
Source: SARB.
Reserves and Exchange Rates
Since the abolition of the Financial Rand System and the dual exchange rate in 1995, South Africa has had a unitary market-determined exchange rate that applies to both current and capital transactions between residents and non-residents.
In 2012 and 2013, the currencies of most emerging-market economies were adversely affected by the uncertainty emanating from unresolved economic issues in the eurozone countries, and the unsatisfactory and partial solution to the reduction of the fiscal deficit in the U.S.. Over and above these factors, lower international prices of some key export commodities, concerns about the sustainability of the financing of South Africa’s current-account deficit and ongoing tension in the domestic labor market have put further pressure on the domestic currency which, in the first quarter of 2013, declined, on balance, by 5.7% against a basket of trading-partner currencies.
Investor sentiment towards emerging-market economies and in particular South Africa improved somewhat towards the end of the first quarter of 2014 as some previously pressing issues changed nature and lowered the perceived risks associated with emerging-market assets. A large part of the second quarter of 2014 was marked by a strengthening in the currencies of many emerging-market economies amid apparent more stable global financial markets and indications that the Chinese authorities are committed to boosting economic activity in China. The ongoing efforts to boost the economic recovery in the euro area in the second quarter of 2014 furthermore buoyed the currencies of many emerging-market economies over the period. In July and August 2014, however, the Rand regained some vigour against major currencies supported by a rise in the policy rate, the announcement of the end of the strike in the manufacturing sector and the weaker-than-expected economic data from the US.
110
In the second quarter of 2015, the South African Rand, along with other emerging-market and commodity-linked currencies, depreciated against major currencies, including the euro and the British pound. The US dollar started the quarter weaker amid softer US data releases, particularly non-farm payrolls data and GDP data for the first quarter. However, the US dollar regained strength as US economic prospects improved later in the quarter, supporting the case for monetary policy normalisation. Emerging-market and commodity-linked currencies were also stressed by heightened risk aversion associated with the Greek debt crisis and a slowdown in economic growth in China. Following a 0.2% decline in the first quarter of 2015, the nominal effective exchange rate of the Rand declined further by 1.8% in the second quarter. In April 2015, the domestic currency appreciated by 3.5% against the US dollar, mainly due to broad-based US dollar weakness. However, during the months of May and June, the Rand depreciated by 3.0% and 0.7%, respectively, against the US dollar. The Rand’s weakness could be attributed to weak domestic economic fundamentals such as subdued economic growth and the sustained high level of unemployment over the period.
Fears of credit-rating downgrades, as well as Eskom’s continued power rationing, also undermined sentiment towards the Rand. However, decisions by credit-rating agencies Fitch and Standard & Poor’s to affirm South Africa’s credit ratings curbed the Rand’s decline, as did the narrower-than-expected first-quarter current-account deficit as well as the better-than-expected trade balance for the second quarter of 2015. The domestic currency unit weakened further in July and August 2015 amid a sell-off in the Chinese equity market. Concerns abound about the strength of the Chinese economy following the devaluation of the Chinese yuan, adding further downward pressure on commodity-linked currencies.
The following table sets forth, for the periods indicated, the exchange rate of the Rand per U.S. Dollar.
Rand
(against the U.S. Dollar)
| | | | | | | | | | | | | | | | |
| Year | | Low | | | High | | | Average | | | Period End | |
2009 | | | 7.2439 | | | | 10.5948 | | | | 8.4372 | | | | 7.3721 | |
2010 | | | 6.6224 | | | | 7.9704 | | | | 7.3222 | | | | 6.6224 | |
2011 | | | 6.5962 | | | | 8.5423 | | | | 7.2531 | | | | 8.1319 | |
2012 | | | 7.4777 | | | | 8.9432 | | | | 8.2099 | | | | 8.4838 | |
2013 | | | 8.4478 | | | | 10.4849 | | | | 9.6502 | | | | 10.4675 | |
2014 | | | 10.2815 | | | | 11.7415 | | | | 10.8444 | | | | 11.5719 | |
January 2015 | | | 11.3966 | | | | 11.7264 | | | | 11.5658 | | | | 11.5517 | |
February 2015 | | | 11.2955 | | | | 11.7872 | | | | 11.5759 | | | | 11.5039 | |
March 2015 | | | 11.7144 | | | | 12.4175 | | | | 12.0644 | | | | 12.2020 | |
April 2015 | | | 11.7889 | | | | 12.2750 | | | | 12.0111 | | | | 11.7889 | |
May 2015 | | | 11.7938 | | | | 12.1545 | | | | 11.9691 | | | | 12.1545 | |
June 2015 | | | 12.1146 | | | | 12.5740 | | | | 12.3016 | | | | 12.2406 | |
July 2015 | | | 12.1849 | | | | 12.7397 | | | | 12.4515 | | | | 12.7397 | |
August 2015 | | | 12.6402 | | | | 13.3406 | | | | 12.9118 | | | | 13.3406 | |
September 2015 | | | 13.1917 | | | | 14.0139 | | | | 13.6073 | | | | 13.8143 | |
October 2015 | | | 13.0422 | | | | 13.9086 | | | | 13.5002 | | | | 13.8167 | |
November 2015 | | | 13.7823 | | | | 14.3860 | | | | 14.1257 | | | | 14.3856 | |
Source: South African Reserve Bank.
111
Change in Reserves
South Africa’s overall balance-of-payments position was in surplus in the amount of R32.7 billion in 2011, following an improvement of R31.3 billion in 2010. In 2012, the country’s net international reserves rose by R9.0 billion and by a further R4.7 billion in 2013. The gross gold and other foreign-exchange reserves, measured in U.S. Dollar, increased from US$48.9 billion at the end of 2011 to US$50.7 billion at the end of 2012, but declined to US$49.6 billion at the end of 2013. The country’s foreign reserves declined further to US$49.1 billion by the end of September 2014. Expressed in Rand terms, gross gold and other foreign exchange reserves increased from R430.9 billion at the end of December 2012 to R520.2 billion at the end of 2013 to R556.8 billion at the end of September 2014, on account of the depreciation of the exchange rate of the Rand. The ratio of imports covered by reserves improved marginally from 19.6 weeks of import cover at the end of December 2012 to 20.7 weeks at the end of December 2013, before decreasing to 19.5 weeks at the end of June 2014.
South Africa’s international reserves decreased further by R1.4 billion in the second quarter of 2015 after having declined by R12.3 billion in the first quarter. Measured in US dollar, the value of South Africa’s gross gold and other foreign reserves (i.e. the international reserves of the Bank before accounting for reserve-related liabilities) increased from US$46.4 billion at the end of March 2015 to US$46.8 billion at the end of June as the impact of a weaker US dollar was partially offset by a decline in the US dollar price of gold. The country’s gross reserves subsequently decreased to US$46.1 billion at the end of August 2015. South Africa’s international liquidity position increased from US$41.3 billion at the end of March 2015 to US$41.6 billion at the end of June before decreasing to US$41.2 billion at the end of August. The level of import cover (i.e. the value of gross international reserves relative to the value of imports of goods and services as well as income payments) increased from 4.6 months at the end of March 2015 to 4.8 months at the end of June 2015.
The following table sets forth the gold and foreign exchange reserves of South Africa in each of the periods indicated.
Foreign Exchange Reserves
| | | | | | | | | | | | | | | | | | | | | | | | | | | | |
| | | For the year ended December 31, | | | As of
September 30, | |
| | | 2009 | | | 2010 | | | 2011 | | | 2012 | | | 2013 | | | 2014 | | | 2015 | |
| | | Rand (million) | |
SARB gold reserves(1) | | | 32,753 | | | | 37,492 | | | | 51,076 | | | | 56,982 | | | | 50,621 | | | | 55,887 | | | | 62,593 | |
Foreign exchange reserves | | | | | | | | | | | | | | | | | | | | | | | | | | | | |
SDRs(2) | | | 20,613 | | | | 18,262 | | | | 22,284 | | | | 23,873 | | | | 29,603 | | | | 32,119 | | | | 37,587 | |
Other(3) | | | 239,335 | | | | 234,872 | | | | 324,459 | | | | 350,087 | | | | 439,965 | | | | 480,518 | | | | 539,875 | |
Gross gold and other foreign reserves | | | 292,701 | | | | 290,626 | | | | 397,819 | | | | 430,942 | | | | 520,189 | | | | 568,524 | | | | 640,055 | |
Notes: —
| (1) | Until March 5, 2005 gold reserves were valued at 90% of the last ten London fixing prices preceding end of period. From March 6, 2005, gold reserves are valued at market price taken at 14:30 on each valuation date. |
| (3) | Non-gold reserves are valued at the middle market exchange rate applicable at end of period. |
Source: SARB.
112
PUBLIC FINANCE
Background
South Africa’s public finances comprise of all finances in the three spheres of government, namely, national, provincial, and local government. Finances in the national and provincial spheres of government consist of all transfer payments from the national government while those in the local government sphere of government consist of transfer payments from national government as well as own revenue.
The Division of Revenue Act (DoRA) provides for the equitable division of revenue raised nationally among the national, provincial and local spheres of government and the responsibilities of all three spheres pursuant to such division; and to provide for matters connected therewith. The objects of DORA are to: (a) provide for the equitable division of revenue raised nationally among the three spheres of government; (b) promote predictability and certainty in respect of all allocations to provinces and municipalities, in order that provinces and municipalities may plan their budgets over a multi-year period and thereby promote better coordination between policy, planning and budgeting; and (c) promote transparency and accountability in the resource allocation process by ensuring that all allocations are reflected in the budgets of provinces and municipalities and by ensuring that the expenditure of conditional allocations is reported on by the receiving provincial departments and municipalities. Government finances are presented in two ways, each highlighting key aspects of the budget. The main budget determines national government’s borrowing requirement. It consists of two elements. The first, appropriations by Parliament through budget votes, are mainly for national departments and include transfers to provinces, local government and public entities. The second, direct charges against the National Revenue Fund, includes the provincial equitable share and debt service costs, as well as the salaries of judges and public representatives. The consolidated budget provides a fuller picture of government’s contribution to the economy. It takes into account the main budget as well as spending of provinces, social security funds and public entities financed from their own revenue.
Provincial budgets are largely financed by the provincial equitable shares and conditional grants from the main budget. But provinces supplement these funds with their own revenues, such as gambling taxes, hospital fees and sales of goods and services. Also excluded from the consolidation is expenditure by metros and other large municipalities, which is financed from their own revenue, such as property rates and services charges. The consolidated budget includes 187 public entities. These include large entities such as South African National Roads Agency Limited, the Passenger Rail Agency, the South African Revenue Services and agencies that provide bulk water infrastructure. Public entities receive some transfers from the main budget but are also financed from own revenue. State-owned companies that function as standalone operations largely on a commercial basis, such as Eskom and Transnet, are not included in the consolidated accounts. Social security funds include Unemployment Insurance Fund, compensation funds and the Road Accident Fund. They are financed mainly by statutory levies or contributions but receive some transfers from the main budget.
National, provincial and local governments are responsible for delivering public services. Some of these services are the exclusive responsibility of one level of government, while others — known as concurrent functions — are shared. Nationally raised revenue is divided with the aim of providing for appropriate funding at each level of government — for example by taking into account their service delivery responsibilities and other sources of revenue available to them. In the 2016/17 fiscal year, national government departments are to be allocated 47.7% of available funds after debt costs, and the contingency reserve has been provided for. Provincial government is to be allocated 43.1% of available funds, mainly for education, health and social welfare. Local government is to receive 9.2% of the available funds, primarily for the provision of basic services to low income households. Most municipalities fund the majority of their spending through charges and taxes.
Between the 2009/10 and 2016/17 fiscal years, there was an allocation of R6.1 trillion for the three spheres of government. National government accounted for R2.9 trillion (47.79%), provincial government R2.7 trillion (43.56%) and local government R650 billion (8.65%). Equitable share accounted to R313 million (48.60%) of the total local government allocation.
113
General government finances in South Africa represent a consolidation of the following: the National Budget; the budgets of the nine provincial governments; extra-budgetary accounts and funds; social security funds; and the budgets of local authorities. The National Government, provincial governments, social security funds, Reconstruction and Development Program (RDP) accounts and extra-budgetary accounts are jointly referred to in this document as the “Consolidated Government Budget.” The Consolidated Government Budget includes transfer payments to local governments but does not constitute a consolidation of local government accounts. Municipalities, universities, polytechnics and various extra-budgetary funds derive substantial shares of their revenue from fees and charges or other sources. The Consolidated Government Budget presents a broader measure of government finances in South Africa. The public sector borrowing requirement shows the budget balance for the entire public sector, including general government and the non-financial public enterprises.
The borrowing powers of provincial and local governments are regulated by law. Provinces and municipalities generally may borrow for capital projects only. Under the Constitution, provinces have their own limited taxing powers and they are responsible for preparing their own budgets and for ensuring prudent financial management at the provincial level. Provinces receive agreed shares of nationally collected revenue and a framework for ensuring an equitable division to local government. The National Treasury introduced generally recognized accounting practices and uniform treasury norms and standards, the prescription of measures to ensure transparency and expenditure control in all spheres of government, and operational procedures for borrowing, guarantees, procurement and oversight over various national and provincial revenue funds.
In terms of Section 230 of the Constitution, provinces are allowed to take out loans for either current expenditure, in the form of a bridging loan that must be repaid within a 12-month period, or capital projects. The Borrowing Powers of Provincial Governments Act of 1996 (Borrowing Powers Act) lists the conditions under which a province may take out loans for capital projects. The Act stipulates that loans must be approved by a loan coordinating committee, which is chaired by the Minister of Finance. Loans may be taken out as direct borrowing from the national government or from private banks and financial institutions. Provinces may not take out loans in foreign currency unless they are specifically authorized to do so by the Minister of Finance. As provinces are accountable in their own right, the National Government does not guarantee loans taken out by provincial governments and will not bail out any province that is unable to repay its loans.
The PFMA regulates the National Government’s financial administration and outlines the various roles of the National Treasury, the Minister of Finance (as head of the National Treasury), the National Revenue Fund, accounting officers, auditors, executive authorities, public entities and other government officials. This legislation also addresses, among other things, regulation of loans, guarantees and other commitments as well as penalties for financial misconduct. Legislation aimed at regulating local government spending, known as the Municipal Finance Management Act of 2003 (MFMA), took effect in July 2004. The legislation seeks to secure sound and sustainable management of the financial affairs of municipalities and other institutions in the local sphere of government, and to establish treasury norms and standards for the local sphere of government.
Municipalities can borrow over the long term to finance capital projects, acquire capital assets or refinance existing debt pursuant to Section 46 of the MFMA. Short-term borrowing (not for more than 12 months) is also possible for operational purposes only. However, the debt needs to be repaid within the financial year in which the debt was incurred pursuant to Section 45 of the MFMA. Furthermore, the Regulatory Framework for Municipal Borrowing (1999) recommends that every municipality should adopt a written debt policy when planning to issue debt. The policy assists in determining borrowing limits that a municipality can cope with. The MFMA further requires that all municipalities seek written comments from the relevant provincial and National Treasury in terms of proposed debt.
As of June 30, 2015, the total balance on borrowing for all municipalities was R48.8 billion. This includes long term loans of R31.8 billion, short term non-marketable bonds of R4.6 billion, and long term marketable bonds of R11.9 billion. The balance represents other short and long term financing instruments. Private sector banks contributed R28.9 billion (59.2%) of the total borrowing, followed by the Development Bank of Southern Africa at R10.7 billion (21.9%), with the remaining R9.2 billion (18.9%) from INCA and other institutions. New borrowing constituted R47.7 billion (97.7%) with the remainder coming from conversion or consolidation of existing borrowing.
114
The Constitution provides that the provincial and local governments are entitled to such percentages of nationally raised revenue as may be determined by Parliament (allocated among the provinces on an equitable basis). Allocations through this “local government equitable share” (LGES) formula are primarily based on how many poor households a municipality provides services to. The formula also makes provision for a contribution towards the administration and governance costs of running a municipality. Allocations also take account of the greater ability of some municipalities to cross-subsidize services to their poor households and less funding is allocated to these (relatively wealthy) municipalities. The new LGES formula which was implemented in the 2013/14 financial year, also taking into account the 2011 census figures, provides a subsidy of R275 for every household with a monthly income less than R2,300, which is about 59% of all households. The previous formula for the local government equitable share targeted 47% of households. Revisions are under way that take into account varying local circumstances: some municipalities have difficulty identifying which households are eligible for free services or do not yet maintain accurate records of service provision. While census data indicates steady progress towards universal access to electricity and clean water, achievement of free basic service standards still has some way to go.
The budgets of the provincial governments are financed through such nationally collected revenue, together with other allocations or grants from the National Government, the provinces’ own revenue collections, unspent balances from previous fiscal years and proceeds from loans for capital outlays. The Constitution provides for the assignment of taxation powers to provinces within a national, regulated framework that is intended to ensure that all taxes are consistent with national economic policy. The Provincial Tax Regulation Process Act of 2001 provides a framework through which provinces can introduce and collect certain fees and taxes. These include automobile license and traffic fees, hospital fees, gambling fees and other user charges and levies. The Financial and Fiscal Commission, a constitutionally established body, has the responsibility of monitoring and overseeing intergovernmental fiscal relations. Additionally, the Intergovernmental Fiscal Relations Act of 1997 established the Budget Council and the Budget Forum to consider intergovernmental budget issues.
Progress continues to be made in extending access to electricity, water, sanitation and refuse removal services. The Government’s aim is to ensure that all citizens receive at least a basic level of amenities. Drawing on international benchmarks, minimum standards of 50kWh of free electricity and 6,000 liters of water per month per household have been adopted. However, the level of free services provided to poor households varies, depending on local circumstances and municipal capacity. The national budget contributes to the financing of household amenities through the local government equitable share, which is mainly allocated for provision of free basic services. There has been a significant growth in allocations to the local government equitable share in recent years, from R20 billion in 2009/10 to R52.9 billion in 2016/17.
The new local government equitable share formula which was implemented in the 2013/14 financial year, also taking into account the 2011 census figures, provides a subsidy of R293 in 2014/15 for every household with a monthly income less than R2,300, which is about 59% of all households. The previous formula for the local government equitable share targeted 47% of households. This threshold is not an official poverty line or a required level to be used by municipalities in their own indigence policies. If municipalities choose to provide fewer households with free basic services than they are funded for through the local government equitable share, then their budget documents should clearly state the reasons for that and whether they consulted with the community on that policy. While census data indicates steady progress towards universal access to electricity and clean water, achievement of free basic service standards still has some way to go.
115
The 2011 Census shows that there has been considerable population growth and internal migration over the past decade. This new data assists in improving the targeting of municipal funding. To account for the growth in households each year, the number of households per municipality is updated annually based on the growth in households reflected in each province in the General Household Survey conducted by Statistics South Africa. The new equitable share formula reflects these changes and makes allocations for free basic services more transparent. Municipalities need to prioritize funding for the provision and maintenance of these services. The funding and provision of infrastructure are also important requirements for continued improvement in basic service delivery. It is not possible to give households free access to services if the supporting infrastructure – such as water distribution systems – is not in place.
Unemployment Insurance Fund (UIF)
In 2001, the Minister of Labor tabled legislation to strengthen the administration of the UIF, target benefits more effectively to the poor and extend the coverage of the fund. Since the UIF was given an estimated amount of R605 million in 2001 to address its outstanding financial debts, it has been experiencing positive financial performances. The UIF was able to meet its operational expenditure requirement and recorded an operating cash surplus of R11.6 billion in fiscal year 2014. The March 2014 actuarial evaluation indicated that the UIF is in a sound position to meet its cash-flow requirements over the next ten years for a wide range of possible scenarios. The UIF had capital and reserves amounting to R109.4 billion as of March 31, 2014. It is estimated that the UIF’s financial performance surplus prior to reserving over the next three fiscal years will be R15.3 billion in fiscal year 2015, R17 billion in fiscal year 2016 and R19 billion in fiscal year 2017.
The projected increase in the operational surplus is mainly attributable to a revision in the estimates for contributions due to an increase in the earnings threshold or ceiling as well as salary increases of contributors. The Unemployment Insurance Amendment Bill, 2015 is presently going through the South African Parliamentary process and is envisaged to be law by 2016. The key changes introduced by this Bill includes the extension of the period of payment of benefits to the contributor from 8 to 12 months with a flat rate payment after eight months; and allows beneficiaries to claim if they have credits regardless of when they last claimed; extends the period during which dependants may apply for benefits on behalf of a deceased contributor from 6 to 18 months; extends the period in which a contributor can lodge a claim from 6 to 12 months and the date of unemployment is deemed to be the date when the claimant applies for benefits.
The UIF is committed to bringing services closer to its client base in all Provinces and provides services at 125 Department of Labor centers with processing functions and 823 visiting points. A priority for the medium term is the recruitment and re-allocation of appropriate resources to manage the new decentralized business environment. The UIF added 179,689 new employees to its database, raising the total to 8,510,449 registered employees as at fiscal year 2014. A total of 1,526,416 employers are registered with the UIF as at fiscal year 2014, an increase of 61,198 new employers compared to fiscal year 2013. These employers are categorized mainly as commercial, domestic and taxi employers, with the majority in the commercial sector.
In response to the global economic crisis, the UIF (which formed part of the National Government’s Framework for South Africa’s Response to the International Economic Crisis) continues to play a pivotal role in schemes designed to inject funding into job creation and retention. The UIF issued R3.561 billion in placement bonds with the Industrial Development Corporation (IDC) as at the end of fiscal year 2013. The UIF/IDC bond is expected to save and create a combined total of 51,081 UIF paying jobs. In addition to the R1.2 billion committed by the UIF towards the Training Layoff Scheme which is designed to provide support to companies that are in distress due to the economic downturn with training and skills development as important elements of this response. The UIF also earmarked R400 million for the Training of Unemployed UIF beneficiaries to improve their chances of being reintegrated back into the labor market and to Social Plan Funding. During the 2013/14 financial year, three training initiatives were rolled out:
| | • | | Training of 3,000 unemployed on End-user computing in collaboration with the Media, Information and Communication Technologies–Sector Education and Training Authority (MICT SETA); |
116
| | • | | Training of 1,000 UIF beneficiaries and unemployed youth on mining-related artisan programs in collaboration with the Mining Qualification Authority; and |
| | • | | Training 1,500 beneficiaries and unemployed youth in various artisan trades in collaboration with the Manufacturing, Engineering and Related Services SETA (MerSETA). |
117
Compensation Fund (CF)
The CF supports employees who experience loss of income as a result of injuries, death or disease in the course of employment. Funds are raised through assessed levies on companies.
While the CF remains financially sound with an accumulated surplus of R23 billion as of March 31, 2015, it has experienced administrative inefficiencies and challenges which are being addressed through a turnaround strategy, including the stabilization of the new SAP system for the processing and payment of compensation claims and the upgrading of the Call Centre in order to improve access. The CF registered 225,511 claims and paid benefits to the value of R1.9 billion in fiscal year 2015. The CF recorded a 3% increase in the number of registered employers at the end of fiscal year 2015 with a concomitant increase in revenue. The increase in revenue is attributed to the implementation of the e-Return On Earnings system, a system to help determine employer assessment and premiums based on the number of accidents and claims made so that those with less exposure to diseases and injuries pay less premiums. In response to the dissatisfaction expressed by the public regarding the unjustifiably long turnaround time in processing claims for occupational injuries and diseases, the CF is speeding up the process of restructuring the Fund and upgrading its information technology infrastructure. To ensure equity of access to services and to improve the claims turnaround time, the CF has started the decentralization of its services to all nine provinces in fiscal year 2014. The Compensation Board reviewed existing benefits in fiscal year 2014, increasing the salary ceiling from R312,480 to R332,479 per annum; pension of employees and widow/ers was set at a minimum of R1,350 per month; as well as increases to the monthly compensation pension by 6.4% in addition to 100% purchasing power of the low pension earners.
Road Accident Fund (RAF)
Understanding that there is a need to reform the unlimited liability system of compensation for road accident victims and supported by the reports of the RAF Commission in 2002, the Government set out on a reform path. In 2005, Parliament passed the RAF Amendment Act, which provided for a limited liability scheme to ensure the viability of the Fund. Five years after the promulgation of the RAF Amendment Act, the estimated reduced liability is R12.9 billion. The cabinet approved the strategy for the reform of the RAF in June 2006.
The department of transport is currently working on getting the Road Accident Benefit Scheme Bill to Cabinet for approval to be tabled in Parliament. Whilst the productivity of claims finalised has improved, the RAF continues to receive over 173,000 new claims last year. As a result, outstanding claims fell from 279,912 in 2012/13 to 217,710 in 2014/15. The deficit has increased to R116 billion at the end of 2014/15.
South African Social Security Agency (SASSA)
The South African Social Security Agency derives its mandate from the South African Social Security Agency Act (2004). It became functional in 2006, taking over the mandate of administration and payments of grants from the provincial departments. The core business of the agency is to administer and pay social grants to beneficiaries. Social assistance means assistance or a financial award in the form of grants provided by the National Government to residents who are unable to sustain themselves. The agency is also required to develop and implement policies, programs, standard operating procedures and systems for an efficient and effective social assistance benefits administration system.
Social assistance and welfare services have grown rapidly in recent years. About 16.7 million South Africans receive social grants, up from 2.5 million in 1998. This growth is expected to reach 18.1 million South Africans by 2018/19 due to higher life expectancy and in order to ensure all eligible children younger than two years of age benefit from the grant.
Over the spending period ahead, nearly R13 billion will be added to social assistance budgets to accommodate the increase in beneficiaries and ensure that the value of grants keeps pace with inflation. Social assistance expenditure will remain stable as a percentage of GDP.
118
The Budget Process
The National Government’s fiscal year ends on March 31 of each year. The Minister of Finance and National Treasury prepare the Budget with the assistance of the Minister of Finance’s Committee on the Budget and approval of Cabinet. The National Treasury is responsible for the fiscal framework within which the budget is constructed and also coordinates the preparation of expenditure estimates. South Africa ranked third out of 102 countries in the 2015 release of the Open Budget Index by the International Budget Partnership. The survey measures the quality of budget transparency, public participation in the budget processes and institutional oversight. South Africa was one of only four countries that perfomed solidly across all three categories. It was in the top five on measures of transparency and oversight by the legislature and audit institutions, but came out sixth for public participation.
The Minister of Finance presents the National Budget to Parliament in February of each year, with provincial treasuries separately presenting their budgets shortly after the National Budget is proposed. Since the presentation of the 1998-1999 Budget, Parliament has been presented each year with a set of three-year spending plans, but is asked to vote only on the budget for the coming year. Each year’s National Budget is based on certain key economic assumptions regarding, among other things, GDP growth, inflation, employment growth, taxable income, private consumption expenditure, government consumption expenditure, import and export levels and investment.
In addition to presenting expenditure estimates to Parliament, the Minister of Finance is responsible for estimating the revenue that existing taxes and tax rates will raise and for proposing tax amendments, if any. The National Budget then takes the form of an appropriations bill authorising National Government expenditures. The appropriations bill originates in the National Assembly and then goes to the Standing Committee on Appropriations of the National Assembly and the Select Committee on Appropriations of the National Council of Provinces before being debated and finally passed by both houses of Parliament towards the end of the Parliamentary session.
In April 2009, Parliament assented to the Money Bills Amendment Procedure and Related Matters Act of 2009 (the Money Bills Act). The Money Bills Act reconciles Parliament’s legislative and oversight mandate provided for in the Constitution and provides for, amongst others, a procedure to amend money bills before Parliament. In general, the new Money Bills Act is viewed as a legislative milestone that will afford Parliament powers to adjust the National Budget. In exercising its powers Parliament must ensure that: (a) there is an appropriate balance between revenue, expenditure and borrowing; (b) levels of debt and debt interest cost are reasonable; (c) the cost of recurrent spending is not deferred to future generations; and (d) there is adequate provision for spending on infrastructure development, overall capital spending and maintenance. In addition, Parliament must consider the short, medium and long-term implications of the fiscal framework, division of revenue and the long-term growth potential of the economy and the development of the country and must take into account cyclical factors that may impact on the prevailing fiscal position, public revenue and expenditure.
As in the case of the National Budget, the budgets of the provincial governments have been accompanied by three-year expenditure projections since 1999. The MTEF is intended to illustrate forward trends in expenditure priorities and to provide a firmer foundation for fiscal planning and review purposes.
The Minister of Finance is required to indicate each year how the expected deficit between consolidated government expenditure and revenue is to be financed or how any surplus is to be applied. The annual Consolidated Government Budget deficit financing requirement is principally met through the issue of long-term fixed and non-fixed-rate National Government debt in the domestic capital market. The South African bond market is well-developed and highly liquid, and has attracted considerable foreign investor interest. The National Government also borrows from time to time in foreign capital markets, in which case the interest due and final repayment must be repaid in foreign currency.
During the course of each fiscal year, government departments and other spending agencies are held to the spending plans approved in the National Budget by a system of expenditure controls under the direction of the National Treasury. Subsequently, audits of all government accounts provide Parliament and the public with verification of the uses to which public funds have been put. The auditor-general, a constitutionally independent official, supervises this auditing process. Accountability is further promoted by the breakdown of expenditures into “votes” for particular government departments, whose director-generals are the accounting officers responsible for these monies. Further breakdowns into departmental programmes and into so-called economic classification items (for example, employee compensation and payments for capital assets) serve to indicate in more detail the commitment of funds to defined purposes.
119
The Treasury Committee, comprising the President, Deputy President, the Minister of Finance, the Deputy Minister of Finance and other Cabinet members who have been assigned the task of assisting the Cabinet in evaluating additional expenditure requests that arise during the course of a budget year, seeks to ensure prudent fiscal management. In order for the Treasury Committee to approve an additional expenditure request, the expenditure must be deemed to be unforeseeable and unavoidable, or to fall within another legally prescribed category to qualify for inclusion in the Adjustments Budget. A contingency reserve is set aside each year of the MTEF to deal with such requests. Such amendments to some elements of the current year’s budget and the Consolidated Budget (in departmental allocations) are made by Parliament in an Adjustments Budget towards the middle of the fiscal year.
Also around the end of October of each year, the Minister of Finance presents the MTBPS. This policy statement outlines the priority policy proposals and the new MTEF that will underpin the next year’s budget.
MTBPS
The 2015 MTBPS sets out the macroeconomic, fiscal and public-expenditure priorities for the medium term. The 2015 MTBPS illustrates a budget framework that seeks to sustain investment, stabilise public debt and maintain funding towards the social priorities of the National Development Plan as expressed in the MTSF. Expenditure growth is expected to outpace inflation by about 1.6%. The framework builds on the commitments made last year to stabilise debt levels, close the primary balance and improve the effectiveness of spending.
In the 2015 MTBPS, the National Treasury projects consolidated budget revenue for fiscal year 2015 to amount to R1,220.8 billion, which is R31.9 billion higher than the Budget 2015 estimate. This is as a result of the upward revisions in non-tax revenue amounting to R28.9 billion (mainly attributed to the R25.4 billion sale of Vodacom shares and higher receipts from other financial transactions) and own revenues for provinces, social security funds and selected public entities by R10.5 billion which offset the R7.6 billion downward revision in gross tax revenue. Taking into account projected underspending, declared unspent money, the 2015 wage settlement agreement with public employees, special appropriations for Eskom and the New Development Bank, and the adjusted state debt cost estimate, the revised estimate of total consolidated expenditure in fiscal year 2015 is R1,378.7 billion. In February 2015, an expenditure of R1,351.0 billion was budgeted for fiscal year 2015. The budget deficit of the consolidated Government for fiscal year 2015 is projected to be 3.8% of GDP, broadly unchanged from the 2015 Budget expectations of 3.9% of GDP. Despite some slippage in the budget deficit projections of 0.7% each in fiscal years 2016 and 2017 compared to the 2015 Budget estimates, the deficit is expected to decline to 3% of GDP in fiscal year 2018.
The audited tax revenue outcome of R986.3 billion for fiscal year 2014 was R7.4 billion lower than the original budget estimate in February 2014 but R7.3 billion higher than the revised 2015 Budget Review estimate. Tax revenue was higher than expected compared to the 2015 Budget target largely as a result of strong growth in personal income tax due to less-than-full fiscal drag relief and fairly high wage growth, particularly for high-income earners as well as large one-off payments arising from the disposal of share options.
In order to maintain the health of the public finances the Government implemented the medium-term fiscal policy package in the 2015 Budget and is focused on following through with its policies. In recent months, two risks identified in the 2015 Budget materialised: a public-sector wage agreement significantly above inflation and a deterioration in economic performance. The increases in the wage bill were funded through a drawdown of the 2015/16 contingency reserve of R5 billion. The projected contingency reserves for the following two years have also been reduced by R12.5 billion and R36 billion, respectively, as a result of the wage agreement. Despite these challenges, the government expects to achieve its targets, although there is limited room for additional unexpected events. The central fiscal objective over the medium term is to stabilise the growth of debt as a share of GDP. Main budget expenditure remained within the limits set out for the 2014 fiscal year and the Government is on track to stay within the spending ceiling in the current year. Debt is stabilising as a share of GDP. Despite some slippage in medium-term budget deficit projections, the deficit is expected to continue to narrow. The 2015 MTBPS proposes a new long-term fiscal guideline to align the spending ceiling explicitly with the long-term path of economic growth. The guideline builds on the Government’s countercyclical approach to sustain development over the long term. This guideline gives expression to the fiscal principles of countercyclicality and debt sustainability and will ensure that spending grows at a stable rate over the business cycle.
120
The 2015 MTBPS makes a technical modification to the spending ceiling. Payments that are directly and fully financed by dedicated revenue flows authorised by specific legislation, such as the skills development levy, will be excluded from the spending ceiling, as will payments that arise from technical adjustments to the value of assets and liabilities. As a result, the spending ceiling will differ slightly from non-interest expenditure.
Given the weaker economic outlook and downward revisions to the in-year estimates, tax revenue collections for fiscal years 2016 and 2017 were revised downwards compared to the 2015 Budget estimates. Projected revenues from corporate income tax and value-added tax have underperformed for the first half of the current fiscal year, and have been revised downwards. Personal income tax collection has been stronger, supported by above-inflation wage settlements and higher marginal tax rates. Over the medium term, gross tax revenue collection is projected to continue growing faster than nominal GDP, but by a narrower margin than in the recent past. This is expected to be largely driven by increases in income tax rates and the fuel levy announced in the 2015 Budget. Over the medium term, government will continue to explore reforms that promote an efficient and progressive tax system, taking into account the recommendations of the Davis Tax Committee. Initiatives already under way include measures to combat base erosion, profit shifting and the misuse of transfer pricing. No specific additional taxes have been implemented as of the date hereof.
Consolidated government expenditure of R1,451.7 billion is proposed for fiscal year 2016, 5.3% more than the revised expenditure estimate for fiscal year 2015. The Government plans for a contingency reserve of R15 billion in 2018/19 to serve as a buffer against economic and fiscal shocks. Spending priorities over the medium term focus on education and skills development, health, social protection, social and economic infrastructure, and support for job creation. Government is projected to close the current deficit in 2015/16, meaning that over the medium term, government will be able to finance part of its capital budget from savings rather than borrowing.
There is a resource allocation of R1,123.2 billion across the three spheres of government in fiscal year 2015. This increases to R1,361.5 billion by fiscal year 2018. The local share of nationally raised revenue grows from 9.0% in fiscal year 2015 to 9.4% by fiscal year 2018, and the provincial share also rises from 42.0% in fiscal year 2015 to 43.4% in 2018/19. The faster growth in allocations to provincial and local government reflects the priority placed on front-line services such as health, education and basic services, as well as the rising cost of these services due to higher wages, and bulk electricity and water costs.
Debt-service costs have fallen from 5.5% of GDP in fiscal year 1998 to 3.1% of GDP in fiscal year 2015. Declining deficits and fiscal surpluses prior to the recession resulted in a particularly pronounced drop in debt-service costs. This created significant fiscal space, enabling the government to preserve the real value of previous allocations and make available additional resources to improve the availability and delivery of public services without having to increase taxes. The National Government’s decision to sustain spending in key areas, following the recession, meant additional borrowing was required to cover the slowdown in revenue collections. Over the 2016 MTEF, debt-service costs will average 3.3% of GDP and is the fastest growing area of expenditure. The paying down of debt-service costs will create fiscal space if the economic environment should deteriorate further.
2016 MTEF
The 2015 MTBPS has announced the 2016 MTEF, which sets out the consolidated expenditure framework for fiscal year 2015/16 through to fiscal year 2018/19. The framework consists of revised baseline estimates reflecting the government’s current spending priorities, including education, social protection and health services (which take up the largest of planned expenditure). Strong growth over the future spending period can be seen in basic education, post-school education and training, health, social protection, human settlements and municipal infrastructure, and defence, public order and safety.
121
2015-2016 National Budget and Consolidated Government Budgets
2015-2016 National Budget
In February 2015, the South African Minister of Finance submitted the 2015-2016 National Budget to Parliament. The 2015-2016 National Budget and the three-year MTEF estimates supported the long-term health of the public finances with a series of revenue and expenditure measures to narrow the budget deficit and stabilise debt. These measures included increases in the personal income tax rates and the fuel levies, and a R25 billion reduction in the spending ceiling for 2015/16 and 2016/17. Government continues to prioritise infrastructure investment and social programmes that support those citizens most in need as well as contributing to structural changes for sustainable growth in the future which include shifting from a growth path reliant on consumption to one led by investment, making the transition to a less energy-intensive economy, strengthening tradable sectors with significant potential for job creation, and investing in cities to reverse inequitable and inefficient patterns of human settlements.
The 2015-2016 National Budget allocated 52.1% of nationally raised resources to provinces and local government over the medium term. Fiscal constraints meant that transfers to provinces and local government would grow more slowly over the medium term than they have in the past. However, provinces face significant cost pressures due to the above-inflation wage agreement, and municipalities face pressures due to the wage agreement as well as due to the rising costs of bulk water and electricity services that they purchase. Accordingly, provincial and local governments will need to reduce costs and reprioritize in order to improve delivery of basic services.
The 2015-2016 National Budget estimated that total national revenues for fiscal year 2015 will amount to R1,049.3 billion. National budget expenditures for fiscal year 2015 were estimated at R1,222.3 billion. Consequently, a main budget deficit of R173.1 billion, or 4.1% of GDP, was forecast. The inclusion of extraordinary receipts and payments into the new reporting format means that there is no longer a distinction between the main budget deficit and the borrowing requirement.
2015-2016 Consolidated Government Budget
The amounts reflected in the budget votes of the national departments whose functions are partially devolved to the provinces do not illustrate total allocations to such functions. By contrast, the Consolidated Government Budget presents a more relevant measure of trends and priorities in government finances in South Africa, particularly in the socio-economic field, and hence the tables and discussion below focus on this measure of government expenditure. See “Public Finance—Background.”
The 2015-2016 consolidated government expenditure was budgeted at R1,351.0 billion for fiscal year 2015. The deficit on the Consolidated Government Budget is lower than that in the main National Budget due to surpluses in the provinces and the social security funds, primarily the Unemployment Insurance Fund and Compensation Funds.
The estimated 2015-2016 Consolidated Government Budget continues to build on policy priorities established in 2001, with a special emphasis on growth-enhancing spending as well as spending programmes that target the poor and vulnerable groups. Growth in all categories of social services spending reflects the National Government’s commitment in improving the social well-being of South Africans.
Education remained the largest category of expenditure, followed by economic affairs and local development and social infrastructure. Health care expenditure and social protection also remained significant.
122
The following table sets forth the Consolidated Government Expenditure as set out in the 2015 MTBPS for the periods indicated.
Consolidated government expenditure, 2012–2014
| | | | | | | | | | | | | | | | | | | | | | | | |
Fiscal year R billion | | 2012 | | | 2013 | | | 2014 | |
| | Outcome | | | % of total | | | Outcome | | | % of total | | | Outcome | | | % of total | |
Current payments | | | 632.6 | | | | 60.6 | % | | | 693.6 | | | | 60.6 | % | | | 735.8 | | | | 59.9 | % |
Compensation of employees | | | 376.6 | | | | 36.1 | % | | | 409.6 | | | | 35.8 | % | | | 441.1 | | | | 35.9 | % |
Goods and services | | | 162.7 | | | | 15.6 | % | | | 174.7 | | | | 15.3 | % | | | 173.9 | | | | 14.2 | % |
Interest and rent on land | | | 93.3 | | | | 8.9 | % | | | 109.3 | | | | 9.5 | % | | | 120.8 | | | | 9.8 | % |
of which: Debt-service costs | | | 88.1 | | | | 8.4 | % | | | 101.2 | | | | 8.8 | % | | | 114.8 | | | | 9.3 | % |
Transfers and subsidies | | | 340.8 | | | | 32.6 | % | | | 371.9 | | | | 32.5 | % | | | 400.0 | | | | 32.6 | % |
of which: Capital transfers | | | 52.3 | | | | 5.0 | % | | | 55.8 | | | | 4.9 | % | | | 58.1 | | | | 4.7 | % |
Provinces and municipalities | | | 83.3 | | | | 8.0 | % | | | 89.6 | | | | 7.8 | % | | | 96.0 | | | | 7.8 | % |
Departmental agencies and accounts | | | 22.4 | | | | 2.1 | % | | | 21.5 | | | | 1.9 | % | | | 24.8 | | | | 2.0 | % |
Higher education institutions | | | 22.1 | | | | 2.1 | % | | | 24.0 | | | | 2.1 | % | | | 25.7 | | | | 2.1 | % |
Foreign governments and international organisations | | | 2.2 | | | | 0.2 | % | | | 2.2 | | | | 0.2 | % | | | 2.3 | | | | 0.2 | % |
Public corporations and private enterprises | | | 24.4 | | | | 2.3 | % | | | 24.6 | | | | 2.2 | % | | | 27.8 | | | | 2.3 | % |
Non-profit institutions | | | 21.7 | | | | 2.1 | % | | | 25.8 | | | | 2.3 | % | | | 26.9 | | | | 2.2 | % |
Households | | | 164.7 | | | | 15.8 | % | | | 184.3 | | | | 16.1 | % | | | 196.6 | | | | 16.0 | % |
Payments for capital assets | | | 66.3 | | | | 6.3 | % | | | 74.5 | | | | 6.5 | % | | | 87.6 | | | | 7.1 | % |
Buildings and other capital assets | | | 52.8 | | | | 5.1 | % | | | 58.0 | | | | 5.1 | % | | | 66.8 | | | | 5.4 | % |
Machinery and equipment | | | 13.5 | | | | 1.3 | % | | | 16.5 | | | | 1.4 | % | | | 20.8 | | | | 1.7 | % |
Payments for financial assets | | | 4.9 | | | | 0.5 | % | | | 4.1 | | | | 0.4 | % | | | 5.4 | | | | 0.4 | % |
| | | | | | | | | | | | | | | | | | | | | | | | |
Consolidated expenditure | | | 1,044.6 | | | | 100.0 | % | | | 1,144.2 | | | | 100.0 | % | | | 1,228.8 | | | | 100.0 | % |
| | | | | | | | | | | | | | | | | | | | | | | | |
Note: —
| (1) | These figures were estimated by the National Treasury and may differ from data published by Stats SA and the SARB. The numbers in this table are not strictly comparable to those published in previous years due to the reclassification of expenditure items for previous years. Data for the history years have been adjusted accordingly. |
Source: South African National Treasury
123
The following table sets forth the Consolidated Government Expenditure as set out in the 2015 MTBPS for the periods indicated. Please note that, while the line items may differ from the 2012-2014 Consolidated Government Budget table, the categories remain the same and can be compared.
Consolidated Government Expenditure by functional & economic classification1, 2012/13 – 2018/19
| | | | | | | | | | | | | | | | | | | | | | | | | | | | | | | | |
| | | 2012/13 | | | 2013/14 | | | 2014/15 | | | 2015/16 | | | 2016/17 | | | 2017/18 | | | 2018/19 | | | Average | |
R billion | | Outcome | | | Revised | | | Medium-term estimates | | | annual
growth
2015/16 –
2018/19 | |
Functional classification | | | | | | | | | | | | | | | | | | | | | | | | | | | | | | | | |
Basic education | | | 170.9 | | | | 185.2 | | | | 197.4 | | | | 213.9 | | | | 228.6 | | | | 249.8 | | | | 270.0 | | | | 8.1 | % |
Basic education | | | 163.9 | | | | 177.3 | | | | 189.2 | | | | 204.5 | | | | 219.2 | | | | 239.6 | | | | 259.3 | | | | 8.2 | % |
Arts, sport, recreation and culture | | | 7.0 | | | | 7.9 | | | | 8.2 | | | | 9.4 | | | | 9.5 | | | | 10.2 | | | | 10.7 | | | | 4.5 | % |
Health | | | 125.1 | | | | 134.0 | | | | 144.6 | | | | 157.7 | | | | 169.7 | | | | 184.7 | | | | 200.6 | | | | 8.3 | % |
Defence, public order and safety | | | 142.9 | | | | 154.9 | | | | 162.6 | | | | 172.0 | | | | 183.7 | | | | 198.9 | | | | 211.8 | | | | 7.2 | % |
Defence and state security | | | 41.7 | | | | 44.9 | | | | 47.5 | | | | 50.0 | | | | 53.0 | | | | 57.2 | | | | 60.8 | | | | 6.7 | % |
Police services | | | 68.9 | | | | 75.3 | | | | 78.3 | | | | 83.1 | | | | 88.7 | | | | 96.0 | | | | 102.5 | | | | 7.3 | % |
Law courts and prisons | | | 32.3 | | | | 34.7 | | | | 36.9 | | | | 38.9 | | | | 42.0 | | | | 45.7 | | | | 48.5 | | | | 7.6 | % |
Post-school education and training | | | 47.1 | | | | 48.3 | | | | 54.4 | | | | 63.7 | | | | 66.2 | | | | 71.0 | | | | 76.6 | | | | 6.3 | % |
Economic affairs | | | 139.6 | | | | 164.7 | | | | 168.8 | | | | 187.6 | | | | 202.3 | | | | 208.5 | | | | 222.5 | | | | 5.9 | % |
Industrial development and trade | | | 26.7 | | | | 30.3 | | | | 26.4 | | | | 30.4 | | | | 32.2 | | | | 32.6 | | | | 34.9 | | | | 4.7 | % |
Employment, labour affairs and social security funds | | | 39.4 | | | | 52.1 | | | | 52.3 | | | | 65.7 | | | | 73.1 | | | | 75.4 | | | | 77.8 | | | | 5.8 | % |
Economic infrastructure and network regulation | | | 60.1 | | | | 66.3 | | | | 71.9 | | | | 71.1 | | | | 76.0 | | | | 78.8 | | | | 86.0 | | | | 6.5 | % |
Science, technology, innovation and the environment | | | 13.4 | | | | 15.9 | | | | 18.1 | | | | 20.5 | | | | 20.9 | | | | 21.7 | | | | 23.8 | | | | 5.2 | % |
Human settlements and municipal infrastructure | | | 131.0 | | | | 142.6 | | | | 156.4 | | | | 178.7 | | | | 189.9 | | | | 204.2 | | | | 222.6 | | | | 7.6 | % |
Agriculture, rural development and land reform | | | 19.3 | | | | 21.0 | | | | 24.2 | | | | 25.6 | | | | 26.5 | | | | 28.3 | | | | 30.0 | | | | 5.4 | % |
General public services | | | 57.8 | | | | 61.1 | | | | 62.2 | | | | 72.5 | | | | 71.8 | | | | 75.8 | | | | 79.8 | | | | 3.3 | % |
Executive and legislative organs | | | 9.6 | | | | 11.1 | | | | 10.2 | | | | 12.6 | | | | 13.1 | | | | 14.0 | | | | 14.9 | | | | 5.7 | % |
General public administration and fiscal affairs | | | 36.3 | | | | 36.8 | | | | 37.5 | | | | 44.9 | | | | 44.0 | | | | 46.5 | | | | 47.1 | | | | 1.6 | % |
Home affairs | | | 5.4 | | | | 6.6 | | | | 7.0 | | | | 7.2 | | | | 7.2 | | | | 7.4 | | | | 9.3 | | | | 8.8 | % |
External affairs and foreign aid | | | 6.5 | | | | 6.7 | | | | 7.4 | | | | 7.7 | | | | 7.5 | | | | 7.9 | | | | 8.5 | | | | 3.5 | % |
Social protection | | | 122.7 | | | | 131.0 | | | | 143.4 | | | | 154.0 | | | | 168.0 | | | | 181.3 | | | | 195.7 | | | | 8.3 | % |
| | | | | | | | | | | | | | | | | | | | | | | | | | | | | | | | |
Allocated by functional classification | | | 956.4 | | | | 1,043.0 | | | | 1,114.0 | | | | 1,225.7 | | | | 1,306.6 | | | | 1,402.6 | | | | 1,509.5 | | | | 7.2 | % |
Special appropriations: Eskom and New Development Bank | | | — | | | | — | | | | — | | | | 25.0 | | | | — | | | | — | | | | — | | | | — | |
Debt-service costs | | | 88.1 | | | | 101.2 | | | | 114.8 | | | | 127.9 | | | | 142.6 | | | | 157.2 | | | | 174.6 | | | | 10.9 | % |
Contingency reserve | | | — | | | | — | | | | — | | | | — | | | | 2.5 | | | | 9.0 | | | | 15.0 | | | | — | |
| | | | | | | | | | | | | | | | | | | | | | | | | | | | | | | | |
Consolidated expenditure | | | 1,044.6 | | | | 1,144.2 | | | | 1,228.8 | | | | 1,378.7 | | | | 1,451.7 | | | | 1,568.8 | | | | 1,699.1 | | | | 7.2 | % |
| | | | | | | | | | | | | | | | | | | | | | | | | | | | | | | | |
124
Consolidated Government Expenditure by functional & economic classification1, 2012/13 – 2018/19
(continued)
| | | | | | | | | | | | | | | | | | | | | | | | | | | | | | | | |
| | | 2012/13 | | | 2013/14 | | | 2014/15 | | | 2015/16 | | | 2016/17 | | | 2017/18 | | | 2018/19 | | | Average | |
R billion | | Outcome | | | Revised | | | Medium-term estimates | | | annual
growth
2015/16 –
2018/19 | |
Economic classification | | | | | | | | | | | | | | | | | | | | | | | | | | | | | | | | |
Current payments | | | 632.6 | | | | 693.6 | | | | 735.8 | | | | 806.3 | | | | 870.4 | | | | 944.0 | | | | 1021.6 | | | | 8.2 | % |
Compensation of employees | | | 376.6 | | | | 409.6 | | | | 441.1 | | | | 486.2 | | | | 524.0 | | | | 569.4 | | | | 615.6 | | | | 8.2 | % |
Goods and services | | | 162.7 | | | | 174.7 | | | | 173.9 | | | | 186.1 | | | | 198.1 | | | | 212.6 | | | | 226.1 | | | | 6.7 | % |
Interest and rent on land | | | 93.3 | | | | 109.3 | | | | 120.8 | | | | 133.9 | | | | 148.4 | | | | 162.0 | | | | 179.9 | | | | 10.3 | % |
of which: Debt-service costs | | | 88.1 | | | | 101.2 | | | | 114.8 | | | | 127.9 | | | | 142.6 | | | | 157.2 | | | | 174.6 | | | | 10.9 | % |
Transfers and subsidies | | | 340.8 | | | | 371.9 | | | | 400.0 | | | | 445.5 | | | | 479.9 | | | | 511.0 | | | | 551.6 | | | | 7.4 | % |
of which: Capital transfers | | | 52.3 | | | | 55.8 | | | | 58.1 | | | | 62.6 | | | | 70.6 | | | | 75.3 | | | | 83.0 | | | | 9.8 | % |
Provinces and municipalities | | | 83.3 | | | | 89.6 | | | | 96.0 | | | | 107.2 | | | | 114.4 | | | | 123.5 | | | | 137.3 | | | | 8.6 | % |
Departmental agencies and accounts | | | 22.4 | | | | 21.5 | | | | 24.8 | | | | 30.6 | | | | 31.1 | | | | 33.9 | | | | 36.7 | | | | 6.2 | % |
Higher education institutions | | | 22.1 | | | | 24.0 | | | | 25.7 | | | | 27.5 | | | | 29.0 | | | | 30.8 | | | | 32.8 | | | | 6.0 | % |
Foreign governments and international organisations | | | 24.4 | | | | 24.6 | | | | 27.8 | | | | 30.7 | | | | 34.3 | | | | 35.1 | | | | 39.2 | | | | 8.4 | % |
Public corporations and private enterprises | | | 2.2 | | | | 2.2 | | | | 2.3 | | | | 2.1 | | | | 2.2 | | | | 2.3 | | | | 2.5 | | | | 6.1 | % |
Non-profit institutions | | | 21.7 | | | | 25.8 | | | | 26.9 | | | | 28.0 | | | | 29.0 | | | | 30.2 | | | | 32.0 | | | | 4.6 | % |
Households | | | 164.7 | | | | 184.3 | | | | 196.6 | | | | 219.5 | | | | 239.9 | | | | 255.3 | | | | 271.2 | | | | 7.3 | % |
Payments for capital assets | | | 66.3 | | | | 74.5 | | | | 87.6 | | | | 97.2 | | | | 98.4 | | | | 104.2 | | | | 110.4 | | | | 4.3 | % |
Buildings and other capital assets | | | 52.8 | | | | 58.0 | | | | 66.8 | | | | 76.3 | | | | 80.4 | | | | 84.8 | | | | 90.4 | | | | 5.8 | % |
Machinery and equipment | | | 13.5 | | | | 16.5 | | | | 20.8 | | | | 20.9 | | | | 18.0 | | | | 19.4 | | | | 20.0 | | | | -1.5 | % |
Payments for financial assets | | | 4.9 | | | | 4.1 | | | | 5.4 | | | | 29.6 | | | | 0.5 | | | | 0.5 | | | | 0.5 | | | | -73.7 | % |
| | | | | | | | | | | | | | | | | | | | | | | | | | | | | | | | |
Allocated by economic classification | | | 1,044.6 | | | | 1,144.2 | | | | 1,228.8 | | | | 1,378.7 | | | | 1,449.2 | | | | 1,559.8 | | | | 1,684.1 | | | | 6.9 | % |
Contingency reserve | | | — | | | | — | | | | — | | | | — | | | | 2.5 | | | | 9.0 | | | | 15.0 | | | | — | |
| | | | | | | | | | | | | | | | | | | | | | | | | | | | | | | | |
Consolidated expenditure | | | 1,044.6 | | | | 1,144.2 | | | | 1,228.8 | | | | 1,378.7 | | | | 1,451.7 | | | | 1,568.8 | | | | 1,699.1 | | | | 7.2 | % |
| | | | | | | | | | | | | | | | | | | | | | | | | | | | | | | | |
| 1. | Consisting of national, provincial, social security funds and selected public entities. |
Source: South African National Treasury
125
During the past decade, growth in consolidated National Government expenditure has exceeded both nominal GDP growth and population growth in South Africa due to the occurrence of various extraordinary items. In fiscal 1993 and fiscal 1994, public-sector borrowing amounted to approximately 10% of GDP. These extraordinary items have included the costs of early retirement offers to former civil servants, losses incurred by the SARB on its foreign exchange forward cover operations and various costs associated with political transition in 1994 and the establishment of a new democratic order. If Consolidated Government expenditure is broadened to include all expenditures by universities and polytechnics (including those in the former TBVC states) and local governments, total government expenditure (technically referred to as general government expenditure) rose from 30% of GDP in fiscal 1983 to 40.9% of GDP in fiscal 1994, of which 3.8% represented settlements of extraordinary liabilities to National Government pension funds and the SARB. Consolidated government expenditure was 29.6% of GDP in fiscal year 2008 and the public-sector borrowing requirement was in deficit at R79.8 billion, or 3.3% of GDP.
Taxation
Taxation in South Africa is administered by SARS, an autonomous body managed by a board of directors and established by legislation to collect revenue and ensure compliance with tax law. SARS’ vision is to be an innovative revenue and customs agency that enhances economic growth and social development and supports South Africa’s integration into the global economy in a way that benefits all South African citizens. Amongst others, SARS collects personal income tax, company tax, value-added tax, customs duties on imports, excise duties on prescribed goods, fuel levies and various other taxes.
While most tax revenues are collected at the national level, municipalities impose and collect property taxes. In addition, the main sources of revenue (although limited in scope) for provinces are motor vehicle licence fees and gambling taxes. Non-tax user charges are levied principally by municipalities and extra-budgetary institutions, such as universities, museums, statutory research councils and public entities.
The National Government aims to maintain and strengthen a tax system that is fair, efficient and internationally competitive, while meeting fiscal policy requirements. Recognising that improving tax administration and collection are essential steps towards achieving meaningful tax reform in the future, the National Government seeks to narrow the tax compliance gap and broaden the tax base. It is the National Government’s policy to keep tax law as simple as possible in order to minimise collection and compliance costs and to monitor the tax system on a continuous basis.
Tax Revenue
Audited results show that tax revenue for fiscal year 2014/15 of R986.3 billion was 9.6% higher than the amount collected in the previous year. The revised tax revenue estimate for fiscal year 2015/16 as per MTBPS 2015 is R1,073.7 billion. Personal income tax (R353.0 billion), value added tax (R261.3 billion) and corporate income tax (R185.0 billion) made the largest contribution to total tax revenue for fiscal year 2014/15.
Continued global uncertainty and lower commodity prices have dampened growth in South Africa resulting in lower than budgeted tax revenue.
126
Personal Income Tax
South Africa has a progressive personal income tax system whereby income categories in different brackets are taxed at different rates. As of 2015, for individuals earning between 0 and R181,900, a tax rate of 18% is levied. This is the lowest tax bracket, with four other brackets being applied to higher income earners. The top bracket has a tax rate of 41%, and it applies to individuals earning more than R701,300. The tax system also provides primary rebates for all taxpayers, as well as secondary rebates for people aged 65 years and older, and a tertiary rebate for people 75 years or older. In practice it means that people earning less than R73,650 will not pay any tax, while those aged 65 years and older will not pay tax if they earn less than R114,800. For those older than 75 years, the tax threshold is R128,500.
The National Government has over the past ten years adjusted income tax brackets to take account of the effects of inflation on income tax paid by individuals. In fiscal year 2015/16, budget proposals resulted in net tax gain of R8.2 billion. Personal income tax bracket adjustments amounted to R8.6 billion in revenue loss. This was however offset through tax rate increases (of 1%) in each of the tax brackets, with the exception of the lowest income bracket.
Tax deductions on personal income tax include deductions for pension contributions, while tax credits are provided for individuals belonging to Medical Schemes. In addition, interest income of up to R22,800 is tax exempt for individuals younger than 65 years, and R33,000 for those 65 years and older. Following the 2014 Budget, South Africa introduced tax free savings accounts to encourage household savings. All returns accruing to these investments will be exempt from tax. With the introduction of tax free investments, the above-mentioned tax free interest income thresholds for individuals will be phased out over time.
Company Tax
Over the past few years, South Africa has reduced the headline corporate income tax rate from 40% to 35% in fiscal year 1995/96, 30% in fiscal year 2000/01, 29% in fiscal year 2006/07 and 28% in fiscal year 2009/10. Currently, the rate remains 28%, and the secondary tax on companies (STC) of 10% has been replaced by a 15% tax on dividends withheld from the dividends distributed to the recipient and not paid by the company distributing the dividends.
Small business corporations (SBCs) with an annual turnover less than R20 million have certain special tax provisions. They are taxed on a graduated scale with the first R67,000 being tax free. There are also 7% and 21% brackets, with only earnings in excess of R550,000 taxed at 28%. In addition SBCs may benefit from accelerated depreciation of assets. There is also a turnover tax option for businesses with an annual turnover of less than R1 million, in an attempt to minimise their compliance burden, while investors are encouraged to fund small businesses through a Venture Capital Company regime. Investments in VCCs are tax-deductible, provided that the investments meet the necessary requirements. In order to encourage funding to small business, following the 2014 Budget, entities which provide grant funding to small businesses will not be taxed on their accruals and receipts, while grant funding from the approved entities is also exempt in the hands of small businesses.
South African tax legislation contains certain corporate reorganisation rollover rules. These rules are intended to facilitate the tax-free transfer of assets in specified circumstances. Taxpayers may not generally deduct interest incurred in respect of loan funding used to acquire shares because shares generally only produce exempt income. However, taxpayers can indirectly obtain a deduction for interest when acquiring shares of a target company when the acquisition is associated with certain rollover reorganisation. The rollover rules were never intended to enable interest deductions when those deductions would not otherwise be available. A measure to control interest deductions in respect of debt used to procure, enable, facilitate or fund certain reorganisation transactions has been introduced. To prevent the misuse of acquisition debt, interest deductions associated with this debt are currently subject to discretionary limits as determined by SARS. These limits are designed to target potential base erosion caused by excessive debt. From April 1, 2014 the aggregate deductions for interest paid or incurred in respect of acquisition debt will become subject to an annual limitation pursuant to a defined formula.
127
The concept of “headquarter company” was introduced with effect from January 1, 2011. Headquarter companies enjoy certain tax and exchange control relief and the concept is aimed at positioning South Africa as a holding company gateway for foreign multinationals into Africa.
As of January 1, 2011, in order to qualify as a headquarter company, certain requirements must be met, inter alia:
| | • | | a headquarter company must be a South African resident company; |
| | • | | each shareholder of the company (whether alone or together with any other company forming part of the same group of companies as the shareholder) holds 10% or more of the equity shares and voting rights in that company; |
| | • | | at least 80% of the cost of the total assets of the company is attributable to any interest in equity shares in, any amount loaned or advanced to, or any intellectual property as defined that is licensed by the headquarter company to, any foreign company in which the headquarter company held at least 10% of the equity shares and voting rights; |
| | • | | where the gross income of the headquarter company exceeds R5 million, at least 50% or more of its gross income consists of rental, dividends, interest, royalty or service fees paid by a foreign company, and/or proceeds from the disposal of equity shares in a foreign company or of any intellectual property which had been licensed by the headquarter company to the foreign company. |
Distributions from collective investment schemes (CIS), follow the flow-through principle, meaning that the income (e.g. interest, dividends, etc.) received by the CIS in securities will retain its nature when distributed to the CIS unit holders. Hedge funds are taxed identically, and will need to register as CIS in future.
A withholding tax on interest was introduced during the 2010/11 legislative cycle and took effect on March 1, 2015. As a result all interest paid to non-residents is taxed at a final withholding tax rate of 15% (subject to double tax agreements) and is payable by the last day of the month following the month during which the interest was paid. However, the withholding charge is subject to some exemptions, including debt issued by government and debt listed on an exchange.
The exemption of interest owed by domestic banks does not include back-to-back loan agreements designed to circumvent the 15% withholding tax e.g., if the bank acts as an intermediary to facilitate the unlisted borrowing of funds by a domestic company from a foreign lender. In addition to the exemption for mobile portfolio debt capital, cross-border interest withholding contains three additional exemptions which apply to: (i) certain foreign payors and foreign payees, and (ii) certain forms of debt owed by a headquarter company. South African double tax agreements with low tax jurisdictions that provide for a zero withholding rate are currently under negotiation.
International transactions are currently subject to rules dealing with transfer pricing and controlled foreign companies.
As of January 1, 2011, a controlled foreign company includes a foreign company where more than 50% of the total participation rights in that foreign company is not only directly held, but also indirectly held by one or more persons that are South African residents other than persons that are headquarter companies. If one or more South African residents hold more than 50% of the participation rights in an offshore cell, the cell will be deemed to be a controlled foreign company without regard to ownership in the other cells. As of April 1, 2012, the ownership threshold in respect of the dividend and capital gain participation exemptions in relation to foreign shares was reduced from 20% down to 1%. This lower threshold is consistent with the global economic concept of direct foreign investment and that of the South African exchange control requirements. It is important to note that the foreign dividend participation exemption provision contains so-called anti-cycle scheme rules within the participation exemption so as to prevent the offshore cycling of funds. The participation exemption does not apply if the foreign dividends at issue arose directly or indirectly from a South African deductible payment that is not subject to South African normal tax in the hands of the offshore recipients.
128
With effect from January 1, 2012, the domestic corporate restructuring rollover rules were extended to fully include the restructuring of offshore companies that remain under the control of the same South African group companies. The asset-for-share, amalgamation, unbundling and liquidation rules will be revised to cover offshore restructurings.
A new uniform system of source rules was introduced on January 1, 2012. The new uniform system combines the common law, pre-existing rules and tax treaty principles. These source rules will loosely reflect implicit tax treaty principles, with a few added built-in protections, so that the South African system is globally aligned. The new source rules eliminate the concept of deemed source. South African sources of income are now fully defined and items of income falling outside these definitions will be treated as foreign source income, unless a particular category of income is not expressly defined, in which case the common rules will continue to apply.
South Africa has also introduced a new limited foreign tax credit that was effective as of January 1, 2012. This foreign tax credit is limited solely to foreign withholding taxes imposed in respect of services rendered in South Africa. These tax credits are limited solely to South African taxes otherwise imposed on the same service income after taking applicable deductions into account. The foreign tax credit was repealed during the 2015 legislative cycle.
South Africa has introduced specific provisions in the various tax acts (Income Tax Act, Value Added Tax and Securities Transfer Tax) to cater for Islamic finance. In 2014, the legislation was amended to also allow SOEs to issue Sukuk, following the successful issue of a Sukuk by the South African government. The changes were introduced to place the above-mentioned products on an equal footing with conventional finance products. In 2015, the provisions were further extended to include listed entities.
Effective April 1, 2012, transfer pricing rules were modernised to be in line with the OECD guidelines. The new transfer pricing rules are closely aligned with the wording of the OECD and UN Model Tax Conventions and are in line with tax treaties and other international tax principles. These might be refined further following the OECD BEPS process which concluded in 2015, which South Africa participated in and committed to.
The taxpayer is obliged to ensure that all its transactions are done on an arm’s length basis. The transfer pricing rules are henceforth used to deny deductions for interest that would not have existed had a South African entity not been thinly capitalised with excessive debt. In the 2014 legislative cycle, the current form of secondary adjustment has been revised and an amount of secondary adjustment, in the case of a company, will be deemed to be a dividend in specie paid by a South African taxpayer to the non-resident connected person. In the case of a natural person or a trust, the amount of the secondary adjustment will be deemed to be a donation made by the South African natural person or trust to the non-resident connected person.
In the 2013 legislative cycle, South Africa introduced a limitation on the deductibility of interest in respect of related party debt and leveraged mergers and acquisitions. This was aimed at preventing the use of excessive debt to boost the bottom line, based on the overall tax benefit. Whilst debt capital is an important instrument of capitalising companies, the legislation seeks to strike a balance between the need to attract debt capital and the protection of the tax base against erosion. This issue was also addressed in one of the OECD BEPD packages.
Investors in equity funds constituted as partnerships or trusts will be granted tax relief and will be regarded as having a permanent establishment in South Africa merely by virtue of their investment. This tax relief places limited partners of trust beneficiaries in the same position had these investors invested directly in the underlying assets of the partnership or trust. The investors will not be exposed to South African tax merely because of the portfolio management activities carried on in South Africa. However, management fees of the South African manager, general partner or trustee will remain taxable in South Africa. To qualify for this relief the investor must satisfy the following requirements: (i) the partner or trust beneficiary must have limited liability like a shareholder of a company; (ii) the partner or trust beneficiary must not participate in the effective management of the business of the partnership or trust; (iii) the partner or the trust beneficiary must not have the authority to act on behalf of the partnership or trust or on behalf of the members of the partnership or trust and (iv) the partner or trust beneficiary must not render any services to or on behalf of the partnership or trust.
129
A new definition of a “foreign partnership” was introduced into the Income Tax Act for tax years commencing after October 1, 2010. The purpose of the new definition is to ensure that entities like limited liability partnerships or limited liability companies and similar hybrid entities are not treated as companies when they are in fact partnerships. The new definition therefore synchronises the South African tax treatment of these entities with foreign tax practice. To qualify as a foreign partnership, an entity must be a partnership, association or body of persons established or formed under foreign law.
In an effort to encourage conservation of South Africa’s rich biodiversity, the Income Tax Act contains tax incentives (introduced in the 2008–2009 Budget) for private landowners that have entered into bilateral agreements to conserve and maintain a particular area of land on behalf of the National Government under the terms of the National Environmental Management: the Biodiversity Act of 2004 and National Environmental Management: the Protected Areas Act of 2003. Landowners are eligible for income tax deductions for environmental maintenance and rehabilitation expenses as well as the loss of the right to use land associated with biodiversity conservation and management under the terms of these agreements. Furthermore, the mineral and petroleum royalty regime came into effect in two phases: Section 1 of the Royalty Act came into effect on November 1, 2009, and the rest of the Royalty Act came into effect on March 1, 2010. Variable royalty rates will apply according to two separate formulae for refined and unrefined minerals. The tax base is gross sales less certain expenses.
During the 2013 legislative cycle, South Africa introduced new VAT rules on digital goods and services. Under these new rules, foreign suppliers of digital goods and services are required to register as VAT vendors as these suppliers provide digital goods and services to South African customers.
Previously, two sets of transaction taxes applied to trading in investment securities: (1) stamp duty, in the case of unlisted shares and (2) un-certificated securities tax, in the case of exchange-traded securities. To simplify administration and to eliminate anomalies created by this dual treatment, with effect from July 1, 2008, all secondary trading in shares (listed or otherwise) are, under the terms of the Securities Transfer Tax Act (replacing the Stamp Duties Act and Un-certificated Securities Tax Act), subject to a single securities transfer tax, at a rate of 0.25%. Amendments to simplify exemptions and clarify the impact on derivative products and partial disposals were also introduced.
Depreciation allowances, including the accelerated depreciation relief for urban development zones, are available to taxpayers that invest in (by erecting or refurbishing) any commercial or residential building within specified urban development zones. The allowance is deductible in the year the erected building or the refurbished part of the building is brought into use by the taxpayer for purposes of trade, and this depreciation relief will benefit owners, users or lessors of such buildings. The amount of the allowance is dependent on whether the taxpayer erects a new commercial or residential building or refurbishes an existing commercial or residential building. Taxpayers that erect a new commercial or residential building within a specified urban development zone will be allowed an 11-year write-off period. In addition, 20% of the cost to the taxpayer of the erection or extension of or addition to that building, which is deductible in the year of assessment during which that building is brought into use by that taxpayer solely for the purposes of that taxpayer’s trade and 8% of that cost in each of the 10 succeeding years of assessment. Depreciation relief has also been afforded to environmental production and post-production assets. Both sets of assets must be ancillary to the manufacturing process, of a permanent nature and utilised to fulfill environmental obligations. Environmental production assets are eligible for a 40:20:20:20 rate of depreciation, while the rate of relief for environmental post-production assets (e.g. dams or disposal facilities) is 5% per annum (i.e., a 20 year straight-line write off period).
130
A voluntary disclosure programme was introduced by the SARS from November 2010 to October 2011. This programme allowed taxpayers who had defaulted on their tax payments to make voluntary disclosure to the SARS and avoid additional tax, penalties and interest being levied against them. The taxpayer participating in the voluntary disclosure programme had to meet certain requirements, such as the SARS not having been aware of the default prior to the taxpayer being allowed to participate in the voluntary disclosure programme. Criminal prosecution will not be initiated against the non-compliant taxpayers but the full amount in default will still have to be paid. The relief will apply to those who defaulted on their tax before February 17, 2011.
Revenue
Revenue Outcomes and revised estimates
The revenue outcome for 2014/15, revised estimates for 2015/16 and the estimates for 2016/17 are presented in the table below. Projected revenues from corporate income tax and VAT have underperformed for the first half of the current fiscal year, and have been revised downwards. Personal income tax (PIT) collection has been stronger, supported by above-inflation wage settlements and higher marginal tax rates.
The tax revenue outcome for 2014/15 was R986 billion, a 9.6% increase on collections in 2013/14 and R7.3 billion higher than the 2015 Budget target. Revenue was higher than projected largely due to strong growth in PIT as a result of less-than-full fiscal drag relief and fairly high wage growth, particularly for high-income earners. Large one-off payments arising from the disposal of share options also had a material effect on PIT collection in the year. Overall, gross tax revenue has been revised downwards by R7.6 billion in 2015/16, R14.6 billion in 2016/17 and R12.4 billion in 2017/18 compared with the projections tabled in the 2015 Budget.
Consolidated Government Revenue
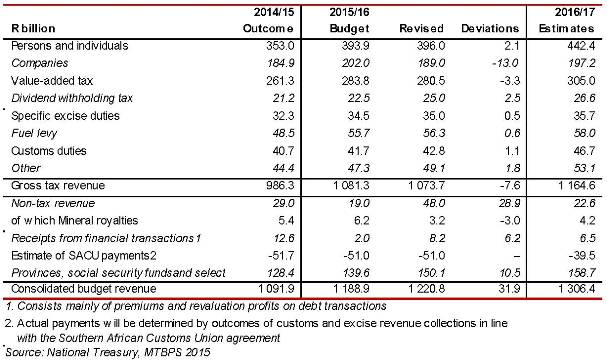
131
Financing
The following table sets forth the financing of the net borrowing requirement of the National Government for the six fiscal years ended March 31, 2015 and estimated amounts for the fiscal year ending March 31, 2016.
Financing of the Net Borrowing Requirement of the National Government
| | | | | | | | | | | | | | | | | | | | | | | | | | | | |
| | | 2010 | | | 2011 | | | 2012 | | | 2013 | | | 2014 | | | 2015 | | | Revised
estimate
2016(3) | |
Borrowing | | | | | | | | | | | | | | | | | | | | |
Revenue | | | 586,113.1 | | | | 672,751.5 | | | | 745,292.2 | | | | 799,761.7 | | | | 887,265.1 | | | | 963,560.6 | | | | 1,070,664.5 | |
Expenditure | | | 747,868.0 | | | | 805,979.1 | | | | 889,911.5 | | | | 965,495.6 | | | | 1,047,758.6 | | | | 1,131,951.8 | | | | 1,246,929.6 | |
Main Budget balance(1) | | | (161,754.9 | ) | | | (133,227.7 | ) | | | (144,619.3 | ) | | | (165,733.9 | ) | | | (160,493.5 | ) | | | (168,391.2 | ) | | | (176,265.2 | ) |
% of GDP | | | (6.6 | )% | | | (4.8 | )% | | | (4.9 | )% | | | (5.2 | )% | | | (4.7 | )% | | | (4.4 | %) | | | (4.3 | %) |
Financing | | | | | | | | | | | | | | | | | | | | |
Domestic short-term loans (net) | | | 49,770.3 | | | | 34,893.0 | | | | 18,724.6 | | | | 22,555.0 | | | | 23,048.0 | | | | 9,569.0 | | | | 13,000.0 | |
Domestic long-term loans (net) | | | 118,855.8 | | | | 136,849.8 | | | | 138,500.8 | | | | 125,767.8 | | | | 149,414.1 | | | | 157,014.0 | | | | 144,944.0 | |
Market loans | | | 132,794.3 | | | | 150,292.0 | | | | 154,860.9 | | | | 161,554.2 | | | | 172,112.2 | | | | 192,414.0 | | | | 174,979.0 | |
Loans issues for switches | | | (399.4 | ) | | | 93.4 | | | | (753.0 | ) | | | (3,848.3 | ) | | | (1,135.3 | ) | | | (1,160.0 | ) | | | (2,479.0 | ) |
Redemptions | | | (13,539.1 | ) | | | (13,535.6 | ) | | | (15,607.1 | ) | | | (31,938.1 | ) | | | (21,562.8 | ) | | | (34,240.0 | ) | | | (27,556.0 | ) |
Foreign loans (net) | | | 23,257.5 | | | | 2,839.6 | | | | 9,135.3 | | | | (11,622.0 | ) | | | 377.8 | | | | 8,357.0 | | | | 9,464.0 | |
Market loans | | | 30,872.4 | | | | 5,151.1 | | | | 12,025.2 | | | | — | | | | 19,619.1 | | | | 22,952.0 | | | | 13,110.0 | |
Arms procurement loan agreements | | | 800.0 | | | | 470.4 | | | | 569.4 | | | | 60.6 | | | | — | | | | — | | | | | |
Redemptions (including revaluation of loans) | | | (8,414.9 | ) | | | (2,781.9 | ) | | | (3,459.3 | ) | | | (11,682.6 | ) | | | (19,241.3 | ) | | | (14,595.0 | ) | | | (2,012.0 | ) |
Change in cash and other balances(2) | | | (30,128.7 | ) | | | (41,354.7 | ) | | | (21,741.4 | ) | | | 29,033.1 | | | | (12,346.4 | ) | | | (6,548.8 | ) | | | 8,857.2 | |
| | | | | | | | | | | | | | | | | | | | | | | | | | | | |
Total | | | 161,754.9 | | | | 133,227.7 | | | | 144,619.3 | | | | 165,733.9 | | | | 160,493.5 | | | | 168,391.2 | | | | 176,265.2 | |
| | | | | | | | | | | | | | | | | | | | | | | | | | | | |
Notes: —
| (1) | A negative number reflects a deficit and a positive number a surplus. |
| (2) | A positive change indicates a reduction in cash balances. |
| (3) | Numbers as published during the October 2015 MTBPS |
Source: South African National Treasury.
In addition to transfers received from the National Budget and their own provinces’ revenue collections, Provincial Budgets are financed by means of opening balances and concessionary and non-concessionary funding such as loans by the DBSA. The deficit of the National Budget is financed mainly by domestic and foreign loans. The provinces are barred constitutionally from raising loans for current expenditure. Loans for bridging finance may be advanced, however, provided that the provinces redeem such loans within 12 months following the date on which they are obtained, and any special conditions be specified in an act of Parliament which is required to be recommended by the Financial and Fiscal Commission. In addition, the National Government may not guarantee any provincial or local government loans, unless the guarantee complies with the norms and conditions for such guarantee as set out in an act of Parliament. See “Public Finance — Background.”
132
Public Enterprises
The National Government owns a number of public enterprises (otherwise known as state-owned entities). The ministers under whose departments these enterprises fall act as the “Executive Authority” over these entities, taking up the role of shareholder on behalf of government. The ministers that act as the Executive Authority include the Minister of Public Enterprises, the Minister of Communications, the Minister of Energy, the Minister of Transport and various other ministers of the National Government.
The Executive Authority oversees the operations of the public enterprise, including the appointment of board members, the entering into of shareholder compacts with the public enterprise, approving major transactions, and the monitoring of performance. The National Treasury is responsible for financial oversight over all the public enterprises, including the review of major transactions, funding requests and applications for guarantees.
Parliament plays a significant role in the oversight of public enterprises through a number of committees that have been assigned responsibility for oversight over public enterprises. These committees include the Parliamentary Portfolio Committee on Public Enterprises, which is responsible for oversight over the Department of Public Enterprises and the key public enterprises that report to the department, the Parliamentary Portfolio Committees responsible for oversight of the various sectors in which public enterprises operate, and the Select Committee on Public Accounts, which is responsible for financial oversight.
The infrastructure investment program/programs of the public enterprises are aimed at delivering infrastructure to enhance economic growth and alleviate poverty. Public enterprises are expected to invest R313 billion over the next three MTEF year periods ending 2017/18. The main public enterprises responsible for delivering this growth are the electricity utility Eskom, the freight transportation company Transnet, the national oil company the Petroleum, Oil and Gas Corporation of South Africa (Pty) Limited (PetroSA), which is a subsidiary of the Central Energy Fund, and the South African National Roads Agency Limited (SANRAL).
The National Government has issued formal contractual guarantees in respect of certain indebtedness of the public enterprises, inter alia to support the capital investment program/programs of the public enterprises. Such guarantees are issued in accordance with the Public Finance Management Act (PFMA). All guarantees are issued jointly by the Minister of Finance and Executive Authority for the relevant public enterprise in terms of the PFMA. The National Government’s aim is for public enterprises to borrow on the strength of their own balance sheets without explicit recourse from the National Government. However, if a clear need for shareholder support is identified, a guarantee for a public enterprise may be provided on application. In such applications, the public enterprise is required to provide a sound business case, ensuring long-term financial sustainability. In extending guarantees, the National Government remains mindful of the guideline of 60% of GDP that has been set for total debt, provisions and contingent liabilities.
Over and above Eskom, Transnet and SANRAL, who have guarantees from the National Government, the current status of some of the more significant public enterprises over the last four fiscal years is set out below.
133
Guarantees of Public Enterprises
| | | | | | | | | | | | | | | | | | | | | | | | | | | | | | | | |
| | | 2011/12 | | | 2012/13 | | | 2013/14 | | | 2014/15 | |
| | | Total
guarantee
amount | | | Total
exposure
amount | | | Total
guarantee
amount | | | Total
exposure
amount | | | Total
guarantee
amount | | | Total
exposure
amount | | | Total
guarantee
amount | | | Total
exposure
amount | |
| | | Rand (million) | |
Eskom | | | 350,000 | | | | 77,230 | | | | 350,000 | | | | 103,523 | | | | 350,000 | | | | 125,125 | | | | 350,000 | | | | 149,944 | |
SANRAL | | | 39,943 | | | | 19,426 | | | | 38,687 | | | | 19,482 | | | | 38,957 | | | | 23,866 | | | | 38,947 | | | | 32,436 | |
TCTA | | | 25,461 | | | | 19,886 | | | | 25,530 | | | | 20,460 | | | | 25,669 | | | | 20,516 | | | | 25,590 | | | | 20,807 | |
DBSA | | | 28,931 | | | | 25,692 | | | | 28,589 | | | | 25,621 | | | | 29,631 | | | | 25,747 | | | | 12,857 | | | | 4,135 | |
IDC | | | 1,824 | | | | 647 | | | | 2,146 | | | | 575 | | | | 1,820 | | | | 504 | | | | 1,620 | | | | 344 | |
Land Bank | | | 3,800 | | | | 1,093 | | | | 1,893 | | | | 893 | | | | 3,500 | | | | 1,097 | | | | 6,600 | | | | 2,098 | |
Denel | | | 1,850 | | | | 1,850 | | | | 1,850 | | | | 1,850 | | | | 1,850 | | | | 1,850 | | | | 1,850 | | | | 1,850 | |
PRASA | | | 1,400 | | | | 264 | | | | 1,400 | | | | 133 | | | | 1,220 | | | | 92 | | | | 1,217 | | | | 48 | |
SAA | | | 2,900 | | | | 1,300 | | | | 7,906 | | | | 2,238 | | | | 7,901 | | | | 5,010 | | | | 14,394 | | | | 8,419 | |
Transnet | | | 3,500 | | | | 3,975 | | | | 3,500 | | | | 3,757 | | | | 3,500 | | | | 3,757 | | | | 3,500 | | | | 3,757 | |
SABC | | | 1,000 | | | | 889 | | | | 1,000 | | | | 167 | | | | 1,000 | | | | — | | | | — | | | | — | |
SA Express | | | — | | | | — | | | | — | | | | — | | | | 539 | | | | 539 | | | | 1,106 | | | | 539 | |
SAPO | | | — | | | | — | | | | — | | | | — | | | | — | | | | — | | | | 1,940 | | | | 270 | |
SARB | | | — | | | | — | | | | — | | | | — | | | | — | | | | — | | | | 7,000 | | | | — | |
Telkom | | | 248 | | | | 85 | | | | 284 | | | | 90 | | | | 356 | | | | 110 | | | | 227 | | | | 100 | |
Other Entities | | | 3,567 | | | | 1,587 | | | | 4,219 | | | | 1,449 | | | | 2,535 | | | | 1,355 | | | | 2,560 | | | | 1,147 | |
| | | | | | | | | | | | | | | | | | | | | | | | | | | | | | | | |
Total | | | 464,424 | | | | 153,924 | | | | 467,004 | | | | 180,239 | | | | 468,478 | | | | 209,568 | | | | 469,408 | | | | 225,894 | |
| | | | | | | | | | | | | | | | | | | | | | | | | | | | | | | | |
| Source: | South African National Treasury |
Eskom Limited (Eskom)
Eskom is a state-owned company responsible for electricity generation, transmission and distribution in South Africa. Eskom generates approximately 95.0% of electricity used in South Africa and approximately 45.0% of the electricity is used in Africa. Eskom directly provides electricity to about 45.0% of all end-users in South Africa. The other 55.0% is resold by redistributors (including municipalities).
While most of Eskom’s business is within South Africa, the company also buys and sells electricity in the SADC region. Eskom’s involvement in African markets beyond South Africa is currently limited to projects that have a direct impact on securing supply of electricity for South Africa. Eskom is investigating additional opportunities in the SADC region.
Eskom’s capital expenditure (capex) programme is well underway. Eskom has committed to a capital expansion programme of R293 billion for the five-year period to 2019/20 and has consistently spent over R50 billion per annum on capex in the past three years. Key achievements of the programme include the first synchronisation of Medupi unit 6 achieved on March 2, 2015, with commercial operation achieved in August 2015.
134
In line with NERSA’s allowed a price increase of 8.0% per annum over the third multi-year price determination (MYPD3) period, which was lower than the 16% that Eskom had applied for, Eskom had to reduce and reprioritize expenditure in some areas. Eskom is targeting to deliver cost savings of R60 billion over the MYPD3, 2013/14 to 2017/18, period through their Business Productivity Programme (BPP).
The Board has approved an updated borrowing programme of R237 billion, covering the period April 1, 2015 to March 31, 2020. Funding raised during the year ending March 31, 2015 amounted to R49.5 billion (2013/14: R43 billion). Over the MYPD3 period, Eskom will continue to be reliant on government support through the R350 billion guarantee facility that the Government has made available, of which Eskom had utilised R165 billion as at September 31, 2015. In line with the Government Support Package announced in September 2014, the Government will be providing R23 billion of funding to Eskom during 2015/16. On July 31, 2015, the first R10 billion tranche was transferred to Eskom, with a further R10 billion to be transferred in December 2015 and the last R3 billion in March 2016. In addition, a R60 billion subordinated loan was approved by the Government in 2008; in 2014, the loan was converted to equity. These measures served to strengthen Eskom’s financial position.
Group revenue for the year increased by 7% to R147.7 billion (2013/14: R138.3 billion), reflecting the impact of the 8% tariff increase partially offset by lost sales due to depressed commodity prices and load-shedding. Primary energy costs continue to escalate, with costs increasing 20% on prior year to R83.4 billion, mainly due to penalties incurred by Eksom under its take-or-pay coal contract for Medupi and heavy reliance on Open Cycle Gas Turbines (OCGTs). Net profits for the year were R3.7 billion (2013/14: R7.0 billion). Cash and cash equivalents as at March 31, 2015 amounted to R8.9 billion.
During 2014/15, electricity supply constraints as a result of poor plant performance and delays in the commissioning of new power stations were experienced that resulted in rolling load-shedding. Eskom is strengthening its maintenance programme with the aim of improving plant performance. Simultaneously, the Government, in partnership with Eskom, has been working to improve demand side management, whilst seeking to augment electricity supply through procuring power from Independent Power Producers (IPPs).
On August 3, 2011, the Department of Energy (DoE) officially launched the Renewable Energy Independent Power Producers Purchase Programme (REIPPPP), in line with government policy (White Paper on Energy of 1998) to introduce up to 30% of new generation capacity from IPPs. Initially, a determination was made that 3,921 megawatts (MW) of renewable energy technologies be brought into commercial operation between mid-2014 and the end of 2018. During 2015, the total determination for renewables has been increased to 13,225MWs to date. There have been three approved bid submission phases termed “bid window” (BW) under the REIPPPP:
| | • | | The first bid submission (BW1) date was November 4, 2011, where 28 preferred bidders were selected to provide 1,425MW of contracted capacity. |
| | • | | The second bid submission (BW2) date was March 5, 2012, where 19 preferred bidders were selected to provide 1,040MW of contracted capacity. |
| | • | | The third bid submission (BW3) date was August 19, 2013, where 17 preferred bidders were selected to provide 1,456MW of contracted capacity. |
Bid windows 3.5 and 4 are currently in the final phases of being concluded. In total 1,860MW has already been commissioned from the first bid windows, supplementing the country’s electricity supply.
Through the IPP programme the DoE is currently in the process of procuring additional renewable energy, coal, gas and cogeneration capacity from the private sector. Requests for proposals to procure 2,500 MW of coal power and 3,126MW of gas power have already been issued.
135
In March 2011, the Cabinet approved the Integrated Resource Plan (IRP 2010), which is a 20-year plan for balancing electricity supply and demand. The country aims to double its electricity generation capacity from 40,000MW to 80,000MW by 2025, ensuring that the economy benefits from a reliable supply of electricity. In the plan it is anticipated that the proportion of coal in South Africa’s generation mix will decrease steadily in favor of renewable energy and nuclear power. The IRP 2010 is in the process of being revised by the DoE in consultation with the relevant stakeholders
Transnet SOC Limited (Transnet)
Transnet is a public company, wholly-owned by the South African Government, and is the custodian of rail, ports and pipelines infrastructure in South Africa. Transnet is responsible for enabling the competitiveness, growth and development of the South African economy through delivering reliable freight transport and handling services. Transnet has five operating divisions:
| | • | | Freight Rail, the largest of the five operating divisions, operates 20,500 kilometers of rail network across South Africa which transports bulk, break-bulk and containerized freight. The rail network and rail services provides strategic links between the mines, production hubs, distribution centres and ports, and connects with the cross-border railways of the region. |
| | • | | Transnet Engineering provides refurbishment, maintenance, upgrades and manufacturing services of rolling stock and specialized equipment for the other operating divisions of Transnet as well as external clients. It also houses the company’s research and development unit to capture opportunities for technology innovation. |
| | • | | Transnet National Ports Authority provides port infrastructure and marine services at the eight commercial seaports in South Africa. The division’s core functions include the planning, provision, maintenance and improvement of port infrastructure. |
| | • | | Transnet Port Terminals provides cargo-handling services at the ports which is critical in supporting the South African Government’s export-led growth strategy. |
In addition, Transnet has operations in Lesotho, Namibia, Swaziland and Mozambique and it plans to expand further into the rest of Africa. The tariffs charged by the National Ports Authority and Pipelines are determined by independent regulators, namely the Port Regulator and the National Energy Regulator of South Africa.
Transnet adopted the Market Demand Strategy (MDS) in 2012 which is currently in its fourth year of implementation. The strategy is aimed at creating capacity ahead of demand with the capital investment programme. The capital investment plan was initially estimated to be R300 billion over the initial seven-year period. However, with the MDS now in its fourth year this has been revised to R336.6 billion over the next seven years. The programme is expected to reduce the cost of doing business in South Africa and facilitate the switch from road transport to rail in order to reduce carbon emissions. The infrastructure upgrades and expansion will improve efficiency and address the current capacity constraints. The majority of the capital expenditure will be dedicated to the rail sector. Transnet’s focus in the rail sector is to increase rail market share by stabilizing and optimizing existing flows and targeting the migration of rail-friendly commodities from road to rail. Transnet Freight Rail maintains a 98% share of the mining bulk exports market, 30% of the intermodal sector and 46% of the general freight bulk.
Transnet’s revenue for fiscal year 2015 increased by 8% to R61.2 billion (2014: R56.6 billion), mainly as a result a 13.5% increase in minerals and chrome; a 10.7% increase in iron ore and manganese; as well as an 8.1% increase in port bulk and break-bulk. Port container volumes increased by 6.3% and petroleum volumes increased by 4.4%.
136
In the period under review, Freight Rail contributed 52% of the revenue generated by the group and Transnet Engineering contributed 17%. Pipelines contributed the least to revenue, accounting for only 4% of Transnet’s revenue. Earnings before interest, taxation, depreciation, impairment and amortization (EBITDA) increased by 8.2% to R23.6 billion (2014: R23.6 billion), resulting in the EBITDA margin remaining steady at 41.8% for 2014 and 2015.
A significant component of the investment plan is geared towards infrastructure, sustainability and capacity creation to support Transnet’s strategic objectives. In 2015, Transnet capital expenditure was R33.6 billion, of which R14.5 billion was deployed for expansionary projects and R19.1 billion to maintain operations. The key capital investment highlights are:
| | • | | Locomotives – concluded locomotive contracts that will result in the acquisition of 1,064 locomotives. R6.9 billion has been spent on this project, and 147 locomotives have been received. |
| | • | | Wagons – Transnet built 2,700 wagons through Transnet Engineering in collaboration with Transnet Freight Rail. The group has spent R3 billion on this project. |
| | • | | Coal line expansion up to 81.0mt – A total of R414 million was invested in the coal line expansion to upgrade yards, lines and electric equipment; |
| | • | | Port infrastructure, equipment and floating crafts – The group has invested R1.4 billion for the maintenance and acquisition of cranes, dredgers, tugs and straddle carrier; |
| | • | | New Multi-Product Pipeline (NMPP) – NMPP is a strategic investment aimed at securing supply of petroleum products from coastal terminals in Durban to inland markets. At the end of March 2015, R23.9 billion had been invested in the project. |
Transnet’s borrowings increased to R110.4 billion in 2014/2015 year, which was an increase of R19.9 billion from 2013/2014 borrowings. Transnet used domestic funding sources as well as foreign sources. Domestic funding sources were mainly commercial paper, bank loans and domestic bonds. Foreign funding sources included Development Finance Institutions, Export Credit Agencies as well as Eskom’s Global Medium-Term Note (GMTN). The majority of the funds were used for the capital expenditure programme of which Transnet Freight Rail received the majority of the funds which were used for the acquisition of the 1,064 locomotives.
PetroSA
PetroSA is a wholly-owned subsidiary of the Central Energy Fund (CEF), which in turn is wholly-owned by the State. The Department of Energy acts as PetroSA’s executive authority. PetroSA was formed in 2002 upon the merger of Soekor E and P (Pty) Limited, Mossgas (Pty) Limited and parts of the Strategic Fuel Fund. PetroSA plays a role in the development of the energy sector in South Africa in support of the broader CEF mandate of ensuring security of energy supply.
PetroSA’s core activities include:
| | • | | Exploration and production of oil and natural gas; |
| | • | | Participation in and acquisition of local as well as international upstream petroleum ventures; |
| | • | | Production of synthetic fuels from offshore gas at the Gas-To-Liquids (GTL) refinery in Mossel Bay; |
| | • | | Development of domestic refining and liquid fuels logistical infrastructure; and |
| | • | | Marketing and trade of oil petrochemicals. |
137
Moreover, PetroSA operates the FA-EM, South Coast gas fields as well as the Oribi and Oryx oil fields. The producing gas fields provide feedstock to the Mossel Bay GTL refinery. PetroSA is also exploring alternative feedstock supply given the depletion of its gas reserves in the FA-EM field. Outside South Africa, the company has exploration acreage in Equatorial Guinea and Namibia. PetroSA’s GTL refinery produces ultra-clean, low-sulphur, low-aromatic synthetic fuels and high-value products converted from natural methane-rich gas and condensate using a unique GTL Fischer Tröpsch technology. Key commodities produced include unleaded petrol, kerosene (paraffin), diesel, propane, liquid oxygen and nitrogen, distillates, eco-fuels and alcohols. Its world-class synthetic fuels and petrochemicals are marketed internationally.
PetroSA operates the following main divisions:
| | • | | Products and Sales: The Trade, Supply and Logistics (TS&L) division is responsible for marketing and selling products and services to customers in South Africa and abroad. |
| | • | | Petrochemicals: PetroSA produces several chemicals at its GTL plant in Mossel Bay. These synthetic chemicals fall into two main groups: alcohols and low-aromatic distillates. These products are placed locally and internationally. |
| | • | | Crude Oil: PetroSA produces crude from its Oribi and Oryx oil fields, located in Block 9, off the coast of SA. It is estimated that the fields produce 1,800 barrels of oil per day. |
| | • | | Commercial Business: In 2006, PetroSA established its Commercial Business in order to facilitate opportunities for players within the petroleum industry from a previously disadvantaged background. Initially, the unit focused on black economic empowerment wholesalers and later expanded its focus to include liquid petroleum gas (LPG). |
Group revenue for the year declined by 21% to R18.5 billion (2013/14: R21.6 billion), mainly due to a reduction in the availability of feedstock for the GTL plant as well as the significant decline in crude oil prices. Lower-than-anticipated yield from the F-O fields has led to the importation of finished product to meet demand, and thus the substitution of a high-margin product with a lower-margin product.
Group results were also affected by the total impairment of R14.4 billion recognized in the year (2013/14: R3.4 billion), relating to the GTL facility (R11.7 billion) as well as the Jubilee and TEN development fields (PetroSA Ghana, R2.7 billion). This was a direct impact of declining oil prices and feedstock challenges plaguing the group.
Despite the recent trend of declining cash balances, reserves remain stable at R10 billion. The group will continue to advance investments in clean energy and explore other avenues such as monetizing tail gas in the near future, amongst other things.
For the 2014/15 financial year the group did not undertake any long term domestic borrowings and has no immediate plans to borrow in the domestic capital market. The group settled the R1.6 billion, in the foreign market, which was raised to partly fund the acquisition of PetroSA-Ghana. The loan was secured by a cash collateral of about R1.7 billion.
ACSA
Airports Company South Africa (ACSA) is a state-owned company (74.6% is owned by the South African Government through the Department of Transport, whilst the Public Investment Corporation SOC Ltd owns 20%, Empowerment Investors hold 4.21%, and Staff through the Employee Share Option Scheme the remaining 1.19%). The company is legally and financially autonomous and operates under commercial law. ACSA is mandated to own and operate South Africa’s nine principal airports, including the three major international airports at Johannesburg, Cape Town and Durban (King Shaka). As a result, ACSA is responsible for processing approximately 90% of all passengers departing on commercial airlines from airports within South Africa. ACSA has a 30-year concession and a 20-year concession to develop, operate and maintain the Mumbai and Guarulhos International Airports respectively. ACSA earns consultancy fees and return on equity from these investments.
138
The ACSA Group derives revenue from two streams, aeronautical and non-aeronautical revenue streams accounting for 63% and 37%, respectively, of the Group’s revenue in the 2014/15 financial year. The former is derived from regulated charges, which consists of aircraft landing and parking charges, and passenger service charges. The non-aeronautical income is derived from commercial undertakings including retail operations, car rental concessions, property leases, car parking, hotel operations and advertising. Another component of non-aeronautical revenue is generated from international operations. The company aims to increase its non-aeronautical revenue from the current 37% of total revenue to 50% in the medium term. ACSA, in partnership with the Brazilian company Invepar, was successful in a bid to manage the development, maintenance and operation of Guarulhos International Airport in Sao Paulo, Brazil. The consortium owns 51.0% of the airport concession, with 49.0% being held by Infraero, the current airport operator. ACSA owns 20% of the consortium with Invepar. Recently ACSA and Munich Airport have established a partnership aimed at sharing knowledge and experiences.
ACSA’s revenue increased by 8.9% to R7.8 billion (2014: R7.1 billion), this was driven by double-digit non-aeronautical growth of 10.4% and a solid aeronautical growth of 8.0%. ACSA experienced an increase in departing passenger numbers from 17.4 million to 17.8 million in the current year, despite the moderate economic climate and weak growth rate experienced in South Africa. ACSA’s net profit for the year amounted to R1.6 billion, 8.5% below the prior year profit of R1.7 billion. The decline in profit is as a result of higher taxes. There was a reduction in finance costs due to the early debt redemption strategy (EDR) to settle interest-bearing debt.
The balance sheet of the company remains in good shape with net equity of R14.0 billion (2014: R12.6 billion). ACSA’s liquidity position improved to 1.37 times from 1.04 times in 2015. The interest cover ratio strengthened to 2.8 times from 2.5 times in the prior year, also as a result of the accelerated repayment strategy.
The ACSA Group is not planning to undertake new borrowings in 2015/16 and 2016/17 given its low level of planned investments. ACSA adopted an EDR strategy that aims to negotiate with lenders the possibility of early settlement of outstanding debts given the entity’s favourable cash position, which increased by 20.9% to R1.2 billion (2014: R1.0 billion) against a backdrop of modest investment plans. The entity’s corporate plan indicates that the entity will only require external funding during the 2017/2018 financial year and this is expected to be secured from the domestic capital markets. The entity has interest-bearing debt amounting to R11.2 billion (2013: R13.0 billion) and plans to repay R703 million during the 2015/16 financial year. The entity’s cash surpluses are invested in domestic money markets instruments and bank accounts. The entity redeemed approximately R1.9 billion of outstanding interest-bearing debt in 2014/2015 of which R1.2 billion was part of the EDR strategy and R700 million was settlements of maturing debt.
The 2014/15 capital expenditure amounted to R826 million which represented a decline of 11% from the R928 million in the prior year. ACSA’s current infrastructure programme provides for the continuation of its operation, ensuring efficient refurbishment and replacement of existing infrastructure. There are no major capital investment programs to increase or add new capacity planned until at least 2016/17.
139
SANRAL
SANRAL is responsible for the planning, design, construction, rehabilitation and maintenance of South Africa’s national road network to support socio-economic development. The national road system connects all the major centers in the country to each other and to neighboring countries. The South African road network comprises approximately 754,600 kilometers of roads, of which 21,403 kilometers is the national road network. The national highway network currently consists of 16,170 kilometers, which is expected to grow to 35,000 kilometers. South Africa has the longest road network of any country in Africa.
In accordance with the SANRAL Act (1998), the agency is responsible for toll and non-toll roads. These operations are funded separately. Non-toll roads are funded by government allocations, and are not allowed to be cross-subsidized from toll road income, and vice versa. Toll operations can be divided into two types—those funded by SANRAL itself and operated on its behalf, and roads concessioned to private parties under public-private partnerships. Hence SANRAL’s revenue comes from two primary sources: grants from the National Government for all non-toll roads, and the tolling revenue received from toll roads.
During the reporting period, SANRAL awarded 200 contracts worth R14.4 billion for new works, rehabilitation, improvement, professional consulting engineering, maintenance, community development and other activities. A total of R3 billion was spent on contracts with Small, Micro and Medium Enterprises (SMMEs). SANRAL’s skills development programme trained 4,000 people in road construction projects and created 20,000 jobs. SANRAL also awarded 45 contracts worth about R903 million to professional consulting engineering companies to design and supervise road and bridge works.
SANRAL’s creditworthiness is rated and published by Moody’s Investor Service. SANRAL’s international rating was downgraded in September 2013 to Baa3 (long-term) and P-3 (short-term) with a negative outlook. The downgrade was a result of uncertainty and resistance to the implementation of electronic tolling (e-tolling) on the Gauteng network. On June 27, 2014, this outlook improved to “stable”, however this was not sustained. In January 2015, the establishment of the e-toll review panel resulted in the outlook being dropped to negative. Following the outcome of the work of the review panel, the Deputy President has since announced the new e-toll dispensation which is currently being implemented, but this is not yet reflected in the entity’s credit rating.
SANRAL’s debt stock amounted to R47.11 billion (2014: R39.83 billion) as at the end of the 2015 financial year. The increase in the entity’s borrowing requirement was largely driven by a sharp decline in e-toll collections. Funding via the debt capital markets remained the main source of financing for the entity. Capital market debt funding accounted for 95% of total debt funding facilities as at March 31, 2015. SANRAL’s debt level is expected to grow to R66.8 billion, should e-toll collection continue to prove less favourable than projections in the short to medium term.
Trans-Caledon Tunnel Authority (TCTA)
The TCTA was established in 1986. The entity is a specialized liability management entity responsible for bulk raw water infrastructure development. TCTA was originally established to implement a single project, the Lesotho Highlands Water Project (LHWP). In March 2000, TCTA’s notice of establishment was amended to allow for the Minister of Water Affairs (now Minister of Water and Sanitation) to issue directives to TCTA in terms of the National Water Act and the entity has since evolved into being responsible for multiple projects. To date the following directives have been received:
| | • | | Lesotho Highlands Water Project – Delivery tunnel and subsequently fulfillment of the Republic’s financial obligations arising from its treaty with Lesotho signed in 1986 (includes both Phase 1 and Phase 2); |
140
| | • | | Advisory services to Umgeni Water, Water Management Institutions, Water Boards and the Department of Water and Sanitation (DWS); |
| | • | | Berg Water Project (BWP) ; |
| | • | | Vaal River Eastern Subsystem Project (VRESAP); |
| | • | | Refurbishment of Mooi-Mgeni Transfer Scheme Phase 1* (MMTS1) and implementation of Phase 2* (MMTS2); |
| | • | | Olifants River Water Resources Development Project Phase 2C and subsequently, all the remaining phases* (ORWRDP); |
| | • | | Komati Water Scheme Augmentation Project (KWSAP); |
| | • | | Mokolo-Crocodile Water Augmentation Project Phase 1 and 2 * (MCWAP 1 and MCWAP 2); |
| | • | | Metsi Bophelo Borehole Project; |
| | • | | Short term solution to Acid Mine Drainage* (AMD); and |
| | • | | Coordination of Strategic Infrastructure Project 3 and 18* (SIP3 and 18) |
| | • | | Off-take to the town of Kriel from the Komati Water Supply Augmentation Project |
| * | Implementation of these projects is still ongoing |
The LHWP is funded under a R43 billion sovereign guarantee. The initial R25 billion guarantees provided for LHWP Phase 1 was increased to cover the activities of LHWP Phase 2 and the short term solution to Acid Mine Drainage (AMD) in the Vaal River area. Commercial funding for the rest of the projects is secured on the basis of income agreements between TCTA and DWS and these determine how costs may be charged on each project.
The total value of bonds issued increased from R18.6 billion in 2014 to R18.9 billion in 2015. This is primarily due to the increase in the CPI which resulted in an increase of R378 million in the WS05 CPI-linked bond. There was also an increase in funding utilised from commercial banks from R6.9 million in 2014 to R7.8 billion in 2015. Funding from commercial banks has increased by 3% in the current year, primarily related to drawdowns on loans utilised on MMTS 2 and MCWAP 1.
In the year under review, TCTA corrected a prior period error in its financial statements as a result of a change in a technical interpretation of its financial statements by its new auditors. There was also a decrease in the restated Tariff Receivable from R27 billion at March 31, 2014 to R26.5 billion at March 31, 2015 due to the reduction in Construction Revenue and Other Income earned during the current year, as the majority of the projects have reached final stages of completion. Construction costs are only actively being incurred on MCWAP and MMTS-2 which are still in progress.
Phase 2 of the Olifants River Water Resources Development Project (ORWRDP 2) involves the development of additional water resource infrastructure consisting of the De Hoop Dam on the Steelpoort. River and bulk raw water distribution infrastructure in the middle Olifants catchment. TCTA’s directive was initially for sub-phase 2C and this was recently expanded to include all the remaining sub-phases. Phase 2C comprises a 40.0 km pipeline from De Hoop Dam to Steelpoort and is currently under construction with water delivery anticipated for December 2015. Phase 2C has an estimated cost at completion of R2.3 billion and is fully funded through transfers from DWS. The funding is provided annually to TCTA in accordance with the construction programme.
141
The MMTS2 project seeks to augment the water supply to municipalities in the KwaZulu Natal province and includes the construction of the Spring Grove dam and associated water transfer systems. The dam was completed and handed over to DWA for operations and maintenance. Tariff billing commenced from July 1, 2012 following consultations with the users and approval by the then Minister of Water Affairs. The approved borrowing limit for the 2015 financial period is R1.988 billion of which R1.590 billion may be utilized at this point. Debt repayment is planned for March 2034. In the year under review, the tariff receivable was R25.5 million higher than expenditure whilst construction expenditure was R3.5 million lower. As a result, debt was R30 million lower than budgeted. Project funding is in place and the approved project budget is R2.066 billion. The cumulative expenditure as at year-end was R1.2 billion and the project remains within budget.
In terms of Acid Mine Drainage (AMD), TCTA’s involvement has been in the implementation of the short-term action plan in the affected basins of Witwatersrand Goldfields where the plan is to prevent the decanting of water and the breaching of the Environmental Critical Level. The Western Basin is operational and the construction of the Central Basin was completed in November 2013. The plant has been treating 72 Ml/day, however this has been reduced to 36 Ml/day to allow for slight modifications. Since the plant was declared operational, the basin has been drawn down by 15 metres. Construction on the Eastern Basin is scheduled to be ready for trial operations in February 2016. The AMD project budget for the short term solution is R2.6 billion while the operating costs budget is estimated at R666 million per annum. The project is being implemented within budget.
TCTA’s aggregate net cash inflows and outflows are expected to balance to nil at the end of each project, once all debt has been extinguished. The cash inflows of R7.1 billion for the year ended March 31, 2015 are marginally higher than the R6.9 billion inflows for 31 March 2014 and are made up of the tariff receivable from DWS, transfers from DWS for DWS-funded projects, drawdowns from loans, interest received and proceeds from the sale of financial assets.
TCTA continues to operate as a financially sound entity that is able to execute its projects in line with its mandate and with the Government’s development agenda.
South African Post Office (SAPO)
The SAPO State Owned Company (SOC) Act of 1958, and 2011 amendment, deals specifically with the establishment of SAPO as a state entity and corporate governance matters. SAPO is wholly-owned by the Government and its executive authority is the Department of Telecommunications and Postal Services.
The Postal Services Act of 1998 sets out the licensing requirements of SAPO as prescribed by the relevant regulatory body, the Independent Communications Authority of South Africa (ICASA). In terms of the licensing framework developed by ICASA, SAPO is the only operator licensed within the reserved market, which covers all mail under 1kg. SAPO’s license was issued in 2008. It is valid for a period of 25 years and is reviewed every three years in relation to SAPO’s performance in rolling out universal service obligations (USO) which include the rollout of postal addresses, points of presence and adherence to delivery targets. In the unreserved market, operators are required to register with ICASA, but there is no licensing framework. SAPO operates in both the reserved and unreserved market.
Lastly, the South African Postbank Limited Act, provides for the corporatisation of the Postbank, which is currently a division of SAPO. The Act allows for the transfer of the Postbank division to the Postbank Company. The Act further provides for the governance and functions of the Postbank once established as a company. In terms of the Act, SAPO will be the Postbank’s bank controlling company (BCC). There is currently a Section 12 application with the Registrar of Banks to enable the establishment of the Postbank as a bank in terms of the Banks Act.
142
SAPO’s current operating structure consists of:
| | • | | Mail: This consists of all services in the reserved market including philately, bulk mail, envelopes and local and international letters and parcels. Mail remains SAPO’s largest revenue contributor. |
| | • | | Retail: This includes access to photocopying machines, third party payments and motor vehicle licensing amongst other things. |
| | • | | Logistics: This includes freight, containers and courier. |
SAPO operates an expansive network of 2,487 service points, through which its services are extended to the general public.
SAPO, like most postal operators, has been experiencing a gradual decline in standard mail volumes; this has required that the entity revise its operating structure in line with the changing requirements of the sector. In order to facilitate a turnaround at SAPO, the Minister of Telecommunications appointed an administrator to run SAPO in November 2014. The administrator was also tasked with the development of a turnaround plan for SAPO.
SAPO is currently in the process of implementing its turnaround plan. Its progress is being monitored by the Department of Telecommunications and Postal Services and the National Treasury with the Deputy President also having oversight.
For the year ended March 31, 2015, SAPO recorded a net loss after tax of R1.49 billion (2013/14: net loss R406.7 million). This was as a result of revenues declining by 13% to R5.01 billion due to a protracted strike in 2014. The strike had a severe impact on revenues well beyond the end of the labour unrest as customers found alternative modes of distribution for their mail packages.
SAPO has been experiencing cash constraints but has been engaging several funding institutions to raise debt of R1.25 billion in order to meet its short- and longer-term funding requirements including the costs associated with the implementation of the turnaround plan. Thus far SAPO has secured R1.0 billion of the targeted debt and should be finalising the remaining requirement in the near term. The debt will be backed by an existing R1.67 billion State Guarantee.
The turnaround plan anticipates strong revenue growth by scaling up government business; strengthening non-banking financial services offerings to drive retail volumes; tapping into the fast growing SMME sector; growing e-Business revenue and growing major and large accounts through cross-selling. Thus far some government business has been secured while more business is aggressively being sought after. Some operations within the business have been streamlined, specifically within transport and property.
143
NATIONAL GOVERNMENT DEBT
General
The legal authorisation for the incurrence of debt by the National Government is set forth in the PFMA. The National Treasury administers the National Government debt of South Africa. In February of each year the annual budget is tabled in Parliament, including the government’s anticipated borrowing requirements and financing strategy for the current financial year and over the medium-term period (three years). Pursuant to Section 66 of the PFMA, the Minister of Finance needs to approve each issuance of debt. The PFMA also sets out for which purposes the Minister may borrow. There is no statutory cap on the stock of debt.
In addition to its direct indebtedness, the National Government is also a guarantor of certain third-party indebtedness. South Africa has issued formal contractual guarantees of certain indebtedness, primarily on behalf of partially or wholly state-owned entities. In this document, the National Government debt does not include debt that is guaranteed by the National Government. However, the guaranteed debt is summarised in the table entitled “Outstanding National Government Guaranteed Debt”. In addition, the National Government debt does not include debts incurred by the nine Provincial Governments.
In this section, “external debt” means debt initially incurred or issued outside South Africa, regardless of the currency of denomination, and “internal debt” means debt initially incurred or issued in South Africa. “Floating debt” means debt that had a maturity at issuance of less than one year. “Funded debt” means debt that had a maturity at issuance of one year or more.
The following table summarises the National Government debt as of March 31 in each of the years 2011 through 2015 and as of September 30, 2015.
| | | | | | | | | | | | | | | | | | | | | | | | |
| | | As of March 31, | | | As of
September 30, | |
| | | 2011 | | | 2012 | | | 2013 | | | 2014 | | | 2015 | | | 2015 | |
| | | Rand (million) | |
Government bonds | | | 733,438 | | | | 890,256 | | | | 1,038,849 | | | | 1,217,512 | | | | 1,399,409 | | | | 1,479,031 | |
Treasury bills | | | 136,150 | | | | 155,159 | | | | 171,985 | | | | 192,206 | | | | 202,217 | | | | 204,536 | |
| | | | | | | | | | | | | | | | | | | | | | | | |
Marketable internal debt | | | 869,588 | | | | 1,045,415 | | | | 1,210,834 | | | | 1,409,718 | | | | 1,601,626 | | | | 1,683,567 | |
Non-marketable internal debt | | | 23,133 | | | | 25,524 | | | | 30,300 | | | | 31,381 | | | | 30,459 | | | | 59,975 | |
| | | | | | | | | | | | | | | | | | | | | | | | |
Total internal debt | | | 892,721 | | | | 1,070,939 | | | | 1,241,134 | | | | 1,441,099 | | | | 1,632,085 | | | | 1,743,542 | |
Total external debt(1) | | | 97,851 | | | | 116,851 | | | | 124,555 | | | | 143,659 | | | | 166,831 | | | | 188,976 | |
| | | | | | | | | | | | | | | | | | | | | | | | |
Total gross loan debt | | | 990,572 | | | | 1,187,790 | | | | 1,365,689 | | | | 1,584,758 | | | | 1,798,916 | | | | 1,932,518 | |
Cash balances(2) | | | (170,163 | ) | | | (198,059 | ) | | | (184,082 | ) | | | (205,304 | ) | | | (214,709 | ) | | | (203,574 | ) |
Total net loan debt(3) | | | 820,409 | | | | 989,730 | | | | 1,181,607 | | | | 1,379,454 | | | | 1,584,207 | | | | 1,728,944 | |
| | | | | | | | | | | | | | | | | | | | | | | | |
GFECRA | | | (28,283 | ) | | | (67,655 | ) | | | (125,552 | ) | | | (177,913 | ) | | | (203,396 | ) | | | (203,396 | )(4) |
| | | | | | | | | | | | | | | | | | | | | | | | |
As percentages of nominal GDP: | | | | | | | | | | | | | | | | | | | | | | | | |
Net loan debt | | | 29.0 | % | | | 32.1 | % | | | 35.5 | % | | | 38.2 | % | | | 41.2 | % | | | 42.1 | % |
External debt | | | 3.5 | % | | | 3.8 | % | | | 3.7 | % | | | 4.0 | % | | | 4.3 | % | | | 4.6 | % |
As percentage of gross loan debt: | | | | | | | | | | | | | | | | | | | | | | | | |
External debt | | | 9.9 | % | | | 9.8 | % | | | 9.1 | % | | | 9.1 | % | | | 9.3 | % | | | 9.8 | % |
Notes:
| (1) | Valued using the applicable foreign exchange rates as at the end of each period. |
144
| (2) | This represents surplus cash of the National Revenue Fund on deposit at the commercial banks and the SARB. Bank balances in foreign currencies are revaluated using the applicable exchange rates as at the end of each period. |
| (3) | The total net loan debt is calculated with due account of the bank balances of the National Revenue Fund (balances of the National Government’s accounts with the SARB and with commercial banks). |
| (4) | Represents the balance on the GFECRA on March 31, 2015. A negative balance indicates a profit and a positive balance reflects a loss. |
Sources: South African National Treasury and the SARB.
Summary of Internal National Government Debt
Total internal National Government debt as of March 31, 2015 was R1,632 billion, an increase of 13.3% over the corresponding amount of R1,441 billion as of March 31, 2014.
The following table sets forth the total internal National Government debt, divided into floating debt and funded debt, for the periods indicated.
Gross National Government Internal Debt
| | | | | | | | | | | | | | | | | | | | | | | | |
| | | As of March 31, | | | As of
September 30, | |
| | | 2011 | | | 2012 | | | 2013 | | | 2014 | | | 2015 | | | 2015 | |
| | | Rand (million) | |
Marketable securities | | | | | | | | | | | | | | | | | | | | | | | | |
Floating | | | 136,150 | | | | 155,159 | | | | 171,985 | | | | 192,206 | | | | 202,217 | | | | 204,536 | |
Funded | | | 733,438 | | | | 890,256 | | | | 1,038,849 | | | | 1,217,512 | | | | 1,399,409 | | | | 1,479,031 | |
| | | | | | | | | | | | | | | | | | | | | | | | |
Total(1) | | | 869,588 | | | | 1,045,415 | | | | 1,210,834 | | | | 1,409,718 | | | | 1,601,626 | | | | 1,683,567 | |
| | | | | | | | | | | | | | | | | | | | | | | | |
Non-marketable securities | | | | | | | | | | | | | | | | | | | | | | | | |
Floating | | | 13,541 | | | | 13,256 | | | | 18,985 | | | | 21,813 | | | | 21,370 | | | | 51,177 | |
Funded | | | 9,592 | | | | 12,268 | | | | 11,315 | | | | 9,568 | | | | 9,089 | | | | 8,798 | |
| | | | | | | | | | | | | | | | | | | | | | | | |
Total(2) | | | 23,133 | | | | 25,524 | | | | 30,300 | | | | 31,381 | | | | 30,459 | | | | 59,975 | |
| | | | | | | | | | | | | | | | | | | | | | | | |
Total internal National Government debt | | | 892,721 | | | | 1,070,939 | | | | 1,241,134 | | | | 1,441,099 | | | | 1,632,085 | | | | 1,743,542 | |
| | | | | | | | | | | | | | | | | | | | | | | | |
Notes: —
| (1) | Treasury bills are classified as floating marketable securities. Government bonds are classified as funded marketable securities. |
| (2) | Borrowings from the Corporation for Public Deposits are classified as floating non-marketable securities. Retail government bonds (since May 2004), together with debt and liabilities of the former TBVC states and the Republic of Namibia that were assumed by the National Government in connection with South Africa’s transition to a constitutional democracy, are classified as funded non-marketable securities. |
Sources: South African National Treasury and SARB.
Summary of External National Government Debt
The Government borrows in the global market to partly finance its foreign currency commitments and to maintain a benchmark in major currencies. In 2014/15, the Government implemented a basket of strategic risk benchmarks to monitor the impact of refinancing, inflation and currency risks on its borrowing programme and debt portfolio. As part of these benchmarks, a limit of 15% is placed on the share of foreign currency debt as percentage of total debt. South Africa’s external National Government debt as a percentage of total debt remains low. External debt as a percentage of total gross loan debt decreased from 9.9% as of March 31, 2011 to 9.3% as of March 31, 2015.
145
The following table sets forth a breakdown of National Government external debt by currency as of March 31 in each of the years 2011 through 2015 and as of September 30, 2015.
External Debt by Currency
| | | | | | | | | | | | | | | | | | | | | | | | |
| | | As of March 31, | | | As of
September 30, | |
| Currency in which debt is held | | 2011 | | | 2012 | | | 2013 | | | 2014 | | | 2015 | | | 2015 | |
| | | (million) | |
Euro | | | 2,925 | | | | 2,735 | | | | 2,544 | | | | 1,126 | | | | 1,488 | | | | 1,428 | |
Pound Sterling | | | 105 | | | | 100 | | | | 83 | | | | 62 | | | | 44 | | | | 35 | |
Swedish Kroner | | | 5,959 | | | | 5,528 | | | | 4,858 | | | | 4,164 | | | | 3,469 | | | | 3,122 | |
US Dollars | | | 8,396 | | | | 9,842 | | | | 8,768 | | | | 10,696 | | | | 11,125 | | | | 11,090 | |
Yen | | | 60,988 | | | | 60,894 | | | | 60,800 | | | | 60,706 | | | | 60,612 | | | | 60,564 | |
| | | | | | | | | | | | | | | | | | | | | | | | |
Total (in Rand)(1) | | | 97,851 | | | | 116,851 | | | | 124,555 | | | | 143,659 | | | | 166,831 | | | | 188,976 | |
| | | | | | | | | | | | | | | | | | | | | | | | |
Note: —
| (1) | The conversion into Rand is calculated at the exchange rate published by the SARB on the last business day of the fiscal year. |
Source: South African National Treasury.
Foreign-currency bond issuances during 2014 were significant milestones for South Africa’s borrowing programme. The first dual-tranche international bond issue in July 2014 was well received in the dollar and euro capital markets. A dual-tranche bond issue combines various currencies and/or maturities in a single transaction, allowing an issuer to reach a broader range of investors. The 30-year US$1 billion note with a coupon rate of 5.375 per cent was priced at 220 basis points above the US Treasury benchmark bond. The 12-year €500 million note with a coupon of 3.75 per cent was priced at 225 basis points above the 12-year euro mid-swap rate. Both tranches were more than three times oversubscribed.
As announced in the 2014 Budget, South Africa entered the Sukuk market and raised US$500 million. The transaction was four times oversubscribed, with orders of US$2.2 billion, marking continued progress in efforts to broaden South Africa’s investor base.
South Africa’s ability to raise foreign debt currency on favorable terms is impacted by its credit ratings, which are subject to change. As discussed above, in 2015, Fitch and Standard & Poor’s reaffirmed South Africa’s credit ratings. Energy supply constraints, labor relations, policy certainty and lack of policy coordination and implementation, the outcome and financing of the government wage bill were the main risks that have evolved in the past 12 months cited by credit rating agencies. As discussed above, the government has made progress in stabilizing the energy supply but supply constraints remain. In 2015, labor relations have improved with work days lost due to strikes in the first half of 2015 significantly lower than in 2014. Future legislation and regulations will be subject to a socioeconomic impact assessment before being passed which is expected to promote better policy coordination, highlight potential risks and unintended consequences and allow for the development of mitigation strategies or alternative solutions before the legislation process begins (such as the visa regulation that resulted in slower tourism into the country). While the government wage bill has had significant impact on the fiscus, it has been financed through a combination of drawing down on the contingency reserve, reprioritizing within existing baselines, reducing headcount, withdrawal of funds from vacant positions, amongst other measures. The Government recognizes that there is a need to radically change the manner in which future negotiations are conducted, and is considering proposals to reform remuneration in the public sector. The Government has also been focused on stabilizing state owned entities and it remains committed to deficit-neutral capital financing of SOEs in the years ahead.
Guaranteed Debt
In addition to its direct indebtedness, the National Government is also a guarantor of certain third-party indebtedness. The National Government has issued formal contractual guarantees in respect of certain indebtedness of wholly or partially state-owned companies.
The following table sets forth the debt guaranteed by the National Government outstanding in each of the years indicated:
Outstanding National Government Guaranteed Debt
| | | | | | | | | | | | | | | | | | | | |
| | | As of March 31, | |
| | | 2011 | | | 2012 | | | 2013 | | | 2014 | | | 2015 | |
| | | Rand (million) | |
Internal | | | 127,709 | | | | 126,901 | | | | 140,975 | | | | 160,784 | | | | 169,211 | |
External | | | 21,891 | | | | 27,023 | | | | 39,265 | | | | 48,784 | | | | 56,682 | |
| | | | | | | | | | | | | | | | | | | | |
Total | | | 149,600 | | | | 153,924 | | | | 180,240 | | | | 209,568 | | | | 225,893 | |
| | | | | | | | | | | | | | | | | | | | |
Source: South African National Treasury.
146
The following table sets forth the National Government’s external guaranteed debt outstanding as of March 31, 2015.
Analysis of National Government External Guaranteed Debt
| | | | | | | | | | | | | | | | |
| | | As of March 31, 2015 | |
Guarantees Issued on Behalf of | | ZAR | | | U.S. Dollars | | | Euro | | | Equivalent
in Rand(1) | |
| | | Amount (million) | |
Transnet | | | 3,500 | | | | — | | | | — | | | | 3,500 | |
Land bank | | | 500 | | | | — | | | | — | | | | 500 | |
Telkom | | | — | | | | — | | | | 8 | | | | 99 | |
IDC | | | — | | | | 15 | | | | 12 | | | | 344 | |
Lesotho Highlands Development Authority | | | 48 | | | | — | | | | 3 | | | | 82 | |
DBSA | | | 2,531 | | | | 52 | | | | 64 | | | | 4,013 | |
Trans-Caledon Tunnel Authority | | | 73 | | | | — | | | | — | | | | 73 | |
ESKOM | | | 34,458 | | | | 401 | | | | 579 | | | | 46,937 | |
| | | | | | | | | | | | | | | | |
Total(2) | | | 41,110 | | | | 468 | | | | 666 | | | | 55,548 | |
| | | | | | | | | | | | | | | | |
Notes: —
| (1) | Conversion of amounts into Rand have been made at the following rates: U.S. Dollar = R12.18; Euro = R13.12. |
| (2) | Does not include guaranteed interest to the amount of R1.1 billion. |
Source: South African National Treasury.
Debt-Service Costs
As a percentage of the National Government expenditure, debt-service costs increased from 8.2% during fiscal year 2010/11 to 10.1% in 2014/15. As a percentage of the National Government revenue, debt-service costs increased from 9.8% during fiscal year 2010/11 to 11.9% in 2014/15. In addition, as a percentage of GDP, debt service costs increased from 2.3% during fiscal year 2010/11 to 3.0% in 2014/15. The following table sets forth such percentages for the periods indicated.
| | | | | | | | | | | | | | | | | | | | |
| | | For the year ended March 31, | |
| | �� | 2011 | | | 2012 | | | 2013 | | | 2014 | | | 2015 | |
Expenditure | | | 8.2 | % | | | 8.6 | % | | | 9.1 | % | | | 9.7 | % | | | 10.1 | % |
Revenue | | | 9.8 | % | | | 10.3 | % | | | 11.0 | % | | | 11.4 | % | | | 11.9 | % |
GDP | | | 2.3 | % | | | 2.5 | % | | | 2.6 | % | | | 2.8 | % | | | 3.0 | % |
Source: South African National Treasury.
The aggregate amount of scheduled repayments in respect of principal and interest on the funded National Government debt outstanding as of September 30, 2015, is set forth in the table below.
| | | | | | | | | | | | | | | | | | | | | | | | |
| | | | | | External Debt | |
Year(1) | | Rand | | | U.S.$ | | | EURO | | | YEN | | | GBP | | | SEK | |
| | | Amount (million) | |
2016 | | | 51,045 | | | | 353 | | | | 48 | | | | 1,194 | | | | 8 | | | | 427 | |
2017 | | | 154,028 | | | | 685 | | | | 867 | | | | 2,386 | | | | 8 | | | | 829 | |
2018 | | | 158,969 | | | | 806 | | | | 55 | | | | 2,384 | | | | 8 | | | | 792 | |
147
| | | | | | | | | | | | | | | | | | | | | | | | |
| | | | | | External Debt | |
Year(1) | | Rand | | | U.S.$ | | | EURO | | | YEN | | | GBP | | | SEK | |
| | | Amount (million) | |
2019 | | | 147,915 | | | | 656 | | | | 41 | | | | 2,381 | | | | 7 | | | | 756 | |
2020 | | | 159,843 | | | | 4,571 | | | | 31 | | | | 2,379 | | | | 2 | | | | 491 | |
2021 | | | 150,586 | | | | 869 | | | | 24 | | | | 31,807 | | | | 1 | | | | 236 | |
2022 | | | 118,238 | | | | 346 | | | | 18 | | | | 30,617 | | | | — | | | | — | |
2023 | | | 133,305 | | | | 1,317 | | | | 18 | | | | — | | | | — | | | | — | |
2024 | | | 147,431 | | | | 1,788 | | | | 18 | | | | — | | | | — | | | | — | |
2025 | | | 102,334 | | | | 218 | | | | 18 | | | | — | | | | — | | | | — | |
2026 | | | 121,301 | | | | 2,159 | | | | 18 | | | | — | | | | — | | | | — | |
2027 | | | 115,744 | | | | 100 | | | | 18 | | | | — | | | | — | | | | — | |
2028 | | | 158,281 | | | | 100 | | | | 518 | | | | — | | | | — | | | | — | |
2029 | | | 50,450 | | | | 100 | | | | — | | | | — | | | | — | | | | — | |
2030 | | | 127,655 | | | | 100 | | | | — | | | | — | | | | — | | | | — | |
2031 | | | 132,563 | | | | 100 | | | | — | | | | — | | | | — | | | | — | |
2032 | | | 93,112 | | | | 100 | | | | — | | | | — | | | | — | | | | — | |
2033 | | | 36,534 | | | | 100 | | | | — | | | | — | | | | — | | | | — | |
2034 | | | 104,107 | | | | 100 | | | | — | | | | — | | | | — | | | | — | |
2035 | | | 39,157 | | | | 100 | | | | — | | | | — | | | | — | | | | — | |
2036 | | | 113,614 | | | | 100 | | | | — | | | | — | | | | — | | | | — | |
2037 | | | 95,825 | | | | 100 | | | | — | | | | — | | | | — | | | | — | |
2038 | | | 55,720 | | | | 100 | | | | — | | | | — | | | | — | | | | — | |
2039 | | | 18,308 | | | | 100 | | | | — | | | | — | | | | — | | | | — | |
2040 | | | 19,408 | | | | 100 | | | | — | | | | — | | | | — | | | | — | |
2041 | | | 97,308 | | | | 850 | | | | — | | | | — | | | | — | | | | — | |
2042 | | | 13,067 | | | | 53 | | | | — | | | | — | | | | — | | | | — | |
2043 | | | 26,395 | | | | 53 | | | | — | | | | — | | | | — | | | | — | |
2044 | | | 25,229 | | | | 53 | | | | — | | | | — | | | | — | | | | — | |
2045 | | | 24,063 | | | | 1,026 | | | | — | | | | — | | | | — | | | | — | |
2046 | | | 31,532 | | | | — | | | | — | | | | — | | | | — | | | | — | |
2047 | | | 40,289 | | | | — | | | | — | | | | — | | | | — | | | | — | |
2048 | | | 37,553 | | | | — | | | | — | | | | — | | | | — | | | | — | |
2049 | | | 34,817 | | | | — | | | | — | | | | — | | | | — | | | | — | |
2050 | | | 11,633 | | | | — | | | | — | | | | — | | | | — | | | | — | |
2051 | | | 11,362 | | | | — | | | | — | | | | — | | | | — | | | | — | |
2052 | | | 11,092 | | | | — | | | | — | | | | — | | | | — | | | | — | |
Total | | | 2,969,815 | | | | 17,203 | | | | 1,692 | | | | 73,148 | | | | 34 | | | | 3,531 | |
| | | | | | | | | | | | | | | | | | | | | | | | |
Principal | | | 1,479,030 | | | | 11,087 | | | | 1,424 | | | | 60,564 | | | | 33 | | | | 3,120 | |
Interest | | | 1,490,785 | | | | 61,161 | | | | 268 | | | | 12,584 | | | | 1 | | | | 411 | |
| | | | | | | | | | | | | | | | | | | | | | | | |
Note: —
| (1) | Fiscal years ending March 31. |
Source: South African National Treasury.
Debt Record
On September 1, 1985, in response to a foreign currency liquidity crisis, South Africa prohibited repayment of certain foreign indebtedness to foreign creditors, while interest payments were made as they became due. Final settlement of affected indebtedness was agreed in 1993. Other than this isolated situation, South Africa has not defaulted in the payment of principal or interest on any of its internal or external indebtedness since becoming a Republic in 1961.
148
Tables and Supplementary Information
Funded Internal Debt of the Republic of South Africa (Domestic Marketable Bonds—in Rand) As of September 30, 2015
| | | | | | | | |
Interest Rate | | Date of Issue | | Maturity Date | | Nominal Amount | |
Zero Coupon | | April 19, 1994 | | October 19, 2015 | | | 77,877,914 | |
13.50% | | September 16, 2012 | | September 15, 2016 | | | 23,757,559,949 | |
13.50% | | February 28, 2002 | | September 15, 2016 | | | 760,000,000 | |
2.50% | | June 9, 2010 | | January 31, 2017 | | | 27,759,675,473 | (1) |
8.25% | | May 7, 2004 | | September 15, 2017 | | | 61,221,933,836 | |
8.00% | | August 13, 2004 | | December 21, 2018 | | | 55,219,000,000 | |
Zero Coupon | | April 18, 1996 | | September 30, 2019 | | | 150,000,000 | |
7.25% | | June 20, 2005 | | January 15, 2020 | | | 71,414,603,937 | |
6.75% | | September 1, 2006 | | March 31, 2021 | | | 67,484,709,007 | |
2.75% | | June 17, 2010 | | January 31, 2022 | | | 39,692,870,504 | (1) |
7.75% | | June 22, 2012 | | February 28, 2023 | | | 55,851,352,549 | |
5.50% | | May 30, 2001 | | December 7, 2023 | | | 74,305,345,851 | (1) |
2.00% | | July 4, 2012 | | January 31, 2025 | | | 33,295,234,247 | |
10.50% | | May 22, 1998 | | December 21, 2025 | | | 52,828,405,383 | |
10.50% | | October 31, 2002 | | December 21, 2025 | | | 100,000,000 | |
10.50% | | May 22, 1998 | | December 21, 2026 | | | 52,828,405,383 | |
10.50% | | October 31, 2002 | | December 21, 2026 | | | 100,000,000 | |
10.50% | | May 22, 1998 | | December 21, 2027 | | | 52,828,405,383 | |
10.50% | | October 31, 2002 | | December 21, 2027 | | | 100,000,000 | |
2.60% | | September 27, 2007 | | March 31, 2028 | | | 48,094,306,791 | |
8.00% | | October 04, 2013 | | January 31, 2030 | | | 77,205,282,574 | |
7.00% | | May 28, 2010 | | February 28, 2031 | | | 88,289,879,862 | |
8.25% | | June 13, 2014 | | March 31, 2032 | | | 55,019,000,000 | |
3.45% | | August 15, 2003 | | December 7, 2033 | | | 70,608,939,149 | (1) |
1.88% | | July 15, 2015 | | February 28, 2033 | | | 2,979,538,626 | |
8.88% | | July 17, 2015 | | February 28, 2035 | | | 8,095,104,507 | |
6.25% | | July 21, 2006 | | March 31, 2036 | | | 83,270,552,145 | |
8.50% | | July 19, 2013 | | January 31, 2037 | | | 70,685,639,317 | |
2.25% | | July 4, 2012 | | January 31, 2038 | | | 36,588,560,750 | |
9.00% | | September 11, 2015 | | January 31, 2040 | | | 1,100,000,000 | |
149
| | | | | | | | |
Interest Rate | | Date of Issue | | Maturity Date | | Nominal Amount | |
6.50% | | June 4, 2010 | | February 28, 2041 | | | 79,098,957,597 | |
8.75% | | July 18, 2014 | | January 31, 2043 | | | 13,328,000,000 | |
8.75% | | July 18, 2014 | | January 31, 2044 | | | 13,328,000,000 | |
8.75% | | July 18, 2014 | | January 31, 2045 | | | 13,328,000,000 | |
2.50% | | July 17, 2013 | | March 31, 2046 | | | 21,962,926,521 | |
8.75% | | June 29, 2012 | | February 28, 2047 | | | 31,269,333,333 | |
8.75% | | June 29, 2012 | | February 28, 2048 | | | 31,269,333,333 | |
8.75% | | June 29, 2012 | | February 28, 2049 | | | 31,269,333,333 | |
2.50% | | July 11, 2012 | | December 31, 2049 | | | 10,821,423,347 | |
2.50% | | July 11, 2012 | | December 31, 2050 | | | 10,821,423,347 | |
2.50% | | July 11, 2012 | | December 31, 2051 | | | 10,821,423,347 | |
4.50% | | December 1, 1986 | | Perpetual | | | 10,410 | |
5.00% | | December 1, 1986 | | Perpetual | | | 57,935 | |
Total Funded Internal Debt | | | | | | | 1,479,030,405,642 | |
| | | | | | | | |
Note: —
| (1) | Inflation-linked bonds have been revalued using the relevant “reference CPI.” |
Source: South African National Treasury.
150
Floating Internal Debt of the Republic of South Africa
(Treasury Bills — in Rand)
As of September 30, 2015
| | | | | | | | |
Interest Rate | | Date of Issue | | Maturity Date | | Nominal Amount | |
6.65% | | October 9, 2014 | | October 8, 2015 | | | 1,300,000,000 | |
6.61% | | October 16, 2014 | | October 15, 2015 | | | 1,300,000,000 | |
6.54% | | October 23, 2014 | | October 22, 2015 | | | 1,300,000,000 | |
6.50% | | October 30, 2014 | | October 29, 2015 | | | 1,300,000,000 | |
6.42% | | November 6, 2014 | | November 5, 2015 | | | 1,300,000,000 | |
6.37% | | November 13, 2014 | | November 12, 2015 | | | 1,300,000,000 | |
6.37% | | November 20, 2014 | | November 19, 2015 | | | 1,300,000,000 | |
6.31% | | November 27, 2014 | | November 26, 2015 | | | 1,135,000,000 | |
6.34% | | December 4, 2014 | | December 3, 2015 | | | 965,000,000 | |
6.46% | | December 11, 2014 | | December 10, 2015 | | | 1,300,000,000 | |
6.45% | | December 18, 2014 | | December 17, 2015 | | | 1,300,000,000 | |
6.46% | | December 25, 2014 | | December 24, 2015 | | | 1,300,000,000 | |
6.65% | | December 31, 2014 | | December 30, 2015 | | | 1,300,000,000 | |
6.72% | | January 7, 2015 | | January 6, 2016 | | | 971,600,000 | |
6.66% | | January 7, 2015 | | October 7, 2015 | | | 1,450,000,000 | |
6.48% | | January 14, 2015 | | January 13, 2016 | | | 1,300,000,000 | |
6.46% | | January 14, 2015 | | October 14, 2015 | | | 1,450,000,000 | |
6.31% | | January 21, 2015 | | January 20, 2016 | | | 1,300,000,000 | |
6.30% | | January 21, 2015 | | October 21, 2015 | | | 1,450,000,000 | |
6.17% | | January 28, 2015 | | January 27, 2016 | | | 1,300,000,000 | |
6.18% | | January 28, 2015 | | October 28, 2015 | | | 1,450,000,000 | |
6.14% | | February 4, 2015 | | February 3, 2016 | | | 1,300,000,000 | |
6.16% | | February 4, 2015 | | November 4, 2015 | | | 1,450,000,000 | |
6.17% | | February 11, 2015 | | February 10, 2016 | | | 1,300,000,000 | |
151
| | | | | | | | |
Interest Rate | | Date of Issue | | Maturity Date | | Nominal Amount | |
6.21% | | February 11, 2015 | | November 11, 2015 | | | 1,450,000,000 | |
6.28% | | February 18, 2015 | | February 17, 2016 | | | 1,300,000,000 | |
6.26% | | February 18, 2015 | | November 18, 2015 | | | 1,450,000,000 | |
6.33% | | February 25, 2015 | | February 24, 2016 | | | 1,300,000,000 | |
6.25% | | February 25, 2015 | | November 25, 2015 | | | 1,450,000,000 | |
6.28% | | March 4, 2015 | | March 2, 2016 | | | 1,300,000,000 | |
6.23% | | March 4, 2015 | | December 2, 2015 | | | 1,450,000,000 | |
6.28% | | March 11, 2015 | | March 9, 2016 | | | 1,300,000,000 | |
6.22% | | March 11, 2015 | | December 9, 2015 | | | 1,450,000,000 | |
6.30% | | March 18, 2015 | | March 16, 2016 | | | 1,300,000,000 | |
6.23% | | March 18, 2015 | | December 16, 2015 | | | 1,450,000,000 | |
6.27% | | March 25, 2015 | | March 23, 2016 | | | 1,300,000,000 | |
6.19% | | March 25, 2015 | | December 23, 2015 | | | 1,450,000,000 | |
6.28% | | April 1, 2015 | | March 30, 2016 | | | 1,410,000,000 | |
6.22% | | April 1, 2015 | | December 30, 2015 | | | 1,560,000,000 | |
6.20% | | April 8, 2015 | | April 6, 2016 | | | 1,410,000,000 | |
6.14% | | April 8, 2015 | | January 6, 2016 | | | 1,560,000,000 | |
6.06% | | April 8, 2015 | | October 7, 2015 | | | 1,845,000,000 | |
6.19% | | April 15, 2015 | | April 13, 2016 | | | 1,410,000,000 | |
6.14% | | April 15, 2015 | | January 13, 2016 | | | 1,560,000,000 | |
6.06% | | April 15, 2015 | | October 14, 2015 | | | 1,845,000,000 | |
6.18% | | April 22, 2015 | | April 20, 2016 | | | 1,410,000,000 | |
6.14% | | April 22, 2015 | | January 20, 2016 | | | 1,560,000,000 | |
152
| | | | | | | | |
Interest Rate | | Date of Issue | | Maturity Date | | Nominal Amount | |
6.02% | | April 22, 2015 | | October 21, 2015 | | | 1,845,000,000 | |
6.18% | | April 29, 2015 | | April 27, 2016 | | | 1,410,000,000 | |
6.17% | | April 29, 2015 | | January 27, 2016 | | | 1,560,000,000 | |
6.06% | | April 29, 2015 | | October 28, 2015 | | | 1,845,000,000 | |
6.25% | | May 6, 2015 | | May 4, 2016 | | | 1,410,000,000 | |
6.22% | | May 6, 2015 | | February 3, 2016 | | | 1,560,000,000 | |
6.07% | | May 6, 2015 | | November 4, 2015 | | | 1,845,000,000 | |
6.26% | | May 13, 2015 | | May 11, 2016 | | | 1,410,000,000 | |
6.27% | | May 13, 2015 | | February 10, 2016 | | | 1,010,000,000 | |
6.06% | | May 13, 2015 | | November 11, 2015 | | | 1,845,000,000 | |
6.29% | | May 20, 2015 | | May 18, 2016 | | | 1,410,000,000 | |
6.26% | | May 20, 2015 | | February 17, 2016 | | | 1,560,000,000 | |
6.04% | | May 20, 2015 | | November 18, 2015 | | | 1,845,000,000 | |
6.39% | | May 27, 2015 | | May 25, 2016 | | | 1,155,000,000 | |
6.26% | | May 27, 2015 | | February 24, 2016 | | | 1,560,000,000 | |
6.03% | | May 27, 2015 | | November 25, 2015 | | | 1,845,000,000 | |
6.48% | | June 3, 2015 | | June 1, 2016 | | | 990,000,000 | |
6.33% | | June 3, 2015 | | March 2, 2016 | | | 1,560,000,000 | |
6.02% | | June 3, 2015 | | December 2, 2015 | | | 1,845,000,000 | |
6.51% | | June 10, 2015 | | June 8, 2016 | | | 1,410,000,000 | |
6.36% | | June 10, 2015 | | March 9, 2016 | | | 1,560,000,000 | |
5.99% | | June 10, 2015 | | December 9, 2015 | | | 1,845,000,000 | |
6.59% | | June 17, 2015 | | June 15, 2016 | | | 1,410,000,000 | |
6.42% | | June 17, 2015 | | March 16, 2016 | | | 1,560,000,000 | |
5.97% | | June 17, 2015 | | December 16, 2015 | | | 83,000,000 | |
6.73% | | June 24, 2015 | | June 22, 2016 | | | 1,410,000,000 | |
6.49% | | June 24, 2015 | | March 23, 2016 | | | 1,560,000,000 | |
153
| | | | | | | | |
Interest Rate | | Date of Issue | | Maturity Date | | Nominal Amount | |
6.02% | | June 24, 2015 | | December 23, 2015 | | | 5,000,000 | |
6.80% | | July 1, 2015 | | June 29, 2016 | | | 1,410,000,000 | |
6.62% | | July 1, 2015 | | March 30, 2016 | | | 1,560,000,000 | |
6.29% | | July 1, 2015 | | December 30, 2015 | | | 1,487,000,000 | |
6.81% | | July 8, 2015 | | July 6, 2016 | | | 1,410,000,000 | |
6.64% | | July 8, 2015 | | April 6, 2016 | | | 1,560,000,000 | |
6.50% | | July 8, 2015 | | January 6, 2016 | | | 1,636,000,000 | |
6.13% | | July 8, 2015 | | October 7, 2015 | | | 2,555,000,000 | |
6.72% | | July 15, 2015 | | July 13, 2016 | | | 1,410,000,000 | |
6.55% | | July 15, 2015 | | April 13, 2016 | | | 1,560,000,000 | |
6.42% | | July 15, 2015 | | January 13, 2016 | | | 1,845,000,000 | |
6.15% | | July 15, 2015 | | October 14, 2015 | | | 2,038,440,000 | |
6.71% | | July 22, 2015 | | July 20, 2016 | | | 1,410,000,000 | |
6.60% | | July 22, 2015 | | April 20, 2016 | | | 1,560,000,000 | |
6.41% | | July 22, 2015 | | January 20, 2016 | | | 1,845,000,000 | |
6.06% | | July 22, 2015 | | October 21, 2015 | | | 2,555,000,000 | |
6.85% | | July 29, 2015 | | July 27, 2016 | | | 1,410,000,000 | |
6.73% | | July 29, 2015 | | April 27, 2016 | | | 1,560,000,000 | |
6.51% | | July 29, 2015 | | January 27, 2016 | | | 1,845,000,000 | |
6.13% | | July 29, 2015 | | October 28, 2015 | | | 2,555,000,000 | |
6.87% | | August 5, 2015 | | August 3, 2016 | | | 1,410,000,000 | |
6.81% | | August 5, 2015 | | May 4, 2016 | | | 1,560,000,000 | |
6.56% | | August 5, 2015 | | February 3, 2016 | | | 1,845,000,000 | |
6.26% | | August 5, 2015 | | November 4, 2015 | | | 2,555,000,000 | |
6.84% | | August 12, 2015 | | August 10, 2016 | | | 1,410,000,000 | |
6.81% | | August 12, 2015 | | May 11, 2016 | | | 1,560,000,000 | |
6.63% | | August 12, 2015 | | February 10, 2016 | | | 1,845,000,000 | |
6.27% | | August 12, 2015 | | November 11, 2015 | | | 2,555,000,000 | |
6.81% | | August 19, 2015 | | August 17, 2016 | | | 1,410,000,000 | |
154
| | | | | | | | |
Interest Rate | | Date of Issue | | Maturity Date | | Nominal Amount | |
6.80% | | August 19, 2015 | | May 18, 2016 | | | 1,560,000,000 | |
6.62% | | August 19, 2015 | | February 17, 2016 | | | 1,845,000,000 | |
6.26% | | August 19, 2015 | | November 18, 2015 | | | 2,555,000,000 | |
6.82% | | August 26, 2015 | | August 24, 2016 | | | 1,410,000,000 | |
6.82% | | August 26, 2015 | | My 25, 2016 | | | 1,560,000,000 | |
6.65% | | August 26, 2015 | | February 24, 2016 | | | 1,845,000,000 | |
6.25% | | August 26, 2015 | | November 25, 2015 | | | 2,555,000,000 | |
6.94% | | September 2, 2015 | | August 31, 2016 | | | 1,410,000,000 | |
6.82% | | September 2, 2015 | | June 1, 2016 | | | 1,560,000,000 | |
6.63% | | September 2, 2015 | | March 2, 2016 | | | 1,845,000,000 | |
6.29% | | September 2, 2015 | | December 2, 2015 | | | 2,555,000,000 | |
7.08% | | September 9, 2015 | | September 7, 2016 | | | 1,410,000,000 | |
6.93% | | September 9, 2015 | | June 8, 2016 | | | 1,560,000,000 | |
6.71% | | September 9, 2015 | | March 9, 2016 | | | 1,845,000,000 | |
6.36% | | September 9, 2015 | | December 9, 2015 | | | 2,555,000,000 | |
7.07% | | September 16, 2015 | | September 14, 2016 | | | 1,410,000,000 | |
6.92% | | September 16, 2015 | | June 15, 2016 | | | 1,560,000,000 | |
6.73% | | September 16, 2015 | | March 16, 2016 | | | 1,845,000,000 | |
6.42% | | September 16, 2015 | | December 16, 2015 | | | 2,555,000,000 | |
7.01% | | September 23, 2015 | | September 21, 2016 | | | 1,410,000,000 | |
6.87% | | September 23, 2015 | | June 22, 2016 | | | 1,560,000,000 | |
6.66% | | September 23, 2015 | | March 23, 2016 | | | 1,845,000,000 | |
6.31% | | September 23, 2015 | | December 23, 2015 | | | 2,555,000,000 | |
6.96% | | September 30, 2015 | | September 28, 2016 | | | 1,410,000,000 | |
6.84% | | September 30, 2015 | | June 29, 2016 | | | 1,560,000,000 | |
6.66% | | September 30, 2015 | | March 30, 2016 | | | 1,845,000,000 | |
6.29% | | September 30, 2015 | | December 30, 2015 | | | 2,555,000,000 | |
Total Floating Internal Debt | | | | | | | 204,536,040,000 | (1)) |
| | | | | | | | |
Note: —
| (1) | Excludes borrowing from the Corporation for Public Deposits to the amount of R51,177,571,210.42 |
Source: South African National Treasury.
155
Funded External Debt of the Republic of South Africa
as of September 30, 2015
| | | | | | | | |
Interest Rate | | Date of Issue | | Maturity Date | | Nominal Amount | |
Capital market loans | | | | |
8.50% | | June 23, 1997 | | June 23, 2017 | | $ | 140,683,000 | |
2.50% | | February 2, 1998 | | May 20, 2021 | | ¥ | 564,480,000 | |
3.80% | | June 1, 2000 | | June 1, 2020 | | ¥ | 30,000,000,000 | |
3.80% | | June 12, 2001 | | September 7, 2021 | | ¥ | 30,000,000,000 | |
4.50% | | April 5, 2006 | | April 5, 2016 | | € | 750,000,000 | |
5.875% | | May 30, 2007 | | May 30, 2022 | | $ | 1,000,000,000 | |
6.875% | | May 27, 2009 | | May 27, 2019 | | $ | 1,500,000,000 | |
6.875% | | September 4, 2009 | | May 27, 2019 | | $ | 500,000,000 | |
5.50% | | March 5, 2010 | | September 3, 2020 | | $ | 2,000,000,000 | |
6.25% | | March 8, 2011 | | March 8, 2041 | | $ | 750,000,000 | |
4.665% | | January 17, 2012 | | January 17, 2024 | | $ | 1,500,000,000 | |
5.875% | | September 16, 2013 | | September 16, 2025 | | $ | 2,000,000,000 | |
5.375% | | July 24, 2014 | | July 24, 2044 | | $ | 1,000,000,000 | |
3.750% | | July 24, 2014 | | July 24, 2026 | | € | 500,000,000 | |
3.903% | | September 24, 2014 | | June 24, 2020 | | $ | 500,000,000 | |
Floating - Non-CIRR | | August 21, 2000 - August 29, 2006 | | January 25, 2007 - July 25, 2016 | | € | 24,079,764.40 | |
Floating - Non-CIRR | | August 21, 2000 - August 29, 2006 | | January 25, 2008 - July 25, 2017 | | € | 45,532,568.30 | |
5.97% Eur-CIRR Fixed | | August 21, 2000 - August 29, 2006 | | January 25, 2007 - July 25, 2016 | | € | 2,777,549.60 | |
5.97% Eur-CIRR Fixed | | August 21, 2000 - August 29, 2006 | | January 25, 2008 - July 25, 2017 | | € | 5,252,085.29 | |
7.32% $-CIRR Fixed | | August 21, 2000 - August 29, 2006 | | January 25, 2007 - July 25, 2016 | | $ | 876,555.16 | |
156
| | | | | | | | |
Interest Rate | | Date of Issue | | Maturity Date | | Nominal Amount | |
7.32% $-CIRR Fixed | | August 21, 2000 - August 29, 2006 | | January 25, 2008 - July 25, 2017 | | $ | 1,717,785.84 | |
7.14% CIRR Fixed | | April 17, 2000 - March 5, 2001 | | April 15, 2006 - October 15, 2018 | | $ | 4,671,006.26 | |
4.70% MC CIRR | | July 17, 2000 - July 17, 2001 | | April 15, 2006 - October 15, 2015 | | € | 5,196,660.04 | |
4.77% Commercial Fixed | | April 15, 2001 | | April 15, 2009 - October 15, 2018 | | € | 3,990,110.72 | |
5.15% Commercial Fixed | | April 15, 2002 - May 21, 2003 | | April 15, 2009 - October 15, 2018 | | $ | 9,825,172.77 | |
5.03% Commercial Fixed | | July 15, 2002 - July 15, 2003 | | October 15, 2006 - April 15, 2016 | | $ | 10,786,907.53 | |
5.63% CIRR – Fixed | | July 15, 2002 - September 28, 2006 | | April 15, 2006 - October 15, 2015 | | € | 2,119,921.87 | |
5.63% MC CIRR | | April 15, 2004 - July 17, 2006 | | April 15, 2009 - October 15, 2018 | | € | 12,589,256.51 | |
6.485% Commercial Fixed | | December 15, 2001 - January 15, 2003 | | April 17, 2006 - October 15, 2015 | | £ | 1,272,458.03 | |
6.545% Sec – CIRR | | July 21, 2004 - July 22, 2005 | | April 15, 2009 - October 15, 2018 | | £ | 6,540,241.56 | |
6.545% Sec – CIRR | | November 26, 2003 - August 24, 2006 | | April 15, 2006 - October 15, 2015 | | £ | 1,883,413.26 | |
6.545% Sec – CIRR | | August 24, 2006 | | October 15, 2006 - April 15, 2016 | | £ | 22,366.38 | |
5.50% Commercial Fixed | | July 21, 2004 | | April 15, 2009 - October 15, 2018 | | € | 9,505,998.80 | |
4.72% Commercial Fixed | | April 18, 2006 | | April 15, 2009 - October 15, 2018 | | € | 16,038.14 | |
3.57% Commercial Fixed | | November 26, 2006 - March 5, 2008 | | April 15, 2008 - October 15, 2015 | | £ | 316,395.48 | |
3.59% Commercial Fixed | | March 24, 2009 - August 19, 2009 | | April 15, 2009 - October 15, 2015 | | £ | 299,970.19 | |
3.65% Commercial Fixed | | March 5, 2008 - October 1, 2008 | | April 15, 2008 - April 15, 2016 | | £ | 86,645.06 | |
157
| | | | | | | | |
Interest Rate | | Date of Issue | | Maturity Date | | Nominal Amount | |
4.23% Commercial Fixed | | December 15, 2008 | | April 15, 2009 - October 15, 2018 | | £ | 57,900.37 | |
4.28% Commercial Fixed | | December 4, 2008 | | April 15, 2009 - October 15, 2018 | | £ | 5,873,906.46 | |
4.61% Commercial Fixed | | July 31, 2008 - April 15, 2010 | | April 15, 2009 - October 15, 2018 | | £ | 3,487,626.57 | |
4.90% Commercial Fixed | | December 15, 2009 | | April 15, 2010 - October 15, 2018 | | £ | 1,093,936.16 | |
4.92% Commercial Fixed | | April 6, 2010 | | April 15, 2011 - April 15, 2020 | | £ | 1,389,048.91 | |
5.10% Commercial Fixed | | December 15, 2009 - October 15, 2010 | | April 15, 2011 - April 15, 2020 | | £ | 2,345,154.10 | |
5.25% Commercial Fixed | | March 23, 2011 | | October 15, 2011 - April 15, 2020 | | £ | 2,077,971.00 | |
6.77% MC CIRR | | July 22, 2005 | | April 15, 2009 - October 15, 2018 | | £ | 40,141.78 | |
5.79% Commercial Fixed | | July 15, 2002 - April 15, 2004 | | April 15, 2009 - October 15, 2018 | | $ | 1,295,349.20 | |
5.97% Commercial Fixed | | October 16, 2006 | | April 15, 2009 - October 15, 2018 | | $ | 562,102.39 | |
5.55% Commercial Fixed | | October 15, 2003 - April 15, 2004 | | April 15, 2009 - October 15, 2018 | | $ | 12,860,100.79 | |
5.315% Commercial Fixed | | April 15, 2009 | | April 15, 2011 - April 15, 2020 | | $ | 91,783.45 | |
5.39% Commercial Fixed | | December 15, 2009 | | April 15, 2010 - October 15, 2018 | | $ | 66,031.20 | |
5.40% Commercial Fixed | | June 22, 2007 - August 19, 2009 | | April 15, 2009 - October 15, 2018 | | $ | 3,707,507.87 | |
158
| | | | | | | | |
Interest Rate | | Date of Issue | | Maturity Date | | Nominal Amount | |
5.45% Commercial Fixed | | October 15, 2001 - July 15, 2002 | | April 15, 2006 - October 15, 2015 | | $ | 1,823,060.41 | |
5.53% Commercial Fixed | | November 26, 2003 - April 26, 2004 | | October 15, 2006 - April 15, 2016 | | $ | 5,866,755.02 | |
5.16% Commercial Fixed | | June 6, 2008 - August 19, 2009 | | April 15, 2009 - October 15, 2018 | | $ | 5,688,049.73 | |
5.61% Commercial Fixed | | December 15, 2009 | | April 15, 2010 - October 15, 2018 | | $ | 43,039.13 | |
5.49% Commercial Fixed | | April 17, 2001 - July 15, 2003 | | April 15, 2009 - October 15, 2018 | | SEK | 153,041,353.61 | |
3.90% Commercial Fixed | | April 15, 2005 - July 22, 2005 | | April 15, 2011 - April 15, 2020 | | SEK | 87,990,409.02 | |
4.30% Commercial Fixed | | October 17, 2005 - January 17, 2006 | | April 15, 2011 - April 15, 2020 | | SEK | 191,699,039.15 | |
3.81% Commercial Fixed | | October 26, 2004 - July 22, 2005 | | April 15, 2009 - October 15, 2018 | | SEK | 115,378,290.93 | |
4.24% Commercial Fixed | | October 17, 2005 - January 16, 2006 | | April 15, 2009 - October 15, 2018 | | SEK | 62,906,291.14 | |
4.57% Commercial Fixed | | April 18, 2006 - October 16, 2006 | | April 15, 2009 - October 15, 2018 | | SEK | 75,974,208.83 | |
5.03% Commercial Fixed | | January 15, 2007 - April 16, 2007 | | April 15, 2009 - October 15, 2018 | | SEK | 20,023,079.13 | |
4.60% Commercial Fixed | | April 18, 2006 - October 16, 2006 | | April 15, 2011 - April 15, 2020 | | SEK | 631,014,027.11 | |
5.05% Commercial Fixed | | January 16, 2007 | | April 15, 2011 - April 15, 2020 | | SEK | 145,508,959.19 | |
159
| | | | | | | | |
Interest Rate | | Date of Issue | | Maturity Date | | Nominal Amount | |
5.60% Commercial Fixed | | June 25, 2007 | | April 15, 2011 - April 15, 2020 | | SEK | 288,424,994.54 | |
5.50% Commercial Fixed | | August 24, 2004 | | October 15, 2006 - April 15, 2016 | | $ | 1,036,184.61 | |
4.42% Commercial Fixed | | November 29, 2004 - December 23, 2005 | | October 15, 2006 - April 15, 2016 | | € | 1,502,756.25 | |
5.48% Commercial Fixed | | December 23, 2005 - June 29, 2006 | | October 15, 2006 - April 15, 2016 | | € | 1,149,043.69 | |
4.52% Commercial Fixed | | July 21, 2004 - October 17, 2005 | | April 15, 2009 - October 15, 2018 | | € | 138,655.02 | |
4.57% Commercial Fixed | | April 15, 2005 - January 17, 2006 | | April 15, 2011 - April 15, 2020 | | € | 16,259,148.72 | |
4.76% Commercial Fixed | | April 18, 2006 - July 17, 2006 | | April 15, 2011 - April 15, 2020 | | € | 26,107,471.99 | |
6.315% Commercial Fixed | | November 1, 2006 - March 20, 2007 | | April 15, 2007 - October 15, 2015 | | £ | 909,238.51 | |
5.13% Commercial Fixed | | October 15, 2006 - March 20, 2007 | | April 15, 2007 - October 15, 2015 | | € | 8,018.65 | |
5.16% Commercial Fixed | | October 15, 2006 - April 16, 2007 | | April 15, 2009 - October 15, 2018 | | € | 3,373,926.49 | |
5.175% Commercial Fixed | | January 15, 2007 | | April 15, 2011 - April 15, 2020 | | € | 8,125,952.71 | |
6.28% Commercial Fixed | | December 21, 2006 | | April 15, 2007 - April 15, 2016 | | £ | 33,049.68 | |
6.28% Commercial Fixed | | October 16, 2006 - January 15, 2007 | | April 15, 2009 - October 15, 2018 | | £ | 7,877.01 | |
6.42% Commercial Fixed | | December 15, 2008 | | April 15, 2011 - April 15, 2020 | | $ | 7,213,277.27 | |
160
| | | | | | | | |
Interest Rate | | Date of Issue | | Maturity Date | | Nominal Amount | |
6.61% Commercial Fixed | | July 15, 2002 - April 15, 2004 | | April 15, 2009 - October 15, 2018 | | $ | 5,890,686.08 | |
6.65% Commercial Fixed | | June 22, 2007 | | October 15, 2010 - April 15, 2020 | | $ | 29,275,553.80 | |
5.89% Commercial Fixed | | October 23, 2009 - April 15, 2010 | | April 15, 2010 - October 15, 2018 | | $ | 2,975,434.23 | |
5.98% Commercial Fixed | | October 16, 2006 | | October 15, 2010 - April 15, 2020 | | $ | 13,811,066.69 | |
5.475% Commercial Fixed | | June 27, 2007 - September 27, 2007 | | October 15, 2007 - October 15, 2015 | | € | 19,104.96 | |
5.515% Commercial Fixed | | July 24, 2007 | | April 15, 2009 - October 15, 2018 | | € | 1,850,824.72 | |
4.93% Commercial Fixed | | April 16, 2007 | | April 15, 2009 - October 15, 2018 | | € | 678,445.22 | |
5.29% Commercial Fixed | | June 25, 2007 - July 24, 2007 | | April 15, 2009 - October 15, 2018 | | SEK | 24,992,544.90 | |
4.64% Commercial Fixed | | November 26, 2007 - December 20, 2007 | | April 15, 2008 - April 15, 2016 | | $ | 1,779,477.60 | |
3.26% Commercial Fixed | | March 19, 2008 - June 17, 2008 | | April 15, 2008 - April 15, 2016 | | $ | 960,265.43 | |
5.09% Commercial Fixed | | April 15, 2009 | | April 15, 2011 - April 15, 2020 | | $ | 140,815.25 | |
5.51% Commercial Fixed | | December 15, 2009 | | April 15, 2011 - April 15, 2020 | | $ | 167,901.61 | |
5.70% Commercial Fixed | | December 15, 2009 - April 15, 2010 | | April 15, 2010 - October 15, 2018 | | $ | 4,295,902.70 | |
161
| | | | | | | | |
Interest Rate | | Date of Issue | | Maturity Date | | Nominal Amount | |
5.70% Commercial Fixed | | September 15, 2009 | | April 15, 2011 - April 15, 2020 | | $ | 109,438.38 | |
6.50% Commercial Fixed | | April 16, 2007 | | April 15, 2009 - October 15, 2018 | | £ | 11,777.77 | |
5.35% Commercial Fixed | | October 17, 2011 | | April 15, 2012 - April 15, 2020 | | £ | 2,664,319.78 | |
5.18% Commercial Fixed | | May 15, 2007 - October 15, 2007 | | April 15, 2011 - April 15, 2020 | | € | 7,394,797.66 | |
6.66% Commercial Fixed | | October 15, 2007 | | April 15, 2011 - April 15, 2020 | | $ | 10,212,881.68 | |
6.75% Commercial Fixed | | July 31, 2008 | | April 15, 2011 - April 15, 2020 | | $ | 22,343,085.70 | |
6.50% Commercial Fixed | | September 16, 2008 | | April 15, 2011 - April 15, 2020 | | $ | 14,547,916.15 | |
7.89% Commercial Fixed | | December 15, 2009 | | April 15, 2011 - April 15, 2020 | | $ | 5,106,441.82 | |
5.34% Commercial Fixed | | May 15, 2007 - October 15, 2007 | | April 15, 2011 - April 15, 2020 | | SEK | 111,627,051.76 | |
5.64% Commercial Fixed | | October 15, 2007 | | April 15, 2011 - April 15, 2020 | | SEK | 104,175,349.00 | |
6.06% Commercial Fixed | | July 31, 2008 | | April 15, 2011 - April 15, 2020 | | SEK | 214,566,063.49 | |
5.79% Commercial Fixed | | September 16, 2008 | | April 15, 2011 - April 15, 2020 | | SEK | 146,878,284.55 | |
5.45% Commercial Fixed | | December 15, 2008 | | April 15, 2011 - April 15, 2020 | | SEK | 77,604,743.55 | |
5.50% Commercial Fixed | | July 31, 2008 - August 18, 2009 | | April 15, 2009 - October 15, 2018 | | SEK | 188,752,255.40 | |
162
| | | | | | | | |
Interest Rate | | Date of Issue | | Maturity Date | | Nominal Amount | |
5.60% Commercial Fixed | | December 15, 2009 | | April 15, 2010 - October 15, 2018 | | SEK | 1,372,754.83 | |
5.62% Commercial Fixed | | December 15, 2009 | | April 15, 2011 - April 15, 2020 | | SEK | 3,490,590.37 | |
5.335% Commercial Fixed | | April 15, 2009 | | April 15, 2011 - April 15, 2020 | | SEK | 2,833,435.63 | |
5.425% Commercial Fixed | | October 23, 2009 - April 15, 2010 | | April 15, 2011 - April 15, 2020 | | SEK | 24,153,961.10 | |
5.80% Commercial Fixed | | October 23, 2009 - April 15, 2010 | | April 15, 2010 - October 15, 2018 | | SEK | 75,810,302.45 | |
6.30% Commercial Fixed | | December 15, 2009 | | April 15, 2011 - April 15, 2020 | | SEK | 52,003,399.89 | |
5.475% Commercial Fixed | | May 20, 2010 - October 15, 2010 | | April 15, 2011 - April 15, 2020 | | SEK | 37,653,082.86 | |
5.525% Commercial Fixed | | December 13, 2010 - April 16, 2012 | | October 15, 2011 - April 15, 2020 | | SEK | 45,871,597.71 | |
5.565% Commercial Fixed | | October 17, 2011 | | April 15, 2012 - April 15, 2020 | | SEK | 59,020,860.18 | |
5.595% Commercial Fixed | | December 07, 2011 - March 20, 2012 | | April 15, 2011 - April 15, 2020 | | SEK | 31,007,020.52 | |
5.575% Commercial Fixed | | December 13, 2010 - April 16, 2012 | | October 15, 2011 - April 15, 2020 | | $ | 2,206,479.11 | |
5.355% Commercial Fixed | | April 6, 2010 | | April 15, 2011 - April 15, 2020 | | $ | 1,427,358.19 | |
5.47% Commercial Fixed | | March 8, 2010 - October 15, 2010 | | April 15, 2011 - April 15, 2020 | | $ | 1,921,318.74 | |
163
| | | | | | | | |
Interest Rate | | Date of Issue | | Maturity Date | | Nominal Amount | |
5.58% Commercial Fixed | | April 6, 2010 | | April 15, 2011 - April 15, 2020 | | $ | 930,352.76 | |
5.695% Commercial Fixed | | March 8, 2010 - October 15, 2010 | | April 15, 2011 - April 15, 2020 | | $ | 1,252,316.49 | |
5.80% Commercial Fixed | | December 13, 2010 - April 16, 2012 | | October 15, 2011 - April 15, 2020 | | $ | 1,438,184.21 | |
5.905% Commercial Fixed | | October 17, 2011 | | April 15, 2012 - April 15, 2020 | | $ | 1,850,444.87 | |
5.68% Commercial Fixed | | October 17, 2011 | | April 15, 2012 - April 15, 2020 | | $ | 2,838,974.48 | |
5.775% Commercial Fixed | | December 07, 2011 - March 20, 2012 | | April 15, 2011 - April 15, 2020 | | $ | 1,491,474.94 | |
6.00% Commercial Fixed | | December 07, 2011 - March 20, 2012 | | April 15, 2011 - April 15, 2020 | | $ | 972,182.30 | |
5.43% Commercial Fixed | | December 07, 2011 - March 20, 2012 | | April 15, 2011 - April 15, 2020 | | £ | 2,191,588.56 | |
1.750% Commercial Fixed | | April 15, 2009 - September 11, 2012 | | April 15, 2011 - April 15, 2020 | | $ | 1,446,961.55 | |
1.158% Commercial Fixed | | April 16, 2012 | | October 15, 2012 - October 15, 2018 | | € | 88,934.82 | |
1.049% Commercial Fixed | | October 23, 2009 - March 22, 2011 | | April 15, 2010 - October 15, 2015 | | £ | 105,468.68 | |
1.069% Commercial Fixed | | March 4, 2009 - March 22, 2011 | | April 15, 2009 - April 15, 2016 | | £ | 623,058.99 | |
1.671% Commercial Fixed | | May 08, 2012 - September 11, 2012 | | October 15, 2012 - April 15, 2020 | | £ | 870,106.71 | |
164
| | | | | | | | |
Interest Rate | | Date of Issue | | Maturity Date | | Nominal Amount | |
1.525% Commercial Fixed | | May 08, 2012 - September 11, 2012 | | April 15, 2011 - April 15, 2020 | | $ | 1,751,866.63 | |
2.162% Commercial Fixed | | October 23, 2009 | | April 15, 2010 - October 15, 2018 | | SEK | 374,118.19 | |
2.287% Commercial Fixed | | May 08, 2012 - September 11, 2012 | | October 15, 2012 - April 15, 2020 | | SEK | 25,605,856.58 | |
Note: —
Commercial Interest Reference Rate (CIRR). The CIRR is determined monthly by the OECD and published on the 14th day of each month. Each CIRR is fixed based on the previous 30-day treasury rate of each currency.
Source: South African National Treasury.
Total External Debt by Currency as of September 30, 2015
| | | | |
Euro | | € | 1,427,757,034 | |
Pound Sterling | | £ | 34,603,661 | |
Swedish Krone | | SEK | 3,122,181,017 | |
U.S. Dollars | | $ | 11,089,958,450 | |
Yen | | ¥ | 60,564,480,000 | |
Source: South African National Treasury.
165