Exhibit 99.D
Medium Term Budget Policy Statement 2018 National Treasury Republic of South Africa 24 October 2018

ISBN: 978-0-621-46859-5RP: RP415/2018The Medium Term Budget Policy Statement is compiled using the latest available information from departmental and other sources. Some of this information is unaudited or subject to revision. To obtain additional copies of this document, please contact: Communications Directorate National Treasury Private Bag X115 Pretoria 0001 South Africa Tel: +27 12 315 5944 Fax: +27 12 407 9055 The document is also available on the internet at: www.treasury.gov.za. ii
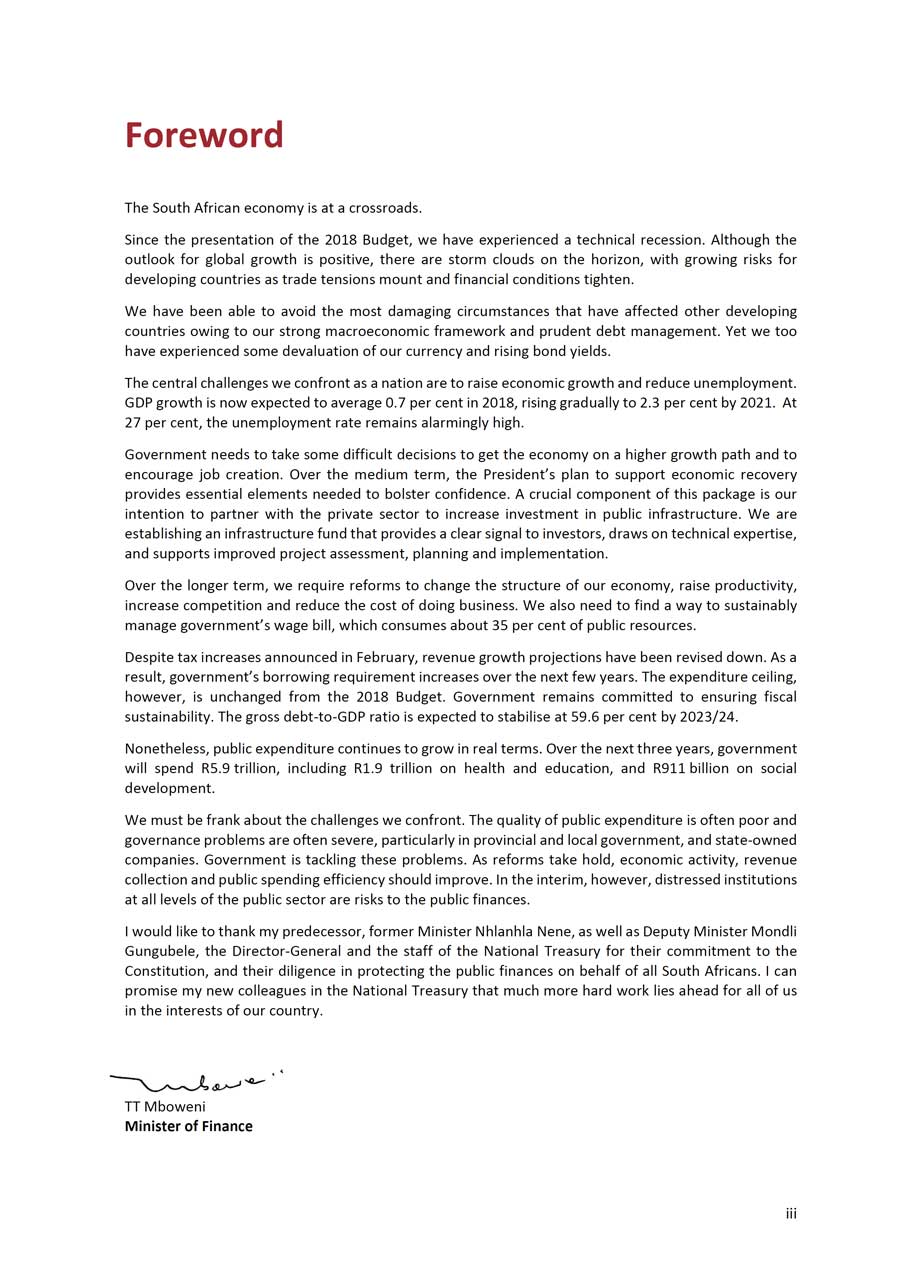
Foreword The South African economy is at a crossroads. Since the presentation of the 2018 Budget, we have experienced a technical recession. Although the outlook for global growth is positive, there are storm clouds on the horizon, with growing risks for developing countries as trade tensions mount and financial conditions tighten. We have been able to avoid the most damaging circumstances that have affected other developing countries owing to our strong macroeconomic framework and prudent debt management. Yet we too have experienced some devaluation of our currency and rising bond yields. The central challenges we confront as a nation are to raise economic growth and reduce unemployment. GDP growth is now expected to average 0.7 per cent in 2018, rising gradually to 2.3 per cent by 2021. At 27 per cent, the unemployment rate remains alarmingly high. Government needs to take some difficult decisions to get the economy on a higher growth path and to encourage job creation. Over the medium term, the President’s plan to support economic recovery provides essential elements needed to bolster confidence. A crucial component of this package is our intention to partner with the private sector to increase investment in public infrastructure. We are establishing an infrastructure fund that provides a clear signal to investors, draws on technical expertise, and supports improved project assessment, planning and implementation. Over the longer term, we require reforms to change the structure of our economy, raise productivity, increase competition and reduce the cost of doing business. We also need to find a way to sustainably manage government’s wage bill, which consumes about 35 per cent of public resources. Despite tax increases announced in February, revenue growth projections have been revised down. As a result, government’s borrowing requirement increases over the next few years. The expenditure ceiling, however, is unchanged from the 2018 Budget. Government remains committed to ensuring fiscal sustainability. The gross debt-to-GDP ratio is expected to stabilise at 59.6 per cent by 2023/24. Nonetheless, public expenditure continues to grow in real terms. Over the next three years, government will spend R5.9 trillion, including R1.9 trillion on health and education, and R911 billion on social development. We must be frank about the challenges we confront. The quality of public expenditure is often poor and governance problems are often severe, particularly in provincial and local government, and state-owned companies. Government is tackling these problems. As reforms take hold, economic activity, revenue collection and public spending efficiency should improve. In the interim, however, distressed institutions at all levels of the public sector are risks to the public finances. I would like to thank my predecessor, former Minister Nhlanhla Nene, as well as Deputy Minister Mondli Gungubele, the Director-General and the staff of the National Treasury for their commitment to the Constitution, and their diligence in protecting the public finances on behalf of all South Africans. I can promise my new colleagues in the National Treasury that much more hard work lies ahead for all of us in the interests of our country. TT Mboweni Minister of Finance iii
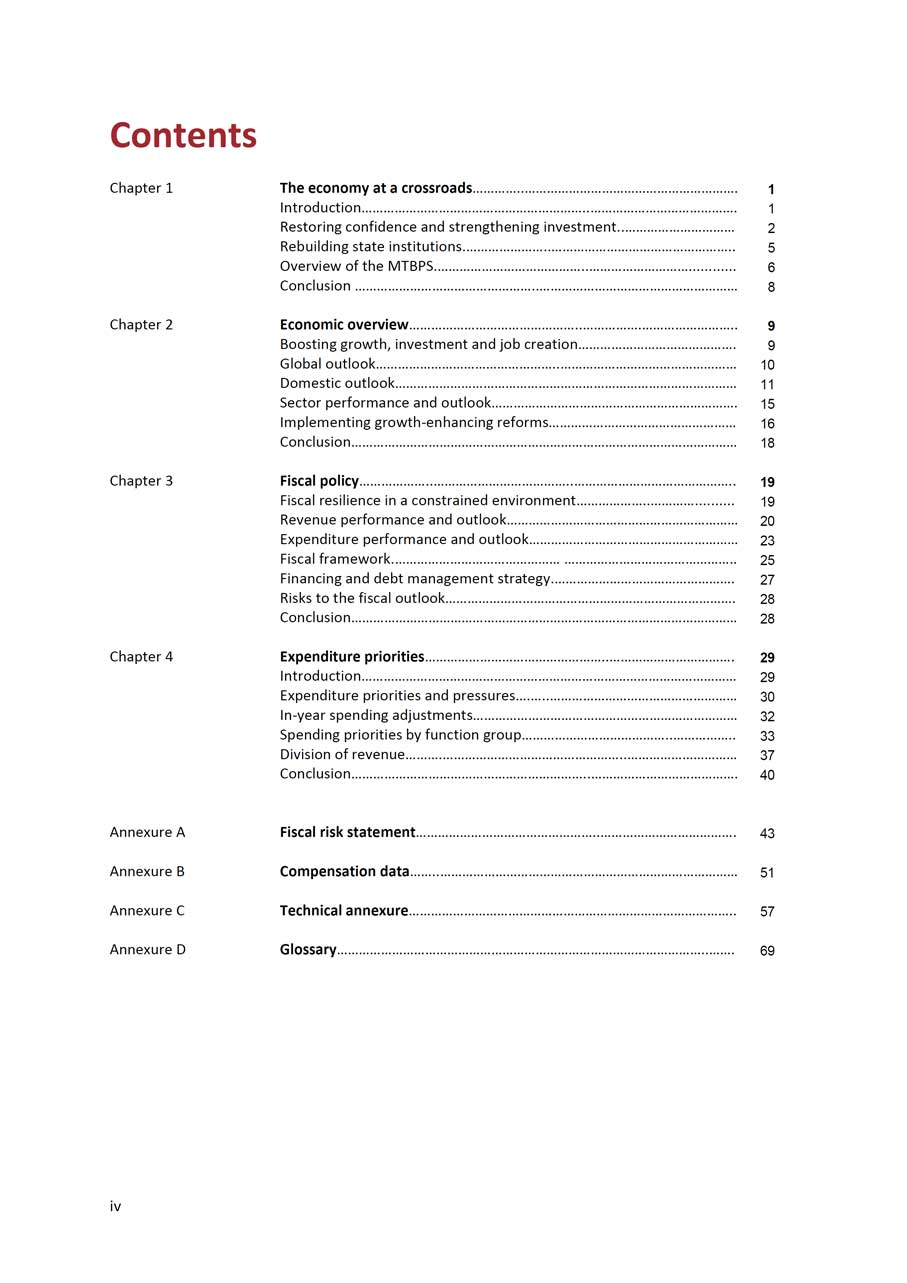
Contents Chapter 1 The economy at a crossroads…………..…………………………………………………. 1Introduction……………………………………………………..…………………………………. 1Restoring confidence and strengthening investment..………………………… 2Rebuilding state institutions.…………………..………………………………………….. 5Overview of the MTBPS.…………………………………..……………………… 6Conclusion …………………………………………..……………………………………………… 8Chapter 2 Economic overview………………………………………..…………….…………………….. 9Boosting growth, investment and job creation……………………………………. 9Global outlook…………………………………………..………………………………………… 10Domestic outlook………………………………………………………………………………… 11Sector performance and outlook…………………………………………………………. 15Implementing growth-enhancing reforms…………………………………………… 16Conclusion…………………………………………………………………………………………… 18Chapter 3 Fiscal policy………………..………………………………..…………………………………….. 19Fiscal resilience in a constrained environment………………..………… 19Revenue performance and outlook……………………………………………………… 20Expenditure performance and outlook………………………………………………… 23Fiscal framework.……………………………………… ……………………………………….. 25Financing and debt management strategy.…………………………………………. 27Risks to the fiscal outlook……………………………………………………………………. 28Conclusion…………………………………………………………………………………………… 28Chapter 4 Expenditure priorities…………………………………………..……………………………. 29Introduction………………………………………………………………………………………… 29Expenditure priorities and pressures….…..…………………………………………… 30In-year spending adjustments……………………………………………………………… 32Spending priorities by function group…………………………………..…………….. 33Division of revenue……….…………………………………………..………………………… 37Conclusion………………………………………………………..…………………………………. 40Annexure A Fiscal risk statement…………………………………………..………………………………. 43Annexure B Compensation data……..……………………………………………………………………… 51Annexure C Technical annexure…………………………………………………………………………….. 57Annexure D Glossary………………………………………………………………………………………..……. 69iv
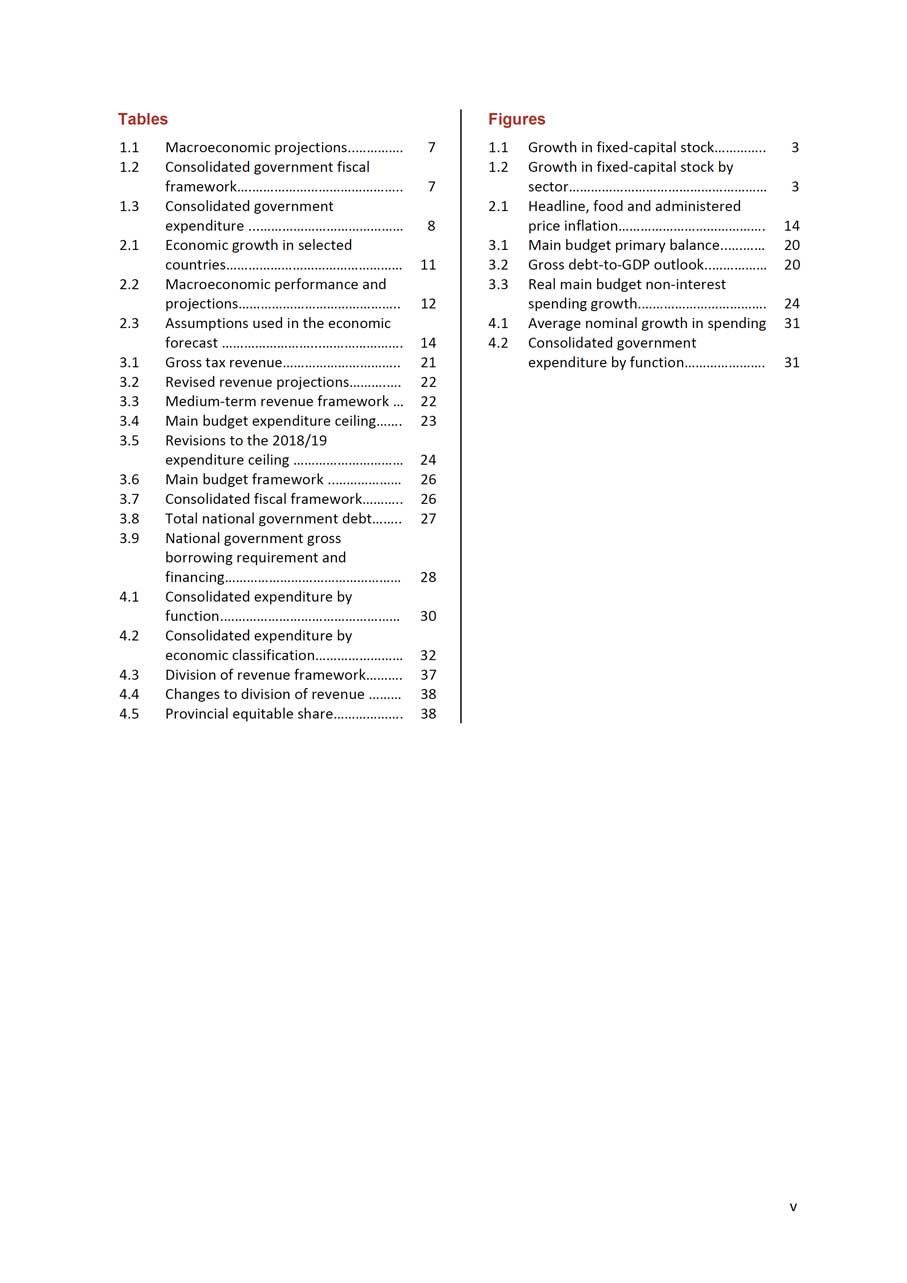
Tables1.1 Macroeconomic projections..………….1.2 Consolidated government fiscalframework….…………………………………..1.3 Consolidated governmentexpenditure ...…………………………………2.1 Economic growth in selectedcountries…………………………………………2.2 Macroeconomic performance andprojections……………………………………..2.3 Assumptions used in the economicforecast ……………………...………………….3.1 Gross tax revenue…………………………..3.2 Revised revenue projections……….….3.3 Medium-term revenue framework …3.4 Main budget expenditure ceiling…….3.5 Revisions to the 2018/19expenditure ceiling …………………………3.6 Main budget framework ..………………3.7 Consolidated fiscal framework………..3.8 Total national government debt……..3.9 National government grossborrowing requirement and financing…………………………………………4.1 Consolidated expenditure byfunction.…………………………………………4.2 Consolidated expenditure byeconomic classification……………………4.3 Division of revenue framework……….4.4 Changes to division of revenue ………4.5 Provincial equitable share……………….
Figures7 1.1 Growth in fixed-capital stock………….. 31.2 Growth in fixed-capital stock by7 sector……………………………………………… 32.1 Headline, food and administered8 price inflation…………………………………. 143.1 Main budget primary balance..….…… 2011 3.2 Gross debt-to-GDP outlook..…………… 203.3 Real main budget non-interest12 spending growth.……………………………. 244.1 Average nominal growth in spending 3114 4.2 Consolidated government21 expenditure by function…………………. 31 22222324262627283032373838v
1 The economy at a crossroads In brief South Africa finds itself at a crossroads. This Medium Term Budget Policy Statement (MTBPS) highlights the difficult economic and fiscal choices confronting government over the next several years. During 2018, South Africa has faced lower-than-expected economic growth and exchange rate depreciation. The global outlook remains positive, but is characterised by greater risk, particularly for developing economies. State institutions are being repaired and renewed, but serious governance challenges exist across the public sector. Government remains committed to fiscal sustainability, but there has been fiscal slippage since the 2018 Budget. Tax revenues have been revised down, partly due to higher value-added tax refunds. Despite spending pressures materialising, the expenditure ceiling remains intact as the anchor of fiscal policy. The consolidated budget deficit narrows from 4.2 per cent in 2019/20 to 4 per cent in 2021/22. Gross debt is expected to stabilise at 59.6 per cent of GDP in 2023/24. The President’s economic stimulus and recovery plan is intended to address the country’s most pressing challenges: anaemic economic growth and high unemployment. The initiative includes an infrastructure fund to be developed in partnership with the private sector, reforms to enhance economic growth and improve governance, and support for urgent education and health needs.
Introductionhe medium-term expenditure framework (MTEF) commits public resources of R5.9 trillion over the next three years. Of this amount,
R5.9 trillion of spending commitments complemented
R3.3 trillion or 56.2 per cent will be allocated to education, health, by balanced effort to
the provision of water and electricity services, and social grants. At the same time, government intends to consolidate the public finances in a balanced manner by maintaining the spending ceiling and ensuring that debt stabilises over the longer term.In combination, these commitments support economic and social development, and ensure sustainable support to millions of South Africans who live in poverty. Yet the resources available cannot be substantially expanded without faster economic growth and job creation. Poor economic performance in the first half of the year has put additional strain on the public finances. Unemployment remains elevated, and many low-
consolidate public finances1
2018 MEDIUM TERM BUDGET POLICY STATEMENT and middle-income households are contending with higher prices for water, electricity and transport. Governance failures and corruption have harmed public service delivery. Economic recovery requires a substantial improvement in business investment. The President has taken the lead in rebuilding confidence by appointing a team of investment advisors. The October 2018 Investment Conference will help to restore policy certainty.
Focus on reforms that support economic growth, reduceinflationary pressures and improve service deliveryPublic-service wageagreement exceeds budgeted baselines by R30.2 billionInflation targeting, flexible exchange rate and prudent debt management reduced effects of external volatility2
Over the period ahead, government is focusing on reforms that support economic growth, reduce inflationary pressures and improve service delivery. Fiscal options have become increasingly limited, and higher revenues need to flow from a broad-based economic expansion.Accordingly, this MTBPS prioritises three interlinked policy areas:• Implementing the President’s economic stimulus and recovery plan, particularly by encouraging private-sector investment.• Improving governance and financial management in national, provincial and local government departments to support service delivery.• Reforming state-owned companies. Improving the financial health of the major state-owned companies will take time, but measures arebeing taken to strengthen governance.Further steps are being taken to strengthen infrastructure planning and address shortcomings in public administration and finances. This includes the work of commissions investigating corruption and governance failures at several institutions, along with ongoing management training, financial strengthening and organisational renewal across the public sector.Government’s compensation bill accounts for about 35 per cent of consolidated expenditure, and forms the major driver of spending pressures. The 2018 public-service wage agreement exceeds budgeted baselines by about R30.2 billion through 2020/21. National and provincial departments are expected to absorb these costs within their R1.8 trillion compensation baselines over the same period. Government is working on an approach to manage these pressures over the medium term.Restoring confidence and strengthening investmentThe 2018 Budget set out expectations of improved economic performance that proved premature. During the first half of this year, South Africa experienced a technical recession - that is, declining quarter-on-quarter GDP - driven primarily by contractions in agriculture and mining.A strengthening US dollar and rising global interest rates have triggered fiscal crises in several major developing countries. South Africa’s inflation targeting regime, flexible exchange rate and prudent debt management strategy have protected the economy from some of the global fallout. But these events have led to a sharp depreciation of the rand and large increases in government bond yields.To promote a return to faster growth and job creation, the President announced an economic stimulus and recovery plan in September 2018. The initiative focuses on five interventions:
CHAPTER 1: THE ECONOMY AT A CROSSROADS • Implementing growth-enhancing economic reforms • Reprioritising public spending to support economic growth and job creation • Establishing an infrastructure fund • Addressing urgent matters in education and health • Investing in municipal social infrastructure improvement. Boosting infrastructure investment
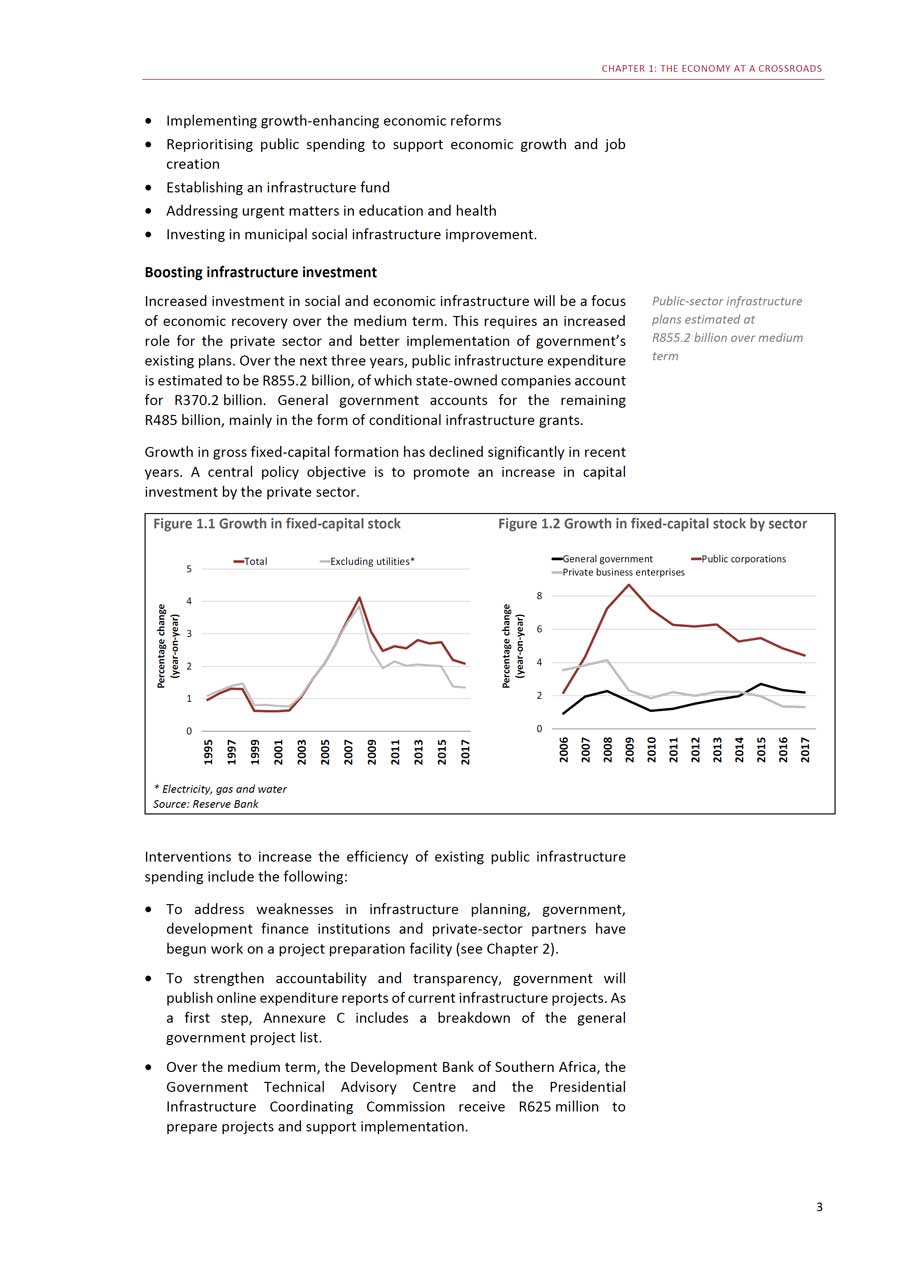
Increased investment in social and economic infrastructure will be a focus of economic recovery over the medium term. This requires an increased role for the private sector and better implementation of government’s existing plans. Over the next three years, public infrastructure expenditure is estimated to be R855.2 billion, of which state-owned companies account for R370.2 billion. General government accounts for the remaining R485 billion, mainly in the form of conditional infrastructure grants.Growth in gross fixed-capital formation has declined significantly in recent years. A central policy objective is to promote an increase in capital investment by the private sector.
Public-sector infrastructure plans estimated atR855.2 billion over medium term
Figure 1.1 Growth in fixed-capital stockTotal Excluding utilities*543210* Electricity, gas and water Source: Reserve Bank
Figure 1.2 Growth in fixed-capital stock by sectorGeneral government Public corporations Private business enterprises86420
Interventions to increase the efficiency of existing public infrastructure spending include the following: • To address weaknesses in infrastructure planning, government, development finance institutions and private-sector partners have begun work on a project preparation facility (see Chapter 2). • To strengthen accountability and transparency, government will publish online expenditure reports of current infrastructure projects. As a first step, Annexure C includes a breakdown of the general government project list. • Over the medium term, the Development Bank of Southern Africa, the Government Technical Advisory Centre and the Presidential Infrastructure Coordinating Commission receive R625 million to prepare projects and support implementation. 3
2018 MEDIUM TERM BUDGET POLICY STATEMENT • Government is negotiating access to infrastructure funding from development finance institutions, multilateral development banks and private banks. These institutions have committed technical resources to help plan, approve, manage and implement projects. • Consideration is being given to scaling up selected urban investment programmes by switching their financing from national government’s balance sheet to development finance institutions, which would facilitate additional technical support. The infrastructure initiative announced by the President builds on efforts to transform public infrastructure provision. It will support projects with “blended” finance, combining capital from the public and private sectors, and development finance institutions. Work to design the fund is under way, with assistance from the private sector and multilateral development banks. Government will report on the progress of these deliberations in the 2019 Budget. Fund design to include The fund is expected to identify innovative financing mechanisms andinnovative financing and allow for accompanying regulatory reforms. An example of this approachregulatory reforms is the Renewable Energy Independent Power Producer Programme, whichinvolved very little public funding, but required offtake agreements guaranteeing future cash flow, and regulatory changes to allow private electricity production. Improved oversight and implementation of the existing capital budget can sharply reduce underspending, which based on recent performance is estimated at R30 billion over the MTEF period. A framework for financing infrastructure Government will develop a framework for investors to assess potential long-term returns on public infrastructure projects. This will support funding from development finance institutions, commercial banks and pension funds. Innovative financing mechanisms (such as initial capital payments, current subsidies or guaranteed offtake agreements) may also be proposed alongside regulatory reforms. Government will publish a list of projects suitable for private-sector and development finance support. Projects will initially be evaluated on the following basis: • Can the project be fully privately funded? Many large infrastructure projects are commercially sustainable. Rather than commit scarce public resources, government will remove regulatory impediments that stand in the way of projects in sectors such as housing, telecommunications and transport (airports, for example). • Is hybrid funding an option? If the project is borderline commercially viable, the fund could support a range of hybrid options, including public-private partnerships, concessional financing, government guarantees, loan subsidies and development finance. • Are there clear social benefits? If the project is not commercially viable and has demonstrated benefits, direct fiscal support may be provided. Reform, reprioritisation, and interventions in health and education The structure of South Africa’s economy is not conducive to high growth or job creation. Network industries - energy, water, transport and telecommunications - need to be modernised. Barriers to entry remain high, making it difficult for small businesses to compete. During 2018, government has initiated reforms in several areas. These include creating policy certainty in the mining and energy sectors by finalising the Mining Charter and updating the Integrated Resource Plan. Growth-enhancing policy initiatives are also under way in the telecommunications, electricity and transport sectors (see Chapter 2). 4
CHAPTER 1: THE ECONOMY AT A CROSSROADS To support these reforms within a constrained fiscal framework, government is proposing reprioritisation of R32.4 billion over the next three years. Of this amount, R15.9 billion goes towards faster-spending infrastructure programmes (including R3.4 billion for school infrastructure and eradicating pit latrines), clothing and textile incentives, and the Expanded Public Works Programme. The remaining R16.5 billion will be allocated to various programmes, including recapitalising the South African Revenue Service (SARS), a minimum wage for community health workers, critical posts and goods and services in health, and streamlining the management of the justice system.
In addition, changes to grant structures amounting to R14.7 billion will promote upgrading of informal settlements in partnership with communities. Housing subsidies amounting to R1 billion will be centralised to better support middle- and lower-income home buyers. In the current year, R1.7 billion is added to infrastructure spending (including funding for fast-spending school building programmes), and R3.4 billion is allocated to drought relief, mostly to upgrade water infrastructure.Rebuilding state institutionsSouth Africa’s budgets for social and economic services are substantial, but the quality of spending is in many areas unacceptably poor, undermining (and in some cases collapsing) service delivery. Poor governance - reflected in inefficiency, corruption and financial mismanagement - reduces the impact of spending and increases pressure on the budget.Government has begun the process of rebuilding important state institutions. The Judicial Commission of Inquiry into Allegations of State Capture, chaired by Deputy Chief Justice Raymond Zondo, and the Commission of Inquiry into Tax Administration and Governance by the South African Revenue Service, chaired by retired Judge Robert Nugent, have both highlighted serious governance failures. These failures are beginning to be addressed. At SARS, for example, reforms under way include regularising VAT refund payments and rebuilding enforcement capacity. This process is supported through the budget, which reprioritises R1.4 billion to SARS over the medium term.Yet serious challenges remain. Some national, provincial and municipal departments are in financial disarray. The Auditor-General’s latest findings raise significant concerns about the level of irregular spending across government. The independent report on VBS Mutual Bank, including the reported large-scale theft of public funds, reinforces those concerns.While the scale of deterioration in the public sector is serious, key institutions established by the Constitution have proven resilient. Parliament, the courts and the Reserve Bank have helped to uncover corruption, with the support of a robust media.The National Treasury’s efforts to strengthen financial management include:• Working with the Auditor-General and law enforcement agencies to reduce irregular expenditure in government, and improving
R14.7 billion for upgrading informal settlements inpartnership with communitiesGovernance failures uncovered in state institutions arebeginning to be addressedWhile deterioration is cause for concern, constitutional institutions have provenresilient5
2018 MEDIUM TERM BUDGET POLICY STATEMENT transparency in expenditure classification to reduce fraud and opportunities for corruption. • Enhancing public finance capacity-building in local government by deploying skilled professionals to manage and recover revenue. • Introducing a strategic framework to support more efficient, cost- effective and transparent procurement efforts, particularly in the health sector. Procurement policy also aims to support small and blackowned businesses. • Developing a framework that will include financial recovery plans to address non-performing departments. Reforming state-owned companies
Reforms under way at Eskom, Transnet, Denel, SA Express and PRASARestructuring of network industries is underconsideration6
The finances of major state-owned companies remain weak. Government has initiated reforms in these entities to improve governance and strengthen financial management:• Over the past year, new boards and executives have been appointed at Denel, Transnet, South African Express Airways and the Passenger RailAgency of South Africa (PRASA).• The Auditor-General is working alongside private firms on the audits of several state-owned companies. To date, previously unreportedirregular expenditure amounting to R27 billion has come to light.• The boards of state-owned companies have initiated forensic investigations into allegations of corruption and are taking actionwhere evidence shows employee involvement in maladministration.• The Eskom board is preparing a long-term turnaround strategy to be presented to government in November 2018, and several other entitieshave updated their turnaround strategies in recent months.Reforms to strengthen network industries, provide sustainable and affordable increases in water and electricity, and reduce the costs of doing business are likely to require major changes in the mandates and operations of state-owned companies. Such changes will build on successes such as the Renewable Energy Independent Power Producer Programme, which has substantially increased private participation in the energy sector, generating 46 000 jobs to date. Government has begun to study long-term reforms in electricity, telecommunications, transport and logistics. Without restructuring, there is a significant risk that the weak financial condition of state-owned companies will put major pressure on the public finances.Government has published a draft Integrated Resource Plan for public comment. Once the plan is final, it will provide long-term certainty on the country’s future energy plans.Overview of the MTBPSEconomic outlookChapter 2 sets out the medium-term economic forecast, together with details of government’s efforts to accelerate economic growth. The GDP
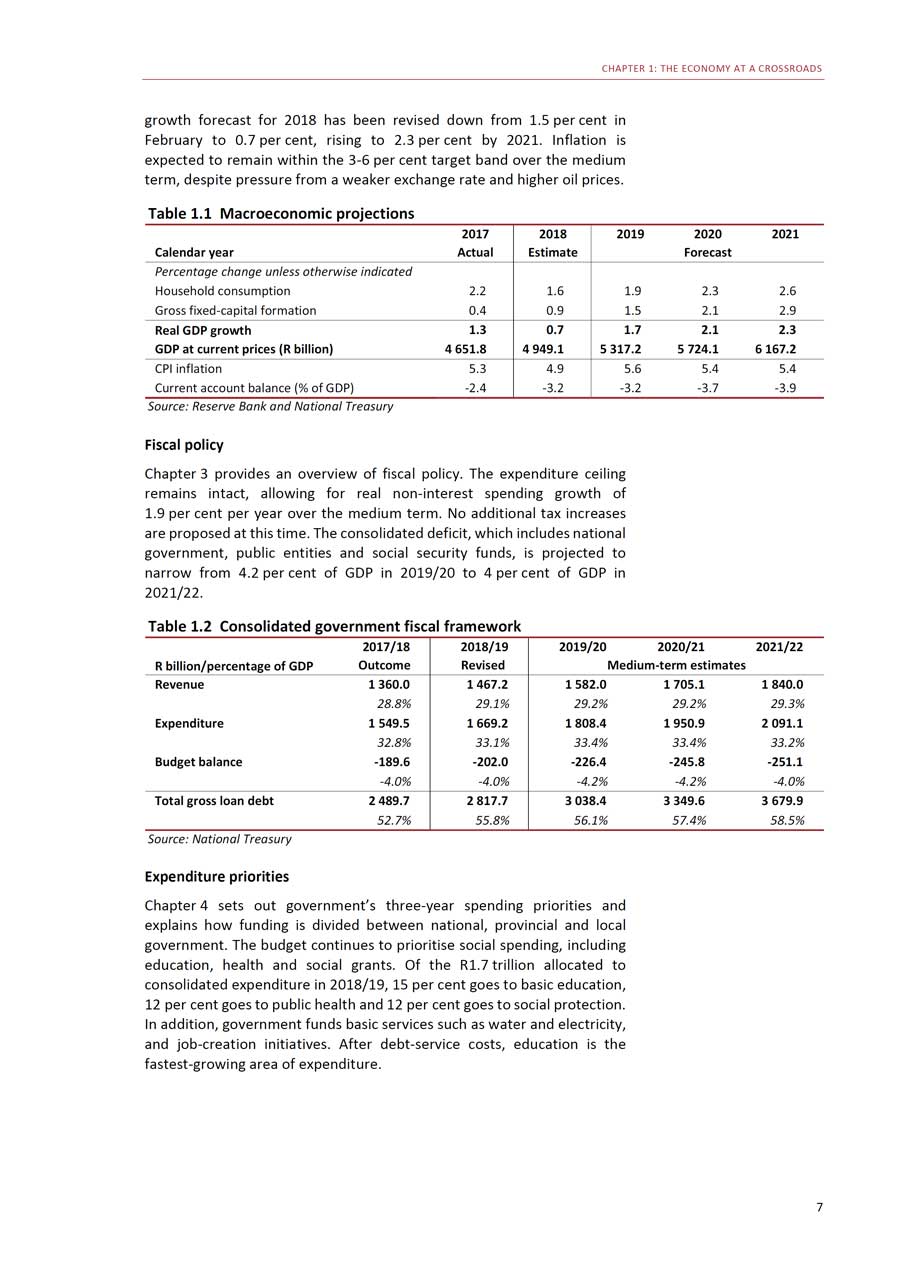
CHAPTER 1: THE ECONOMY AT A CROSSROADS growth forecast for 2018 has been revised down from 1.5 per cent in February to 0.7 per cent, rising to 2.3 per cent by 2021. Inflation is expected to remain within the 3-6 per cent target band over the medium term, despite pressure from a weaker exchange rate and higher oil prices. Table 1.1 Macroeconomic projections 2017 2018 2019 2020 2021Calendar year Actual Estimate ForecastPercentage change unless otherwise indicatedHousehold consumption 2.2 1.6 1.9 2.3 2.6Gross fixed-capital formation 0.4 0.9 1.5 2.1 2.9Real GDP growth 1.3 0.7 1.7 2.1 2.3GDP at current prices (R billion) 4 651.8 4 949.1 5 317.2 5 724.1 6 167.2CPI inflation 5.3 4.9 5.6 5.4 5.4Current account balance (% of GDP) -2.4 -3.2 -3.2 -3.7 -3.9Source: Reserve Bank and National Treasury Fiscal policy Chapter 3 provides an overview of fiscal policy. The expenditure ceiling remains intact, allowing for real non-interest spending growth of 1.9 per cent per year over the medium term. No additional tax increases are proposed at this time. The consolidated deficit, which includes national government, public entities and social security funds, is projected to narrow from 4.2 per cent of GDP in 2019/20 to 4 per cent of GDP in 2021/22. Table 1.2 Consolidated government fiscal framework 2017/18 2018/19 2019/20 2020/21 2021/22R billion/percentage of GDP Outcome Revised Medium-term estimatesRevenue 1 360.0 1 467.2 1 582.0 1 705.1 1 840.028.8% 29.1% 29.2% 29.2% 29.3%Expenditure 1 549.5 1 669.2 1 808.4 1 950.9 2 091.132.8% 33.1% 33.4% 33.4% 33.2%Budget balance -189.6 -202.0 -226.4 -245.8 -251.1-4.0% -4.0% -4.2% -4.2% -4.0%Total gross loan debt 2 489.7 2 817.7 3 038.4 3 349.6 3 679.952.7% 55.8% 56.1% 57.4% 58.5%Source: National Treasury Expenditure priorities Chapter 4 sets out government’s three-year spending priorities and explains how funding is divided between national, provincial and local government. The budget continues to prioritise social spending, including education, health and social grants. Of the R1.7 trillion allocated to consolidated expenditure in 2018/19, 15 per cent goes to basic education, 12 per cent goes to public health and 12 per cent goes to social protection. In addition, government funds basic services such as water and electricity, and job-creation initiatives. After debt-service costs, education is the fastest-growing area of expenditure. 7
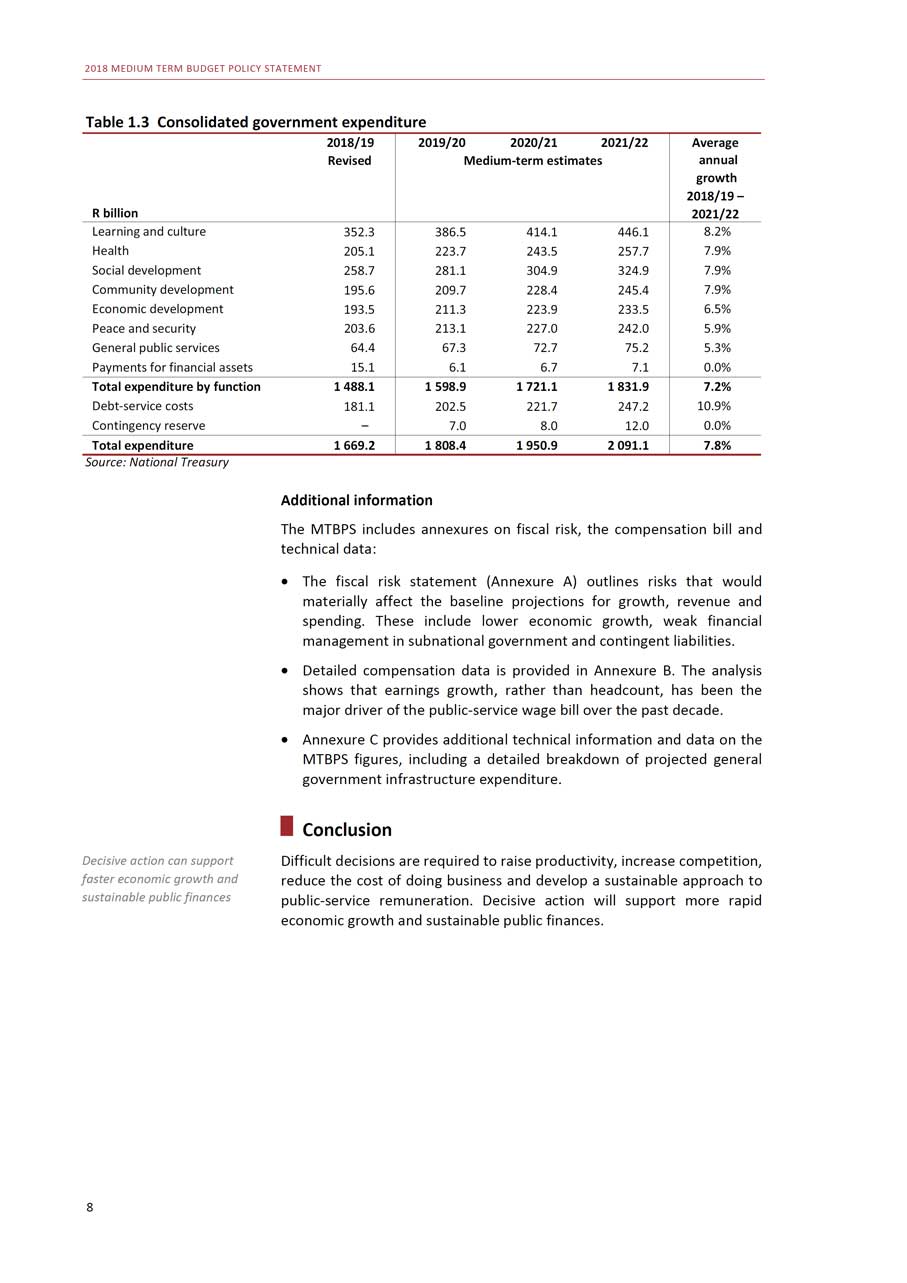
2018 MEDIUM TERM BUDGET POLICY STATEMENT Table 1.3 Consolidated government expenditure 2018/19 2019/20 2020/21 2021/22 AverageRevised Medium-term estimates annualgrowth2018/19 -R billion 2021/22Learning and culture 352.3 386.5 414.1 446.1 8.2%Health 205.1 223.7 243.5 257.7 7.9%Social development 258.7 281.1 304.9 324.9 7.9%Community development 195.6 209.7 228.4 245.4 7.9%Economic development 193.5 211.3 223.9 233.5 6.5%Peace and security 203.6 213.1 227.0 242.0 5.9%General public services 64.4 67.3 72.7 75.2 5.3%Payments for financial assets 15.1 6.1 6.7 7.1 0.0%Total expenditure by function 1 488.1 1 598.9 1 721.1 1 831.9 7.2%Debt-service costs 181.1 202.5 221.7 247.2 10.9%Contingency reserve - 7.0 8.0 12.0 0.0%Total expenditure 1 669.2 1 808.4 1 950.9 2 091.1 7.8%Source: National Treasury Additional information The MTBPS includes annexures on fiscal risk, the compensation bill and technical data: • The fiscal risk statement (Annexure A) outlines risks that would materially affect the baseline projections for growth, revenue and spending. These include lower economic growth, weak financial management in subnational government and contingent liabilities. • Detailed compensation data is provided in Annexure B. The analysis shows that earnings growth, rather than headcount, has been the major driver of the public-service wage bill over the past decade. • Annexure C provides additional technical information and data on the MTBPS figures, including a detailed breakdown of projected general government infrastructure expenditure. Conclusion
Decisive action can support faster economic growth and sustainable public finances8
Difficult decisions are required to raise productivity, increase competition, reduce the cost of doing business and develop a sustainable approach to public-service remuneration. Decisive action will support more rapid economic growth and sustainable public finances.
2 Economic overview In brief • GDP growth has been revised from 1.5 to 0.7 per cent in 2018 following a recession in the first half of the year. The economic outlook is weaker than projected in the 2018 Budget, although GDP growth is expected to recover gradually to 2.3 per cent by 2021 as confidence grows and investment gathers pace. • The global economy is expected to continue growing at 3.7 per cent in 2018 and 2019. Global risks, however, are becoming more pronounced. Small and open developing economies, such as South Africa, are increasingly vulnerable to financial volatility and trade disruption. • Government’s economic stimulus and recovery plan is intended to support a return to higher growth over the medium term. A combination of policy certainty, growth-enabling economic reforms, improved governance, and partnerships with business and labour will be key to restoring confidence and investment. Infrastructure spending will also support economic activity and job creation.
Boosting growth, investment and job creation South Africa needs strong, sustained economic growth to sharply reduce unemployment, and to encourage inclusive development and
Strong, sustained economic growth needed to sharply
transformation. The National Development Plan (NDP) put forward reduce unemployment
the goal of 5.4 per cent GDP growth to support these objectives. Over the past decade, however, GDP growth has averaged 1.8 per cent - well below the level needed to transform the economy. At the time of the February 2018 Budget, a synchronised global recovery was expected, and there was a sense of optimism that confidence and investment would recover on the strength of improved political certainty. This contributed to higher business confidence, a strengthening rand, declining bond yields and a positive outlook. Yet the economy has not performed as expected. GDP grew by 0.6 per cent in the first half of 2018 compared with the same period in 2017. On a quarter-on-quarter basis, however, GDP fell during the first half of 2018, leading to a technical recession. Mining and agricultural production have contracted, import growth has accelerated and investment growth 9
2018 MEDIUM TERM BUDGET POLICY STATEMENT remains muted. Per-capita GDP continues to decline as the economy grows more slowly than the population.
Global concerns include mounting trade disputes and tightening financial conditionsBuilding partnerships that promote investment is central to government’s agendaGlobal growth expected to remain at 3.7 per cent in 2018 and 2019, decelerating thereafter10
Over the medium term, concerns about sharpening global trade disputes, volatile commodity prices and tightening financial conditions will weigh on investor confidence. If these risks materialise, they could prompt renewed risk aversion and financial volatility, leading to a less favourable environment for investment in and exports from developing countries.Confronted by low domestic growth and an uncertain global environment, government is taking steps to bolster economic activity, investment and job creation in the short to medium term. The economic stimulus and recovery plan announced by the President in September 2018 seeks to focus public spending in areas that can grow the economy, create jobs, accelerate necessary growth-enhancing reforms, promote infrastructure development, and tackle problems in education and healthcare.The October 2018 Jobs Summit followed extensive consultation in the National Economic Development and Labour Council, and underscores the importance of effective partnerships between the public and private sectors and civil society. The forthcoming Investment Conference will be complemented by an infrastructure fund being designed to attract private and development-finance capital to well-run public infrastructure projects that contribute to economic growth and development.Policy certainty in areas such as mining and energy is being restored, and the governance of state-owned companies and entities such as Eskom, Transnet and the South African Revenue Service (SARS) is being strengthened.Government is committed to macroeconomic stability and prudent fiscal management. Sustainable public finances, inflation targeting and a flexible exchange rate provide a platform to attract investment and absorb external shocks. To make the most of these macroeconomic building blocks, reforms are needed to transform the structure of the economy - raising productivity, increasing competition and reducing the cost of doing business.Global outlookThe world economy grew by 3.7 per cent in 2017, up from 3.3 per cent in 2016. Stronger growth in developed economies contributed to rising global trade and several developing economies (Russia, Brazil and Nigeria) emerged from recession. The International Monetary Fund (IMF) projects that global growth will remain at 3.7 per cent in 2018 and 2019.US economic growth is expected to slow from 2.9 per cent in 2018 to1.8 per cent by 2020 as the effects of fiscal stimulus wane. In the euro area, growth is expected to ease from 2.4 per cent in 2017 to 1.9 per cent by 2019 in response to reduced external demand. Uncertainty about the arrangements by which the United Kingdom will leave the European Union continues to undermine confidence.World trade volume growth is expected to slow to 4.2 per cent in 2018 and4 per cent in 2019, from 5.2 per cent in 2017, as trade tensions unfold.
CHAPTER 2: ECONOMIC OVERVIEW
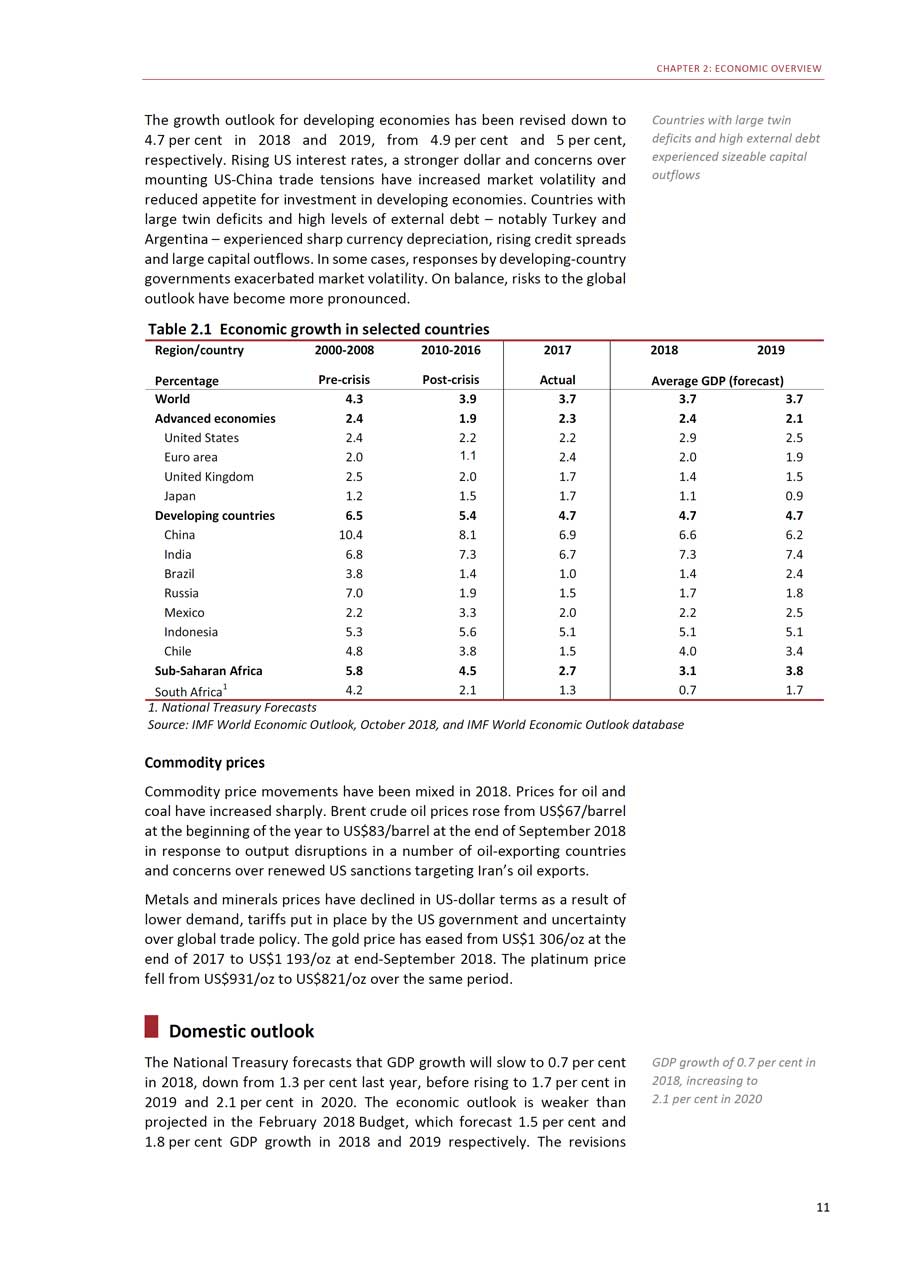
The growth outlook for developing economies has been revised down to4.7 per cent in 2018 and 2019, from 4.9 per cent and 5 per cent, respectively. Rising US interest rates, a stronger dollar and concerns over mounting US-China trade tensions have increased market volatility and reduced appetite for investment in developing economies. Countries with large twin deficits and high levels of external debt - notably Turkey and Argentina - experienced sharp currency depreciation, rising credit spreads and large capital outflows. In some cases, responses by developing-country governments exacerbated market volatility. On balance, risks to the global outlook have become more pronounced.Table 2.1 Economic growth in selected countries
Countries with large twin deficits and high external debt experienced sizeable capital outflows
Region/country 2000-2008 2010-2016 2017 2018 2019Percentage Pre-crisis Post-crisis Actual Average GDP (forecast)World 4.3 3.9 3.7 3.7 3.7Advanced economies 2.4 1.9 2.3 2.4 2.1United States 2.4 2.2 2.2 2.9 2.5Euro area 2.0 1.1 2.4 2.0 1.9United Kingdom 2.5 2.0 1.7 1.4 1.5Japan 1.2 1.5 1.7 1.1 0.9Developing countries 6.5 5.4 4.7 4.7 4.7China 10.4 8.1 6.9 6.6 6.2India 6.8 7.3 6.7 7.3 7.4Brazil 3.8 1.4 1.0 1.4 2.4Russia 7.0 1.9 1.5 1.7 1.8Mexico 2.2 3.3 2.0 2.2 2.5Indonesia 5.3 5.6 5.1 5.1 5.1Chile 4.8 3.8 1.5 4.0 3.4Sub-Saharan Africa 5.8 4.5 2.7 3.1 3.8South Africa1 4.2 2.1 1.3 0.7 1.71. National Treasury Forecasts Source: IMF World Economic Outlook, October 2018, and IMF World Economic Outlook database Commodity prices Commodity price movements have been mixed in 2018. Prices for oil and coal have increased sharply. Brent crude oil prices rose from US$67/barrel at the beginning of the year to US$83/barrel at the end of September 2018 in response to output disruptions in a number of oil-exporting countries and concerns over renewed US sanctions targeting Iran’s oil exports. Metals and minerals prices have declined in US-dollar terms as a result of lower demand, tariffs put in place by the US government and uncertainty over global trade policy. The gold price has eased from US$1 306/oz at the end of 2017 to US$1 193/oz at end-September 2018. The platinum price fell from US$931/oz to US$821/oz over the same period. Domestic outlook
The National Treasury forecasts that GDP growth will slow to 0.7 per cent in 2018, down from 1.3 per cent last year, before rising to 1.7 per cent in 2019 and 2.1 per cent in 2020. The economic outlook is weaker than projected in the February 2018 Budget, which forecast 1.5 per cent and1.8 per cent GDP growth in 2018 and 2019 respectively. The revisions
GDP growth of 0.7 per cent in 2018, increasing to2.1 per cent in 202011
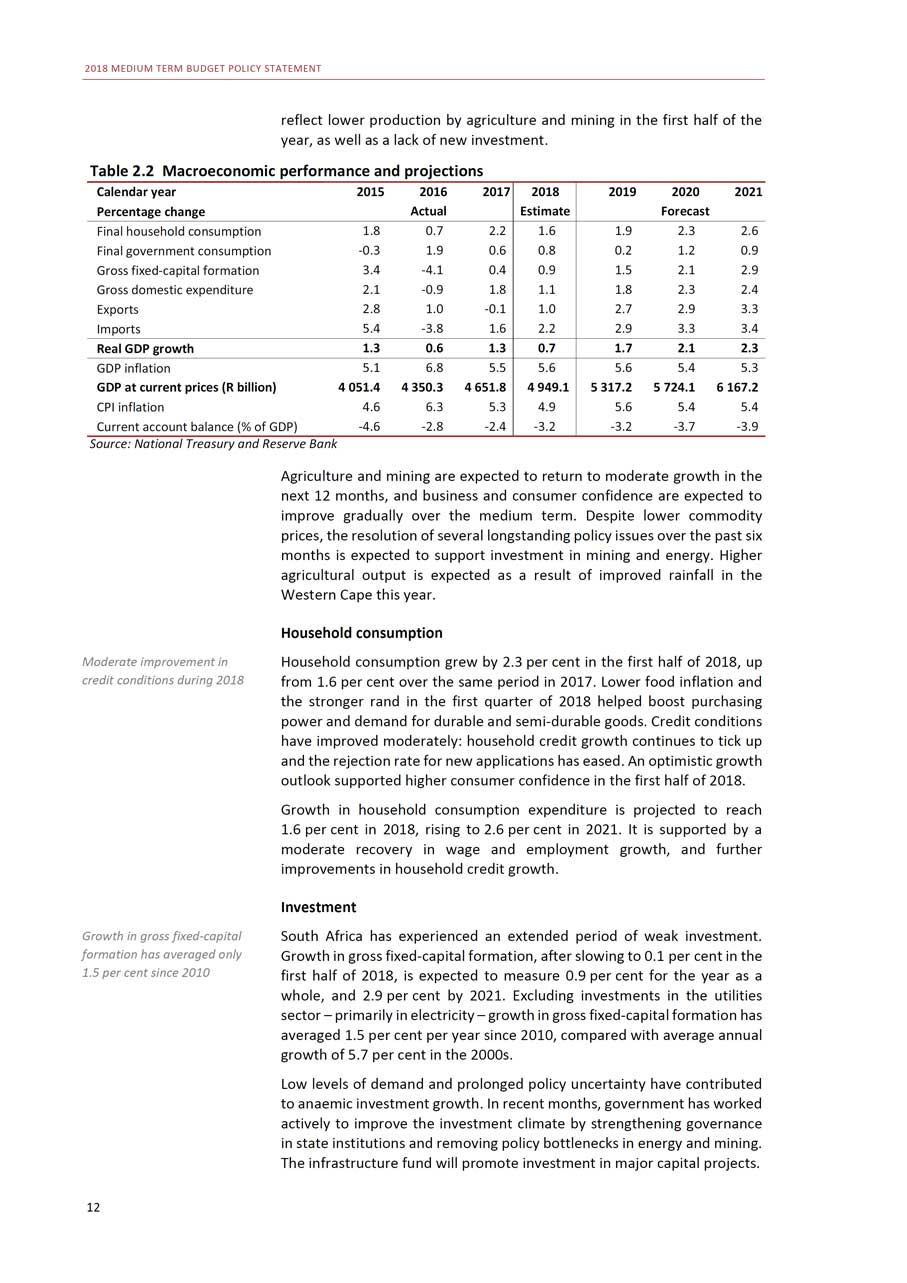
2018 MEDIUM TERM BUDGET POLICY STATEMENT reflect lower production by agriculture and mining in the first half of the year, as well as a lack of new investment. Table 2.2 Macroeconomic performance and projections Calendar year 2015 2016 2017 2018 2019 2020 2021Percentage change Actual Estimate ForecastFinal household consumption 1.8 0.7 2.2 1.6 1.9 2.3 2.6Final government consumption -0.3 1.9 0.6 0.8 0.2 1.2 0.9Gross fixed-capital formation 3.4 -4.1 0.4 0.9 1.5 2.1 2.9Gross domestic expenditure 2.1 -0.9 1.8 1.1 1.8 2.3 2.4Exports 2.8 1.0 -0.1 1.0 2.7 2.9 3.3Imports 5.4 -3.8 1.6 2.2 2.9 3.3 3.4Real GDP growth 1.3 0.6 1.3 0.7 1.7 2.1 2.3GDP inflation 5.1 6.8 5.5 5.6 5.6 5.4 5.3GDP at current prices (R billion) 4 051.4 4 350.3 4 651.8 4 949.1 5 317.2 5 724.1 6 167.2CPI inflation 4.6 6.3 5.3 4.9 5.6 5.4 5.4Current account balance (% of GDP) -4.6 -2.8 -2.4 -3.2 -3.2 -3.7 -3.9Source: National Treasury and Reserve Bank Agriculture and mining are expected to return to moderate growth in the next 12 months, and business and consumer confidence are expected to improve gradually over the medium term. Despite lower commodity prices, the resolution of several longstanding policy issues over the past six months is expected to support investment in mining and energy. Higher agricultural output is expected as a result of improved rainfall in the Western Cape this year. Household consumption
Moderate improvement in credit conditions during 2018Growth in gross fixed-capital formation has averaged only1.5 per cent since 201012
Household consumption grew by 2.3 per cent in the first half of 2018, up from 1.6 per cent over the same period in 2017. Lower food inflation and the stronger rand in the first quarter of 2018 helped boost purchasing power and demand for durable and semi-durable goods. Credit conditions have improved moderately: household credit growth continues to tick up and the rejection rate for new applications has eased. An optimistic growth outlook supported higher consumer confidence in the first half of 2018.Growth in household consumption expenditure is projected to reach1.6 per cent in 2018, rising to 2.6 per cent in 2021. It is supported by a moderate recovery in wage and employment growth, and further improvements in household credit growth.InvestmentSouth Africa has experienced an extended period of weak investment. Growth in gross fixed-capital formation, after slowing to 0.1 per cent in the first half of 2018, is expected to measure 0.9 per cent for the year as a whole, and 2.9 per cent by 2021. Excluding investments in the utilities sector - primarily in electricity - growth in gross fixed-capital formation has averaged 1.5 per cent per year since 2010, compared with average annual growth of 5.7 per cent in the 2000s.Low levels of demand and prolonged policy uncertainty have contributed to anaemic investment growth. In recent months, government has worked actively to improve the investment climate by strengthening governance in state institutions and removing policy bottlenecks in energy and mining. The infrastructure fund will promote investment in major capital projects.

CHAPTER 2: ECONOMIC OVERVIEW Exchange rate
In the first three quarters of 2018, the rand weakened by 12.4 per cent against the US dollar. The currency depreciated largely in response to a strengthening of the dollar, negative investor sentiment induced by market volatility in Turkey and Argentina, and wider concerns about trade tensions. Low levels of domestic economic growth contributed to rand weakness.Balance of paymentsThe current account deficit widened to 4 per cent of GDP during the first half of 2018 from 2.4 per cent over the same period in 2017. This was largely due to a smaller trade surplus, higher net income payments and deteriorating terms of trade. The value of total exports of goods and services rose by 1.3 per cent in the first half of 2018, while that of imports of goods and services rose by 4.4 per cent. The current account deficit is expected to average 3.2 per cent of GDP in 2018, rising to 3.9 per cent over the medium term, as a result of import growth and weaker terms of trade.EmploymentUnemployment remains extremely high. Government recognises the centrality of private-sector job creation in sustainably reducing joblessness. Changes in employment levels over the past year have been marginal, with unemployment at 27.2 per cent in the second quarter of 2018. Formal non-agricultural employment grew by 0.3 per cent in the first half of the year, compared with the same period in 2017. Average employment in the government sector, which accounts for about21 per cent of total formal non-agricultural employment, rose by1.8 per cent in the first half of the year, mostly as a result of temporary employment for voter registration. Employment outside government declined by 0.1 per cent in the first half of 2018.InflationHeadline inflation continued to ease in 2018, averaging 4.5 per cent over the first eight months of the year compared with 5.5 per cent over the same period in 2017. This trend was largely driven by lower food inflation. Core inflation, which excludes food, fuel and electricity prices, slowed from4.9 per cent in the first eight months of 2017 to 4.2 per cent over the same period in 2018. Inflation expectations have eased slightly in 2018 but remain near the upper end of the 3 to 6 per cent target range.Higher inflation is expected during the remainder of 2018 in response to administered price increases. In recent months, rising oil prices and a weaker currency led to a sharp increase in fuel prices. Electricity prices, which rose by 2.1 per cent in August 2017, increased by 7.8 per cent in August 2018.Headline inflation is projected to average 4.9 per cent in 2018, rising to5.4 per cent by 2021 as food price inflation returns to its historic average. The medium-term outlook has adjusted the assumption of electricity price inflation from 8 per cent to 10 per cent.
Rand depreciated by12.4 percent against US dollar in first nine months of 2018Private-sector job creation is central to sustainably reducing unemploymentInflation has eased, but is expected to increase in response to higher oil and administered pricesMedium-term inflation projections remain within targeted range13
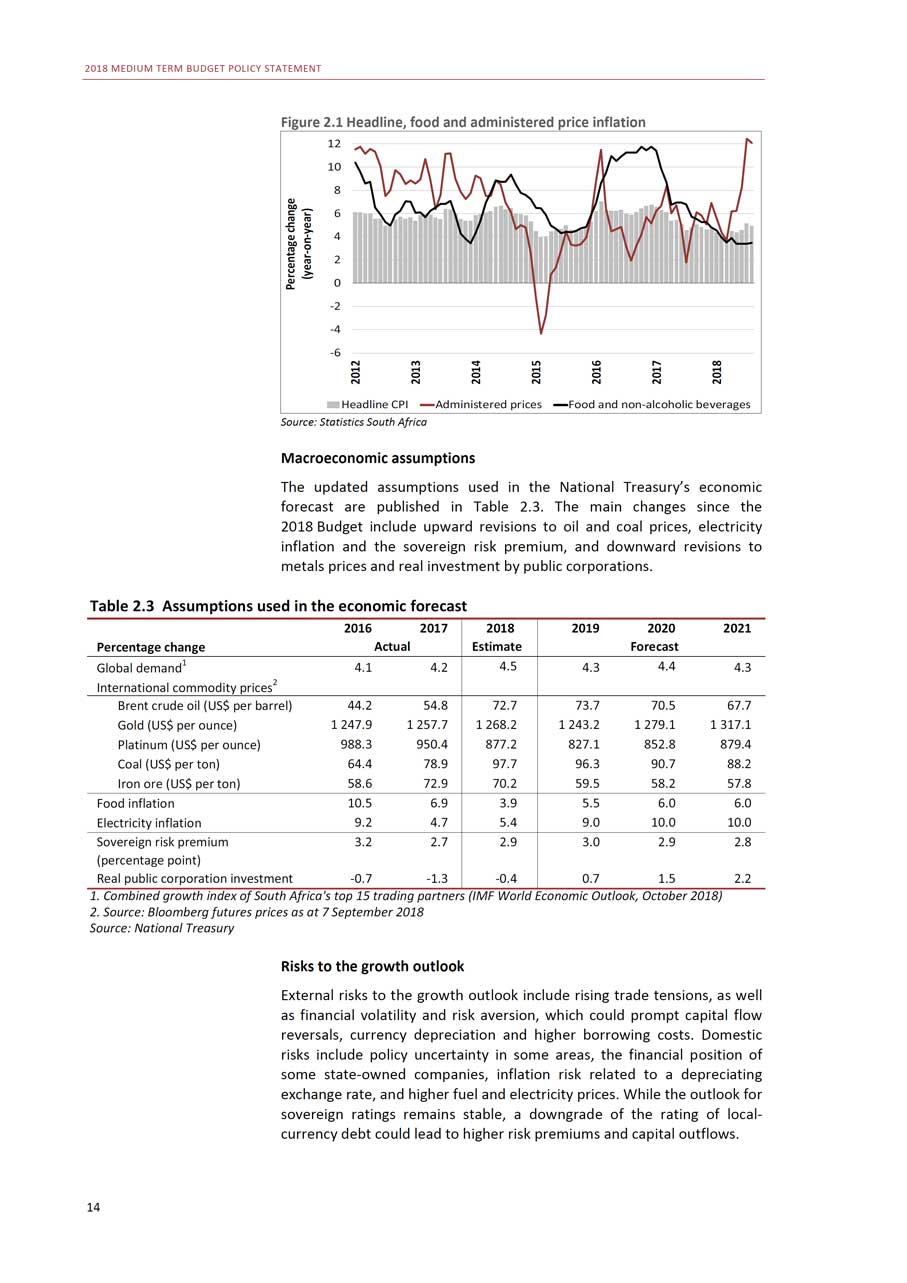
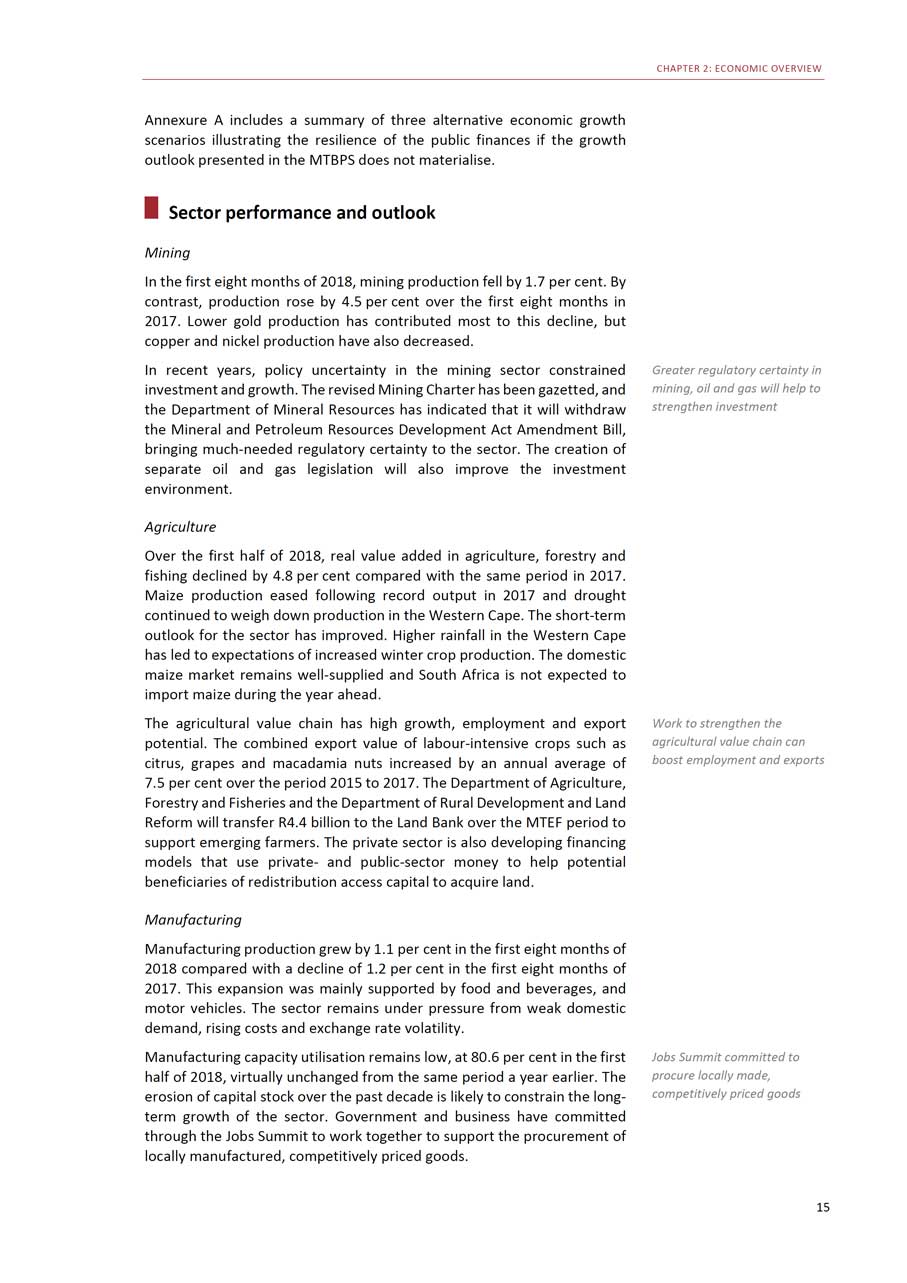
2018 MEDIUM TERM BUDGET POLICY STATEMENT Figure 2.1 Headline, food and administered price inflation 12 10 8 6 4 2 0 -2 -4 -6 Headline CPI Administered prices Food and non-alcoholic beveragesSource: Statistics South Africa Macroeconomic assumptions The updated assumptions used in the National Treasury’s economic forecast are published in Table 2.3. The main changes since the 2018 Budget include upward revisions to oil and coal prices, electricity inflation and the sovereign risk premium, and downward revisions to metals prices and real investment by public corporations. Table 2.3 Assumptions used in the economic forecast 2016 2017 2018 2019 2020 2021Percentage change Actual Estimate ForecastGlobal demand1 4.1 4.2 4.5 4.3 4.4 4.3International commodity prices2Brent crude oil (US$ per barrel) 44.2 54.8 72.7 73.7 70.5 67.7Gold (US$ per ounce) 1 247.9 1 257.7 1 268.2 1 243.2 1 279.1 1 317.1Platinum (US$ per ounce) 988.3 950.4 877.2 827.1 852.8 879.4Coal (US$ per ton) 64.4 78.9 97.7 96.3 90.7 88.2Iron ore (US$ per ton) 58.6 72.9 70.2 59.5 58.2 57.8Food inflation 10.5 6.9 3.9 5.5 6.0 6.0Electricity inflation 9.2 4.7 5.4 9.0 10.0 10.0Sovereign risk premium 3.2 2.7 2.9 3.0 2.9 2.8(percentage point) Real public corporation investment -0.7 -1.3 -0.4 0.7 1.5 2.21. Combined growth index of South Africa’s top 15 trading partners (IMF World Economic Outlook, October 2018) 2. Source: Bloomberg futures prices as at 7 September 2018 Source: National Treasury Risks to the growth outlook External risks to the growth outlook include rising trade tensions, as well as financial volatility and risk aversion, which could prompt capital flow reversals, currency depreciation and higher borrowing costs. Domestic risks include policy uncertainty in some areas, the financial position of some state-owned companies, inflation risk related to a depreciating exchange rate, and higher fuel and electricity prices. While the outlook for sovereign ratings remains stable, a downgrade of the rating of local- currency debt could lead to higher risk premiums and capital outflows. 14
CHAPTER 2: ECONOMIC OVERVIEW Annexure A includes a summary of three alternative economic growth scenarios illustrating the resilience of the public finances if the growth outlook presented in the MTBPS does not materialise. Sector performance and outlook Mining In the first eight months of 2018, mining production fell by 1.7 per cent. By contrast, production rose by 4.5 per cent over the first eight months in 2017. Lower gold production has contributed most to this decline, but copper and nickel production have also decreased.
In recent years, policy uncertainty in the mining sector constrained investment and growth. The revised Mining Charter has been gazetted, and the Department of Mineral Resources has indicated that it will withdraw the Mineral and Petroleum Resources Development Act Amendment Bill, bringing much-needed regulatory certainty to the sector. The creation of separate oil and gas legislation will also improve the investment environment.AgricultureOver the first half of 2018, real value added in agriculture, forestry and fishing declined by 4.8 per cent compared with the same period in 2017. Maize production eased following record output in 2017 and drought continued to weigh down production in the Western Cape. The short-term outlook for the sector has improved. Higher rainfall in the Western Cape has led to expectations of increased winter crop production. The domestic maize market remains well-supplied and South Africa is not expected to import maize during the year ahead.The agricultural value chain has high growth, employment and export potential. The combined export value of labour-intensive crops such as citrus, grapes and macadamia nuts increased by an annual average of7.5 per cent over the period 2015 to 2017. The Department of Agriculture, Forestry and Fisheries and the Department of Rural Development and Land Reform will transfer R4.4 billion to the Land Bank over the MTEF period to support emerging farmers. The private sector is also developing financing models that use private- and public-sector money to help potential beneficiaries of redistribution access capital to acquire land.ManufacturingManufacturing production grew by 1.1 per cent in the first eight months of 2018 compared with a decline of 1.2 per cent in the first eight months of 2017. This expansion was mainly supported by food and beverages, and motor vehicles. The sector remains under pressure from weak domestic demand, rising costs and exchange rate volatility.Manufacturing capacity utilisation remains low, at 80.6 per cent in the first half of 2018, virtually unchanged from the same period a year earlier. The erosion of capital stock over the past decade is likely to constrain the long- term growth of the sector. Government and business have committed through the Jobs Summit to work together to support the procurement of locally manufactured, competitively priced goods.
Greater regulatory certainty in mining, oil and gas will help to strengthen investmentWork to strengthen the agricultural value chain can boost employment and exportsJobs Summit committed to procure locally made,competitively priced goods15
2018 MEDIUM TERM BUDGET POLICY STATEMENT Financial and business services Real value added in the finance, insurance, real estate and business services sector rose by 2 per cent in the first half of 2018, compared with 1.8 per cent over the same period in 2017. Formal employment in the sector rose by 0.5 per cent, with most jobs contributed by real estate, and legal and accounting services.
Legislation to assist over- indebted households being considered in ParliamentReforms to change structure of economy could boost growth by three percentage pointsover next decade16
Government has introduced legislation to promote new products and protect consumers of financial services. The National Credit Amendment Bill, which aims to assist over-indebted low-income households, is under consideration in the National Council of Provinces. The Insurance Act (2017), which came into effect in July 2018, introduces a legal framework for the micro-insurance industry and aims to promote formal insurance for low-income households. Cabinet approved the Financial Sector Laws Amendment Bill in September 2018 and has released it for public comment. The bill seeks to strengthen curatorship provisions for financial institutions to protect vulnerable depositors and reduce systemic risk.Implementing growth-enhancing reformsA decade of poor economic performance and high unemployment has reinforced the urgent need for a comprehensive programme of reforms to change the underlying structure of the economy. Necessary structural reforms include modernising the energy, water, transport and telecommunications industries; lowering barriers to entry and addressing distorted patterns of ownership through increased competition and small business growth; enabling growth in labour-intensive sectors such as agriculture and tourism; promoting export competitiveness; harnessing regional growth opportunities; and reducing the cost of doing business.National Treasury modelling suggests that such reforms can raise GDP growth by as much as three percentage points over the next decade. In recent months, progress has been made in these areas. For example:• The Department of Telecommunications and Postal Services hasgazetted a proposed policy for the licensing of high-demand spectrum.The communications regulator plans to auction spectrum for 4G services by April 2019, and simultaneously establish a wholesale open-access network to lower the cost of data.• The departments of Energy and Public Enterprises, and the NationalTreasury, have begun work to determine how a restructured electricitysector can support long-term growth, a secure energy supply, a sustainable electricity utility and higher investment in electricity generation, transmission and distribution.• The Economic Regulation of Transport Bill, now before Parliament, willcontribute to competitive pricing and improved service quality intransport. Administered transport prices will be reviewed to reduce the cost of doing business. Reviews of administered prices in other sectors, such as energy, are under way.Such reforms can boost long-term growth. In the short term, government is focusing its actions in three areas: Establishing policy certainty and
CHAPTER 2: ECONOMIC OVERVIEW restoring investor confidence; strengthening public institutions and stateowned companies; and creating partnerships for growth. Establishing policy certainty and restoring investor confidence Since the 2018 Budget was tabled in Parliament, government has acted to restore investor confidence by: • Finalising the Mining Charter, and preparing to withdraw the Mineral and Petroleum Resources Development Act Amendment Bill. These steps, which followed consultation with business, labour and communities, reduce uncertainty that has held back mining investment. • Ensuring that Eskom concluded 27 outstanding power-purchase agreements with independent power producers. This will bring benefits to the communities where those projects are located by creating an estimated 61 000 jobs and enabling investments of R56 billion. • Re-establishing a sustainable approach to energy planning by updating the Integrated Resource Plan for consideration by Parliament. • Revising the Public Procurement Bill, currently awaiting Cabinet approval for public consultation, which will replace existing regulations. The bill allows small firms and those operating in rural and township economies to participate more effectively in public procurement. • Creating a panel to advise government on measures to effect fair andequitable land reform that will increase agricultural output and buildself-sufficiency in food production.
To boost tourism, the Department of Home Affairs is amending regulations for the entry of minors into South Africa, reviewing the list of countries whose citizens require visas to enter South Africa and implementing an e- visa pilot platform. The department has also extended ten-year multiple- entry visas to several countries. To facilitate skilled immigration, the department is working on a critical skills list to enable foreign students to be granted permanent residence on graduation or be issued with visas.Strengthening public institutions and state-owned companiesGovernment has initiated reforms to restore good governance and financial stability at public institutions and state-owned companies. They include measures to strengthen the boards and senior management teams of Eskom, Transnet, South African Airways and the Passenger Rail Agency of South Africa. Steps have also been taken to improve governance and renew public confidence in SARS. The Department of Trade and Industry will improve the capacity of the South African Bureau of Standards to certify local content and consider simplifying the verification process.Creating partnerships for growthThe October 2018 Jobs Summit strengthened the partnership between government, business, labour and communities. Highlights included:• Improving the efficiency of government spending, for example by increasing placement ratios in the private sector for beneficiaries ofpublic employment programmes, and receiving local procurement commitments from the private sector.
Onerous visa regulations to be modified by Home Affairs to encourage tourismReforms aim to restore good governance at Eskom,Transnet, SAA and SARS17
2018 MEDIUM TERM BUDGET POLICY STATEMENT • Project-specific collaboration, as demonstrated by partnerships between commercial farmers, lenders and black farmers. • Improving policy certainty through consultations that respond to affected groups, evidenced in both the extension of the employment tax incentive as well as changes in the training lay-off scheme.
Business-led youthemployment initiative offers work experience, training and job placement servicesSmall Business and Innovation Fund and CEO Initiative’s SME Fund support entrepreneurship
The Youth Employment Service, a business-led initiative launched in March 2018, offers one-year work experience and training alongside job placement services. Government supports the initiative, which also benefits from the employment tax incentive and enhanced broad-based black economic empowerment recognition.The National Minimum Wage Bill, which introduces a minimum wage of R20/hour, was approved by the National Council of Provinces in August 2018, and awaits ratification. Embedded in the Labour Relations Amendment Act, also awaiting ratification, are reforms aimed at reducing workplace conflict, and the duration and severity of industrial action. The Jobs Summit resulted in an agreement to extend the employment tax incentive, due to lapse in 2019, for 10 years. The incentive, which encourages the hiring of younger workers, supported about 690 000 jobs in the 2016 tax year.The Small Business and Innovation Fund will help entrepreneurs and small businesses to navigate the pre-start-up phase and provide support as they scale up their enterprises. This will complement the work of the CEO Initiative’s SME Fund, which has raised R1.4 billion to date, with about R500 million expected to be committed for debt and equity investments in SMEs by the first quarter of 2019.The financial sector has committed to invest R100 billion over five years in black industrial enterprises and firms. The Financial Sector Transformation Council is working with the Department of Trade and Industry to finalise guidelines for the disbursement of this funding.The infrastructure fund announced as part of the President’s economic stimulus and recovery plan is intended to encourage capital investment by the private sector and development finance institutions in public infrastructure. The fund will build on work under way in government to improve the planning and management of large infrastructure projects.
Strengthening the planning and rollout of public infrastructure projects Many public infrastructure projects have been marred by weak project preparation, planning and execution caused by lack of technical expertise and institutional capacity. These institutional weaknesses often translate into lengthy delays, overor underspending, and quality concerns. Government has established a project preparation facility, with funding set aside over the medium term. The facility will combine the efforts of the National Treasury, the Government Technical Advisory Centre, the Presidential Infrastructure Coordinating Commission, the Development Bank of Southern Africa, the Association for Savings and Investment South Africa, the Banking Association of South Africa, the South Africa Venture Capital and Private Equity Association, and the New Development Bank. It will deploy technical experts to sponsoring departments to support development of investment-ready projects. Conclusion To increase the economy’s ability to grow sustainably at higher levels, South Africa requires a series of reforms that will raise productivity, increase competition and reduce the cost of doing business. 18
3 Fiscal policy In brief • Government remains committed to sustainable public finances. Despite major spending pressures, the expenditure ceiling remains intact. • Gross debt is projected to stabilise at 59.6 per cent of GDP in 2023/24. Currency depreciation accounts for about 70 per cent of the upward revision to gross loan debt in the current year. • Tax revenue has been revised down by R27.4 billion in 2018/19, R24.7 billion in 2019/20 and R33 billion in 2020/21 relative to the 2018 Budget. This mainly reflects higher-than-expected VAT refunds. • The consolidated budget deficit is estimated at 4 per cent in 2018/19, compared with the 2018 Budget projection of 3.6 per cent of GDP. After rising to 4.2 per cent, the deficit stabilises at 4 per cent in the outer year. • Slow economic growth remains the primary risk to the framework. While some state-owned companies receive funding in the current year, their poor financial position could burden the public finances over the medium term. Fiscal resilience in a constrained environment he 2018 Budget Review announced large-scale expenditure reprioritisation and tax increases, notably a one percentage point
increase in the VAT rate. These measures, combined with the
expectation of improved confidence, implied that gross national debt would stabilise at 56.2 per cent of GDP in 2022/23.
In recent months, deteriorating economic performance and revenue shortfalls have contributed to some slippage in fiscal projections. Other risks identified in the 2018 Budget have materialised, including a public- service wage agreement significantly above inflation, and continued decline in the financial condition of some state-owned companies, leading to requests for budget support. Following years of slow spending growth and tax increases, there is little room for large fiscal adjustments.Taking these developments into account, government is maintaining its commitment to fiscal sustainability and debt stabilisation without
Weak economic performance and revenue shortfallscontribute to slippage in fiscal projections 19
2018 MEDIUM TERM BUDGET POLICY STATEMENT introducing fiscal measures that could limit growth. Over the medium-term expenditure framework (MTEF) period, government will: • Maintain the main budget expenditure ceiling. Funds will be reprioritised to manage spending pressures and support the President’s economic stimulus and recovery plan. • Avoid increases in the major tax instruments unless the economic environment requires it. At this stage, revenue projections assume no changes to tax rates, but provide for annual adjustments to personal income tax brackets, levies and excise duties in line with inflation. • Retain national departments’ compensation ceilings. This implies continued restrictions on personnel budgets and public employment.
Consolidated budget deficit expected to decline from 4.2 per cent of GDP in 2019/20 to 4 per cent in 2021/22
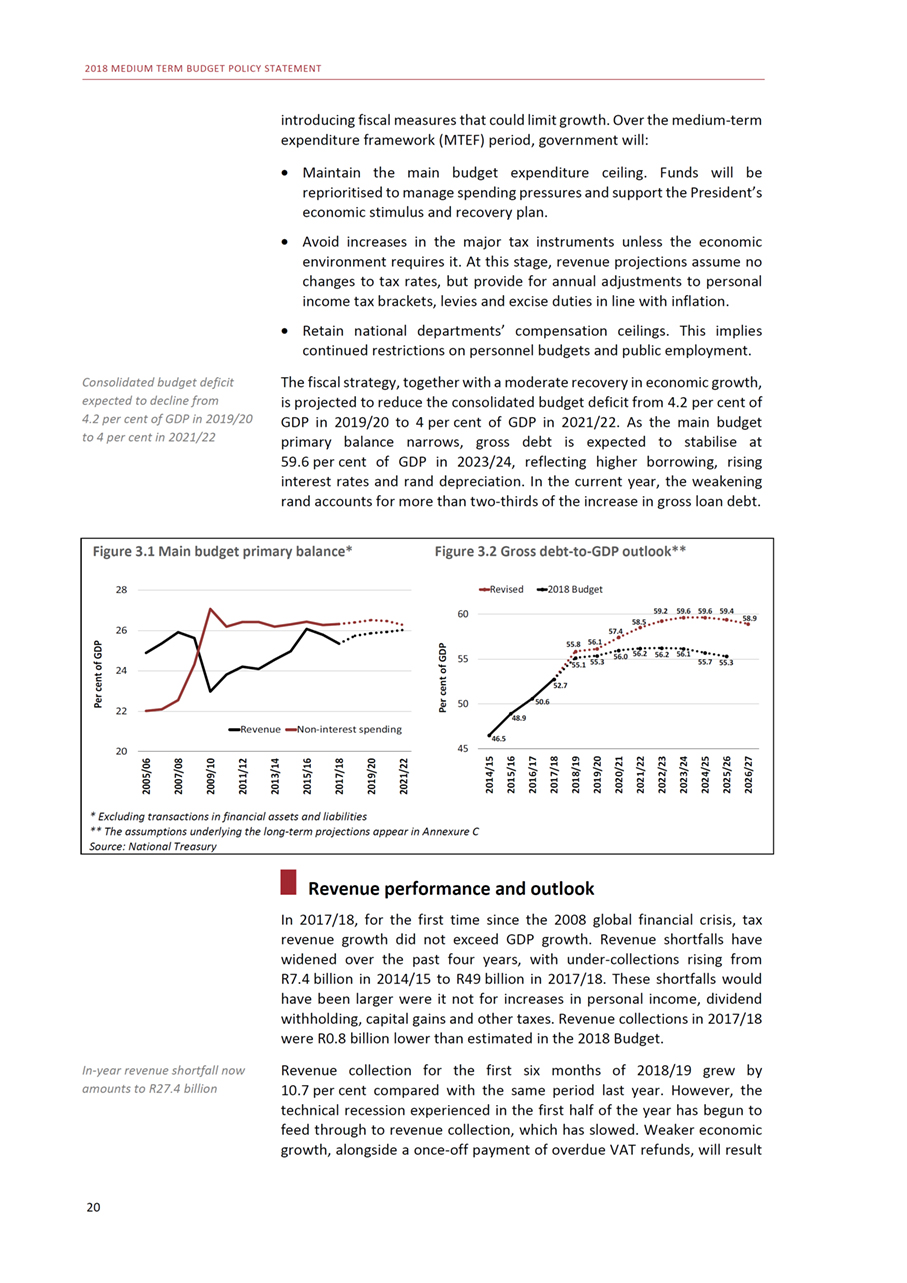
The fiscal strategy, together with a moderate recovery in economic growth, is projected to reduce the consolidated budget deficit from 4.2 per cent of GDP in 2019/20 to 4 per cent of GDP in 2021/22. As the main budget primary balance narrows, gross debt is expected to stabilise at 59.6 per cent of GDP in 2023/24, reflecting higher borrowing, rising interest rates and rand depreciation. In the current year, the weakening rand accounts for more than two-thirds of the increase in gross loan debt.
Figure 3.1 Main budget primary balance* 28
Figure 3.2 Gross debt-to-GDP outlook** Revised 2018 Budget 59.2 59.6 59.6 59.4
26 24 22 Revenue Non-interest spending 20 * Excluding transactions in financial assets and liabilities
60 55 50 50.6 48.9 46.5 45
55.8 55.1 52.7
56.1 55.3
58.5 57.4 56.0 56.2 56.2 56.1
58.9 55.7 55.3
** The assumptions underlying the long-term projections appear in Annexure C Source: National Treasury Revenue performance and outlook In 2017/18, for the first time since the 2008 global financial crisis, tax revenue growth did not exceed GDP growth. Revenue shortfalls have widened over the past four years, with under-collections rising from R7.4 billion in 2014/15 to R49 billion in 2017/18. These shortfalls would have been larger were it not for increases in personal income, dividend withholding, capital gains and other taxes. Revenue collections in 2017/18 were R0.8 billion lower than estimated in the 2018 Budget.
In-year revenue shortfall now amounts to R27.4 billion 20
Revenue collection for the first six months of 2018/19 grew by 10.7 per cent compared with the same period last year. However, the technical recession experienced in the first half of the year has begun to feed through to revenue collection, which has slowed. Weaker economic growth, alongside a once-off payment of overdue VAT refunds, will result
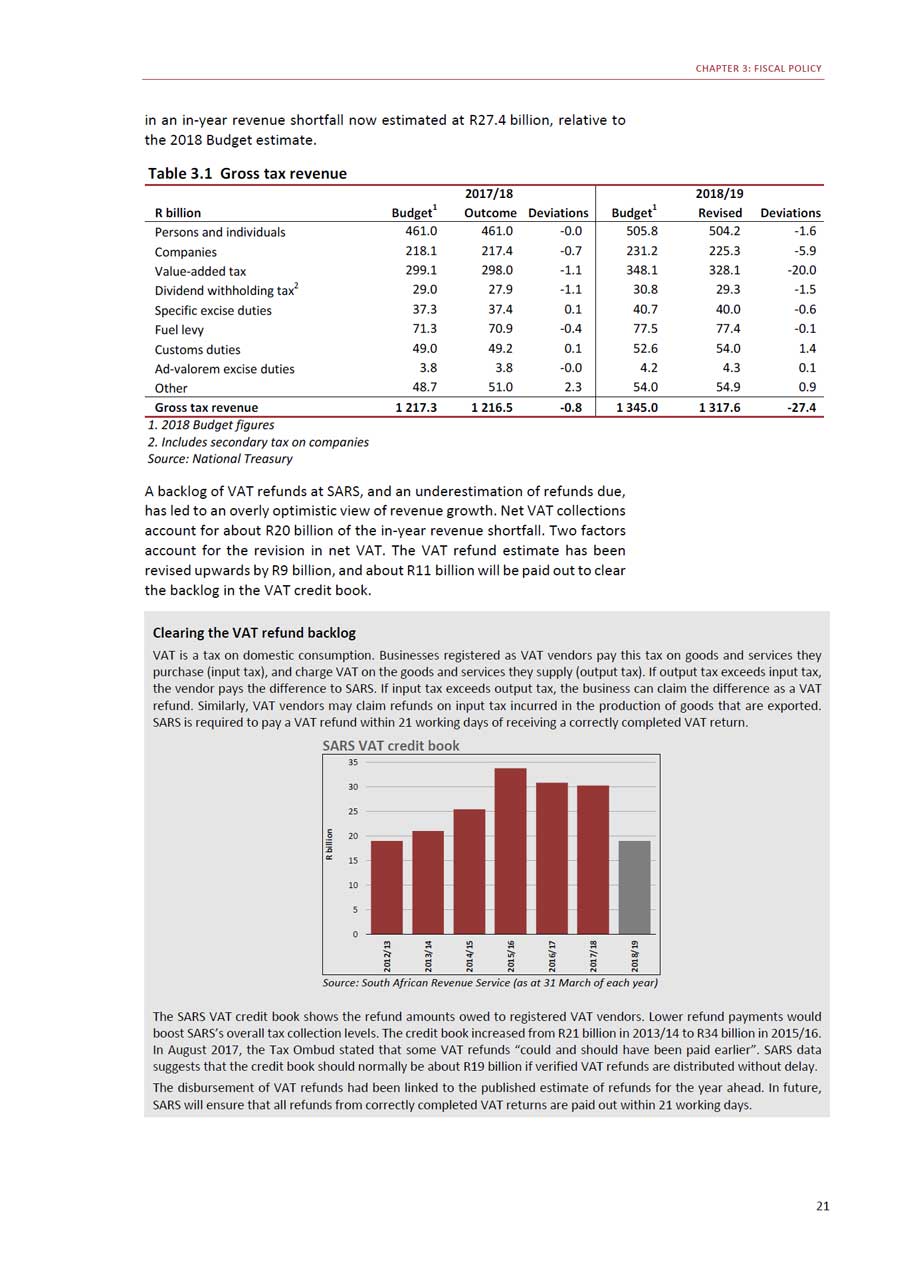
CHAPTER 3: FISCAL POLICY in an in-year revenue shortfall now estimated at R27.4 billion, relative to the 2018 Budget estimate. Table 3.1 Gross tax revenue 2017/18 2018/19R billion Budget1 Outcome Deviations Budget1 Revised DeviationsPersons and individuals 461.0 461.0 -0.0 505.8 504.2 -1.6Companies 218.1 217.4 -0.7 231.2 225.3 -5.9Value-added tax 299.1 298.0 -1.1 348.1 328.1 -20.0Dividend withholding tax2 29.0 27.9 -1.1 30.8 29.3 -1.5Specific excise duties 37.3 37.4 0.1 40.7 40.0 -0.6Fuel levy 71.3 70.9 -0.4 77.5 77.4 -0.1Customs duties 49.0 49.2 0.1 52.6 54.0 1.4Ad-valorem excise duties 3.8 3.8 -0.0 4.2 4.3 0.1Other 48.7 51.0 2.3 54.0 54.9 0.9Gross tax revenue 1 217.3 1 216.5 -0.8 1 345.0 1 317.6 -27.41. 2018 Budget figures 2. Includes secondary tax on companies Source: National Treasury A backlog of VAT refunds at SARS, and an underestimation of refunds due, has led to an overly optimistic view of revenue growth. Net VAT collections account for about R20 billion of the in-year revenue shortfall. Two factors account for the revision in net VAT. The VAT refund estimate has been revised upwards by R9 billion, and about R11 billion will be paid out to clear the backlog in the VAT credit book. Clearing the VAT refund backlog VAT is a tax on domestic consumption. Businesses registered as VAT vendors pay this tax on goods and services they purchase (input tax), and charge VAT on the goods and services they supply (output tax). If output tax exceeds input tax, the vendor pays the difference to SARS. If input tax exceeds output tax, the business can claim the difference as a VAT refund. Similarly, VAT vendors may claim refunds on input tax incurred in the production of goods that are exported. SARS is required to pay a VAT refund within 21 working days of receiving a correctly completed VAT return. SARS VAT credit book 35 30 25 20 15 10 5 0 Source: South African Revenue Service (as at 31 March of each year) The SARS VAT credit book shows the refund amounts owed to registered VAT vendors. Lower refund payments would boost SARS’s overall tax collection levels. The credit book increased from R21 billion in 2013/14 to R34 billion in 2015/16. In August 2017, the Tax Ombud stated that some VAT refunds “could and should have been paid earlier”. SARS data suggests that the credit book should normally be about R19 billion if verified VAT refunds are distributed without delay. The disbursement of VAT refunds had been linked to the published estimate of refunds for the year ahead. In future, SARS will ensure that all refunds from correctly completed VAT returns are paid out within 21 working days. 21
2018 MEDIUM TERM BUDGET POLICY STATEMENT The remaining R7.4 billion of the shortfall in the current year mostly reflects slower corporate income tax collections due to weak growth in wholesale and retail trade, manufacturing and transport. Personal income tax continues to be negatively affected by job losses, moderate wage settlements, lower bonus payments and a slower expansion of public- sector employment.
Commission of inquiry has underlined concerns aboutsevere governance weaknesses in SARSTax revenue growth projections lower across medium term
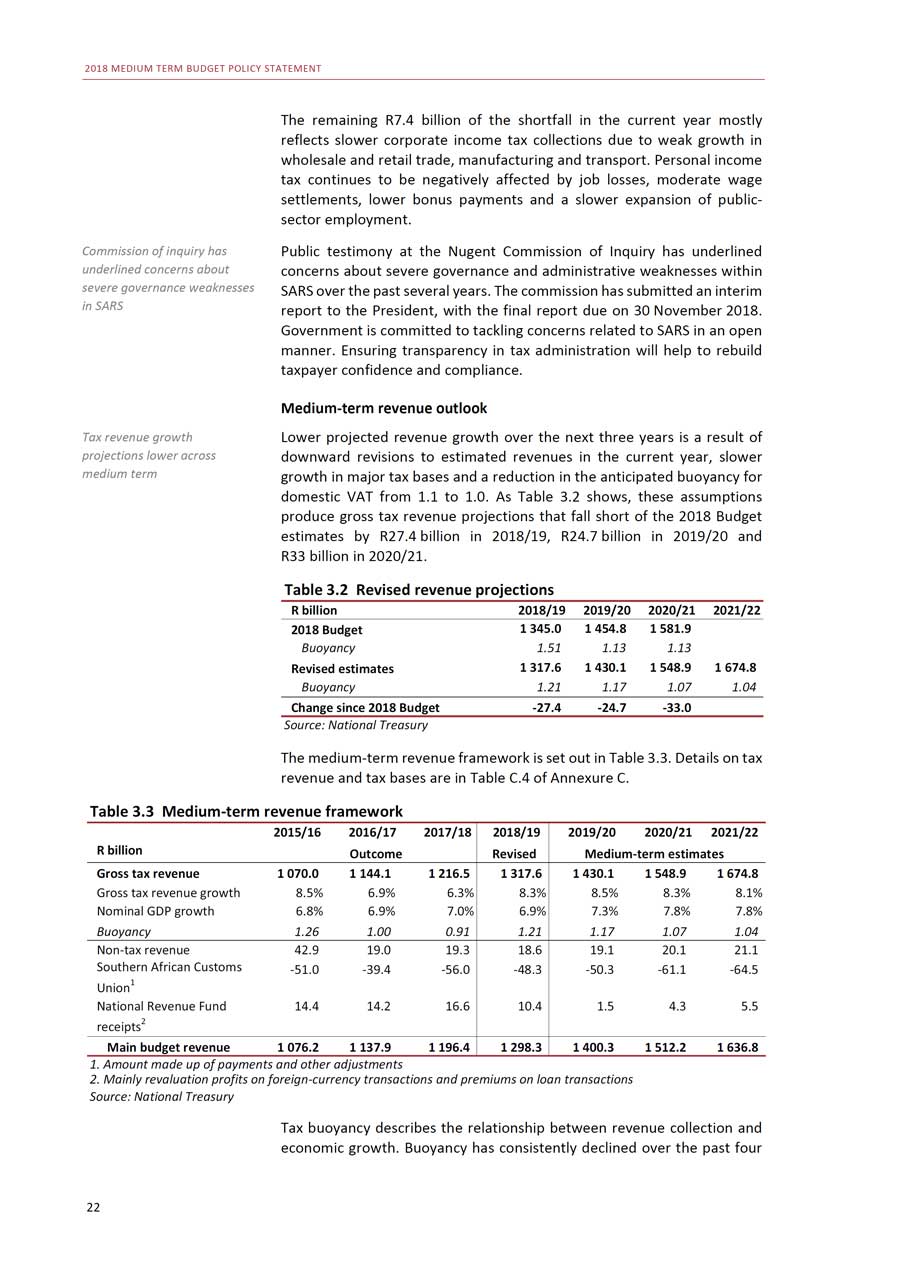
Public testimony at the Nugent Commission of Inquiry has underlined concerns about severe governance and administrative weaknesses within SARS over the past several years. The commission has submitted an interim report to the President, with the final report due on 30 November 2018. Government is committed to tackling concerns related to SARS in an open manner. Ensuring transparency in tax administration will help to rebuild taxpayer confidence and compliance.Medium-term revenue outlookLower projected revenue growth over the next three years is a result of downward revisions to estimated revenues in the current year, slower growth in major tax bases and a reduction in the anticipated buoyancy for domestic VAT from 1.1 to 1.0. As Table 3.2 shows, these assumptions produce gross tax revenue projections that fall short of the 2018 Budget estimates by R27.4 billion in 2018/19, R24.7 billion in 2019/20 and R33 billion in 2020/21.Table 3.2 Revised revenue projectionsR billion 2018/19 2019/20 2020/21 2021/222018 Budget 1 345.0 1 454.8 1 581.9Buoyancy 1.51 1.13 1.13Revised estimates 1 317.6 1 430.1 1 548.9 1 674.8Buoyancy 1.21 1.17 1.07 1.04Change since 2018 Budget -27.4 -24.7 -33.0Source: National TreasuryThe medium-term revenue framework is set out in Table 3.3. Details on tax revenue and tax bases are in Table C.4 of Annexure C.
Table 3.3 Medium-term revenue framework 2015/16 2016/17 2017/18 2018/19 2019/20 2020/21 2021/22R billion Outcome Revised Medium-term estimatesGross tax revenue 1 070.0 1 144.1 1 216.5 1 317.6 1 430.1 1 548.9 1 674.8Gross tax revenue growth 8.5% 6.9% 6.3% 8.3% 8.5% 8.3% 8.1%Nominal GDP growth 6.8% 6.9% 7.0% 6.9% 7.3% 7.8% 7.8%Buoyancy 1.26 1.00 0.91 1.21 1.17 1.07 1.04Non-tax revenue 42.9 19.0 19.3 18.6 19.1 20.1 21.1Southern African Customs -51.0 -39.4 -56.0 -48.3 -50.3 -61.1 -64.5Union1 National Revenue Fund 14.4 14.2 16.6 10.4 1.5 4.3 5.5receipts2 Main budget revenue 1 076.2 1 137.9 1 196.4 1 298.3 1 400.3 1 512.2 1 636.81. Amount made up of payments and other adjustments 2. Mainly revaluation profits on foreign-currency transactions and premiums on loan transactions Source: National Treasury Tax buoyancy describes the relationship between revenue collection and economic growth. Buoyancy has consistently declined over the past four 22
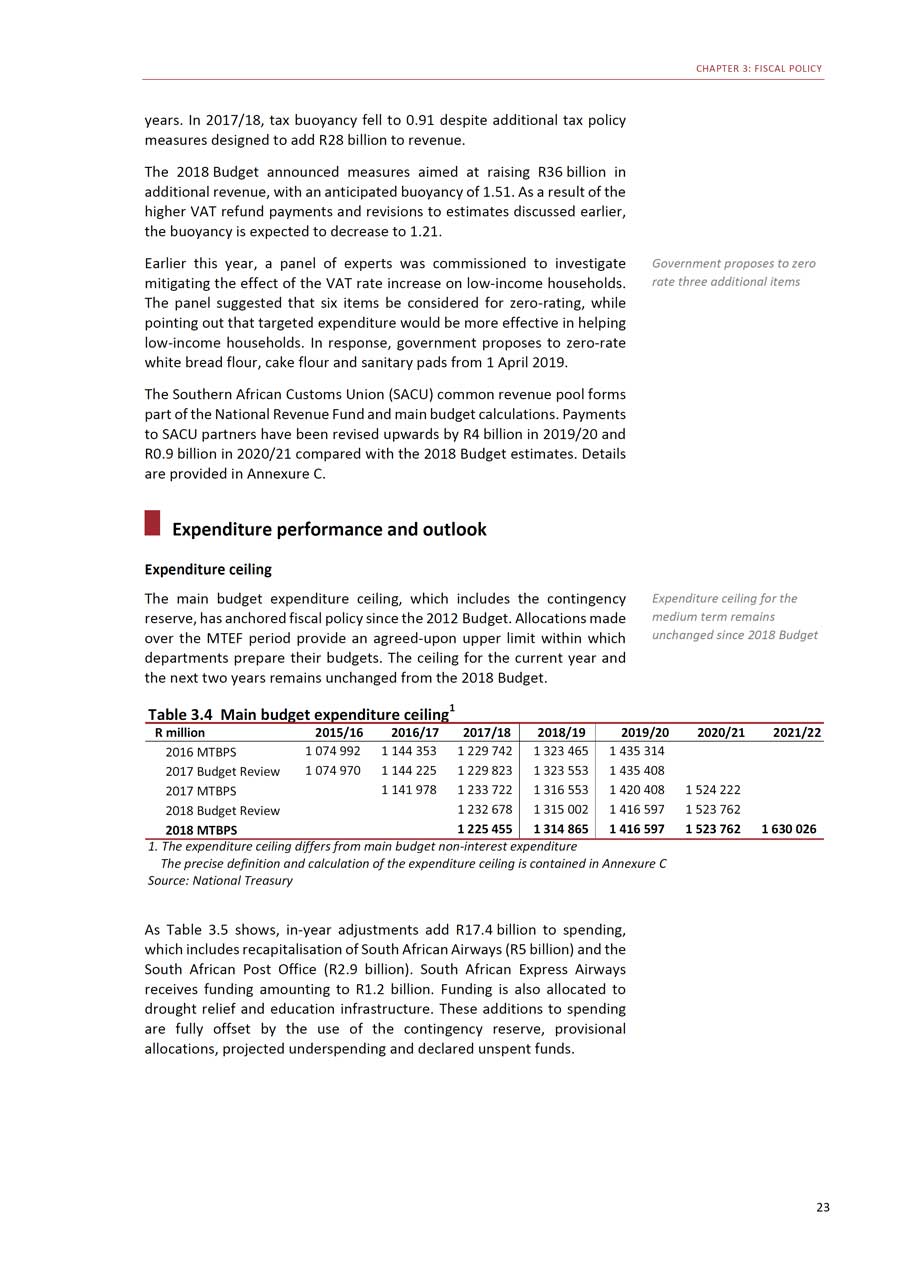
CHAPTER 3: FISCAL POLICY years. In 2017/18, tax buoyancy fell to 0.91 despite additional tax policy measures designed to add R28 billion to revenue. The 2018 Budget announced measures aimed at raising R36 billion in additional revenue, with an anticipated buoyancy of 1.51. As a result of the higher VAT refund payments and revisions to estimates discussed earlier, the buoyancy is expected to decrease to 1.21.
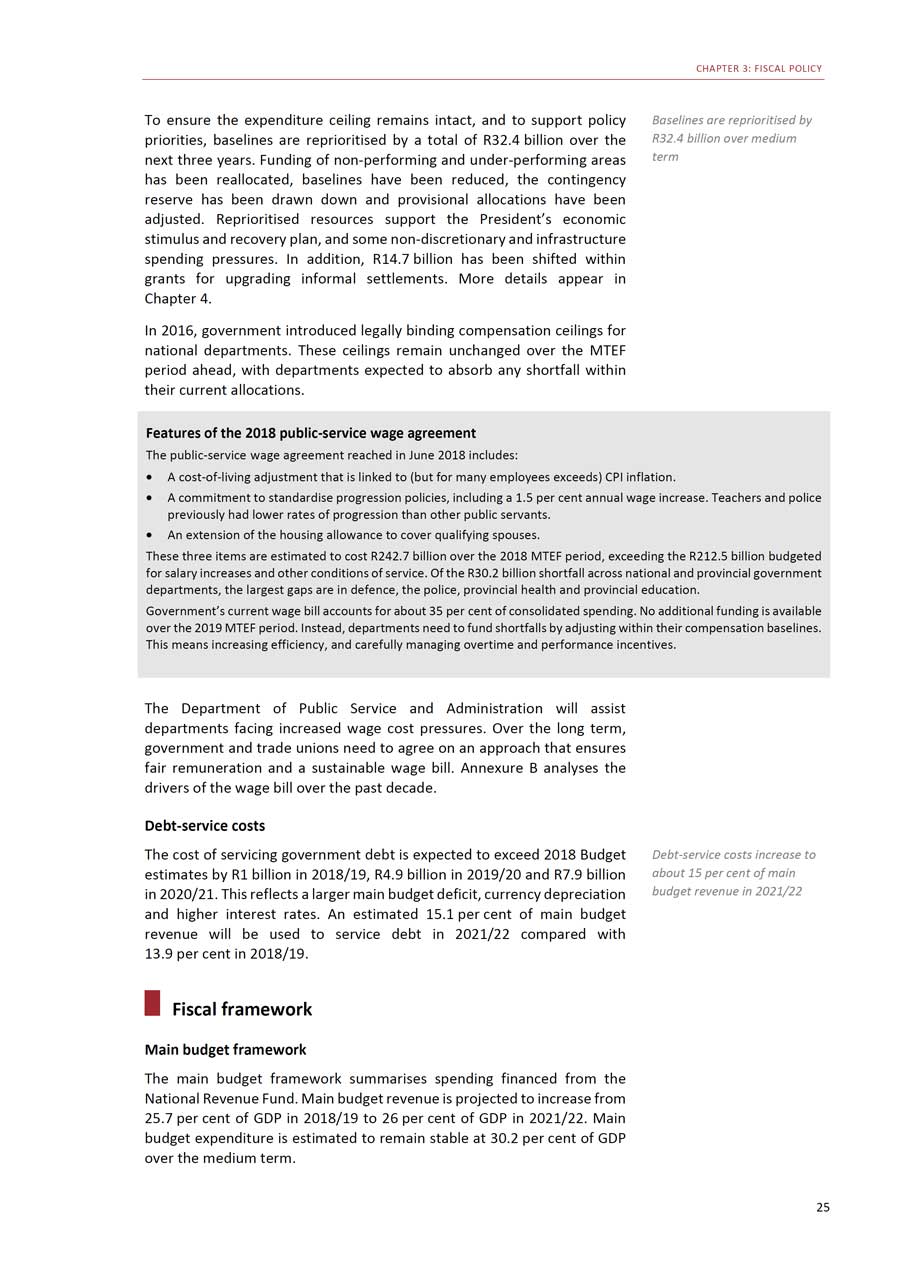
Earlier this year, a panel of experts was commissioned to investigate mitigating the effect of the VAT rate increase on low-income households. The panel suggested that six items be considered for zero-rating, while pointing out that targeted expenditure would be more effective in helping low-income households. In response, government proposes to zero-rate white bread flour, cake flour and sanitary pads from 1 April 2019.The Southern African Customs Union (SACU) common revenue pool forms part of the National Revenue Fund and main budget calculations. Payments to SACU partners have been revised upwards by R4 billion in 2019/20 and R0.9 billion in 2020/21 compared with the 2018 Budget estimates. Details are provided in Annexure C.Expenditure performance and outlookExpenditure ceilingThe main budget expenditure ceiling, which includes the contingency reserve, has anchored fiscal policy since the 2012 Budget. Allocations made over the MTEF period provide an agreed-upon upper limit within which departments prepare their budgets. The ceiling for the current year and the next two years remains unchanged from the 2018 Budget.Table 3.4 Main budget expenditure ceiling1
Government proposes to zero rate three additional itemsExpenditure ceiling for the medium term remainsunchanged since 2018 Budget
R million 2015/16 2016/17 2017/18 2018/19 2019/20 2020/21 2021/222016 MTBPS 1 074 992 1 144 353 1 229 742 1 323 465 1 435 3142017 Budget Review 1 074 970 1 144 225 1 229 823 1 323 553 1 435 4082017 MTBPS 1 141 978 1 233 722 1 316 553 1 420 408 1 524 2222018 Budget Review 1 232 678 1 315 002 1 416 597 1 523 7622018 MTBPS 1 225 455 1 314 865 1 416 597 1 523 762 1 630 0261. The expenditure ceiling differs from main budget non-interest expenditure The precise definition and calculation of the expenditure ceiling is contained in Annexure C Source: National Treasury As Table 3.5 shows, in-year adjustments add R17.4 billion to spending, which includes recapitalisation of South African Airways (R5 billion) and the South African Post Office (R2.9 billion). South African Express Airways receives funding amounting to R1.2 billion. Funding is also allocated to drought relief and education infrastructure. These additions to spending are fully offset by the use of the contingency reserve, provisional allocations, projected underspending and declared unspent funds. 23

2018 MEDIUM TERM BUDGET POLICY STATEMENT Table 3.5 Revisions to the 2018/19 expenditure ceiling R million Expenditure ceiling: 2018 Budget Review 1 315 002Upward expenditure adjustments 17 392Budget Facility for Infrastructure projects and project preparation 870Schools infrastructure backlogs grant 800Drought relief 3 412Financial support to state-owned companies:Special Appropriation Bill: South African Airways 5 000South African Express Airways 1 249South African Post Office 2 947Commissions of inquiry into tax administration and state capture 409Self-financing1 1 777Roll-overs and unforeseeable and unavoidable expenditure 927Downward expenditure adjustments (17 529)Declared unspent funds (329)Contingency reserve (8 000)Provisional allocation for contingencies not assigned to votes (6 000)National government projected underspending (2 700)Local government repayment to the National Revenue Fund (500)Revised expenditure ceiling 1 314 8651. Spending financed from revenue derived from departments’ specific activitiesSource: National TreasuryMedium-term expenditure outlook
Expenditure ceiling for next two years will be maintained, and grows by 1.5 per cent in real terms in 2021/22
The expenditure ceiling will be maintained for the next two years and is set to grow at 1.5 per cent in real terms in 2021/22 — largely in line with average real GDP growth over the past decade. Non-interest expenditure remains broadly unchanged as a share of GDP over the medium term. In real terms, non-interest spending grows by an average 1.9 per cent per year. This includes a contingency reserve amounting to R7 billion in 2019/20, R8 billion in 2020/21 and R12 billion in 2021/22.Figure 3.3 Real main budget non-interest spending growth*1210.810
8.5 8.486420-2
9.07.24.23.22.2
2.0 1.7 2.0-0.04
2.41.7
2.3
1.9
1.6
*Excluding payments for financial assets Source: National Treasury 24
CHAPTER 3: FISCAL POLICY
To ensure the expenditure ceiling remains intact, and to support policy priorities, baselines are reprioritised by a total of R32.4 billion over the next three years. Funding of non-performing and under-performing areas has been reallocated, baselines have been reduced, the contingency reserve has been drawn down and provisional allocations have been adjusted. Reprioritised resources support the President’s economic stimulus and recovery plan, and some non-discretionary and infrastructure spending pressures. In addition, R14.7 billion has been shifted within grants for upgrading informal settlements. More details appear in Chapter 4.In 2016, government introduced legally binding compensation ceilings for national departments. These ceilings remain unchanged over the MTEF period ahead, with departments expected to absorb any shortfall within their current allocations.Features of the 2018 public-service wage agreementThe public-service wage agreement reached in June 2018 includes:
Baselines are reprioritised by R32.4 billion over medium term
• A cost-of-living adjustment that is linked to (but for many employees exceeds) CPI inflation. • A commitment to standardise progression policies, including a 1.5 per cent annual wage increase. Teachers and police previously had lower rates of progression than other public servants. • An extension of the housing allowance to cover qualifying spouses. These three items are estimated to cost R242.7 billion over the 2018 MTEF period, exceeding the R212.5 billion budgeted for salary increases and other conditions of service. Of the R30.2 billion shortfall across national and provincial government departments, the largest gaps are in defence, the police, provincial health and provincial education. Government’s current wage bill accounts for about 35 per cent of consolidated spending. No additional funding is available over the 2019 MTEF period. Instead, departments need to fund shortfalls by adjusting within their compensation baselines. This means increasing efficiency, and carefully managing overtime and performance incentives. The Department of Public Service and Administration will assist departments facing increased wage cost pressures. Over the long term, government and trade unions need to agree on an approach that ensures fair remuneration and a sustainable wage bill. Annexure B analyses the drivers of the wage bill over the past decade. Debt-service costs
The cost of servicing government debt is expected to exceed 2018 Budget estimates by R1 billion in 2018/19, R4.9 billion in 2019/20 and R7.9 billion in 2020/21. This reflects a larger main budget deficit, currency depreciation and higher interest rates. An estimated 15.1 per cent of main budget revenue will be used to service debt in 2021/22 compared with13.9 per cent in 2018/19.Fiscal frameworkMain budget frameworkThe main budget framework summarises spending financed from the National Revenue Fund. Main budget revenue is projected to increase from25.7 per cent of GDP in 2018/19 to 26 per cent of GDP in 2021/22. Main budget expenditure is estimated to remain stable at 30.2 per cent of GDP over the medium term.
Debt-service costs increase to about 15 per cent of mainbudget revenue in 2021/2225
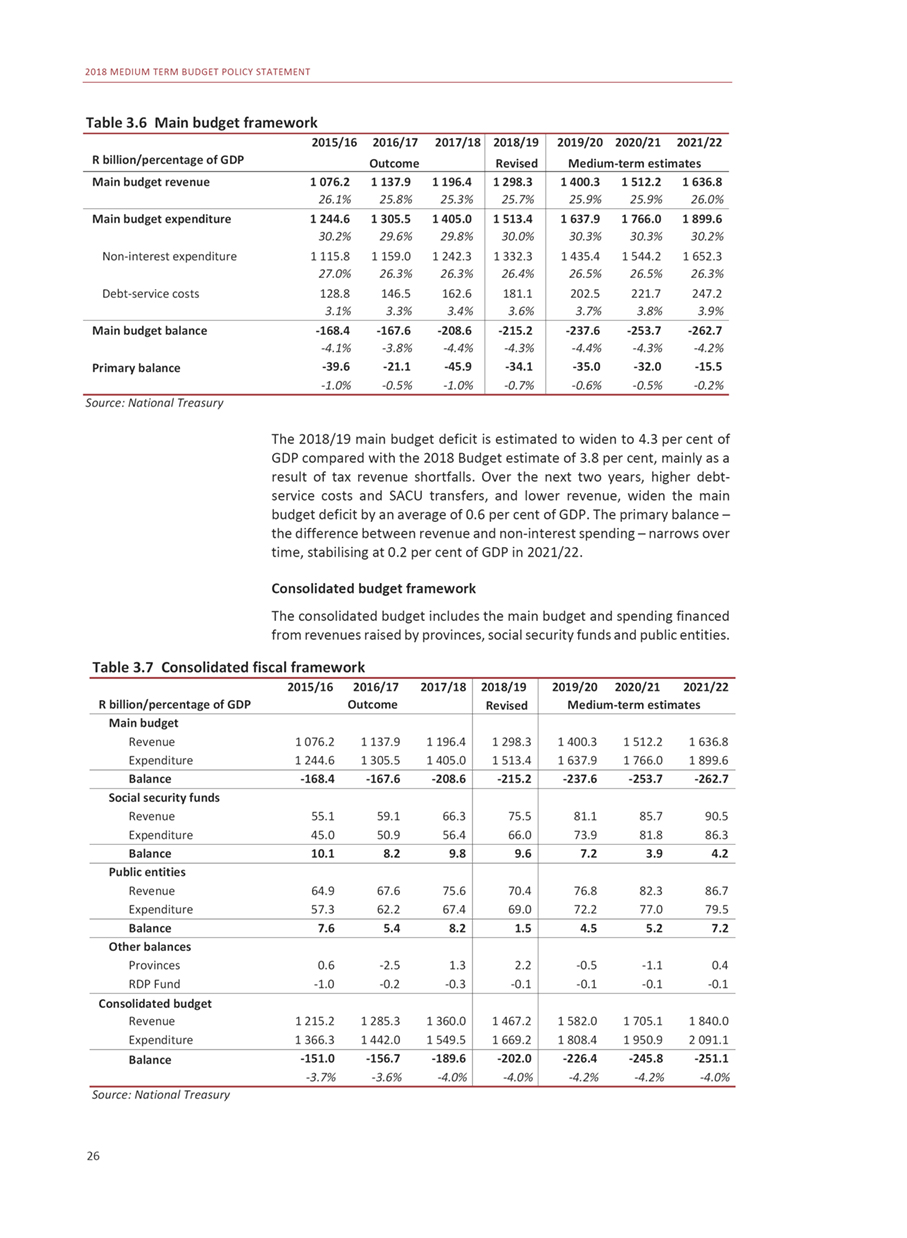
2018 MEDIUM TERM BUDGET POLICY STATEMENT Table 3.6 Main budget framework 2015/16 2016/17 2017/18 2018/19 2019/20 2020/21 2021/22R billion/percentage of GDP Outcome Revised Medium-term estimatesMain budget revenue 1 076.2 1 137.9 1 196.4 1 298.3 1 400.3 1 512.2 1 636.826.1% 25.8% 25.3% 25.7% 25.9% 25.9% 26.0%Main budget expenditure 1 244.6 1 305.5 1 405.0 1 513.4 1 637.9 1 766.0 1 899.630.2% 29.6% 29.8% 30.0% 30.3% 30.3% 30.2%Non-interest expenditure 1 115.8 1 159.0 1 242.3 1 332.3 1 435.4 1 544.2 1 652.327.0% 26.3% 26.3% 26.4% 26.5% 26.5% 26.3%Debt-service costs 128.8 146.5 162.6 181.1 202.5 221.7 247.23.1% 3.3% 3.4% 3.6% 3.7% 3.8% 3.9%Main budget balance -168.4 -167.6 -208.6 -215.2 -237.6 -253.7 -262.7-4.1% -3.8% -4.4% -4.3% -4.4% -4.3% -4.2%Primary balance -39.6 -21.1 -45.9 -34.1 -35.0 -32.0 -15.5-1.0% -0.5% -1.0% -0.7% -0.6% -0.5% -0.2%Source: National Treasury The 2018/19 main budget deficit is estimated to widen to 4.3 per cent of GDP compared with the 2018 Budget estimate of 3.8 per cent, mainly as a result of tax revenue shortfalls. Over the next two years, higher debtservice costs and SACU transfers, and lower revenue, widen the main budget deficit by an average of 0.6 per cent of GDP. The primary balance - the difference between revenue and non-interest spending - narrows over time, stabilising at 0.2 per cent of GDP in 2021/22. Consolidated budget framework The consolidated budget includes the main budget and spending financed from revenues raised by provinces, social security funds and public entities. Table 3.7 Consolidated fiscal framework 2015/16 2016/17 2017/18 2018/19 2019/20 2020/21 2021/22R billion/percentage of GDP Outcome Revised Medium-term estimatesMain budgetRevenue 1 076.2 1 137.9 1 196.4 1 298.3 1 400.3 1 512.2 1 636.8Expenditure 1 244.6 1 305.5 1 405.0 1 513.4 1 637.9 1 766.0 1 899.6Balance -168.4 -167.6 -208.6 -215.2 -237.6 -253.7 -262.7Social security fundsRevenue 55.1 59.1 66.3 75.5 81.1 85.7 90.5Expenditure 45.0 50.9 56.4 66.0 73.9 81.8 86.3Balance 10.1 8.2 9.8 9.6 7.2 3.9 4.2Public entitiesRevenue 64.9 67.6 75.6 70.4 76.8 82.3 86.7Expenditure 57.3 62.2 67.4 69.0 72.2 77.0 79.5Balance 7.6 5.4 8.2 1.5 4.5 5.2 7.2Other balancesProvinces 0.6 -2.5 1.3 2.2 -0.5 -1.1 0.4RDP Fund -1.0 -0.2 -0.3 -0.1 -0.1 -0.1 -0.1Consolidated budgetRevenue 1 215.2 1 285.3 1 360.0 1 467.2 1 582.0 1 705.1 1 840.0Expenditure 1 366.3 1 442.0 1 549.5 1 669.2 1 808.4 1 950.9 2 091.1Balance -151.0 -156.7 -189.6 -202.0 -226.4 -245.8 -251.1-3.7% -3.6% -4.0% -4.0% -4.2% -4.2% -4.0%Source: National Treasury 26
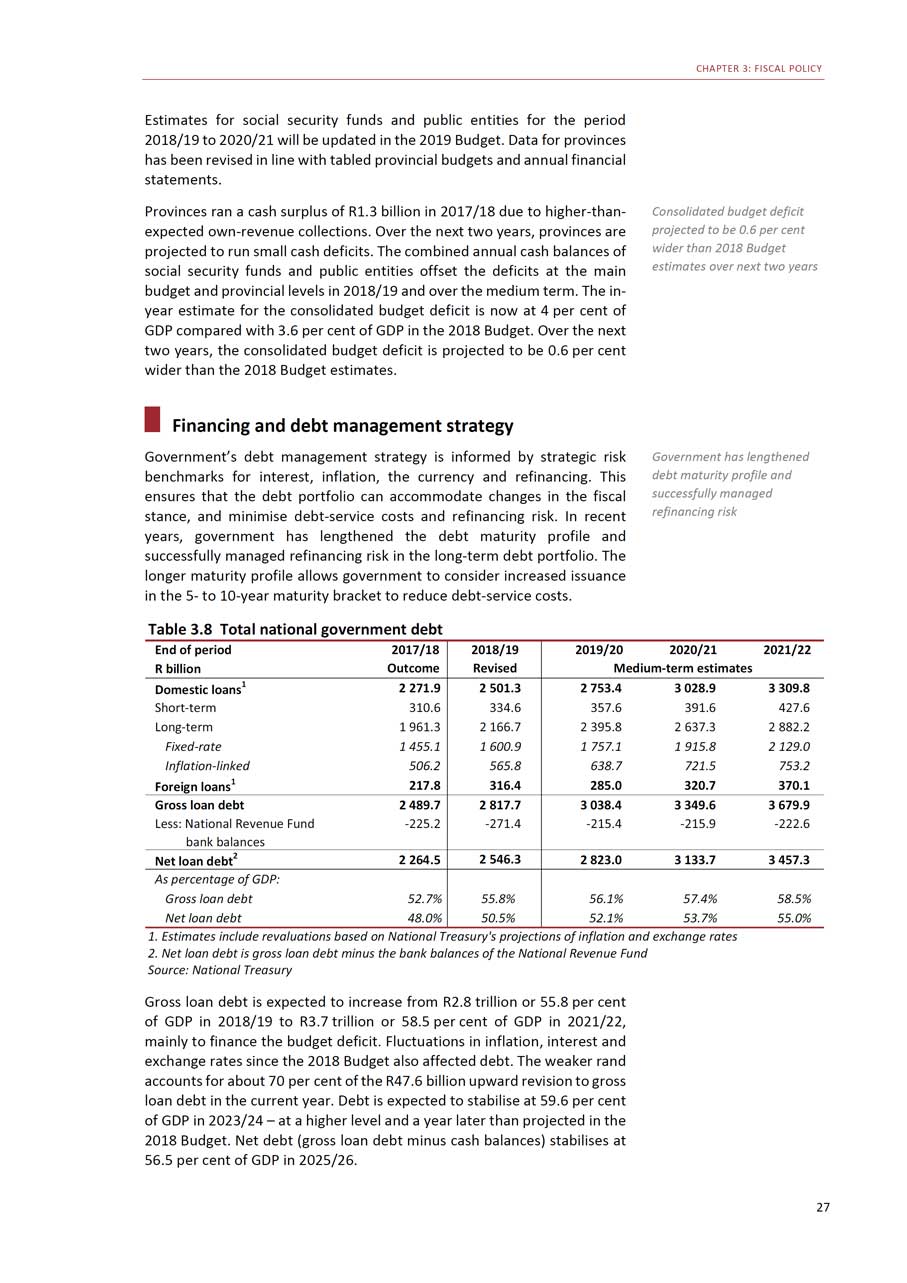
CHAPTER 3: FISCAL POLICY Estimates for social security funds and public entities for the period 2018/19 to 2020/21 will be updated in the 2019 Budget. Data for provinces has been revised in line with tabled provincial budgets and annual financial statements.
Provinces ran a cash surplus of R1.3 billion in 2017/18 due to higher-than- expected own-revenue collections. Over the next two years, provinces are projected to run small cash deficits. The combined annual cash balances of social security funds and public entities offset the deficits at the main budget and provincial levels in 2018/19 and over the medium term. The in- year estimate for the consolidated budget deficit is now at 4 per cent of GDP compared with 3.6 per cent of GDP in the 2018 Budget. Over the next two years, the consolidated budget deficit is projected to be 0.6 per cent wider than the 2018 Budget estimates.Financing and debt management strategyGovernment’s debt management strategy is informed by strategic risk benchmarks for interest, inflation, the currency and refinancing. This ensures that the debt portfolio can accommodate changes in the fiscal stance, and minimise debt-service costs and refinancing risk. In recent years, government has lengthened the debt maturity profile and successfully managed refinancing risk in the long-term debt portfolio. The longer maturity profile allows government to consider increased issuance in the 5- to 10-year maturity bracket to reduce debt-service costs.Table 3.8 Total national government debt
Consolidated budget deficit projected to be 0.6 per cent wider than 2018 Budgetestimates over next two yearsGovernment has lengthened debt maturity profile and successfully managedrefinancing risk
End of period 2017/18 2018/19 2019/20 2020/21 2021/22R billion Outcome Revised Medium-term estimatesDomestic loans1 2 271.9 2 501.3 2 753.4 3 028.9 3 309.8Short-term 310.6 334.6 357.6 391.6 427.6Long-term 1 961.3 2 166.7 2 395.8 2 637.3 2 882.2Fixed-rate 1 455.1 1 600.9 1 757.1 1 915.8 2 129.0Inflation-linked 506.2 565.8 638.7 721.5 753.2Foreign loans1 217.8 316.4 285.0 320.7 370.1Gross loan debt 2 489.7 2 817.7 3 038.4 3 349.6 3 679.9Less: National Revenue Fund -225.2 -271.4 -215.4 -215.9 -222.6bank balancesNet loan debt2 2 264.5 2 546.3 2 823.0 3 133.7 3 457.3As percentage of GDP:Gross loan debt 52.7% 55.8% 56.1% 57.4% 58.5%Net loan debt 48.0% 50.5% 52.1% 53.7% 55.0%1. Estimates include revaluations based on National Treasury’s projections of inflation and exchange rates 2. Net loan debt is gross loan debt minus the bank balances of the National Revenue Fund Source: National Treasury Gross loan debt is expected to increase from R2.8 trillion or 55.8 per cent of GDP in 2018/19 to R3.7 trillion or 58.5 per cent of GDP in 2021/22, mainly to finance the budget deficit. Fluctuations in inflation, interest and exchange rates since the 2018 Budget also affected debt. The weaker rand accounts for about 70 per cent of the R47.6 billion upward revision to gross loan debt in the current year. Debt is expected to stabilise at 59.6 per cent of GDP in 2023/24 - at a higher level and a year later than projected in the 2018 Budget. Net debt (gross loan debt minus cash balances) stabilises at 56.5 per cent of GDP in 2025/26. 27
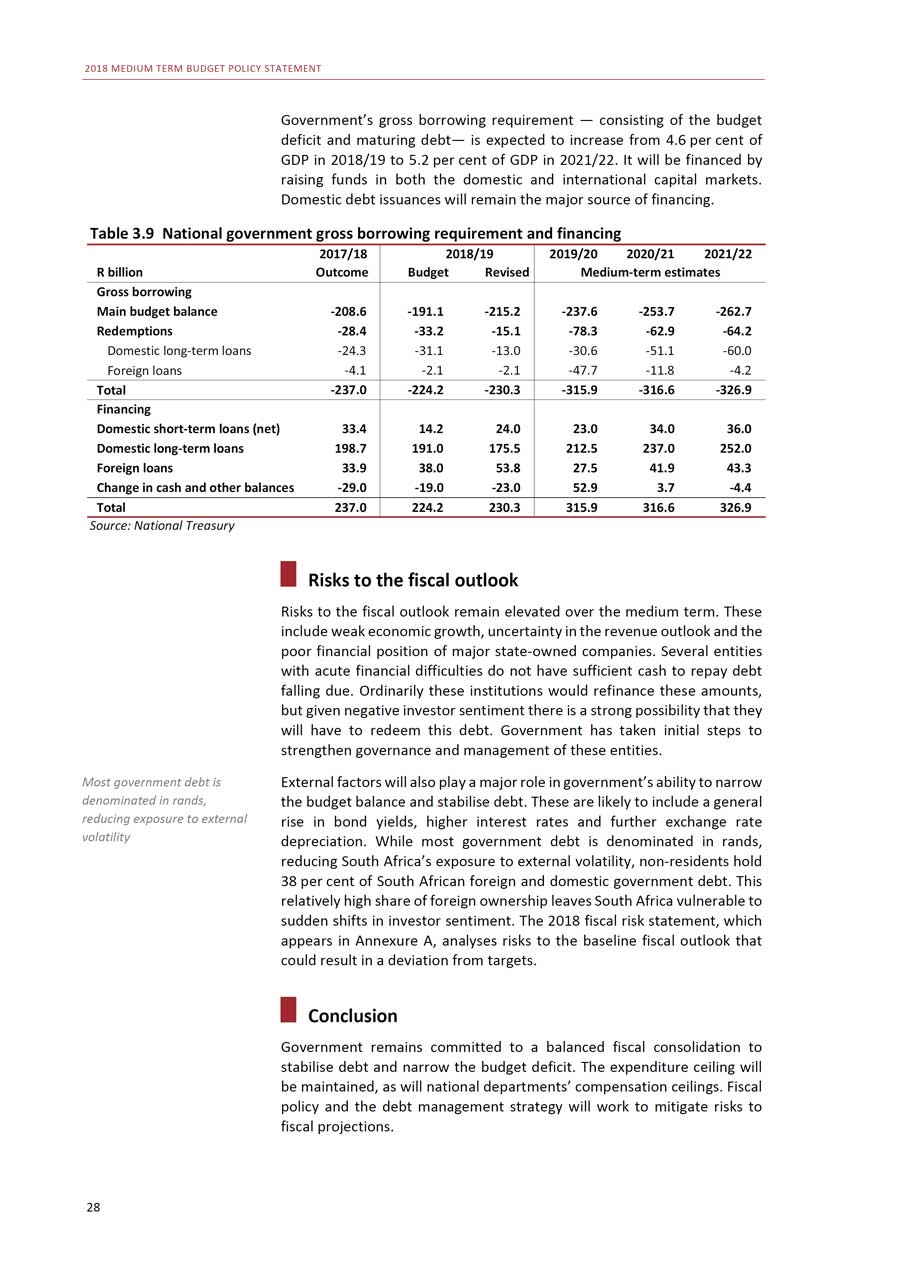
2018 MEDIUM TERM BUDGET POLICY STATEMENT Government’s gross borrowing requirement — consisting of the budget deficit and maturing debt— is expected to increase from 4.6 per cent of GDP in 2018/19 to 5.2 per cent of GDP in 2021/22. It will be financed by raising funds in both the domestic and international capital markets. Domestic debt issuances will remain the major source of financing. Table 3.9 National government gross borrowing requirement and financing 2017/18 2018/19 2019/20 2020/21 2021/22R billion Outcome Budget Revised Medium-term estimatesGross borrowingMain budget balance -208.6 -191.1 -215.2 -237.6 -253.7 -262.7Redemptions -28.4 -33.2 -15.1 -78.3 -62.9 -64.2Domestic long-term loans -24.3 -31.1 -13.0 -30.6 -51.1 -60.0Foreign loans -4.1 -2.1 -2.1 -47.7 -11.8 -4.2Total -237.0 -224.2 -230.3 -315.9 -316.6 -326.9FinancingDomestic short-term loans (net) 33.4 14.2 24.0 23.0 34.0 36.0Domestic long-term loans 198.7 191.0 175.5 212.5 237.0 252.0Foreign loans 33.9 38.0 53.8 27.5 41.9 43.3Change in cash and other balances -29.0 -19.0 -23.0 52.9 3.7 -4.4Total 237.0 224.2 230.3 315.9 316.6 326.9Source: National Treasury Risks to the fiscal outlook Risks to the fiscal outlook remain elevated over the medium term. These include weak economic growth, uncertainty in the revenue outlook and the poor financial position of major state-owned companies. Several entities with acute financial difficulties do not have sufficient cash to repay debt falling due. Ordinarily these institutions would refinance these amounts, but given negative investor sentiment there is a strong possibility that they will have to redeem this debt. Government has taken initial steps to strengthen governance and management of these entities.
Most government debt is denominated in rands,reducing exposure to external volatility28
External factors will also play a major role in government’s ability to narrow the budget balance and stabilise debt. These are likely to include a general rise in bond yields, higher interest rates and further exchange rate depreciation. While most government debt is denominated in rands, reducing South Africa’s exposure to external volatility, non-residents hold38 per cent of South African foreign and domestic government debt. This relatively high share of foreign ownership leaves South Africa vulnerable to sudden shifts in investor sentiment. The 2018 fiscal risk statement, which appears in Annexure A, analyses risks to the baseline fiscal outlook that could result in a deviation from targets.ConclusionGovernment remains committed to a balanced fiscal consolidation to stabilise debt and narrow the budget deficit. The expenditure ceiling will be maintained, as will national departments’ compensation ceilings. Fiscal policy and the debt management strategy will work to mitigate risks to fiscal projections.
4 Expenditure priorities In brief • Government spending is expected to total R5.9 trillion over the medium-term expenditure framework (MTEF) period, growing at an annual average of 7.8 per cent per year. • Funding remains focused on ensuring access to health and education, supporting low-income households through social grants, and providing basic services such as water and electricity. • The expenditure ceiling remains unchanged from the 2018 Budget. Of the R32.4 billion of expenditure reprioritised over the medium term, R15.9 billion goes towards faster-spending infrastructure programmes, clothing and textile incentives, and job creation under the Expanded Public Works Programme. • The public-service wage bill constitutes the largest share of government expenditure by economic classification, crowding out other spending. The wage agreement reached in 2018 adds to these pressures. • National and provincial government will work with municipalities to improve governance and confront weaknesses in financial management. Introduction
Government’s three-year spending plans aim to reduce poverty and inequality, and to increase employment and inclusive growth. Thesepriorities are set out in the National Development Plan (NDP) and
Medium-term spending plans focus on reducing poverty and inequality, and boosting
the medium-term strategic framework, which guide resource allocation.Healthcare, education, basic services and social grants continue to receive priority in allocations. Despite a constrained fiscal environment, these areas grow in real terms by 2-3 per cent per year. The wage bill remains the single largest driver of expenditure, but is projected to decline slightly as a share of total spending over the medium term.The expenditure ceiling remains unchanged from the 2018 Budget. Reprioritisation takes into account the President’s economic stimulus and recovery plan. To support job creation, funds are reprioritised to programmes designed to boost growth in township and rural economies,
employment and growthReprioritisation takes into account President’s economic stimulus and recovery plan29
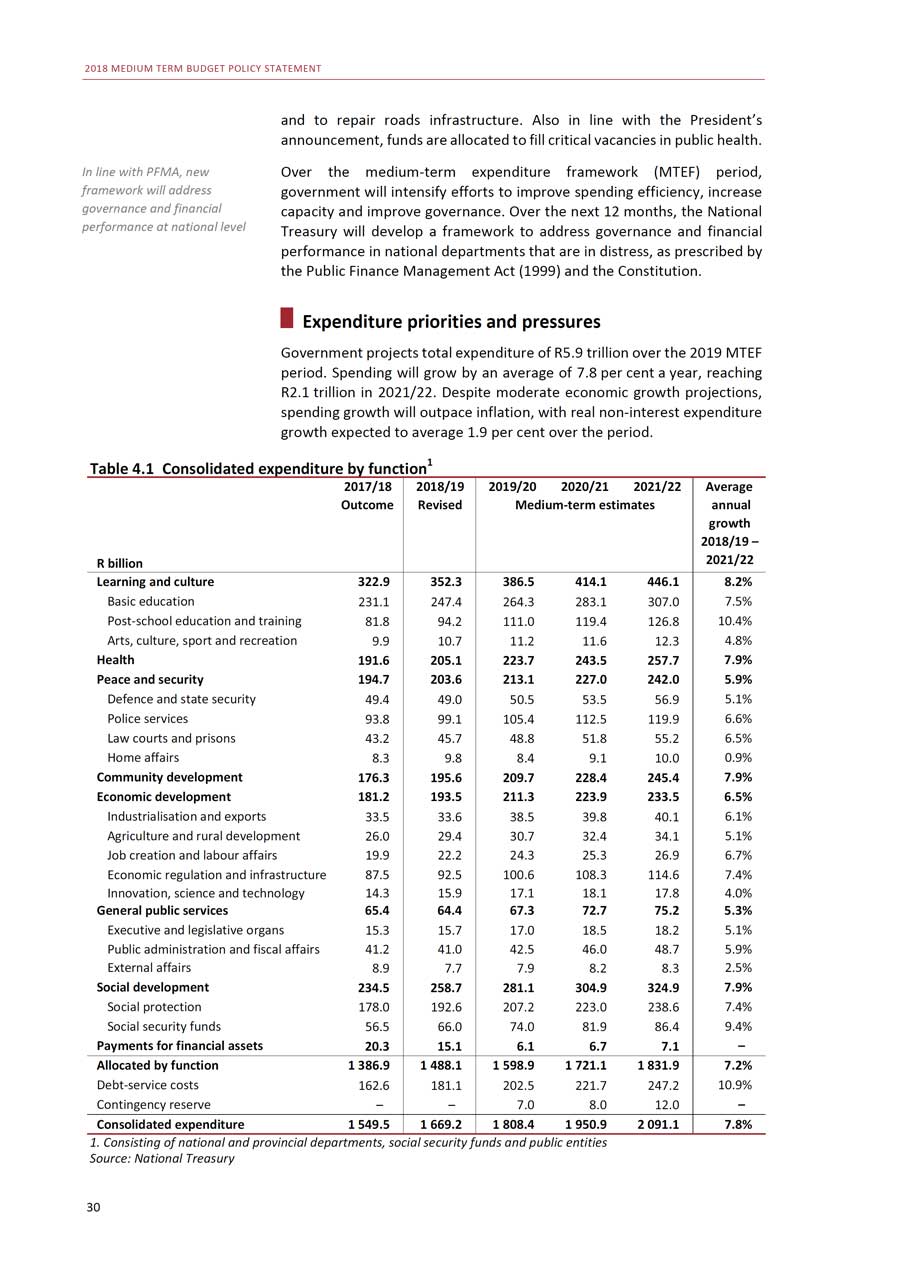
2018 MEDIUM TERM BUDGET POLICY STATEMENT and to repair roads infrastructure. Also in line with the President’s announcement, funds are allocated to fill critical vacancies in public health.
In line with PFMA, new framework will address governance and financialperformance at national level
Over the medium-term expenditure framework (MTEF) period, government will intensify efforts to improve spending efficiency, increase capacity and improve governance. Over the next 12 months, the National Treasury will develop a framework to address governance and financial performance in national departments that are in distress, as prescribed by the Public Finance Management Act (1999) and the Constitution.Expenditure priorities and pressuresGovernment projects total expenditure of R5.9 trillion over the 2019 MTEF period. Spending will grow by an average of 7.8 per cent a year, reaching R2.1 trillion in 2021/22. Despite moderate economic growth projections, spending growth will outpace inflation, with real non-interest expenditure growth expected to average 1.9 per cent over the period.
Table 4.1 Consolidated expenditure by function1 2017/18 2018/19 2019/20 2020/21 2021/22 AverageOutcome Revised Medium-term estimates annualgrowth2018/19 -R billion 2021/22Learning and culture 322.9 352.3 386.5 414.1 446.1 8.2%Basic education 231.1 247.4 264.3 283.1 307.0 7.5%Post-school education and training 81.8 94.2 111.0 119.4 126.8 10.4%Arts, culture, sport and recreation 9.9 10.7 11.2 11.6 12.3 4.8%Health 191.6 205.1 223.7 243.5 257.7 7.9%Peace and security 194.7 203.6 213.1 227.0 242.0 5.9%Defence and state security 49.4 49.0 50.5 53.5 56.9 5.1%Police services 93.8 99.1 105.4 112.5 119.9 6.6%Law courts and prisons 43.2 45.7 48.8 51.8 55.2 6.5%Home affairs 8.3 9.8 8.4 9.1 10.0 0.9%Community development 176.3 195.6 209.7 228.4 245.4 7.9%Economic development 181.2 193.5 211.3 223.9 233.5 6.5%Industrialisation and exports 33.5 33.6 38.5 39.8 40.1 6.1%Agriculture and rural development 26.0 29.4 30.7 32.4 34.1 5.1%Job creation and labour affairs 19.9 22.2 24.3 25.3 26.9 6.7%Economic regulation and infrastructure 87.5 92.5 100.6 108.3 114.6 7.4%Innovation, science and technology 14.3 15.9 17.1 18.1 17.8 4.0%General public services 65.4 64.4 67.3 72.7 75.2 5.3%Executive and legislative organs 15.3 15.7 17.0 18.5 18.2 5.1%Public administration and fiscal affairs 41.2 41.0 42.5 46.0 48.7 5.9%External affairs 8.9 7.7 7.9 8.2 8.3 2.5%Social development 234.5 258.7 281.1 304.9 324.9 7.9%Social protection 178.0 192.6 207.2 223.0 238.6 7.4%Social security funds 56.5 66.0 74.0 81.9 86.4 9.4%Payments for financial assets 20.3 15.1 6.1 6.7 7.1 -Allocated by function 1 386.9 1 488.1 1 598.9 1 721.1 1 831.9 7.2%Debt-service costs 162.6 181.1 202.5 221.7 247.2 10.9%Contingency reserve - - 7.0 8.0 12.0 -Consolidated expenditure 1 549.5 1 669.2 1 808.4 1 950.9 2 091.1 7.8%1. Consisting of national and provincial departments, social security funds and public entities Source: National Treasury 30
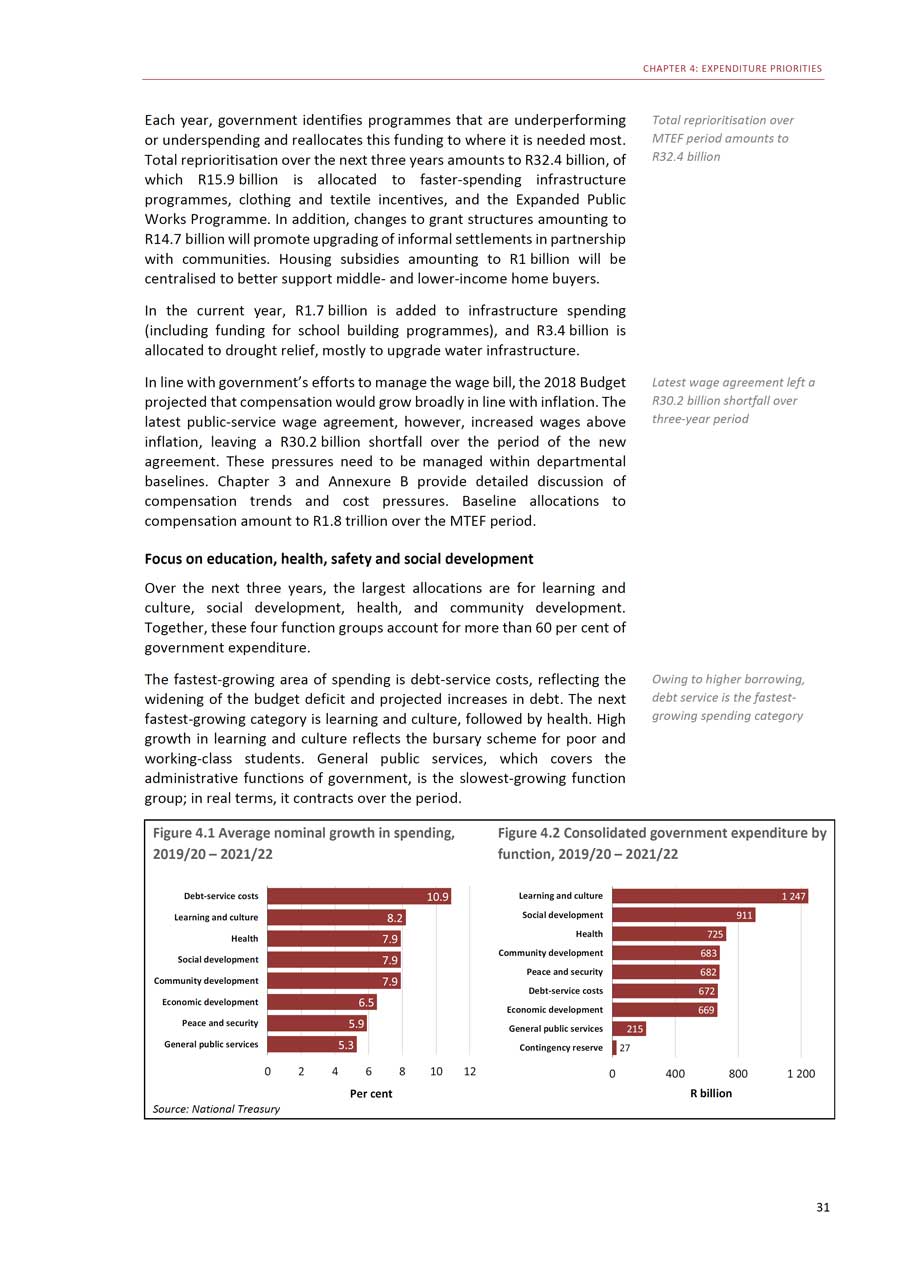
CHAPTER 4: EXPENDITURE PRIORITIES
Each year, government identifies programmes that are underperforming or underspending and reallocates this funding to where it is needed most. Total reprioritisation over the next three years amounts to R32.4 billion, of which R15.9 billion is allocated to faster-spending infrastructure programmes, clothing and textile incentives, and the Expanded Public Works Programme. In addition, changes to grant structures amounting to R14.7 billion will promote upgrading of informal settlements in partnership with communities. Housing subsidies amounting to R1 billion will be centralised to better support middle- and lower-income home buyers.In the current year, R1.7 billion is added to infrastructure spending (including funding for school building programmes), and R3.4 billion is allocated to drought relief, mostly to upgrade water infrastructure.In line with government’s efforts to manage the wage bill, the 2018 Budget projected that compensation would grow broadly in line with inflation. The latest public-service wage agreement, however, increased wages above inflation, leaving a R30.2 billion shortfall over the period of the new agreement. These pressures need to be managed within departmental baselines. Chapter 3 and Annexure B provide detailed discussion of compensation trends and cost pressures. Baseline allocations to compensation amount to R1.8 trillion over the MTEF period.Focus on education, health, safety and social developmentOver the next three years, the largest allocations are for learning and culture, social development, health, and community development. Together, these four function groups account for more than 60 per cent of government expenditure.The fastest-growing area of spending is debt-service costs, reflecting the widening of the budget deficit and projected increases in debt. The next fastest-growing category is learning and culture, followed by health. High growth in learning and culture reflects the bursary scheme for poor and working-class students. General public services, which covers the administrative functions of government, is the slowest-growing function group; in real terms, it contracts over the period.
Total reprioritisation over MTEF period amounts to R32.4 billionLatest wage agreement left a R30.2 billion shortfall over three-year periodOwing to higher borrowing, debt service is the fastest- growing spending category
Figure 4.1 Average nominal growth in spending, 2019/20 - 2021/22Debt-service costs 10.9Learning and culture 8.2Health 7.9Social development 7.9Community development 7.9Economic development 6.5Peace and security 5.9General public services 5.30 2 4 6 8 10 12Per centSource: National Treasury
Figure 4.2 Consolidated government expenditure by function, 2019/20 - 2021/22Learning and culture 1 247Social development 911Health 725Community development 683Peace and security 682Debt-service costs 672Economic development 669General public services 215Contingency reserve 270 400 800 1 200R billion
31
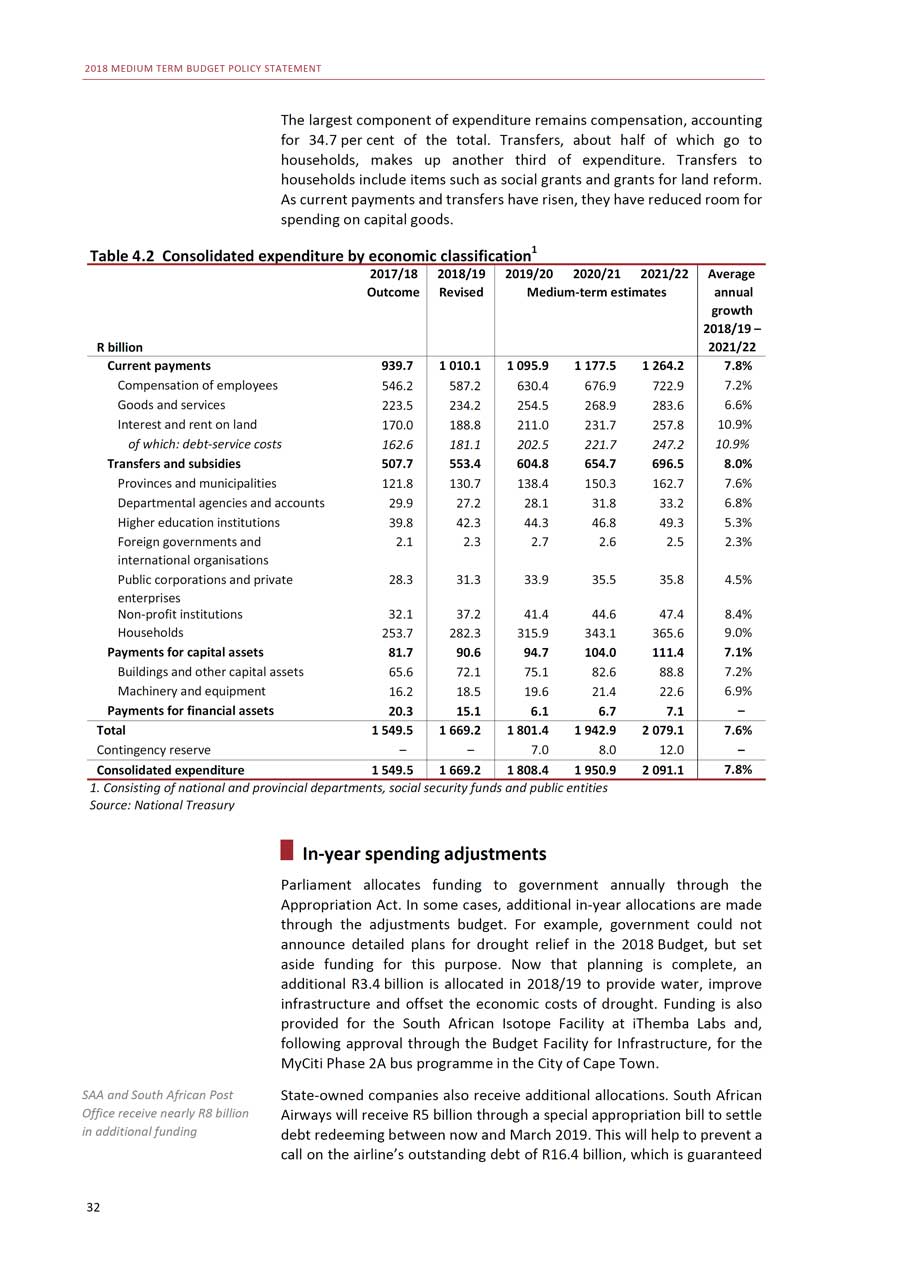
2018 MEDIUM TERM BUDGET POLICY STATEMENT The largest component of expenditure remains compensation, accounting for 34.7 per cent of the total. Transfers, about half of which go to households, makes up another third of expenditure. Transfers to households include items such as social grants and grants for land reform. As current payments and transfers have risen, they have reduced room for spending on capital goods. Table 4.2 Consolidated expenditure by economic classification1 2017/18 2018/19 2019/20 2020/21 2021/22 AverageOutcome Revised Medium-term estimates annualgrowth2018/19 -R billion 2021/22Current payments 939.7 1 010.1 1 095.9 1 177.5 1 264.2 7.8%Compensation of employees 546.2 587.2 630.4 676.9 722.9 7.2%Goods and services 223.5 234.2 254.5 268.9 283.6 6.6%Interest and rent on land 170.0 188.8 211.0 231.7 257.8 10.9%of which: debt-service costs 162.6 181.1 202.5 221.7 247.2 10.9%Transfers and subsidies 507.7 553.4 604.8 654.7 696.5 8.0%Provinces and municipalities 121.8 130.7 138.4 150.3 162.7 7.6%Departmental agencies and accounts 29.9 27.2 28.1 31.8 33.2 6.8%Higher education institutions 39.8 42.3 44.3 46.8 49.3 5.3%Foreign governments and 2.1 2.3 2.7 2.6 2.5 2.3%international organisationsPublic corporations and private 28.3 31.3 33.9 35.5 35.8 4.5%enterprisesNon-profit institutions 32.1 37.2 41.4 44.6 47.4 8.4%Households 253.7 282.3 315.9 343.1 365.6 9.0%Payments for capital assets 81.7 90.6 94.7 104.0 111.4 7.1%Buildings and other capital assets 65.6 72.1 75.1 82.6 88.8 7.2%Machinery and equipment 16.2 18.5 19.6 21.4 22.6 6.9%Payments for financial assets 20.3 15.1 6.1 6.7 7.1 -Total 1 549.5 1 669.2 1 801.4 1 942.9 2 079.1 7.6%Contingency reserve - - 7.0 8.0 12.0 -Consolidated expenditure 1 549.5 1 669.2 1 808.4 1 950.9 2 091.1 7.8%1. Consisting of national and provincial departments, social security funds and public entities Source: National Treasury In-year spending adjustments Parliament allocates funding to government annually through the Appropriation Act. In some cases, additional in-year allocations are made through the adjustments budget. For example, government could not announce detailed plans for drought relief in the 2018 Budget, but set aside funding for this purpose. Now that planning is complete, an additional R3.4 billion is allocated in 2018/19 to provide water, improve infrastructure and offset the economic costs of drought. Funding is also provided for the South African Isotope Facility at iThemba Labs and, following approval through the Budget Facility for Infrastructure, for the MyCiti Phase 2A bus programme in the City of Cape Town.
SAA and South African Post Office receive nearly R8 billion in additional funding32
State-owned companies also receive additional allocations. South African Airways will receive R5 billion through a special appropriation bill to settle debt redeeming between now and March 2019. This will help to prevent a call on the airline’s outstanding debt of R16.4 billion, which is guaranteed
CHAPTER 4: EXPENDITURE PRIORITIES by government. In addition, R1.2 billion is allocated to South African Express Airways. The South African Post Office receives R2.9 billion to reduce debt levels. It is expected that new boards at state-owned companies will ensure higher standards of governance and more effective use of public money. Other in-year allocations include: • R800 million added to the school infrastructure backlogs grant to complete approved projects. • R166 million added to the national health insurance (NHI) indirect grant (health facility revitalisation) component to procure medical equipment and to design a new academic hospital in Limpopo. • R546 million reprioritised within the NHI indirect grant to address the critical shortage of medical professionals in the health sector, and to procure beds and linen for health facilities. The revised national spending allocations are set out in the 2018 Adjusted Estimates of National Expenditure. Changes to conditional grants are included in the 2018 Division of Revenue Amendment Bill. Revised provincial appropriations will be tabled in provincial legislatures before the end of the current financial year. Spending priorities by function group Learning and culture
This function receives the largest share of spending over the MTEF period. Improving the quality of education, building scarce skills and transforming society through inclusive growth are key objectives of the NDP. Over the medium term, this function group will concentrate on early-grade reading and mathematics in basic education, and increasing graduation rates in post-secondary education and training.The most urgent priority is to eradicate pit latrines and make other improvements in school sanitation. In 2018/19, funding for sanitation projects will be reprioritised from existing school infrastructure budgets. Over the medium term, government, donors and private-sector companies will fund these projects and test new sanitation technology. For constructing and maintaining schools, including sanitation projects, R3.4 billion is allocated to the education infrastructure grant. Funds are also allocated to the same grant to continue repairing infrastructure damaged by storms and floods in KwaZulu-Natal in 2017.The Department of Women has developed a framework to provide free sanitary towels to learners from low-income households. The project rollout is funded through the provincial equitable share.The Minister of Higher Education and Training placed the National Student Financial Aid Scheme (NSFAS) under administration in August 2018. Backlogs in payments of student allowances and general administration are improving, and the 2019 application process is now proceeding smoothly despite a one-month delay. The actual costs of the new bursary programme for poor and working-class students, as well as the number of
Learning and culture priorities include eradicating pit latrines, focus on early grades andimproving graduation ratesNSFAS administration problems being resolved and application process on track33
2018 MEDIUM TERM BUDGET POLICY STATEMENT first-time entrants, will only be known once the NSFAS closes out the 2018 academic year. The Department of Higher Education and Training is developing a funding framework to clarify students’ food, book, transport and accommodation allowances, and the obligations required of bursary students during and after their studies. Funds recommended through the Budget Facility for Infrastructure, and from educational institutions and the department, will support the Student Housing Infrastructure Programme. Over the next 10 years, it will provide 300 000 new beds at universities, and technical and vocational colleges.
R61.5 billion from skills levy for learnerships, internships and skills development
Over the medium term, an estimated R61.5 billion in revenue from the skills development levy will continue to expand participation in learnerships, internships and skills development programmes.Community developmentThis function group finances access to water, sanitation, electricity and shelter for poor households. The local government equitable share, which finances free basic services to low-income households and some administrative costs for municipalities, is expected to grow by9.4 per cent per year to R82.2 billion by 2021/22.
Partnering with communities to upgrade informal settlements More than 3.1 million South Africans live in informal settlements, over half of which are in metropolitan municipalities. Over the medium term, informal-settlement upgrading will intensify. On-site upgrading of settlements involves providing municipal services and security of tenure to households. This will encourage residents to improve their own dwellings. Public programmes and funding mechanisms will focus on allowing more flexible and differentiated improvements to settlements. Government will prioritise engagement with communities and their inclusion in upgrading, for example through helping to build and maintain infrastructure. New conditions and ring-fenced funding for upgrading will be included in the urban settlements development grant for metropolitan areas and the human settlements development grant for provinces in 2019/20. Following the pilot phase, government intends to introduce separate metropolitan and provincial grants for informal settlement upgrading. With most electrification backlogs in metros in informal settlements, it is also proposed that allocations for the integrated national electrification programme (municipal) grant be incorporated into the new grant mechanism in these cities. The finance-linked individual subsidy programme supports households whose income is too high to qualify for a government-provided house, but below the threshold to qualify for a home loan. Subsidies within the programme, administered through the National Housing Finance Corporation, will be increased, with funding shifted from the human settlements development grant. The title deeds restoration grant will be phased back into the human settlements development grant after 2021/22.
Support for integrated public transport networks in 13 cities34
Over the medium term, public transport expenditure is expected to increase to R101.1 billion as integrated public transport networks are built and operated in 13 cities. This amount also supports rail infrastructure and provincial bus services. Small reductions are also proposed to the human settlements development grant, urban settlements development grant and integrated national electrification programme (Eskom) grant to fund other priorities.
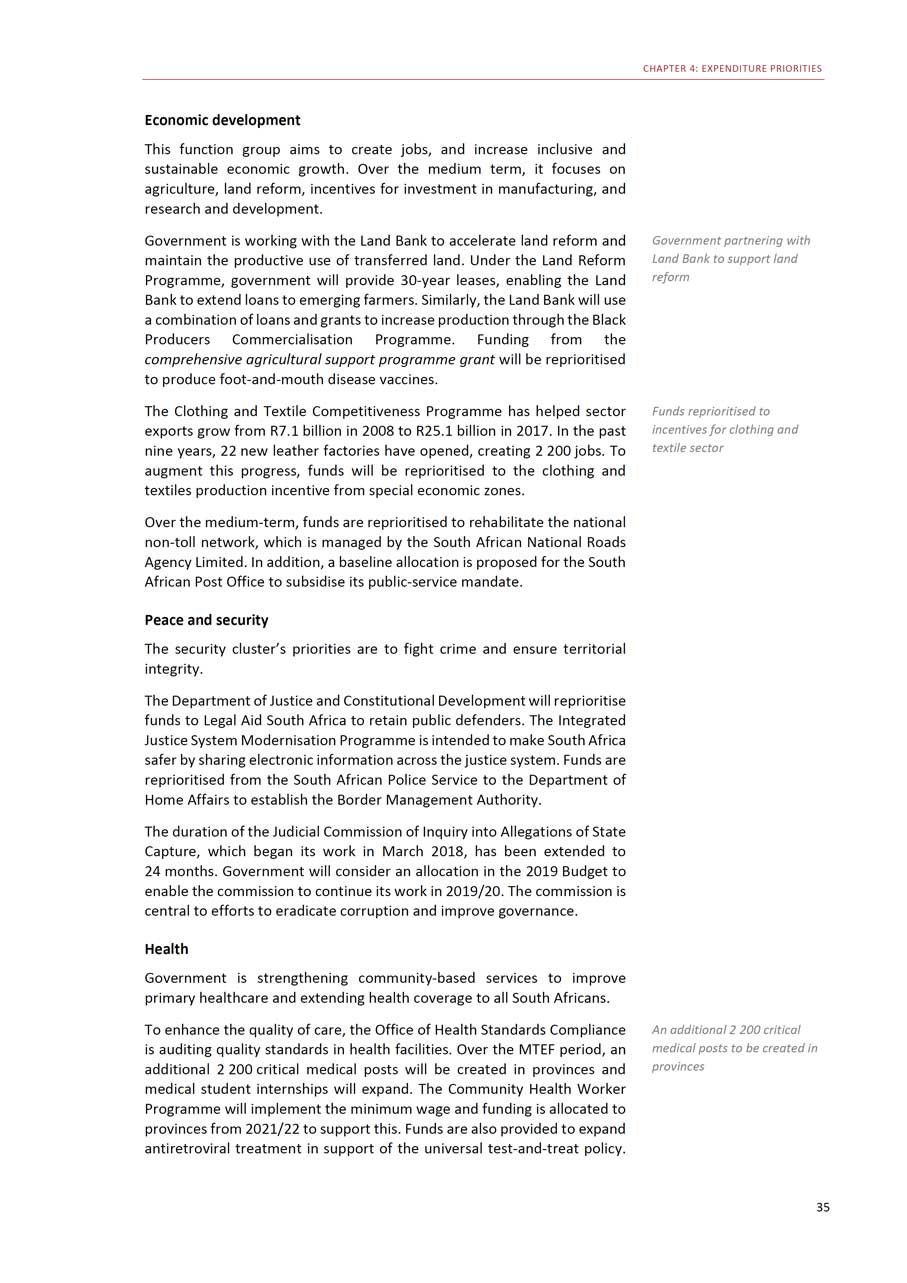
CHAPTER 4: EXPENDITURE PRIORITIES Economic development This function group aims to create jobs, and increase inclusive and sustainable economic growth. Over the medium term, it focuses on agriculture, land reform, incentives for investment in manufacturing, and research and development.
Government is working with the Land Bank to accelerate land reform and maintain the productive use of transferred land. Under the Land Reform Programme, government will provide 30-year leases, enabling the Land Bank to extend loans to emerging farmers. Similarly, the Land Bank will use a combination of loans and grants to increase production through the Black Producers Commercialisation Programme. Funding from the comprehensive agricultural support programme grant will be reprioritised to produce foot-and-mouth disease vaccines.The Clothing and Textile Competitiveness Programme has helped sector exports grow from R7.1 billion in 2008 to R25.1 billion in 2017. In the past nine years, 22 new leather factories have opened, creating 2 200 jobs. To augment this progress, funds will be reprioritised to the clothing and textiles production incentive from special economic zones.Over the medium-term, funds are reprioritised to rehabilitate the national non-toll network, which is managed by the South African National Roads Agency Limited. In addition, a baseline allocation is proposed for the South African Post Office to subsidise its public-service mandate.Peace and securityThe security cluster’s priorities are to fight crime and ensure territorial integrity.The Department of Justice and Constitutional Development will reprioritise funds to Legal Aid South Africa to retain public defenders. The Integrated Justice System Modernisation Programme is intended to make South Africa safer by sharing electronic information across the justice system. Funds are reprioritised from the South African Police Service to the Department of Home Affairs to establish the Border Management Authority.The duration of the Judicial Commission of Inquiry into Allegations of State Capture, which began its work in March 2018, has been extended to24 months. Government will consider an allocation in the 2019 Budget to enable the commission to continue its work in 2019/20. The commission is central to efforts to eradicate corruption and improve governance.HealthGovernment is strengthening community-based services to improve primary healthcare and extending health coverage to all South Africans.To enhance the quality of care, the Office of Health Standards Compliance is auditing quality standards in health facilities. Over the MTEF period, an additional 2 200 critical medical posts will be created in provinces and medical student internships will expand. The Community Health Worker Programme will implement the minimum wage and funding is allocated to provinces from 2021/22 to support this. Funds are also provided to expand antiretroviral treatment in support of the universal test-and-treat policy.
Government partnering with Land Bank to support land reformFunds reprioritised to incentives for clothing and textile sectorAn additional 2 200 critical medical posts to be created in provinces35
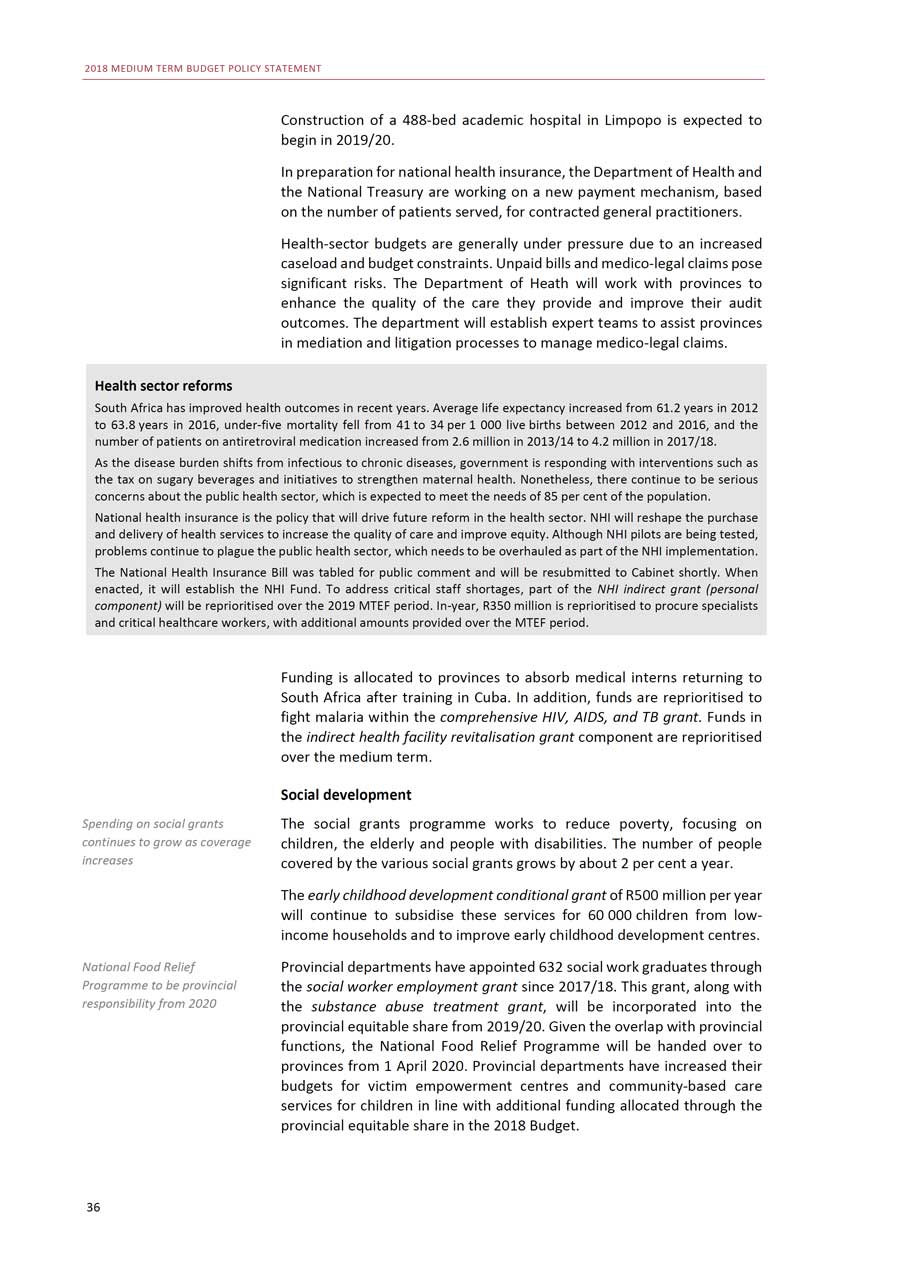
2018 MEDIUM TERM BUDGET POLICY STATEMENT Construction of a 488-bed academic hospital in Limpopo is expected to begin in 2019/20. In preparation for national health insurance, the Department of Health and the National Treasury are working on a new payment mechanism, based on the number of patients served, for contracted general practitioners. Health-sector budgets are generally under pressure due to an increased caseload and budget constraints. Unpaid bills and medico-legal claims pose significant risks. The Department of Heath will work with provinces to enhance the quality of the care they provide and improve their audit outcomes. The department will establish expert teams to assist provinces in mediation and litigation processes to manage medico-legal claims. Health sector reforms South Africa has improved health outcomes in recent years. Average life expectancy increased from 61.2 years in 2012 to 63.8 years in 2016, under-five mortality fell from 41 to 34 per 1 000 live births between 2012 and 2016, and the number of patients on antiretroviral medication increased from 2.6 million in 2013/14 to 4.2 million in 2017/18. As the disease burden shifts from infectious to chronic diseases, government is responding with interventions such as the tax on sugary beverages and initiatives to strengthen maternal health. Nonetheless, there continue to be serious concerns about the public health sector, which is expected to meet the needs of 85 per cent of the population. National health insurance is the policy that will drive future reform in the health sector. NHI will reshape the purchase and delivery of health services to increase the quality of care and improve equity. Although NHI pilots are being tested, problems continue to plague the public health sector, which needs to be overhauled as part of the NHI implementation. The National Health Insurance Bill was tabled for public comment and will be resubmitted to Cabinet shortly. When enacted, it will establish the NHI Fund. To address critical staff shortages, part of the NHI indirect grant (personal component) will be reprioritised over the 2019 MTEF period. In-year, R350 million is reprioritised to procure specialists and critical healthcare workers, with additional amounts provided over the MTEF period. Funding is allocated to provinces to absorb medical interns returning to South Africa after training in Cuba. In addition, funds are reprioritised to fight malaria within the comprehensive HIV, AIDS, and TB grant. Funds in the indirect health facility revitalisation grant component are reprioritised over the medium term. Social development
Spending on social grants continues to grow as coverage increasesNational Food ReliefProgramme to be provincial responsibility from 202036
The social grants programme works to reduce poverty, focusing on children, the elderly and people with disabilities. The number of people covered by the various social grants grows by about 2 per cent a year.The early childhood development conditional grant of R500 million per year will continue to subsidise these services for 60 000 children from low- income households and to improve early childhood development centres.Provincial departments have appointed 632 social work graduates through the social worker employment grant since 2017/18. This grant, along with the substance abuse treatment grant, will be incorporated into the provincial equitable share from 2019/20. Given the overlap with provincial functions, the National Food Relief Programme will be handed over to provinces from 1 April 2020. Provincial departments have increased their budgets for victim empowerment centres and community-based care services for children in line with additional funding allocated through the provincial equitable share in the 2018 Budget.
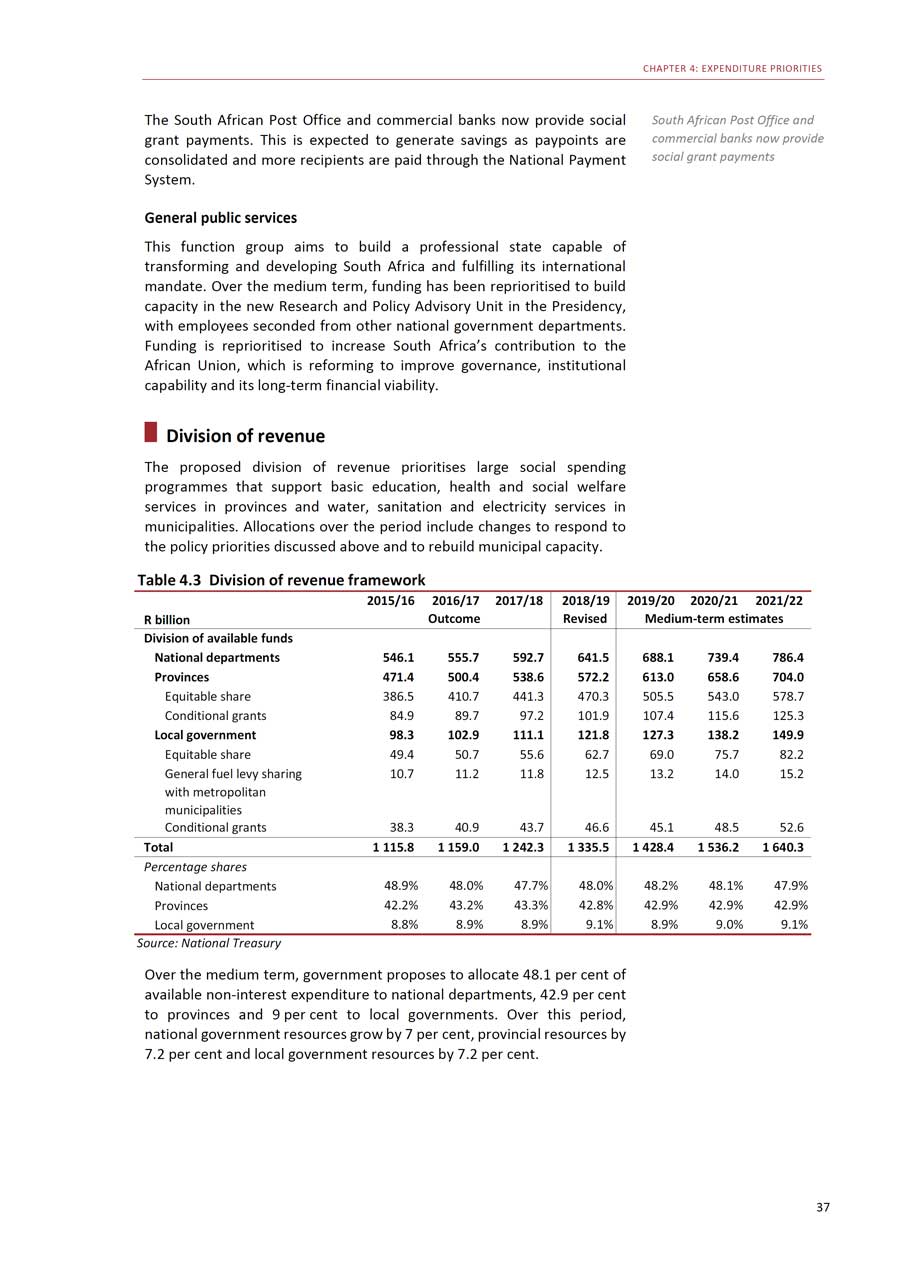
CHAPTER 4: EXPENDITURE PRIORITIES
The South African Post Office and commercial banks now provide social grant payments. This is expected to generate savings as paypoints are consolidated and more recipients are paid through the National Payment System.General public servicesThis function group aims to build a professional state capable of transforming and developing South Africa and fulfilling its international mandate. Over the medium term, funding has been reprioritised to build capacity in the new Research and Policy Advisory Unit in the Presidency, with employees seconded from other national government departments. Funding is reprioritised to increase South Africa’s contribution to the African Union, which is reforming to improve governance, institutional capability and its long-term financial viability.Division of revenueThe proposed division of revenue prioritises large social spending programmes that support basic education, health and social welfare services in provinces and water, sanitation and electricity services in municipalities. Allocations over the period include changes to respond to the policy priorities discussed above and to rebuild municipal capacity.Table 4.3 Division of revenue framework
South African Post Office and commercial banks now provide social grant payments
2015/16 2016/17 2017/18 2018/19 2019/20 2020/21 2021/22R billion Outcome Revised Medium-term estimatesDivision of available fundsNational departments 546.1 555.7 592.7 641.5 688.1 739.4 786.4Provinces 471.4 500.4 538.6 572.2 613.0 658.6 704.0Equitable share 386.5 410.7 441.3 470.3 505.5 543.0 578.7Conditional grants 84.9 89.7 97.2 101.9 107.4 115.6 125.3Local government 98.3 102.9 111.1 121.8 127.3 138.2 149.9Equitable share 49.4 50.7 55.6 62.7 69.0 75.7 82.2General fuel levy sharing 10.7 11.2 11.8 12.5 13.2 14.0 15.2with metropolitanmunicipalitiesConditional grants 38.3 40.9 43.7 46.6 45.1 48.5 52.6Total 1 115.8 1 159.0 1 242.3 1 335.5 1 428.4 1 536.2 1 640.3Percentage sharesNational departments 48.9% 48.0% 47.7% 48.0% 48.2% 48.1% 47.9%Provinces 42.2% 43.2% 43.3% 42.8% 42.9% 42.9% 42.9%Local government 8.8% 8.9% 8.9% 9.1% 8.9% 9.0% 9.1%Source: National Treasury Over the medium term, government proposes to allocate 48.1 per cent of available non-interest expenditure to national departments, 42.9 per cent to provinces and 9 per cent to local governments. Over this period, national government resources grow by 7 per cent, provincial resources by 7.2 per cent and local government resources by 7.2 per cent. 37
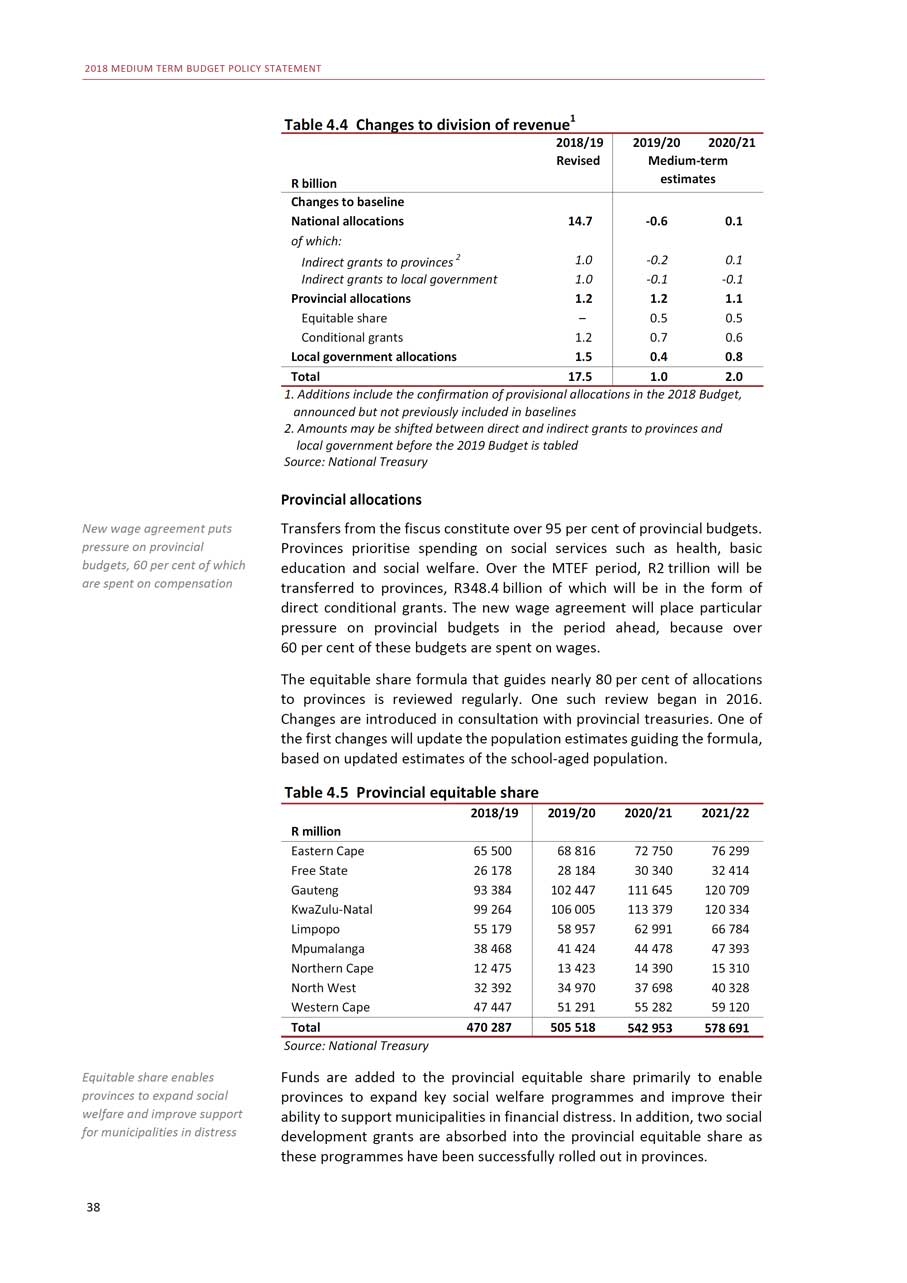
2018 MEDIUM TERM BUDGET POLICY STATEMENT Table 4.4 Changes to division of revenue1 2018/19 2019/20 2020/21Revised Medium-termR billion estimatesChanges to baselineNational allocations 14.7 -0.6 0.1of which:Indirect grants to provinces2 1.0 -0.2 0.1Indirect grants to local government 1.0 -0.1 -0.1Provincial allocations 1.2 1.2 1.1Equitable share - 0.5 0.5Conditional grants 1.2 0.7 0.6Local government allocations 1.5 0.4 0.8Total 17.5 1.0 2.01. Additions include the confirmation of provisional allocations in the 2018 Budget, announced but not previously included in baselines 2. Amounts may be shifted between direct and indirect grants to provinces and local government before the 2019 Budget is tabled Source: National Treasury Provincial allocations
New wage agreement puts pressure on provincialbudgets, 60 per cent of which are spent on compensationEquitable share enables provinces to expand socialwelfare and improve support for municipalities in distress38
Transfers from the fiscus constitute over 95 per cent of provincial budgets. Provinces prioritise spending on social services such as health, basic education and social welfare. Over the MTEF period, R2 trillion will be transferred to provinces, R348.4 billion of which will be in the form of direct conditional grants. The new wage agreement will place particular pressure on provincial budgets in the period ahead, because over60 per cent of these budgets are spent on wages.The equitable share formula that guides nearly 80 per cent of allocations to provinces is reviewed regularly. One such review began in 2016. Changes are introduced in consultation with provincial treasuries. One of the first changes will update the population estimates guiding the formula, based on updated estimates of the school-aged population.Table 4.5 Provincial equitable share2018/19 2019/20 2020/21 2021/22 R millionEastern Cape 65 500 68 816 72 750 76 299Free State 26 178 28 184 30 340 32 414Gauteng 93 384 102 447 111 645 120 709KwaZulu-Natal 99 264 106 005 113 379 120 334Limpopo 55 179 58 957 62 991 66 784Mpumalanga 38 468 41 424 44 478 47 393Northern Cape 12 475 13 423 14 390 15 310North West 32 392 34 970 37 698 40 328Western Cape 47 447 51 291 55 282 59 120Total 470 287 505 518 542 953 578 691Source: National TreasuryFunds are added to the provincial equitable share primarily to enable provinces to expand key social welfare programmes and improve their ability to support municipalities in financial distress. In addition, two social development grants are absorbed into the provincial equitable share as these programmes have been successfully rolled out in provinces.
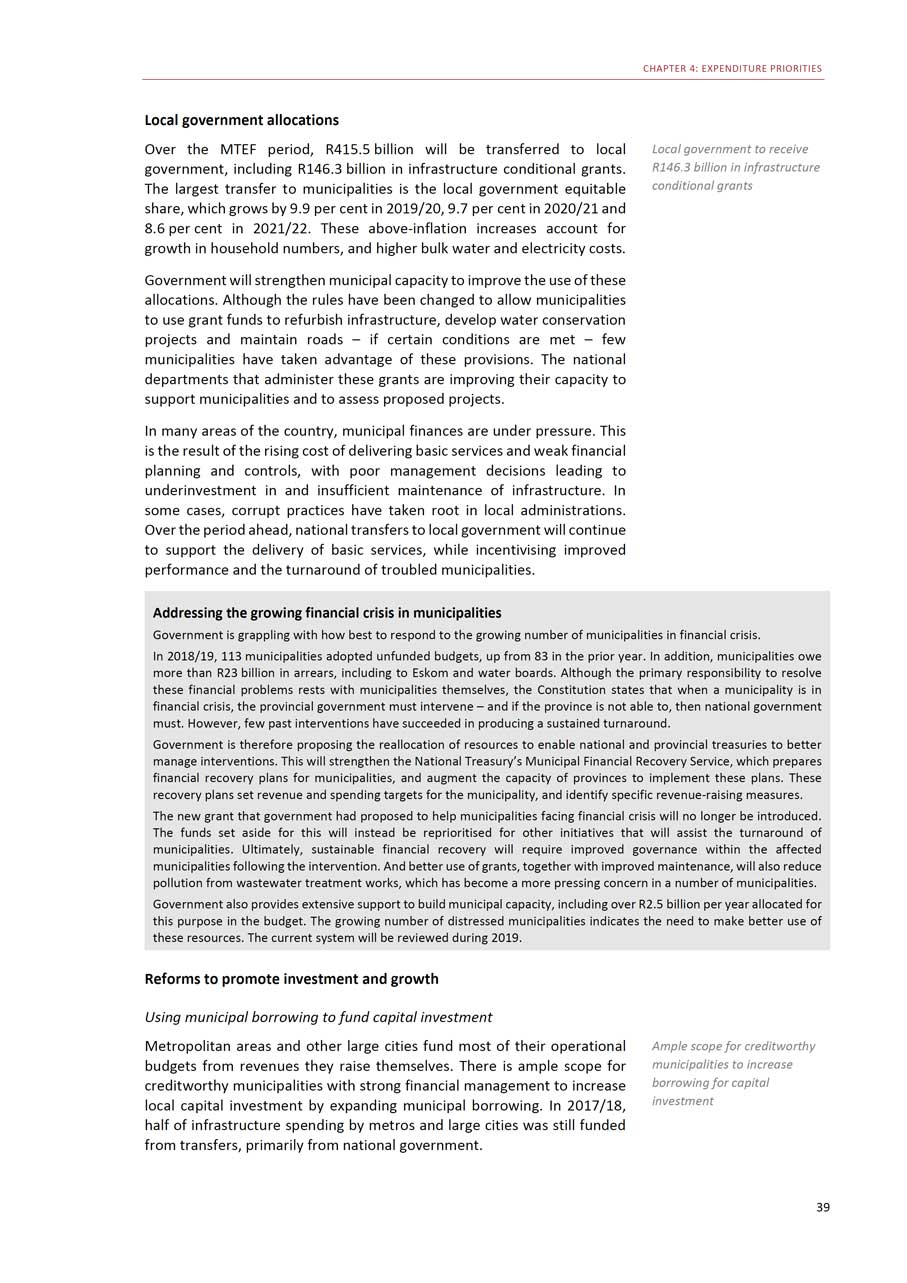
CHAPTER 4: EXPENDITURE PRIORITIES Local government allocations
Over the MTEF period, R415.5 billion will be transferred to local government, including R146.3 billion in infrastructure conditional grants. The largest transfer to municipalities is the local government equitable share, which grows by 9.9 per cent in 2019/20, 9.7 per cent in 2020/21 and8.6 per cent in 2021/22. These above-inflation increases account for growth in household numbers, and higher bulk water and electricity costs.Government will strengthen municipal capacity to improve the use of these allocations. Although the rules have been changed to allow municipalities to use grant funds to refurbish infrastructure, develop water conservation projects and maintain roads - if certain conditions are met - few municipalities have taken advantage of these provisions. The national departments that administer these grants are improving their capacity to support municipalities and to assess proposed projects.In many areas of the country, municipal finances are under pressure. This is the result of the rising cost of delivering basic services and weak financial planning and controls, with poor management decisions leading to underinvestment in and insufficient maintenance of infrastructure. In some cases, corrupt practices have taken root in local administrations. Over the period ahead, national transfers to local government will continue to support the delivery of basic services, while incentivising improved performance and the turnaround of troubled municipalities.Addressing the growing financial crisis in municipalities
Local government to receive R146.3 billion in infrastructure conditional grants
Government is grappling with how best to respond to the growing number of municipalities in financial crisis. In 2018/19, 113 municipalities adopted unfunded budgets, up from 83 in the prior year. In addition, municipalities owe more than R23 billion in arrears, including to Eskom and water boards. Although the primary responsibility to resolve these financial problems rests with municipalities themselves, the Constitution states that when a municipality is in financial crisis, the provincial government must intervene - and if the province is not able to, then national government must. However, few past interventions have succeeded in producing a sustained turnaround. Government is therefore proposing the reallocation of resources to enable national and provincial treasuries to better manage interventions. This will strengthen the National Treasury’s Municipal Financial Recovery Service, which prepares financial recovery plans for municipalities, and augment the capacity of provinces to implement these plans. These recovery plans set revenue and spending targets for the municipality, and identify specific revenue-raising measures. The new grant that government had proposed to help municipalities facing financial crisis will no longer be introduced. The funds set aside for this will instead be reprioritised for other initiatives that will assist the turnaround of municipalities. Ultimately, sustainable financial recovery will require improved governance within the affected municipalities following the intervention. And better use of grants, together with improved maintenance, will also reduce pollution from wastewater treatment works, which has become a more pressing concern in a number of municipalities. Government also provides extensive support to build municipal capacity, including over R2.5 billion per year allocated for this purpose in the budget. The growing number of distressed municipalities indicates the need to make better use of these resources. The current system will be reviewed during 2019. Reforms to promote investment and growth Using municipal borrowing to fund capital investment
Metropolitan areas and other large cities fund most of their operational budgets from revenues they raise themselves. There is ample scope for creditworthy municipalities with strong financial management to increase local capital investment by expanding municipal borrowing. In 2017/18, half of infrastructure spending by metros and large cities was still funded from transfers, primarily from national government.
Ample scope for creditworthy municipalities to increaseborrowing for capital investment39
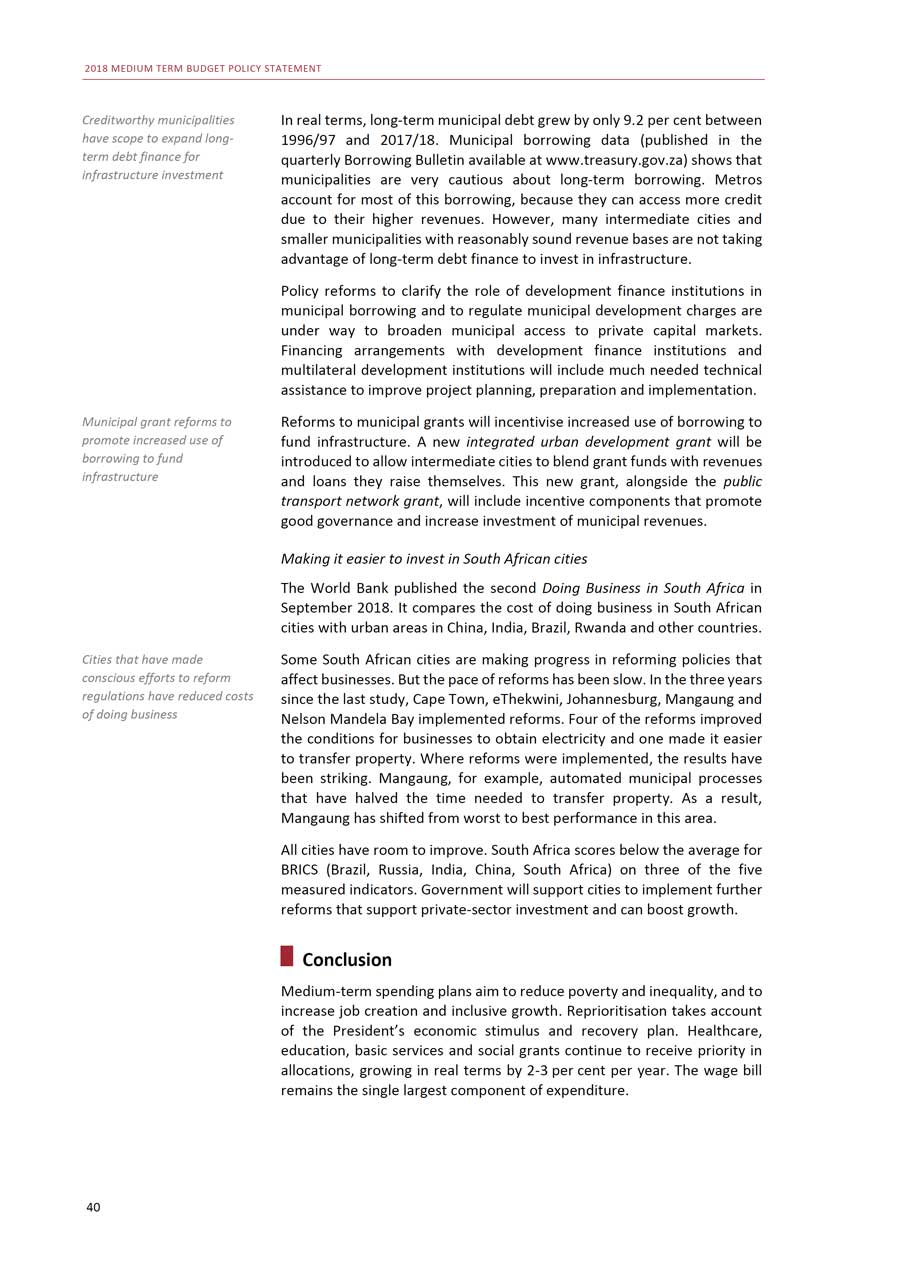
2018 MEDIUM TERM BUDGET POLICY STATEMENT
Creditworthy municipalities have scope to expand long- term debt finance forinfrastructure investmentMunicipal grant reforms to promote increased use of borrowing to fundinfrastructureCities that have made conscious efforts to reform regulations have reduced costs of doing business40
In real terms, long-term municipal debt grew by only 9.2 per cent between 1996/97 and 2017/18. Municipal borrowing data (published in the quarterly Borrowing Bulletin available at www.treasury.gov.za) shows that municipalities are very cautious about long-term borrowing. Metros account for most of this borrowing, because they can access more credit due to their higher revenues. However, many intermediate cities and smaller municipalities with reasonably sound revenue bases are not taking advantage of long-term debt finance to invest in infrastructure.Policy reforms to clarify the role of development finance institutions in municipal borrowing and to regulate municipal development charges are under way to broaden municipal access to private capital markets. Financing arrangements with development finance institutions and multilateral development institutions will include much needed technical assistance to improve project planning, preparation and implementation.Reforms to municipal grants will incentivise increased use of borrowing to fund infrastructure. A new integrated urban development grant will be introduced to allow intermediate cities to blend grant funds with revenues and loans they raise themselves. This new grant, alongside the public transport network grant, will include incentive components that promote good governance and increase investment of municipal revenues.Making it easier to invest in South African citiesThe World Bank published the second Doing Business in South Africa in September 2018. It compares the cost of doing business in South African cities with urban areas in China, India, Brazil, Rwanda and other countries.Some South African cities are making progress in reforming policies that affect businesses. But the pace of reforms has been slow. In the three years since the last study, Cape Town, eThekwini, Johannesburg, Mangaung and Nelson Mandela Bay implemented reforms. Four of the reforms improved the conditions for businesses to obtain electricity and one made it easier to transfer property. Where reforms were implemented, the results have been striking. Mangaung, for example, automated municipal processes that have halved the time needed to transfer property. As a result, Mangaung has shifted from worst to best performance in this area.All cities have room to improve. South Africa scores below the average for BRICS (Brazil, Russia, India, China, South Africa) on three of the five measured indicators. Government will support cities to implement further reforms that support private-sector investment and can boost growth.ConclusionMedium-term spending plans aim to reduce poverty and inequality, and to increase job creation and inclusive growth. Reprioritisation takes account of the President’s economic stimulus and recovery plan. Healthcare, education, basic services and social grants continue to receive priority in allocations, growing in real terms by 2-3 per cent per year. The wage bill remains the single largest component of expenditure.
ANNEXURES 41

2018 MEDIUM TERM BUDGET POLICY STATEMENT This page was left blank intentionally. 42
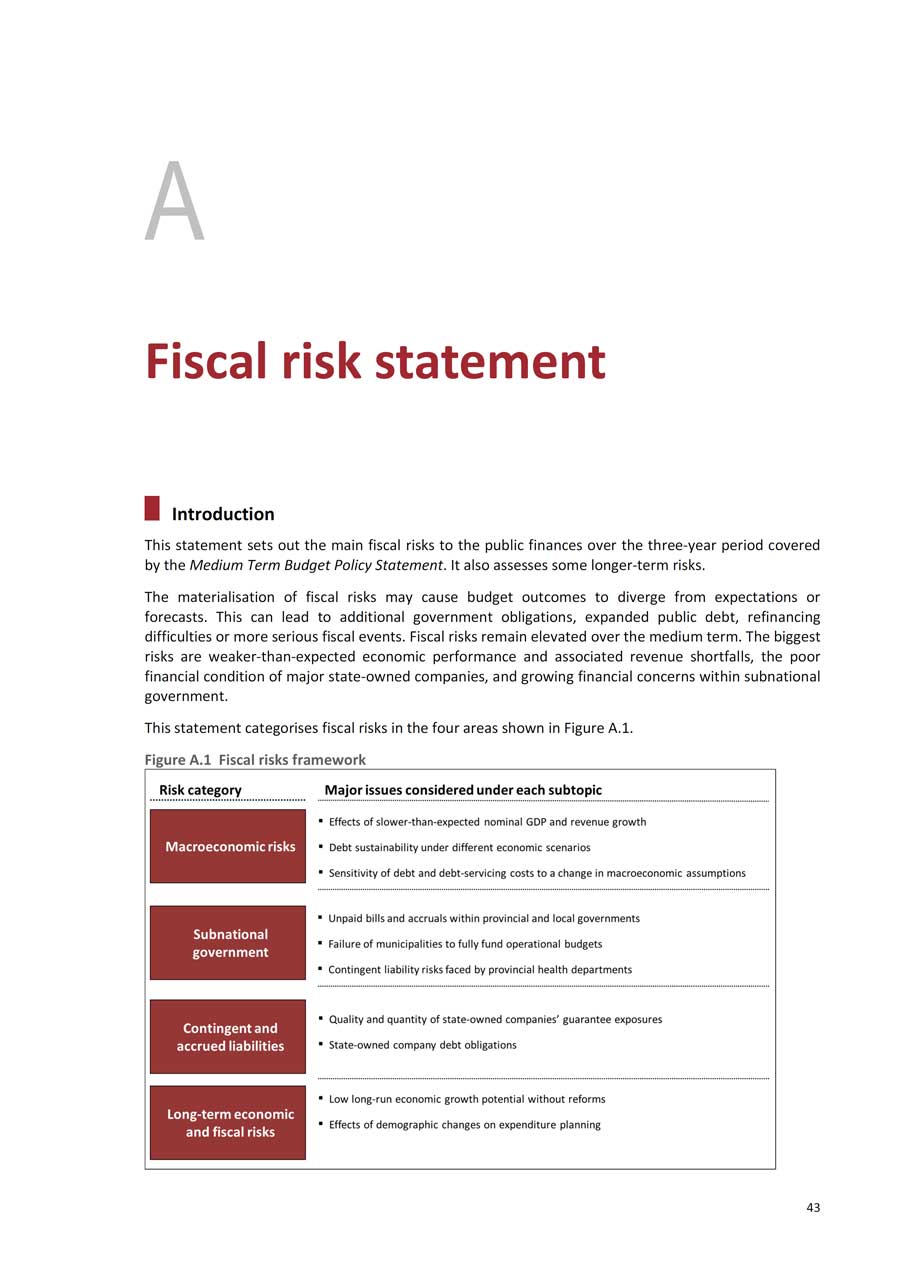
A Fiscal risk statement Introduction This statement sets out the main fiscal risks to the public finances over the three-year period covered by the Medium Term Budget Policy Statement. It also assesses some longer-term risks. The materialisation of fiscal risks may cause budget outcomes to diverge from expectations or forecasts. This can lead to additional government obligations, expanded public debt, refinancing difficulties or more serious fiscal events. Fiscal risks remain elevated over the medium term. The biggest risks are weaker-than-expected economic performance and associated revenue shortfalls, the poor financial condition of major state-owned companies, and growing financial concerns within subnational government. This statement categorises fiscal risks in the four areas shown in Figure A.1. Figure A.1 Fiscal risks framework 43
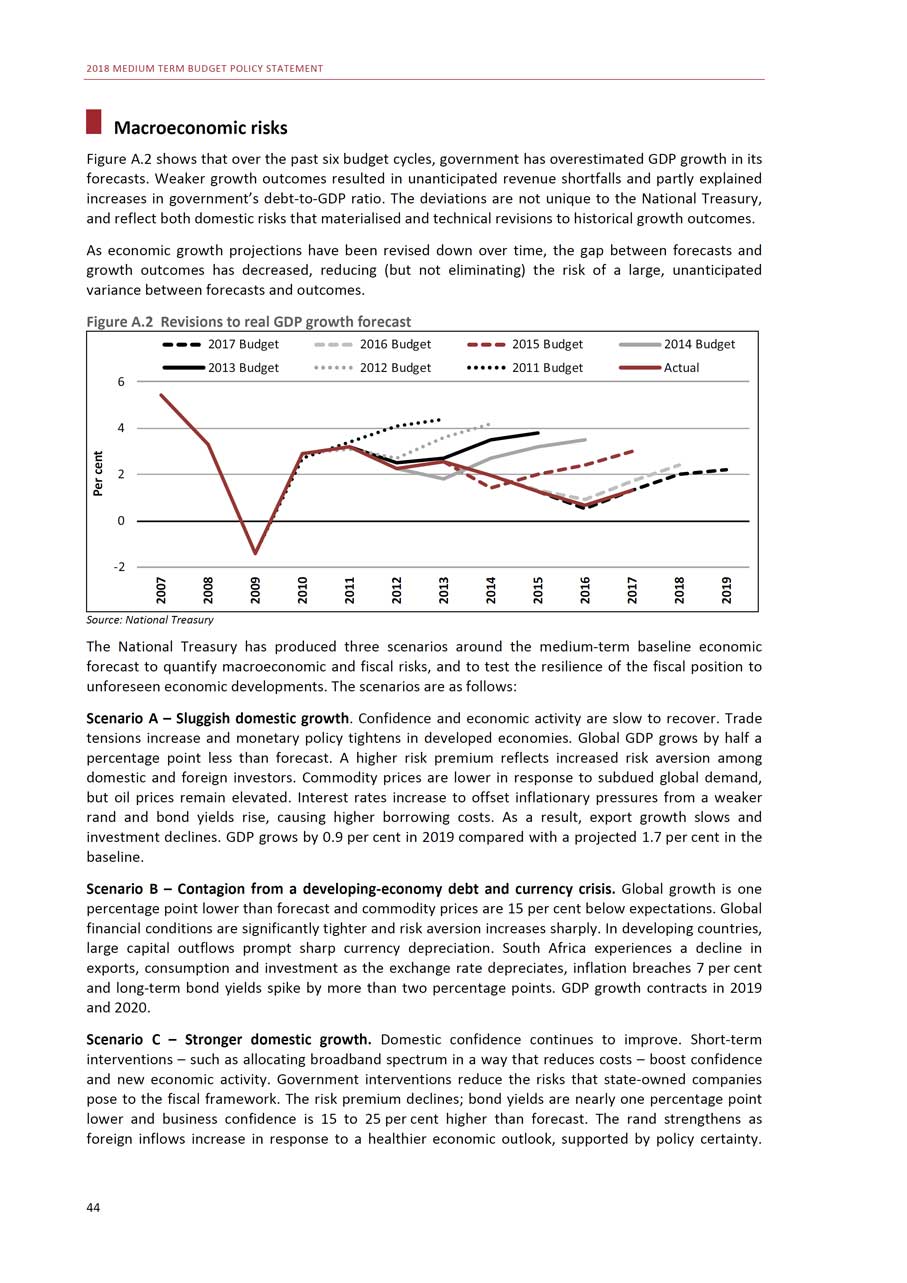
2018 MEDIUM TERM BUDGET POLICY STATEMENT Macroeconomic risks Figure A.2 shows that over the past six budget cycles, government has overestimated GDP growth in its forecasts. Weaker growth outcomes resulted in unanticipated revenue shortfalls and partly explained increases in government’s debt-to-GDP ratio. The deviations are not unique to the National Treasury, and reflect both domestic risks that materialised and technical revisions to historical growth outcomes. As economic growth projections have been revised down over time, the gap between forecasts and growth outcomes has decreased, reducing (but not eliminating) the risk of a large, unanticipated variance between forecasts and outcomes. Figure A.2 Revisions to real GDP growth forecast 2017 Budget 2016 Budget 2015 Budget 2014 Budget2013 Budget 2012 Budget 2011 Budget Actual6 4 2 0 -2 Source: National Treasury The National Treasury has produced three scenarios around the medium-term baseline economic forecast to quantify macroeconomic and fiscal risks, and to test the resilience of the fiscal position to unforeseen economic developments. The scenarios are as follows: Scenario A - Sluggish domestic growth. Confidence and economic activity are slow to recover. Trade tensions increase and monetary policy tightens in developed economies. Global GDP grows by half a percentage point less than forecast. A higher risk premium reflects increased risk aversion among domestic and foreign investors. Commodity prices are lower in response to subdued global demand, but oil prices remain elevated. Interest rates increase to offset inflationary pressures from a weaker rand and bond yields rise, causing higher borrowing costs. As a result, export growth slows and investment declines. GDP grows by 0.9 per cent in 2019 compared with a projected 1.7 per cent in the baseline. Scenario B - Contagion from a developing-economy debt and currency crisis. Global growth is one percentage point lower than forecast and commodity prices are 15 per cent below expectations. Global financial conditions are significantly tighter and risk aversion increases sharply. In developing countries, large capital outflows prompt sharp currency depreciation. South Africa experiences a decline in exports, consumption and investment as the exchange rate depreciates, inflation breaches 7 per cent and long-term bond yields spike by more than two percentage points. GDP growth contracts in 2019 and 2020. Scenario C - Stronger domestic growth. Domestic confidence continues to improve. Short-term interventions - such as allocating broadband spectrum in a way that reduces costs - boost confidence and new economic activity. Government interventions reduce the risks that state-owned companies pose to the fiscal framework. The risk premium declines; bond yields are nearly one percentage point lower and business confidence is 15 to 25 per cent higher than forecast. The rand strengthens as foreign inflows increase in response to a healthier economic outlook, supported by policy certainty. 44
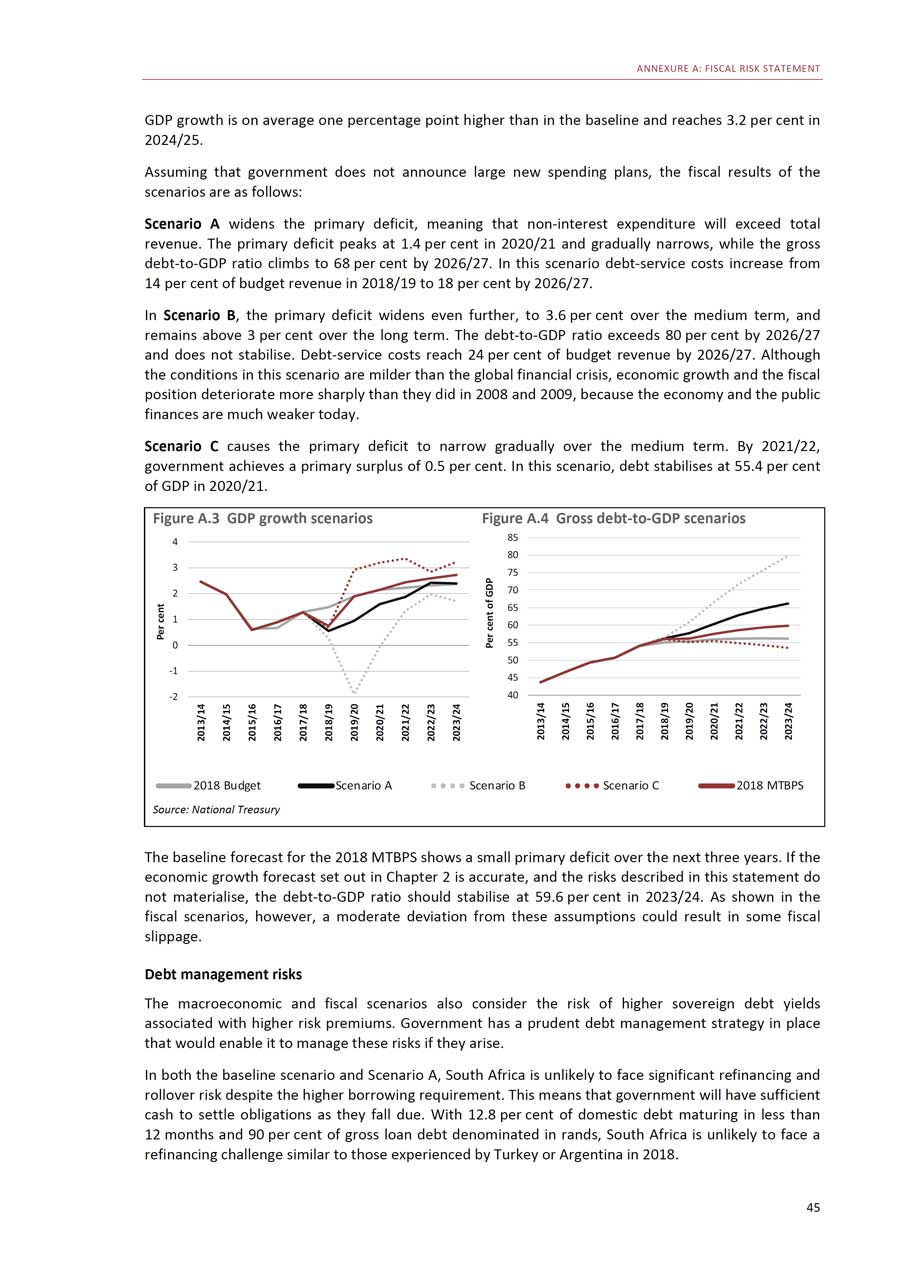
ANNEXURE A: FISCAL RISK STATEMENT GDP growth is on average one percentage point higher than in the baseline and reaches 3.2 per cent in 2024/25. Assuming that government does not announce large new spending plans, the fiscal results of the scenarios are as follows: Scenario A widens the primary deficit, meaning that non-interest expenditure will exceed total revenue. The primary deficit peaks at 1.4 per cent in 2020/21 and gradually narrows, while the gross debt-to-GDP ratio climbs to 68 per cent by 2026/27. In this scenario debt-service costs increase from 14 per cent of budget revenue in 2018/19 to 18 per cent by 2026/27. In Scenario B, the primary deficit widens even further, to 3.6 per cent over the medium term, and remains above 3 per cent over the long term. The debt-to-GDP ratio exceeds 80 per cent by 2026/27 and does not stabilise. Debt-service costs reach 24 per cent of budget revenue by 2026/27. Although the conditions in this scenario are milder than the global financial crisis, economic growth and the fiscal position deteriorate more sharply than they did in 2008 and 2009, because the economy and the public finances are much weaker today. Scenario C causes the primary deficit to narrow gradually over the medium term. By 2021/22, government achieves a primary surplus of 0.5 per cent. In this scenario, debt stabilises at 55.4 per cent of GDP in 2020/21.
Figure A.3 GDP growth scenarios43210-1-22018 Budget Scenario ASource: National Treasury
Figure A.4 Gross debt-to-GDP scenarios85807570656055504540Scenario B Scenario C 2018 MTBPS
The baseline forecast for the 2018 MTBPS shows a small primary deficit over the next three years. If the economic growth forecast set out in Chapter 2 is accurate, and the risks described in this statement do not materialise, the debt-to-GDP ratio should stabilise at 59.6 per cent in 2023/24. As shown in the fiscal scenarios, however, a moderate deviation from these assumptions could result in some fiscal slippage. Debt management risks The macroeconomic and fiscal scenarios also consider the risk of higher sovereign debt yields associated with higher risk premiums. Government has a prudent debt management strategy in place that would enable it to manage these risks if they arise. In both the baseline scenario and Scenario A, South Africa is unlikely to face significant refinancing and rollover risk despite the higher borrowing requirement. This means that government will have sufficient cash to settle obligations as they fall due. With 12.8 per cent of domestic debt maturing in less than 12 months and 90 per cent of gross loan debt denominated in rands, South Africa is unlikely to face a refinancing challenge similar to those experienced by Turkey or Argentina in 2018. 45
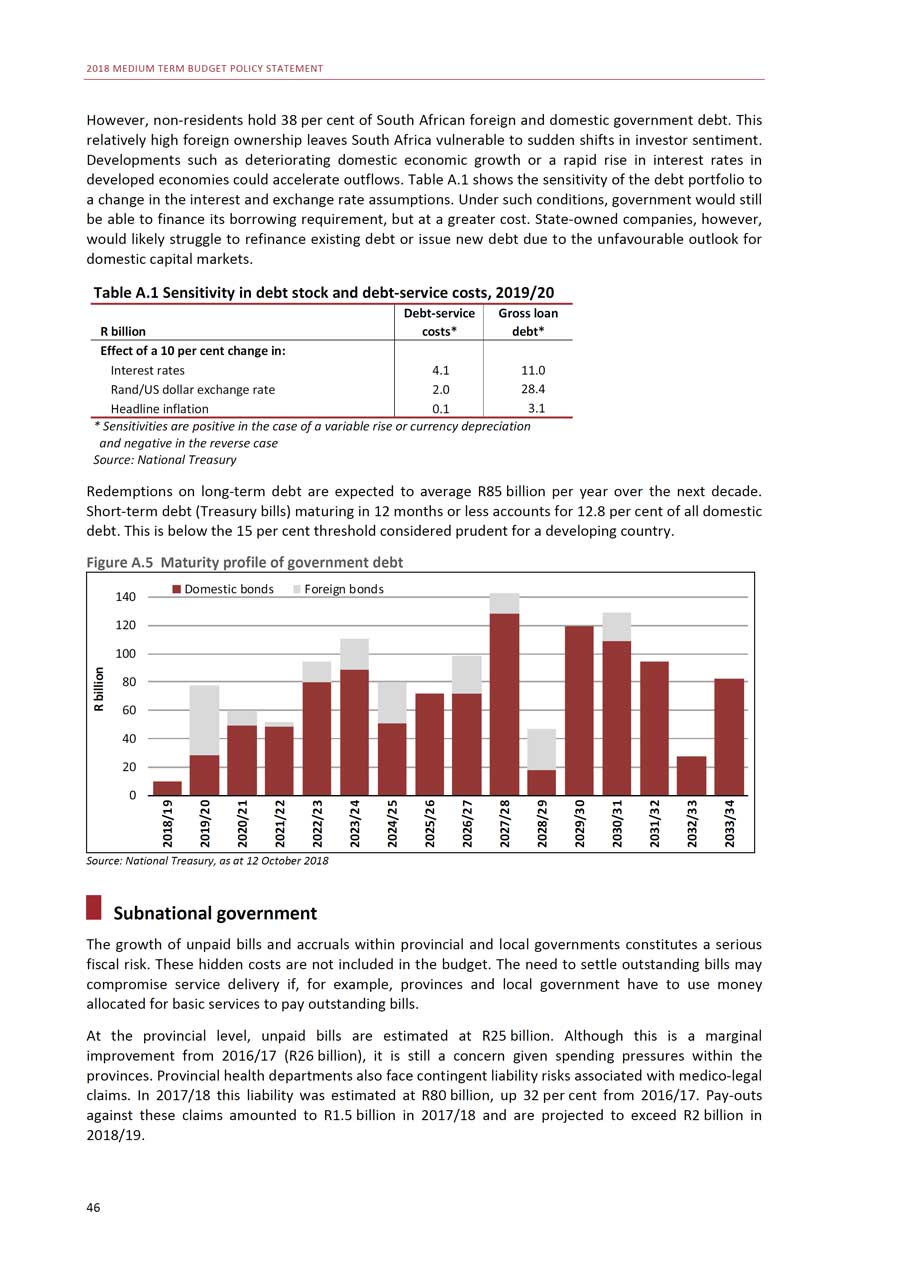
2018 MEDIUM TERM BUDGET POLICY STATEMENT However, non-residents hold 38 per cent of South African foreign and domestic government debt. This relatively high foreign ownership leaves South Africa vulnerable to sudden shifts in investor sentiment. Developments such as deteriorating domestic economic growth or a rapid rise in interest rates in developed economies could accelerate outflows. Table A.1 shows the sensitivity of the debt portfolio to a change in the interest and exchange rate assumptions. Under such conditions, government would still be able to finance its borrowing requirement, but at a greater cost. State-owned companies, however, would likely struggle to refinance existing debt or issue new debt due to the unfavourable outlook for domestic capital markets. Table A.1 Sensitivity in debt stock and debt-service costs, 2019/20 Debt-service Gross loanR billion costs* debt*Effect of a 10 per cent change in:Interest rates 4.1 11.0Rand/US dollar exchange rate 2.0 28.4Headline inflation 0.1 3.1* Sensitivities are positive in the case of a variable rise or currency depreciation and negative in the reverse case Source: National Treasury Redemptions on long-term debt are expected to average R85 billion per year over the next decade. Short-term debt (Treasury bills) maturing in 12 months or less accounts for 12.8 per cent of all domestic debt. This is below the 15 per cent threshold considered prudent for a developing country. Figure A.5 Maturity profile of government debt
140120100806040200
Domestic bonds Foreign bonds
Source: National Treasury, as at 12 October 2018 Subnational government The growth of unpaid bills and accruals within provincial and local governments constitutes a serious fiscal risk. These hidden costs are not included in the budget. The need to settle outstanding bills may compromise service delivery if, for example, provinces and local government have to use money allocated for basic services to pay outstanding bills. At the provincial level, unpaid bills are estimated at R25 billion. Although this is a marginal improvement from 2016/17 (R26 billion), it is still a concern given spending pressures within the provinces. Provincial health departments also face contingent liability risks associated with medico-legal claims. In 2017/18 this liability was estimated at R80 billion, up 32 per cent from 2016/17. Pay-outs against these claims amounted to R1.5 billion in 2017/18 and are projected to exceed R2 billion in 2018/19. 46
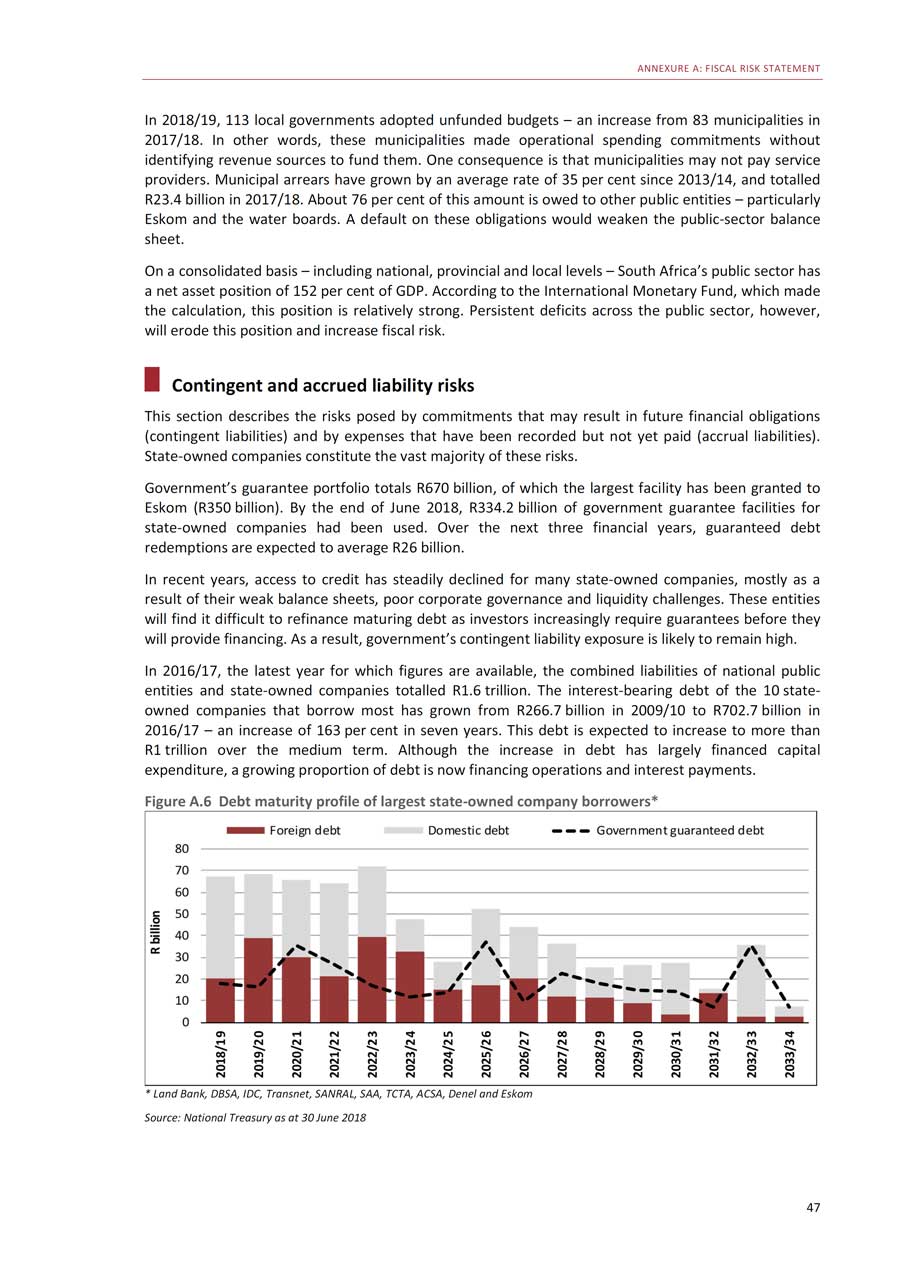
ANNEXURE A: FISCAL RISK STATEMENT In 2018/19, 113 local governments adopted unfunded budgets - an increase from 83 municipalities in 2017/18. In other words, these municipalities made operational spending commitments without identifying revenue sources to fund them. One consequence is that municipalities may not pay service providers. Municipal arrears have grown by an average rate of 35 per cent since 2013/14, and totalled R23.4 billion in 2017/18. About 76 per cent of this amount is owed to other public entities - particularly Eskom and the water boards. A default on these obligations would weaken the public-sector balance sheet. On a consolidated basis - including national, provincial and local levels - South Africa’s public sector has a net asset position of 152 per cent of GDP. According to the International Monetary Fund, which made the calculation, this position is relatively strong. Persistent deficits across the public sector, however, will erode this position and increase fiscal risk. Contingent and accrued liability risks This section describes the risks posed by commitments that may result in future financial obligations (contingent liabilities) and by expenses that have been recorded but not yet paid (accrual liabilities). State-owned companies constitute the vast majority of these risks. Government’s guarantee portfolio totals R670 billion, of which the largest facility has been granted to Eskom (R350 billion). By the end of June 2018, R334.2 billion of government guarantee facilities for state-owned companies had been used. Over the next three financial years, guaranteed debt redemptions are expected to average R26 billion. In recent years, access to credit has steadily declined for many state-owned companies, mostly as a result of their weak balance sheets, poor corporate governance and liquidity challenges. These entities will find it difficult to refinance maturing debt as investors increasingly require guarantees before they will provide financing. As a result, government’s contingent liability exposure is likely to remain high. In 2016/17, the latest year for which figures are available, the combined liabilities of national public entities and state-owned companies totalled R1.6 trillion. The interest-bearing debt of the 10 state- owned companies that borrow most has grown from R266.7 billion in 2009/10 to R702.7 billion in 2016/17 - an increase of 163 per cent in seven years. This debt is expected to increase to more than R1 trillion over the medium term. Although the increase in debt has largely financed capital expenditure, a growing proportion of debt is now financing operations and interest payments. Figure A.6 Debt maturity profile of largest state-owned company borrowers* * Land Bank, DBSA, IDC, Transnet, SANRAL, SAA, TCTA, ACSA, Denel and Eskom Source: National Treasury as at 30 June 2018 47
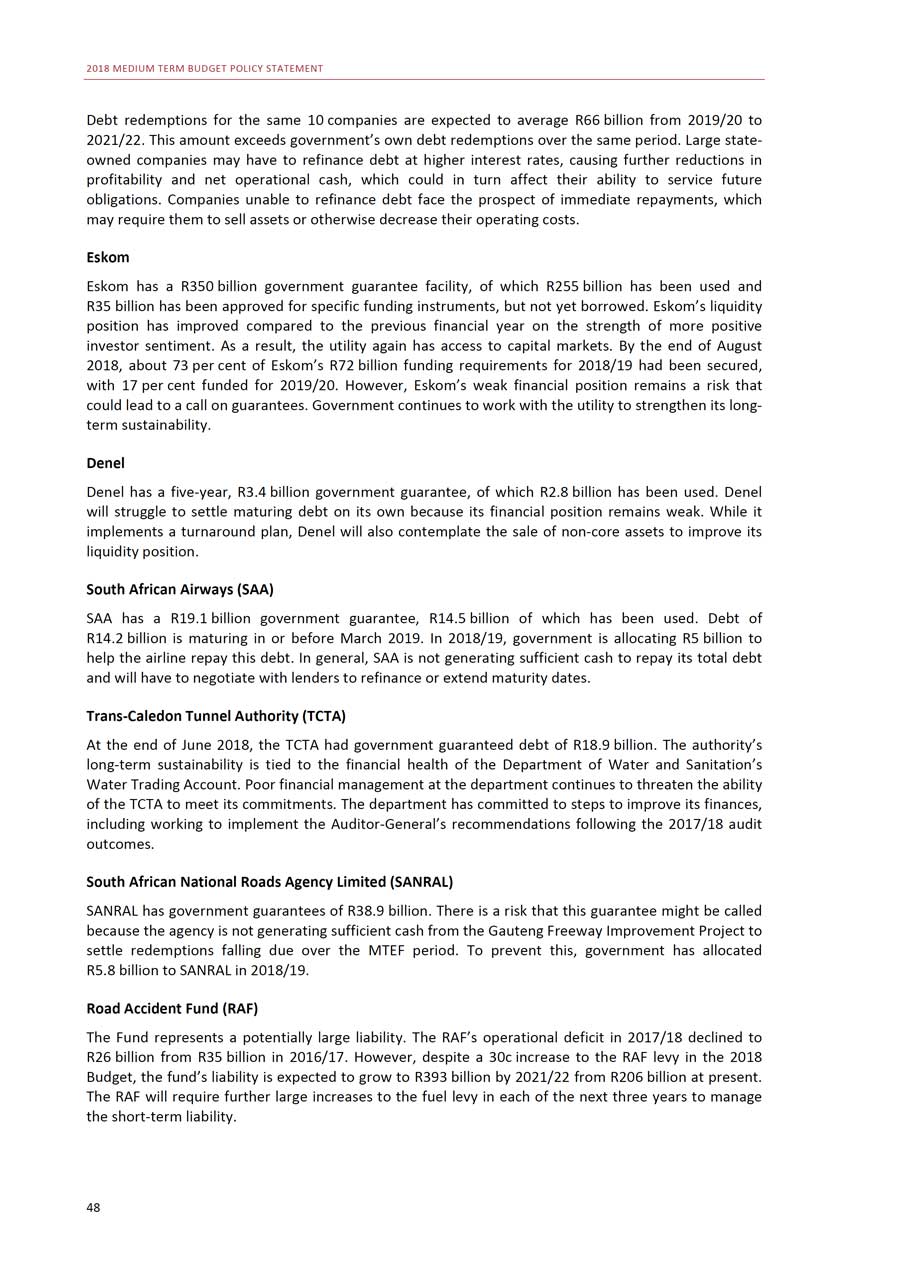
2018 MEDIUM TERM BUDGET POLICY STATEMENT Debt redemptions for the same 10 companies are expected to average R66 billion from 2019/20 to 2021/22. This amount exceeds government’s own debt redemptions over the same period. Large stateowned companies may have to refinance debt at higher interest rates, causing further reductions in profitability and net operational cash, which could in turn affect their ability to service future obligations. Companies unable to refinance debt face the prospect of immediate repayments, which may require them to sell assets or otherwise decrease their operating costs. Eskom Eskom has a R350 billion government guarantee facility, of which R255 billion has been used and R35 billion has been approved for specific funding instruments, but not yet borrowed. Eskom’s liquidity position has improved compared to the previous financial year on the strength of more positive investor sentiment. As a result, the utility again has access to capital markets. By the end of August 2018, about 73 per cent of Eskom’s R72 billion funding requirements for 2018/19 had been secured, with 17 per cent funded for 2019/20. However, Eskom’s weak financial position remains a risk that could lead to a call on guarantees. Government continues to work with the utility to strengthen its long- term sustainability. Denel Denel has a five-year, R3.4 billion government guarantee, of which R2.8 billion has been used. Denel will struggle to settle maturing debt on its own because its financial position remains weak. While it implements a turnaround plan, Denel will also contemplate the sale of non-core assets to improve its liquidity position. South African Airways (SAA) SAA has a R19.1 billion government guarantee, R14.5 billion of which has been used. Debt of R14.2 billion is maturing in or before March 2019. In 2018/19, government is allocating R5 billion to help the airline repay this debt. In general, SAA is not generating sufficient cash to repay its total debt and will have to negotiate with lenders to refinance or extend maturity dates. Trans-Caledon Tunnel Authority (TCTA) At the end of June 2018, the TCTA had government guaranteed debt of R18.9 billion. The authority’s long-term sustainability is tied to the financial health of the Department of Water and Sanitation’s Water Trading Account. Poor financial management at the department continues to threaten the ability of the TCTA to meet its commitments. The department has committed to steps to improve its finances, including working to implement the Auditor-General’s recommendations following the 2017/18 audit outcomes. South African National Roads Agency Limited (SANRAL) SANRAL has government guarantees of R38.9 billion. There is a risk that this guarantee might be called because the agency is not generating sufficient cash from the Gauteng Freeway Improvement Project to settle redemptions falling due over the MTEF period. To prevent this, government has allocated R5.8 billion to SANRAL in 2018/19. Road Accident Fund (RAF) The Fund represents a potentially large liability. The RAF’s operational deficit in 2017/18 declined to R26 billion from R35 billion in 2016/17. However, despite a 30c increase to the RAF levy in the 2018 Budget, the fund’s liability is expected to grow to R393 billion by 2021/22 from R206 billion at present. The RAF will require further large increases to the fuel levy in each of the next three years to manage the short-term liability. 48
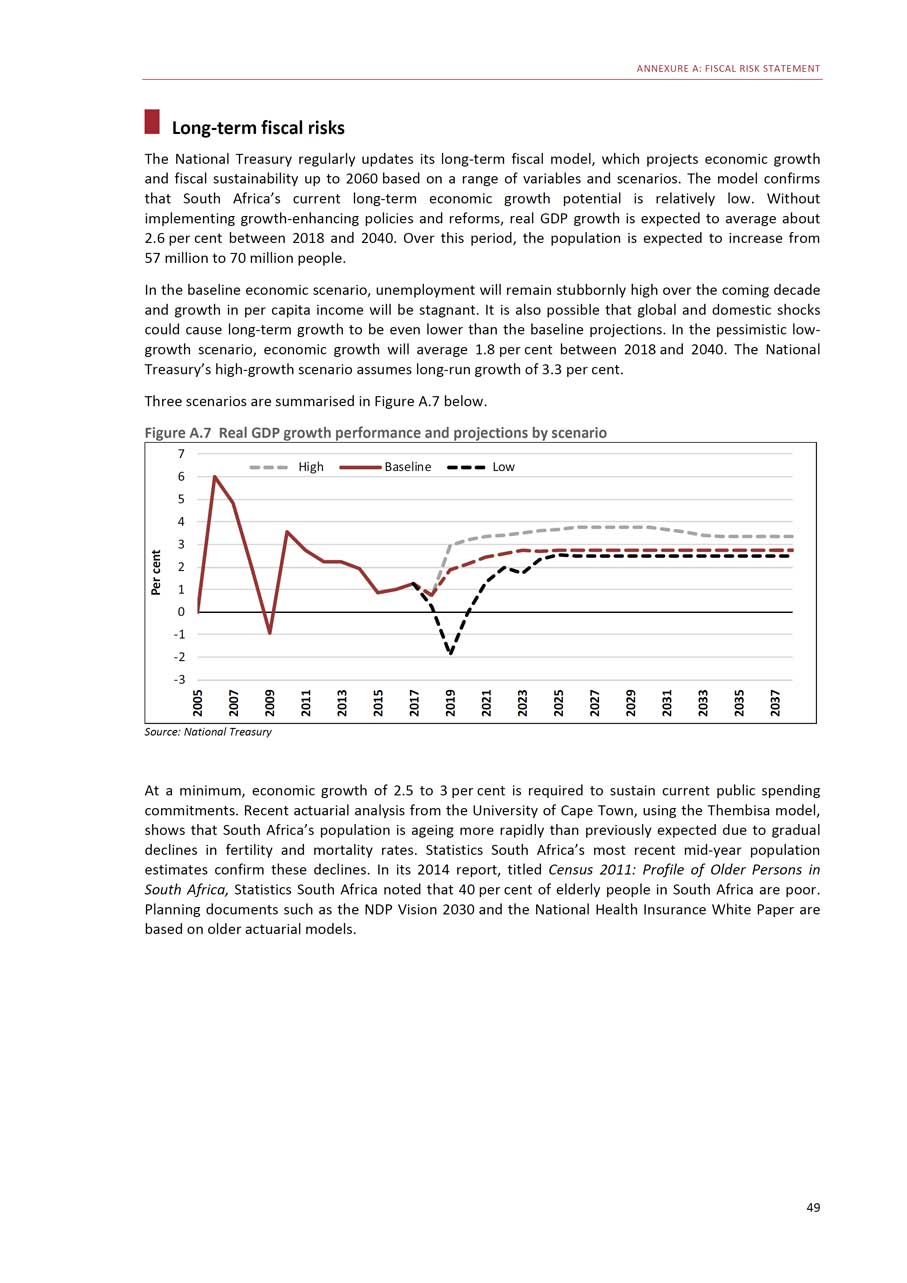
ANNEXURE A: FISCAL RISK STATEMENT Long-term fiscal risks The National Treasury regularly updates its long-term fiscal model, which projects economic growth and fiscal sustainability up to 2060 based on a range of variables and scenarios. The model confirms that South Africa’s current long-term economic growth potential is relatively low. Without implementing growth-enhancing policies and reforms, real GDP growth is expected to average about 2.6 per cent between 2018 and 2040. Over this period, the population is expected to increase from 57 million to 70 million people. In the baseline economic scenario, unemployment will remain stubbornly high over the coming decade and growth in per capita income will be stagnant. It is also possible that global and domestic shocks could cause long-term growth to be even lower than the baseline projections. In the pessimistic lowgrowth scenario, economic growth will average 1.8 per cent between 2018 and 2040. The National Treasury’s high-growth scenario assumes long-run growth of 3.3 per cent. Three scenarios are summarised in Figure A.7 below. Figure A.7 Real GDP growth performance and projections by scenario 7
6543210-1-2-3
High Baseline Low
Source: National Treasury At a minimum, economic growth of 2.5 to 3 per cent is required to sustain current public spending commitments. Recent actuarial analysis from the University of Cape Town, using the Thembisa model, shows that South Africa’s population is ageing more rapidly than previously expected due to gradual declines in fertility and mortality rates. Statistics South Africa’s most recent mid-year population estimates confirm these declines. In its 2014 report, titled Census 2011: Profile of Older Persons in South Africa, Statistics South Africa noted that 40 per cent of elderly people in South Africa are poor. Planning documents such as the NDP Vision 2030 and the National Health Insurance White Paper are based on older actuarial models. 49
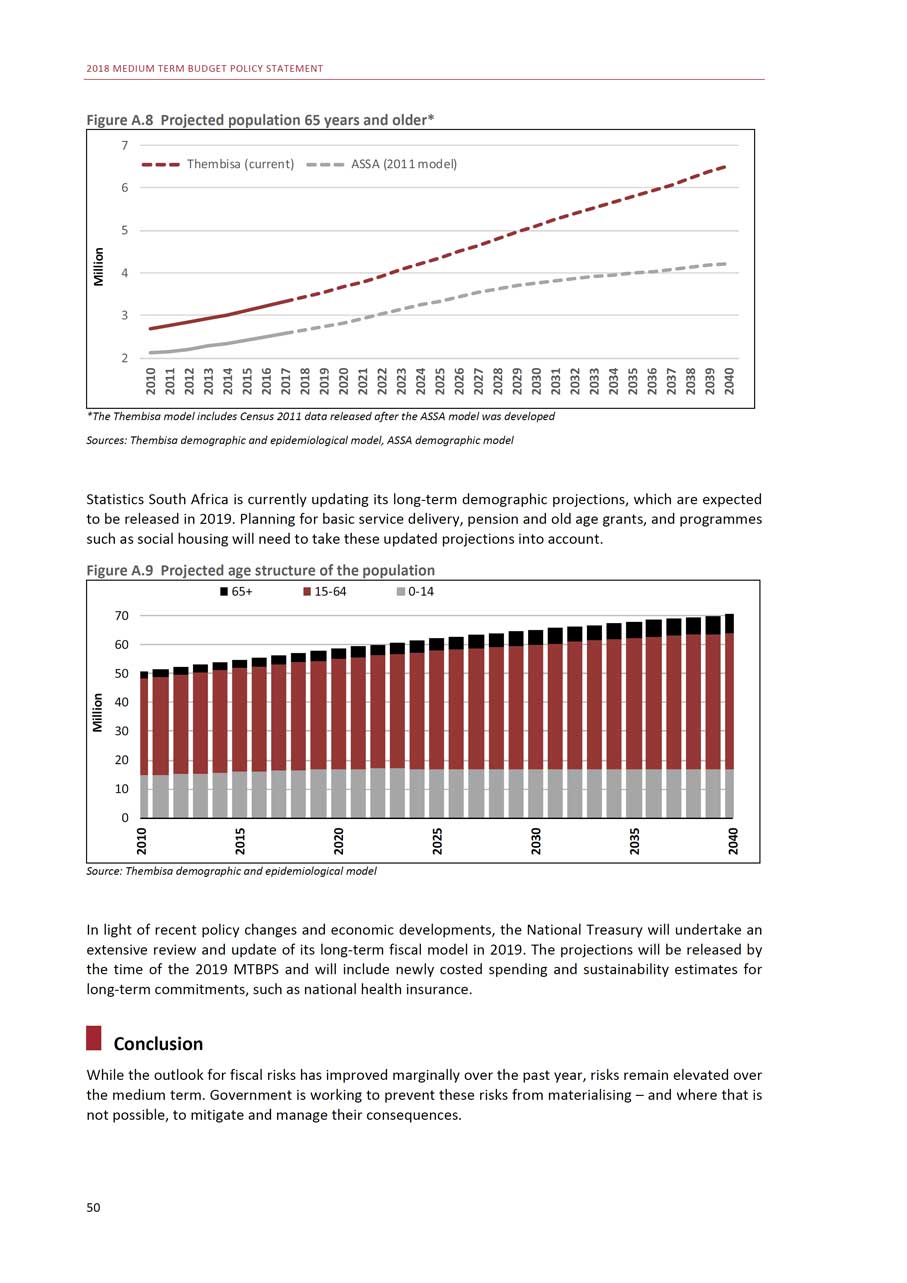
2018 MEDIUM TERM BUDGET POLICY STATEMENT Figure A.8 Projected population 65 years and older* 7 Thembisa (current) ASSA (2011 model)6 5 4 3 2 *The Thembisa model includes Census 2011 data released after the ASSA model was developed Sources: Thembisa demographic and epidemiological model, ASSA demographic model Statistics South Africa is currently updating its long-term demographic projections, which are expected to be released in 2019. Planning for basic service delivery, pension and old age grants, and programmes such as social housing will need to take these updated projections into account. Figure A.9 Projected age structure of the population 65+ 15-64 0-1470 60 50 40 30 20 10 0 Source: Thembisa demographic and epidemiological model In light of recent policy changes and economic developments, the National Treasury will undertake an extensive review and update of its long-term fiscal model in 2019. The projections will be released by the time of the 2019 MTBPS and will include newly costed spending and sustainability estimates for long-term commitments, such as national health insurance. Conclusion While the outlook for fiscal risks has improved marginally over the past year, risks remain elevated over the medium term. Government is working to prevent these risks from materialising - and where that is not possible, to mitigate and manage their consequences. 50
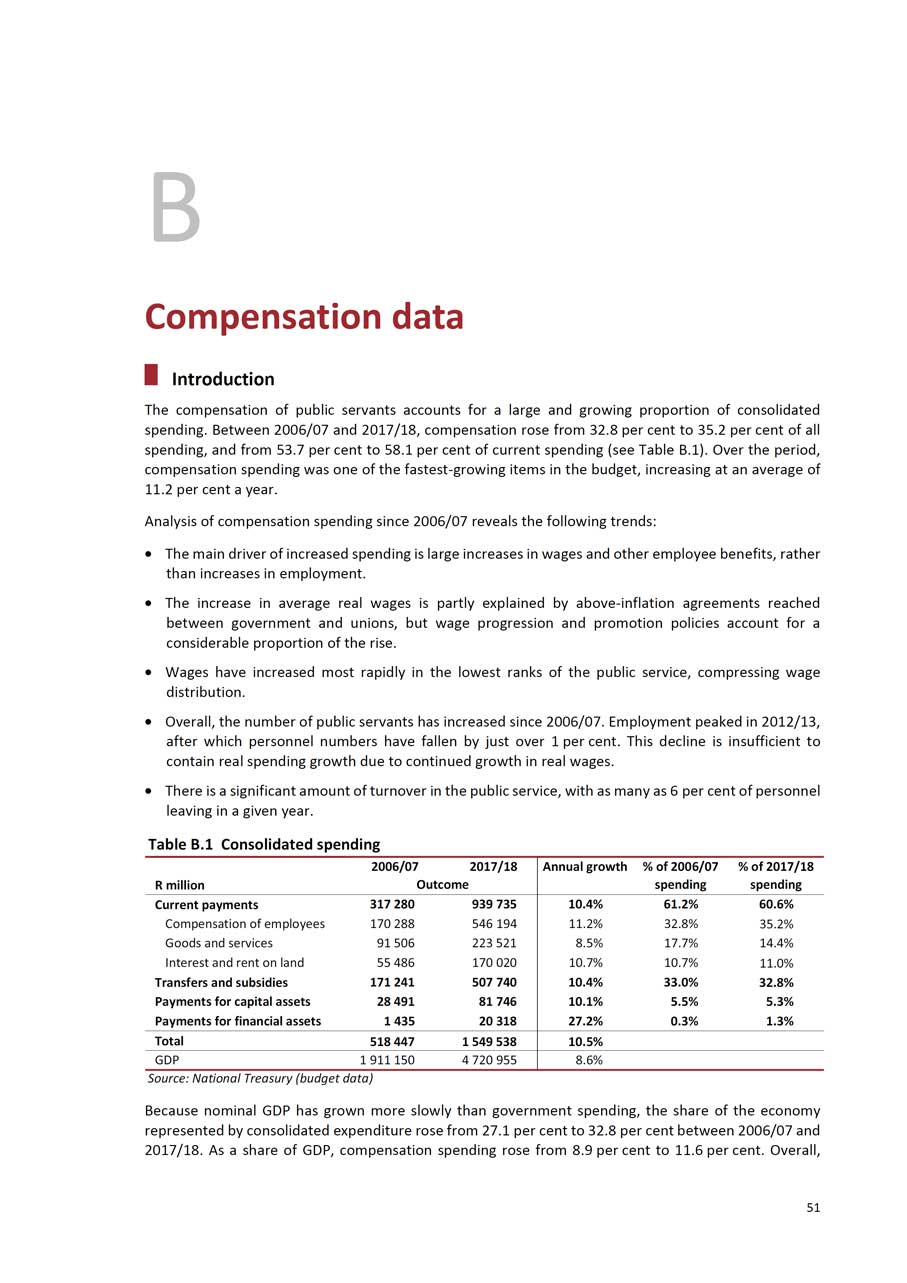
B Compensation data Introduction The compensation of public servants accounts for a large and growing proportion of consolidated spending. Between 2006/07 and 2017/18, compensation rose from 32.8 per cent to 35.2 per cent of all spending, and from 53.7 per cent to 58.1 per cent of current spending (see Table B.1). Over the period, compensation spending was one of the fastest-growing items in the budget, increasing at an average of 11.2 per cent a year. Analysis of compensation spending since 2006/07 reveals the following trends: • The main driver of increased spending is large increases in wages and other employee benefits, rather than increases in employment. • The increase in average real wages is partly explained by above-inflation agreements reached between government and unions, but wage progression and promotion policies account for a considerable proportion of the rise. • Wages have increased most rapidly in the lowest ranks of the public service, compressing wage distribution. • Overall, the number of public servants has increased since 2006/07. Employment peaked in 2012/13, after which personnel numbers have fallen by just over 1 per cent. This decline is insufficient to contain real spending growth due to continued growth in real wages. • There is a significant amount of turnover in the public service, with as many as 6 per cent of personnel leaving in a given year. Table B.1 Consolidated spending 2006/07 2017/18 Annual growth % of 2006/07 % of 2017/18R million Outcome spending spendingCurrent payments 317 280 939 735 10.4% 61.2% 60.6%Compensation of employees 170 288 546 194 11.2% 32.8% 35.2%Goods and services 91 506 223 521 8.5% 17.7% 14.4%Interest and rent on land 55 486 170 020 10.7% 10.7% 11.0%Transfers and subsidies 171 241 507 740 10.4% 33.0% 32.8%Payments for capital assets 28 491 81 746 10.1% 5.5% 5.3%Payments for financial assets 1 435 20 318 27.2% 0.3% 1.3%Total 518 447 1 549 538 10.5%GDP 1 911 150 4 720 955 8.6%Source: National Treasury (budget data) Because nominal GDP has grown more slowly than government spending, the share of the economy represented by consolidated expenditure rose from 27.1 per cent to 32.8 per cent between 2006/07 and 2017/18. As a share of GDP, compensation spending rose from 8.9 per cent to 11.6 per cent. Overall, 51
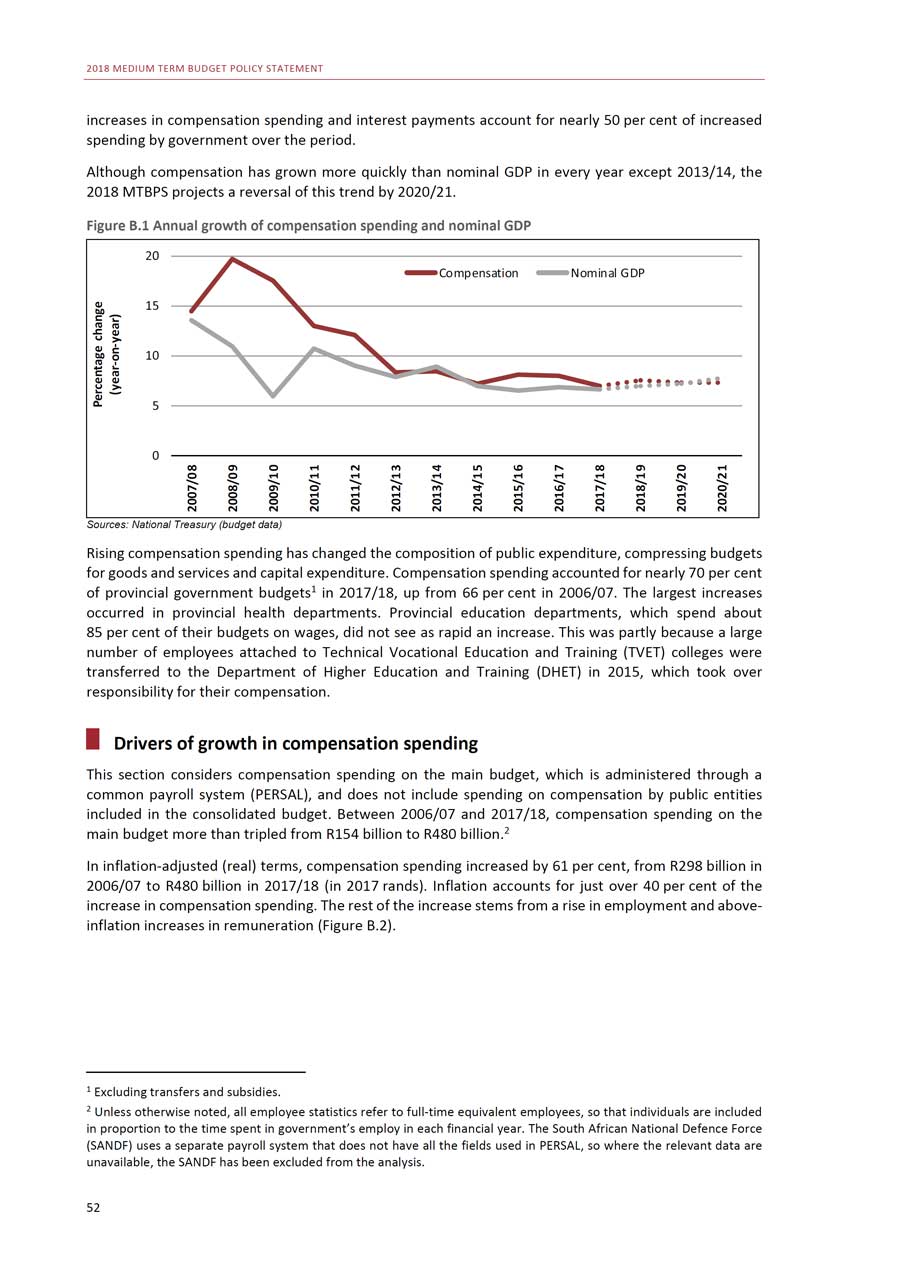
2018 MEDIUM TERM BUDGET POLICY STATEMENT increases in compensation spending and interest payments account for nearly 50 per cent of increased spending by government over the period. Although compensation has grown more quickly than nominal GDP in every year except 2013/14, the 2018 MTBPS projects a reversal of this trend by 2020/21. Figure B.1 Annual growth of compensation spending and nominal GDP 20 Compensation Nominal GDP15 10 5 0 Sources: National Treasury (budget data) Rising compensation spending has changed the composition of public expenditure, compressing budgets for goods and services and capital expenditure. Compensation spending accounted for nearly 70 per cent of provincial government budgets1 in 2017/18, up from 66 per cent in 2006/07. The largest increases occurred in provincial health departments. Provincial education departments, which spend about 85 per cent of their budgets on wages, did not see as rapid an increase. This was partly because a large number of employees attached to Technical Vocational Education and Training (TVET) colleges were transferred to the Department of Higher Education and Training (DHET) in 2015, which took over responsibility for their compensation. Drivers of growth in compensation spending This section considers compensation spending on the main budget, which is administered through a common payroll system (PERSAL), and does not include spending on compensation by public entities included in the consolidated budget. Between 2006/07 and 2017/18, compensation spending on the main budget more than tripled from R154 billion to R480 billion.2 In inflation-adjusted (real) terms, compensation spending increased by 61 per cent, from R298 billion in 2006/07 to R480 billion in 2017/18 (in 2017 rands). Inflation accounts for just over 40 per cent of the increase in compensation spending. The rest of the increase stems from a rise in employment and aboveinflation increases in remuneration (Figure B.2). 1 Excluding transfers and subsidies. 2 Unless otherwise noted, all employee statistics refer to full-time equivalent employees, so that individuals are included in proportion to the time spent in government’s employ in each financial year. The South African National Defence Force (SANDF) uses a separate payroll system that does not have all the fields used in PERSAL, so where the relevant data are unavailable, the SANDF has been excluded from the analysis. 52
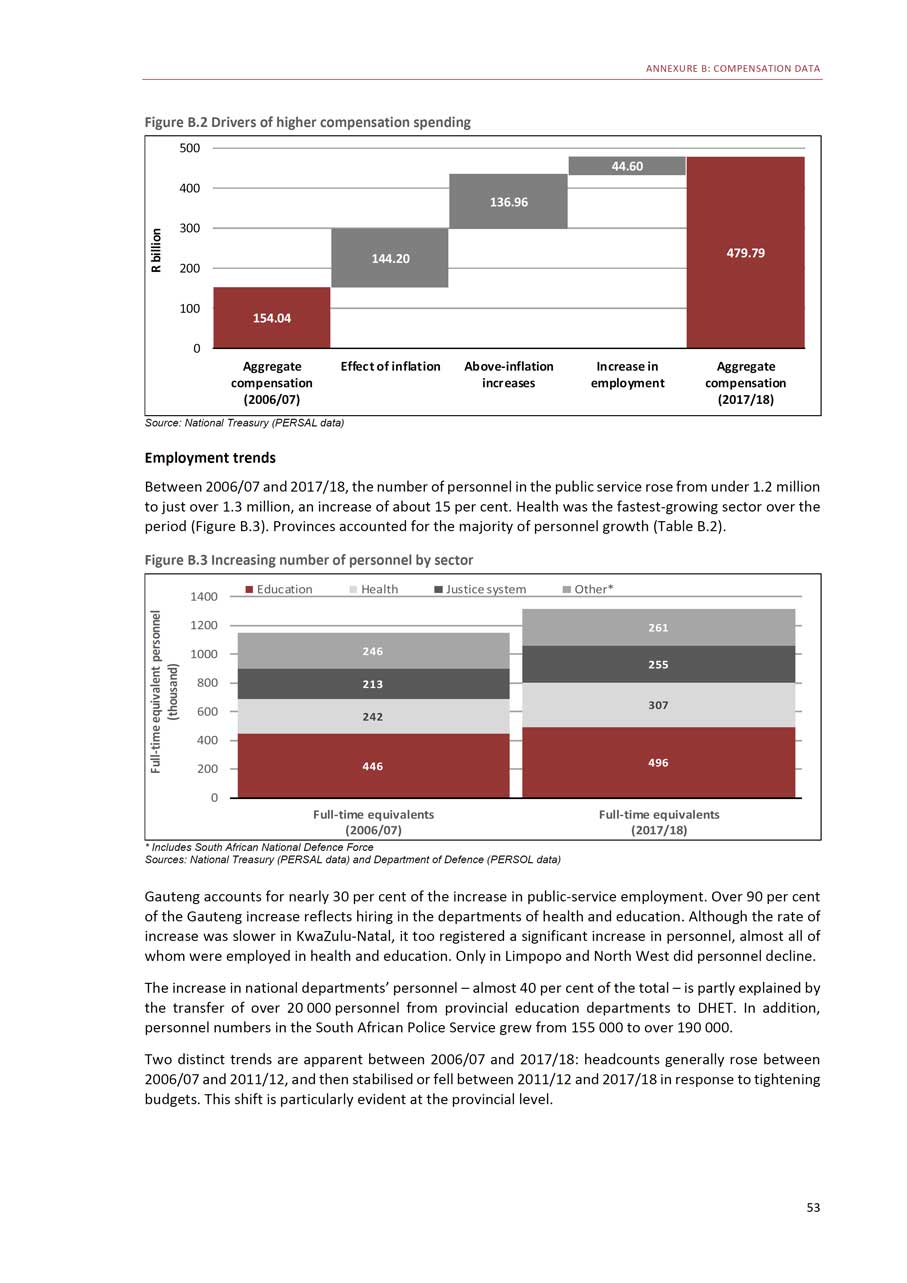
ANNEXURE B: COMPENSATION DATA Figure B.2 Drivers of higher compensation spending 500 44.60 400 136.96 300
2001000
144.20154.04Aggregate Effect of inflation compensation(2006/07)
479.79Above-inflation Increase in Aggregateincreases employment compensation(2017/18)
Source: National Treasury (PERSAL data) Employment trends Between 2006/07 and 2017/18, the number of personnel in the public service rose from under 1.2 million to just over 1.3 million, an increase of about 15 per cent. Health was the fastest-growing sector over the period (Figure B.3). Provinces accounted for the majority of personnel growth (Table B.2). Figure B.3 Increasing number of personnel by sector
1400120010008006004002000
Education Health246213242446Full-time equivalents (2006/07)
Justice system Other*261255307496Full-time equivalents (2017/18)
* Includes South African National Defence Force Sources: National Treasury (PERSAL data) and Department of Defence (PERSOL data) Gauteng accounts for nearly 30 per cent of the increase in public-service employment. Over 90 per cent of the Gauteng increase reflects hiring in the departments of health and education. Although the rate of increase was slower in KwaZulu-Natal, it too registered a significant increase in personnel, almost all of whom were employed in health and education. Only in Limpopo and North West did personnel decline. The increase in national departments’ personnel - almost 40 per cent of the total - is partly explained by the transfer of over 20 000 personnel from provincial education departments to DHET. In addition, personnel numbers in the South African Police Service grew from 155 000 to over 190 000. Two distinct trends are apparent between 2006/07 and 2017/18: headcounts generally rose between 2006/07 and 2011/12, and then stabilised or fell between 2011/12 and 2017/18 in response to tightening budgets. This shift is particularly evident at the provincial level. 53
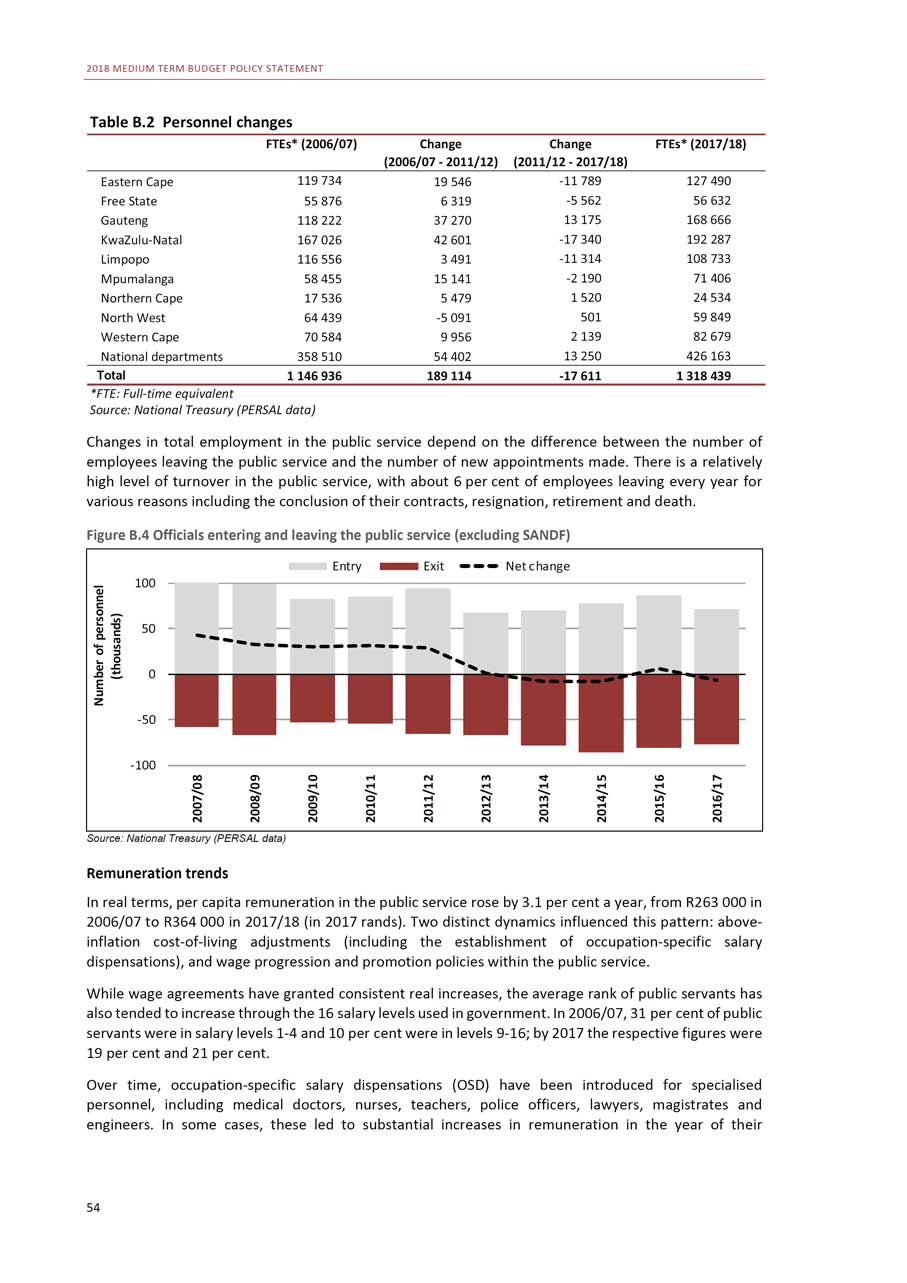
2018 MEDIUM TERM BUDGET POLICY STATEMENT Table B.2 Personnel changes FTEs* (2006/07) Change Change FTEs* (2017/18)(2006/07 - 2011/12) (2011/12 - 2017/18)Eastern Cape 119 734 19 546 -11 789 127 490Free State 55 876 6 319 -5 562 56 632Gauteng 118 222 37 270 13 175 168 666KwaZulu-Natal 167 026 42 601 -17 340 192 287Limpopo 116 556 3 491 -11 314 108 733Mpumalanga 58 455 15 141 -2 190 71 406Northern Cape 17 536 5 479 1 520 24 534North West 64 439 -5 091 501 59 849Western Cape 70 584 9 956 2 139 82 679National departments 358 510 54 402 13 250 426 163Total 1 146 936 189 114 -17 611 1 318 439*FTE: Full-time equivalent Source: National Treasury (PERSAL data) Changes in total employment in the public service depend on the difference between the number of employees leaving the public service and the number of new appointments made. There is a relatively high level of turnover in the public service, with about 6 per cent of employees leaving every year for various reasons including the conclusion of their contracts, resignation, retirement and death. Figure B.4 Officials entering and leaving the public service (excluding SANDF) Entry Exit Net change100 50 0 -50 -100 Source: National Treasury (PERSAL data) Remuneration trends In real terms, per capita remuneration in the public service rose by 3.1 per cent a year, from R263 000 in 2006/07 to R364 000 in 2017/18 (in 2017 rands). Two distinct dynamics influenced this pattern: aboveinflation cost-of-living adjustments (including the establishment of occupation-specific salary dispensations), and wage progression and promotion policies within the public service. While wage agreements have granted consistent real increases, the average rank of public servants has also tended to increase through the 16 salary levels used in government. In 2006/07, 31 per cent of public servants were in salary levels 1-4 and 10 per cent were in levels 9-16; by 2017 the respective figures were 19 per cent and 21 per cent. Over time, occupation-specific salary dispensations (OSD) have been introduced for specialised personnel, including medical doctors, nurses, teachers, police officers, lawyers, magistrates and engineers. In some cases, these led to substantial increases in remuneration in the year of their 54
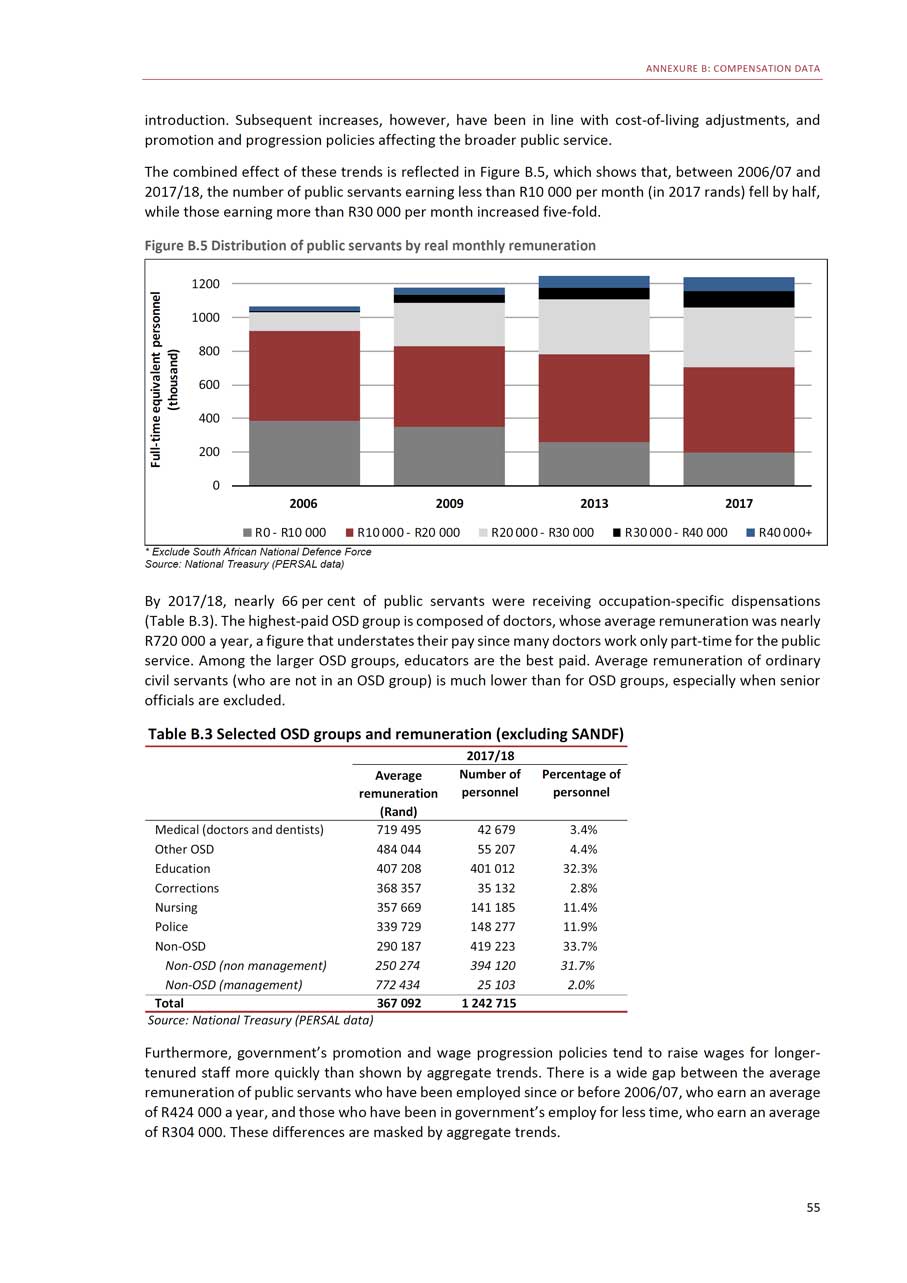
ANNEXURE B: COMPENSATION DATA introduction. Subsequent increases, however, have been in line with cost-of-living adjustments, and promotion and progression policies affecting the broader public service. The combined effect of these trends is reflected in Figure B.5, which shows that, between 2006/07 and 2017/18, the number of public servants earning less than R10 000 per month (in 2017 rands) fell by half, while those earning more than R30 000 per month increased five-fold. Figure B.5 Distribution of public servants by real monthly remuneration 1200 1000 800 600 400 200 0 2006 2009 2013 2017R0 - R10 000 R10 000 - R20 000 R20 000 - R30 000 R30 000 - R40 000 R40 000+* Exclude South African National Defence Force Source: National Treasury (PERSAL data) By 2017/18, nearly 66 per cent of public servants were receiving occupation-specific dispensations (Table B.3). The highest-paid OSD group is composed of doctors, whose average remuneration was nearly R720 000 a year, a figure that understates their pay since many doctors work only part-time for the public service. Among the larger OSD groups, educators are the best paid. Average remuneration of ordinary civil servants (who are not in an OSD group) is much lower than for OSD groups, especially when senior officials are excluded. Table B.3 Selected OSD groups and remuneration (excluding SANDF) 2017/18 Average Number of Percentage ofremuneration personnel personnel(Rand)Medical (doctors and dentists) 719 495 42 679 3.4%Other OSD 484 044 55 207 4.4%Education 407 208 401 012 32.3%Corrections 368 357 35 132 2.8%Nursing 357 669 141 185 11.4%Police 339 729 148 277 11.9%Non-OSD 290 187 419 223 33.7%Non-OSD (non management) 250 274 394 120 31.7%Non-OSD (management) 772 434 25 103 2.0%Total 367 092 1 242 715Source: National Treasury (PERSAL data) Furthermore, government’s promotion and wage progression policies tend to raise wages for longertenured staff more quickly than shown by aggregate trends. There is a wide gap between the average remuneration of public servants who have been employed since or before 2006/07, who earn an average of R424 000 a year, and those who have been in government’s employ for less time, who earn an average of R304 000. These differences are masked by aggregate trends. 55
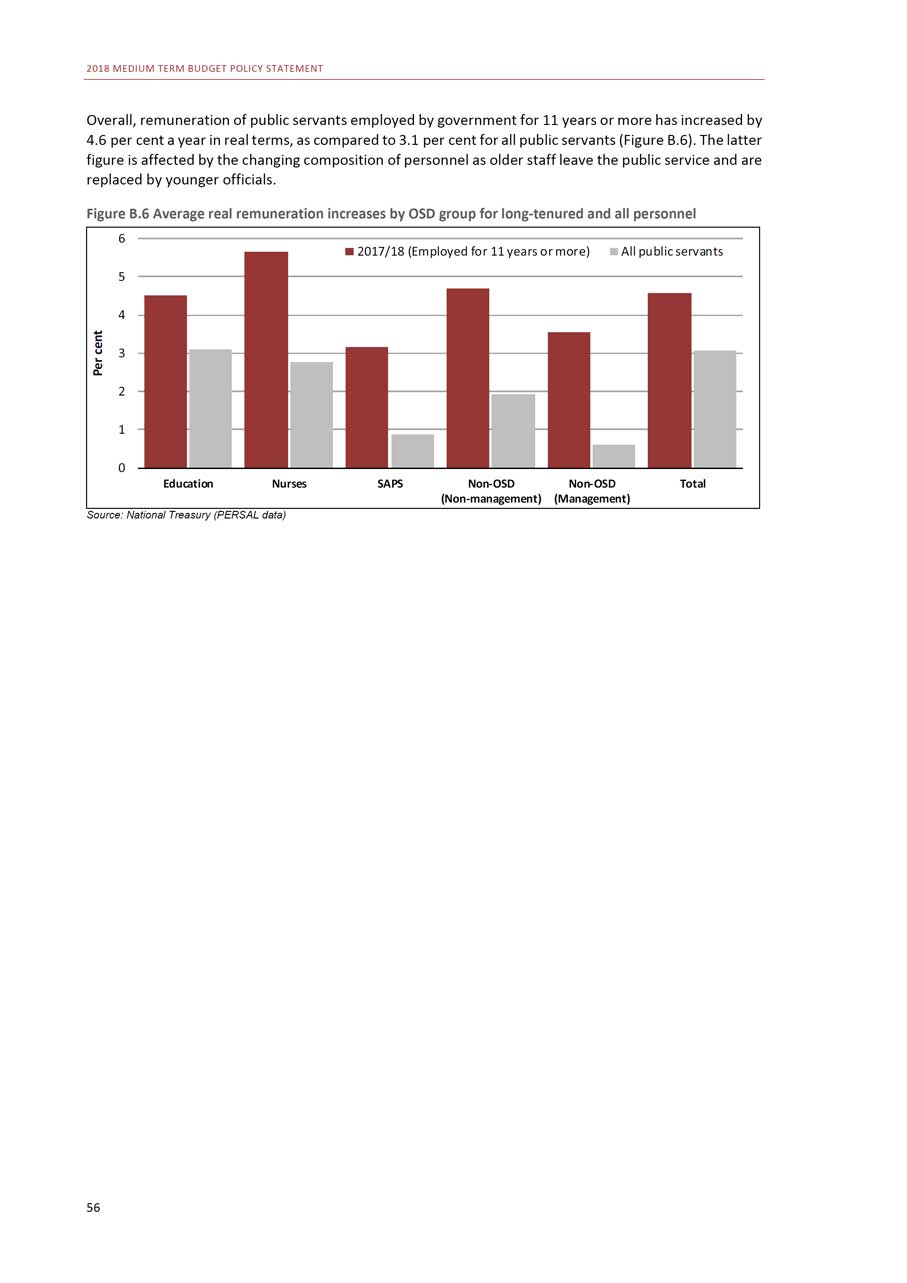
2018 MEDIUM TERM BUDGET POLICY STATEMENT Overall, remuneration of public servants employed by government for 11 years or more has increased by 4.6 per cent a year in real terms, as compared to 3.1 per cent for all public servants (Figure B.6). The latter figure is affected by the changing composition of personnel as older staff leave the public service and are replaced by younger officials. Figure B.6 Average real remuneration increases by OSD group for long-tenured and all personnel 6 2017/18 (Employed for 11 years or more) All public servants 5 4 3 2 1 0 Education Nurses SAPS Non-OSD Non-OSD Total(Non-management) (Management)Source: National Treasury (PERSAL data) 56
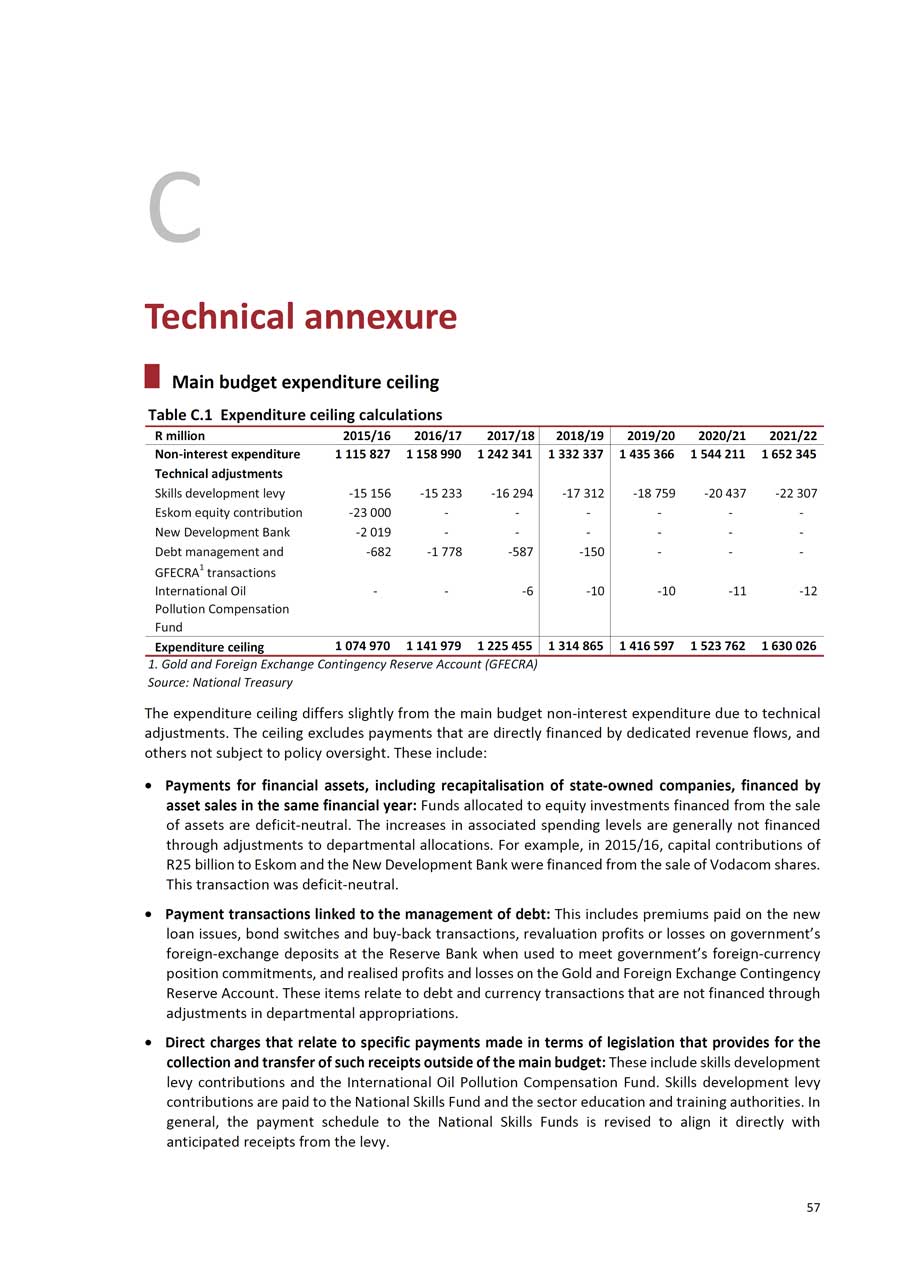
C Technical annexure Main budget expenditure ceiling Table C.1 Expenditure ceiling calculations R million 2015/16 2016/17 2017/18 2018/19 2019/20 2020/21 2021/22Non-interest expenditure 1 115 827 1 158 990 1 242 341 1 332 337 1 435 366 1 544 211 1 652 345Technical adjustmentsSkills development levy -15 156 -15 233 -16 294 -17 312 -18 759 -20 437 -22 307Eskom equity contribution -23 000 - - - - - -New Development Bank -2 019 - - - - - -Debt management and -682 -1 778 -587 -150 - - -GFECRA1 transactions International Oil - - -6 -10 -10 -11 -12Pollution Compensation Fund Expenditure ceiling 1 074 970 1 141 979 1 225 455 1 314 865 1 416 597 1 523 762 1 630 0261. Gold and Foreign Exchange Contingency Reserve Account (GFECRA) Source: National Treasury The expenditure ceiling differs slightly from the main budget non-interest expenditure due to technical adjustments. The ceiling excludes payments that are directly financed by dedicated revenue flows, and others not subject to policy oversight. These include: • Payments for financial assets, including recapitalisation of state-owned companies, financed by asset sales in the same financial year: Funds allocated to equity investments financed from the sale of assets are deficit-neutral. The increases in associated spending levels are generally not financed through adjustments to departmental allocations. For example, in 2015/16, capital contributions of R25 billion to Eskom and the New Development Bank were financed from the sale of Vodacom shares. This transaction was deficit-neutral. • Payment transactions linked to the management of debt: This includes premiums paid on the new loan issues, bond switches and buy-back transactions, revaluation profits or losses on government’s foreign-exchange deposits at the Reserve Bank when used to meet government’s foreign-currency position commitments, and realised profits and losses on the Gold and Foreign Exchange Contingency Reserve Account. These items relate to debt and currency transactions that are not financed through adjustments in departmental appropriations. • Direct charges that relate to specific payments made in terms of legislation that provides for the collection and transfer of such receipts outside of the main budget: These include skills development levy contributions and the International Oil Pollution Compensation Fund. Skills development levy contributions are paid to the National Skills Fund and the sector education and training authorities. In general, the payment schedule to the National Skills Funds is revised to align it directly with anticipated receipts from the levy. 57
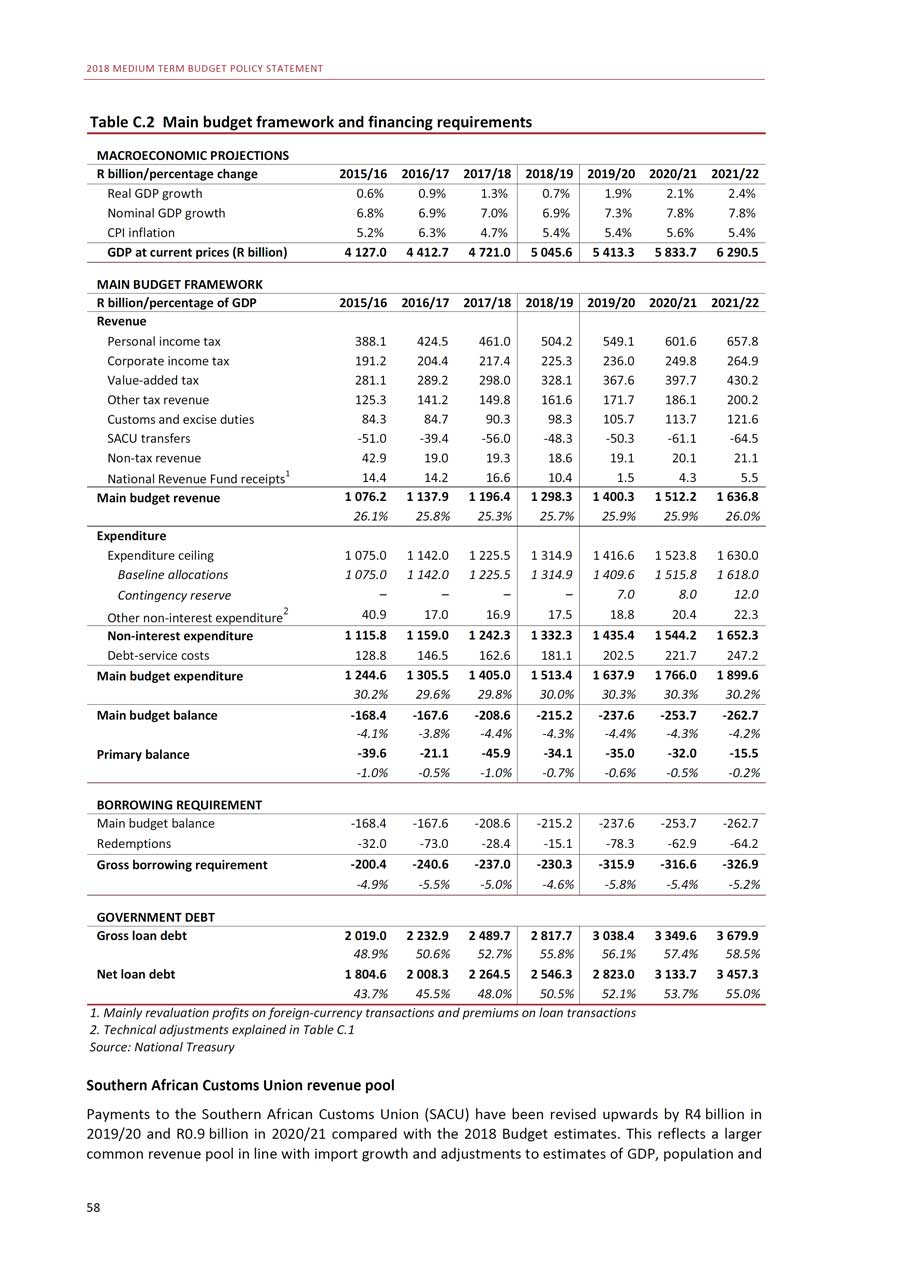
2018 MEDIUM TERM BUDGET POLICY STATEMENT Table C.2 Main budget framework and financing requirements MACROECONOMIC PROJECTIONS R billion/percentage change 2015/16 2016/17 2017/18 2018/19 2019/20 2020/21 2021/22Real GDP growth 0.6% 0.9% 1.3% 0.7% 1.9% 2.1% 2.4%Nominal GDP growth 6.8% 6.9% 7.0% 6.9% 7.3% 7.8% 7.8%CPI inflation 5.2% 6.3% 4.7% 5.4% 5.4% 5.6% 5.4%GDP at current prices (R billion) 4 127.0 4 412.7 4 721.0 5 045.6 5 413.3 5 833.7 6 290.5MAIN BUDGET FRAMEWORKR billion/percentage of GDP 2015/16 2016/17 2017/18 2018/19 2019/20 2020/21 2021/22RevenuePersonal income tax 388.1 424.5 461.0 504.2 549.1 601.6 657.8Corporate income tax 191.2 204.4 217.4 225.3 236.0 249.8 264.9Value-added tax 281.1 289.2 298.0 328.1 367.6 397.7 430.2Other tax revenue 125.3 141.2 149.8 161.6 171.7 186.1 200.2Customs and excise duties 84.3 84.7 90.3 98.3 105.7 113.7 121.6SACU transfers -51.0 -39.4 -56.0 -48.3 -50.3 -61.1 -64.5Non-tax revenue 42.9 19.0 19.3 18.6 19.1 20.1 21.1National Revenue Fund receipts1 14.4 14.2 16.6 10.4 1.5 4.3 5.5Main budget revenue 1 076.2 1 137.9 1 196.4 1 298.3 1 400.3 1 512.2 1 636.826.1% 25.8% 25.3% 25.7% 25.9% 25.9% 26.0%ExpenditureExpenditure ceiling 1 075.0 1 142.0 1 225.5 1 314.9 1 416.6 1 523.8 1 630.0Baseline allocations 1 075.0 1 142.0 1 225.5 1 314.9 1 409.6 1 515.8 1 618.0Contingency reserve - - - - 7.0 8.0 12.0Other non-interest expenditure2 40.9 17.0 16.9 17.5 18.8 20.4 22.3Non-interest expenditure 1 115.8 1 159.0 1 242.3 1 332.3 1 435.4 1 544.2 1 652.3Debt-service costs 128.8 146.5 162.6 181.1 202.5 221.7 247.2Main budget expenditure 1 244.6 1 305.5 1 405.0 1 513.4 1 637.9 1 766.0 1 899.630.2% 29.6% 29.8% 30.0% 30.3% 30.3% 30.2%Main budget balance -168.4 -167.6 -208.6 -215.2 -237.6 -253.7 -262.7-4.1% -3.8% -4.4% -4.3% -4.4% -4.3% -4.2%Primary balance -39.6 -21.1 -45.9 -34.1 -35.0 -32.0 -15.5-1.0% -0.5% -1.0% -0.7% -0.6% -0.5% -0.2%BORROWING REQUIREMENTMain budget balance -168.4 -167.6 -208.6 -215.2 -237.6 -253.7 -262.7Redemptions -32.0 -73.0 -28.4 -15.1 -78.3 -62.9 -64.2Gross borrowing requirement -200.4 -240.6 -237.0 -230.3 -315.9 -316.6 -326.9-4.9% -5.5% -5.0% -4.6% -5.8% -5.4% -5.2%GOVERNMENT DEBTGross loan debt 2 019.0 2 232.9 2 489.7 2 817.7 3 038.4 3 349.6 3 679.948.9% 50.6% 52.7% 55.8% 56.1% 57.4% 58.5%Net loan debt 1 804.6 2 008.3 2 264.5 2 546.3 2 823.0 3 133.7 3 457.343.7% 45.5% 48.0% 50.5% 52.1% 53.7% 55.0%1. Mainly revaluation profits on foreign-currency transactions and premiums on loan transactions 2. Technical adjustments explained in Table C.1 Source: National Treasury Southern African Customs Union revenue pool Payments to the Southern African Customs Union (SACU) have been revised upwards by R4 billion in 2019/20 and R0.9 billion in 2020/21 compared with the 2018 Budget estimates. This reflects a larger common revenue pool in line with import growth and adjustments to estimates of GDP, population and 58
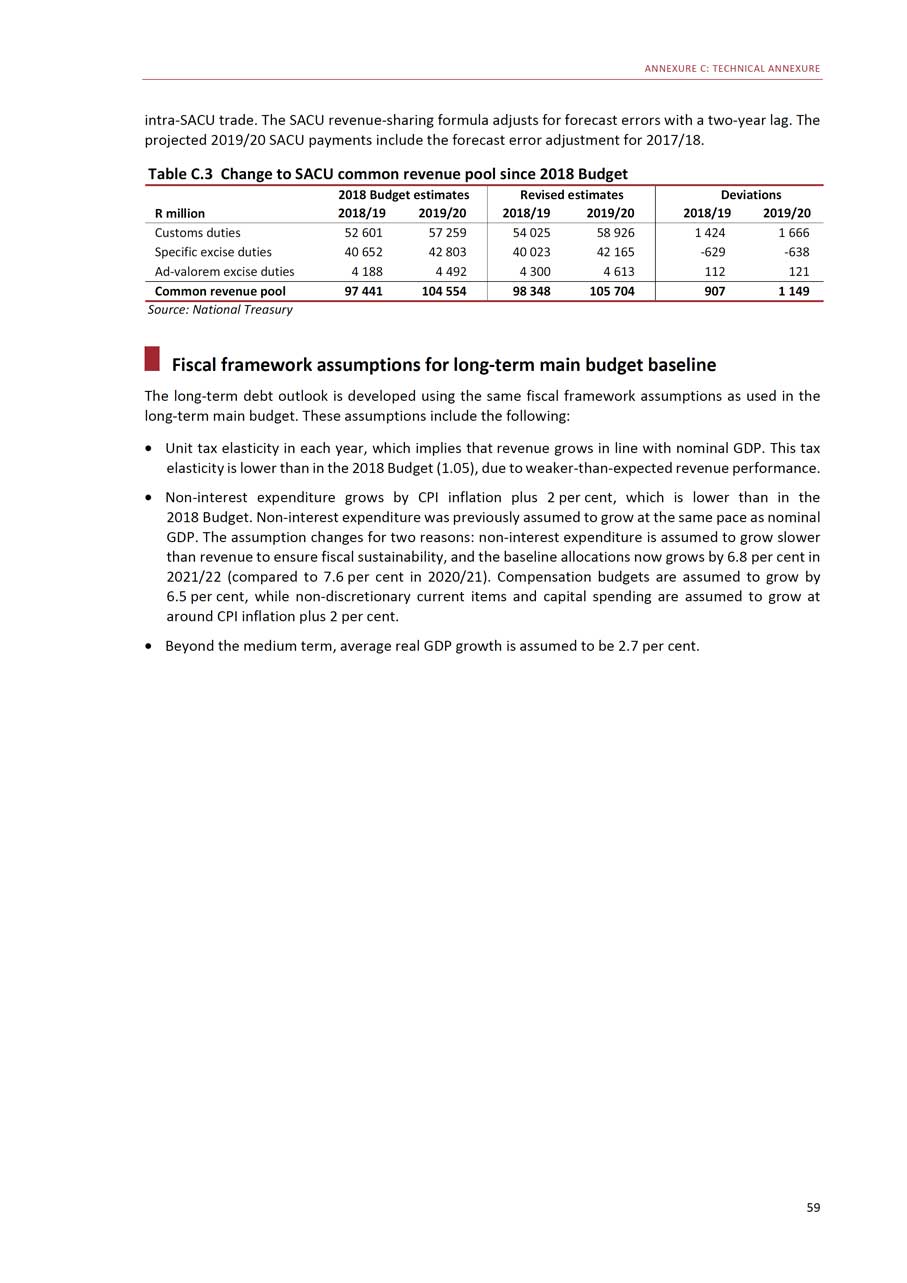
ANNEXURE C: TECHNICAL ANNEXURE intra-SACU trade. The SACU revenue-sharing formula adjusts for forecast errors with a two-year lag. The projected 2019/20 SACU payments include the forecast error adjustment for 2017/18. Table C.3 Change to SACU common revenue pool since 2018 Budget 2018 Budget estimates Revised estimates DeviationsR million 2018/19 2019/20 2018/19 2019/20 2018/19 2019/20Customs duties 52 601 57 259 54 025 58 926 1 424 1 666Specific excise duties 40 652 42 803 40 023 42 165 -629 -638Ad-valorem excise duties 4 188 4 492 4 300 4 613 112 121Common revenue pool 97 441 104 554 98 348 105 704 907 1 149Source: National Treasury Fiscal framework assumptions for long-term main budget baseline The long-term debt outlook is developed using the same fiscal framework assumptions as used in the long-term main budget. These assumptions include the following: • Unit tax elasticity in each year, which implies that revenue grows in line with nominal GDP. This tax elasticity is lower than in the 2018 Budget (1.05), due to weaker-than-expected revenue performance. • Non-interest expenditure grows by CPI inflation plus 2 per cent, which is lower than in the 2018 Budget. Non-interest expenditure was previously assumed to grow at the same pace as nominal GDP. The assumption changes for two reasons: non-interest expenditure is assumed to grow slower than revenue to ensure fiscal sustainability, and the baseline allocations now grows by 6.8 per cent in 2021/22 (compared to 7.6 per cent in 2020/21). Compensation budgets are assumed to grow by 6.5 per cent, while non-discretionary current items and capital spending are assumed to grow at around CPI inflation plus 2 per cent. • Beyond the medium term, average real GDP growth is assumed to be 2.7 per cent. 59
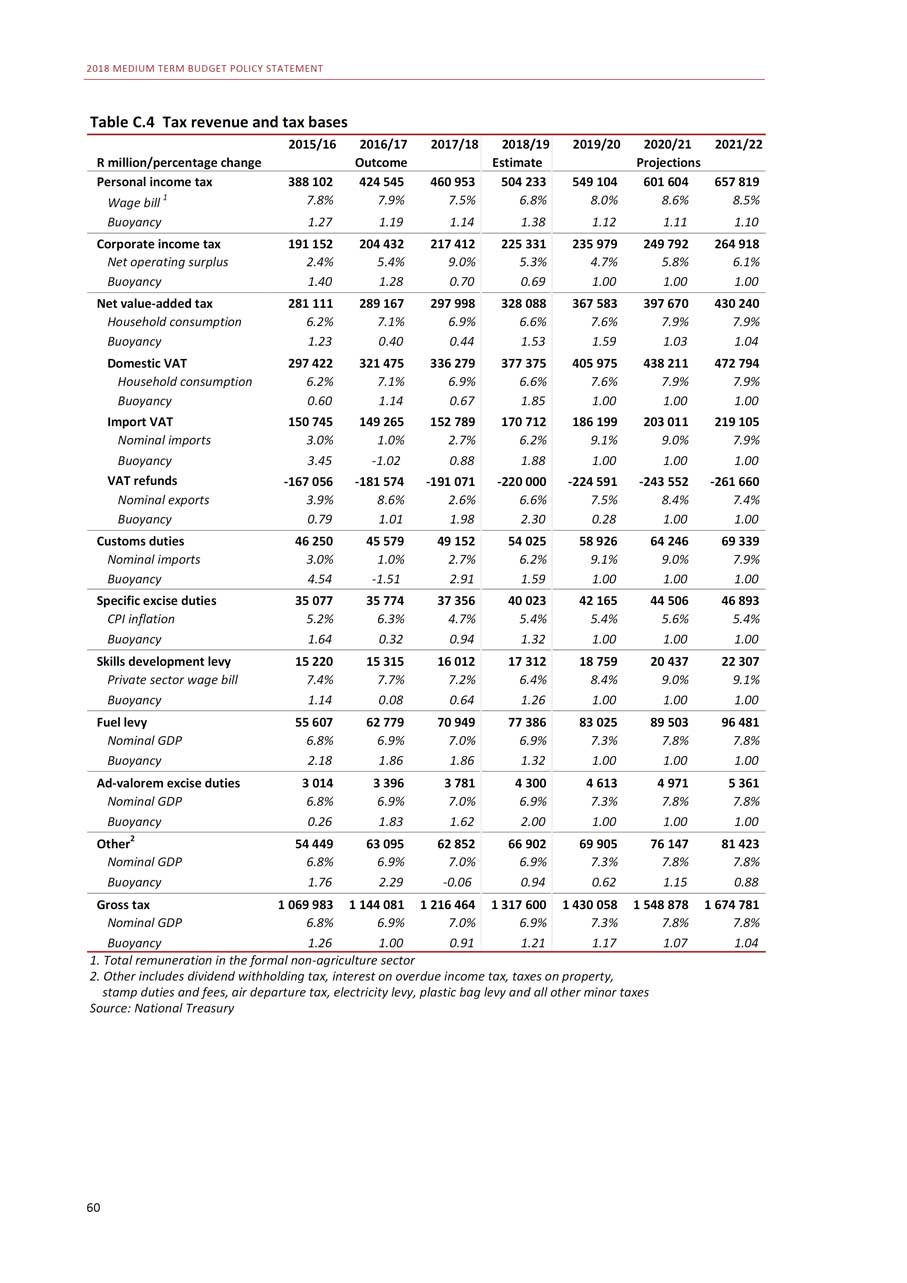
2018 MEDIUM TERM BUDGET POLICY STATEMENT Table C.4 Tax revenue and tax bases 2015/16 2016/17 2017/18 2018/19 2019/20 2020/21 2021/22R million/percentage change Outcome Estimate ProjectionsPersonal income tax 388 102 424 545 460 953 504 233 549 104 601 604 657 819Wage bill1 7.8% 7.9% 7.5% 6.8% 8.0% 8.6% 8.5%Buoyancy 1.27 1.19 1.14 1.38 1.12 1.11 1.10Corporate income tax 191 152 204 432 217 412 225 331 235 979 249 792 264 918Net operating surplus 2.4% 5.4% 9.0% 5.3% 4.7% 5.8% 6.1%Buoyancy 1.40 1.28 0.70 0.69 1.00 1.00 1.00Net value-added tax 281 111 289 167 297 998 328 088 367 583 397 670 430 240Household consumption 6.2% 7.1% 6.9% 6.6% 7.6% 7.9% 7.9%Buoyancy 1.23 0.40 0.44 1.53 1.59 1.03 1.04Domestic VAT 297 422 321 475 336 279 377 375 405 975 438 211 472 794Household consumption 6.2% 7.1% 6.9% 6.6% 7.6% 7.9% 7.9%Buoyancy 0.60 1.14 0.67 1.85 1.00 1.00 1.00Import VAT 150 745 149 265 152 789 170 712 186 199 203 011 219 105Nominal imports 3.0% 1.0% 2.7% 6.2% 9.1% 9.0% 7.9%Buoyancy 3.45 -1.02 0.88 1.88 1.00 1.00 1.00VAT refunds -167 056 -181 574 -191 071 -220 000 -224 591 -243 552 -261 660Nominal exports 3.9% 8.6% 2.6% 6.6% 7.5% 8.4% 7.4%Buoyancy 0.79 1.01 1.98 2.30 0.28 1.00 1.00Customs duties 46 250 45 579 49 152 54 025 58 926 64 246 69 339Nominal imports 3.0% 1.0% 2.7% 6.2% 9.1% 9.0% 7.9%Buoyancy 4.54 -1.51 2.91 1.59 1.00 1.00 1.00Specific excise duties 35 077 35 774 37 356 40 023 42 165 44 506 46 893CPI inflation 5.2% 6.3% 4.7% 5.4% 5.4% 5.6% 5.4%Buoyancy 1.64 0.32 0.94 1.32 1.00 1.00 1.00Skills development levy 15 220 15 315 16 012 17 312 18 759 20 437 22 307Private sector wage bill 7.4% 7.7% 7.2% 6.4% 8.4% 9.0% 9.1%Buoyancy 1.14 0.08 0.64 1.26 1.00 1.00 1.00Fuel levy 55 607 62 779 70 949 77 386 83 025 89 503 96 481Nominal GDP 6.8% 6.9% 7.0% 6.9% 7.3% 7.8% 7.8%Buoyancy 2.18 1.86 1.86 1.32 1.00 1.00 1.00Ad-valorem excise duties 3 014 3 396 3 781 4 300 4 613 4 971 5 361Nominal GDP 6.8% 6.9% 7.0% 6.9% 7.3% 7.8% 7.8%Buoyancy 0.26 1.83 1.62 2.00 1.00 1.00 1.00Other2 54 449 63 095 62 852 66 902 69 905 76 147 81 423Nominal GDP 6.8% 6.9% 7.0% 6.9% 7.3% 7.8% 7.8%Buoyancy 1.76 2.29 -0.06 0.94 0.62 1.15 0.88Gross tax 1 069 983 1 144 081 1 216 464 1 317 600 1 430 058 1 548 878 1 674 781Nominal GDP 6.8% 6.9% 7.0% 6.9% 7.3% 7.8% 7.8%Buoyancy 1.26 1.00 0.91 1.21 1.17 1.07 1.041. Total remuneration in the formal non-agriculture sector 2. Other includes dividend withholding tax, interest on overdue income tax, taxes on property, stamp duties and fees, air departure tax, electricity levy, plastic bag levy and all other minor taxes Source: National Treasury 60

ANNEXURE C: TECHNICAL ANNEXURE 2017/18 outcomes and 2018/19 mid-year estimates Table C.5 summarises national and provincial appropriated expenditure outcomes for 2017/18 and estimates for the first half of 2018/19. Details are presented in Tables C.6 and C.7. National expenditure was R1.4 trillion in 2017/18, R8.1 billion lower than the adjusted budget estimate. This underspending was mainly driven by transfers and subsidies, and goods and services. Spending on capital assets was also lower than the adjusted budget estimate. Provincial expenditure in 2017/18 amounted to R556.1 billion or 99 per cent of the 2017/18 original budget estimate. Expenditure by provinces amounted to R239.4 billion in the first five months of 2018/19, representing 40.5 per cent of the original budget for the year. Provinces are primarily responsible for the delivery of social services including basic education and health. Compensation of employees is the largest spending item in provincial budgets, accounting for 61.5 per cent of spending in the first five months of 2018/19. Table C.5 National and provincial expenditure outcomes and mid-year estimates 2017/18 2018/19Original Adjusted Audited Over(-)/ Original Adjusted Actualbudget estimate outcome under(+) budget estimate1 spendingApril toR billion September2National appropriation 767.0 781.5 768.8 12.7 814.5 831.6 390.7Direct charges 636.2 636.1 636.1 -0.1 683.7 685.1 336.7Debt-service costs 162.4 163.3 162.6 0.7 180.1 181.1 87.3Provincial equitable share 441.3 441.3 441.3 - 470.3 470.3 235.1Other direct charges 32.5 31.4 32.2 -0.8 33.3 33.7 14.3National votes 1 403.2 1 417.6 1 405.0 12.6 1 498.2 1 516.6 727.4of which:Compensation of employees 154.7 155.7 156.3 -0.6 163.6 163.6 80.2Goods and services 65.7 66.2 64.6 1.5 65.9 69.0 27.0Transfers and subsidies 999.1 997.1 987.0 10.1 1 069.5 1 072.8 527.5Payments for capital assets 15.8 15.7 15.2 0.5 14.3 16.3 5.0Payments for financial assets 5.4 19.4 19.0 0.3 4.6 13.8 0.3Provisional allocation for - - - - 6.0 - -contingenciesnot assigned to votesContingency reserve 6.0 - - - 8.0 - -Projected underspending - -4.5 - -4.5 - -3.2 -Main budget expenditure 1 409.2 1 413.1 1 405.0 8.1 1 512.2 1 513.4 727.4Provincial expenditure 551.9 561.8 556.1 5.8 591.5 n/a 239.4of which:Compensation of employees 336.0 334.8 334.1 0.7 361.1 n/a 147.3Transfers and subsidies 74.7 71.1 75.3 -4.2 71.7 n/a 31.7Payments for capital assets 35.3 42.0 34.9 7.1 39.7 n/a 11.71. Provinces will table adjusted estimates during November 2018 2. Provincial expenditure as at 31 August 2018 Source: National Treasury 61
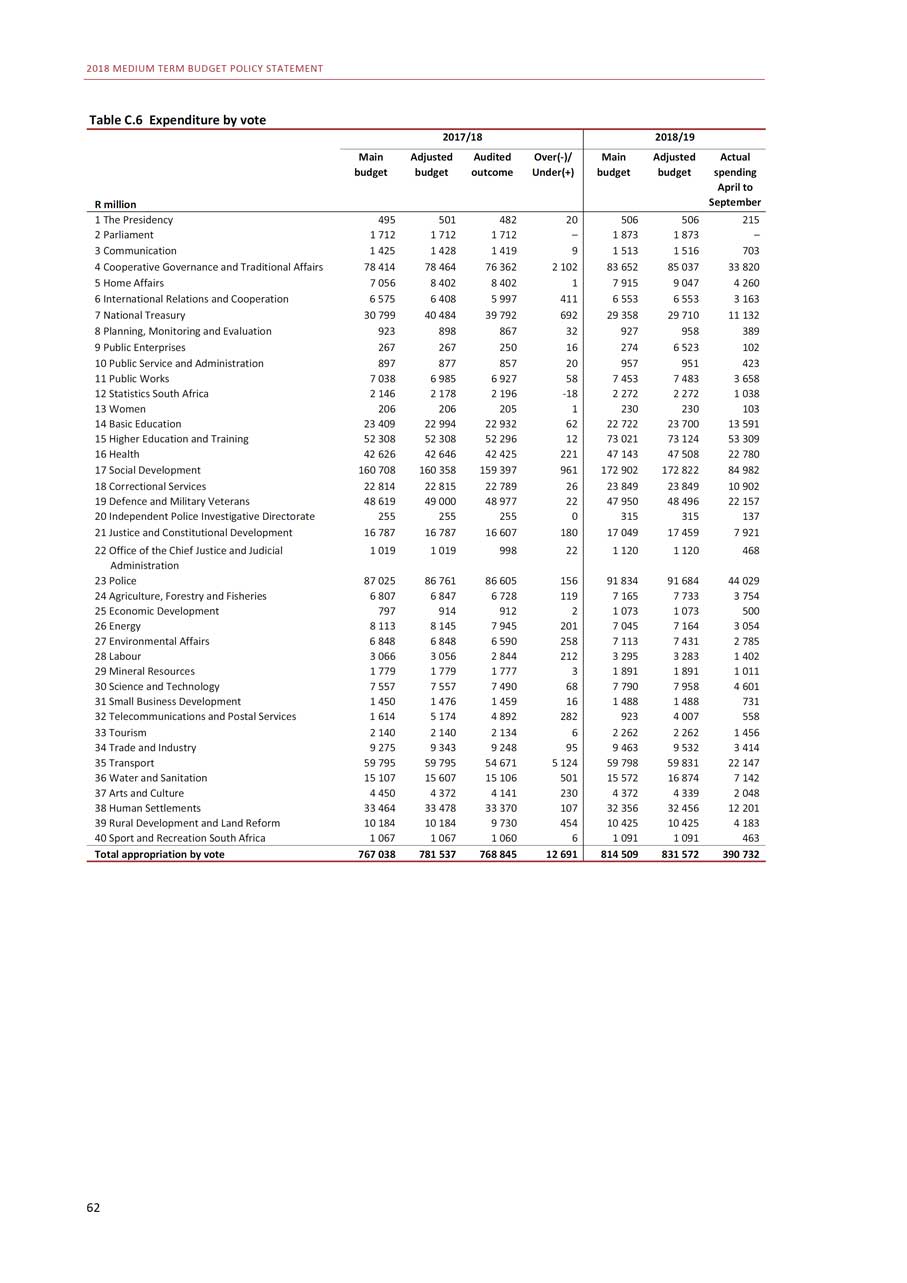
2018 MEDIUM TERM BUDGET POLICY STATEMENT Table C.6 Expenditure by vote 2017/18 2018/19Main Adjusted Audited Over(-)/ Main Adjusted Actualbudget budget outcome Under(+) budget budget spendingApril toR million September1 The Presidency 495 501 482 20 506 506 2152 Parliament 1 712 1 712 1 712 - 1 873 1 873 -3 Communication 1 425 1 428 1 419 9 1 513 1 516 7034 Cooperative Governance and Traditional Affairs 78 414 78 464 76 362 2 102 83 652 85 037 33 8205 Home Affairs 7 056 8 402 8 402 1 7 915 9 047 4 2606 International Relations and Cooperation 6 575 6 408 5 997 411 6 553 6 553 3 1637 National Treasury 30 799 40 484 39 792 692 29 358 29 710 11 1328 Planning, Monitoring and Evaluation 923 898 867 32 927 958 3899 Public Enterprises 267 267 250 16 274 6 523 10210 Public Service and Administration 897 877 857 20 957 951 42311 Public Works 7 038 6 985 6 927 58 7 453 7 483 3 65812 Statistics South Africa 2 146 2 178 2 196 -18 2 272 2 272 1 03813 Women 206 206 205 1 230 230 10314 Basic Education 23 409 22 994 22 932 62 22 722 23 700 13 59115 Higher Education and Training 52 308 52 308 52 296 12 73 021 73 124 53 30916 Health 42 626 42 646 42 425 221 47 143 47 508 22 78017 Social Development 160 708 160 358 159 397 961 172 902 172 822 84 98218 Correctional Services 22 814 22 815 22 789 26 23 849 23 849 10 90219 Defence and Military Veterans 48 619 49 000 48 977 22 47 950 48 496 22 15720 Independent Police Investigative Directorate 255 255 255 0 315 315 13721 Justice and Constitutional Development 16 787 16 787 16 607 180 17 049 17 459 7 92122 Office of the Chief Justice and Judicial 1 019 1 019 998 22 1 120 1 120 468Administration23 Police 87 025 86 761 86 605 156 91 834 91 684 44 02924 Agriculture, Forestry and Fisheries 6 807 6 847 6 728 119 7 165 7 733 3 75425 Economic Development 797 914 912 2 1 073 1 073 50026 Energy 8 113 8 145 7 945 201 7 045 7 164 3 05427 Environmental Affairs 6 848 6 848 6 590 258 7 113 7 431 2 78528 Labour 3 066 3 056 2 844 212 3 295 3 283 1 40229 Mineral Resources 1 779 1 779 1 777 3 1 891 1 891 1 01130 Science and Technology 7 557 7 557 7 490 68 7 790 7 958 4 60131 Small Business Development 1 450 1 476 1 459 16 1 488 1 488 73132 Telecommunications and Postal Services 1 614 5 174 4 892 282 923 4 007 55833 Tourism 2 140 2 140 2 134 6 2 262 2 262 1 45634 Trade and Industry 9 275 9 343 9 248 95 9 463 9 532 3 41435 Transport 59 795 59 795 54 671 5 124 59 798 59 831 22 14736 Water and Sanitation 15 107 15 607 15 106 501 15 572 16 874 7 14237 Arts and Culture 4 450 4 372 4 141 230 4 372 4 339 2 04838 Human Settlements 33 464 33 478 33 370 107 32 356 32 456 12 20139 Rural Development and Land Reform 10 184 10 184 9 730 454 10 425 10 425 4 18340 Sport and Recreation South Africa 1 067 1 067 1 060 6 1 091 1 091 463Total appropriation by vote 767 038 781 537 768 845 12 691 814 509 831 572 390 73262
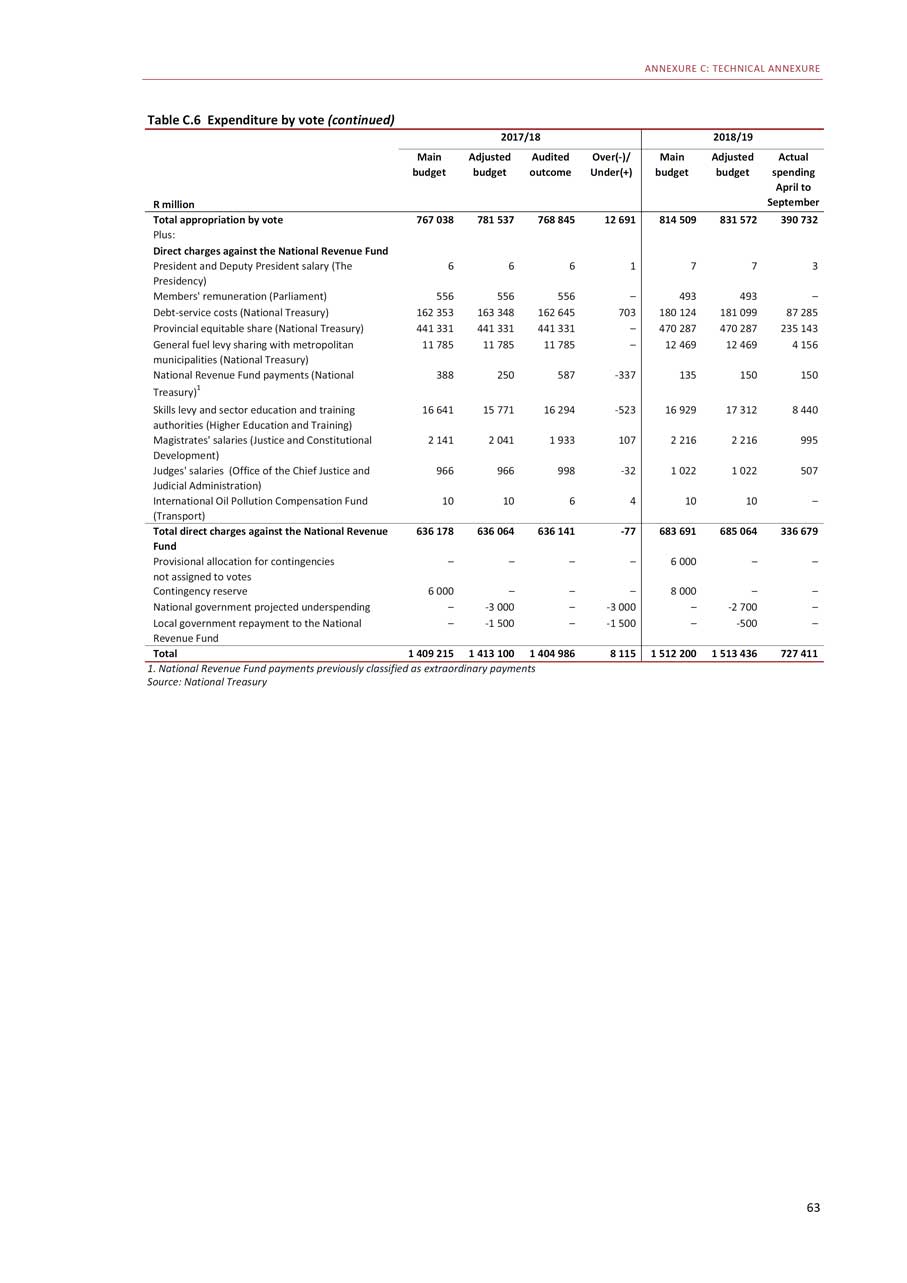
ANNEXURE C: TECHNICAL ANNEXURE Table C.6 Expenditure by vote (continued) 2017/18 2018/19Main Adjusted Audited Over(-)/ Main Adjusted Actualbudget budget outcome Under(+) budget budget spendingApril toR million SeptemberTotal appropriation by vote 767 038 781 537 768 845 12 691 814 509 831 572 390 732Plus:Direct charges against the National Revenue FundPresident and Deputy President salary (The 6 6 6 1 7 7 3Presidency)Members’ remuneration (Parliament) 556 556 556 - 493 493 -Debt-service costs (National Treasury) 162 353 163 348 162 645 703 180 124 181 099 87 285Provincial equitable share (National Treasury) 441 331 441 331 441 331 - 470 287 470 287 235 143General fuel levy sharing with metropolitan 11 785 11 785 11 785 - 12 469 12 469 4 156municipalities (National Treasury) National Revenue Fund payments (National 388 250 587 -337 135 150 150Treasury)1 Skills levy and sector education and training 16 641 15 771 16 294 -523 16 929 17 312 8 440authorities (Higher Education and Training) Magistrates’ salaries (Justice and Constitutional 2 141 2 041 1 933 107 2 216 2 216 995Development) Judges’ salaries (Office of the Chief Justice and 966 966 998 -32 1 022 1 022 507Judicial Administration) International Oil Pollution Compensation Fund 10 10 6 4 10 10 -(Transport) Total direct charges against the National Revenue 636 178 636 064 636 141 -77 683 691 685 064 336 679FundProvisional allocation for contingencies - - - - 6 000 - -not assigned to votesContingency reserve 6 000 - - - 8 000 - -National government projected underspending - -3 000 - -3 000 - -2 700 -Local government repayment to the National - -1 500 - -1 500 - -500 -Revenue Fund Total 1 409 215 1 413 100 1 404 986 8 115 1 512 200 1 513 436 727 4111. National Revenue Fund payments previously classified as extraordinary payments Source: National Treasury 63
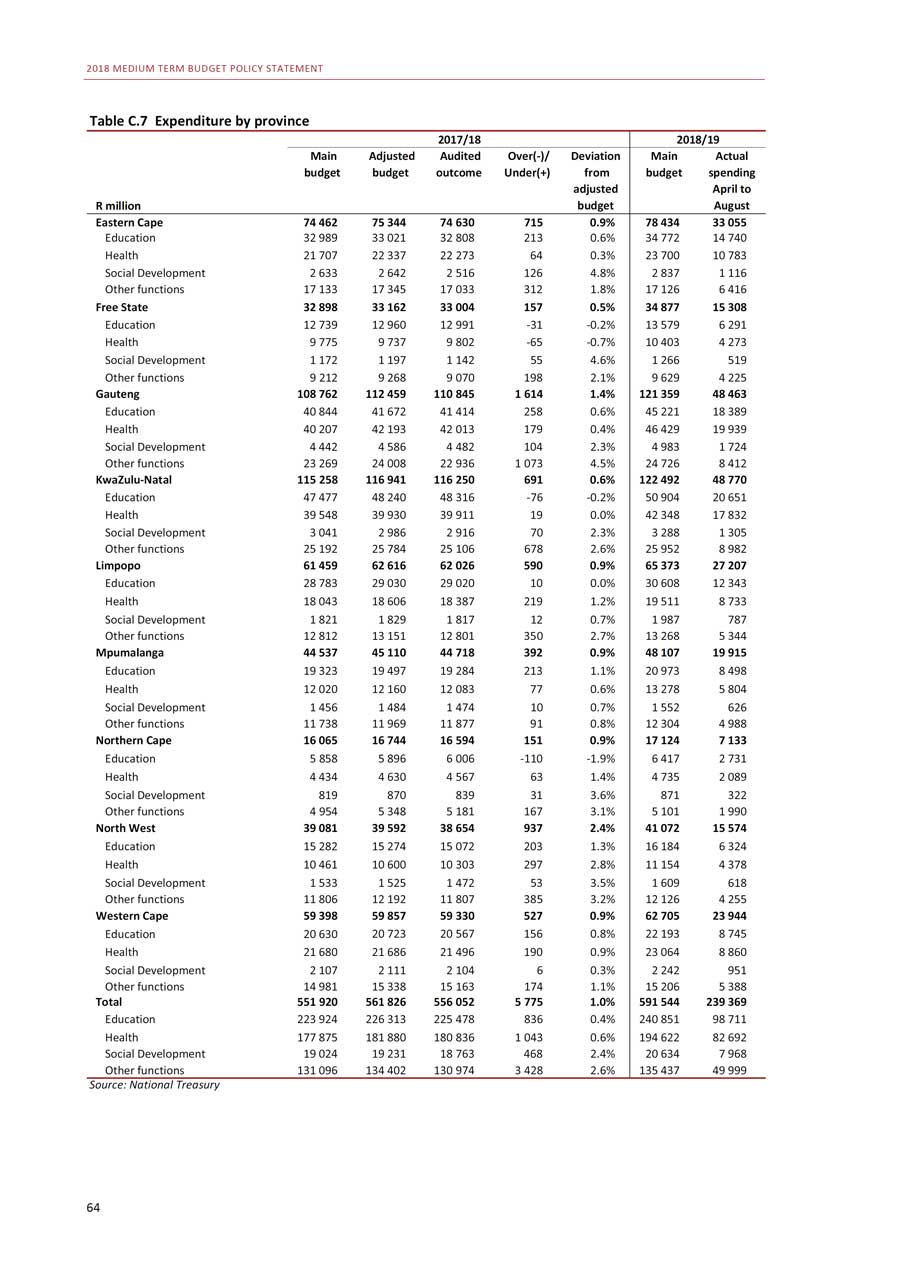
2018 MEDIUM TERM BUDGET POLICY STATEMENT Table C.7 Expenditure by province 2017/18 2018/19Main Adjusted Audited Over(-)/ Deviation Main Actualbudget budget outcome Under(+) from budget spendingadjusted April toR million budget AugustEastern Cape 74 462 75 344 74 630 715 0.9% 78 434 33 055Education 32 989 33 021 32 808 213 0.6% 34 772 14 740Health 21 707 22 337 22 273 64 0.3% 23 700 10 783Social Development 2 633 2 642 2 516 126 4.8% 2 837 1 116Other functions 17 133 17 345 17 033 312 1.8% 17 126 6 416Free State 32 898 33 162 33 004 157 0.5% 34 877 15 308Education 12 739 12 960 12 991 -31 -0.2% 13 579 6 291Health 9 775 9 737 9 802 -65 -0.7% 10 403 4 273Social Development 1 172 1 197 1 142 55 4.6% 1 266 519Other functions 9 212 9 268 9 070 198 2.1% 9 629 4 225Gauteng 108 762 112 459 110 845 1 614 1.4% 121 359 48 463Education 40 844 41 672 41 414 258 0.6% 45 221 18 389Health 40 207 42 193 42 013 179 0.4% 46 429 19 939Social Development 4 442 4 586 4 482 104 2.3% 4 983 1 724Other functions 23 269 24 008 22 936 1 073 4.5% 24 726 8 412KwaZulu-Natal 115 258 116 941 116 250 691 0.6% 122 492 48 770Education 47 477 48 240 48 316 -76 -0.2% 50 904 20 651Health 39 548 39 930 39 911 19 0.0% 42 348 17 832Social Development 3 041 2 986 2 916 70 2.3% 3 288 1 305Other functions 25 192 25 784 25 106 678 2.6% 25 952 8 982Limpopo 61 459 62 616 62 026 590 0.9% 65 373 27 207Education 28 783 29 030 29 020 10 0.0% 30 608 12 343Health 18 043 18 606 18 387 219 1.2% 19 511 8 733Social Development 1 821 1 829 1 817 12 0.7% 1 987 787Other functions 12 812 13 151 12 801 350 2.7% 13 268 5 344Mpumalanga 44 537 45 110 44 718 392 0.9% 48 107 19 915Education 19 323 19 497 19 284 213 1.1% 20 973 8 498Health 12 020 12 160 12 083 77 0.6% 13 278 5 804Social Development 1 456 1 484 1 474 10 0.7% 1 552 626Other functions 11 738 11 969 11 877 91 0.8% 12 304 4 988Northern Cape 16 065 16 744 16 594 151 0.9% 17 124 7 133Education 5 858 5 896 6 006 -110 -1.9% 6 417 2 731Health 4 434 4 630 4 567 63 1.4% 4 735 2 089Social Development 819 870 839 31 3.6% 871 322Other functions 4 954 5 348 5 181 167 3.1% 5 101 1 990North West 39 081 39 592 38 654 937 2.4% 41 072 15 574Education 15 282 15 274 15 072 203 1.3% 16 184 6 324Health 10 461 10 600 10 303 297 2.8% 11 154 4 378Social Development 1 533 1 525 1 472 53 3.5% 1 609 618Other functions 11 806 12 192 11 807 385 3.2% 12 126 4 255Western Cape 59 398 59 857 59 330 527 0.9% 62 705 23 944Education 20 630 20 723 20 567 156 0.8% 22 193 8 745Health 21 680 21 686 21 496 190 0.9% 23 064 8 860Social Development 2 107 2 111 2 104 6 0.3% 2 242 951Other functions 14 981 15 338 15 163 174 1.1% 15 206 5 388Total 551 920 561 826 556 052 5 775 1.0% 591 544 239 369Education 223 924 226 313 225 478 836 0.4% 240 851 98 711Health 177 875 181 880 180 836 1 043 0.6% 194 622 82 692Social Development 19 024 19 231 18 763 468 2.4% 20 634 7 968Other functions 131 096 134 402 130 974 3 428 2.6% 135 437 49 999Source: National Treasury 64
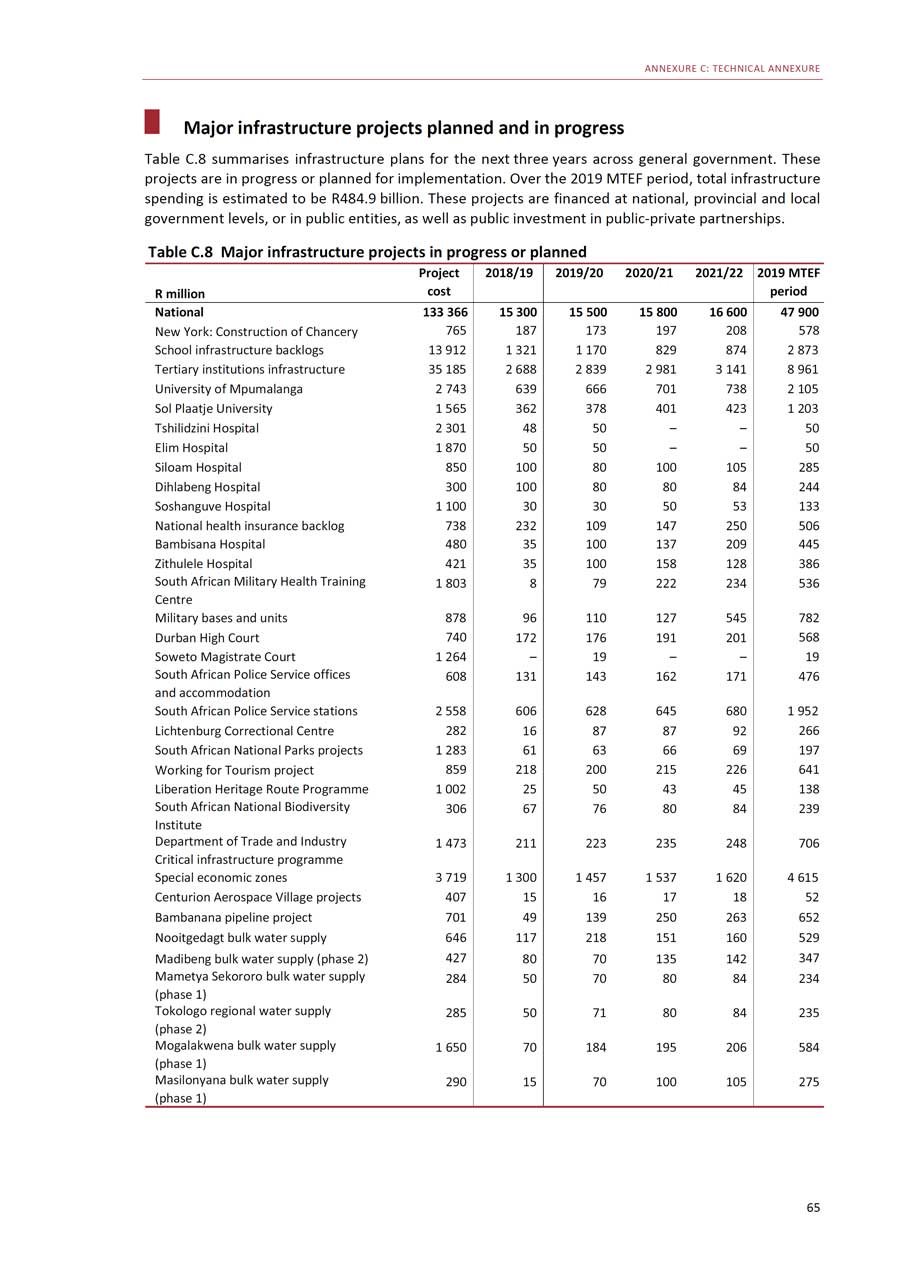
ANNEXURE C: TECHNICAL ANNEXURE Major infrastructure projects planned and in progress Table C.8 summarises infrastructure plans for the next three years across general government. These projects are in progress or planned for implementation. Over the 2019 MTEF period, total infrastructure spending is estimated to be R484.9 billion. These projects are financed at national, provincial and local government levels, or in public entities, as well as public investment in public-private partnerships. Table C.8 Major infrastructure projects in progress or planned Project 2018/19 2019/20 2020/21 2021/22 2019 MTEFR million cost periodNational 133 366 15 300 15 500 15 800 16 600 47 900New York: Construction of Chancery 765 187 173 197 208 578School infrastructure backlogs 13 912 1 321 1 170 829 874 2 873Tertiary institutions infrastructure 35 185 2 688 2 839 2 981 3 141 8 961University of Mpumalanga 2 743 639 666 701 738 2 105Sol Plaatje University 1 565 362 378 401 423 1 203Tshilidzini Hospital 2 301 48 50 - - 50Elim Hospital 1 870 50 50 - - 50Siloam Hospital 850 100 80 100 105 285Dihlabeng Hospital 300 100 80 80 84 244Soshanguve Hospital 1 100 30 30 50 53 133National health insurance backlog 738 232 109 147 250 506Bambisana Hospital 480 35 100 137 209 445Zithulele Hospital 421 35 100 158 128 386South African Military Health Training 1 803 8 79 222 234 536CentreMilitary bases and units 878 96 110 127 545 782Durban High Court 740 172 176 191 201 568Soweto Magistrate Court 1 264 - 19 - - 19South African Police Service offices 608 131 143 162 171 476and accommodationSouth African Police Service stations 2 558 606 628 645 680 1 952Lichtenburg Correctional Centre 282 16 87 87 92 266South African National Parks projects 1 283 61 63 66 69 197Working for Tourism project 859 218 200 215 226 641Liberation Heritage Route Programme 1 002 25 50 43 45 138South African National Biodiversity 306 67 76 80 84 239InstituteDepartment of Trade and Industry 1 473 211 223 235 248 706Critical infrastructure programmeSpecial economic zones 3 719 1 300 1 457 1 537 1 620 4 615Centurion Aerospace Village projects 407 15 16 17 18 52Bambanana pipeline project 701 49 139 250 263 652Nooitgedagt bulk water supply 646 117 218 151 160 529Madibeng bulk water supply (phase 2) 427 80 70 135 142 347Mametya Sekororo bulk water supply 284 50 70 80 84 234(phase 1) Tokologo regional water supply 285 50 71 80 84 235(phase 2) Mogalakwena bulk water supply 1 650 70 184 195 206 584(phase 1) Masilonyana bulk water supply 290 15 70 100 105 275(phase 1) 65
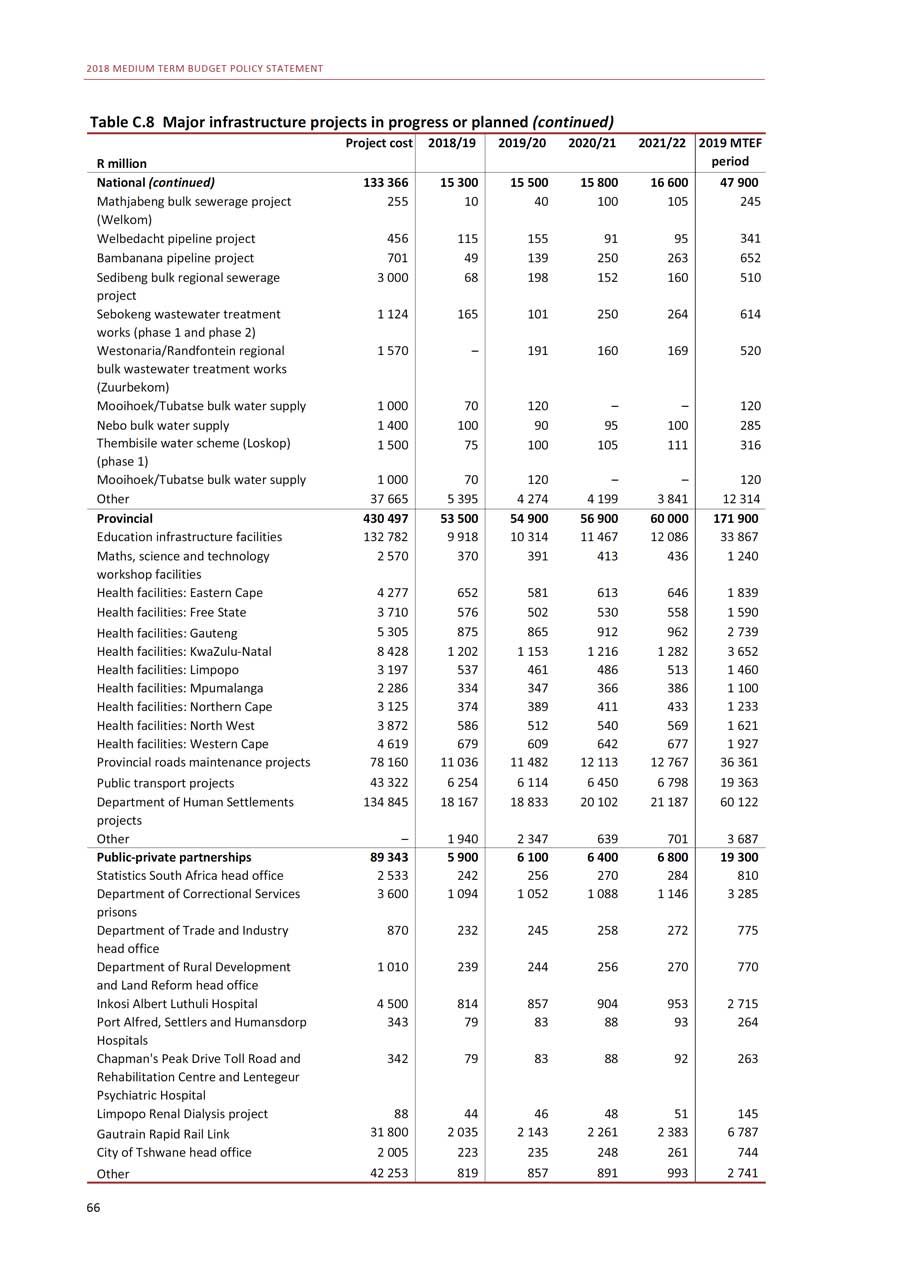
2018 MEDIUM TERM BUDGET POLICY STATEMENT Table C.8 Major infrastructure projects in progress or planned (continued) Project cost 2018/19 2019/20 2020/21 2021/22 2019 MTEFR million periodNational (continued) 133 366 15 300 15 500 15 800 16 600 47 900Mathjabeng bulk sewerage project 255 10 40 100 105 245(Welkom)Welbedacht pipeline project 456 115 155 91 95 341Bambanana pipeline project 701 49 139 250 263 652Sedibeng bulk regional sewerage 3 000 68 198 152 160 510project Sebokeng wastewater treatment 1 124 165 101 250 264 614works (phase 1 and phase 2)Westonaria/Randfontein regional 1 570 - 191 160 169 520bulk wastewater treatment works(Zuurbekom)Mooihoek/Tubatse bulk water supply 1 000 70 120 - - 120Nebo bulk water supply 1 400 100 90 95 100 285Thembisile water scheme (Loskop) 1 500 75 100 105 111 316(phase 1)Mooihoek/Tubatse bulk water supply 1 000 70 120 - - 120Other 37 665 5 395 4 274 4 199 3 841 12 314Provincial 430 497 53 500 54 900 56 900 60 000 171 900Education infrastructure facilities 132 782 9 918 10 314 11 467 12 086 33 867Maths, science and technology 2 570 370 391 413 436 1 240workshop facilitiesHealth facilities: Eastern Cape 4 277 652 581 613 646 1 839Health facilities: Free State 3 710 576 502 530 558 1 590Health facilities: Gauteng 5 305 875 865 912 962 2 739Health facilities: KwaZulu-Natal 8 428 1 202 1 153 1 216 1 282 3 652Health facilities: Limpopo 3 197 537 461 486 513 1 460Health facilities: Mpumalanga 2 286 334 347 366 386 1 100Health facilities: Northern Cape 3 125 374 389 411 433 1 233Health facilities: North West 3 872 586 512 540 569 1 621Health facilities: Western Cape 4 619 679 609 642 677 1 927Provincial roads maintenance projects 78 160 11 036 11 482 12 113 12 767 36 361Public transport projects 43 322 6 254 6 114 6 450 6 798 19 363Department of Human Settlements 134 845 18 167 18 833 20 102 21 187 60 122projectsOther - 1 940 2 347 639 701 3 687Public-private partnerships 89 343 5 900 6 100 6 400 6 800 19 300Statistics South Africa head office 2 533 242 256 270 284 810Department of Correctional Services 3 600 1 094 1 052 1 088 1 146 3 285prisons Department of Trade and Industry 870 232 245 258 272 775head officeDepartment of Rural Development 1 010 239 244 256 270 770and Land Reform head officeInkosi Albert Luthuli Hospital 4 500 814 857 904 953 2 715Port Alfred, Settlers and Humansdorp 343 79 83 88 93 264HospitalsChapman’s Peak Drive Toll Road and 342 79 83 88 92 263Rehabilitation Centre and LentegeurPsychiatric HospitalLimpopo Renal Dialysis project 88 44 46 48 51 145Gautrain Rapid Rail Link 31 800 2 035 2 143 2 261 2 383 6 787City of Tshwane head office 2 005 223 235 248 261 744Other 42 253 819 857 891 993 2 74166
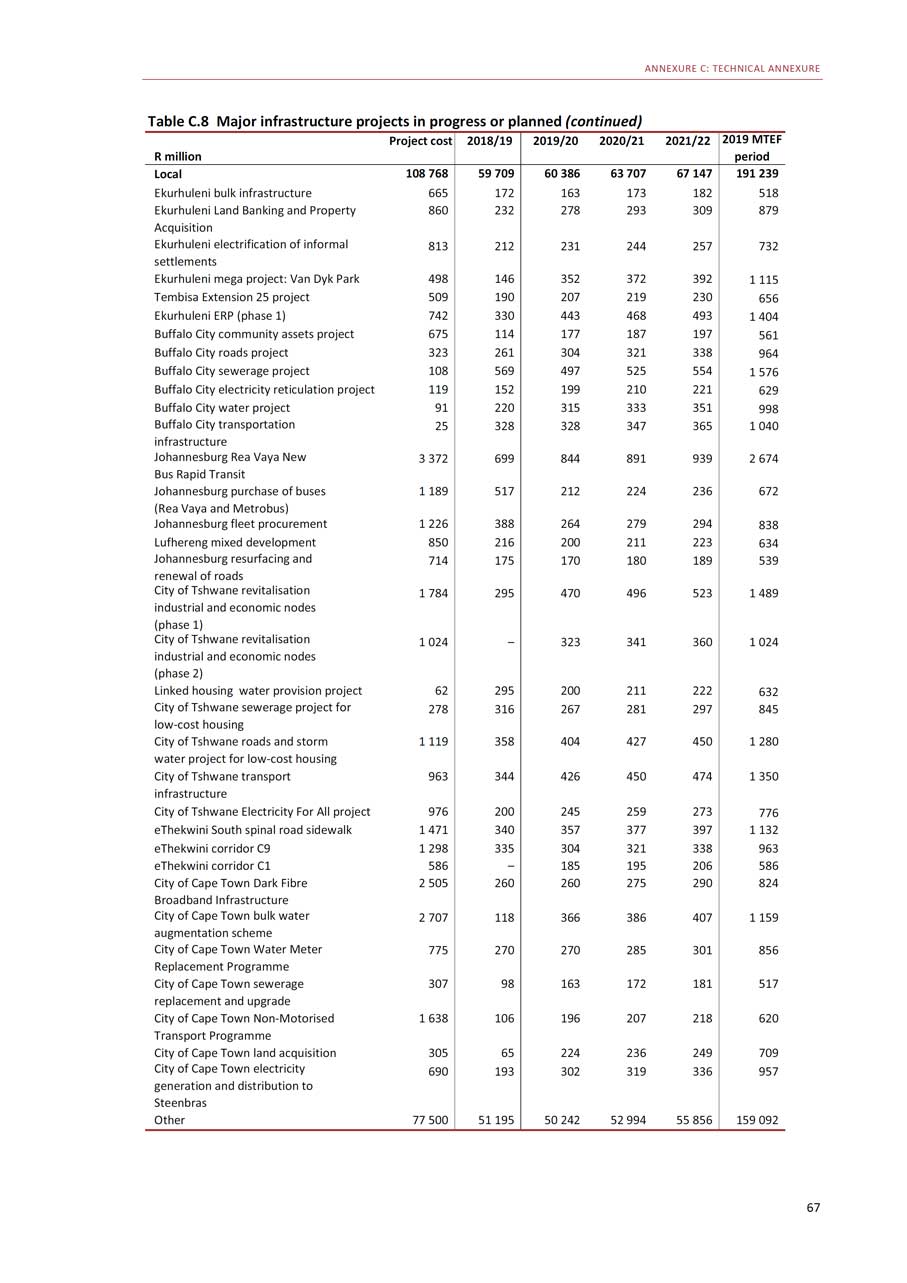
ANNEXURE C: TECHNICAL ANNEXURE Table C.8 Major infrastructure projects in progress or planned (continued) Project cost 2018/19 2019/20 2020/21 2021/22 2019 MTEFR million periodLocal 108 768 59 709 60 386 63 707 67 147 191 239Ekurhuleni bulk infrastructure 665 172 163 173 182 518Ekurhuleni Land Banking and Property 860 232 278 293 309 879AcquisitionEkurhuleni electrification of informal 813 212 231 244 257 732settlementsEkurhuleni mega project: Van Dyk Park 498 146 352 372 392 1 115Tembisa Extension 25 project 509 190 207 219 230 656Ekurhuleni ERP (phase 1) 742 330 443 468 493 1 404Buffalo City community assets project 675 114 177 187 197 561Buffalo City roads project 323 261 304 321 338 964Buffalo City sewerage project 108 569 497 525 554 1 576Buffalo City electricity reticulation project 119 152 199 210 221 629Buffalo City water project 91 220 315 333 351 998Buffalo City transportation 25 328 328 347 365 1 040infrastructure Johannesburg Rea Vaya New 3 372 699 844 891 939 2 674Bus Rapid TransitJohannesburg purchase of buses 1 189 517 212 224 236 672(Rea Vaya and Metrobus)Johannesburg fleet procurement 1 226 388 264 279 294 838Lufhereng mixed development 850 216 200 211 223 634Johannesburg resurfacing and 714 175 170 180 189 539renewal of roads City of Tshwane revitalisation 1 784 295 470 496 523 1 489industrial and economic nodes(phase 1)City of Tshwane revitalisation 1 024 - 323 341 360 1 024industrial and economic nodes(phase 2)Linked housing water provision project 62 295 200 211 222 632City of Tshwane sewerage project for 278 316 267 281 297 845low-cost housing City of Tshwane roads and storm 1 119 358 404 427 450 1 280water project for low-cost housingCity of Tshwane transport 963 344 426 450 474 1 350infrastructureCity of Tshwane Electricity For All project 976 200 245 259 273 776eThekwini South spinal road sidewalk 1 471 340 357 377 397 1 132eThekwini corridor C9 1 298 335 304 321 338 963eThekwini corridor C1 586 - 185 195 206 586City of Cape Town Dark Fibre 2 505 260 260 275 290 824Broadband Infrastructure City of Cape Town bulk water 2 707 118 366 386 407 1 159augmentation scheme City of Cape Town Water Meter 775 270 270 285 301 856Replacement Programme City of Cape Town sewerage 307 98 163 172 181 517replacement and upgradeCity of Cape Town Non-Motorised 1 638 106 196 207 218 620Transport ProgrammeCity of Cape Town land acquisition 305 65 224 236 249 709City of Cape Town electricity 690 193 302 319 336 957generation and distribution to Steenbras Other 77 500 51 195 50 242 52 994 55 856 159 09267
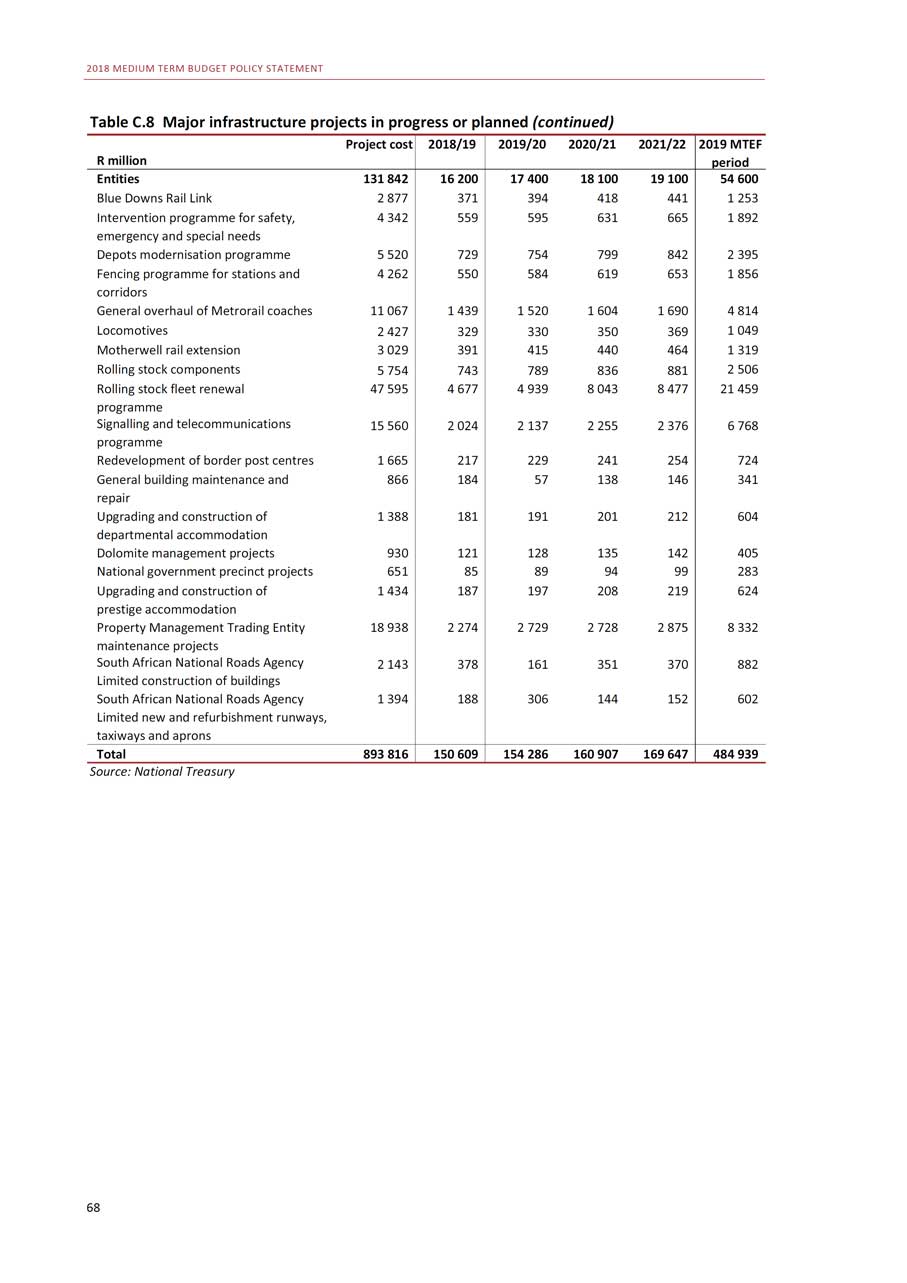
2018 MEDIUM TERM BUDGET POLICY STATEMENT Table C.8 Major infrastructure projects in progress or planned (continued) Project cost 2018/19 2019/20 2020/21 2021/22 2019 MTEFR million periodEntities 131 842 16 200 17 400 18 100 19 100 54 600Blue Downs Rail Link 2 877 371 394 418 441 1 253Intervention programme for safety, 4 342 559 595 631 665 1 892emergency and special needsDepots modernisation programme 5 520 729 754 799 842 2 395Fencing programme for stations and 4 262 550 584 619 653 1 856corridorsGeneral overhaul of Metrorail coaches 11 067 1 439 1 520 1 604 1 690 4 814Locomotives 2 427 329 330 350 369 1 049Motherwell rail extension 3 029 391 415 440 464 1 319Rolling stock components 5 754 743 789 836 881 2 506Rolling stock fleet renewal 47 595 4 677 4 939 8 043 8 477 21 459programmeSignalling and telecommunications 15 560 2 024 2 137 2 255 2 376 6 768programmeRedevelopment of border post centres 1 665 217 229 241 254 724General building maintenance and 866 184 57 138 146 341repairUpgrading and construction of 1 388 181 191 201 212 604departmental accommodationDolomite management projects 930 121 128 135 142 405National government precinct projects 651 85 89 94 99 283Upgrading and construction of 1 434 187 197 208 219 624prestige accommodation Property Management Trading Entity 18 938 2 274 2 729 2 728 2 875 8 332maintenance projects South African National Roads Agency 2 143 378 161 351 370 882Limited construction of buildings South African National Roads Agency 1 394 188 306 144 152 602Limited new and refurbishment runways, taxiways and aprons Total 893 816 150 609 154 286 160 907 169 647 484 939Source: National Treasury 68
Glossary
Adjustment estimatesAccrued liabilityAppropriationAsset price inflationBalance of paymentsBasel IIIBaselineBudget balanceBudget Facility for InfrastructureCapital erosionCapital flightCapital flowConditional grantsConsolidated government expenditureConsumer price index (CPI)Consumption expenditure
Presentation to Parliament of the amendments to be made to the appropriations voted in the main budget for the year.A liability that is not paid in the fiscal year in which it is incurred, and so continues to be owed in the next fiscal year.The approval by Parliament of spending from the National Revenue Fund, or by a provincial legislature from the Provincial Revenue Fund.An increase in the overall price of assets over a specific period of time.A summary statement of all the transactions of the residents of a country with the rest of the world over a particular time period. Reforms developed by the Basel Committee on Banking Supervision to strengthen the regulation, supervision and risk management of the banking sector.The initial allocations used during the budget process, derived from the previous year’s forward estimates.The difference between expenditure and revenue. If expenditure exceeds revenue, the budget is in deficit. If the reverse is true, it is in surplus.A reform to the budget process that establishes specialised structures, procedures and criteria for committing fiscal resources to public infrastructure spending.The deterioration of capital due to the lack of investment in the economy.A large outflow of investments from a country in response to heightened economic, political or policy risk.A flow of investments into and out of a country.Allocations of money from one sphere of government to another, conditional on certain services being delivered or on compliance with specified requirements.Total expenditure by national and provincial government, social security funds and selected public entities, including transfers to municipalities or other entities. See also main budget expenditure.The main measure of inflation, charting changes in the price movements of a basket of consumer goods and services.Expenditure on goods and services, including salaries, which are consumed within a short period of time - usually a year.69
2018 MEDIUM TERM BUDGET POLICY STATEMENT
Contingency reserveContingent liabilityCore inflationCountercyclical fiscal policyCredit ratingCrowding-inCrowding-outCurrent account (of the balance of payments)Current balanceDebt-service cost Debt redemptionDepreciation (capital)Depreciation (exchange rate) Division of revenueEmployment tax incentiveEquitable shareExpenditure ceiling70
An amount set aside, but not allocated in advance, to accommodate changes in the economic environment and to meet unforeseen spending pressures.A government obligation, such as a guarantee, that will only result in expenditure if a specific event occurs. See also government guarantee.A measure of the change in consumer price levels that excludes temporary shocks and represents the long-run trend of changes in the price level. See also headline inflation.Policy that has the opposite effect on economic activity to that caused by the business cycle, such as slowing spending growth in a boom period and accelerating spending in a recession.An indicator of the risk of default by a borrower or the riskiness of a financial instrument. Ratings agencies assign grades signifying the borrower’s capacity to meet its financial obligations or the probability that the value of the financial instrument will be realised. See also rating agency.An increase in private investment or consumption as a result of government spending.A fall in private investment or consumption as a result of increased government expenditure.The difference between total exports and imports, including service payments and receipts, interest, dividends and transfers. This account can be in deficit or surplus. See also trade balance. The difference between revenue and current expenditure, which consists of compensation of employees, goods and services, and interest and rent on land.The cost of interest on government debt.Repayment of the principal and any outstanding interest on a bond.A reduction in the value of fixed capital as a result of wear and tear or redundancy.A reduction in the external value of a currency.The allocation of funds between national, provincial and local government as required by the Constitution.An incentive to encourage the creation of jobs for youth by allowing employers to claim a reduction in employees’ tax.The allocation of revenue to national, provincial and local government as required by the Constitution.An overall limit on expenditure that enables government to manage departmental spending levels.
GLOSSARY
External imbalanceFinancial account (of the balance of payments)Financial and Fiscal CommissionFinancial yearFiscal consolidationFiscal policy Fiscal spaceFlexible exchange rate Foreign direct investmentFull-time equivalentGDP inflationGold and foreign exchange accountGovernment guaranteeGross domestic product (GDP)Gross fixed capital formationHeadline inflation
An excessively positive or negative current account balance, reflecting an excess or deficit of domestic investment over domestic savings.A statement of all financial transactions between a country and the rest of the world, including portfolio and fixed investment flows, and movements in foreign reserves.An independent body established in terms of the Constitution to make recommendations to Parliament and provincial legislatures about financial issues affecting the three spheres of government.The 12 months according to which companies and organisations budget and account. Government’s financial year runs from1 April to 31 March.Measures to stabilise a government’s debt-to-GDP ratio and narrow its budget deficit.Policy on taxation, spending and borrowing by government. Government’s ability to provide additional resources in the budget without jeopardising fiscal sustainability.Determination of currency exchange rates by market forces.The acquisition of long-term business interests in another country, usually involving management, technology and financial participation.An indicator measuring the proportion of time for which an employee receives a salary. It enables government to estimate annual personnel costs by aggregating the amount of part-time work to calculate the full-time equivalents. For example, two people working full-time for six months of the year would count as one full-time equivalent.A measure of the total increase in prices in the whole economy. Unlike CPI inflation, GDP inflation includes price increases in goods that are exported and intermediate goods such as machines, but excludes imported goods.A Reserve Bank account that reflects its losses and profits on holdings of foreign currency and gold reserves, driven by changes in the exchange rate of the rand to the US dollar and the gold price.An assurance made by government to a lender that a financial obligation will be honoured, even if the borrowing government institution is unable to repay the debt. See also contingent liability. A measure of total national output, income and expenditure in the economy.The addition to a country’s fixed capital stock over a specific period, before providing for depreciation.A measure of the change in the CPI level that includes temporary price shocks to the economy, such as once-off price changes. See also core inflation.71
2018 MEDIUM TERM BUDGET POLICY STATEMENT
Integrated financialmanagement system (IFMS) projectIndependent power producerIndirect grantInflationInflation targetingLabour force participationMain budget expenditureMedium Term Expenditure Committee (MTEC)Medium Term Expenditure Framework (MTEF)Medium-term strategic frameworkMonetary policyMoney supply National budgetNational Development Plan (NDP)National Revenue FundNet asset position Nominal exchange rateNon-interest expenditure Occupation-specificdispensation (OSD)Opportunity cost72
A project to review, upgrade and integrate government’s financial management information technology systems.A private-sector business that generates energy for the national grid.A grant allowing a national department to perform a function on behalf of a province or municipality. No funds are transferred, but the end-product of the grant, such as infrastructure, is generally transferred to the province or municipality.An increase in the general level of prices.A monetary policy framework intended to achieve price stability over a certain period of time. The Reserve Bank and government agree on a target rate or range of inflation to be maintained.The ratio of employed and unemployed workers (the labour force) relative to the working-age population.National government expenditure and transfers to provincial and local government financed from the National Revenue Fund, excluding revenues and spending related to social security funds, extra-budgetary institutions and provincial own revenue. See also consolidated government expenditure.The committee responsible for evaluating the budget submissions of national departments and recommending allocations.The three-year spending plans of national and provincial governments published at the same the time as the budget.The five-year strategy of government coinciding with the electoral term.The actions taken by a country’s monetary authority (e.g. the Reserve Bank), normally focused around money supply and interest rates.The total stock of money in an economy.The projected revenue and expenditure flowing through the National Revenue Fund. It does not include spending by provinces or local government from their own revenues.A national strategy to eliminate poverty and reduce inequality.The consolidated account of national government into which all taxes, fees and charges collected by the South African Revenue Service, and departmental revenue must be paid.The total value of a company’s assets minus its liabilities. The current rate of exchange between the rand and foreign currencies.Total expenditure by government less debt-service costs. A public-sector initiative aimed at improving government’s ability to attract and retain skilled employees in targeted occupations through increased remuneration.The cost of an alternative forgone to pursue a certain action.
GLOSSARY
Primary deficit/surplusPrimary expenditure Primary sectorPrivate-sector credit extensionProductivityProtectionismPublic entitiesPublic-private partnership (PPP)Public-sector borrowing requirementPurchasing managers’ index (PMI)Rating agencyReal effective exchange rateReal expenditureReal interest rate RedemptionRevaluation gain/lossRepurchase (repo) rateReserves (foreign exchange)RolloverSeasonally adjusted and annualised
The difference between total revenue and non-interest expenditure. When revenue exceeds non-interest expenditure, there is a surplus.Non-interest expenditure by government. The agricultural and mining sectors of the economy. Credit provided to the private sector by banks. This includes all loans, credit card balances and leases.A measure of the amount of output generated from every unit of input over a period of time. Typically used to measure changes in labour efficiency.When a country restricts international trade to protect domestic industries.Companies, agencies, funds and accounts that are fully or partly owned by government or public authorities and regulated by law. A contractual arrangement in which a private entity performs part of a government function and assumes the associated risks. In return, the private entity receives a fee based on predefined performance criteria.The consolidated cash borrowing requirement of general government and non-financial public enterprises.A composite index measuring the change in manufacturing activity compared with the previous month.A company that evaluates the ability of countries or other borrowers to honour their debt obligations. Credit ratings are used by international investors as indications of risk. See alsocredit rating.A measure of the rate of exchange of the rand relative to a trade- weighted average of South Africa’s trading partners’ currencies, adjusted for inflation.Expenditure measured in constant prices, in other words, adjusted to remove the effects of inflation.The level of interest after removing the effects of inflation. The return of an investor’s principal in a fixed-income security, such as a preferred stock or bond.The difference in value of an asset, liability or transaction from its original (historical) rate to its current rate.The interest rate at which the Reserve Bank lends to commercial banks.Holdings of foreign exchange, either by the Reserve Bank only, or by the Reserve Bank and domestic banking institutions.Funds not spent during a given financial year that flow into the following year’s budget.The process of removing the seasonal volatility (monthly or quarterly) from a time series. This provides a measure of the underlying trend in the data. Once the rate is annualised, it is expressed as if it were applied over one year.73
2018 MEDIUM TERM BUDGET POLICY STATEMENT
Social grantsSouthern African Customs Union (SACU) agreementSouthern African Development Community (SADC)Sovereign debtSpecial economic zoneSupply-side constraintsSwitch (auction)Tax buoyancyTerms of trade Trade balanceTransversal term contractTreasury billsTwin deficit Twin peaksUndercapitalisation Unit labour costsUnsecured lendingYield74
Social benefits available to qualifying individuals, funded wholly or partly by the state.An agreement that allows for the unrestricted flow of goods and services, and a sharing of customs and excise revenue, between South Africa, Botswana, eSwatini, Lesotho and Namibia.A regional intergovernmental organisation that promotes collaboration, economic integration and technical cooperation throughout Southern Africa.Debt issued by a government.A designated area where infrastructure and incentives are provided to clusters of businesses to encourage private investment and employment growth.A situation where a country’s productive capacity cannot keep up with rising demand.Auctions to exchange bonds to manage refinancing risk or improve tradability.Describes the relationship between total tax revenue collections and economic growth. This measure includes the effects of policy changes on revenue. A value above one means that revenues are growing faster than the economy and below one means they are growing below the rate of GDP growth.An index measuring the ratio of export prices to import prices. The monetary record of a country’s net imports and exports of physical merchandise. See also current account.A fixed-term contract to procure goods or services needed by more than one government department.Short-term government debt instruments that yield no interest but are issued at a discount. Maturities vary from one day to12 months.The combination of deficits on the budget and the current account. An approach to organising financial sector regulation and supervision involving two regulators. One is responsible for ensuring financial services firms sell their products in an appropriate way. The other is responsible for ensuring financial firms remain financially sound and are generally prudent.Lack of sufficient funds (capital) to conduct day-to-day operations. The cost of labour per unit of output, calculated by dividing average wages by productivity (output per worker per hour).A loan that is not backed or secured by any type of collateral to reduce the lender’s risk.A financial return or interest paid to buyers of government bonds.


