Exhibit 99.E
DESCRIPTION OF THE REPUBLIC OF SOUTH AFRICA
DATED FEBRUARY 15, 2019
INCORPORATION OF DOCUMENTS BY REFERENCE
This document is an exhibit to the Republic of South Africa’s Annual Report on Form 18-K under the Securities Exchange Act of 1934 for the fiscal year ended March 31, 2018. All amendments to such Annual Report on Form 18-K/A filed by South Africa following the date hereof shall be incorporated by reference into this document. Any statement contained in a document, all or a portion of which is incorporated or deemed to be incorporated by reference herein, shall be deemed to be modified or superseded for purposes of this document to the extent that a statement contained herein or in any other subsequently filed document that also is or is deemed to be incorporated by reference herein modifies or supersedes such statement. Any statement so modified or superseded shall not be deemed, except as so modified or superseded, to constitute a part of this document.
TABLE OF CONTENTS
In this document, the government of the Republic of South Africa is referred to as the “National Government,” “the Government” or the “South African Government”. The currency of the Republic of South Africa (South Africa) is the South African Rand. In this document, all amounts are expressed in South African Rand (R or Rand) or US Dollars (US$, $ or Dollars), except as otherwise specified. See “The External Sector of the Economy—Reserves and Exchange Rates” for the average rates for the Rand against the Dollar for each of the years 2015 through February 11, 2019. On February 12, 2019, the exchange rate, as reported by the South African Reserve Bank (SARB), was R13.7721 per Dollar (or 7.261057 US cents per Rand).
The Republic’s fiscal year begins on April 1 and ends on March 31. For example, the 2018 fiscal year refers to the fiscal year beginning April 1, 2017 and ending March 31, 2018. Economic data presented in this description is presented on a calendar year basis unless reference is made to the relevant fiscal year or the fiscal year is otherwise indicated by the context. For example, economic data referring to the “first quarter” of 2018 refers to data as at, or for the three months ended, June 30, 2018. Economic data referring to the “first three months” of 2018, by contrast, refers to data as at, or for the three months ended, March 31, 2018.
Unless otherwise indicated, references to gross domestic product (GDP) are to real GDP, calculated using constant prices in order to adjust for inflation (with 2010 as a base year), and % changes in GDP refer to changes as compared to the previous year or the same quarter of the previous year, unless otherwise indicated.
Unless otherwise stated herein, references in this description to the 2018-2019 Budget are to the 2018-2019 National Budget as released on February 22, 2018 and not as amended by the Medium-Term Budget Policy Statement (MTBPS) released on October 24, 2018. References to the 2018-2019 Consolidated Government Budget, which includes the 2018-2019 National Budget as part thereof, shall be construed accordingly.
Some figures included in this document have been subject to rounding adjustments. As a result, sum totals of data presented in this document may not precisely equate to the arithmetic sum of the data being totaled.
SUMMARY INFORMATION
The following summary tables do not purport to be complete and are qualified in their entirety by the more detailed information appearing elsewhere in this document.
The following tables set forth certain summary statistics about the economy of South Africa, public finance and debt of the National Government for the periods indicated.
Selected Economic Indicators
| | | As of and for the year ended December 31, | | | As of and for
the nine months
ended September 30,(1) | |
| | | 2013 | | | 2014 | | | 2015 | | | 2016 | | | 2017 | | | 2018 | |
| | | | Rand (million) (except percentages) | |
| The Economy | | | | | | | | | | | | | | | | | | | | | | | | |
| Gross Domestic Product (GDP) | | | | | | | | | | | | | | | | | | | | | | | | |
| Nominal GDP(2) | | | 3,539,977 | | | | 3,805,350 | | | | 4,051,421 | | | | 4,350,314 | | | | 4,651,785 | | | | 4,804,357 | * |
| Real GDP(3) | | | 2,973,175 | | | | 3,028,090 | | | | 3,066,835 | | | | 3,084,174 | | | | 3,124,785 | | | | 3,133,633 | * |
| Real % change from prior year | | | 2.5 | | | | 1.8 | | | | 1.3 | | | | 0.6 | | | | 1.3 | | | | 0.8 | |
| Unemployment rate (%) | | | 24.7 | % | | | 25.1 | % | | | 25.4 | % | | | 26.7 | % | | | 27.5 | % | | | 27.1 | % |
| | | | | | | | | | | | | | | | | | | | | | | | | |
| Balance of payments | | | | | | | | | | | | | | | | | | | | | | | | |
| Current account | | | (204,841 | ) | | | (192,966 | ) | | | (186,084 | ) | | | (121,188 | ) | | | (110,495 | ) | | | (96,314 | )** |
| Financial account | | | 209,256 | | | | 207,864 | | | | 171,826 | | | | 161,140 | | | | 135,774 | | | | 105,160 | ** |
| Change in gross gold and other foreign reserves | | | (4,658 | ) | | | (15,134 | ) | | | 14,015 | | | | (40,193 | ) | | | (25,525 | ) | | | (8,966 | )** |
| Rand/Dollar exchange rate (average) | | | 9.65 | | | | 10.84 | | | | 12.76 | | | | 14.71 | | | | 13.31 | | | | 12.89 | |
| Consumer prices (2016/12=100) | | | 82.9 | | | | 88.0 | | | | 92.0 | | | | 97.83 | | | | 104.7 | | | | 109.4 | |
| Producer prices (2016/12=100) | | | 82.1 | | | | 88.1 | | | | 91.31 | | | | 97.78 | | | | 105.2 | | | | 111.3 | |
* Estimate based on first three quarters of 2018, seasonally adjusted and annualized.
** Cumulative numbers up to the third quarter, not seasonally adjusted.
| | | As of and for the fiscal year ended March 31, | |
| | | 2014 | | | 2015 | | | 2016 | | | 2017(5) | | | 2018(6) | |
| | | | | | | | | | | | | | | | |
| Main Government Revenue | | | 887,366.2 | | | | 965,456.9 | | | | 1,076,234.4 | | | | 1,137,896.4 | | | | 1,196,394.0 | |
| % of GDP(2) | | | 24.5 | % | | | 25.0 | % | | | 26.1 | % | | | 25.8 | % | | | 25.3 | % |
| Main Government Expenditure | | | 1,047,758.6 | | | | 1,131,900.1 | | | | 1,244,622.9 | | | | 1,305,486.2 | | | | 1,404,985.9 | |
| % of GDP(2) | | | 29.0 | % | | | 29.3 | % | | | 30.2 | % | | | 29.6 | % | | | 29.8 | % |
| Main Budget Deficit | | | (160,392.4 | ) | | | (166,443.2 | ) | | | (168,388.5 | ) | | | (167,589.80 | ) | | | (208,591.9 | ) |
| % of GDP(2) | | | (4.44 | )% | | | (4.31 | %) | | | (4.08 | %) | | | (3.80 | %) | | | (4.42 | %) |
| Net borrowing requirement | | | 160,392.4 | | | | 166,443.2 | | | | 168,388.5 | | | | 167,589.80 | | | | 208,591.9 | |
| Change in cash and other balances(4) | | | (12,448.4 | ) | | | (8,500.8 | ) | | | 13,020.5 | | | | (25,982.30 | ) | | | (29,027.50 | ) |
Notes:
N/A = not available
| (1) | First half of 2018, seasonally adjusted and annualized. |
| (3) | At constant 2010 prices. |
| (4) | The total debt of National Government (net) is calculated with due account of the bank balances of the National Revenue Fund (balances of National Government’s accounts with the SARB and the Tax and Loans Accounts with commercial banks). |
| (5) | Final outcome for fiscal year 2017, as reflected in the MTBPS (October 2018). |
| (6) | Estimates as revised and reflected in the MTBPS (October 2017). |
Source: National Treasury, SARB and Statistics SA (Stats SA).
The estimates included in this Annual Report are based on the 1993 System of National Accounts (SNA) published by the United Nations in cooperation with other international organizations. This means that the methodology, concepts and classifications are in accordance with the latest guidelines of an internationally agreed system of national accounts. The estimates of real GDP are expressed in terms of a 2010 base year. Revision of the estimates for all components of the national accounts is done from time to time based on the availability of data.
Statistics South Africa (Stats SA), who compiles the expenditure side of national accounts, has rebased certain GDP estimates in the Statistical Release, P0441, Gross Domestic Product, Third Quarter 2014 dated November 25, 2014 in terms of a 2010 base year.
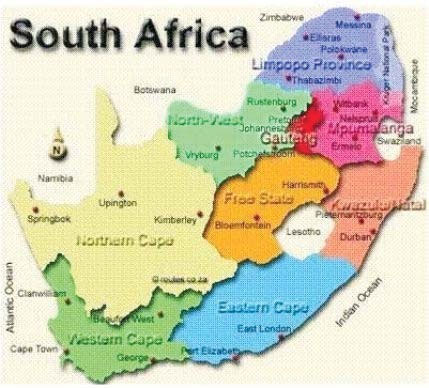
MAP OF THE REPUBLIC OF SOUTH AFRICA
REPUBLIC OF SOUTH AFRICA
Area and Population
South Africa is situated on the southern tip of the African continent, with the Atlantic Ocean to the west and the Indian Ocean to the east. The north of the country shares common borders with Namibia, Botswana and Zimbabwe and, to the north east, the country shares a border with Mozambique. South Africa also shares common borders with the kingdoms of Lesotho and Swaziland. The total surface area of South Africa is approximately 1,219,090 square kilometers, with over 3,000 kilometers of coastline.
South Africa comprises nine provinces, which are the Eastern Cape, Free State, Gauteng, KwaZulu-Natal, Limpopo, Mpumalanga, Northern Cape, North West and Western Cape Provinces.
According to the racial classifications that formed the basis for the apartheid system, “Black” referred to persons of original African indigenous origin, “Asian” to persons of Asian origin, “White” to persons of Caucasian ethnic origin and “Coloured” to persons of mixed race. While the National Government no longer makes any unfair discrimination based on race, the country’s history of racial division and racial and ethnic differences continues to have social and economic significance. This is because social and economic policies are judged partly by their ability to address disparities and discrimination and to equalize opportunities. Therefore, in this document, reference to such racially classified statistics is made occasionally to illustrate those disparities.
South Africa’s population is approximately 57.73 million as at June 30, 2018, of which 29.5 million, representing 51% of the population, are female. Approximately 80.9% are Black African, 8.8% are Coloured, 2.5% are Indian/Asian and 7.8% are White. The most densely populated parts of South Africa are the four major industrialized areas: the Pretoria/Witwatersrand/Vereeniging area of Gauteng (which includes Johannesburg), the Durban/Pinetown/Pietermaritzburg area of KwaZulu-Natal, the Cape Peninsula area of the Western Cape (which includes Cape Town) and the Port Elizabeth/Uitenhage area of the Eastern Cape.
South Africa has a diverse population consisting of Afrikaans and English-speaking Whites, Asians (including Indians), Coloreds, Khoi, Nguni, San, Sotho-Tswana, Tsonga, Venda and persons that have immigrated to South Africa from across the globe. By virtue of the country’s diversity, South Africa has 11 official languages, namely Afrikaans, English, isiNdebele, isiXhosa, isiZulu, Sepedi, Sesotho, Setswana, siSwati, Tshivenda and Xitsonga. According to the results of the census conducted in 2011, isiZulu is the mother tongue of 22.6% of the population, followed by isiXhosa at 15.9%, Sepedi at 9.1%, Afrikaans at 7.9%, and English and Setswana at 8.2% each. IsiNdebele is the least spoken language in South Africa, at 1.5%.
Government and Political Parties
Following the repeal of apartheid legislation, South Africa held its first fully democratic national election on 27 April 1994.
On 10 May 1994, Nelson Mandela, who had previously been elected as president of the ANC, was inaugurated as South Africa’s first black president. Mr. Mandela served until his deputy, Thabo Mbeki succeeded him on 14 June 1999. Mr. Mbeki resigned from the presidency on September 2008, and Kgalema Motlanthe served as interim President between 25 September 2008 and 9 May 2009.
On May 24, 2014, following the ANC’s victory in the elections, Jacob Zuma was inaugurated as the fourth democratically elected President of the Republic, Mr. Cyril Ramaphosa was elected as Deputy President.
In October 2017, the Supreme Court of Appeals ruled that former President Zuma had to face 18 counts of corruption, fraud, racketeering and money laundering. On 13 December 2018, the North Gauteng High Court ruled that former President Zuma would no longer receive state funding for his legal defence. On 14 February 2018 former President Zuma resigned as President of the Republic.
On 15 February 2018, Mr Cyril Ramaphosa was sworn in as the President of the Republic of South Africa.
On 27 February 2018, President Ramaphosa made several appointments to his cabinet, including the following: Mr. Jeffrey Thamsanqa Radebe as Minister of Energy; Mr. Gwede Mantashe as Minister of Mineral Resources; Mr. Pravin Jamnadas Gordhan as Minister of Public Enterprises; Ms. Letsatsi-Duba as Minister of State Security; Dr. Zweli Mkhize as Minister of Cooperative Governance and Traditional Affairs; Mr. Derek Hanekom as Minister of Tourism; General Bheki Cele as Minister of Police; Dr. Nkosazana Clarice Dlamini Zuma as Minister in the Presidency for Planning, Monitoring and Evaluation; Ms. Mmamoloko Kubayi-Ngubane as Minister of Science and Technology; Ms. Lindiwe Sisulu as Minister of International Relations and Cooperation; Ms. Nelandi Pandor as Minister of Higher Education; Ms. Ayanda Dlodlo as Minister of Public Services and Administration; Ms. Maite Nkoana-Mashabane as Minister of Rural and Land Reform; Mr. Gugile Kwinti as Minister of Water and Sanitation; Ms. Susan Shabangu as Minister of Social Development; and Ms. Bathabile Dlamini as Minister of Women in the Presidency.
Constitution
The current Constitution was adopted in 1996 and phased in between 1997 and 1999. The Constitution provides for elections every five years as well as for the separation of powers among the legislative, executive and judicial branches of the National Government. Under the Constitution, the bicameral Parliament, in which the legislative authority of the National Government is vested, is comprised of a National Assembly and a National Council of Provinces (NCOP).
The National Assembly consists of no fewer than 350 and no more than 400 members elected on the basis of proportional representation pursuant to which political parties receive seats in proportion to the votes cast for the parties concerned.
The National Assembly is mandated by the Constitution to choose the President, provide a national forum for public consideration of issues, pass legislation, scrutinise and oversee executive action, maintain oversight of the bodies and institutions established by Chapter 9 of the Constitution, and ensure that Members of Cabinet are accountable collectively and individually to Parliament for the exercise of theirs powers and the performance of their functions.
The NCOP is one of the two Houses of Parliament. The NCOP is constitutionally mandated to ensure that provincial interests are taken into account in the national sphere of government. This is done through participation in the national legislative process and by providing a national forum for consideration of issues affecting provinces.
The NCOP also plays a unique role in the promotion of the principles of Cooperative Government and Intergovernmental Relations. It ensures that the three spheres of government work together in performing their unique functions in terms of the Constitution and that in doing so, they do not encroach in each other’s area of competence.
The NCOP consists of 90 members (namely 54 permanent members and 36 special delegates). Each of the nine provincial legislatures elects ten representatives.
Each province has its own executive authority, the premier. The premiers are elected by each Provincial legislature from among its members. The powers of the premier are exercised in consultation with a provincial executive council, which is constituted in a manner similar to the Cabinet in the National Government. The provinces exercise limited power on a national level, principally through their representatives in the NCOP, and also through their power to block Parliamentary action affecting the constitutional position and status of the provinces. When deciding on bills that amend the constitution, the provincial delegations vote in accordance with the mandate conferred on them by their respective provincial legislature. Each province has one vote and at least six provinces have to vote in favour of the Bill for it to be passed. When deciding on bills that affect the provinces, the provincial delegations vote in accordance with the mandate conferred on them by their respective provincial legislatures. Each province has one vote and at least five provinces need to vote in favour of the bill for it to be approved.
Political Parties
The ANC, which was founded in 1912 and which led the struggle against apartheid, is the ruling party in eight of the nine South African provinces, and the most influential party in South Africa in terms of the size of its electoral constituency support. Following the May 2014 elections, the ANC occupies 249 of the National Assembly’s 400 seats. Every five years the ANC holds a National Conference, which is the highest decision –making body and which decides the policies of the ANC, adopts proposed constitutional amendments and elects the National Executive Committee. The 54th ANC National Conference took place in Johannesburg, Gauteng Province, from December 16 to December 20, 2017, where Mr. Cyril Ramaphosa was elected president of the ANC.
2014 National and Provincial Elections
The official general election results were announced on May 10, 2014. The ruling ANC won the elections, receiving 62% of the votes cast in respect of the national elections. The DA remained the official opposition of the ANC, with 22% of the votes, and the EFF came in third with 6% of the votes.
The table below sets out the National and Provincial Assembly seats secured by political parties following the May 2014 general elections.
| Political Party | | Number of seats in
National Assembly | | | Proportional
Representation seats | |
| | | | | | | | | | | | | |
| ANC | | | 249 | | | | 62.15 | % | | | 118 | | | | 59.0 | % |
| DA | | | 89 | | | | 22.23 | % | | | 45 | | | | 22.5 | % |
| EFF | | | 25 | | | | 6.35 | % | | | 11 | | | | 5.5 | % |
| IFP | | | 10 | | | | 2.4 | % | | | 5 | | | | 2.5 | % |
| NFP | | | 6 | | | | 1.57 | % | | | 3 | | | | 1.5 | % |
| UDM | | | 4 | | | | 1 | % | | | 2 | | | | 1.0 | % |
| VF PLUS | | | 4 | | | | 0.9 | % | | | 3 | | | | 1.5 | % |
| COPE | | | 3 | | | | 0.67 | % | | | 3 | | | | 1.5 | % |
| ACDP | | | 3 | | | | 0.57 | % | | | 3 | | | | 1.5 | % |
| AIC | | | 3 | | | | 0.53 | % | | | 3 | | | | 1.5 | % |
| AGANG SA | | | 2 | | | | 0.28 | % | | | 2 | | | | 1.0 | % |
| PAC | | | 1 | | | | 0.21 | % | | | 1 | | | | 0.5 | % |
| APC | | | 1 | | | | 0.17 | % | | | 1 | | | | 0.5 | % |
| Total | | | 400 | | | | 100.0 | % | | | 200 | | | | 100.0 | % |
Source: IEC.
The table below sets out the NCOP seats secured by political parties following the May 2014 general elections.
Political Party | | Permanent | | | Special | |
| | | | | | | |
| ANC | | | 33 | | | | 27 | |
| DA | | | 13 | | | | 7 | |
| EFF | | | 6 | | | | 1 | |
| IFP | | | 1 | | | | 0 | |
| NFP | | | 0 | | | | 1 | |
| UDM | | | 1 | | | | 0 | |
| Total | | | 54 | | | | 36 | |
Source: Parliament of the Republic of South Africa
2019 National and Provincial Elections
The Independent Electoral Commission (IEC) announced that National and Provincial elections had been scheduled to take place in May of 2019. As of December 31, 2018 there were a total of 26.1 million registered voters.
2016 Municipal Elections
Municipal elections are held every five years. Municipal elections were held on August 3, 2016. The shares of the votes for the major parties were as follows: ANC – 53.9%, DA – 26.9%, EFF – 8.2%, IFP – 4.23%, and COPE – 0.42%. The NFP failed to pay the registration fee to the Independent Electoral Commission and thus did not participate in the elections. The next municipal elections are scheduled to take place in 2021.
Recent Developments
On 9 October 2018, Mr. Tito Titus Mboweni was appointed as Minister of Finance. Mr. Mboweni has previously served as a Governor of the South African Reserve Bank.
On 22 November 2018, additional cabinet appointments were made, including the following: Ms. Nomvula Mokonyane as Minister of Environmental Affairs; Dr. Siyabonga Cyprian Cwele as Minister of Home Affairs; and Ms. Stella Ndabeni-Abrahams as Minister of Communications. On the same date, the Ministry of Communications was merged with the Ministries of Telecommunications and Postal Services.
Mr. Ebrahim Patel continues to serve as Minister of Economic Development, since his appointment in May of 2009.
Legal System
The South African legal system is based upon Roman-Dutch law and incorporates certain elements of English law, subject to the Bill of Rights contained in the Constitution. Judicial authority in South Africa is vested in the courts, which are established pursuant to the Constitution. The Constitution is the supreme law of the land and no other law can supersede the provisions of the Constitution. The Constitutional Court is the supreme court of the land and has jurisdiction as the court of final instance over all matters relating to the interpretation, protection and enforcement of the terms of the Constitution. It is also the court of first instance on matters such as those concerning the constitutionality of an Act of Parliament referred to it by a member of the National Assembly. Decisions of the Constitutional Court are binding upon all persons and upon all legislative, executive and judicial organs of state. Matters not falling within the jurisdiction of the Constitutional Court fall within the jurisdiction of the Supreme Court, which consists of the Supreme Court of Appeal and various High Courts. Judgments of the Supreme Court of Appeal are binding on all courts of a lower order, including the High Courts, and judgments of the High Courts are binding on the lower courts within their respective areas of jurisdiction.
The Chief Justice, currently Justice Mogoeng Mogoeng who was appointed on September 8, 2011, and the Deputy Chief Justice of the Constitutional Court are appointed by the President in consultation with the Judicial Service Commission (the JSC) and the leaders of parties represented in the National Assembly. The Judge President and Deputy President of the Supreme Court of Appeal are appointed by the President after consulting with the JSC only. The remaining judges of the Constitutional Court, the Supreme Court of Appeal and the High Courts are appointed by the President on the advice of the JSC.
Land Reform
Land reform in South Africa is a complex issue, due to both the apartheid era legacy of dispossessing black South Africans of their land and the current development challenges. Through the judicial process and the Constitution’s protection of private property rights, the National Government seeks to facilitate the equitable transfer of land to South Africans who lost their land as a result of the land dispossession policies of the previous regime in South Africa.
The Department of Rural Development and Land Reform had previously set 2014 as the deadline for achieving land reform in South Africa through the redistribution of 30% of white-owned commercial agricultural land to those previously dispossessed of such land. According to the Department of Rural Development and Land Reform, as of 31 March 2018 approximately 8.4 million hectares of land have been transferred to previously disadvantaged South Africans under the restitution and redistribution programs; the initial 30% target was 24.6 million hectares.
The implementation of the land restitution and land reform programs are supported through allocations to the Department. Expenditure grew from R8.9 billion in 2002 to R9.5 billion in 2014, mainly due to the increase in land reform and restitution grants, and remained at R9.5 billion in 2015 due to the tight fiscal environment. Expenditures decreased to R9.1 billion in 2016, increased to R10.1 billion in 2017 and decreased to R9.7 billion in 2018. Expenditures, however, are expected to increase to R11 billion by 2020.
The government is committed to pursuing a comprehensive approach to land and agrarian reform that is supportive of inclusive growth and balances the need for transformation with the need for policy certainty to allow increased agricultural output, growth and food security. To this end an advisory panel on land reform has been appointed and it includes sector experts such as: farmers, policy makers, academics and lawyers to provide concrete measures to achieve a more effective land reform programme. The Commission on Restitution of Land Rights through the Department of Rural Development and Land Reform has also embarked on a parliamentary process to evaluate the constitutionality of land expropriation without compensation. As part of the parliamentary process currently underway to evaluate the constitutionality of land expropriation without compensation, a parliamentary Joint Constitutional Review Committee adopted a resolution calling for the amendment of section 25 of the constitution to allow for expropriation of land without compensation in the public interest. The Committee recommended that it be made explicit that this is one of the means by which unequitable land ownership patterns in South Africa can be addressed. The Committee’s final report and recommendations were tabled in the National Assembly for debate, subsequently forwarded to the NCOP for concurrence. Another parliamentary committee is currently processing the amendment bill that will contain the detail, as well as the precise wording, of how the relevant sections of the constitution would be amended. Additionally, the eventual outcomes of this process would be required to be ratified by the Constitutional Court. The outcomes of this process have to be ratified by the Constitutional Court. Collectively the outcomes of these processes will assist government in mapping a way forward with regard to answering South Africa’s land question.
Broad-Based Black Economic Empowerment
Broad-Based Black Economic Empowerment (B-BBEE) continues to be core tenet of the National Government’s initiative to address the economic exclusion of historically disadvantaged South Africans. As part of this initiative, the National Government enacted the Broad-Based Black Economic Empowerment Act, 2003 (Act No. 53 of 2003) (BBBEE Act), which came into effect in April 2004. For purposes of the B-BBEE Act, “black people” is a generic term which means Africans, Coloureds and Indians who are South African citizens. The BBBEE Act aims to facilitate B-BBEE and promote economic transformation by: incentivizing meaningful participation by black people in the economy; changing the racial composition of ownership and management structures in enterprises; promoting investment programs that lead to BBBEE; enabling access to economic activities, infrastructure and skills for black women and rural and local communities; increasing the extent to which workers, communities and cooperatives own and manage enterprises; and promoting access to finance for black economic empowerment (BEE). The Act requires that every organ of national and local government and every public entity must apply B-BBEE relevant Codes of Good Practice in issuing licenses, implementing procurement policies, determining qualification criteria for the sale of state-owned enterprises and developing criteria for entering into public private partnerships.
The Department of Trade and Industry (DTI), has issued the B-BBEE Codes of Good Practice on Black Economic Empowerment (the Codes). The Codes, which were promulgated in February 2007 and amended in October 2013, set out general principles for measuring ownership, management control, skills development, enterprise and supplier development and socio-economic development, including special guidance for qualifying small enterprises. The Codes also provide guidance on B-BBEE verification, the recognition of contributions toward BEE of multinationals and the treatment of public entities and other enterprises wholly owned by organs of state.
Multinational Companies
The Codes have given multinational companies flexibility in the manner in which they can implement the Codes. A multinational company can retain sole ownership of its South African subsidiary, provided that alternative measures to broaden economic participation by black people, in terms of the Codes, are exercised. So called “equity equivalent” programs focus on skills transfer, empowerment of small-medium-micro-enterprises (SMME) and broader socio-economic empowerment projects.
Public Entities and State Agencies
The BBBEE Act places a legal obligation on state agencies to contribute to B-BBEE, including when developing and implementing their preferential procurement policies. The Preferential Procurement Policy Framework Act, 2000 (Act No. 5 of 2000) (PPPFA) states that all spheres of government must have a mechanism in place that would bring about categories of preference in allocation of contracts when procuring goods and services to advance historically disadvantaged individuals (HDIs). HDIs are South African citizens who, (1) due to the apartheid policy that was in place, had no voting rights in the national elections prior to the introduction of the Constitution of 1983 or 1992, (2) are female, or (3) have a disability. The Regulations to the Act were amended in 2011 to advance the objectives of the B-BBEE Act. In terms of the new regulations, the B-BBEE contributorship level of an enterprise (calculated with reference to the Codes) will account for up to 20.0% of the scorecard in respect of all tenders valued between R30,000 and R1,000,000 and up to 10.0% of the scorecard in respect of tenders exceeding R1,000,000. As of January 20, 2017, the amended PPPFA regulations had been registered by the National Treasury. The effective date of the regulations is April 1, 2017. The amended regulations, increased the threshold from R30,000 up to R50 million. The B-BBEE Status Level contributes 20.0%. Tenders above R50 Million, a total of10% will be contributed to the B-BBEE Status Level. A dispensation has been made for an organ of state and public entities to apply pre-qualifying criteria to advance certain designated groups.
Private Sector
A business’s B-BBEE status is an important factor affecting its ability to tender successfully for Government and public entity tenders and (in certain sectors like mining and gaming) to obtain licenses, as well as trading with other firms in the private sector. The amendments introduced by the DTI and approved by Parliament in 2013 impose penalties in certain circumstances such as fronting or circumvention to the legislation. These amendments became effective as of October 24, 2014. Private sector clients increasingly require their suppliers to have a minimum B-BBEE rating in order to boost their own B-BBEE ratings. B-BBEE is accordingly an important factor to be taken into account by any firm conducting business in South Africa.
The B-BBEE Act provides for the DTI to publish and promote any transformation charter (for later development into industry codes) for a particular sector of the economy, provided that charter (or code) is developed by the major stakeholders in that sector and advances the objectives of the BBBEE Act. These charters/codes set out a blueprint and timeline for the transformation of the relevant economic sectors. Charter can include economic sectors such as tourism, financial services, forestry and construction, among others.
Some of the biggest challenges facing the National Government in relation to the implementation of B-BBEE include educating the South African public on the objectives, opportunities and perceptions relating to B-BBEE, providing certainty as to the requirements of B-BBEE, ensuring that the objectives of B-BBEE are properly adhered to and encouraging investment in South Africa that advances B-BBEE and promotes economic and social transformation.
Mining Industry Reform
Mining in South Africa has historically been undertaken largely by the private sector. As of December 31, 2018 there were approximately 1,700 operating mines and quarries in South Africa. The most important mining houses in South Africa include Anglo American plc, De Beers Corporation, African Mineral Limited, BHP Billiton SA, Gold Fields Limited, Impala Platinum Holdings Limited, Lonmin plc, Kumba Iron Ore Limited, Exxaro Limited, Xstrata plc and Harmony Gold Limited. These corporations, together with their affiliates, are responsible for the majority of the gold, diamond, uranium, zinc, lead, platinum, chrome, iron ore, coal and silver mining in South Africa.
The Mineral and Petroleum Resources Development Act (MPRDA) and the Mining Charter
The Minister of Mineral Resources (previously the Minister of Minerals and Energy) is the competent authority for granting prospecting and mining licenses. In granting rights to HDIs, the DMR’s objective for fiscal year 2015 was to grant 200 such licenses, 760 of which have been granted as of September 30, 2015 . As of that same date, the department has granted approximately 3,800 permits for small-scale mining. As of 31 December 2018, the mining industry employed over 460,000 workers.
The South African Mineral Resources Administration System (SAMRAD), was launched in April 2011 to process mining license applications, which enables the monitoring of the status and improves overall quality of license applications. Through SAMRAD, the general public can view the locality of applications, rights and permits made or held.
The DMR is also responsible for managing environmental impacts from mining-related activities, and by the end of September 2018, had conducted 849 environmental inspections out of a target of 1275 inspections . The Department of Environmental Affairs has transferred some of the functions of the National Environmental Management Act related to mining activities to the DMR, which means the DMR would be the competent authority for environmental impact assessments for the mines and would also be responsible for developing tools and systems for mine environmental management and reporting. The DMR is currently developing measures to streamline the licensing process relating to mining environmental issues to improve turnaround times.
In September, 2018, Mineral Resources Ministry issued a new Mining Charter. The new set of rules aims to distribute mineral wealth more equally among citizens. The new Mining Charter includes the following provisions:
The revised Mining Charter contains significant differences from the existing Mining Charter, including, among others, the following:
(i) existing mining companies have only 12 months to meet most of the new requirements, and the penalty for not meeting such timelines includes criminal sanctions, suspension of operations and/or suspension or withdrawal of the mining right;
(ii) an ownership target of 30% of the equity of mining companies to be held by black shareholders must be achieved and maintained, and black partners must directly and actively control their share of equity interest in the mining company. On procurement, supplier and enterprise development, mining right holders must spend at least 70% of total mining goods procurement spend on locally manufactured goods while a minimum of 80% of services must be procured from South African based companies.
(iii) a holder of a mining right must pay a minimum of 1% of its annual turnover in any given financial year to black shareholders, prior to and over and above any distributions to the shareholders of the company (subject only to the solvency and liquidity requirements); and
(iv) mining companies must achieve the following minimum HDI and HDI female demographic representation: 50% at executive management (board) level (25% of which must be female HDIs), 60% at senior management level (30% of which must be female HDIs), 75% at middle management level (38% of which must be female HDIs), 88% at junior management level (44% of which must be female HDIs) and 60% of the company’s core and critical skills employees.
Other Mining Industry Initiatives and Legislation
The Mineral and Petroleum Resources Royalty Act of 2008 (the Royalty Act) is aimed at ensuring that the country benefits from the exploitation of its mineral resources by imposing a resource rent on holders of rights. It also seeks to stimulate investment in the sector by addressing potential investor needs for regulatory certainty. The Royalty Act recognizes that mineral resources are non-renewable and are part of the common heritage of all South Africans, and thus imposes a royalty on the extraction and transfer of mineral resources.
Health and safety standards within the industry are governed by the Mine Health and Safety Act of 1996 (MHSA). From January to October 2017 , 77 mining accident fatalities were registered, a decreased compared to 78 fatalitites during the same period in 2016.These fatalities are partially attributable to a lack of stringent safety measures. Land slide accidents remain the largest cause of fatalities, followed by transportation and machinery accidents.
In September 2012, the Cabinet approved the moratorium on the acceptance and processing of applications to explore shale gas, allowing normal exploration (excluding the actual hydraulic fracturing) to proceed under the existing regulatory framework.
The Council for Geoscience (CGS) has undertaken a shale gas research project that is aimed at unlocking the unknowns and assumptions about shale gas exploration in the country. The project is also aimed at building scientific skills in the area of shale gas exploration as this is a new concept to the country at large.
The programme is funded by the DMR and will assist the government in making well informed decision about shale gas in South Africa.
The objectives of the programme are to collect and review new geological information of the Karoo Basin, to define an environmental baseline, to assess the amount of recoverable gas mainly from the Whitehill and Prince Albert Formations, to cover various geo-environmental impacts like ground water dynamics with possible contamination, and monitor potential seismic interferences.
The CGS Shale gas project will serve as a baseline study for future shale gas research work and play a vital role in review of Petroleum Exploration and Exploitation Regulations. National Environmental Management Act (NEMA) regulations will be utilized as a framework in identifying shortfalls of the environmental impacts of the shale gas
Internal Security
Criminal Activity
Incidents of murder increased from 17,023 in 2013/2014 to 17,805 in 2014/2015 to 18,673 in 2015/2016, to 19,016 in 2016/2017 to 20,336 in 2017/2018. Between 2016/2017 and 2017/2018 incidents of murder increased by 6.9%.
Incidents of rape decreased from 45,349 in 2013/2014 to 43,195 in 2014/2015, to 41,503 in 2015/2016, to 39,828 in 2016/2018 and increased to 40,035 in 2017/2018. Between 2016/2017 and 2017/2018 incidents of rape increased by 0.5%
Incidents of aggravated robbery which includes carjacking, bank robbery, robbery of cash in transit and robbery at residential and non-residential premises increased from 118,963 in 2013/2014 to 129,045 in 2014/2015 to 132,527 in 2015/2016 to 140,956 in 2016/2017, and decreased to 138,364 in 2017/2018. Between 2016/2017 and 2017/2018 incidents of aggravated robbery decreased by 1.8%,
Incidents of drug-related crime detected as a result of police action increased from 260,596 in 2013/2014 to 266,902 in 2014/2015 then decreased to 259,165 in 2015/2016, and then increased again to 292,689 in 2016/2017 and to 323,547 in 2017/2018. Between 2016/2017 and 2017/2018 incidents of drug-related crime detected as a result of police action increased by 10.5%.
To enhance national security and territorial integrity at ports of entry, the South African Police Service (SAPS) undertook various crime prevention and combating actions at ports of entry during 2017/2018. The actions undertaken in this regard included 322 roadblocks, 44,401 vehicle patrols, 2,018 Vehicle Check Points (VCPs), 60,295 foot patrols and 2 421 vessel patrols.
In 2017/2018, 216,654,278 kg of cannabis, 864,451 Mandrax tablets, 392,945 kg of crystal meth (Tik-Tik), 77,444 kg of cocaine and 546,500 kg of heroin were seized by the SAPS. Furthermore, the South African Narcotics Enforcement Bureau (SANEB) dismantled a total of 53 clandestine laboratories. Overall, the SANEB has succeeded in drug seizures valued at R238.6 million, ranging from cannabis, cocaine, methamphetamine, methaqualone, methacathinone, heroin, nyaope and ecstasy. During 2017/2018, the SAPS confiscated 1,294,076 liters of liquor countrywide. A total number of 59,092 liquor operations were conducted, in order to eradicate the illegal trade in liquor. These operations resulted in the closure of 19,965 identified unlicensed liquor premises and illegal liquor traders were also charged.
In 2017/2018, the Directorate for Priority Crime Investigation (DPCI) executed 1,506 arrests and secured 957 convictions for persons involved in serious commercial crime-related activities. Counterfeit goods were seized to the value of R122.4 million.
In 2017/18, a total of 311 SAPS members were convicted for different types of misconduct, emanating from Independent Police Investigative Directorate (IPID) investigations and recommendations. In addition, a total of 36 SAPS members were dismissed. In terms of criminal convictions, the IPID obtained 99 criminal convictions of SAPS members as at the end of 2017/18. From this, a total of 112 police officers were convicted for various offences committed, of which the sentences included five life sentences for four murders and one rape conviction during 2017/18. In Pretoria, two police officers were sentenced to life and 15 years’ imprisonment for rape. In Limpopo, a policeman was also sentenced to life and 15 years’ imprisonment for murder. Other matters in which life sentences were handed down took place in the Eastern Cape, Western Cape and Gauteng provinces.
During 2017/2018, the IPID concluded a Memorandum of Understanding (MoU) with the Inspector-General for Intelligence (IGI). The MoU has played a significant role in enabling the investigation of the plundering of the Secret Service Account (SSA) by criminal elements in the Crime Intelligence (CI) Division of the SAPS.
Following the 2016 Constitutional Court judgment in which various sections of the IPID Act (2011) were declared to be inconsistent with the Constitution, the IPID commenced the process of reviewing and amending the IPID Act in 2017/18 to align it with the Constitution. In this regard, the IPID collaborated with civil society and jointly hosted two workshops with the African Policing Civilian Oversight Forum to consult with relevant stakeholders on the comprehensive amendment of the IPID Act. The proposed amendments are awaiting Cabinet Approval.
In 2017/18, the Civilian Secretariat for the Police Service (CSP) finalized the policy framework for establishing a homogenized “Single Police Service” in South Africa. The objectives of the framework are to institute systems, structures and processes for the integration and cooperation of the police service; ensure uniformity through the development of norms and standards; clarify and streamline operational command and control; and provide a basis for relevant legislative amendments to fully establish a “Single Police Service”. The aim is to improve efficiencies in law enforcement and policing in the country by maximizing available resources through coordinated planning to reduce crime and violence over the medium to long term. As of 2018/2019, the Single Police Service Joint Task Team was undertaking phase three of the process to establish a “Single Police Service”, with a particular focus on integrating traffic police with the SAPS through norms and standards, and harmonizing processes with the National Traffic Law Enforcement Review Committee.
In 2017/18, the department further produced a Customer Satisfaction Survey Report to provide insight into the perceptions and experiences of individuals who have previously lodged complaints against the SAPS. Participants in the survey were drawn from the SAPS complaints database across all nine provinces. The survey indicated that SAPS had 7,450 service delivery complainants in the database. The monitoring and evaluation of SAPS performance and conduct remains one of the most important functions of the Civilian Secretariat, which will also contribute towards the national development plan goal of having a professionalized police service by 2030. Professionalization of the police service entails the development of a professional, competent, accountable, transparent and highly skilled police service that provides policing in accordance to constitutional imperatives.
Justice
Departments in the Justice, Crime Prevention and Security (JCPS) cluster have continued to implement the 2014-2019 integrated MTSF objectives to ensure that all people in South Africa are and feel safe. In addition, the development and finalization of an Integrated Criminal Justice Strategy (ICJS) by the cluster will assist in addressing challenges and shortcoming across the criminal justice value chain and strengthening the cooperation and integration of law enforcement agencies in realizing the strategic objectives of the National Development Plan (NDP).
The Department of Justice and Constitutional Development leads the implementation of the integrated justice system programme in the JCPS cluster. The objective of this programme is to electronically enable and integrate the end-to-end criminal justice business processes (from the reporting of a crime to the release of a convicted person) through technology solutions and to manage the related inter-departmental information exchanges across the criminal justice system. Through the programme, a digital transformation strategy was prepared that outlines several initiatives to modernize the CJS through technology solutions that enable new technological capabilities, realize cost efficiencies and refocus human capacity towards higher value activities. The strategy is aligned with the ICJS and will be a key focus area for implementation by the cluster through 2024.
Regarding prosecutions, great strides have been made by the National Prosecuting Authority to ensure that high conviction rates are maintained and improved on in all court forums. Performance in high courts fluctuated from 91% in 2014/15, 89.9% in 2015/16, 91% in 2016/17 to 91.7% in 2017/18, while performance in regional courts increased from 76.6% in 2014/15, 78.4% in 2015/16, 80% in 2016/17 to 81% in 2017/18, and in district courts from 94.2% in 2014/15, 94.7% in 2015/16, 95.6% in 2016/17 to 96.1% in 2017/18. A significant improvement was also noted in 2017/18 on the prosecution of specialized crime. In this regard, the Specialized Commercial Crime Unit obtained a conviction rate of 94.1% in relation to complex commercial crime matters against a target of 93%. Organized crime prosecution also achieved a conviction rate of 93.8% and the number of convictions (346) exceeded the annual expectations of 269 convictions. With regard to sexual offences, a conviction rate of 72.7% was achieved in 2017/18, which is an all-time high, and reflects the cluster’s firm commitment to deliver justice for the most vulnerable members of society.
The Asset Forfeiture Unit (AFU) continues to play a critical role in the fight against corruption and has delivered significant returns in the past few years showing that crime does not pay. In its endeavor to curb the increase of corruption, the unit obtained freezing orders to the value of R4.4 billion in 2017/18, and recorded recoveries in terms of the Prevention of Organized Crime Act (1998) to the value of R302.8 million. In line with its operational plan, the unit adopted a strategy that not only seeks to extend the footprint of asset forfeiture in the fight against crime, but one that also seeks to deliver maximum impact in several identified focus areas.
Defence
As a sovereign state, South Africa has a duty to safeguard its borders against the possibility of transnational crime, international crime syndicates and cartels, the illegal flow of undocumented migrants, and illicit economic activities. The SA National Defence Force in conjunction with the Ministry of Defence and and Military Affairs continued borderline protection by deploying 15 sub-units along the borders in Limpopo, Mpumalanga, KwaZulu-Natal, Free State, Eastern Cape, Northern Cape and North West Provinces. Operational successes for borderline protection in 2017/18 includes the confiscation of 34 weapons, 130 stolen vehicles and 1,882 live-stock, the apprehension of 11,316 undocumented foreigners, the arrest of 464 criminals and confiscation of 10,196 kg of dagga (marijuana) and contraband goods valued at of R27 million.
International Relations
South Africa maintains diplomatic relations with 123 countries. South African representation abroad includes 104 embassies, 16 consulates, 97, honorary consulates, 2 liaison offices, 68 non-resident accreditations and 12 representations in international organizations. South Africa hosts 123 embassies, 53 consulates, 79 honorary consulates, 1 liaison office, 18 non-resident accreditations and 35 international organizations.
United Nations
South Africa is one of the 51 founding members of the United Nations (UN) in 1945. South Africa has served as a member of the UN Security Council, the UN Human Rights Council and is a member of the UN General Assembly and the Economic and Social Council of the United Nations.
International Monetary Fund (IMF)
South Africa is a founding member of the IMF. South Africa is also one of 40 participants that have ratified the IMF’s expanded and amended New Arrangements to Borrow (NAB), to which South Africa committed a maximum SDR340 million during the five-year period from 2012 to 2017, and was called upon to lend a total of SDR 90.2 million (R1.4 billion). South Africa has renewed its membership as a participant in the NAB for the five-year period from 2017 until 2022 and has renewed its commitment of SDR340 billion. As of February 22, 2016, South Africa’s quota at the IMF was of 3.1 billion SDRs.
South Africa is one of the 35 participants with commitments to the IMF’s 2012 Bilateral Borrowing Agreements (BBAs). South Africa committed US$2 billion to the 2012 BBAs. In October 2017, South Africa migrated to the IMF’s 2016 BBAs, to which it again committed US$2 billion (SDR2.8 billion).
South Africa also contributes funds to the Poverty Reduction and Growth Trust (PGRT), the IMF’s instrument for financial support to low-income countries (LICs).
On December 18, 2018, the IMF’s managing director and chairwoman, Christine Lagarde, met with President Ramaphosa in South Africa.
World Bank
South Africa is a founding member of the World Bank Group, which comprises the International Bank for Reconstruction and Development (IBRD), the International Development Association (IDA), the International Finance Corporation (IFC) and the Multilateral Investment Guarantee Agency.
General Agreement on Tariffs and Trade
South Africa is a founding member of the General Agreement on Tariffs and Trade (GATT), participated in the Uruguay Round of Multilateral Trade Negotiations and acceded to the Marrakesh Agreement that established the World Trade Organization (WTO) in 1994. It is also part of the generalized system of preferences of Canada, the European Union (EU), Japan, Norway, Russia, Switzerland, Turkey and the US.
South Africa is party to the Economic Partnership Agreement with the European Union, the Southern Africa Customs Union, the Trade, Development and Cooperation Agreement; the EFTA-SACU Free Trade Agreement, the Southern Common Market (Mercosur) PTA and the Trade and Investment Framework Agreement.
Organization for Economic Cooperation and Development
South Africa enjoys a strong partnership with the Organization for Economic Cooperation and Development (OECD) and participates in numerous programs and committees. South Africa is a signatory to the Convention on Combating Bribery of Foreign Public Officials in International Business Transactions, and part of the Mutual Acceptance of Data system and has played a key role in the establishment of the African Tax Administrators Forum.
Group of 20 (G20)
South Africa is a member of the Group of 20 and is also a member of the Financial Stability Board (FSB), a structure responsible for setting standards and monitoring the progress of financial regulation globally.
BRICS
South Africa became a member of BRICS in December 2010, and has participated in all subsequent summits.
Commonwealth
In 1994, South Africa re-joined the Commonwealth. South Africa’s participation is limited to promoting economic, social and cultural cooperation and enhancing democracy through the Commonwealth Heads of States and Ministers’ meetings.
Public Health
South Africa has a well-established health sector which comprises 8.9% of GDP (including private sector expenditure). There are over 4,000 public health facilities, including approximately 400 hospitals throughout the Republic. Public health spending was approximately R206.6 billion in the 2017/18 fiscal year (including the school nutrition program and training of medical professionals), slightly less than private health spending (R211billion).
Minister of Health Dr Aaron Motsoaledi, was appointed in 2009, and has overseen the realization of various achievements in the health sector, including among others, improved life expectancy and reduction in child and maternal mortality. For the period 2013 to 2016, life expectancy has increased from an estimated average of 62.2 years to 63.8, under-five mortality rate declined from 41 deaths to 34 deaths per 1000 live births, infant mortality rates declined from 28 deaths to 25 deaths per 1000 live births, and maternal mortality decreased from 165 deaths to 152 deaths of pregnant women per 100 000 live births. Contributing to the decline in mortality rates are increased access to anti-retroviral treatment through universal test and treat, the introduction of GeneXpert, a new TB diagnostic tool, and the introduction of dual and triple therapy which drastically reduced the mother-to-child HIV transmission rate to 1.3% in 2016/17.
HIV, AIDS and TB
Stats SA estimates the average life expectancy in South Africa for females to be 67.3 years, and for males to be 61.1 years. However, it should be noted that life expectation estimates vary, primarily due to differences in assumptions about the rapidity with which the HIV epidemic will spread and the morbidity and mortality of the disease.
| ● | The socio-economic impact of the HIV and AIDS epidemic on South Africa is significant and the National Government has made the curtailment and treatment of this disease a high priority. This, along with the treatment and prevention of TB, is part of a multi-pronged strategy to improve public health services which also includes hospital revitalization, increasing the number of health professionals in the public sector, the introduction of new generation child vaccines, and improved infectious and non-communicable disease control programs. |
| ● | A multi-sectoral approach aims to improve prevention programs and mitigate the impact of AIDS-related morbidity and mortality. The National Strategic Plan for HIV, TB and STIs 2017-2022 (launched on March 31, 2017, by the then Deputy President Cyril Ramaphosa) aims to build on achievements made in HIV, TB and STI prevention, treatment and care and address social and structural barriers that increase vulnerability to HIV, TB and STI infection and increase protection of human rights. Some of the key objectives of this plan include; |
| ● | Reducing new HIV infections from 270,000 to less than 100,000 per year. |
| ● | Reducing new tuberculosis (TB) infections from 450,000 to less than 315,000 per year. |
| ● | Reaching the 90–90–90 targets—whereby 90% of people living with HIV know their HIV status, 90% of people who know their HIV positive status are accessing treatment and 90% of people on treatment have suppressed viral loads—by 2020. |
Spending on HIV and AIDS has grown rapidly to around R34.9 billion per annum (including foreign donor contributions) in 2017/18, of which R18.1 billion came from the HIV and AIDS conditional grant to provincial departments of health. There is some recent evidence that widespread ART treatment is beginning to turn around national mortality and life expectancy indicators. According to StatSA’s 2018 mid-year population estimates, the number of people living with HIV has increased over the past decade from 5.3 million in 2008 to 7.5 million in 2018 but the number of HIV related deaths has been on a constant decline from 248,208 to 116,110 over the same period.
Quality of care
Increasing focus has been placed on improving the quality of the public health sector through the establishment of Office of Health Standards and Compliance (OHSC). OHSC is mandated to monitor and enforce compliance with health establishments with norms and standards prescribed by the Minister of Health. The Office is also mandated to consider and investigate complaints relating to the quality of the public sector. Other initiatives such as the Ideal Clinic programme aim to raise the standard of primary healthcare facilities in the country.
National Health Insurance (NHI)
NHI is the South African government’s chosen path towards achieving universal coverage, equitable access and improved quality of health care for all. Substantial changes are envisaged in both the public and private health sectors, particularly in terms of the way these are financed. Key to this reform is establishing an NHI Fund, which will pool funding for healthcare and purchase services from both public and private providers on behalf of the whole population.
It is being implemented in phases from 2012 over a 14-year period. The first phase involves improving primary health care services in rural areas and under-served communities through the ideal clinic programme and an expanded programme of hospital construction and revitalization. In the current second phase, the government plans to establish an NHI Fund and the NHI Bill, which establishes this fund is likely to be introduced in Parliament during 2019.
THE SOUTH AFRICAN ECONOMY
Overview
South Africa has the second largest economy in Sub-Saharan Africa in terms of total GDP and accounted for over 20% of the aggregate GDP of Sub-Saharan Africa during 2017. A stable and transparent macroeconomic framework, a well-developed financial sector and resilient institutions have underpinned long-term economic stability.
South Africa has a robust regulatory environment, openness to trade, a floating exchange rate, a credible inflation targeting regime and sound institutions, strong investor protection and an independent judiciary. The country has a mature and accessible legal system, providing certainty and respect for the rule of law.
South Africa is resource rich. It is the world’s largest producer of platinum and chromium and holds the world’s largest known reserves of manganese, platinum group metals, chromium, vanadium and alumino-silicates. The economy includes sophisticated finance, wholesale and retail trade, catering and accommodation sectors, as well as a developed manufacturing sector. Financial markets are liquid and both equities and government bonds are actively traded by domestic and international investors.
The World Economic Forum Global Competitiveness Report 2018 ranks South Africa 67th out of 140, dropping by 5 places from the 2017 survey. South Africa continues to rank favourably for financial market development, large market size and good infrastructure. South Africa has a sophisticated banking sector with major footprint in Africa. It is the continent’s financial hub, with the Johannesburg Stock Exchange (JSE) being Africa’s largest stock exchange by market capitalisation.
With the most developed industrial and financial capabilities on the African continent, South Africa plays an important role in regional policies, markets, finance and infrastructure and has an attractive position as the gateway into Africa. Outwardly oriented South African companies are among the largest sources of foreign direct investment (FDI) in Africa and the country’s development finance institutions are playing an increasing role in the funding of regional infrastructure investments. According to the United Nations Conference on Trade and Development’s (UNCTAD) World Investment Report 2018, outward FDI by South African firms increased by 64% to US$7.4 billion in 2017 as retailers expand to Namibia and one of SA’s largest banks opens more branches across the continent.
The legacy of apartheid era politics and economics is still felt today. South Africa aims to achieve higher levels of inclusive growth that raises employment and reduces inequality. The poor are better off in absolute terms under South Africa’s new constitutional dispensation, thanks in large part to government’s social spending.
The medium-term expenditure framework (MTEF) has committed public resources of R5.9 trillion between 2018 and 2020. Of this amount, R3.3 trillion or 56.2% will be allocated to education, health, the provision of water and electricity services, and social grants. Expenditure on social grants will increase faster than inflation to protect the poor and to compensate partially for an increase in value-added tax. A study published in February 2015 by the World Bank’s Poverty Global Practice found that South Africa’s fiscal system lifted some 3.6 million individuals out of poverty when measured as those living on less than $2.50 per day.
However, income inequality remains high even after progressive fiscal policy, due in large part to high unemployment. The Gini coefficient, which is a measure of economic inequality where 0 indicates no inequality and 1 absolute inequality, was equal to 0.68 for South Africa in 2015, among the highest in the world. The World Bank’s fiscal incidence study estimated that South Africa’s fiscal policy reduced the Gini coefficient by almost a quarter in 2010.
Labor and Employment
Unemployment, and youth unemployment in particular, remains a critical challenge to reducing poverty and inequality. Only 43.1% of the adult population (ages 15 to 64) are employed, either in the formal or informal sector. Although formal sector non-agricultural employment surpassed the levels of employment last seen prior to the global financial crisis of 2008, gains have not kept pace with the growth of the working age population, leaving a structural employment backlog. Youth unemployment is particularly high: as of September 2018, the unemployment rate for 15-24 year olds was 52.8%, with young people below the age of 25 accounting for 22.7% of the unemployed.
Patterns of unemployment reflect the effects of the apartheid system on income, settlements and education. As of September 2018, the unemployment rate among the economically active white population was 7.1% (from 7.6% in September 2017), whereas the unemployment rate among the economically active black population was steady at 31.1%.
The impact of slowing economic growth on employment has been particularly large for vulnerable groups. Unemployment is higher for the less educated, women and individuals from more rural provinces.
The October 2018 Jobs Summit resulted in a major framework agreement setting out 20 action plans aimed at boosting job creation, the retention of jobs and economic growth, underscoring the importance of effective partnerships between the public and private sectors and civil society. The primary aim of the agreement is to create an estimated 275,000 jobs annually. The principle strategies underpinning the process includes investment promotion, upgrading industrial capacity, upgrading skills and education, and developing infrastructure amongst others.
GDP growth is expected to recover slowly, reaching 2.3% by 2021. Agriculture and mining are expected to return to moderate growth, while business and consumer confidence are expected to improve gradually in the medium-term. The resolution of long-standing policy issues in recent months, such as the approval of the new mining charter, will likely support investment particularly in the mining and energy sectors.
The economic stimulus and recovery plan announced by President Ramaphosa in September 2018 seeks to focus public spending in areas that can grow the economy, create jobs, accelerate necessary growth-enhancing reforms, promote infrastructure development, and tackle problems in education and healthcare – whilst maintaining the expenditure ceiling commitments of government and stabilising debt as a percentage of GDP.
Government has reprioritised spending of R15.9 billion towards infrastructure programmes, supporting industrialisation, and the Expanded Public Works Programme. On October 24, 2018, Minister of Finance Tito Mboweni announced that over the next three years, public infrastructure expenditure is estimated to be R855.2 billion, of which state-owned companies alone account for R370.2 billion. To improve the delivery of this spending, Minister Mboweni announced the establishment of an Infrastructure Fund. The Fund will work to support projects with “blended” financing and increase public infrastructure efficiency. An additional R16.5 billion of spending will be allocated to various programmes, including funding to restore capacity at the South African Revenue Service.
Arising from the Presidential Investment Summit, held in October 2018, investment commitments of $35 billion (R516bn) were received as part of the plan to attract $100 billion over the next five years to boost the country’s economy. Approximately $10 billion were pledged by Saudi Arabia, $10 billion by the United Araba Emirates and $15 billion from China. The President also appointed a team of investment envoys - bankers, business people, economists and former ministers - to attract new investors from the world’s financial capitals.
Government is also working on improving governance and financial management in state-owned companies as well as in national, provincial and local government departments.
The National Development Plan 2030 outlines the long-term vision for South Africa. A core element of this vision is a commitment to strong, sustained and inclusive economic growth to sharply reduce unemployment, poverty and inequality. In 2019, Government will publish the MTSF which sets the NDP’s priorities for the next 5 years.
GDP
In the first three quarters of 2018 GDP growth eased to 0.8% compared with 1.3% in the same period the prior year. The economy fell into technical recession in the first half of 2018, as a result of production losses in the agriculture and mining sectors, while investment growth remained subdued and imports accelerated. GDP growth rebounded to 2.2% q/q (saar) in the third quarter, primarily driven by a recovery in the manufacturing, transport, finance and business services sectors. The manufacturing sector was supported by a R13bn increase in inventories.. From the expenditure side, household expenditure growth rebounded, while export growth doubled, attributed to rising mining, manufacturing and agriculture exports.
The primary sector contracted by 1.9% year-on-year in the first three quarters of 2018, following an 8.5% expansion in the comparable period in 2017. The decline in the sector was driven by a contraction in production in both the agricultural and mining sectors. Growth in the agricultural sector contracted by 3.2% in the three quarters of 2018 after expanding by 21.3% in the first three quarters of 2017. The impact of severe drought conditions in the Western Cape and the delayed harvesting of summer crops resulted in an 5.4% year-on-year contraction in the sector in the first half of the year. Agricultural production growth rebounded in 3Q2018 underpinned by later-than-usual harvesting of summer field crops, due to a late start to the planting season earlier in the year. In addition, soft citrus producers reached record export levels in 2018 despite concerns over water availability in key growing regions.
Growth in mining sector output in the first three quarters of 2018 decreased by 1.4% compared to an expansion of 4.5% in the corresponding period in 2017. Global commodity prices and the related fears of US-China trade wars have tempered growth, hitting most mining categories such as Platinum Group Metal’s (PGM), iron-ore, gold, copper and nickel. Gold production has struggled in particular, declining by 13% in the first 10 months of 2018, weighed by long term constraints and more recently strike activity. Recent efforts to reduce regulatory uncertainty are expected to support growth, but structural factors continue to constrain growth as firms contemplate restructuring plans and intentions to retrench workers.
Contrastingly, growth in the tertiary sector has held up well, largely contributing positively to GDP growth in the three quarters of 2018. Output in the financial and business services sector - the largest sector in the economy - was 2.2% higher in the three quarters to September (from 1.8% in the same period in 2017), largely driven higher by increased commercial banking activity. Trade, which is the second largest sector in the economy, rebounded from a 0.9% contraction in the first three quarters of 2017 to expand by 0.4% growth in the corresponding period this year. After contracting in the first half of 2018, the trade sector bounced back to positive growth in the third quarter as wholesale and retail trade sales growth improved.
The real gross value added by the secondary sector slowed to 0.4% in the first three quarters of 2018 from 0.8% in the comparable period in 2018, as the contraction in the construction sector outpaced the modest recovery in manufacturing and utilities growth. The construction sector contracted by 1.2% in the first three quarters of 2018 after registering no growth in the first three quarters of 2017. Output growth in the manufacturing and utilities sectors both recovered to 0.9% from contractions of 1.1% and 0.4% in the first three quarters of 2018. Both sectors rebounded in the third quarter with positive growth in manufacturing production driven by basic iron and steel, metal products and machinery; petroleum and chemicals; wood and paper; and motor vehicles.
Based on the expenditure side, real GDP growth in the first three quarters of 2018 was buoyed by household consumption growth. Growth in consumption moderated to 1.9% year-on-year, after expanding by 2.0% in the same period in 2017. Over the period, household spending was driven by a broad-based expansion in expenditure on goods. However, real expenditure on services slowed from 2.7% in the first three quarters in 2017 to 1.7% in the comparable period in 2018.
Gross fixed capital formation in the first three quarters to September contracted 0.3% year-on-year following a 0.7% expansion in the same period last year. Growth in private sector investment fell by 0.3% compared to a 1.3% expansion in the first three quarters of 2017. Business confidence has improved somewhat, but remains volatile. The /Rand Merchant Bank/Bureau of Economic Research Business Confidence Index (RMB/BER) surged by 11 points from 34 in the fourth quarter of 2017 to 45 in the first quarter of 2018as a result of positive sentiment surrounding changes in political leadership. Sentiment fell back to 39 points in the second quarter and to 38 in the third quarter of 2018 as overall business activity remained weak. The rate of contraction in real fixed investment by government moderated to 0.2% in the first three quarters of 2018, following a 0.7% contraction during the same period in 2017. Public corporation investment had contracted by 0.2% in the first three quarters in 2017, and remained unchanged in the corresponding period in 2018. Weak investment and subdued productivity growth have slowed the potential pace of GDP growth to an estimated range of between 1.2 and 1.5% in 2018, from 3% at the start of the decade.
Annual real growth in consumption expenditure by the government rose to 1.2% in the first three quarters of 2018, after slowing to 0.7% during the same period in 2017, reflecting an increase in purchases of goods and services and compensation of employees.
Overall, net exports contributed negatively to GDP growth in the first three quarters of 2018 as imports grew faster than exports. Real growth in imports accelerated to 4.9% from 0.7% in the corresponding period of 2017, largely driven by increased imports of machinery, electrical equipment, vehicle and transport equipment, as higher exports required increased imports. Export growth was up 2.8% in the first three quarters of 2018, after declining by 1.5% in the same period in 2017, supported by increased exports for vehicles and transport equipment, pearls, precious & semi-precious stones, mineral products and vegetable products.
At the 2018 Medium-Term Budget Policy Statement, the National Treasury projected GDP growth to slow from 1.3% in 2017 to 0.7% in 2018. This projection is a downward revision compared with the Budget 2018 forecast, where GDP growth was projected at 1.5% in 2018. GDP growth is forecast to improve moderately, reaching 2.3% by 2021. The downward revisions to the economic forecast reflect weak outcomes in the first half of the 2018, a slower than expected improvement in domestic investment, and a lower anticipated trade intensity of global growth.
Household consumption expenditure is expected to grow by 1.6 % in 2018, supported by stronger purchasing power in early 2018 and moderate increases in credit extension, despite muted improvements in employment. Over the medium term, growth in household spending is expected to strengthen to 2.6 % by 2021, supported by a modest recovery in wage and employment growth, higher consumer confidence and further improvements in household credit extension.
Growth in gross fixed capital formation has been revised lower from the 2018 Budget, and is now projected to average 1.9 % over the next four years. Low levels of demand and policy uncertainty, as well as low commodity prices have dampened investment. Government has actively worked to improve the investment climate by strengthening governance in state institutions and removing policy bottlenecks in energy and mining.
Elevated policy uncertainty, the financial positions of state-owned enterprises, and the volatility of the rand exchange rate are key domestic downside risks to the economic outlook. However, sustained improvements in confidence, particularly related to the implementation and finalization of outstanding policy issues, may reduce barriers to investment and improve sentiment, presenting an upside risk to the growth outlook. External risks to the growth outlook include rising trade tensions and increased risk aversion, which may prompt capital outflows and exacerbate volatility in financial markets and the exchange rate.
GDP Summary
| | | | | | | | | | | | | | | | | | | |
| | | As of and for the year ended December 31, | | | As of and for
the nine-
month period
ended
September
30, | |
| | | | 2013 | | | | 2014 | | | | 2015 | | | | 2016 | | | | 2017 | | | | 2018(1) | |
| Nominal GDP (millions of Rand) at market prices | | | 3,539,977 | | | | 3,805,350 | | | | 4,051,421 | | | | 4,350,314 | | | | 4,651,785 | | | | 4,804,357 | |
| Real GDP (millions of Rand) at 2010 prices | | | 2,973,175 | | | | 3,028,090 | | | | 3,066,835 | | | | 3,084,174 | | | | 3,124,785 | | | | 3,133,633 | |
| Real GDP Growth (percentages) | | | 2.5 | | | | 1.8 | | | | 1.3 | | | | 0.6 | | | | 1.3 | | | | 0.8 | |
| Population (million) | | | 53.3 | | | | 54.2 | | | | 55.1 | | | | 55.9 | | | | 56.8 | | | | 57.7 | |
| Per Capita GDP (nominal) | | | 66,952 | | | | 71,064 | | | | 74,633 | | | | 79,066 | | | | 83,390 | | | | 252,116 | |
| Per Capita GDP (real) | | | 56,232 | | | | 56,549 | | | | 56,518 | | | | 56,054 | | | | 56,016 | | | | 54,401 | |
��
Note:
(1) First nine months of 2018, seasonally adjusted and annualized.
Sources: SARB and Stats SA
| | | As of and for the year ended December 31, | | | As of and for the nine-month period
ended September 30, | |
| | | 2013 | | | 2014 | | | 2015 | | | 2016 | | | 2017 | | | 2018 | |
| Rand (million) | | | | | | | | | | | | | | | | | | | | | | | | |
| Real GDP at market prices | | | 2,973,175 | | | | 3,028,090 | | | | 3,066,835 | | | | 3,084,174 | | | | 3,124,785 | | | | 4,844,415 | |
| Add: Imports of goods and services | | | 921,356 | | | | 916,155 | | | | 965,505 | | | | 929,014 | | | | 943,848 | | | | 979,475 | |
| Total supply of goods and services | | | 3,894,531 | | | | 3,944,245 | | | | 4,032,341 | | | | 4,013,188 | | | | 4,068,632 | | | | 5,823,891 | |
| Less: Exports of goods and services | | | 852,994 | | | | 883,501 | | | | 908,257 | | | | 917,039 | | | | 916,150 | | | | 931,362 | |
| Total goods and services available for domestic expenditure | | | 3,041,537 | | | | 3,060,744 | | | | 3,124,083 | | | | 3,096,148 | | | | 3,152,482 | | | | 4,892,529 | |
| Domestic Expenditure | | | | | | | | | | | | | | | | | | | | | | | | |
| Final consumption expenditure by households | | | 1,803,625 | | | | 1,818,511 | | | | 1,851,399 | | | | 1,864,370 | | | | 1,906,114 | | | | 1,932,412 | |
| Final consumption expenditure by general government(1) | | | 609,383 | | | | 619,681 | | | | 617,713 | | | | 629,495 | | | | 633,445 | | | | 641,957 | |
| | | As of and for the year ended December 31, | | | As of and for the
nine-month period
ended September 30, | |
| | | | 2013 | | | | 2014 | | | | 2015 | | | | 2016 | | | | 2017 | | | | 2018(3) | |
| Total Final consumption expenditure(1) | | | 2,413,008 | | | | 2,438,192 | | | | 2,469,113 | | | | 2,493,864 | | | | 2,539,559 | | | | 2,574,3691 | |
| Gross fixed capital formation | | | 614,502 | | | | 618,787 | | | | 640,018 | | | | 613,711 | | | | 616,049 | | | | 613,429 | |
| Change in inventories | | | 21,889 | | | | 6,180 | | | | 19,000 | | | | (7,798 | ) | | | (1,846 | ) | | | 4,130 | |
| Residual item(2) | | | (7,862 | ) | | | (2,414 | ) | | | (4,047 | ) | | | (3,634 | ) | | | (1,278 | ) | | | 2,489 | |
| Total gross domestic expenditure | | | 3,041,537 | | | | 3,060,745 | | | | 3,124,084 | | | | 3,096,143 | | | | 3,152,484 | | | | 3,188,415 | |
| Real GDP (at 2010 prices) | | | 2,973,175 | | | | 3,028,090 | | | | 3,066,835 | | | | 3,084,174 | | | | 3,124,785 | | | | 4,844,415 | |
Notes:
| (1) | Consumption expenditure by general government includes current expenditure on salaries and wages and on goods and other services of a non-capital nature of the general departments (not business enterprises) of the National Government authorities, provincial government authorities, local government authorities and extra-budgetary institutions. |
| (2) | Represents the difference between the calculation of GDP according to the expenditure and production method. |
| (3) | First half of 2018, seasonally adjusted and annualized. Source: SARB and Stats SA. |
GDP and Expenditures as Percentage of Real GDP (at constant 2010 prices)
| | | As of and for the year ended December 31, | | | As of and for the nine-
month period ended
September 30, | |
| | | | 2013 | | | | 2014 | | | | 2015 | | | | 2016 | | | | 2017 | | | | 2018(3) | |
| Real GDP at market prices | | | 100.0 | | | | 100.0 | | | | 100.0 | | | | 100 | | | | 100 | | | | 100 | |
| Add: Imports of goods and services | | | 30.2 | | | | 30.3 | | | | 31.5 | | | | 30.1 | | | | 30.2 | | | | 20.2 | |
| Total supply of goods and services | | | 130.2 | | | | 130.3 | | | | 131.5 | | | | 130.1 | | | | 130.2 | | | | 120.2 | |
| Less: Exports of goods and services | | | 28.7 | | | | 29.2 | | | | 29.6 | | | | 29.7 | | | | 29.3 | | | | 19.2 | |
| Total goods and services available for domestic expenditure | | | 102.3 | | | | 101.1 | | | | 101.9 | | | | 100.4 | | | | 100.9 | | | | 101.0 | |
| Domestic Expenditure | | | | | | | | | | | | | | | | | | | | | | | | |
| Final consumption expenditure by households | | | 60.7 | | | | 60.1 | | | | 60.4 | | | | 60.4 | | | | 61.0 | | | | 39.9 | |
| Final consumption expenditure by general government(1) | | | 20.5 | | | | 20.5 | | | | 20.1 | | | | 20.4 | | | | 20.3 | | | | 13.3 | |
| Total Final consumption expenditure | | | 81.2 | | | | 80.5 | | | | 80.5 | | | | 80.9 | | | | 81.3 | | | | 53.1 | |
| Gross fixed capital formation | | | 20.7 | | | | 20.4 | | | | 20.9 | | | | 19.9 | | | | 19.7 | | | | 12.7 | |
| Change in inventories | | | 0.7 | | | | 0.2 | | | | 0.6 | | | | 0.3 | | | | 0.1 | | | | 0.1 | |
| Residual item(2) | | | 0.3 | | | | 0.1 | | | | 0.1 | | | | 0.1 | | | | 0.0 | | | | 0.1 | |
| Total gross domestic expenditure | | | 102.3 | | | | 101.1 | | | | 101.9 | | | | 100.4 | | | | 100.9 | | | | 65.8 | |
Notes:
| (1) | Consumption expenditure by general government includes current expenditure on salaries and wages and on goods and other services of a non-capital nature of the general departments (not business enterprises) of public authorities. Public authorities include National Government authorities, provincial government authorities, local government authorities and extra-budgetary institutions. |
| (2) | Represents the difference between the calculation of GDP according to the expenditure and production methods. |
| (3) | First nine months of 2018, seasonally adjusted and annualized. |
Sources: SARB and Stats SA
Gross Domestic Expenditure (GDE)
Real growth in gross domestic expenditure was up 1.6% year-on-year in the first three quarters of 2018, mainly led by buoyant household demand, growth in government expenditure and exports.
Real growth in household consumption expenditure increased by 1.9% year-on-year in the first three quarters of 2018, after rising by 2.0% in the same period in 2017. Credit extended to households augmented household income, and supported spending in an environment of slow economic growth, higher fuel prices and rising unemployment. The ratio of household debt to nominal disposable income has steadied at around 71% in the third quarter of 2018 as disposable income has grown at roughly the same pace as debt. Household savings rates remained largely constant, reaching 1.5% as a proportion of GDP in the third quarter of 2018, from 1.6% in 2017. Household net worth as a proportion of disposable income continues to fall, reaching 364% in the third quarter of 2018. Nominal wages per worker grew by 4.5% in the first half of 2018, as consumer price inflation averaged 4.3%..
Growth in household demand reflected a broad-based improvement across all goods components. For the first three quarters of 2018, real spending growth in durable goods remained buoyant, up 4.9% compared to the same period in 2017, mainly reflecting strong demand in the first half of 2018; but by the third quarter, this growth rate slowed to 0.2% year on year. Semi-durable goods grew by 3.5% year-on-year, rebounding from 1.1% during the first three quarters of 2017, while growth in non-durables was 1.0% higher in the first three quarters of 2018. Consumption growth by households during the first three quarters of 2018 was mainly driven by spending on furnishing, household equipment and maintenance (6.0%), clothing and footwear (3.7%) health (4.7%) and miscellaneous goods and services (2.4%). Larger expenditure categories such as transport, food and beverages and utilities also showed positive growth during the period under consideration, supported by lower food inflation and a stronger rand exchange rate at the beginning of the year. Real spending by households on services moderated to 1.7% year-on-year in the first three quarters of 2018, after rising by 2.7% in the same period of 2017, as spending on transport stagnated and communication moderated.
Real consumption by government increased in the first three quarters of 2018, mainly driven by an increase compensation for employees and spending on goods and services in the first and third quarter of 2018. Consumption growth by general government consistently contributed positively to overall GDP growth in the first three quarters of 2018.
South Africa has experienced an extended period of weak investment as a result of low levels of demand and prolonged policy uncertainty. Residential investment contracted by 2.9% in the first three quarters of 2018, compared to a 1.2% rise over the same period in 2017, but there was an improvement in non-residential building which rose by 2.1% in the first three quarters of 2018, following a contraction of 6.4% compared to the same period in 2017. Growth in transport equipment slowed to 1.7% in the first three quarters of 2018, while investment in manufacturing and other equipment contracted by 3.1% over the same period. The capital stock in manufacturing continued to decline in 2017, although this was offset by positive growth in capital stock of the tertiary sectors.
Principal Sectors of the Economy
The following two tables set forth real gross value added and the percentage increase in gross value added for the periods indicated.
Real Gross Value Added by Sector (at constant 2010 prices)
| | | As of and for the year ended December 31(1) | | | Growth percentage contribution | |
| | | | 2013 | | | | 2014 | | | | 2015 | | | | 2016 | | | | 2017 | | | | 2018(2) | | | | 2018(1) | |
| Agriculture, forestry and fishing | | | 71,143 | | | | 75,982 | | | | 71,153 | | | | 63,869 | | | | 75,185 | | | | 61,559 | | | | (0,1 | ) |
| Mining and quarrying | | | 230,772 | | | | 226,791 | | | | 233,745 | | | | 224,016 | | | | 234,305 | | | | 171,112 | | | | (0.1 | ) |
| Manufacturing | | | 381,173 | | | | 382,498 | | | | 381,149 | | | | 384,615 | | | | 384,036 | | | | 285,348 | | | | (0.1 | ) |
| Electricity, gas and water | | | 68,289 | | | | 67,622 | | | | 66,479 | | | | 64,918 | | | | 65,018 | | | | 48,654 | | | | 0.0 | |
| Construction | | | 102,818 | | | | 106,403 | | | | 108,362 | | | | 109,524 | | | | 109,185 | | | | 80,597 | | | | 0.0 | |
| Trade, catering and accommodation | | | 408,968 | | | | 414,826 | | | | 422,502 | | | | 429,641 | | | | 426,935 | | | | 305,777 | | | | 0.1 | |
| Transport, storage and communication | | | 250,129 | | | | 258,906 | | | | 262,498 | | | | 264,599 | | | | 268,494 | | | | 200,086 | | | | 0.1 | |
| Finance, insurance, real estate and business services | | | 576,707 | | | | 592,352 | | | | 607,581 | | | | 621,798 | | | | 633,413 | | | | 484,637 | | | | 0.5 | |
| General government services | | | 450,348 | | | | 464,664 | | | | 469,224 | | | | 475,795 | | | | 477,386 | | | | 359,934 | | | | 0,1 | |
| Personal services | | | 159,530 | | | | 162,367 | | | | 164,047 | | | | 166,465 | | | | 168,459 | | | | 128,721 | | | | 0.1 | |
| Gross value added at basic prices | | | 2,699,878 | | | | 2,752,410 | | | | 2,786,739 | | | | 2,805,240 | | | | 2,842,416 | | | | 2,126,425 | | | | 0.8 | |
Note:
(1) Millions of Rand.
(2) The seasonally unadjusted nine months of 2018 compared to the first nine months of 2017.
Source: Stats SA.
Percentage Growth in Real Gross Value Added by Sector
(at constant 2010 prices)
| | | For the year ended December 31, | | | As of and for the nine-month period ended June 30, | |
| | | | 2013 | | | | 2014 | | | | 2015 | | | | 2016 | | | | 2017 | | | | 2018(1) |
| Agriculture, forestry and fishing | | | 4.5 | | | | 6.8 | | | | (6.4 | ) | | | (10.2 | ) | | | 17.7 | | | | (8.9 | ) |
| Mining and quarrying | | | 4.0 | | | | (1.7 | ) | | | 3.1 | | | | (4.2 | ) | | | 4.6 | | | | (4,3 | ) |
| Manufacturing | | | 1.0 | | | | 0.2 | | | | (0.4 | ) | | | 0.9 | | | | (0.2 | ) | | | (2.5 | ) |
| Electricity, gas and water | | | (0.6 | ) | | | (1.0 | ) | | | (1.7 | ) | | | (2.3 | ) | | | 0.2 | | | | 2.7 | |
| Construction | | | 4.6 | | | | 3.5 | | | | 1.8 | | | | 1.1 | | | | (0.3 | ) | | | (3.7 | ) |
| Trade, catering and accommodation | | | 2.0 | | | | 1.4 | | | | 1.9 | | | | 1.7 | | | | (0.6 | ) | | | 1.3 | |
| Transport, storage and communication | | | 2.9 | | | | 3.5 | | | | 1.4 | | | | 0.8 | | | | 1.5 | | | | 2.8 | |
| Finance, insurance, real estate and business services | | | 2.6 | | | | 2.7 | | | | 2.6 | | | | 2.3 | | | | 1.9 | | | | 6.7 | |
| General government services | | | 3.2 | | | | 3.2 | | | | 1.0 | | | �� | 1.4 | | | | 0.3 | | | | 2.3 | |
| Personal services | | | 2.6 | | | | 1.8 | | | | 1.0 | | | | 1.5 | | | | 1.2 | | | | 2.9 | |
| Gross value added at basic prices | | | 2.6 | | | | 1.9 | | | | 1.2 | | | | 0.7 | | | | 1.3 | | | | 2.1 | |
Note:
(1) The seasonally unadjusted first nine months of 2018 compared to the first nine months of 2017.
Source: Stats SA.
Finance, Insurance, Real Estate and Business Services
The finance, insurance, real estate and business services sector is the largest in the South African economy by Gross Value Added (GVA), accounting for 20.5% of the total economy.
Growth in real value added by the finance, insurance, real-estate and business services sector edged up to 6.7% in the first three quarters of 2018, reflecting broadly flat growth in net interest income and premium income in the banking and insurance sectors, respectively.
The sector’s contribution to growth in overall gross domestic production accordingly increased slightly from 0.9% during the first three quarters of 2017 to 1.1% during the same period of 2018.
According to the Quarterly Employment Statistics (QES) surveys published by Stats SA, which surveys enterprises registered for income tax, the finance, insurance, real estate and business services sectors employed 2,232,334 persons in the quarter ended December 2017 and 2,231,709 persons in the third quarter of 2018 – roughly 22.9% of the total workforce. The drop in employment in the sector reflects a decline in employment in the banking industry as well as the legal, bookkeeping and auditing activities.
Trade, Catering and Accommodation
This sector comprises wholesale and retail trade and allied services, catering and accommodation services and motor trade and repair services. Activities include the resale of new and used goods and the rendering of repair services. Real value added growth in the sector rose to 0.4% for the first three quarters of 2018, a recovery from the contraction of 0.9% over the same period in 2017. Growth was driven by improvement in the retail trade sector which recorded growth of 1.5% for the year to date, which offset a sharp 6.1% decline in accommodation industries, due to a contraction in the income generated by hotels, guesthouses and others.
Despite the challenging trading conditions in the trade, catering and accommodation sector owing to weak local and international demand, formal employment in the sector has remained relatively resilient, constituting 22% of total employment. According to the latest QES, employment in the trade, catering and accommodation sector grew by 1.2% year-to-date compared to the corresponding period in 2017.
Tourism
Catering and accommodation services growth is closely linked to the growth of the tourism sector. The gross direct value added of the tourism industries for South Africa amounted to R114,634 million (or 3.0% of total GVA generated) in 2017 and R120,040 million (or 4.7% of total GVA generated) in 2016. The tourism sector directly employed 722,013 persons in 2017, an increase of 4. 6% or 31,752 employees compared with 2016. The tourism share of total employment increased from 2016 (4.4%) to 2017 (4,.5%).
A downward trend has been observed for tourist arrivals from South Africa’s leading overseas markets. Arrivals from key source markets such as the UK (South Africa’s largest overseas market, accounting for 19.6%), China and India have declined in recent years. Anecdotal evidence suggests that continued challenges in obtaining visas and uncertainty over unabridged birth certificates for minors have hampered growth in arrivals from these key markets. A recent relaxation in visa requirements for tourists, in particular the amendments to the requirements for travelling with minors, could see an improvement in tourist arrivals in 2019/20. This, coupled with renewed marketing efforts aimed at stimulating domestic tourism is expected to boost growth in the catering and accommodation services sector.
Manufacturing
Manufacturing is South Africa’s third largest sector, constituting approximately 13.2% of GDP in 2017. The sector is a substantial job creator, providing employment for approximately 1.2 million people or 12.2% of total employment.
Real valued added in the manufacturing sector declined by 0.2% during 2017, contributing -0.02 percentage points to overall GDP growth. However, real value added in 3Q2018 increased by 7.5%q/q (saar) contributing 0.9 percentage points to 3Q2018 GDP, making manufacturing the largest contributor to GDP growth. Production has improved in 2018 increasing by 1.0% over the first three quarters of 2018 compared to the same period in 2017. The increase was driven by food and beverages, metals products and motor vehicles and parts which increased by 4.6%, 0.9% and 3.0%, respectively.
Part of the recovery was driven by improved external demand, with a 7.1% increase in exports in the nine months to September 2018 compared to the same period in 2017. The improvement in export performance can mainly be attributed to base metals and food and beverages. Imports also increased 6.9% over the same period.
Despite the improvement in production, manufacturing capacity utilization remained low at 80.6% in the first half of 2018, remaining close to the low ten year average of 80.9. The erosion of capital stock since 2009 continues and is likely to constrain the long-term growth of the sector.
Composition of Manufacturing Sector Growth
| | | | Weights | | | For the nine months ended September | |
| | | | | | 2017 | | | 2018 | |
| Food and beverages | | | 25.2 | % | | | 0.8 | | | | 4.6 | |
| Petrochemicals | | | 24.0 | % | | | (5.1 | ) | | | (0.7 | ) |
| Metals products | | | 18.7 | % | | | 4.0 | | | | 0.9 | |
| Wood and paper | | | 11.6 | % | | | (3.5 | ) | | | (1.4 | ) |
| Motor vehicles and parts | | | 6.9 | % | | | (2.2 | ) | | | 3.0 | |
| Glass and non-metallic | | | 3.9 | % | | | (3.6 | ) | | | 2.0 | |
| Clothing and textiles | | | 3.3 | % | | | (4.2 | ) | | | (3.5 | ) |
| Furniture and other manufacturing | | | 3.2 | % | | | (0.9 | ) | | | 2.2 | |
| Electrical machinery | | | 1.7 | % | | | (8.1 | ) | | | (7.1 | ) |
| Radio and TV | | | 1.6 | % | | | (0.5 | ) | | | (10.4 | ) |
| Total | | | 100.0 | % | | | (1.3 | ) | | | 1.0 | |
Source: Stats SA.
Transport, Storage and Communications
The transport, storage and communications sector grew by 1.2% during the first three quarters of 2018 and contributed 0.5 percentage points to GDP growth during that period. The sector represented 10.0% of gross value added for the first three quarters of 2018.
Transport and Storage
South Africa’s modern and extensive transport and logistics system, which is coordinated by the Department of Transport, plays an important role in the national and regional economies, transporting freight for export and domestic use, as well as enabling the movement of people within and between cities and rural areas. The transport system comprises airports, sea ports, roads, rail and public transport networks. Increased activity in land transport, in particular freight and passenger rail transportation, supported growth in the sector in Q3 2018.
Transnet, the horizontally integrated state-owned company, plays a central role in freight transportation through its rail, port and pipeline operations. The Passenger Rail Agency of South Africa (PRASA) provides both intercity and intra-city rail services. The South African National Roads Agency Limited (SANRAL) is responsible for the upgrading and expansion of the national road system while provincial and municipal governments are responsible for secondary roads. See “Public Finance—Public Enterprises.”
The South African road network and national road network comprise approximately 750,000 km of roads and 21,403 km of roads, respectively. The national and local railway network consists of approximately 20,824 km of track and is divided into ten geographical areas under the control of Transnet Freight Rail (TFR). PRASA is planning to invest R173 billion in new infrastructure over between 2019 and 2029 A total of 580 of these trains will be manufactured in South Africa.
The commercial airport infrastructure in South Africa consists primarily of nine airports which are owned and operated on a commercial basis by the Airports Company of South Africa Limited (ACSA). South Africa’s three major international airports are Johannesburg’s OR Tambo, Cape Town International and Durban’s King Shaka.
Transnet, is the custodian of rail, ports and pipelines, responsible for delivering reliable freight transport and handling services. Transnet National Ports Authority (National Ports Authority) operates as a landlord port authority, managing, controlling and administering the South African port system on behalf of the state. The National Ports Authority owns and manages the eight ports within South Africa and its tariffs are regulated by the National Ports Regulator. Approximately 98% of South Africa’s exports are conveyed by sea. Transnet Port Terminals, along with some private sector players, is responsible for the operations at ports.
The pipeline network is responsible for the transport of more than 85% of refined fuel and gas products. The business is regulated by the National Energy Regulator of South Africa (Nersa).
The Economic Regulation of Transport Bill is currently being revised after public comments were received. The Bill will contribute to competitive pricing and improved service quality in transport. Administered transport prices will be reviewed to reduce the cost of doing business.
Communications
The communications sub-sector consists of postal services and telecommunications services. Growth in the real output of the telecommunications subsector continued to benefit from technological innovations and attractive data promotions.
In a report by the International Telecommunication Union, in 2017 there were 91,878,275 mobile cellular subscriptions in South Africa, an increase from 82,412,880 in 2016. There were 1,698,360 fixed broadband subscriptions, an increase from 1,150,770 in 2016. There were 3,629,141 fixed telephone subscriptions in 2017, a decrease from 4,522,850 in 2016.
Fixed-line services are dominated by Telkom SA Limited (Telkom). Telkom shareholders are (i) the National Government, with a direct holding of 39.8% (ii) Public Investment Corporation, with a direct holding of 10.9%, (iii) Telkom Treasury 2.0% and (iv) Free Float 47.3%. The remaining 47.3% of Telkom’s issued shares are in free float. Telkom is listed on the Johannesburg Stock Exchange (JSE). For the financial year ended March 31, 2018 Telkom’s Group operating revenue was R41.02 billion (40.97 billion in 2017) and profit after tax was R3.158 billion (R3.907 billion in 2017). It is one of the largest companies in South Africa and together with its subsidiaries and joint ventures forms one of the largest communications services providers on the African continent.
The second national fixed-line operator is Neotel. There are five licensed mobile operators: Vodacom, MTN, Cell-C, Virgin Mobile and Telkom Mobile. The telecoms sector has seen quite a few developments in 2016, with many firms attempting to invest in new technologies, and become more cost competitive in terms of the cost of data.
Cellular telephony is among the fastest growing sub-sectors of the South African economy with Vodacom, MTN and Cell C investing funds in improving the quality of their networks and establishing LTE sites. Fibre investment is also growing rapidly, with a number of players entering this space. The number of fibre broadband providers has grown rapidly with the formation of Openserve and Telkom’s infrastructure business. The move from analogue to digital television has been fast-tracked, the latest position is that government will embark on a retail-driven approach, giving vouchers to indigent households to buy set top boxes from commercial providers rather than continuing with a plan to run the project itself. A significant amount of spectrum in the 2.6GHz and the 70 and 800 MHz bands is available for allocation. In October 2018 the Independent Communications authority of South Africa (ICASA) announced it will release plans to license high-demand radio frequency spectrum by the end of March 2019. They aim to auction batches of radio frequencies for 4G and simultaneously establish a whole sale open access network (WOAN), although, the exact amount that will be dedicated to the WOAN are not yet known. The WOAN will be a new entity that will sell wholesale connectivity to retail service providers.
The South African Post Office Limited (SAPO) is responsible for postal services through the Postal Act and the Postal Services Act 1998. See “Public Finance—Public Enterprises.”
Mining and Quarrying
While South Africa’s economy is now well-diversified, the mining industry continues to play a significant role in the country’s economy despite the longer-term decline in the sector’s relative contribution to GDP and revenue collections. Mining remains a vital sector in terms of job creation, indirect linkages to other industries through upstream procurement and downstream value addition, significant foreign exchange generation and the country’s balance of payments.
In the first three quarters ended September 2018, real value added in the mining sector contracted by 1.4% compared with the same period in 2017, in line with a decline in total production volumes of 1.2%. Over this period, the sector contributed -0.1 percentage points to overall GDP growth of 0.8%. Production remains highly volatile. On a seasonally adjusted and annualised quarterly basis, the sector contracted 8.8% in the third quarter of 2018, following an expansion of 8.1% in the second quarter. Mineral sales increased 2.6% year-on-year in the first nine months of 2018 compared to the same period in 2017, with coal and manganese sales particularly strong, increasing by 11.7% and 41%, respectively. By contrast, gold and iron ore sales declined 14.8% and 7.5%, respectively, over the same period, weighed down in part by a strong US dollar and US-China trade tensions.
According to the QES, the mining sector shed 3,000 jobs to reach 457,000 in the four quarters to September 2018, a decline of 0.7%. The gold mining sector, in particular, consistently shed jobs for eight of the last nine quarters ending September 2018. Employment in the sector will remain under severe pressure as several companies have announced the restructuring or closure of their mining operations.
Of the pressures that weigh on the industry, policy and regulatory uncertainty has been highlighted as the main challenge, contributing significantly to the sector’s underperformance in recent years. The lack of policy direction has in turn frustrated investment in the sector, which has levelled off since 2011, with minimal prospects for improvement in the near future.
Progress has been made in this area, however, as the two main contributors to policy uncertainty have been resolved. Firstly, Cabinet approved the decision of the Department of Mineral Resources to withdraw the Mineral and Petroleum Resources Development Amendment Bill from Parliament, leaving the mining industry to be governed by the Act in its present form while the particular needs of the petroleum sector will be dealt with in separate, dedicated legislation. Secondly, following a renewed public consultation process, the third iteration of the Mining Charter was finalized in September, and is widely considered to reflect a compromise between different industry stakeholders.
Furthermore, relations between the industry and the Department of Mineral Resources have improved in the course of the year, fuelling hope that investor confidence in the sector will improve – one such indicator being the commitment from Anglo American at the Investment Summit of October 2018, to invest R71.5bn in the period up to 2022
The following table sets forth mineral production and sales for the periods indicated.
Mineral Production
| | | | Index of
Production
Volume Including | | | Index of
Production
Volume
Excluding | | | Total Value of
Mineral Sales | | | Total Value of
Mineral Sales | |
| Year | | | Gold(1) | | | Gold(1) | | | Including Gold(2) | | | Excluding Gold(2) | |
| | | | | | | | | | | | | | |
| 2013 | | | | 98.9 | | | | 97.7 | | | | 397,677.90 | | | | 327,691.00 | |
| 2014 | | | | 96.9 | | | | 95.3 | | | | 396,277.60 | | | | 332,928.80 | |
| 2015 | | | | 100.0 | | | | 100.0 | | | | 387,646.70 | | | | 324,946.70 | |
| 2016 | | | | 96.3 | | | | 95.9 | | | | 423,997.90 | | | | 348,506.10 | |
| 2017 | | | | 100.1 | | | | 101.1 | | | | 474,471,40 | | | | 391,535,30 | |
| 2018(3) | | | | 98.0 | | | | 100.8 | | | | 355,463,60 | | | | 303,314,20 | |
Notes:
(1) Base: 2015 = 100.
(2) Rand million.
(3) Rand million, through September 30, 2018.
Source: Stats SA.
Construction
Construction real value added in the sector for the year to the third quarter of 2018 contracted by 1.2% year-on-year as the difficult conditions of 2017 persisted. The weakness in the sector prompted declines in employment growth in the sector. According to the QES, construction sector employment declined by 3.5% year-on-year for the first three quarter of 2018 from a 1.2 % year-on-year increase for the corresponding period in 2017.
The First National Bank/Bureau of Economic Research (FNB/BER) Building Survey shows building activity was generally lower in 2018 due to a combination of continued weakness in residential building activity and a significant slowdown in non-residential activity. This is important because the growth in non-residential activity in the beginning of the year had boosted growth in the building sector.
The prevailing economic environment has unfavourably impacted the non-residential property segment. The latest SARB Quarterly Bulletin shows that growth in credit demand by the real estate sector weakened 3Q2108, while growth in mortgage advances on commercial property moderated from a high of 9.1%y/y in in April 2018 to 7.3% y/y in July. With activity in the non-residential property market mostly influenced by the direction of economic growth, a continued weakness in the sector is expected. Treasury forecasts GDP to increase by only 0.7% in 2018.
Civil Engineering
Investment growth in construction works declined to 2.3% year-on-year for the first three quarters of 2018 from a decrease of 0.1% year-on-year for the corresponding period in 2017. The FNB/BER Civil Confidence Index remained at a low level, registering 17 pts in 3Q2018 – a 17 year low. Over 90% of the respondents cited insufficient demand for new construction work as a business constraint. The difficult conditions in the civil construction sector are likely to persist as both public sector infrastructure expenditure and private sector investment remain constrained. There have been sizeable cuts in infrastructure allocations over the MTEF – approximately R60 billion in public sector infrastructure budget cuts were implemented between 2017/18 and 2020/21 – and private sector investment has contracted over the last three quarters, led by the decline in non-residential investment activity. Recently-announced measures to stimulate the economy include a R400bn infrastructure fund which is expected to provide some support to the sector as it is rolled out.
Agriculture, Forestry and Fishing
The agriculture, forestry and fishing sector made up 2.4% of total GDP in 2017 in real terms, increasing from 2.1% in 2016. This was the result of favourable weather conditions which supported production, following a protracted drought which weighed on the sector’s performance in 2015 and 2016.
Over the past 20 years, the sector has on average contributed 2.5% to total GDP. Despite the sector’s small direct contribution, strong linkages to the informal economy, rural areas and upstream (i.e. agricultural inputs) and downstream (i.e. food processing, paper and pulp production) activities means it has high output and employment multipliers which increase its overall value to the economy. The top ten employment multipliers for the South African economy include commodities from the services and agriculture sectors only. Extending this to the top twenty, there are another six commodities from manufacturing sub-sectors with strong links to the agriculture sector (i.e. leather products, furniture, sugar, animal feeding, bakery products and wood products).
In the period ended September 2018, real value added in the agriculture, forestry and fishing sector contracted by 3.2% compared with the same period in 2017. On a seasonally adjusted and annualised quarterly basis, the sector expanded 6.5% in the third quarter of 2017, following a sharp contraction of 31.9% in the second quarter. The sharp contractions in the sector’s gross value added over the first two quarters of the year are in large part reflective of a correction in agricultural activity following record production of maize and soybeans in the previous season which was reflected in exceptionally strong production numbers in the last two quarters of 2017. In the third quarter however, production was supported by later than usual harvesting of summer field crops due to a late start to the planting season earlier in the year. In addition, soft citrus producers reached record export levels in 2018 despite concerns over water availability in key growing regions. A rebound in winter field crop production is also expected to support the sector further in the fourth quarter.
Exports of certain agricultural products have shown encouraging growth over recent years, particularly into new markets in Asia. Trade promotion, market access and water interventions are crucial to unlock investment in key crops such as apples, table grapes, citrus, wine, avocados, macadamia and pecan nuts and beef, which hold significant potential to increase agricultural exports. Industry and the Department of Agriculture, Forestry and Fisheries (DAFF) are collaborating to expand access to existing and new export markets. For example, collaboration between DAFF and the local citrus industry to open up market access in China is bearing success – the value of citrus exports reached record levels in 2018 following significant growth in 2017. Export growth in these and other crops will come from leveraging public-private partnerships to improve market access, which must be supported by the availability of water.
In line with the aims of maximising agriculture’s contribution to jobs and growth, and more efficient use of public resources, several government departments are working to improve coordination of farmer support programs. This will eliminate existing overlaps and double-dipping of funding from the agriculture and rural development departments. Efforts to unlock specific constraints in the economy by joint working teams between business, labour and government are also underway. In agriculture, work is focused on water management, financing and insurance (targeting smallholder farmers with little or no collateral), and trade promotion and market access.
The government launched Operation Phakisa for Agriculture, Land Reform and Rural Development in 2017, which aimed to revitalise the agriculture and agro-processing value chains. In terms of producer support and market access, 23 Agri-parks are currently under development and will be completed by year end 2019. Further to this, the Black Farmer Commercialisation Programme seeks to increase transformation in a way that is supportive of production by employing a two phase model which allows black farmers the necessary support to operate at commercial level. The first phase is a preparatory one where farmers are supported in terms of skills, infrastructure, certification for exports (where necessary) and business planning. The second phase is a funding one to facilitate black farmers operating viable commercial entities by providing blended funding (both grant and loan financing) in collaboration with the Land Bank, financial sector, agribusiness and other development funding institutions. In addition, there are some innovative policies business and communities are testing in changing ownership structures, with voluntary land reform – for example in Witzenberg.
Despite the sharp contractions in production over the first half of 2018, average employment in the sector during the first three quarters of 2018 was almost unchanged in relation to the same period in 2017, expanding by 4000 jobs.
Electricity, Gas and Water
The electricity, gas and water sector increased by 0.9% during the first three quarters of 2018 and did not make any contribution to GDP growth in the first three quarters of the year. The share of gross value added for the sector amounted to 3.1% for the first three quarters of 2018.
Electricity
South Africa generates two-thirds of Africa’s electricity. More than 83% of South Africa’s electricity is coal generated. Koeberg, a large nuclear station near Cape Town, provides about 4% of capacity. A further 7% is provided by hydro-electric and pumped storage schemes.
Generation of electricity in South Africa is currently dominated by Eskom, the wholly state-owned utility, which also owns and operates the national electricity grid. The company supplies about 95% of South Africa’s electricity. It is regulated by the National Energy Regulator of South Africa (NERSA), which is also mandated to regulate electricity departments of local authorities as well as the piped-gas and petroleum pipeline sectors.
Energy supply has deteriorated with the energy availability factor declining to 73.7% for the 2018/19 financial year from 78.6% in the previous financial year. In terms of its outlook, Eskom states that it has implemented strategies to return the average energy availability factor to 80% by 2020. Medupi’s Unit 4 was connected to the grid on November 28, 2017, eight months ahead of schedule. Unit 3 of Medupi was synchronised for the first time in April 2018. All six units of Medupi and Kusile are expected to be completed by May 2020 and September 2022respectively. In addition, Ingula’s Unit 1 came into commercial operation on August 30, 2016 and all four units are now fully operational, with each unit generating about 333 MW. The projects have been financed by a mix of higher electricity tariffs, debt issued by Eskom, backed by a government guarantee, and loans from multilateral development banks. The Renewable Energy Independent Power Producer (REIPP) Programme has procured 6,422MW to date, with 3,272MW operational. In addition, 27 new projects were signed off in April 2018 by the minister of energy.
Oil and Gas
The wholesale and retail markets for petroleum products in South Africa are subject to a set of government controls. The government regulates wholesale margins and controls the retail price of petrol. The petrol retail price is fixed on a monthly basis, but varies each month with respect to global crude oil prices, the Rand/Dollar exchange rate and taxes. The administration of the pricing regulation is done by the Central Energy Fund on behalf of the Department of Energy (DOE). South Africa has very limited oil reserves. Approximately 60% of its crude oil requirements are met by imports from the Middle East and Africa.
Water
South Africa is largely a semi-arid and water scarce country with a mean annual rainfall of 450 mm, almost half the world average. South Africa’s inland water resources include 22 major rivers, 165 large dams, more than 4,000 medium and small dams on public and private land and hundreds of small rivers.
The South African government has launched a wide ranging ten-year program to address water supply and sanitation backlogs affecting under-serviced households. Improvement to bulk water infrastructure has been prioritized.. Initiatives are expected to fast-track the issuing of water licenses, expand the water system capacity, speed up construction programs, address backlogged projects and rehabilitate and upgrade existing water and sanitation infrastructure across the country. The department is also in the process of establishing an independent water regulator by 2023.
The Western Cape faced an unprecedented drought in 2017, but the situation has since improved. As of October 2018, average dam levels in the Western Cape increased to around 76% (the highest level recorded in recent years) compared to 34% in 2017. Much of the improvement has been thanks to improved demand management, rather than above-average rainfalls. However, there remain areas where drought conditions persist. In the Karoo, dam levels sit around 20%.
Public Sector Enterprises
The National Government owns a number of public enterprises (otherwise known as state-owned entities). The ministers under whose departments these enterprises fall act as the “Executive Authority” over these entities, taking up the role of shareholder on behalf of government. The ministers that act as the Executive Authority include the Minister of Public Enterprises, the Minister of Communications, the Minister of Energy, the Minister of Transport and various other ministers of the National Government.
The Executive Authority oversees the operations of the public enterprise, including the appointment of board members, the entering into of shareholder compacts with the public enterprise, approving major transactions, and the monitoring of performance. The National Treasury is responsible for financial oversight over all the public enterprises, including the review of major transactions, funding requests and applications for guarantees.
Parliament plays a significant role in the oversight of public enterprises through a number of committees that have been assigned responsibility for oversight over public enterprises. These committees include the Parliamentary Portfolio Committee on Public Enterprises, which is responsible for oversight over the Department of Public Enterprises and the key public enterprises that report to the department, the Parliamentary Portfolio Committees responsible for oversight of the various sectors in which public enterprises operate, and the Select Committee on Public Accounts, which is responsible for financial oversight.
The infrastructure investment program/programs of the public enterprises are aimed at delivering infrastructure to enhance economic growth and alleviate poverty. Public enterprises are expected to invest R405.5 billion in capital expenditure between 2016/17 and 2018/19. The main public enterprises responsible for delivering this growth are the electricity utility, Eskom, the freight transportation company, Transnet, the national oil company, the Petroleum, Oil and Gas Corporation of South Africa (Pty) Limited (PetroSA), which is a subsidiary of the Central Energy Fund, and SANRAL.
The National Government has issued formal contractual guarantees in respect of certain indebtedness of the public enterprises, inter alia, to support the capital investment program/programs of the public enterprises. Such guarantees are issued in accordance with the PFMA. All guarantees are issued jointly by the Minister of Finance and Executive Authority for the relevant public enterprise in terms of the PFMA. The National Government’s aim is for public enterprises to borrow on the strength of their own balance sheets without explicit recourse from the National Government. However, if a clear need for shareholder support is identified, a guarantee for a public enterprise may be provided on application. In such applications, the public enterprise is required to provide a sound business case, ensuring long-term financial sustainability. In extending guarantees, the National Government remains mindful of the guideline of 60.0% of GDP that has been set for total debt, provisions and contingent liabilities.
Over and above Eskom, Transnet and SANRAL, who have guarantees from the National Government, the current status of some of the more significant public enterprises over the last four fiscal years is set out below.
Guarantees of Public Enterprises
| | | 2015/16 | | | 2016/17 | | | 2017 /18 | | | As of September 30, 2018 | |
| | | Total
guarantee
amount | | | Total
exposure
amount | | | Total
guarantee
amount | | | Total
exposure
amount | | | Total
guarantee
amount | | | Total
exposure
amount | | | Total
guarantee
amount | | | Total
exposure
amount | |
| Rand (million) | | | | | | | | | | | | | | | | | | | | | | | | | | | | | | | | |
| Eskom | | | 350,000 | | | | 174,586 | | | | 350,000 | | | | 202,825 | | | | 350,000 | | | | 244,678 | | | | 350,000 | | | | 255,445 | |
| SANRAL | | | 38,947 | | | | 35,358 | | | | 37,910 | | | | 29,458 | | | | 38,947 | | | | 30,368 | | | | 38,946 | | | | 30,317 | |
| TCTA | | | 25,755 | | | | 21,173 | | | | 25,638 | | | | 20,886 | | | | 25,658 | | | | 18,912 | | | | 25,000 | | | | 18,927 | |
| SAA | | | 14,394 | | | | 14,394 | | | | 19,114 | | | | 17,819 | | | | 19,114 | | | | 11,059 | | | | 19,114 | | | | 14,555 | |
| DBSA | | | 13,892 | | | | 4,258 | | | | 12,324 | | | | 3,993 | | | | 12,038 | | | | 3,975 | | | | 11,170 | | | | 4,119 | |
| LandBank | | | 6,600 | | | | 5,304 | | | | 11,100 | | | | 3,805 | | | | 9,600 | | | | 3,806 | | | | 9,600 | | | | 2,509 | |
| Transnet | | | 3,500 | | | | 3,757 | | | | 3,500 | | | | 3,757 | | | | 3,500 | | | | 3,757 | | | | 3,500 | | | | 3,591 | |
| Denel | | | 1,850 | | | | 1,850 | | | | 1,850 | | | | 1,850 | | | | 2,430 | | | | 2,430 | | | | 2,430 | | | | 2,430 | |
| SA Express | | | 1,106 | | | | 539 | | | | 1,106 | | | | 827 | | | | 1,106 | | | | 867 | | | | 1,106 | | | | 867 | |
| IDC | | | 1,988 | | | | 243 | | | | 435 | | | | 138 | | | | 448 | | | | 137 | | | | 490 | | | | 150 | |
| SAPO | | | 4,440 | | | | 1,270 | | | | 3,970 | | | | 3,989 | | | | 4,170 | | | | 400 | | | | 470 | | | | 400 | |
| Telkom | | | — | | | | — | | | | 245 | | | | 108 | | | | 253 | | | | 111 | | | | 277 | | | | 122 | |
| PRASA | | | 1,400 | | | | 2 | | | | 1,217 | | | | — | | | | — | | | | — | | | | — | | | | — | |
| Other Entities | | | 4,300 | | | | 1,215 | | | | 5,739 | | | | 902 | | | | 2,574 | | | | 771 | | | | 2,281 | | | | 747 | |
| Total | | | 468,172 | | | | 263,949 | | | | 474,148 | | | | 290,357 | | | | 469,838 | | | | 321,271 | | | | 464,384 | | | | 334,179 | |
Source: National Treasury.
Eskom Limited (Eskom)
Eskom is a state-owned company responsible for electricity generation, transmission and distribution in South Africa. Eskom generates approximately 90% of electricity used in South Africa and approximately 40% of the electricity used in Africa. Eskom directly provides electricity to about 45% of all end users in South Africa. The other 55% is resold by redistributors (including municipalities).
While most of Eskom’s business is within South Africa, the company also buys and sells electricity in the SADC region. Eskom’s involvement in African markets beyond South Africa is currently limited to projects that have a direct impact on securing supply of electricity for South Africa. Eskom is investigating additional opportunities in the SADC region.
Key achievements include the commercialization of all four Units of the Ingula Power Station, with a nominal capacity of 333MW each, as well as the capacity added by Unit 6, 5 and 4 of the Medupi Power Station and Unit 1 of the Kusile Power Station.
For the Corporate Plan period ending in the 2021/22 financial year, Eskom sought to deliver a R337 billion funding plan to support the entity’s capital investment and maintain sufficient liquidity. However, due to the lack of access to the domestic and international bond funding markets, governance issues that plagued the company and the qualified audit report on the 2016/17 Annual Financial Statements; as well as a reduction in the organisational cash requirement due to savings; Eskom had to reduce its funding plan to R274 billion for the five years from 2018/19 to 2022/23. As at 30 September 2018, Eskom planned to raise R72 billion during the current financial year, of which R53 billion, or 73%, has already been secured for the 2018/19 financial year. In addition, Eskom has managed to secure 22% in advance for the 2019/20 financial year.
Eskom will continue to be reliant on Government support through the R350 billion Government Guarantee facility that was made available to support the construction of its capex programme. Eskom’s current guarantee exposure, including interest to Government, amounts to R256.7 billion as at 30 September 2018. Of the R350 billion Government guarantee, 96% has been committed, while 4% remains unallocated for future funding.
Eskom announced its Annual Financial Statements for the year ended 31 March 2018, with a loss of R2.3 billion, and the external auditors expressed a qualified audit opinion on these financials. The qualification was based on the non-compliance with the Public Finance Management Act (PFMA), relating to the previous years as the auditors’ decided to review Eskom’s compliance since 2012.
The Group revenue as at 31 March 2018 was reported at R177.4 billion (March 17: R171.1 billion). This was mainly due to a relatively lower approved tariff increase of 2.23% for the 2017/18 financial year (2016/17: 8%) coupled with a 0.9% (2016/17: 0.2%) decline in sales volume and the growing municipal debt. The decline in sales volume is attributable to increased self-generation as customers move to alternative sources, and reduced exports to SADC countries due to good rainfall as hydropower dominates its electricity generation. Primary energy cost increased marginally to R85.2 billion (March 2017: R82.8 billion). Of this, expenditure on Independent Power Producers (IPPs) amounted to R21.3 billion for the year, however, adding 9 584GWh to the grid (March 2017: R21.7 billion and 11 529GWh).
Earnings before interest, tax, depreciation and amortisation (EBITDA) improved to R45.4 billion (March 2017: R37.5 billion), even though the Eskom Group experienced a net loss of R2.3 billion after tax. Nevertheless, the EBITDA margin improved to 25.91% (March 2017: 21.44%), mainly as a result of significant cost containment initiatives to compensate for the below-inflation tariff increase. Eskom saved R68.9 billion, against the target of R61.9 billion through the five-year Business Productivity Programme (BPP) that evolved into the Design-to-Cost strategy. Crucial to the improvement of Eskom’s financial position is increasing the EBITDA margin, through a combination of delivering on cost savings initiatives and efficiencies, stimulating demand to increase sales and attaining a cost-reflective price of electricity. Cash and cash equivalents at year-end declined to R15.8 billion (March 2017: R20.4 billion). However, this is mainly attributable to shortfalls driven by a lower net cash from operations and increased finance costs (i.e. capital repayments and interest expenses). This is a clear indication that Eskom will continue to borrow in order to maintain a good liquidity position to be able to settle its debt obligations.
In December 2017, the National Energy Regulator of South Africa (NERSA) allowed a price increase of 5.23% for the 2018/19 financial year, which was lower than the 19.9% that Eskom had applied for. Eskom had to reduce and reprioritize expenditure in some areas in order to comply with this approval. Eskom remains of the view that the decision was not made in accordance with the Electricity Regulation Act of 2006 and the Multi-Year Pricing Determination (MYPD) methodology, both of which require NERSA to allow Eskom to recover efficient costs and a fair return. In June 2018, Eskom lodged a High Court review to set aside NERSA’s revenue decision for 2018/19.
In October 2018, NERSA announced that the Regulatory Clearing Account (RCA) balance of R32 billion that was approved in June 2018 will be recovered over a four-year period amounting to R8.2 billion each year.
As at 31 March 2018, the total available IPP capacity of 4 779MW included renewable IPPs of 3 774MW and IPP peakers of 1 005MW. On 4 April 2018, Eskom signed additional agreements with one project under bid window 3.5 and 21 projects under bid window 4. As at 30 September 2018, a total of 68 projects have been connected to the grid, enabling access to 5 005MW.
No load shedding was implemented during the year to 31 March 2018. However, as at 30 September 2018, Eskom reported that given the deteriorating generating plant performance, coupled with low coal stock levels, and exacerbated by the unavailability of Unit 5 of the Lethabo Power Station due to a steam pressure pipe rupturing, there is a risk of rotational load shedding.
Transnet SOC Limited (Transnet)
Transnet is a public company, wholly-owned by the South African Government, and is the custodian of rail, ports and pipelines infrastructure in South Africa. Transnet is responsible for enabling the competitiveness, growth and development of the South African economy through delivering reliable freight transport and handling services. Transnet has five operating divisions:
| ● | Freight Rail, the largest of the five operating divisions, operates 30,400 kilometers of rail network across South Africa which transports bulk, break-bulk and containerized freight. The rail network and rail services provide strategic links between the mines, production hubs, distribution centers and ports, and connect with the cross-border railways of the region. |
| ● | Transnet Engineering provides refurbishment, maintenance, upgrades and manufacturing services of rolling stock and specialized equipment for the other operating divisions of Transnet as well as external clients. It also houses the company’s research and development unit to capture opportunities for technology innovation. |
| ● | Transnet National Ports Authority provides port infrastructure and marine services at the eight commercial seaports in South Africa. The division’s core functions include the planning, provision, maintenance and improvement of port infrastructure. |
| ● | Transnet Port Terminals provides cargo-handling services at the ports which is critical in supporting the South African Government’s export-led growth strategy. |
In addition, Transnet has operations in Lesotho, Namibia, Swaziland and Mozambique and it plans to expand further into the rest of Africa. The tariffs charged by the National Ports Authority and Pipelines are determined by independent regulators, namely the Port Regulator and the National Energy Regulator of South Africa.
Transnet is currently transitioning from the Market Demand Strategy (MDS) that was first implemented in 2012 to a new Transnet 4.0 Strategy (Transnet 4.0). The MDS was aimed at creating capacity ahead of demand with the capital investment program. The MDS has largely achieved its objective of closing the market demand capacity gap for freight logistics infrastructure, with approximately R165,6 billion invested in the previous six years. Transnet 4.0 provides a framework for Transnet’s growth and diversification within the context of the 4th Industrial Revolution. The main growth thrusts of Transnet 4.0 include:
| ● | Extending Transnet’s footprint in Africa, the Middle East and South Asia; |
| ● | Product and service innovation; and |
| ● | Expanding Transnet’s advanced manufacturing business, with leading technologies to enhance new and existing products, and improve business processes |
PetroSA
PetroSA is a wholly-owned subsidiary of the Central Energy Fund (CEF), which in turn is wholly-owned by the State. The Department of Energy acts as PetroSA’s executive authority. PetroSA was formed in 2002 upon the merger of Soekor E and P (Pty) Limited, Mossgas (Pty) Limited and parts of the Strategic Fuel Fund. PetroSA plays a role in the development of the energy sector in South Africa in support of the broader CEF mandate of ensuring security of energy supply.
PetroSA’s core activities include:
| ● | Exploration and production of oil and natural gas; |
| ● | Participation in and acquisition of local as well as international upstream petroleum ventures; |
| ● | Production of synthetic fuels from offshore gas at the Gas-To-Liquids (GTL) refinery in Mossel Bay; |
| ● | Development of domestic refining and liquid fuels logistical infrastructure; and |
| ● | Marketing and trade of oil petrochemicals. |
Moreover, PetroSA operates the FA-EM, South Coast gas fields as well as the Oribi and Oryx oil fields. The producing gas fields provide feedstock to the Mossel Bay GTL refinery. PetroSA is also exploring alternative feedstock supply given the depletion of its gas reserves in the FA-EM field. Outside South Africa, the company has exploration acreage in Equatorial Guinea and Namibia. PetroSA’s GTL refinery produces ultra clean, low-sulphur, low-aromatic synthetic fuels and high-value products converted from natural methane rich gas and condensate using a unique GTL Fischer Tröpsch technology. Key commodities produced include unleaded petrol, kerosene (paraffin), diesel, propane, liquid oxygen and nitrogen, distillates, eco-fuels and alcohols. Its world-class synthetic fuels and petrochemicals are marketed internationally.
PetroSA operates the following main divisions:
| ● | Products and Sales: The Trade, Supply and Logistics (TS&L) division is responsible for marketing and selling products and services to customers in South Africa and abroad. |
| ● | Petrochemicals: PetroSA produces several chemicals at its GTL plant in Mossel Bay. These synthetic chemicals fall into two main groups: alcohols and low-aromatic distillates. These products are placed locally and internationally. |
| ● | Crude Oil: PetroSA produces crude from its Oribi and Oryx oil fields, located in Block 9, off the coast of SA. It is estimated that the fields produce 1,800 barrels of oil per day. |
| ● | Commercial Business: In 2006, PetroSA established its Commercial Business in order to facilitate opportunities for players within the petroleum industry from a previously disadvantaged background. Initially, the unit focused on black economic empowerment wholesalers and later expanded its focus to include liquid petroleum gas (LPG). |
The CEF group has been faced with sustainability pressures since the 2013/2014 financial year mainly as a result of the feedstock shortages (gas feedstock) which is extremely necessary in the sustainable operation of its gas to liquid (GTL) refinery. As an interim measure, PetroSA has started processing crude oil producing 18,000bpd. With additional capital expenditure, the entity will be able to scale up its production. The final turnaround strategy of PetroSA is however under discussion with the Minister of Energy.
In addition, CEF is mitigating against the Group’s worsening financial position through the implementation of a number of cost reduction strategies including adoption of a consolidated shared service model and divesture from non-performing projects.
Most importantly, CEF is engaged in a strategy review process aimed to refocus its mandate in light of rapid changes in the energy sector. The strategic review process will among other objectives serve as a platform for government and CEF to work together in addressing CEF’s very wide mandate which has thus far been costly to the entity.
The CEF Group recorded a 44.0% decline in revenues from R20.7 billion in 2016 to R11.6 billion in 2017. This was mainly due to the decline in the sale of petroleum products and the decreased production at the Gas-to-Liquids (GTL) refinery in Mossel Bay. Group performance was unfavorably affected by changes in the operating model for the refinery, which was necessitated by the declining gas reserves. The new model has partially converted a gas to liquid refinery into condensate processing refinery, resulting in the use of more expensive imported feedstock when compared to the cost of the indigenous gas. The new operating model requires the refinery to operate at its maximum operating capacity in order for the operations to generate adequate margins. A net profit of R387 million were recorded for the 2017/2018 financial year. Cash and cash equivalents for the year were maintained at R15.7 billion; reserves however include restricted cash generated from the sale of strategic stock which may have to be utilized in replacing the stock.
For the 2016/17 financial year the group did not undertake any long-term domestic borrowings and has no immediate plans to borrow in the domestic capital market. PetroSA applied for the renewal of the foreign borrowing limit of US$250 million on April 11, 2017 and received approval from the Minister of Finance on May 14, 2017 for R3 billion, which is the Rand equivalent of USD200 million converted at USD/ZAR1 =15. The additional funding of R750 million was required by the Trade, Supply and Logistics (TS&L) unit of PetroSA and will be utilized for its trading activities and to manage its liquidity gap. An amount of R2.25 billion was to be utilized for the Reserve Based Lending facility which is a revolving credit facility secured against the producing asset of PetroSA Ghana.
ACSA
Airports Company South Africa (ACSA) is a state-owned company (74.6% owned by the South African Government through the Department of Transport, while the Public Investment Corporation SOC Ltd owns 20.0%, Empowerment Investors hold 4.21%, and Staff through the Employee Share Option Scheme the remaining 1.19%). The company is legally and financially autonomous and operates under commercial law. ACSA is mandated to own and operate South Africa’s nine principal airports, including the three major international airports at Johannesburg, Cape Town and Durban (King Shaka). As a result, ACSA is responsible for processing approximately 90.0% of all passengers departing on commercial airlines from airports within South Africa. ACSA has a 30-year concession and a 20-year concession to develop, operate and maintain the Mumbai (India) and Guarulhos International (Sao Paulo, Brazil) Airports respectively. ACSA earns consultancy fees and return on equity from these investments.
The ACSA Group derives revenue from two streams, aeronautical and non-aeronautical revenue. The former is derived from regulated charges, which consist of aircraft landing and parking charges, and passenger service charges. The non-aeronautical income is derived from commercial undertakings including retail operations, car rental concessions, property leases, car parking, hotel operations and advertising. Another component of non-aeronautical revenue is generated from international operations. ACSA’s non-aeronautical revenue accounted for 49% of total revenue in 2017/18 compared to 37% in the prior year. The non-aeronautical revenue grew by 4.6% to R3.3 billion, supported by buoyancy in ACSA’s retail, car rental and property rental activities. ACSA’s performance in terms of non-aeronautical revenue is marginally below its target of 50%, but compares favorably with the global contribution of non-aeronautical revenue which averages 45% at major global airport operators or groups.
ACSA made steady progress in the expansion of airport service activities in 2017/18. In South Africa, ACSA secured five-year contract to provide management and consultancy services to the Mthatha Airport. ACSA has also increased the scope of work at the Kotoka International Airport in Ghana, where ACSA is managing the airport expansion project and the terminal operations after construction is complete. ACSA has also concluded several memoranda of understanding with airport authorities in sub-Saharan Africa, including the Cameroon Civil Aviation Authority, Liberia Airport Authority and Namibian Airports company.
SANRAL
SANRAL is responsible for the planning, design, construction, rehabilitation and maintenance of South Africa’s national road network to support socio-economic development. The national road system connects all the major centers in the country to each other and to neighboring countries. The South African road network comprises approximately 754,600 kilometers of roads, of which 22,214 kilometers is the national road network. The national highway network currently consists of 16,170 kilometers, which is expected to grow to 25,000 kilometers. South Africa has the longest road network of any country in Africa.
In accordance with the SANRAL Act (1998), the agency is responsible for toll and non-toll roads. These operations are funded separately. Non-toll roads are funded by government allocations, and are not allowed to be cross-subsidized from toll road income, and vice versa. Toll operations can be divided into two types – those funded by SANRAL itself and operated on its behalf, and roads concessioned to private parties under public private partnerships. Hence SANRAL’s revenue comes from two primary sources: grants from the National Government for all non-toll roads, and the tolling revenue received from toll roads.
During 2017/18 SANRAL undertook a total of 223 projects to build new roads, improve existing roads, and rehabilitate roads in a sub-optimal condition. These projects on non-toll and toll roads directly under include 848km of toll and non-toll roadway. SANRAL awarded 60 new contracts worth R4.9 billion for new works, rehabilitation and improvement, periodic and special maintenance, routine maintenance, community development and other activities during the year ended March 31, 2018.
In 2017/18, SANRAL recorded total revenue of R16.285 billion (2016/17: R13.95 billion). An annual Government grant of R15.9 billion was provided. Of this grant, an amount of R463 million was earmarked for the Gauteng Freeway Improvement Project (GFIP), to off-set the loss of income resulting from lower toll fees under the dispensation announced by Government in 2015. A further R1.9 billion was also transferred to toll operations in 2017/18. The balance was transferred to non-toll roads and R6.3 billion of this was apportioned to capital projects. At the end of the financial year, R2.9 billion of the capital budget was unspent but committed to multiyear projects.
Trans-Caledon Tunnel Authority (TCTA)
The TCTA was established in 1986. The entity is a specialized liability management entity responsible for bulk raw water infrastructure development. TCTA was originally established to implement a single project, the Lesotho Highlands Water Project (LHWP). In March 2000, TCTA’s notice of establishment was amended to allow for the Minister of Water Affairs (now Minister of Water and Sanitation) to issue directives to TCTA in terms of the National Water Act and the entity has since evolved into being responsible for multiple projects. To date the following directives have been received:
| ● | Lesotho Highlands Water Project – Delivery tunnel and subsequently fulfillment of the Republic’s financial obligations arising from its treaty with Lesotho signed in 1986 (includes both Phase 1 and Phase 2); |
| ● | Advisory services to Umgeni Water, Water Management Institutions, Water Boards and the Department of Water and Sanitation (DWS); |
| ● | Berg Water Project (BWP); |
| ● | Vaal River Eastern Subsystem Project (VRESAP); |
| ● | Refurbishment of Mooi-Mgeni Transfer Scheme Phase 1* (MMTS1) and implementation of Phase 2* (MMTS2); |
| ● | Olifants River Water Resources Development Project Phase 2C and subsequently, all the remaining phases* (ORWRDP); |
| ● | Komati Water Scheme Augmentation Project (KWSAP); |
| ● | Mokolo-Crocodile Water Augmentation Project Phases 1 and 2 * (MCWAP 1 and MCWAP 2); |
| ● | Metsi Bophelo Borehole Project; |
| ● | Short term solution to Acid Mine Drainage* (AMD); |
| ● | Coordination of Strategic Infrastructure Projects 3 and 18* (SIP3 and 18); |
| ● | Mzimvubu Water Project; and |
| ● | Off-take to the town of Kriel from the Komati Water Supply Augmentation Project. |
Implementation of these projects is still on-going
In 2014, the initial R25 billion guarantees provided for LHWP Phase 1 were extended to cover the activities of LHWP Phase 2 and the short-term solution to Acid Mine Drainage (AMD) in the Vaal River area. Commercial funding for the rest of the projects is secured on the basis of income agreements between TCTA and DWS and these agreements determine how costs may be recovered on each project.
Lesotho Highlands Water Project (LHWP): in the past year, TCTA activities included the ongoing management of debt relating to the LHWP, as well as fulfilment of the associated financial obligations of the Government of the Republic of South Africa to the Kingdom of Lesotho. R6.5 billion worth of bank term loans and revolving credit facilities, amounting to R4bn and R2.5bn respectively, were arranged to raise funds for the redemption of the WS05 bond for the LHWP on 31 July 2018. R9.2bn was required to redeem the WS05, R6.5bn of which was funded via the new bank facilities, with the balance financed from TCTA savings. LHWP will still have facilities of R3.8bn to use should cash shortfall prevail which would be sufficient to ensure that the estimated cash depletion date (in the event no tariffs are received and no additional funding is obtained) would occur beyond 31 March 2019
Mokolo-Crocodile Water Augmentation Project (MCWAP): The first phase of this project, MCWAP-1 was declared to be fully operational in September 2016, and TCTA is now making preparations for the implementation of the second phase, MCWAP-2 which will supply water meet Eskom’s environmental requirements which are part of the World Bank loan for Medupi. In the preceding year, TCTA commenced with the Environmental Impact Assessment (EIA) of the project. The Environmental Impact Report is planned to be submitted to the Department of Environment Affairs (DEA) in the 2018/19 financial year, and will be followed by environmental authorisation and an appeal process.
TCTA’s total debt decreased by R1 592 million from 31 March 2017 to 31 March 2018 due to the redemption of WSP02. Total debt stands at R27 149 million (2017: R28 741 million). The most significant movement in debt was the increase in short-term liabilities of R6 259 million, from 2017 to 2018, mainly arising from the reclassification of the WSP05 bonds from long term to short term liabilities due to their intended redemption on 1 August 2018
As a non-profit organization, TCTA’s aggregate net cash inflows and outflows are expected to balance to nil at the end of each project, once all debt has been extinguished. Cash inflows from operating activities for the year ended 31 March 2018 were higher than for the year ended 31 March 2017, due to higher receipts of revenues and netted off by lower recoveries on fiscally funded projects. The higher receipts were partly due to the repayment of the outstanding balance for the 2016/17 financial year. The total receipts for the 2017/18 financial year amounted to R6 218 million. The tariff billing for the current financial year was higher than the previous financial year due to increased volumes.
South African Post Office (SAPO)
The SAPO State Owned Company (SOC) Act of 1958, and 2011 amendment, deals specifically with the establishment of SAPO as a state entity and corporate governance matters. SAPO is wholly-owned by the Government and its executive authority is the Department of Telecommunications and Postal Services.
The Postal Services Act of 1998 sets out the licensing requirements of SAPO as prescribed by the relevant regulatory body, the Independent Communications Authority of South Africa (ICASA). In terms of the licensing framework developed by ICASA, SAPO is the only operator licensed within the reserved market, which covers all mail under 1kg. SAPO’s license is valid for a period of 25 years and is reviewed every three years in relation to SAPO’s performance in rolling out universal service obligations (USO) which include the rollout of postal addresses, points of presence and adherence to delivery targets. In the unreserved market, operators are required to register with ICASA, but there is no licensing framework. SAPO operates in both the reserved and unreserved market.
Lastly, the South African Postbank Limited Act, provides for the corporatization of the Postbank, which is currently a division of SAPO. The Act allows for the transfer of the Postbank division to the Postbank Company. The Act further provides for the governance and functions of the Postbank once established as a company. SAPO operates an expansive network of 2,487 service points, through which its services are extended to the general public
SAPO, like most postal operators, has been experiencing a gradual decline in standard mail volumes; this has required that the entity revise its business model, with a focus on a diversification in revenues and the reduction of costs through the introduction of efficiencies and automation into the operations of the entity. This has been the main focus of the Board and executive management.
The Department of Telecommunications and Postal Services has indicated its intention to pass a Postal Services Amendment Bill before the end of the financial year ending March 2019. The Bill aims to reposition the SAPO as an aggregator of government services.
For the year ended March 31 2018, SAPO recorded a net loss after tax of R 1.077 billion. Revenue for the year ending March 2018 was R4.4 billion (R4.6 billion on 2017), whilst expenditure totaled R5.2 billion (R5.6 billion in 2017). In December 2017, the government allocated R3.7 billion to SAPO to defray debt that it had raised monthly to mostly fund its operations. In addition the government has allocated R2.9 billion to the entity to further assist in stabilizing its operations further and reducing its reliance of debt, this was allocated in the 2018 Adjustments Budget.
During the financial year ending March 2018, SAPO signed a contract with the South African Social Security Agency for the payment of social grants. This will be an ongoing mandate.
Denel
Denel is a state-owned aerospace and defence company (100% owned by the South African Government through the Department of Public Enterprises). Denel operates through several business units that have diverse capabilities in the defence industry, ranging from designing, developing, integrating and supporting artillery, munitions, missiles, aerostructures, aircraft maintenance, unmanned aerial vehicles system and optical payloads based on high technology.
In order to improve and strengthen governance at the Denel Group, the Minister of Public Enterprises appointed a new Board in April 2018. The new Board has demonstrated its willingness to strengthen governance by instituting on-going disciplinary action against the Group Finance Director.
Denel has been experiencing challenges that include weak contract management, poor levels of productivity and liquidity. In order to resolve these challenges, Denel is in the processes of implementing its Board approved turnaround strategy. The focus areas of the strategy include, reducing cost structure, improving programme delivery and generation of cash.
The company is legally and financially autonomous and operates under commercial law. Denel operates through several business units, including Denel Aerostructures, Denel Land systems and Denel Aviation. Denel derives revenue from local and foreign markets and the Group’s revenue declined by 2% from R8.2 billion in 2015/16 to R8.0 billion in 2016/17. This decline is mainly attributed to decreased local demand as the South African Government continues to focus on fiscal consolidation. To counter this, the Group has intensified its efforts to grow export market sales.
Denel’s net profit declined by 16% from R395 million in 2015/16 to R333 million in 2016/17. The decline in the Group’s net profit is mainly attributed to the decreased local demand, foreign exchange losses and escalating finance costs which increased by 34% from R203 million in 2015/16 to R272 million in 2016/17
Denel’s balance sheet consists of net equity of R2.6 billion (2016: R2.3 billion). The Group remains highly levered with debt of R3.3 billion.
SA Express
SA Express is a state-owned regional airline (100.0% owned by the South African Government through the Department of Public Enterprises). The company is legally and financially autonomous and operates under commercial law. SA Express operates short- and medium-haul routes connecting primary and secondary domestic and regional destinations in South Africa and neighboring countries.
As of the latest available financial statements, SA Express derives revenue from passenger ticket sales and cargo transport services. SA Express’ revenue increased by 1.0% to R2.5 billion for the 2014/15 fiscal year (2013/14: R2.56 billion), this was driven by the increase in average prices despite the challenging global economic conditions. SA Express’ net loss for the 2014/15 year amounted to R132 million, a 1,220% decline from the prior year loss of R10 million. There was an increase in finance costs due to increased borrowings.
As of the latest available financial statements, the balance sheet of the company consists of net equity of R56 million (2014: R188 million). SA Express’ liquidity position decreased to 0.60 times in the 2014/15 financial year from 0.80 times in 2013/14 as a result of faster increases in current liabilities relative to current assets.
As of the latest available financial statements, the capital expenditure of 2014/15 amounted to R110 million from R180 million in 2013/14.
Development Finance Institutions (DFIs)
South Africa has seven national Development Finance Institutions (DFIs) operating in sectors ranging from infrastructure, agriculture, industrial development and human settlements. These national DFIs are fully state-owned and report to their respective National Government shareholder departments. As of March 31, 2018, the three major DFIs, namely, the Land and Agricultural Development Bank of Southern Africa (Land Bank); Development Bank of Southern Africa (DBSA) and the Industrial Development Corporation (IDC) and National Housing Finance Corporation (NHFC) had a total asset base amounting to R2795.16 billion and funding liabilities of R109 billion.
Where necessary, DFIs continue to be supported by the National Government through a combination of financial instruments, such as grants and guarantees and recapitalization. The government has also allowed certain DFIs to obtain external loan funding which consists of loans obtained from capital market funding as well as concessionary funding from multilateral development finance institutions. Currently only two DFIs, the Development Bank of Southern Africa (DBSA) and the Industrial Development Corporation (IDC) are permitted through their Acts to operate and invest outside the borders of South Africa.
Informal Sector of the Economy
The informal sector employs approximately 3.0 million people (excluding agriculture and domestic service) and, as of September 30, 2018, accounted for 18.4% of total employment.
Informal enterprises encompass a very wide range of activities, such as the production of marketable products, the distribution of merchandise and the provision of services. Informal enterprises also mobilize capital at a grass-roots level for the provision of dwellings and community-based services. The businesses in this sector typically operate at a low level of organization and on a small scale, with little or no division between labor and capital. Since the informal sector operates outside the legislated labor environment, employment tends to be casual, based on kinship or personal and social relations rather than on contractual arrangements with formal guarantees.
Employment and Trade Unions
Employment
Employment remains one of the key challenges for the South African economy. Faster growth is required over an extended period of time to significantly increase labor absorption, reduce high unemployment and achieve a more equitable distribution of income.
Employment growth has not been fast enough to absorb the increasing labor force and the structural backlog of unemployment. Since the end of 2010 – the trough of the employment downturn – as of September 30, 2018, the labor force has grown by 23.7%. The labour force participation rate increased by 4.5 percentage points to 59.5% over the same period. As of September 2018, 40.5% of the working age population was not economically active. The official (narrow) unemployment rate increased from 23.9% in December 2010 to 27.1% in September 2018, while the broad unemployment rate (which includes discouraged workers) has averaged around 43.2%. As a result, the number of unemployed rose by 1.8 million; discouraged workers rose by 557,000 since December 2010. In comparison, employment has grown by 15.2%, or 2.5 million employees over the same period. Employment growth has been high in the utilities (albeit from a low base), finance and mining sectors.
Total employment per sector
Total formal and informal
employment per sector as at
September 30, 2018 | | Total employed
(thousands) | | | As a percentage of
total | | | Change since
December 2010
(thousands) | | | Average growth per
year since December
2010 | |
| Mining | | | 406 | | | | 2 | % | | | 85 | | | | 3 | % |
| Manufacturing | | | 1,719 | | | | 10 | % | | | (170 | ) | | | (1 | )% |
| Utilities | | | 156 | | | | 1 | % | | | 60 | | | | 7 | % |
| Construction | | | 1,502 | | | | 9 | % | | | 387 | | | | 4 | % |
| Trade | | | 3,305 | | | | 20 | % | | | 179 | | | | 1 | % |
| Transport | | | 996 | | | | 6 | % | | | 191 | | | | 3 | % |
| Financial Real Estate and Business Services | | | 2,502 | | | | 15 | % | | | 802 | | | | 5 | % |
| Community social and personal services | | | 3,675 | | | | 22 | % | | | 690 | | | | 3 | % |
| Agriculture | | | 842 | | | | 5 | % | | | 193 | | | | 4 | % |
| Private households | | | 1,267 | | | | 8 | % | | | 55 | | | | 1 | % |
| Other | | | 11 | | | | 0 | % | | | 10 | | | | 37 | % |
| Total | | | 16,380 | | | | 100 | % | | | 2,482 | | | | 2 | % |
Source: Quarterly Labour Force Survey (QLFS), Stats SA.
The following table sets forth the change in formal, non-agricultural, formal employment and the percentage of registered unemployed people for the periods indicated.
| | | For the year ended December 31, | | | As of and for the nine-month period ended September 30, | |
| | | | 2013 | | | | 2014 | | | | 2015 | | | | 2016 | | | | 2017 | | | | 2018 | |
| Employment (% change on prior year)(1) | | | | | | | | | | | | | | | | | | | | | | | | |
| Public Sector(1) | | | 2.2 | | | | 5.8 | | | | -1.8 | | | | 1.9 | | | | (2.9 | ) | | | 1.5 | |
| Private Sector(1) | | | 1.7 | | | | 1.1 | | | | 2.5 | | | | 3.7 | | | | 1.3 | | | | 0.0 | |
| Total | | | 1.8 | | | | 2.1 | | | | 1.5 | | | | 3.3 | | | | 0.4 | | | | 0.3 | |
| Official Unemployment(2) (%) | | | 24.7 | | | | 25.1 | | | | 25.4 | | | | 26.7 | | | | 27.5 | | | | 27.1 | |
Notes:
(1) Employment in the formal non-agricultural sectors.
(2) QLFS as at September 30, 2018. Starting in January 2015, the estimates are based on a new master sample, which impacts comparability with previous periods.
Source: QES, QLFS, Stats SA.
The national government has placed job creation and skills development at the heart of its policies, by promoting an environment that is conducive to private sector growth and investment, with future legislation and regulation being subject to a socio-economic impact assessment before being passed, and microeconomic reform as well as by directly impacting employment levels through public sector hiring and targeted job-creation programs. Some of these interventions include the following:
| ● | The Employment Tax Incentive aims to incentivize firms to employ young inexperienced workers, and at the same time providing younger workers with work experience to improve the probability of later employment. Initial impact analyses suggest a modest but positive impact. A 10-year extension was agreed by social partners in September 2018. Within the current legislative cycle, the Incentive has been extended to February 2024, with a further extension to February 2029 to be put forward with the legislative amendments in the 2019 legislative cycle. |
| ● | The Expanded Public Works Program (EPWP) is one of government’s short-to-medium term programs aimed at providing short-term jobs and training for the unemployed. It is a national program covering all spheres of government and state-owned enterprises. |
| ● | The National Skills Development Strategy (NSDS) guides skills development in South Africa and seeks to ensure that the labor market is better able to cope with developmental challenges such as poverty, inequality and unemployment through responsive education and training. |
| ● | The Jobs Summit convened in October 2018 followed extensive consultation with government and its social partners, who have collectively arrived at a number of agreements on interventions to drive job creation and job retention, thus boosting the inclusivity of economic growth. These include in areas such as public employment programmes, new sector-specific labor intensive initiatives, and enhanced policy and regulatory certainty that works to unlock inclusive growth and employment. Post-Summit monitoring and evaluation will be conducted by two oversight bodies, including a Presidential Committee. |
Education, skills, employment and unemployment
There is a positive correlation between skills levels (using educational attainment as a proxy) and employment. Individuals with lower skills levels represent the majority of the unemployed. As at September 30, 2018, narrow unemployment stood at 31.8% for workers with less than complete secondary education, while it falls to 29.4% for workers with completed secondary education and 12.7% for workers with technical or academic qualifications beyond secondary education.
Education
Education is one of the National Government’s priority areas. This prioritization is reflected in the total government expenditure on education – at 20.2% of consolidated government expenditure in fiscal year 2017/18, South Africa’s total expenditure is above the 15% to 20% threshold as set by the UNESCO Education for All initiative in 2008.
According to Education Statistics 2016, published in June 2018 by the Department of Basic Education, the South African basic education system had 13.3 million students, 440,151 educators and 29,749 schools, of which 1,856 were independent schools. With enrolment and gender parity virtually achieved, particularly at primary school level where the gross enrolment ratio is 97 for girls and 100 for boys, the focus is on improving the quality of education, rather than access. Improving learner performance in literacy and numeracy is central to the overall improvement in education outcomes at all levels. South Africa’s performance within basic education is substandard, with the country’s quality of primary education ranked 116 out of 137 countries as per the most recent World Economic Forum’s Global Competitiveness Report.
To address the impact of poverty on educational opportunities, a “no-fee schools” policy was introduced in 2007 that ensured that the poorest 40% did not have to pay school fees. Over 79% of schools benefitted from this policy as of the 2017/18 financial year according to the Department of Basic Education. These “no-fee schools” receive additional resources to provide the necessary learner and teacher support materials. By 2013/14, 8.8 million learners had access to free education, which, by 2017/18, had risen to 9.7 million.
The National School Nutrition Program (NSNP) provides daily meals to approximately 9 million learners at 19,800 schools. The NSNP is funded by means of a conditional grant, and is allocated R21.7 billion between 2018/19 and 2020/21, with the aim of enhancing the learning capacity of poor students by providing them with a nutritious meal every school day.
A safe and secure learning environment is a critical element to improving the quality of learning and teaching. To this end, the school infrastructure backlogs grant and the education infrastructure grant to provinces are allocated R35.5 billion between 2018/19 and 2020/21. This complements funds already in the baselines of provincial education departments for school infrastructure. In addition funds of R1.2bn are made available over the medium term to support the quality of maths, science and technology being taught, particularly in disadvantaged schools.
Higher education
Access to university education has steadily increased, with enrolment in public universities up from 892,936 in 2010 to 975,837 in the 2016 academic year. One of the key outputs identified under this priority outcome is to increase the number of science, engineering and technology graduates because of the contribution that these graduates can make to the economic growth that the country seeks. Additional grant funding is provided to those universities that are able to increase enrolment and graduation numbers in these key areas.
FET Colleges are also recognized as primary sites for skills development. Quality is a concern at these colleges and the DHET has committed to implement measures that aim to address poor performance at the FET Colleges. The Sector Education and Training Authorities (SETAs) and the National Skills Fund, the key workplace skills development agencies, intend to spend R58.4 billion between 2018/19 and 2020/21 on a range of skills development programs.
Urgent reform of the financing of higher education – and particularly university education – will take place over the medium term, to ensure that the poor are also able to access opportunities at universities and FET Colleges. In the 2018 Budget Review, government allocated an additional R57 billion (in addition to the approximately R10 billion provisionally allocated in the 2017 Budget Review) for fee-free higher education and training over the period between 2018/19 and 2020/21 for poor and working-class students from households with an annual income of less than R350 000. Additional top-ups were also made to the National Student Financial Aid Scheme (NSFAS).
Trade Unions and Labor Disputes
The Labour Relations Act promotes collective bargaining through, among other things, protecting organizational rights for unions and the right to strike. Trade union representation is an accepted fact of industrial practice in South Africa. Almost all sectors of the economy, including the public service, have representative unions which engage employers over issues affecting their workforce.
Union density serves as an indication of the strength and potential influence of unions in the economy. South Africa’s union density is quite high. As at December 2017, the number of registered trade unions was 191.
Most trade unions in South Africa are organized in federations, of which there are 24 registered with the Department of Labor as of April 2017. The largest federation is the Congress of South African Trade Unions (COSATU), which had approximately 1.6 million members as of 2018. COSATU includes the National Union of Mineworkers, the South African Clothing and Textile Workers Union, the Food and Allied Workers Union and the National Education, Health and Allied Workers Union. Other significant federations include the Federation of Unions of South Africa (with a membership of approximately 500 000 members) and the National Council of Trade Unions (with a membership of approximately 400 000 members).
The Labor Relations Act of 1995 (Labor Relations Act) promotes collective bargaining through, among other things, protecting organizational rights for unions and the right to strike as well as setting out the procedures for instituting legal strikes, introducing special requirements for the use of secondary strikes, picketing, protest action and replacement labor and protecting an employer’s right to have recourse to lockout. The right to strike is contingent on the exhaustion of dispute procedures and on the condition that the industry does not provide essential services. The Labor Relations Act also establishes a framework for the formation of bargaining councils to determine matters within the public sector and each industrial sector, the criteria for which are to be established by the National Economic Development and Labor Council. When employers and employees cannot agree on the formation of a bargaining council, a statutory council may be formed.
The Labor Relations Act permits the use of privately negotiated dispute resolution procedures and also encourages a centralized dispute resolution mechanism. The Commission for Conciliation, Mediation and Arbitration (CCMA) is responsible for attempting to resolve industrial disputes through conciliation and mediation. If these attempts fail, the CCMA may determine the dispute by arbitration or the parties may refer the dispute to the Labour Court unless it falls into the categories that must be resolved finally by arbitration and may not be referred to the Labour Court. The Labour Court is comprised of both trial and appellate divisions and, together with the High Court of South Africa and Supreme Court of Appeals, has jurisdiction over all matters referred to it under the Labour Relations Act.
The Labor Relations Amendment Act in 2014 gave legal power to the Commission for Conciliation, Mediation and Arbitration (CCMA) to approach negotiation parties to assist in resolving issues. It is expected that this will help avoid disruptions to the economy. The CCMA has already demonstrated success in this regard, and has cut the duration of arbitration proceedings by more than 75% since 2003. The CCMA was heavily involved in the private security sector negotiations since violent strikes in 2005/06, which has avoided industrial action in its wage negotiations this year.
Labor Legislation
Since 1994, significant legislation has been adopted designed to improve labor relations, the quality of employment, skills development and employment equality. South African labor legislation promotes equity in employment and prohibits discrimination in the workplace on the grounds of race, gender, sex, pregnancy, marital status, family responsibility, ethnic or social origin, color, sexual orientation, age, disability, religion, HIV status, conscience, belief, political opinion, culture, language or birth.
To realize these objectives, legislation requires all employers to take steps to end unfair discriminatory practices and policies. In addition, legislation mandates designated employers to prepare and implement employment equity plans and to report to the Department of Labour on their progress in ending unfair discriminatory practices and in promoting equity.
Post-1994, the following acts were promulgated to govern labor market activity and these include:
| ● | the Compensation for Occupational Injuries and Diseases Act of 1993, which regulates safety and health matters in the workplace; |
| ● | the Labor Relations Act of 1995, which applies to all workers and employees and aims to promote economic development, social justice, labour peace and democracy in the workplace. It affords workers protection in line with international standards; |
| ● | Basic Conditions of Employment Act of 1997, which applies to all workers and regulates leave, working hours, employment contracts, deductions, pay slips and termination; |
| ● | the Employment Equity Act of 1998, which protects workers and job seekers against unfair discrimination and provides a framework for the implementation of affirmative action; |
| ● | the Skills Development Act of 1998 and Skills Development Levies Act of 1999, which aims to develop the skills in the South African labour force as well as outlines how employers should contribute to the National Skills Fund (NSF); |
| ● | the Unemployment Insurance Act of 2001 and Unemployment Insurance Contribution Act of 2002 outlines the security available to workers when they become unemployed as well as how to contribute to the UIF Contribution Fund; and |
| ● | The Employment Services Act of 2014 came into effect in August 2015. It provides for the creation of a Public Employment Service, and will provide state assistance to unemployed job seekers. Assistance will take the form of improved matching and placement of work seekers with opportunities, as well as through training. This act repeals the Employment Services provisions contained in the Skills Development Act. |
The Department of Labor has enacted amendments to the Basic Conditions of Employment Act, Employment Equity Act and Labour Relations Act to update and improve legislation periodically. The amendments to the Labour Relations Act deal with two main issues. First, offering more protection to non-standard employment (temporary workers, fixed and part-time contract workers). Temporary work is extended to three months to allow for genuine temporary work. For a fixed term contract beyond three months, the worker is entitled to be treated equally to a permanent employee. Both the employment service providers and their clients have joint and several liability for non-compliance. There must also be sufficient justification for fixed contract rather than absorbing workers into the permanent workforce. Part-time workers should also be treated on the whole not less favourably than comparable full-time employees, including access to training and skills development. Second, the amendments seek to enable a better dialogue in difficult wage negotiations and reduce the likelihood of disputes disrupting the economy; the CCMA is given legal power to approach negotiating parties to assist in resolution.
The amendments to the Basic Conditions of Employment Act include: the extension of the scope of the prohibition and regulation of work by children; empowering the Minister of Labor to regulate a broader range of matters in sectoral determinations (minimum wages for sectors where workers are particularly vulnerable); simplifying the Department of Labor’s ability to take enforcement steps against non-compliant employers (and to access the Labor Court for this purpose); and increasing penalties and maximum sentences for non-compliance.
The amendments to the Employment Equity Act clarified who qualifies as a member of the “designated groups”, and reduced the number of factors considered when assessing compliance, as well as increased the penalties for non-compliance. Regulations published under the Act provide good practice for determining equal pay for work of equal value.
In November 2018 President Cyril Ramaphosa assented to the National Minimum Wage Bill, the Basic Conditions of Employment Amendment Bill and Labour Relations Amendment Bill, that together introduce a national minimum wage (NMW) of R20 an hour, effective January, 1 2019. Further, the legislation provides for the technical arrangements needed to support implementation of the NMW. In addition, an agreement on codes of good practice should help to normalise employer/ employee relations, build trust and increase propensity to hire. The codes set out practical guidelines for standard behaviour during collective bargaining, industrial action and picketing.
Benefits
Although the National Government has not established a comprehensive welfare system of the type found in many industrialized countries, it does maintain a variety of social benefit schemes relating to, among other things, compensation for occupational injuries and diseases, occupational health and safety, unemployment insurance, old age, disability and survivor benefits, child support grants, unemployment, sickness and maternity benefits, worker injury benefits and various health care benefits targeted to certain persons. Other programs provide for a developmental social welfare program to ensure, among other things, delivery of benefits to the poorest South Africans and improved social insurance. These programs are funded largely from budgetary allocations and through improved efficiency of delivery of services, subsidies or payments. South Africa is considering the introduction of a comprehensive social security system.
Prices and Wages
Annual consumer price inflation moderated to an average of 5.2% in the first 11 months of 2018 compared to 4.6% in the first ten months of 2017. The moderation in headline inflation was mainly driven by a slowdown in food price inflation, which offset the impact of higher petrol prices.
Food inflation averaged 3.4% in the first ten months of 2018, down from 7.0% in the corresponding period in 2017, as the prices of bread & cereals, and fruits declined sharply into deflationary territory. This drop in prices follows double digit price increases in these categories in 2016 after the 2015 drought. Meat prices have also decelerated to an average of 7.8% in the first ten months of 2018, from average of 12.5% over the same period in 2017.
Transport inflation rose 6.7% in the ten months to October 2018, from an average of 5.1% over the same period in 2017, underpinned by higher petrol prices. Petrol price inflation grew 14.2% in the first ten months of 2018, almost double the 7.2% in the previous year, driven by higher global oil prices and a weaker rand exchange rate.
Core inflation, which represents the long-run trend of the price level and excludes temporary shocks, moderated from an average of 4.8% year-on-year over the first ten months of 2017, to 4.2% in the same period in 2018. The downward pressure in core inflation was generated by insurance, housing rentals, vehicle purchases and funeral services, as domestic demand remain subdued.
The Government forecasts CPI inflation will remain within the 3-6% target range in the medium-term, although it is expected to rise closer to the upper end of the target band, reaching 5.4% by 2021, as food inflation rises to its historical average. Other upside risks to inflation include weaker exchange rate, higher wage growth, oil prices and rising electricity and water tariffs.
Growth in average nominal remuneration per worker in the formal non-agricultural sectors of the economy amounted to 5.5% in the third quarter of 2018, compared to 3.0% growth in the corresponding period in 2017. Average remuneration per worker increased to 4.0% in the private sector from -0.8% but slowed to 9.8% in the public sector from 13.5% during the third quarter of 2018, compared to the same period in the previous year. Above-inflation public sector wage increases are likely to put pressure on wage inflation – which is an important driver of services inflation.
Nominal remuneration increases were below the upper limit of the inflation target range in the first three quarters of 2018 in: manufacturing (3.8%), construction (-0.5%), transport (2.6%), mining (3.9%), the wholesale, retail and trade sector (5.3%), utilities (-2.1%) and financial services (0.3%). Remuneration growth was above the target range in the government (6.7%) and non-governmental sector (6.3%).
Producer price inflation for final manufactured goods rose modestly to an average of 5.3% in the first ten months of 2018 compared to an average increase of 4.8% in the corresponding period in 2017. The increase in producer price inflation was due to higher cost inflation in petroleum and chemical products as well as transport equipment.
| Prices and Wages | | For the year ended December 31, | | | As of November | |
| | | | 2013 | | | | 2014 | | | | 2015 | | | | 2016 | | | | 2017 | | | | 2018(3) | |
| Consumer Prices(1) | | | 82.9 | | | | 88.0 | | | | 92.0 | | | | 97.83 | | | | 104.7 | | | | 109.4 | |
| Percentage change from prior year | | | 5.76 | % | | | 6.09 | % | | | 4.58 | % | | | 6.34 | % | | | 7.02 | % | | | 4.5 | % |
| Production Prices(4) | | | 82.1 | | | | 88.1 | | | | 91.31 | | | | 97.78 | | | | 105.2 | | | | 111.3 | |
| Percentage change from prior year | | | 6.00 | % | | | 7.40 | % | | | 3.61 | % | | | 7.08 | % | | | 7.59 | % | | | 5.8 | % |
| Remuneration per worker | | | | | | | | | | | | | | | | | | | | | | | | |
| At current prices | | | 7.2 | % | | | 6.6 | % | | | 7.0 | % | | | 5.8 | % | | | 6.4 | % | | | 4.5 | %(2) |
| At constant prices | | | 4.2 | % | | | 1.3 | % | | | 2.1 | % | | | (0.1 | )% | | | 0.0 | % | | | (0.6 | )%(2) |
Notes:
(1) December 2016 = 100.
(2) Year on year change Q1 2017 to Q1 2018.
(3) The average values over the first eleven months.
(4) 2016 = 100.
Source: SARB, Stats SA.
Monetary and Financial System
The South African financial system consists of banks and non-bank financial institutions such as investment funds, portfolio management companies, securities investment firms, insurance companies, development funding institutions and pension funds.
The South African Reserve Bank (SARB)
The SARB is the central bank of South Africa, with its head office in Pretoria and cash center branches in Cape Town, Durban and Johannesburg. The Constitution of the Republic of South Africa established the SARB as an independent central bank, subject only to acts of Parliament and to regular consultation with the Minister of Finance. The principal responsibilities of the SARB include, among others: formulating and implementing monetary policy; issuing banknotes and coin; acting as banker to the National Government; regulating banks licensed under the Banks Act of 1990; providing facilities for the clearing and settlement of claims between banks; acting as custodian of the country’s gold and other foreign reserves; acting as a lender of last resort; conducting open-market operations for purposes of the implementation of monetary policy; supervising large primary, secondary and tertiary co-operatives; collecting, processing and interpreting economic statistics and related information; and formulating and implementing exchange control policies in cooperation with the Minister of Finance and the National Treasury. Following the enactment of the Financial Sector Regulation Act 9 of 2017 (FSR Act) on 22 August 2017, the Prudential Authority (PA) was formally established on 1 April 2018. The PA is a legal entity operating within the administration of the SARB. The objective of the PA is to: promote and enhance the safety and soundness of financial institutions that provide financial products and securities services; promote and enhance the safety and soundness of market infrastructures; protect financial customers against the risk that those financial institutions may fail to meet their obligations; and assist in maintaining financial stability.
Unlike many other central banks, shares in the SARB are held by private shareholders, with no shares held by the National Government. The SARB was listed on the JSE from its inception in 1921 until May 2002, when it was de-listed. Currently, approximately 758 shareholders, including companies, institutions and individuals, hold SARB shares. No single shareholder may hold more than 10,000 shares. Dividends are paid to shareholders out of net profits at a rate of 10.0% per annum of the nominal value of the shares. After certain provisions, 10.0% of the SARB’s surplus in any year is paid into a statutory reserve fund, and the balance is paid to the National Government.
The SARB’s Board of Directors has 15 members, who hold office for a period of three years, which can be renewed for a further two terms of three years each. The Governor and three Deputy Governors of the SARB are appointed by the President for an initial five-year term and subsequent terms of five years or less. Former President Zuma appointed Mr. Lesetja Kganyago as Governor of the SARB with effect from November 9, 2014. Of the remaining 11 directors, four are appointed by the President, with the remaining seven elected by the SARB’s shareholders.
The South African Reserve Bank Act was amended in 2010 (through Amendment Act No. 4 of 2010) to provide mechanisms to ensure that shareholders contribute to the functioning of the SARB without adversely influencing the SARB’s decision-making capabilities through group or block formations.
Monetary Policy
The main objective of the SARB’s monetary policy has been the pursuit of price stability. This policy contributes to the broader macroeconomic policies of the National Government by creating a stable financial environment and improving the standard of living of all inhabitants of the country. The SARB does not have fixed exchange rate targets and allows the Rand to float freely against international currencies.
The current inflation-targeting framework is a broad-based strategy for achieving price stability, centered on an analysis of price developments, and is characterized by a publicly announced inflation target range (currently 3.0-6.0%). Monetary policy decisions are guided by the deviation of the expected rate of increase in headline CPI from that target. An important factor in determining monetary policy is the forecast generated by the SARB’s macroeconomic models, although monetary policy is not decided mechanically according to these forecasts, nor are policymakers obliged to ensure inflation is permanently within the target range. Rather, the framework includes a degree of flexibility, permitting temporary departures of inflation from the target in the event of shocks (such as oil price movements).
In response to the global financial crisis and subsequent weak global recovery, the repurchase rate was lowered from a peak of 12.0% in 2008 to 5.0% by mid-2012. Policy reversed direction in January 2014, when the repurchase rate was raised from 5.0% to 5.5%, marking the beginning of an interest rate tightening cycle. The policy change occurred against the backdrop of a deterioration in the inflation forecast, which showed an extended breach of the upper target band starting in the second quarter of 2014. The primary cause of the deteriorating outlook was Rand depreciation, driven by lower commodity prices as well as expectations of a somewhat less expansionary monetary policy stance by the US Federal Reserve.
At the July 2014 meeting, the MPC decided to raise the repurchase rate again, to 5.75%, reflecting a persistently unfavorable inflation outlook. In the following months, however, an unexpected collapse in global oil prices lowered inflation markedly.. In July 2015,the MPC decided to continue on its path of gradual policy normalization, raising the repurchase rate by 25 basis points, followed by an additional 25 basis point increase at the November 2015 meeting, bringing the repurchase rate to 6.25%. Facing the prospect of a prolonged breach of the inflation target range, the MPC increased the repurchase rate by 50 basis points to 6.75% per annum as of January 29, 2016, and by a further 25 basis points to 7.0% in March 2016. These changes brought the cumulative increase since the start of the tightening cycle in early January 2014 to 200 basis points.
In July 2017, the MPC decided to lower the repurchase rate by 25 basis points to 6.75%, the first rate cut since 2012. In March 2018, the MPC lowered the repurchase rate by another 25 basis points to 6.5%. In its January 2019 meeting, the MPC unanimously decided to keep the repurchase rate unchanged at 6.75%. This increase was made in light of tighter global financial conditions, a weaker exchange rate, higher wage growth, increases in international oil prices and rising electricity and water tariffs. At the time of the increase, demand pressures were assessed as to not pose a significant risk to the inflation outlook.
In its role of implementing monetary policy, the SARB monitors and influences conditions in the South African money and credit markets and affects interest rates, growth in lending and growth of deposits. The SARB uses open market operations to manage the amount of liquidity available to banks on a weekly basis in repurchase transactions. The interest rate for such repurchase transactions is set by the SARB’s MPC and has a significant impact on all short-term interest rates in the economy. The monetary policy stance is decided at the bi-monthly meetings of the MPC. There exists, however, a continuous process of review that takes new information and developments into consideration.
Open market operations entail the buying and selling of securities by the SARB in the open market in order to regulate the conditions in the money market or the level and pattern of interest rates. By injecting or absorbing funds through purchases and sales of securities, the SARB may increase or decrease liquidity in the banking system. Although these transactions are primarily undertaken to achieve long-term monetary objectives, a further objective may be to stabilize temporary money-market fluctuations.
The SARB may purchase and sell National Government securities for the SARB’s own account, providing it with an effective means of influencing money market liquidity. Other techniques used by the SARB to influence liquidity include purchasing securities outright, allocating National Government deposits between the SARB and private banks, issuing SARB debentures and entering into foreign exchange swaps with banks.
Currently, nine primary dealers make markets in government paper, five of which are domestic banks and four of which are international banks. Since its appointment of primary dealers in 1998, the SARB no longer acts as an agent for the National Government in buying or selling its securities. During 2004 the SARB conducted a review of its money-market operations.. As a result, on May 25, 2005, following extensive consultations with market participants, the SARB implemented several changes to its refinancing operations with three aims: to streamline the SARB’s refinancing operations to make them simpler and more transparent; to encourage banks to take more responsibility for managing their own individual liquidity needs in the market; and to promote a more active money market in South Africa. These changes include, among other things, the announcement on the Wednesday morning prior to the main weekly repurchase auction, of an estimate of the average daily market liquidity requirement by the SARB and the estimated range within which the daily requirement is expected to fluctuate in the coming week and the introduction of standing facilities (previously referred to as final clearing or reverse repurchase tenders) at a spread of 50 basis points above or below the prevailing repurchase rate to accommodate banks with short or long liquidity positions.
However, the central feature of the SARB’s operational arrangements – the conduct of repurchase auctions on Wednesdays, with one-week maturity at a repurchase rate fixed at the level announced by the MPC – remains unchanged.
Before the introduction of the changes to the SARB’s refinancing operations, the accommodation amount provided at the main weekly repurchase auction was stable at around R13 billion, which was also the approximate level of the average daily liquidity requirement of the private sector banks. Thereafter, the amounts on offer at the weekly main refinancing auctions varied, with generally higher levels around month end and lower levels towards the middle of the month. In order to even out the banks’ end-of-day positions, standing facilities and cash reserve accounts were utilized.
Following the evening-out of the oversold forward foreign exchange book in February 2004, the SARB continued to increase its foreign exchange reserves through the measured buying of foreign exchange from the market, thereby creating Rand liquidity. The banks’ required cash reserve balances with the SARB rose considerably in September 2004, as vault cash was no longer allowed as part of qualifying cash reserves due to the phase-out of vault cash concessions, which started in September 2001.
The outstanding amount and composition of interest-bearing instruments utilized by the SARB were changed to drain liquidity from the money market. Debentures with a 56-day maturity were first issued on December 1, 2004, and 56-day reverse repurchase transactions were first conducted on March 24, 2005.
The outstanding amount of South African Government bonds in the SARB monetary policy portfolio amounted to R7.85 billion nominal loans as at January 2019. This followed an agreement between the National Treasury and the SARB on October 20, 2003, which allowed the SARB to restructure and shorten the average maturity of interest-bearing government bonds held in its monetary policy portfolio by conducting cash-neutral switch auctions.
The following table sets forth the rate at which the SARB provided liquidity to banks as of each month-end indicated.
Repurchase Transaction Rate
| 2017 | | | (%) | |
| January | | | | 7.00 | |
| February | | | | 7.00 | |
| March | | | | 7.00 | |
| April | | | | 7.00 | |
| May | | | | 7.00 | |
| June | | | | 7.00 | |
| July | | | | 6.75 | |
| August | | | | 6.75 | |
| September | | | | 6.75 | |
| October | | | | 6.75 | |
| November | | | | 6.75 | |
December | | | | 6.75 | |
| 2018 | |
| January | 6.75 |
| February | 6.75 |
| March | 6.50 |
| April | 6.50 |
| May | 6.50 |
| June | 6.50 |
| July | 6.50 |
| August | 6.50 |
| September | 6.50 |
| October | 6.50 |
| November | 6.75 |
| December | 6.75 |
Source: SARB.
In May 2007, the SARB began to accept certain parastatal bonds in its repurchase auctions, thereby extending the range of securities which may be used as collateral in the refinancing system. This included a selection of bonds included in the All Bond Index, as determined by the Bond Exchange of South Africa Limited (BESA), excluding those issued by commercial banks. The added securities do not qualify as liquid assets in terms of the Banks Act. Below is a list of assets which were added as eligible collateral. However, at the end of August 2010, the SARB implemented certain changes to its monetary policy operational procedures, including the phasing out of parastatal bonds included in the All Bond Index as eligible collateral in the SARB’s refinancing operations. As a result, with effect from March 1, 2011, these bonds were no longer accepted as collateral.
Additional securities accepted in repurchase auctions Rand denominated
Assets previously and still included as eligible collateral
Government bonds
Land Bank bills
Separate trading of registered interest and principal of securities (STRIPS)
SARB debentures
Treasury bills
Assets which were added from May 23, 2007 but which were phased out with effect from March 1, 2010
DBSA (DV07)
Eskom Holdings Ltd. (ES09, E170, ES33)
SANRAL (SZ25)
Transnet Ltd. (T011)
Trans-Caledon Tunnel Authority (WS03, WS04)
Source: SARB.
In August 2010, further changes to the monetary policy operational procedures of the SARB were made. These included the use of longer-term foreign exchange swaps with maturities of up to 12 months as an instrument to manage money market liquidity more effectively. The consequence of conducting longer-term foreign exchange swap transactions to drain liquidity from the market is that the SARB reflects an overbought forward position on its monthly releases of official gold and foreign exchange reserves. In addition, the estimated ranges of the weekly liquidity requirement were discounted and the spread between the rates for standing facilities and the repurchase rate was widened from 50 basis points to 100 basis points below and above the prevailing repurchase rate in order to encourage interbank lending by making the rates more punitive for banks to square off their liquidity positions with the SARB compared to the rates in the interbank market.
The SARB introduced a new liquidity management strategy in August 2013 designed to ensure broad alignment between the money market shortage and underlying conditions in the money market. The strategy entailed a gradual increase in the money market shortage to reflect the growth trend in notes and coin in circulation outside the SARB as well as the required cash reserve holdings of commercial banks, thereby enhancing the robustness of the monetary policy implementation framework. The increased usage of foreign exchange swaps by the SARB coincided with the implementation of the strategy as a measure to manage the impact of short-term fluctuations in notes and coin on the money market shortage. Since September 2016, the SARB has for operational reasons adjusted its liquidity management strategy and managed the money market shortage around the R56.0 billion level.
The following table sets forth the money supply (M1A, M1, M2 and M3) of South Africa during the periods indicated.
Money Supply
| | | As of December 31, | | As of September 30, |
| | | 2013 | | 2014 | | 2015 | | 2016 | | 2017 | | 2018 |
| | | Rand (million) |
| Coin and banknotes in circulation | | 87,014 | | 94,193 | | 101,053 | | 107,573 | | 114,430 | | 119,370 |
| Check and transmission deposits | | 549,323 | | 589,602 | | 657,190 | | 702,822 | | 748,084 | | 749,063 |
| Total: M1A(1) | | 636,337 | | 683,795 | | 758,243 | | 810,395 | | 862,515 | | 868,434 |
| Other demand deposits(2) | | 495,702 | | 557,477 | | 670,265 | | 796,516 | | 838,451 | | 890,276 |
| | | As of December 31, | | As of September 30, |
| | | 2013 | | 2014 | | 2015 | | 2016 | | 2017 | | 2018 |
| | | Rand (million) |
| Total: M1(3) | | 1,132,039 | | 1,241,272 | | 1,428,508 | | 1,606,911 | | 1,700,966 | | 1,758,710 |
| Other short- and medium-term deposits(4) | | 917,655 | | 985,272 | | 1,013,017 | | 994,290 | | 1,105,067 | | 1,107,924 |
| Total: M2(5) | | 2,049,694 | | 2,226,544 | | 2,441,525 | | 2,601,201 | | 2,806,033 | | 2,866,633 |
| Long-term deposits(6) | | 462,557 | | 467,355 | | 534,382 | | 555,346 | | 553,098 | | 682,290 |
| Total: M3(7) | | 2,512,251 | | 2,693,899 | | 2,975,907 | | 3,156,546 | | 3,359,131 | | 3,548,924 |
Notes:
| (1) | Notes and coins in circulation plus check and transmission deposits of the domestic private sector with monetary institutions. |
| (2) | Demand deposits (other than check and transmission deposits) of the domestic private sector with monetary institutions. |
| (3) | M1A plus other demand deposits held by the domestic private sector. |
| (4) | Short-term deposits (other than demand deposits) and medium-term deposits (including all savings deposits) of the domestic private sector with monetary institutions, including savings deposits with, and savings bank certificates issued by the Postbank (a division of the SAPO). |
| (5) | M1 plus other short-term and medium-term deposits held by the domestic private sector. |
| (6) | Long-term deposits of the domestic private sector with monetary institutions, including national saving certificates issued by the Postbank. |
| (7) | M2 plus long-term deposits held by the domestic private sector. |
Source: SARB.
Since the introduction of an inflation-targeting monetary framework, growth in the most broadly defined money supply (M3) has not been used as an intermediate target for monetary policy purposes. Nevertheless, money supply and credit may provide useful information about prospective spending plans and inflationary pressures.
The Basel III capital-adequacy framework and the accompanying regulatory reforms were implemented in January 2013. In line with the requirements of Basel III, the South African banking sector remains well capitalized. South African banks meet the minimum capital adequacy requirements. At the end of September 2018, total capital adequacy stood at 16.4%, common equity tier 1 (CET 1) at 12.7% and at the tier 1 level was 13.2%. The implementation of the Basel III framework in South Africa is based on a phased-in approach which commenced on January 1, 2013 and will continue up to 2019, in line with the timelines determined by the Basel Committee. The Basel III Liquidity Coverage Ratio has been implemented from January 1, 2015, while the Net Stable Funding Ratio became effective on January 1, 2018.
From late 2010 the M3 growth rate fluctuated around an average of 7.0%, displaying a sideways trend in the subsequent years before increasing from 5.9% in February 2014 to a recent high of 10.5% in December 2015. During the four years to June 2014, year-on-year growth in M3 generally fell below that of nominal GDP, but this trend started to reverse towards the end of 2014 and into 2015 as sluggish economic activity and lower commodity prices weighed on the level of nominal value added in the economy. The firmer growth in M3 deposits was underpinned by growth in deposits of both the household and corporate sectors and can partly be ascribed to rising interest rates, accelerating inflation and moderately rising real final demand, combined with a build-up in precautionary balances by asset managers in the wake of renewed financial market volatility. The depreciation of the Rand from 2013 also resulted in an upward revaluation of foreign-currency deposits included in M3. On a quarterly seasonally adjusted and annualized basis, growth in M3 reached a recent high of 13.8% in the second quarter of 2015, before slowing in the subsequent period to as low as 1.2 % in the second quarter of 2017. Growth in M3 slowed significantly in 2016 following a gradual year-on-year increase over the preceding two years. This reflected, among other things, a methodological change to the monetary statistics which partly affected the value of deposits reported by banks from January 2016. In their surveys, reporting banks were requested to move certain short-term debt instruments, such as structured and credit-linked notes, from deposits to debt securities as they fall outside the definition of money. Growth in M3 then trended higher as from mid-2016 and occasionally exceeded the weak expansion in nominal GDP. The upward momentum in money supply growth reflected a notable recovery in the growth of deposit holdings of financial companies, supported by sustained growth in household deposits and a marginal improvement in the deposits of non-financial companies. Factors that contributed to the higher growth in M3 during 2017 included institutional investor receipts of proceeds from the redemption of the R203 government bond in September, which shifted deposits from government to deposit holders, being included in the calculation of money supply; and banks’ drive, in the context of Basel III liquidity requirements, to attract and maintain stable longer-term deposits, especially of the household sector. In 2018 the quarter-to-quarter seasonally adjusted and annualized growth in M3 rebounded from 0.1% in the second quarter of 2018 to 9.9% in the third quarter. The recovery was supported by an increase in the deposit holdings of the corporate sector amidst uncertain financial market conditions, while growth in household sector deposits slowed marginally in the wake of the increase in the value-added tax (VAT) rate and rising fuel prices.
Cash, check and other demand deposits expanded at an average year-on-year rate of 4.6% in the first nine months of 2018, down from 9.8% in 2017. Despite private sector banks’ efforts to attract stable funding, growth in long-term deposits only averaged 4.7% through September 30, 2018, down from 8.0% in 2016. By contrast, growth in short- and medium-term deposits fluctuated below zero % during most of 2016 and 2017, although it rebounded to average year-on-year growth of 10.1% in the first nine months of 2018. The contribution of long-term deposits to total deposit balances remained at around 19% for most of 2017, with cash, check and other demand deposits accounting for 49%.
Financial System Stability
The SARB regards the achievement and maintenance of price stability as its primary goal. A necessary parallel objective to this is financial system stability, without which monetary policy cannot be effectively implemented. To pursue the maintenance of financially stable conditions and contain systemic risk, the SARB, with the help of the Financial Stability Committee and the Financial Stability Department continuously assesses the stability and efficiency of the key components of the financial system and, formulates and reviews policies for intervention and crisis resolution. In 1999, the SARB established a Financial Stability Committee with the specific mandate to strive to enhance financial stability by continuously assessing the stability and efficiency of the financial system, formulating and reviewing appropriate policies for intervention and crisis resolution, and strengthening the key components of the financial system. A Financial Stability Department was established within the SARB with effect from August 1, 2001 to help monitor the stability of the financial system as a whole by identifying inherent weaknesses and the build-up of risks that may result in financial system disturbances. Central to the SARB’s increased focus on, and contribution to, the financial stability discourse, a semi-annual Financial Stability Review is published that covers both a quantitative and qualitative assessment of the strength and weakness of the South African financial system.
A cross-sectoral body was created in 2002 to facilitate cooperation in identifying threats to the stability of the South African financial sector and in proposing and obtaining approval for appropriate plans, mechanisms and structures to mitigate such threats. This body creates a coordinated network of contingency planning contacts throughout the financial services industry, and has the capacity to act as a crisis management team to deal with tactical situations affecting one or more firms. It also facilitates cooperation between key financial sector institutions and regulators in times of catastrophic events or disasters through business continuity planning, which serves to protect staff, facilitate recovery and sustain both a stable financial market and consumer confidence.
The Financial Sector Regulation Act (FSR Act) came into effect on 1 April 2018. The Act provides an explicit financial stability mandate to the SARB and also creates statutory structures for the coordination and cooperation on financial stability issues among financial sector regulators. The Financial Stability Oversight Committee (FSOC), as set out in the FSR Act is composed of representatives from the Financial Sector Conduct Authority, Prudential Authority, Financial Intelligence Centre, National Credit Regulator as well as the SARB. Its primary objective is to support the SARB in promoting financial stability, through co-operation and collaboration, and co-ordination of action, among the financial sector regulators and the SARB. The Act also establishes the Financial Sector Contingency Forum, which also includes representatives from the industry, and has as its main objective assisting the FSOC with the identification of potential risks and to coordinating appropriate plans and actions to mitigate such risks.
Regulation of the Financial Sector
Since 1994, South Africa has made a dedicated effort to deregulate the financial sector. The new market-based approach to regulation relies heavily on the use of strengthened corporate governance and accountability principles, enhanced disclosure systems, and market discipline as an incentive to compliance. Although increased deregulation has encouraged both competition and innovation, it has simultaneously demanded heightened supervision, more explicit market integrity and strengthened consumer protection mechanisms.
South Africa is committed to implementing legislative and regulatory frameworks that are robust and in line with international commitments to reform financial sectors and markets in line with the otherG20 jurisdictions. The FSR Act, introduces a Twin Peaks structure of regulation, establishing the Prudential Authority (PA) under the administration of the SARB and the Financial Sector Conduct Authority (FSCA) as the primary Authorities in the regulation of financial sector. However, the SARB remains the authority for the financial stability mandate. Objectives of PA include the promotion and enhancement of the safety and soundness of financial institutions and of market infrastructures, protection of financial customers from risks of those regulated financial institutions emanating from their failure to meet obligations and in addition assisting the SARB in maintaining financial stability. The FSCA has a market conduct focus, with objectives to enhance and support the efficiency and integrity of financial markets, the protection of financial customers by promoting fair treatment of financial customers, provision of financial education programs in addition to assisting in maintaining financial stability. The Authorities have various regulatory instruments including prudential and conduct standards, in line with their respective roles.
Domestic regulation and supervision requirements incorporate international standards. For instance, South African financial institutions must comply with all relevant Basel capital adequacy and liquidity standards. The phase-in period for the Basel III requirements began on January 1, 2013 and is anticipated to last through 2019. South Africa is already in compliance with the capital requirements of Basel III and will continue to comply with all the other related requirements within the stipulated timeline. South African financial institutions must also comply with the financial reporting and disclosure standards incorporated in the international accounting standards, adopted by the International Organization of Securities Commissions. The various financial markets, financial institutions and financial instruments are regulated by a series of general, specific and enabling legislation.
Legislation enacted in 1998 provides for an independent competition authority, comprising an investigative division and an adjudicative division with broad powers to, among other things, issue compliance orders and interdicts, levy fines, impose structural remedies such as divestitures and prohibit mergers. The legislation also provides for a right of appeal to a specially-constituted judicial authority. In the majority of cases, the adjudicative divisions have sole jurisdiction over competition matters. Amendments to the legislation enacted in 1999 require pre-merger notification in particular cases.
Recent legislative and regulatory initiatives coming into force since 2015 include the following:
| ● | The Financial Sector Regulation (FSR) Act, (no.9 of 2017), came into effect on 1 April 2019 and the PA and FSCA were established on the same date. The FSR Act has as its objective to enhance financial stability and mandates the SARB as the key player, with contributions from the PA. In addition, the FSR Act promotes, among other things, financial stability, the fair treatment and protection of financial customers, the efficiency and integrity of the financial system, the prevention of financial crime and transformation in the financial sector. |
| ● | The Portfolio Committee on Trade and Industry was granted permission by the National Assembly to introduce the National Credit Amendment Bill of 2018 (Committee Bill) addressing debt relief. The draft Committee Bill, which was published for public comment on November 24, 2017, and primarily aims to amend the NCA, 2005, providing for a debt intervention and matters connected therewith. |
| ● | In December 2016, Parliament’s Standing Committee on Finance (SCOF) invited the public to make written submissions on the Insurance Bill, 2016, which was tabled by National Treasury in Parliament on January 28, 2016. The Bill provides a consolidated legal framework for the prudential supervision of the insurance sector in line with the international standards for insurance regulation and supervision. |
| ● | In February 2018, National Treasury published the final Ministerial Regulations issued in terms of the Financial Markets Act. These regulations cover the OTC derivatives markets and mark a significant achievement in terms of meeting the G20 obligations to implement legislative and regulatory reforms for safer financial markets. In Addition, the Financial Sector Conduct Authority and the Prudential Authority have issued accompanying conduct and joint standards for the authorization of OTC derivatives providers, additional trade repository licensing requirements, conduct standards for providers, and trade-reporting obligations. In addition, the Regulators published for final consultation, a third draft of the margin requirements for non-centrally cleared OTC derivatives. |
| ● | In 2016, the FSB (now FSCA) granted two new exchange licenses in terms of the Financial Markets Act, to ZARX (Pty) Ltd (ZAR X) and 4 Africa Exchange (Pty) Ltd (4AX). In 2017, the licensing of A2X markets, and Equities Express Securities Exchange (EESE) increased the number of local exchanges to four, including the JSE. |
| ● | The National Treasury is exploring options to promote entry into the banking sector as South Africa’s highly concentrated banking sector may compromise the level of competition needed to bring about efficiency improvements and greater access to financial services. |
| ● | South Africa is proposing a deposit insurance scheme, which can contribute to the development of a less concentrated banking sector and support financial inclusion and transformation of the sector. |
| ● | In June 2015, the Banks Amendment Act 2015 was enacted to amend the Banks Act 1990. The Act aims to enhance the curatorship of banks in order to make the financial sector safer and protect depositors. The Act enhances the powers of the curator of a bank while under curatorship by expanding the basis on which a curator of a bank may dispose of all or part of the bank providing for: |
| ● | allowing for the creation of a good bank outside the existing corporate entity; |
| ● | facilitation of the transfer of all or part of a bank’s business to a successor entity; |
| ● | a disposal pursuant to a transfer under section 54 of the Banks Act; and |
| ● | facilitation of the implementation of the above steps by the curator. |
| ● | In May 2017, the SARB published for public comment a discussion paper entitled “designing a deposit insurance scheme for South Africa”. The deposit insurance scheme aims to protect less financially sophisticated depositors in the event of a bank failure, thereby contributing to customer protection, enhancing the stability of the South African financial system. The scheme is also intended to increase competition in the banking sector by promoting entry into the banking sector as well as introduce efficiency improvements. |
| ● | In April 2017, the Financial Intelligence Amendment Bill was signed into law. The Financial Intelligence Amendment Act seeks to strengthen the commitment to combatting financial crimes and address the gaps identified in the Financial Action Task Force and the IMF’s Financial Assessment Programme Technical Note on AML/CFT for South Africa in December 2014. |
| ● | On November 6, 2015, DTI released a review of final limitations on fees and interest rate regulations, which was effected from May 2016. The review introduced new caps on fees and interest rates applicable to credit agreements falling under the National Credit Act 34 of 2005. The biggest change relates to unsecured credit agreements, where the proposed cap was reduced to 28.0% from 35.4% based on the then prevailing repurchase rate of 7.0%. The caps aim to protect consumers from unscrupulous lending practices and over-indebtedness. However, the credit providers have warned against the unintended consequences of these proposals, which include credit rationing and an increase in the number of banks introducing credit life insurance policies to circumvent lower interest rate caps. |
| ● | On January 16, 2019, the Crypto Assets Regulatory Working Group released a consultation paper on policy proposals for crypto assets. The paper discusses issues relating to the classification of crypto assets, the risks and benefits of crypto assets and tentative proposals on how to regulate crypto assets in South Africa. |
The foundation of the exchange control system in South Africa is the Currency and Exchanges Act of 1933, which entitles the President to enact regulations in relation to any matter relating to currency, banking or exchanges. Reforms implemented since 1994 have adapted the framework of exchange control to remove most of the major barriers to cross-border transactions. However, the Act of 1933 and the Regulations of 1961 (as amended) (Regulations) continue to form the basis of the exchange control system to this day. The Regulations set out prohibitions on the holding or dealing in foreign currency and gold and the exporting of capital or rights to capital except under the permissions and conditions set by the Treasury. The Minister of Finance has delegated responsibility for the administration of exchange control to the SARB, with certain exceptions. The Minister of Finance appoints banks as Authorized Dealers in foreign exchange to support the administration of controls, guided by the Exchange Control Rulings (issued by the Reserve Bank), which set out the authorities granted to Authorized Dealers and the detailed rules and procedures to be followed. See “Monetary and Financial System – Exchange Control” below.
Structure of the Banking Industry
At the end of October 2017, 19 banks, three mutual banks and 15 local branches of foreign banks were registered with the Office of the Registrar of Banks. In addition, 30 foreign banks had authorized representative offices in South Africa.
The four largest banking groups dominating the South African banking sector are ABSA Bank Limited, the Standard Bank of South Africa Limited, FirstRand Bank Limited and Nedbank Limited, and maintained 82.0% of total banking-sector assets at the end of October 2017. The four largest banks offer a wide range of services to both individual and corporate customers at branches across all nine provinces.
The South African banking system remained profitable and adequately capitalized throughout 2016 and into 2017. The total stock of outstanding loans and advances in the banking sector increased by 4.0% to R3,856 billion as at the end of October 2017 (October 2016: R3,706 billion). The capital adequacy ratio for the banking sector was 16.8% in October 2017, exceeding the 9.5% minimum capital adequacy requirement and therefore reflecting adequate systemic capitalization. The banking sector’s capital consists mainly of share capital and reserves (the highest loss-absorbing capital types).
Total banking-sector assets increased from R4,881 billion at the end of October 2016 to R5,124 billion at the end of October 2017, representing a 5.0% increase. The increase in total banking-sector assets is largely attributable to an increase in term loans, treasury bills and other dated investment and trading securities. Impaired advances to gross loans and advances, a key indicator of credit risk, has declined marginally to 2.8% in October 2017 compared to 2.9% in October 2016.
Financial Sector Charter
In August 2002, the financial sector voluntarily committed itself to developing a charter to address historical sector imbalances, particularly with reference to human resource development, broadening economic participation and access to financial services. Thereafter, key industry stakeholders came together to develop the Financial Sector Charter, which was launched by the industry and the Minister of Finance in October 2003. The Financial Sector Charter was built around a central vision of promoting a transformed, vibrant and globally-competitive financial sector that reflects the socioeconomic demographics of South Africa and contributes to the establishment of an equitable society by effectively providing accessible financial services to all South Africans and directing investment into targeted areas in the economy.
The Financial Sector Charter established sector transformation goals, emphasizing targets for human resource development, procurement and enterprise development, access to financial services and ownership transfer. In order to provide access to financial services, the country’s four major retail banks – ABSA, FirstRand, Nedbank and Standard Bank – as well as the Postbank, launched the Mzansi account in October 2004. Mzansi is a low cost national bank account aimed at ensuring that those falling within the lower socio-economic groups have access to first-order retail banking products that would provide them with entry-level banking services. There have been approximately six million Mzansi accounts opened, 4.5 million of which were opened by South Africa’s four major commercial banks. It is estimated that 72.0% of these were first-time accounts. Major banks have since de-emphasized Mzansi and are promoting their own branded low-income accounts. The percentage of adult South Africans who use banking services has improved from 51.0% as at June 30, 2006 to 75.0% as at June 30, 2013.
In addition, the financial sector committed to ensuring that 80.0% of the population in lower income groups has access to full-service banking points of presence within at least 15 kilometers of every poor South African and cash-withdrawal points of presence such as automatic teller machines within at least ten kilometers. By December 2010, 91.6% of poor households had access to points of presence of banks and Postbank within ten kilometers of their home. This percentage was 84.7% if only the big four banks are considered.
Credit Allocation
Growth in bank credit extended to the domestic private sector declined steadily to an annual average of 6.8% in 2016 and 5.5% in 2017, following four consecutive years of average growth of approximately 8.0%. The decline in credit growth reflected the depressed state of domestic economic activity. Year-on-year growth in total loans and advances reached a post-recession low of 3.8% in January 2018 – its lowest rate since August 2010. However, growth in credit extension was impacted by the implementation of International Financial Reporting Standard 9 from January 2018. Banks’ calculation of the provision for credit losses (impairments) changed fundamentally, which affected outstanding credit balances. The impairment requirements in the new IFRS 9 standard are based on an expected credit loss model and replace the International Accounting Standard (IAS) 39 Financial Instruments: Recognition and Measurement incurred loss model. Subsequently, growth over 12 months in credit extension to both the household and corporate sectors increased moderately as total loans and advances extended by monetary institutions to the domestic private sector increased from 3.8% in January 2018 to 5.2% in September. However, average growth at 4.6% through September 2018 was still well below the 7.4% and 5.5% in the same periods in 2016 and 2017 as persistent low business confidence and high unemployment weighed on credit demand. Nonetheless, growth in credit extension to companies remained weak, likely suppressed by reduced corporate investment amid protracted weak domestic demand and low business confidence in an environment of heightened political uncertainty. Domestic demand for goods and services was affected by reduced household spending as a result of uncertain employment prospects, which contributed to weak household demand for bank credit. The quarter-to-quarter seasonally adjusted and annualized growth in total loans and advances to the private sector decreased from a high of 10.3% in the fourth quarter of 2015, to 2.7% in the first quarter of 2018, reflecting not only a loss of momentum, but also the technical adjustment mentioned above. The quarterly growth rate then accelerated to 7.8% in the third quarter of 2018. The slower growth in credit extension relative to nominal GDP resulted in a decrease in the ratio of credit to GDP, from 73.7% in the fourth quarter of 2015 to 70.9% in the second quarter of 2018.
Growth in mortgage advances on commercial property has slowed significantly from a high of 16.1% in September 2015 to 6.8% in December 2017. In 2018 growth initially accelerated to 9.1% in April before moderating to 5.3% in September. Growth in mortgage advances on residential property was relatively static, remaining at approximately 3.4% in the first nine months of 2018, moderately down from a recent peak of 4.2% in February 2016. Instalment sale credit and leasing finance, mostly used for the financing of new and second-hand vehicles, increased moderately from 2.4% in May 2016 to 6.2% in September 2018, in line with stronger new vehicle sales.
The following table sets out the distribution of gross credit exposure at the end of September 2018.
Percentage distribution of total credit extended (as of September 30, 2018)
| | Percentage distribution of total gross credit
exposure of banks |
| Corporate exposure | 38.1 |
| Public sector entities | 2.2 |
| Local government and municipalities | 0.4 |
| Sovereign (including central government and central bank) | 9.8 |
| Banks | 11.6 |
| Securities firms | 3.2 |
| Retail exposure | 34.0 |
| Securitization exposure | 0.7 |
Source: SARB
The following table sets out the distribution of gross credit exposure by economic sector at the end of September 2018.
Credit extension by economic sector as of September 30, 2018
Sectorial distribution of credit | | Rand (billion) | | As a percentage of total credit |
| Agriculture, hunting, forestry and fishing | | 124.3 | | 2.0 |
| Mining and quarrying | | 191.9 | | 3.0 |
| Manufacturing | | 327.2 | | 5.2 |
| Electricity | | 154.6 | | 2.4 |
| Construction | | 64.7 | | 1.0 |
| Wholesale, retail trade and accommodation | | 364.9 | | 5.8 |
| Transport and communication | | 209.5 | | 3.3 |
| Financial intermediation and insurance | | 1,509.3 | | 23.9 |
| Real estate | | 536.5 | | 8.5 |
| Business services | | 224.8 | | 3.6 |
| Community, social and personal services | | 465.4 | | 7.4 |
| Private households | | 1,861.0 | | 29.5 |
| Other | | 275.3 | | 4.4 |
| Total | | 6,309.3 | | 100.00 |
Source: SARB
The following table sets out the geographical distribution of gross credit exposure as of September 30, 2018.
Geographical distribution of credit | | Rand (billion) | | As a percentage of total credit |
| South Africa | | 5,482.8 | | 86.9 |
| Other African countries | | 176.7 | | 2.8 |
| Europe | | 422.8 | | 6.7 |
| Asia | | 63.1 | | 1.0 |
| North America | | 138.8 | | 2.2 |
| South America | | 6.3 | | 0.1 |
| Other | | 18.9 | | 0.3 |
| Total | | 6,309.2 | | 100.0 |
Source: SARB
Capital Markets
The JSE was established in 1887 and is a licensed exchange for all securities. The JSE is governed externally by South African legislation and internally by its own rules and regulations. The JSE was listed on June 5, 2006. The listing included a proposal regarding the implementation of a B-BBEE initiative. In February 2011, the JSE launched the Black Economic Empowerment (BEE) Segment, offering a facility for BEE-compliant parties to list and trade BEE scheme shares. Subsequent to the Financial Sector Conduct Authority’s (FSCA) change in policy in relation to the regulation of all providers of over-the-counter (OTC) share trading platforms, the JSE made amendments to the JSE Listings Requirements in July 2015 to allow trading in BEE securities on the BEE Segment via the use of a verification agent, in addition to the current BEE contract route. Consequently, some companies moved from OTC trading to a listing on the JSE’s BEE Segment. At the end of September 2018, a total of two companies were listed on the JSE’s BEE Segment.
The FSCA has granted four new stock exchange licenses in recent yearsZAR X started trading in February 2017, followed by 4 Africa Exchange (4AX) in September 2017 and A2X Markets (A2X) in October 2017. The fourth new exchange, Equity Express Securities Exchange (EESE), started trading in December 2017.Together with JSE, South Africa now has five licensed stock exchanges.
The introduction of the Johannesburg Equities Trading system (JET), an electronic, automated and central order-driven system, culminated in the closure of the trading floor in 1996. Subsequently, the trading system and real-time information dissemination system (InfoWiz) of the London Stock Exchange (LSE), replaced JET in May 2002. In 2007, the JSE and the LSE both moved onto the LSE’s new trading platform, TradElectTM. JSE members connected to JSE TradElectTM and InfoWiz through a hub at the JSE in South Africa. In July 2012, the JSE moved its equity market trading activity onto Millennium ExchangeTM after concluding a license agreement with technology solutions provider MillenniumIT. Consequently, the JSE’s trading system relocated from London to Johannesburg.
In June 2003, the JSE announced the first alternative “exchange” in Africa that would list small- and medium-sized companies, specifically targeting B-BBEE and junior mining companies. The Alternative Exchange (AltX) opened in October 2003 and runs parallel to the main board, with separate listings requirements and reduced fees. As of September 30, 2018, 46 companies were listed on AltX with a market capitalization of R19.8 billion.
The South African Futures Exchange (SAFEX) is the forum for trading futures and options contracts. The JSE acquired SAFEX in August 2001 and merged it into the JSE as the Equity Derivatives Market and the Commodity Derivatives Market. Colloquially, the term “SAFEX” is still used to refer to the JSE’s derivatives market. In February 2005, the JSE launched Yield-X, which is the platform for trading of all interest rate-related and currency derivative products. Subsequent to the BESA merger, Yield-X has been collapsed into the JSE’s Interest Rate and Currency Derivatives Markets.
Derivative instruments are traded either on an OTC basis or on an exchange. The Equity and Commodity Derivatives Markets of the JSE, together with the Interest Rate and Currency Derivatives Markets are responsible for traing in all futures contracts and options on futures. SAFEX Clearing Company (Pty) Limited (Safcom) is the clearing house for SAFEX and also provides compliance, surveillance and other exchange services. SAFEX introduced commodity futures in South Africa in July 1995, Rand-Dollar futures in May 1997, and individual equity futures in February 1999. On June 18, 2007, the JSE began trading in various foreign currency derivatives. The financial market infrastructure was modernized in 2008 through the replacement by the JSE of its 15-year-old derivatives system with a multiple instrument online trading system, Nutron.
Regulation of insider trading is vested in the FSCA, which has extensive surveillance and detection capability and was established in partnership with the JSE. The JSE published a revised booklet on Insider trading and other market abuses in August 2013. The purpose of this booklet is to bring together the various acts, requirements and relevant corporate governance guidelines that have a bearing on preventing market abuse.
Pursuant to the amalgamation of the BESA and the JSE in June 2009, the trading platforms of the two interest rate markets operated by the JSE, namely the Yield-X market and the BESA market, were integrated in 2011. As a result, the old BESA BTB system was decommissioned and the reporting of bond transactions migrated onto the JSE Nutron platform on May 9, 2011. The rules and directives covering the integrated markets (Yield-X and BESA) known as the ‘JSE Interest Rate and Currency (IRC) rules and directives’ also came into effect on May 9, 2011, thus repealing the old rules and directives previously applicable to the BESA market.
The JSE launched in August 2018 a new electronic trading platform for primary dealers in government bonds. The new platform is envisaged to improve liquidity through transparency, price discovery and settlement assurance allowing traders to transact at lower trading costs.
While Share Transactions Totally Electronic (Strate) has been the only central securities depository since its inception in 1999, the FSCA granted Granite Central Securities Depository a financial market infrastructure license to operate as such a depository in August 2015. The license mandate is for bonds and money-market instruments. Strate is in the process of modernizing the market infrastructure for its money-market, bond and equity depository operations with a software suite streamlining its service across all asset classes as the three systems are consolidated into one. To date, Strate implemented the new system for money-market instruments and bonds.
The main index charting the performance of the JSE is the FTSE/JSE All-Share Price Index. At September 30, 2018, the FTSE/JSE All-Share Price Index included 165 companies and accounted for approximately 81.8% (on a gross market capitalization basis) of the market capitalization of the JSE. As at November 30, 2018, the ten largest companies by market capitalization represented approximately 64.9% of total market capitalization.
Exchange Controls
South African law provides for exchange controls, which, among other things, restrict the outward flow of capital from South Africa, the Kingdoms of Lesotho and Eswatini and the Republic of Namibia, known as the common monetary area (CMA). The Exchange Control Regulations are applied throughout the CMA and regulate transactions involving South African residents, including companies and institutional investors. The basic purpose of the Exchange Control Regulations is to mitigate the negative effects caused by a decline of foreign capital reserves in South Africa, which could result in the devaluation of the Rand. The National Government has, however, committed itself to gradually relaxing exchange controls. On October 1, 2016, a joint tax and exchange control Special Voluntary Disclosure Programme (SVDP) commenced which ended on August 31, 2017. The SVDP was a joint initiative between the South African Revenue Service (SARS) and the SARB, in conjunction with the National Treasury, for individuals and companies to regularize both their unauthorized tax and exchange control affairs, for a limited period.
The SARB, on behalf of the Minister of Finance, administers South Africa’s exchange control regulations. The appointment of Authorized Dealers in foreign exchange (Authorized Dealers) and Authorized Dealers in foreign exchange with limited authority (ADLAs), previously considered and approved by the Minister of Finance, has been delegated to the Financial Surveillance Department. A number of banking institutions and entities have been appointed as Authorized Dealers and/or Authorized Dealers in foreign exchange with limited authority. In addition, in 2017, the first Restricted Authorized Dealer was appointed. Such banking institutions and entities undertake foreign exchange transactions for their own account on behalf of their clients, subject to conditions established by the SARB. Until 1995, control over non-residents’ capital transactions was based mainly on the Financial Rand System, which was reintroduced in 1985 at the time of the proclamation of the debt standstill. In March 1995, the National Government abolished the Financial Rand System and the resulting dual exchange rate. No capital controls are, therefore, applied to non-residents, who may freely invest in and disinvest from South Africa. This applies to portfolio investment as well as foreign direct investment into South Africa.
Since the abolition of the Financial Rand System in 1995, South Africa has had a unitary exchange rate that applies to both current and capital transactions between residents and non-residents. As discussed below, South African residents still face certain restrictions. However, these restrictions have gradually been eased to foster macroeconomic stability, a stronger balance of payments and financial sector development. The proposed strategy going forward is characterized by a fundamental shift from a system where a substantial fraction of cross-border transactions are subject to restrictions, approvals and administrative requirements to a more open regime where transactions are generally permitted with a narrow set of regulations targeted at specific national interests, macroeconomic and financial risks. In 2014, the Minister of Finance announced that the National Treasury, in conjunction with the SARB and other stakeholders would streamline the Exchange Control Rulings and associated Exchange Control Manual in order to, among others, improve administration. With a view to transparency regarding remaining exchange controls in place, two Currency and Exchanges Manuals, for Authorized Dealers and ADLAs, respectively, as well as two guideline documents for individuals and business entities were published on the website of the SARB on July 29, 2016, for implementation from August 1, 2016. This was the first time that the technical document, normally only issued to Authorized Dealers, was made available to the public.
The broad principles for exchange control reforms are as follows:
| ● | supporting macroeconomic and financial stability through the macro-prudential regulation of cross border capital flows; |
| ● | encouraging the growth of South African companies in domestic, regional and international markets; |
| ● | supporting cross-border trade and higher levels of foreign direct investment in South Africa; |
| ● | support the overarching strategy for increasing investment and growth; |
| ● | reflect a fundamental shift in the approach to regulation; |
| ● | recognize the different objectives that are supported by exchange controls (e.g., contributing to systemic stability; supporting prudential regulation of financial institutions; protecting the tax base; and supporting the prevention of financial crime (including money laundering)); |
| ● | address the distortions created by exchange controls; |
| ● | holistic approach taking into account interactions between institutions and individuals, residents and non-residents; and |
| ● | proportionate reporting requirements. |
The present exchange control system in South Africa is used primarily to control movements of capital by South African residents. In order to ensure that capital transfers are not disguised as current payments, controls and limits are placed on transfers of a current nature. South African residents may avail of a single discretionary allowance of up to R1 million per calendar year, without the requirement to obtain a Tax Clearance Certificate, that may be used for any legal purpose (including for investment purposes abroad as well as the sending of gift parcels in lieu of cash, excluding gold and jewelry) without any documentary evidence having to be produced, except for travel purposes outside the CMA, where certain prescribed documentation is required. In addition, private individuals may invest up to R10 million per calendar year for any purpose outside the CMA, provided that the individual is over the age of 18 years and subject to obtaining a Tax Clearance Certificate, which is issued by SARS.
Furthermore, in order to eliminate the bias against residents, the SARB’s Financial Surveillance Department will consider investments by residents in excess of the R10 million foreign capital allowance, subject to certain conditions, such as tax compliance. South African residents who are temporarily abroad may also avail of the R1 million single discretionary allowance and the R10 million foreign capital allowance per calendar year without returning to South Africa. Residents temporarily abroad may also receive pension and retirement annuities as well as monetary gifts and loans.
The Minister of Finance also announced the removal of controls on emigrants’ remaining assets. Emigrants can now transfer up to R10 million per single person or R20 million per family unit per calendar year and emigrants can also apply to the SARB’s Financial Surveillance Department for the transfer of all their assets without the application of any exit levy to free those assets, provided their tax obligations were met.
With effect from October 2004, limits on foreign direct investments by South African corporates were abolished. Dividends declared by offshore subsidiaries of South African companies may be retained offshore. Foreign dividends repatriated to South Africa may be retransferred offshore again at any time for any purpose. Corporates are allowed, on application, to transfer funds from South Africa for each new and approved foreign investment outside the CMA. Authorized Dealers administer the directives and guidelines on foreign direct investments under R1 billion, per company, per calendar year. Application to the SARB’s Financial Surveillance Department for prior approval of a foreign investment is still required for foreign direct investments over R1 billion, per company, per calendar year. These applications, which allow the SARB to monitor the level of foreign investment, are considered on merit and are granted if South African exchange control authorities believe the investments would be of long-term economic benefit to South Africa. As of February 21, 2018 the minimum requirement to obtain at least 10.0% of the foreign target entity’s equity and/or voting rights has been abolished. This necessitates a distinction between foreign direct investments and foreign portfolio investments, the latter now being defined as a category of international investments that covers investments in equity and debt securities, excluding any such instruments that are classified as foreign direct investments. Foreign portfolio investments reflect investments in which companies and private equity funds, who are tax residents in South Africa, own less than 10.0% of the voting rights in the foreign target entity.
The SARB reserves the right to stagger capital outflows relating to very large foreign investments to manage any potential impact on the foreign exchange market. In order to reduce the administrative costs and procedures of doing business for corporates, the Minister of Finance, in the 2011 MTBPS, allowed corporates to be able to top up capital in their off-shore business from South Africa, provided they remain within an annual limit, which is currently R1 billion. The transfer of the unutilized amounts and/or additional working capital to foreign target entities and/or to increase an applicant’s approved equity interest and/or voting rights in an off-shore target entity, as and when required, is permitted without recourse to South Africa. South African corporates are also allowed to make bona fide new outward foreign direct investments outside their current line of business.
South African companies are generally permitted to undertake international expansion and the policy stance is to encourage growth into the rest of Africa. There are no limits on the use of domestic capital for funding investment, although administrative and reporting conditions remain in place and investments above R1 billion per year require approval. The HoldCo regime introduced in 2013 provides local companies with a structure for managing their multinational operations without restrictions. With effect from February 21, 2018, listed companies may transfer up to R3 billion per calendar year into approved HoldCos; unlisted companies may transfer up to R2 billion per calendar year, subject to transparency requirements. Listed companies can further apply to the SARB to transfer additional amounts of up to 25.0% of the company’s market capitalization, subject to demonstrated benefits for South Africa. Unlisted companies may also apply for additional funding.
In the 2009 MTBPS, reforms to reduce red tape on business transactions were announced. The prohibition on Southern African Development Community (SADC) loop structures was abolished and in the 2011 MTBPS, the Minister of Finance announced that transactions which result in ‘loop’ structures not exceeding a threshold of 10.0% - 20.0% equity, and/or voting rights, whichever is higher, in the foreign target entity, will be processed by Authorized Dealers without the need for prior approvals. With effect from February 21, 2018 South African companies are now permitted to acquire up to 40.0% equity and/or voting rights, whichever is the higher, in a foreign target entity which may hold investments and/or make loans into any CMA country. This dispensation does not apply to foreign direct investments and foreign portfolio investments where the South African company on its own or where several South African companies collectively hold an equity interest and/or voting rights in the foreign target entity that exceed 40.0% in total. Loop structures above 40.0% require prior approval from the Financial Surveillance Department of SARB who will apply due consideration to transparency, tax, equivalent audit standards and governance.
From March 1, 2017, South African residents, excluding mandated state-owned companies, have been granted certain exemptions relating to the sale, transfer, assignment and licensing of intellectual property to unrelated non-resident parties in an arm’s length transaction and at a fair market price.
In the 2010 MTBPS, the Minister of Finance announced measures to encourage global diversification from a domestic base by using South Africa as a gateway to Africa. In this regard, from January 1, 2010, qualifying internationally headquartered companies are allowed to raise and deploy capital offshore without the need to obtain exchange control approval, subject to reporting requirements. With effect from November 2012, the shares and/or debt of a headquarter company may be listed on regulated South African exchanges or be held directly or indirectly by a shareholder with shares or debt listed on regulated South African exchanges.
A 1:1 ratio remains applicable for the acquisition of residential properties and any other financial transactions (such as portfolio investments, securities lending, hedging and repurchase agreements, among others) by non-residents and affected persons. Local financial assistance made available to emigrants also remains subject to the 1:1 ratio for financial transactions and/or the acquisition of residential or commercial property in South Africa. Emigrants that utilize their remaining Rand assets as collateral must comply with the 1:1 ratio irrespective of the nature of the transaction.
Authorized Dealers are allowed to approve the granting of credit terms in respect of exports only for periods not exceeding six months, with an extension of a further six months in certain circumstances without reference to the SARB. In an endeavor to reduce barriers to trade, the Minister allowed corporates to do advance payments for capital goods for up to 100.0% of ex-factory cost of goods to be imported not exceeding a total value of R10 million. Payments for importation of capital goods in excess of R10 million may only be provided up to 50.0% of the ex-factory cost of the goods to be imported. The requirement for Authorized Dealers to view a copy of the SARS Customs Declaration bearing the Movement Reference Number (MRN) in respect of advance payments for imports has been dispensed with for payments up to R50,000. Furthermore, corporates are allowed to cover forward (using forward exchange contracts) up to 75.0% of budgeted import commitments or export accruals in respect of the forthcoming financial year without an application to the SARB. The R250,000 limit on advance payments for permissible imports, other than capital goods, was removed and South African companies are allowed to open foreign bank accounts for permissible purposes without prior approval, subject to reporting obligations.
South African companies involved in international trade are permitted to operate a single customer foreign currency (CFC) account for both trade and services and use it for a wider variety of permissible transactions. This reduced the transaction costs associated with multi CFC accounts and their restricted use. South African importers and exporters of goods have been permitted to offset permissible costs over a CFC account. The requirement that companies must convert foreign exchange credited to a CFC account to Rand within 180 days was removed, however there is still a requirement to repatriate export proceeds to South Africa.
In addition, foreign currency purchased in the spot market for permissible transactions in respect of a firm and ascertainable underlying commitment, or the maturity proceeds of hedging contracts, may be credited to a CFC account if the funds are transferred abroad within a period of 30 days.
Various measures aimed at easing certain of the country’s remaining exchange control regulations became effective in the late 1990s. The measures included: abolishing most of the remaining quantitative limits on current account transactions; permitting South African institutions to invest funds abroad; permitting trading of Rand dollar futures contracts on SAFEX, with participation initially restricted to individuals and institutional investors; and relaxing the application of local borrowings limits to foreign-controlled South African companies.
Retirement funds and underwritten policies of long-term insurers are permitted, without prior SARB approval, to invest up to 30.0% of their total retail assets under management in foreign assets and an additional 10.0% in Africa. Collective investment scheme management companies, investment managers registered as institutional investors for exchange control purposes and investment- linked businesses of long-term insurers are permitted to invest up to 40.0% of their total retail assets under management in foreign assets and an additional 10.0% in Africa.
The macro-prudential limit for Authorized Dealers was introduced in 2010 and enabled Authorized Dealers to acquire direct and indirect foreign exposure of up to a macro-prudential limit of 25.0% of their total liabilities excluding total shareholders’ equity.
In the 2013 Budget Speech, the Minister of Finance announced that Authorized Dealers may invest an additional 5.0% of their total liabilities, excluding total shareholders’ equity, for expansion into Africa, in addition to the current macro-prudential limit of 25.0%.
In the 2014 Budget Speech, the Minister of Finance announced that Authorized Dealers are allowed to participate in foreign syndicated loans, regardless of whether the borrower is resident or not, provided they are within their macro-prudential foreign exposure limit.
Foreign entities are permitted to list equity, debt and derivative instruments on regulated South African exchanges. Foreign entities, local Authorized Dealers and regulated South African exchanges are allowed to issue inward listed instruments referencing foreign assets on regulated South African exchanges, subject to prior approval. Furthermore, South African private individuals, corporates, trusts, partnerships and emigrants are permitted to invest without restrictions in approved inward-listed instruments on regulated South African exchanges. Foreign companies may be allowed to use their shares as acquisition currency, subject to prior approval from the SARB’s Financial Surveillance Department.
In the 2011 MTBPS, the Minister of Finance announced further significant reforms of inward listings in order to promote the development of the South African capital markets. All listed shares on the JSE Limited, traded and settled in Rand, would be classified as domestic assets for the purpose of trading on the JSE Limited and inclusion in its indices. This new dispensation did not affect companies which were classified as domestic, which had a primary listing on a foreign exchange, which would continue to be included in the indices as was then the case. This initiative was intended to improve South Africa’s position as a financial gateway into Africa. However, in order to maintain a balance between capital market growth and development and the objective of managing exposure to foreign risk, prudential institutions would still be required to report their foreign exposure to regulatory authorities.
These changes also heralded a shift in the regulatory regime from control measures to prudential regulation.
The restrictions on South African companies and other entities to participate in foreign inward-listed securities on the JSE Limited, including participation in the Rand futures, were removed. These changes enabled South African companies, trusts, partnerships and banks to manage their foreign exposure. These changes also allowed companies to diversify and hedge their currency exposure, which supported macroeconomic stability, reduced exchange-rate volatility and deepened domestic financial markets. This dispensation was also extended to investment in inward-listed (foreign) instruments on regulated South African exchanges.
Furthermore, the Minister of Finance allowed the JSE Limited to offer to non-resident and qualifying South African and other CMA corporate entities directly and actively involved in the agricultural grain industry, Zambian referenced grain derivative contracts for trading and settlement in USD.
To assist South Africa’s technology, media and telecommunications companies to access capital for growth into Africa, the Minister of Finance announced in the 2014 Budget Speech that unlisted technology, media, telecommunications, exploration and other research and development companies, may apply to the SARB’s Financial Surveillance Department to primary list offshore or raise foreign loans and capital for their operations. In addition, such companies may now establish offshore companies without the requirement to primary list offshore.
Furthermore, companies listed on regulated South African exchanges may secondary list and/or list depository receipt programs on foreign exchanges to facilitate both local and offshore foreign direct investment expansions.
In the 2014 Budget Speech, the Minister of Finance announced that, in order to promote foreign diversification through domestic channels, foreign member funds had been introduced, which are collective investment schemes and alternative investment funds such as private equity funds, venture capital funds and hedge funds, which would be allowed to offer foreign exposure to their underlying investors.
From February 24, 2017, local collective investment scheme management companies registered with the then Financial Services Board (now Financial Sector Conduct Authority) and regulated under the Collective Investment Scheme Control Act (2002) would be allowed to inward list exchange-traded funds referencing foreign assets on regulated South African exchanges. These funds are not subject to macro prudential limits on amounts that may be invested offshore. South African institutional investors and Authorized Dealers are allowed to invest in such funds, subject to their respective macro prudential limits. These funds are classified as foreign assets for prudential purposes. Qualifying collective investment management companies wishing to inward list exchange traded funds referencing foreign assets on regulated South African exchanges require prior written approval from the Financial Surveillance Department.
In an effort to promote competition and reduce the cost of remittances to neighboring and other countries, ownership restrictions on international participation in ADLAs (i.e., foreign exchange bureaus) were removed. In addition to this, the requirement for money remittance agencies to partner with existing Authorized Dealers in order to do remittance work is no longer obligatory.
In 2015, in an effort to reduce costs in respect of low value cross-border transfers and entice a large portion of the community into the formal banking arena, the Financial Intelligence Centre (FIC), the Minister of Finance and the SARB’s National Payment System Department and Financial Surveillance Department, in collaboration with the Reporting Entities, agreed to remove certain requirements relative to residents and non-residents.
The Minister of Finance announced in the 2017 Budget speech that the National Treasury would undertake a review of its capital flows management framework, which would be reviewed against best practice of other developing economies. In addition, the National Treasury would begin consulting with interested parties on new inward listings. Consultation between the SARB and the National Treasury on these and other matters continues to be a priority, with a focus on a modernized policy framework and improving South Africa’s investment climate.
Gold and Foreign Exchange Contingency Reserve Account (GFECRA)
GFECRA in the books of the SARB reflects the Rand valuation profits and losses on all the gold, SDRs and foreign exchange that form part of the official gross foreign exchange reserves of the country. It also includes the Rand value of the foreign exchange forward transactions conducted by the SARB as well as liabilities of the SARB denominated in foreign currencies.
The GFECRA comprises credit and debit balances on three different sub-accounts: a gold price adjustment account (GPAA); a foreign exchange adjustment account (FEAA); and a forward exchange contracts adjustment account (FECAA).
The GPAA reflects any valuation profit or loss on the gold held by the SARB. The volume of the gold holdings has been fairly static over the past decade at around four million fine ounces. The FEAA account reflects any profit or loss on the Rand valuation of the foreign currencies held due to the depreciation or appreciation of the Rand against these currencies. In terms of the SARB Act, the SARB can calculate an exchange commission on all foreign exchange transactions conducted on behalf of the National Treasury. This commission or exchange margin is also reflected in the FEAA and settled annually by the National Treasury.
The FECAA reflects profits or losses on any forward exchange contract entered into by the SARB, valuation profits and losses on foreign exchange liabilities of the SARB, and any profit or loss due to changes in the value of the Rand against the currency of the United States on certain agreements for the reinsurance of export contracts. Since early 1997, the SARB has terminated the extension of forward cover with respect to future external commitments. The SARB, however, conduct sizeable amounts of foreign exchange swaps for liquidity management in the money market.
As at March 31, 2017, the GFECRA showed a positive balance of R231.2 billion, which represents net valuation gains of approximately the same amount and cash flow losses of R224.6million. These cash flow losses were settled on April 25, 2017. As at March 31, 2018, the GFECRA balance had decreased to R193.9 billion, mainly due to the appreciation of the exchange rate of the Rand over the period. Cash flow losses to be settled by the NT amounted to R141 million for the year to March 31, 2018. This balance was settled on April 20, 2018.
The SARB does not intervene in the foreign exchange market with a view to influence the value of the Rand exchange rate. However, the SARB purchases foreign exchange from the Authorized Dealers to accumulate reserves when market conditions allow.
THE EXTERNAL SECTOR OF THE ECONOMY
Foreign Trade
The following table sets forth South Africa’s balance of trade for the periods indicated.
Balance of Trade
Year | | Balance of Trade
Rand (billion) |
| | | |
| 2013 | | (69.4) |
| 2014 | | (54.9) |
| 2015 | | (46.1) |
| 2016 | | 34.7 |
| 2017 | | 72.7 |
| 2018(1) | | 6.3 |
Note:
(1) To June 30, 2018.
The following table presents a breakdown of South Africa’s balance of trade by sector for the periods indicated.
| | | Year ended December 31, |
| | | Rand (billion) |
| Sector | | 2013 | | 2014 | | 2015 | | 2016 | | 2017(1) |
| Exports | | | | | | | | | | |
| Total merchandise exports | | 900.4 | | 969.9 | | 1,004.5 | | 1,080.8 | | 546.3 |
| Agriculture, forestry & fishing | | 54.1 | | 62.7 | | 67.5 | | 78.7 | | 40.0 |
| Total: Mining | | 275.5 | | 274.7 | | 253.1 | | 275.0 | | 156.5 |
| Coal mining | | 56.4 | | 55.2 | | 51.7 | | 61.3 | | 35.3 |
| Gold & uranium ore mining* | | 65.8 | | 64.2 | | 69.4 | | 69.8 | | 343 |
| Other mining* | | 153.3 | | 155.4 | | 131.9 | | 143.9 | | 86.9 |
| Total: Manufacturing* | | 570.8 | | 632.4 | | 683.8 | | 727.2 | | 349.8 |
| Food | | 21.3 | | 24.9 | | 24.8 | | 27.9 | | 12.1 |
| Beverages | | 13.9 | | 15.2 | | 16.3 | | 17.6 | | 8.0 |
| Tobacco | | 2.7 | | 2.7 | | 3.1 | | 3.0 | | 1.4 |
| Textiles | | 8.0 | | 8.6 | | 9.3 | | 10.5 | | 5.4 |
| Wearing apparel | | 4.1 | | 4.6 | | 5.1 | | 5.2 | | 2.5 |
| Leather & leather products | | 4.6 | | 4.7 | | 4.9 | | 4.9 | | 2.2 |
| Footwear | | 2.3 | | 2.6 | | 2.7 | | 2.7 | | 1.2 |
| Wood & wood products | | 4.4 | | 5.6 | | 6.4 | | 7.0 | | 3.4 |
| Paper & paper products | | 13.8 | | 16.5 | | 18.6 | | 21.1 | | 10.3 |
| Printing, publishing & recorded media | | 1.1 | | 1.2 | | 1.3 | | 1.3 | | 0.5 |
| Coke & refined petroleum products* | | 34.2 | | 38.0 | | 37.5 | | 34.5 | | 21.4 |
| Basic chemicals | | 45.9 | | 50.7 | | 53.0 | | 54.1 | | 27.7 |
| Other chemicals | | 8.6 | | 11.1 | | 12.6 | | 11.7 | | 6.5 |
| Rubber products | | 5.6 | | 5.8 | | 5.8 | | 5.8 | | 2.7 |
| Plastic products | | 14.0 | | 16.9 | | 15.2 | | 17.2 | | 7.8 |
| Glass & glass products | | 4.5 | | 5.1 | | 5.7 | | 6.0 | | 2.5 |
| Non-metallic minerals | | 11.8 | | 13.6 | | 13.4 | | 16.9 | | 7.5 |
| Basic iron & steel | | 76.3 | | 92.6 | | 84.1 | | 91.0 | | 48.3 |
| Basic non-ferrous metals | | 31.8 | | 32.7 | | 35.0 | | 36.4 | | 18.2 |
| Metal products excluding machinery | | 3.3 | | 3.6 | | 3.4 | | 3.3 | | 1.8 |
| Machinery & equipment | | 59.7 | | 64.6 | | 65.9 | | 67.5 | | 30.2 |
| Electrical machinery | | 19.6 | | 23.4 | | 24.2 | | 23.9 | | 99 |
| Television, radio & communication equipment* | | 0.6 | | 0.7 | | 0.7 | | 0.6 | | 0.2 |
| Professional & scientific equipment* | | 5.1 | | 6.7 | | 7.0 | | 7.3 | | 3.2 |
| Motor vehicles, parts & accessories | | 78.3 | | 93.9 | | 1157 | | 133.1 | | 59.0 |
| Other transport equipment | | 6.6 | | 7.5 | | 8.6 | | 9.3 | | 4.6 |
| Furniture | | 5.4 | | 5.6 | | 5.7 | | 5.5 | | 2.3 |
| Other industries | | 2.4 | | 2.7 | | 3.3 | | 3.9 | | 2.0 |
| Electricity, gas & steam | | | | | | | | | | |
| Undefined | | 1.2 | | 2.2 | | 3.6 | | 4.5 | | 1.3 |
| Imports | | | | | | | | | | |
| Total merchandise imports | | 997.6 | | 1,083.0 | | 1,088,0 | | 1,099.3 | | 536.6 |
| Agriculture, forestry & fishing | | 37.8 | | 40.5 | | 46,5 | | 59.1 | | 26.1 |
| Total: Mining | | 15.6 | | 14.7 | | 13,7 | | 17.4 | | 9.0 |
| Coal mining | | 2.8 | | 2.9 | | 2,6 | | 3.0 | | 3.2 |
| Gold & uranium ore mining* | | 0.0 | | 0.0 | | 0,0 | | 0.0 | | 0.0 |
| Other mining* | | 12.8 | | 11.8 | | 11,0 | | 14.4 | | 5.8 |
| Total: Manufacturing | | 944.2 | | 1,027.8 | | 1 027,8 | | 1,022.9 | | 501.4 |
| Food | | 21.5 | | 21.4 | | 23,3 | | 25.4 | | 13.1 |
| Beverages | | 6.3 | | 59 | | 62 | | 6.5 | | 2.6 |
| Tobacco | | 1.5 | | 2.1 | | 2,4 | | 3.3 | | 1.1 |
| Textiles | | 14.7 | | 16.2 | | 18,3 | | 19.2 | | 9.2 |
| Wearing apparel | | 17.0 | | 18.7 | | 22,0 | | 23.7 | | 10.7 |
| Leather & leather products | | 3.7 | | 4.2 | | 4,6 | | 4.3 | | 1.8 |
| Footwear | | 10.9 | | 11.7 | | 13,4 | | 14.4 | | 6.2 |
| Wood & wood products | | 4.0 | | 4.5 | | 5,0 | | 5.3 | | 2.6 |
| Paper & paper products | | 11.1 | | 12.6 | | 13.7 | | 14.7 | | 6.2 |
| Printing, publishing & recorded media | | 3.1 | | 2.9 | | 2.8 | | 2.8 | | 1.0 |
| Coke & refined petroleum products | | 210.3 | | 246.9 | | 165.0 | | 142.0 | | 79.4 |
| Basic chemicals | | 77.4 | | 83.9 | | 93.0 | | 94.0 | | 46.5 |
| Other chemicals | | 16.1 | | 18.6 | | 199 | | 20.3 | | 9.2 |
| Rubber products | | 14.0 | | 14.4 | | 14.5 | | 15.2 | | 7.9 |
| Plastic products | | 243 | | 27.8 | | 30.5 | | 33.1 | | 15.2 |
| Glass & glass products | | 10.1 | | 11.4 | | 12.7 | | 136 | | 6.1 |
| Non-metallic minerals | | 4.2 | | 5.5 | | 5.6 | | 5.5 | | 2.7 |
| Basic iron & steel | | 30.0 | | 27.3 | | 30.5 | | 29.0 | | 14.8 |
| Basic non-ferrous metals | | 12.2 | | 14.4 | | 20.4 | | 20.9 | | 10.5 |
| Metal products excluding machinery | | 7.6 | | 8.2 | | 9.2 | | 9.3 | | 4.8 |
| Machinery & equipment | | 202.9 | | 214.5 | | 230.1 | | 238.8 | | 113.3 |
| Electrical machinery | | 101.5 | | 104.9 | | 121.6 | | 118.8 | | 54.1 |
| Television, radio & communication equipment* | | 2.4 | | 2.5 | | 2.4 | | 2.4 | | 0.9 |
| Professional & scientific equipment* | | 23.5 | | 24.8 | | 27.6 | | 29.7 | | 13.8 |
| Motor vehicles, parts & accessories | | 88.5 | | 88.9 | | 91.4 | | 84.9 | | 46.2 |
| Other transport equipment | | 9.3 | | 14.0 | | 21.9 | | 23.5 | | 10.2 |
| Furniture | | 7.8 | | 8.3 | | 9.9 | | 10.1 | | 4.4 |
| Other industries | | 8.3 | | 9.8 | | 10.1 | | 10.8 | | 4.8 |
| Undefined | | 0.7 | | 1.1 | | 1.4 | �� | 1.5 | | 1.1 |
Note:
(1) To June 30, 2017.
* Categories restated based on a new basket of products - 2013 to 2017.
Source: Quantec.
Exports
South Africa’s exports to developed economies still consist mainly of mineral products, chemical products and base metals while the composition of exports to Africa consists mainly of machinery and appliances, vehicles and parts and other manufactured goods. Since 2012, the fastest growing markets for South African exports have been Africa and Asia, with exports to these two continents accounting for almost 60% of total exports.
In the first three quarters of 2017, the value of exports improved by 3.6% compared with the same period in 2016, driven primarily by mineral products (34%), and cereals (42%). These were, however, off-set to some extent by significant declines in machinery (-11%), and vehicles, aircraft and vessels (-7%)
Improving economic prospects in advanced economies combined with sustained weakness in the Rand underpinned domestic exports, despite declining commodity prices and a slowdown in emerging market economies. Furthermore, trade and financial links with sub-Saharan Africa continue to grow, providing opportunities for South African firms to expand into the continent. The uneven global recovery as well as structural changes across economies meant that South Africa has had to diversify its export basket over time in order to help reduce its external vulnerabilities while at the same time taking advantages of the opportunities presented by economies growing at a faster pace.
Export performance in the first half of 2016 largely reflected global economic trends. The first six months of 2017 saw a 1.6 percentage point decline in exports to Africa compared to the same period in 2016, reflecting the deteriorating economic conditions in the region. Exports to Asia grew by 12.5% and exports to Europe by 3.8%, however exports to the Americas fell by 0.3 percent.
Almost 50% of overall exported vehicle products were destined for Europe, while Asia was the recipient of over 26% of precious metal exports. The volume of new vehicle exports is expected to continue to improve further in 2017 and 2018, which will positively reinforce the current account balance. Exports to China were weighed down by decreased demand for minerals and metal products.
Asia remains the largest recipient of South Africa’s goods, accounting for 32% of total exports in the nine months to September 2017, followed by Africa 26%, and Europe at 25%. Exports to Asia totalled R266.8 billion while those to Africa totalled R216.7 billion in the year to September. Exports to these two regions have over time outpaced exports to the EU, which now account for only 25% of South Africa’s total exports from 43% in the mid-1990s. The US accounted for 9% of total domestic exports in the first three quarters of 2017, also depicting a declining trend.
Imports
Imports dropped by 1.2% in the first nine months of 2017 compared to the same period in 2015 reflecting weaker domestic demand. Imports for all categories, except for vehicles and mineral products increased. The effects of the drought were seen in the 40% increase in agricultural product, particularly vegetables which increased by 60%.
Approximately 44% of South African imports are from Asia, principally reflecting mineral imports. From Europe and America, South Africa mainly imports capital goods and the share of imports are 33% and 11%, respectively.
Current Account Deficit
South Africa’s current account deficit improved from 2.8% of GDP in 2016 to 2.4% in 2017. The improvement reflects a widening of the trade surplus as a result of a rise in the value of exported goods which rose at a much faster pace than merchandise imports. Over the same period, the shortfall on the services, income and current transfer account widened, but by less than the improvement in the trade balance. The current account deteriorated to 4.0% of GDP in the first half of 2018, as a result of a narrowing in the trade surplus.
South Africa’s Commitment to the WTO
South Africa is a founding member of the General Agreement of Trade and Tariffs (GATT) and has been an active participant for decades in the various GATT rounds of multilateral trade negotiations. In line with the need to open up the economy and increase competition in the economy, South Africa has liberalized most sectors of the economy since the 1990s.
South Africa has phased out support measures and subsidies inconsistent with the principles expressed in the GATT. This encourages South African industries to improve their competitiveness in domestic and foreign markets, while at the same time benefiting from cost reductions, supply side support measures and reduced import duties of trading partner countries that were negotiated in the Uruguay Round, as well as from certain market access preferences that have been granted to South Africa by Canada, the EU, Japan, Norway, Russia, Switzerland and the US.
South Africa enjoys beneficial trade agreements with a number of countries, both multilateral and bilateral. It enjoys preferential treatment under the African Growth and Opportunity Act when trading with the United States.
In Africa, South Africa has a number of free trade agreements with African countries. These include Botswana, Lesotho and Namibia, under the auspices of the Southern African Customs Union. South Africa is also an important member of the SADC, which, among other things, allows for preferential trading access to Zimbabwe. It is anticipated that the Tripartite Free Trade Agreement between SADC, the Common Market for Eastern and Southern Africa (COMESA) and East African Community (EAC) will help to facilitate market access and increased trade within the continent.
South Africa also has an agreement with the EU to export most of its goods duty free under the Trade Development and Cooperation Agreement and is in the process of negotiating a new trade agreement and a new economic partnership agreement. China, India and Brazil are also important markets for South Africa. Thus South Africa has strengthened diplomatic ties and trade cooperation with these countries.
Geographic Distribution of Trade
The following table sets forth the distribution of South Africa’s exports and imports of merchandise for the periods indicated.
Distribution of Merchandise Trade
| | | 2012 | | 2013 | | 2014 | | 2015 | | 2016 | | 2017(1) |
| | | (Rand billions) |
| Exports | | | | | | | | | | | | |
| China | | 84.4 | | 115.7 | | 94.9 | | 92.6 | | 100.1 | | 78.0 |
| Germany | | 36.0 | | 38.9 | | 47.3 | | 66.7 | | 80.8 | | 63.5 |
| United States | | 63.0 | | 64.8 | | 68.1 | | 76.6 | | 78.6 | | 62.1 |
| Not allocated | | 86.5 | | 81.9 | | 76.2 | | 88.4 | | 80.7 | | 58.4 |
| Japan | | 45.3 | | 51.8 | | 52.1 | | 50.1 | | 49.3 | | 39.8 |
| India | | 30.6 | | 28.9 | | 40.7 | | 40.4 | | 47.7 | | 37.8 |
| United Kingdom | | 26.3 | | 30.7 | | 35.9 | | 41.2 | | 45.8 | | 32.3 |
| Mozambique | | 18.5 | | 26.1 | | 31.0 | | 27.8 | | 31.8 | | 27.5 |
| Netherlands | | 22.7 | | 29.0 | | 32.5 | | 24.4 | | 28.0 | | 27.0 |
| Zambia | | 19.6 | | 24.1 | | 26.9 | | 26.9 | | 27.8 | | 19.7 |
| Zimbabwe | | 18.7 | | 22.0 | | 23.6 | | 23.9 | | 27.3 | | 18.7 |
| Imports | | | | | | | | | | | | |
| China | | 119.9 | | 154.4 | | 167.6 | | 199.4 | | 199.0 | | 146.7 |
| Germany | | 83.9 | | 103.2 | | 108.5 | | 122.3 | | 129.7 | | 97.5 |
| United States | | 61.0 | | 63.0 | | 71.3 | | 76.3 | | 72.9 | | 55.7 |
| Saudi Arabia | | 65.1 | | 77.4 | | 77.3 | | 33.6 | | 41.7 | | 38.6 |
| India | | 37.7 | | 51.9 | | 49.4 | | 53.7 | | 45.6 | | 38.4 |
| Japan | | 37.8 | | 39.4 | | 41.0 | | 39.9 | | 37.5 | | 27.8 |
| Thailand | | 22.1 | | 26.5 | | 25.8 | | 26.3 | | 31.8 | | 24.6 |
| United Kingdom | | 28.7 | | 32.1 | | 35.4 | | 35.0 | | 31.8 | | 22.8 |
| Italy | | 21.1 | | 26.0 | | 28.6 | | 28.3 | | 27.1 | | 21.7 |
| Nigeria | | 30.5 | | 34.9 | | 55.7 | | 38.6 | | 30.5 | | 19.7 |
| Angola | | 23.0 | | 18.9 | | 21.8 | | 17.1 | | 18.7 | | 12.4 |
Note:
(1) Through September 30, 2017.
Source: Quantec.
Balance of Payments
The following table sets forth the balance of payments for South Africa for the periods indicated(1).
| | | For the year ended December 31 | | | For the
six
months ended
June | |
| | | 2013 | | | 2014 | | | 2015 | | | 2016 | | | 2017 | | | 2018 | |
| | | (Rand millions) | |
| Current account | | | | | | | | | | | | | | | | | | | | | | | | |
| Merchandise exports (f.o.b.)(2) | | | 867,021 | | | | 942,825 | | | | 970,623 | | | | 1,058,032 | | | | 1,108,322 | | | | 533,800 | |
| Net gold exports(3) | | | 671,174 | | | | 71,942 | | | | 59,521 | | | | 66,762 | | | | 66,411 | | | | 36,565 | |
| Service receipts | | | 162,183 | | | | 182,725 | | | | 191,605 | | | | 210,865 | | | | 210,238 | | | | 102,447 | |
| Income receipts | | | 64,441 | | | | 82,235 | | | | 98,016 | | | | 87,773 | | | | 81,637 | | | | 43,852 | |
| Less: Merchandise imports (f.o.b)(2) | | | 1,003,603 | | | | 1,069,638 | | | | 1,076,290 | | | | 1,090,089 | | | | 1,102,055 | | | | 564,106 | |
| Less: Payments for services | | | 174,162 | | | | 184,828 | | | | 197,643 | | | | 218,830 | | | | 215,544 | | | | 104,355 | |
| Less: Income payments | | | 157,229 | | | | 183,779 | | | | 198,382 | | | | 208,243 | | | | 221,201 | | | | 124,711 | |
Current transfers (net receipts (+))(4) | | | (30,666 | ) | | | (34,448 | ) | | | (33,533 | ) | | | (27,458 | ) | | | (38,303 | ) | | | (19,805 | ) |
| Balance on current account | | | (204,841 | ) | | | (192,966 | ) | | | (186,084 | ) | | | (121,188 | ) | | | (110,495 | ) | | | (96,314 | ) |
| Capital transfer account (net receipts (+)) | | | 243 | | | | 236 | | | | 243 | | | | 241 | | | | 246 | | | | 120 | |
| | | | | | | | | | | | | | | | | | For the six months ended June | |
| | | 2013 | | | 2014 | | | 2015 | | | 2016 | | | 2017 | | | 2018 | |
| Financial account | | | | | | | | | | | | | | | | | | | | | | | | |
| Net direct investment (Inflow (+)/outflow (-))(4) | | | 15,942 | | | | (20,607 | ) | | | (51,217 | ) | | | (32,942 | ) | | | (80,472 | ) | | | 18,374 | |
| Net incurrence of liabilities(5) | | | 80,138 | | | | 62,627 | | | | 22,065 | | | | 32,876 | | | | 17,663 | | | | 42,138 | |
| Net acquisition of financial assets(6) | | | (64,196 | ) | | | (83,234 | ) | | | (73,282 | ) | | | (65,818 | ) | | | (98,135 | ) | | | (23,764 | ) |
| Net portfolio investment (Inflow (+)/outflow (-)) | | | 107,191 | | | | 145,774 | | | | 122,622 | | | | 240,559 | | | | 220,371 | | | | 81,557 | |
| Net incurrence of liabilities | | | 130,199 | | | | 146,944 | | | | 121,290 | | | | 139,866 | | | | 278,828 | | | | 106,040 | |
| Equity and investment fund shares | | | 69,086 | | | | 100,384 | | | | 105,101 | | | | 25,399 | | | | 102,269 | | | | 55,359 | |
| Debt securities | | | 61,113 | | | | 46,560 | | | | 16,189 | | | | 114,467 | | | | 176,559 | | | | 50,681 | |
| Net acquisition of financial assets | | | (23,008 | ) | | | (1,170 | ) | | | 1,332 | | | | 100,693 | | | | (58,457 | ) | | | (24,483 | ) |
| Equity and investment fund shares | | | (22,074 | ) | | | 8,363 | | | | 20,009 | | | | 109,279 | | | | (27,213 | ) | | | (17,256 | ) |
| Debt securities | | | (934 | ) | | | (9,533 | ) | | | (18,677 | ) | | | (8,586 | ) | | | (31,244 | ) | | | (7,227 | ) |
| Net financial derivatives (Inflow (+)/outflow (-)) | | | 7,478 | | | | 16,409 | | | | 4,882 | | | | (13,757 | ) | | | (4,247 | ) | | | (1,545 | ) |
| Net incurrence of liabilities | | | (188,354 | ) | | | (194,842 | ) | | | (320,856 | ) | | | (499,330 | ) | | | (227,481 | ) | | | (104,999 | ) |
| Net acquisition of financial assets | | | 195,832 | | | | 211,251 | | | | 325,738 | | | | 485,573 | | | | 223,234 | | | | 103,454 | |
| Net other investment (Inflow (+)/outflow (-)) | | | 53,663 | | | | 121,821 | | | | 119,042 | | | | (22,235 | ) | | | (9,002 | ) | | | 9,122 | |
| Liabilities | | | 50,412 | | | | 148,133 | | | | 72,273 | | | | (3,747 | ) | | | 60,675 | | | | 15,521 | |
| Assets | | | 3,251 | | | | -26,312 | | | | 46,769 | | | | (18,488 | ) | | | (69,677 | ) | | | (6,399 | ) |
| Reserve assets (Increase (-)/decrease (+))(7) | | | (4,658 | ) | | | (15,134 | ) | | | 14,015 | | | | (40,193 | ) | | | (25,525 | ) | | | (8,966 | ) |
| Balance on financial account | | | 179,616 | | | | 248,263 | | | | 209,344 | | | | 131,432 | | | | 101,125 | | | | 98,542 | |
| Memo item: Balance on financial account excluding reserve assets | | | 184,274 | | | | 263,397 | | | | 195,329 | | | | 171,625 | | | | 126,650 | | | | 107,508 | |
| Unrecorded transactions(8) | | | 24982 | | | | (55,533 | ) | | | (23,503 | ) | | | (10,485 | ) | | | 9,124 | | | | (2,348 | ) |
| Memo item: Balance on financial account excluding reserve assets including unrecorded transactions | | | 209256 | | | | 207,864 | | | | 171,826 | | | | 161,140 | | | | 135,774 | | | | 105,160 | |
Notes:
| 1. | Data for 2015, 2016, 2017 and 2018 figures are preliminary and subject to revision. |
| 2. | Published customs figures adjusted for balance-of-payments purposes. |
| 3. | Commodity gold. Before 1981 net gold exports comprised net foreign sales of gold plus changes in gold holdings of the South African Reserve Bank and other banking institutions. |
| 4. | A net incurrence of liabilities (inflow of capital) is indicated by a positive (+) sign. A net disposal of liabilities (outflow of capital) is indicated by a negative (-) sign. A net acquisition of assets (outflow of capital) is indicated by a negative (-) sign. A net disposal of assets (inflow of capital) is indicated by a positive (+) sign. |
| 5. | Investment by foreigners in undertakings in South Africa in which they have individually or collectively in the case of affiliated organizations or persons at least 10.0% of the voting rights. |
| 6. | Investment by South African residents in undertakings abroad in which they have at least 10.0% of the voting rights. |
| 7. | Foreign-currency liabilities of the Reserve Bank with non-resident institutions and loans from the IMF are included in the calculation of reserve assets. An increase in reserve assets is indicated by a negative (-) sign and a decrease is indicated by a positive (+) sign. |
| 8. | Transactions on the current, capital transfer and financial accounts. |
Source: SARB.
Current Account
South Africa’s trade patterns and volumes changed notably during the past decade. These changes were brought about by, among other factors, uneven growth performance of the country’s most important trading partner countries in the aftermath of the 2008 global recession, substantial infrastructure development projects and a number of trade agreements concluded to promote international trade.
Notwithstanding various policy measures to enhance external competitiveness, to promote trade, and to raise the country’s growth performance, the South African economy has become more dependent on surplus saving from the rest of the world to finance the much-needed increase in gross fixed capital formation. The country’s import penetration ratio (i.e., the extent to which the country relies on merchandise imports to satisfy domestic expenditure) reached a peak in 2015. This was followed by a decrease in 2016 and a slight recovery in 2017. The import penetration ratio rose further in the first half of 2018.
Owing to stronger growth in import volumes surpassing that of merchandise exports, the trade balance has been at a deficit since 2012. This deficit narrowed from 2013 to 2015 at which time weak terms of trade began to improve. In 2016, the trade balance experienced a surplus which widened in 2017. The trade surplus however narrowed in the first half of 2018 mainly as a result of an increase in the value of merchandise imports alongside a contraction in the value of exported goods.
The value of merchandise exports advanced steadily from 2003 up to 2017 with a brief interruption in 2009. The increase in export proceeds could largely be attributed to higher Rand prices of merchandise exports along with a slower increase in export volumes over the period. The value of merchandise exports however declined slightly in the first half of 2018, reflecting decreased Rand prices of merchandise exports over the period. Notwithstanding the dwindling volume of net gold exports, domestic gold producers benefited from a surge in the international price of gold since 2006 to a historic high in 2011. Then the price of gold fluctuated, hitting a 5 year low in 2015.. Further to demand and supply conditions, the price of gold benefited during the past few years from the on-going uncertainty in global financial markets, as well as geopolitical tensions. The US dollar price of gold has however been declining since 2011 and recorded an average of US$1,160 per fine ounce in 2015 before rebounding in 2016 to US$1,248. The gold price increased further in 2017 and averaged US$1,318 in the first half of 2018. In Rand terms, the price of gold advanced for the most part at an even faster pace due to the depreciation in the exchange value of the Rand over the period, declining marginally in 2013 before increasing again from 2014 to 2016. The Rand price of gold decreased noticeably in 2017 to R16,754 and continued to decline thereafter before averaging R16,214 in the first half of 2018 as the increase in the US dollar price of the metal was offset by the higher external value of the Rand.
The value of merchandise imports increased during the period of 2010 to 2017 owing mainly to strong domestic demand. The upward trend continued during the first half of 2018. Although manufactured goods remained the largest component of merchandise imports in value terms, it declined as a ratio of total merchandise imports, from 73.9% in 2003 to roughly 67.0% in 2012 and the subsequent two years. Manufactured goods as a percentage of total merchandise imports was 72.6% in 2017. The three main subcategories of manufactured imports, which together account for approximately 73.0% of the total import value of manufactured goods, are machinery and electrical equipment, vehicles and transport equipment, and chemical products. Following a widening of 11.4% in 2016, the deficit on the services, income and current transfer account of the balance of payments increased further by 17.5% in 2017. The decline in income receipts coupled with a rise in income payments contributed to the widening of the deficit. Having declined by almost 20% in 2016, gross dividend receipts continued to decline – contracting by 11% in 2017, driven by lower dividends from companies with a non-direct investment relationship. Gross dividend payments remained relatively unchanged while gross interest payments escalated by 17.7%. Gross current transfer payments also increased mostly on account of higher payments to the member states of the Southern African Customs Union (SACU). The deficit on the services, income and current transfer account expressed as a percentage of GDP increased from 3.6% in 2016 to 3.9% in 2017, which also represents a 10-year average.
In the first half of 2018, the deficit on the services, income and current transfer account increased compared to the first half of 2017. This was driven by wider deficits in net income and net current transfer payments while net services payments displayed a slight improvement. When expressed as a ratio of GDP, the overall services, income and current transfer account waned deficit from 3.6% in the first half of 2017 to 4.2% in the first half of 2018.
Financial Account
The overall net capital inflow of the financial account of the balance of payments (including reserve assets but excluding unrecorded transactions) amounted to R101.1 billion in 2017, somewhat less than the R131.4 billion recorded in 2016. Direct investment, other investment and financial derivatives recorded outflows while portfolio investment recorded inflows over the two years: 2016 and 2017. For 2017 as a whole, financial account inflows represented 2.2% of GDP compared to 3.0% in 2016.
Inward foreign direct investment decreased from R32.9 billion in 2016 to R17.7 billion in 2017. Cumulatively, inward foreign portfolio investment increased from R139.9 billion in 2016 to R278.9 billion in 2017. Other investment liabilities increased significantly from an outflow of R3.7 billion in 2016 to an inflow of R60.7 billion in 2017.
Outward foreign direct investment flows increased from R65.8 billion in 2016 to R98.1 billion in 2017. Outward foreign portfolio investment reverted from an inflow of R100.7 billion in 2016 to an outflow of R58.5 billion in 2017. Outward foreign other investment increased from R18.5 billion in 2016 to R69.7 billion in 2017.
South Africa’s financial account of the balance of payments (including reserve assets but excluding unrecorded transactions) recorded a smaller net capital inflow of R45.3 billion in the second quarter of 2018, following an inflow of R53.2 billion in the first quarter. On a net basis, direct, portfolio and other investment as well as financial derivatives registered capital inflows in the second quarter of 2018.
South Africa’s direct investment liabilities recorded inflows of R31.6 billion in the second quarter of 2018 following an inflow of R10.5 billion in the first quarter. The larger inflow during the second quarter was due primarily to an increase in loans extended by foreign parent companies to domestic subsidiaries and an increase in the share of non-resident equity investment in domestic companies, mainly due to foreign company acquiring a significant stake in a domestic construction company.
Inward portfolio investment flows into South Africa amounted to only R16.6 billion in the second quarter of 2018, following inflows of R89.4billion in the previous quarter. Non-resident investors accumulated debt securities to the value of R3.8 billion in the second quarter of 2018 compared to an inflow of R46.9 billion in the first quarter. The lower inflow reflected the disposal of domestic Rand-denominated debt securities by foreign investors in anticipation of a further rise in US bond yields following expectations of more increases in the federal funds rate. On an annual basis, inward investment into South African debt securities amounted to R176.6 billion in 2017, significantly more than the R114.5 billion in 2016.
South Africa recorded other investment liabilities of R13.1 billion in the second quarter of 2018 following an inflow of R2.4 billion in the first quarter. The larger inflow resulted from an increase in foreign currency-denominated deposits at domestic banks, which was partly countered by the repayment of short-term foreign loans by the domestic private non-banking sector. Inflows related to other investment liabilities were significantly larger in 2017, amounting to R60.7 billion compared to an outflows of R3.7 billion in 2016. South African entities’ direct investment abroad decreased from R20.5 billion in the first quarter of 2018, to R3.3 billion in the second quarter, as domestic private sector companies reduced the acquisition of equity holdings in foreign subsidiaries. Cumulatively, South African entities, direct investment abroad recorded outflows of R98.1 billion in 2017 following outflows of R65.8 billion in 2016.
South African residents acquired foreign portfolio assets to the value of R8.9 billion in the second quarter of 2018, following the acquisition of such assets to the value of R15.6 billion in the first quarter as the domestic private non-banking sector acquired less foreign equity securities. South African investors acquired foreign portfolio assets amounting to R58.5 billion in 2017, compared to the disposal of portfolio assets to the value of R100.7 billion in 2016.
Outflows related to other investment assets reverted to an inflow of R14.7 billion in the second quarter of 2018 from an outflow of R21.1 billion in the first quarter as the repayment of short-term loans by non-residents was partly countered by the domestic banking sector extending long-term loans to non-residents. For 2017 as a whole, other investment outflows amounted to R69.7 billion compared to outflows of R18.5 billion in 2016.
The following table sets forth capital movements into and out of South Africa for the periods indicated.
Financial account(1)
| | | | | | | | | | | | | | | | | | For the six months ended June | |
| Rand (million) | | 2013 | | | 2014 | | | 2015 | | | 2016 | | | 2017 | | | 2018 | |
| Net incurrence of liabilities2 | | | | | | | | | | | | | | | | | | | | | | | | |
| Direct investment3 | | | 80,138 | | | | 62,627 | | | | 22,065 | | | | 32,876 | | | | 17,663 | | | | (42,138 | ) |
| Public corporations | | | 0 | | | | 0 | | | | 0 | | | | 0 | | | | 0 | | | | 0 | |
| Banking sector | | | 20,160 | | | | 1,121 | | | | 3,257 | | | | (9,844 | ) | | | (21922 | ) | | | 4,112 | |
| Private sector | | | 59,978 | | | | 61,506 | | | | 18,808 | | | | (42,720 | ) | | | 39585 | | | | 38,026 | |
| Portfolio investment | | | 130,199 | | | | 146,944 | | | | 121,290 | | | | 139,866 | | | | 278,828 | | | | 106,040 | |
| Monetary authorities | | | 0 | | | | 0 | | | | 0 | | | | 0 | | | | 0 | | | | 0 | |
| Public authorities | | | 61,489 | | | | 51,563 | | | | 3,287 | | | | 141,112 | | | | 171,650 | | | | 43,287 | |
| Public corporations | | | 8,320 | | | | 2,613 | | | | 16,262 | | | | (11,316 | ) | | | -1,804 | | | | 1,280 | |
| Banking sector | | | 11,700 | | | | 16,545 | | | | 3,169 | | | | 11,239 | | | | 37,909 | | | | 10,858 | |
| Private sector | | | 48,690 | | | | 76,223 | | | | 98,572 | | | | (1,169 | ) | | | 71,073 | | | | 50,615 | |
| Financial derivatives | | | (188,354 | ) | | | (194,842 | ) | | | (320,856 | ) | | | (499,330 | ) | | | (227,481 | ) | | | (104,999 | ) |
| Banking sector | | | (188,354 | ) | | | (194,842 | ) | | | (320,856 | ) | | | (499,330 | ) | | | (227,481 | ) | | | (104,999 | ) |
| Other investment | | | 50,412 | | | | 148,133 | | | | 72,273 | | | | (3,747 | ) | | | 60,675 | | | | 15,521 | |
| Monetary authorities4 | | | 953 | | | | 4,483 | | | | (1,606 | ) | | | 286 | | | | (1,059 | ) | | | (1,120 | ) |
| Public authorities | | | (1,763 | ) | | | (4,210 | ) | | | (3,925 | ) | | | (3,350 | ) | | | (2,477 | ) | | | (949 | ) |
| Public corporations | | | 12,765 | | | | 17,836 | | | | 18,960 | | | | 25,543 | | | | 24,452 | | | | 3,490 | |
| Banking sector | | | 16,964 | | | | 123,106 | | | | 33,443 | | | | (12,369 | ) | | | (19,013 | ) | | | 17,944 | |
| Private sector | | | 21,493 | | | | 6,918 | | | | 25,401 | | | | (13,857 | ) | | | 58,772 | | | | (3,844 | ) |
| Special Drawing Rights | | | 0 | | | | 0 | | | | 0 | | | | 0 | | | | 0 | | | | 0 | |
| Net acquisition of financial assets5 | | | 107,221 | | | | 83,933 | | | | 309,628 | | | | 461,767 | | | | (28,560 | ) | | | 39,842 | |
| Direct investment6 | | | (64,196 | ) | | | (83,234 | ) | | | (73,282 | ) | | | (65,818 | ) | | | (98,135 | ) | | | (23,764 | ) |
| Public corporations | | | (110 | ) | | | 0 | | | | 0 | | | | 0 | | | | 0 | | | | 0 | |
| Banking sector | | | 28 | | | | 11 | | | | 18 | | | | 20 | | | | (498 | ) | | | 0 | |
| Private sector | | | (64,114 | ) | | | (83,245 | ) | | | (73,300 | ) | | | (65,838 | ) | | | (97,637 | ) | | | (23,764 | ) |
| Portfolio investment | | | (23,008 | ) | | | (1,170 | ) | | | 1,332 | | | | 100,693 | | | | (58,457 | ) | | | (24,483 | ) |
| Public corporations | | | 0 | | | | 0 | | | | 0 | | | | 0 | | | | 0 | | | | 0 | |
| Banking sector | | | 12,620 | | | | 3,491 | | | | (3,069 | ) | | | 19,901 | | | | (6,443 | ) | | | 2,057 | |
| Private sector | | | (35,628 | ) | | | (4,661 | ) | | | 4,401 | | | | 80,792 | | | | (52,014 | ) | | | (26,540 | ) |
| Financial derivatives | | | 195,832 | | | | 211,251 | | | | 325,738 | | | | 485,573 | | | | 223,234 | | | | 103,454 | |
| Banking sector | | | 195,832 | | | | 211,251 | | | | 325,738 | | | | 485,573 | | | | 223,234 | | | | 103,454 | |
| Other investment | | | 3,251 | | | | (26,312 | ) | | | 46,769 | | | | (18,488 | ) | | | (69,677 | ) | | | (6,399 | ) |
| Monetary authorities7 | | | 0 | | | | 0 | | | | 0 | | | | 0 | | | | 0 | | | | 0 | |
| Public authorities | | | 0 | | | | 0 | | | | 0 | | | | 0 | | | | (3,431 | ) | | | (4,088 | ) |
| Public corporations | | | (3,895 | ) | | | 1,802 | | | | (3,199 | ) | | | (1,231 | ) | | | (992 | ) | | | (1,544 | ) |
| Banking sector | | | 14,216 | | | | (15,850 | ) | | | 69,078 | | | | (15,659 | ) | | | 10,501 | | | | 19,098 | |
| Private sector | | | (7,070 | ) | | | (12,264 | ) | | | (19,110 | ) | | | (1,598 | ) | | | (75,755 | ) | | | (19,865 | ) |
| Reserve assets8 | | | (4,658 | ) | | | (15,134 | ) | | | 14,015 | | | | (40,193 | ) | | | (25,525 | ) | | | (8,966 | ) |
Notes:
| 1. | Identified capital movements. |
| 2. | A net incurrence of liabilities (inflow of capital) is indicated by a positive (+) sign. A net disposal of liabilities (outflow of capital) is indicated by a negative (-) sign. |
| 3. | Investment by foreigners in undertakings in South Africa in which they have individually or collectively in the case of affiliated organizations or persons at least 10.0% of the voting rights. |
| 4. | These transactions comprise the liabilities of the South African Reserve Bank and the Corporation for Public Deposits. |
| 5. | A net acquisition of financial assets (outflow of capital) is indicated by a negative (-) sign. A net disposal of financial assets (inflow of capital) is indicated by a positive (+) sign. |
| 6. | Investment by South African residents in undertakings abroad in which they individually or collectively in the case of affiliated organizations or persons have at least 10.0% of the voting rights. |
| 7. | Including the long-term assets of the South African Reserve Bank and the Corporation for Public Deposits. |
| 8. | Foreign-currency liabilities of the Reserve Bank with non-resident institutions and loans from the IMF are included in the calculation of reserve assets. An increase in reserve assets is indicated by a negative (-) sign and a decrease is indicated by a positive (+) sign. |
Source: SARB.
The following table sets forth total foreign direct investment by South African entities and total foreign direct investment in South Africa by foreign entities for the periods indicated.
Foreign Direct Investment
| | | 2012 | | | 2013 | | | 2014 | | | 2015 | | | 2016 | |
| | | Rand (millions) | |
| South African foreign direct investment | | | | | | | | | | | | | | | | | | | | |
| Europe | | | 429,366 | | | | 495,681 | | | | 602,615 | | | | 806,494 | | | | 690,195 | |
| Africa | | | 200,407 | | | | 232,292 | | | | 298,255 | | | | 347,669 | | | | 333,466 | |
| Americas | | | 84,249 | | | | 103,572 | | | | 128,716 | | | | 111,326 | | | | 122,014 | |
| Asia | | | 200,619 | | | | 478,849 | | | | 590,681 | | | | 1,050,253 | | | | 1,177,362 | |
| Oceania | | | 35,586 | | | | 39,359 | | | | 70,804 | | | | 88,807 | | | | 80,407 | |
| Other | | | 27 | | | | 102 | | | | 18 | | | | 5 | | | | 39 | |
| Total | | | 950,254 | | | | 1,349,855 | | | | 1,691,089 | | | | 2,404,554 | | | | 2,403,483 | |
| Foreign direct investment in South Africa | | | | | | | | | | | | | | | | | | | | |
| Europe | | | 1,085,479 | | | | 1,252,027 | | | | 1,246,913 | | | | 1,542,225 | | | | 1,366,366 | |
| Americas | | | 132,882 | | | | 135,534 | | | | 150,947 | | | | 160,648 | | | | 156,478 | |
| Asia | | | 115,923 | | | | 143,558 | | | | 137,954 | | | | 162,986 | | | | 206,175 | |
| Africa | | | 42,668 | | | | 45,575 | | | | 53,370 | | | | 63,692 | | | | 66,456 | |
| Oceania | | | 12,603 | | | | 18,371 | | | | 18,835 | | | | 40,438 | | | | 57,810 | |
| Other | | | 469 | | | | 695 | | | | 633 | | | | 423 | | | | 322 | |
| Total | | | 1,390,024 | | | | 1,595,760 | | | | 1,608,652 | | | | 1,970,412 | | | | 1,853,607 | |
Source: SARB.
South Africa’s total external debt decreased notably from US$183.2 billion at the end of March 2018 to US$170.8 billion at the end of June 2018, due to non-residents’ net sales of domestic rand-denominated government bonds as well as valuation effects. The increase in South Africa’s gross external debt, in rand terms, from R2 165 billion at the end of March 2018 to R2 347 billion at the end of June 2018 reflected the valuation effect of the depreciation in the exchange value of the rand on foreign currency denominated bonds.
Foreign currency-denominated external debt increased from US$75.9 billion at the end of March 2018 to US$81.6 billion at the end of June 2018. International bond issuances by national government and the domestic banking sector, together with long-term loans extended to the private sector, contributed largely to the increase.
Rand-denominated external debt, in US dollars, decreased substantially from US$107.3 billion at the end of March 2018 to US$89.2 billion at the end of June 2018. Net sales of domestic government bonds by non-residents, the depreciation in the exchange value of the rand, and a decline in the market value of domestic debt securities due to an increase in the yields were the main reasons for the decline in rand-denominated debt.
South Africa’s total external debt as a ratio of annual GDP decreased from 50.4% at the end of March 2018 to 45.7% at the end of June 2018, while the ratio of external debt to export earnings decreased from 161.7% to 148.2% over the same period.
Foreign Currency-Denominated Debt of South Africa(1)
| | | As of December 31, | | | As of June 30, | |
| | | 2013 | | | 2014 | | | 2015 | | | 2016 | | | 2017 | | | 2018 | |
| | | Rand (million)(2) | |
| Foreign-currency-denominated debt | | | | | | | | | | | | | | | | | | | | | | | | |
| Public sector | | | 94,584 | | | | 95,040 | | | | 119,470 | | | | 110,539 | | | | 121,355 | | | | 139,150 | |
| Monetary sector(3) | | | 126,772 | | | | 212,425 | | | | 310,550 | | | | 261,621 | | | | 210,597 | | | | 224,440 | |
| Non-monetary private sector | | | 191,513 | | | | 210,377 | | | | 286,784 | | | | 263,338 | | | | 273,100 | | | | 355,358 | |
| Bearer bonds and notes | | | 227,710 | | | | 262,833 | | | | 362,771 | | | | 328,059 | | | | 328,288 | | | | 402,222 | |
| Long-term loans | | | — | | | | — | | | | — | | | | — | | | | — | | | | — | |
| Total foreign-currency-denominated debt | | | 640,579 | | | | 780,675 | | | | 1,079,575 | | | | 963,557 | | | | 933,340 | | | | 1,121,170 | |
Notes:
| (1) | Excluding blocked Rand accounts, ordinary and non-redeemable preference shares, quoted domestic debentures and quoted domestic loan stock. |
| (2) | Valued at middle-market exchange rates as of the end of period. |
| (3) | Including lending to other sectors. |
Source: SARB.
Reserves and Exchange Rates
Since the abolition of the Financial Rand System and the dual exchange rate in 1995, South Africa has had a unitary market-determined exchange rate that applies to both current and capital transactions between residents and non-residents.
Investor sentiment towards emerging-market economies and in particular South Africa improved towards the end of the first quarter of 2014. Indications that the Chinese authorities are committed to boosting economic activity in China and on-going efforts to boost the economic recovery in the euro area in the second quarter of 2014 furthermore buoyed the currencies of many emerging-market economies over the period.
The South African Rand stabilized in 2017 compared to the volatility and large fluctuations in the previous year, trading in a range between R12.43 and R14.47 against the US dollar.. South Africa’s current account deficit started widening again in 2017.
Between mid-September and mid-November 2017, the rand depreciated by 12% against the US dollar. The rand’s depreciation was further driven by the Fed’s interest rate increases which also affected currencies of most emerging-market economies (EMEs). The decision by Moody’s towards the end of November 2017 to keep South Africa’s sovereign credit rating unchanged at Baa3 (however with a negative outlook) provided relief.
The global economic and political environment experienced uncertainty and volatility during 2018, monetary policy tightening by the US Fed affecting most foreign exchange markets. Potential trade disputes between the US and various countries, specifically China, renewed Brexit complexities as well as potential spill overs from political and economic instability in EMEs such as Turkey, Brazil and Argentina caused the Rand to depreciate from an average of R12.2 against the US dollar in January to an average of R14.3 in December. In 2018, the Rand experienced increased volatility trading between a low of R11.56 and a high of R15.54 against the US dollar..
On the domestic front, the South African economy slipped into a technical recession in the second quarter of 2018 amid a deterioration in the fiscal metrics with both the government’s deficit and debt levels forecast to increase further in the near future. This again ignited fear of possible ratings downgrades after Minister of Finance, Mr Tito Mboweni, delivered the Medium Term Budget Policy Statement in October 2018 in complex economic and political conditions.
On a trade-weighted basis, the rand depreciated by 2% between December 2016 and December 2017. This was followed by a brief retreat in the first quarter of 2018. For the remainder of 2018, however, the nominal effective exchange rate (NEER) of the rand declined by 13%. The real effective exchange rate (REER) of the rand followed a similar trend since 2017. In summary, the rand’s competitiveness among the group of 20 trading partners increased by 7% in the first eight months of 2018.
The following table sets forth, for the periods indicated, the exchange rate of the Rand per Dollar.
Rand
(Against the US Dollar)
| Year | | Low | | High | | Average | | Period End |
| 2011 | | 6.5962 | | 8.5423 | | 7.2531 | | 8.1319 |
| 2012 | | 7.4777 | | 8.9432 | | 8.2099 | | 8.4838 |
| 2013 | | 8.4478 | | 10.4849 | | 9.6502 | | 10.4675 |
| 2014 | | 10.2815 | | 11.7415 | | 10.8444 | | 11.5719 |
| 2015 | | 11.2955 | | 15.5742 | | 12.7507 | | 15.5742 |
| 2016 | | 13.2747 | | 16.8927 | | 14.7088 | | 13.6282 |
| 2017 | | 12.2566 | | 14.4606 | | 13.3129 | | 12.2940 |
| January 2018 | | 11.8483 | | 12.4626 | | 12.2041 | | 11.8753 |
| February 2018 | | 11.5604 | | 12.0987 | | 11.8220 | | 11.7735 |
| March 2018 | | 11.6360 | | 12.0635 | | 11.8356 | | 11.8128 |
| April 2018 | | 11.8154 | | 12.4260 | | 12.0841 | | 12.3651 |
| May 2018 | | 12.2416 | | 12.8058 | | 12.5294 | | 12.4805 |
| June 2018 | | 12.5494 | | 13.8802 | | 13.2855 | | 13.7432 |
| July 2018 | | 13.1591 | | 13.7497 | | 13.4145 | | 13.1591 |
| August 2018 | | 13.2809 | | 14.7038 | | 14.0890 | | 14.6545 |
| Year | | Low | | High | | Average | | Period End |
| September 2018 | | 14.1581 | | 15.5487 | | 14.7797 | | 14.1581 |
| October 2018(2) | | 14.1400 | | 14.8450 | | 14.4869 | | 14.7600 |
| November 2018(2) | | 13.6450 | | 14.5050 | | 14.0901 | | 13.8400 |
| December 2018(2) | | 13.6725 | | 14.5100 | | 14.2574 | | 14.3775 |
| January 2019(1) (2) | | 13.8425 | | 14.4100 | | 14.0096 | | 13.8425 |
Source: SARB.
(1) Through January 11, 2019
(2) Source: U.S. Federal Reserve
Change in Reserves
South Africa’s overall balance-of-payments position was in surplus in the amount of R9 billion in 2012, before declining to R4.7 billion in 2013. In 2014 the country’s overall balance-of-payments position registered a surplus of R15.1 billion, before swinging to a deficit of R14.0 billion in 2015. The gross gold and other foreign exchange reserves, measured in US Dollar, decreased to US$49.6 billion at the end of 2013 from US$50.7 billion at the end of 2012, and declined further to US$49.1 billion at the end of 2014. The country’s foreign reserves continued the downward trend in 2015, declining to US$45.8 billion. South Africa’s gross gold and other foreign exchange reserves recovered in 2016 and 2017, increasing to US$47.4 and US$50.7 respectively. Expressed in Rand terms, gross gold and other foreign exchange reserves increased from R520.2 billion at the end of 2013 to R568.5 billion at the end of 2014, and increased further to R713.9 billion at the end of 2015, on account of the depreciation of the exchange rate of the Rand. The country’s foreign reserves have since declined to R647.8 billion and R624.8 billion in 2016 and 2017 respectively. The ratio of imports covered by reserves improved, albeit marginally from 4.6 months of import cover at the end of December 2013 to 4.7 months at the end of December 2014, before increasing further to 5.7 months at the end of December 2015. The ratio of imports covered by reserves decreased to 5.2 months at the end of December 2016, before decreasing further to 4.6 months at the end of December 2017.
The gross gold and foreign exchange reserves increased to US$50.4 billion (R714.7 billion) at the end of September 2018, up from US$49.4 billion (R666.6 billion) in September 2017. The increase in US dollar terms mainly reflects proceeds received from maturing foreign exchange swaps conducted for liquidity management purposes which was partially offset by the appreciation of the US dollar against most currencies and foreign currency payments made on behalf of the Government. The increase in Rand terms was mainly due to the depreciation of the exchange rate.
As reflected in the table below on ‘Foreign Exchange Reserves’, South Africa’s gross gold and foreign exchange reserves showed an increasing trend during the years 2012 to 2015, which was mainly due to the depreciation of the exchange rate. The decline in the gross gold and foreign exchange reserves from December 2015 to December 2016 was due to the appreciation of the exchange rate. Expressed in US dollar terms, the gross gold and foreign exchange reserves declined from $50.7 billion in 2012 to $45.8 billion in 2015, whilst increasing to $47.4 billion in 2016. The increase in the gross gold and foreign exchange reserves in 2016 was primarily due to the proceeds from foreign debt issuance by government.
South Africa’s international reserves decreased by R6.2 billion in the third quarter of 2016, following a decline of R1.3 billion in the second quarter. The country’s international reserves subsequently increased by R54.3 billion in the fourth quarter of 2016. In the first quarter of 2017, South Africa’s international reserves recorded a decrease of R14.2 billion, followed by increases of R1.1 billion and R23.7 billion in the second and third quarters of 2017, respectively, before increasing by R14.9 billion in the fourth quarter of 2017. Between the first and third quarters of 2018, South Africa’s international reserves recorded an increase of R5.2 billion. Measured in US dollar, the value of South Africa’s gross gold and other foreign reserves (i.e., the international reserves of the Bank before accounting for reserve-related liabilities) increased from US$46.4 billion at the end of June 2016 to US$47.2 billion at the end of September 2016 primarily due to foreign currency loans entered into by the Bank. The short-term foreign currency loans were required to facilitate certain transactions by the Bank in the foreign exchange market as part of its operational responsibilities. The country’s gross gold and other foreign reserves increased further, albeit slightly, to US$47.4 at the end of December 2016. However, South Africa’s gross gold and other foreign reserves declined to US$46.6 at the end of March 2017, before recovering to US$47.4 at the end of June 2017. South Africa’s gross gold and other foreign reserves increased to US$49.4 billion at the end of September, mainly reflecting proceeds from foreign debt issuance by government, before increasing to US$50.7 billion at the end of December mainly due to the depreciation of the US dollar against major currencies as well as an increase in the US dollar gold price. Between January and September 2018, South Africa’s gross gold and other foreign exchange reserves fluctuated between US$49.5 billion and US$51.1 billion. The level of import cover (i.e., the value of gross international reserves relative to the value of imports of goods and services and income payments) decreased from 5.4 months at the end of March 2016 to 5.3 months at the end of June 2016. Between July and December 2016, the level of import cover fluctuated between 5.2 and 5.3 months. The level of import cover however, decreased to 5.0 months at the end of March 2017 and further to 4.9 months at the end of June 2017, before increasing to 5.2 months at the end of September 2017. However, the level of import cover decreased to 4.6 months at the end of December. The level of import cover remained relatively stable between January and May 2018, fluctuating between 4.4 months and 4.9 months, before increasing to 5.3 months at the end of May.
The international liquidity position reflected a similar trend to the gross gold and foreign exchange reserves in that it had declined from $47.9 billion in 2012 to $40.7 billion in 2015, whilst increasing marginally to $40.8 billion in 2016. South Africa’s international liquidity position, which hovered around US$41 billion since the beginning of 2016, increased to US$42.0 billion at the end of September 2016, before decreasing to US$40.8 billion at the end of December. The country’s international liquidity position increased to US$41.4 at the end of March 2017 and further to US$42.2 at the end of June. From January 2018 to September, South Africa’s international liquidity position fluctuated between US$42.2 billion and US$43.6 billion. More specifically, South Africa’s international liquidity position reflected a positive balance of US$42.7 billion at the end of September 2017, decreasing to US$42.2 billion on September 30, 2018. The decline in the international liquidity position was due to maturing swaps conducted for liquidity management purposes and a decrease in the foreign currency deposits received.
The following table sets forth the gold and foreign exchange reserves of South Africa in each of the periods indicated.
Foreign Exchange Reserves
| | | For the year ended December 31, | | | As of September 30, | |
| | | 2013 | | | 2014 | | | 2015 | | | 2016 | | | 2017 | | | 2017 | | | 2018 | |
| | | Rand (million) | |
| SARB gold reserves(1) | | | 50,621 | | | | 55,890 | | | | 66,696 | | | | 63,817 | | | | 64,335 | | | | 70,047 | | | | 67,663 | |
| Foreign exchange reserves | | | — | | | | — | | | | — | | | | — | | | | — | | | | — | | | | — | |
| SDR holdings(2) | | | 28,893 | | | | 29,995 | | | | 38,736 | | | | 32,777 | | | | 31,373 | | | | 34,126 | | | | 35,399 | |
| Other(3) | | | 440,719 | | | | 476,639 | | | | 608,575 | | | | 551,232 | | | | 529,070 | | | | 562,467 | | | | 611,636 | |
| Gross gold and other foreign reserves | | | 520,232 | | | | 562,524 | | | | 714,007 | | | | 647,825 | | | | 624,778 | | | | 666,640 | | | | 714,698 | |
| | | | | | | | | | | | | | | | | | | | | | | | | | | | | |
Notes:
| (1) | Since March 6, 2005, gold reserves are valued at market price taken at 14:30 on each valuation date. |
| (3) | Non-gold reserves are valued at the middle market exchange rate applicable at end of period. |
Source: SARB.
Public Finance
Background
South Africa’s public finances comprise all finances in the three spheres of government, namely, national, provincial, and local government. Finances in the national and provincial spheres of government consist of all transfer payments from the national government while those in the local government sphere of government consist of transfer payments from national government as well as own revenue.
The Division of Revenue Act (DORA) provides for the equitable division of revenue raised nationally among the national, provincial and local spheres of government and the responsibilities of all three spheres pursuant to such division, and addresses other matters connected therewith. The objectives of DORA are to: (a) provide for the equitable division of revenue raised nationally among the three spheres of government; (b) promote predictability and certainty in respect of all allocations to provinces and municipalities, in order that provinces and municipalities may plan their budgets over a multi-year period and thereby promote better coordination between policy, planning and budgeting; and (c) promote transparency and accountability in the resource allocation process by ensuring that all allocations are reflected in the budgets of provinces and municipalities, ensuring that the expenditure of conditional allocations is reported on by the receiving provincial and municipal departments. Government finances are presented in two ways, each highlighting key aspects of the budget. The main budget determines national government’s borrowing requirement. It has two elements. The first, appropriations by Parliament through budget votes, are mainly for national departments and including transfers to provinces, local government and public entities. The second, consists of direct charges against the National Revenue Fund, include the provincial equitable share and debt service costs, as well as the salaries of judges and public representatives. The Consolidated Budget provides a fuller picture of government’s contribution to the economy. It takes into account the main budget as well as spending of provinces, social security funds and public entities financed from their own revenue.
Provincial budgets are largely financed by the provincial equitable shares and conditional grants from the main budget. But provinces supplement these funds with their own revenues, such as gambling taxes, hospital fees and sales of goods and services. Also excluded from the consolidation is expenditures by the eight “category A” metropolitan municipalities as defined by the constitution and other large municipalities, which is financed from their own revenue, such as property rates and services charges. The Consolidated Government Budget includes 185 public entities. These include large entities such as South African National Roads Agency Limited, the Passenger Rail Agency, the South African Revenue Services and agencies that provide bulk water infrastructure. Public entities receive some transfers from the main budget but are also financed from own revenue. State-owned companies that function as standalone operations largely on a commercial basis, such as Eskom and Transnet, are not included in the consolidated accounts. Social security funds include Unemployment Insurance Fund, compensation funds and the Road Accident Fund. They are financed mainly by statutory levies or contributions but receive some transfers from the main budget.
National, provincial and local governments are responsible for delivering public services. Some of these services are the exclusive responsibility of one level of government, while others – known as concurrent functions – are shared. Nationally raised revenue is divided with the aim of providing for appropriate funding at each level of government – for example by taking into account their service delivery responsibilities and other sources of revenue available to them. In the 2017/18 fiscal year, national government departments are to be allocated 47.6% of available funds after debt costs, and the contingency reserve has been provided for. Provincial government is to be allocated 43.4% of available funds, mainly for education, health and social welfare. Local government is to receive 9.1% of the available funds, primarily for the provision of basic services to low-income households. Most municipalities fund the majority of their spending through charges and taxes.
Between the 2013/14 and 2019/20 fiscal years, there was an allocation of R8.2 trillion for the three spheres of government. National government accounted for R4 trillion (47.9%), provincial government R3.6 trillion (43.2%) and local government R738 billion (8.9%). Equitable share accounted to R370.1 million (50.1%) of the total local government allocation.
General government finances in South Africa represent a consolidation of the following: the National Budget; the budgets of the nine provincial governments; extra-budgetary accounts and funds; social security funds; and the budgets of local authorities. The National Government, provincial governments, social security funds, Reconstruction and Development Programs (RDP) accounts and extra-budgetary accounts are jointly referred to in this document as the “Consolidated Government Budget.” The Consolidated Government Budget includes transfer payments to local governments but does not constitute a consolidation of local government accounts. Municipalities, universities, polytechnics and various extra-budgetary funds derive substantial shares of their revenue from fees and charges or other sources. The Consolidated Government Budget presents a broader measure of government finances in South Africa. The public sector borrowing requirement shows the budget balance for the entire public sector, including general government and the non-financial public enterprises.
The borrowing powers of provincial and local governments are regulated by law. Provinces and municipalities generally may borrow for capital projects only. Under the Constitution, provinces have their own limited taxing powers and they are responsible for preparing their own budgets and for ensuring prudent financial management at the provincial level. Provinces receive agreed shares of nationally collected revenue and a framework for ensuring an equitable division to local government. The National Treasury has introduced generally recognized accounting practices and uniform treasury norms and standards, the prescription of measures to ensure transparency and expenditure control in all spheres of government, and operational procedures for borrowing, guarantees, procurement and oversight over various national and provincial revenue funds.
In terms of Section 230 of the Constitution, provinces are allowed to take out loans for either current expenditure, in the form of a bridging loan that must be repaid within a 12-month period, or capital projects. The Borrowing Powers of Provincial Governments Act of 1996 (Borrowing Powers Act) lists the conditions under which a province may take out loans for capital projects. The Act stipulates that loans must be approved by a loan coordinating committee, which is chaired by the Minister of Finance. Loans may be taken out as direct borrowing from the national government or from private banks and financial institutions. Provinces may not take out loans in foreign currency unless they are specifically authorized to do so by the Minister of Finance. As provinces are accountable in their own right, the National Government does not guarantee loans taken out by provincial governments and will not bail out any province that is unable to repay its loans.
The Public Finance Management Act (PFMA) regulates the National Government’s financial administration and outlines the various roles of the National Treasury, the Minister of Finance (as head of the National Treasury), the National Revenue Fund, accounting officers, auditors, executive authorities, public entities and other government officials. This legislation also addresses, among other things, regulation of loans, guarantees and other commitments as well as penalties for financial misconduct. Legislation aimed at regulating local government spending, known as the Municipal Finance Management Act of 2003 (MFMA), took effect in July 2004. The legislation seeks to secure sound and sustainable management of the financial affairs of municipalities and other institutions in the local sphere of government, and to establish treasury norms and standards for the local sphere of government.
Municipalities can borrow over the long term to finance capital projects, acquire capital assets or refinance existing debt pursuant to Section 46 of the MFMA. Short-term borrowing (not for more than 12 months) is also possible for operational purposes only. However, the debt needs to be repaid within the financial year in which the debt was incurred pursuant to Section 45 of the MFMA. Furthermore, the Regulatory Framework for Municipal Borrowing recommends that every municipality should adopt a written debt policy when planning to issue debt. The policy assists in determining borrowing limits that a municipality can cope with. The MFMA further requires that all municipalities seek written comments from the public, the relevant provincial treasury and National Treasury with respect to proposed debt.
As of June 30 2018, the total balance on long term borrowing for all municipalities was R60.3 billion as reported by lenders to municipalities. The total long term debt reported by municipalities is slightly higher at R62.5 billion. Of the amount reported by the lenders, long term loans represented R41.7 billion or 69.0% while the remaining 31.0% was made up of R18.6 billion in bonds. Just over half of long-term municipal debt is held by public sector lenders (R32.1 billion or 53.0%) while the private sector holds a total of R28.2 billion or 47.0%. The Development Bank of Southern Africa with 42.0% is the largest lender to municipalities followed by the private commercial banks accounting for a total of 24.0%. The remaining 34.0% is held by International DFI’s, the Infrastructure Finance Corporation Limited (INCA), and other lenders (including pension funds and insurers). New long-term borrowing for the 2017/18 municipal financial year totaled R8.7 billion which was 64.0% of the budgeted borrowing.
The Constitution provides that the provincial and local governments are entitled to such percentages of nationally raised revenue as may be determined by Parliament (allocated among the provinces on an equitable basis). The largest allocation to municipalities is the “local government equitable share” (LGES) which is allocated through a formula that is primarily based on how many poor households a municipality provides services to. The budgets of the provincial governments are financed through such nationally collected revenue, together with other allocations or grants from the National Government, the provinces’ own revenue collections, unspent balances from previous fiscal years and proceeds from loans for capital outlays. The Constitution provides for the assignment of taxation powers to provinces within a national, regulated framework that is intended to ensure that all taxes are consistent with national economic policy. The Provincial Tax Regulation Process Act of 2001 provides a framework through which provinces can introduce and collect certain fees and taxes. These include automobile license and traffic fees, hospital fees, gambling fees and other user charges and levies. The Financial and Fiscal Commission, a constitutionally established body, has the responsibility of monitoring and overseeing intergovernmental fiscal relations. Additionally, the Intergovernmental Fiscal Relations Act of 1997 established the Budget Council and the Budget Forum to consider intergovernmental budget issues.
The 2016 Community Survey (the largest survey between censuses) confirmed that progress continues to be made in extending access to electricity, water, sanitation and refuse removal services. The Government’s aim is to ensure that all citizens receive at least a basic level of amenities. Drawing on international benchmarks, minimum standards of 50kWh of free electricity and 6,000 litters of free water per month per household have been adopted. However, the level of free services provided to poor households varies, depending on local circumstances and municipal capacity. The national budget contributes to the financing of household amenities through the local government equitable share, which is mainly allocated for provision of free basic services. There has been a significant growth in allocations to the local government equitable share in recent years, from R20 billion in 2009/10 to R57 billion in 2017/18. Over the Medium Term Expenditure Framework, allocations will increase to R62.7 billion in 2018/19, and R69.3 billion in 2019/20.
The new local government equitable share formula which was implemented in the 2013/14 financial year, also taking into account the 2011 census figures, provides a monthly subsidy of R359 in 2017/18 for every household with a monthly income less than the value of two state old age pensions, which is about 59.0% of all households. The previous formula for the local government equitable share targeted 47.0% of households. This threshold is not an official poverty line or a required level to be used by municipalities in their own indigence policies. If municipalities choose to provide fewer households with free basic services than they are funded for through the local government equitable share, then their budget documents should clearly state the reasons for that and whether they consulted with the community on that policy. The formula also makes provision for a contribution towards the administration and governance costs of running a municipality. Allocations also take account of the greater ability of some municipalities to cross subsidize services to their poor households and less funding is allocated to these (relatively wealthy) municipalities. While census and community survey data indicates steady progress towards universal access to electricity and clean water, achievement of free basic service standards still has some way to go.
According to a joint report by the World Health Organization (WHO) and UNICEF, as of 2015, 49.18 million people in South Africa had access to piped drinking water, an increase compared to 48.42 million in 2014. An additional 2.56 million had access to non-piped drinking water a decrease compared to 2.58 in 2014. In 2015, 25.48 million people had access to sewer sanitation, 1.48 million to septic sanitation and 12.88 million to latrine sanitation an increase compared to 24.88 million, 1.46 million and 12.67 million respectively in 2014.
According to the World Bank, 84.2% of the population in South Afirca had access to electricity in 2016, a decrease compared to 85.5% in 2015.
The 2016 Community Survey shows that rapid population growth and internal migration continue to be defining features of South African demographics. This data assists in improving the targeting of municipal funding. To account for the growth in households each year, the number of households per municipality used in the LGES formula is updated annually based on the growth in households reflected in each province in the General Household Survey conducted by Statistics South Africa. The new equitable share formula reflects these changes and makes allocations for free basic services more transparent. Municipalities need to prioritize funding for the provision and maintenance of these services. The funding and provision of infrastructure are also important requirements for continued improvement in basic service delivery. The expansion of infrastructure needed to deliver basic services is funded through conditional grants allocated to municipalities. It is not possible to give households free access to services if the supporting infrastructure – such as water distribution systems – is not in place.
Unemployment Insurance Fund (UIF)
In 2001, the Minister of Labor tabled legislation to strengthen the administration of the UIF, target benefits more effectively to the poor and extend the coverage of the fund. Since the UIF was given an estimated amount of R605 million in 2001 to address its outstanding financial debts, it has been experiencing positive financial performances. The UIF was able to meet its operational expenditure requirement and recorded an operating cash surplus of R13.5 billion in fiscal year 2018. The March 2018 actuarial evaluation indicated that the UIF is in a sound position to meet its cash-flow requirements through 2028 in a wide range of scenarios. The UIF had capital and reserves amounting to R146.6 billion as of March 31, 2018. It is estimated that the UIF’s financial performance surplus prior to reserving over the next three fiscal years will be R1.4 billion in fiscal year 2020, R1.5 billion in fiscal year 2021 and R1.6 billion in fiscal year 2022.
The projected increase in the operational surplus is mainly attributable to a revision in the estimates for contributions due to an increase in the earnings threshold or ceiling as well as salary increases of contributors. However, the projected smaller operational surplus is as a result of the implementation of the amended benefits. The Unemployment Insurance Amendment Act, 2016 has been passed by the National Assembly and was implemented in January 2017. The key changes introduced by this Bill include the extension of the period of payment of benefits to the contributor from eight to 12 months with a flat rate payment after eight months; and allowing beneficiaries to claim as long as the beneficiary has worked for 13 weeks prior to claiming, regardless of when they last claimed; extension of the period during which dependents may apply for benefits on behalf of a deceased contributor from six to 18 months; extension of the period in which a contributor can lodge a claim from six to 12 months, and the date of unemployment is deemed to be the date when the claimant applies for benefits; and the threshold period after which a person can make a claim for illness benefits has been reduced from more than 14 days to more than seven days.
The UIF is committed to bringing services closer to its client base in all provinces and provides services at 126 Department of Labor centers with processing functions and 823 visiting points. A priority for the medium term is the recruitment and reallocation of appropriate resources to manage the new decentralized business environment including enhancing service delivery using multiple ICT channels to access UIF services including making services available all day every day and the use of smartphones to access UIF services. The UIF added 296,097 new employees to its database, raising the total to 9,636,837 registered employees as at fiscal year 2018. A total of 1,704,277employers are registered with the UIF as at fiscal year 2018, an increase of 66,198 new employers compared to fiscal year 2017. These employers are categorized mainly as commercial, domestic and taxi employers, with the majority in the commercial sector.
In response to the 2008 global economic crisis, the UIF (which formed part of the National Government’s Framework for South Africa’s Response to the International Economic Crisis) continues to play a pivotal role in schemes designed to inject funding into job creation and retention. The UIF issued R2.8 billion in placement bonds with the Industrial Development Corporation (IDC) as at the end of fiscal year 2016. The UIF/IDC bond is expected to save and create a combined 53,140 UIF paying jobs in the Automotive & Transport Equipment, Basic Metals & Mining, Chemical Products and Pharmaceuticals and Clothing & Textiles sectors. In addition, R1.2 billion have been committed by the UIF towards the Training Layoff Scheme which is designed to provide support to companies that are in distress due to the economic downturn with training and skills development as important elements of this response. The UIF spent R95.7 million for the Training of 4,702 unemployed UIF beneficiaries at Technical Vocational Education and Training (TVET) Colleges and SETAs in order to improve their chances of being reintegrated back into the labor market and to Social Plan Funding. In addition, the Fund assisted 358 beneficiaries through the Training Layoff Scheme and assisted 71 companies and saved8,504 jobs with the turnaround solutions program. UIF investments through the Public Investment Corporation have sustained 6,860 jobs of which 3,024 are permanent, 3,836 are temporary / seasonal and 195 are new jobs created during the 2018 fiscal year.
Compensation Fund (CF)
The CF supports employees who experience loss of income as a result of injuries, death or disease in the course of employment. Funds are raised through assessed levies on companies.
The CF remains financially sound with an accumulated surplus of R32.3 billion as of March 31, 2018. The CF registered 184,100 claims and paid benefits valued at R1.2 billion and medical claims amounting to R2.4 billion in fiscal year 2018. The CF recorded a 9% increase in the number of registered employers at the end of fiscal year 2018 with a 9.1% increase in revenue in fiscal year 2018. The increase in revenue is attributed to increased compliance by employers with the payment of the assessment fee, and an increase in the number of employers registered with the fund. The Compensation for Occupational Injuries and Diseases Amendment Bill, 2018 has been tabled in Parliament. The amendments include the provision for rehabilitation, re-integration and return to work of occupationally injured and sick employees; extend the application of the Act to include domestic workers, regulate the use of health care services and regulate compliance and enforcement and provide for matters connected therewith. In response to the dissatisfaction expressed by the public regarding the unjustifiably long turnaround time in processing claims for occupational injuries and diseases, the CF is speeding up the process of restructuring the Fund and upgrading its information technology infrastructure. To ensure equity of access to services and to improve the claims turnaround time, the CF has finalized the decentralization of its services to all nine provinces in fiscal year 2017. The Compensation Board reviewed existing benefits in fiscal year 2018, increasing the salary ceiling by 6.8% from R403,500 to R430,944 per annum; all pensions payable from the Compensation Fund increased by 5.8%. The maximum monthly earnings level on which all types of disability is based increased by 6.8%, while the minimum monthly value in respect of free food and quarters increased by 6.8% and 7.1%, respectively.
Road Accident Fund (RAF)
Understanding that there is a need to reform the unlimited liability system of compensation for road accident victims and supported by the reports of the RAF Commission in 2002, the Government set out on a reform path. In 2005, Parliament passed the RAF Amendment Act, which provided for a limited liability scheme to ensure the viability of the Fund. Five years after the promulgation of the RAF Amendment Act, the estimated reduced liability is R12.9 billion. The cabinet approved the strategy for the reform of the RAF in June 2006.
The Cabinet approved the Road Accident Benefit Scheme Bill in March 2017. The RAF received 271,933 new claims in 2017/18. Outstanding claims toaled 245,926 as at March 31, 2018 due to an increased number of registrations, as well as claims finalized, hence RAF could not meet the high influx of new claims registered.. The accumulated deficit has increased to R207 billion at the end of 2017/18.
South African Social Security Agency (SASSA)
The South African Social Security Agency derives its mandate from the South African Social Security Agency Act (2004). The Act entered into force in 2006, and replacing the Provincial mandate of administering social assistance in the form of financial award to beneficiaries who cannot sustain themselves. The agency is also required to develop and implement policies, programs, standard operating procedures and systems for an efficient and effective social assistance benefits administration system.
Social assistance and welfare services have grown rapidly in recent years. About 17.5 million South Africans received social grants as at the end of October 2018, up from 17.2 million in October 2017. This growth is expected to reach 18.4 million South Africans by 2021/22 due to the increase in population growth, higher life expectancy and efforts to ensure all eligible children benefit from the grant.
Over the spending period ahead (2019/20 – 2021/22), an annual average of R13.3 billion per annum will be added to social assistance budgets to accommodate the increase in beneficiaries and ensure that the value of grants keeps pace with inflation over the MTEF period. Social assistance expenditure will remain stable at around 3% of GDP.
The Budget Process
The National Government’s fiscal year ends on March 31 of each year. The Minister of Finance and National Treasury prepare the Budget with the assistance of the Minister of Finance’s Committee on the Budget and approval of Cabinet. The National Treasury is responsible for the fiscal framework within which the budget is constructed and also coordinates the preparation of expenditure estimates. South Africa ranked third out of 102 countries in the 2015 release of the Open Budget Index by the International Budget Partnership. In the 2017 release of the Open Budget Index, South Africa ranked first, alongside New Zealand, out of 115 countries. The survey measures the quality of budget transparency, public participation in the budget processes and institutional oversight. South Africa was one of only four countries that performed solidly across all three categories. The Republic ranked in the top five on measures of transparency and oversight by the legislature and audit institutions, but placed sixth in public participation.
The Minister of Finance presents the National Budget to Parliament in February of each year, with provincial treasuries separately presenting their budgets shortly after the National Budget is proposed. Since the presentation of the 1998-1999 Budget, Parliament has been presented each year with a set of three-year spending plans, but is asked to vote only on the budget for the coming year. Each year’s National Budget is based on certain key macroeconomic assumptions regarding, among other things, GDP growth, inflation, employment growth, taxable income, private consumption expenditure, government consumption expenditure, import and export levels and investment.
In addition to presenting expenditure estimates to Parliament, the Minister of Finance is responsible for estimating the revenue that existing taxes and tax rates will raise and for proposing tax amendments, if any. The National Budget then takes the form of an appropriations bill authorizing National Government expenditures. The appropriations bill originates in the National Assembly and then goes to the Standing Committee on Appropriations of the National Assembly and the Select Committee on Appropriations of the NCOP before being debated and finally passed by both houses of Parliament towards the end of the Parliamentary session. Finally, the President has to sign the bill before it becomes a law.
In April 2009, Parliament assented to the Money Bills Amendment Procedure and Related Matters Act of 2009 (the Money Bills Act). The Money Bills Act reconciles Parliament’s legislative and oversight mandate provided for in the Constitution and provides for, among other things, a procedure to amend money bills before Parliament. In general, the new Money Bills Act is viewed as a legislative milestone that will afford Parliament powers to adjust the National Budget. In exercising its powers, Parliament must ensure that: (a) there is an appropriate balance between revenue, expenditure and borrowing; (b) levels of debt and debt interest cost are reasonable; (c) the cost of recurrent spending is not deferred to future generations; and (d) there is adequate provision for spending on infrastructure development, overall capital spending and maintenance. In addition, Parliament must consider the short, medium and long-term implications of the fiscal framework, division of revenue and the long-term growth potential of the economy and the development of the country. Further, it must take into account cyclical factors that may impact on the prevailing fiscal position, public revenue and expenditure.
As in the case of the National Budget, the budgets of the provincial governments have been accompanied by three-year expenditure projections since 1999. The MTEF is intended to illustrate forward trends in expenditure priorities and to provide a firmer foundation for fiscal planning and review purposes.
The Minister of Finance is required to indicate each year how the expected deficit between consolidated government expenditure and revenue is to be financed or how any surplus is to be applied. The annual Consolidated Government Budget deficit financing requirement is principally met through the issue of long term fixed and non-fixed-rate National Government debt in the domestic capital market. The South African bond market is well-developed and highly liquid, and has attracted considerable foreign investor interest. The National Government also borrows from time to time in foreign capital markets, in which case the interest due and final repayment must be repaid in foreign currency.
During the course of each fiscal year, government departments and other spending agencies are held to the spending plans approved in the National Budget by a system of expenditure controls under the direction of the National Treasury. Subsequently, audits of all government accounts provide Parliament and the public with verification of the uses to which public funds have been put. The Auditor-General, a constitutionally independent official, supervises this auditing process. Current Auditor-General, Thembekile Kimi Makwetu, was appointed by former president Zuma on December 1, 2013, for a term of seven years.
Accountability is further promoted by the breakdown of expenditures into “votes” for particular government departments, whose director-generals are the accounting officers responsible for these monies. Further breakdowns into departmental programs and into so-called economic classification items (for example, employee compensation and payments for capital assets) serve to indicate in more detail the commitment of funds to defined purposes.
The Treasury Committee, comprising the President, Deputy President, the Minister of Finance, the Deputy Minister of Finance and other Cabinet members who have been assigned the task of assisting the Cabinet in evaluating additional expenditure requests that arise during the course of a budget year, seeks to ensure prudent fiscal management. In order for the Treasury Committee to approve an additional expenditure request, the expenditure must be deemed to be unforeseeable and unavoidable, or to fall within another legally prescribed category to qualify for inclusion in the Adjustments Budget. A contingency reserve is set aside each year of the MTEF to deal with such requests. Such amendments to some elements of the current year’s budget and the consolidated budget (in departmental allocations) are made by Parliament in an Adjustments Budget towards the middle of the fiscal year.
Also around the end of October of each year, the Minister of Finance presents the MTBPS. This policy statement outlines the priority policy proposals and the new MTEF that will underpin the next year’s budget.
Medium Term Budget Policy Statement (MTBPS)
The 2018 MTBPS sets out the macroeconomic, fiscal and public-expenditure priorities for the medium term. South Africa’s budget is strongly aligned with constitutional imperatives and is highly progressive. Over the past five years, government has followed a path of measured fiscal consolidation, aiming to stabilize the debt-to-GDP ratio by reducing spending and introducing tax increases. This strategy met with some success, reflected in a narrowing primary deficit, but debt has continued to rise as a share of GDP given that economic growth rates have declined.
The audited gross tax revenue outcome of R1.216 trillion for fiscal year 2017 was R49 billion lower than the original budget estimate in February 2017 and R0.8 billion lower than the revised 2018 Budget Review estimate. These shortfalls would have been larger were it not for tax increases amounting to R28 billion in 2017/18. Compared with the 2018 Budget estimates, value-added tax and dividend-withholding tax were the worst-performing tax categories, recording under-collections of R1.1 billion each. Corporate income tax (CIT) and fuel levy also recorded notable under-collections of R0.7 billion and R0.4 billion, respectively.
This year, the technical recession experienced in the first half of the year has begun to feed through to revenue collection, which has slowed. Weaker economic growth, alongside a once-off payment of VAT refunds backlog, will result in revenue shortfall now estimated at R27.4 billion, relative to the 2018 Budget estimate. A backlog of VAT refunds at South African Revenue Service, and an underestimation of refunds due, has led to an overly optimistic view of revenue growth. Net VAT collections account for about R20 billion of the 2018 in-year revenue shortfall. Two factors account for the revision in net VAT. The VAT refund estimate has been revised upwards by R9 billion, and about R11 billion will be paid out to clear the backlog in the VAT credit book. The remaining R7.4 billion of the shortfall in the current year mostly reflects slower corporate income tax collections due to weak growth in wholesale and retail trade, manufacturing and transport. Personal income tax continues to be negatively affected by job losses, moderate wage settlements, lower bonus payments and a slower expansion of public sector employment.
In the 2018 MTBPS, consolidated government revenue is projected to increase from R1.582 trillion in 2019/20 to R1.840 trillion in 2021/22. Gross tax revenue is projected to fall short of the 2018 Budget estimates by R24.7 billion in 2019/20 and R33 billion in 2020/21. Lower revenue growth in the years ahead reflects downward revisions to estimated revenues in the current year, slower growth in major tax bases and a reduction in the anticipated buoyancy for domestic VAT from 1.1 to 1.0.
Government’s three-year spending plans aim to reduce poverty and inequality, and to increase employment and inclusive growth. These priorities are set out in the NDP and the MTSF, which guide resource allocation. Healthcare, education, basic services and social grants continue to receive priority in allocations. Despite a constrained fiscal environment, these areas grow in real terms by 2-3%per year. Government projects total expenditure of R5.9 trillion over the 2019 MTEF period. Spending will grow by an average of 7.8% a year, reaching R2.1 trillion in 2021/22. Despite moderate economic growth projections, spending growth will outpace inflation, with real non-interest expenditure growth expected to average 1.9%over the period. Debt-service costs as an expenditure category grows the fastest at 10.9%.
The deficit is projected to reach 4% of GDP by 2021/22. Gross loan debt is expected to increase from R2.8 trillion or 55.8% of GDP in 2018/19 to R3.7 trillion or 58.5%of GDP in 2021/22. Fluctuations in inflation, interest and exchange rates since the 2018 Budget also affected debt. The weaker rand accounts for about 70% of the R47.6 billion upward revision to gross loan debt in the current year. Government is acutely aware of the dangers of unchecked debt accumulation. Debt is projected to stabilize at 59.6% of GDP in 2023/24.
To ensure the expenditure ceiling remains intact, and to support policy priorities, baselines are reprioritized by a total of R32.4 billion over the next three years. Funding of non-performing and under-performing areas has been reallocated, baselines have been reduced, the contingency reserve has been drawn down and provisional allocations have been adjusted. Reprioritized resources support the Government’ economic stimulus and recovery plan, and some non-discretionary and infrastructure spending pressures. In addition, R14.7 billion has been shifted within grants for upgrading informal settlements. Housing subsidies amounting to R1 billion will be centralized to improve support for middle and lower-income home buyers over the medium term.
There is a resource allocation of R1.336 trillion across the three spheres of government in fiscal year 2018/19. This increases to R1.640 trillion by fiscal year 2021/22. The proposed division of revenue prioritizes large social spending programs that support basic education, health and social welfare services in provinces and water, sanitation and electricity services in municipalities. Allocations over the period include changes to respond to the policy priorities discussed above and to rebuild municipal capacity. Over the medium term, government proposes to allocate 48.1%of available non-interest expenditure to national departments, 42.9%to provinces and 9%to local governments. Over this period, national government resources grow by 7%, provincial resources by 7.2% and local government resources by 7.2%.
2018 MTEF
The 2018 MTBPS has announced the 2019 MTEF, which sets out the consolidated expenditure framework for fiscal year 2018/19 through to fiscal year 2021/22. The framework consists of revised baseline estimates reflecting the government’s current spending priorities, including community development, social development, economic development, health services, as well as learning and culture (which take up the largest of planned expenditure). Strong growth over the future spending period can be seen in post-school education and training, community development, health, basic education and social protection.
2018-2019 National Budget and Consolidated Government Budgets
2018-2019 National Budget
In February 2018, the South African Minister of Finance submitted the 2018-2019 National Budget to Parliament. The 2018-2019 National Budget and the three-year MTEF estimates supported the long-term health of the public finances with a series of revenue and expenditure measures to narrow the budget deficit and stabilize debt. These measures included:
| ● | Revenue measures to raise an additional R36 billion in 2018/19 by increasing VAT and other taxes, which feed through to the outer years of the MTEF period. |
| ● | Funding for fee-free higher education and training, which amounts to additional spending of R57 billion over the medium term. |
| ● | A provisional allocation in 2018/19 of R6 billion for drought management, assistance to the water sector, and to improve the planning and execution of national priority infrastructure projects. |
| ● | A higher contingency reserve of R8 billion in 2018/19, R8 billion in 2019/20 and R10 billion in 2020/21, to allow for uncertainties associated with the economic outlook, the finances of state-owned companies and other spending pressures. |
Together with an improved growth outlook, the proposals were expected to reduce the consolidated budget deficit – the difference between total revenue and expenditure – from 4.3% of GDP in 2017/18 to 3.5% in 2020/21. A narrower deficit, stronger Rand and lower borrowing costs would result in gross government debt stabilizing at 56.2% of GDP by 2022/23. Net debt stabilizes at 53.2% of GDP in 2023/24. The risks to the fiscal outlook were elevated and included uncertainty in the pace of economic recovery, public-service wage pressures and the precarious finances of state-owned companies. A significant portion of funding has been reprioritized to safeguard the provision of social services, bolster public health programs, mitigate the increasing costs of higher education for students from low- and middle-income households, and maintain infrastructure investment. Apart from debt-service costs, one of the fastest-growing spending categories is post-school education and training, which grows by an annual average of 13.7%. Consolidated government spending expected to increase from R1.67 trillion in 2018/19 to R1.94 trillion in 2020/21. This represented annual average growth of 7.6%, or 2.1%in real terms.
The 2018 National Budget estimated 2018/19 gross tax revenue (after proposal) to amount to R1.345 trillion. Revenue measures were expected to raise R36 billion in 2018/19. The largest contribution was R22.9 billion from the one percentage point increase in VAT. In addition, R6.8 billion would be raised from lower-than-inflation increases to the personal income tax rebates and brackets.
The 2018-2019 National Budget estimated that total national revenues for fiscal year 2018 will amount to R1.321 trillion. National budget expenditures for fiscal year 2018 were estimated at R1.512 trillion. Consequently, the main budget deficit, which is government’s net borrowing requirement, was estimated at R191.1 billion, or 3.8% of GDP. As a result of fiscal measures, the primary deficit was projected to narrow towards a balance by 2020/21.
2018-2019 Consolidated Government Budget
The amounts reflected in the budget votes of the national departments whose functions are partially devolved to the provinces do not illustrate total allocations to such functions. By contrast, the Consolidated Government Budget presents a more relevant measure of trends and priorities in government finances in South Africa, particularly in the socio-economic field, and hence the tables and discussion below focus on this measure of government expenditure. See “Public Finance—Background.”
In the 2018 National Budget, the consolidated government expenditure was expected to increase from R1.558 trillion in 2017/18 to R1.942 trillion by 2020/21. This represents real annual average growth of 2.1%. The consolidated government budget deficit was estimated to narrow from 4.3% of GDP in 2017/18 to 3.5% by 2020/21. The deficit on the Consolidated Government Budget is lower than that in the main National Budget due to surpluses in the provinces and the social security funds, primarily the Unemployment Insurance Fund.
The estimated 2018-2019 Consolidated Government Budget continues to build on policy priorities established in 2001, with a special emphasis on growth-enhancing spending as well as spending programs that target the poor and vulnerable groups. Growth in all categories of social services spending reflects the National Government’s commitment to improving the social well-being of South Africans.
Basic education remained the largest category of expenditure receiving 16.5% of total allocations, followed by social development, health and economic affairs, which received 13.9% of allocations. The largest category of spending in terms of inputs required, however, remains compensation of employees which accounts for 35.2 of expenditures. Peace and security, and community development also remained significant. Consolidation in the midst of prolonged low growth calls for more vigilance in budgeting, and steps are being taken across government to improve budget execution and the in-year monitoring of spending. National and provincial departments and municipalities submit monthly reports to the National Treasury. To strengthen oversight, a process has been initiated for all national public entities to report on a quarterly basis. This will improve transparency and provide early warnings of budget deviations.
The following table sets forth the Consolidated Government Expenditure as set out in the 2018 MTBPS for the periods indicated.
Consolidated government expenditure, 2015-2017
| Fiscal year | | 2015 | | | 2016 | | | 2017 | |
| R billion | | Outcome | | | % of Total | | | Outcome | | | % of Total | | | Outcome | | | % of Total | |
| Current payments | | | 806.5 | | | | 59.0 | % | | | 881.6 | | | | 61.1 | % | | | 939.7 | | | | 60.6 | % |
| Compensation of employees | | | 472.8 | | | | 34.6 | % | | | 510.8 | | | | 35.4 | % | | | 546.2 | | | | 35.2 | % |
| Goods and services | | | 195.2 | | | | 14.3 | % | | | 214.0 | | | | 14.8 | % | | | 223.5 | | | | 14.4 | % |
| Interest and rent on land | | | 138.5 | | | | 10.1 | % | | | 156.8 | | | | 10.9 | % | | | 170.0 | | | | 11.0 | % |
| of which Debt-service costs | | | 128.8 | | | | 9.4 | % | | | 146.5 | | | | 10.2 | % | | | 162.6 | | | | 10.5 | % |
| Transfers and subsidies | | | 436.4 | | | | 31.9 | % | | | 471.8 | | | | 32.7 | % | | | 507.7 | | | | 32.8 | % |
| of which Capital transfers | | | 65.5 | | | | 4.8 | % | | | 69.9 | | | | 4.8 | % | | | 78.2 | | | | 5.0 | % |
| Provinces and municipalities | | | 108.2 | | | | 7.9 | % | | | 112.8 | | | | 7.8 | % | | | 121.8 | | | | 7.9 | % |
| Departmental agencies and accounts | | | 22.9 | | | | 1.7 | % | | | 25.7 | | | | 1.8 | % | | | 29.9 | | | | 1.9 | % |
| Higher education institutions | | | 29.4 | | | | 2.2 | % | | | 32.0 | | | | 2.2 | % | | | 39.8 | | | | 2.6 | % |
Foreign governments and
international organisations | | | 2.1 | | | | 0.2 | % | | | 2.3 | | | | 0.2 | % | | | 2.1 | | | | 0.1 | % |
Public corporations and private
enterprises | | | 28.7 | | | | 2.1 | % | | | 33.7 | | | | 2.3 | % | | | 28.3 | | | | 1.8 | % |
| Non-profit institutions | | | 28.6 | | | | 2.1 | % | | | 30.3 | | | | 2.1 | % | | | 32.1 | | | | 2.1 | % |
| Households | | | 216.5 | | | | 15.8 | % | | | 235.1 | | | | 16.3 | % | | | 253.7 | | | | 16.4 | % |
| Payments for capital assets | | | 92.3 | | | | 6.8 | % | | | 80.3 | | | | 5.6 | % | | | 81.7 | | | | 5.3 | % |
| Buildings and other capital assets | | | 75.4 | | | | 5.5 | % | | | 63.6 | | | | 4.4 | % | | | 65.6 | | | | 4.2 | % |
| Machinery and equipment | | | 16.8 | | | | 1.2 | % | | | 16.7 | | | | 1.2 | % | | | 16.2 | | | | 1.0 | % |
| Payments for financial assets | | | 31.1 | | | | 2.3 | % | | | 8.3 | | | | 0.6 | % | | | 20.3 | | | | 1.3 | % |
| Consolidated expenditure | | | 1,366.3 | | | | 100.0 | % | | | 1,442.0 | | | | 100.0 | % | | | 1,549.5 | | | | 100.0 | % |
Note:
| (1) | These figures were estimated by the National Treasury and may differ from data published by Stats SA and the SARB. The numbers in this table are not strictly comparable to those published in previous years due to the reclassification of expenditure items for previous years. Data for the history years have been adjusted accordingly. |
Source: National Treasury.
The following table sets forth the Consolidated Government Expenditure as set out in the 2016 MTBPS for the periods indicated. Please note that, while the line items may differ from the 2013-2015 Consolidated Government Budget table, the categories remain the same and can be compared.
Consolidated Government Expenditure by function & economic classification1, 2015/16-2021/22
| R billion | | 2015/16 | | | 2016/17 | | | 2017/18 | | | 2018/19 | | | 2019/20 | | | 2020/21 | | | 2021/22 | | | Average annual growth 2018/19 - 2021/22 | |
| | | Outcome | | | Revised | | | Medium-term estimates | | | | |
| Functional Classification | | | | | | | | | | | | | | | | | | | | | | | | |
| Learning and culture | | 271.0 | | | 292.2 | | | 322.9 | | | 352.3 | | | 386.5 | | | 414.1 | | | 446.1 | | | 8.2 | % |
| Basic education | | 203.1 | | | 217.2 | | | 231.1 | | | 247.4 | | | 264.3 | | | 283.1 | | | 307.0 | | | 7.5 | % |
| Post-school education and training | | 58.6 | | | 65.5 | | | 81.8 | | | 94.2 | | | 111.0 | | | 119.4 | | | 126.8 | | | 10.4 | % |
| Arts, culture, sport and recreation | | 9.3 | | | 9.5 | | | 9.9 | | | 10.7 | | | 11.2 | | | 11.6 | | | 12.3 | | | 4.8 | % |
| Health | | 163.7 | | | 176.5 | | | 191.6 | | | 205.1 | | | 223.7 | | | 243.5 | | | 257.7 | | | 7.9 | % |
| Peace and security | | 175.6 | | | 185.1 | | | 194.7 | | | 203.6 | | | 213.1 | | | 227.0 | | | 242.0 | | | 5.9 | % |
| Defense and state security | | 46.2 | | | 47.8 | | | 49.4 | | | 49.0 | | | 50.5 | | | 53.5 | | | 56.9 | | | 5.1 | % |
| Police services | | 83.2 | | | 87.6 | | | 93.8 | | | 99.1 | | | 105.4 | | | 112.5 | | | 119.9 | | | 6.6 | % |
| Law courts and prisons | | 38.9 | | | 41.4 | | | 43.2 | | | 45.7 | | | 48.8 | | | 51.8 | | | 55.2 | | | 6.5 | % |
| Home affairs | | 7.2 | | | 8.3 | | | 8.3 | | | 9.8 | | | 8.4 | | | 9.1 | | | 10.0 | | | 0.9 | % |
| Community development | | 171.5 | | | 176.3 | | | 176.3 | | | 195.6 | | | 209.7 | | | 228.4 | | | 245.4 | | | 7.9 | % |
| Economic development | | 173.4 | | | 183.3 | | | 181.2 | | | 193.5 | | | 211.3 | | | 223.9 | | | 233.5 | | | 6.5 | % |
| Industrialization and exports | | 34.0 | | | 35.6 | | | 33.5 | | | 33.6 | | | 38.5 | | | 39.8 | | | 40.1 | | | 6.1 | % |
| Agriculture and rural development | | 25.2 | | | 26.2 | | | 26.0 | | | 29.4 | | | 30.7 | | | 32.4 | | | 34.1 | | | 5.1 | % |
| Job creation and labor affairs | | 17.7 | | | 18.9 | | | 19.9 | | | 22.2 | | | 24.3 | | | 25.3 | | | 26.9 | | | 6.7 | % |
| Economic regulation and infrastructure | | 81.7 | | | 87.4 | | | 87.5 | | | 92.5 | | | 100.6 | | | 108.3 | | | 114.6 | | | 7.4 | % |
| Innovation, science and technology | | 14.9 | | | 15.2 | | | 14.3 | | | 15.9 | | | 17.1 | | | 18.1 | | | 17.8 | | | 4.0 | % |
| General public services | | 84.3 | | | 64.9 | | | 65.4 | | | 64.4 | | | 67.3 | | | 72.7 | | | 75.2 | | | 5.3 | % |
| Executive and legislative organs | | 12.6 | | | 12.8 | | | 15.3 | | | 15.7 | | | 17.0 | | | 18.5 | | | 18.2 | | | 5.1 | % |
| Public administration and fiscal affairs | | 61.5 | | | 40.2 | | | 41.2 | | | 41.0 | | | 42.5 | | | 46.0 | | | 48.7 | | | 5.9 | % |
| External affairs | | 10.2 | | | 11.9 | | | 8.9 | | | 7.7 | | | 7.9 | | | 8.2 | | | 8.3 | | | 2.5 | % |
| Social development | | 198 | | | 216.3 | | | 234.5 | | | 258.7 | | | 281.1 | | | 304.9 | | | 324.9 | | | 7.9 | % |
| Social protection | | 153 | | | 165.3 | | | 178.0 | | | 192.6 | | | 207.2 | | | 223.0 | | | 238.6 | | | 7.4 | % |
| Social security funds | | 45 | | | 51 | | | 56.5 | | | 66.0 | | | 74.0 | | | 81.9 | | | 86.4 | | | 9.4 | % |
| Payments for financial assets | | 31.0 | | | 8.2 | | | 20.3 | | | 15.1 | | | 6.1 | | | 6.7 | | | 7.1 | | | | |
| Allocation by functional classification | | 1,237.4 | | | 1,294.6 | | | 1,386.9 | | | 1,488.1 | | | 1,598.9 | | | 1,721.1 | | | 1,831.9 | | | 7.2 | % |
| Contingency reserve | | | | | | | | | | | | | | 7.0 | | | 8.0 | | | 12.0 | | | | |
| Debt-service costs | | 128.8 | | | 146.5 | | | 162.6 | | | 181.1 | | | 202.5 | | | 221.7 | | | 247.2 | | | 10.9 | % |
| Consolidated expenditure | | 1,366.2 | | | 1,441.2 | | | 1,549.5 | | | 1,669.2 | | | 1,808.4 | | | 1,950.9 | | | 2,091.1 | | | 7.8 | % |
Consolidated Government Expenditure by functional & economic classification1, 2015/16-2021/22 (continued)
| | | 2015/16 | | | 2016/17 | | | 2017/18 | | | 2018/19 | | | 2019/20 | | | 2020/21 | | | 2021/22 | | | Average
annual
growth
2018/19 –
2021/22 | |
| R billion | | Outcome | | | Revised | | | Medium -term estimates | | | | |
| Economic classification | | | | | | | | | | | | | | | | | | | | | | | | |
| Current payments | | 806.5 | | | 881.6 | | | 939.7 | | | 1,010.1 | | | 1,095.9 | | | 1,177.5 | | | 1,264.2 | | | 7.8 | % |
| Compensation of employees | | 472.8 | | | 510.5 | | | 546.2 | | | 587.2 | | | 630.4 | | | 676.9 | | | 722.9 | | | 7.2 | % |
| Goods and services | | 195.3 | | | 214.3 | | | 223.5 | | | 234.2 | | | 254.5 | | | 268.9 | | | 283.6 | | | 6.6 | % |
| Interest and rent on land | | 138.5 | | | 156.8 | | | 170.0 | | | 188.8 | | | 211.0 | | | 231.7 | | | 257.8 | | | 10.9 | % |
| of which Debt-service costs | | 128.8 | | | 146.5 | | | 162.6 | | | 181.1 | | | 202.5 | | | 221.7 | | | 247.2 | | | 10.9 | % |
| Transfers and subsidies | | 436.4 | | | 471.0 | | | 507.7 | | | 553.4 | | | 604.8 | | | 654.7 | | | 696.5 | | | 8.0 | % |
| of which Capital transfers | | 65.5 | | | 69.9 | | | 78.2 | | | 73.1 | | | 76.8 | | | 78.0 | | | 81.7 | | | | |
| Provinces and municipalities | | 108.2 | | | 112.7 | | | 121.8 | | | 130.7 | | | 138.4 | | | 150.3 | | | 162.7 | | | 7.6 | % |
| Departmental agencies and accounts | | 22.9 | | | 25.7 | | | 29.9 | | | 27.2 | | | 28.1 | | | 31.8 | | | 33.2 | | | 6.8 | % |
| Higher education institutions | | 29.4 | | | 32.0 | | | 39.8 | | | 42.3 | | | 44.3 | | | 46.8 | | | 49.3 | | | 5.3 | % |
| Foreign governments and international organizations | | 2.1 | | | 2.3 | | | 2.1 | | | 2.3 | | | 2.7 | | | 2.6 | | | 2.5 | | | 2.3 | % |
| Public corporations and private enterprises | | 28.7 | | | 33.7 | | | 28.3 | | | 31.3 | | | 33.9 | | | 35.5 | | | 35.8 | | | 4.5 | % |
| Non-profit institutions | | 28.6 | | | 30.3 | | | 32.1 | | | 37.2 | | | 41.4 | | | 44.6 | | | 47.4 | | | 8.4 | % |
| Households | | 216.5 | | | 234.3 | | | 253.7 | | | 282.3 | | | 315.9 | | | 343.1 | | | 365.6 | | | 9.0 | % |
| Payments for capital assets | | 92.2 | | | 80.2 | | | 81.7 | | | 90.6 | | | 94.7 | | | 104.0 | | | 111.4 | | | 7.1 | % |
| Buildings and other capital assets | | 75.4 | | | 63.5 | | | 65.6 | | | 72.1 | | | 75.1 | | | 82.6 | | | 88.8 | | | 7.2 | % |
| Machinery and equipment | | 16.8 | | | 16.7 | | | 16.2 | | | 18.5 | | | 19.6 | | | 21.4 | | | 22.6 | | | 6.9 | % |
| Payments for financial assets | | 31.0 | | | 8.2 | | | 20.3 | | | 15.1 | | | 6.1 | | | 6.7 | | | 7.1 | | | | |
| Allocation by economic classification | | 1,366.2 | | | 1,441.1 | | | 1,549.5 | | | 1,669.2 | | | 1,801.4 | | | 1,942.9 | | | 2,079.1 | | | 7.6 | % |
| Contingency reserve | | — | | | — | | | 0 | | | 0 | | | 7 | | | 8 | | | 12 | | | | |
| Consolidated expenditure | | 1,366.2 | | | 1,441.1 | | | 1,549.5 | | | 1,669.2 | | | 1,808.4 | | | 1,950.9 | | | 2,091.1 | | | 7.8 | % |
Note:
(1) Consisting of national, provincial, social security funds and public entities.
Source: National Treasury.
Taxation
Taxation in South Africa is administered by South African Revenue Service (SARS), an autonomous body managed by a board of directors and established by legislation to collect revenue and ensure compliance with tax law. SARS’ vision is to be an innovative revenue and customs agency that enhances economic growth and social development and supports South Africa’s integration into the global economy in a way that benefits all South African citizens. Among others, SARS collects personal income tax, company tax, value added tax, customs duties on imports, excise duties on prescribed goods, fuel levies and various other taxes.
While most tax revenues are collected at the national level, municipalities impose and collect property taxes. In addition, the main sources of revenue (although limited in scope) for provinces are motor vehicle license fees and gambling taxes. Non-tax user charges are levied principally by municipalities and extra-budgetary institutions, such as universities, museums, statutory research councils and public entities.
The National Government aims to maintain and strengthen a tax system that is fair, efficient and internationally competitive, while meeting fiscal policy requirements. Recognizing that improving tax administration and collection are essential steps towards achieving meaningful tax reform in the future, the National Government seeks to narrow the tax compliance gap and broaden the tax base. It is the National Government’s policy to keep tax law as simple as possible in order to minimize collection and compliance costs and to monitor the tax system on a continuous basis.
Personal Income Tax
South Africa has a progressive personal income tax system whereby income categories in different brackets are taxed at different rates. As of 2018, for individuals earning between R0 and R195,850, a tax rate of 18.0% is levied. This is the lowest tax bracket, with four other brackets being applied to higher income earners. The top bracket has a tax rate of 45.0%, and it applies to individuals earning more than R1.5 million per annum. The tax system also provides primary rebates for all taxpayers, as well as secondary rebates for people aged 65 years and older, and a tertiary rebate for people 75 years or older. In practice, it means that people earning less than R78,150 will not pay any tax, while those aged 65 years and older will not pay tax if they earn less than R121,000. For those older than 75 years, the tax threshold is R135,300.
The National Government has, over the past ten years, adjusted income tax brackets to take account of the effects of inflation on income tax paid by individuals.
Tax deductions on personal income tax include deductions for pension contributions, while tax credits are provided for individuals belonging to medical aids. In addition, interest income of up to R22,800 is tax exempt for individuals younger than 65 years and R33,000 for those 65 years and older.
Company Tax
South Africa reduced the headline corporate income tax rate from 40% in 1994 to the current 28.0% rate. Dividends are taxed in the hands of investors at 20% on a withholding basis.
Small business corporations (SBCs) with an annual turnover of less than R20 million have certain special tax provisions. They are taxed on a graduated scale with the first R78,150 being tax free. There are also 7.0% and 21.0% brackets, with taxable income in excess of R550,000 taxed at 28.0%. In addition, SBCs may benefit from accelerated depreciation of assets. There is a turnover tax option for businesses with an annual turnover of less than R1 million, in an attempt to minimize their compliance burden, while investors are encouraged to fund small businesses through a Venture Capital Company regime. Investments in VCCs are tax deductible, provided that the investments meet the necessary requirements. Since 2014, entities which provide grant funding to small businesses will not be taxed on their accruals and receipts, while grant funding in the hands of small businesses is also tax exempt, regardless of source.
Capital gains tax is levied on any capital gains realized by individuals and companies. Individuals are taxed at their marginal income tax rate, with a 40.0% inclusion rate. Primary residences have an exemption of R2 million. Companies are taxed at the corporate income tax rate of 28.0%, with an 80.0% inclusion rate.
South African tax legislation contains certain corporate reorganization rollover rules. These rules are intended to facilitate the tax free transfer of assets in specified circumstances. Taxpayers may not generally deduct interest incurred in respect of loan funding used to acquire shares because shares generally only produce exempt income. However, taxpayers can indirectly obtain a deduction for interest when acquiring shares of a target company when the acquisition is associated with certain rollover reorganizations.
The concept of “headquarter company” was introduced with effect from January 1, 2011. Headquarter companies enjoy certain tax and exchange control relief and the concept is aimed at positioning South Africa as a holding company gateway for foreign multinationals into Africa.
In order to qualify as a headquarter company, certain requirements must be met, inter alia:
| ● | a headquarter company must be a South African resident company; |
| ● | each shareholder of the company (whether alone or together with any other company forming part of the same group of companies as the shareholder) holds 10.0% or more of the equity shares and voting rights in that company; |
| ● | at least 80.0% or more of the cost of the total assets of the company is attributable to any interest in equity shares in, any amount loaned or advanced to, or any intellectual property as defined that is licensed by the headquarter company to, any foreign company in which the headquarter company held at least 10.0% of the equity shares and voting rights; and |
| ● | where the gross income of the headquarter company exceeds R5 million, at least 50.0% or more of its gross income consists of rental, dividends, interest, royalty or service fees paid by a foreign company, and/or proceeds from the disposal of equity shares in a foreign company or of any intellectual property which had been licensed by the headquarter company to the foreign company. |
Distributions from collective investment schemes (CIS), follow the flow-through principle, meaning that the income (e.g. interest, dividends, etc.) received by the CIS in securities will retain its nature when distributed to the CIS unit holders. If the income is not distributed within 12 months it will be taxed at CIS level. Real estate investment trusts (REIT’s) have their own taxation regime, and although income is taxed at REIT level, the flow through principle applies for distributed income. Distributed income is tax deductible at REIT level, while REITs are not subject to capital gains tax on disposal of their real estate assets.
A withholding tax on interest took effect on January 1, 2015. As a result, all interest paid to non-residents is taxed at a final withholding tax rate of 15.0% and is payable within 14 days after the end of the month during which the interest is paid. However, the withholding charge is subject to some exemptions, including debt issued by government and debt listed on an exchange. The exemption of interest owed by domestic banks does not include back-to-back loan agreements designed to circumvent the 15.0% withholding tax (e.g., if the bank acts as an intermediary to facilitate the unlisted borrowing of funds by a domestic company from a foreign lender).
In addition to the exemption for mobile portfolio debt capital, cross-border interest withholding contains three additional exemptions which apply to: (a) trade finance; (b) certain foreign payers and foreign payees; and (c) certain forms of debt owed by a headquarter company. South African double tax agreements with low tax jurisdictions that provide for a zero withholding rate will be renegotiated.
In addition to withholding taxes on interest and dividends, offshore royalty payments are also subject to a 15.0% withholding tax. All withholding taxes are subject to double tax treaty provisions. South Africa has an extensive double tax treaty network with over 70 countries, which makes the country more attractive for foreign investors.
International transactions are subject to rules dealing with transfer pricing and controlled foreign companies. South Africa is part of the Base Erosion Profit Shifting (BEPS) project conducted by the Organization of Economic Cooperation and Development (OECD). Following the conclusion of the first part of the project, South Africa is in the process of aligning its relevant processes and legislation to OECD proposals. This includes subscribing to the country by country (CbC) reporting arrangement, whereby participating countries will be compelled to collect and share information on multinationals operating in their countries. Following the BEPS process, the G 20 identified the tax challenges posed by the digitization of the global economy as a particular concern needing special focus. The OECD formed a Task Force for the Digital Economy (TFDE) and South Africa is an active member. The TFDE is expected to make final recommendations to G20 members by 2020.
As of January 1, 2011, a controlled foreign company includes a foreign company where more than 50.0% of the total participation rights in that foreign company is not only directly held, but also indirectly held by one or more persons that are South African residents other than persons that are headquarter companies. If one or more South African residents hold more than 50.0% of the participation rights in an offshore cell, the cell will be deemed to be a controlled foreign company without regard to ownership in the other cells. As of April 1, 2012, the ownership threshold in respect of the dividend and capital gain participation exemptions in relation to foreign shares was reduced from 20.0% down to 10.0%. This lower threshold is consistent with the global economic concept of direct foreign investment and that of the South African exchange control requirements.
Effective April 1, 2012, transfer pricing rules were modernized to be in line with the OECD guidelines. The amendment will shift the focus from goods and services to a broader category of “cross-border transactions, operations, schemes, agreements or understandings” that have been effected between, or undertaken for the benefit of connected persons. The new transfer pricing rules are closely aligned with the wording of the OECD and UN Model Tax Conventions and are in line with tax treaties and other international tax principles. Updates to the initial guidelines have been updated and implemented in South Africa.
In relation to the thin-capitalization provisions, the amendments effectively took away the tax Commissioner’s discretion to determine whether or not financial assistance provided to a South African resident by a non-resident who is connected to the resident, is excessive in relation to the fixed capital of the recipient of the financial assistance. The taxpayer will now be obliged to ensure that all its transactions are done on an arm’s length basis. Further, the thin capitalization rules have now been merged directly into the transfer pricing rules. The transfer pricing rules will henceforth be used to deny deductions for interest that would not have existed had a South African entity not been thinly capitalized with excessive debt.
A new uniform system of source rules was introduced on January 1, 2012. The new uniform system combines the common rules, pre-existing rules and tax treaty principles. These source rules will loosely reflect implicit tax treaty principles, with a few added built-in protections, so that the South African system is globally aligned. The new source rules eliminate the concept of deemed source. South African sources of income are now fully defined and items of income falling outside these definitions will be treated as foreign source income, unless a particular category of income is not expressly defined, in which case the common rules will continue to apply.
Investors in equity funds constituted as partnerships or trusts will be granted tax relief and will be regarded as having a permanent establishment in South Africa merely by virtue of their investment. This tax relief places limited partners of trust beneficiaries in the same position had these investors invested directly in the underlying assets of the partnership or trust. The investors will not be exposed to South African tax merely because of the portfolio management activities carried on in South Africa. However, management fees of the South African manager, general partner or trustee will remain taxable in South Africa. To qualify for this relief the investor must satisfy the following requirements: (a) the partner or trust beneficiary must have limited liability like a shareholder of a company; (b) the partner or trust beneficiary must not participate in the effective management of the business of the partnership or trust; (c) the partner or the trust beneficiary must not have the authority to act on behalf of the partnership or trust or on behalf of the members of the partnership or trust; and (d) the partner or trust beneficiary must not render any services to or on behalf of the partnership or trust.
A new definition of a “foreign partnership” was introduced into the Income Tax Act for tax years commencing after October 1, 2010. The purpose of the new definition is to ensure that entities like limited liability partnerships or limited liability companies and similar hybrid entities are not treated as companies when they are in fact partnerships. The new definition therefore synchronizes the South African tax treatment of these entities with foreign tax practice. To qualify as a foreign partnership, an entity must be a partnership, association or body of persons established or formed under foreign law.
South Africa has introduced specific provisions in the various tax acts (Income tax Act, Value Added Tax and Securities Transfer Tax) to cater for Islamic finance. In 2014, the legislation was amended to also allow state owned enterprises to issue a Sukuk, following the successful issue of a Sukuk by the South African government. The changes were introduced to place the above mentioned products on an equal footing with conventional finance products.
In an effort to encourage conservation of South Africa’s rich biodiversity, the Income Tax Act contains tax incentives (introduced in the 2008–2009 Budget) for private landowners that have entered into bilateral agreements to conserve and maintain a particular area of land on behalf of the National Government under the terms of the National Environmental Management: the Biodiversity Act of 2004 and: National Environmental Management: the Protected Areas Act of 2003. Landowners are eligible for income tax deductions for environmental maintenance and rehabilitation expenses as well as the loss of the right to use land associated with biodiversity conservation and management under the terms of these agreements. Furthermore, the mineral and petroleum royalty regime came into effect in two phases: Section 1 of the Royalty Act came into effect on November 1, 2009, and the rest of the Royalty Act came into effect on March 1, 2010. Variable royalty rates will apply according to two separate formulae for refined and unrefined minerals. The tax base is gross sales less certain expenses. According to the OECD, in 2016, South Africa’s environmentally related tax revenue as a share of total tax revenue accounted for 5.37%.
South Africa levies a securities transfer tax (STT) on the transfer of both listed and unlisted shares at a rate of 0.25%. There are exemptions for securities backed lending transactions, and the STT only applies to equity securities.
Depreciation allowances, including the increased depreciation relief for urban development zones, are available to taxpayers that invest in (by erecting or refurbishing) any commercial or residential building within specified urban development zones. The allowance is deductible in the year the erected building or the refurbished part of the building is brought into use by the taxpayer for purposes of trade, and this depreciation relief will benefit owners, users or lessors of such buildings.
The amount of the allowance is dependent on whether the taxpayer erects a new commercial or residential building or refurbishes an existing commercial or residential building. Taxpayers that erect a new commercial or residential building within a specified urban development zone will be allowed an 11-year write-off period. In addition, 20.0% of the cost to the taxpayer of the erection or extension of or addition to that building, which is deductible in the year of assessment during which that building is brought into use by that taxpayer solely for the purposes of that taxpayer’s trade and 8.0% of that cost in each of the ten succeeding years of assessment. Depreciation relief has also been afforded to environmental production and post-production assets. Both sets of assets must be ancillary to the manufacturing process, of a permanent nature and utilized to fulfill environmental obligations. Environmental production assets are eligible for a 40:20:20:20 rate of depreciation, while the rate of relief for environmental post-production assets (e.g. dams or disposal facilities) is 5.0% per annum (i.e., a 20-year straight-line write-off period).
Consolidated Government Revenue
Revenue Outcomes and revised estimates
Gross tax revenue collections for 2017/18 amounted to R1.22 trillion, a decrease of R0.8 billion compared to the 2018 Budget estimates. The largest shortfall against the 2017 Budget estimate was in dividend withholding tax (R1.1 billion), reflecting continued pressure on corporate profits. Further shortfalls were registered for value added tax (R1.1 billion), corporate income tax (R0.7 billion) and the fuel levy (R0.4 billion). These shortfalls were offset by higher collections in interest on overdue income tax, as well as in donations and securities transfer taxes.
For the first six months of 2018/19, gross tax revenue collection grew by 10.7%compared to the same period last year. However, the effects of the technical recession experienced in the first half of the year have begun to feed through to revenue collection, which has since slowed down. Corporate and personal income taxes have been the hardest hit, both reflecting significant under-collections in the first six months of 2018/19. Given weaker economic growth, alongside an additional R20 billion in value-added tax (VAT) refunds, the National Treasury projects a tax revenue shortfall of R27.4 billion in 2018/19 compared with the 2018 Budget estimate.
Revenue weakness reflects a number of economic factors:
| ● | GDP growth has been revised downwards in 2018 following a recession in the first half of the year. This reflects lower production by the agriculture and mining sectors, as well as a lack of new investment due to low levels of demand and prolonged policy uncertainty. |
| ● | Personal income tax collection has been negatively affected by continued job losses, the moderation in wage settlements, lower bonus payments and a slower expansion of public-sector employment. |
| ● | Corporate income tax under collections in the first half of 2018/19 were a result of weak growth in the wholesale and trade, manufacturing and transport sectors. Corporate profitability remains under pressure amid subdued business and consumer confidence. |
| ● | Continued weak investment as well as lower household consumption, as a result of a contraction in disposable household incomes in the second quarter of 2018, negatively affected domestic VAT collections. The estimate for VAT refunds in 2018/19 has been revised upwards by R9 billion compared to the 2018 Budget, and an additional R11 billion will be paid out to clear the backlog in the VAT credit book. |
Gross tax revenue performance and projections
| R billion | Budget1 | 2017/18
Outcome | Deviations | Budget1 | 2018/19
Revised | Deviations |
| Persons and individuals | 461.0 | 461.0 | 0.0 | 505.8 | 504.2 | (1.6) |
| Companies | 218.1 | 217.4 | (0.7) | 231.2 | 225.3 | (5.9) |
| Value-added tax | 299.1 | 298.0 | (1.1) | 348.1 | 328.1 | (20.0) |
| Dividend withholding tax2 | 29.0 | 27.9 | (1.1) | 30.8 | 29.3 | (1.5) |
| Specific excise duties | 37.3 | 37.4 | 0.1 | 40.7 | 40.0 | (0.6) |
| Fuel levy | 71.3 | 70.9 | (0.4) | 77.5 | 77.4 | (0.1) |
| Customs duties | 49.0 | 49.2 | 0.1 | 52.6 | 54.0 | 1.4 |
| Ad-valorem excise duties | 3.8 | 3.8 | 0.0 | 4.2 | 4.3 | 0.1 |
| Other | 48.7 | 51.0 | 2.3 | 54.0 | 54.9 | 0.9 |
| Gross tax revenue | 1,217.3 | 1,216.5 | (0.8) | 1,345.0 | 1,317.6 | (27.4) |
| 1. 2018 Budget figures | |
| 2. Includes secondary tax on companies | |
| Source: National Treasury | |
Financing
The following table sets forth the financing of the net borrowing requirement of the National Government for the five fiscal years ended March 31, 2018 and estimated amounts for the fiscal year ending March 31, 2019.
Financing of the Net Borrowing Requirement of the National Government
| R Million | | 2014 | | 2015 | | 2016 | | 2017 | | 2018 | | Revised
estimate
2019(3) |
| Borrowing | | | | | | | | | | | | |
| Revenue | | 887,366.2 | | 965,456.9 | | 1,076,234.4 | | 1,137,896.4 | | 1,196,394.0 | | 1,298,267.5 |
| Expenditure | | 1,047,758.6 | | 1,131,900.1 | | 1,244,622.9 | | 1,305,486.2 | | 1,404,985.9 | | 1,513,436.1 |
| Main Budget balance(1) | | (160,392.4) | | (166,443.2) | | (168,388.5) | | (167,589.80) | | (208,591.9) | | (215,168.6) |
| % of GDP | | (4.44)% | | (4.31%) | | (4.08%) | | (3.80%) | | (4.42%) | | (4.26%) |
| Financing | | | | | | | | | | | | |
| Domestic short-term loans (net) | | 23,048.0 | | 9,569.0 | | 13,075.0 | | 40,507.1 | | 33,408.1 | | 24,000.0 |
| Domestic long-term loans (net) | | 149,414.4 | | 157,014.0 | | 146,172.0 | | 116,684.3 | | 174,438.0 | | 162,481.0 |
| Market loans | | 172,112.5 | | 192,414.0 | | 176,795.0 | | 175,070.5 | | 200,249.7 | | 175,500.0 |
| Loans issues for switches | | (1,135.3) | | (1,160.0) | | (2,479.0) | | (1,036.4) | | (1,557.6) | | — |
| Redemptions | | (21,562.8) | | (34,240.0) | | (28,144.0) | | (57,349.8) | | (24,254.1) | | (13,019.0) |
| Foreign loans (net) | | 378.4 | | 8,361.0 | | (3,879.0) | | 36,380.7 | | 29,773.3 | | 51,706.0 |
| Market loans | | 19,619.1 | | 22,952.0 | | — | | 50,959.3 | | 33,894.5 | | 53,818.0 |
| Loans issues for switches | | — | | — | | — | | 1,111.4 | | — | | — |
| Arms procurement loan agreements | | — | | — | | — | | — | | — | | — |
| Redemptions (including revaluation of loans) | | (19,240.7) | | (14,591.0) | | (3,879.0) | | (15,690.0) | | (4,121.2) | | (2,112.0) |
| Change in cash and other balances(2) | | (12,448.4) | | (8,500.8) | | 13,020.5 | | (25,982.30) | | (29,027.50) | | (23,018.40) |
| | | | | | | | | | | | | |
| Total | | 160,392.4 | | 166,443.2 | | 168,388.5 | | 167,589.80 | | 208,591.9 | | 215,168.6 |
Notes:
(1) A negative number reflects a deficit and a positive number a surplus.
(2) A positive change indicates a reduction in cash balances.
(3) Numbers as published during the October 2018 MTBPS.
Source: National Treasury.
In addition to transfers received from the National Budget and their own provinces’ revenue collections, Provincial Budgets are financed by means of opening balances and concessionary and non-concessionary funding such as loans by the DBSA. The deficit of the National Budget is financed mainly by domestic and foreign loans. The provinces are barred constitutionally from raising loans for current expenditure. Loans for bridging finance may be advanced, however, provided that the provinces redeem such loans within 12 months following the date on which they are obtained, and any special conditions be specified in an act of Parliament which is required to be recommended by the Financial and Fiscal Commission. In addition, the National Government may not guarantee any provincial or local government loans, unless the guarantee complies with the norms and conditions for such guarantee as set out in an act of Parliament. See “Public Finance—Background.”
NATIONAL GOVERNMENT DEBT
General
The legal authorization for the incurrence of debt by the National Government is set forth in the PFMA. The National Treasury administers the National Government debt of South Africa. In February of each year the annual budget is tabled in Parliament, including the government’s anticipated borrowing requirements and financing strategy for the current financial year and over the medium-term period (three years). Pursuant to Section 66 of the PFMA, the Minister of Finance needs to approve each issuance of debt. The PFMA also sets out for which purposes the Minister may borrow. There is no statutory cap on the stock of debt. In addition to its direct indebtedness, the National Government is also a guarantor of certain third-party indebtedness. South Africa has issued formal contractual guarantees of certain indebtedness, primarily on behalf of partially or wholly state-owned entities. In this document, the National Government debt does not include debt that is guaranteed by the National Government. However, the guaranteed debt is summarized in the table entitled “Outstanding National Government Guaranteed Debt”. In addition, the National Government debt does not include debts incurred by the nine Provincial Governments. In this section, “external debt” means debt initially incurred or issued outside South Africa, regardless of the currency of denomination, and “internal debt” means debt initially incurred or issued in South Africa. “Floating debt” means debt that had a maturity at issuance of less than one year. “Funded debt” means debt that had a maturity at issuance of one year or more.
The following table summarizes the National Government debt as of March 31 in each of the years 2014 through 2018 and as of September 30, 2018.
| | | As of March 31, | | | As of
September
30, | |
| | | 2014 | | | 2015 | | | 2016 | | | 2017 | | | 2018 | | | 2018 | |
| | | Rand (million) | |
| Government bonds | | 1,217,512 | | | 1,399,282 | | | 1,572,574 | | | 1,731,657 | | | 1,949,573 | | | 2,058,817 | |
| Treasury bills | | 192,206 | | | 202,217 | | | 209,468 | | | 249,970 | | | 293,321 | | | 296,393 | |
| Marketable internal debt | | 1,409,718 | | | 1,601,499 | | | 1,782,042 | | | 1,981,627 | | | 2,242,894 | | | 2,355,210 | |
| Non-marketable internal debt | | 31,381 | | | 30,586 | | | 37,322 | | | 38,443 | | | 29,013 | | | 58,190 | |
| Total internal debt | | 1,441,099 | | | 1,632,085 | | | 1,819,364 | | | 2,020,070 | | | 2,271,907 | | | 2,413,400 | |
| Total external debt(1) | | 143,659 | | | 166,830 | | | 199,607 | | | 212,754 | | | 217,811 | | | 286,396 | |
| Total gross loan debt | | 1,584,758 | | | 1,798,915 | | | 2,018,971 | | | 2,232,824 | | | 2,489,718 | | | 2,699,796 | |
| Cash balances(2) | | (205,304 | ) | | (214,708 | ) | | (214,333 | ) | | (224,615 | ) | | (205,196 | ) | | (274,641 | ) |
| Total net loan debt(3) | | 1,379,454 | | | 1,584,207 | | | 1,804,638 | | | 2,008,209 | | | 2,284,522 | | | 2,425,155 | |
| GFECRA | | (177,913 | ) | | (203,396 | ) | | (304,653 | ) | | (231,158 | ) | | (193,917 | )(4) | | (193,917 | )(4) |
| As percentages of nominal GDP: | | | | | | | | | | | | | | | | | | |
| Net loan debt | | 38.2 | % | | 41.2 | % | | 44.2 | % | | 45.51 | % | | 48.39 | % | | 48.06 | % |
| External debt | | 4.0 | % | | 4.3 | % | | 4.9 | % | | 4.82 | % | | 4.61 | % | | 5.68 | % |
| As percentage of gross loan debt: | | | | | | | | | | | | | | | | | | |
| External debt | | 9.1 | % | | 9.3 | % | | 9.9 | % | | 9.53 | % | | 8.75 | % | | 10.61 | % |
Notes:
| (1) | Valued using the applicable foreign exchange rates as at the end of each period. |
| (2) | This represents surplus cash of the National Revenue Fund on deposit at the commercial banks and the SARB. Bank balances in foreign currencies are revaluated using the applicable exchange rates as at the end of each period. |
| (3) | The total net loan debt is calculated with due account of the bank balances of the National Revenue Fund (balances of the National Government’s accounts with the SARB and with commercial banks). |
| (4) | Represents the balance on the GFECRA on March 31, 2018. A negative balance indicates a profit and a positive balance reflects a loss. |
Sources: South African National Treasury and the SARB.
Summary of Internal National Government Debt
Total internal National Government debt as of March 31, 2018 was R2,272 billion, an increase of 12.5% over the corresponding amount of R2,020 billion as of March 31, 2017.
The following table sets forth the total internal National Government debt, divided into floating debt and funded debt, for the periods indicated.
Gross National Government Internal Debt
| | | As of March 31, | | As of September
30, | |
| | | 2014 | | | 2015 | | | 2016 | | | 2017 | | | 2018 | | | 2018 | |
| | | Rand (million) | |
| Marketable securities | | | | | | | | | | | | | | | | | | |
| Floating | | 192,206 | | | 202,217 | | | 209,469 | | | 249,970 | | | 293,321 | | | 296,393 | |
| Funded | | 1,217,512 | | | 1,399,409 | | | 1,572,573 | | | 1,731,657 | | | 1,949,573 | | | 2,058,817 | |
| Total(1) | | 1,409,718 | | | 1,601,626 | | | 1,782,042 | | | 1,981,627 | | | 2,242,894 | | | 2,355,210 | |
| Non-marketable securities | | | | | | | | | | | | | | | | | | |
| Floating | | 21,813 | | | 21,370 | | | 27,194 | | | 27,2199 | | | 17,256 | | | 46,532 | |
| Funded | | 9,568 | | | 9,089 | | | 10,128 | | | 11,244 | | | 11,757 | | | 11,658 | |
| Total(2) | | 31,381 | | | 30,459 | | | 37,322 | | | 38,443 | | | 29,013 | | | 58,190 | |
| Total internal National Government debt | | 1,441,099 | | | 1,632,085 | | | 1,819,364 | | | 2,020,070 | | | 2,271,907 | | | 2,413,400 | |
Notes:
| (1) | Treasury bills are classified as floating marketable securities. Government bonds are classified as funded marketable securities. |
| (2) | Borrowings from the Corporation for Public Deposits are classified as floating non-marketable securities. Retail government bonds (since May 2004), together with debt and liabilities of the former TBVC states (which include Transkei, Bophuthatswana, Venda and Ciskei) and the Republic of Namibia that were assumed by the National Government in connection with South Africa’s transition to a constitutional democracy, are classified as funded non-marketable securities. |
Sources: South African National Treasury and SARB.
Summary of External National Government Debt
The National Government borrows in the global market partly to finance its foreign currency commitments and partly to maintain a benchmark in major currencies. As part of these benchmarks, a limit of 15.0% is placed on the share of foreign currency debt as a percentage of total debt. South Africa’s external National Government debt as a percentage of total debt remains low. External debt as a percentage of total gross loan debt declined marginally from 9.53% to 8.75% as of March 31, 2017 and 2018, respectively and is 10.61% as at September 30, 2018.
The following table sets forth a breakdown of National Government external debt by currency as of March 31 in each of the years 2014 through 2018 and as of September 30, 2018.
External Debt by Currency
| | | As of March 31, | | As of
September 30, |
Currency in which debt is held | | 2014 | | 2015 | | 2016 | | 2017 | | 2018 | | 2018 |
| | | (million) |
| Euro | | 1,126 | | 1,488 | | 1,383 | | 549 | | 548 | | 527 |
| Pound Sterling | | 62 | | 44 | | 26 | | 14 | | 14 | | 7 |
| Swedish Kroner | | 4,164 | | 3,469 | | 2,775 | | 1,733 | | 1,733 | | 1,039 |
| US Dollars | | 10,696 | | 11,125 | | 11,055 | | 16,962 | | 16,961 | | 18,923 |
| Yen | | 60,706 | | 60,612 | | 60,517 | | 60,376 | | 60,376 | | 60,282 |
| Total (in Rand)(1) | | 143,659 | | 166,831 | | 199,607 | | 212,754 | | 217,811 | | 286,396 |
Note:
| (1) | The conversion into Rand is calculated at the exchange rate published by the SARB on the last business day of the fiscal year. |
Source: National Treasury.
The 2018 Budget Review made provision for US$9 billion equivalent to be raised in the international capital markets over the medium-term with a US$3 billion issuance envisaged in 2018/19. Part of the proceeds was intended to build up cash for a larger redemption of USD3.5 billion due in 2019/20. However, due to market conditions, US$ 2.0 billion of the planned US$3 billion was placed in the international capital markets. The amount comprised of US$1.4 billion and US$0.6 billion respectively on the 12 and 30 year bonds.
South Africa’s ability to raise foreign debt currency on favorable terms is impacted by its credit ratings, which are subject to change. In the first half of 2018, pressures on South Africa’s credit ratings somewhat subsided following a year of unpleasant rating outcomes from all solicited rating agencies. The lessened pressure on the ratings resulted from, among others, the appointment of Cyril Ramaphosa as President of the Republic which led to improved business and consumer confidence. The 2018 February Budget, which outlined fiscal measures aimed at stimulating economic growth and stabilizing high government debt, was also well received by rating agencies.
As a result, on 23 March 2018, Moody’s affirmed both South Africa’s long-term foreign and local currency credit ratings at ‘Baa3’ and changed the outlook to stable from negative. This concluded the rating agency’s decision to place South Africa’s ratings on ‘review for downgrade’ in November 2017. R&I followed suit on 13 April 2018 and affirmed the country’s long-term foreign and local currency credit ratings at ‘BBB’ and ‘BBB+’ respectively, and changed the outlook to stable from negative. On 25 May 2018, S&P Global Ratings (S&P) affirmed the country’s long term foreign currency rating at ‘BB’ and local currency rating at ‘BB+’, also maintaining a stable outlook. Fitch Ratings (Fitch), on 15 June 2018, affirmed both South Africa’s ratings at ‘BB+’ and also maintained a stable outlook. South Africa’s long-term foreign and local currency ratings by Moody’s and Rating and Investment Information Inc., the largest Japanese credit rating agency, remain investment grade, while S&P and Fitch are non-investment grade. All solicited agencies hold a stable outlook.
The 2018 MTBPS portrayed a gloomy picture, with revised projections compared to the February Budget being credit negative as outlined by Moody’s and Fitch in their commentary notes, published on 25 October 2018. The agencies highlighted among other factors that the 2018 MTBPS reflects weaker projections compared to the February Budget and does not contain any fiscal offsetting measures. Furthermore, the higher debt-to-GDP trajectory estimated to stabilize at 56.2%in 2022/23 remained a constraint to South Africa’s credit ratings.
Following S&P’s second annual rating review visit in October 2018, S&P on 23 November 2018 affirmed both South Africa’s long-term foreign and local currency ratings at ‘BB’ and ‘BB+’ respectively and maintained a stable outlook. According to S&P, the affirmation of the rating and the stable outlook takes into consideration the series of economic reforms the President Ramaphosa’s government is pursuing, that should help boost the economy from 2019, despite structural impediments, chronic skills shortages, and high unemployment. However, anemic economic growth in 2018 and high contingent liabilities continue to weigh on South Africa’s fiscal prospects and debt burden.
Fitch also followed suit on 06 December 2018, affirming both South Africa’s ratings at ‘BB+’ and maintaining a stable outlook. According to Fitch, the ratings affirmation and stable outlook are based on the following factors: low growth potential, sizeable government debt and contingent liabilities and the risk of rising social tensions due to extremely high inequality. However, the ratings are supported by strong institutions, a favorable government debt structure, deep local capital markets and a healthy banking sector.
| Rating Agency | Credit Rating Action | Action | LTFC¹ | LTLC² | Outlook |
| Fitch | 06-Dec-18 | Ratings affirmed | BB+ | BB+ | stable |
| S&P | 23-Nov-18 | Ratings affirmed | BB | BB+ | stable |
| R&I | 13-Apr-18 | Ratings affirmed | BBB | BBB+ | stable |
| Moody’s | 23-Mar-18 | Ratings affirmed | Baa3 | Baa3 | stable |
¹ Long Term Foreign Currency, ² Long Term Local Currency
Guaranteed Debt
In addition to its direct indebtedness, the National Government is also a guarantor of certain third-party indebtedness. The National Government has issued formal contractual guarantees in respect of certain indebtedness of wholly or partially state-owned companies.
The following table sets forth the debt guaranteed by the National Government outstanding in each of the years indicated:
Outstanding National Government Guaranteed Debt
| | | As of March 31, |
| | | 2014 | | 2015 | | 2016 | | 2017 | | 2018 |
| | | Rand (million) |
| Internal | | 160,784 | | 169,211 | | 187,009 | | 191,894 | | 208,102 |
| External(1) | | 48,784 | | 56,682 | | 76,972 | | 98,525 | | 113,169 |
| Total | | 209,568 | | 225,893 | | 263,981 | | 290,419 | | 321,271 |
Note:
| (1) | Excludes guarantees to the Independent Power Producers and Public-Private Partnerships. |
Source: National Treasury.
The following table sets forth the National Government’s external guaranteed debt outstanding as of March 31, 2018.
Analysis of National Government External Guaranteed Debt
| | | As of March 31, 2018 |
Guarantees Issued on Behalf of | | ZAR | | US Dollars | | Euro | | Equivalent in Rand(1) |
| | | Amount (million) |
| Transnet | | 3,500 | | — | | — | | 3,500 |
| Land bank | | 1,000 | | — | | — | | 1,000 |
| Telkom | | — | | — | | 8 | | 111 |
| IDC | | — | | — | | 9 | | 137 |
| Lesotho Highlands Development Authority | | 3 | | — | | 0 | | 3 |
| DBSA | | 3,172 | | 5 | | 50 | | 3,961 |
| Trans-Caledon Tunnel Authority | | 0 | | — | | — | | 0 |
| ESKOM | | 52,639 | | 2,834 | | 1,103 | | 102,392 |
| Total(2) | | 60,314 | | 2,839 | | 1,170 | | 111,104 |
Note:
| (1) | Conversion of amounts into Rand have been made at the following rates: US Dollar = R11.87; Euro = R14.62. |
| (2) | Does not include guaranteed interest to the amount of R5.5 billion. |
Source: National Treasury.
Debt-Service Costs
As a percentage of the National Government expenditure, debt-service costs increased from 9.7% during fiscal year 2013/14 to 11.6% in 2017/18. As a percentage of the National Government revenue, debt-service costs increased from 11.4% during fiscal year 2013/14 to 13.6% in 2017/18. In addition, as a percentage of GDP, debt-service costs increased from 2.8% during fiscal year 2013/14 to 3.4% in 2017/18. The following table sets forth such percentages for the periods indicated.
| | | For the year ended March 31, As % of GDP | |
| | | 2014 | | | 2015 | | | 2016 | | | 2017 | | | 2018 | |
| Expenditure | | 9.7 | % | | 10.1 | % | | 10.3 | % | | 11.2 | % | | 11.6 | % |
| Revenue | | 11.4 | % | | 11.9 | % | | 12.0 | % | | 12.9 | % | | 13.6 | % |
| Debt Service Costs | | 2.8 | % | | 3.0 | % | | 3.1 | % | | 3.3 | % | | 3.4 | % |
Source: National Treasury.
The aggregate amount of scheduled repayments in respect of principal and interest on the funded National Government debt outstanding as of September 30, 2018, is set forth in the table below.
| | | | | | External Debt | |
| Year(1) | | Rand | | | US$ | | | EURO | | | YEN | | | GBP | | | SEK | |
| | | | | | Amount (million) | | | | | | | |
| 2019 | | 156 514 | | | 1031 | | | 55 | | | 2,384 | | | 8 | | | 792 | |
| 2020 | | 177 699 | | | 1008 | | | 41 | | | 2,381 | | | 7 | | | 756 | |
| 2021 | | 192 485 | | | 4,359 | | | 31 | | | 2,379 | | | 2 | | | 491 | |
| 2022 | | 183 619 | | | 1,319 | | | 24 | | | 31,807 | | | 1 | | | 236 | |
| 2023 | | 213 991 | | | 797 | | | 18 | | | 30,617 | | | — | | | — | |
| 2024 | | 215 295 | | | 1,767 | | | 18 | | | — | | | — | | | — | |
| 2025 | | 174 373 | | | 2,238 | | | 18 | | | — | | | — | | | — | |
| 2026 | | 193 158 | | | 668 | | | 18 | | | — | | | — | | | — | |
| 2027 | | 234 416 | | | 2,609 | | | 18 | | | — | | | — | | | — | |
| 2028 | | 117 285 | | | 1,770 | | | 518 | | | — | | | — | | | — | |
| 2029 | | 217 739 | | | 1,465 | | | | | | — | | | — | | | — | |
| 2030 | | 176 264 | | | 2,441 | | | — | | | — | | | — | | | — | |
| 2031 | | 100 725 | | | 355 | | | — | | | — | | | — | | | — | |
| 2032 | | 154 710 | | | 1,714 | | | — | | | — | | | — | | | — | |
| 2033 | | 151 800 | | | 273 | | | — | | | — | | | — | | | — | |
| 2034 | | 161 479 | | | 273 | | | — | | | — | | | — | | | — | |
| 2035 | | 171 064 | | | 273 | | | — | | | — | | | — | | | — | |
| 2036 | | 44 986 | | | 273 | | | — | | | — | | | — | | | — | |
| 2037 | | 126 489 | | | 273 | | | — | | | — | | | — | | | — | |
| 2038 | | 129 884 | | | 273 | | | — | | | — | | | — | | | — | |
| 2039 | | 74 402 | | | 273 | | | — | | | — | | | — | | | — | |
| 2040 | | 70 661 | | | 273 | | | | | | | | | | | | | |
| 2041 | | 66 921 | | | 273 | | | — | | | — | | | — | | | — | |
| 2042 | | 86 031 | | | 1,023 | | | — | | | — | | | — | | | — | |
| 2043 | | 80 188 | | | 226 | | | — | | | — | | | — | | | — | |
| 2044 | | 74 345 | | | 226 | | | — | | | — | | | — | | | — | |
| 2045 | | 24 154 | | | 226 | | | — | | | — | | | — | | | — | |
| 2046 | | 23 579 | | | 1,199 | | | — | | | — | | | — | | | — | |
| 2047 | | 156 514 | | | 172 | | | — | | | — | | | — | | | — | |
| 2048 | | 177 699 | | | 1,172 | | | — | | | — | | | — | | | — | |
| 2049 | | 192 485 | | | 1,580 | | | — | | | — | | | — | | | — | |
| 2050 | | 183 619 | | | 618 | | | — | | | — | | | — | | | — | |
| 2051 | | 213 991 | | | — | | | — | | | — | | | — | | | — | |
| 2052 | | 215 295 | | | — | | | — | | | — | | | — | | | — | |
| Total | | 4,398,583 | | | 32,440 | | | 1,626 | | | 71,954 | | | 26 | | | 3,103 | |
| | | | | | | | | | | | | | | | | | | |
| | | | | | | | | | | | | | | | | | | |
| Principal | | 2,339,770 | | | 19,121 | | | 1,383 | | | 60,517 | | | 24 | | | 2,773 | |
| Interest | | 2,058,813 | | | 13,319 | | | 243 | | | 11,437 | | | 2 | | | 330 | |
Note:
| (1) | Fiscal years ending March 31. |
Source: National Treasury.
Debt Record
South Africa has not defaulted in the payment of principal or interest on any of its internal or external indebtedness in the last twenty years.
Tables and Supplementary Information
Funded Internal Debt of the Republic of South Africa (Domestic Marketable Bonds – in Rand) as of September 30, 2018
Interest Rate | | Date of Issue | | Maturity Date | | Nominal Amount |
| | | | | | | |
| 8.00% | | August 13, 2004 | | December 21, 2018 | | 13,709,000,000,000 |
| Zero Coupon | | April 18, 1996 | | September 30, 2019 | | 129,498,544.21 |
| 7.25% | | June 20, 2005 | | January 15, 2020 | | 35,479,603,937.00 |
| 6.75% | | September 1, 2006 | | March 31, 2021 | | 53,374,709,007.00 |
| 2.75% | | June 17, 2010 | | January 31, 2022 | | 31,327,,000,000(1) |
| 7.75% | | June 22, 2012 | | February 28, 2023 | | 79,807,352,549 |
| 5.50% | | May 30, 2001 | | December 7, 2023 | | 33,407,517,477(1) |
| 2.00% | | July 4, 2012 | | January 31, 2025 | | 36,925,,000,000(1) |
| 10.50% | | May 22, 1998 | | December 21, 2025 | | 70,984,048,100.00 |
| 10.50% | | May 22, 1998 | | December 21, 2026 | | 70,984,048,101.89 |
| 10.50% | | May 22, 1998 | | December 21, 2027 | | 70,984,048,100.00 |
| 2.60% | | September 27, 2007 | | March 31, 2028 | | 29,497,817,562(1) |
| 1.875% | | July 16, 2016 | | March 31, 2029 | | 17,080,000,000(1) |
| 8.00% | | October 4, 2013 | | January 31, 2030 | | 119,740,024,973 |
| 7.00% | | May 28, 2010 | | February 28, 2031 | | 110,792,390,244 |
| 8.25% | | June 13, 2014 | | March 31, 2032 | | 95,599,801,181 |
| 3.45% | | August 15, 2003 | | December 7, 2033 | | 37,266,184,999(1) |
| 1.88% | | July 15, 2016 | | August 31, 2033 | | 23,655,000,000(1) |
| 8.88% | | July 17, 2015 | | February 28, 2035 | | 82,391,522,273 |
| 6.25% | | July 21, 2006 | | March 31, 2036 | | 99,382,552,145 |
| 8.50% | | July 19, 2013 | | January 31, 2037 | | 115,178,792,164 |
| 2.25% | | July 4, 2012 | | January 31, 2038 | | 35,535,000,000(1) |
| 9.00% | | September 11, 2015 | | January 31, 2040 | | 81,502,745,596 |
| 6.50% | | June 4, 2010 | | February 28, 2041 | | 92,232,856,496 |
| 8.75% | | July 18, 2014 | | January 31, 2043 | | 42,745,570,633 |
| 8.75% | | July 18, 2014 | | January 31, 2044 | | 42,745,570,633 |
| 8.75% | | July 18, 2014 | | January 31, 2045 | | 42,745,570,633 |
| 2.50% | | July 17, 2013 | | March 31, 2046 | | 36,170,000,000(1) |
| 8.75% | | June 29, 2012 | | February 28, 2047 | | 66,776,714,692.00 |
| 8.75% | | June 29, 2012 | | February 28, 2048 | | 66,776,714,690.00 |
| 8.75% | | June 29,2012 | | February 28, 2049 | | 66,776,714,692.00 |
| 2.50% | | July 11, 2012 | | December 31, 2049 | | 16,613,333,333.00(1) |
| 2.50% | | July 11, 2012 | | December 31, 2050 | | 16,613,333,334.00(1) |
| 2.50% | | July 11, 2012 | | December 31, 2051 | | 16,613,333,333.00(1) |
| 4.50% | | December 1, 1986 | | Perpetual | | 10,410 |
| 5.00% | | December 1, 1986 | | Perpetual | | 57,935 |
| Total Funded Internal Debt | | | | | | 1,851,543,437,766.60 |
Note:
| (1) | Inflation-linked bonds have been revalued using the relevant “reference CPI”. |
Source: National Treasury.
Floating Internal Debt of the Republic of South Africa (Treasury Bills – in Rand) As of September 30, 2018
| Interest Rate | | Date of Issue | | Maturity Date | | Principal Amount
(in Rand) |
| 0.00% | | Various Dates | | On Request | | 72,585,182 |
| 7.36% | | October 4, 2017 | | October 3, 2018 | | 2 500,000,000 |
| 7.40% | | October 11, 2017 | | October 10, 2018 | | 2,500,000,000 |
| 7.49% | | October 18, 2017 | | October 17, 2018 | | 2,500,000,000 |
| 7.74% | | October 25, 2017 | | October 24, 2018 | | 2,500,000,000 |
| 8.09% | | November 1, 2017 | | October 31, 2018 | | 2,500,000,000 |
| 8.13% | | November 8, 2017 | | November 7, 2018 | | 2,500,000,000 |
| 8.19% | | November 15, 2017 | | November 14, 2018 | | 2,500,000,000 |
| 8.13% | | November 22, 2017 | | November 21, 2018 | | 2,500,000,000 |
| 8.13% | | November 29, 2017 | | November 28, 2018 | | 3,281,000,000 |
| 8.24% | | December 6, 2017 | | December 5, 2018 | | 2,500,000,000 |
| 8.29% | | December 13, 2017 | | December 12, 2018 | | 3,350,000,000 |
| 8.25% | | December 20, 2017 | | December 19, 2018 | | 2,500,000,000 |
| 7.91% | | December 27, 2017 | | December 27, 2018 | | 3,000,000,000 |
| 7.78% | | January 3, 2018 | | January 2, 2019 | | 2,500,000,000 |
| 7.92% | | January 3, 2018 | | October 3, 2018 | | 2,500,000,000 |
| 7.71% | | January 10, 2018 | | January 9, 2019 | | 2,500,000,000 |
| 7.74% | | January 10, 2018 | | October 10, 2018 | | 3,700,000,000 |
| 7.68% | | January 17, 2018 | | January 16, 2019 | | 2,300,000,000 |
| 7.70% | | January 17, 2018 | | October 17, 2018 | | 2,100,000,000 |
| 7.66% | | January 24, 2018 | | January 23, 2019 | | 2,300,000,000 |
| 7.66% | | January 24, 2018 | | October 24, 2018 | | 2,100,000,000 |
| 7.62% | | January 31, 2018 | | January 30, 2019 | | 2,300,000,000 |
| 7.58% | | January 31, 2018 | | October 31, 2018 | | 2,100,000,000 |
| 7.61% | | February 7, 2018 | | February 6, 2019 | | 2,300,000,000 |
| 7.57% | | February 7, 2018 | | November 7, 2018 | | 2,100,000,000 |
| 7.58% | | February 14, 2018 | | February 13, 2019 | | 2,300,000,000 |
| 7.57% | | February 14, 2018 | | November 14, 2018 | | 2,100,000,000 |
| 7.43% | | February 21, 2018 | | February 20, 2019 | | 2,300,000,000 |
| 7.46% | February 21, 2018 | November 221 2018 | 2,100,000,000 |
| 7.27% | February 28, 2018 | February 27, 2019 | 2,300,000,000 |
| 7.30% | February 28, 2018 | November 28, 2018 | 2,100,000,000 |
| 7.31% | March 7, 2018 | March 6, 2019 | 2,300,000,000 |
| 7.33% | March 7, 2018 | December 5, 2018 | 2,100,000,000 |
| 7.30% | March 14, 2018 | March 13, 2019 | 2,300,000,000 |
| 7.34% | March 14, 2018 | December 12, 2018 | 2,100,000,000 |
| 7.36% | March 22, 2018 | March 20, 2019 | 1,780,000,000 |
| 7.40% | March 22, 2018 | December 19, 2018 | 2,100,000,000 |
| 7.31% | March 28, 2018 | March 27, 2019 | 2,300,000,000 |
| 7.32% | March 28, 2018 | December 27, 2018 | 2,100,000,000 |
| 7.26% | April 4, 2018 | April 3, 2019 | 2,410,000,000 |
| 7.23% | April 4, 2018 | January 2, 2019 | 2,270,000,000 |
| 7.21% | April 4, 2018 | October 3, 2018 | 2,200,000,000 |
| 7.28% | April 11, 2018 | April 10, 2019 | 2,410,000,000 |
| 7.29% | April 11, 2018 | January 9, 2019 | 2,270,000,000 |
| 7.27% | April 11, 2018 | October 10, 2018 | 2,200,000,000 |
| 7.38% | April 18, 2018 | April 17, 2019 | 2,310,000,000 |
| 7.39% | April 18, 2018 | January 16, 2019 | 1,844,000,000 |
| 7.31% | April 18, 2018 | October 17, 2018 | 2,800,000,000 |
| 7.32% | April 25, 2018 | April 24, 2019 | 2,410,000,000 |
| 7.31% | April 25, 2018 | January 23, 2019 | 2,270,000,000 |
| 7.26% | April 25, 2018 | October 24, 2018 | 2,200,000,000 |
| 7.42% | May 2, 2018 | May 2, 2019 | 1,440,000,000 |
| 7.41% | May 2, 2018 | January 30, 2019 | 1,845,000,000 |
| 7.23% | May 2, 2018 | October 31, 2018 | 2,200,000,000 |
| 7.46% | May 9, 2018 | May 8, 2019 | 2,410,000,000 |
| 7.41% | May 9, 2018 | February 6, 2019 | 2,270,000,000 |
| 7.33% | May 9, 2018 | November 7, 2018 | 775,000,000 |
| 7.42% | May 16, 2018 | May 15, 2019 | 2,410,000,000 |
| 7.43% | May 16, 2018 | February 13, 2019 | 2,270,000,000 |
| 7.33% | May 16, 2018 | November 14, 2018 | 2,200,000,000 |
| 7.47% | May 23, 2018 | May 22, 2019 | 2,410,000,000 |
| 7.47% | May 23, 2018 | February 20, 2019 | 2,270,000,000 |
| 7.36% | May 23, 2018 | November 21, 2018 | 2,200,000,000 |
| 7.48% | May 30, 2018 | May 29, 2019 | 2410,000,000 |
| 7.47% | May 30, 2018 | February 27, 2019 | 2,270,000,000 |
| 7.37% | May 30, 2018 | November 28, 2018 | 2,200,000,000 |
| 7.54% | June 6, 2018 | June 5, 2019 | 2,410,000,000 |
| 7.53% | June 6, 2018 | March 6, 2019 | 2,270,000,000 |
| 7.38% | June 6, 2018 | December 5, 2018 | 2,200,000,000 |
| 7.72% | June 13, 2018 | June 12, 2019 | 1,780,000,000 |
| 7.50% | June 13, 2018 | March 13, 2019 | 2,097,500,000 |
| 7.40% | June 13, 2018 | December 12, 2018 | 2,200,000,000 |
| 7.75% | June 20, 2018 | June 19, 2019 | 2,410,000,000 |
| 7.67% | June 20, 2018 | March 20, 2019 | 2,270,000,000 |
| 7.38% | June 20, 2018 | December 19, 2018 | 2,200,000,000 |
| 7.76% | June 27, 2018 | June 26, 2019 | 2,410,000,000 |
| 7.71% | June 27, 2018 | March 27, 2019 | 2,270,000,000 |
| 7.40% | June 27, 2018 | December 27, 2018 | 2,200,000,000 |
| 7.82% | July 4, 2018 | July 3, 2019 | 2,410,000,000 |
| 7.73% | July 4, 2018 | April 3, 2019 | 2,270,000000 |
| 7.40% | July 4, 2018 | January 2, 2019 | 1,895,000,000 |
| 7.20% | July 4, 2018 | October 3, 2018 | 2,105,000,000 |
| 7.83% | July 11, 2018 | July 10, 2019 | 2,410,000,000 |
| 7.72% | July 11, 2018 | April 10, 2019 | 2,270,000,000 |
| 7.48% | July 11, 2018 | January 9, 2019 | 2,200,000,000 |
| 7.19% | July 11, 2018 | October 10, 2018 | 1,800,000,000 |
| 7.88% | July 18, 2018 | July 17, 2019 | 2,410,000,000 |
| 7.72% | July 18, 2018 | April 17, 2019 | 2,270,000,000 |
| 7.50% | July 18, 2018 | January 16, 2019 | 2,200,000,000 |
| 7.19% | July 18, 2018 | October 17, 2018 | 1,800,000,000 |
| 7.86% | July 25, 2018 | July 24, 2019 | 2,410,000,000 |
| 7.76% | July 25, 2018 | April 24, 2019 | 2,270,000,000 |
| 7.55% | July 25, 2018 | January 23, 2019 | 2,200,000,000 |
| 7.18% | July 25, 2018 | October 24, 2018 | 1,800,000,000 |
| 7.85% | August 1, 2018 | August 1, 2019 | 2,410,000,000 |
| 7.75% | August 1, 2018 | May 2, 2019 | 2,270,000,000 |
| 7.54% | August 1, 2018 | January 30, 2019 | 2,200,000,000 |
| 7.21% | August 1, 2018 | October 31, 2018 | 1,800,000,000 |
| 7.86% | August 8, 2018 | August 8, 2019 | 2,410,000,000 |
| 7.75% | August 8, 2018 | May 8, 2019 | 2,270,000,000 |
| 7.56% | August 8, 2018 | February 6, 2019 | 2,200,000,000 |
| 7.20% | August 8, 2018 | November 7, 2018 | 1,800,000,000 |
| 7.92% | August 15, 2018 | August 15, 2019 | 2,410,000,000 |
| 7.79% | August 15, 2018 | May 15, 2019 | 2,270,000,000 |
| 7.58% | August 15, 2018 | February 13, 2019 | 2,200,000,000 |
| 7.23% | August 15, 2018 | November 14, 2018 | 1,800,000,000 |
| 7.93% | August 22, 2018 | August 22, 2019 | 2,410,000,000 |
| 7.93% | August 22, 2018 | May 22, 2019 | 2,270,000,000 |
| 7.66% | August 22, 2018 | February 20, 2019 | 2,746,400,000 |
| 7.30% | August 22, 2018 | November 21, 2018 | 1,253,600,000 |
| 7.95% | August 29, 2018 | August 29, 2019 | 2,410,000,000 |
| 7.89% | August 29, 2018 | May 29, 2019 | 2,270,000,000 |
| 7.67% | August 29, 2018 | February 27, 2019 | 2,200,000,000 |
| 7.28% | August 29, 2018 | November 28, 2018 | 1,800,000,000 |
| 8.02% | September 5, 2018 | September 5, 2019 | 2,410,000,000 |
| 7.92% | September 5, 2018 | June 5, 2019 | 2,270,000,000 |
| 7.70% | September 5, 2018 | March 6, 2019 | 2,200,000,000 |
| 7.29% | September 5, 2018 | December 5, 2018 | 1,800,000,000 |
| 8.04% | September 12, 2018 | September 12, 2019 | 2,410,000,000 |
| 7.95% | September 12, 2018 | June 12, 2019 | 2,270,000,000 |
| 7.70% | September 12, 2018 | March 13, 2019 | 2,200,000,000 |
| 7.29% | September 12, 2018 | December 12, 2018 | 1,800,000,000 |
| 8.03% | September 19, 2018 | September 19, 2019 | 2,735,000,000 |
| 7.95% | September 19, 2018 | June 19, 2019 | 2,595,000,000 |
| 7.71% | September 19, 2018 | March 20, 2019 | 2,525,000,000 |
| 7.27% | September 19, 2018 | December 19, 2018 | 2,800,000,000 |
| 8.01% | September 26, 2018 | September 26, 2019 | 2,735,000,000 |
| 7.88% | September 26, 2018 | June 26, 2019 | 2,595,000,000 |
| 7.94% | September 26, 2018 | March 27, 2019 | 2,525,000,000 |
| 7.25% | September 26, 2018 | December 27, 2018 | 2,800,000,000 |
| | | | |
| | | Total Floating Internal Debt | 296,465,085,182 |
Note:
| (1) | Excludes borrowing from the Corporation for Public Deposits to the amount of R58,075,323,689.06. |
Source: National Treasury.
Funded External Debt of the Republic of South Africa as of March 31, 2017/November 30, 2018
Interest Rate | Date of Issue | Maturity Date | | Nominal Amount |
| Capital market loans | | | | |
| 6.30% | May 15, 2018 | May 15, 2048 | $ | 600,000,000 |
| 2.50% | February 2, 1998 | May 20, 2021 | ¥ | 282,240,000 |
| 3.80% | June 1, 2000 | June 1, 2020 | ¥ | 30,000,000,000 |
| 3.80% | June 12, 2001 | September 7, 2021 | ¥ | 30,000,000,000 |
| 4.875% | April 14, 2016 | April 14, 2026 | $ | 1 250,000,000 |
| 5.875% | May 30, 2007 | May 30, 2022 | $ | 1,000,000,000 |
| 6.875% | May 27, 2009 | May 27, 2019 | $ | 1,248,000,000 |
| 6.875% | September 4, 2009 | May 27, 2019 | $ | 500,000,000 |
| 5.50% | March 5, 2010 | September 3, 2020 | $ | 1,619,112,000 |
| 6.25% | March 8, 2011 | March 8, 2041 | $ | 750,000,000 |
| 4.665% | January 17, 2012 | January 17, 2024 | $ | 1,500,000,000 |
| 5.875% | September 16, 2013 | September 16, 2025 | $ | 2,000,000,000 |
| 5.375% | July 24, 2014 | July 24, 2044 | $ | 1,000,000,000 |
| 3.750% | July 24, 2014 | July 24, 2026 | € | 500,000,000 |
| 5.0% | October 12, 2016 | October 12, 2046 | $ | 1,000,000,000 |
| 4.30% | October 12, 2016 | October 12,2028 | $ | 2,000,000,000 |
| 3.903% | September 24, 2014 | June 24, 2020 | $ | 500,000,000 |
| 4.850% | September 27, 2017 | September 27, 2027 | $ | 1000,000,000 |
| 5.650% | September 27, 2017 | September 27, 2047 | $ | 1,500,000,000 |
| 5.875% | May 15, 2018 | May 15, 2030 | $ | 1,400,000,000 |
| | | | | |
7.14% CIRR Fixed | April 17, 2000 - March 5, 2001 | April 15, 2006 - October 15, 2018 | $ | 310,005.50 |
| 4.77% Commercial Fixed | April 15, 2001 | April 15, 2009 - October 15, 2018 | € | 570,015.80 |
| 5.15% Commercial Fixed | April 15, 2002 - May 21, 2003 | April 15, 2009 - October 15, 2018 | $ | 1,403,596.16 |
| 5.63% MC CIRR | April 15, 2004 - July 17, 2006 | April 15, 2009 - October 15, 2018 | € | 1,798,465.29 |
| 6.545% Sec-CIRR | July 21, 2004 - July 22, 2005 | April 15, 2009 - October 15, 2018 | £ | 934,320.30 |
| 5.50% Commercial Fixed | July 21, 2004 | April 15, 2009 - October 15, 2018 | € | 1,357,999.85 |
| 4.72% Commercial Fixed | April 18, 2006 | April 15, 2009 - October 15, 2018 | € | 2,291.16 |
| 4.23% Commercial Fixed | December 15, 2008 | April 15, 2009 - October 15, 2018 | £ | 8,271.47 |
| 4.28% Commercial Fixed | December 4, 2008 | April 15, 2009 - October 15, 2018 | £ | 839,129.50 |
| 4.61% Commercial Fixed | July 31, 2008 - April 15, 2010 | April 15, 2009 - October 15, 2018 | £ | 498,232.36 |
| 4.90% Commercial Fixed | December 15, 2009 | April 15, 2010 - October 15, 2018 | £ | 156,276.62 |
| 4.92% Commercial Fixed | April 6, 2010 | April 15, 2011 - April 15, 2020 | £ | 555,619.56 |
| 5.10% Commercial Fixed | December 15, 2009 - October 15, 2010 | April 15, 2011 - April 15, 2020 | £ | 938,061.68 |
| 5.25% Commercial Fixed | March 23, 2011 | October 15, 2011 - April 15, 2020 | £ | 831,188.33 |
| 6.77% MC CIRR | July 22, 2005 | April 15, 2009 - October 15, 2018 | £ | 5,734.59 |
| 5.79% Commercial Fixed | July 15, 2002 - April 15, 2004 | April 15, 2009 - October 15, 2018 | $ | 185,049.82 |
| 5.97% Commercial Fixed | October 16, 2006 | April 15, 2009 - October 15, 2018 | $ | 80,300.36 |
| 5.55% Commercial Fixed | October 15, 2003 - April 15, 2004 | April 15, 2009 - October 15, 2018 | $ | 1,837,157.28 |
Interest Rate | Date of Issue | Maturity Date | | Nominal Amount |
| 5.315% Commercial Fixed | April 15, 2009 | April 15, 2011 - April 15, 2020 | $ | 36,713.38 |
| 5.39% Commercial Fixed | December 15, 2009 | April 15, 2010 - October 15, 2018 | $ | 9,432.99 |
| 5.40% Commercial Fixed | June 22, 2007 - August 19, 2009 | April 15, 2009 - October 15, 2018 | $ | 529,644,00 |
| 5.16% Commercial Fixed | June 6, 2008 - August 19, 2009 | April 15, 2009 - October 15, 2018 | $ | 812,578.64 |
| 5.61% Commercial Fixed | December 15, 2009 | April 15, 2010 - October 15, 2018 | $ | 6,148.44 |
| 5.49% Commercial Fixed | April 17, 2001 - July 15, 2003 | April 15, 2009 - October 15, 2018 | SEK | 21,863,050.48 |
| 3.90% Commercial Fixed | April 15, 2005 - July 22, 2005 | April 15, 2011 - April 15, 2020 | SEK | 35,196,163.67 |
| 4.30% Commercial Fixed | October 17, 2005 - January 17, 2006 | April 15, 2011 - April 15, 2020 | SEK | 83,684,084.10 |
| 3.81% Commercial Fixed | October 26, 2004 - July 22, 2005 | April 15, 2009 - October 15, 2018 | SEK | 26,328,363.35 |
| 4.24% Commercial Fixed | October 17, 2005 - January 16, 2006 | April 15, 2009 - October 15, 2018 | SEK | 8,986,613.06 |
| 4.57% Commercial Fixed | April 18, 2006 - October 16, 2006 | April 15, 2009 - October 15, 2018 | SEK | 10,863,889.67 |
| 5.03% Commercial Fixed | January 15, 2007 - April 16, 2007 | April 15, 2009 - October 15, 2018 | SEK | 2,860,440.01 |
| 4.60% Commercial Fixed | April 18, 2006 - October 16, 2006 | April 15, 2011 - April 15, 2020 | SEK | 252,405,610.79 |
| 5.05% Commercial Fixed | January 16, 2007 | April 15, 2011 - April 15, 2020 | SEK | 58,203,583.63 |
| 5.60% Commercial Fixed | June 25, 2007 | April 15, 2011 - April 15, 2020 | SEK | 115,566,105.66 |
| 4.52% Commercial Fixed | July 21, 2004 - October 17, 2005 | April 15, 2009 - October 15, 2018 | € | 19,807.85 |
| 4.57% Commercial Fixed | April 15, 2005 - January 17, 2006 | April 15, 2011 - April 15, 2020 | € | 6,503,659.52 |
| 4.76% Commercial Fixed | April 18, 2006 - July 17, 2006 | April 15, 2011 - April 15, 2020 | € | 10,442,988.80 |
| 5.16% Commercial Fixed | October 15, 2006 - April 16, 2007 | April 15, 2009 - October 15, 2018 | € | 481,989.50 |
| 5.175% Commercial Fixed | January 15, 2007 | April 15, 2011 - April 15, 2020 | € | 3,250,381.08 |
| 6.28% Commercial Fixed | October 16, 2006 - January 15, 2007 | April 15, 2009 - October 15, 2018 | £ | 1,125.28 |
| 6.42% Commercial Fixed | December 15, 2008 | April 15, 2011 - April 15, 2020 | $ | 2,885,310.94 |
| 6.61% Commercial Fixed | July 15, 2002 - April 15, 2004 | April 15, 2009 - October 15, 2018 | $ | 841,526.63 |
| 6.65% Commercial Fixed | June 22, 2007 | October 15, 2010 - April 15, 2020 | $ | 11,710,221.53 |
| 5.89% Commercial Fixed | October 23, 2009 - April 15, 2010 | April 15, 2010 - October 15, 2018 | $ | 425,062.02 |
| 5.98% Commercial Fixed | October 16, 2006 | October 15, 2010 - April 15, 2020 | $ | 5,524,426. |
| 5.515% Commercial Fixed | July 24, 2007 | April 15, 2009 - October 15, 2018 | € | 264,403.58 |
| 4.93% Commercial Fixed | April 16, 2007 | April 15, 2009 - October 15, 2018 | € | 96,920.72 |
| 5.29% Commercial Fixed | June 25, 2007 - July 24, 2007 | April 15, 2009 - October 15, 2018 | SEK | 3,580,533.42 |
| 5.09% Commercial Fixed | April 15, 2009 | April 15, 2011 - April 15, 2020 | $ | 56,326.10 |
| 5.51% Commercial Fixed | December 15, 2009 | April 15, 2011 - April 15, 2020 | $ | 67,160.64 |
| 5.70% Commercial Fixed | December 15, 2009 - April 15, 2010 | April 15, 2010 - October 15, 2018 | $ | 613,700.38 |
| 5.70% Commercial Fixed | September 15, 2009 | April 15, 2011 - April 15, 2020 | $ | 43,775.36 |
| 6.50% Commercial Fixed | April 16, 2007 | April 15, 2009 - October 15, 2018 | £ | 1,682.51 |
| 5.35% Commercial Fixed | October 17, 2011 | April 15, 2012 - April 15, 2020 | £ | 1,065,727.96 |
| 5.18% Commercial Fixed | May 15, 2007 - October 15, 2007 | April 15, 2011 - April 15, 2020 | € | 2,957,919.06 |
| 6.66% Commercial Fixed | October 15, 2007 | April 15, 2011 - April 15, 2020 | $ | 4,085,152.65 |
| 6.75% Commercial Fixed | July 31, 2008 | April 15, 2011 - April 15, 2020 | $ | 8,937,234.14 |
| 6.50% Commercial Fixed | September 16, 2008 | April 15, 2011 - April 15, 2020 | $ | 5,819,166.44 |
| 7.89% Commercial Fixed | December 15, 2009 | April 15, 2011 - April 15, 2020 | $ | 2,042,576.75 |
| 5.34% Commercial Fixed | May 15, 2007 - October 15, 2007 | April 15, 2011 - April 15, 2020 | SEK | 44,650,820.86 |
| 5.64% Commercial Fixed | October 15, 2007 | April 15, 2011 - April 15, 2020 | SEK | 41,670,139.55 |
| 6.06% Commercial Fixed | July 31, 2008 | April 15, 2011 - April 15, 2020 | SEK | 85,826,425.44 |
| 5.79% Commercial Fixed | September 16, 2008 | April 15, 2011 - April 15, 2020 | SEK | 73,751,313.85 |
| 5.45% Commercial Fixed | December 15, 2008 | April 15, 2011 - April 15, 2020 | SEK | 31,041,897.39 |
| 5.50% Commercial Fixed | July 31, 2008 - August 18, 2009 | April 15, 2009 - October 15, 2018 | SEK | 26,972,921.48 |
| 5.60% Commercial Fixed | December 15, 2009 | April 15, 2010 - October 15, 2018 | SEK | 00.00 |
| 5.62% Commercial Fixed | December 15, 2009 | April 15, 2011 - April 15, 2020 | SEK | 1,396,236.20 |
| 5.335% Commercial Fixed | April 15, 2009 | April 15, 2011 - April 15, 2020 | SEK | 1,133,374.20 |
| 5.425% Commercial Fixed | October 23, 2009 - April 15, 2010 | April 15, 2011 - April 15, 2020 | SEK | 11,869,625.12 |
| 5.80% Commercial Fixed | October 23, 2009 - April 15, 2010 | April 15, 2010 - October 15, 2018 | SEK | 14,724,300.10 |
| 6.30% Commercial Fixed | December 15, 2009 | April 15, 2011 - April 15, 2020 | SEK | 20,801,359.91 |
| 5.475% Commercial Fixed | May 20, 2010 - October 15, 2010 | April 15, 2011 - April 15, 2020 | SEK | 15,977,301.87 |
| 5.525% Commercial Fixed | December 13,2010 - April 16, 2012 | October 15, 2011 - April 15, 2020 | SEK | 18,348,639.14 |
| 5.565% Commercial Fixed | October 17, 2011 | April 15, 2012 - April 15, 2020 | SEK | 23,608,344.12 |
| 5.595% Commercial Fixed | December 7, 2011 - March 20, 2012 | April 15, 2011 - April 15, 2020 | SEK | 12,402,808.15 |
| 5.575% Commercial Fixed | December 13, 2010 - April 16, 2012 | October 15, 2011 - April 15, 2020 | $ | 882,591.67 |
| 5.355% Commercial Fixed | April 6, 2010 | April 15, 2011 - April 15, 2020 | $ | 570,943.28 |
| 5.47% Commercial Fixed | March 8, 2010 - October 15, 2010 | April 15, 2011 - April 15, 2020 | $ | 768,527.45 |
| 5.58% Commercial Fixed | April 6, 2010 | April 15, 2011 - April 15, 2020 | $ | 372,141.13 |
| 5.695% Commercial Fixed | March 8, 2010 - October 15, 2010 | April 15, 2011 - April 15, 2020 | $ | 500,926.56 |
| 5.80% Commercial Fixed | December 13, 2010 - April 16, 2012 | October 15, 2011 - April 15, 2020 | $ | 575,273.66 |
| 5.905% Commercial Fixed | October 17, 2011 | April 15, 2012 - April 15, 2020 | $ | 740,177.93 |
| 5.68% Commercial Fixed | October 17, 2011 | April 15, 2012 - April 15, 2020 | $ | 1,135,589.79 |
| 5.775% Commercial Fixed | December 7, 2011 - March 20, 2012 | April 15, 2011 - April 15, 2020 | $ | 596,590.06 |
| 6.00% Commercial Fixed | December 7, 2011 - March 20, 2012 | April 15, 2011 - April 15, 2020 | $ | 388,872.87 |
Interest Rate | Date of Issue | Maturity Date | | Nominal Amount |
| 5.43% Commercial Fixed | December 7, 2011 - March 20, 2012 | April 15, 2011 - April 15, 2020 | £ | 876,635.46 |
| 1.750% Commercial Fixed | April 15, 2009 - September 11, 2012 | April 15, 2011 - April 15, 2020 | $ | 578,784.59 |
| 1.158% Commercial Fixed | April 16, 2012 | October 15, 2012 - October 15, 2018 | € | 12,705.01 |
| 1.671% Commercial Fixed | May 8, 2012 - September 11, 2012 | October 15, 2012 - April 15, 2020 | £ | 348,042.69 |
| 1.525% Commercial Fixed | May 8, 2012 - September 11, 2012 | April 15, 2011 - April 15, 2020 | $ | 700,746.69 |
| 2.162% Commercial Fixed | October 23, 2009 | April 15, 2010 - October 15, 2018 | SEK | 165,072.22 |
| 2.287% Commercial Fixed | May 8, 2012 - September 11, 2012 | October 15, 2012 - April 15, 2020 | SEK | 10,242,342.71 |
Note:
Commercial Interest Reference Rate (CIRR). The CIRR is determined monthly by the OECD and published on the 14th day of each month. Each CIRR is fixed based on the previous 30-day treasury rate of each currency.
Source: National Treasury.
Total External Debt by Currency as of September 30, 2018
| Euro | € 527,759,546.78 |
| Pound Sterling | £ 7,060,048.12 |
| Swedish Krone | SEK 1,039,113,047.31 |
| U.S. Dollars | $ 18,923,185,432.49 |
| Yen | ¥ 60,282,240,000.00 |