UNITED STATES
SECURITIES AND EXCHANGE COMMISSION
Washington, D.C. 20549
FORM N-CSR
CERTIFIED SHAREHOLDER REPORT
OF
REGISTERED MANAGEMENT INVESTMENT COMPANIES
Investment Company Act file number: 811-07239
Name of Registrant: | | Vanguard Horizon Funds |
Address of Registrant: | | P.O. Box 2600 |
| | Valley Forge, PA 19482 |
| | |
Name and address of agent for service: | | Anne E. Robinson, Esquire |
| | P.O. Box 876 |
| | Valley Forge, PA 19482 |
Registrant’s telephone number, including area code: (610) 669-1000
Date of fiscal year end: September 30
Date of reporting period: October 1, 2018—September 30, 2019
Item 1: Reports to Shareholders

Annual Report | September 30, 2019 Vanguard Strategic Equity Fund |
See the inside front cover for important information about access to your fund’s annual and semiannual shareholder reports. |
Important information about access to shareholder reports
Beginning on January 1, 2021, as permitted by regulations adopted by the Securities and Exchange Commission, paper copies of your fund’s annual and semiannual shareholder reports will no longer be sent to you by mail, unless you specifically request them. Instead, you will be notified by mail each time a report is posted on the website and will be provided with a link to access the report.
If you have already elected to receive shareholder reports electronically, you will not be affected by this change and do not need to take any action. You may elect to receive shareholder reports and other communications from the fund electronically by contacting your financial intermediary (such as a broker-dealer or bank) or, if you invest directly with the fund, by calling Vanguard at one of the phone numbers on the back cover of this report or by logging on to vanguard.com.
You may elect to receive paper copies of all future shareholder reports free of charge. If you invest through a financial intermediary, you can contact the intermediary to request that you continue to receive paper copies. If you invest directly with the fund, you can call Vanguard at one of the phone numbers on the back cover of this report or log on to vanguard.com. Your election to receive paper copies will apply to all the funds you hold through an intermediary or directly with Vanguard.
Contents | |
| |
A Note From Our Chairman | 1 |
Your Fund’s Performance at a Glance | 2 |
Advisor’s Report | 3 |
About Your Fund’s Expenses | 5 |
Performance Summary | 7 |
Financial Statements | 9 |
Please note: The opinions expressed in this report are just that—informed opinions. They should not be considered promises or advice. Also, please keep in mind that the information and opinions cover the period through the date on the front of this report. Of course, the risks of investing in your fund are spelled out in the prospectus.
A Note From Our Chairman

Tim Buckley
Chairman and Chief Executive Officer
Dear Shareholder,
Recent volatility in financial markets—affecting stocks, bonds, and commodities—has been a good reminder of the wise old adage, “Never keep all your eggs in one basket.” Maintaining balance and diversification in your investment portfolio can help to both limit risk and set you up for long-term success.
It’s understandable why some investors might become complacent after a long market run-up like the one that lifted stock prices, especially U.S. stock prices, in the years following the global financial crisis. But failing to rebalance regularly can leave a portfolio with a much different mix of assets than intended and, often, more risk than intended.
Balance across and diversification within asset classes are powerful tools for managing risk and achieving your investment goals. A portfolio’s allocation will determine a large portion of its long-term return and also the majority of its volatility risk. A well-diversified portfolio is less vulnerable to significant swings in the performance of any one segment of the asset classes in which it invests.
Balance and diversification will never eliminate the risk of loss, nor will they guarantee positive returns in a declining market. But they should reduce the chance that you’ll suffer disproportionate losses in one particular high-flying asset class or sector when it comes back to earth. And exposure to all key market components should give you at least some participation in the sectors that are performing best at any given time.
Vanguard is committed to helping you achieve balance and diversification in your portfolios to help meet your investment goals. We thank you for your continued loyalty.
Sincerely,

Mortimer J. Buckley
Chairman and Chief Executive Officer
October 14, 2019
1
Your Fund’s Performance at a Glance
· Vanguard Strategic Equity Fund returned –5.63% for the 12 months ended September 30, 2019. It lagged its benchmark, the MSCI US Small + Mid Cap 2200 Index, which returned –1.09%.
· The broad U.S. stock market as measured by the Russell 3000 Index returned nearly 3% during the period. Stocks endured stretches of volatility at the end of 2018 and during the spring of 2019. But their performance was boosted by the accommodative stance of the Federal Reserve, which cut interest rates in August and September in response to a softening economy.
· The utilities, real estate, and information technology sectors helped the fund’s relative performance. Industrials, energy, and consumer discretionary detracted the most.
· Over the ten years ended September 30, 2019, the fund’s average annual return of more than 13% was slightly above that of its benchmark index.
Market Barometer
| | Average Annual Total Returns | |
| | Periods Ended September 30, 2019 | |
| | One Year | | Three Years | | Five Years | |
Stocks | | | | | | | |
Russell 1000 Index (Large-caps) | | 3.87% | | 13.19% | | 10.62% | |
Russell 2000 Index (Small-caps) | | -8.89 | | 8.23 | | 8.19 | |
Russell 3000 Index (Broad U.S. market) | | 2.92 | | 12.83 | | 10.44 | |
FTSE All-World ex US Index (International) | | -1.12 | | 6.46 | | 3.24 | |
| | | | | | | |
Bonds | | | | | | | |
Bloomberg Barclays U.S. Aggregate Bond Index (Broad taxable market) | | 10.30% | | 2.92% | | 3.38% | |
Bloomberg Barclays Municipal Bond Index (Broad tax-exempt market) | | 8.55 | | 3.19 | | 3.66 | |
FTSE Three-Month U.S. Treasury Bill Index | | 2.36 | | 1.52 | | 0.95 | |
| | | | | | | |
CPI | | | | | | | |
Consumer Price Index | | 1.71% | | 2.07% | | 1.53% | |
2
Advisor’s Report
For the 12 months ended September 30, 2019, Vanguard Strategic Equity Fund returned –5.63%. It lagged its benchmark, the MSCI US Small + Mid Cap 2200 Index, which returned –1.09%.
Investment objective and strategy
Our approach to investing focuses on fundamentals—not technical analysis of stock price movements. We compare mid- and small-capitalization U.S. stocks within the same industry group to identify those with characteristics that we believe will outperform over the long run.
To do this, we use a strict quantitative approach to evaluate a stock’s attractiveness based on five characteristics: high quality—healthy balance sheets and steady cash-flow generation; management decisions—sound investment policies that favor internal over external funding; consistent earnings growth—the ability to grow earnings year after year; strong market sentiment—market confirmation of our view; and reasonable valuation—we strive to avoid overpriced stocks.
Using these five themes, we generate a daily composite stock ranking as we seek to capitalize on market inefficiencies. We then monitor our portfolio based on those rankings and adjust when appropriate to maximize expected returns while minimizing exposure to risks that our research indicates don’t improve returns (such as industry selection and other risks relative to our benchmark).
Investment environment
Although the broad-market Russell 3000 Index of U.S. stocks advanced nearly 3%, the recent macroeconomic environment—characterized by high economic and policy uncertainty, low GDP growth, and low interest rates—contributed to some extraordinary trends in the equity markets. These trends are not unusual at the late stage of a business cycle and include the following:
· Value underperformance. The markets have experienced the longest stretch of value underperformance since the dot-com bubble burst in 2000. Investors have flocked to high-growth-potential companies, hoping for higher expected returns without necessarily looking at the underlying earnings. Those companies then trade at inflated valuations that are increasingly diverging from those of value companies.
· Trading on sentiment. The equity market has been trading mostly on sentiment. Investors have reacted to macroeconomic shocks such as tariffs and Federal Reserve rate announcements while largely ignoring fundamentals (such as quality and growth) since May 2018.
· Junk rally. A big junk rally during which stocks with high valuations and low-quality earnings have outperformed began in January 2019. It has been a risk-on and fundamental-off market, with investors giving up safety for returns.
3
Although markets such as the current one can be challenging, it is crucial to maintain a long-term focus. These conditions are not unusual at the late stage of a business cycle; investors should expect to see them at least once.
Just like any other form of active equity strategy, ours is designed to deliver long-term outperformance. Often, quantitatively driven funds are some of the first to bounce back after a drop in the markets. They can weather unpredictability through expert portfolio managers, analysts, and traders who stay focused on historical trends and perform regular, in-depth data analysis.
Our successes and shortfalls
Against the fiscal year’s unusual backdrop, the fund lagged across the board as all five of our decision models did not perform as expected. Seven of its 11 industry sectors detracted on a relative basis. Utilities, real estate, and information technology did best; industrials, energy, and consumer discretionary were the biggest detractors.
The portfolio benefited from FirstEnergy and Entergy in utilities, Extra Space Storage and Spirit Realty Capital in real estate, and Cadence Design Systems in information technology. The greatest shortfalls came from Denbury Resources and California Resources in energy, The Greenbrier Companies and AeroVironment in industrials, and Tailored Brands in consumer discretionary.
We continue to believe that constructing a portfolio focused on fundamentals will benefit investors over the long term, although we recognize that the market can reward or punish us in the near term. We feel the fund offers a strong mix of stocks with attractive valuations and growth characteristics.
We thank you for your investment and look forward to the coming fiscal year.
Portfolio Managers:
James P. Stetler
Binbin Guo, Principal, Head of Alpha Equity Investments
Vanguard Quantitative Equity Group
October 15, 2019
4
About Your Fund’s Expenses
As a shareholder of the fund, you incur ongoing costs, which include costs for portfolio management, administrative services, and shareholder reports (like this one), among others. Operating expenses, which are deducted from a fund’s gross income, directly reduce the investment return of the fund.
A fund’s expenses are expressed as a percentage of its average net assets. This figure is known as the expense ratio. The following examples are intended to help you understand the ongoing costs (in dollars) of investing in your fund and to compare these costs with those of other mutual funds. The examples are based on an investment of $1,000 made at the beginning of the period shown and held for the entire period.
The accompanying table illustrates your fund’s costs in two ways:
· Based on actual fund return. This section helps you to estimate the actual expenses that you paid over the period. The “Ending Account Value” shown is derived from the fund’s actual return, and the third column shows the dollar amount that would have been paid by an investor who started with $1,000 in the fund. You may use the information here, together with the amount you invested, to estimate the expenses that you paid over the period.
To do so, simply divide your account value by $1,000 (for example, an $8,600 account value divided by $1,000 = 8.6), then multiply the result by the number given for your fund under the heading “Expenses Paid During Period.”
· Based on hypothetical 5% yearly return. This section is intended to help you compare your fund’s costs with those of other mutual funds. It assumes that the fund had a yearly return of 5% before expenses, but that the expense ratio is unchanged. In this case—because the return used is not the fund’s actual return—the results do not apply to your investment. The example is useful in making comparisons because the Securities and Exchange Commission requires all mutual funds to calculate expenses based on a 5% return. You can assess your fund’s costs by comparing this hypothetical example with the hypothetical examples that appear in shareholder reports of other funds.
Note that the expenses shown in the table are meant to highlight and help you compare ongoing costs only and do not reflect transaction costs incurred by the fund for buying and selling securities. Further, the expenses do not include any purchase, redemption, or account service fees described in the fund prospectus. If such fees were applied to your account, your costs would be higher. Your fund does not carry a “sales load.”
The calculations assume no shares were bought or sold during the period. Your actual costs may have been higher or lower, depending on the amount of your investment and the timing of any purchases or redemptions.
You can find more information about the fund’s expenses, including annual expense ratios, in the Financial Statements section of this report. For additional information on operating expenses and other shareholder costs, please refer to your fund’s current prospectus.
5
Six Months Ended September 30, 2019 | | | |
| Beginning | Ending | Expenses |
| Account Value | Account Value | Paid During |
Strategic Equity Fund | 3/31/2019 | 9/30/2019 | Period |
Based on Actual Fund Return | $1,000.00 | $1,013.68 | $0.86 |
Based on Hypothetical 5% Yearly Return | 1,000.00 | 1,024.22 | 0.86 |
The calculations are based on expenses incurred in the most recent six-month period. The fund’s annualized six-month expense ratio for that period is 0.17%. The dollar amounts shown as “Expenses Paid” are equal to the annualized expense ratio multiplied by the average account value over the period, multiplied by the number of days in the most recent six-month period, then divided by the number of days in the most recent 12-month period (183/365).
6
Strategic Equity Fund
Performance Summary
All of the returns in this report represent past performance, which is not a guarantee of future results that may be achieved by the fund. (Current performance may be lower or higher than the performance data cited. For performance data current to the most recent month-end, visit our website at vanguard.com/performance.) Note, too, that both investment returns and principal value can fluctuate widely, so an investor’s shares, when sold, could be worth more or less than their original cost. The returns shown do not reflect taxes that a shareholder would pay on fund distributions or on the sale of fund shares.
Cumulative Performance: September 30, 2009, Through September 30, 2019
Initial Investment of $10,000

| | Average Annual Total Returns | |
| | Periods Ended September 30, 2019 | |
| | | | | Final Value |
| | One | Five | Ten | of a $10,000 |
| | Year | Years | Years | Investment |

| Strategic Equity Fund | -5.63% | 7.81% | 13.10% | $34,240 |

| MSCI US Small + Mid Cap 2200 Index | -1.09 | 9.15 | 12.91 | 33,685 |

| Dow Jones U.S. Total Stock Market Float Adjusted Index | 2.81 | 10.40 | 13.09 | 34,207 |
See Financial Highlights for dividend and capital gains information.
7
Strategic Equity Fund
Sector Diversification
As of September 30, 2019
Communication Services | 3.3% |
Consumer Discretionary | 12.1 |
Consumer Staples | 3.1 |
Energy | 3.4 |
Financials | 15.1 |
Health Care | 11.8 |
Industrials | 14.6 |
Information Technology | 16.1 |
Materials | 5.3 |
Real Estate | 10.1 |
Utilities | 5.1 |
The table reflects the fund’s equity exposure, based on its investments in stocks and stock index futures. Any holdings in short-term reserves are excluded. Sector categories are based on the Global Industry Classification Standard (“GICS”), except for the “Other” category (if applicable), which includes securities that have not been provided a GICS classification as of the effective reporting period.
The Global Industry Classification Standard (“GICS”) was developed by and is the exclusive property and a service mark of MSCI Inc. (“MSCI”) and Standard and Poor’s, a division of McGraw-Hill Companies, Inc. (“S&P”), and is licensed for use by Vanguard. Neither MSCI, S&P nor any third party involved in making or compiling the GICS or any GICS classification makes any express or implied warranties or representations with respect to such standard or classification (or the results to be obtained by the use thereof), and all such parties hereby expressly disclaim all warranties of originality, accuracy, completeness, merchantability or fitness for a particular purpose with respect to any such standard or classification. Without limiting any of the foregoing, in no event shall MSCI, S&P, any of its affiliates or any third party involved in making or compiling the GICS or any GICS classification have any liability for any direct, indirect, special, punitive, consequential or any other damages (including lost profits) even if notified of the possibility of such damages.
8
Strategic Equity Fund
Financial Statements
Statement of Net Assets
As of September 30, 2019
The fund files its complete schedule of portfolio holdings with the Securities and Exchange Commission (SEC) for the first and third quarters of each fiscal year as an exhibit to its reports on Form N-PORT. The fund’s Form N-PORT reports are available on the SEC’s website at www.sec.gov.
| | | | | Market | |
| | | | | Value· | |
| | | Shares | | ($000 | ) |
Common Stocks (99.5%)1 | | | | | |
Communication Services (3.3%) | | | | | |
^ | Match Group Inc. | | 583,457 | | 41,682 | |
| Discovery Communications Inc. Class A | | 1,197,954 | | 31,902 | |
* | TripAdvisor Inc. | | 800,175 | | 30,951 | |
| News Corp. Class B | | 1,286,804 | | 18,395 | |
| New York Times Co. Class A | | 633,796 | | 18,050 | |
| Discovery Communications Inc. | | 660,120 | | 16,252 | |
^ | World Wrestling Entertainment Inc. Class A | | 201,734 | | 14,353 | |
* | IAC/InterActiveCorp | | 61,903 | | 13,493 | |
^,* | MSG Networks Inc. | | 744,379 | | 12,074 | |
* | Vonage Holdings Corp. | | 729,645 | | 8,245 | |
* | Bandwidth Inc. Class A | | 116,390 | | 7,578 | |
| TEGNA Inc. | | 416,337 | | 6,466 | |
| News Corp. Class A | | 429,783 | | 5,983 | |
| Nexstar Media Group Inc. Class A | | 56,165 | | 5,746 | |
* | Liberty Media Corp-Liberty SiriusXM Class A | | 116,232 | | 4,832 | |
| | | | | 236,002 | |
Consumer Discretionary (12.0%) | | | | | |
| Best Buy Co. Inc. | | 887,919 | | 61,257 | |
| PulteGroup Inc. | | 1,582,895 | | 57,855 | |
^,* | RH | | 328,377 | | 56,097 | |
| Whirlpool Corp. | | 313,725 | | 49,681 | |
* | Chipotle Mexican Grill Inc. Class A | | 58,134 | | 48,860 | |
| Deckers Outdoor Corp. | | 290,603 | | 42,823 | |
| Brinker International Inc. | | 973,650 | | 41,546 | |
* | MercadoLibre Inc. | | 75,174 | | 41,438 | |
| Bloomin’ Brands Inc. | | 2,035,801 | | 38,538 | |
* | Planet Fitness Inc. Class A | | 575,825 | | 33,323 | |
| Rent-A-Center Inc. | | 1,147,388 | | 29,591 | |
| Autoliv Inc. | | 307,483 | | 24,254 | |
| Lear Corp. | | 182,651 | | 21,535 | |
* | Roku Inc. | | 211,386 | | 21,511 | |
* | Etsy Inc. | | 363,941 | | 20,563 | |
| H&R Block Inc. | | 761,312 | | 17,982 | |
^,* | YETI Holdings Inc. | | 604,259 | | 16,919 | |
^ | Bed Bath & Beyond Inc. | | 1,564,091 | | 16,642 | |
* | Chegg Inc. | | 536,815 | | 16,078 | |
| Kohl’s Corp. | | 321,272 | | 15,954 | |
| DR Horton Inc. | | 301,507 | | 15,892 | |
| Darden Restaurants Inc. | | 122,985 | | 14,539 | |
* | SeaWorld Entertainment Inc. | | 539,095 | | 14,189 | |
| Jack in the Box Inc. | | 151,925 | | 13,843 | |
| Wingstop Inc. | | 144,248 | | 12,590 | |
| Toll Brothers Inc. | | 273,107 | | 11,211 | |
* | Fossil Group Inc. | | 848,521 | | 10,615 | |
| Newell Brands Inc. | | 503,662 | | 9,429 | |
| Gentex Corp. | | 341,053 | | 9,391 | |
* | Under Armour Inc. Class A | | 454,514 | | 9,063 | |
* | Under Armour Inc. Class C | | 444,714 | | 8,063 | |
* | Meritage Homes Corp. | | 106,271 | | 7,476 | |
* | NVR Inc. | | 1,855 | | 6,896 | |
| Adient plc | | 293,695 | | 6,743 | |
| Lithia Motors Inc. Class A | | 50,299 | | 6,659 | |
| Dave & Buster’s Entertainment Inc. | | 151,275 | | 5,892 | |
| Dick’s Sporting Goods Inc. | | 100,976 | | 4,121 | |
| Macy’s Inc. | | 239,024 | | 3,714 | |
| Dine Brands Global Inc. | | 45,716 | | 3,468 | |
* | Chewy Inc. | | 126,851 | | 3,118 | |
* | Qurate Retail Group Inc. QVC Group Class A | | 274,148 | | 2,828 | |
| | | | | 852,187 | |
Consumer Staples (3.1%) | | | | | |
| Lamb Weston Holdings Inc. | | 660,225 | | 48,011 | |
* | Boston Beer Co. Inc. Class A | | 110,175 | | 40,112 | |
* | Herbalife Nutrition Ltd. | | 827,525 | | 31,330 | |
| McCormick & Co. Inc. | | 157,830 | | 24,669 | |
9
Strategic Equity Fund
| | | | | Market | |
| | | | | Value· | |
| | | Shares | | ($000 | ) |
^ | Medifast Inc. | | 159,133 | | 16,491 | |
| Casey’s General Stores Inc. | | 77,470 | | 12,485 | |
| Bunge Ltd. | | 209,819 | | 11,880 | |
| Coty Inc. Class A | | 1,052,127 | | 11,058 | |
| Campbell Soup Co. | | 150,279 | | 7,051 | |
| Ingles Markets Inc. Class A | | 165,514 | | 6,432 | |
* | Post Holdings Inc. | | 49,640 | | 5,254 | |
* | US Foods Holding Corp. | | 104,715 | | 4,304 | |
| | | | | 219,077 | |
Energy (3.4%) | | | | | |
| HollyFrontier Corp. | | 901,536 | | 48,358 | |
| Plains GP Holdings LP Class A | | 1,418,711 | | 30,119 | |
| Delek US Holdings Inc. | | 646,157 | | 23,456 | |
* | Southwestern Energy Co. | | 11,668,762 | | 22,521 | |
* | Renewable Energy Group Inc. | | 1,135,167 | | 17,033 | |
| Cabot Oil & Gas Corp. | | 962,696 | | 16,915 | |
| Devon Energy Corp. | | 692,015 | | 16,650 | |
| Marathon Oil Corp. | | 1,309,090 | | 16,063 | |
| Denbury Resources Inc. | | 12,457,437 | | 14,824 | |
^,* | California Resources Corp. | | 979,406 | | 9,990 | |
| Peabody Energy Corp. | | 540,226 | | 7,952 | |
| Range Resources Corp. | | 1,649,240 | | 6,300 | |
| EQT Corp. | | 478,650 | | 5,093 | |
| PBF Energy Inc. Class A | | 147,344 | | 4,006 | |
| | | | | 239,280 | |
Financials (15.0%) | | | | | |
| Ally Financial Inc. | | 1,812,841 | | 60,114 | |
| Regions Financial Corp. | | 3,465,863 | | 54,830 | |
| Primerica Inc. | | 410,875 | | 52,276 | |
| LPL Financial Holdings Inc. | | 636,564 | | 52,135 | |
| Zions Bancorp NA | | 1,168,240 | | 52,010 | |
| Lincoln National Corp. | | 714,379 | | 43,091 | |
| Comerica Inc. | | 634,801 | | 41,891 | |
| MSCI Inc. Class A | | 187,878 | | 40,910 | |
| Santander Consumer USA Holdings Inc. | | 1,526,521 | | 38,942 | |
| MGIC Investment Corp. | | 3,006,452 | | 37,821 | |
* | Globe Life Inc. | | 382,677 | | 36,645 | |
| Walker & Dunlop Inc. | | 647,372 | | 36,207 | |
| Assured Guaranty Ltd. | | 803,626 | | 35,729 | |
| AXA Equitable Holdings Inc. | | 1,509,980 | | 33,461 | |
| Webster Financial Corp. | | 486,638 | | 22,809 | |
* | NMI Holdings Inc. Class A | | 820,028 | | 21,534 | |
| Essent Group Ltd. | | 448,960 | | 21,402 | |
| Voya Financial Inc. | | 376,707 | | 20,508 | |
| First American Financial Corp. | | 333,127 | | 19,658 | |
| Cincinnati Financial Corp. | | 167,218 | | 19,509 | |
| Cullen/Frost Bankers Inc. | | 217,775 | | 19,284 | |
| Universal Insurance Holdings Inc. | | 605,931 | | 18,172 | |
| Hanover Insurance Group Inc. | | 121,764 | | 16,504 | |
| Fifth Third Bancorp | | 584,599 | | 16,006 | |
| Umpqua Holdings Corp. | | 963,120 | | 15,853 | |
| FirstCash Inc. | | 171,923 | | 15,760 | |
* | Arch Capital Group Ltd. | | 360,999 | | 15,155 | |
* | Athene Holding Ltd. Class A | | 346,878 | | 14,590 | |
* | World Acceptance Corp. | | 113,620 | | 14,488 | |
| CIT Group Inc. | | 319,413 | | 14,473 | |
| Citizens Financial Group Inc. | | 366,014 | | 12,946 | |
| First Horizon National Corp. | | 756,257 | | 12,251 | |
| FactSet Research Systems Inc. | | 48,653 | | 11,821 | |
* | Alleghany Corp. | | 13,464 | | 10,741 | |
| Commerce Bancshares Inc. | | 170,590 | | 10,346 | |
| Unum Group | | 318,343 | | 9,461 | |
| Federal Agricultural Mortgage Corp. | | 114,118 | | 9,319 | |
| People’s United Financial Inc. | | 554,084 | | 8,663 | |
| First Financial Bankshares Inc. | | 258,398 | | 8,612 | |
| First Hawaiian Inc. | | 309,385 | | 8,261 | |
| Hancock Whitney Corp. | | 203,111 | | 7,778 | |
| Everest Re Group Ltd. | | 26,179 | | 6,966 | |
| Nelnet Inc. Class A | | 108,882 | | 6,925 | |
* | SVB Financial Group | | 30,762 | | 6,428 | |
| PacWest Bancorp | | 173,897 | | 6,319 | |
| Erie Indemnity Co. Class A | | 30,871 | | 5,731 | |
| Community Bank System Inc. | | 73,657 | | 4,544 | |
| American Equity Investment Life Holding Co. | | 174,896 | | 4,232 | |
| RenaissanceRe Holdings Ltd. | | 19,342 | | 3,742 | |
| MarketAxess Holdings Inc. | | 10,060 | | 3,295 | |
| Nasdaq Inc. | | 30,048 | | 2,985 | |
| International Bancshares Corp. | | 42,610 | | 1,646 | |
| | | | | 1,064,779 | |
Health Care (11.8%) | | | | | |
* | Veeva Systems Inc. Class A | | 359,829 | | 54,942 | |
| Chemed Corp. | | 119,857 | | 50,049 | |
10
Strategic Equity Fund
| | | | | Market | |
| | | | | Value· | |
| | | Shares | | ($000 | ) |
* | Charles River Laboratories International Inc. | | 375,089 | | 49,650 | |
| Dentsply Sirona Inc. | | 901,089 | | 48,037 | |
* | PRA Health Sciences Inc. | | 422,231 | | 41,898 | |
* | Mettler-Toledo International Inc. | | 57,566 | | 40,549 | |
| Universal Health Services Inc. Class B | | 256,730 | | 38,189 | |
| Agilent Technologies Inc. | | 478,682 | | 36,681 | |
* | IQVIA Holdings Inc. | | 245,394 | | 36,657 | |
* | Tenet Healthcare Corp. | | 1,629,596 | | 36,047 | |
* | Haemonetics Corp. | | 278,795 | | 35,167 | |
| Bruker Corp. | | 732,167 | | 32,164 | |
* | Henry Schein Inc. | | 467,670 | | 29,697 | |
* | Medpace Holdings Inc. | | 341,884 | | 28,732 | |
* | Waters Corp. | | 119,183 | | 26,605 | |
* | Myriad Genetics Inc. | | 820,404 | | 23,488 | |
* | Varian Medical Systems Inc. | | 161,244 | | 19,202 | |
* | Novocure Ltd. | | 252,846 | | 18,908 | |
* | Tandem Diabetes Care Inc. | | 300,247 | | 17,709 | |
* | Endo International plc | | 5,482,418 | | 17,599 | |
| Cooper Cos. Inc. | | 59,098 | | 17,552 | |
| DaVita Inc. | | 301,365 | | 17,199 | |
| Encompass Health Corp. | | 259,090 | | 16,395 | |
* | Ionis Pharmaceuticals Inc. | | 242,940 | | 14,554 | |
| Enanta Pharmaceuticals Inc. | | 197,252 | | 11,851 | |
* | Molina Healthcare Inc. | | 93,088 | | 10,214 | |
* | Syneos Health Inc. | | 183,951 | | 9,788 | |
* | IDEXX Laboratories Inc. | | 34,949 | | 9,504 | |
* | Amedisys Inc. | | 66,683 | | 8,736 | |
* | Hologic Inc. | | 160,939 | | 8,126 | |
* | Halozyme Therapeutics Inc. | | 519,645 | | 8,060 | |
* | Global Blood Therapeutics Inc. | | 146,369 | | 7,102 | |
* | Tivity Health Inc. | | 400,944 | | 6,668 | |
* | ImmunoGen Inc. | | 2,379,833 | | 5,759 | |
* | Arrowhead Pharmaceuticals Inc. | | 102,197 | | 2,880 | |
| | | | | 836,358 | |
Industrials (14.5%) | | | | | |
| Copart Inc. | | 796,888 | | 64,014 | |
| WW Grainger Inc. | | 192,431 | | 57,181 | |
| Allison Transmission Holdings Inc. | | 1,119,103 | | 52,654 | |
| Spirit AeroSystems Holdings Inc. Class A | | 614,843 | | 50,565 | |
| Expeditors International of Washington Inc. | | 677,295 | | 50,316 | |
| Huntington Ingalls Industries Inc. | | 221,035 | | 46,813 | |
* | HD Supply Holdings Inc. | | 1,136,126 | | 44,508 | |
| L3Harris Technologies Inc. | | 212,182 | | 44,270 | |
| SkyWest Inc. | | 752,367 | | 43,186 | |
* | Meritor Inc. | | 2,149,036 | | 39,757 | |
* | TriNet Group Inc. | | 635,868 | | 39,545 | |
| Robert Half International Inc. | | 661,783 | | 36,835 | |
| HEICO Corp. | | 222,370 | | 27,770 | |
| Dover Corp. | | 237,296 | | 23,625 | |
* | FTI Consulting Inc. | | 217,518 | | 23,055 | |
| Nielsen Holdings plc | | 1,074,846 | | 22,840 | |
| GATX Corp. | | 278,689 | | 21,607 | |
* | AeroVironment Inc. | | 391,380 | | 20,962 | |
* | MasTec Inc. | | 298,926 | | 19,409 | |
* | Aerojet Rocketdyne Holdings Inc. | | 382,086 | | 19,299 | |
| Korn Ferry | | 474,467 | | 18,333 | |
| AGCO Corp. | | 226,952 | | 17,180 | |
| Oshkosh Corp. | | 222,432 | | 16,860 | |
| Wabash National Corp. | | 1,132,819 | | 16,437 | |
* | IHS Markit Ltd. | | 244,496 | | 16,352 | |
| Jacobs Engineering Group Inc. | | 161,251 | | 14,754 | |
| Continental Building Products Inc. | | 535,262 | | 14,607 | |
* | Avis Budget Group Inc. | | 436,164 | | 12,326 | |
| Textron Inc. | | 248,160 | | 12,150 | |
| Tetra Tech Inc. | | 135,039 | | 11,716 | |
| Lennox International Inc. | | 46,992 | | 11,418 | |
* | Mercury Systems Inc. | | 132,746 | | 10,775 | |
| Landstar System Inc. | | 90,682 | | 10,209 | |
| Masco Corp. | | 242,547 | | 10,109 | |
| Quad/Graphics Inc. | | 945,039 | | 9,932 | |
| Old Dominion Freight Line Inc. | | 57,885 | | 9,839 | |
| Rush Enterprises Inc. Class A | | 241,532 | | 9,318 | |
| Pentair plc | | 230,975 | | 8,731 | |
* | JetBlue Airways Corp. | | 484,090 | | 8,109 | |
| Armstrong World Industries Inc. | | 81,226 | | 7,855 | |
| CH Robinson Worldwide Inc. | | 65,437 | | 5,548 | |
* | Teledyne Technologies Inc. | | 16,948 | | 5,457 | |
| Owens Corning | | 82,256 | | 5,199 | |
* | TrueBlue Inc. | | 243,134 | | 5,130 | |
| Ennis Inc. | | 233,372 | | 4,716 | |
| Herman Miller Inc. | | 93,970 | | 4,331 | |
* | Sensata Technologies Holding plc | | 74,760 | | 3,742 | |
| KAR Auction Services Inc. | | 137,593 | | 3,378 | |
| | | | | 1,032,722 | |
11
Strategic Equity Fund
| | | | | Market | |
| | | | | Value· | |
| | | Shares | | ($000 | ) |
Information Technology (16.0%) | | | | | |
| CDW Corp. | | 531,457 | | 65,497 | |
* | Cadence Design Systems Inc. | | 905,428 | | 59,831 | |
* | CACI International Inc. Class A | | 225,685 | | 52,192 | |
* | Zebra Technologies Corp. | | 252,058 | | 52,017 | |
| Booz Allen Hamilton Holding Corp. Class A | | 730,483 | | 51,879 | |
* | Fortinet Inc. | | 639,149 | | 49,061 | |
| Citrix Systems Inc. | | 487,399 | | 47,044 | |
| Broadridge Financial Solutions Inc. | | 350,970 | | 43,671 | |
* | Five9 Inc. | | 766,177 | | 41,174 | |
| Jabil Inc. | | 1,098,781 | | 39,303 | |
| Xilinx Inc. | | 401,391 | | 38,493 | |
* | HubSpot Inc. | | 246,635 | | 37,392 | |
| Avnet Inc. | | 819,584 | | 36,459 | |
* | Paycom Software Inc. | | 166,872 | | 34,958 | |
* | Box Inc. | | 2,036,007 | | 33,716 | |
* | Advanced Micro Devices Inc. | | 1,085,149 | | 31,458 | |
* | Synaptics Inc. | | 771,263 | | 30,812 | |
* | Lattice Semiconductor Corp. | | 1,580,376 | | 28,897 | |
* | Tech Data Corp. | | 270,412 | | 28,188 | |
| Ciena Corp. | | 585,170 | | 22,956 | |
| MAXIMUS Inc. | | 260,426 | | 20,120 | |
* | Fair Isaac Corp. | | 64,352 | | 19,532 | |
* | RingCentral Inc. Class A | | 151,589 | | 19,049 | |
| ManTech International Corp. Class A | | 207,786 | | 14,838 | |
* | Euronet Worldwide Inc. | | 98,717 | | 14,442 | |
| CSG Systems International Inc. | | 261,530 | | 13,516 | |
* | Manhattan Associates Inc. | | 161,953 | | 13,065 | |
* | Amkor Technology Inc. | | 1,326,658 | | 12,073 | |
| Dropbox Inc. Class A | | 586,716 | | 11,834 | |
* | Verint Systems Inc. | | 271,631 | | 11,620 | |
| Leidos Holdings Inc. | | 133,706 | | 11,483 | |
* | Teradata Corp. | | 364,346 | | 11,295 | |
| Sabre Corp. | | 489,291 | | 10,958 | |
| Science Applications International Corp. | | 117,973 | | 10,305 | |
| Teradyne Inc. | | 169,763 | | 9,831 | |
* | Unisys Corp. | | 1,315,755 | | 9,776 | |
* | Inphi Corp. | | 157,999 | | 9,646 | |
| Xerox Holdings Corp. | | 306,410 | | 9,165 | |
| Cirrus Logic Inc. | | 145,382 | | 7,790 | |
| Enphase Energy Inc. | | 333,699 | | 7,418 | |
^,* | SunPower Corp. Class A | | 618,582 | | 6,786 | |
* | Anixter International Inc. | | 89,119 | | 6,160 | |
* | Trade Desk Inc. Class A | | 29,591 | | 5,550 | |
| EPAM Systems Inc. | | 29,959 | | 5,462 | |
* | Everbridge Inc. | | 87,233 | | 5,383 | |
* | ePlus Inc. | | 67,902 | | 5,167 | |
* | SMART Global Holdings Inc. | | 186,216 | | 4,745 | |
* | Keysight Technologies Inc. | | 42,510 | | 4,134 | |
^,* | Fitbit Inc. Class A | | 1,044,846 | | 3,981 | |
* | SolarEdge Technologies Inc. | | 46,471 | | 3,890 | |
| Maxim Integrated Products Inc. | | 64,631 | | 3,743 | |
* | Alarm.com Holdings Inc. | | 73,691 | | 3,437 | |
* | PROS Holdings Inc. | | 55,267 | | 3,294 | |
* | Mellanox Technologies Ltd. | | 16,671 | | 1,827 | |
| | | | | 1,136,313 | |
Materials (5.2%) | | | | | |
| Ball Corp. | | 870,481 | | 63,380 | |
| CF Industries Holdings Inc. | | 1,093,127 | | 53,782 | |
| Huntsman Corp. | | 1,827,200 | | 42,501 | |
| Louisiana-Pacific Corp. | | 1,372,152 | | 33,728 | |
| Sealed Air Corp. | | 717,448 | | 29,781 | |
| Avery Dennison Corp. | | 259,831 | | 29,509 | |
| Royal Gold Inc. | | 173,187 | | 21,338 | |
| Warrior Met Coal Inc. | | 1,048,742 | | 20,471 | |
| Scotts Miracle-Gro Co. | | 177,405 | | 18,063 | |
| Greif Inc. Class A | | 384,886 | | 14,583 | |
| Reliance Steel & Aluminum Co. | | 139,901 | | 13,943 | |
| Domtar Corp. | | 353,317 | | 12,652 | |
| Vulcan Materials Co. | | 74,428 | | 11,257 | |
* | Axalta Coating Systems Ltd. | | 218,203 | | 6,579 | |
| | | | | 371,567 | |
Real Estate (10.1%) | | | | | |
| Extra Space Storage Inc. | | 492,709 | | 57,558 | |
| Service Properties Trust | | 1,954,543 | | 50,408 | |
| Spirit Realty Capital Inc. | | 1,030,159 | | 49,303 | |
| Invitation Homes Inc. | | 1,631,522 | | 48,309 | |
| Brixmor Property Group Inc. | | 2,302,129 | | 46,710 | |
| Medical Properties Trust Inc. | | 2,234,626 | | 43,709 | |
| Life Storage Inc. | | 361,850 | | 38,143 | |
| Park Hotels & Resorts Inc. | | 1,508,527 | | 37,668 | |
| Lexington Realty Trust Class B | | 3,489,683 | | 35,769 | |
| Omega Healthcare Investors Inc. | | 826,259 | | 34,529 | |
| VEREIT Inc. | | 3,440,219 | | 33,645 | |
| Kimco Realty Corp. | | 1,603,186 | | 33,475 | |
12
Strategic Equity Fund
| | | | | Market | |
| | | | | Value· | |
| | | Shares | | ($000 | ) |
| EPR Properties | | 432,390 | | 33,234 | |
| Sabra Health Care REIT Inc. | | 1,289,400 | | 29,605 | |
| Mid-America Apartment Communities Inc. | | 187,262 | | 24,346 | |
| Essex Property Trust Inc. | | 55,500 | | 18,129 | |
| National Health Investors Inc. | | 195,267 | | 16,088 | |
| CubeSmart | | 424,161 | | 14,803 | |
| Xenia Hotels & Resorts Inc. | | 675,544 | | 14,268 | |
| Alexandria Real Estate Equities Inc. | | 69,559 | | 10,715 | |
| Universal Health Realty Income Trust | | 75,916 | | 7,804 | |
^ | Washington Prime Group Inc. | | 1,690,851 | | 7,000 | |
| American Campus Communities Inc. | | 142,730 | | 6,863 | |
| Senior Housing Properties Trust | | 727,847 | | 6,736 | |
| Brandywine Realty Trust | | 358,345 | | 5,429 | |
| Healthcare Trust of America Inc. Class A | | 147,583 | | 4,336 | |
| Ashford Hospitality Trust Inc. | | 1,155,426 | | 3,825 | |
| American Homes 4 Rent Class A | | 136,515 | | 3,534 | |
| | | | | 715,941 | |
Utilities (5.1%) | | | | | |
| FirstEnergy Corp. | | 1,497,454 | | 72,222 | |
| AES Corp. | | 3,220,875 | | 52,629 | |
| NRG Energy Inc. | | 1,303,973 | | 51,637 | |
| Vistra Energy Corp. | | 1,755,978 | | 46,937 | |
| Ameren Corp. | | 394,571 | | 31,586 | |
| Entergy Corp. | | 238,068 | | 27,940 | |
| OGE Energy Corp. | | 606,177 | | 27,508 | |
| Pinnacle West Capital Corp. | | 276,790 | | 26,868 | |
| Black Hills Corp. | | 120,932 | | 9,279 | |
| American Water Works Co. Inc. | | 70,466 | | 8,754 | |
| MDU Resources Group Inc. | | 141,328 | | 3,984 | |
| | | | | 359,344 | |
Total Common Stocks
(Cost $6,088,263) | | | | 7,063,570 | |
Temporary Cash Investments (1.7%)1 | | | | | |
Money Market Fund (1.7%) | | | | | |
2,3 | Vanguard Market Liquidity Fund, 2.098% | | 1,192,076 | | 119,219 | |
| | | | | | |
| | | Face | | | |
| | | Amount | | | |
| | | ($000 | ) | | |
U.S. Government and Agency Obligations (0.0%) | | | | | |
4 | United States Treasury Bill, 1.981%, 11/7/19 | | 550 | | 549 | |
4 | United States Treasury Bill, 2.045%, 11/21/19 | | 1,300 | | 1,297 | |
| | | | | 1,846 | |
Total Temporary Cash Investments
(Cost $121,054) | | | | 121,065 | |
Total Investments (101.2%)
(Cost $6,209,317) | | | | 7,184,635 | |
| | | | | | |
| | | | Amount | |
| | | | ($000 | ) |
Other Assets and Liabilities (-1.2%) | | | | | |
Other Assets | | | | | |
Investment in Vanguard | | | | 335 | |
Receivables for Investment Securities Sold | | | | 6,341 | |
Receivables for Accrued Income | | | | 8,125 | |
Receivables for Capital Shares Issued | | | | 3,415 | |
Variation Margin Receivable—Futures Contract | | | | 122 | |
Other Assets | | | | 494 | |
Total Other Assets | | | | 18,832 | |
Liabilities | | | | | |
Payables for Investment Securities Purchased | | | | (5,251 | ) |
Collateral for Securities on Loan | | | | (84,913 | ) |
Payables for Capital Shares Redeemed | | | | (9,996 | ) |
Payables to Vanguard | | | | (3,744 | ) |
Variation Margin Payable—Futures Contract | | | | (22 | ) |
Other Liabilities | | | | (1,065 | ) |
Total Liabilities | | | | (104,991 | ) |
Net Assets (100%) | | | | | |
Applicable to 222,739,638 outstanding $.001 par value shares of beneficial interest (unlimited authorization) | | | | 7,098,476 | |
Net Asset Value Per Share | | | | $31.87 | |
13
Strategic Equity Fund
At September 30, 2019, net assets consisted of:
| | Amount | |
| | ($000 | ) |
Paid-in Capital | | 5,968,938 | |
Total Distributable Earnings (Loss) | | 1,129,538 | |
Net Assets | | 7,098,476 | |
· | See Note A in Notes to Financial Statements. |
| |
^ | Includes partial security positions on loan to broker-dealers. The total value of securities on loan is $81,564,000. |
| |
* | Non-income-producing security. |
| |
1 | The fund invests a portion of its cash reserves in equity markets through the use of index futures contracts. After giving effect to futures investments, the fund’s effective common stock and temporary cash investment positions represent 100.1% and 1.1%, respectively, of net assets. |
| |
2 | Affiliated money market fund available only to Vanguard funds and certain trusts and accounts managed by Vanguard. Rate shown is the 7-day yield. |
| |
3 | Collateral of $84,913,000 was received for securities on loan. |
| |
4 | Securities with a value of $1,846,000 have been segregated as initial margin for open futures contracts. |
| |
| REIT—Real Estate Investment Trust. |
Derivative Financial Instruments Outstanding as of Period End
Futures Contracts | | | | | | | | | |
| | | | | | | | | |
| | | | | | | | ($000 | ) |
| | | | | | | | | |
| | | | | | | | | |
| | | | | | | | Value and | |
| | | | Number of | | | | Unrealized | |
| | | | Long (Short | ) | Notional | | Appreciation | |
| | Expiration | | Contracts | | Amount | | (Depreciation | ) |
Long Futures Contracts | | | | | | | | | |
E-mini Russell 2000 Index | | December 2019 | | 381 | | 29,051 | | (865 | ) |
E-mini S&P Mid-Cap 400 Index | | December 2019 | | 54 | | 10,465 | | (151 | ) |
| | | | | | | | (1,016 | ) |
See accompanying Notes, which are an integral part of the Financial Statements.
14
Strategic Equity Fund
Statement of Operations
| | Year Ended | |
| | September 30, 2019 | |
| | | |
| | ($000 | ) |
Investment Income | | | |
Income | | | |
Dividends | | 111,966 | |
Interest1 | | 880 | |
Securities Lending—Net | | 497 | |
Total Income | | 113,343 | |
Expenses | | | |
The Vanguard Group—Note B | | | |
Investment Advisory Services | | 2,280 | |
Management and Administrative | | 8,933 | |
Marketing and Distribution | | 718 | |
Custodian Fees | | 53 | |
Auditing Fees | | 33 | |
Shareholders’ Reports | | 72 | |
Trustees’ Fees and Expenses | | 5 | |
Total Expenses | | 12,094 | |
Net Investment Income | | 101,249 | |
Realized Net Gain (Loss) | | | |
Investment Securities Sold1 | | 99,140 | |
Futures Contracts | | (2,370 | ) |
Realized Net Gain (Loss) | | 96,770 | |
Change in Unrealized Appreciation (Depreciation) | | | |
Investment Securities1 | | (665,833 | ) |
Futures Contracts | | (634 | ) |
Change in Unrealized Appreciation (Depreciation) | | (666,467 | ) |
Net Increase (Decrease) in Net Assets Resulting from Operations | | (468,448 | ) |
1 Interest income, realized net gain (loss), and change in unrealized appreciation (depreciation) from an affiliated company of the fund were $830,000, $6,000, and $5,000, respectively. Purchases and sales are for temporary cash investment purposes.
See accompanying Notes, which are an integral part of the Financial Statements.
15
Strategic Equity Fund
Statement of Changes in Net Assets
| | Year Ended September 30, | |
| | | | | |
| | 2019 | | 2018 | |
| | ($000 | ) | ($000 | ) |
Increase (Decrease) in Net Assets | | | | | |
Operations | | | | | |
Net Investment Income | | 101,249 | | 82,253 | |
Realized Net Gain (Loss) | | 96,770 | | 562,077 | |
Change in Unrealized Appreciation (Depreciation) | | (666,467 | ) | 432,387 | |
Net Increase (Decrease) in Net Assets Resulting from Operations | | (468,448 | ) | 1,076,717 | |
Distributions | | | | | |
Net Investment Income | | (84,240 | ) | (92,114 | ) |
Realized Capital Gain1 | | (515,278 | ) | (479,773 | ) |
Total Distributions | | (599,518 | ) | (571,887 | ) |
Capital Share Transactions | | | | | |
Issued | | 756,397 | | 889,191 | |
Issued in Lieu of Cash Distributions | | 563,538 | | 537,684 | |
Redeemed | | (1,099,829 | ) | (1,035,958 | ) |
Net Increase (Decrease) from Capital Share Transactions | | 220,106 | | 390,917 | |
Total Increase (Decrease) | | (847,860 | ) | 895,747 | |
Net Assets | | | | | |
Beginning of Period | | 7,946,336 | | 7,050,589 | |
End of Period | | 7,098,476 | | 7,946,336 | |
1 Includes fiscal 2019 and 2018 short-term gain distributions totaling $23,989,000 and $28,727,000, respectively. Short-term gain distributions are treated as ordinary income dividends for tax purposes.
See accompanying Notes, which are an integral part of the Financial Statements.
16
Strategic Equity Fund
Financial Highlights
For a Share Outstanding | Year Ended September 30, | |
Throughout Each Period | 2019 | | 2018 | | 2017 | | 2016 | | 2015 | |
Net Asset Value, Beginning of Period | $37.21 | | $34.89 | | $30.41 | | $30.82 | | $32.02 | |
Investment Operations | | | | | | | | | | |
Net Investment Income | .449 | 1 | .392 | 1 | .504 | 1 | .624 | | .466 | |
Net Realized and Unrealized Gain (Loss) on Investments | (2.980 | ) | 4.781 | | 4.988 | | 2.440 | | .207 | |
Total from Investment Operations | (2.531 | ) | 5.173 | | 5.492 | | 3.064 | | .673 | |
Distributions | | | | | | | | | | |
Dividends from Net Investment Income | (.395 | ) | (.460 | ) | (.509 | ) | (.507 | ) | (.354 | ) |
Distributions from Realized Capital Gains | (2.414 | ) | (2.393 | ) | (.503 | ) | (2.967 | ) | (1.519 | ) |
Total Distributions | (2.809 | ) | (2.853 | ) | (1.012 | ) | (3.474 | ) | (1.873 | ) |
Net Asset Value, End of Period | $31.87 | | $37.21 | | $34.89 | | $30.41 | | $30.82 | |
| | | | | | | | | | |
Total Return2 | -5.63% | | 15.63% | | 18.28% | | 10.62% | | 2.01% | |
| | | | | | | | | | |
Ratios/Supplemental Data | | | | | | | | | | |
Net Assets, End of Period (Millions) | $7,098 | | $7,946 | | $7,051 | | $6,046 | | $5,739 | |
Ratio of Total Expenses to Average Net Assets | 0.17% | | 0.17% | | 0.18% | | 0.18% | | 0.21% | |
Ratio of Net Investment Income to Average Net Assets | 1.42% | | 1.10% | | 1.53% | | 2.09% | | 1.41% | |
Portfolio Turnover Rate | 60% | | 82% | | 81% | | 74% | | 70% | |
1 Calculated based on average shares outstanding.
2 Total returns do not include account service fees that may have applied in the periods shown. Fund prospectuses provide information about any applicable account service fees.
See accompanying Notes, which are an integral part of the Financial Statements.
17
Strategic Equity Fund
Notes to Financial Statements
Vanguard Strategic Equity Fund is registered under the Investment Company Act of 1940 as an open-end investment company, or mutual fund.
A. The following significant accounting policies conform to generally accepted accounting principles for U.S. investment companies. The fund consistently follows such policies in preparing its financial statements.
1. Security Valuation: Securities are valued as of the close of trading on the New York Stock Exchange (generally 4 p.m., Eastern time) on the valuation date. Equity securities are valued at the latest quoted sales prices or official closing prices taken from the primary market in which each security trades; such securities not traded on the valuation date are valued at the mean of the latest quoted bid and asked prices. Securities for which market quotations are not readily available, or whose values have been materially affected by events occurring before the fund’s pricing time but after the close of the securities’ primary markets, are valued by methods deemed by the board of trustees to represent fair value. Investments in Vanguard Market Liquidity Fund are valued at that fund’s net asset value. Temporary cash investments are valued using the latest bid prices or using valuations based on a matrix system (which considers such factors as security prices, yields, maturities, and ratings), both as furnished by independent pricing services.
2. Futures Contracts: The fund uses index futures contracts to a limited extent, with the objective of maintaining full exposure to the stock market while maintaining liquidity. The fund may purchase or sell futures contracts to achieve a desired level of investment, whether to accommodate portfolio turnover or cash flows from capital share transactions. The primary risks associated with the use of futures contracts are imperfect correlation between changes in market values of stocks held by the fund and the prices of futures contracts, and the possibility of an illiquid market. Counterparty risk involving futures is mitigated because a regulated clearinghouse is the counterparty instead of the clearing broker. To further mitigate counterparty risk, the fund trades futures contracts on an exchange, monitors the financial strength of its clearing brokers and clearinghouse, and has entered into clearing agreements with its clearing brokers. The clearinghouse imposes initial margin requirements to secure the fund’s performance and requires daily settlement of variation margin representing changes in the market value of each contract. Any assets pledged as initial margin for open contracts are noted in the Statement of Net Assets.
Futures contracts are valued at their quoted daily settlement prices. The notional amounts of the contracts are not recorded in the Statement of Net Assets. Fluctuations in the value of the contracts are recorded in the Statement of Net Assets as an asset (liability) and in the Statement of Operations as unrealized appreciation (depreciation) until the contracts are closed, when they are recorded as realized futures gains (losses).
During the year ended September 30, 2019, the fund’s average investments in long and short futures contracts represented less than 1% and 0% of net assets, respectively, based on the average of the notional amounts at each quarter-end during the period.
3. Federal Income Taxes: The fund intends to continue to qualify as a regulated investment company and distribute all of its taxable income. Management has analyzed the fund’s tax positions taken for all open federal income tax years (September 30, 2016–2019), and has concluded that no provision for federal income tax is required in the fund’s financial statements.
18
Strategic Equity Fund
4. Distributions: Distributions to shareholders are recorded on the ex-dividend date. Distributions are determined on a tax basis and may differ from net investment income and realized capital gains for financial reporting purposes.
5. Securities Lending: To earn additional income, the fund lends its securities to qualified institutional borrowers. Security loans are subject to termination by the fund at any time, and are required to be secured at all times by collateral in an amount at least equal to the market value of securities loaned. Daily market fluctuations could cause the value of loaned securities to be more or less than the value of the collateral received. When this occurs, the collateral is adjusted and settled before the opening of the market on the next business day. The fund further mitigates its counterparty risk by entering into securities lending transactions only with a diverse group of prequalified counterparties, monitoring their financial strength, and entering into master securities lending agreements with its counterparties. The master securities lending agreements provide that, in the event of a counterparty’s default (including bankruptcy), the fund may terminate any loans with that borrower, determine the net amount owed, and sell or retain the collateral up to the net amount owed to the fund; however, such actions may be subject to legal proceedings. While collateral mitigates counterparty risk, in the event of a default, the fund may experience delays and costs in recovering the securities loaned. The fund invests cash collateral received in Vanguard Market Liquidity Fund, and records a liability in the Statement of Net Assets for the return of the collateral, during the period the securities are on loan. Securities lending income represents fees charged to borrowers plus income earned on invested cash collateral, less expenses associated with the loan. During the term of the loan, the fund is entitled to all distributions made on or in respect of the loaned securities.
6. Credit Facility: The fund and certain other funds managed by The Vanguard Group (“Vanguard”) participate in a $4.3 billion committed credit facility provided by a syndicate of lenders pursuant to a credit agreement that may be renewed annually; each fund is individually liable for its borrowings, if any, under the credit facility. Borrowings may be utilized for temporary and emergency purposes, and are subject to the fund’s regulatory and contractual borrowing restrictions. The participating funds are charged administrative fees and an annual commitment fee of 0.10% of the undrawn amount of the facility; these fees are allocated to the funds based on a method approved by the fund’s board of trustees and included in Management and Administrative expenses on the fund’s Statement of Operations. Any borrowings under this facility bear interest at a rate based upon the higher of the one-month London Interbank Offered Rate, federal funds effective rate, or overnight bank funding rate plus an agreed-upon spread.
The fund had no borrowings outstanding at September 30, 2019, or at any time during the period then ended.
7. Other: Dividend income is recorded on the ex-dividend date. Interest income includes income distributions received from Vanguard Market Liquidity Fund and is accrued daily. Premiums and discounts on debt securities purchased are amortized and accreted, respectively, to interest income over the lives of the respective securities. Security transactions are accounted for on the date securities are bought or sold. Costs used to determine realized gains (losses) on the sale of investment securities are those of the specific securities sold.
B. In accordance with the terms of a Funds’ Service Agreement (the “FSA”) between Vanguard and the fund, Vanguard furnishes to the fund investment advisory, corporate management, administrative, marketing, and distribution services at Vanguard’s cost of operations (as defined by the FSA). These
19
Strategic Equity Fund
costs of operations are allocated to the fund based on methods and guidelines approved by the board of trustees. Vanguard does not require reimbursement in the current period for certain costs of operations (such as deferred compensation/benefits and risk/insurance costs); the fund’s liability for these costs of operations is included in Payables to Vanguard on the Statement of Net Assets. All other costs of operations payable to Vanguard are generally settled twice a month.
Upon the request of Vanguard, the fund may invest up to 0.40% of its net assets as capital in Vanguard. At September 30, 2019, the fund had contributed to Vanguard capital in the amount of $335,000, representing less than 0.01% of the fund’s net assets and 0.13% of Vanguard’s capital received pursuant to the FSA. The fund’s trustees and officers are also directors and employees, respectively, of Vanguard.
C. Various inputs may be used to determine the value of the fund’s investments. These inputs are summarized in three broad levels for financial statement purposes. The inputs or methodologies used to value securities are not necessarily an indication of the risk associated with investing in those securities.
Level 1—Quoted prices in active markets for identical securities.
Level 2—Other significant observable inputs (including quoted prices for similar securities, interest rates, prepayment speeds, credit risk, etc.).
Level 3—Significant unobservable inputs (including the fund’s own assumptions used to determine the fair value of investments). Any investments valued with significant unobservable inputs are noted on the Statement of Net Assets.
The following table summarizes the market value of the fund’s investments and derivatives as of September 30, 2019, based on the inputs used to value them:
| Level 1 | | Level 2 | | Level 3 | |
Investments | ($000 | ) | ($000 | ) | ($000 | ) |
Common Stocks | 7,063,570 | | — | | — | |
Temporary Cash Investments | 119,219 | | 1,846 | | — | |
Futures Contracts—Assets1 | 122 | | — | | — | |
Futures Contracts—Liabilities1 | (22 | ) | — | | — | |
Total | 7,182,889 | | 1,846 | | — | |
1 Represents variation margin on the last day of the reporting period.
D. Permanent differences between book-basis and tax-basis components of net assets are reclassified among capital accounts in the financial statements to reflect their tax character. These reclassifications have no effect on net assets or net asset value per share. As of period end, permanent differences primarily attributable to the accounting for distributions in connection with fund share redemptions were reclassified between the following accounts:
| Amount |
| ($000) |
Paid-in Capital | 9,237 |
Total Distributable Earnings (Loss) | (9,237) |
20
Strategic Equity Fund
Temporary differences between book-basis and tax-basis components of total distributable earnings (loss) arise when certain items of income, gain, or loss are recognized in different periods for financial statement and tax purposes; these differences will reverse at some time in the future. The differences are primarily related to the tax deferral of losses on wash sales and the realization of unrealized gains or losses on certain futures contracts. As of period end, the tax-basis components of total distributable earnings (loss) are detailed in the table as follows:
| Amount |
| ($000) |
Undistributed Ordinary Income | 65,757 |
Undistributed Long-Term Gains | 91,605 |
Capital Loss Carryforwards (Non-expiring) | — |
Net Unrealized Gains (Losses) | 975,318 |
As of September 30, 2019, gross unrealized appreciation and depreciation for investments and derivatives based on cost for U.S. federal income tax purposes were as follows:
| Amount ($000) |
Tax Cost | 6,209,317 |
Gross Unrealized Appreciation | 1,429,372 |
Gross Unrealized Depreciation | (454,054) |
Net Unrealized Appreciation (Depreciation) | 975,318 |
E. During the year ended September 30, 2019, the fund purchased $4,283,187,000 of investment securities and sold $4,540,143,000 of investment securities, other than temporary cash investments.
F. Capital shares issued and redeemed were:
| Year Ended September 30, |
| 2019 | 2018 |
| Shares | Shares |
| (000) | (000) |
Issued | 24,126 | 24,945 |
Issued in Lieu of Cash Distributions | 20,418 | 15,880 |
Redeemed | (35,338) | (29,353) |
Net Increase (Decrease) in Shares Outstanding | 9,206 | 11,472 |
G. Management has determined that no events or transactions occurred subsequent to September 30, 2019, that would require recognition or disclosure in these financial statements.
21
Report of Independent Registered Public Accounting Firm
To the Board of Trustees of Vanguard Horizon Funds and Shareholders of Vanguard Strategic Equity Fund
Opinion on the Financial Statements
We have audited the accompanying statement of net assets of Vanguard Strategic Equity Fund (one of the funds constituting Vanguard Horizon Funds, referred to hereafter as the “Fund”) as of September 30, 2019, the related statement of operations for the year ended September 30, 2019, the statement of changes in net assets for each of the two years in the period ended September 30, 2019, including the related notes, and the financial highlights for each of the five years in the period ended September 30, 2019 (collectively referred to as the “financial statements”). In our opinion, the financial statements present fairly, in all material respects, the financial position of the Fund as of September 30, 2019, the results of its operations for the year then ended, the changes in its net assets for each of the two years in the period ended September 30, 2019 and the financial highlights for each of the five years in the period ended September 30, 2019 in conformity with accounting principles generally accepted in the United States of America.
Basis for Opinion
These financial statements are the responsibility of the Fund’s management. Our responsibility is to express an opinion on the Fund’s financial statements based on our audits. We are a public accounting firm registered with the Public Company Accounting Oversight Board (United States) (“PCAOB”) and are required to be independent with respect to the Fund in accordance with the U.S. federal securities laws and the applicable rules and regulations of the Securities and Exchange Commission and the PCAOB.
We conducted our audits of these financial statements in accordance with the standards of the PCAOB. Those standards require that we plan and perform the audit to obtain reasonable assurance about whether the financial statements are free of material misstatement, whether due to error or fraud.
Our audits included performing procedures to assess the risks of material misstatement of the financial statements, whether due to error or fraud, and performing procedures that respond to those risks. Such procedures included examining, on a test basis, evidence regarding the amounts and disclosures in the financial statements. Our audits also included evaluating the accounting principles used and significant estimates made by management, as well as evaluating the overall presentation of the financial statements. Our procedures included confirmation of securities owned as of September 30, 2019 by correspondence with the custodian and brokers and by agreement to the underlying ownership records of the transfer agent; when replies were not received from brokers, we performed other auditing procedures. We believe that our audits provide a reasonable basis for our opinion.
/s/PricewaterhouseCoopers LLP
Philadelphia, Pennsylvania
November 13, 2019
We have served as the auditor of one or more investment companies in The Vanguard Group of Funds since 1975.
22
Special 2019 tax information (unaudited) for Vanguard Strategic Equity Fund
This information for the fiscal year ended September 30, 2019, is included pursuant to provisions of the Internal Revenue Code.
The fund distributed $495,829,000 as capital gain dividends (20% rate gain distributions) to shareholders during the fiscal year.
For nonresident alien shareholders, 100% of short-term capital gain dividends distributed by the fund are qualified short-term capital gains.
The fund distributed $73,751,000 of qualified dividend income to shareholders during the fiscal year.
For corporate shareholders, 82.4% of investment income (dividend income plus short-term gains, if any) qualifies for the dividends-received deduction.
23
This page intentionally left blank.
This page intentionally left blank.
This page intentionally left blank.
The People Who Govern Your Fund
The trustees of your mutual fund are there to see that the fund is operated and managed in your best interests since, as a shareholder, you are a part owner of the fund. Your fund’s trustees also serve on the board of directors of The Vanguard Group, Inc., which is owned by the Vanguard funds and provides services to them.
A majority of Vanguard’s board members are independent, meaning that they have no affiliation with Vanguard or the funds they oversee, apart from the sizable personal investments they have made as private individuals. The independent board members have distinguished backgrounds in business, academia, and public service. Each of the trustees and executive officers oversees 212 Vanguard funds.
Information for each trustee and executive officer of the fund appears below. That information, as well as the Vanguard fund count, is as of the date on the cover of this fund report. The mailing address of the trustees and officers is P.O. Box 876, Valley Forge, PA 19482. More information about the trustees is in the Statement of Additional Information, which can be obtained, without charge, by contacting Vanguard at 800-662-7447, or online at vanguard.com.
Interested Trustee1
Mortimer J. Buckley
Born in 1969. Trustee since January 2018. Principal occupation(s) during the past five years and other experience: chairman of the board (January 2019–present) of Vanguard and of each of the investment companies served by Vanguard; chief executive officer (January 2018–present) of Vanguard; chief executive officer, president, and trustee (January 2018–present) of each of the investment companies served by Vanguard; president and director (2017–present) of Vanguard; and president (February 2018–present) of Vanguard Marketing Corporation. Chief investment officer (2013–2017), managing director (2002–2017), head of the Retail Investor Group (2006–2012), and chief information officer (2001–2006) of Vanguard. Chairman of the board (2011–2017) and trustee (2009–2017) of the Children’s Hospital of Philadelphia; trustee (2018–present) of The Shipley School.
Independent Trustees
Emerson U. Fullwood
Born in 1948. Trustee since January 2008. Principal occupation(s) during the past five years and other experience: executive chief staff and marketing officer for North America and corporate vice president (retired 2008) of Xerox Corporation (document management products and services). Former president of the Worldwide Channels Group, Latin America, and Worldwide Customer Service and executive chief staff officer of Developing Markets of Xerox. Executive in residence and 2009–2010 Distinguished Minett Professor at the Rochester Institute of Technology. Director of SPX FLOW, Inc. (multi-industry manufacturing). Director of the University of Rochester Medical Center, the Monroe Community College Foundation, the United Way of Rochester, North Carolina A&T University, and Roberts Wesleyan College. Trustee of the University of Rochester.
Amy Gutmann
Born in 1949. Trustee since June 2006. Principal occupation(s) during the past five years and other experience: president (2004–present) of the University of Pennsylvania. Christopher H. Browne Distinguished Professor of Political Science, School of Arts and Sciences, and professor of communication, Annenberg School for Communication, with secondary faculty appointments in the Department of Philosophy, School of Arts and Sciences, and at the Graduate School of Education, University of Pennsylvania. Trustee of the National Constitution Center.
F. Joseph Loughrey
Born in 1949. Trustee since October 2009. Principal occupation(s) during the past five years and other experience: president and chief operating officer (retired 2009) and vice chairman of the board (2008–2009) of Cummins Inc. (industrial machinery). Chairman of the board of Hillenbrand, Inc. (specialized consumer services), and the Lumina Foundation.
1 Mr. Buckley is considered an “interested person,” as defined in the Investment Company Act of 1940, because he is an officer of the Vanguard funds.
Director of the V Foundation and Oxfam America. Member of the advisory council for the College of Arts and Letters and chair of the advisory board to the Kellogg Institute for International Studies, both at the University of Notre Dame.
Mark Loughridge
Born in 1953. Trustee since March 2012. Principal occupation(s) during the past five years and other experience: senior vice president and chief financial officer (retired 2013) of IBM (information technology services). Fiduciary member of IBM’s Retirement Plan Committee (2004–2013), senior vice president and general manager (2002–2004) of IBM Global Financing, vice president and controller (1998–2002) of IBM, and a variety of other prior management roles at IBM. Member of the Council on Chicago Booth.
Scott C. Malpass
Born in 1962. Trustee since March 2012. Principal occupation(s) during the past five years and other experience: chief investment officer (1989–present) and vice president (1996–present) of the University of Notre Dame. Assistant professor of finance at the Mendoza College of Business, University of Notre Dame, and member of the Notre Dame 403(b) Investment Committee. Chairman of the board of TIFF Advisory Services, Inc. Member of the board of Catholic Investment Services, Inc. (investment advisors) and the board of superintendence of the Institute for the Works of Religion.
Deanna Mulligan
Born in 1963. Trustee since January 2018. Principal occupation(s) during the past five years and other experience: president (2010–present) and chief executive officer (2011–present) of The Guardian Life Insurance Company of America. Chief operating officer (2010–2011) and executive vice president (2008–2010) of Individual Life and Disability of The Guardian Life Insurance Company of America. Member of the board of The Guardian Life Insurance Company of America, the American Council of Life Insurers, the Partnership for New York City (business leadership), and the Committee Encouraging Corporate Philanthropy. Trustee of the Economic Club of New York and the Bruce Museum (arts and science). Member of the Advisory Council for the Stanford Graduate School of Business.
André F. Perold
Born in 1952. Trustee since December 2004. Principal occupation(s) during the past five years and other experience: George Gund Professor of Finance and Banking, Emeritus at the Harvard Business School (retired 2011). Chief investment officer and co-managing partner of HighVista Strategies LLC (private investment firm). Board of advisors and investment committee member of the Museum of Fine Arts Boston. Board member (2018–present) of RIT Capital Partners (investment firm); investment committee member of Partners Health Care System.
Sarah Bloom Raskin
Born in 1961. Trustee since January 2018. Principal occupation(s) during the past five years and other experience: deputy secretary (2014–2017) of the United States Department of the Treasury. Governor (2010–2014) of the Federal Reserve Board. Commissioner (2007–2010) of financial regulation for the State of Maryland. Member of the board of directors (2012–2014) of Neighborhood Reinvestment Corporation. Director (2017–present) of i(x) Investments, LLC; director (2017–present) of Reserve Trust. Rubinstein Fellow (2017–present) of Duke University; trustee (2017–present) of Amherst College.
Peter F. Volanakis
Born in 1955. Trustee since July 2009. Principal occupation(s) during the past five years and other experience: president and chief operating officer (retired 2010) of Corning Incorporated (communications equipment) and director of Corning Incorporated (2000–2010) and Dow Corning (2001–2010). Director (2012) of SPX Corporation (multi-industry manufacturing). Overseer of the Amos Tuck School of Business Administration, Dartmouth College (2001–2013). Chairman of the board of trustees of Colby-Sawyer College. Member of the board of Hypertherm Inc. (industrial cutting systems, software, and consumables).
Executive Officers
Glenn Booraem
Born in 1967. Principal occupation(s) during the past five years and other experience: principal of Vanguard. Investment stewardship officer (2017–present), treasurer (2015–2017), controller (2010–2015), and assistant controller (2001–2010) of each of the investment companies served by Vanguard.
Christine M. Buchanan
Born in 1970. Principal occupation(s) during the past five years and other experience: principal of Vanguard and global head of Fund Administration at Vanguard. Treasurer (2017–present) of each of the investment companies served by Vanguard. Partner (2005–2017) at KPMG LLP (audit, tax, and advisory services).
Thomas J. Higgins
Born in 1957. Principal occupation(s) during the past five years and other experience: principal of Vanguard. Chief financial officer (2008–present) and treasurer (1998–2008) of each of the investment companies served by Vanguard.
Peter Mahoney
Born in 1974. Principal occupation(s) during the past five years and other experience: principal of Vanguard. Controller (2015–present) of each of the investment companies served by Vanguard. Head of International Fund Services (2008–2014) at Vanguard.
Anne E. Robinson
Born in 1970. Principal occupation(s) during the past five years and other experience: general counsel (2016–present) of Vanguard. Secretary (2016–present) of Vanguard and of each of the investment companies served by Vanguard. Managing director (2016–present) of Vanguard. Director and senior vice president (2016–2018) of Vanguard Marketing Corporation. Managing director and general counsel of Global Cards and Consumer Services (2014–2016) at Citigroup. Counsel (2003–2014) at American Express.
Michael Rollings
Born in 1963. Principal occupation(s) during the past five years and other experience: finance director (2017–present) and treasurer (2017) of each of the investment companies served by Vanguard. Managing director (2016–present) of Vanguard. Chief financial officer (2016–present) of Vanguard. Director (2016–present) of Vanguard Marketing Corporation. Executive vice president and chief financial officer (2006–2016) of MassMutual Financial Group.
John E. Schadl
Born in 1972. Principal occupation(s) during the past five years and other experience: principal of Vanguard. Chief compliance officer (2019–present) of Vanguard and of each of the investment companies served by Vanguard. Assistant vice president (May 2019–present) of Vanguard Marketing Corporation.
Vanguard Senior Management Team
Joseph Brennan | Chris D. McIsaac |
Mortimer J. Buckley | James M. Norris |
Gregory Davis | Thomas M. Rampulla |
John James | Karin A. Risi |
Martha G. King | Anne E. Robinson |
John T. Marcante | Michael Rollings |
| | 
|
| | |
| | P.O. Box 2600 |
| | Valley Forge, PA 19482-2600 |
Connect with Vanguard® > vanguard.com
Fund Information > 800-662-7447
Direct Investor Account Services > 800-662-2739
Institutional Investor Services > 800-523-1036
Text Telephone for People
Who Are Deaf or Hard of Hearing > 800-749-7273
This material may be used in conjunction with the offering of shares of any Vanguard fund only if preceded or accompanied by the fund’s current prospectus.
All comparative mutual fund data are from Morningstar, Inc., unless otherwise noted.
You can obtain a free copy of Vanguard’s proxy voting guidelines by visiting vanguard.com/proxyreporting or by calling Vanguard at 800-662-2739. The guidelines are also available from the SEC’s website, www.sec.gov. In addition, you may obtain a free report on how your fund voted the proxies for securities it owned during the 12 months ended June 30. To get the report, visit either vanguard.com/proxyreporting or www.sec.gov.
You can review information about your fund on the SEC’s website, and you can receive copies of this information, for a fee, by sending a request via email addressed to publicinfo@sec.gov.
Source for Bloomberg Barclays indexes: Bloomberg Index Services Limited. Copyright 2019, Bloomberg. All rights reserved.
| © 2019 The Vanguard Group, Inc. |
| All rights reserved. |
| Vanguard Marketing Corporation, Distributor. |
| |
| Q1140 112019 |

Annual Report | September 30, 2019 Vanguard Capital Opportunity Fund |
See the inside front cover for important information about access to your fund’s annual and semiannual shareholder reports. |
Important information about access to shareholder reports
Beginning on January 1, 2021, as permitted by regulations adopted by the Securities and Exchange Commission, paper copies of your fund’s annual and semiannual shareholder reports will no longer be sent to you by mail, unless you specifically request them. Instead, you will be notified by mail each time a report is posted on the website and will be provided with a link to access the report.
If you have already elected to receive shareholder reports electronically, you will not be affected by this change and do not need to take any action. You may elect to receive shareholder reports and other communications from the fund electronically by contacting your financial intermediary (such as a broker-dealer or bank) or, if you invest directly with the fund, by calling Vanguard at one of the phone numbers on the back cover of this report or by logging on to vanguard.com.
You may elect to receive paper copies of all future shareholder reports free of charge. If you invest through a financial intermediary, you can contact the intermediary to request that you continue to receive paper copies. If you invest directly with the fund, you can call Vanguard at one of the phone numbers on the back cover of this report or log on to vanguard.com. Your election to receive paper copies will apply to all the funds you hold through an intermediary or directly with Vanguard.
Contents | |
| |
A Note From Our Chairman | 1 |
Your Fund’s Performance at a Glance | 2 |
Advisor’s Report | 3 |
About Your Fund’s Expenses | 7 |
Performance Summary | 9 |
Financial Statements | 11 |
Please note: The opinions expressed in this report are just that—informed opinions. They should not be considered promises or advice. Also, please keep in mind that the information and opinions cover the period through the date on the front of this report. Of course, the risks of investing in your fund are spelled out in the prospectus.
A Note From Our Chairman

Tim Buckley
Chairman and Chief Executive Officer
Dear Shareholder,
Recent volatility in financial markets—affecting stocks, bonds, and commodities—has been a good reminder of the wise old adage, “Never keep all your eggs in one basket.” Maintaining balance and diversification in your investment portfolio can help to both limit risk and set you up for long-term success.
It’s understandable why some investors might become complacent after a long market run-up like the one that lifted stock prices, especially U.S. stock prices, in the years following the global financial crisis. But failing to rebalance regularly can leave a portfolio with a much different mix of assets than intended and, often, more risk than intended.
Balance across and diversification within asset classes are powerful tools for managing risk and achieving your investment goals. A portfolio’s allocation will determine a large portion of its long-term return and also the majority of its volatility risk. A well-diversified portfolio is less vulnerable to significant swings in the performance of any one segment of the asset classes in which it invests.
Balance and diversification will never eliminate the risk of loss, nor will they guarantee positive returns in a declining market. But they should reduce the chance that you’ll suffer disproportionate losses in one particular high-flying asset class or sector when it comes back to earth. And exposure to all key market components should give you at least some participation in the sectors that are performing best at any given time.
Vanguard is committed to helping you achieve balance and diversification in your portfolios to help meet your investment goals. We thank you for your continued loyalty.
Sincerely,

Mortimer J. Buckley
Chairman and Chief Executive Officer
October 14, 2019
1
Your Fund’s Performance at a Glance
· Vanguard Capital Opportunity Fund returned approximately –5% for the 12 months ended September 30, 2019, lagging its benchmark, the Russell Midcap Growth Index, which returned just over 5%.
· The broad U.S. stock market advanced nearly 3% for the year, which was marked by sharp intervals of volatility and uncertainty. Investors fretted over U.S.-China trade, heightened tensions with Iran, the imbroglio over Britain’s exit from the European Union, and whether an inverted yield curve signaled a recession ahead. With an eye toward the deteriorating global economic outlook, the Federal Reserve lowered short-term interest rates twice to sustain the U.S. economic recovery.
· Large-and mid-capitalization stocks generally outdistanced their small-cap counterparts.
· Returns were negative in six of the fund’s ten sectors. Its holdings in industrial, information technology, and health care stocks were the biggest detractors.
Market Barometer | | | |
| | Average Annual Total Returns |
| Periods Ended September 30, 2019 |
| One Year | Three Years | Five Years |
Stocks | | | |
Russell 1000 Index (Large-caps) | 3.87% | 13.19% | 10.62% |
Russell 2000 Index (Small-caps) | -8.89 | 8.23 | 8.19 |
Russell 3000 Index (Broad U.S. market) | 2.92 | 12.83 | 10.44 |
FTSE All-World ex US Index (International) | -1.12 | 6.46 | 3.24 |
| | | |
Bonds | | | |
Bloomberg Barclays U.S. Aggregate Bond Index | | | |
(Broad taxable market) | 10.30% | 2.92% | 3.38% |
Bloomberg Barclays Municipal Bond Index | | | |
(Broad tax-exempt market) | 8.55 | 3.19 | 3.66 |
FTSE Three-Month U.S. Treasury Bill Index | 2.36 | 1.52 | 0.95 |
| | | |
CPI | | | |
Consumer Price Index | 1.71% | 2.07% | 1.53% |
2
Advisor’s Report
For the 12 months ended September 30, 2019, Vanguard Capital Opportunity Fund returned –5.01% for Investor Shares and –4.95% for Admiral Shares. The results trailed the 5.20% return of its benchmark, the Russell Midcap Growth Index. The fund’s results also trailed the 4.25% return of the Standard & Poor’s 500 Index, which serves as a proxy for the broad market in the attribution discussion that follows. Relative to the S&P 500 Index, sector allocation and stock selection both detracted from the fund’s results.
The investment environment
The fiscal year featured a moderating U.S. economy and choppy performance in the U.S. equity market. The decade-long American expansion continued, but showed signs of late-cycle fatigue amid a broader global slowdown. Consumer spending remained healthy, bolstered by labor market strength, even as consumer confidence waned in the summer months. Business investment weakened late in the fiscal year, a notable reversal from a year ago, and trade-driven uncertainty hindered business confidence.
Other major economies slowed, particularly in Europe and China. Geopolitical tension intensified, including an apparent Iranian attack on Saudi Arabia’s oil infrastructure and a further deterioration in U.S.-China relations. The Federal Reserve responded to the unease with interest rate cuts that took effect in August and September, an about-face from last year’s tightening campaign.
The equity market proved resilient in the face of this widespread uncertainty, with the S&P 500 Index finishing the period up more than 4% even as corporate earnings sharply decelerated. Analysts now project just +2% earnings growth for the index in 2019, well below the original expectations for double-digit growth. Market sentiment hinged chiefly on U.S.-China trade progress and Fed policy.
In late 2018, the market fell precipitously as rising interest rates and trade negativity spawned fears of imminent recession. This decline proved short-lived, however, as optimism grew for a trade deal and more accommodative Fed commentary. The market bounced aggressively and ascended to record highs in April, June, and July. Defensive sectors generally outperformed, led by utilities (+27%), real estate (+25%), and consumer staples (+17%). Health care (–4%) was a notable outlier, as its domestic political sensitivity outweighed its defensive merits. Energy (–19%) was the biggest laggard amid a steep decline in oil prices.
Outlook for U.S. equities
Our long-standing cautious optimism currently tilts slightly more toward caution, a reflection of increased concerns in both the international and domestic arenas. The S&P 500 Index is near record highs despite a moderation in economic activity. Absolute valuation (16.7 times forward price/earnings valuation) is perhaps reasonable relative to anemic bond yields (1.7% on 10-year Treasuries at the end
3
of the fiscal year), but the divergence between equity market performance and underlying economic activity feels unsustainable.
Indeed, though equity market indexes have prevailed at elevated levels, the bond markets are indicating apparent distress. In August, the 10-year Treasury yield briefly dipped below that of 2-year Treasuries, a yield curve inversion that is often seen as a harbinger of recession.
Meanwhile, confidence persists that a U.S.-China trade deal will be achieved, even as relations steadily worsen and national political crises unfold in both countries (an impeachment inquiry in the U.S. and the Hong Kong protests for China). We have been hopeful that trade-inspired geopolitical risks would subside, but instead we observe mostly false starts and provocation. American domestic political rancor has likewise escalated, with hyperpartisanship effectively paralyzing the federal government’s legislative and executive branches.
Despite the relentless uncertainty, we believe in America’s economic engine, the free enterprise system. This fundamental faith undergirds and informs our desire to own U.S. equities over the long term, and we remain cognizant of how quickly conditions can improve. Our largest sector positions continue to be in information technology and health care, where the development of innovative technologies and therapies is not tied to near-term economic prospects. However, we also invest in companies and industries with more cyclical orientations, such as semiconductors and airlines. These companies rely heavily on global growth and, in some cases, a constructive China relationship.
Portfolio update
The portfolio maintained large overweight positions in information technology, health care, and industrial stocks. These sectors made up 75% of average assets, compared with their 45% combined weighting in the S&P 500 Index. The portfolio and index were equally weighted in consumer discretionary, at 10% of average assets, and modestly under-weighted in financials (7% of average assets, compared with 13% for the index) and communication services (4%, compared with 10%). The fund maintained an underweight position in all other sectors: consumer staples, energy, materials, real estate, and utilities.
Unfavorable stock selection primarily drove fund underperformance, with particular weakness in industrials, information technology, and health care. Within industrials, key detractors included FedEx (–39%), whose operational miscues have exacerbated trade war concerns, and several airlines, including American (–34%) and Southwest (–12%). Within information technology, laggards NetApp (–37%) and HP (–24%) more than offset strong performances by KLA (+61%) and Universal Display (+43%). And within health care, weakness in Alkermes
4
(–54%), Biogen (–34%), and BioMarin (–30%) outpaced a broader plunge in the biotech space.
Sector allocation also detracted from relative performance, driven primarily by the fund’s varied positioning within the four defensive-oriented sectors. The portfolio had negligible exposure to the three outperforming defensive sectors (consumer staples, utilities, and real estate) and a significant overweight position in the single underperforming defensive sector (health care). This collective headwind proved significant, more than offsetting the benefit from the portfolio’s energy underweight.
As of September 30, 2019, the fund’s top 10 holdings made up 29% of assets.
Advisor perspectives
We routinely discuss portfolio positioning within the framework of the S&P 500 Index sectors. For instance, our overweight sector allocations for some time have included information technology, health care, and industrials. We also occasionally discuss portfolio structure more thematically. For example, we highlight our preference for “mind”—technology, innovation, and the like—over “matter”—commodities and other real assets.
Another way to frame our exposures is via high-level categories such as defensive, growth/cyclical, and commodity-linked stocks. For instance, our aggregate portfolio weighting in the defensive bucket is comparable to that of the S&P 500 Index, but as previously noted, our actual underlying ownership is heavily skewed toward health care.
We believe our portfolio has credible defensive qualities, even if achieved in unorthodox fashion, and we prefer pharmaceutical and biotech companies—and, in particular, the unsung potential of novel drugs—to businesses tied to food and other staples. Following its underperformance, the health care sector traded at a far more attractive absolute and relative valuation at the end of the 12 months (14.4 times forward P/E, compared with its 16.2 times 20-year average) than its defensive sector peers, including consumer staples (19.9 times, compared with 16.8 times) and utilities (20.1 times, compared with 14.4 times).
In the growth/cyclical and commodity-linked buckets, the story is similar: comparable exposure at the aggregate level, but significant differentiation beneath the surface. Within growth/ cyclical, which houses our information technology overweight position, our ownership of FAANG (Facebook, Apple, Amazon, Netflix, and Google/Alphabet) stocks, the market’s putative technology leaders, has materially lagged their market weighting. We instead own semiconductor and other technology hardware and software companies with secular (and cyclical) growth trajectories at a valuation discount to the typical FAANG premium.
5
And in the commodity-linked sectors (energy, materials, and industrials), our slight overweight posture is especially superficial, as our ownership—principally, commodity-consuming companies—stands in direct contrast to the bucket’s pro-commodity bias. Avoiding the commodity producers has generally served us well in recent years. That said, the fund has derived no obvious benefit from its substantial exposure to cheaper commodities on the cost side of the ledger. Within industrials, for instance, our airlines ownership underperformed the market despite solid fundamentals amid a decline in crude oil prices; we continue to see exceptional value in this industry.
Conclusion
Regardless of the framing, a differentiated portfolio guarantees only divergence, not outperformance. The fund’s disappointing year reaffirms this basic truth, with weak stock selection serving as the primary culprit for our underperformance. Many of the fund’s idiosyncratic bottom-up features directly contributed to these poor relative results. A confluence of nonmarket considerations has recently plagued our drug-centric defensives (health care reform rhetoric) and our growth-oriented cyclicals (the U.S.-China imbroglio). We are optimistic that our portfolio—and the company-specific trajectories therein—features an attractive combination of secular growth and reasonable valuations, and we are hopeful it will outperform in the years ahead.
PRIMECAP Management Company
October 15, 2019
6
About Your Fund’s Expenses
As a shareholder of the fund, you incur ongoing costs, which include costs for portfolio management, administrative services, and shareholder reports (like this one), among others. Operating expenses, which are deducted from a fund’s gross income, directly reduce the investment return of the fund.
A fund’s expenses are expressed as a percentage of its average net assets. This figure is known as the expense ratio. The following examples are intended to help you understand the ongoing costs (in dollars) of investing in your fund and to compare these costs with those of other mutual funds. The examples are based on an investment of $1,000 made at the beginning of the period shown and held for the entire period.
The accompanying table illustrates your fund’s costs in two ways:
· Based on actual fund return. This section helps you to estimate the actual expenses that you paid over the period. The “Ending Account Value” shown is derived from the fund’s actual return, and the third column shows the dollar amount that would have been paid by an investor who started with $1,000 in the fund. You may use the information here, together with the amount you invested, to estimate the expenses that you paid over the period.
To do so, simply divide your account value by $1,000 (for example, an $8,600 account value divided by $1,000 = 8.6), then multiply the result by the number given for your fund under the heading “Expenses Paid During Period.”
· Based on hypothetical 5% yearly return. This section is intended to help you compare your fund’s costs with those of other mutual funds. It assumes that the fund had a yearly return of 5% before expenses, but that the expense ratio is unchanged. In this case—because the return used is not the fund’s actual return—the results do not apply to your investment. The example is useful in making comparisons because the Securities and Exchange Commission requires all mutual funds to calculate expenses based on a 5% return. You can assess your fund’s costs by comparing this hypothetical example with the hypothetical examples that appear in shareholder reports of other funds.
Note that the expenses shown in the table are meant to highlight and help you compare ongoing costs only and do not reflect transaction costs incurred by the fund for buying and selling securities. Further, the expenses do not include any purchase, redemption, or account service fees described in the fund prospectus. If such fees were applied to your account, your costs would be higher. Your fund does not carry a “sales load.”
The calculations assume no shares were bought or sold during the period. Your actual costs may have been higher or lower, depending on the amount of your investment and the timing of any purchases or redemptions.
You can find more information about the fund’s expenses, including annual expense ratios, in the Financial Statements section of this report. For additional information on operating expenses and other shareholder costs, please refer to your fund’s current prospectus.
7
Six Months Ended September 30, 2019 | | | |
| Beginning | Ending | Expenses |
| Account Value | Account Value | Paid During |
Capital Opportunity Fund | 3/31/2019 | 9/30/2019 | Period |
Based on Actual Fund Return | | | |
Investor Shares | $1,000.00 | $1,000.47 | $2.16 |
Admiral™ Shares | 1,000.00 | 1,000.81 | 1.81 |
Based on Hypothetical 5% Yearly Return | | | |
Investor Shares | $1,000.00 | $1,022.91 | $2.18 |
Admiral Shares | 1,000.00 | 1,023.26 | 1.83 |
The calculations are based on expenses incurred in the most recent six-month period. The fund’s annualized six-month expense ratios for that period are 0.43% for Investor Shares and 0.36% for Admiral Shares. The dollar amounts shown as “Expenses Paid” are equal to the annualized expense ratio multiplied by the average account value over the period, multiplied by the number of days in the most recent six-month period, then divided by the number of days in the most recent 12-month period (183/365).
8
Capital Opportunity Fund
Performance Summary
All of the returns in this report represent past performance, which is not a guarantee of future results that may be achieved by the fund. (Current performance may be lower or higher than the performance data cited. For performance data current to the most recent month-end, visit our website at vanguard.com/performance.) Note, too, that both investment returns and principal value can fluctuate widely, so an investor’s shares, when sold, could be worth more or less than their original cost. The returns shown do not reflect taxes that a shareholder would pay on fund distributions or on the sale of fund shares.
Cumulative Performance: September 30, 2009, Through September 30, 2019
Initial Investment of $10,000

| Average Annual Total Returns | |
| Periods Ended September 30, 2019 | |
| | | | Final Value |
| One | Five | Ten | of a $10,000 |
| Year | Years | Years | Investment |

| Capital Opportunity Fund Investor Shares | -5.01% | 11.12% | 13.70% | $36,108 |

| Russell Midcap Growth Index | 5.20 | 11.12 | 14.08 | 37,337 |

| Dow Jones U.S. Total Stock Market Float Adjusted Index | 2.81 | 10.40 | 13.09 | 34,207 |
| | | | |
| | | | Final Value |
| One | Five | Ten | of a $50,000 |
| Year | Years | Years | Investment |
Capital Opportunity Fund Admiral Shares | -4.95% | 11.20% | 13.78% | $181,783 |
Russell Midcap Growth Index | 5.20 | 11.12 | 14.08 | 186,685 |
Dow Jones U.S. Total Stock Market Float Adjusted Index | 2.81 | 10.40 | 13.09 | 171,034 |
See Financial Highlights for dividend and capital gains information.
9
Capital Opportunity Fund
Sector Diversification
As of September 30, 2019
Communication Services | | 4.1 | % |
Consumer Discretionary | | 10.8 | |
Energy | | 1.8 | |
Financials | | 7.5 | |
Health Care | | 28.2 | |
Industrials | | 17.9 | |
Information Technology | | 29.7 | |
Materials | | 0.0 | |
The table reflects the fund’s equity exposure, based on its investments in stocks. Any holdings in short-term reserves are excluded. Sector categories are based on the Global Industry Classification Standard (“GICS”), except for the “Other” category (if applicable), which includes securities that have not been provided a GICS classification as of the effective reporting period.
The Global Industry Classification Standard (“GICS”) was developed by and is the exclusive property and a service mark of MSCI Inc. (“MSCI”) and Standard and Poor’s, a division of McGraw-Hill Companies, Inc. (“S&P”), and is licensed for use by Vanguard. Neither MSCI, S&P nor any third party involved in making or compiling the GICS or any GICS classification makes any express or implied warranties or representations with respect to such standard or classification (or the results to be obtained by the use thereof), and all such parties hereby expressly disclaim all warranties of originality, accuracy, completeness, merchantability or fitness for a particular purpose with respect to any such standard or classification. Without limiting any of the foregoing, in no event shall MSCI, S&P, any of its affiliates or any third party involved in making or compiling the GICS or any GICS classification have any liability for any direct, indirect, special, punitive, consequential or any other damages (including lost profits) even if notified of the possibility of such damages.
10
Capital Opportunity Fund
Financial Statements
Statement of Net Assets
As of September 30, 2019
The fund files its complete schedule of portfolio holdings with the Securities and Exchange Commission (SEC) for the first and third quarters of each fiscal year as an exhibit to its reports on Form N-PORT. The fund’s Form N-PORT reports are available on the SEC’s website at www.sec.gov.
| | | | Market |
| | | | Value• |
| | Shares | | ($000) |
Common Stocks (96.4%) | | | |
Communication Services (3.9%) | | | |
* | Alphabet Inc. Class C | 236,548 | | 288,352 |
* | Alphabet Inc. Class A | 233,970 | | 285,710 |
* | Electronic Arts Inc. | 400,000 | | 39,128 |
* | Facebook Inc. Class A | 128,400 | | 22,865 |
| Walt Disney Co. | 36,700 | | 4,783 |
* | Sprint Corp. | 215,800 | | 1,332 |
* | Lions Gate Entertainment Corp. Class A | 67,300 | | 623 |
* | Lions Gate Entertainment Corp. Class B | 67,900 | | 593 |
| | | | 643,386 |
Consumer Discretionary (10.4%) | | | |
* | Alibaba Group Holding Ltd. ADR | 2,070,500 | | 346,250 |
* | CarMax Inc. | 2,706,197 | | 238,145 |
| TJX Cos. Inc. | 3,150,000 | | 175,581 |
| Royal Caribbean Cruises Ltd. | 1,473,200 | | 159,592 |
| Carnival Corp. | 3,366,700 | | 147,158 |
* | Amazon.com Inc. | 79,870 | | 138,647 |
*,^ | Tesla Inc. | 486,766 | | 117,247 |
| Sony Corp. ADR | 1,602,300 | | 94,744 |
* | Norwegian Cruise Line Holdings Ltd. | 1,290,200 | | 66,794 |
* | Capri Holdings Ltd. | 1,230,600 | | 40,807 |
| Ross Stores Inc. | 254,200 | | 27,924 |
| eBay Inc. | 665,600 | | 25,945 |
| Gildan Activewear Inc. Class A | 600,000 | | 21,300 |
| Las Vegas Sands Corp. | 328,000 | | 18,945 |
* | Ulta Beauty Inc. | 68,700 | | 17,220 |
| Marriott International Inc. Class A | 131,300 | | 16,330 |
| L Brands Inc. | 575,000 | | 11,264 |
| Newell Brands Inc. | 458,500 | | 8,583 |
| Whirlpool Corp. | 52,200 | | 8,266 |
| Hilton Worldwide Holdings Inc. | 76,333 | | 7,107 |
| Restaurant Brands International Inc. | 88,500 | | 6,296 |
| Lowe’s Cos. Inc. | 37,800 | | 4,156 |
* | Burlington Stores Inc. | 1,950 | | 390 |
* | AutoZone Inc. | 220 | | 239 |
* | Five Below Inc. | 1,600 | | 202 |
| | | | 1,699,132 |
Energy (1.8%) | | | |
| Pioneer Natural Resources Co. | 1,045,673 | | 131,514 |
| Hess Corp. | 1,156,774 | | 69,962 |
* | Transocean Ltd. | 12,165,096 | | 54,378 |
| Cabot Oil & Gas Corp. | 1,260,550 | | 22,148 |
* | Southwestern Energy Co. | 3,500,000 | | 6,755 |
| TechnipFMC plc | 134,700 | | 3,252 |
| EOG Resources Inc. | 2,400 | | 178 |
| | | | 288,187 |
Financials (7.2%) | | | |
| Wells Fargo & Co. | 3,560,500 | | 179,592 |
| E*TRADE Financial Corp. | 3,967,629 | | 173,346 |
| Bank of America Corp. | 5,286,817 | | 154,217 |
| Northern Trust Corp. | 1,648,551 | | 153,843 |
| Charles Schwab Corp. | 3,296,900 | | 137,909 |
| Discover Financial Services | 1,461,688 | | 118,528 |
| JPMorgan Chase & Co. | 817,836 | | 96,251 |
| Raymond James Financial Inc. | 755,700 | | 62,315 |
| CME Group Inc. | 169,954 | | 35,918 |
| Progressive Corp. | 320,000 | | 24,720 |
| Citigroup Inc. | 330,000 | | 22,796 |
| Cboe Global Markets Inc. | 156,900 | | 18,029 |
| | | | 1,177,464 |
Health Care (27.2%) | | | |
| Eli Lilly & Co. | 5,358,742 | | 599,268 |
| Amgen Inc. | 2,544,999 | | 492,483 |
* | Biogen Inc. | 2,067,850 | | 481,437 |
* | BioMarin Pharmaceutical Inc. | 5,001,030 | | 337,069 |
| Novartis AG ADR | 3,366,500 | | 292,549 |
* | Boston Scientific Corp. | 5,854,076 | | 238,202 |
* | Seattle Genetics Inc. | 2,692,900 | | 229,974 |
11
Capital Opportunity Fund
| | | | Market |
| | | | Value• |
| | Shares | | ($000) |
* | QIAGEN NV | 6,921,300 | | 228,195 |
| Roche Holding AG | 669,034 | | 194,799 |
| Bristol-Myers Squibb Co. | 3,551,830 | | 180,113 |
| Thermo Fisher Scientific Inc. | 551,964 | | 160,770 |
* | Illumina Inc. | 431,200 | | 131,180 |
* | Alkermes plc | 6,238,535 | | 121,714 |
* | Edwards Lifesciences Corp. | 535,000 | | 117,652 |
| AstraZeneca plc ADR | 2,247,400 | | 100,167 |
* | Elanco Animal Health Inc. | 3,350,158 | | 89,081 |
| Abbott Laboratories | 965,400 | | 80,775 |
| PerkinElmer Inc. | 888,700 | | 75,691 |
| Zimmer Biomet Holdings Inc. | 448,400 | | 61,552 |
| Medtronic plc | 477,000 | | 51,812 |
* | Charles River Laboratories International Inc. | 346,000 | | 45,800 |
* | Alcon Inc. | 628,840 | | 36,655 |
* | Waters Corp. | 111,000 | | 24,778 |
* | BeiGene Ltd. | 2,366,000 | | 22,737 |
| Agilent Technologies Inc. | 215,000 | | 16,475 |
* | BeiGene Ltd. ADR | 119,171 | | 14,594 |
1 | Siemens Healthineers AG | 136,900 | | 5,383 |
* | ImmunoGen Inc. | 810,800 | | 1,962 |
| Cerner Corp. | 9,400 | | 641 |
| | | | 4,433,508 |
Industrials (17.3%) | | | |
| Southwest Airlines Co. | 9,741,300 | | 526,128 |
* | United Airlines Holdings Inc. | 5,290,013 | | 467,690 |
| FedEx Corp. | 2,059,374 | | 299,783 |
| Airbus SE | 2,219,400 | | 288,142 |
| Delta Air Lines Inc. | 4,017,300 | | 231,396 |
| American Airlines Group Inc. | 7,211,800 | | 194,502 |
| Jacobs Engineering Group Inc. | 2,095,919 | | 191,777 |
* | AECOM | 4,440,430 | | 166,782 |
* | JetBlue Airways Corp. | 6,708,250 | | 112,363 |
| Caterpillar Inc. | 528,600 | | 66,767 |
| TransDigm Group Inc. | 87,569 | | 45,595 |
| Curtiss-Wright Corp. | 335,000 | | 43,339 |
| IDEX Corp. | 225,000 | | 36,873 |
| Textron Inc. | 661,000 | | 32,363 |
| Old Dominion Freight Line Inc. | 131,600 | | 22,368 |
| United Technologies Corp. | 136,600 | | 18,649 |
* | Ryanair Holdings plc ADR | 262,800 | | 17,445 |
| Boeing Co. | 43,750 | | 16,646 |
* | Lyft Inc. Class A | 369,600 | | 15,094 |
| Spirit AeroSystems Holdings Inc. Class A | 139,600 | | 11,481 |
| Rockwell Automation Inc. | 42,600 | | 7,020 |
| | | | 2,812,203 |
Information Technology (28.6%) | | | |
| Texas Instruments Inc. | 3,222,550 | | 416,482 |
* | Adobe Inc. | 1,456,300 | | 402,303 |
| Microsoft Corp. | 2,792,200 | | 388,200 |
| NetApp Inc. | 5,685,800 | | 298,561 |
* | Micron Technology Inc. | 6,287,200 | | 269,407 |
* | Splunk Inc. | 2,176,400 | | 256,511 |
| QUALCOMM Inc. | 2,891,790 | | 220,586 |
* | Flex Ltd. | 19,096,402 | | 199,844 |
| KLA Corp. | 1,208,100 | | 192,632 |
* | Trimble Inc. | 4,571,900 | | 177,435 |
| Universal Display Corp. | 1,040,564 | | 174,711 |
* | Cree Inc. | 3,392,800 | | 166,247 |
| Corning Inc. | 5,826,974 | | 166,185 |
| ASML Holding NV | 668,900 | | 166,168 |
* | Descartes Systems Group Inc. | 4,120,721 | | 166,106 |
| Visa Inc. Class A | 650,000 | | 111,807 |
| NVIDIA Corp. | 490,100 | | 85,312 |
| Entegris Inc. | 1,639,300 | | 77,145 |
| VMware Inc. Class A | 491,500 | | 73,754 |
| Intuit Inc. | 205,000 | | 54,518 |
| Hewlett Packard Enterprise Co. | 3,262,565 | | 49,493 |
* | PayPal Holdings Inc. | 465,000 | | 48,169 |
* | FormFactor Inc. | 2,565,941 | | 47,842 |
* | BlackBerry Ltd. | 8,562,376 | | 44,952 |
| HP Inc. | 2,357,200 | | 44,598 |
| Jabil Inc. | 1,210,000 | | 43,282 |
* | Keysight Technologies Inc. | 436,000 | | 42,401 |
| Teradyne Inc. | 695,000 | | 40,247 |
* | Nuance Communications Inc. | 2,254,000 | | 36,763 |
| Telefonaktiebolaget LM Ericsson ADR | 4,305,700 | | 34,359 |
| Apple Inc. | 140,800 | | 31,535 |
| Plantronics Inc. | 718,200 | | 26,803 |
^ | Nokia Oyj ADR | 4,026,000 | | 20,372 |
* | salesforce.com Inc. | 132,300 | | 19,639 |
| Intel Corp. | 290,000 | | 14,944 |
| Western Digital Corp. | 196,000 | | 11,689 |
* | Palo Alto Networks Inc. | 41,200 | | 8,398 |
* | Autodesk Inc. | 55,000 | | 8,124 |
| Analog Devices Inc. | 44,200 | | 4,938 |
12
Capital Opportunity Fund
| | | | Market |
| | | | Value• |
| | Shares | | ($000) |
| Micro Focus International plc ADR | 332,789 | | 4,709 |
* | Dell Technologies Inc. | 74,509 | | 3,864 |
| Oracle Corp. | 62,500 | | 3,439 |
| DXC Technology Co. | 72,200 | | 2,130 |
| Applied Materials Inc. | 10,700 | | 534 |
* | Arista Networks Inc. | 1,100 | | 263 |
| | | | 4,657,401 |
Materials (0.0%) | | | |
| Albemarle Corp. | 400 | | 28 |
Total Common Stocks | | | |
(Cost $7,418,312) | | | 15,711,309 |
Temporary Cash Investment (4.2%) | | | |
Money Market Fund (4.2%) | | | |
2,3 | Vanguard Market Liquidity Fund, 2.098% | | | |
| (Cost $688,673) | 6,886,790 | | 688,748 |
Total Investments (100.6%) | | | |
(Cost $8,106,985) | | | 16,400,057 |
| | | | | | | | |
| Amount |
| ($000) |
Other Assets and Liabilities (-0.6%) | |
Other Assets | |
Investment in Vanguard | 773 |
Receivables for Investment Securities Sold | 8,150 |
Receivables for Accrued Income | 14,733 |
Receivables for Capital Shares Issued | 1,991 |
Total Other Assets | 25,647 |
Liabilities | |
Payables for Investment Securities Purchased | (1,573) |
Collateral for Securities on Loan | (94,159) |
Payables for Investment Advisor | (9,772) |
Payables for Capital Shares Redeemed | (8,265) |
Payables to Vanguard | (9,563) |
Total Liabilities | (123,332) |
Net Assets (100%) | 16,302,372 |
At September 30, 2019, net assets consisted of: |
| Amount |
| ($000) |
Paid-in Capital | 6,997,403 |
Total Distributable Earnings (Loss) | 9,304,969 |
Net Assets | 16,302,372 |
| |
Investor Shares—Net Assets | |
Applicable to 26,161,038 outstanding $.001 par value shares of beneficial interest (unlimited authorization) | 1,684,307 |
Net Asset Value Per Share—Investor Shares | $64.38 |
| |
Admiral Shares—Net Assets | |
Applicable to 98,285,132 outstanding $.001 par value shares of beneficial interest (unlimited authorization) | 14,618,065 |
Net Asset Value Per Share—Admiral Shares | $148.73 |
· | See Note A in Notes to Financial Statements. |
* | Non-income-producing security. |
^ | Includes partial security positions on loan to broker-dealers. The total value of securities on loan is $90,438,000. |
1 | Security exempt from registration under Rule 144A of the Securities Act of 1933. Such securities may be sold in transactions exempt from registration, normally to qualified institutional buyers. At September 30, 2019, the value of this security represented 0.0% of net assets. |
2 | Affiliated money market fund available only to Vanguard funds and certain trusts and accounts managed by Vanguard. Rate shown is the 7-day yield. |
3 | Collateral of $94,159,000 was received for securities on loan. |
| ADR—American Depositary Receipt. |
See accompanying Notes, which are an integral part of the Financial Statements.
13
Capital Opportunity Fund
Statement of Operations
| Year Ended |
| September 30, 2019 |
| ($000) |
Investment Income | |
Income | |
Dividends—Unaffiliated Issuers1 | 199,936 |
Interest—Affiliated Issuers | 11,573 |
Securities Lending—Net | 2,137 |
Total Income | 213,646 |
Expenses | |
Investment Advisory Fees—Note B | 39,148 |
The Vanguard Group—Note C | |
Management and Administrative—Investor Shares | 3,298 |
Management and Administrative—Admiral Shares | 18,606 |
Marketing and Distribution—Investor Shares | 169 |
Marketing and Distribution—Admiral Shares | 490 |
Custodian Fees | 208 |
Auditing Fees | 31 |
Shareholders’ Reports—Investor Shares | 23 |
Shareholders’ Reports—Admiral Shares | 51 |
Trustees’ Fees and Expenses | 17 |
Total Expenses | 62,041 |
Net Investment Income | 151,605 |
Realized Net Gain (Loss) | |
Investment Securities Sold—Unaffiliated Issuers | 1,009,769 |
Investment Securities Sold—Affiliated Issuers | 3,320 |
Foreign Currencies | (111) |
Realized Net Gain (Loss) | 1,012,978 |
Change in Unrealized Appreciation (Depreciation) | |
Investment Securities—Unaffiliated Issuers | (2,138,060) |
Investment Securities—Affiliated Issuers | 23,754 |
Foreign Currencies | (60) |
Change in Unrealized Appreciation (Depreciation) | (2,114,366) |
Net Increase (Decrease) in Net Assets Resulting from Operations | (949,783) |
1 Dividends are net of foreign withholding taxes of $3,657,000.
See accompanying Notes, which are an integral part of the Financial Statements.
14
Capital Opportunity Fund
Statement of Changes in Net Assets
| Year Ended September 30, |
| 2019 | 2018 |
| ($000) | ($000) |
Increase (Decrease) in Net Assets | | |
Operations | | |
Net Investment Income | 151,605 | 115,333 |
Realized Net Gain (Loss) | 1,012,978 | 1,580,910 |
Change in Unrealized Appreciation (Depreciation) | (2,114,366) | 1,568,343 |
Net Increase (Decrease) in Net Assets Resulting from Operations | (949,783) | 3,264,586 |
Distributions | | |
Net Investment Income | | |
Investor Shares | (12,069) | (13,842) |
Admiral Shares | (115,544) | (92,824) |
Realized Capital Gain1 | | |
Investor Shares | (164,478) | (79,440) |
Admiral Shares | (1,388,254) | (536,203) |
Total Distributions | (1,680,345) | (722,309) |
Capital Share Transactions | | |
Investor Shares | (95,511) | (426,473) |
Admiral Shares | 591,538 | 518,196 |
Net Increase (Decrease) from Capital Share Transactions | 496,027 | 91,723 |
Total Increase (Decrease) | (2,134,101) | 2,634,000 |
Net Assets | | |
Beginning of Period | 18,436,473 | 15,802,473 |
End of Period | 16,302,372 | 18,436,473 |
1 Includes fiscal 2019 and 2018 short-term gain distributions totaling $47,662,000 and $16,130,000, respectively. Short-term gain distributions are treated as ordinary income dividends for tax purposes.
See accompanying Notes, which are an integral part of the Financial Statements.
15
Capital Opportunity Fund
Financial Highlights
Investor Shares
For a Share Outstanding | | | Year Ended September 30, | |
Throughout Each Period | 2019 | 2018 | 2017 | 2016 | 2015 | |
Net Asset Value, Beginning of Period | $75.87 | $65.51 | $54.99 | $50.25 | $51.42 | |
Investment Operations | | | | | | |
Net Investment Income | .5491 | .4281 | .4291 | .375 | .349 | |
Net Realized and Unrealized Gain (Loss) on Investments | (5.116) | 12.957 | 13.136 | 7.090 | .666 | |
Total from Investment Operations | (4.567) | 13.385 | 13.565 | 7.465 | 1.015 | |
Distributions | | | | | | |
Dividends from Net Investment Income | (.473) | (.449) | (.370) | (.299) | (.308) | |
Distributions from Realized Capital Gains | (6.450) | (2.576) | (2.675) | (2.426) | (1.877) | |
Total Distributions | (6.923) | (3.025) | (3.045) | (2.725) | (2.185) | |
Net Asset Value, End of Period | $64.38 | $75.87 | $65.51 | $54.99 | $50.25 | |
| | | | | | |
Total Return2 | -5.01% | 21.03% | 25.77% | 15.20% | 1.72% | |
| | | | | | |
Ratios/Supplemental Data | | | | | | |
Net Assets, End of Period (Millions) | $1,684 | $2,065 | $2,182 | $2,134 | $2,283 | |
Ratio of Total Expenses to Average Net Assets | 0.44% | 0.43% | 0.44% | 0.45% | 0.45% | |
Ratio of Net Investment Income to Average Net Assets | 0.84% | 0.62% | 0.73% | 0.73% | 0.65% | |
Portfolio Turnover Rate | 6% | 10% | 9% | 6% | 7% | |
1 Calculated based on average shares outstanding.
2 Total returns do not include account service fees that may have applied in the periods shown. Fund prospectuses provide information about any applicable account service fees.
See accompanying Notes, which are an integral part of the Financial Statements.
16
Capital Opportunity Fund
Financial Highlights
Admiral Shares
For a Share Outstanding | | | Year Ended September 30, | |
Throughout Each Period | 2019 | 2018 | 2017 | 2016 | 2015 | |
Net Asset Value, Beginning of Period | $175.34 | $151.28 | $127.00 | $116.06 | $118.79 | |
Investment Operations | | | | | | |
Net Investment Income | 1.3741 | 1.1031 | 1.0841 | .965 | .916 | |
Net Realized and Unrealized Gain (Loss) on Investments | (11.834) | 29.937 | 30.333 | 16.366 | 1.504 | |
Total from Investment Operations | (10.460) | 31.040 | 31.417 | 17.331 | 2.420 | |
Distributions | | | | | | |
Dividends from Net Investment Income | (1.241) | (1.030) | (.962) | (.791) | (.816) | |
Distributions from Realized Capital Gains | (14.909) | (5.950) | (6.175) | (5.600) | (4.334) | |
Total Distributions | (16.150) | (6.980) | (7.137) | (6.391) | (5.150) | |
Net Asset Value, End of Period | $148.73 | $175.34 | $151.28 | $127.00 | $116.06 | |
| | | | | | |
Total Return2 | -4.95% | 21.12% | 25.86% | 15.28% | 1.78% | |
| | | | | | |
Ratios/Supplemental Data | | | | | | |
Net Assets, End of Period (Millions) | $14,618 | $16,372 | $13,621 | $11,593 | $10,579 | |
Ratio of Total Expenses to Average Net Assets | 0.37% | 0.36% | 0.37% | 0.38% | 0.38% | |
Ratio of Net Investment Income to Average Net Assets | 0.91% | 0.69% | 0.80% | 0.80% | 0.72% | |
Portfolio Turnover Rate | 6% | 10% | 9% | 6% | 7% | |
1 Calculated based on average shares outstanding.
2 Total returns do not include account service fees that may have applied in the periods shown. Fund prospectuses provide information about any applicable account service fees.
See accompanying Notes, which are an integral part of the Financial Statements.
17
Capital Opportunity Fund
Notes to Financial Statements
Vanguard Capital Opportunity Fund is registered under the Investment Company Act of 1940 as an open-end investment company, or mutual fund. The fund offers two classes of shares: Investor Shares and Admiral Shares. Each of the share classes has different eligibility and minimum purchase requirements, and is designed for different types of investors.
A. The following significant accounting policies conform to generally accepted accounting principles for U.S. investment companies. The fund consistently follows such policies in preparing its financial statements.
1. Security Valuation: Securities are valued as of the close of trading on the New York Stock Exchange (generally 4 p.m., Eastern time) on the valuation date. Equity securities are valued at the latest quoted sales prices or official closing prices taken from the primary market in which each security trades; such securities not traded on the valuation date are valued at the mean of the latest quoted bid and asked prices. Securities for which market quotations are not readily available, or whose values have been affected by events occurring before the fund’s pricing time but after the close of the securities’ primary markets, are valued at their fair values calculated according to procedures adopted by the board of trustees. These procedures include obtaining quotations from an independent pricing service, monitoring news to identify significant market- or security-specific events, and evaluating changes in the values of foreign market proxies (for example, ADRs, futures contracts, or exchange-traded funds), between the time the foreign markets close and the fund’s pricing time. When fair-value pricing is employed, the prices of securities used by a fund to calculate its net asset value may differ from quoted or published prices for the same securities. Investments in Vanguard Market Liquidity Fund are valued at that fund’s net asset value.
2. Foreign Currency: Securities and other assets and liabilities denominated in foreign currencies are translated into U.S. dollars using exchange rates obtained from an independent third party as of the fund’s pricing time on the valuation date. Realized gains (losses) and unrealized appreciation (depreciation) on investment securities include the effects of changes in exchange rates since the securities were purchased, combined with the effects of changes in security prices. Fluctuations in the value of other assets and liabilities resulting from changes in exchange rates are recorded as unrealized foreign currency gains (losses) until the assets or liabilities are settled in cash, at which time they are recorded as realized foreign currency gains (losses).
3. Federal Income Taxes: The fund intends to continue to qualify as a regulated investment company and distribute all of its taxable income. Management has analyzed the fund’s tax positions taken for all open federal income tax years (September 30, 2016–2019), and has concluded that no provision for federal income tax is required in the fund’s financial statements.
4. Distributions: Distributions to shareholders are recorded on the ex-dividend date. Distributions are determined on a tax basis and may differ from net investment income and realized capital gains for financial reporting purposes.
5. Securities Lending: To earn additional income, the fund lends its securities to qualified institutional borrowers. Security loans are subject to termination by the fund at any time, and are required to be secured at all times by collateral in an amount at least equal to the market value of securities loaned. Daily market fluctuations could cause the value of loaned securities to be more or less than the value of the collateral received. When this occurs, the collateral is adjusted and
18
Capital Opportunity Fund
settled before the opening of the market on the next business day. The fund further mitigates its counterparty risk by entering into securities lending transactions only with a diverse group of prequalified counterparties, monitoring their financial strength, and entering into master securities lending agreements with its counterparties. The master securities lending agreements provide that, in the event of a counterparty’s default (including bankruptcy), the fund may terminate any loans with that borrower, determine the net amount owed, and sell or retain the collateral up to the net amount owed to the fund; however, such actions may be subject to legal proceedings. While collateral mitigates counterparty risk, in the event of a default, the fund may experience delays and costs in recovering the securities loaned. The fund invests cash collateral received in Vanguard Market Liquidity Fund, and records a liability in the Statement of Net Assets for the return of the collateral, during the period the securities are on loan. Securities lending income represents fees charged to borrowers plus income earned on invested cash collateral, less expenses associated with the loan. During the term of the loan, the fund is entitled to all distributions made on or in respect of the loaned securities.
6. Credit Facility: The fund and certain other funds managed by The Vanguard Group (“Vanguard”) participate in a $4.3 billion committed credit facility provided by a syndicate of lenders pursuant to a credit agreement that may be renewed annually; each fund is individually liable for its borrowings, if any, under the credit facility. Borrowings may be utilized for temporary and emergency purposes, and are subject to the fund’s regulatory and contractual borrowing restrictions. The participating funds are charged administrative fees and an annual commitment fee of 0.10% of the undrawn amount of the facility; these fees are allocated to the funds based on a method approved by the fund’s board of trustees and included in Management and Administrative expenses on the fund’s Statement of Operations. Any borrowings under this facility bear interest at a rate based upon the higher of the one-month London Interbank Offered Rate, federal funds effective rate, or overnight bank funding rate plus an agreed-upon spread.
The fund had no borrowings outstanding at September 30, 2019, or at any time during the period then ended.
7. Other: Dividend income is recorded on the ex-dividend date. Interest income includes income distributions received from Vanguard Market Liquidity Fund and is accrued daily. Security transactions are accounted for on the date securities are bought or sold. Costs used to determine realized gains (losses) on the sale of investment securities are those of the specific securities sold.
Each class of shares has equal rights as to assets and earnings, except that each class separately bears certain class-specific expenses related to maintenance of shareholder accounts (included in Management and Administrative expenses) and shareholder reporting. Marketing and distribution expenses are allocated to each class of shares based on a method approved by the board of trustees. Income, other non-class-specific expenses, and gains and losses on investments are allocated to each class of shares based on its relative net assets.
B. PRIMECAP Management Company provides investment advisory services to the fund for a fee calculated at an annual percentage rate of average net assets. For the year ended September 30, 2019, the investment advisory fee represented an effective annual rate of 0.24% of the fund’s average net assets.
19
Capital Opportunity Fund
C. In accordance with the terms of a Funds’ Service Agreement (the “FSA”) between Vanguard and the fund, Vanguard furnishes to the fund corporate management, administrative, marketing, and distribution services at Vanguard’s cost of operations (as defined by the FSA). These costs of operations are allocated to the fund based on methods and guidelines approved by the board of trustees. Vanguard does not require reimbursement in the current period for certain costs of operations (such as deferred compensation/benefits and risk/insurance costs); the fund’s liability for these costs of operations is included in Payables to Vanguard on the Statement of Net Assets. All other costs of operations payable to Vanguard are generally settled twice a month.
Upon the request of Vanguard, the fund may invest up to 0.40% of its net assets as capital in Vanguard. At September 30, 2019, the fund had contributed to Vanguard capital in the amount of $773,000, representing less than 0.01% of the fund’s net assets and 0.31% of Vanguard’s capital received pursuant to the FSA. The fund’s trustees and officers are also directors and employees, respectively, of Vanguard.
D. Various inputs may be used to determine the value of the fund’s investments. These inputs are summarized in three broad levels for financial statement purposes. The inputs or methodologies used to value securities are not necessarily an indication of the risk associated with investing in those securities.
Level 1—Quoted prices in active markets for identical securities.
Level 2—Other significant observable inputs (including quoted prices for similar securities, interest rates, prepayment speeds, credit risk, etc.).
Level 3—Significant unobservable inputs (including the fund’s own assumptions used to determine the fair value of investments). Any investments valued with significant unobservable inputs are noted on the Statement of Net Assets.
The following table summarizes the market value of the fund’s investments as of September 30, 2019, based on the inputs used to value them:
| Level 1 | Level 2 | Level 3 |
Investments | ($000) | ($000) | ($000) |
Common Stocks | 15,200,248 | 511,061 | — |
Temporary Cash Investments | 688,748 | — | — |
Total | 15,888,996 | 511,061 | — |
E. Permanent differences between book-basis and tax-basis components of net assets are reclassified among capital accounts in the financial statements to reflect their tax character. These reclassifications have no effect on net assets or net asset value per share. As of period end, permanent differences primarily attributable to the accounting for foreign currency transactions and distributions in connection with fund share redemptions were reclassified between the following accounts:
| Amount |
| ($000) |
Paid-in Capital | 49,526 |
Total Distributable Earnings (Loss) | (49,526) |
20
Capital Opportunity Fund
Temporary differences between book-basis and tax-basis components of total distributable earnings (loss) arise when certain items of income, gain, or loss are recognized in different periods for financial statement and tax purposes; these differences will reverse at some time in the future. The differences are primarily related to the tax deferral of losses on wash sales. As of period end, the tax-basis components of total distributable earnings (loss) are detailed in the table as follows:
| Amount |
| ($000) |
Undistributed Ordinary Income | 109,985 |
Undistributed Long-Term Gains | 910,440 |
Capital Loss Carryforwards (Non-expiring) | — |
Net Unrealized Gains (Losses) | 8,292,984 |
As of September 30, 2019, gross unrealized appreciation and depreciation for investments and derivatives based on cost for U.S. federal income tax purposes were as follows:
| Amount |
| ($000) |
Tax Cost | 8,106,985 |
Gross Unrealized Appreciation | 8,985,387 |
Gross Unrealized Depreciation | (692,315) |
Net Unrealized Appreciation (Depreciation) | 8,293,072 |
F. During the year ended September 30, 2019, the fund purchased $998,056,000 of investment securities and sold $2,008,016,000 of investment securities, other than temporary cash investments.
21
Capital Opportunity Fund
G. Capital share transactions for each class of shares were:
| | | | | | Year Ended September 30, | |
| | | | 2019 | | | | 2018 | |
| | Amount | | Shares | | Amount | | Shares | |
| | ($000 | ) | (000 | ) | ($000 | ) | (000 | ) |
Investor Shares | | | | | | | | | |
Issued | | 189,938 | | 2,962 | | 303,860 | | 4,350 | |
Issued in Lieu of Cash Distributions | | 165,096 | | 2,846 | | 87,895 | | 1,308 | |
Redeemed | | (450,545 | ) | (6,862 | ) | (818,228 | ) | (11,752 | ) |
Net Increase (Decrease)—Investor Shares | | (95,511 | ) | (1,054 | ) | (426,473 | ) | (6,094 | ) |
Admiral Shares | | | | | | | | | |
Issued | | 619,486 | | 4,131 | | 1,124,125 | | 6,979 | |
Issued in Lieu of Cash Distributions | | 1,350,319 | | 10,083 | | 566,776 | | 3,652 | |
Redeemed | | (1,378,267 | ) | (9,297 | ) | (1,172,705 | ) | (7,300 | ) |
Net Increase (Decrease)—Admiral Shares | | 591,538 | | 4,917 | | 518,196 | | 3,331 | |
H. Certain of the fund’s investments are in companies that are considered to be affiliated companies of the fund because the fund owns more than 5% of the outstanding voting securities of the company or the issuer is another member of The Vanguard Group. Transactions during the period in securities of these companies were as follows:
| | | | Current Period Transactions | | | |
| | Sept. 30, | | | | Proceeds | | Realized | | | | | | | | Sept. 30, | |
| | 2018 | | | | from | | Net | | Change in | | | | Capital Gain | | 2019 | |
| | Market | | Purchases | | Securities | | Gain | | Unrealized | | | | Distributions | | Market | |
| | Value | | at Cost | | Sold | | (Loss | ) | App. (Dep. | ) | Income | | Received | | Value | |
| | ($000 | ) | ($000 | ) | ($000 | ) | ($000 | ) | ($000 | ) | ($000 | ) | ($000 | ) | ($000 | ) |
Descartes Systems Group Inc. | | 144,356 | | — | | 5,215 | | 3,272 | | 23,693 | | — | | — | | NA1 | |
Vanguard Market Liquidity Fund | | 706,830 | | NA2 | | NA2 | | 48 | | 61 | | 11,573 | | — | | 688,748 | |
Total | | 851,186 | | | | | | 3,320 | | 23,754 | | 11,573 | | — | | 688,748 | |
1 Not applicable—at September 30, 2019, the issuer was not an affiliated company of the fund.
2 Not applicable—purchases and sales are for temporary cash investment purposes.
I. Management has determined that no events or transactions occurred subsequent to September 30, 2019, that would require recognition or disclosure in these financial statements.
22
Report of Independent Registered Public Accounting Firm
To the Board of Trustees of Vanguard Horizon Funds and Shareholders of Vanguard Capital Opportunity Fund
Opinion on the Financial Statements
We have audited the accompanying statement of net assets of Vanguard Capital Opportunity Fund (one of the funds constituting Vanguard Horizon Funds, referred to hereafter as the “Fund”) as of September 30, 2019, the related statement of operations for the year ended September 30, 2019, the statement of changes in net assets for each of the two years in the period ended September 30, 2019, including the related notes, and the financial highlights for each of the five years in the period ended September 30, 2019 (collectively referred to as the “financial statements”). In our opinion, the financial statements present fairly, in all material respects, the financial position of the Fund as of September 30, 2019, the results of its operations for the year then ended, the changes in its net assets for each of the two years in the period ended September 30, 2019 and the financial highlights for each of the five years in the period ended September 30, 2019 in conformity with accounting principles generally accepted in the United States of America.
Basis for Opinion
These financial statements are the responsibility of the Fund’s management. Our responsibility is to express an opinion on the Fund’s financial statements based on our audits. We are a public accounting firm registered with the Public Company Accounting Oversight Board (United States) (“PCAOB”) and are required to be independent with respect to the Fund in accordance with the U.S. federal securities laws and the applicable rules and regulations of the Securities and Exchange Commission and the PCAOB.
We conducted our audits of these financial statements in accordance with the standards of the PCAOB. Those standards require that we plan and perform the audit to obtain reasonable assurance about whether the financial statements are free of material misstatement, whether due to error or fraud.
Our audits included performing procedures to assess the risks of material misstatement of the financial statements, whether due to error or fraud, and performing procedures that respond to those risks. Such procedures included examining, on a test basis, evidence regarding the amounts and disclosures in the financial statements. Our audits also included evaluating the accounting principles used and significant estimates made by management, as well as evaluating the overall presentation of the financial statements. Our procedures included confirmation of securities owned as of September 30, 2019 by correspondence with the custodian and brokers and by agreement to the underlying ownership records of the transfer agent; when replies were not received from brokers, we performed other auditing procedures. We believe that our audits provide a reasonable basis for our opinion.
/s/PricewaterhouseCoopers LLP
Philadelphia, Pennsylvania
November 19, 2019
We have served as the auditor of one or more investment companies in The Vanguard Group of Funds since 1975.
23
Special 2019 tax information (unaudited) for Vanguard Capital Opportunity Fund
This information for the fiscal year ended September 30, 2019, is included pursuant to provisions of the Internal Revenue Code.
The fund distributed $1,547,762,000 as capital gain dividends (20% rate gain distributions) to shareholders during the fiscal year.
For nonresident alien shareholders, 100% of short-term capital gain dividends distributed by the fund are qualified short-term capital gains.
The fund distributed $175,282,000 of qualified dividend income to shareholders during the fiscal year.
For corporate shareholders, 100.0% of investment income (dividend income plus short-term gains, if any) qualifies for the dividends-received deduction.
24
This page intentionally left blank.
This page intentionally left blank.
The People Who Govern Your Fund
The trustees of your mutual fund are there to see that the fund is operated and managed in your best interests since, as a shareholder, you are a part owner of the fund. Your fund’s trustees also serve on the board of directors of The Vanguard Group, Inc., which is owned by the Vanguard funds and provides services to them.
A majority of Vanguard’s board members are independent, meaning that they have no affiliation with Vanguard or the funds they oversee, apart from the sizable personal investments they have made as private individuals. The independent board members have distinguished backgrounds in business, academia, and public service. Each of the trustees and executive officers oversees 212 Vanguard funds.
Information for each trustee and executive officer of the fund appears below. That information, as well as the Vanguard fund count, is as of the date on the cover of this fund report. The mailing address of the trustees and officers is P.O. Box 876, Valley Forge, PA 19482. More information about the trustees is in the Statement of Additional Information, which can be obtained, without charge, by contacting Vanguard at 800-662-7447, or online at vanguard.com.
Interested Trustee1
Mortimer J. Buckley
Born in 1969. Trustee since January 2018. Principal occupation(s) during the past five years and other experience: chairman of the board (January 2019–present) of Vanguard and of each of the investment companies served by Vanguard; chief executive officer (January 2018–present) of Vanguard; chief executive officer, president, and trustee (January 2018–present) of each of the investment companies served by Vanguard; president and director (2017–present) of Vanguard; and president (February 2018–present) of Vanguard Marketing Corporation. Chief investment officer (2013–2017), managing director (2002–2017), head of the Retail Investor Group (2006–2012), and chief information officer (2001–2006) of Vanguard. Chairman of the board (2011–2017) and trustee (2009–2017) of the Children’s Hospital of Philadelphia; trustee (2018–present) of The Shipley School.
Independent Trustees
Emerson U. Fullwood
Born in 1948. Trustee since January 2008. Principal occupation(s) during the past five years and other experience: executive chief staff and marketing officer for North America and corporate vice president (retired 2008) of Xerox Corporation (document management products and services). Former president of the Worldwide Channels Group, Latin America, and Worldwide Customer Service and executive chief staff officer of Developing Markets of Xerox. Executive in residence and 2009–2010 Distinguished Minett Professor at the Rochester Institute of Technology. Director of SPX FLOW, Inc. (multi-industry manufacturing). Director of the University of Rochester Medical Center, the Monroe Community College Foundation, the United Way of Rochester, North Carolina A&T University, and Roberts Wesleyan College. Trustee of the University of Rochester.
Amy Gutmann
Born in 1949. Trustee since June 2006. Principal occupation(s) during the past five years and other experience: president (2004–present) of the University of Pennsylvania. Christopher H. Browne Distinguished Professor of Political Science, School of Arts and Sciences, and professor of communication, Annenberg School for Communication, with secondary faculty appointments in the Department of Philosophy, School of Arts and Sciences, and at the Graduate School of Education, University of Pennsylvania. Trustee of the National Constitution Center.
F. Joseph Loughrey
Born in 1949. Trustee since October 2009. Principal occupation(s) during the past five years and other experience: president and chief operating officer (retired 2009) and vice chairman of the board (2008–2009) of Cummins Inc. (industrial machinery). Chairman of the board of Hillenbrand, Inc. (specialized consumer services), and the Lumina Foundation.
1 Mr. Buckley is considered an “interested person,” as defined in the Investment Company Act of 1940, because he is an officer of the Vanguard funds.
Director of the V Foundation and Oxfam America. Member of the advisory council for the College of Arts and Letters and chair of the advisory board to the Kellogg Institute for International Studies, both at the University of Notre Dame.
Mark Loughridge
Born in 1953. Trustee since March 2012. Principal occupation(s) during the past five years and other experience: senior vice president and chief financial officer (retired 2013) of IBM (information technology services). Fiduciary member of IBM’s Retirement Plan Committee (2004–2013), senior vice president and general manager (2002–2004) of IBM Global Financing, vice president and controller (1998–2002) of IBM, and a variety of other prior management roles at IBM. Member of the Council on Chicago Booth.
Scott C. Malpass
Born in 1962. Trustee since March 2012. Principal occupation(s) during the past five years and other experience: chief investment officer (1989–present) and vice president (1996–present) of the University of Notre Dame. Assistant professor of finance at the Mendoza College of Business, University of Notre Dame, and member of the Notre Dame 403(b) Investment Committee. Chairman of the board of TIFF Advisory Services, Inc. Member of the board of Catholic Investment Services, Inc. (investment advisors) and the board of superintendence of the Institute for the Works of Religion.
Deanna Mulligan
Born in 1963. Trustee since January 2018. Principal occupation(s) during the past five years and other experience: president (2010–present) and chief executive officer (2011–present) of The Guardian Life Insurance Company of America. Chief operating officer (2010–2011) and executive vice president (2008–2010) of Individual Life and Disability of The Guardian Life Insurance Company of America. Member of the board of The Guardian Life Insurance Company of America, the American Council of Life Insurers, the Partnership for New York City (business leadership), and the Committee Encouraging Corporate Philanthropy. Trustee of the Economic Club of New York and the Bruce Museum (arts and science). Member of the Advisory Council for the Stanford Graduate School of Business.
André F. Perold
Born in 1952. Trustee since December 2004. Principal occupation(s) during the past five years and other experience: George Gund Professor of Finance and Banking, Emeritus at the Harvard Business School (retired 2011). Chief investment officer and co-managing partner of HighVista Strategies LLC (private investment firm). Board of advisors and investment committee member of the Museum of Fine Arts Boston. Board member (2018–present) of RIT Capital Partners (investment firm); investment committee member of Partners Health Care System.
Sarah Bloom Raskin
Born in 1961. Trustee since January 2018. Principal occupation(s) during the past five years and other experience: deputy secretary (2014–2017) of the United States Department of the Treasury. Governor (2010–2014) of the Federal Reserve Board. Commissioner (2007–2010) of financial regulation for the State of Maryland. Member of the board of directors (2012–2014) of Neighborhood Reinvestment Corporation. Director (2017–present) of i(x) Investments, LLC; director (2017–present) of Reserve Trust. Rubinstein Fellow (2017–present) of Duke University; trustee (2017–present) of Amherst College.
Peter F. Volanakis
Born in 1955. Trustee since July 2009. Principal occupation(s) during the past five years and other experience: president and chief operating officer (retired 2010) of Corning Incorporated (communications equipment) and director of Corning Incorporated (2000–2010) and Dow Corning (2001–2010). Director (2012) of SPX Corporation (multi-industry manufacturing). Overseer of the Amos Tuck School of Business Administration, Dartmouth College (2001–2013). Chairman of the board of trustees of Colby-Sawyer College. Member of the board of Hypertherm Inc. (industrial cutting systems, software, and consumables).
Executive Officers
Glenn Booraem
Born in 1967. Principal occupation(s) during the past five years and other experience: principal of Vanguard. Investment stewardship officer (2017–present), treasurer (2015–2017), controller (2010–2015), and assistant controller (2001–2010) of each of the investment companies served by Vanguard.
Christine M. Buchanan
Born in 1970. Principal occupation(s) during the past five years and other experience: principal of Vanguard and global head of Fund Administration at Vanguard. Treasurer (2017–present) of each of the investment companies served by Vanguard. Partner (2005–2017) at KPMG LLP (audit, tax, and advisory services).
Thomas J. Higgins
Born in 1957. Principal occupation(s) during the past five years and other experience: principal of Vanguard. Chief financial officer (2008–present) and treasurer (1998–2008) of each of the investment companies served by Vanguard.
Peter Mahoney
Born in 1974. Principal occupation(s) during the past five years and other experience: principal of Vanguard. Controller (2015–present) of each of the investment companies served by Vanguard. Head of International Fund Services (2008–2014) at Vanguard.
Anne E. Robinson
Born in 1970. Principal occupation(s) during the past five years and other experience: general counsel (2016–present) of Vanguard. Secretary (2016–present) of Vanguard and of each of the investment companies served by Vanguard. Managing director (2016–present) of Vanguard. Director and senior vice president (2016–2018) of Vanguard Marketing Corporation. Managing director and general counsel of Global Cards and Consumer Services (2014–2016) at Citigroup. Counsel (2003–2014) at American Express.
Michael Rollings
Born in 1963. Principal occupation(s) during the past five years and other experience: finance director (2017–present) and treasurer (2017) of each of the investment companies served by Vanguard. Managing director (2016–present) of Vanguard. Chief financial officer (2016–present) of Vanguard. Director (2016–present) of Vanguard Marketing Corporation. Executive vice president and chief financial officer (2006–2016) of MassMutual Financial Group.
John E. Schadl
Born in 1972. Principal occupation(s) during the past five years and other experience: principal of Vanguard. Chief compliance officer (2019–present) of Vanguard and of each of the investment companies served by Vanguard. Assistant vice president (May 2019–present) of Vanguard Marketing Corporation.
Vanguard Senior Management Team |
| |
Joseph Brennan | Chris D. McIsaac |
Mortimer J. Buckley | James M. Norris |
Gregory Davis | Thomas M. Rampulla |
John James | Karin A. Risi |
Martha G. King | Anne E. Robinson |
John T. Marcante | Michael Rollings |
| 
|
| |
| P.O. Box 2600 |
| Valley Forge, PA 19482-2600 |
Connect with Vanguard® > vanguard.com
Fund Information > 800-662-7447
Direct Investor Account Services > 800-662-2739
Institutional Investor Services > 800-523-1036
Text Telephone for People
Who Are Deaf or Hard of Hearing > 800-749-7273
This material may be used in conjunction with the offering of shares of any Vanguard fund only if preceded or accompanied by the fund’s current prospectus.
All comparative mutual fund data are from Morningstar, Inc., unless otherwise noted.
You can obtain a free copy of Vanguard’s proxy voting guidelines by visiting vanguard.com/proxyreporting or by calling Vanguard at 800-662-2739. The guidelines are also available from the SEC’s website, www.sec.gov. In addition, you may obtain a free report on how your fund voted the proxies for securities it owned during the 12 months ended June 30. To get the report, visit either vanguard.com/proxyreporting or www.sec.gov.
You can review information about your fund on the SEC’s website, and you can receive copies of this information, for a fee, by sending a request via email addressed to publicinfo@sec.gov.
Source for Bloomberg Barclays indexes: Bloomberg Index Services Limited. Copyright 2019, Bloomberg. All rights reserved.
| © 2019 The Vanguard Group, Inc. |
| All rights reserved. |
| Vanguard Marketing Corporation, Distributor. |
| |
| Q1110 112019 |

Annual Report | September 30, 2019 Vanguard Global Equity Fund |
See the inside front cover for important information about access to your fund’s annual and semiannual shareholder reports. |
Important information about access to shareholder reports
Beginning on January 1, 2021, as permitted by regulations adopted by the Securities and Exchange Commission, paper copies of your fund’s annual and semiannual shareholder reports will no longer be sent to you by mail, unless you specifically request them. Instead, you will be notified by mail each time a report is posted on the website and will be provided with a link to access the report.
If you have already elected to receive shareholder reports electronically, you will not be affected by this change and do not need to take any action. You may elect to receive shareholder reports and other communications from the fund electronically by contacting your financial intermediary (such as a broker-dealer or bank) or, if you invest directly with the fund, by calling Vanguard at one of the phone numbers on the back cover of this report or by logging on to vanguard.com.
You may elect to receive paper copies of all future shareholder reports free of charge. If you invest through a financial intermediary, you can contact the intermediary to request that you continue to receive paper copies. If you invest directly with the fund, you can call Vanguard at one of the phone numbers on the back cover of this report or log on to vanguard.com. Your election to receive paper copies will apply to all the funds you hold through an intermediary or directly with Vanguard.
Contents | |
| |
A Note From Our Chairman | 1 |
Your Fund’s Performance at a Glance | 2 |
Advisors’ Report | 3 |
About Your Fund’s Expenses | 7 |
Performance Summary | 9 |
Financial Statements | 11 |
Please note: The opinions expressed in this report are just that—informed opinions. They should not be considered promises or advice. Also, please keep in mind that the information and opinions cover the period through the date on the front of this report. Of course, the risks of investing in your fund are spelled out in the prospectus.
A Note From Our Chairman

Tim Buckley
Chairman and Chief Executive Officer
Dear Shareholder,
Recent volatility in financial markets—affecting stocks, bonds, and commodities—has been a good reminder of the wise old adage, “Never keep all your eggs in one basket.” Maintaining balance and diversification in your investment portfolio can help to both limit risk and set you up for long-term success.
It’s understandable why some investors might become complacent after a long market run-up like the one that lifted stock prices, especially U.S. stock prices, in the years following the global financial crisis. But failing to rebalance regularly can leave a portfolio with a much different mix of assets than intended and, often, more risk than intended.
Balance across and diversification within asset classes are powerful tools for managing risk and achieving your investment goals. A portfolio’s allocation will determine a large portion of its long-term return and also the majority of its volatility risk. A well-diversified portfolio is less vulnerable to significant swings in the performance of any one segment of the asset classes in which it invests.
Balance and diversification will never eliminate the risk of loss, nor will they guarantee positive returns in a declining market. But they should reduce the chance that you’ll suffer disproportionate losses in one particular high-flying asset class or sector when it comes back to earth. And exposure to all key market components should give you at least some participation in the sectors that are performing best at any given time.
Vanguard is committed to helping you achieve balance and diversification in your portfolios to help meet your investment goals. We thank you for your continued loyalty.
Sincerely,

Mortimer J. Buckley
Chairman and Chief Executive Officer
October 14, 2019
1
Your Fund’s Performance at a Glance
· Vanguard Global Equity Fund returned 2.19% for the 12 months ended September 30, 2019. The fund outpaced the 1.38% result of its benchmark, the MSCI All Country World Index, which tracks stocks in about 50 developed and emerging markets.
· Stocks cooled worldwide. The broad U.S. market gained less than 3%. Non-U.S. markets returned roughly –1%, on a market-weighted average basis, in U.S. dollars. Non-U.S. returns averaged roughly 2% in local currency terms, but a rise in the U.S. dollar’s value erased those modest gains for dollar-based investors.
· Worries about the pace of global economic growth and central bank plans to ease monetary policies virtually worldwide also marked the period. Bonds easily outperformed stocks, with major bond market indexes returning about 10%.
· Security selection drove the fund’s outperformance. Selection proved strong in four of 11 industry sectors, accounting for roughly half the global value of stocks—financials, materials, health care, and information technology. Pacific Rim and emerging markets holdings outperformed, while European holdings lagged.
· For the decade ended September 30, 2019, the fund returned 9.67%, annualized, topping the benchmark’s 8.35% result. The fund had a cumulative ten-year edge of nearly 29 percentage points.
Market Barometer
| | Average Annual Total Returns | |
| | Periods Ended September 30, 2019 | |
| | One Year | | Three Years | | Five Years | |
Stocks | | | | | | | |
Russell 1000 Index (Large-caps) | | 3.87% | | 13.19% | | 10.62% | |
Russell 2000 Index (Small-caps) | | -8.89 | | 8.23 | | 8.19 | |
Russell 3000 Index (Broad U.S. market) | | 2.92 | | 12.83 | | 10.44 | |
FTSE All-World ex US Index (International) | | -1.12 | | 6.46 | | 3.24 | |
| | | | | | | |
Bonds | | | | | | | |
Bloomberg Barclays U.S. Aggregate Bond Index (Broad taxable market) | | 10.30% | | 2.92% | | 3.38% | |
Bloomberg Barclays Municipal Bond Index (Broad tax-exempt market) | | 8.55 | | 3.19 | | 3.66 | |
FTSE Three-Month U.S. Treasury Bill Index | | 2.36 | | 1.52 | | 0.95 | |
| | | | | | | |
CPI | | | | | | | |
Consumer Price Index | | 1.71% | | 2.07% | | 1.53% | |
2
Advisors’ Report
For the fiscal year ended September 30, 2019, Vanguard Global Equity Fund returned 2.19%, outpacing the 1.38% result of its benchmark, the MSCI All Country World Index, which tracks stocks in about 50 developed and emerging markets. Your fund is managed by two independent advisors, a strategy that enhances the fund’s diversification by providing exposure to distinct yet complementary investment approaches. It’s not uncommon for different advisors to have different views about individual securities or the broader investment environment.
The table below presents the amount and percentage of fund assets that each advisor manages, as well as brief descriptions of their investment strategies. Each advisor has also prepared a discussion of the investment environment that existed during the past year and its effect on portfolio positioning. These comments were prepared on October 10, 2019.
Marathon Asset Management LLP
Portfolio Managers:
Neil M. Ostrer,
Co-Head of Global Equity
William J. Arah,
Co-Head of Global Equity
Global equity markets charted a more volatile course during the 12 months ended September 30, compared with the previous period. Sharp declines in the fourth quarter of 2018 quickly reversed in 2019, leading to a marginal gain for the entire period under review. Much of this
Vanguard Global Equity Fund Investment Advisors
| | Fund Assets Managed | | |
Investment Advisor | | % | | $ Million | | Investment Strategy |
Marathon Asset Management LLP | | 49 | | 3,206 | | A long-term and contrarian investment philosophy and process with a focus on industry capital cycle analysis and in-depth management assessment. |
Baillie Gifford Overseas Ltd. | | 48 | | 3,122 | | A long-term, active, bottom-up investment approach is used to identify companies that can generate above-average growth in earnings and cash flow. |
Cash Investments | | 3 | | 185 | | These short-term reserves are invested by Vanguard in equity index products to simulate investment in stocks. Each advisor may also maintain a modest cash position. |
3
volatility stemmed from concerns about the potential effects of trade disputes on the global economy, uncertain political environments in the United Kingdom and Hong Kong, and uncertainty about the future of monetary accommodation. Amid this backdrop, our portfolio performed well on a relative basis, largely driven by strong stock selection across several key markets—North America, emerging markets, and Europe.
At the sector level, our underweight to energy and overweight to consumer staples contributed positively to our relative returns. Stock selection in materials, financials, and information technology also helped. On the downside were our underweights to utilities—the best-performing sector over the period—and real estate, as well as stock selection in that sector and in communication services.
At the stock level, our overweight to blue-chip consumer companies such as Hershey, Procter & Gamble, and Nestlé made large positive contributions. Shares rose as the companies benefited from increased pricing and investors sought refuge in this defensive area of the market. Barrick Gold was another strong performer, outpacing the rise in gold prices as investors became more aware of the benefits from a merger with Randgold Resources and improving capital allocation discipline. Merck performed well because of its continued success in oncology.
In emerging markets, Brazilian apparel group Alpargatas performed strongly throughout the period. The firm, which owns the globally recognized Havaianas footwear brand, increased its revenue across key business segments and benefited from its expanding international presence.
Not owning Microsoft hurt our relative performance as the success of its cloud computing business continued. Energy group National Oilwell Varco performed poorly along with the overall energy sector as orders for equipment and refurbishment services were delayed. Another detractor was Fairfax Financial, whose shares continued to lag the broader market as the company’s value-oriented investment style remained out of favor.
This has certainly been a U.S.-led equity cycle, but investors are increasingly nervous about the market trajectory, given a sharp deterioration in domestic purchasing manager indexes coupled with yield curve inversion. The negative sentiment is evident in the outperformance of more defensive sectors—utilities, real estate, and consumer staples were some of the best performers over the last 12 months. Investors hope that the Federal Reserve keeps the cycle alive by cutting interest rates further to stimulate growth, but they are becoming aware of the limitations of monetary policy.
4
The market has both highly valued growth companies and many slower-growing or more cyclical businesses that appear very reasonably valued. Investors have sought safety in high-quality companies, pushing their valuations to record levels. However, valuation always matters in the end, so the irony may be that much of this perceived safety is, in fact, a mirage. A recent rotation away from growth to value in the U.S. was short-lived and perhaps is a sign of further volatility to come.
Baillie Gifford Overseas Ltd.
Portfolio Managers:
Charles Plowden,
Joint Senior Partner
and Lead Portfolio Manager
Spencer Adair, CFA,
Partner and Investment Manager,
Global Alpha Strategy
Malcolm MacColl,
Partner and Investment Manager,
Global Alpha Strategy
Macroeconomic and, notably, political events have continued to dominate headlines. There are always reasons to be fearful. Investors may wonder, among many concerns: “But what about Brexit?” or “What about trade wars?” To counter this situation and maintain our focus on bottom-up investment, we underpin our sleeve of your fund with optimism as a core belief. To seek out that rare subset of companies with the potential to become multiples of their current size, we need to be able to envisage what might go right in each case.
We look for investments that can double in value over five years. This growth hurdle is periodically tested for existing holdings. As a result, in the last 12 months we have continued to sell U.S. cyclical holdings, such as Royal Caribbean and First Republic Bank, and semiconductor companies, such as Rohm, Advanced Micro Devices, and Infineon.
We remain enthusiastic about two broad areas of growth—Asian consumption and technology. Both were tested in the last year by concerns about trade, the democracy movement in Hong Kong, and worries about data and privacy. But our bias toward optimism tells us that in the long term these trends will continue, and we seek companies with strong competitive advantages to exploit the growth opportunities.
We have sought to approach the increasing prevalence of technology from a new angle: how it will affect industry and corporations. Our personal lives have been revolutionized by technology to the extent that social interactions, retail, and media are now dominated by smart devices. In the workplace, it has yet to have such an impact, but this is changing. We bought Microsoft, whose suite of products enables greater efficiency in the office environment and which will benefit from
5
a subscription payment model. We also built up a position in Shopify, which helps traditional companies sell their products and services online.
We place most fast-improving health care applications within the broad technology area. In the last year we repurchased two former holdings, the gene-sequencing company Illumina and the heart pump manufacturer Abiomed. We also took a new position in Sysmex, which offers diagnostic testing. Data analysis is key to the success of all three companies. Capturing data about patients, mapping that against better understanding of diseases, and personalizing treatment will revolutionize health care in the next decade. We also have a new holding, Novocure, which has had remarkable success in treating some forms of brain cancer and has a potential application for other solid-state tumors.
Growth investing has been in vogue for a decade or longer, and we are being questioned about the sustainability of new technological breakthroughs. Our response is that we are living in a remarkable age of disruption. Today there are nine billion connected devices globally. Yet we are still in the very early stages of understanding the value of the data these will collect and how data could be used to address society’s needs. We remain optimistic that we can find many companies that can not only adapt to this new environment but also flourish, providing investors strong returns from global equities.
6
About Your Fund’s Expenses
As a shareholder of the fund, you incur ongoing costs, which include costs for portfolio management, administrative services, and shareholder reports (like this one), among others. Operating expenses, which are deducted from a fund’s gross income, directly reduce the investment return of the fund.
A fund’s expenses are expressed as a percentage of its average net assets. This figure is known as the expense ratio. The following examples are intended to help you understand the ongoing costs (in dollars) of investing in your fund and to compare these costs with those of other mutual funds. The examples are based on an investment of $1,000 made at the beginning of the period shown and held for the entire period.
The accompanying table illustrates your fund’s costs in two ways:
· Based on actual fund return. This section helps you to estimate the actual expenses that you paid over the period. The “Ending Account Value” shown is derived from the fund’s actual return, and the third column shows the dollar amount that would have been paid by an investor who started with $1,000 in the fund. You may use the information here, together with the amount you invested, to estimate the expenses that you paid over the period.
To do so, simply divide your account value by $1,000 (for example, an $8,600 account value divided by $1,000 = 8.6), then multiply the result by the number given for your fund under the heading “Expenses Paid During Period.”
· Based on hypothetical 5% yearly return. This section is intended to help you compare your fund’s costs with those of other mutual funds. It assumes that the fund had a yearly return of 5% before expenses, but that the expense ratio is unchanged. In this case—because the return used is not the fund’s actual return—the results do not apply to your investment. The example is useful in making comparisons because the Securities and Exchange Commission requires all mutual funds to calculate expenses based on a 5% return. You can assess your fund’s costs by comparing this hypothetical example with the hypothetical examples that appear in shareholder reports of other funds.
Note that the expenses shown in the table are meant to highlight and help you compare ongoing costs only and do not reflect transaction costs incurred by the fund for buying and selling securities. Further, the expenses do not include any purchase, redemption, or account service fees described in the fund prospectus. If such fees were applied to your account, your costs would be higher. Your fund does not carry a “sales load.”
The calculations assume no shares were bought or sold during the period. Your actual costs may have been higher or lower, depending on the amount of your investment and the timing of any purchases or redemptions.
You can find more information about the fund’s expenses, including annual expense ratios, in the Financial Statements section of this report. For additional information on operating expenses and other shareholder costs, please refer to your fund’s current prospectus.
7
Six Months Ended September 30, 2019
| Beginning | Ending | Expenses |
| Account Value | Account Value | Paid During |
Global Equity Fund | 3/31/2019 | 9/30/2019 | Period |
Based on Actual Fund Return | $1,000.00 | $1,037.80 | $2.45 |
Based on Hypothetical 5% Yearly Return | 1,000.00 | 1,022.66 | 2.43 |
The calculations are based on expenses incurred in the most recent six-month period. The fund’s annualized six-month expense ratio for that period is 0.48%. The dollar amounts shown as “Expenses Paid” are equal to the annualized expense ratio multiplied by the average account value over the period, multiplied by the number of days in the most recent six-month period, then divided by the number of days in the most recent 12-month period (183/365).
8
Global Equity Fund
Performance Summary
All of the returns in this report represent past performance, which is not a guarantee of future results that may be achieved by the fund. (Current performance may be lower or higher than the performance data cited. For performance data current to the most recent month-end, visit our website at vanguard.com/performance.) Note, too, that both investment returns and principal value can fluctuate widely, so an investor’s shares, when sold, could be worth more or less than their original cost. The returns shown do not reflect taxes that a shareholder would pay on fund distributions or on the sale of fund shares.
Cumulative Performance: September 30, 2009, Through September 30, 2019
Initial Investment of $10,000
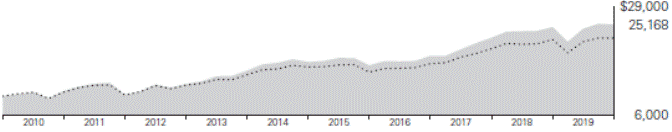
| | Average Annual Total Returns | |
| | Periods Ended September 30, 2019 | |
| | | | | Final Value |
| | One | Five | Ten | of a $10,000 |
| | Year | Years | Years | Investment |

| Global Equity Fund | 2.19% | 7.92% | 9.67% | $25,168 |

| MSCI All Country World Index | 1.38 | 6.65 | 8.35 | 22,296 |
See Financial Highlights for dividend and capital gains information.
9
Global Equity Fund
Sector Diversification
As of September 30, 2019
Communication Services | | 8.2 | % |
Consumer Discretionary | | 14.1 | |
Consumer Staples | | 8.2 | |
Energy | | 2.6 | |
Financials | | 23.3 | |
Health Care | | 11.4 | |
Industrials | | 12.5 | |
Information Technology | | 13.8 | |
Materials | | 4.8 | |
Real Estate | | 1.0 | |
Utilities | | 0.1 | |
The table reflects the fund’s equity exposure, based on its investments in stocks and stock index futures. Any holdings in short-term reserves are excluded. Sector categories are based on the Global Industry Classification Standard (“GICS”), except for the “Other” category (if applicable), which includes securities that have not been provided a GICS classification as of the effective reporting period.
The Global Industry Classification Standard (“GICS”) was developed by and is the exclusive property and a service mark of MSCI Inc. (“MSCI”) and Standard and Poor’s, a division of McGraw-Hill Companies, Inc. (“S&P”), and is licensed for use by Vanguard. Neither MSCI, S&P nor any third party involved in making or compiling the GICS or any GICS classification makes any express or implied warranties or representations with respect to such standard or classification (or the results to be obtained by the use thereof), and all such parties hereby expressly disclaim all warranties of originality, accuracy, completeness, merchantability or fitness for a particular purpose with respect to any such standard or classification. Without limiting any of the foregoing, in no event shall MSCI, S&P, any of its affiliates or any third party involved in making or compiling the GICS or any GICS classification have any liability for any direct, indirect, special, punitive, consequential or any other damages (including lost profits) even if notified of the possibility of such damages.
10
Global Equity Fund
Financial Statements
Statement of Net Assets—Investments Summary
As of September 30, 2019
This Statement summarizes the fund’s holdings by asset type. Details are reported for each of the fund’s 50 largest individual holdings and for investments that, in total for any issuer, represent more than 1% of the fund’s net assets. The total value of smaller holdings is reported as a single amount within each category.
The fund files its complete schedule of portfolio holdings with the Securities and Exchange Commission (SEC) four times in each fiscal year. For the second and fourth quarters the complete list of the fund’s holdings is available on vanguard.com and on Form N-CSR, or you can have it mailed to you without charge by calling 800-662-7447. For the first and third quarters of each fiscal year, the complete list of the fund’s holdings is available as an exhibit to its reports on Form N-PORT. The fund’s Form N-CSR and Form N-PORT reports are available on the SEC’s website at www.sec.gov.
| | | | | Market | | Percentage | |
| | | | | Value· | | of Net | |
| | | Shares | | ($000 | ) | Assets | |
Common Stocks | | | | | | | |
Australia † | | | | 72,776 | | 1.1% | |
| | | | | | | |
Austria † | | | | 3,543 | | 0.1% | |
| | | | | | | |
Belgium † | | | | 2,837 | | 0.0% | |
| | | | | | | |
Brazil | | | | | | | |
| Banco Bradesco SA Preference Shares | | 4,668,960 | | 38,116 | | 0.6% | |
| Brazil—Other † | | | | 61,341 | | 0.9% | |
| | | | | 99,457 | | 1.5% | |
Canada | | | | | | | |
| Fairfax Financial Holdings Ltd. (XTSE) | | 103,654 | | 45,691 | | 0.7% | |
1 | Canada—Other † | | | | 148,033 | | 2.3% | |
| | | | | 193,724 | | 3.0% | |
| | | | | | | | |
Chile † | | | | 9,607 | | 0.2% | |
| | | | | | | | |
China | | | | | | | |
* | Alibaba Group Holding Ltd. ADR | | 538,641 | | 90,077 | | 1.4% | |
| Ping An Insurance Group Co. of China Ltd. | | 4,780,500 | | 54,946 | | 0.8% | |
*,^ | Autohome Inc. ADR | | 204,697 | | 17,017 | | 0.3% | |
1 | China—Other † | | | | 106,328 | | 1.6% | |
| | | | | 268,368 | | 4.1% | |
| | | | | | | | |
Colombia † | | | | 5,424 | | 0.1% | |
| | | | | | | |
Czech Republic † | | | | 1,841 | | 0.0% | |
| | | | | | | |
1Denmark † | | | | 41,196 | | 0.6% | |
| | | | | | | |
Finland † | | | | 8,723 | | 0.1% | |
11
Global Equity Fund
| | | | | Market | | Percentage | |
| | | | | Value· | | of Net | |
| | | Shares | | ($000 | ) | Assets | |
France | | | | | | | |
| Pernod Ricard SA | | 285,076 | | 50,738 | | 0.8% | |
| France—Other † | | | | 115,172 | | 1.8% | |
| | | | | 165,910 | | 2.6% | |
Germany | | | | | | | |
| SAP SE | | 470,825 | | 55,404 | | 0.8% | |
| Germany—Other † | | | | 88,469 | | 1.4% | |
| | | | | 143,873 | | 2.2% | |
| | | | | | | | |
Greece † | | | | 15,091 | | 0.2% | |
| | | | | | | | |
Hong Kong | | | | | | | |
| AIA Group Ltd. | | 7,256,400 | | 68,435 | | 1.1% | |
| Hong Kong—Other † | | | | 54,318 | | 0.8% | |
| | | | | 122,753 | | 1.9% | |
India | | | | | | | |
| Housing Development Finance Corp. Ltd. | | 1,474,847 | | 41,166 | | 0.6% | |
1 | India—Other † | | | | 85,328 | | 1.3% | |
| | | | | 126,494 | | 1.9% | |
| | | | | | | | |
Indonesia † | | | | 2,011 | | 0.0% | |
| | | | | | | | |
Ireland | | | | | | | |
| CRH plc | | 1,361,124 | | 46,673 | | 0.7% | |
§ | Ireland—Other † | | | | 44,439 | | 0.7% | |
| | | | | 91,112 | | 1.4% | |
| | | | | | | | |
Italy † | | | | 10,559 | | 0.2% | |
| | | | | | | |
Japan | | | | | | | |
| MS&AD Insurance Group Holdings Inc. | | 1,689,900 | | 54,929 | | 0.9% | |
| Olympus Corp. | | 3,314,700 | | 44,907 | | 0.7% | |
| Japan—Other † | | | | 425,845 | | 6.5% | |
| | | | | 525,681 | | 8.1% | |
| | | | | | | | |
Kenya † | | | | 2,563 | | 0.0% | |
| | | | | | | | |
Malaysia † | | | | 646 | | 0.0% | |
| | | | | | | |
1Mexico † | | | | 19,288 | | 0.3% | |
| | | | | | | |
Netherlands | | | | | | | |
| Unilever NV | | 790,460 | | 47,465 | | 0.7% | |
* | Prosus NV | | 482,357 | | 35,409 | | 0.6% | |
1 | Netherlands—Other † | | | | 41,653 | | 0.6% | |
| | | | | 124,527 | | 1.9% | |
| | | | | | | | |
New Zealand † | | | | 1,832 | | 0.0% | |
| | | | | | | |
Norway † | | | | 40,802 | | 0.6% | |
12
Global Equity Fund
| | | | | Market | | Percentage | |
| | | | | Value· | | of Net | |
| | | Shares | | ($000 | ) | Assets | |
Other | | | | | | | |
2 | Vanguard FTSE Emerging Markets ETF | | 569,046 | | 22,910 | | 0.4% | |
| | | | | | | | |
Peru † | | | | 1,838 | | 0.0% | |
| | | | | | | |
Philippines † | | | | 259 | | 0.0% | |
| | | | | | | |
Poland † | | | | 1,399 | | 0.0% | |
| | | | | | | |
Russia † | | | | 51,078 | | 0.8% | |
| | | | | | | |
Singapore † | | | | 13,114 | | 0.2% | |
| | | | | | | |
South Africa | | | | | | | |
| Naspers Ltd. | | 482,357 | | 73,033 | | 1.1% | |
| South Africa—Other † | | | | 22,328 | | 0.4% | |
| | | | | 95,361 | | 1.5% | |
South Korea | | | | | | | |
| Samsung Electronics Co. Ltd. | | 952,434 | | 38,996 | | 0.6% | |
| South Korea—Other † | | | | 35,721 | | 0.6% | |
| | | | | 74,717 | | 1.2% | |
| | | | | | | | |
1Spain † | | | | 4,725 | | 0.1% | |
| | | | | | | |
Sweden † | | | | 78,205 | | 1.2% | |
| | | | | | | |
Switzerland | | | | | | | |
| Cie Financiere Richemont SA (XVTX) | | 581,989 | | 42,652 | | 0.7% | |
| Schindler Holding AG | | 159,490 | | 35,692 | | 0.5% | |
| Switzerland—Other † | | | | 106,207 | | 1.6% | |
| | | | | 184,551 | | 2.8% | |
Taiwan | | | | | | | |
| Taiwan Semiconductor Manufacturing Co. Ltd. ADR | | 901,462 | | 41,900 | | 0.6% | |
| Taiwan—Other † | | | | 36,923 | | 0.6% | |
| | | | | 78,823 | | 1.2% | |
| | | | | | | | |
Thailand † | | | | 3,687 | | 0.1% | |
| | | | | | | |
Turkey † | | | | 4,965 | | 0.1% | |
| | | | | | | |
United Kingdom | | | | | | | |
| Prudential plc | | 5,290,562 | | 95,872 | | 1.5% | |
§,1 | United Kingdom—Other † | | | | 245,061 | | 3.7% | |
| | | | | 340,933 | | 5.2% | |
United States | | | | | | | |
Communication Services | | | | | | | |
* | Alphabet Inc. Class C | | 81,799 | | 99,713 | | 1.5% | |
* | Facebook Inc. Class A | | 434,417 | | 77,361 | | 1.2% | |
* | Alphabet Inc. Class A | | 38,178 | | 46,621 | | 0.7% | |
| Communication Services—Other † | | | | 76,548 | | 1.2% | |
| | | | | 300,243 | | 4.6% | |
13
Global Equity Fund
| | | | | Market | | Percentage | |
| | | | | Value· | | of Net | |
| | | Shares | | ($000 | ) | Assets | |
Consumer Discretionary | | | | | | | |
* | Amazon.com Inc. | | 69,884 | | 121,312 | | 1.9% | |
* | Booking Holdings Inc. | | 24,663 | | 48,404 | | 0.7% | |
| Service Corp. International | | 771,154 | | 36,869 | | 0.6% | |
| Consumer Discretionary—Other † | | | | 164,913 | | 2.5% | |
| | | | | 371,498 | | 5.7% | |
Consumer Staples | | | | | | | |
| Procter & Gamble Co. | | 357,233 | | 44,433 | | 0.7% | |
| Consumer Staples—Other † | | | | 164,681 | | 2.5% | |
| | | | | 209,114 | | 3.2% | |
Energy | | | | | | | |
| EOG Resources Inc. | | 517,174 | | 38,384 | | 0.6% | |
| Energy—Other † | | | | 43,478 | | 0.7% | |
| | | | | 81,862 | | 1.3% | |
Financials | | | | | | | |
| Moody’s Corp. | | 382,091 | | 78,264 | | 1.2% | |
| Wells Fargo & Co. | | 1,375,769 | | 69,394 | | 1.1% | |
* | Markel Corp. | | 40,649 | | 48,043 | | 0.7% | |
| Travelers Cos. Inc. | | 321,335 | | 47,779 | | 0.7% | |
| US Bancorp | | 831,639 | | 46,023 | | 0.7% | |
* | Berkshire Hathaway Inc. Class B | | 205,929 | | 42,837 | | 0.7% | |
| MarketAxess Holdings Inc. | | 124,044 | | 40,624 | | 0.6% | |
| Arthur J Gallagher & Co. | | 449,442 | | 40,257 | | 0.6% | |
| Financials—Other † | | | | 271,212 | | 4.2% | |
| | | | | 684,433 | | 10.5% | |
Health Care | | | | | | | |
| Anthem Inc. | | 343,719 | | 82,527 | | 1.3% | |
| Johnson & Johnson | | 505,421 | | 65,391 | | 1.0% | |
* | Waters Corp. | | 276,856 | | 61,803 | | 0.9% | |
| Merck & Co. Inc. | | 570,607 | | 48,034 | | 0.7% | |
| Thermo Fisher Scientific Inc. | | 152,248 | | 44,345 | | 0.7% | |
| ResMed Inc. | | 314,569 | | 42,501 | | 0.7% | |
* | Seattle Genetics Inc. | | 412,666 | | 35,242 | | 0.5% | |
| Health Care—Other † | | | | 141,355 | | 2.2% | |
| | | | | 521,198 | | 8.0% | |
Industrials | | | | | | | |
* | Kirby Corp. | | 509,299 | | 41,844 | | 0.6% | |
§ | Industrials—Other † | | | | 237,395 | | 3.7% | |
| | | | | 279,239 | | 4.3% | |
Information Technology | | | | | | | |
| Mastercard Inc. Class A | | 291,129 | | 79,062 | | 1.2% | |
| Visa Inc. Class A | | 389,787 | | 67,047 | | 1.1% | |
| Oracle Corp. | | 1,201,568 | | 66,122 | | 1.0% | |
| Texas Instruments Inc. | | 413,899 | | 53,492 | | 0.8% | |
| Microsoft Corp. | | 335,383 | | 46,628 | | 0.7% | |
| Intel Corp. | | 873,300 | | 45,001 | | 0.7% | |
| Information Technology—Other † | | | | 208,872 | | 3.2% | |
| | | | | 566,224 | | 8.7% | |
Materials | | | | | | | |
| Martin Marietta Materials Inc. | | 186,831 | | 51,210 | | 0.8% | |
| Materials—Other † | | | | 61,552 | | 0.9% | |
| | | | | 112,762 | | 1.7% | |
14
Global Equity Fund
| | | | | Market | | Percentage | |
| | | | | Value· | | of Net | |
| | | Shares | | ($000 | ) | Assets | |
Real Estate † | | | | 55,723 | | 0.9% | |
| | | | | 3,182,296 | | 48.9% | |
Total Common Stocks (Cost $5,192,843) | | | | 6,239,499 | | 95.8%3 | |
| | | | | | | | |
| | Coupon | | | | | | | |
Temporary Cash Investments | | | | | | | | | |
Money Market Fund | | | | | | | | | |
4,5 | Vanguard Market Liquidity Fund | | 2.098% | | 2,917,626 | | 291,792 | | 4.5% | |
| | | | | | | | | |
6U.S. Government and Agency Obligations † | | | | | | 6,735 | | 0.1% | |
Total Temporary Cash Investments (Cost $298,490) | | | | | | 298,527 | | 4.6%3 | |
Total Investments (Cost $5,491,333) | | | | | | 6,538,026 | | 100.4% | |
Other Assets and Liabilities | | | | | | | | | |
Other Assets6,7 | | | | | | 44,860 | | 0.7% | |
Liabilities5 | | | | | | (70,309 | ) | (1.1% | ) |
| | | | | | (25,449 | ) | (0.4% | ) |
Net Assets | | | | | | 6,512,577 | | 100.0% | |
| | | | | | | | | |
| | | | | | | | Amount | |
| | | | | | | | ($000 | ) |
Statement of Assets and Liabilities | | | | | | | | | |
Assets | | | | | | | | | |
Investments in Securities, at Value | | | | | | | | | |
Unaffiliated Issuers | | | | | | | | 6,223,324 | |
Affiliated Issuers | | | | | | | | 314,702 | |
| | | | | | | | | |
Total Investments in Securities | | | | | | | | 6,538,026 | |
Investment in Vanguard | | | | | | | | 306 | |
Receivables for Investment Securities Sold | | | | | | | | 1,125 | |
Receivables for Accrued Income | | | | | | | | 13,311 | |
Receivables for Capital Shares Issued | | | | | | | | 17,089 | |
Variation Margin Receivable—Futures Contracts | | | | | | | | 865 | |
Unrealized Appreciation—Forward Currency Contracts | | | | | | | | 16 | |
Other Assets6,7 | | | | | | | | 12,148 | |
Total Assets | | | | | | | | 6,582,886 | |
Liabilities | | | | | | | | | |
Payables for Investment Securities Purchased | | | | | | | | 4,958 | |
Collateral for Securities on Loan | | | | | | | | 52,993 | |
Payables to Investment Advisor | | | | | | | | 4,271 | |
Payables for Capital Shares Redeemed | | | | | | | | 2,843 | |
Payables to Vanguard | | | | | | | | 4,662 | |
Variation Margin Payable—Futures Contracts | | | | | | | | 175 | |
Unrealized Depreciation—Forward Currency Contracts | | | | | | | | 356 | |
Other Liabilities | | | | | | | | 51 | |
Total Liabilities | | | | | | | | 70,309 | |
Net Assets | | | | | | | | 6,512,577 | |
15
Global Equity Fund
At September 30, 2019, net assets consisted of:
| | Amount | |
| | ($000 | ) |
Paid-in Capital | | 5,110,227 | |
Total Distributable Earnings (Loss) | | 1,402,350 | |
Net Assets | | 6,512,577 | |
Applicable to 211,810,453 outstanding $.001 par value shares of beneficial interest (unlimited authorization) | | 6,512,577 | |
Net Asset Value Per Share | | 30.75 | |
· See Note A in Notes to Financial Statements.
* Non-income-producing security.
^ Includes partial security positions on loan to broker-dealers. The total value of securities on loan is $49,240,000.
§ Certain of the fund’s securities are valued using significant unobservable inputs.
† Represents the aggregate value, by category, of securities that are not among the 50 largest holdings and, in total for any issuer, represent 1% or less of net assets.
1 Certain of the fund’s securities are exempt from registration under Rule 144A of the Securities Act of 1933. Such securities may be sold in transactions exempt from registration, normally to qualified institutional buyers. At September 30, 2019, the aggregate value of these securities was $77,161,000, representing 1.2% of net assets.
2 Considered an affiliated company of the fund as the issuer is another member of The Vanguard Group.
3 The fund invests a portion of its cash reserves in equity markets through the use of index futures contracts. After giving effect to futures investments, the fund’s effective common stock and temporary cash investment positions represent 98.2% and 2.2%, respectively, of net assets.
4 Affiliated money market fund available only to Vanguard funds and certain trusts and accounts managed by Vanguard. Rate shown is the 7-day yield.
5 Includes $52,993,000 of collateral received for securities on loan.
6 Securities with a value of $6,735,000 and cash of $701,000 have been segregated as initial margin for open futures contracts.
7 Cash of $510,000 has been segregated as collateral for open forward currency contracts.
ADR—American Depositary Receipt.
16
Global Equity Fund
Derivative Financial Instruments Outstanding as of Period End |
| | | | ($000) |
| | | | Value and |
| | Number of | | Unrealized |
| | Long (Short) | Notional | Appreciation |
| Expiration | Contracts | Amount | (Depreciation) |
Long Futures Contracts | | | | |
E-mini S&P 500 Index | December 2019 | 697 | 103,801 | (1,055) |
Dow Jones EURO STOXX 50 Index | December 2019 | 511 | 19,800 | 242 |
Topix Index | December 2019 | 90 | 13,218 | 478 |
FTSE 100 Index | December 2019 | 134 | 12,165 | 131 |
S&P ASX 200 Index | December 2019 | 50 | 5,638 | 22 |
NIKKEI 225 Index | December 2019 | 11 | 1,106 | 31 |
| | | | (151) |
| | | | |
| | | | |
Forward Currency Contracts | | | | |
| Contract | | Unrealized | Unrealized |
| Settlement | Contract Amount (000) | Appreciation | (Depreciation) |
Counterparty | Date | Receive | Deliver | ($000) | ($000) |
Bank of America, N.A. | 12/24/19 | EUR | 15,604 | USD | 17,298 | — | (173) |
Bank of America, N.A. | 12/16/19 | JPY | 1,254,627 | USD | 11,676 | — | (4) |
Bank of America, N.A. | 12/24/19 | GBP | 8,122 | USD | 10,125 | — | (102) |
Toronto-Dominion Bank | 12/24/19 | AUD | 7,234 | USD | 4,973 | — | (77) |
Royal Bank of Canada | 12/16/19 | JPY | 116,828 | USD | 1,087 | — | — |
Bank of America, N.A. | 12/24/19 | USD | 1,070 | EUR | 965 | 11 | — |
Bank of America, N.A. | 12/24/19 | USD | 340 | AUD | 494 | 5 | — |
| | | | | | | 16 | (356) |
| | | | | | | | |
AUD—Australian dollar.
EUR—euro.
GBP—British pound.
JPY—Japanese yen.
USD—U.S. dollar.
See accompanying Notes, which are an integral part of the Financial Statements.
17
Global Equity Fund
Statement of Operations
| | Year Ended | |
| | September 30, 2019 | |
| | ($000 | ) |
Investment Income | | | |
Income | | | |
Dividends—Unaffiliated Issuers1 | | 162,428 | |
Dividends—Affiliated Issuers | | 560 | |
Interest—Unaffiliated Issuers | | 242 | |
Interest—Affiliated Issuers | | 6,077 | |
Securities Lending—Net | | 442 | |
Total Income | | 169,749 | |
Expenses | | | |
Investment Advisory Fees—Note B | | | |
Basic Fee | | 13,915 | |
Performance Adjustment | | 1,453 | |
The Vanguard Group—Note C | | | |
Management and Administrative | | 12,115 | |
Marketing and Distribution | | 622 | |
Custodian Fees | | 354 | |
Auditing Fees | | 44 | |
Shareholders’ Reports | | 71 | |
Trustees’ Fees and Expenses | | 8 | |
Total Expenses | | 28,582 | |
Net Investment Income | | 141,167 | |
Realized Net Gain (Loss) | | | |
Investment Securities Sold—Unaffiliated Issuers | | 268,311 | |
Investment Securities Sold—Affiliated Issuers | | (2,580 | ) |
Futures Contracts | | 6,488 | |
Forward Currency Contracts | | (2,535 | ) |
Foreign Currencies | | (918 | ) |
Realized Net Gain (Loss) | | 268,766 | |
Change in Unrealized Appreciation (Depreciation) | | | |
Investment Securities—Unaffiliated Issuers | | (217,153 | ) |
Investment Securities—Affiliated Issuers | | 3,092 | |
Futures Contracts | | (2,003 | ) |
Forward Currency Contracts | | 154 | |
Foreign Currencies | | (50 | ) |
Change in Unrealized Appreciation (Depreciation) | | (215,960 | ) |
Net Increase (Decrease) in Net Assets Resulting from Operations | | 193,973 | |
1 Dividends are net of foreign withholding taxes of $6,557,000.
See accompanying Notes, which are an integral part of the Financial Statements.
18
Global Equity Fund
Statement of Changes in Net Assets
| | Year Ended September 30, | |
| | 2019 | | 2018 | |
| | ($000 | ) | ($000 | ) |
Increase (Decrease) in Net Assets | | | | | |
Operations | | | | | |
Net Investment Income | | 141,167 | | 77,061 | |
Realized Net Gain (Loss) | | 268,766 | | 395,863 | |
Change in Unrealized Appreciation (Depreciation) | | (215,960 | ) | 73,651 | |
Net Increase (Decrease) in Net Assets Resulting from Operations | | 193,973 | | 546,575 | |
Distributions | | | | | |
Net Investment Income | | (72,598 | ) | (72,958 | ) |
Realized Capital Gain1 | | (314,346 | ) | — | |
Total Distributions | | (386,944 | ) | (72,958 | ) |
Capital Share Transactions | | | | | |
Issued | | 1,495,387 | | 742,350 | |
Issued in Lieu of Cash Distributions | | 360,512 | | 67,815 | |
Redeemed | | (919,403 | ) | (901,606 | ) |
Net Increase (Decrease) from Capital Share Transactions | | 936,496 | | (91,441 | ) |
Total Increase (Decrease) | | 743,525 | | 382,176 | |
Net Assets | | | | | |
Beginning of Period | | 5,769,052 | | 5,386,876 | |
End of Period | | 6,512,577 | | 5,769,052 | |
1 Includes fiscal 2019 and 2018 short-term gain distributions totaling $0 and $0, respectively. Short-term gain distributions are treated as ordinary income dividends for tax purposes.
See accompanying Notes, which are an integral part of the Financial Statements.
19
Global Equity Fund
Financial Highlights
For a Share Outstanding | | Year Ended September 30, | |
Throughout Each Period | | 2019 | | 2018 | | 2017 | | 2016 | | 2015 | |
Net Asset Value, Beginning of Period | | $32.62 | | $29.98 | | $25.18 | | $22.85 | | $24.19 | |
Investment Operations | | | | | | | | | | | |
Net Investment Income | | .700 | 1,2 | .426 | 1 | .351 | 1 | .385 | | .373 | |
Net Realized and Unrealized Gain (Loss) on Investments | | (.354 | ) | 2.618 | | 4.823 | | 2.350 | | (1.338 | ) |
Total from Investment Operations | | .346 | | 3.044 | | 5.174 | | 2.735 | | (.965 | ) |
Distributions | | | | | | | | | | | |
Dividends from Net Investment Income | | (.416 | ) | (.404 | ) | (.374 | ) | (.405 | ) | (.375 | ) |
Distributions from Realized Capital Gains | | (1.800 | ) | — | | — | | — | | — | |
Total Distributions | | (2.216 | ) | (.404 | ) | (.374 | ) | (.405 | ) | (.375 | ) |
Net Asset Value, End of Period | | $30.75 | | $32.62 | | $29.98 | | $25.18 | | $22.85 | |
| | | | | | | | | | | |
Total Return3 | | 2.19% | | 10.22% | | 20.85% | | 12.11% | | -4.09% | |
| | | | | | | | | | | |
Ratios/Supplemental Data | | | | | | | | | | | |
Net Assets, End of Period (Millions) | | $6,513 | | $5,769 | | $5,387 | | $4,515 | | $4,144 | |
Ratio of Total Expenses to Average Net Assets4 | | 0.48% | | 0.48% | | 0.48% | | 0.51% | | 0.57% | |
Ratio of Net Investment Income to Average Net Assets | | 2.35%2 | | 1.34% | | 1.30% | | 1.61% | | 1.49% | |
Portfolio Turnover Rate | | 49% | | 40% | | 47% | | 45% | | 36% | |
1 Calculated based on average shares outstanding.
2 Net investment income per share and the ratio of net investment income to average net assets include $.200 and 0.67%, respectively, resulting from a special dividend from Naspers Ltd. in September 2019.
3 Total returns do not include account service fees that may have applied in the periods shown. Fund prospectuses provide information about any applicable account service fees.
4 Includes performance-based investment advisory fee increases (decreases) of 0.02%, 0.02%, 0.02%, 0.05%, and 0.08%.
See accompanying Notes, which are an integral part of the Financial Statements.
20
Global Equity Fund
Notes to Financial Statements
Vanguard Global Equity Fund is registered under the Investment Company Act of 1940 as an open-end investment company, or mutual fund. The fund invests in securities of foreign issuers, which may subject it to investment risks not normally associated with investing in securities of U.S. corporations.
A. The following significant accounting policies conform to generally accepted accounting principles for U.S. investment companies. The fund consistently follows such policies in preparing its financial statements.
1. Security Valuation: Securities are valued as of the close of trading on the New York Stock Exchange (generally 4 p.m., Eastern time) on the valuation date. Equity securities are valued at the latest quoted sales prices or official closing prices taken from the primary market in which each security trades; such securities not traded on the valuation date are valued at the mean of the latest quoted bid and asked prices. Securities for which market quotations are not readily available, or whose values have been affected by events occurring before the fund’s pricing time but after the close of the securities’ primary markets, are valued at their fair values calculated according to procedures adopted by the board of trustees. These procedures include obtaining quotations from an independent pricing service, monitoring news to identify significant market- or security-specific events, and evaluating changes in the values of foreign market proxies (for example, ADRs, futures contracts, or exchange-traded funds), between the time the foreign markets close and the fund’s pricing time. When fair-value pricing is employed, the prices of securities used by a fund to calculate its net asset value may differ from quoted or published prices for the same securities. Investments in Vanguard Market Liquidity Fund are valued at that fund’s net asset value. Temporary cash investments are valued using the latest bid prices or using valuations based on a matrix system (which considers such factors as security prices, yields, maturities, and ratings), both as furnished by independent pricing services.
2. Foreign Currency: Securities and other assets and liabilities denominated in foreign currencies are translated into U.S. dollars using exchange rates obtained from an independent third party as of the fund’s pricing time on the valuation date. Realized gains (losses) and unrealized appreciation (depreciation) on investment securities include the effects of changes in exchange rates since the securities were purchased, combined with the effects of changes in security prices. Fluctuations in the value of other assets and liabilities resulting from changes in exchange rates are recorded as unrealized foreign currency gains (losses) until the assets or liabilities are settled in cash, at which time they are recorded as realized foreign currency gains (losses).
3. Futures and Forward Currency Contracts: The fund uses index futures contracts to a limited extent, with the objective of maintaining full exposure to the stock market while maintaining liquidity. The fund may purchase or sell futures contracts to achieve a desired level of investment, whether to accommodate portfolio turnover or cash flows from capital share transactions. The primary risks associated with the use of futures contracts are imperfect correlation between changes in market values of stocks held by the fund and the prices of futures contracts, and the possibility of an illiquid market. Counterparty risk involving futures is mitigated because a regulated clearinghouse is the counterparty instead of the clearing broker. To further mitigate counterparty risk, the fund trades futures contracts on an exchange, monitors the financial strength of its clearing brokers and clearinghouse, and has entered into clearing agreements with its clearing brokers. The clearinghouse imposes initial margin requirements to secure the fund’s performance and requires daily settlement of variation margin representing changes in the market value of each contract. Any assets pledged as initial margin for open contracts are noted in the Statement of Net Assets.
21
Global Equity Fund
The fund enters into forward currency contracts to provide the appropriate currency exposure related to any open futures contracts or to protect the value of securities and related receivables and payables against changes in foreign exchange rates. The fund’s risks in using these contracts include movement in the values of the foreign currencies relative to the U.S. dollar and the ability of the counterparties to fulfill their obligations under the contracts. The fund mitigates its counterparty risk by entering into forward currency contracts only with a diverse group of prequalified counterparties, monitoring their financial strength, entering into master netting arrangements with its counterparties, and requiring its counterparties to transfer collateral as security for their performance. In the absence of a default, the collateral pledged or received by the fund cannot be repledged, resold, or rehypothecated. The master netting arrangements provide that, in the event of a counterparty’s default (including bankruptcy), the fund may terminate the forward currency contracts, determine the net amount owed by either party in accordance with its master netting arrangements, and sell or retain any collateral held up to the net amount owed to the fund under the master netting arrangements. The forward currency contracts contain provisions whereby a counterparty may terminate open contracts if the fund’s net assets decline below a certain level, triggering a payment by the fund if the fund is in a net liability position at the time of the termination. The payment amount would be reduced by any collateral the fund has pledged. Any assets pledged as collateral for open contracts are noted in the Statement of Net Assets. The value of collateral received or pledged is compared daily to the value of the forward currency contracts exposure with each counterparty, and any difference, if in excess of a specified minimum transfer amount, is adjusted and settled within two business days.
Futures contracts are valued at their quoted daily settlement prices. Forward currency contracts are valued at their quoted daily prices obtained from an independent third party, adjusted for currency risk based on the expiration date of each contract. The notional amounts of the contracts are not recorded in the Statement of Net Assets. Fluctuations in the value of the contracts are recorded in the Statement of Assets and Liabilities as an asset (liability) and in the Statement of Operations as unrealized appreciation (depreciation) until the contracts are closed, when they are recorded as realized gains (losses) on futures or forward currency contracts.
During the year ended September 30, 2019, the fund’s average investments in long and short futures contracts represented 2% and 0% of net assets, respectively, based on the average of the notional amounts at each quarter-end during the period. The fund’s average investment in forward currency contracts represented less than 1% of net assets, based on the average of the notional amounts at each quarter-end during the period.
4. Federal Income Taxes: The fund intends to continue to qualify as a regulated investment company and distribute all of its taxable income. Management has analyzed the fund’s tax positions taken for all open federal income tax years (September 30, 2016–2019), and has concluded that no provision for federal income tax is required in the fund’s financial statements.
5. Distributions: Distributions to shareholders are recorded on the ex-dividend date. Distributions are determined on a tax basis and may differ from net investment income and realized capital gains for financial reporting purposes.
6. Securities Lending: To earn additional income, the fund lends its securities to qualified institutional borrowers. Security loans are subject to termination by the fund at any time, and are required to be secured at all times by collateral in an amount at least equal to the market value of securities loaned. Daily market fluctuations could cause the value of loaned securities to be more or less than the value of the collateral received. When this occurs, the collateral is adjusted and
22
Global Equity Fund
settled before the opening of the market on the next business day. The fund further mitigates its counterparty risk by entering into securities lending transactions only with a diverse group of prequalified counterparties, monitoring their financial strength, and entering into master securities lending agreements with its counterparties. The master securities lending agreements provide that, in the event of a counterparty’s default (including bankruptcy), the fund may terminate any loans with that borrower, determine the net amount owed, and sell or retain the collateral up to the net amount owed to the fund; however, such actions may be subject to legal proceedings. While collateral mitigates counterparty risk, in the event of a default, the fund may experience delays and costs in recovering the securities loaned. The fund invests cash collateral received in Vanguard Market Liquidity Fund, and records a liability in the Statement of Assets and Liabilities for the return of the collateral, during the period the securities are on loan. Securities lending income represents fees charged to borrowers plus income earned on invested cash collateral, less expenses associated with the loan. During the term of the loan, the fund is entitled to all distributions made on or in respect of the loaned securities.
7. Credit Facility: The fund and certain other funds managed by The Vanguard Group (“Vanguard”) participate in a $4.3 billion committed credit facility provided by a syndicate of lenders pursuant to a credit agreement that may be renewed annually; each fund is individually liable for its borrowings, if any, under the credit facility. Borrowings may be utilized for temporary and emergency purposes, and are subject to the fund’s regulatory and contractual borrowing restrictions. The participating funds are charged administrative fees and an annual commitment fee of 0.10% of the undrawn amount of the facility; these fees are allocated to the funds based on a method approved by the fund’s board of trustees and included in Management and Administrative expenses on the fund’s Statement of Operations. Any borrowings under this facility bear interest at a rate based upon the higher of the one-month London Interbank Offered Rate, federal funds effective rate, or overnight bank funding rate plus an agreed-upon spread.
The fund had no borrowings outstanding at September 30, 2019, or at any time during the period then ended.
8. Other: Dividend income is recorded on the ex-dividend date. Interest income includes income distributions received from Vanguard Market Liquidity Fund and is accrued daily. Premiums and discounts on debt securities purchased are amortized and accreted, respectively, to interest income over the lives of the respective securities. Security transactions are accounted for on the date securities are bought or sold. Costs used to determine realized gains (losses) on the sale of investment securities are those of the specific securities sold.
Taxes on foreign dividends and capital gains have been provided for in accordance with the fund’s understanding of the applicable countries’ tax rules and rates. The fund has filed tax reclaims for previously withheld taxes on dividends earned in certain European Union countries. These filings are subject to various administrative and judicial proceedings within these countries. Such tax reclaims received during the year, if any, are included in dividend income. No other amounts for additional tax reclaims are reflected in the financial statements due to the uncertainty as to the ultimate resolution of proceedings, the likelihood of receipt of these reclaims, and the potential timing of payment.
B. The investment advisory firms Marathon Asset Management LLP and Baillie Gifford Overseas Ltd. each provide investment advisory services to a portion of the fund for a fee calculated at an annual percentage rate of average net assets managed by the advisor. The basic fees of Marathon Asset Management LLP and Baillie Gifford Overseas Ltd. are subject to quarterly adjustments
23
Global Equity Fund
based on performance relative to the MSCI All Country World Index for the preceding three years. Until November 2018, a portion of the fund was managed by Acadian Asset Management LLC. The basic fee paid to Acadian Asset Management LLC was subject to quarterly adjustments based on performance relative to the MSCI All Country World Index for the preceding three years.
Vanguard manages the cash reserves of the fund as described below.
For the year ended September 30, 2019, the aggregate investment advisory fee represented an effective annual basic rate of 0.23% of the fund’s average net assets, before a net increase of $1,453,000 (0.02%) based on performance.
C. In accordance with the terms of a Funds’ Service Agreement (the “FSA”) between Vanguard and the fund, Vanguard furnishes to the fund corporate management, administrative, marketing, distribution, and cash management services at Vanguard’s cost of operations (as defined by the FSA). These costs of operations are allocated to the fund based on methods and guidelines approved by the board of trustees. Vanguard does not require reimbursement in the current period for certain costs of operations (such as deferred compensation/benefits and risk/insurance costs); the fund’s liability for these costs of operations is included in Payables to Vanguard on the Statement of Assets and Liabilities. All other costs of operations payable to Vanguard are generally settled twice a month.
Upon the request of Vanguard, the fund may invest up to 0.40% of its net assets as capital in Vanguard. At September 30, 2019, the fund had contributed to Vanguard capital in the amount of $306,000, representing less than 0.01% of the fund’s net assets and 0.12% of Vanguard’s capital received pursuant to the FSA. The fund’s trustees and officers are also directors and employees, respectively, of Vanguard.
D. Various inputs may be used to determine the value of the fund’s investments. These inputs are summarized in three broad levels for financial statement purposes. The inputs or methodologies used to value securities are not necessarily an indication of the risk associated with investing in those securities.
Level 1—Quoted prices in active markets for identical securities.
Level 2—Other significant observable inputs (including quoted prices for similar securities, interest rates, prepayment speeds, credit risk, etc.).
Level 3—Significant unobservable inputs (including the fund’s own assumptions used to determine the fair value of investments). Any investments valued with significant unobservable inputs are noted on the Statement of Net Assets.
24
Global Equity Fund
The following table summarizes the market value of the fund’s investments and derivatives as of September 30, 2019, based on the inputs used to value them:
| | Level 1 | | Level 2 | | Level 3 | |
Investments | | ($000 | ) | ($000 | ) | ($000 | ) |
Common Stocks—International | | 631,883 | | 2,425,320 | | — | |
Common Stocks—United States | | 3,181,855 | | 441 | | — | |
Temporary Cash Investments | | 291,792 | | 6,735 | | — | |
Futures Contracts—Assets1 | | 865 | | — | | — | |
Futures Contracts—Liabilities1 | | (175 | ) | — | | — | |
Forward Currency Contracts—Assets | | — | | 16 | | — | |
Forward Currency Contracts—Liabilities | | — | | (356 | ) | — | |
Total | | 4,106,220 | | 2,432,156 | | — | |
1 Represents variation margin on the last day of the reporting period.
E. At September 30, 2019, the fair values of derivatives were reflected in the Statement of Assets and Liabilities as follows:
| | | | Foreign | | | |
| | Equity | | Exchange | | | |
| | Contracts | | Contracts | | Total | |
Statement of Assets and Liabilities Caption | | ($000 | ) | ($000 | ) | ($000 | ) |
Variation Margin Receivable—Futures Contracts | | 865 | | — | | 865 | |
Unrealized Appreciation—Forward Currency Contracts | | — | | 16 | | 16 | |
Total Assets | | 865 | | 16 | | 881 | |
| | | | | | | |
Variation Margin Payable—Futures Contracts | | (175 | ) | — | | (175 | ) |
Unrealized Depreciation—Forward Currency Contracts | | — | | (356 | ) | (356 | ) |
Total Liabilities | | (175 | ) | (356 | ) | (531 | ) |
Realized net gain (loss) and the change in unrealized appreciation (depreciation) on derivatives for the year ended September 30, 2019, were:
| | | | Foreign | | | |
| | Equity | | Exchange | | | |
| | Contracts | | Contracts | | Total | |
Realized Net Gain (Loss) on Derivatives | | ($000 | ) | ($000 | ) | ($000 | ) |
Futures Contracts | | 6,488 | | — | | 6,488 | |
Forward Currency Contracts | | — | | (2,535 | ) | (2,535 | ) |
Realized Net Gain (Loss) on Derivatives | | 6,488 | | (2,535 | ) | 3,953 | |
| | | | | | | |
Change in Unrealized Appreciation (Depreciation) on Derivatives | | | | | | | |
Futures Contracts | | (2,003 | ) | — | | (2,003 | ) |
Forward Currency Contracts | | — | | 154 | | 154 | |
Change in Unrealized Appreciation (Depreciation) on Derivatives | | (2,003 | ) | 154 | | (1,849 | ) |
25
Global Equity Fund
F. Permanent differences between book-basis and tax-basis components of net assets are reclassified among capital accounts in the financial statements to reflect their tax character. These reclassifications have no effect on net assets or net asset value per share. As of period end, permanent differences primarily attributable to the accounting for foreign currency transactions, passive foreign investment companies, distributions in connection with fund share redemptions, and tax expense on capital gains were reclassified between the following accounts:
| | Amount | |
| | ($000 | ) |
Paid-in Capital | | 21,491 | |
Total Distributable Earnings (Loss) | | (21,491 | ) |
Temporary differences between book-basis and tax-basis components of total distributable earnings (loss) arise when certain items of income, gain, or loss are recognized in different periods for financial statement and tax purposes; these differences will reverse at some time in the future. The differences are primarily related to the tax deferral of losses on wash sales; the realization of unrealized gains or losses on certain futures contracts and forward currency contracts; and unrealized gains on passive foreign investment companies. As of period end, the tax-basis components of total distributable earnings (loss) are detailed in the table as follows:
| | Amount | |
| | ($000 | ) |
Undistributed Ordinary Income | | 142,690 | |
Undistributed Long-Term Gains | | 246,945 | |
Capital Loss Carryforwards (Non-expiring) | | — | |
Net Unrealized Gains (Losses) | | 1,016,663 | |
As of September 30, 2019, gross unrealized appreciation and depreciation for investments and derivatives based on cost for U.S. federal income tax purposes were as follows:
| | Amount | |
| | ($000 | ) |
Tax Cost | | 5,521,510 | |
Gross Unrealized Appreciation | | 1,347,087 | |
Gross Unrealized Depreciation | | (330,071 | ) |
Net Unrealized Appreciation (Depreciation) | | 1,017,016 | |
G. During the year ended September 30, 2019, the fund purchased $3,433,748,000 of investment securities and sold $2,799,775,000 of investment securities, other than temporary cash investments.
26
Global Equity Fund
H. Capital shares issued and redeemed were:
| | Year Ended September 30, | |
| | 2019 | | 2018 | |
| | Shares | | Shares | |
| | (000 | ) | (000 | ) |
Issued | | 52,576 | | 23,286 | |
Issued in Lieu of Cash Distributions | | 13,666 | | 2,178 | |
Redeemed | | (31,277 | ) | (28,299 | ) |
Net Increase (Decrease) in Shares Outstanding | | 34,965 | | (2,835 | ) |
I. Transactions during the period in investments where the issuer is another member of The Vanguard Group were as follows:
| | | | Current Period Transactions | | | |
| | Sept. 30, | | | | Proceeds | | Realized | | Change | | | | | | Sept. 30, | |
| | 2018 | | | | from | | Net | | in Net | | | | Capital Gain | | 2019 | |
| | Market | | Purchases | | Securities | | Gain | | Unrealized | | | | Distributions | | Market | |
| | Value | | at Cost | | Sold | | (Loss | ) | App. (Dep. | ) | Income | | Received | | Value | |
| | ($000 | ) | ($000 | ) | ($000 | ) | ($000 | ) | ($000 | ) | ($000 | ) | ($000 | ) | ($000 | ) |
Vanguard FTSE Emerging Markets ETF | | 21,093 | | 84,479 | | 83,116 | | (2,594 | ) | 3,048 | | 560 | | — | | 22,910 | |
Vanguard Market Liquidity Fund | | 256,293 | | NA1 | | NA1 | | 14 | | 44 | | 6,077 | | — | | 291,792 | |
Total | | 277,386 | | | | | | (2,580 | ) | 3,092 | | 6,637 | | — | | 314,702 | |
1 Not applicable—purchases and sales are for temporary cash investment purposes.
J. Management has determined that no events or transactions occurred subsequent to September 30, 2019, that would require recognition or disclosure in these financial statements.
27
Report of Independent Registered Public Accounting Firm
To the Board of Trustees of Vanguard Horizon Funds and Shareholders of Vanguard Global Equity Fund
Opinion on the Financial Statements
We have audited the accompanying statement of net assets—investments summary and statement of assets and liabilities of Vanguard Global Equity Fund (one of the funds constituting Vanguard Horizon Funds, referred to hereafter as the “Fund”) as of September 30, 2019, the related statement of operations for the year ended September 30, 2019, the statement of changes in net assets for each of the two years in the period ended September 30, 2019, including the related notes, and the financial highlights for each of the five years in the period ended September 30, 2019 (collectively referred to as the “financial statements”). In our opinion, the financial statements present fairly, in all material respects, the financial position of the Fund as of September 30, 2019, the results of its operations for the year then ended, the changes in its net assets for each of the two years in the period ended September 30, 2019 and the financial highlights for each of the five years in the period ended September 30, 2019 in conformity with accounting principles generally accepted in the United States of America.
Basis for Opinion
These financial statements are the responsibility of the Fund’s management. Our responsibility is to express an opinion on the Fund’s financial statements based on our audits. We are a public accounting firm registered with the Public Company Accounting Oversight Board (United States) (“PCAOB”) and are required to be independent with respect to the Fund in accordance with the U.S. federal securities laws and the applicable rules and regulations of the Securities and Exchange Commission and the PCAOB.
We conducted our audits of these financial statements in accordance with the standards of the PCAOB. Those standards require that we plan and perform the audit to obtain reasonable assurance about whether the financial statements are free of material misstatement, whether due to error or fraud.
Our audits included performing procedures to assess the risks of material misstatement of the financial statements, whether due to error or fraud, and performing procedures that respond to those risks. Such procedures included examining, on a test basis, evidence regarding the amounts and disclosures in the financial statements. Our audits also included evaluating the accounting principles used and significant estimates made by management, as well as evaluating the overall presentation of the financial statements. Our procedures included confirmation of securities owned as of September 30, 2019 by correspondence with the custodian and brokers and by agreement to the underlying ownership records of the transfer agent; when replies were not received from brokers, we performed other auditing procedures. We believe that our audits provide a reasonable basis for our opinion.
/s/PricewaterhouseCoopers LLP
Philadelphia, Pennsylvania
November 19, 2019
We have served as the auditor of one or more investment companies in The Vanguard Group of Funds since 1975.
28
Special 2019 tax information (unaudited) for Vanguard Global Equity Fund
This information for the fiscal year ended September 30, 2019, is included pursuant to provisions of the Internal Revenue Code.
The fund distributed $328,134,000 as capital gain dividends (20% rate gain distributions) to shareholders during the fiscal year.
The fund distributed $72,598,000 of qualified dividend income to shareholders during the fiscal year.
For corporate shareholders, 21.5% of investment income (dividend income plus short-term gains, if any) qualifies for the dividends-received deduction.
29
This page intentionally left blank.
The People Who Govern Your Fund
The trustees of your mutual fund are there to see that the fund is operated and managed in your best interests since, as a shareholder, you are a part owner of the fund. Your fund’s trustees also serve on the board of directors of The Vanguard Group, Inc., which is owned by the Vanguard funds and provides services to them.
A majority of Vanguard’s board members are independent, meaning that they have no affiliation with Vanguard or the funds they oversee, apart from the sizable personal investments they have made as private individuals. The independent board members have distinguished backgrounds in business, academia, and public service. Each of the trustees and executive officers oversees 212 Vanguard funds.
Information for each trustee and executive officer of the fund appears below. That information, as well as the Vanguard fund count, is as of the date on the cover of this fund report. The mailing address of the trustees and officers is P.O. Box 876, Valley Forge, PA 19482. More information about the trustees is in the Statement of Additional Information, which can be obtained, without charge, by contacting Vanguard at 800-662-7447, or online at vanguard.com.
Interested Trustee1
Mortimer J. Buckley
Born in 1969. Trustee since January 2018. Principal occupation(s) during the past five years and other experience: chairman of the board (January 2019–present) of Vanguard and of each of the investment companies served by Vanguard; chief executive officer (January 2018–present) of Vanguard; chief executive officer, president, and trustee (January 2018–present) of each of the investment companies served by Vanguard; president and director (2017–present) of Vanguard; and president (February 2018–present) of Vanguard Marketing Corporation. Chief investment officer (2013–2017), managing director (2002–2017), head of the Retail Investor Group (2006–2012), and chief information officer (2001–2006) of Vanguard. Chairman of the board (2011–2017) and trustee (2009–2017) of the Children’s Hospital of Philadelphia; trustee (2018–present) of The Shipley School.
Independent Trustees
Emerson U. Fullwood
Born in 1948. Trustee since January 2008. Principal occupation(s) during the past five years and other experience: executive chief staff and marketing officer for North America and corporate vice president (retired 2008) of Xerox Corporation (document management products and services). Former president of the Worldwide Channels Group, Latin America, and Worldwide Customer Service and executive chief staff officer of Developing Markets of Xerox. Executive in residence and 2009–2010 Distinguished Minett Professor at the Rochester Institute of Technology. Director of SPX FLOW, Inc. (multi-industry manufacturing). Director of the University of Rochester Medical Center, the Monroe Community College Foundation, the United Way of Rochester, North Carolina A&T University, and Roberts Wesleyan College. Trustee of the University of Rochester.
Amy Gutmann
Born in 1949. Trustee since June 2006. Principal occupation(s) during the past five years and other experience: president (2004–present) of the University of Pennsylvania. Christopher H. Browne Distinguished Professor of Political Science, School of Arts and Sciences, and professor of communication, Annenberg School for Communication, with secondary faculty appointments in the Department of Philosophy, School of Arts and Sciences, and at the Graduate School of Education, University of Pennsylvania. Trustee of the National Constitution Center.
F. Joseph Loughrey
Born in 1949. Trustee since October 2009. Principal occupation(s) during the past five years and other experience: president and chief operating officer (retired 2009) and vice chairman of the board (2008–2009) of Cummins Inc. (industrial machinery). Chairman of the board of Hillenbrand, Inc. (specialized consumer services), and the Lumina Foundation.
1 Mr. Buckley is considered an “interested person,” as defined in the Investment Company Act of 1940, because he is an officer of the Vanguard funds.
Director of the V Foundation and Oxfam America. Member of the advisory council for the College of Arts and Letters and chair of the advisory board to the Kellogg Institute for International Studies, both at the University of Notre Dame.
Mark Loughridge
Born in 1953. Trustee since March 2012. Principal occupation(s) during the past five years and other experience: senior vice president and chief financial officer (retired 2013) of IBM (information technology services). Fiduciary member of IBM’s Retirement Plan Committee (2004–2013), senior vice president and general manager (2002–2004) of IBM Global Financing, vice president and controller (1998–2002) of IBM, and a variety of other prior management roles at IBM. Member of the Council on Chicago Booth.
Scott C. Malpass
Born in 1962. Trustee since March 2012. Principal occupation(s) during the past five years and other experience: chief investment officer (1989–present) and vice president (1996–present) of the University of Notre Dame. Assistant professor of finance at the Mendoza College of Business, University of Notre Dame, and member of the Notre Dame 403(b) Investment Committee. Chairman of the board of TIFF Advisory Services, Inc. Member of the board of Catholic Investment Services, Inc. (investment advisors) and the board of superintendence of the Institute for the Works of Religion.
Deanna Mulligan
Born in 1963. Trustee since January 2018. Principal occupation(s) during the past five years and other experience: president (2010–present) and chief executive officer (2011–present) of The Guardian Life Insurance Company of America. Chief operating officer (2010–2011) and executive vice president (2008–2010) of Individual Life and Disability of The Guardian Life Insurance Company of America. Member of the board of The Guardian Life Insurance Company of America, the American Council of Life Insurers, the Partnership for New York City (business leadership), and the Committee Encouraging Corporate Philanthropy. Trustee of the Economic Club of New York and the Bruce Museum (arts and science). Member of the Advisory Council for the Stanford Graduate School of Business.
André F. Perold
Born in 1952. Trustee since December 2004. Principal occupation(s) during the past five years and other experience: George Gund Professor of Finance and Banking, Emeritus at the Harvard Business School (retired 2011). Chief investment officer and co-managing partner of HighVista Strategies LLC (private investment firm). Board of advisors and investment committee member of the Museum of Fine Arts Boston. Board member (2018–present) of RIT Capital Partners (investment firm); investment committee member of Partners Health Care System.
Sarah Bloom Raskin
Born in 1961. Trustee since January 2018. Principal occupation(s) during the past five years and other experience: deputy secretary (2014–2017) of the United States Department of the Treasury. Governor (2010–2014) of the Federal Reserve Board. Commissioner (2007–2010) of financial regulation for the State of Maryland. Member of the board of directors (2012–2014) of Neighborhood Reinvestment Corporation. Director (2017–present) of i(x) Investments, LLC; director (2017–present) of Reserve Trust. Rubinstein Fellow (2017–present) of Duke University; trustee (2017–present) of Amherst College.
Peter F. Volanakis
Born in 1955. Trustee since July 2009. Principal occupation(s) during the past five years and other experience: president and chief operating officer (retired 2010) of Corning Incorporated (communications equipment) and director of Corning Incorporated (2000–2010) and Dow Corning (2001–2010). Director (2012) of SPX Corporation (multi-industry manufacturing). Overseer of the Amos Tuck School of Business Administration, Dartmouth College (2001–2013). Chairman of the board of trustees of Colby-Sawyer College. Member of the board of Hypertherm Inc. (industrial cutting systems, software, and consumables).
Executive Officers
Glenn Booraem
Born in 1967. Principal occupation(s) during the past five years and other experience: principal of Vanguard. Investment stewardship officer (2017–present), treasurer (2015–2017), controller (2010–2015), and assistant controller (2001–2010) of each of the investment companies served by Vanguard.
Christine M. Buchanan
Born in 1970. Principal occupation(s) during the past five years and other experience: principal of Vanguard and global head of Fund Administration at Vanguard. Treasurer (2017–present) of each of the investment companies served by Vanguard. Partner (2005–2017) at KPMG LLP (audit, tax, and advisory services).
Thomas J. Higgins
Born in 1957. Principal occupation(s) during the past five years and other experience: principal of Vanguard. Chief financial officer (2008–present) and treasurer (1998–2008) of each of the investment companies served by Vanguard.
Peter Mahoney
Born in 1974. Principal occupation(s) during the past five years and other experience: principal of Vanguard. Controller (2015–present) of each of the investment companies served by Vanguard. Head of International Fund Services (2008–2014) at Vanguard.
Anne E. Robinson
Born in 1970. Principal occupation(s) during the past five years and other experience: general counsel (2016–present) of Vanguard. Secretary (2016–present) of Vanguard and of each of the investment companies served by Vanguard. Managing director (2016–present) of Vanguard. Director and senior vice president (2016–2018) of Vanguard Marketing Corporation. Managing director and general counsel of Global Cards and Consumer Services (2014–2016) at Citigroup. Counsel (2003–2014) at American Express.
Michael Rollings
Born in 1963. Principal occupation(s) during the past five years and other experience: finance director (2017–present) and treasurer (2017) of each of the investment companies served by Vanguard. Managing director (2016–present) of Vanguard. Chief financial officer (2016–present) of Vanguard. Director (2016–present) of Vanguard Marketing Corporation. Executive vice president and chief financial officer (2006–2016) of MassMutual Financial Group.
John E. Schadl
Born in 1972. Principal occupation(s) during the past five years and other experience: principal of Vanguard. Chief compliance officer (2019–present) of Vanguard and of each of the investment companies served by Vanguard. Assistant vice president (May 2019–present) of Vanguard Marketing Corporation.
Vanguard Senior Management Team
Joseph Brennan | Chris D. McIsaac |
Mortimer J. Buckley | James M. Norris |
Gregory Davis | Thomas M. Rampulla |
John James | Karin A. Risi |
Martha G. King | Anne E. Robinson |
John T. Marcante | Michael Rollings |
| 
P.O. Box 2600 Valley Forge, PA 19482-2600 |
Connect with Vanguard® > vanguard.com
Fund Information > 800-662-7447
Direct Investor Account Services > 800-662-2739
Institutional Investor Services > 800-523-1036
Text Telephone for People
Who Are Deaf or Hard of Hearing > 800-749-7273
This material may be used in conjunction with the offering of shares of any Vanguard fund only if preceded or accompanied by the fund’s current prospectus.
All comparative mutual fund data are from Morningstar, Inc., unless otherwise noted.
You can obtain a free copy of Vanguard’s proxy voting guidelines by visiting vanguard.com/proxyreporting or by calling Vanguard at 800-662-2739. The guidelines are also available from the SEC’s website, www.sec.gov. In addition, you may obtain a free report on how your fund voted the proxies for securities it owned during the 12 months ended June 30. To get the report, visit either vanguard.com/proxyreporting or www.sec.gov.
You can review information about your fund on the SEC’s website, and you can receive copies of this information, for a fee, by sending a request via email addressed to publicinfo@sec.gov.
Source for Bloomberg Barclays indexes: Bloomberg Index Services Limited. Copyright 2019, Bloomberg. All rights reserved.
CFA® is a registered trademark owned by CFA Institute.
| © 2019 The Vanguard Group, Inc. |
| All rights reserved. |
| Vanguard Marketing Corporation, Distributor. |
| |
| Q1290 112019 |

Annual Report | September 30, 2019 Vanguard Strategic Small-Cap Equity Fund |
See the inside front cover for important information about access to your fund’s annual and semiannual shareholder reports. |
Important information about access to shareholder reports
Beginning on January 1, 2021, as permitted by regulations adopted by the Securities and Exchange Commission, paper copies of your fund’s annual and semiannual shareholder reports will no longer be sent to you by mail, unless you specifically request them. Instead, you will be notified by mail each time a report is posted on the website and will be provided with a link to access the report.
If you have already elected to receive shareholder reports electronically, you will not be affected by this change and do not need to take any action. You may elect to receive shareholder reports and other communications from the fund electronically by contacting your financial intermediary (such as a broker-dealer or bank) or, if you invest directly with the fund, by calling Vanguard at one of the phone numbers on the back cover of this report or by logging on to vanguard.com.
You may elect to receive paper copies of all future shareholder reports free of charge. If you invest through a financial intermediary, you can contact the intermediary to request that you continue to receive paper copies. If you invest directly with the fund, you can call Vanguard at one of the phone numbers on the back cover of this report or log on to vanguard.com. Your election to receive paper copies will apply to all the funds you hold through an intermediary or directly with Vanguard.
Contents | |
| |
A Note From Our Chairman | 1 |
Your Fund’s Performance at a Glance | 2 |
Advisor’s Report | 3 |
About Your Fund’s Expenses | 5 |
Performance Summary | 7 |
Financial Statements | 9 |
Please note: The opinions expressed in this report are just that—informed opinions. They should not be considered promises or advice. Also, please keep in mind that the information and opinions cover the period through the date on the front of this report. Of course, the risks of investing in your fund are spelled out in the prospectus.
A Note From Our Chairman

Tim Buckley
Chairman and Chief Executive Officer
Dear Shareholder,
Recent volatility in financial markets—affecting stocks, bonds, and commodities—has been a good reminder of the wise old adage, “Never keep all your eggs in one basket.” Maintaining balance and diversification in your investment portfolio can help to both limit risk and set you up for long-term success.
It’s understandable why some investors might become complacent after a long market run-up like the one that lifted stock prices, especially U.S. stock prices, in the years following the global financial crisis. But failing to rebalance regularly can leave a portfolio with a much different mix of assets than intended and, often, more risk than intended.
Balance across and diversification within asset classes are powerful tools for managing risk and achieving your investment goals. A portfolio’s allocation will determine a large portion of its long-term return and also the majority of its volatility risk. A well-diversified portfolio is less vulnerable to significant swings in the performance of any one segment of the asset classes in which it invests.
Balance and diversification will never eliminate the risk of loss, nor will they guarantee positive returns in a declining market. But they should reduce the chance that you’ll suffer disproportionate losses in one particular high-flying asset class or sector when it comes back to earth. And exposure to all key market components should give you at least some participation in the sectors that are performing best at any given time.
Vanguard is committed to helping you achieve balance and diversification in your portfolios to help meet your investment goals. We thank you for your continued loyalty.
Sincerely,

Mortimer J. Buckley
Chairman and Chief Executive Officer
October 14, 2019
1
Your Fund’s Performance at a Glance
· Vanguard Strategic Small-Cap Equity Fund returned–2.91% for the 12 months ended September 30, 2019. It lagged its benchmark, which returned–6.93%.
· Using proprietary valuation models to identify the most attractive stocks in the MSCI US Small Cap 1750 Index, the fund seeks long-term capital appreciation by investing in domestic small-capitalization stocks. Individual stocks are selected based on variables that include improving fundamentals and steady cash flow.
· Ten of the 11 industry sectors in the fund detracted from relative performance; only information technology contributed positive results. Health care, energy, and consumer discretionary were the biggest laggards.
· For the ten years ended September 30, the fund’s average annual return of 12.13% exceeded that of its benchmark, which returned 11.95%.
Market Barometer
| Average Annual Total Returns |
| Periods Ended September 30, 2019 |
| One Year | Three Years | Five Years |
Stocks | | | |
Russell 1000 Index (Large-caps) | 3.87% | 13.19% | 10.62% |
Russell 2000 Index (Small-caps) | -8.89 | 8.23 | 8.19 |
Russell 3000 Index (Broad U.S. market) | 2.92 | 12.83 | 10.44 |
FTSE All-World ex US Index (International) | -1.12 | 6.46 | 3.24 |
| | | |
Bonds | | | |
Bloomberg Barclays U.S. Aggregate Bond Index | | | |
(Broad taxable market) | 10.30% | 2.92% | 3.38% |
Bloomberg Barclays Municipal Bond Index | | | |
(Broad tax-exempt market) | 8.55 | 3.19 | 3.66 |
FTSE Three-Month U.S. Treasury Bill Index | 2.36 | 1.52 | 0.95 |
| | | |
CPI | | | |
Consumer Price Index | 1.71% | 2.07% | 1.53% |
2
Advisor’s Report
For the 12 months ended September 30, 2019, Vanguard Strategic Small-Cap Equity Fund returned –12.91%. It lagged its benchmark, the MSCI US Small Cap 1750 Index, which returned –6.93%.
Investment objective and strategy
Although we consider it important to understand how overall performance is affected by macroeconomic factors, our approach to investing focuses on specific fundamentals, not technical analysis of stock price movements. We compare stocks within industry groups to identify those we believe will outperform over time.
Our strict quantitative approach evaluates a stock’s attractiveness based on five key characteristics: high quality, with healthy balance sheets and steady cash flow generation; effective management decisions, including sound investment policies that favor internal over external funding; consistent earnings growth, with the ability to grow earnings year after year; strong market sentiment, or market confirmation of our view; and reasonable valuation, focused on avoiding overpriced stocks.
Using these five themes, we generate a daily composite stock ranking, seeking to capitalize on market inefficiencies. We then monitor our portfolio based on those rankings and adjust when appropriate to maximize expected returns and minimize exposure to risks that our research indicates don’t improve returns (such as industry selection and other risks relative to the benchmark).
Investment environment
Although the broad-market Russell 3000 Index of U.S. stocks advanced nearly 3%, the recent macroeconomic environment—characterized by high economic and policy uncertainty, low GDP growth, and low interest rates—contributed to some extraordinary trends. They include the following:
· Value underperformance. The markets have experienced the longest stretch of value underperformance since the dot-com bubble burst in 2000. Investors have flocked to high-growth-potential companies, hoping for higher expected returns without necessarily looking at the underlying earnings. Those companies then trade at inflated valuations that are increasingly diverging from those of value companies.
· Trading on sentiment. The equity market has been trading mostly on sentiment. Investors have reacted to macroeconomic shocks such as tariffs and Federal Reserve rate announcements while largely ignoring fundamentals (such as quality and growth) since the spring of 2018.
· Junk rally. A rally during which stocks with high valuations and low-quality earnings have outperformed began in January 2019. It has been a risk-on and fundamental-off market, with investors giving up safety for returns.
Although markets such as the current one can be challenging, it is crucial to maintain a long-term focus. These conditions are
3
not unusual at the late stage of a business cycle; investors should expect to see them at least once.
Just like any other form of active equity strategy, ours is designed to deliver long-term outperformance. Often, quantitatively driven funds are some of the first to bounce back after a drop in the markets. They can weather unpredictability through expert portfolio managers, analysts, and traders who stay focused on historical trends and perform regular, in-depth data analysis.
Our successes and shortfalls
Against the fiscal year’s unusual backdrop, the fund lagged across the board as all five of our decision models did not perform as expected. Ten of its 11 industry sectors detracted on a relative basis. Only information technology contributed positively; health care, consumer discretionary, and energy were the biggest detractors.
The portfolio benefited from SolarEdge Technologies and Booz Allen Hamilton in information technology, Tandem Diabetes Care in health care, FTI Consulting in industrials, and RH in consumer discretionary. The greatest shortfalls came from Denbury Resources and California Resources in energy and Endo International, Mallinckrodt, and Acorda Therapeutics in health care.
We believe that the Strategic Small-Cap Equity Fund offers a strong mix of stocks with attractive valuations and growth characteristics relative to its benchmark. Although we recognize that risk can reward or punish us over the near term, we believe that constructing a portfolio that emphasizes our key fundamentals through different market environments will benefit investors over the long term.
We thank you for your investment and look forward to the coming fiscal year.
Portfolio Managers:
James P. Stetler
Binbin Guo, Principal, Head of Alpha Equity Investments
Vanguard Quantitative Equity Group
October 16, 2019
4
About Your Fund’s Expenses
As a shareholder of the fund, you incur ongoing costs, which include costs for portfolio management, administrative services, and shareholder reports (like this one), among others. Operating expenses, which are deducted from a fund’s gross income, directly reduce the investment return of the fund.
A fund’s expenses are expressed as a percentage of its average net assets. This figure is known as the expense ratio. The following examples are intended to help you understand the ongoing costs (in dollars) of investing in your fund and to compare these costs with those of other mutual funds. The examples are based on an investment of $1,000 made at the beginning of the period shown and held for the entire period.
The accompanying table illustrates your fund’s costs in two ways:
· Based on actual fund return. This section helps you to estimate the actual expenses that you paid over the period. The “Ending Account Value” shown is derived from the fund’s actual return, and the third column shows the dollar amount that would have been paid by an investor who started with $1,000 in the fund. You may use the information here, together with the amount you invested, to estimate the expenses that you paid over the period.
To do so, simply divide your account value by $1,000 (for example, an $8,600 account value divided by $1,000 = 8.6), then multiply the result by the number given for your fund under the heading “Expenses Paid During Period.”
· Based on hypothetical 5% yearly return. This section is intended to help you compare your fund’s costs with those of other mutual funds. It assumes that the fund had a yearly return of 5% before expenses, but that the expense ratio is unchanged. In this case—because the return used is not the fund’s actual return—the results do not apply to your investment. The example is useful in making comparisons because the Securities and Exchange Commission requires all mutual funds to calculate expenses based on a 5% return. You can assess your fund’s costs by comparing this hypothetical example with the hypothetical examples that appear in shareholder reports of other funds.
Note that the expenses shown in the table are meant to highlight and help you compare ongoing costs only and do not reflect transaction costs incurred by the fund for buying and selling securities. Further, the expenses do not include any purchase, redemption, or account service fees described in the fund prospectus. If such fees were applied to your account, your costs would be higher. Your fund does not carry a “sales load.”
The calculations assume no shares were bought or sold during the period. Your actual costs may have been higher or lower, depending on the amount of your investment and the timing of any purchases or redemptions.
You can find more information about the fund’s expenses, including annual expense ratios, in the Financial Statements section of this report. For additional information on operating expenses and other shareholder costs, please refer to your fund’s current prospectus.
5
Six Months Ended September 30, 2019
| Beginning | Ending | Expenses |
| Account Value | Account Value | Paid During |
Strategic Small-Cap Equity Fund | 3/31/2019 | 9/30/2019 | Period |
Based on Actual Fund Return | $1,000.00 | $987.74 | $1.15 |
Based on Hypothetical 5% Yearly Return | 1,000.00 | 1,023.92 | 1.17 |
The calculations are based on expenses incurred in the most recent six-month period. The fund’s annualized six-month expense ratio for that period is 0.23%. The dollar amounts shown as “Expenses Paid” are equal to the annualized expense ratio multiplied by the average account value over the period, multiplied by the number of days in the most recent six-month period, then divided by the number of days in the most recent 12-month period (183/365).
6
Strategic Small-Cap Equity Fund
Performance Summary
All of the returns in this report represent past performance, which is not a guarantee of future results that may be achieved by the fund. (Current performance may be lower or higher than the performance data cited. For performance data current to the most recent month-end, visit our website at vanguard.com/performance.) Note, too, that both investment returns and principal value can fluctuate widely, so an investor’s shares, when sold, could be worth more or less than their original cost. The returns shown do not reflect taxes that a shareholder would pay on fund distributions or on the sale of fund shares.
Cumulative Performance: September 30, 2009, Through September 30, 2019
Initial Investment of $10,000
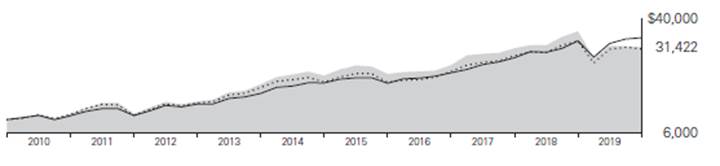
| | Average Annual Total Returns | |
| | Periods Ended September 30, 2019 | |
| | | | | Final Value |
| | One | Five | Ten | of a $10,000 |
| | Year | Years | Years | Investment |

| Strategic Small-Cap Equity Fund | -12.91% | 6.47% | 12.13% | $31,422 |

| MSCI US Small Cap 1750 Index | -6.93 | 7.93 | 11.95 | 30,915 |

| Dow Jones U.S. Total Stock Market Float Adjusted Index | 2.81 | 10.40 | 13.09 | 34,207 |
See Financial Highlights for dividend and capital gains information.
7
Strategic Small-Cap Equity Fund
Sector Diversification
As of September 30, 2019
Communication Services | 2.6% |
Consumer Discretionary | 11.6 |
Consumer Staples | 2.6 |
Energy | 3.3 |
Financials | 17.7 |
Health Care | 13.0 |
Industrials | 15.4 |
Information Technology | 15.1 |
Materials | 4.8 |
Real Estate | 10.3 |
Utilities | 3.6 |
The table reflects the fund’s equity exposure, based on its investments in stocks and stock index futures. Any holdings in short-term reserves are excluded. Sector categories are based on the Global Industry Classification Standard (“GICS”), except for the “Other” category (if applicable), which includes securities that have not been provided a GICS classification as of the effective reporting period.
The Global Industry Classification Standard (“GICS”) was developed by and is the exclusive property and a service mark of MSCI Inc. (“MSCI”) and Standard and Poor’s, a division of McGraw-Hill Companies, Inc. (“S&P”), and is licensed for use by Vanguard. Neither MSCI, S&P nor any third party involved in making or compiling the GICS or any GICS classification makes any express or implied warranties or representations with respect to such standard or classification (or the results to be obtained by the use thereof), and all such parties hereby expressly disclaim all warranties of originality, accuracy, completeness, merchantability or fitness for a particular purpose with respect to any such standard or classification. Without limiting any of the foregoing, in no event shall MSCI, S&P, any of its affiliates or any third party involved in making or compiling the GICS or any GICS classification have any liability for any direct, indirect, special, punitive, consequential or any other damages (including lost profits) even if notified of the possibility of such damages.
8
Strategic Small-Cap Equity Fund
Financial Statements
Statement of Net Assets
As of September 30, 2019
The fund files its complete schedule of portfolio holdings with the Securities and Exchange Commission (SEC) for the first and third quarters of each fiscal year as an exhibit to its reports on Form N-PORT. The fund’s Form N-PORT reports are available on the SEC’s website at www.sec.gov.
| | | Market |
| | | Value· |
| | Shares | ($000) |
Common Stocks (99.3%)1 | | |
Communication Services (2.5%) | | |
^ | Match Group Inc. | 98,606 | 7,044 |
| TEGNA Inc. | 323,055 | 5,017 |
* | Glu Mobile Inc. | 826,090 | 4,122 |
| Consolidated Communications Holdings Inc. | 778,356 | 3,705 |
| Nexstar Media Group Inc. Class A | 33,000 | 3,376 |
* | Liberty TripAdvisor Holdings Inc. Class A | 354,359 | 3,334 |
* | Boingo Wireless Inc. | 217,906 | 2,419 |
| Meredith Corp. | 53,433 | 1,959 |
* | Bandwidth Inc. Class A | 25,554 | 1,664 |
* | IMAX Corp. | 60,219 | 1,322 |
*,^ | Frontier Communications Corp. | 848,558 | 736 |
* | Cars.com Inc. | 80,630 | 724 |
| | | 35,422 |
| Consumer Discretionary (11.6%) | | |
*,^ | RH | 66,881 | 11,425 |
* | Deckers Outdoor Corp. | 67,474 | 9,943 |
^ | Brinker International Inc. | 217,555 | 9,283 |
| Rent-A-Center Inc. | 357,601 | 9,223 |
* | Etsy Inc. | 160,805 | 9,085 |
| Bloomin’ Brands Inc. | 465,185 | 8,806 |
* | frontdoor Inc. | 179,309 | 8,709 |
*,^ | YETI Holdings Inc. | 299,265 | 8,379 |
| Dine Brands Global Inc. | 88,855 | 6,741 |
| Adient plc | 274,929 | 6,312 |
* | American Axle & Manufacturing Holdings Inc. | 691,058 | 5,681 |
* | Fossil Group Inc. | 419,682 | 5,250 |
* | Skyline Champion Corp. | 171,626 | 5,164 |
* | Genesco Inc. | 126,775 | 5,074 |
^ | Shoe Carnival Inc. | 156,064 | 5,058 |
* | Planet Fitness Inc. Class A | 73,167 | 4,234 |
* | Conn’s Inc. | 160,672 | 3,994 |
* | Stoneridge Inc. | 116,060 | 3,594 |
| Dave & Buster’s Entertainment Inc. | 90,674 | 3,532 |
| Jack in the Box Inc. | 38,614 | 3,519 |
* | Meritage Homes Corp. | 49,046 | 3,450 |
| Wingstop Inc. | 38,269 | 3,340 |
* | TopBuild Corp. | 22,895 | 2,208 |
* | Taylor Morrison Home Corp. Class A | 83,054 | 2,154 |
* | 1-800-Flowers.com Inc. Class A | 141,061 | 2,087 |
* | Chegg Inc. | 66,195 | 1,983 |
* | SeaWorld Entertainment Inc. | 73,876 | 1,944 |
| Ruth’s Hospitality Group Inc. | 80,536 | 1,644 |
^ | Bed Bath & Beyond Inc. | 135,447 | 1,441 |
* | Gentherm Inc. | 30,973 | 1,273 |
* | Asbury Automotive Group Inc. | 12,067 | 1,235 |
* | Cavco Industries Inc. | 6,276 | 1,206 |
* | Zumiez Inc. | 33,446 | 1,059 |
^ | GameStop Corp. Class A | 185,360 | 1,023 |
| Core-Mark Holding Co. Inc. | 29,246 | 939 |
| Signet Jewelers Ltd. | 43,895 | 736 |
| Columbia Sportswear Co. | 7,285 | 706 |
| | | 161,434 |
Consumer Staples (2.6%) | | |
* | TreeHouse Foods Inc. | 153,800 | 8,528 |
| Coca-Cola Consolidated Inc. | 20,074 | 6,100 |
| Ingles Markets Inc. Class A | 139,357 | 5,415 |
| Medifast Inc. | 50,377 | 5,221 |
* | Boston Beer Co. Inc. Class A | 9,179 | 3,342 |
* | Performance Food Group Co. | 61,701 | 2,839 |
* | Edgewell Personal Care Co. | 48,114 | 1,563 |
9
Strategic Small-Cap Equity Fund
| | | Market |
| | | Value· |
| | Shares | ($000) |
* | Simply Good Foods Co. | 50,317 | 1,459 |
* | Chefs’ Warehouse Inc. | 26,549 | 1,071 |
| John B Sanfilippo & Son Inc. | 10,315 | 996 |
| | | 36,534 |
Energy (3.3%) | | |
* | Southwestern Energy Co. | 3,971,594 | 7,665 |
* | W&T Offshore Inc. | 1,743,852 | 7,621 |
* | Denbury Resources Inc. | 3,777,685 | 4,496 |
* | CONSOL Energy Inc. | 268,098 | 4,190 |
* | Renewable Energy Group Inc. | 264,393 | 3,967 |
| Arch Coal Inc. Class A | 47,355 | 3,514 |
*,^ | California Resources Corp. | 317,410 | 3,238 |
| Delek US Holdings Inc. | 81,697 | 2,966 |
| CVR Energy Inc. | 54,769 | 2,412 |
| Range Resources Corp. | 497,706 | 1,901 |
* | SEACOR Holdings Inc. | 22,207 | 1,045 |
| DMC Global Inc. | 20,904 | 919 |
* | REX American Resources Corp. | 10,210 | 779 |
| Archrock Inc. | 74,558 | 743 |
| | | 45,456 |
Financials (17.6%) | | |
| LPL Financial Holdings Inc. | 154,819 | 12,680 |
| Primerica Inc. | 91,655 | 11,661 |
| Hanover Insurance Group Inc. | 81,215 | 11,008 |
| Popular Inc. | 196,539 | 10,629 |
| Radian Group Inc. | 450,377 | 10,287 |
| Assured Guaranty Ltd. | 229,611 | 10,209 |
| First Citizens BancShares Inc. Class A | 20,878 | 9,845 |
| FirstCash Inc. | 106,903 | 9,800 |
| International Bancshares Corp. | 248,868 | 9,611 |
| Webster Financial Corp. | 202,733 | 9,502 |
| Umpqua Holdings Corp. | 570,533 | 9,391 |
| Walker & Dunlop Inc. | 164,734 | 9,214 |
| FNB Corp. | 757,605 | 8,735 |
| Federal Agricultural Mortgage Corp. | 106,260 | 8,677 |
| Nelnet Inc. Class A | 124,950 | 7,947 |
| OFG Bancorp | 359,904 | 7,882 |
* | NMI Holdings Inc. Class A | 287,802 | 7,558 |
| Navient Corp. | 514,319 | 6,583 |
| Universal Insurance Holdings Inc. | 218,341 | 6,548 |
* | Mr Cooper Group Inc. | 615,128 | 6,533 |
| Cathay General Bancorp | 165,460 | 5,747 |
* | Enova International Inc. | 245,083 | 5,085 |
| MGIC Investment Corp. | 328,376 | 4,131 |
| American Equity Investment Life Holding Co. | 156,752 | 3,793 |
| Brightsphere Investment Group Inc. | 366,598 | 3,633 |
| Waddell & Reed Financial Inc. Class A | 210,492 | 3,616 |
| Essent Group Ltd. | 71,215 | 3,395 |
| Westamerica Bancorporation | 47,760 | 2,970 |
| First Financial Bankshares Inc. | 76,865 | 2,562 |
| Banner Corp. | 43,242 | 2,429 |
| S&T Bancorp Inc. | 61,648 | 2,252 |
| First Midwest Bancorp Inc. | 112,481 | 2,191 |
| First BanCorp | 219,368 | 2,189 |
* | Cannae Holdings Inc. | 64,426 | 1,770 |
*,^ | Health Insurance Innovations Inc. Class A | 69,404 | 1,730 |
| Artisan Partners Asset Management Inc. Class A | 61,242 | 1,729 |
| First Interstate BancSystem Inc. Class A | 42,694 | 1,718 |
| Hilltop Holdings Inc. | 64,590 | 1,543 |
| Piper Jaffray Cos. | 18,366 | 1,386 |
| Kinsale Capital Group Inc. | 12,462 | 1,287 |
| Federated Investors Inc. Class B | 37,567 | 1,218 |
| National General Holdings Corp. | 47,617 | 1,096 |
| Hancock Whitney Corp. | 22,455 | 860 |
| First Hawaiian Inc. | 29,991 | 801 |
| Columbia Banking System Inc. | 21,276 | 785 |
| Independent Bank Corp. | 8,434 | 630 |
| | | 244,846 |
Health Care (12.9%) | | |
* | Charles River Laboratories International Inc. | 88,840 | 11,760 |
| Bruker Corp. | 242,670 | 10,661 |
* | Medpace Holdings Inc. | 118,103 | 9,925 |
* | Integer Holdings Corp. | 124,982 | 9,444 |
* | PRA Health Sciences Inc. | 89,643 | 8,895 |
* | Novocure Ltd. | 116,145 | 8,685 |
* | Tenet Healthcare Corp. | 392,409 | 8,680 |
| Encompass Health Corp. | 136,629 | 8,646 |
* | Haemonetics Corp. | 65,779 | 8,297 |
* | Esperion Therapeutics Inc. | 188,262 | 6,902 |
* | STAAR Surgical Co. | 248,600 | 6,409 |
| Ensign Group Inc. | 134,970 | 6,402 |
10
Strategic Small-Cap Equity Fund
| | | Market |
| | | Value· |
| | Shares | ($000) |
* | Enanta Pharmaceuticals Inc. | 104,431 | 6,274 |
* | Allscripts Healthcare Solutions Inc. | 536,049 | 5,886 |
* | Natera Inc. | 140,635 | 4,613 |
* | Quidel Corp. | 68,450 | 4,199 |
| Spectrum Pharmaceuticals Inc. | 445,132 | 3,692 |
| Ironwood Pharmaceuticals Inc. Class A | 416,257 | 3,574 |
* | ImmunoGen Inc. | 1,448,576 | 3,506 |
* | Endo International plc | 1,086,645 | 3,488 |
* | AMAG Pharmaceuticals Inc. | 296,246 | 3,422 |
* | Arrowhead Pharmaceuticals Inc. | 118,789 | 3,347 |
* | HMS Holdings Corp. | 93,730 | 3,230 |
* | Brookdale Senior Living Inc. | 418,400 | 3,171 |
* | Vanda Pharmaceuticals Inc. | 237,520 | 3,154 |
* | CorVel Corp. | 40,904 | 3,096 |
* | Veeva Systems Inc. Class A | 19,154 | 2,925 |
* | NuVasive Inc. | 39,163 | 2,482 |
| Patterson Cos. Inc. | 130,746 | 2,330 |
*,^ | Mallinckrodt plc | 844,815 | 2,036 |
* | Acorda Therapeutics Inc. | 610,867 | 1,753 |
* | Inovalon Holdings Inc. Class A | 78,499 | 1,287 |
* | Myriad Genetics Inc. | 40,160 | 1,150 |
| Mesa Laboratories Inc. | 4,815 | 1,145 |
| US Physical Therapy Inc. | 8,264 | 1,079 |
* | Lantheus Holdings Inc. | 41,638 | 1,044 |
* | Prestige Consumer Healthcare Inc. | 26,095 | 905 |
*,^ | Novavax Inc. | 146,419 | 735 |
* | Ra Pharmaceuticals Inc. | 30,994 | 733 |
* | Krystal Biotech Inc. | 19,490 | 677 |
* | Halozyme Therapeutics Inc. | 42,181 | 654 |
| | | 180,293 |
Industrials (15.3%) | | |
| Armstrong World Industries Inc. | 111,537 | 10,786 |
* | FTI Consulting Inc. | 96,898 | 10,270 |
* | Aerojet Rocketdyne Holdings Inc. | 196,549 | 9,928 |
| AGCO Corp. | 123,612 | 9,357 |
* | MasTec Inc. | 140,398 | 9,116 |
* | Continental Building Products Inc. | 332,570 | 9,076 |
* | WESCO International Inc. | 182,567 | 8,721 |
| Triumph Group Inc. | 361,029 | 8,260 |
* | Meritor Inc. | 441,640 | 8,170 |
| Korn Ferry | 210,660 | 8,140 |
| Tetra Tech Inc. | 93,356 | 8,100 |
| Rush Enterprises Inc. Class A | 208,890 | 8,059 |
| ArcBest Corp. | 261,470 | 7,962 |
* | Builders FirstSource Inc. | 366,024 | 7,531 |
| SkyWest Inc. | 125,379 | 7,197 |
| Triton International Ltd. | 182,017 | 6,159 |
| Ennis Inc. | 280,333 | 5,666 |
| EMCOR Group Inc. | 65,102 | 5,607 |
| HEICO Corp. Class A | 57,492 | 5,595 |
* | Atkore International Group Inc. | 181,840 | 5,519 |
* | Resideo Technologies Inc. | 342,943 | 4,921 |
* | Echo Global Logistics Inc. | 216,550 | 4,905 |
| Kforce Inc. | 129,077 | 4,884 |
* | BMC Stock Holdings Inc. | 151,831 | 3,975 |
* | Herc Holdings Inc. | 80,278 | 3,734 |
| Landstar System Inc. | 28,158 | 3,170 |
| MSA Safety Inc. | 27,496 | 3,000 |
* | TriNet Group Inc. | 42,389 | 2,636 |
* | American Woodmark Corp. | 28,797 | 2,560 |
* | Astronics Corp. | 86,745 | 2,549 |
| Quad/Graphics Inc. | 227,396 | 2,390 |
* | Generac Holdings Inc. | 28,669 | 2,246 |
* | Hub Group Inc. Class A | 47,688 | 2,217 |
| Covanta Holding Corp. | 112,116 | 1,938 |
| McGrath RentCorp | 24,605 | 1,712 |
^ | ADT Inc. | 236,222 | 1,481 |
| Albany International Corp. Class A | 16,395 | 1,478 |
* | GMS Inc. | 48,195 | 1,384 |
| Advanced Drainage Systems Inc. | 38,684 | 1,248 |
* | Avis Budget Group Inc. | 39,939 | 1,129 |
| Terex Corp. | 28,780 | 747 |
* | AeroVironment Inc. | 11,629 | 623 |
| | | 214,146 |
Information Technology (15.0%) | | |
* | CACI International Inc. Class A | 50,424 | 11,661 |
* | Synaptics Inc. | 277,791 | 11,098 |
* | Tech Data Corp. | 99,928 | 10,416 |
| ManTech International Corp. Class A | 132,724 | 9,478 |
* | Five9 Inc. | 163,018 | 8,761 |
* | Cardtronics plc Class A | 280,061 | 8,469 |
* | Box Inc. | 505,355 | 8,369 |
| Booz Allen Hamilton Holding Corp. Class A | 110,737 | 7,864 |
* | Workiva Inc. Class A | 169,870 | 7,445 |
*,^ | SunPower Corp. Class A | 671,794 | 7,370 |
* | Diebold Nixdorf Inc. | 626,434 | 7,016 |
11
Strategic Small-Cap Equity Fund
| | | Market |
| | | Value· |
| | Shares | ($000) |
| Jabil Inc. | 195,387 | 6,989 |
* | Cirrus Logic Inc. | 126,964 | 6,803 |
* | Lattice Semiconductor Corp. | 362,120 | 6,621 |
* | SolarEdge Technologies Inc. | 77,227 | 6,465 |
* | Advanced Micro Devices Inc. | 219,075 | 6,351 |
* | Unisys Corp. | 811,719 | 6,031 |
| TTEC Holdings Inc. | 119,097 | 5,702 |
* | Fabrinet | 106,384 | 5,564 |
* | Fitbit Inc. Class A | 1,421,848 | 5,417 |
* | Anixter International Inc. | 77,010 | 5,323 |
* | HubSpot Inc. | 34,645 | 5,252 |
* | Euronet Worldwide Inc. | 29,799 | 4,360 |
| Comtech Telecommunications Corp. | 118,418 | 3,849 |
* | Manhattan Associates Inc. | 46,146 | 3,723 |
*,^ | Paysign Inc. | 321,407 | 3,246 |
* | Avid Technology Inc. | 518,993 | 3,213 |
| MAXIMUS Inc. | 36,448 | 2,816 |
* | Verint Systems Inc. | 63,813 | 2,730 |
* | NCR Corp. | 81,850 | 2,583 |
* | Appfolio Inc. | 21,875 | 2,081 |
* | ePlus Inc. | 26,634 | 2,027 |
* | Cornerstone OnDemand Inc. | 34,605 | 1,897 |
* | Zebra Technologies Corp. | 8,876 | 1,832 |
* | Extreme Networks Inc. | 197,138 | 1,434 |
* | Sykes Enterprises Inc. | 41,003 | 1,256 |
* | Amkor Technology Inc. | 128,825 | 1,172 |
* | SMART Global Holdings Inc. | 43,414 | 1,106 |
* | Plexus Corp. | 14,365 | 898 |
| SYNNEX Corp. | 7,555 | 853 |
* | Insight Enterprises Inc. | 14,752 | 821 |
* | Harmonic Inc. | 124,272 | 818 |
| Avnet Inc. | 17,749 | 790 |
* | Virtusa Corp. | 20,071 | 723 |
* | Model N Inc. | 24,339 | 676 |
| | | 209,369 |
Materials (4.8%) | | |
| Royal Gold Inc. | 91,511 | 11,275 |
* | Element Solutions Inc. | 866,224 | 8,818 |
| Valvoline Inc. | 398,580 | 8,781 |
| Domtar Corp. | 200,930 | 7,195 |
| Huntsman Corp. | 266,613 | 6,201 |
| Owens-Illinois Inc. | 528,378 | 5,427 |
* | AdvanSix Inc. | 187,448 | 4,821 |
* | Verso Corp. | 316,497 | 3,918 |
| Schnitzer Steel Industries Inc. | 105,903 | 2,188 |
* | Allegheny Technologies Inc. | 99,416 | 2,013 |
| Silgan Holdings Inc. | 54,831 | 1,647 |
| Carpenter Technology Corp. | 20,395 | 1,054 |
| Warrior Met Coal Inc. | 43,685 | 853 |
| Schweitzer-Mauduit International Inc. | 21,904 | 820 |
| Greif Inc. Class A | 21,351 | 809 |
| Quaker Chemical Corp. | 4,387 | 694 |
| | | 66,514 |
Real Estate (10.2%) | | |
| Medical Properties Trust Inc. | 650,120 | 12,716 |
| Service Properties Trust | 397,597 | 10,254 |
| National Health Investors Inc. | 119,162 | 9,818 |
| EPR Properties | 123,842 | 9,519 |
| SITE Centers Corp. | 610,730 | 9,228 |
| Sabra Health Care REIT Inc. | 391,268 | 8,984 |
| EastGroup Properties Inc. | 65,404 | 8,177 |
| Life Storage Inc. | 77,414 | 8,160 |
| Lexington Realty Trust Class B | 746,768 | 7,655 |
| Outfront Media Inc. | 257,589 | 7,156 |
| GEO Group Inc. | 411,927 | 7,143 |
| Hannon Armstrong Sustainable Infrastructure Capital Inc. | 196,638 | 5,732 |
| Piedmont Office Realty Trust Inc. Class A | 245,690 | 5,130 |
| Spirit Realty Capital Inc. | 98,230 | 4,701 |
| Retail Properties of America Inc. | 335,489 | 4,133 |
| CoreCivic Inc. | 193,593 | 3,345 |
| Essential Properties Realty Trust Inc. | 132,776 | 3,042 |
| Universal Health Realty Income Trust | 26,888 | 2,764 |
| Rayonier Inc. | 88,343 | 2,491 |
| Brandywine Realty Trust | 126,149 | 1,911 |
| One Liberty Properties Inc. | 64,566 | 1,778 |
| iStar Inc. | 115,347 | 1,505 |
| Global Net Lease Inc. | 71,132 | 1,387 |
| Independence Realty Trust Inc. | 92,264 | 1,320 |
| RPT Realty | 71,772 | 973 |
^ | Pennsylvania REIT | 160,010 | 915 |
^ | Washington Prime Group Inc. | 215,515 | 892 |
12
Strategic Small-Cap Equity Fund
| | | Market |
| | | Value· |
| | Shares | ($000) |
| City Office REIT Inc. | 59,087 | 850 |
| Xenia Hotels & Resorts Inc. | 37,448 | 791 |
| | | 142,470 |
Utilities (3.5%) | | |
| PNM Resources Inc. | 190,861 | 9,940 |
| IDACORP Inc. | 84,541 | 9,525 |
| NorthWestern Corp. | 74,652 | 5,603 |
| Hawaiian Electric Industries Inc. | 116,075 | 5,294 |
| Otter Tail Corp. | 88,989 | 4,783 |
| Unitil Corp. | 44,603 | 2,830 |
| Black Hills Corp. | 36,639 | 2,811 |
| Clearway Energy Inc. | 104,440 | 1,906 |
| Avista Corp. | 36,549 | 1,770 |
| ONE Gas Inc. | 15,820 | 1,521 |
| ALLETE Inc. | 16,946 | 1,481 |
| American States Water Co. | 13,252 | 1,191 |
| Portland General Electric Co. | 13,059 | 736 |
| | | 49,391 |
Total Common Stocks | | |
(Cost $1,308,501) | | 1,385,875 |
Temporary Cash Investments (3.0%)1 | | |
Money Market Fund (2.9%) | | |
2,3 | Vanguard Market Liquidity Fund, 2.098% | 407,326 | 40,737 |
| | | |
| | Face | |
| | Amount | |
| | ($000) | |
U.S. Government and Agency Obligations (0.1%) | | |
4 | United States Treasury Bill, 2.170%, 11/7/19 | 400 | 399 |
Total Temporary Cash Investments | | |
(Cost $41,132) | | 41,136 |
Total Investments (102.3%) | | |
(Cost $1,349,633) | | 1,427,011 |
| Amount |
| ($000) |
Other Assets and Liabilities (-2.3%) | |
Other Assets | |
Investment in Vanguard | 67 |
Receivables for Investment Securities Sold | 4,927 |
Receivables for Accrued Income | 1,699 |
Receivables for Capital Shares Issued | 1,705 |
Variation Margin Receivable—Futures Contracts | 20 |
Total Other Assets | 8,418 |
Liabilities | |
Payables for Investment Securities Purchased | (7) |
Collateral for Securities on Loan | (36,339) |
Payables for Capital Shares Redeemed | (1,350) |
Payables to Vanguard | (490) |
Variation Margin Payable—Futures Contracts | (13) |
Other Liabilities | (2,145) |
Total Liabilities | (40,344) |
Net Assets (100%) | |
Applicable to 44,418,551 outstanding $.001 par value shares of beneficial interest (unlimited authorization) | 1,395,085 |
Net Asset Value Per Share | $31.41 |
At September 30, 2019, net assets consisted of:
| Amount |
| ($000) |
Paid-in Capital | 1,275,199 |
Total Distributable Earnings (Loss) | 119,886 |
Net Assets | 1,395,085 |
· See Note A in Notes to Financial Statements.
^ Includes partial security positions on loan to broker-dealers. The total value of securities on loan is $34,167,000.
* Non-income-producing security.
1 The fund invests a portion of its cash reserves in equity markets through the use of index futures contracts. After giving effect to futures investments, the fund’s effective common stock and temporary cash investment positions represent 100.0% and 2.3%, respectively, of net assets.
2 Affiliated money market fund available only to Vanguard funds and certain trusts and accounts managed by Vanguard. Rate shown is the 7-day yield.
3 Collateral of $36,339,000 was received for securities on loan.
4 Securities with a value of $399,000 have been segregated as initial margin for open futures contracts.
REIT—Real Estate Investment Trust.
13
Strategic Small-Cap Equity Fund
Derivative Financial Instruments Outstanding as of Period End | | | | |
| | | | |
Futures Contracts | | | | |
| | | | ($000) |
| | | | Value and |
| | Number of | | Unrealized |
| | Long (Short) | Notional | Appreciation |
| Expiration | Contracts | Amount | (Depreciation) |
Long Futures Contracts | | | | |
E-mini Russell 2000 Index | December 2019 | 111 | 8,464 | (210) |
See accompanying Notes, which are an integral part of the Financial Statements.
14
Strategic Small-Cap Equity Fund
Statement of Operations
| Year Ended |
| September 30, 2019 |
| ($000) |
Investment Income | |
Income | |
Dividends | 22,405 |
Interest1 | 160 |
Securities Lending—Net | 743 |
Total Income | 23,308 |
Expenses | |
The Vanguard Group—Note B | |
Investment Advisory Services | 1,386 |
Management and Administrative | 2,431 |
Marketing and Distribution | 200 |
Custodian Fees | 26 |
Auditing Fees | 33 |
Shareholders’ Reports | 39 |
Trustees’ Fees and Expenses | 1 |
Total Expenses | 4,116 |
Net Investment Income | 19,192 |
Realized Net Gain (Loss) | |
Investment Securities Sold1 | 38,407 |
Futures Contracts | (1,039) |
Realized Net Gain (Loss) | 37,368 |
Change in Unrealized Appreciation (Depreciation) | |
Investment Securities1 | (308,171) |
Futures Contracts | (136) |
Change in Unrealized Appreciation (Depreciation) | (308,307) |
Net Increase (Decrease) in Net Assets Resulting from Operations | (251,747) |
1 Interest income, realized net gain (loss), and change in unrealized appreciation (depreciation) from an affiliated company of the fund were $145,000, $1,000, and $3,000, respectively. Purchases and sales are for temporary cash investment purposes.
See accompanying Notes, which are an integral part of the Financial Statements.
15
Strategic Small-Cap Equity Fund
Statement of Changes in Net Assets
| Year Ended September 30, |
| 2019 | | 2018 |
| ($000) | | ($000) |
Increase (Decrease) in Net Assets | | | |
Operations | | | |
Net Investment Income | 19,192 | | 17,319 |
Realized Net Gain (Loss) | 37,368 | | 154,770 |
Change in Unrealized Appreciation (Depreciation) | (308,307) | | 89,218 |
Net Increase (Decrease) in Net Assets Resulting from Operations | (251,747) | | 261,307 |
Distributions | | | |
Net Investment Income | (17,600) | | (17,683) |
Realized Capital Gain1 | (136,307) | | (92,040) |
Total Distributions | (153,907) | | (109,723) |
Capital Share Transactions | | | |
Issued | 319,383 | | 359,541 |
Issued in Lieu of Cash Distributions | 142,242 | | 100,724 |
Redeemed | (577,783) | | (367,708) |
Net Increase (Decrease) from Capital Share Transactions | (116,158) | | 92,557 |
Total Increase (Decrease) | (521,812) | | 244,141 |
Net Assets | | | |
Beginning of Period | 1,916,897 | | 1,672,756 |
End of Period | 1,395,085 | | 1,916,897 |
1 Includes fiscal 2019 and 2018 short-term gain distributions totaling $10,577,000 and $18,625,000, respectively. Short-term gain distributions are treated as ordinary income dividends for tax purposes.
See accompanying Notes, which are an integral part of the Financial Statements.
16
Strategic Small-Cap Equity Fund
Financial Highlights
For a Share Outstanding | Year Ended September 30, |
Throughout Each Period | 2019 | | 2018 | 2017 | 2016 | 2015 |
Net Asset Value, Beginning of Period | $40.21 | | $36.99 | $31.45 | $28.95 | $30.91 |
Investment Operations | | | | | | |
Net Investment Income | .3931 | | .3731 | .4621 | .494 | .368 |
Net Realized and Unrealized Gain (Loss) on Investments | (5.888) | | 5.294 | 5.545 | 2.682 | .349 |
Total from Investment Operations | (5.495) | | 5.667 | 6.007 | 3.176 | .717 |
Distributions | | | | | | |
Dividends from Net Investment Income | (.378) | | (.394) | (.467) | (.340) | (.246) |
Distributions from Realized Capital Gains | (2.927) | | (2.053) | — | (.336) | (2.431) |
Total Distributions | (3.305) | | (2.447) | (.467) | (.676) | (2.677) |
Net Asset Value, End of Period | $31.41 | | $40.21 | $36.99 | $31.45 | $28.95 |
| | | | | | |
Total Return2 | -12.91% | | 16.13% | 19.19% | 11.14% | 2.10% |
| | | | | | |
Ratios/Supplemental Data | | | | | | |
Net Assets, End of Period (Millions) | $1,395 | | $1,917 | $1,673 | $1,351 | $945 |
Ratio of Total Expenses to Average Net Assets | 0.26% | | 0.29% | 0.29% | 0.29% | 0.34% |
Ratio of Net Investment Income to Average Net Assets | 1.22% | | 0.99% | 1.34% | 1.78% | 1.34% |
Portfolio Turnover Rate | 67% | | 88% | 91% | 89% | 62% |
1 Calculated based on average shares outstanding.
2 Total returns do not include account service fees that may have applied in the periods shown. Fund prospectuses provide information about any applicable account service fees.
See accompanying Notes, which are an integral part of the Financial Statements.
17
Strategic Small-Cap Equity Fund
Notes to Financial Statements
Vanguard Strategic Small-Cap Equity Fund is registered under the Investment Company Act of 1940 as an open-end investment company, or mutual fund.
A. The following significant accounting policies conform to generally accepted accounting principles for U.S. investment companies. The fund consistently follows such policies in preparing its financial statements.
1. Security Valuation: Securities are valued as of the close of trading on the New York Stock Exchange (generally 4 p.m., Eastern time) on the valuation date. Equity securities are valued at the latest quoted sales prices or official closing prices taken from the primary market in which each security trades; such securities not traded on the valuation date are valued at the mean of the latest quoted bid and asked prices. Securities for which market quotations are not readily available, or whose values have been materially affected by events occurring before the fund’s pricing time but after the close of the securities’ primary markets, are valued by methods deemed by the board of trustees to represent fair value. Investments in Vanguard Market Liquidity Fund are valued at that fund’s net asset value. Temporary cash investments are valued using the latest bid prices or using valuations based on a matrix system (which considers such factors as security prices, yields, maturities, and ratings), both as furnished by independent pricing services.
2. Futures Contracts: The fund uses index futures contracts to a limited extent, with the objective of maintaining full exposure to the stock market while maintaining liquidity. The fund may purchase or sell futures contracts to achieve a desired level of investment, whether to accommodate portfolio turnover or cash flows from capital share transactions. The primary risks associated with the use of futures contracts are imperfect correlation between changes in market values of stocks held by the fund and the prices of futures contracts, and the possibility of an illiquid market. Counterparty risk involving futures is mitigated because a regulated clearinghouse is the counterparty instead of the clearing broker. To further mitigate counterparty risk, the fund trades futures contracts on an exchange, monitors the financial strength of its clearing brokers and clearinghouse, and has entered into clearing agreements with its clearing brokers. The clearinghouse imposes initial margin requirements to secure the fund’s performance and requires daily settlement of variation margin representing changes in the market value of each contract. Any assets pledged as initial margin for open contracts are noted in the Statement of Net Assets.
Futures contracts are valued at their quoted daily settlement prices. The notional amounts of the contracts are not recorded in the Statement of Net Assets. Fluctuations in the value of the contracts are recorded in the Statement of Net Assets as an asset (liability) and in the Statement of Operations as unrealized appreciation (depreciation) until the contracts are closed, when they are recorded as realized futures gains (losses).
During the year ended September 30, 2019, the fund’s average investments in long and short futures contracts represented less than 1% and 0% of net assets, respectively, based on the average of the notional amounts at each quarter-end during the period.
3. Federal Income Taxes: The fund intends to continue to qualify as a regulated investment company and distribute all of its taxable income. Management has analyzed the fund’s tax positions taken for all open federal income tax years (September 30, 2016–2019), and has concluded that no provision for federal income tax is required in the fund’s financial statements.
18
Strategic Small-Cap Equity Fund
4. Distributions: Distributions to shareholders are recorded on the ex-dividend date. Distributions are determined on a tax basis and may differ from net investment income and realized capital gains for financial reporting purposes.
5. Securities Lending: To earn additional income, the fund lends its securities to qualified institutional borrowers. Security loans are subject to termination by the fund at any time, and are required to be secured at all times by collateral in an amount at least equal to the market value of securities loaned. Daily market fluctuations could cause the value of loaned securities to be more or less than the value of the collateral received. When this occurs, the collateral is adjusted and settled before the opening of the market on the next business day. The fund further mitigates its counterparty risk by entering into securities lending transactions only with a diverse group of prequalified counterparties, monitoring their financial strength, and entering into master securities lending agreements with its counterparties. The master securities lending agreements provide that, in the event of a counterparty’s default (including bankruptcy), the fund may terminate any loans with that borrower, determine the net amount owed, and sell or retain the collateral up to the net amount owed to the fund; however, such actions may be subject to legal proceedings. While collateral mitigates counterparty risk, in the event of a default, the fund may experience delays and costs in recovering the securities loaned. The fund invests cash collateral received in Vanguard Market Liquidity Fund, and records a liability in the Statement of Net Assets for the return of the collateral, during the period the securities are on loan. Securities lending income represents fees charged to borrowers plus income earned on invested cash collateral, less expenses associated with the loan. During the term of the loan, the fund is entitled to all distributions made on or in respect of the loaned securities.
6. Credit Facility: The fund and certain other funds managed by The Vanguard Group (“Vanguard”) participate in a $4.3 billion committed credit facility provided by a syndicate of lenders pursuant to a credit agreement that may be renewed annually; each fund is individually liable for its borrowings, if any, under the credit facility. Borrowings may be utilized for temporary and emergency purposes, and are subject to the fund’s regulatory and contractual borrowing restrictions. The participating funds are charged administrative fees and an annual commitment fee of 0.10% of the undrawn amount of the facility; these fees are allocated to the funds based on a method approved by the fund’s board of trustees and included in Management and Administrative expenses on the fund’s Statement of Operations. Any borrowings under this facility bear interest at a rate based upon the higher of the one-month London Interbank Offered Rate, federal funds effective rate, or overnight bank funding rate plus an agreed-upon spread.
The fund had no borrowings outstanding at September 30, 2019, or at any time during the period then ended.
7. Other: Dividend income is recorded on the ex-dividend date. Interest income includes income distributions received from Vanguard Market Liquidity Fund and is accrued daily. Premiums and discounts on debt securities purchased are amortized and accreted, respectively, to interest income over the lives of the respective securities. Security transactions are accounted for on the date securities are bought or sold. Costs used to determine realized gains (losses) on the sale of investment securities are those of the specific securities sold.
19
Strategic Small-Cap Equity Fund
B. In accordance with the terms of a Funds’ Service Agreement (the “FSA”) between Vanguard and the fund, Vanguard furnishes to the fund investment advisory, corporate management, administrative, marketing, and distribution services at Vanguard’s cost of operations (as defined by the FSA). These costs of operations are allocated to the fund based on methods and guidelines approved by the board of trustees. Vanguard does not require reimbursement in the current period for certain costs of operations (such as deferred compensation/benefits and risk/insurance costs); the fund’s liability for these costs of operations is included in Payables to Vanguard on the Statement of Net Assets. All other costs of operations payable to Vanguard are generally settled twice a month.
Upon the request of Vanguard, the fund may invest up to 0.40% of its net assets as capital in Vanguard. At September 30, 2019, the fund had contributed to Vanguard capital in the amount of $67,000, representing less than 0.01% of the fund’s net assets and 0.03% of Vanguard’s capital received pursuant to the FSA. The fund’s trustees and officers are also directors and employees, respectively, of Vanguard.
C. Various inputs may be used to determine the value of the fund’s investments. These inputs are summarized in three broad levels for financial statement purposes. The inputs or methodologies used to value securities are not necessarily an indication of the risk associated with investing in those securities.
Level 1—Quoted prices in active markets for identical securities.
Level 2—Other significant observable inputs (including quoted prices for similar securities, interest rates, prepayment speeds, credit risk, etc.).
Level 3—Significant unobservable inputs (including the fund’s own assumptions used to determine the fair value of investments). Any investments valued with significant unobservable inputs are noted on the Statement of Net Assets.
The following table summarizes the market value of the fund’s investments and derivatives as of September 30, 2019, based on the inputs used to value them:
| Level 1 | Level 2 | Level 3 |
Investments | ($000) | ($000) | ($000) |
Common Stocks | 1,385,875 | — | — |
Temporary Cash Investments | 40,737 | 399 | — |
Futures Contracts—Assets1 | 20 | — | — |
Futures Contracts—Liabilities1 | (13) | — | — |
Total | 1,426,619 | 399 | — |
1 Represents variation margin on the last day of the reporting period.
20
Strategic Small-Cap Equity Fund
D. Permanent differences between book-basis and tax-basis components of net assets are reclassified among capital accounts in the financial statements to reflect their tax character. These reclassifications have no effect on net assets or net asset value per share. As of period end, permanent differences primarily attributable to the accounting for distributions in connection with fund share redemptions were reclassified between the following accounts:
| Amount |
| ($000) |
Paid-in Capital | 4,915 |
Total Distributable Earnings (Loss) | (4,915) |
Temporary differences between book-basis and tax-basis components of total distributable earnings (loss) arise when certain items of income, gain, or loss are recognized in different periods for financial statement and tax purposes; these differences will reverse at some time in the future. The differences are primarily related to the tax deferral of losses on wash sales and the realization of unrealized gains or losses on certain futures contracts. As of period end, the tax-basis components of total distributable earnings (loss) are detailed in the table as follows:
| Amount |
| ($000) |
Undistributed Ordinary Income | 11,569 |
Undistributed Long-Term Gains | 32,239 |
Capital Loss Carryforwards (Non-expiring) | — |
Net Unrealized Gains (Losses) | 76,405 |
As of September 30, 2019, gross unrealized appreciation and depreciation for investments and derivatives based on cost for U.S. federal income tax purposes were as follows:
| Amount |
| ($000) |
Tax Cost | 1,350,605 |
Gross Unrealized Appreciation | 246,466 |
Gross Unrealized Depreciation | (170,061) |
Net Unrealized Appreciation (Depreciation) | 76,405 |
E. During the year ended September 30, 2019, the fund purchased $1,055,621,000 of investment securities and sold $1,301,399,000 of investment securities, other than temporary cash investments.
21
Strategic Small-Cap Equity Fund
F. Capital shares issued and redeemed were:
| Year Ended September 30, |
| 2019 | 2018 |
| Shares | Shares |
| (000) | (000) |
Issued | 10,044 | 9,482 |
Issued in Lieu of Cash Distributions | 4,946 | 2,813 |
Redeemed | (18,246) | (9,846) |
Net Increase (Decrease) in Shares Outstanding | (3,256) | 2,449 |
G. Management has determined that no events or transactions occurred subsequent to September 30, 2019, that would require recognition or disclosure in these financial statements.
22
Report of Independent Registered Public Accounting Firm
To the Board of Trustees of Vanguard Horizon Funds and Shareholders of Vanguard Strategic Small-Cap Equity Fund
Opinion on the Financial Statements
We have audited the accompanying statement of net assets of Vanguard Strategic Small-Cap Equity Fund (one of the funds constituting Vanguard Horizon Funds, referred to hereafter as the “Fund”) as of September 30, 2019, the related statement of operations for the year ended September 30, 2019, the statement of changes in net assets for each of the two years in the period ended September 30, 2019, including the related notes, and the financial highlights for each of the five years in the period ended September 30, 2019 (collectively referred to as the “financial statements”). In our opinion, the financial statements present fairly, in all material respects, the financial position of the Fund as of September 30, 2019, the results of its operations for the year then ended, the changes in its net assets for each of the two years in the period ended September 30, 2019 and the financial highlights for each of the five years in the period ended September 30, 2019 in conformity with accounting principles generally accepted in the United States of America.
Basis for Opinion
These financial statements are the responsibility of the Fund’s management. Our responsibility is to express an opinion on the Fund’s financial statements based on our audits. We are a public accounting firm registered with the Public Company Accounting Oversight Board (United States) (“PCAOB”) and are required to be independent with respect to the Fund in accordance with the U.S. federal securities laws and the applicable rules and regulations of the Securities and Exchange Commission and the PCAOB.
We conducted our audits of these financial statements in accordance with the standards of the PCAOB. Those standards require that we plan and perform the audit to obtain reasonable assurance about whether the financial statements are free of material misstatement, whether due to error or fraud.
Our audits included performing procedures to assess the risks of material misstatement of the financial statements, whether due to error or fraud, and performing procedures that respond to those risks. Such procedures included examining, on a test basis, evidence regarding the amounts and disclosures in the financial statements. Our audits also included evaluating the accounting principles used and significant estimates made by management, as well as evaluating the overall presentation of the financial statements. Our procedures included confirmation of securities owned as of September 30, 2019 by correspondence with the custodian and brokers and by agreement to the underlying ownership records of the transfer agent; when replies were not received from brokers, we performed other auditing procedures. We believe that our audits provide a reasonable basis for our opinion.
/s/PricewaterhouseCoopers LLP
Philadelphia, Pennsylvania
November 19, 2019
We have served as the auditor of one or more investment companies in The Vanguard Group of Funds since 1975.
23
Special 2019 tax information (unaudited) for Vanguard Strategic Small-Cap Equity Fund
This information for the fiscal year ended September 30, 2019, is included pursuant to provisions of the Internal Revenue Code.
The fund distributed $128,982,000 as capital gain dividends (20% rate gain distributions) to shareholders during the fiscal year.
For nonresident alien shareholders, 100% of short-term capital gain dividends distributed by the fund are qualified short-term capital gains.
The fund distributed $17,600,000 of qualified dividend income to shareholders during the fiscal year.
For corporate shareholders, 83.5% of investment income (dividend income plus short-term gains, if any) qualifies for the dividends-received deduction.
24
This page intentionally left blank.
This page intentionally left blank.
The People Who Govern Your Fund
The trustees of your mutual fund are there to see that the fund is operated and managed in your best interests since, as a shareholder, you are a part owner of the fund. Your fund’s trustees also serve on the board of directors of The Vanguard Group, Inc., which is owned by the Vanguard funds and provides services to them.
A majority of Vanguard’s board members are independent, meaning that they have no affiliation with Vanguard or the funds they oversee, apart from the sizable personal investments they have made as private individuals. The independent board members have distinguished backgrounds in business, academia, and public service. Each of the trustees and executive officers oversees 212 Vanguard funds.
Information for each trustee and executive officer of the fund appears below. That information, as well as the Vanguard fund count, is as of the date on the cover of this fund report. The mailing address of the trustees and officers is P.O. Box 876, Valley Forge, PA 19482. More information about the trustees is in the Statement of Additional Information, which can be obtained, without charge, by contacting Vanguard at 800-662-7447, or online at vanguard.com.
Interested Trustee1
Mortimer J. Buckley
Born in 1969. Trustee since January 2018. Principal occupation(s) during the past five years and other experience: chairman of the board (January 2019–present) of Vanguard and of each of the investment companies served by Vanguard; chief executive officer (January 2018–present) of Vanguard; chief executive officer, president, and trustee (January 2018–present) of each of the investment companies served by Vanguard; president and director (2017–present) of Vanguard; and president (February 2018–present) of Vanguard Marketing Corporation. Chief investment officer (2013–2017), managing director (2002–2017), head of the Retail Investor Group (2006–2012), and chief information officer (2001–2006) of Vanguard. Chairman of the board (2011–2017) and trustee (2009–2017) of the Children’s Hospital of Philadelphia; trustee (2018–present) of The Shipley School.
Independent Trustees
Emerson U. Fullwood
Born in 1948. Trustee since January 2008. Principal occupation(s) during the past five years and other experience: executive chief staff and marketing officer for North America and corporate vice president (retired 2008) of Xerox Corporation (document management products and services). Former president of the Worldwide Channels Group, Latin America, and Worldwide Customer Service and executive chief staff officer of Developing Markets of Xerox. Executive in residence and 2009–2010 Distinguished Minett Professor at the Rochester Institute of Technology. Director of SPX FLOW, Inc. (multi-industry manufacturing). Director of the University of Rochester Medical Center, the Monroe Community College Foundation, the United Way of Rochester, North Carolina A&T University, and Roberts Wesleyan College. Trustee of the University of Rochester.
Amy Gutmann
Born in 1949. Trustee since June 2006. Principal occupation(s) during the past five years and other experience: president (2004–present) of the University of Pennsylvania. Christopher H. Browne Distinguished Professor of Political Science, School of Arts and Sciences, and professor of communication, Annenberg School for Communication, with secondary faculty appointments in the Department of Philosophy, School of Arts and Sciences, and at the Graduate School of Education, University of Pennsylvania. Trustee of the National Constitution Center.
F. Joseph Loughrey
Born in 1949. Trustee since October 2009. Principal occupation(s) during the past five years and other experience: president and chief operating officer (retired 2009) and vice chairman of the board (2008–2009) of Cummins Inc. (industrial machinery). Chairman of the board of Hillenbrand, Inc. (specialized consumer services), and the Lumina Foundation.
1 Mr. Buckley is considered an “interested person,” as defined in the Investment Company Act of 1940, because he is an officer of the Vanguard funds.
Director of the V Foundation and Oxfam America. Member of the advisory council for the College of Arts and Letters and chair of the advisory board to the Kellogg Institute for International Studies, both at the University of Notre Dame.
Mark Loughridge
Born in 1953. Trustee since March 2012. Principal occupation(s) during the past five years and other experience: senior vice president and chief financial officer (retired 2013) of IBM (information technology services). Fiduciary member of IBM’s Retirement Plan Committee (2004–2013), senior vice president and general manager (2002–2004) of IBM Global Financing, vice president and controller (1998–2002) of IBM, and a variety of other prior management roles at IBM. Member of the Council on Chicago Booth.
Scott C. Malpass
Born in 1962. Trustee since March 2012. Principal occupation(s) during the past five years and other experience: chief investment officer (1989–present) and vice president (1996–present) of the University of Notre Dame. Assistant professor of finance at the Mendoza College of Business, University of Notre Dame, and member of the Notre Dame 403(b) Investment Committee. Chairman of the board of TIFF Advisory Services, Inc. Member of the board of Catholic Investment Services, Inc. (investment advisors) and the board of superintendence of the Institute for the Works of Religion.
Deanna Mulligan
Born in 1963. Trustee since January 2018. Principal occupation(s) during the past five years and other experience: president (2010–present) and chief executive officer (2011–present) of The Guardian Life Insurance Company of America. Chief operating officer (2010–2011) and executive vice president (2008–2010) of Individual Life and Disability of The Guardian Life Insurance Company of America. Member of the board of The Guardian Life Insurance Company of America, the American Council of Life Insurers, the Partnership for New York City (business leadership), and the Committee Encouraging Corporate Philanthropy. Trustee of the Economic Club of New York and the Bruce Museum (arts and science). Member of the Advisory Council for the Stanford Graduate School of Business.
André F. Perold
Born in 1952. Trustee since December 2004. Principal occupation(s) during the past five years and other experience: George Gund Professor of Finance and Banking, Emeritus at the Harvard Business School (retired 2011). Chief investment officer and co-managing partner of HighVista Strategies LLC (private investment firm). Board of advisors and investment committee member of the Museum of Fine Arts Boston. Board member (2018–present) of RIT Capital Partners (investment firm); investment committee member of Partners Health Care System.
Sarah Bloom Raskin
Born in 1961. Trustee since January 2018. Principal occupation(s) during the past five years and other experience: deputy secretary (2014–2017) of the United States Department of the Treasury. Governor (2010–2014) of the Federal Reserve Board. Commissioner (2007–2010) of financial regulation for the State of Maryland. Member of the board of directors (2012–2014) of Neighborhood Reinvestment Corporation. Director (2017–present) of i(x) Investments, LLC; director (2017–present) of Reserve Trust. Rubinstein Fellow (2017–present) of Duke University; trustee (2017–present) of Amherst College.
Peter F. Volanakis
Born in 1955. Trustee since July 2009. Principal occupation(s) during the past five years and other experience: president and chief operating officer (retired 2010) of Corning Incorporated (communications equipment) and director of Corning Incorporated (2000–2010) and Dow Corning (2001–2010). Director (2012) of SPX Corporation (multi-industry manufacturing). Overseer of the Amos Tuck School of Business Administration, Dartmouth College (2001–2013). Chairman of the board of trustees of Colby-Sawyer College. Member of the board of Hypertherm Inc. (industrial cutting systems, software, and consumables).
Executive Officers
Glenn Booraem
Born in 1967. Principal occupation(s) during the past five years and other experience: principal of Vanguard. Investment stewardship officer (2017–present), treasurer (2015–2017), controller (2010–2015), and assistant controller (2001–2010) of each of the investment companies served by Vanguard.
Christine M. Buchanan
Born in 1970. Principal occupation(s) during the past five years and other experience: principal of Vanguard and global head of Fund Administration at Vanguard. Treasurer (2017–present) of each of the investment companies served by Vanguard. Partner (2005–2017) at KPMG LLP (audit, tax, and advisory services).
Thomas J. Higgins
Born in 1957. Principal occupation(s) during the past five years and other experience: principal of Vanguard. Chief financial officer (2008–present) and treasurer (1998–2008) of each of the investment companies served by Vanguard.
Peter Mahoney
Born in 1974. Principal occupation(s) during the past five years and other experience: principal of Vanguard. Controller (2015–present) of each of the investment companies served by Vanguard. Head of International Fund Services (2008–2014) at Vanguard.
Anne E. Robinson
Born in 1970. Principal occupation(s) during the past five years and other experience: general counsel (2016–present) of Vanguard. Secretary (2016–present) of Vanguard and of each of the investment companies served by Vanguard. Managing director (2016–present) of Vanguard. Director and senior vice president (2016–2018) of Vanguard Marketing Corporation. Managing director and general counsel of Global Cards and Consumer Services (2014–2016) at Citigroup. Counsel (2003–2014) at American Express.
Michael Rollings
Born in 1963. Principal occupation(s) during the past five years and other experience: finance director (2017–present) and treasurer (2017) of each of the investment companies served by Vanguard. Managing director (2016–present) of Vanguard. Chief financial officer (2016–present) of Vanguard. Director (2016–present) of Vanguard Marketing Corporation. Executive vice president and chief financial officer (2006–2016) of MassMutual Financial Group.
John E. Schadl
Born in 1972. Principal occupation(s) during the past five years and other experience: principal of Vanguard. Chief compliance officer (2019–present) of Vanguard and of each of the investment companies served by Vanguard. Assistant vice president (May 2019–present) of Vanguard Marketing Corporation.
Vanguard Senior Management Team | | |
| | |
Joseph Brennan | | Chris D. McIsaac |
Mortimer J. Buckley | | James M. Norris |
Gregory Davis | | Thomas M. Rampulla |
John James | | Karin A. Risi |
Martha G. King | | Anne E. Robinson |
John T. Marcante | | Michael Rollings |
| 
P.O. Box 2600 Valley Forge, PA 19482-2600 |
Connect with Vanguard® > vanguard.com
Fund Information > 800-662-7447
Direct Investor Account Services > 800-662-2739
Institutional Investor Services > 800-523-1036
Text Telephone for People
Who Are Deaf or Hard of Hearing > 800-749-7273
This material may be used in conjunction with the offering of shares of any Vanguard fund only if preceded or accompanied by the fund’s current prospectus.
All comparative mutual fund data are from Morningstar, Inc., unless otherwise noted.
You can obtain a free copy of Vanguard’s proxy voting guidelines by visiting vanguard.com/proxyreporting or by calling Vanguard at 800-662-2739. The guidelines are also available from the SEC’s website, www.sec.gov. In addition, you may obtain a free report on how your fund voted the proxies for securities it owned during the 12 months ended June 30. To get the report, visit either vanguard.com/proxyreporting or www.sec.gov.
You can review information about your fund on the SEC’s website, and you can receive copies of this information, for a fee, by sending a request via email addressed to publicinfo@sec.gov.
Source for Bloomberg Barclays indexes: Bloomberg Index Services Limited. Copyright 2019, Bloomberg. All rights reserved.
| © 2019 The Vanguard Group, Inc. All rights reserved. Vanguard Marketing Corporation, Distributor. Q6150 112019 |
Item 2: Code of Ethics. The Registrant has adopted a code of ethics that applies to the Registrant’s principal executive officer, principal financial officer, principal accounting officer or controller or persons performing similar functions. The Code of Ethics was amended during the reporting period covered by this report to make certain technical, non-material changes.
Item 3: Audit Committee Financial Expert. All members of the Audit Committee have been determined by the Registrant’s Board of Trustees to be Audit Committee Financial Experts and to be independent: F. Joseph Loughrey, Mark Loughridge, Sarah Bloom Raskin, and Peter F. Volanakis.
Item 4: Principal Accountant Fees and Services.
(a) Audit Fees.
Audit Fees of the Registrant.
Fiscal Year Ended September 30, 2019: $141,000
Fiscal Year Ended September 30, 2018: $145,000
Aggregate Audit Fees of Registered Investment Companies in the Vanguard Group.
Fiscal Year Ended September 30, 2019: $9,568,215
Fiscal Year Ended September 30, 2018: $9,734,277
Includes fees billed in connection with audits of the Registrant, other registered investment companies in the Vanguard complex, The Vanguard Group, Inc., and Vanguard Marketing Corporation.
(b) Audit-Related Fees.
Fiscal Year Ended September 30, 2019: $3,012,031
Fiscal Year Ended September 30, 2018: $5,581,336
Includes fees billed in connection with assurance and related services provided to the Registrant, other registered investment companies in the Vanguard complex, The Vanguard Group, Inc., and Vanguard Marketing Corporation.
(c) Tax Fees.
Fiscal Year Ended September 30, 2019: $357,238
Fiscal Year Ended September 30, 2018: $347,985
Includes fees billed in connection with tax compliance, planning, and advice services provided to the Registrant, other registered investment companies in the Vanguard complex, The Vanguard Group, Inc., and Vanguard Marketing Corporation.
(d) All Other Fees.
Fiscal Year Ended September 30, 2019: $0
Fiscal Year Ended September 30, 2018: $0
Includes fees billed for services related to tax reported information provided to the Registrant, other registered investment companies in the Vanguard complex, The Vanguard Group, Inc., and Vanguard Marketing Corporation.
(e) (1) Pre-Approval Policies. The policy of the Registrant’s Audit Committee is to consider, and, if appropriate, approve before the principal accountant is engaged for such services, all specific audit and non-audit services provided to: the Registrant, other registered investment companies in the Vanguard complex, The Vanguard Group, Inc., and entities controlled by The Vanguard Group, Inc. that provide ongoing services to the Registrant. In making a determination, the Audit Committee considers whether the services are consistent with maintaining the principal accountant’s independence.
In the event of a contingency situation in which the principal accountant is needed to provide services in between scheduled Audit Committee meetings, the Chairman of the Audit Committee would be called on to consider and, if appropriate, pre-approve audit or permitted non-audit services in an amount sufficient to complete services through the next Audit Committee meeting, and to determine if such services would be consistent with maintaining the accountant’s independence. At the next scheduled Audit Committee meeting, services and fees would be presented to the Audit Committee for formal consideration, and, if appropriate, approval by the entire Audit Committee. The Audit Committee would again consider whether such services and fees are consistent with maintaining the principal accountant’s independence.
The Registrant’s Audit Committee is informed at least annually of all audit and non-audit services provided by the principal accountant to the Vanguard complex, whether such services are provided to: the Registrant, other registered investment companies in the Vanguard complex, The Vanguard Group, Inc., or other entities controlled by The Vanguard Group, Inc. that provide ongoing services to the Registrant.
(2) No percentage of the principal accountant’s fees or services were approved pursuant to the waiver provision of paragraph (c)(7)(i)(C) of Rule 2-01 of Regulation S-X.
(f) For the most recent fiscal year, over 50% of the hours worked under the principal accountant’s engagement were not performed by persons other than full-time, permanent employees of the principal accountant.
(g) Aggregate Non-Audit Fees.
Fiscal Year Ended September 30, 2019: $357,238
Fiscal Year Ended September 30, 2018: $347,985
Includes fees billed for non-audit services provided to the Registrant, other registered investment companies in the Vanguard complex, The Vanguard Group, Inc., and Vanguard Marketing Corporation.
(h) For the most recent fiscal year, the Audit Committee has determined that the provision of all non-audit services was consistent with maintaining the principal accountant’s independence.
Item 5: Audit Committee of Listed Registrants.
The Registrant is a listed issuer as defined in rule 10A-3 under the Securities Exchange Act of 1934 (“Exchange Act”). The Registrant has a separately-designated standing audit committee established in accordance with Section 3(a)(58)(A) of the Exchange Act. The Registrant’s audit committee members are: F. Joseph Loughrey, Mark Loughridge, Sarah Bloom Raskin, and Peter F. Volanakis.
Vanguard® Global Equity Fund
Schedule of Investments
September 30, 2019
| | | | | Market | |
| | | | | Value | |
| | | Shares | | ($000 | ) |
Common Stocks (95.8%)1 | | | | | |
Australia (1.1%) | | | | | |
| Orica Ltd. | | 1,504,811 | | 22,916 | |
| Cleanaway Waste Management Ltd. | | 4,029,285 | | 5,308 | |
| Newcrest Mining Ltd. | | 219,215 | | 5,059 | |
| Brambles Ltd. | | 598,343 | | 4,608 | |
| Coca-Cola Amatil Ltd. | | 587,345 | | 4,226 | |
| QBE Insurance Group Ltd. | | 496,265 | | 4,209 | |
| carsales.com Ltd. | | 334,033 | | 3,451 | |
| ALS Ltd. | | 609,411 | | 3,299 | |
| Alumina Ltd. | | 1,937,423 | | 3,104 | |
| BlueScope Steel Ltd. | | 354,327 | | 2,878 | |
| BHP Group Ltd. | | 94,476 | | 2,335 | |
| GUD Holdings Ltd. | | 268,799 | | 1,826 | |
| Nine Entertainment Co. Holdings Ltd. | | 1,368,036 | | 1,808 | |
| IPH Ltd. | | 260,193 | | 1,531 | |
| Metcash Ltd. | | 691,550 | | 1,396 | |
| Domain Holdings Australia Ltd. | | 586,717 | | 1,344 | |
| Caltex Australia Ltd. | | 67,170 | | 1,193 | |
| GWA Group Ltd. | | 483,945 | | 1,108 | |
* | Asaleo Care Ltd. | | 1,253,175 | | 825 | |
| Sigma Healthcare Ltd. | | 869,323 | | 352 | |
| | | | | 72,776 | |
Austria (0.1%) | | | | | |
| Wienerberger AG | | 82,067 | | 1,998 | |
| Oesterreichische Post AG | | 25,416 | | 892 | |
| ANDRITZ AG | | 15,990 | | 653 | |
| | | | | 3,543 | |
Belgium (0.0%) | | | | | |
| Anheuser-Busch InBev SA/NV | | 29,812 | | 2,837 | |
| | | | | | |
Brazil (1.5%) | | | | | |
| Banco Bradesco SA Preference Shares | | 4,668,960 | | 38,116 | |
| B3 SA - Brasil Bolsa Balcao | | 2,656,900 | | 27,899 | |
| TOTVS SA | | 619,100 | | 8,603 | |
* | Alpargatas SA Preference Shares | | 1,089,252 | | 6,790 | |
| Porto Seguro SA | | 343,242 | | 4,865 | |
| Natura Cosmeticos SA | | 593,052 | | 4,833 | |
| MRV Engenharia e Participacoes SA | | 928,700 | | 3,943 | |
| Itausa - Investimentos Itau SA Preference Shares | | 752,523 | | 2,387 | |
* | LPS Brasil Consultoria de Imoveis SA | | 537,100 | | 1,030 | |
| Embraer SA | | 199,222 | | 859 | |
| LOG Commercial Properties e Participacoes SA | | 22,525 | | 132 | |
| | | | | 99,457 | |
Canada (3.0%) | | | | | |
| Fairfax Financial Holdings Ltd. (XTSE) | | 103,654 | | 45,691 | |
| Barrick Gold Corp. | | 1,696,084 | | 29,393 | |
* | Shopify Inc. Class A | | 84,152 | | 26,227 | |
| Ritchie Bros Auctioneers Inc. (XNYS) | | 467,034 | | 18,635 | |
^ | Brookfield Asset Management Inc. Class A | | 337,986 | | 17,947 | |
| Canadian Natural Resources Ltd. | | 501,315 | | 13,338 | |
| Fairfax Financial Holdings Ltd. | | 27,770 | | 12,246 | |
^ | PrairieSky Royalty Ltd. | | 618,965 | | 8,634 | |
| Ritchie Bros Auctioneers Inc. (XTSE) | | 205,269 | | 8,182 | |
*,2 | Spin Master Corp. | | 223,072 | | 6,816 | |
| Gildan Activewear Inc. | | 186,395 | | 6,615 | |
| | | | | 193,724 | |
Chile (0.2%) | | | | | |
| Quinenco SA | | 1,465,008 | | 3,593 | |
| Cia Cervecerias Unidas SA | | 255,483 | | 2,854 | |
* | Cia Sud Americana de Vapores SA | | 60,919,641 | | 2,116 | |
| Enaex SA | | 95,150 | | 1,044 | |
| | | | | 9,607 | |
1
Vanguard® Global Equity Fund
Schedule of Investments
September 30, 2019
| | | | | Market | |
| | | | | Value | |
| | | Shares | | ($000 | ) |
China (4.1%) | | | | | |
* | Alibaba Group Holding Ltd. ADR | | 538,641 | | 90,077 | |
| Ping An Insurance Group Co. of China Ltd. | | 4,780,500 | | 54,946 | |
| Brilliance China Automotive Holdings Ltd. | | 21,130,000 | | 22,699 | |
* | Meituan Dianping Class B | | 1,728,900 | | 17,658 | |
*,^ | Autohome Inc. ADR | | 204,697 | | 17,017 | |
* | Ctrip.com International Ltd. ADR | | 543,765 | | 15,927 | |
* | 58.com Inc. ADR | | 296,254 | | 14,608 | |
| Tsingtao Brewery Co. Ltd. | | 1,856,000 | | 11,198 | |
* | Baidu Inc. ADR | | 59,674 | | 6,132 | |
| Want Want China Holdings Ltd. | | 6,065,557 | | 4,844 | |
| Yum China Holdings Inc. | | 105,574 | | 4,796 | |
| Tingyi Cayman Islands Holding Corp. | | 2,791,608 | | 3,930 | |
| China Mengniu Dairy Co. Ltd. | | 619,000 | | 2,317 | |
2 | BAIC Motor Corp. Ltd. | | 2,138,132 | | 1,321 | |
| Ajisen China Holdings Ltd. | | 2,393,000 | | 670 | |
* | Goodbaby International Holdings Ltd. | | 1,515,000 | | 228 | |
| | | | | 268,368 | |
Colombia (0.1%) | | | | | |
| Bancolombia SA ADR | | 88,016 | | 4,353 | |
| Grupo Aval Acciones y Valores Preference Shares | | 2,867,790 | | 1,071 | |
| | | | | 5,424 | |
Czech Republic (0.0%) | | | | | |
| Komercni banka as | | 54,453 | | 1,841 | |
| | | | | | |
Denmark (0.6%) | | | | | |
* | Genmab A/S | | 76,237 | | 15,490 | |
| Coloplast A/S Class B | | 58,627 | | 7,054 | |
| Vestas Wind Systems A/S | | 68,126 | | 5,285 | |
| Novo Nordisk A/S Class B | | 80,551 | | 4,163 | |
| GN Store Nord A/S | | 81,559 | | 3,306 | |
* | Demant A/S | | 92,385 | | 2,365 | |
| Carlsberg A/S Class B | | 15,983 | | 2,362 | |
2 | Orsted A/S | | 9,134 | | 849 | |
| Danske Bank A/S | | 23,150 | | 322 | |
| | | | | 41,196 | |
Finland (0.1%) | | | | | |
| Sampo Oyj Class A | | 102,138 | | 4,058 | |
| Tikkurila Oyj | | 273,780 | | 4,041 | |
| Wartsila Oyj Abp | | 55,777 | | 624 | |
| | | | | 8,723 | |
France (2.6%) | | | | | |
| Pernod Ricard SA | | 285,076 | | 50,738 | |
| Bureau Veritas SA | | 1,038,152 | | 24,988 | |
| Legrand SA | | 325,269 | | 23,204 | |
| EssilorLuxottica SA | | 147,264 | | 21,232 | |
| Schneider Electric SE | | 232,394 | | 20,321 | |
| Airbus SE | | 26,246 | | 3,407 | |
| Edenred | | 69,538 | | 3,336 | |
| BNP Paribas SA | | 55,112 | | 2,679 | |
| Eurofins Scientific SE | | 4,975 | | 2,314 | |
| AXA SA | | 79,458 | | 2,029 | |
| Alten SA | | 13,486 | | 1,540 | |
| Getlink SE | | 98,969 | | 1,486 | |
| Thales SA | | 12,913 | | 1,484 | |
| Teleperformance | | 6,525 | | 1,414 | |
| L’Occitane International SA | | 590,130 | | 1,174 | |
| ArcelorMittal | | 72,624 | | 1,022 | |
^ | TOTAL SA | | 19,137 | | 996 | |
| JCDecaux SA | | 31,032 | | 840 | |
| Elis SA (XPAR) | | 29,319 | | 518 | |
| Quadient SAS | | 18,062 | | 374 | |
| Vicat SA | | 7,763 | | 337 | |
| Elis SA (XLON) | | 14,337 | | 254 | |
2
Vanguard® Global Equity Fund
Schedule of Investments
September 30, 2019
| | | | | Market | |
| | | | | Value | |
| | | Shares | | ($000 | ) |
| Imerys SA | | 5,566 | | 223 | |
| | | | | 165,910 | |
Germany (2.2%) | | | | | |
| SAP SE | | 470,825 | | 55,404 | |
| Deutsche Boerse AG | | 170,554 | | 26,600 | |
| Henkel AG & Co. KGaA Preference Shares | | 251,007 | | 24,837 | |
| Henkel AG & Co. KGaA | | 86,803 | | 7,946 | |
| adidas AG | | 14,228 | | 4,429 | |
| Fresenius Medical Care AG & Co. KGaA | | 52,879 | | 3,554 | |
| BASF SE | | 34,962 | | 2,444 | |
| Brenntag AG | | 46,793 | | 2,263 | |
| Volkswagen AG Preference Shares | | 12,817 | | 2,180 | |
| Deutsche Telekom AG | | 127,667 | | 2,141 | |
| Axel Springer SE | | 30,599 | | 2,101 | |
| Bayerische Motoren Werke AG | | 26,960 | | 1,899 | |
* | HelloFresh SE | | 112,348 | | 1,704 | |
| CTS Eventim AG & Co. KGaA | | 23,058 | | 1,299 | |
| Stabilus SA | | 25,782 | | 1,261 | |
| Hannover Rueck SE | | 6,014 | | 1,016 | |
| TUI AG (XETR) | | 71,392 | | 830 | |
| Symrise AG Class A | | 8,035 | | 781 | |
| Gerresheimer AG | | 7,755 | | 556 | |
| GEA Group AG | | 15,533 | | 419 | |
* | zooplus AG | | 1,759 | | 209 | |
| | | | | 143,873 | |
Greece (0.2%) | | | | | |
| Eurobank Ergasias SA | | 10,921,892 | | 10,575 | |
| JUMBO SA | | 154,147 | | 2,923 | |
| Fourlis Holdings SA | | 265,290 | | 1,593 | |
| | | | | 15,091 | |
Hong Kong (1.9%) | | | | | |
| AIA Group Ltd. | | 7,256,400 | | 68,435 | |
| Jardine Matheson Holdings Ltd. | | 389,100 | | 20,824 | |
| Sands China Ltd. | | 2,652,400 | | 11,985 | |
| CK Hutchison Holdings Ltd. | | 737,800 | | 6,513 | |
| HSBC Holdings plc | | 778,800 | | 5,973 | |
| Stella International Holdings Ltd. | | 2,182,173 | | 3,398 | |
* | Esprit Holdings Ltd. | | 8,023,714 | | 1,525 | |
| Hongkong & Shanghai Hotels Ltd. | | 1,108,200 | | 1,077 | |
| Television Broadcasts Ltd. | | 617,600 | | 1,007 | |
| First Pacific Co. Ltd. | | 2,353,250 | | 901 | |
| Dairy Farm International Holdings Ltd. | | 99,100 | | 625 | |
| SmarTone Telecommunications Holdings Ltd. | | 334,694 | | 291 | |
| New World Development Co. Ltd. | | 117,000 | | 152 | |
| Texwinca Holdings Ltd. | | 206,823 | | 47 | |
| | | | | 122,753 | |
India (1.9%) | | | | | |
| Housing Development Finance Corp. Ltd. | | 1,474,847 | | 41,166 | |
2 | Reliance Industries Ltd. GDR | | 891,508 | | 33,217 | |
| ICICI Bank Ltd. ADR | | 1,763,042 | | 21,474 | |
| ICICI Bank Ltd. | | 2,612,911 | | 15,923 | |
| Axis Bank Ltd. | | 606,169 | | 5,866 | |
| Bharti Airtel Ltd. | | 667,601 | | 3,461 | |
* | Vodafone Idea Ltd. | | 24,012,068 | | 2,086 | |
| Shriram Transport Finance Co. Ltd. | | 100,235 | | 1,515 | |
| Genpact Ltd. | | 37,418 | | 1,450 | |
| Yes Bank Ltd. | | 574,537 | | 336 | |
| | | | | 126,494 | |
Indonesia (0.0%) | | | | | |
| Media Nusantara Citra Tbk PT | | 23,105,650 | | 2,011 | |
| | | | | | |
Ireland (1.4%) | | | | | |
| CRH plc | | 1,361,124 | | 46,673 | |
3
Vanguard® Global Equity Fund
Schedule of Investments
September 30, 2019
| | | | | Market | |
| | | | | Value | |
| | | Shares | | ($000 | ) |
* | Ryanair Holdings plc ADR | | 388,471 | | 25,787 | |
| Bank of Ireland Group plc | | 3,615,643 | | 14,327 | |
| Flutter Entertainment plc (XLON) | | 29,217 | | 2,734 | |
| Irish Continental Group plc | | 197,470 | | 899 | |
| Flutter Entertainment plc (XDUB) | | 7,403 | | 692 | |
*,§ | Irish Bank Resolution Corp. Ltd. | | 122,273 | | — | |
| | | | | 91,112 | |
Italy (0.2%) | | | | | |
| CNH Industrial NV | | 354,113 | | 3,606 | |
* | Saipem SPA | | 520,872 | | 2,354 | |
| UniCredit SPA | | 157,272 | | 1,854 | |
| Davide Campari-Milano SPA | | 136,917 | | 1,237 | |
| Amplifon SPA | | 34,399 | | 844 | |
| Intesa Sanpaolo SPA (Registered) | | 280,426 | | 664 | |
| | | | | 10,559 | |
Japan (8.1%) | | | | | |
| MS&AD Insurance Group Holdings Inc. | | 1,689,900 | | 54,929 | |
| Olympus Corp. | | 3,314,700 | | 44,907 | |
| Sysmex Corp. | | 480,900 | | 32,308 | |
| SMC Corp. | | 74,100 | | 31,850 | |
| Advantest Corp. | | 703,500 | | 31,361 | |
| Sumitomo Mitsui Trust Holdings Inc. | | 788,600 | | 28,557 | |
| Toyota Motor Corp. | | 330,500 | | 22,196 | |
| Bridgestone Corp. | | 564,000 | | 21,949 | |
| Tokio Marine Holdings Inc. | | 402,400 | | 21,588 | |
| KDDI Corp. | | 802,600 | | 20,942 | |
| CyberAgent Inc. | | 542,100 | | 20,896 | |
| Secom Co. Ltd. | | 204,200 | | 18,685 | |
| Sompo Holdings Inc. | | 381,900 | | 16,039 | |
| Kyocera Corp. | | 210,200 | | 13,106 | |
| Persol Holdings Co. Ltd. | | 609,800 | | 11,590 | |
| Koito Manufacturing Co. Ltd. | | 140,900 | | 6,936 | |
| Hitachi Ltd. | | 180,600 | | 6,763 | |
| Nippon Telegraph & Telephone Corp. | | 118,300 | | 5,660 | |
| USS Co. Ltd. | | 289,500 | | 5,638 | |
| Sohgo Security Services Co. Ltd. | | 101,600 | | 5,344 | |
| Seven & i Holdings Co. Ltd. | | 114,900 | | 4,404 | |
| West Japan Railway Co. | | 44,800 | | 3,791 | |
| Resona Holdings Inc. | | 859,600 | | 3,699 | |
| Kirin Holdings Co. Ltd. | | 167,100 | | 3,556 | |
| East Japan Railway Co. | | 36,200 | | 3,462 | |
| Mitsubishi Estate Co. Ltd. | | 171,600 | | 3,318 | |
| Dai-ichi Life Holdings Inc. | | 213,300 | | 3,243 | |
| Kao Corp. | | 43,000 | | 3,190 | |
| Sumitomo Mitsui Financial Group Inc. | | 92,700 | | 3,185 | |
| NTT Data Corp. | | 206,700 | | 2,683 | |
| Inpex Corp. | | 278,900 | | 2,570 | |
| Japan Post Holdings Co. Ltd. | | 268,600 | | 2,479 | |
| Bandai Namco Holdings Inc. | | 35,750 | | 2,229 | |
| NEC Corp. | | 46,300 | | 1,958 | |
| Obayashi Corp. | | 186,900 | | 1,869 | |
| Mitsubishi Corp. | | 75,900 | | 1,869 | |
| TDK Corp. | | 20,200 | | 1,826 | |
| Fuji Media Holdings Inc. | | 131,600 | | 1,700 | |
| Mizuho Financial Group Inc. | | 1,037,900 | | 1,595 | |
* | Renesas Electronics Corp. | | 242,700 | | 1,590 | |
| ITOCHU Corp. | | 75,700 | | 1,568 | |
| Nomura Holdings Inc. | | 367,300 | | 1,561 | |
| Nissan Chemical Corp. | | 36,400 | | 1,524 | |
| Toyo Suisan Kaisha Ltd. | | 37,900 | | 1,522 | |
| Daiwa House Industry Co. Ltd. | | 46,000 | | 1,495 | |
| Sekisui Chemical Co. Ltd. | | 91,700 | | 1,427 | |
| SCSK Corp. | | 29,600 | | 1,393 | |
| Marui Group Co. Ltd. | | 63,500 | | 1,345 | |
4
Vanguard® Global Equity Fund
Schedule of Investments
September 30, 2019
| | | | | Market | |
| | | | | Value | |
| | | Shares | | ($000 | ) |
| Alfresa Holdings Corp. | | 60,000 | | 1,344 | |
| Daifuku Co. Ltd. | | 25,500 | | 1,327 | |
| Asics Corp. | | 77,100 | | 1,322 | |
| Maeda Corp. | | 146,100 | | 1,281 | |
| Otsuka Holdings Co. Ltd. | | 32,600 | | 1,225 | |
| Omron Corp. | | 22,100 | | 1,218 | |
| AEON Financial Service Co. Ltd. | | 76,800 | | 1,161 | |
| Sega Sammy Holdings Inc. | | 82,300 | | 1,155 | |
| Matsumotokiyoshi Holdings Co. Ltd. | | 29,400 | | 1,079 | |
| LIXIL Group Corp. | | 60,100 | | 1,062 | |
| Tokyo Gas Co. Ltd. | | 39,800 | | 1,007 | |
| Nippon Television Holdings Inc. | | 77,970 | | 1,004 | |
| Casio Computer Co. Ltd. | | 64,300 | | 1,001 | |
| Nomura Co. Ltd. | | 78,400 | | 992 | |
| Sumitomo Electric Industries Ltd. | | 74,500 | | 951 | |
| Toray Industries Inc. | | 127,500 | | 950 | |
| Toyota Industries Corp. | | 16,200 | | 935 | |
| Rohm Co. Ltd. | | 12,100 | | 933 | |
| Toyo Seikan Group Holdings Ltd. | | 55,700 | | 869 | |
| TechnoPro Holdings Inc. | | 14,500 | | 865 | |
| Shimizu Corp. | | 95,200 | | 865 | |
| Hoshizaki Corp. | | 10,700 | | 843 | |
| Fukuoka Financial Group Inc. | | 44,000 | | 835 | |
| Takeda Pharmaceutical Co. Ltd. | | 22,800 | | 782 | |
| MediPal Holdings Corp. | | 34,200 | | 763 | |
| Azbil Corp. | | 28,400 | | 763 | |
| Kansai Electric Power Co. Inc. | | 67,300 | | 754 | |
| Nippon Shokubai Co. Ltd. | | 13,100 | | 748 | |
| Jafco Co. Ltd. | | 19,400 | | 738 | |
| Ryohin Keikaku Co. Ltd. | | 36,500 | | 684 | |
| Senko Group Holdings Co. Ltd. | | 86,600 | | 677 | |
| Taiheiyo Cement Corp. | | 24,700 | | 664 | |
| Obic Co. Ltd. | | 5,700 | | 653 | |
| Ushio Inc. | | 44,700 | | 635 | |
| Penta-Ocean Construction Co. Ltd. | | 112,300 | | 624 | |
| Sawai Pharmaceutical Co. Ltd. | | 11,600 | | 600 | |
| SHO-BOND Holdings Co. Ltd. | | 16,300 | | 574 | |
| Tokyo Ohka Kogyo Co. Ltd. | | 14,500 | | 542 | |
| Sumitomo Metal Mining Co. Ltd. | | 17,100 | | 534 | |
| Megmilk Snow Brand Co. Ltd. | | 20,600 | | 498 | |
| Mitsubishi Logistics Corp. | | 19,300 | | 492 | |
| Aeon Delight Co. Ltd. | | 15,100 | | 475 | |
| Nippon Suisan Kaisha Ltd. | | 74,900 | | 424 | |
| FUJIFILM Holdings Corp. | | 9,500 | | 418 | |
| Tsumura & Co. | | 14,300 | | 384 | |
| Onward Holdings Co. Ltd. | | 51,600 | | 269 | |
* | Mitsui E&S Holdings Co. Ltd. | | 16,700 | | 147 | |
| Subaru Corp. | | 5,000 | | 141 | |
| Yamato Holdings Co. Ltd. | | 8,700 | | 131 | |
| Tohoku Electric Power Co. Inc. | | 4,900 | | 48 | |
| | | | | 525,681 | |
Kenya (0.0%) | | | | | |
| East African Breweries Ltd. | | 1,373,697 | | 2,563 | |
| | | | | | |
Malaysia (0.0%) | | | | | |
| Sime Darby Bhd. | | 1,201,600 | | 646 | |
| | | | | | |
Mexico (0.3%) | | | | | |
* | Genomma Lab Internacional SAB de CV Class B | | 6,621,932 | | 6,349 | |
| Gentera SAB de CV | | 4,670,905 | | 3,853 | |
| Grupo Lala SAB de CV | | 2,400,011 | | 2,752 | |
| Grupo Televisa SAB ADR | | 184,527 | | 1,805 | |
2 | Nemak SAB de CV | | 3,663,895 | | 1,652 | |
| Grupo Financiero Inbursa SAB de CV | | 1,290,371 | | 1,641 | |
5
Vanguard® Global Equity Fund
Schedule of Investments
September 30, 2019
| | | | | Market | |
| | | | | Value | |
| | | Shares | | ($000 | ) |
| Industrias Bachoco SAB de CV Class B | | 280,728 | | 1,236 | |
| | | | | 19,288 | |
Netherlands (1.9%) | | | | | |
| Unilever NV | | 790,460 | | 47,465 | |
* | Prosus NV | | 482,357 | | 35,409 | |
2 | Signify NV | | 877,537 | | 24,117 | |
| Heineken NV | | 41,002 | | 4,429 | |
| Koninklijke Philips NV | | 56,803 | | 2,625 | |
| Koninklijke Ahold Delhaize NV | | 98,245 | | 2,457 | |
| Akzo Nobel NV | | 26,651 | | 2,375 | |
| Koninklijke KPN NV | | 588,884 | | 1,835 | |
| ASML Holding NV | | 5,749 | | 1,426 | |
| Boskalis Westminster | | 42,496 | | 886 | |
| Coca-Cola European Partners plc | | 13,545 | | 751 | |
| Randstad NV | | 11,407 | | 560 | |
*,2 | Takeaway.com NV | | 2,411 | | 192 | |
| | | | | 124,527 | |
New Zealand (0.0%) | | | | | |
| Spark New Zealand Ltd. | | 505,038 | | 1,395 | |
| SKY Network Television Ltd. | | 622,375 | | 437 | |
| | | | | 1,832 | |
Norway (0.6%) | | | | | |
| Schibsted ASA Class A | | 641,964 | | 18,998 | |
| Schibsted ASA Class B | | 300,676 | | 8,432 | |
* | Adevinta ASA Class A | | 641,964 | | 7,417 | |
* | Adevinta ASA Class B | | 300,676 | | 3,486 | |
| Equinor ASA | | 77,229 | | 1,463 | |
| DNB ASA | | 57,082 | | 1,006 | |
| | | | | 40,802 | |
Other (0.4%) | | | | | |
3 | Vanguard FTSE Emerging Markets ETF | | 569,046 | | 22,910 | |
| | | | | | |
Peru (0.0%) | | | | | |
| Cia de Minas Buenaventura SAA ADR | | 121,068 | | 1,838 | |
| | | | | | |
Philippines (0.0%) | | | | | |
| Lopez Holdings Corp. | | 3,056,549 | | 259 | |
| | | | | | |
Poland (0.0%) | | | | | |
| Eurocash SA | | 267,209 | | 1,399 | |
| | | | | | |
Russia (0.8%) | | | | | |
| Sberbank of Russia PJSC ADR | | 1,738,313 | | 24,584 | |
* | Mail.Ru Group Ltd. GDR (XLON) | | 471,234 | | 9,852 | |
* | Yandex NV Class A | | 83,752 | | 2,932 | |
| PhosAgro PJSC GDR | | 227,591 | | 2,906 | |
* | Global Ports Investments plc GDR | | 794,186 | | 2,369 | |
| Lukoil PJSC ADR | | 23,975 | | 1,980 | |
| Alrosa PJSC | | 1,582,585 | | 1,818 | |
| Magnit PJSC | | 30,977 | | 1,697 | |
| Sberbank of Russia PJSC ADR (XLON) | | 116,233 | | 1,649 | |
| Globaltrans Investment plc GDR | | 143,255 | | 1,233 | |
* | Mail.Ru Group Ltd. GDR | | 2,727 | | 58 | |
| | | | | 51,078 | |
Singapore (0.2%) | | | | | |
| Delfi Ltd. | | 4,326,700 | | 3,580 | |
| Great Eastern Holdings Ltd. | | 216,800 | | 3,562 | |
| United Overseas Bank Ltd. | | 153,500 | | 2,853 | |
| Haw Par Corp. Ltd. | | 150,341 | | 1,455 | |
| DBS Group Holdings Ltd. | | 73,900 | | 1,337 | |
| United Industrial Corp. Ltd. | | 160,200 | | 327 | |
| | | | | 13,114 | |
South Africa (1.5%) | | | | | |
| Naspers Ltd. | | 482,357 | | 73,033 | |
6
Vanguard® Global Equity Fund
Schedule of Investments
September 30, 2019
| | | | | Market | |
| | | | | Value | |
| | | Shares | | ($000 | ) |
| Anglo American Platinum Ltd. | | 104,475 | | 6,299 | |
| Tiger Brands Ltd. | | 355,978 | | 4,948 | |
| Telkom SA SOC Ltd. | | 754,652 | | 3,518 | |
| Anglo American plc Ordinary Shares | | 105,911 | | 2,458 | |
| Cie Financiere Richemont SA (XJSE) | | 280,421 | | 2,067 | |
| Raubex Group Ltd. | | 1,151,625 | | 1,448 | |
| Grindrod Ltd. | | 3,118,065 | | 926 | |
| Tsogo Sun Gaming Ltd. | | 584,936 | | 509 | |
* | Tsogo Sun Hotels Ltd. | | 584,936 | | 155 | |
| | | | | 95,361 | |
South Korea (1.2%) | | | | | |
| Samsung Electronics Co. Ltd. | | 952,434 | | 38,996 | |
| Shinhan Financial Group Co. Ltd. | | 201,001 | | 7,024 | |
| Samsung Fire & Marine Insurance Co. Ltd. | | 23,559 | | 4,390 | |
| LG Corp. | | 71,705 | | 4,194 | |
| SK Hynix Inc. | | 58,970 | | 4,050 | |
| AMOREPACIFIC Group | | 60,607 | | 3,311 | |
| Hyundai Motor Co. | | 25,410 | | 2,845 | |
| Hana Financial Group Inc. | | 80,163 | | 2,360 | |
| KT Corp. ADR | | 176,411 | | 1,995 | |
| S-1 Corp. | | 22,461 | | 1,843 | |
| Hankook Tire & Technology Co. Ltd. | | 57,894 | | 1,559 | |
| KT Corp. | | 52,767 | | 1,210 | |
| GS Home Shopping Inc. | | 7,253 | | 940 | |
| | | | | 74,717 | |
Spain (0.1%) | | | | | |
| Viscofan SA | | 26,411 | | 1,237 | |
| Bankia SA | | 477,930 | | 902 | |
2 | Gestamp Automocion SA | | 160,020 | | 747 | |
| Acerinox SA | | 79,138 | | 678 | |
* | Ferrovial SA | | 21,072 | | 609 | |
| Mediaset Espana Comunicacion SA | | 43,515 | | 280 | |
| Banco Santander SA | | 66,923 | | 272 | |
| | | | | 4,725 | |
Sweden (1.2%) | | | | | |
| Atlas Copco AB Class B | | 923,043 | | 24,995 | |
| Epiroc AB Class B | | 1,597,584 | | 16,486 | |
| Svenska Handelsbanken AB Class A | | 1,552,109 | | 14,520 | |
* | Spotify Technology SA | | 89,004 | | 10,147 | |
| Assa Abloy AB Class B | | 244,081 | | 5,426 | |
| Sandvik AB | | 138,505 | | 2,156 | |
| Millicom International Cellular SA | | 25,194 | | 1,223 | |
| Nordea Bank Abp (XHEL) | | 167,813 | | 1,189 | |
| Swedish Match AB | | 23,387 | | 967 | |
| Nordic Entertainment Group AB Class B | | 33,767 | | 798 | |
* | Modern Times Group MTG AB Class B | | 33,413 | | 277 | |
| Nordea Bank Abp (XSTO) | | 2,971 | | 21 | |
| | | | | 78,205 | |
Switzerland (2.8%) | | | | | |
| Cie Financiere Richemont SA (XVTX) | | 581,989 | | 42,652 | |
| Schindler Holding AG | | 159,490 | | 35,692 | |
| Nestle SA | | 293,029 | | 31,780 | |
| Novartis AG | | 271,681 | | 23,578 | |
| Roche Holding AG | | 57,530 | | 16,751 | |
| Geberit AG | | 34,184 | | 16,336 | |
| Kuehne & Nagel International AG | | 59,862 | | 8,809 | |
| Adecco Group AG | | 52,738 | | 2,918 | |
| Logitech International SA | | 42,037 | | 1,708 | |
| Sonova Holding AG | | 7,107 | | 1,654 | |
| DKSH Holding AG | | 18,573 | | 927 | |
| UBS Group AG | | 72,621 | | 825 | |
| Helvetia Holding AG | | 5,360 | | 740 | |
7
Vanguard® Global Equity Fund
Schedule of Investments
September 30, 2019
| | | | | Market | |
| | | | | Value | |
| | | Shares | | ($000 | ) |
* | Alcon Inc. | | 3,106 | | 181 | |
| | | | | 184,551 | |
Taiwan (1.2%) | | | | | |
| Taiwan Semiconductor Manufacturing Co. Ltd. ADR | | 901,462 | | 41,900 | |
| Taiwan Semiconductor Manufacturing Co. Ltd. | | 1,736,577 | | 15,423 | |
| Yungtay Engineering Co. Ltd. | | 2,390,000 | | 4,877 | |
| Teco Electric and Machinery Co. Ltd. | | 4,857,190 | | 3,915 | |
| Delta Electronics Inc. | | 858,488 | | 3,668 | |
| Giant Manufacturing Co. Ltd. | | 471,469 | | 3,207 | |
* | PChome Online Inc. | | 563,510 | | 2,350 | |
| Chroma ATE Inc. | | 439,000 | | 2,082 | |
| Merida Industry Co. Ltd. | | 246,547 | | 1,401 | |
| | | | | 78,823 | |
Thailand (0.1%) | | | | | |
| Kasikornbank PCL (Foreign) | | 407,200 | | 2,091 | |
| Bangkok Bank PCL (Foreign) | | 178,600 | | 1,028 | |
* | BEC World PCL (Foreign) | | 2,348,800 | | 568 | |
| | | | | 3,687 | |
Turkey (0.1%) | | | | | |
* | Turkiye Garanti Bankasi AS | | 2,008,866 | | 3,627 | |
| Ulker Biskuvi Sanayi AS | | 384,377 | | 1,338 | |
| | | | | 4,965 | |
United Kingdom (5.2%) | | | | | |
| Prudential plc | | 5,290,562 | | 95,872 | |
| Reckitt Benckiser Group plc | | 418,604 | | 32,685 | |
| BHP Group plc | | 1,461,907 | | 31,226 | |
| Spectris plc | | 449,231 | | 13,485 | |
* | Just Eat plc | | 1,623,665 | | 13,338 | |
| Hays plc | | 6,781,527 | | 12,572 | |
| GlaxoSmithKline plc | | 414,699 | | 8,889 | |
| WPP plc | | 645,974 | | 8,089 | |
| Intertek Group plc | | 98,747 | | 6,647 | |
| Compass Group plc | | 242,354 | | 6,236 | |
| Rightmove plc | | 805,750 | | 5,452 | |
| Standard Chartered plc | | 555,802 | | 4,665 | |
| Unilever plc | | 75,957 | | 4,565 | |
| HomeServe plc | | 304,270 | | 4,436 | |
| BP plc | | 682,698 | | 4,322 | |
| 3i Group plc | | 294,966 | | 4,222 | |
| Diageo plc | | 101,863 | | 4,161 | |
2 | Merlin Entertainments plc | | 723,364 | | 4,025 | |
| RELX plc | | 159,855 | | 3,797 | |
| Experian plc | | 107,355 | | 3,433 | |
| Bunzl plc | | 125,397 | | 3,278 | |
| DCC plc | | 31,453 | | 2,743 | |
2 | ConvaTec Group plc | | 1,090,285 | | 2,348 | |
| Glencore plc | | 770,283 | | 2,321 | |
| Rolls-Royce Holdings plc | | 237,715 | | 2,310 | |
| SSP Group plc | | 299,928 | | 2,284 | |
| Antofagasta plc | | 206,229 | | 2,277 | |
| Barclays plc | | 1,192,328 | | 2,197 | |
| GVC Holdings plc | | 232,514 | | 2,124 | |
| BAE Systems plc | | 299,696 | | 2,099 | |
| Admiral Group plc | | 78,687 | | 2,046 | |
| Informa plc | | 193,692 | | 2,029 | |
| Royal Dutch Shell plc Class A | | 68,703 | | 2,015 | |
| Rio Tinto plc | | 38,718 | | 2,013 | |
* | Serco Group plc | | 1,084,271 | | 1,989 | |
| DS Smith plc | | 445,108 | | 1,971 | |
| ITV plc | | 1,217,122 | | 1,885 | |
| Lloyds Banking Group plc | | 2,768,111 | | 1,835 | |
| Royal Dutch Shell plc Class B | | 59,916 | | 1,771 | |
| G4S plc | | 754,192 | | 1,756 | |
8
Vanguard® Global Equity Fund
Schedule of Investments
September 30, 2019
| | | | | Market | |
| | | | | Value | |
| | | Shares | | ($000 | ) |
| WH Smith plc | | 65,317 | | 1,596 | |
| Tesco plc | | 499,377 | | 1,476 | |
| Carnival plc | | 32,274 | | 1,336 | |
2 | Auto Trader Group plc | | 208,613 | | 1,308 | |
| easyJet plc | | 89,085 | | 1,257 | |
| Inchcape plc | | 146,269 | | 1,135 | |
* | Capita plc | | 635,382 | | 1,132 | |
| IG Group Holdings plc | | 149,595 | | 1,108 | |
| Smith & Nephew plc | | 42,632 | | 1,027 | |
* | Georgia Capital plc | | 80,150 | | 1,006 | |
| St. James’s Place plc | | 77,993 | | 938 | |
| Jupiter Fund Management plc | | 198,172 | | 866 | |
| TUI AG (XLON) | | 73,823 | | 857 | |
| Provident Financial plc | | 157,101 | | 787 | |
| Barratt Developments plc | | 92,859 | | 739 | |
| National Grid plc | | 57,632 | | 624 | |
| Pagegroup plc | | 106,342 | | 573 | |
| Vodafone Group plc | | 284,148 | | 566 | |
| Pets at Home Group plc | | 218,515 | | 558 | |
| National Express Group plc | | 104,832 | | 558 | |
| British American Tobacco plc | | 15,086 | | 557 | |
| Close Brothers Group plc | | 31,761 | | 550 | |
| Rotork plc | | 138,478 | | 530 | |
| John Wood Group plc | | 110,426 | | 515 | |
| Daily Mail & General Trust plc | | 48,684 | | 511 | |
| Rathbone Brothers plc | | 18,184 | | 497 | |
| Devro plc | | 183,523 | | 430 | |
| International Personal Finance plc | | 297,621 | | 405 | |
| IMI plc | | 33,748 | | 398 | |
2 | McCarthy & Stone plc | | 203,379 | | 363 | |
| Playtech plc | | 68,120 | | 357 | |
| Euromoney Institutional Investor plc | | 18,107 | | 329 | |
| Petrofac Ltd. | | 47,259 | | 232 | |
2 | Non-Standard Finance plc | | 419,844 | | 206 | |
| Moneysupermarket.com Group plc | | 42,634 | | 198 | |
*,^,§ | Thomas Cook Group plc | | 1,494,021 | | — | |
| | | | | 340,933 | |
United States (48.9%) Communication Services (4.6%) | | | | | |
* | Alphabet Inc. Class C | | 81,799 | | 99,713 | |
* | Facebook Inc. Class A | | 434,417 | | 77,361 | |
* | Alphabet Inc. Class A | | 38,178 | | 46,621 | |
*,^ | Zillow Group Inc. | | 645,697 | | 19,255 | |
| Omnicom Group Inc. | | 204,244 | | 15,992 | |
* | Netflix Inc. | | 58,008 | | 15,524 | |
| Activision Blizzard Inc. | | 148,829 | | 7,876 | |
* | Electronic Arts Inc. | | 79,549 | | 7,781 | |
| Entercom Communications Corp. Class A | | 1,349,795 | | 4,508 | |
* | Eventbrite Inc. Class A | | 242,519 | | 4,295 | |
* | Zillow Group Inc. Class A | | 44,560 | | 1,317 | |
| | | | | 300,243 | |
Consumer Discretionary (5.7%) | | | | | |
* | Amazon.com Inc. | | 69,884 | | 121,312 | |
* | Booking Holdings Inc. | | 24,663 | | 48,404 | |
| Service Corp. International | | 771,154 | | 36,869 | |
* | Chipotle Mexican Grill Inc. Class A | | 31,383 | | 26,377 | |
* | CarMax Inc. | | 266,139 | | 23,420 | |
* | GrubHub Inc. | | 374,872 | | 21,072 | |
*,^ | Tesla Inc. | | 79,361 | | 19,116 | |
| TJX Cos. Inc. | | 245,479 | | 13,683 | |
* | AutoZone Inc. | | 12,409 | | 13,459 | |
* | Visteon Corp. | | 154,997 | | 12,793 | |
* | Chegg Inc. | | 367,470 | | 11,006 | |
| Harley-Davidson Inc. | | 188,660 | | 6,786 | |
9
Vanguard® Global Equity Fund
Schedule of Investments
September 30, 2019
| | | | | Market | |
| | | | | Value | |
| | | Shares | | ($000 | ) |
| Williams-Sonoma Inc. | | 98,504 | | 6,696 | |
| Wolverine World Wide Inc. | | 202,592 | | 5,725 | |
* | Ulta Beauty Inc. | | 19,071 | | 4,780 | |
| | | | | 371,498 | |
Consumer Staples (3.2%) | | | | | |
| Procter & Gamble Co. | | 357,233 | | 44,433 | |
| Archer-Daniels-Midland Co. | | 792,769 | | 32,559 | |
| Coca-Cola Co. | | 534,929 | | 29,122 | |
| Bunge Ltd. | | 500,565 | | 28,342 | |
| Colgate-Palmolive Co. | | 276,443 | | 20,321 | |
| Costco Wholesale Corp. | | 56,761 | | 16,353 | |
| Kimberly-Clark Corp. | | 83,206 | | 11,820 | |
| PepsiCo Inc. | | 83,157 | | 11,401 | |
| Hershey Co. | | 67,929 | | 10,528 | |
| PriceSmart Inc. | | 43,605 | | 3,100 | |
| Spectrum Brands Holdings Inc. | | 21,536 | | 1,135 | |
| | | | | 209,114 | |
Energy (1.3%) | | | | | |
| EOG Resources Inc. | | 517,174 | | 38,384 | |
| Apache Corp. | | 1,180,812 | | 30,229 | |
| National Oilwell Varco Inc. | | 604,139 | | 12,808 | |
| TechnipFMC plc | | 18,458 | | 441 | |
| | | | | 81,862 | |
Financials (10.5%) | | | | | |
| Moody’s Corp. | | 382,091 | | 78,264 | |
| Wells Fargo & Co. | | 1,375,769 | | 69,394 | |
* | Markel Corp. | | 40,649 | | 48,043 | |
| Travelers Cos. Inc. | | 321,335 | | 47,779 | |
| US Bancorp | | 831,639 | | 46,023 | |
* | Berkshire Hathaway Inc. Class B | | 205,929 | | 42,837 | |
| MarketAxess Holdings Inc. | | 124,044 | | 40,624 | |
| Arthur J Gallagher & Co. | | 449,442 | | 40,257 | |
| Hartford Financial Services Group Inc. | | 557,253 | | 33,775 | |
| American Express Co. | | 273,420 | | 32,340 | |
| Loews Corp. | | 581,423 | | 29,932 | |
| Chubb Ltd. | | 152,635 | | 24,641 | |
| TD Ameritrade Holding Corp. | | 467,291 | | 21,823 | |
* | LendingTree Inc. | | 57,004 | | 17,696 | |
| Bank of New York Mellon Corp. | | 384,380 | | 17,378 | |
| Aflac Inc. | | 305,109 | | 15,963 | |
| Jefferies Financial Group Inc. | | 859,474 | | 15,814 | |
| Interactive Brokers Group Inc. | | 292,347 | | 15,723 | |
* | Alleghany Corp. | | 19,549 | | 15,595 | |
| Willis Towers Watson plc | | 53,690 | | 10,361 | |
| First Republic Bank | | 105,174 | | 10,170 | |
| T. Rowe Price Group Inc. | | 45,278 | | 5,173 | |
| M&T Bank Corp. | | 30,565 | | 4,828 | |
| | | | | 684,433 | |
Health Care (8.0%) | | | | | |
| Anthem Inc. | | 343,719 | | 82,527 | |
| Johnson & Johnson | | 505,421 | | 65,391 | |
* | Waters Corp. | | 276,856 | | 61,803 | |
| Merck & Co. Inc. | | 570,607 | | 48,034 | |
| Thermo Fisher Scientific Inc. | | 152,248 | | 44,345 | |
| ResMed Inc. | | 314,569 | | 42,501 | |
* | Seattle Genetics Inc. | | 412,666 | | 35,242 | |
* | Alnylam Pharmaceuticals Inc. | | 310,418 | | 24,964 | |
* | Illumina Inc. | | 76,733 | | 23,344 | |
* | ABIOMED Inc. | | 122,533 | | 21,797 | |
* | Novocure Ltd. | | 233,591 | | 17,468 | |
* | Myriad Genetics Inc. | | 600,039 | | 17,179 | |
| Baxter International Inc. | | 154,822 | | 13,542 | |
*,^ | Teladoc Health Inc. | | 195,418 | | 13,234 | |
10
Vanguard® Global Equity Fund
Schedule of Investments
September 30, 2019
| | | | | Market | |
| | | | | Value | |
| | | Shares | | ($000 | ) |
* | Globus Medical Inc. | | 192,233 | | 9,827 | |
| | | | | 521,198 | |
Industrials (4.3%) | | | | | |
* | Kirby Corp. | | 509,299 | | 41,844 | |
| CH Robinson Worldwide Inc. | | 310,733 | | 26,344 | |
| United Parcel Service Inc. Class B | | 195,595 | | 23,436 | |
| 3M Co. | | 118,616 | | 19,500 | |
* | SiteOne Landscape Supply Inc. | | 258,090 | | 19,104 | |
| Expeditors International of Washington Inc. | | 249,744 | | 18,554 | |
| Union Pacific Corp. | | 114,487 | | 18,545 | |
| Wabtec Corp. | | 249,378 | | 17,920 | |
| United Technologies Corp. | | 130,965 | | 17,879 | |
* | Stericycle Inc. | | 335,111 | | 17,067 | |
| Fastenal Co. | | 438,746 | | 14,334 | |
* | Axon Enterprise Inc. | | 247,602 | | 14,059 | |
* | NOW Inc. | | 829,723 | | 9,517 | |
| PACCAR Inc. | | 108,032 | | 7,563 | |
* | Univar Solutions Inc. | | 353,352 | | 7,336 | |
| Lincoln Electric Holdings Inc. | | 71,884 | | 6,237 | |
*,§ | Sun-Times Media Group Inc. Class A | | 130,959 | | — | |
| | | | | 279,239 | |
Information Technology (8.7%) | | | | | |
| Mastercard Inc. Class A | | 291,129 | | 79,062 | |
| Visa Inc. Class A | | 389,787 | | 67,047 | |
| Oracle Corp. | | 1,201,568 | | 66,122 | |
| Texas Instruments Inc. | | 413,899 | | 53,492 | |
| Microsoft Corp. | | 335,383 | | 46,628 | |
| Intel Corp. | | 873,300 | | 45,001 | |
| Broadridge Financial Solutions Inc. | | 246,278 | | 30,644 | |
| Teradyne Inc. | | 448,839 | | 25,992 | |
| Applied Materials Inc. | | 476,387 | | 23,772 | |
| Analog Devices Inc. | | 164,430 | | 18,372 | |
| Paychex Inc. | | 217,669 | | 18,017 | |
| TE Connectivity Ltd. | | 183,148 | | 17,066 | |
| Maxim Integrated Products Inc. | | 283,344 | | 16,408 | |
* | PayPal Holdings Inc. | | 138,234 | | 14,320 | |
* | Trade Desk Inc. Class A | | 75,956 | | 14,246 | |
| Accenture plc Class A | | 59,141 | | 11,376 | |
| Dolby Laboratories Inc. Class A | | 171,436 | | 11,082 | |
* | IPG Photonics Corp. | | 32,669 | | 4,430 | |
| Xilinx Inc. | | 32,819 | | 3,147 | |
| | | | | 566,224 | |
Materials (1.7%) | | | | | |
| Martin Marietta Materials Inc. | | 186,831 | | 51,210 | |
| PPG Industries Inc. | | 172,155 | | 20,402 | |
| Albemarle Corp. | | 261,644 | | 18,190 | |
* | Axalta Coating Systems Ltd. | | 354,578 | | 10,691 | |
| Linde plc | | 49,520 | | 9,593 | |
| Freeport-McMoRan Inc. | | 279,657 | | 2,676 | |
| | | | | 112,762 | |
Real Estate (0.9%) | | | | | |
* | Howard Hughes Corp. | | 112,160 | | 14,536 | |
| Rayonier Inc. | | 509,271 | | 14,361 | |
| Weyerhaeuser Co. | | 514,470 | | 14,251 | |
^ | Tanger Factory Outlet Centers Inc. | | 812,356 | | 12,575 | |
| | | | | 55,723 | |
| | | | | 3,182,296 | |
Total Common Stocks (Cost $5,192,843) | | | | 6,239,499 | |
11
Vanguard® Global Equity Fund
Schedule of Investments
September 30, 2019
| | | | | | | Market | |
| | | | | | | Value | |
| | Coupon | | | Shares | | ($000 | ) |
Temporary Cash Investments (4.6%)1 | | | | | | |
Money Market Fund (4.5%) | | | | | | |
4,5 | Vanguard Market Liquidity Fund | 2.098% | | | 2,917,626 | | 291,792 | |
| | | | | | | | |
| | | | | Face | | | |
| | | Maturity | | Amount | | | |
| | | Date | | ($000 | ) | | |
U.S. Government and Agency Obligations (0.1%) | | | | | | |
6 | United States Treasury Bill | 1.954% | 11/7/19 | | 5,000 | | 4,991 | |
6 | United States Treasury Bill | 2.048% | 11/21/19 | | 750 | | 748 | |
6 | United States Treasury Bill | 1.997% | 12/26/19 | | 1,000 | | 996 | |
| | | | | | | 6,735 | |
Total Temporary Cash Investments (Cost $298,490) | | | | | 298,527 | |
Total Investments (100.4%) (Cost $5,491,333) | | | | | 6,538,026 | |
Other Assets and Liabilities—Net (-0.4%)6,7 | | | | | (25,449 | ) |
Net Assets (100%) | | | | | 6,512,577 | |
| | | | | | | | | | |
* | Non-income-producing security. |
^ | Includes partial security positions on loan to broker-dealers. The total value of securities on loan is $49,240,000. |
§ | Security value determined using significant unobservable inputs. |
1 | The fund invests a portion of its cash reserves in equity markets through the use of index futures contracts. After giving effect to futures investments, the fund’s effective common stock and temporary cash investment positions represent 98.2% and 2.2%, respectively, of net assets. |
2 | Security exempt from registration under Rule 144A of the Securities Act of 1933. Such securities may be sold in transactions exempt from registration, normally to qualified institutional buyers. At September 30, 2019, the aggregate value of these securities was $77,161,000, representing 1.2% of net assets. |
3 | Considered an affiliated company of the fund as the issuer is another member of The Vanguard Group. |
4 | Affiliated money market fund available only to Vanguard funds and certain trusts and accounts managed by Vanguard. Rate shown is the 7-day yield. |
5 | Includes $52,993,000 of collateral received for securities on loan. |
6 | Securities with a value of $6,735,000 and cash of $701,000 have been segregated as initial margin for open futures contracts. |
7 | Cash of $510,000 has been segregated as collateral for open forward currency contracts. |
| ADR—American Depositary Receipt. |
| GDR—Global Depositary Receipt. |
12
This page intentionally left blank.
| © 2019 The Vanguard Group, Inc. |
| All rights reserved. |
| Vanguard Marketing Corporation, Distributor. |
| |
| SNA1290 112019 |

Report of Independent Registered Public Accounting Firm
To the Board of Trustees of Vanguard Horizon Funds and Shareholders of Vanguard Global Equity Fund
Opinion on the Financial Statements
We have audited the accompanying statement of net assets—investments summary and statement of assets and liabilities of Vanguard Global Equity Fund (one of the funds constituting Vanguard Horizon Funds, referred to hereafter as the “Fund”) as of September 30, 2019, the related statement of operations for the year ended September 30, 2019, the statement of changes in net assets for each of the two years in the period ended September 30, 2019, including the related notes, and the financial highlights for each of the five years in the period ended September 30, 2019 (included in Item 1 of this Form N-CSR) and the schedule of investments (included in Item 6 of this Form N-CSR) as of September 30, 2019 (collectively referred to as the “financial statements”). In our opinion, the financial statements present fairly, in all material respects, the financial position of the Fund as of September 30, 2019, the results of its operations for the year then ended, the changes in its net assets for each of the two years in the period ended September 30, 2019 and the financial highlights for each of the five years in the period ended September 30, 2019 in conformity with accounting principles generally accepted in the United States of America.
Basis for Opinion
These financial statements are the responsibility of the Fund’s management. Our responsibility is to express an opinion on the Fund’s financial statements based on our audits. We are a public accounting firm registered with the Public Company Accounting Oversight Board (United States) (“PCAOB”) and are required to be independent with respect to the Fund in accordance with the U.S. federal securities laws and the applicable rules and regulations of the Securities and Exchange Commission and the PCAOB.
We conducted our audits of these financial statements in accordance with the standards of the PCAOB. Those standards require that we plan and perform the audit to obtain reasonable assurance about whether the financial statements are free of material misstatement, whether due to error or fraud.
Our audits included performing procedures to assess the risks of material misstatement of the financial statements, whether due to error or fraud, and performing procedures that respond to those risks. Such procedures included examining, on a test basis, evidence regarding the amounts and disclosures in the financial statements. Our audits also included evaluating the accounting principles used and significant estimates made by management, as well as evaluating the overall presentation of the financial statements. Our procedures included confirmation of securities owned as of September 30, 2019 by correspondence with the custodian and brokers and by agreement to the underlying ownership records of the transfer agent; when replies were not received from brokers, we performed other auditing procedures. We believe that our audits provide a reasonable basis for our opinion.

November 19, 2019
We have served as the auditor of one or more investment companies in The Vanguard Group of Funds since 1975.
PricewaterhouseCoopers LLP, Two Commerce Square, Suite 1800, 2001 Market Street, Philadelphia, PA 19103-7042 T: (267) 330 3000, F: (267) 330 3300, www.pwc.com/us
Item 7: Disclosure of Proxy Voting Policies and Procedures for Closed-End Management Investment Companies.
Not applicable.
Item 8: Portfolio Managers of Closed-End Management Investment Companies.
Not applicable.
Item 9: Purchase of Equity Securities by Closed-End Management Investment Company and Affiliated Purchasers.
Not applicable.
Item 10: Submission of Matters to a Vote of Security Holders.
Not applicable.
Item 11: Controls and Procedures.
(a) Disclosure Controls and Procedures. The Principal Executive and Financial Officers concluded that the Registrant’s Disclosure Controls and Procedures are effective based on their evaluation of the Disclosure Controls and Procedures as of a date within 90 days of the filing date of this report.
(b) Internal Control Over Financial Reporting. There were no significant changes in Registrant’s Internal Control Over Financial Reporting or in other factors that could significantly affect this control subsequent to the date of the evaluation, including any corrective actions with regard to significant deficiencies and material weaknesses.
Item 12: Disclosure of Securities Lending Activities for Closed-End Management Investment Companies.
Not applicable.
Item 13: Exhibits.
(a) Code of Ethics.
(b) Certifications.
Pursuant to the requirements of the Securities Exchange Act of 1934 and the Investment Company Act of 1940, the registrant has duly caused this report to be signed on its behalf by the undersigned, thereunto duly authorized.
| VANGUARD HORIZON FUNDS |
| |
BY: | /s/ MORTIMER J. BUCKLEY* | |
| | |
| MORTIMER J. BUCKLEY | |
| CHIEF EXECUTIVE OFFICER | |
Date: November 15, 2019
Pursuant to the requirements of the Securities Exchange Act of 1934 and the Investment Company Act of 1940, this report has been signed below by the following persons on behalf of the registrant and in the capacities and on the dates indicated.
| VANGUARD HORIZON FUNDS |
| |
BY: | /s/ MORTIMER J. BUCKLEY* | |
| | |
| MORTIMER J. BUCKLEY | |
| CHIEF EXECUTIVE OFFICER | |
|
Date: November 15, 2019 |
|
| VANGUARD HORIZON FUNDS |
| |
BY: | /s/ JOHN BENDL* | |
| | |
| JOHN BENDL | |
| CHIEF FINANCIAL OFFICER | |
| |
Date: November 15, 2019 | |
* By: /s/ Anne E. Robinson
Anne E. Robinson, pursuant to a Power of Attorney filed on January 18, 2018 (see file Number 33-32216) and a Power of Attorney filed on October 30, 2019 (see file Number 811-02554), Incorporated by Reference.