UNITED STATES
SECURITIES AND EXCHANGE COMMISSION
Washington, D.C. 20549
FORM N-CSR
CERTIFIED SHAREHOLDER REPORT
OF
REGISTERED MANAGEMENT INVESTMENT COMPANIES
| | |
| Investment Company Act file number: | 811-07239 |
Name of Registrant: | Vanguard Horizon Funds |
Address of Registrant: | P.O. Box 2600 |
| | Valley Forge, PA 19482 |
Name and address of agent for service: | Anne E. Robinson, Esquire |
| | P.O. Box 876 |
| | Valley Forge, PA 19482 |
Registrant’s telephone number, including area code: (610) 669-1000 |
Date of fiscal year end: September 30 |
Date of reporting period: October 1, 2015 – September 30, 2016 |
Item 1: Reports to Shareholders |

Annual Report | September 30, 2016
Vanguard Strategic Equity Fund
A new format, unwavering commitment
As you begin reading this report, you’ll notice that we’ve made some improvements to the opening sections—based on feedback from you, our clients.
Page 1 starts with a new ”Your Fund’s Performance at a Glance,” a concise, handy summary of how your fund performed during the period.
In the renamed ”Chairman’s Perspective,” Bill McNabb will focus on enduring principles and investment insights.
We’ve modified some tables, and eliminated some redundancy, but we haven’t removed any information.
At Vanguard, we’re always looking for better ways to communicate and to help you make sound investment decisions. Thank you for entrusting your assets to us.
| |
| Contents | |
| Your Fund’s Performance at a Glance. | 1 |
| Chairman’s Perspective. | 3 |
| Advisor’s Report. | 6 |
| Fund Profile. | 9 |
| Performance Summary. | 10 |
| Financial Statements. | 12 |
| Your Fund’s After-Tax Returns. | 27 |
| About Your Fund’s Expenses. | 28 |
| Glossary. | 30 |
Please note: The opinions expressed in this report are just that—informed opinions. They should not be considered promises or advice.
Also, please keep in mind that the information and opinions cover the period through the date on the front of this report. Of course, the
risks of investing in your fund are spelled out in the prospectus.
See the Glossary for definitions of investment terms used in this report.
About the cover: No matter what language you speak, Vanguard has one consistent message and set of principles. Our primary
focus is on you, our clients. We conduct our business with integrity as a faithful steward of your assets. This message is shown
translated into seven languages, reflecting our expanding global presence.
Your Fund’s Performance at a Glance
• Vanguard Strategic Equity Fund returned nearly 11% for the 12 months ended September 30, 2016. It lagged its benchmark, the MSCI US Small + Mid Cap 2200 Index, by about 4 percentage points. The fund also trailed its peer-group average.
• Information technology and real estate companies were among the fund’s strongest performers. Energy and consumer staples were among the sectors that detracted most from the fund’s relative performance.
• Effective September 1, most real estate investment trusts were moved out of the financial sector and into a new real estate sector, the 11th in the fund’s benchmark.
• Over the ten years ended September 30, 2016, the fund’s average annual return was about a percentage point below its benchmark but higher than the average of its peer group.
| |
| Total Returns: Fiscal Year Ended September 30, 2016 | |
| | Total |
| | Returns |
| Vanguard Strategic Equity Fund | 10.62% |
| MSCI US Small + Mid Cap 2200 Index | 14.54 |
| Mid-Cap Core Funds Average | 11.26 |
| Mid-Cap Core Funds Average: Derived from data provided by Lipper, a Thomson Reuters Company. |
| |
| Total Returns: Ten Years Ended September 30, 2016 | |
| | Average |
| | Annual Return |
| Strategic Equity Fund | 7.36% |
| MSCI US Small + Mid Cap 2200 Index | 8.37 |
| Mid-Cap Core Funds Average | 7.03 |
| Mid-Cap Core Funds Average: Derived from data provided by Lipper, a Thomson Reuters Company. |
The figures shown represent past performance, which is not a guarantee of future results. (Current performance may be
lower or higher than the performance data cited. For performance data current to the most recent month-end, visit our
website at vanguard.com/performance.) Note, too, that both investment returns and principal value can fluctuate widely, so
an investor’s shares, when sold, could be worth more or less than their original cost.
1
| | |
| Expense Ratios | | |
| Your Fund Compared With Its Peer Group | | |
| | | Peer Group |
| | Fund | Average |
| Strategic Equity Fund | 0.21% | 1.18% |
The fund expense ratio shown is from the prospectus dated January 28, 2016, and represents estimated costs for the current fiscal year. For
the fiscal year ended September 30, 2016, the fund’s expense ratio was 0.18%. The peer-group expense ratio is derived from data provided
by Lipper, a Thomson Reuters Company, and captures information through year-end 2015.
Peer group: Mid-Cap Core Funds.
2
Chairman’s Perspective

Bill McNabb
Chairman and Chief Executive Officer
Dear Shareholder,
If you think you’ve had reason to feel uneasy about the investment environment lately, you’re not imagining things. In just the past few months, we’ve seen economic uncertainty, intense political polarization, and super-low bond yields. Yet at the same time, the stock market kept pushing higher.
In this confusing and sometimes contradictory climate, you may be asking yourself a question that I hear often: How do I make sense of all this, keep investing, and still get a good night’s sleep?
As with any problem, there are multiple ways to go at it. But there’s one approach in particular that is simple, straightforward, and nearly foolproof: Save more money. Not only can saving more give you a greater sense of control over your investment plan, it can help compensate for long-term returns that, in our estimation, could fall short of historical averages.
I love the way one of our investment pros put it. Fran Kinniry this summer told The Wall Street Journal, “Investing is always a partnership between you and the markets.” He explained that the markets carried more than their fair share of the weight for a couple of decades, through the 1990s, providing outsized returns that made the investor’s half of the partnership relatively light work. “But now you are going to have to be the majority partner.”
Sobering? Sure. Hopeless? Definitely not.
3
Over the 12 months since last September, U.S. stocks returned 15%, though the rise has not been a one-way ticket straight up. International markets have also posted strong returns, but lower than those of the broad U.S. market. The decision by United Kingdom voters in June to exit the European Union came as a surprise but caused market heartburn for only a few days.
In fixed income, yields remained extremely low—about 1.60% on the 10-year U.S. Treasury note at the end of September, after dipping below 1.40% over the summer. And bond yields in some international markets were negative.
Even this relatively small window of time illustrates a truism of the financial markets: There will always be segments that perform well and others that don’t. Saving more saves you from trying to control the uncontrollable—how economies and the markets perform. And it keeps you in control of one of the most vital parts of your investment program.
Although the “save more” logic is easy to grasp, it’s not always easy to follow. Bills, illness, the loss of a job—these can affect any of us.
But whatever our circumstances, figuring out how to save more is worth the effort. It requires that we make difficult decisions to forgo some consumption today to increase the likelihood of consuming (or consuming more) in the future. This is the very heart of investing. Sacrifices are never fun, so consider carrying them out systematically and in doses that you
| | | |
| Market Barometer | | | |
| | Average Annual Total Returns |
| | Periods Ended September 30, 2016 |
| | One | Three | Five |
| | Year | Years | Years |
| Stocks | | | |
| Russell 1000 Index (Large-caps) | 14.93% | 10.78% | 16.41% |
| Russell 2000 Index (Small-caps) | 15.47 | 6.71 | 15.82 |
| Russell 3000 Index (Broad U.S. market) | 14.96 | 10.44 | 16.36 |
| FTSE All-World ex US Index (International) | 9.62 | 0.71 | 6.50 |
| |
| Bonds | | | |
| Bloomberg Barclays U.S. Aggregate Bond Index | | | |
| (Broad taxable market) | 5.19% | 4.03% | 3.08% |
| Bloomberg Barclays Municipal Bond Index | | | |
| (Broad tax-exempt market) | 5.58 | 5.54 | 4.48 |
| Citigroup Three-Month U.S. Treasury Bill Index | 0.20 | 0.06 | 0.06 |
| |
| CPI | | | |
| Consumer Price Index | 1.46% | 1.03% | 1.25% |
4
can be comfortable with—for instance, gradually getting up to the max in your IRA, or adding a percentage point or so to the amount you stash in your employer’s retirement plan. As a point of reference, we generally suggest that investors strive for a retirement savings rate of 12%–15%, including any employer contributions.
If you need more convincing about the wisdom of the “save more” course of action, it might be helpful to examine your alternatives. This list is by no means exhaustive, but it hits on a few of the big ones, and none are without risk.
• Reach for yield. With yields so low on many types of bonds, it’s tempting to find the corners of the fixed income market where payouts are juicier. But with the juice comes considerable risk. You need to be aware that you’d be taking on more risk—and how much more.
• Go all-in on a hot-performing asset class or fund. By now, you know better than that, right?
• Sit tight. This approach isn’t a terrible idea; it’s better than panicking and deciding to just “do something,” particularly if that means changing your approach in response to the market’s movements.
Here’s the inescapably challenging part of your partnership with the markets: In the short run, your “partner” is fickle, emotional, and wildly unpredictable. But in the long run, your partner is mostly rational and extremely helpful.
The best way to minimize your vulnerability to the market’s mood swings, and to maximize the benefit of your partner’s longer-term strengths, is to expect less and save more. Maybe the markets will deliver better-than-expected returns. Maybe they’ll be consistent with our more modest expectations. In either case, a higher savings rate can help put you in a better position to reach your goals.
As always, thank you for investing with Vanguard.
Sincerely,

F. William McNabb III
Chairman and Chief Executive Officer
October 18, 2016
5
Advisor’s Report
For the fiscal year ended September 30, 2016, Vanguard Strategic Equity Fund returned 10.62%, underperforming the MSCI US Small + Midcap 2200 benchmark by 3.92 percentage points.
Overall, equities fared well during the period as the broad U.S. equity market (as measured by the MSCI US Investable Market 2500 Index) returned 15.04%. Large-capitalization stocks outpaced smaller-cap equities, and value-oriented equities outperformed growth stocks. The U.S. equity market performed even more strongly than international markets, which returned 6.52% (as measured by the MSCI EAFE Index). However, emerging markets continued to outperform developed economies. Within the benchmark, performance was positive across all sectors. Returns were best in materials, utilities, and information technology and weakest in consumer discretionary and financials. Returns also were strong in real estate, which became a separate sector on September 1.
Growth around the globe remained subdued. The U.S. economy grew at an annual rate of 1.4% in the second quarter of 2016 after growing 0.8% in the first quarter. The increase reflected positive contributions from personal consumption expenditures, exports, and nonresidential fixed investment; but negative contributions from private inventory investment and residential fixed investment weighed on the U.S. economy.
The International Monetary Fund estimated global growth to be 2.9% in the first half of 2016, slightly weaker than in the second half of 2015. Brexit is still unfolding, as the long-term arrangements between the United Kingdom and the European Union will be uncertain for some time.
There was also a partial recovery in commodity prices. After hitting a 10-year low in January, oil prices rallied by 50% to $45 per barrel in August, mostly because of production outages. Nonfuel commodity prices also increased, with metals and agricultural commodity prices rising by 12% and 9%.
Although it’s important to understand how overall performance is affected by the macro factors we’ve described, our approach to investing focuses on specific fundamentals—not technical analysis of stock price movements. We compare all stocks in our investment universe within the same industry group in order to identify those with characteristics that we believe will outperform over the long run.
To do this, we use a strict quantitative approach that systematically focuses on several key fundamental factors. We believe that attractive stocks exhibit five key characteristics: 1) high quality—
6
healthy balance sheets and steady cash-flow generation; 2) effective use of capital—sound investment policies that favor internal over external funding; 3) consistent earnings growth—ability to grow earnings year after year; 4) strong market sentiment—market confirmation of our view; and 5) reasonable valuation—we strive to avoid overpriced stocks.
Using these five themes, we generate a composite rank for all the stocks in our universe each day—seeking to capitalize on investor biases across the market. We then monitor our portfolio based on those rankings and adjust when appropriate to maximize expected returns while minimizing exposure to risks that our research indicates don’t improve returns (such as industry selection and other risks relative to our benchmark).
Our portfolio focuses on the attractive stocks from our model that we expect to exhibit future outperformance over time. However, as with any investment management process, there will be periods when our model doesn’t perform as expected. Unfortunately, over the annual period under review, the stocks that outperformed had characteristics that our model doesn’t pursue. While we’re disappointed with the performance results, it’s important to remind our investors that we maintain our commitment through different market environments to stocks that have solid fundamentals and that we believe will outperform in the long run.
During the fiscal year, the management decisions and valuation components of our model were the greatest positive contributors to performance. Growth and quality also contributed positively but the results were more modest. The sentiment component of the model detracted from performance. As a result, the model’s effectiveness was mixed over the period. We had strong stock selection results in two sectors, were relatively flat in one, and had negative results in eight benchmark sectors. Stock selection was most successful in information technology and real estate while mostly disappointing in energy and financials.
Among individual stocks, the largest contributors came from overweight positions in Advanced Micro Devices, Cirrus Logic, and Computer Sciences. Relative to the portfolio’s benchmark, we benefited from underweighting or avoiding poor performers such as Alliance Data Systems and Akamai Technologies.
Overweight positions in poorly performing Alon USA Energy, Western Refining, and Noble Corporation hurt performance. In addition, underweight positions in strongly
7
performing stocks, such as Marathon Oil and ONEOK, contributed to the fund’s underperformance relative to its benchmark.
We continue to believe that constructing a portfolio that focuses on the key fundamentals described above will benefit investors over the long term, while recognizing that risk can reward or punish us in the near term. We feel the fund offers a strong mix of stocks with attractive valuation and growth characteristics relative to its benchmark.
We thank you for your investment and look forward to the coming fiscal year.
Portfolio Managers:
Michael R. Roach, CFA
James P. Stetler, Principal
Binbin Guo, Principal, Head of Equity
Research and Portfolio Strategies
Vanguard Quantitative Equity Group
October 21, 2016
8
Strategic Equity Fund
Fund Profile
As of September 30, 2016
| | | |
| Portfolio Characteristics | | |
| | | | DJ |
| | | | U.S. |
| | | MSCI US | Total |
| | | Small + | Market |
| | | Mid Cap | FA |
| | Fund | 2200 Index | Index |
| Number of Stocks | 398 | 2,155 | 3,850 |
| Median Market Cap | $4.2B | $6.3B | $51.8B |
| Price/Earnings Ratio | 17.0x | 28.5x | 23.7x |
| Price/Book Ratio | 2.3x | 2.5x | 2.8x |
| Return on Equity | 13.0% | 12.7% | 16.6% |
| Earnings Growth | | | |
| Rate | 13.0% | 9.4% | 7.6% |
| Dividend Yield | 1.8% | 1.6% | 2.0% |
| Foreign Holdings | 0.9% | 0.0% | 0.0% |
| Turnover Rate | 74% | — | — |
| Ticker Symbol | VSEQX | — | — |
| Expense Ratio1 | 0.21% | — | — |
| 30-Day SEC Yield | 1.69% | — | — |
| Short-Term Reserves | -0.2% | — | — |
| | | |
| Sector Diversification (% of equity exposure) |
| | | | DJ |
| | | | U.S. |
| | | MSCI US | Total |
| | | Small + | Market |
| | | Mid Cap | FA |
| | Fund | 2200 Index | Index |
| Consumer Discretionary | 14.5% | 14.3% | 12.8% |
| Consumer Staples | 4.5 | 4.6 | 8.7 |
| Energy | 5.2 | 5.1 | 6.7 |
| Financials | 13.5 | 13.6 | 13.3 |
| Health Care | 10.0 | 9.9 | 14.2 |
| Industrials | 14.3 | 14.4 | 10.3 |
| Information Technology | 16.4 | 16.5 | 20.7 |
| Materials | 6.3 | 6.2 | 3.3 |
| Real Estate | 9.2 | 9.3 | 4.3 |
| Telecommunication | | | |
| Services | 0.9 | 0.9 | 2.4 |
| Utilities | 5.2 | 5.2 | 3.3 |
| | |
| Volatility Measures | | |
| | MSCI US | DJ |
| | Small + | U.S. Total |
| | Mid Cap | Market |
| | 2200 Index | FA Index |
| R-Squared | 0.96 | 0.89 |
| Beta | 0.96 | 1.03 |
| These measures show the degree and timing of the fund’s |
| fluctuations compared with the indexes over 36 months. |
| | |
| Ten Largest Holdings (% of total net assets) |
| Regions Financial Corp. | Regional Banks | 1.0% |
| Entergy Corp. | Electric Utilities | 1.0 |
| CR Bard Inc. | Health Care | |
| | Equipment | 1.0 |
| Best Buy Co. Inc. | Computer & | |
| | Electronics Retail | 1.0 |
| Hologic Inc. | Health Care | |
| | Equipment | 0.9 |
| FirstEnergy Corp. | Electric Utilities | 0.9 |
| Masco Corp. | Building Products | 0.9 |
| Advanced Micro Devices | | |
| Inc. | Semiconductors | 0.9 |
| Quintiles Transnational | Life Sciences Tools & | |
| Holdings Inc. | Services | 0.9 |
| Computer Sciences | IT Consulting & | |
| Corp. | Other Services | 0.9 |
| Top Ten | | 9.4% |
| The holdings listed exclude any temporary cash investments and equity index products. |
Investment Focus

1 The expense ratio shown is from the prospectus dated January 28, 2016, and represents estimated costs for the current fiscal year. For the fiscal
year ended September 30, 2016, the expense ratio was 0.18%.
9
Strategic Equity Fund
Performance Summary
All of the returns in this report represent past performance, which is not a guarantee of future results that may be achieved by the fund. (Current performance may be lower or higher than the performance data cited. For performance data current to the most recent month-end, visit our website at vanguard.com/performance.) Note, too, that both investment returns and principal value can fluctuate widely, so an investor’s shares, when sold, could be worth more or less than their original cost. The returns shown do not reflect taxes that a shareholder would pay on fund distributions or on the sale of fund shares.
Cumulative Performance: September 30, 2006, Through September 30, 2016
Initial Investment of $10,000

| | | | | |
| | | Average Annual Total Returns | |
| | | Periods Ended September 30, 2016 | |
| | | | | | Final Value |
| | | One | Five | Ten | of a $10,000 |
| | | Year | Years | Years | Investment |
| | Strategic Equity Fund* | 10.62% | 18.17% | 7.36% | $20,347 |
| | MSCI US Small + Mid Cap 2200 | | | | |
| •••••••• | Index | 14.54 | 16.81 | 8.37 | 22,336 |
| – – – – | Mid-Cap Core Funds Average | 11.26 | 14.47 | 7.03 | 19,725 |
| | Dow Jones U.S. Total Stock Market | | | | |
| | Float Adjusted Index | 14.93 | 16.30 | 7.49 | 20,592 |
| Mid-Cap Core Funds Average: Derived from data provided by Lipper, a Thomson Reuters Company. |
See Financial Highlights for dividend and capital gains information.
10
Strategic Equity Fund
Fiscal-Year Total Returns (%): September 30, 2006, Through September 30, 2016

11
Strategic Equity Fund
Financial Statements
Statement of Net Assets
As of September 30, 2016
The fund reports a complete list of its holdings in regulatory filings four times in each fiscal year, at the quarter-ends. For the second and fourth fiscal quarters, the lists appear in the fund’s semiannual and annual reports to shareholders. For the first and third fiscal quarters, the fund files the lists with the Securities and Exchange Commission on Form N-Q. Shareholders can look up the fund’s Forms N-Q on the SEC’s website at sec.gov. Forms N-Q may also be reviewed and copied at the SEC’s Public Reference Room (see the back cover of this report for further information).
| | | |
| | | | Market |
| | | | Value• |
| | | Shares | ($000) |
| Common Stocks (99.5%)1 | | |
| Consumer Discretionary (14.4%) | |
| | Best Buy Co. Inc. | 1,504,904 | 57,457 |
| ^ | Nordstrom Inc. | 1,032,044 | 53,542 |
| | Darden Restaurants Inc. | 857,763 | 52,598 |
| * | Michael Kors Holdings | | |
| | Ltd. | 1,061,120 | 49,650 |
| ^,* | Smith & Wesson | | |
| | Holding Corp. | 1,793,357 | 47,685 |
| | American Eagle | | |
| | Outfitters Inc. | 2,654,720 | 47,413 |
| | Leggett & Platt Inc. | 1,026,048 | 46,767 |
| | Big Lots Inc. | 949,476 | 45,337 |
| * | American Axle & | | |
| | Manufacturing Holdings | | |
| | Inc. | 1,946,132 | 33,512 |
| | Children’s Place Inc. | 379,628 | 30,321 |
| * | Boyd Gaming Corp. | 1,489,775 | 29,468 |
| | Cooper Tire & Rubber Co. | 600,309 | 22,824 |
| | PVH Corp. | 193,600 | 21,393 |
| | DR Horton Inc. | 703,100 | 21,234 |
| | Jack in the Box Inc. | 213,790 | 20,511 |
| | Brinker International Inc. | 401,757 | 20,261 |
| | Lear Corp. | 152,024 | 18,428 |
| * | MSG Networks Inc. | 969,736 | 18,047 |
| | News Corp. Class B | 1,159,691 | 16,491 |
| | World Wrestling | | |
| | Entertainment Inc. | | |
| | Class A | 744,712 | 15,862 |
| ^ | Regal Entertainment | | |
| | Group Class A | 629,260 | 13,686 |
| * | Express Inc. | 999,936 | 11,789 |
| | Whirlpool Corp. | 64,392 | 10,442 |
| * | Burlington Stores Inc. | 126,356 | 10,237 |
| | Wyndham Worldwide | | |
| | Corp. | 147,088 | 9,903 |
| * | Strayer Education Inc. | 211,300 | 9,864 |
| | Gannett Co. Inc. | 783,075 | 9,115 |
| | | |
| * | Liberty SiriusXM Group | | |
| | Class A | 261,506 | 8,886 |
| | Hasbro Inc. | 103,264 | 8,192 |
| * | BJ’s Restaurants Inc. | 227,600 | 8,091 |
| | Abercrombie & Fitch Co. | 500,273 | 7,949 |
| | News Corp. Class A | 534,272 | 7,469 |
| | Bloomin’ Brands Inc. | 397,106 | 6,846 |
| | Sturm Ruger & Co. Inc. | 104,874 | 6,058 |
| | Caleres Inc. | 210,665 | 5,328 |
| * | Denny’s Corp. | 468,600 | 5,009 |
| | Rent-A-Center Inc. | 371,405 | 4,695 |
| * | Cooper-Standard Holding | | |
| | Inc. | 47,000 | 4,644 |
| | Barnes & Noble Inc. | 383,397 | 4,332 |
| | Kohl’s Corp. | 98,700 | 4,318 |
| * | Liberty SiriusXM Group | | |
| | Class C | 128,100 | 4,280 |
| * | Michaels Cos. Inc. | 175,687 | 4,246 |
| | AMC Entertainment | | |
| | Holdings Inc. | 117,200 | 3,644 |
| | Cato Corp. Class A | 106,629 | 3,507 |
| | Bob Evans Farms Inc. | 88,900 | 3,405 |
| * | Genesco Inc. | 58,900 | 3,208 |
| | Cheesecake Factory Inc. | 52,473 | 2,627 |
| * | Penn National Gaming Inc. | 186,422 | 2,530 |
| | Time Inc. | 163,500 | 2,368 |
| | Ethan Allen Interiors Inc. | 65,862 | 2,060 |
| ^,* | Weight Watchers | | |
| | International Inc. | 165,668 | 1,710 |
| | TEGNA Inc. | 71,500 | 1,563 |
| | Callaway Golf Co. | 119,800 | 1,391 |
| * | Tile Shop Holdings Inc. | 82,274 | 1,362 |
| | Finish Line Inc. Class A | 54,952 | 1,268 |
| | Group 1 Automotive Inc. | 19,809 | 1,265 |
| | GNC Holdings Inc. Class A | 60,343 | 1,232 |
| * | Urban Outfitters Inc. | 34,816 | 1,202 |
| * | Murphy USA Inc. | 16,731 | 1,194 |
| | | | 869,716 |
12
Strategic Equity Fund
| | | |
| | | | Market |
| | | | Value• |
| | | Shares | ($000) |
| Consumer Staples (4.5%) | | |
| | Tyson Foods Inc. Class A | 616,348 | 46,023 |
| | Dean Foods Co. | 2,608,390 | 42,777 |
| ^,* | Herbalife Ltd. | 651,544 | 40,389 |
| | JM Smucker Co. | 210,300 | 28,504 |
| | ConAgra Foods Inc. | 590,047 | 27,797 |
| * | SUPERVALU Inc. | 3,823,723 | 19,080 |
| | Fresh Del Monte | | |
| | Produce Inc. | 173,633 | 10,401 |
| | Ingredion Inc. | 76,745 | 10,212 |
| | Universal Corp. | 133,700 | 7,784 |
| | Ingles Markets Inc. | | |
| | Class A | 153,751 | 6,079 |
| ^ | Natural Health Trends | | |
| | Corp. | 212,101 | 5,994 |
| * | USANA Health Sciences | | |
| | Inc. | 42,947 | 5,942 |
| * | Post Holdings Inc. | 63,000 | 4,862 |
| | Energizer Holdings Inc. | 90,980 | 4,545 |
| ^ | Pilgrim’s Pride Corp. | 142,974 | 3,020 |
| ^ | Cal-Maine Foods Inc. | 64,251 | 2,476 |
| * | Central Garden & Pet Co. | 47,500 | 1,235 |
| ^,* | Amplify Snack Brands Inc. | 75,400 | 1,221 |
| | Sanderson Farms Inc. | 12,600 | 1,214 |
| | SpartanNash Co. | 41,900 | 1,212 |
| | | | 270,767 |
| Energy (5.2%) | | |
| | Rowan Cos. plc Class A | 3,421,037 | 51,863 |
| ^,* | Transocean Ltd. | 4,311,575 | 45,961 |
| | Ensco plc Class A | 4,815,322 | 40,930 |
| * | Newfield Exploration Co. | 620,100 | 26,949 |
| | Tesoro Corp. | 337,732 | 26,870 |
| ^,* | Denbury Resources Inc. | 5,403,400 | 17,453 |
| | Energen Corp. | 270,800 | 15,631 |
| | Noble Corp. plc | 2,388,418 | 15,143 |
| ^ | Diamond Offshore | | |
| | Drilling Inc. | 789,823 | 13,909 |
| ^,* | Sanchez Energy Corp. | 1,214,656 | 10,737 |
| | Plains GP Holdings LP | | |
| | Class A | 792,920 | 10,260 |
| * | Chesapeake Energy Corp. | 1,529,347 | 9,589 |
| * | Southwestern Energy Co. | 353,300 | 4,890 |
| * | Carrizo Oil & Gas Inc. | 96,800 | 3,932 |
| * | Unit Corp. | 190,100 | 3,536 |
| * | Enbridge Energy | | |
| | Management LLC | 119,588 | 3,042 |
| | Core Laboratories NV | 26,907 | 3,022 |
| ^ | Atwood Oceanics Inc. | 270,076 | 2,347 |
| * | McDermott International | | |
| | Inc. | 457,000 | 2,290 |
| * | Laredo Petroleum Inc. | 165,100 | 2,130 |
| | | |
| * | Overseas Shipholding | | |
| | Group Inc. Class A | 134,900 | 1,426 |
| | Archrock Inc. | 96,000 | 1,256 |
| * | Renewable Energy Group | | |
| | Inc. | 143,800 | 1,218 |
| * | Northern Oil and Gas Inc. | 438,200 | 1,174 |
| | | | 315,558 |
| Financials (13.4%) | | |
| | Regions Financial Corp. | 6,084,217 | 60,051 |
| | MSCI Inc. Class A | 632,921 | 53,127 |
| | Navient Corp. | 3,583,658 | 51,856 |
| | Popular Inc. | 1,295,007 | 49,495 |
| | Assured Guaranty Ltd. | 1,781,792 | 49,445 |
| * | MGIC Investment Corp. | 5,795,352 | 46,363 |
| | Voya Financial Inc. | 1,334,508 | 38,461 |
| | Great Western Bancorp | | |
| | Inc. | 974,116 | 32,458 |
| | Unum Group | 811,413 | 28,651 |
| | Everest Re Group Ltd. | 150,360 | 28,564 |
| | Primerica Inc. | 439,583 | 23,311 |
| | Washington Federal Inc. | 748,630 | 19,973 |
| | Universal Insurance | | |
| | Holdings Inc. | 787,134 | 19,836 |
| | Cathay General Bancorp | 639,880 | 19,696 |
| | AmTrust Financial | | |
| | Services Inc. | 724,202 | 19,430 |
| | Aspen Insurance | | |
| | Holdings Ltd. | 413,265 | 19,254 |
| | Reinsurance Group of | | |
| | America Inc. Class A | 169,845 | 18,333 |
| * | World Acceptance Corp. | 307,552 | 15,082 |
| | Synovus Financial Corp. | 460,141 | 14,968 |
| | First American Financial | | |
| | Corp. | 362,550 | 14,241 |
| | Zions Bancorporation | 388,300 | 12,045 |
| | Huntington Bancshares | | |
| | Inc. | 1,129,900 | 11,141 |
| | Citizens Financial Group | | |
| | Inc. | 422,400 | 10,438 |
| | Assurant Inc. | 102,118 | 9,420 |
| | Axis Capital Holdings Ltd. | 166,465 | 9,044 |
| * | Walker & Dunlop Inc. | 326,749 | 8,254 |
| * | E*TRADE Financial Corp. | 253,400 | 7,379 |
| | Ally Financial Inc. | 342,200 | 6,663 |
| | Heritage Insurance | | |
| | Holdings Inc. | 438,161 | 6,314 |
| | Northern Trust Corp. | 91,400 | 6,214 |
| | Investors Bancorp Inc. | 512,500 | 6,155 |
| ^,* | Credit Acceptance Corp. | 29,902 | 6,012 |
| * | Flagstar Bancorp Inc. | 216,200 | 6,000 |
| * | INTL. FCStone Inc. | 147,000 | 5,711 |
13
Strategic Equity Fund
| | | |
| | | | Market |
| | | | Value• |
| | | Shares | ($000) |
| | TCF Financial Corp. | 370,210 | 5,372 |
| | Central Pacific Financial | | |
| | Corp. | 175,600 | 4,423 |
| ^,* | BofI Holding Inc. | 197,212 | 4,418 |
| | Nelnet Inc. Class A | 98,912 | 3,993 |
| | MarketAxess Holdings Inc. | 22,700 | 3,759 |
| | Validus Holdings Ltd. | 72,001 | 3,587 |
| | FactSet Research | | |
| | Systems Inc. | 21,700 | 3,518 |
| | Nasdaq Inc. | 50,900 | 3,438 |
| | NorthStar Asset | | |
| | Management Group Inc. | 242,000 | 3,129 |
| | Cullen/Frost Bankers Inc. | 41,900 | 3,014 |
| | Raymond James Financial | | |
| | Inc. | 51,300 | 2,986 |
| | Eaton Vance Corp. | 75,800 | 2,960 |
| * | Affiliated Managers Group | | |
| | Inc. | 20,100 | 2,908 |
| | Umpqua Holdings Corp. | 188,400 | 2,835 |
| * | Essent Group Ltd. | 97,500 | 2,594 |
| | Sterling Bancorp | 144,300 | 2,525 |
| | HCI Group Inc. | 73,364 | 2,227 |
| | CNO Financial Group Inc. | 145,300 | 2,219 |
| | Old National Bancorp | 155,879 | 2,192 |
| | International Bancshares | | |
| | Corp. | 48,700 | 1,450 |
| * | KCG Holdings Inc. Class A | 88,900 | 1,381 |
| | Maiden Holdings Ltd. | 104,500 | 1,326 |
| | Lincoln National Corp. | 27,000 | 1,268 |
| | Bank of Hawaii Corp. | 17,200 | 1,249 |
| | Fulton Financial Corp. | 83,200 | 1,208 |
| | East West Bancorp Inc. | 32,900 | 1,208 |
| | Torchmark Corp. | 18,900 | 1,208 |
| | Banc of California Inc. | 69,000 | 1,205 |
| | Chemical Financial Corp. | 27,100 | 1,196 |
| | AMERISAFE Inc. | 20,300 | 1,193 |
| | Great Southern Bancorp | | |
| | Inc. | 29,000 | 1,180 |
| | Federal Agricultural | | |
| | Mortgage Corp. | 29,700 | 1,173 |
| | | | 811,727 |
| Health Care (10.0%) | | |
| | CR Bard Inc. | 256,925 | 57,623 |
| * | Hologic Inc. | 1,473,752 | 57,226 |
| * | Quintiles Transnational | | |
| | Holdings Inc. | 677,913 | 54,952 |
| * | Charles River Laboratories | | |
| | International Inc. | 588,234 | 49,023 |
| * | WellCare Health Plans Inc. | 415,760 | 48,681 |
| * | PRA Health Sciences Inc. | 852,513 | 48,175 |
| * | INC Research Holdings | | |
| | Inc. Class A | 1,074,812 | 47,915 |
| | | |
| * | Align Technology Inc. | 243,646 | 22,842 |
| | Chemed Corp. | 140,237 | 19,783 |
| * | PAREXEL International | | |
| | Corp. | 233,800 | 16,237 |
| * | VCA Inc. | 202,700 | 14,185 |
| * | AMN Healthcare | | |
| | Services Inc. | 411,116 | 13,102 |
| * | ABIOMED Inc. | 98,100 | 12,614 |
| * | Prestige Brands Holdings | | |
| | Inc. | 249,343 | 12,036 |
| | Bruker Corp. | 526,866 | 11,934 |
| * | Laboratory Corp. of | | |
| | America Holdings | 76,832 | 10,563 |
| * | Amedisys Inc. | 212,624 | 10,087 |
| * | United Therapeutics Corp. | 80,848 | 9,547 |
| | Owens & Minor Inc. | 269,476 | 9,359 |
| * | Masimo Corp. | 156,865 | 9,332 |
| * | Array BioPharma Inc. | 1,143,027 | 7,715 |
| | Teleflex Inc. | 43,383 | 7,291 |
| * | Healthways Inc. | 249,900 | 6,612 |
| * | Emergent BioSolutions | | |
| | Inc. | 207,118 | 6,530 |
| * | Five Prime Therapeutics | | |
| | Inc. | 108,100 | 5,674 |
| * | Amsurg Corp. | 72,897 | 4,888 |
| * | ICU Medical Inc. | 34,619 | 4,375 |
| * | Halyard Health Inc. | 123,500 | 4,280 |
| | Universal Health Services | | |
| | Inc. Class B | 28,946 | 3,567 |
| * | HMS Holdings Corp. | 134,000 | 2,971 |
| | PDL BioPharma Inc. | 881,300 | 2,952 |
| * | OraSure Technologies Inc. | 232,700 | 1,855 |
| * | Cynosure Inc. Class A | 32,800 | 1,671 |
| * | Infinity Pharmaceuticals | | |
| | Inc. | 1,042,392 | 1,626 |
| * | Surgical Care Affiliates | | |
| | Inc. | 25,553 | 1,246 |
| * | Inogen Inc. | 20,300 | 1,216 |
| * | Triple-S Management | | |
| | Corp. Class B | 55,100 | 1,208 |
| | Kindred Healthcare Inc. | 116,100 | 1,187 |
| | | | 602,080 |
| Industrials (14.2%) | | |
| | Masco Corp. | 1,626,798 | 55,815 |
| * | Spirit AeroSystems | | |
| | Holdings Inc. Class A | 1,157,435 | 51,552 |
| | Owens Corning | 953,315 | 50,898 |
| * | Hawaiian Holdings Inc. | 1,039,274 | 50,509 |
| | Huntington Ingalls | | |
| | Industries Inc. | 314,212 | 48,206 |
| *,2 | Wabash National Corp. | 3,351,195 | 47,721 |
| * | United Rentals Inc. | 590,000 | 46,309 |
14
Strategic Equity Fund
| | | |
| | | | Market |
| | | | Value• |
| | | Shares | ($000) |
| | BWX Technologies Inc. | 1,099,791 | 42,199 |
| | Cintas Corp. | 324,721 | 36,564 |
| | Pitney Bowes Inc. | 1,863,600 | 33,843 |
| | AO Smith Corp. | 333,684 | 32,965 |
| ^ | Greenbrier Cos. Inc. | 917,108 | 32,374 |
| * | JetBlue Airways Corp. | 1,693,597 | 29,198 |
| * | Meritor Inc. | 2,381,736 | 26,509 |
| | RR Donnelley & Sons | | |
| | Co. | 1,442,666 | 22,679 |
| | Alaska Air Group Inc. | 331,557 | 21,836 |
| | L-3 Communications | | |
| | Holdings Inc. | 125,192 | 18,870 |
| | GATX Corp. | 423,043 | 18,847 |
| | Deluxe Corp. | 278,582 | 18,615 |
| * | American Woodmark Corp. | 211,782 | 17,063 |
| | ManpowerGroup Inc. | 225,401 | 16,287 |
| | General Cable Corp. | 878,035 | 13,153 |
| | SkyWest Inc. | 426,187 | 11,256 |
| | Comfort Systems USA Inc. | 363,500 | 10,654 |
| | Herman Miller Inc. | 369,766 | 10,575 |
| | Global Brass & Copper | | |
| | Holdings Inc. | 276,600 | 7,991 |
| | Briggs & Stratton Corp. | 425,630 | 7,938 |
| | Aircastle Ltd. | 349,879 | 6,949 |
| | Dun & Bradstreet Corp. | 48,700 | 6,653 |
| | Steelcase Inc. Class A | 439,135 | 6,100 |
| | Douglas Dynamics Inc. | 177,002 | 5,653 |
| * | NCI Building Systems Inc. | 372,471 | 5,434 |
| | Quad/Graphics Inc. | 181,619 | 4,853 |
| | Brink’s Co. | 94,800 | 3,515 |
| | Insperity Inc. | 46,300 | 3,363 |
| | Tetra Tech Inc. | 86,582 | 3,071 |
| | CEB Inc. | 52,402 | 2,854 |
| * | Trex Co. Inc. | 45,500 | 2,672 |
| * | Energy Recovery Inc. | 161,600 | 2,582 |
| * | Chart Industries Inc. | 78,300 | 2,571 |
| | Ennis Inc. | 151,100 | 2,546 |
| * | ACCO Brands Corp. | 248,100 | 2,392 |
| | Universal Forest | | |
| | Products Inc. | 23,100 | 2,275 |
| * | TriNet Group Inc. | 98,400 | 2,128 |
| * | Huron Consulting Group Inc. | 30,100 | 1,799 |
| | Brady Corp. Class A | 51,900 | 1,796 |
| | Insteel Industries Inc. | 40,500 | 1,468 |
| * | Quanta Services Inc. | 50,100 | 1,402 |
| * | Continental Building | | |
| | Products Inc. | 59,900 | 1,257 |
| * | MasTec Inc. | 42,100 | 1,252 |
| * | FTI Consulting Inc. | 27,100 | 1,208 |
| | Knoll Inc. | 52,300 | 1,195 |
| * | Gibraltar Industries Inc. | 31,700 | 1,178 |
| | | | 858,592 |
| | | |
| Information Technology (16.3%) | |
| * | Advanced Micro Devices | | |
| | Inc. | 8,077,361 | 55,815 |
| | Computer Sciences Corp. | 1,050,228 | 54,832 |
| | CDW Corp. | 1,180,101 | 53,966 |
| | Booz Allen Hamilton | | |
| | Holding Corp. Class A | 1,647,440 | 52,076 |
| * | Aspen Technology Inc. | 1,105,036 | 51,705 |
| | SYNNEX Corp. | 439,501 | 50,151 |
| * | Tech Data Corp. | 578,989 | 49,046 |
| * | Cirrus Logic Inc. | 916,277 | 48,700 |
| * | First Data Corp. Class A | 3,623,523 | 47,686 |
| | CSRA Inc. | 1,750,665 | 47,093 |
| | NVIDIA Corp. | 644,305 | 44,148 |
| * | Manhattan Associates Inc. | 734,841 | 42,341 |
| | Avnet Inc. | 859,126 | 35,276 |
| | Leidos Holdings Inc. | 811,983 | 35,143 |
| * | NCR Corp. | 1,043,221 | 33,581 |
| * | GoDaddy Inc. Class A | 956,590 | 33,031 |
| * | Teradata Corp. | 937,454 | 29,061 |
| * | Synaptics Inc. | 486,990 | 28,528 |
| | DST Systems Inc. | 178,370 | 21,033 |
| * | CACI International Inc. | | |
| | Class A | 159,225 | 16,066 |
| | Science Applications | | |
| | International Corp. | 204,397 | 14,179 |
| * | Gigamon Inc. | 235,900 | 12,927 |
| | CSG Systems | | |
| | International Inc. | 290,200 | 11,994 |
| | EarthLink Holdings Corp. | 1,497,617 | 9,285 |
| * | Cardtronics plc Class A | 198,000 | 8,831 |
| * | Inphi Corp. | 186,203 | 8,102 |
| * | Sykes Enterprises Inc. | 269,060 | 7,569 |
| | Broadridge Financial | | |
| | Solutions Inc. | 107,164 | 7,265 |
| * | Ciena Corp. | 324,695 | 7,078 |
| * | TTM Technologies Inc. | 568,100 | 6,505 |
| * | Advanced Energy | | |
| | Industries Inc. | 118,532 | 5,609 |
| * | MaxLinear Inc. | 272,500 | 5,524 |
| * | Angie’s List Inc. | 507,000 | 5,024 |
| * | Sanmina Corp. | 172,463 | 4,910 |
| | Seagate Technology plc | 126,800 | 4,888 |
| | Ingram Micro Inc. | 124,363 | 4,435 |
| * | ePlus Inc. | 38,400 | 3,625 |
| * | Cadence Design Systems | | |
| | Inc. | 140,000 | 3,574 |
| | Travelport Worldwide Ltd. | 236,000 | 3,547 |
| * | Viavi Solutions Inc. | 427,300 | 3,158 |
| * | Itron Inc. | 38,000 | 2,119 |
| * | 3D Systems Corp. | 101,400 | 1,820 |
| * | F5 Networks Inc. | 14,100 | 1,757 |
| * | Zebra Technologies Corp. | 22,900 | 1,594 |
15
Strategic Equity Fund
| | | |
| | | | Market |
| | | | Value• |
| | | Shares | ($000) |
| * | Super Micro Computer Inc. | 65,488 | 1,530 |
| * | Lumentum Holdings Inc. | 34,900 | 1,458 |
| * | Fabrinet | 30,700 | 1,369 |
| * | Arrow Electronics Inc. | 19,992 | 1,279 |
| | Xerox Corp. | 122,616 | 1,242 |
| | ManTech International | | |
| | Corp. Class A | 32,500 | 1,225 |
| * | Cray Inc. | 50,000 | 1,177 |
| | | | 983,877 |
| Materials (6.2%) | | |
| | Avery Dennison Corp. | 678,017 | 52,743 |
| | Trinseo SA | 861,974 | 48,753 |
| | Steel Dynamics Inc. | 1,939,023 | 48,456 |
| ^,* | AK Steel Holding Corp. | 8,803,596 | 42,521 |
| | Cabot Corp. | 517,926 | 27,145 |
| | Commercial Metals Co. | 1,667,475 | 26,996 |
| | United States Steel Corp. | 1,276,800 | 24,080 |
| | Bemis Co. Inc. | 441,407 | 22,516 |
| * | Coeur Mining Inc. | 1,385,000 | 16,385 |
| | Worthington Industries | | |
| | Inc. | 257,615 | 12,373 |
| | Reliance Steel & | | |
| | Aluminum Co. | 170,728 | 12,298 |
| | Domtar Corp. | 248,560 | 9,229 |
| | Huntsman Corp. | 446,785 | 7,269 |
| | Greif Inc. Class A | 79,000 | 3,918 |
| | Rayonier Advanced | | |
| | Materials Inc. | 267,400 | 3,575 |
| | Chemours Co. | 216,700 | 3,467 |
| | Kaiser Aluminum Corp. | 35,513 | 3,072 |
| * | Koppers Holdings Inc. | 81,900 | 2,636 |
| * | GCP Applied Technologies | | |
| | Inc. | 83,200 | 2,356 |
| | Neenah Paper Inc. | 27,141 | 2,144 |
| | Schnitzer Steel Industries | | |
| | Inc. | 90,500 | 1,892 |
| * | Clearwater Paper Corp. | 18,800 | 1,216 |
| * | Cliffs Natural Resources | | |
| | Inc. | 191,300 | 1,119 |
| | | | 376,159 |
| Real Estate (9.2%) | | |
| | Hospitality Properties | | |
| | Trust | 1,539,611 | 45,757 |
| | DuPont Fabros | | |
| | Technology Inc. | 1,008,185 | 41,588 |
| | CBL & Associates | | |
| | Properties Inc. | 3,149,049 | 38,229 |
| | Gaming and Leisure | | |
| | Properties Inc. | 1,044,368 | 34,934 |
| | Communications Sales | | |
| | & Leasing Inc. | 1,058,163 | 33,237 |
| | | | |
| ^ | Government Properties | | | |
| | Income Trust | 1,454,760 | 32,907 |
| | Lamar Advertising Co. | | | |
| | Class A | | 456,104 | 29,788 |
| | VEREIT Inc. | 2,286,248 | 23,708 |
| | Lexington Realty Trust | 2,271,673 | 23,398 |
| | Spirit Realty Capital Inc. | 1,723,542 | 22,975 |
| | Macerich Co. | | 262,104 | 21,196 |
| | GEO Group Inc. | | 814,223 | 19,362 |
| | Ryman Hospitality | | | |
| | Properties Inc. | | 398,192 | 19,177 |
| | Senior Housing | | | |
| | Properties Trust | | 728,262 | 16,539 |
| | EPR Properties | | 209,800 | 16,520 |
| | Summit Hotel Properties | | | |
| | Inc. | 1,057,800 | 13,921 |
| | Mack-Cali Realty Corp. | | 431,724 | 11,752 |
| | Washington Prime | | | |
| | Group Inc. | | 828,600 | 10,258 |
| | RLJ Lodging Trust | | 483,669 | 10,172 |
| | Apple Hospitality REIT Inc. | | 486,487 | 9,005 |
| | Corrections Corp. of | | | |
| | America | | 622,383 | 8,632 |
| | Care Capital Properties | | | |
| | Inc. | | 284,361 | 8,104 |
| | Ashford Hospitality Trust | | | |
| | Inc. | 1,286,154 | 7,575 |
| | Pennsylvania REIT | | 308,349 | 7,101 |
| | Sunstone Hotel Investors | | | |
| | Inc. | | 548,337 | 7,013 |
| | CoreSite Realty Corp. | | 92,369 | 6,839 |
| | Select Income REIT | | 197,662 | 5,317 |
| | Brandywine Realty Trust | | 325,200 | 5,080 |
| | LaSalle Hotel Properties | | 171,469 | 4,093 |
| | WP Carey Inc. | | 45,500 | 2,936 |
| | Global Net Lease Inc. | | 279,000 | 2,277 |
| | NorthStar Realty Finance | | | |
| | Corp. | | 160,400 | 2,112 |
| | Omega Healthcare | | | |
| | Investors Inc. | | 59,200 | 2,099 |
| | Ramco-Gershenson | | | |
| | Properties Trust | | 111,600 | 2,091 |
| | Sabra Health Care REIT Inc. | 75,000 | 1,889 |
| | Universal Health Realty | | | |
| | Income Trust | | 26,700 | 1,683 |
| * | Altisource Portfolio | | | |
| | Solutions SA | | 47,700 | 1,545 |
| | Piedmont Office Realty | | | |
| | Trust Inc. Class A | | 62,800 | 1,367 |
| | DDR Corp. | | 78,000 | 1,360 |
| | RAIT Financial Trust | | 388,960 | 1,315 |
| | Medical Properties Trust Inc. | 79,800 | 1,179 |
| | | | | 556,030 |
16
Strategic Equity Fund
| | | |
| | | | Market |
| | | | Value• |
| | | Shares | ($000) |
| Telecommunication Services (0.9%) | |
| | Telephone & Data | | |
| | Systems Inc. | 561,839 | 15,271 |
| * | SBA Communications | | |
| | Corp. Class A | 104,313 | 11,700 |
| ^ | Windstream Holdings Inc. | 944,820 | 9,495 |
| | Cogent Communications | | |
| | Holdings Inc. | 249,471 | 9,183 |
| * | Cincinnati Bell Inc. | 1,511,100 | 6,165 |
| * | General Communication | | |
| | Inc. Class A | 95,100 | 1,308 |
| * | FairPoint | | |
| | Communications Inc. | 81,400 | 1,223 |
| | | | 54,345 |
| Utilities (5.2%) | | |
| | Entergy Corp. | 751,716 | 57,679 |
| | FirstEnergy Corp. | 1,708,130 | 56,505 |
| | UGI Corp. | 1,055,150 | 47,735 |
| | NiSource Inc. | 1,895,595 | 45,703 |
| | AES Corp. | 2,397,306 | 30,805 |
| | NRG Energy Inc. | 1,596,756 | 17,900 |
| | WGL Holdings Inc. | 276,249 | 17,321 |
| | Great Plains Energy Inc. | 357,949 | 9,768 |
| | MDU Resources Group | | |
| | Inc. | 320,500 | 8,154 |
| | CenterPoint Energy Inc. | 345,815 | 8,033 |
| | ONE Gas Inc. | 66,044 | 4,084 |
| | Vectren Corp. | 60,774 | 3,051 |
| | National Fuel Gas Co. | 53,400 | 2,887 |
| | Spark Energy Inc. Class A | 49,500 | 1,442 |
| | NRG Yield Inc. | 79,500 | 1,348 |
| | Unitil Corp. | 30,300 | 1,184 |
| | | | 313,599 |
| Total Common Stocks | | |
| (Cost $5,313,279) | | 6,012,450 |
| | | |
| Temporary Cash Investments (1.3%)1 | |
| Money Market Fund (1.3%) | | |
| 3,4 | Vanguard Market | | |
| | Liquidity Fund, | | |
| | 0.640% | 797,200 | 79,728 |
| |
| | | Face | |
| | | Amount | |
| | | ($000) | |
| U.S. Government and Agency Obligations (0.0%) |
| 5,6 | Federal Home Loan | | |
| | Bank Discount Notes, | | |
| | 0.341%, 11/16/16 | 100 | 100 |
| 6 | United States Treasury | | |
| | Bill, 0.320%, 11/25/16 | 1,100 | 1,100 |
| | United States Treasury | | |
| | Bill, 0.257%, 12/29/16 | 100 | 100 |
| | | | 1,300 |
| Total Temporary Cash Investments | |
| (Cost $81,023) | | 81,028 |
| Total Investments (100.8%) | | |
| (Cost $5,394,302) | | 6,093,478 |
17
Strategic Equity Fund
| |
| | Amount |
| | ($000) |
| Other Assets and Liabilities (-0.8%) | |
| Other Assets | |
| Investment in Vanguard | 464 |
| Receivables for Investment Securities Sold 45,246 |
| Receivables for Accrued Income | 7,388 |
| Receivables for Capital Shares Issued | 4,837 |
| Other Assets7 | 7,493 |
| Total Other Assets | 65,428 |
| Liabilities | |
| Payables for Investment Securities | |
| Purchased | (39,049) |
| Collateral for Securities on Loan | (57,489) |
| Payables for Capital Shares Redeemed | (3,152) |
| Payables to Vanguard | (6,554) |
| Other Liabilities | (6,832) |
| Total Liabilities | (113,076) |
| Net Assets (100%) | |
| Applicable to 198,796,037 outstanding | |
| $.001 par value shares of beneficial | |
| interest (unlimited authorization) | 6,045,830 |
| Net Asset Value Per Share | $30.41 |
| |
| At September 30, 2016, net assets consisted of: |
| | Amount |
| | ($000) |
| Paid-in Capital | 5,179,285 |
| Undistributed Net Investment Income | 67,820 |
| Accumulated Net Realized Gains | 99,296 |
| Unrealized Appreciation (Depreciation) | |
| Investment Securities | 699,176 |
| Futures Contracts | 253 |
| Net Assets | 6,045,830 |
• See Note A in Notes to Financial Statements.
* Non-income-producing security.
^ Includes partial security positions on loan to broker-dealers. The total value of securities on loan is $54,702,000.
1 The fund invests a portion of its cash reserves in equity markets through the use of index futures contracts. After giving effect to futures
investments, the fund’s effective common stock and temporary cash investment positions represent 100.0% and 0.8%, respectively, of
net assets.
2 Considered an affiliated company of the fund as the fund owns more than 5% of the outstanding voting securities of such company.
3 Affiliated money market fund available only to Vanguard funds and certain trusts and accounts managed by Vanguard. Rate shown is the
7-day yield.
4 Includes $57,489,000 of collateral received for securities on loan.
5 The issuer operates under a congressional charter; its securities are generally neither guaranteed by the U.S. Treasury nor backed by the full
faith and credit of the U.S. government.
6 Securities with a value of $1,200,000 have been segregated as initial margin for open futures contracts.
7 Cash of $233,000 has been segregated as initial margin for open futures contracts.
REIT—Real Estate Investment Trust.
See accompanying Notes, which are an integral part of the Financial Statements.
18
Strategic Equity Fund
Statement of Operations
| |
| | Year Ended |
| | September 30, 2016 |
| | ($000) |
| Investment Income | |
| Income | |
| Dividends | 120,565 |
| Interest | 109 |
| Securities Lending—Net | 10,501 |
| Total Income | 131,175 |
| Expenses | |
| The Vanguard Group—Note B | |
| Investment Advisory Services | 2,386 |
| Management and Administrative | 6,718 |
| Marketing and Distribution | 1,152 |
| Custodian Fees | 66 |
| Auditing Fees | 35 |
| Shareholders’ Reports | 72 |
| Trustees’ Fees and Expenses | 4 |
| Total Expenses | 10,433 |
| Net Investment Income | 120,742 |
| Realized Net Gain (Loss) | |
| Investment Securities Sold | 139,816 |
| Futures Contracts | 3,200 |
| Realized Net Gain (Loss) | 143,016 |
| Change in Unrealized Appreciation (Depreciation) | |
| Investment Securities | 324,835 |
| Futures Contracts | 451 |
| Change in Unrealized Appreciation (Depreciation) | 325,286 |
| Net Increase (Decrease) in Net Assets Resulting from Operations | 589,044 |
See accompanying Notes, which are an integral part of the Financial Statements.
19
Strategic Equity Fund
Statement of Changes in Net Assets
| | |
| | Year Ended September 30, |
| | 2016 | 2015 |
| | ($000) | ($000) |
| Increase (Decrease) in Net Assets | | |
| Operations | | |
| Net Investment Income | 120,742 | 84,421 |
| Realized Net Gain (Loss) | 143,016 | 613,463 |
| Change in Unrealized Appreciation (Depreciation) | 325,286 | (608,999) |
| Net Increase (Decrease) in Net Assets Resulting from Operations | 589,044 | 88,885 |
| Distributions | | |
| Net Investment Income | (93,924) | (60,071) |
| Realized Capital Gain1 | (549,653) | (257,765) |
| Total Distributions | (643,577) | (317,836) |
| Capital Share Transactions | | |
| Issued | 714,159 | 1,082,468 |
| Issued in Lieu of Cash Distributions | 602,796 | 301,093 |
| Redeemed | (956,042) | (807,310) |
| Net Increase (Decrease) from Capital Share Transactions | 360,913 | 576,251 |
| Total Increase (Decrease) | 306,380 | 347,300 |
| Net Assets | | |
| Beginning of Period | 5,739,450 | 5,392,150 |
| End of Period2 | 6,045,830 | 5,739,450 |
| 1 Includes fiscal 2016 and 2015 short-term gain distributions totaling $0 and $0, respectively. Short-term gain distributions are treated as |
| ordinary income dividends for tax purposes. |
| 2 Net Assets—End of Period includes undistributed (overdistributed) net investment income of $67,820,000 and $53,032,000. |
See accompanying Notes, which are an integral part of the Financial Statements.
20
Strategic Equity Fund
Financial Highlights
| | | | | |
| For a Share Outstanding | Year Ended September 30, |
| Throughout Each Period | 2016 | 2015 | 2014 | 2013 | 2012 |
| Net Asset Value, Beginning of Period | $30.82 | $32.02 | $27.34 | $21.02 | $16.30 |
| Investment Operations | | | | | |
| Net Investment Income | . 624 | . 466 | . 361 | . 4261 | .249 |
| Net Realized and Unrealized Gain (Loss) | | | | | |
| on Investments | 2.440 | .207 | 4.679 | 6.244 | 4.667 |
| Total from Investment Operations | 3.064 | .673 | 5.040 | 6.670 | 4.916 |
| Distributions | | | | | |
| Dividends from Net Investment Income | (. 507) | (. 354) | (. 360) | (. 350) | (.196) |
| Distributions from Realized Capital Gains | (2.967) | (1.519) | — | — | — |
| Total Distributions | (3.474) | (1.873) | (.360) | (.350) | (.196) |
| Net Asset Value, End of Period | $30.41 | $30.82 | $32.02 | $27.34 | $21.02 |
| |
| Total Return2 | 10.62% | 2.01% | 18.53% | 32.23% | 30.32% |
| |
| Ratios/Supplemental Data | | | | | |
| Net Assets, End of Period (Millions) | $6,046 | $5,739 | $5,392 | $4,239 | $3,254 |
| Ratio of Total Expenses to | | | | | |
| Average Net Assets | 0.18% | 0.21% | 0.27% | 0.28% | 0.29% |
| Ratio of Net Investment Income to | | | | | |
| Average Net Assets | 2.09% | 1.41% | 1.19% | 1.75%1 | 1.25% |
| Portfolio Turnover Rate | 74% | 70% | 60% | 64% | 67% |
1 Net investment income per share and the ratio of net investment income to average net assets include $.043 and 0.18%, respectively,
resulting from a special dividend received in connection with a merger between T-Mobile US Inc. and Metro PCS Communications Inc.
in May 2013.
2 Total returns do not include account service fees that may have applied in the periods shown. Fund prospectuses provide information about
any applicable account service fees.
See accompanying Notes, which are an integral part of the Financial Statements.
21
Strategic Equity Fund
Notes to Financial Statements
Vanguard Strategic Equity Fund is registered under the Investment Company Act of 1940 as an open-end investment company, or mutual fund.
A. The following significant accounting policies conform to generally accepted accounting principles for U.S. investment companies. The fund consistently follows such policies in preparing its financial statements.
1. Security Valuation: Securities are valued as of the close of trading on the New York Stock Exchange (generally 4 p.m., Eastern time) on the valuation date. Equity securities are valued at the latest quoted sales prices or official closing prices taken from the primary market in which each security trades; such securities not traded on the valuation date are valued at the mean of the latest quoted bid and asked prices. Securities for which market quotations are not readily available, or whose values have been materially affected by events occurring before the fund’s pricing time but after the close of the securities’ primary markets, are valued by methods deemed by the board of trustees to represent fair value. Investments in Vanguard Market Liquidity Fund are valued at that fund’s net asset value. Temporary cash investments acquired over 60 days to maturity are valued using the latest bid prices or using valuations based on a matrix system (which considers such factors as security prices, yields, maturities, and ratings), both as furnished by independent pricing services. Other temporary cash investments are valued at amortized cost, which approximates market value.
2. Futures Contracts: The fund uses index futures contracts to a limited extent, with the objective of maintaining full exposure to the stock market while maintaining liquidity. The fund may purchase or sell futures contracts to achieve a desired level of investment, whether to accommodate portfolio turnover or cash flows from capital share transactions. The primary risks associated with the use of futures contracts are imperfect correlation between changes in market values of stocks held by the fund and the prices of futures contracts, and the possibility of an illiquid market. Counterparty risk involving futures is mitigated because a regulated clearinghouse is the counterparty instead of the clearing broker. To further mitigate counterparty risk, the fund trades futures contracts on an exchange, monitors the financial strength of its clearing brokers and clearinghouse, and has entered into clearing agreements with its clearing brokers. The clearinghouse imposes initial margin requirements to secure the fund’s performance and requires daily settlement of variation margin representing changes in the market value of each contract.
Futures contracts are valued at their quoted daily settlement prices. The aggregate settlement values of the contracts are not recorded in the Statement of Net Assets. Fluctuations in the value of the contracts are recorded in the Statement of Net Assets as an asset (liability) and in the Statement of Operations as unrealized appreciation (depreciation) until the contracts are closed, when they are recorded as realized futures gains (losses).
During the year ended September 30, 2016, the fund’s average investments in long and short futures contracts represented less than 1% and 0% of net assets, respectively, based on the average of aggregate settlement values at each quarter-end during the period.
3. Federal Income Taxes: The fund intends to continue to qualify as a regulated investment company and distribute all of its taxable income. Management has analyzed the fund’s tax positions taken for all open federal income tax years (September 30, 2013–2016), and has concluded that no provision for federal income tax is required in the fund’s financial statements.
4. Distributions: Distributions to shareholders are recorded on the ex-dividend date.
22
Strategic Equity Fund
5. Securities Lending: To earn additional income, the fund lends its securities to qualified institutional borrowers. Security loans are subject to termination by the fund at any time, and are required to be secured at all times by collateral in an amount at least equal to the market value of securities loaned. Daily market fluctuations could cause the value of loaned securities to be more or less than the value of the collateral received. When this occurs, the collateral is adjusted and settled on the next business day. The fund further mitigates its counterparty risk by entering into securities lending transactions only with a diverse group of prequalified counterparties, monitoring their financial strength, and entering into master securities lending agreements with its counterparties. The master securities lending agreements provide that, in the event of a counterparty’s default (including bankruptcy), the fund may terminate any loans with that borrower, determine the net amount owed, and sell or retain the collateral up to the net amount owed to the fund; however, such actions may be subject to legal proceedings. While collateral mitigates counterparty risk, in the absence of a default the fund may experience delays and costs in recovering the securities loaned. The fund invests cash collateral received in Vanguard Market Liquidity Fund, and records a liability in the Statement of Net Assets for the return of the collateral, during the period the securities are on loan. Securities lending income represents fees charged to borrowers plus income earned on invested cash collateral, less expenses associated with the loan. During the term of the loan, the fund is entitled to all distributions made on or in respect of the loaned securities.
6. Credit Facility: The fund and certain other funds managed by The Vanguard Group (“Vanguard”) participate in a $3.1 billion committed credit facility provided by a syndicate of lenders pursuant to a credit agreement that may be renewed annually; each fund is individually liable for its borrowings, if any, under the credit facility. Borrowings may be utilized for temporary and emergency purposes, and are subject to the fund’s regulatory and contractual borrowing restrictions. The participating funds are charged administrative fees and an annual commitment fee of 0.10% of the undrawn amount of the facility; these fees are allocated to the funds based on a method approved by the fund’s board of trustees and included in Management and Administrative expenses on the fund’s Statement of Operations. Any borrowings under this facility bear interest at a rate based upon the higher of the one-month London Interbank Offered Rate, federal funds effective rate, or overnight bank funding rate plus an agreed-upon spread.
The fund had no borrowings outstanding at September 30, 2016, or at any time during the period then ended.
7. Other: Dividend income is recorded on the ex-dividend date. Interest income includes income distributions received from Vanguard Market Liquidity Fund and is accrued daily. Premiums and discounts on debt securities purchased are amortized and accreted, respectively, to interest income over the lives of the respective securities. Security transactions are accounted for on the date securities are bought or sold. Costs used to determine realized gains (losses) on the sale of investment securities are those of the specific securities sold.
B. In accordance with the terms of a Funds’ Service Agreement (the “FSA”) between Vanguard and the fund, Vanguard furnishes to the fund investment advisory, corporate management, administrative, marketing, and distribution services at Vanguard’s cost of operations (as defined by the FSA). These costs of operations are allocated to the fund based on methods and guidelines approved by the board of trustees. Vanguard does not require reimbursement in the current period for certain costs of operations (such as deferred compensation/benefits and risk/insurance costs); the fund’s liability for these costs of operations is included in Payables to Vanguard on the Statement of Net Assets.
23
Strategic Equity Fund
Upon the request of Vanguard, the fund may invest up to 0.40% of its net assets as capital in Vanguard. At September 30, 2016, the fund had contributed to Vanguard capital in the amount of $464,000, representing 0.01% of the fund’s net assets and 0.19% of Vanguard’s capitalization. The fund’s trustees and officers are also directors and employees, respectively, of Vanguard.
C. Various inputs may be used to determine the value of the fund’s investments. These inputs are summarized in three broad levels for financial statement purposes. The inputs or methodologies used to value securities are not necessarily an indication of the risk associated with investing in those securities.
Level 1—Quoted prices in active markets for identical securities.
Level 2—Other significant observable inputs (including quoted prices for similar securities, interest rates, prepayment speeds, credit risk, etc.).
Level 3—Significant unobservable inputs (including the fund’s own assumptions used to determine the fair value of investments).
The following table summarizes the market value of the fund’s investments as of September 30, 2016, based on the inputs used to value them:
| | | |
| | Level 1 | Level 2 | Level 3 |
| Investments | ($000) | ($000) | ($000) |
| Common Stocks | 6,012,450 | — | — |
| Temporary Cash Investments | 79,728 | 1,300 | — |
| Futures Contracts—Assets1 | 296 | — | — |
| Futures Contracts—Liabilities1 | (12) | — | — |
| Total | 6,092,462 | 1,300 | — |
| 1 Represents variation margin on the last day of the reporting period. |
D. At September 30, 2016, the aggregate settlement value of open futures contracts and the related unrealized appreciation (depreciation) were:
| | | | |
| | | | ($000) |
| | | | Aggregate | |
| | | Number of | Settlement | Unrealized |
| | | Long (Short) | Value | Appreciation |
| Futures Contracts | Expiration | Contracts | Long (Short) | (Depreciation) |
| E-mini Russell 2000 Index | December 2016 | 208 | 25,965 | 160 |
| E-mini S&P Mid-Cap 400 Index | December 2016 | 54 | 8,368 | 93 |
| | | | | 253 |
Unrealized appreciation (depreciation) on open futures contracts is required to be treated as realized gain (loss) for tax purposes.
E. Distributions are determined on a tax basis and may differ from net investment income and realized capital gains for financial reporting purposes. Differences may be permanent or temporary. Permanent differences are reclassified among capital accounts in the financial statements to reflect their tax character. Temporary differences arise when certain items of income, expense, gain, or loss
24
Strategic Equity Fund
are recognized in different periods for financial statement and tax purposes. These differences will reverse at some time in the future. Differences in classification may also result from the treatment of short-term gains as ordinary income for tax purposes.
The fund used a tax accounting practice to treat a portion of the price of capital shares redeemed during the year as distributions from net investment income and realized capital gains. Accordingly, the fund has reclassified $12,030,000 from undistributed net investment income, and $15,758,000 from accumulated net realized gains, to paid-in capital.
For tax purposes, at September 30, 2016, the fund had $73,987,000 of ordinary income and $99,550,000 of long-term capital gains available for distribution.
At September 30, 2016, the cost of investment securities for tax purposes was $5,394,302,000. Net unrealized appreciation of investment securities for tax purposes was $699,176,000, consisting of unrealized gains of $945,427,000 on securities that had risen in value since their purchase and $246,251,000 in unrealized losses on securities that had fallen in value since their purchase.
F. During the year ended September 30, 2016, the fund purchased $4,285,262,000 of investment securities and sold $4,445,163,000 of investment securities, other than temporary cash investments.
G. Capital shares issued and redeemed were:
| | |
| | Year Ended September 30, |
| | 2016 | 2015 |
| | Shares | Shares |
| | (000) | (000) |
| Issued | 24,472 | 32,774 |
| Issued in Lieu of Cash Distributions | 21,011 | 9,610 |
| Redeemed | (32,942) | (24,537) |
| Net Increase (Decrease) in Shares Outstanding | 12,541 | 17,847 |
H. Certain of the fund’s investments are in companies that are considered to be affiliated companies of the fund because the fund owns more than 5% of the outstanding voting securities of the company or the issuer is another member of Vanguard. Transactions during the period in securities of these companies were as follows:
| | | | | | |
| | | Current Period Transactions | |
| | Sept. 30, | | Proceeds | | | Sept. 30, |
| | 2015 | | from | | Capital Gain | 2016 |
| | Market | Purchases | Securities | | Distributions | Market |
| | Value | at Cost | Sold1 | Income | Received | Value |
| | ($000) | ($000) | ($000) | ($000) | ($000) | ($000) |
| Vanguard Market Liquidity Fund | 120,166 | NA2 | NA 2 | 103 | — | 79,728 |
| Wabash National Corp. | NA3 | 29,428 | 6,924 | — | — | 47,721 |
| Total | 120,166 | | | 103 | — | 127,449 |
| 1 Includes net realized gain (loss) on affiliated investment securities sold of ($763,000). |
| 2 Not applicable—purchases and sales are for temporary cash investment purposes. |
| 3 Not applicable—at September 30, 2015, the issuer was not an affiliated company of the fund. |
I. Management has determined that no material events or transactions occurred subsequent to September 30, 2016, that would require recognition or disclosure in these financial statements.
25
Report of Independent Registered
Public Accounting Firm
To the Board of Trustees of Vanguard Horizon Funds and the Shareholders of Vanguard Strategic Equity Fund:
In our opinion, the accompanying statement of net assets and the related statements of operations and of changes in net assets and the financial highlights present fairly, in all material respects, the financial position of Vanguard Strategic Equity Fund (constituting a separate portfolio of Vanguard Horizon Funds, hereafter referred to as the “Fund”) at September 30, 2016, the results of its operations for the year then ended, the changes in its net assets for each of the two years in the period then ended, and the financial highlights for each of the five years in the period then ended, in conformity with accounting principles generally accepted in the United States of America. These financial statements and financial highlights (hereafter referred to as “financial statements”) are the responsibility of the Fund’s management. Our responsibility is to express an opinion on these financial statements based on our audits. We conducted our audits of these financial statements in accordance with the standards of the Public Company Accounting Oversight Board (United States). Those standards require that we plan and perform the audit to obtain reasonable assurance about whether the financial statements are free of material misstatement. An audit includes examining, on a test basis, evidence supporting the amounts and disclosures in the financial statements, assessing the accounting principles used and significant estimates made by management, and evaluating the overall financial statement presentation. We believe that our audits, which included confirmation of securities at September 30, 2016 by correspondence with the custodian and brokers and by agreement to the underlying ownership records of the transfer agent, provide a reasonable basis for our opinion.
/s/PricewaterhouseCoopers LLP
Philadelphia, Pennsylvania
November 15, 2016

Special 2016 tax information (unaudited) for Vanguard Strategic Equity Fund
This information for the fiscal year ended September 30, 2016, is included pursuant to provisions
of the Internal Revenue Code for corporate shareholders only.
The fund distributed $565,410,000 as capital gain dividends (20% rate gain distributions) to
shareholders during the fiscal year.
The fund distributed $78,389,000 of qualified dividend income to shareholders during the fiscal year.
For corporate shareholders, 71.8% of investment income (dividend income plus short-term gains, if
any) qualifies for the dividends-received deduction.
26
Your Fund’s After-Tax Returns
This table presents returns for your fund both before and after taxes. The after-tax returns are shown in two ways: (1) assuming that an investor owned the fund during the entire period and paid taxes on the fund’s distributions, and (2) assuming that an investor paid taxes on the fund’s distributions and sold all shares at the end of each period.
Calculations are based on the highest individual federal income tax and capital gains tax rates in effect at the times of the distributions and the hypothetical sales. State and local taxes were not considered. After-tax returns reflect any qualified dividend income, using actual prior-year figures and estimates for 2016. (In the example, returns after the sale of fund shares may be higher than those assuming no sale. This occurs when the sale would have produced a capital loss. The calculation assumes that the investor received a tax deduction for the loss.)
Please note that your actual after-tax returns will depend on your tax situation and may differ from those shown. Also note that if you own the fund in a tax-deferred account, such as an individual retirement account or a 401(k) plan, this information does not apply to you. Such accounts are not subject to current taxes.
Finally, keep in mind that a fund’s performance—whether before or after taxes—does not guarantee future results.
| | | |
| Average Annual Total Returns: Strategic Equity Fund | | | |
| Periods Ended September 30, 2016 | | | |
| | One | Five | Ten |
| | Year | Years | Years |
| Returns Before Taxes | 10.62% | 18.17% | 7.36% |
| Returns After Taxes on Distributions | 7.72 | 17.06 | 6.47 |
| Returns After Taxes on Distributions and Sale of Fund Shares | 8.07 | 14.69 | 5.85 |
27
About Your Fund’s Expenses
As a shareholder of the fund, you incur ongoing costs, which include costs for portfolio management, administrative services, and shareholder reports (like this one), among others. Operating expenses, which are deducted from a fund’s gross income, directly reduce the investment return of the fund.
A fund’s expenses are expressed as a percentage of its average net assets. This figure is known as the expense ratio. The following examples are intended to help you understand the ongoing costs (in dollars) of investing in your fund and to compare these costs with those of other mutual funds. The examples are based on an investment of $1,000 made at the beginning of the period shown and held for the entire period.
The accompanying table illustrates your fund’s costs in two ways:
• Based on actual fund return. This section helps you to estimate the actual expenses that you paid over the period. The ”Ending Account Value“ shown is derived from the fund‘s actual return, and the third column shows the dollar amount that would have been paid by an investor who started with $1,000 in the fund. You may use the information here, together with the amount you invested, to estimate the expenses that you paid over the period.
To do so, simply divide your account value by $1,000 (for example, an $8,600 account value divided by $1,000 = 8.6), then multiply the result by the number given for your fund under the heading ”Expenses Paid During Period.“
• Based on hypothetical 5% yearly return. This section is intended to help you compare your fund‘s costs with those of other mutual funds. It assumes that the fund had a yearly return of 5% before expenses, but that the expense ratio is unchanged. In this case—because the return used is not the fund’s actual return—the results do not apply to your investment. The example is useful in making comparisons because the Securities and Exchange Commission requires all mutual funds to calculate expenses based on a 5% return. You can assess your fund’s costs by comparing this hypothetical example with the hypothetical examples that appear in shareholder reports of other funds.
Note that the expenses shown in the table are meant to highlight and help you compare ongoing costs only and do not reflect transaction costs incurred by the fund for buying and selling securities. Further, the expenses do not include any purchase, redemption, or account service fees described in the fund prospectus. If such fees were applied to your account, your costs would be higher. Your fund does not carry a “sales load.”
The calculations assume no shares were bought or sold during the period. Your actual costs may have been higher or lower, depending on the amount of your investment and the timing of any purchases or redemptions.
You can find more information about the fund’s expenses, including annual expense ratios, in the Financial Statements section of this report. For additional information on operating expenses and other shareholder costs, please refer to your fund’s current prospectus.
28
| | | |
| Six Months Ended September 30, 2016 | | | |
| | Beginning | Ending | Expenses |
| | Account Value | Account Value | Paid During |
| Strategic Equity Fund | 3/31/2016 | 9/30/2016 | Period |
| Based on Actual Fund Return | $1,000.00 | $1,070.02 | $0.88 |
| Based on Hypothetical 5% Yearly Return | 1,000.00 | 1,024.15 | 0.86 |
The calculations are based on expenses incurred in the most recent six-month period. The fund’s annualized six-month expense ratio for that
period is 0.17%. The dollar amounts shown as “Expenses Paid” are equal to the annualized expense ratio multiplied by the average account
value over the period, multiplied by the number of days in the most recent six-month period, then divided by the number of days in the most
recent 12-month period (183/366).
29
Glossary
30-Day SEC Yield. A fund’s 30-day SEC yield is derived using a formula specified by the U.S. Securities and Exchange Commission. Under the formula, data related to the fund’s security holdings in the previous 30 days are used to calculate the fund’s hypothetical net income for that period, which is then annualized and divided by the fund’s estimated average net assets over the calculation period. For the purposes of this calculation, a security’s income is based on its current market yield to maturity (for bonds), its actual income (for asset-backed securities), or its projected dividend yield (for stocks). Because the SEC yield represents hypothetical annualized income, it will differ—at times significantly—from the fund’s actual experience. As a result, the fund’s income distributions may be higher or lower than implied by the SEC yield.
Beta. A measure of the magnitude of a fund’s past share-price fluctuations in relation to the ups and downs of a given market index. The index is assigned a beta of 1.00. Compared with a given index, a fund with a beta of 1.20 typically would have seen its share price rise or fall by 12% when the index rose or fell by 10%. For this report, beta is based on returns over the past 36 months for both the fund and the index. Note that a fund’s beta should be reviewed in conjunction with its R-squared (see definition). The lower the R-squared, the less correlation there is between the fund and the index, and the less reliable beta is as an indicator of volatility.
Dividend Yield. Dividend income earned by stocks, expressed as a percentage of the aggregate market value (or of net asset value, for a fund). The yield is determined by dividing the amount of the annual dividends by the aggregate value (or net asset value) at the end of the period. For a fund, the dividend yield is based solely on stock holdings and does not include any income produced by other investments.
Earnings Growth Rate. The average annual rate of growth in earnings over the past five years for the stocks now in a fund.
Equity Exposure. A measure that reflects a fund’s investments in stocks and stock futures. Any holdings in short-term reserves are excluded.
Expense Ratio. A fund’s total annual operating expenses expressed as a percentage of the fund’s average net assets. The expense ratio includes management and administrative expenses, but does not include the transaction costs of buying and selling portfolio securities.
Foreign Holdings. The percentage of a fund represented by securities or depositary receipts of companies based outside the United States.
Inception Date. The date on which the assets of a fund (or one of its share classes) are first invested in accordance with the fund’s investment objective. For funds with a subscription period, the inception date is the day after that period ends. Investment performance is measured from the inception date.
Median Market Cap. An indicator of the size of companies in which a fund invests; the midpoint of market capitalization (market price x shares outstanding) of a fund’s stocks, weighted by the proportion of the fund’s assets invested in each stock. Stocks representing half of the fund’s assets have market capitalizations above the median, and the rest are below it.
Price/Book Ratio. The share price of a stock divided by its net worth, or book value, per share. For a fund, the weighted average price/book ratio of the stocks it holds.
30
Price/Earnings Ratio. The ratio of a stock’s current price to its per-share earnings over the past year. For a fund, the weighted average P/E of the stocks it holds. P/E is an indicator of market expectations about corporate prospects; the higher the P/E, the greater the expectations for a company’s future growth.
R-Squared. A measure of how much of a fund’s past returns can be explained by the returns from the market in general, as measured by a given index. If a fund’s total returns were precisely synchronized with an index’s returns, its R-squared would be 1.00. If the fund’s returns bore no relationship to the index’s returns, its R-squared would be 0. For this report, R-squared is based on returns over the past 36 months for both the fund and the index.
Return on Equity. The annual average rate of return generated by a company during the past five years for each dollar of shareholder’s equity (net income divided by shareholder’s equity). For a fund, the weighted average return on equity for the companies whose stocks it holds.
Short-Term Reserves. The percentage of a fund invested in highly liquid, short-term securities that can be readily converted to cash.
Turnover Rate. An indication of the fund’s trading activity. Funds with high turnover rates incur higher transaction costs and may be more likely to distribute capital gains (which may be taxable to investors). The turnover rate excludes in-kind transactions, which have minimal impact on costs.
31
The People Who Govern Your Fund
The trustees of your mutual fund are there to see that the fund is operated and managed in your best interests since, as a shareholder, you are a part owner of the fund. Your fund’s trustees also serve on the board of directors of The Vanguard Group, Inc., which is owned by the Vanguard funds and provides services to them on an at-cost basis.
A majority of Vanguard’s board members are independent, meaning that they have no affiliation with Vanguard or the funds they oversee, apart from the sizable personal investments they have made as private individuals. The independent board members have distinguished backgrounds in business, academia, and public service. Each of the trustees and executive officers oversees 198 Vanguard funds.
The following table provides information for each trustee and executive officer of the fund. The mailing address of the trustees and officers is P.O. Box 876, Valley Forge, PA 19482. More information about the trustees is in the Statement of Additional Information, which can be obtained, without charge, by contacting Vanguard at 800-662-7447, or online at vanguard.com.
|
| InterestedTrustee1 |
| F. William McNabb III |
| Born 1957. Trustee Since July 2009. Chairman of |
| the Board. Principal Occupation(s) During the Past |
| Five Years and Other Experience: Chairman of the |
| Board of The Vanguard Group, Inc., and of each of |
| the investment companies served by The Vanguard |
| Group, since January 2010; Director of The Vanguard |
| Group since 2008; Chief Executive Officer and |
| President of The Vanguard Group, and of each of |
| the investment companies served by The Vanguard |
| Group, since 2008; Director of Vanguard Marketing |
| Corporation; Managing Director of The Vanguard |
| Group (1995–2008). |
| |
| IndependentTrustees |
| Emerson U. Fullwood |
| Born 1948. Trustee Since January 2008. Principal |
| Occupation(s) During the Past Five Years and Other |
| Experience: Executive Chief Staff and Marketing |
| Officer for North America and Corporate Vice President |
| (retired 2008) of Xerox Corporation (document manage- |
| ment products and services); Executive in Residence |
| and 2009–2010 Distinguished Minett Professor at |
| the Rochester Institute of Technology; Lead Director |
| of SPX FLOW, Inc. (multi-industry manufacturing); |
| Director of the United Way of Rochester, the University |
| of Rochester Medical Center, Monroe Community |
| College Foundation, North Carolina A&T University, |
| and Roberts Wesleyan College. |
|
| Rajiv L. Gupta |
| Born 1945. Trustee Since December 2001.2 Principal |
| Occupation(s) During the Past Five Years and Other |
| Experience: Chairman and Chief Executive Officer |
| (retired 2009) and President (2006–2008) of |
| Rohm and Haas Co. (chemicals); Director of Tyco |
| International plc (diversified manufacturing and |
| services), HP Inc. (printer and personal computer |
| manufacturing), and Delphi Automotive plc |
| (automotive components); Senior Advisor at |
| New Mountain Capital. |
Amy Gutmann |
| Born 1949. Trustee Since June 2006. Principal |
| Occupation(s) During the Past Five Years and |
| Other Experience: President of the University of |
| Pennsylvania; Christopher H. Browne Distinguished |
| Professor of Political Science, School of Arts and |
| Sciences, and Professor of Communication, Annenberg |
| School for Communication, with secondary faculty |
| appointments in the Department of Philosophy, School |
| of Arts and Sciences, and at the Graduate School of |
| Education, University of Pennsylvania; Trustee of the |
| National Constitution Center; Chair of the Presidential |
| Commission for the Study of Bioethical Issues. |
JoAnn Heffernan Heisen |
| Born 1950. Trustee Since July 1998. Principal |
| Occupation(s) During the Past Five Years and |
| Other Experience: Corporate Vice President and |
| Chief Global Diversity Officer (retired 2008) and |
| Member of the Executive Committee (1997–2008) |
| of Johnson & Johnson (pharmaceuticals/medical |
| devices/consumer products); Director of Skytop |
| Lodge Corporation (hotels) and the Robert Wood |
| Johnson Foundation; Member of the Advisory |
| Board of the Institute for Women’s Leadership |
| at Rutgers University. |
|
| F. Joseph Loughrey |
| Born 1949. Trustee Since October 2009. Principal |
| Occupation(s) During the Past Five Years and Other |
| Experience: President and Chief Operating Officer |
| (retired 2009) of Cummins Inc. (industrial machinery); |
| Chairman of the Board of Hillenbrand, Inc. (specialized |
| consumer services), and of Oxfam America; Director |
| of SKF AB (industrial machinery), Hyster-Yale Materials |
| Handling, Inc. (forklift trucks), the Lumina Foundation |
| for Education, and the V Foundation for Cancer |
| Research; Member of the Advisory Council for the |
| College of Arts and Letters and of the Advisory Board |
| to the Kellogg Institute for International Studies, both |
| at the University of Notre Dame. |
Mark Loughridge |
| Born 1953. Trustee Since March 2012. Principal |
| Occupation(s) During the Past Five Years and Other |
| Experience: Senior Vice President and Chief Financial |
| Officer (retired 2013) at IBM (information technology |
| services); Fiduciary Member of IBM’s Retirement Plan |
| Committee (2004–2013); Director of the Dow Chemical |
| Company; Member of the Council on Chicago Booth. |
Scott C. Malpass |
| Born 1962. Trustee Since March 2012. Principal |
| Occupation(s) During the Past Five Years and Other |
| Experience: Chief Investment Officer and Vice |
| President at the University of Notre Dame; Assistant |
| Professor of Finance at the Mendoza College of |
| Business at Notre Dame; Member of the Notre Dame |
| 403(b) Investment Committee, the Board of Advisors |
| for Spruceview Capital Partners, and the Investment |
| Advisory Committee of Major League Baseball; Board |
| Member of TIFF Advisory Services, Inc., and Catholic |
| Investment Services, Inc. (investment advisors). |
André F. Perold |
| Born 1952. Trustee Since December 2004. Principal |
| Occupation(s) During the Past Five Years and Other |
| Experience: George Gund Professor of Finance and |
| Banking, Emeritus at the Harvard Business School |
| (retired 2011); Chief Investment Officer and Managing |
| Partner of HighVista Strategies LLC (private investment |
| firm); Director of Rand Merchant Bank; Overseer of |
| the Museum of Fine Arts Boston. |
Peter F. Volanakis |
| Born 1955. Trustee Since July 2009. Principal |
| Occupation(s) During the Past Five Years and |
| Other Experience: President and Chief Operating |
| Officer (retired 2010) of Corning Incorporated |
| (communications equipment); Chairman of the |
| Board of Trustees of Colby-Sawyer College; |
| Member of the Advisory Board of the Norris |
| Cotton Cancer Center. |
| |
| Executive Officers | |
| Glenn Booraem | |
| Born 1967. Treasurer Since May 2015. Principal |
| Occupation(s) During the Past Five Years and |
| Other Experience: Principal of The Vanguard Group, |
| Inc.; Treasurer of each of the investment companies |
| served by The Vanguard Group; Controller of each of |
| the investment companies served by The Vanguard |
| Group (2010–2015); Assistant Controller of each of |
| the investment companies served by The Vanguard |
| Group (2001–2010). | |
Thomas J. Higgins | |
| Born 1957. Chief Financial Officer Since September |
| 2008. Principal Occupation(s) During the Past Five |
| Years and Other Experience: Principal of The Vanguard |
| Group, Inc.; Chief Financial Officer of each of the |
| investment companies served by The Vanguard Group; |
| Treasurer of each of the investment companies served |
| by The Vanguard Group (1998–2008). |
Peter Mahoney | |
| Born 1974. Controller Since May 2015. Principal |
| Occupation(s) During the Past Five Years and Other |
| Experience: Head of Global Fund Accounting at The |
| Vanguard Group, Inc.; Controller of each of the invest- |
| ment companies served by The Vanguard Group; |
| Head of International Fund Services at The Vanguard |
| Group (2008–2014). | |
Anne E. Robinson | |
| Born 1970. Secretary Since September 2016. Principal |
| Occupation(s) During the Past Five Years and Other |
| Experience: Managing Director of The Vanguard Group, |
| Inc.; General Counsel of The Vanguard Group; Secretary |
| of The Vanguard Group and of each of the investment |
| companies served by The Vanguard Group; Director |
| and Senior Vice President of Vanguard Marketing |
| Corporation; Managing Director and General Counsel |
| of Global Cards and Consumer Services at Citigroup |
| (2014–2016); Counsel at American Express (2003–2014). |
| |
| Vanguard Senior ManagementTeam |
| Mortimer J. Buckley | James M. Norris |
| Kathleen C. Gubanich | Thomas M. Rampulla |
| Martha G. King | Glenn W. Reed |
| John T. Marcante | Karin A. Risi |
| Chris D. McIsaac | Michael Rollings |
| |
| Chairman Emeritus and Senior Advisor |
| John J. Brennan | |
| Chairman, 1996–2009 | |
| Chief Executive Officer and President, 1996–2008 |
| |
| Founder | |
| John C. Bogle | |
| Chairman and Chief Executive Officer, 1974–1996 |
1 Mr. McNabb is considered an “interested person,” as defined in the Investment Company Act of 1940, because he is an officer of the Vanguard funds.
2 December 2002 for Vanguard Equity Income Fund, the Vanguard Municipal Bond Funds, and the Vanguard State Tax-Exempt Funds.
|  |
| | P.O. Box 2600 |
| | Valley Forge, PA 19482-2600 |
| |
| |
| |
| Connect with Vanguard® > vanguard.com |
| |
| |
| |
| Fund Information > 800-662-7447 | CFA® is a registered trademark owned by CFA Institute. |
| Direct Investor Account Services > 800-662-2739 | |
| Institutional Investor Services > 800-523-1036 | |
| Text Telephone for People | |
| Who Are Deaf or Hard of Hearing> 800-749-7273 | |
| |
| This material may be used in conjunction | |
| with the offering of shares of any Vanguard | |
| fund only if preceded or accompanied by | |
| the fund’s current prospectus. | |
| |
| All comparative mutual fund data are from Lipper, a | |
| Thomson Reuters Company, or Morningstar, Inc., unless | |
| otherwise noted. | |
| |
| You can obtain a free copy of Vanguard’s proxy voting | |
| guidelines by visiting vanguard.com/proxyreporting or by | |
| calling Vanguard at 800-662-2739. The guidelines are | |
| also available from the SEC’s website, sec.gov. In | |
| addition, you may obtain a free report on how your fund | |
| voted the proxies for securities it owned during the 12 | |
| months ended June 30. To get the report, visit either | |
| vanguard.com/proxyreporting or sec.gov. | |
| |
| You can review and copy information about your fund at | |
| the SEC’s Public Reference Room in Washington, D.C. To | |
| find out more about this public service, call the SEC at | |
| 202-551-8090. Information about your fund is also | |
| available on the SEC’s website, and you can receive | |
| copies of this information, for a fee, by sending a | |
| request in either of two ways: via email addressed to | |
| publicinfo@sec.gov or via regular mail addressed to the | |
| Public Reference Section, Securities and Exchange | |
| Commission, Washington, DC 20549-1520. | |
| |
| | © 2016 The Vanguard Group, Inc. |
| | All rights reserved. |
| | Vanguard Marketing Corporation, Distributor. |
| |
| | Q1140 112016 |
Annual Report | September 30, 2016
Vanguard Capital Opportunity Fund
A new format, unwavering commitment
As you begin reading this report, you’ll notice that we’ve made some improvements to the opening sections—based on feedback from you, our clients.
Page 1 starts with a new ”Your Fund’s Performance at a Glance,” a concise, handy summary of how your fund performed during the period.
In the renamed ”Chairman’s Perspective,” Bill McNabb will focus on enduring principles and investment insights.
We’ve modified some tables, and eliminated some redundancy, but we haven’t removed any information.
At Vanguard, we’re always looking for better ways to communicate and to help you make sound investment decisions. Thank you for entrusting your assets to us.
| |
| Contents | |
| Your Fund’s Performance at a Glance. | 1 |
| Chairman’s Perspective. | 3 |
| Advisor’s Report. | 6 |
| Fund Profile. | 9 |
| Performance Summary. | 11 |
| Financial Statements. | 13 |
| Your Fund’s After-Tax Returns. | 25 |
| About Your Fund’s Expenses. | 26 |
| Glossary. | 28 |
Please note: The opinions expressed in this report are just that—informed opinions. They should not be considered promises or advice.
Also, please keep in mind that the information and opinions cover the period through the date on the front of this report. Of course, the
risks of investing in your fund are spelled out in the prospectus.
See the Glossary for definitions of investment terms used in this report.
About the cover: No matter what language you speak, Vanguard has one consistent message and set of principles. Our primary
focus is on you, our clients. We conduct our business with integrity as a faithful steward of your assets. This message is shown
translated into seven languages, reflecting our expanding global presence.
Your Fund’s Performance at a Glance
• Vanguard Capital Opportunity Fund returned about 15% for the 12 months ended September 30, 2016, exceeding the return of about 11% for its benchmark, the Russell Midcap Growth Index, and the nearly 9% average return of its multi-capitalization growth fund peers.
• Value stocks outpaced their growth counterparts for the period. All of the Capital Opportunity Fund’s industry sectors posted gains.
• PRIMECAP Management Company, the fund’s advisor, traditionally invests most heavily in the information technology and health care sectors. The Capital Opportunity Fund’s technology stocks advanced about 38%, well ahead of those in the benchmark, and contributed nearly 12 percentage points to results. The fund’s health care stocks returned about 8%, less than those in the benchmark, and added about 2 percentage points to results.
| |
| Total Returns: Fiscal Year Ended September 30, 2016 | |
| | Total |
| | Returns |
| Vanguard Capital Opportunity Fund | |
| Investor Shares | 15.20% |
| Admiral™ Shares | 15.28 |
| Russell Midcap Growth Index | 11.24 |
| Multi-Cap Growth Funds Average | 8.91 |
| Multi-Cap Growth Funds Average: Derived from data provided by Lipper, a Thomson Reuters Company. |
| Admiral Shares carry lower expenses and are available to investors who meet certain account-balance requirements. |
| |
| Total Returns: Ten Years Ended September 30, 2016 | |
| | Average |
| | Annual Return |
| Capital Opportunity Fund Investor Shares | 9.42% |
| Russell Midcap Growth Index | 8.51 |
| Multi-Cap Growth Funds Average | 6.81 |
| Multi-Cap Growth Funds Average: Derived from data provided by Lipper, a Thomson Reuters Company. |
The figures shown represent past performance, which is not a guarantee of future results. (Current performance may be
lower or higher than the performance data cited. For performance data current to the most recent month-end, visit our
website at vanguard.com/performance.) Note, too, that both investment returns and principal value can fluctuate widely, so
an investor’s shares, when sold, could be worth more or less than their original cost.
1
| | | |
| Expense Ratios | | | |
| Your Fund Compared With Its Peer Group | | | |
| | Investor | Admiral | Peer Group |
| | Shares | Shares | Average |
| Capital Opportunity Fund | 0.45% | 0.38% | 1.25% |
The fund expense ratios shown are from the prospectus dated January 28, 2016, and represent estimated costs for the current fiscal year. For
the fiscal year ended September 30, 2016, the fund’s expense ratios were 0.45% for Investor Shares and 0.38% for Admiral Shares. The
peer-group expense ratio is derived from data provided by Lipper, a Thomson Reuters Company, and captures information through year-end
2015.
Peer group: Multi-Cap Growth Funds.
2
Chairman’s Perspective

Bill McNabb
Chairman and Chief Executive Officer
Dear Shareholder,
If you think you’ve had reason to feel uneasy about the investment environment lately, you’re not imagining things. In just the past few months, we’ve seen economic uncertainty, intense political polarization, and super-low bond yields. Yet at the same time, the stock market kept pushing higher.
In this confusing and sometimes contradictory climate, you may be asking yourself a question that I hear often: How do I make sense of all this, keep investing, and still get a good night’s sleep?
As with any problem, there are multiple ways to go at it. But there’s one approach in particular that is simple, straightforward, and nearly foolproof: Save more money. Not only can saving more give you a greater sense of control over your investment plan, it can help compensate for long-term returns that, in our estimation, could fall short of historical averages.
I love the way one of our investment pros put it. Fran Kinniry this summer told The Wall Street Journal, “Investing is always a partnership between you and the markets.” He explained that the markets carried more than their fair share of the weight for a couple of decades, through the 1990s, providing outsized returns that made the investor’s half of the partnership relatively light work. “But now you are going to have to be the majority partner.”
Sobering? Sure. Hopeless? Definitely not.
3
Over the 12 months since last September, U.S. stocks returned 15%, though the rise has not been a one-way ticket straight up. International markets have also posted strong returns, but lower than those of the broad U.S. market. The decision by United Kingdom voters in June to exit the European Union came as a surprise but caused market heartburn for only a few days.
In fixed income, yields remained extremely low—about 1.60% on the 10-year U.S. Treasury note at the end of September, after dipping below 1.40% over the summer. And bond yields in some international markets were negative.
Even this relatively small window of time illustrates a truism of the financial markets: There will always be segments that perform well and others that don’t. Saving more saves you from trying to control the uncontrollable—how economies and the markets perform. And it keeps you in control of one of the most vital parts of your investment program.
Although the “save more” logic is easy to grasp, it’s not always easy to follow. Bills, illness, the loss of a job—these can affect any of us.
But whatever our circumstances, figuring out how to save more is worth the effort. It requires that we make difficult decisions to forgo some consumption today to increase the likelihood of consuming (or consuming more) in the future. This is the very heart of investing. Sacrifices are never fun, so consider carrying them out systematically and in doses that you
| | | |
| Market Barometer | | | |
| | Average Annual Total Returns |
| | Periods Ended September 30, 2016 |
| | One | Three | Five |
| | Year | Years | Years |
| Stocks | | | |
| Russell 1000 Index (Large-caps) | 14.93% | 10.78% | 16.41% |
| Russell 2000 Index (Small-caps) | 15.47 | 6.71 | 15.82 |
| Russell 3000 Index (Broad U.S. market) | 14.96 | 10.44 | 16.36 |
| FTSE All-World ex US Index (International) | 9.62 | 0.71 | 6.50 |
| |
| Bonds | | | |
| Bloomberg Barclays U.S. Aggregate Bond Index | | | |
| (Broad taxable market) | 5.19% | 4.03% | 3.08% |
| Bloomberg Barclays Municipal Bond Index | | | |
| (Broad tax-exempt market) | 5.58 | 5.54 | 4.48 |
| Citigroup Three-Month U.S. Treasury Bill Index | 0.20 | 0.06 | 0.06 |
| |
| CPI | | | |
| Consumer Price Index | 1.46% | 1.03% | 1.25% |
4
can be comfortable with—for instance, gradually getting up to the max in your IRA, or adding a percentage point or so to the amount you stash in your employer’s retirement plan. As a point of reference, we generally suggest that investors strive for a retirement savings rate of 12%–15%, including any employer contributions.
If you need more convincing about the wisdom of the “save more” course of action, it might be helpful to examine your alternatives. This list is by no means exhaustive, but it hits on a few of the big ones, and none are without risk.
• Reach for yield. With yields so low on many types of bonds, it’s tempting to find the corners of the fixed income market where payouts are juicier. But with the juice comes considerable risk. You need to be aware that you’d be taking on more risk—and how much more.
• Go all-in on a hot-performing asset class or fund. By now, you know better than that, right?
• Sit tight. This approach isn’t a terrible idea; it’s better than panicking and deciding to just “do something,” particularly if that means changing your approach in response to the market’s movements.
Here’s the inescapably challenging part of your partnership with the markets: In the short run, your “partner” is fickle, emotional, and wildly unpredictable. But in the long run, your partner is mostly rational and extremely helpful.
The best way to minimize your vulnerability to the market’s mood swings, and to maximize the benefit of your partner’s longer-term strengths, is to expect less and save more. Maybe the markets will deliver better-than-expected returns. Maybe they’ll be consistent with our more modest expectations. In either case, a higher savings rate can help put you in a better position to reach your goals.
As always, thank you for investing with Vanguard.
Sincerely,

F. William McNabb III
Chairman and Chief Executive Officer
October 18, 2016
5
Advisor’s Report
For the fiscal year ended September 30, 2016, Vanguard Capital Opportunity Fund returned 15.20% for Investor Shares and 15.28% for Admiral Shares. These results exceeded the 11.24% return of its benchmark, the Russell Midcap Growth Index, and the 8.91% average return of its multi-capitalization growth fund competitors, but were slightly below the 15.43% return of the Standard and Poor’s 500 Index which serves as a proxy for the broad market in the attribution discussion that follows.
The fund’s information technology portfolio was the most significant contributor to its absolute and relative results, returning 38%, compared with the 23% return of the S&P 500 Information Technology Index. The fund’s overweight position in health care detracted from returns relative to the S&P 500 Index, as did the poor relative performance of its industrial holdings, which returned 6%, compared with the 19% return of the S&P 500 Industrials Index. Financials were a bright spot for the fund thanks to the combined benefit of an underweight position (financials were the worst-performing sector over the period) and favorable stock selection.
The investment environment
The investment environment has been inhospitable for active managers recently, with the vast majority of large-capitalization growth stock funds underperforming their benchmarks in calendar year 2016. The dispersion of sector returns has been extreme, as have the pace and magnitude of changes in market leadership.
For example, during the first quarter alone, the best-performing sector in the S&P 500 Index, telecommunication services (+17%), returned nearly 22 percentage points more than the worst-performing sector, financials (–5%). Telecommunication services (+25%) and utilities (+23%), which led the market for the first six months of the calendar year (compared with the 4% total return of the S&P 500 Index), were the worst-performing sectors during the third calendar quarter, when each returned –6% (compared with the 4% total return of the S&P 500 Index). Conversely, information technology, which had a slightly negative total return in the first half of the year, far exceeded all other sectors during the third quarter, returning 12%.
Portfolio update
The portfolio remained heavily overweighted in information technology and health care stocks, which had a combined ending weight of 65%, compared with 36% in the S&P 500 Index. The portfolio’s most significant underweights were in consumer staples, energy, real estate, and utilities; those sectors’ combined ending weight was less than 1%, compared with 24% in the S&P 500 Index. The portfolio also was underweighted in consumer discretionary, financials, materials, and telecommunication services. Combined, they represented 15% of assets at the end of the period, compared with 31% in the S&P 500 Index.
In information technology, the fund is most overweighted in semiconductors and semiconductor equipment (11% versus 3% for the S&P 500 Index) and electronic equipment instruments and components
6
(5% versus 0.4%). Semiconductors were the sector’s best-performing industry for both the fund (+50%) and the index (+39%), with the fund’s outperformance driven by NVIDIA (+181%) and Texas Instruments (+45%). The fund’s electronic equipment instruments and components holdings returned 41%, exceeding the index return because of Trimble (+74%), Corning (+42%), and Flex (+29%). Software holdings returned 26%, as Adobe Systems (+32%) was offset by Nuance Communications (–11%), and hardware holdings returned 30%, led by Hewlett Packard Enterprise (+59%), HP (+30%), and BlackBerry (+30%). The fund’s internet holdings returned 39%, led by Alibaba (+79%).
In health care, the fund is most overweighted in biotechnology and pharmaceutical stocks, whose 24% combined weighting at the end of the period was approximately triple their weighting in the S&P 500 Index. The portfolio’s biotechnology holdings returned 8%. Biogen (+7%), the fund’s largest holding, suffered several setbacks during the fiscal year but rebounded strongly during the third quarter, returning 29% in part on rumors that the company could be acquired. The fund’s pharmaceutical holdings returned –4%, below the index return, as Eli Lilly (–2%), Roche (–2%), and Novartis (–11%) underperformed.
The fund is also significantly overweighted in industrial stocks (16% versus 10% for the S&P 500 Index) due to its investments in airlines (8% versus 1% for the index) and air freight and logistics (3% versus 1%). Airlines were the worst-performing group in industrials last fiscal year, and the –7% return of the fund’s airline holdings accounted for most of the underperfor-mance in industrials.
As of September 30, 2016, the fund’s top ten holdings represented 36% of assets.
Advisor perspectives
Our search for new investments often begins by researching out-of-favor companies and industries. Over the last several years, the information technology industry has been disrupted by cloud computing and the associated shift to subscription-based pricing models, the rise of smartphones and concomitant erosion of the personal computer market, and the advent of social networking. The industry has always been characterized by such disruptive innovations, which force incumbents to internally develop or acquire next-generation technologies in order to survive. Although such transitions carry significant risks, investors who focus solely on the threats posed by next-generation technologies often ignore the significant intellectual capital, established sales and distribution channels, and sizable cash flows the “old technology” incumbents bring to bear.
Several years ago, Adobe and Microsoft were dismissed as “old technology” companies tied to legacy business models. Their software was delivered from locally deployed servers or personal computers and sold as perpetual licenses with annual maintenance contracts, whereas next-generation competitors delivered their software from the cloud and sold monthly subscriptions.
7
At the end of 2011, Adobe traded for $28 per share, or 11.5 times the 2012 estimated earnings per share (EPS) of $2.45, while at the end of 2012, Microsoft sold for $27 per share, or 8.8 times the 2013 estimated EPS of $3.04. In Adobe’s case, as it became clear that the company’s transition to a software-as-a-service (SaaS) model would be successful, investors overlooked the negative near-term financial impact of the transition and began to value the stock based on its long-term earnings potential. Adobe currently trades for $107, or 27.3 times the 2017 estimated EPS of $3.97. In Microsoft’s case, the transitioning of its existing software to a SaaS model was accompanied by the creation of entirely new cloud computing businesses, which gave investors confidence that the company would remain a valued partner to its business customers as they shifted their internal IT environments to the cloud. Microsoft currently sells for $57, or 18.7 times the 2017 estimated EPS of $3.06.
The portfolio contains a number of stocks of “old technology” companies, including Intel (13.3 times the 2017 estimated EPS), Hewlett Packard Enterprise (10.6 times), HP Inc. (9.6 times), Micron Technology (13.1 times), NetApp (13.2 times), and QUALCOMM (13.8 times). Each company faces unique challenges, but each possesses significant competitive advantages and has the potential to exceed the market’s modest expectations.
Outside of information technology, we remain enthusiastic about the fund’s airline holdings, whose extraordinarily low valuation multiples reflect a high degree of skepticism about their ability to sustain current profits. We are more sanguine about the outlook for airline industry profitability, as we believe industry supply and demand dynamics are favorable.
We also find many financials to be attractively valued, particularly large banks that are trading near book value and could benefit significantly from rising interest rates. Finally, we are excited by the prospects for our health care holdings, many of which currently trade at or below the S&P 500 Index forward price-to-earnings multiple in spite of superior secular growth prospects. In the short term, however, we expect significant volatility in this area, as two of the fund’s largest holdings, Biogen and Eli Lilly, present data related to their respective Alzheimer’s drugs later this year.
Conclusion
As bottom-up stock pickers, we spend our time searching for stocks with long-term prospects we find to be materially better than market prices would seem to imply. Our approach often results in portfolios that bear little resemblance to market indexes, creating the possibility for substantial deviations in relative performance. For example, our relative returns were significantly negative during the first half of calendar 2016 when the fund’s overweighted sectors and industries underperformed, and we expect to experience similar conditions in the future. We nonetheless believe that this approach can generate superior results for shareholders over the long term.
PRIMECAP Management Company
October 21, 2016
8
Capital Opportunity Fund
Fund Profile
As of September 30, 2016
| | |
| Share-Class Characteristics | |
| | Investor | Admiral |
| | Shares | Shares |
| Ticker Symbol | VHCOX | VHCAX |
| Expense Ratio1 | 0.45% | 0.38% |
| 30-Day SEC Yield | 0.74% | 0.81% |
| | | |
| Portfolio Characteristics | | |
| | | | DJ |
| | | | U.S. |
| | | Russell | Total |
| | | Midcap | Market |
| | | Growth | FA |
| | Fund | Index | Index |
| Number of Stocks | 135 | 464 | 3,850 |
| Median Market Cap | $39.2B | $11.4B | $51.8B |
| Price/Earnings Ratio | 24.1x | 28.7x | 23.7x |
| Price/Book Ratio | 3.6x | 5.4x | 2.8x |
| Return on Equity | 14.7% | 19.6% | 16.6% |
| Earnings Growth | | | |
| Rate | 11.1% | 11.7% | 7.6% |
| Dividend Yield | 1.2% | 1.1% | 2.0% |
| Foreign Holdings | 10.8% | 0.0% | 0.0% |
| Turnover Rate | 6% | — | — |
| Short-Term | | | |
| Reserves | 3.6% | — | — |
| | |
| Volatility Measures | | |
| | Russell | DJ |
| | Midcap | U.S. Total |
| | Growth | Market |
| | Index | FA Index |
| R-Squared | 0.84 | 0.74 |
| Beta | 0.98 | 1.01 |
| These measures show the degree and timing of the fund’s fluctuations compared with the indexes over 36 months. |
| | |
| Ten Largest Holdings (% of total net assets) |
| Biogen Inc. | Biotechnology | 6.0% |
| Amgen Inc. | Biotechnology | 5.1 |
| Eli Lilly & Co. | Pharmaceuticals | 4.4 |
| Alphabet Inc. | Internet Software & | |
| | Services | 3.2 |
| BioMarin Pharmaceutical | | |
| Inc. | Biotechnology | 3.1 |
| Southwest Airlines Co. | Airlines | 3.1 |
| FedEx Corp. | Air Freight & | |
| | Logistics | 3.0 |
| Roche Holding AG | Pharmaceuticals | 2.7 |
| NVIDIA Corp. | Semiconductors | 2.7 |
| Adobe Systems Inc. | Application Software | 2.6 |
| Top Ten | | 35.9% |
| The holdings listed exclude any temporary cash investments and equity index products. |
Investment Focus

1 The expense ratios shown are from the prospectus dated January 28, 2016, and represent estimated costs for the current fiscal year. For the fiscal
year ended September 30, 2016, the expense ratios were 0.45% for Investor Shares and 0.38% for Admiral Shares.
9
Capital Opportunity Fund
| | | |
| Sector Diversification (% of equity exposure) |
| | | Russell | DJ |
| | | Midcap | U.S. Total |
| | | Growth | Market |
| | Fund | Index | FA Index |
| Consumer | | | |
| Discretionary | 9.4% | 23.4% | 12.8% |
| Consumer Staples | 0.0 | 7.4 | 8.7 |
| Energy | 0.6 | 1.5 | 6.7 |
| Financials | 3.9 | 4.9 | 13.3 |
| Health Care | 33.1 | 16.2 | 14.2 |
| Industrials | 16.8 | 13.9 | 10.3 |
| Information | | | |
| Technology | 34.0 | 22.2 | 20.7 |
| Materials | 1.8 | 5.1 | 3.3 |
| Real Estate | 0.0 | 4.8 | 4.3 |
| Telecommunication | | | |
| Services | 0.4 | 0.5 | 2.4 |
| Utilities | 0.0 | 0.1 | 3.3 |
10
Capital Opportunity Fund
Performance Summary
All of the returns in this report represent past performance, which is not a guarantee of future results that may be achieved by the fund. (Current performance may be lower or higher than the performance data cited. For performance data current to the most recent month-end, visit our website at vanguard.com/performance.) Note, too, that both investment returns and principal value can fluctuate widely, so an investor’s shares, when sold, could be worth more or less than their original cost. The returns shown do not reflect taxes that a shareholder would pay on fund distributions or on the sale of fund shares.
Cumulative Performance: September 30, 2006, Through September 30, 2016
Initial Investment of $10,000

| | | | | |
| | | Average Annual Total Returns | |
| | | Periods Ended September 30, 2016 | |
| | | | | | Final Value |
| | | One | Five | Ten | of a $10,000 |
| | | Year | Years | Years | Investment |
| | Capital Opportunity Fund Investor | | | | |
| | Shares | 15.20% | 19.53% | 9.42% | $24,600 |
| •••••••• | Russell Midcap Growth Index | 11.24 | 15.85 | 8.51 | 22,628 |
| – – – – | Multi-Cap Growth Funds Average | 8.91 | 14.29 | 6.81 | 19,332 |
| | Dow Jones U.S. Total Stock Market | | | | |
| | Float Adjusted Index | 14.93 | 16.30 | 7.49 | 20,592 |
| Multi-Cap Growth Funds Average: Derived from data provided by Lipper, a Thomson Reuters Company. |
| | | | |
| | | | | Final Value |
| | One | Five | Ten | of a $50,000 |
| | Year | Years | Years | Investment |
| Capital Opportunity Fund Admiral Shares | 15.28% | 19.61% | 9.50% | $123,908 |
| Russell Midcap Growth Index | 11.24 | 15.85 | 8.51 | 113,142 |
| Dow Jones U.S. Total Stock Market Float | | | | |
| Adjusted Index | 14.93 | 16.30 | 7.49 | 102,961 |
See Financial Highlights for dividend and capital gains information.
11
Capital Opportunity Fund
Fiscal-Year Total Returns (%): September 30, 2006, Through September 30, 2016

12
Capital Opportunity Fund
Financial Statements
Statement of Net Assets
As of September 30, 2016
The fund reports a complete list of its holdings in regulatory filings four times in each fiscal year, at the quarter-ends. For the second and fourth fiscal quarters, the lists appear in the fund’s semiannual and annual reports to shareholders. For the first and third fiscal quarters, the fund files the lists with the Securities and Exchange Commission on Form N-Q. Shareholders can look up the fund’s Forms N-Q on the SEC’s website at sec.gov. Forms N-Q may also be reviewed and copied at the SEC’s Public Reference Room (see the back cover of this report for further information).
| | | |
| | | | Market |
| | | | Value• |
| | | Shares | ($000) |
| Common Stocks (96.7%) | | |
| Consumer Discretionary (9.1%) | |
| * | CarMax Inc. | 4,610,697 | 245,981 |
| | TJX Cos. Inc. | 2,600,900 | 194,495 |
| | Carnival Corp. | 3,487,600 | 170,265 |
| | Royal Caribbean | | |
| | Cruises Ltd. | 1,827,000 | 136,934 |
| *,^ | Tesla Motors Inc. | 597,566 | 121,921 |
| * | Amazon.com Inc. | 64,630 | 54,115 |
| | Sony Corp. ADR | 1,570,800 | 52,166 |
| * | Norwegian Cruise Line | | |
| | Holdings Ltd. | 1,255,200 | 47,321 |
| | Ross Stores Inc. | 613,100 | 39,422 |
| | Gildan Activewear Inc. | | |
| | Class A | 1,240,000 | 34,658 |
| | L Brands Inc. | 480,000 | 33,970 |
| | Bed Bath & Beyond Inc. | 703,700 | 30,336 |
| * | Shutterfly Inc. | 533,650 | 23,822 |
| | Las Vegas Sands Corp. | 340,000 | 19,564 |
| | Tribune Media Co. | | |
| | Class A | 503,000 | 18,369 |
| * | Ascena Retail Group Inc. | 1,175,200 | 6,569 |
| | Newell Brands Inc. | 86,200 | 4,539 |
| | Lowe’s Cos. Inc. | 59,200 | 4,275 |
| | Lions Gate Entertainment | | |
| | Corp. | 155,000 | 3,098 |
| * | tronc Inc. | 120,000 | 2,026 |
| | Carter’s Inc. | 23,120 | 2,005 |
| * | AutoZone Inc. | 2,475 | 1,902 |
| | Marriott International Inc. | | |
| | Class A | 20,000 | 1,347 |
| | Hilton Worldwide | | |
| | Holdings Inc. | 34,000 | 780 |
| * | Cabela’s Inc. | 10,000 | 549 |
| | | | 1,250,429 |
| Energy (0.5%) | | |
| | Cabot Oil & Gas Corp. | 1,290,000 | 33,282 |
| * | Southwestern Energy Co. | 2,000,000 | 27,680 |
| | Schlumberger Ltd. | 57,065 | 4,488 |
| * | Transocean Ltd. | 385,000 | 4,104 |
| | | |
| | National Oilwell Varco Inc. | 75,000 | 2,755 |
| ^ | Frank’s International NV | 100,000 | 1,300 |
| | Ensco plc Class A | 143,340 | 1,218 |
| | Range Resources Corp. | 30,000 | 1,163 |
| | | | 75,990 |
| Financials (3.8%) | | |
| | Charles Schwab Corp. | 7,531,300 | 237,763 |
| * | E*TRADE Financial Corp. | 3,823,100 | 111,329 |
| | JPMorgan Chase & Co. | 775,351 | 51,631 |
| | Northern Trust Corp. | 736,700 | 50,088 |
| | Discover Financial | | |
| | Services | 545,100 | 30,825 |
| | CME Group Inc. | 162,950 | 17,032 |
| | Progressive Corp. | 416,600 | 13,123 |
| | Travelers Cos. Inc. | 32,000 | 3,666 |
| | Chubb Ltd. | 2,407 | 302 |
| | | | 515,759 |
| Health Care (32.0%) | | |
| * | Biogen Inc. | 2,633,838 | 824,470 |
| | Amgen Inc. | 4,215,900 | 703,254 |
| | Eli Lilly & Co. | 7,454,400 | 598,290 |
| * | BioMarin | | |
| | Pharmaceutical Inc. | 4,606,100 | 426,156 |
| | Roche Holding AG | 1,506,800 | 373,289 |
| | Novartis AG ADR | 3,007,200 | 237,449 |
| * | QIAGEN NV | 7,983,500 | 219,067 |
| * | Illumina Inc. | 1,168,900 | 212,342 |
| | Medtronic plc | 1,989,100 | 171,858 |
| * | Boston Scientific Corp. | 6,198,800 | 147,531 |
| * | Seattle Genetics Inc. | 1,834,500 | 99,081 |
| | Thermo Fisher | | |
| | Scientific Inc. | 517,100 | 82,250 |
| * | Edwards Lifesciences | | |
| | Corp. | 560,000 | 67,514 |
| | PerkinElmer Inc. | 997,000 | 55,942 |
| | Abbott Laboratories | 1,299,600 | 54,960 |
| * | Alkermes plc | 750,000 | 35,272 |
| * | Charles River Laboratories | | |
| | International Inc. | 420,000 | 35,003 |
| * | Waters Corp. | 145,000 | 22,981 |
13
Capital Opportunity Fund
| | | |
| | | | Market |
| | | | Value• |
| | | Shares | ($000) |
| | Agilent Technologies Inc. | 233,000 | 10,972 |
| | AstraZeneca plc ADR | 177,500 | 5,833 |
| | Zimmer Biomet | | |
| | Holdings Inc. | 27,800 | 3,615 |
| *,^ | ImmunoGen Inc. | 1,160,800 | 3,111 |
| * | Cerner Corp. | 10,000 | 618 |
| | | | 4,390,858 |
| Industrials (16.3%) | | |
| | Southwest Airlines Co. | 10,935,100 | 425,266 |
| | FedEx Corp. | 2,336,474 | 408,135 |
| * | United Continental | | |
| | Holdings Inc. | 4,376,200 | 229,619 |
| | American Airlines | | |
| | Group Inc. | 5,203,400 | 190,497 |
| | Delta Air Lines Inc. | 4,690,000 | 184,599 |
| | Airbus Group SE | 2,918,040 | 176,510 |
| * | JetBlue Airways Corp. | 6,985,150 | 120,424 |
| * | Jacobs Engineering | | |
| | Group Inc. | 2,233,419 | 115,513 |
| | Ritchie Bros Auctioneers | | |
| | Inc. (New York Shares) | 2,487,000 | 87,219 |
| | Union Pacific Corp. | 672,000 | 65,540 |
| | Rockwell Automation Inc. | 520,450 | 63,672 |
| | IDEX Corp. | 595,900 | 55,758 |
| * | AECOM | 1,680,000 | 49,946 |
| | Curtiss-Wright Corp. | 465,000 | 42,366 |
| * | Spirit Airlines Inc. | 198,235 | 8,431 |
| | Textron Inc. | 75,000 | 2,981 |
| ^ | Chicago Bridge & Iron | | |
| | Co. NV | 100,000 | 2,803 |
| * | Esterline Technologies | | |
| | Corp. | 30,631 | 2,329 |
| | | | 2,231,608 |
| Information Technology (32.9%) | |
| | NVIDIA Corp. | 5,317,400 | 364,348 |
| * | Adobe Systems Inc. | 3,325,700 | 360,971 |
| | Texas Instruments Inc. | 4,480,300 | 314,427 |
| | NetApp Inc. | 7,456,200 | 267,081 |
| | Microsoft Corp. | 4,530,000 | 260,928 |
| * | Alibaba Group Holding | | |
| | Ltd. ADR | 2,204,200 | 233,182 |
| * | Alphabet Inc. Class A | 279,630 | 224,839 |
| * | Alphabet Inc. Class C | 283,622 | 220,457 |
| * | Flex Ltd. | 14,833,902 | 202,038 |
| | Corning Inc. | 8,080,000 | 191,092 |
| * | Trimble Navigation Ltd. | 6,465,500 | 184,655 |
| * | Micron Technology Inc. | 7,881,000 | 140,124 |
| | KLA-Tencor Corp. | 1,754,000 | 122,271 |
| | QUALCOMM Inc. | 1,735,300 | 118,868 |
| * | Cree Inc. | 3,944,900 | 101,463 |
| *,1 | Descartes Systems | | |
| | Group Inc. | 4,645,000 | 99,960 |
| | Visa Inc. Class A | 1,071,400 | 88,605 |
| | ASML Holding NV | 800,000 | 87,664 |
| | | |
| * | BlackBerry Ltd. | 9,408,200 | 75,077 |
| *,1 | FormFactor Inc. | 5,809,700 | 63,035 |
| * | Rambus Inc. | 4,980,000 | 62,250 |
| | Hewlett Packard | | |
| | Enterprise Co. | 2,690,000 | 61,197 |
| | Plantronics Inc. | 1,150,000 | 59,754 |
| *,^ | VMware Inc. Class A | 607,700 | 44,575 |
| | HP Inc. | 2,860,000 | 44,416 |
| * | NeuStar Inc. Class A | 1,653,416 | 43,964 |
| * | Electronic Arts Inc. | 500,000 | 42,700 |
| | Intuit Inc. | 320,000 | 35,203 |
| * | Entegris Inc. | 2,019,231 | 35,175 |
| * | Nuance | | |
| | Communications Inc. | 2,395,000 | 34,728 |
| ^ | Telefonaktiebolaget LM | | |
| | Ericsson ADR | 4,230,000 | 30,498 |
| | Intel Corp. | 800,000 | 30,200 |
| | Apple Inc. | 261,000 | 29,506 |
| * | PayPal Holdings Inc. | 640,000 | 26,221 |
| | Jabil Circuit Inc. | 1,186,000 | 25,879 |
| * | eBay Inc. | 762,100 | 25,073 |
| | Teradyne Inc. | 1,085,000 | 23,414 |
| * | Keysight Technologies Inc. | 732,000 | 23,197 |
| * | Yahoo! Inc. | 526,300 | 22,684 |
| * | Dell Technologies Inc - | | |
| | VMware Inc | 424,069 | 20,270 |
| | Western Digital Corp. | 302,439 | 17,684 |
| | Analog Devices Inc. | 230,000 | 14,824 |
| | Applied Materials Inc. | 425,000 | 12,814 |
| * | Ciena Corp. | 500,000 | 10,900 |
| * | F5 Networks Inc. | 51,650 | 6,438 |
| * | Mobileye NV | 117,431 | 4,999 |
| * | salesforce.com Inc. | 47,800 | 3,410 |
| | Mastercard Inc. | 15,000 | 1,527 |
| * | Workday Inc. Class A | 10,000 | 917 |
| | | | 4,515,502 |
| Materials (1.7%) | | |
| | Monsanto Co. | 2,318,786 | 236,980 |
| |
| Telecommunication Services (0.4%) | |
| | AT&T Inc. | 1,308,426 | 53,135 |
| * | Sprint Corp. | 230,000 | 1,525 |
| | | | 54,660 |
| Total Common Stocks | | |
| (Cost $6,453,456) | | 13,271,786 |
| Temporary Cash Investments (3.9%) | |
| Money Market Fund (3.9%) | | |
| 2,3 | Vanguard Market | | |
| | Liquidity Fund, 0.640% | | |
| | (Cost $536,955) | 5,369,255 | 536,979 |
| Total Investments (100.6%) | | |
| (Cost $6,990,411) | | 13,808,765 |
14
Capital Opportunity Fund
| | |
| | | Amount |
| | | ($000) |
| Other Assets and Liabilities (-0.6%) | | |
| Other Assets | | |
| Investment in Vanguard | | 1,038 |
| Receivables for Investment Securities Sold | 1,145 |
| Receivables for Accrued Income | | 11,803 |
| Receivables for Capital Shares Issued | | 5,397 |
| Other Assets | | 4,140 |
| Total Other Assets | | 23,523 |
| Liabilities | | |
| Payables for Investment Securities | | |
| Purchased | | (2,623) |
| Collateral for Securities on Loan | | (45,779) |
| Payables for Investment Advisor | | (8,150) |
| Payables for Capital Shares Redeemed | | (30,388) |
| Payables to Vanguard | | (16,541) |
| Other Liabilities | | (2,147) |
| Total Liabilities | | (105,629) |
| Net Assets (100%) | 13,726,659 |
| |
| At September 30, 2016, net assets consisted of: |
| | Amount |
| | ($000) |
| Paid-in Capital | 6,189,632 |
| Undistributed Net Investment Income | 63,405 |
| Accumulated Net Realized Gains | 655,402 |
| Unrealized Appreciation (Depreciation) | |
| Investment Securities | 6,818,354 |
| Foreign Currencies | (134) |
| Net Assets | 13,726,659 |
| |
| |
| Investor Shares—Net Assets | |
| Applicable to 38,808,060 outstanding | |
| $.001 par value shares of beneficial | |
| interest (unlimited authorization) | 2,134,031 |
| Net Asset Value Per Share— | |
| Investor Shares | $54.99 |
| |
| |
| Admiral Shares—Net Assets | |
| Applicable to 91,278,253 outstanding | |
| $.001 par value shares of beneficial | |
| interest (unlimited authorization) | 11,592,628 |
| Net Asset Value Per Share— | |
| Admiral Shares | $127.00 |
• See Note A in Notes to Financial Statements.
* Non-income-producing security.
^ Includes partial security positions on loan to broker-dealers. The total value of securities on loan is $44,669,000.
1 Considered an affiliated company of the fund as the fund owns more than 5% of the outstanding voting securities of such company.
2 Affiliated money market fund available only to Vanguard funds and certain trusts and accounts managed by Vanguard. Rate shown is the
7-day yield.
3 Includes $45,779,000 of collateral received for securities on loan.
ADR—American Depositary Receipt.
See accompanying Notes, which are an integral part of the Financial Statements.
15
Capital Opportunity Fund
Statement of Operations
| |
| | Year Ended |
| | September 30, 2016 |
| | ($000) |
| Investment Income | |
| Income | |
| Dividends1 | 148,541 |
| Interest | 2,200 |
| Securities Lending—Net | 2,944 |
| Total Income | 153,685 |
| Expenses | |
| Investment Advisory Fees—Note B | 31,992 |
| The Vanguard Group—Note C | |
| Management and Administrative—Investor Shares | 4,019 |
| Management and Administrative—Admiral Shares | 13,251 |
| Marketing and Distribution—Investor Shares | 415 |
| Marketing and Distribution—Admiral Shares | 701 |
| Custodian Fees | 273 |
| Auditing Fees | 33 |
| Shareholders’ Reports—Investor Shares | 36 |
| Shareholders’ Reports—Admiral Shares | 45 |
| Trustees’ Fees and Expenses | 15 |
| Total Expenses | 50,780 |
| Net Investment Income | 102,905 |
| Realized Net Gain (Loss) | |
| Investment Securities Sold | 737,756 |
| Foreign Currencies | (72) |
| Realized Net Gain (Loss) | 737,684 |
| Change in Unrealized Appreciation (Depreciation) | |
| Investment Securities | 1,030,201 |
| Foreign Currencies | 78 |
| Change in Unrealized Appreciation (Depreciation) | 1,030,279 |
| Net Increase (Decrease) in Net Assets Resulting from Operations | 1,870,868 |
| 1 Dividends are net of foreign withholding taxes of $4,594,000. |
See accompanying Notes, which are an integral part of the Financial Statements.
16
Capital Opportunity Fund
Statement of Changes in Net Assets
| | |
| | Year Ended September 30, |
| | 2016 | 2015 |
| | ($000) | ($000) |
| Increase (Decrease) in Net Assets | | |
| Operations | | |
| Net Investment Income | 102,905 | 98,542 |
| Realized Net Gain (Loss) | 737,684 | 706,716 |
| Change in Unrealized Appreciation (Depreciation) | 1,030,279 | (559,499) |
| Net Increase (Decrease) in Net Assets Resulting from Operations | 1,870,868 | 245,759 |
| Distributions | | |
| Net Investment Income | | |
| Investor Shares | (13,445) | (16,335) |
| Admiral Shares | (71,675) | (69,765) |
| Realized Capital Gain1 | | |
| Investor Shares | (109,093) | (99,546) |
| Admiral Shares | (507,435) | (370,543) |
| Total Distributions | (701,648) | (556,189) |
| Capital Share Transactions | | |
| Investor Shares | (336,913) | (487,925) |
| Admiral Shares | 32,413 | 816,562 |
| Net Increase (Decrease) from Capital Share Transactions | (304,500) | 328,637 |
| Total Increase (Decrease) | 864,720 | 18,207 |
| Net Assets | | |
| Beginning of Period | 12,861,939 | 12,843,732 |
| End of Period2 | 13,726,659 | 12,861,939 |
1 Includes fiscal 2016 and 2015 short-term gain distributions totaling $3,304,000 and $10,268,000, respectively. Short-term gain distributions
are treated as ordinary income dividends for tax purposes.
2 Net Assets—End of Period includes undistributed (overdistributed) net investment income of $63,405,000 and $51,816,000.
See accompanying Notes, which are an integral part of the Financial Statements.
17
Capital Opportunity Fund
Financial Highlights
| | | | | |
| Investor Shares | | | | | |
| |
| For a Share Outstanding | Year Ended September 30, |
| Throughout Each Period | 2016 | 2015 | 2014 | 2013 | 2012 |
| Net Asset Value, Beginning of Period | $50.25 | $51.42 | $44.57 | $33.22 | $28.17 |
| Investment Operations | | | | | |
| Net Investment Income | .375 | .349 | .272 | .270 | .216 |
| Net Realized and Unrealized Gain (Loss) | | | | | |
| on Investments | 7.090 | .666 | 8.314 | 12.395 | 6.464 |
| Total from Investment Operations | 7.465 | 1.015 | 8.586 | 12.665 | 6.680 |
| Distributions | | | | | |
| Dividends from Net Investment Income | (. 299) | (. 308) | (. 072)1 | (. 385)1 | (.161) |
| Distributions from Realized Capital Gains | (2.426) | (1.877) | (1.664) | (.930) | (1.469) |
| Total Distributions | (2.725) | (2.185) | (1.736) | (1.315) | (1.630) |
| Net Asset Value, End of Period | $54.99 | $50.25 | $51.42 | $44.57 | $33.22 |
| |
| Total Return2 | 15.20% | 1.72% | 19.85% | 39.40% | 24.62% |
| |
| Ratios/Supplemental Data | | | | | |
| Net Assets, End of Period (Millions) | $2,134 | $2,283 | $2,793 | $2,720 | $2,432 |
| Ratio of Total Expenses to Average Net Assets | 0.45% | 0.45% | 0.47% | 0.48% | 0.48% |
| Ratio of Net Investment Income to | | | | | |
| Average Net Assets | 0.73% | 0.65% | 0.57% | 0.68% | 0.67% |
| Portfolio Turnover Rate | 6% | 7% | 7% | 9% | 9% |
1 Fiscal 2013 dividends from net investment income include $.157 per share from a dividend received from ASML Holding NV. Subsequent to
the payment of the fund’s dividend from net investment income in December 2012, the ASML dividend was reallocated to return of capital.
The reallocation reduced the fund’s dividend from net investment income in December 2013. The reallocation had no impact on net assets,
net asset values per share, or total returns.
2 Total returns do not include transaction or account service fees that may have applied in the periods shown. Fund prospectuses provide
information about any applicable transaction and account service fees.
See accompanying Notes, which are an integral part of the Financial Statements.
18
Capital Opportunity Fund
Financial Highlights
| | | | | |
| Admiral Shares | | | | | |
| |
| For a Share Outstanding | Year Ended September 30, |
| Throughout Each Period | 2016 | 2015 | 2014 | 2013 | 2012 |
| Net Asset Value, Beginning of Period | $116.06 | $118.79 | $102.97 | $76.75 | $65.10 |
| Investment Operations | | | | | |
| Net Investment Income | .965 | .916 | .728 | .707 | .559 |
| Net Realized and Unrealized Gain (Loss) | | | | | |
| on Investments | 16.366 | 1.504 | 19.185 | 28.613 | 14.917 |
| Total from Investment Operations | 17.331 | 2.420 | 19.913 | 29.320 | 15.476 |
| Distributions | | | | | |
| Dividends from Net Investment Income | (.791) | (.816) | (.251)1 | (. 953)1 | (.434) |
| Distributions from Realized Capital Gains | (5.600) | (4.334) | (3.842) | (2.147) | (3.392) |
| Total Distributions | (6.391) | (5.150) | (4.093) | (3.100) | (3.826) |
| Net Asset Value, End of Period | $127.00 | $116.06 | $118.79 | $102.97 | $76.75 |
| |
| Total Return2 | 15.28% | 1.78% | 19.94% | 39.50% | 24.69% |
| |
| Ratios/Supplemental Data | | | | | |
| Net Assets, End of Period (Millions) | $11,593 | $10,579 | $10,051 | $7,927 | $5,045 |
| Ratio of Total Expenses to Average Net Assets | 0.38% | 0.38% | 0.40% | 0.41% | 0.41% |
| Ratio of Net Investment Income to | | | | | |
| Average Net Assets | 0.80% | 0.72% | 0.64% | 0.75% | 0.74% |
| Portfolio Turnover Rate | 6% | 7% | 7% | 9% | 9% |
1 Fiscal 2013 dividends from net investment income include $.363 per share from a dividend received from ASML Holding NV. Subsequent to
the payment of the fund’s dividend from net investment income in December 2012, the ASML dividend was reallocated to return of capital.
The reallocation reduced the fund’s dividend from net investment income in December 2013. The reallocation had no impact on net assets,
net asset values per share, or total returns.
2 Total returns do not include transaction or account service fees that may have applied in the periods shown. Fund prospectuses provide
information about any applicable transaction and account service fees.
See accompanying Notes, which are an integral part of the Financial Statements.
19
Capital Opportunity Fund
Notes to Financial Statements
Vanguard Capital Opportunity Fund is registered under the Investment Company Act of 1940 as an open-end investment company, or mutual fund. The fund offers two classes of shares: Investor Shares and Admiral Shares. Investor Shares are available to any investor who meets the fund’s minimum purchase requirements. Admiral Shares are designed for investors who meet certain administrative, service, and account-size criteria.
A. The following significant accounting policies conform to generally accepted accounting principles for U.S. investment companies. The fund consistently follows such policies in preparing its financial statements.
1. Security Valuation: Securities are valued as of the close of trading on the New York Stock Exchange (generally 4 p.m., Eastern time) on the valuation date. Equity securities are valued at the latest quoted sales prices or official closing prices taken from the primary market in which each security trades; such securities not traded on the valuation date are valued at the mean of the latest quoted bid and asked prices. Securities for which market quotations are not readily available, or whose values have been affected by events occurring before the fund’s pricing time but after the close of the securities’ primary markets, are valued at their fair values calculated according to procedures adopted by the board of trustees. These procedures include obtaining quotations from an independent pricing service, monitoring news to identify significant market- or security-specific events, and evaluating changes in the values of foreign market proxies (for example, ADRs, futures contracts, or exchange-traded funds), between the time the foreign markets close and the fund’s pricing time. When fair-value pricing is employed, the prices of securities used by a fund to calculate its net asset value may differ from quoted or published prices for the same securities. Investments in Vanguard Market Liquidity Fund are valued at that fund’s net asset value.
2. Foreign Currency: Securities and other assets and liabilities denominated in foreign currencies are translated into U.S. dollars using exchange rates obtained from an independent third party as of the fund’s pricing time on the valuation date. Realized gains (losses) and unrealized appreciation (depreciation) on investment securities include the effects of changes in exchange rates since the securities were purchased, combined with the effects of changes in security prices. Fluctuations in the value of other assets and liabilities resulting from changes in exchange rates are recorded as unrealized foreign currency gains (losses) until the assets or liabilities are settled in cash, at which time they are recorded as realized foreign currency gains (losses).
3. Federal Income Taxes: The fund intends to continue to qualify as a regulated investment company and distribute all of its taxable income. Management has analyzed the fund’s tax positions taken for all open federal income tax years (September 30, 2013–2016), and has concluded that no provision for federal income tax is required in the fund’s financial statements.
4. Distributions: Distributions to shareholders are recorded on the ex-dividend date.
5. Securities Lending: To earn additional income, the fund lends its securities to qualified institutional borrowers. Security loans are subject to termination by the fund at any time, and are required to be secured at all times by collateral in an amount at least equal to the market value of securities loaned. Daily market fluctuations could cause the value of loaned securities to be more or less than the value of the collateral received. When this occurs, the collateral is adjusted and settled on the next business day. The fund further mitigates its counterparty risk by entering into securities lending transactions only with a diverse group of prequalified counterparties, monitoring their financial strength, and entering into master securities lending agreements with its counterparties. The master securities lending agreements provide that, in the event of a counterparty’s default (including bankruptcy), the
20
Capital Opportunity Fund
fund may terminate any loans with that borrower, determine the net amount owed, and sell or retain the collateral up to the net amount owed to the fund; however, such actions may be subject to legal proceedings. While collateral mitigates counterparty risk, in the absence of a default the fund may experience delays and costs in recovering the securities loaned. The fund invests cash collateral received in Vanguard Market Liquidity Fund, and records a liability in the Statement of Net Assets for the return of the collateral, during the period the securities are on loan. Securities lending income represents fees charged to borrowers plus income earned on invested cash collateral, less expenses associated with the loan. During the term of the loan, the fund is entitled to all distributions made on or in respect of the loaned securities.
6. Credit Facility: The fund and certain other funds managed by The Vanguard Group (“Vanguard”) participate in a $3.1 billion committed credit facility provided by a syndicate of lenders pursuant to a credit agreement that may be renewed annually; each fund is individually liable for its borrowings, if any, under the credit facility. Borrowings may be utilized for temporary and emergency purposes, and are subject to the fund’s regulatory and contractual borrowing restrictions. The participating funds are charged administrative fees and an annual commitment fee of 0.10% of the undrawn amount of the facility; these fees are allocated to the funds based on a method approved by the fund’s board of trustees and included in Management and Administrative expenses on the fund’s Statement of Operations. Any borrowings under this facility bear interest at a rate based upon the higher of the one-month London Interbank Offered Rate, federal funds effective rate, or overnight bank funding rate plus an agreed-upon spread.
The fund had no borrowings outstanding at September 30, 2016, or at any time during the period then ended.
7. Other: Dividend income is recorded on the ex-dividend date. Interest income includes income distributions received from Vanguard Market Liquidity Fund and is accrued daily. Security transactions are accounted for on the date securities are bought or sold. Costs used to determine realized gains (losses) on the sale of investment securities are those of the specific securities sold.
Each class of shares has equal rights as to assets and earnings, except that each class separately bears certain class-specific expenses related to maintenance of shareholder accounts (included in Management and Administrative expenses) and shareholder reporting. Marketing and distribution expenses are allocated to each class of shares based on a method approved by the board of trustees. Income, other non-class-specific expenses, and gains and losses on investments are allocated to each class of shares based on its relative net assets.
B. PRIMECAP Management Company provides investment advisory services to the fund for a fee calculated at an annual percentage rate of average net assets. For the year ended September 30, 2016, the investment advisory fee represented an effective annual rate of 0.24% of the fund’s average net assets.
C. In accordance with the terms of a Funds’ Service Agreement (the “FSA”) between Vanguard and the fund, Vanguard furnishes to the fund corporate management, administrative, marketing, and distribution services at Vanguard’s cost of operations (as defined by the FSA). These costs of operations are allocated to the fund based on methods and guidelines approved by the board of trustees. Vanguard does not require reimbursement in the current period for certain costs of operations (such as deferred compensation/benefits and risk/insurance costs); the fund’s liability for these costs of operations is included in Payables to Vanguard on the Statement of Net Assets.
21
Capital Opportunity Fund
Upon the request of Vanguard, the fund may invest up to 0.40% of its net assets as capital in Vanguard. At September 30, 2016, the fund had contributed to Vanguard capital in the amount of $1,038,000, representing 0.01% of the fund’s net assets and 0.42% of Vanguard’s capitalization. The fund’s trustees and officers are also directors and employees, respectively, of Vanguard.
D. Various inputs may be used to determine the value of the fund’s investments. These inputs are summarized in three broad levels for financial statement purposes. The inputs or methodologies used to value securities are not necessarily an indication of the risk associated with investing in those securities.
Level 1—Quoted prices in active markets for identical securities.
Level 2—Other significant observable inputs (including quoted prices for similar securities, interest rates, prepayment speeds, credit risk, etc.).
Level 3—Significant unobservable inputs (including the fund’s own assumptions used to determine the fair value of investments).
The following table summarizes the market value of the fund’s investments as of September 30, 2016, based on the inputs used to value them:
| | | |
| | Level 1 | Level 2 | Level 3 |
| Investments | ($000) | ($000) | ($000) |
| Common Stocks | 12,721,987 | 549,799 | — |
| Temporary Cash Investments | 536,979 | — | — |
| Total | 13,258,966 | 549,799 | — |
E. Distributions are determined on a tax basis and may differ from net investment income and realized capital gains for financial reporting purposes. Differences may be permanent or temporary. Permanent differences are reclassified among capital accounts in the financial statements to reflect their tax character. Temporary differences arise when certain items of income, expense, gain, or loss are recognized in different periods for financial statement and tax purposes. These differences will reverse at some time in the future. Differences in classification may also result from the treatment of short-term gains as ordinary income for tax purposes.
During the year ended September 30, 2016, the fund realized net foreign currency losses of $72,000, which decreased distributable net income for tax purposes; accordingly, such losses have been reclassified from accumulated net realized gains to undistributed net investment income.
The fund used a tax accounting practice to treat a portion of the price of capital shares redeemed during the year as distributions from net investment income and realized capital gains. Accordingly, the fund has reclassified $6,124,000 from undistributed net investment income, and $44,006,000 from accumulated net realized gains, to paid-in capital.
For tax purposes, at September 30, 2016, the fund had $89,419,000 of ordinary income and $645,231,000 of long-term capital gains available for distribution.
At September 30, 2016, the cost of investment securities for tax purposes was $6,990,411,000. Net unrealized appreciation of investment securities for tax purposes was $6,818,354,000, consisting of unrealized gains of $7,128,078,000 on securities that had risen in value since their purchase and $309,724,000 in unrealized losses on securities that had fallen in value since their purchase.
22
Capital Opportunity Fund
F. During the year ended September 30, 2016, the fund purchased $793,200,000 of investment securities and sold $1,415,526,000 of investment securities, other than temporary cash investments.
G. Capital share transactions for each class of shares were:
| | | | |
| | Year Ended September 30, |
| | 2016 | 2015 |
| | Amount | Shares | Amount | Shares |
| | ($000) | (000) | ($000) | (000) |
| Investor Shares | | | | |
| Issued | 188,678 | 3,739 | 365,789 | 6,845 |
| Issued in Lieu of Cash Distributions | 117,285 | 2,266 | 111,603 | 2,090 |
| Redeemed | (642,876) | (12,626) | (965,317) | (17,816) |
| Net Increase (Decrease)—Investor Shares | (336,913) | (6,621) | (487,925) | (8,881) |
| Admiral Shares | | | | |
| Issued | 620,027 | 5,277 | 1,187,443 | 9,514 |
| Issued in Lieu of Cash Distributions | 526,393 | 4,406 | 403,938 | 3,277 |
| Redeemed | (1,114,007) | (9,555) | (774,819) | (6,256) |
| Net Increase (Decrease)—Admiral Shares | 32,413 | 128 | 816,562 | 6,535 |
H. Certain of the fund’s investments are in companies that are considered to be affiliated companies of the fund because the fund owns more than 5% of the outstanding voting securities of the company or the issuer is another member of The Vanguard Group. Transactions during the period in securities of these companies were as follows:
| | | | | | |
| | | Current Period Transactions | |
| | Sept. 30, | | Proceeds | | | Sept. 30, |
| | 2015 | | from | | Capital Gain | 2016 |
| | Market | Purchases | Securities | | Distributions | Market |
| | Value | at Cost | Sold1 | Income | Received | Value |
| | ($000) | ($000) | ($000) | ($000) | ($000) | ($000) |
| Descartes Systems Group Inc. | 82,170 | — | — | — | — | 99,960 |
| FormFactor Inc. | 39,390 | — | — | — | — | 63,035 |
| Vanguard Market Liquidity Fund | 877,225 | NA2 | NA 2 | 2,200 | — | 536,979 |
| Total | 998,785 | | | 2,200 | — | 699,974 |
| 1 Includes net realized gain (loss) on affiliated investment securities sold of $6,000. |
| 2 Not applicable—purchases and sales are for temporary cash investment purposes. |
I. Management has determined that no material events or transactions occurred subsequent to September 30, 2016, that would require recognition or disclosure in these financial statements.
23
Report of Independent Registered
Public Accounting Firm
To the Board of Trustees of Vanguard Horizon Funds and the Shareholders of Vanguard Capital Opportunity Fund:
In our opinion, the accompanying statement of net assets and the related statements of operations and of changes in net assets and the financial highlights present fairly, in all material respects, the financial position of Vanguard Capital Opportunity Fund (constituting a separate portfolio of Vanguard Horizon Funds, hereafter referred to as the “Fund”) at September 30, 2016, the results of its operations for the year then ended, the changes in its net assets for each of the two years in the period then ended, and the financial highlights for each of the five years in the period then ended, in conformity with accounting principles generally accepted in the United States of America. These financial statements and financial highlights (hereafter referred to as “financial statements”) are the responsibility of the Fund’s management. Our responsibility is to express an opinion on these financial statements based on our audits. We conducted our audits of these financial statements in accordance with the standards of the Public Company Accounting Oversight Board (United States). Those standards require that we plan and perform the audit to obtain reasonable assurance about whether the financial statements are free of material misstatement. An audit includes examining, on a test basis, evidence supporting the amounts and disclosures in the financial statements, assessing the accounting principles used and significant estimates made by management, and evaluating the overall financial statement presentation. We believe that our audits, which included confirmation of securities at September 30, 2016 by correspondence with the custodian and brokers and by agreement to the underlying ownership records of the transfer agent, provide a reasonable basis for our opinion.
/s/PricewaterhouseCoopers LLP
Philadelphia, Pennsylvania
November 15, 2016

Special 2016 tax information (unaudited) for Vanguard Capital Opportunity Fund
This information for the fiscal year ended September 30, 2016, is included pursuant to provisions
of the Internal Revenue Code.
The fund distributed $656,236,000 as capital gain dividends (20% rate gain distributions) to
shareholders during the fiscal year.
For nonresident alien shareholders, 100% of short-term capital gain dividends distributed by the fund
are qualified short-term capital gains.
The fund distributed $88,424,000 of qualified dividend income to shareholders during the fiscal year.
For corporate shareholders, 95.2% of investment income (dividend income plus short-term gains, if
any) qualifies for the dividends-received deduction.
24
Your Fund’s After-Tax Returns
This table presents returns for your fund both before and after taxes. The after-tax returns are shown in two ways: (1) assuming that an investor owned the fund during the entire period and paid taxes on the fund’s distributions, and (2) assuming that an investor paid taxes on the fund’s distributions and sold all shares at the end of each period.
Calculations are based on the highest individual federal income tax and capital gains tax rates in effect at the times of the distributions and the hypothetical sales. State and local taxes were not considered. After-tax returns reflect any qualified dividend income, using actual prior-year figures and estimates for 2016. (In the example, returns after the sale of fund shares may be higher than those assuming no sale. This occurs when the sale would have produced a capital loss. The calculation assumes that the investor received a tax deduction for the loss.)
The table shows returns for Investor Shares only; returns for other share classes will differ. Please note that your actual after-tax returns will depend on your tax situation and may differ from those shown. Also note that if you own the fund in a tax-deferred account, such as an individual retirement account or a 401(k) plan, this information does not apply to you. Such accounts are not subject to current taxes.
Finally, keep in mind that a fund’s performance—whether before or after taxes—does not guarantee future results.
| | | |
| Average Annual Total Returns: Capital Opportunity Fund Investor Shares | | |
| Periods Ended September 30, 2016 | | | |
| |
| | One | Five | Ten |
| | Year | Years | Years |
| Returns Before Taxes | 15.20% | 19.53% | 9.42% |
| Returns After Taxes on Distributions | 13.82 | 18.48 | 8.53 |
| Returns After Taxes on Distributions and Sale of Fund Shares | 9.62 | 15.83 | 7.60 |
25
About Your Fund’s Expenses
As a shareholder of the fund, you incur ongoing costs, which include costs for portfolio management, administrative services, and shareholder reports (like this one), among others. Operating expenses, which are deducted from a fund’s gross income, directly reduce the investment return of the fund.
A fund’s expenses are expressed as a percentage of its average net assets. This figure is known as the expense ratio. The following examples are intended to help you understand the ongoing costs (in dollars) of investing in your fund and to compare these costs with those of other mutual funds. The examples are based on an investment of $1,000 made at the beginning of the period shown and held for the entire period.
The accompanying table illustrates your fund’s costs in two ways:
• Based on actual fund return. This section helps you to estimate the actual expenses that you paid over the period. The ”Ending Account Value“ shown is derived from the fund‘s actual return, and the third column shows the dollar amount that would have been paid by an investor who started with $1,000 in the fund. You may use the information here, together with the amount you invested, to estimate the expenses that you paid over the period.
To do so, simply divide your account value by $1,000 (for example, an $8,600 account value divided by $1,000 = 8.6), then multiply the result by the number given for your fund under the heading ”Expenses Paid During Period.“
• Based on hypothetical 5% yearly return. This section is intended to help you compare your fund‘s costs with those of other mutual funds. It assumes that the fund had a yearly return of 5% before expenses, but that the expense ratio is unchanged. In this case—because the return used is not the fund’s actual return—the results do not apply to your investment. The example is useful in making comparisons because the Securities and Exchange Commission requires all mutual funds to calculate expenses based on a 5% return. You can assess your fund’s costs by comparing this hypothetical example with the hypothetical examples that appear in shareholder reports of other funds.
Note that the expenses shown in the table are meant to highlight and help you compare ongoing costs only and do not reflect transaction costs incurred by the fund for buying and selling securities. Further, the expenses do not include any purchase, redemption, or account service fees described in the fund prospectus. If such fees were applied to your account, your costs would be higher. Your fund does not carry a “sales load.”
The calculations assume no shares were bought or sold during the period. Your actual costs may have been higher or lower, depending on the amount of your investment and the timing of any purchases or redemptions.
You can find more information about the fund’s expenses, including annual expense ratios, in the Financial Statements section of this report. For additional information on operating expenses and other shareholder costs, please refer to your fund’s current prospectus.
26
| | | |
| Six Months Ended September 30, 2016 | | | |
| | Beginning | Ending | Expenses |
| | Account Value | Account Value | Paid During |
| Capital Opportunity Fund | 3/31/2016 | 9/30/2016 | Period |
| Based on Actual Fund Return | | | |
| Investor Shares | $1,000.00 | $1,105.55 | $2.42 |
| Admiral Shares | 1,000.00 | 1,105.89 | 2.00 |
| Based on Hypothetical 5% Yearly Return | | | |
| Investor Shares | $1,000.00 | $1,022.70 | $2.33 |
| Admiral Shares | 1,000.00 | 1,023.10 | 1.92 |
The calculations are based on expenses incurred in the most recent six-month period. The fund’s annualized six-month expense ratios for that
period are 0.46% for Investor Shares and 0.38% for Admiral Shares. The dollar amounts shown as “Expenses Paid” are equal to the
annualized expense ratio multiplied by the average account value over the period, multiplied by the number of days in the most recent
six-month period, then divided by the number of days in the most recent 12-month period (183/366).
27
Glossary
30-Day SEC Yield. A fund’s 30-day SEC yield is derived using a formula specified by the U.S. Securities and Exchange Commission. Under the formula, data related to the fund’s security holdings in the previous 30 days are used to calculate the fund’s hypothetical net income for that period, which is then annualized and divided by the fund’s estimated average net assets over the calculation period. For the purposes of this calculation, a security’s income is based on its current market yield to maturity (for bonds), its actual income (for asset-backed securities), or its projected dividend yield (for stocks). Because the SEC yield represents hypothetical annualized income, it will differ—at times significantly—from the fund’s actual experience. As a result, the fund’s income distributions may be higher or lower than implied by the SEC yield.
Beta. A measure of the magnitude of a fund’s past share-price fluctuations in relation to the ups and downs of a given market index. The index is assigned a beta of 1.00. Compared with a given index, a fund with a beta of 1.20 typically would have seen its share price rise or fall by 12% when the index rose or fell by 10%. For this report, beta is based on returns over the past 36 months for both the fund and the index. Note that a fund’s beta should be reviewed in conjunction with its R-squared (see definition). The lower the R-squared, the less correlation there is between the fund and the index, and the less reliable beta is as an indicator of volatility.
Dividend Yield. Dividend income earned by stocks, expressed as a percentage of the aggregate market value (or of net asset value, for a fund). The yield is determined by dividing the amount of the annual dividends by the aggregate value (or net asset value) at the end of the period. For a fund, the dividend yield is based solely on stock holdings and does not include any income produced by other investments.
Earnings Growth Rate. The average annual rate of growth in earnings over the past five years for the stocks now in a fund.
Equity Exposure. A measure that reflects a fund’s investments in stocks and stock futures. Any holdings in short-term reserves are excluded.
Expense Ratio. A fund’s total annual operating expenses expressed as a percentage of the fund’s average net assets. The expense ratio includes management and administrative expenses, but does not include the transaction costs of buying and selling portfolio securities.
Foreign Holdings. The percentage of a fund represented by securities or depositary receipts of companies based outside the United States.
Inception Date. The date on which the assets of a fund (or one of its share classes) are first invested in accordance with the fund’s investment objective. For funds with a subscription period, the inception date is the day after that period ends. Investment performance is measured from the inception date.
Median Market Cap. An indicator of the size of companies in which a fund invests; the midpoint of market capitalization (market price x shares outstanding) of a fund’s stocks, weighted by the proportion of the fund’s assets invested in each stock. Stocks representing half of the fund’s assets have market capitalizations above the median, and the rest are below it.
Price/Book Ratio. The share price of a stock divided by its net worth, or book value, per share. For a fund, the weighted average price/book ratio of the stocks it holds.
28
Price/Earnings Ratio. The ratio of a stock’s current price to its per-share earnings over the past year. For a fund, the weighted average P/E of the stocks it holds. P/E is an indicator of market expectations about corporate prospects; the higher the P/E, the greater the expectations for a company’s future growth.
R-Squared. A measure of how much of a fund’s past returns can be explained by the returns from the market in general, as measured by a given index. If a fund’s total returns were precisely synchronized with an index’s returns, its R-squared would be 1.00. If the fund’s returns bore no relationship to the index’s returns, its R-squared would be 0. For this report, R-squared is based on returns over the past 36 months for both the fund and the index.
Return on Equity. The annual average rate of return generated by a company during the past five years for each dollar of shareholder’s equity (net income divided by shareholder’s equity). For a fund, the weighted average return on equity for the companies whose stocks it holds.
Short-Term Reserves. The percentage of a fund invested in highly liquid, short-term securities that can be readily converted to cash.
Turnover Rate. An indication of the fund’s trading activity. Funds with high turnover rates incur higher transaction costs and may be more likely to distribute capital gains (which may be taxable to investors). The turnover rate excludes in-kind transactions, which have minimal impact on costs.
29
This page intentionally left blank.
This page intentionally left blank.
The People Who Govern Your Fund
The trustees of your mutual fund are there to see that the fund is operated and managed in your best interests since, as a shareholder, you are a part owner of the fund. Your fund’s trustees also serve on the board of directors of The Vanguard Group, Inc., which is owned by the Vanguard funds and provides services to them on an at-cost basis.
A majority of Vanguard’s board members are independent, meaning that they have no affiliation with Vanguard or the funds they oversee, apart from the sizable personal investments they have made as private individuals. The independent board members have distinguished backgrounds in business, academia, and public service. Each of the trustees and executive officers oversees 198 Vanguard funds.
The following table provides information for each trustee and executive officer of the fund. The mailing address of the trustees and officers is P.O. Box 876, Valley Forge, PA 19482. More information about the trustees is in the Statement of Additional Information, which can be obtained, without charge, by contacting Vanguard at 800-662-7447, or online at vanguard.com.
|
| InterestedTrustee1 |
| F. William McNabb III |
| Born 1957. Trustee Since July 2009. Chairman of |
| the Board. Principal Occupation(s) During the Past |
| Five Years and Other Experience: Chairman of the |
| Board of The Vanguard Group, Inc., and of each of |
| the investment companies served by The Vanguard |
| Group, since January 2010; Director of The Vanguard |
| Group since 2008; Chief Executive Officer and |
| President of The Vanguard Group, and of each of |
| the investment companies served by The Vanguard |
| Group, since 2008; Director of Vanguard Marketing |
| Corporation; Managing Director of The Vanguard |
| Group (1995–2008). |
| |
| IndependentTrustees |
| Emerson U. Fullwood |
| Born 1948. Trustee Since January 2008. Principal |
| Occupation(s) During the Past Five Years and Other |
| Experience: Executive Chief Staff and Marketing |
| Officer for North America and Corporate Vice President |
| (retired 2008) of Xerox Corporation (document manage- |
| ment products and services); Executive in Residence |
| and 2009–2010 Distinguished Minett Professor at |
| the Rochester Institute of Technology; Lead Director |
| of SPX FLOW, Inc. (multi-industry manufacturing); |
| Director of the United Way of Rochester, the University |
| of Rochester Medical Center, Monroe Community |
| College Foundation, North Carolina A&T University, |
| and Roberts Wesleyan College. |
|
| Rajiv L. Gupta |
| Born 1945. Trustee Since December 2001.2 Principal |
| Occupation(s) During the Past Five Years and Other |
| Experience: Chairman and Chief Executive Officer |
| (retired 2009) and President (2006–2008) of |
| Rohm and Haas Co. (chemicals); Director of Tyco |
| International plc (diversified manufacturing and |
| services), HP Inc. (printer and personal computer |
| manufacturing), and Delphi Automotive plc |
| (automotive components); Senior Advisor at |
| New Mountain Capital. |
Amy Gutmann |
| Born 1949. Trustee Since June 2006. Principal |
| Occupation(s) During the Past Five Years and |
| Other Experience: President of the University of |
| Pennsylvania; Christopher H. Browne Distinguished |
| Professor of Political Science, School of Arts and |
| Sciences, and Professor of Communication, Annenberg |
| School for Communication, with secondary faculty |
| appointments in the Department of Philosophy, School |
| of Arts and Sciences, and at the Graduate School of |
| Education, University of Pennsylvania; Trustee of the |
| National Constitution Center; Chair of the Presidential |
| Commission for the Study of Bioethical Issues. |
JoAnn Heffernan Heisen |
| Born 1950. Trustee Since July 1998. Principal |
| Occupation(s) During the Past Five Years and |
| Other Experience: Corporate Vice President and |
| Chief Global Diversity Officer (retired 2008) and |
| Member of the Executive Committee (1997–2008) |
| of Johnson & Johnson (pharmaceuticals/medical |
| devices/consumer products); Director of Skytop |
| Lodge Corporation (hotels) and the Robert Wood |
| Johnson Foundation; Member of the Advisory |
| Board of the Institute for Women’s Leadership |
| at Rutgers University. |
|
| F. Joseph Loughrey |
| Born 1949. Trustee Since October 2009. Principal |
| Occupation(s) During the Past Five Years and Other |
| Experience: President and Chief Operating Officer |
| (retired 2009) of Cummins Inc. (industrial machinery); |
| Chairman of the Board of Hillenbrand, Inc. (specialized |
| consumer services), and of Oxfam America; Director |
| of SKF AB (industrial machinery), Hyster-Yale Materials |
| Handling, Inc. (forklift trucks), the Lumina Foundation |
| for Education, and the V Foundation for Cancer |
| Research; Member of the Advisory Council for the |
| College of Arts and Letters and of the Advisory Board |
| to the Kellogg Institute for International Studies, both |
| at the University of Notre Dame. |
Mark Loughridge |
| Born 1953. Trustee Since March 2012. Principal |
| Occupation(s) During the Past Five Years and Other |
| Experience: Senior Vice President and Chief Financial |
| Officer (retired 2013) at IBM (information technology |
| services); Fiduciary Member of IBM’s Retirement Plan |
| Committee (2004–2013); Director of the Dow Chemical |
| Company; Member of the Council on Chicago Booth. |
Scott C. Malpass |
| Born 1962. Trustee Since March 2012. Principal |
| Occupation(s) During the Past Five Years and Other |
| Experience: Chief Investment Officer and Vice |
| President at the University of Notre Dame; Assistant |
| Professor of Finance at the Mendoza College of |
| Business at Notre Dame; Member of the Notre Dame |
| 403(b) Investment Committee, the Board of Advisors |
| for Spruceview Capital Partners, and the Investment |
| Advisory Committee of Major League Baseball; Board |
| Member of TIFF Advisory Services, Inc., and Catholic |
| Investment Services, Inc. (investment advisors). |
André F. Perold |
| Born 1952. Trustee Since December 2004. Principal |
| Occupation(s) During the Past Five Years and Other |
| Experience: George Gund Professor of Finance and |
| Banking, Emeritus at the Harvard Business School |
| (retired 2011); Chief Investment Officer and Managing |
| Partner of HighVista Strategies LLC (private investment |
| firm); Director of Rand Merchant Bank; Overseer of |
| the Museum of Fine Arts Boston. |
Peter F. Volanakis |
| Born 1955. Trustee Since July 2009. Principal |
| Occupation(s) During the Past Five Years and |
| Other Experience: President and Chief Operating |
| Officer (retired 2010) of Corning Incorporated |
| (communications equipment); Chairman of the |
| Board of Trustees of Colby-Sawyer College; |
| Member of the Advisory Board of the Norris |
| Cotton Cancer Center. |
| |
| Executive Officers | |
| Glenn Booraem | |
| Born 1967. Treasurer Since May 2015. Principal |
| Occupation(s) During the Past Five Years and |
| Other Experience: Principal of The Vanguard Group, |
| Inc.; Treasurer of each of the investment companies |
| served by The Vanguard Group; Controller of each of |
| the investment companies served by The Vanguard |
| Group (2010–2015); Assistant Controller of each of |
| the investment companies served by The Vanguard |
| Group (2001–2010). | |
Thomas J. Higgins | |
| Born 1957. Chief Financial Officer Since September |
| 2008. Principal Occupation(s) During the Past Five |
| Years and Other Experience: Principal of The Vanguard |
| Group, Inc.; Chief Financial Officer of each of the |
| investment companies served by The Vanguard Group; |
| Treasurer of each of the investment companies served |
| by The Vanguard Group (1998–2008). |
Peter Mahoney | |
| Born 1974. Controller Since May 2015. Principal |
| Occupation(s) During the Past Five Years and Other |
| Experience: Head of Global Fund Accounting at The |
| Vanguard Group, Inc.; Controller of each of the invest- |
| ment companies served by The Vanguard Group; |
| Head of International Fund Services at The Vanguard |
| Group (2008–2014). | |
Anne E. Robinson | |
| Born 1970. Secretary Since September 2016. Principal |
| Occupation(s) During the Past Five Years and Other |
| Experience: Managing Director of The Vanguard Group, |
| Inc.; General Counsel of The Vanguard Group; Secretary |
| of The Vanguard Group and of each of the investment |
| companies served by The Vanguard Group; Director |
| and Senior Vice President of Vanguard Marketing |
| Corporation; Managing Director and General Counsel |
| of Global Cards and Consumer Services at Citigroup |
| (2014–2016); Counsel at American Express (2003–2014). |
| |
| Vanguard Senior ManagementTeam |
| Mortimer J. Buckley | James M. Norris |
| Kathleen C. Gubanich | Thomas M. Rampulla |
| Martha G. King | Glenn W. Reed |
| John T. Marcante | Karin A. Risi |
| Chris D. McIsaac | Michael Rollings |
| |
| Chairman Emeritus and Senior Advisor |
| John J. Brennan | |
| Chairman, 1996–2009 | |
| Chief Executive Officer and President, 1996–2008 |
| |
| Founder | |
| John C. Bogle | |
| Chairman and Chief Executive Officer, 1974–1996 |
1 Mr. McNabb is considered an “interested person,” as defined in the Investment Company Act of 1940, because he is an officer of the Vanguard funds.
2 December 2002 for Vanguard Equity Income Fund, the Vanguard Municipal Bond Funds, and the Vanguard State Tax-Exempt Funds.
|  |
| | P.O. Box 2600 |
| | Valley Forge, PA 19482-2600 |
| |
| |
| |
| Connect with Vanguard® > vanguard.com |
| |
| |
| |
| Fund Information > 800-662-7447 | |
| Direct Investor Account Services > 800-662-2739 | |
| Institutional Investor Services > 800-523-1036 | |
| Text Telephone for People | |
| Who Are Deaf or Hard of Hearing> 800-749-7273 | |
| |
| This material may be used in conjunction | |
| with the offering of shares of any Vanguard | |
| fund only if preceded or accompanied by | |
| the fund’s current prospectus. | |
| |
| All comparative mutual fund data are from Lipper, a | |
| Thomson Reuters Company, or Morningstar, Inc., unless | |
| otherwise noted. | |
| |
| You can obtain a free copy of Vanguard’s proxy voting | |
| guidelines by visiting vanguard.com/proxyreporting or by | |
| calling Vanguard at 800-662-2739. The guidelines are | |
| also available from the SEC’s website, sec.gov. In | |
| addition, you may obtain a free report on how your fund | |
| voted the proxies for securities it owned during the 12 | |
| months ended June 30. To get the report, visit either | |
| vanguard.com/proxyreporting or sec.gov. | |
| |
| You can review and copy information about your fund at | |
| the SEC’s Public Reference Room in Washington, D.C. To | |
| find out more about this public service, call the SEC at | |
| 202-551-8090. Information about your fund is also | |
| available on the SEC’s website, and you can receive | |
| copies of this information, for a fee, by sending a | |
| request in either of two ways: via email addressed to | |
| publicinfo@sec.gov or via regular mail addressed to the | |
| Public Reference Section, Securities and Exchange | |
| Commission, Washington, DC 20549-1520. | |
| |
| | © 2016 The Vanguard Group, Inc. |
| | All rights reserved. |
| | Vanguard Marketing Corporation, Distributor. |
| |
| | Q1110 112016 |

Annual Report | September 30, 2016
Vanguard Strategic Small-Cap Equity Fund
A new format, unwavering commitment
As you begin reading this report, you’ll notice that we’ve made some improvements to the opening sections—based on feedback from you, our clients.
Page 1 starts with a new ”Your Fund’s Performance at a Glance,” a concise, handy summary of how your fund performed during the period.
In the renamed ”Chairman’s Perspective,” Bill McNabb will focus on enduring principles and investment insights.
We’ve modified some tables, and eliminated some redundancy, but we haven’t removed any information.
At Vanguard, we’re always looking for better ways to communicate and to help you make sound investment decisions. Thank you for entrusting your assets to us.
| |
| Contents | |
| Your Fund’s Performance at a Glance. | 1 |
| Chairman’s Perspective. | 3 |
| Advisor’s Report. | 6 |
| Fund Profile. | 8 |
| Performance Summary. | 9 |
| Financial Statements. | 11 |
| Your Fund’s After-Tax Returns. | 24 |
| About Your Fund’s Expenses. | 25 |
| Glossary. | 27 |
Please note: The opinions expressed in this report are just that—informed opinions. They should not be considered promises or advice.
Also, please keep in mind that the information and opinions cover the period through the date on the front of this report. Of course, the
risks of investing in your fund are spelled out in the prospectus.
See the Glossary for definitions of investment terms used in this report.
About the cover: No matter what language you speak, Vanguard has one consistent message and set of principles. Our primary
focus is on you, our clients. We conduct our business with integrity as a faithful steward of your assets. This message is shown
translated into seven languages, reflecting our expanding global presence.
Your Fund’s Performance at a Glance
• Vanguard Strategic Small-Cap Equity Fund returned more than 11% for the 12 months ended September 30, 2016. It lagged its benchmark, the MSCI US Small Cap 1750 Index, by about 4 percentage points. The fund also trailed its peer-group average.
• Information technology, materials, and real estate companies were among the fund’s strongest performers. Energy and health care detracted the most from relative performance.
• Effective September 1, real estate was moved out of the financial sector and designated as a new sector, the 11th in the fund’s benchmark.
• Over the ten years ended September 30, the fund’s average annual return was about 1 percentage point below that of the benchmark, but it exceeded its peer-group average.
| |
| Total Returns: Fiscal Year Ended September 30, 2016 | |
| | Total |
| | Returns |
| Vanguard Strategic Small-Cap Equity Fund | 11.14% |
| MSCI US Small Cap 1750 Index | 15.43 |
| Small-Cap Core Funds Average | 13.01 |
| Small-Cap Core Funds Average: Derived from data provided by Lipper, a Thomson Reuters Company. |
| |
| Total Returns: Ten Years Ended September 30, 2016 | |
| | Average |
| | Annual Return |
| Strategic Small-Cap Equity Fund | 7.40% |
| MSCI US Small Cap 1750 Index | 8.31 |
| Small-Cap Core Funds Average | 6.21 |
| Small-Cap Core Funds Average: Derived from data provided by Lipper, a Thomson Reuters Company. |
The figures shown represent past performance, which is not a guarantee of future results. (Current performance may be
lower or higher than the performance data cited. For performance data current to the most recent month-end, visit our
website at vanguard.com/performance.) Note, too, that both investment returns and principal value can fluctuate widely, so
an investor’s shares, when sold, could be worth more or less than their original cost.
1
| | |
| Expense Ratios | | |
| Your Fund Compared With Its Peer Group | | |
| | | Peer Group |
| | Fund | Average |
| Strategic Small-Cap Equity Fund | 0.34% | 1.25% |
The fund expense ratio shown is from the prospectus dated January 28, 2016, and represents estimated costs for the current fiscal year. For
the fiscal year ended September 30, 2016, the fund’s expense ratio was 0.29%. The peer-group expense ratio is derived from data provided
by Lipper, a Thomson Reuters Company, and captures information through year-end 2015.
Peer group: Small-Cap Core Funds.
2
Chairman’s Perspective

Bill McNabb
Chairman and Chief Executive Officer
Dear Shareholder,
If you think you’ve had reason to feel uneasy about the investment environment lately, you’re not imagining things. In just the past few months, we’ve seen economic uncertainty, intense political polarization, and super-low bond yields. Yet at the same time, the stock market kept pushing higher.
In this confusing and sometimes contradictory climate, you may be asking yourself a question that I hear often: How do I make sense of all this, keep investing, and still get a good night’s sleep?
As with any problem, there are multiple ways to go at it. But there’s one approach in particular that is simple, straightforward, and nearly foolproof: Save more money. Not only can saving more give you a greater sense of control over your investment plan, it can help compensate for long-term returns that, in our estimation, could fall short of historical averages.
I love the way one of our investment pros put it. Fran Kinniry this summer told The Wall Street Journal, “Investing is always a partnership between you and the markets.” He explained that the markets carried more than their fair share of the weight for a couple of decades, through the 1990s, providing outsized returns that made the investor’s half of the partnership relatively light work. “But now you are going to have to be the majority partner.”
Sobering? Sure. Hopeless? Definitely not.
3
Over the 12 months since last September, U.S. stocks returned 15%, though the rise has not been a one-way ticket straight up. International markets have also posted strong returns, but lower than those of the broad U.S. market. The decision by United Kingdom voters in June to exit the European Union came as a surprise but caused market heartburn for only a few days.
In fixed income, yields remained extremely low—about 1.60% on the 10-year U.S. Treasury note at the end of September, after dipping below 1.40% over the summer. And bond yields in some international markets were negative.
Even this relatively small window of time illustrates a truism of the financial markets: There will always be segments that perform well and others that don’t. Saving more saves you from trying to control the uncontrollable—how economies and the markets perform. And it keeps you in control of one of the most vital parts of your investment program.
Although the “save more” logic is easy to grasp, it’s not always easy to follow. Bills, illness, the loss of a job—these can affect any of us.
But whatever our circumstances, figuring out how to save more is worth the effort. It requires that we make difficult decisions to forgo some consumption today to increase the likelihood of consuming (or consuming more) in the future. This is the very heart of investing. Sacrifices are never fun, so consider carrying them out systematically and in doses that you
| | | |
| Market Barometer | | | |
| | Average Annual Total Returns |
| | Periods Ended September 30, 2016 |
| | One | Three | Five |
| | Year | Years | Years |
| Stocks | | | |
| Russell 1000 Index (Large-caps) | 14.93% | 10.78% | 16.41% |
| Russell 2000 Index (Small-caps) | 15.47 | 6.71 | 15.82 |
| Russell 3000 Index (Broad U.S. market) | 14.96 | 10.44 | 16.36 |
| FTSE All-World ex US Index (International) | 9.62 | 0.71 | 6.50 |
| |
| Bonds | | | |
| Bloomberg Barclays U.S. Aggregate Bond Index | | | |
| (Broad taxable market) | 5.19% | 4.03% | 3.08% |
| Bloomberg Barclays Municipal Bond Index | | | |
| (Broad tax-exempt market) | 5.58 | 5.54 | 4.48 |
| Citigroup Three-Month U.S. Treasury Bill Index | 0.20 | 0.06 | 0.06 |
| |
| CPI | | | |
| Consumer Price Index | 1.46% | 1.03% | 1.25% |
4
can be comfortable with—for instance, gradually getting up to the max in your IRA, or adding a percentage point or so to the amount you stash in your employer’s retirement plan. As a point of reference, we generally suggest that investors strive for a retirement savings rate of 12%–15%, including any employer contributions.
If you need more convincing about the wisdom of the “save more” course of action, it might be helpful to examine your alternatives. This list is by no means exhaustive, but it hits on a few of the big ones, and none are without risk.
• Reach for yield. With yields so low on many types of bonds, it’s tempting to find the corners of the fixed income market where payouts are juicier. But with the juice comes considerable risk. You need to be aware that you’d be taking on more risk—and how much more.
• Go all-in on a hot-performing asset class or fund. By now, you know better than that, right?
• Sit tight. This approach isn’t a terrible idea; it’s better than panicking and deciding to just “do something,” particularly if that means changing your approach in response to the market’s movements.
Here’s the inescapably challenging part of your partnership with the markets: In the short run, your “partner” is fickle, emotional, and wildly unpredictable. But in the long run, your partner is mostly rational and extremely helpful.
The best way to minimize your vulnerability to the market’s mood swings, and to maximize the benefit of your partner’s longer-term strengths, is to expect less and save more. Maybe the markets will deliver better-than-expected returns. Maybe they’ll be consistent with our more modest expectations. In either case, a higher savings rate can help put you in a better position to reach your goals.
As always, thank you for investing with Vanguard.
Sincerely,

F. William McNabb III
Chairman and Chief Executive Officer
October 18, 2016
5
Advisor’s Report
For the fiscal year ended September 30, 2016, Vanguard Strategic Small-Cap Equity Fund returned 11.14%, lagging its benchmark, the MSCI Small Cap 1750 Index, by 4.29 percentage points.
Overall, equities performed well, with the broad U.S. equity market up 15.02%. Small-capitalization stocks slightly outpaced large- and mid-cap equities, and value-oriented equities outpaced their growth counterparts.
Globally, the U.S. equity market outperformed other developed markets, which returned 6.52%. Emerging markets rebounded from the previous year with strong positive returns. Performance within the small-cap benchmark was positive in all 11 sectors. Materials, utilities, and information technology had the largest returns.
Growth around the globe remains subdued. The U.S. economy grew at an annual rate of 0.8% in the first quarter of 2016 and 1.4% in the second quarter. Positive contributions from personal consumption expenditures, exports, and nonresidential fixed investments were partly offset by declines in private inventory investment and residential fixed investment.
The International Monetary Fund estimated global growth at 2.9% in the first half of 2016, slightly weaker than in the second half of 2015. Brexit is still unfolding, as the long-term arrangements between the United Kingdom and the European Union will be uncertain for some time. Commodity prices have partly recovered.
After hitting a ten-year low in January 2016, oil prices rallied 50% to $45 in August, mostly because of production outages. Nonfuel commodity prices also have increased, with metals prices rising 12% and agricultural commodity prices 9%.
Although it’s important to understand how overall performance is affected by these macroeconomic factors, our approach to investing focuses on specific fundamentals—not technical analysis of stock price movements. We compare all stocks in our investment universe within the same industry group to identify those with characteristics that we believe will outperform over the long run.
To do this, we use a strict quantitative approach that systematically focuses on several key fundamental factors. We believe that attractive stocks exhibit five key characteristics: high quality––healthy balance sheets and steady cash-flow generation; effective use of capital––sound investment policies that favor internal over external funding; consistent earnings growth––the ability to grow earnings year after year; strong market sentiment––market confirmation of our view; and reasonable valuation––avoidance of overpriced stocks.
Using these five themes, we generate a composite rank for all the stocks in our universe each day, seeking to capitalize on investor biases across the market. We monitor our portfolio based on those rankings and adjust when appropriate to maximize expected returns, while minimizing exposure to risks that our
6
research indicates doesn’t improve returns (such as industry selection and other risks relative to our benchmark).
Our portfolio focuses on the attractive stocks from our model that we expect will exhibit future outperformance over time. However, as with any investment management process, there will be periods when our model doesn’t perform as expected. Unfortunately, over the latest fiscal year, the stocks that outperformed had characteristics that our model doesn’t pursue. Although we are disappointed with the performance results, it’s important to remind our investors that we maintain our commitment through different market environments to stocks that have solid fundamentals and that we believe will outperform in the long run.
Although our valuation and management decisions models contributed to performance, our growth and quality signals were weak, and our sentiment model detracted. We always maintain a positive view on each of our five submodels, but we recently introduced a dynamic weighting process that shifts their relative importance through time. This process underweighted the sentiment component and increased the weight of the management decisions component, which mitigated our underper-formance over the period.
Over the 12 months, our portfolio generated positive stock selection results in four sectors. We realized positive contributions from real estate, information technology, materials, and industrials. In real estate, our most successful positions included Government Properties Income,
DuPont Fabros, and Select Income REIT. Performance in IT was driven by Advanced Micro Devices, Gigamon, and Cirrus Logic. Materials benefited from our positions in Trinseo SA, Kraton, and Koppers Holdings.
Unfortunately, we were not able to match the outperformance across all sectors, with the most disappointing stock selection results in energy, health care, and financials. In energy, Alon USA, Western Refining, and CVR Energy hurt performance. In health care, Infinity Pharmaceuticals, Sucampo Pharmaceuticals, and NewLink Genetics detracted. First NBC Bank Holding, MGIC Investment, and Cowen Group likewise didn’t perform as expected in financials.
We believe that the Strategic Small-Cap Equity Fund offers a strong mix of stocks with attractive valuations and growth characteristics relative to its benchmark. Although we recognize that risk can reward or punish us in the near term, we continue to believe that constructing a portfolio that emphasizes the key fundamentals within our model will benefit investors over the long term.
We thank you for your investment and look forward to the coming fiscal year.
Portfolio Managers:
Michael R. Roach, CFA
James P. Stetler, Principal
Binbin Guo, Principal, Head of Equity
Research and Portfolio Strategies
Vanguard Quantitative Equity Group
October 21, 2016
7
Strategic Small-Cap Equity Fund
Fund Profile
As of September 30, 2016
| | | |
| Portfolio Characteristics | | |
| | | MSCI US | DJ |
| | | Small Cap | U.S. Total |
| | | 1750 | Market |
| | Fund | Index | FA Index |
| Number of Stocks | 290 | 1,709 | 3,850 |
| Median Market Cap | $1.9B | $2.5B | $51.8B |
| Price/Earnings Ratio | 18.1x | 32.3x | 23.7x |
| Price/Book Ratio | 2.2x | 2.2x | 2.8x |
| Return on Equity | 9.8% | 10.6% | 16.6% |
| Earnings Growth Rate | 11.5% | 8.0% | 7.6% |
| Dividend Yield | 1.8% | 1.6% | 2.0% |
| Foreign Holdings | 1.1% | 0.0% | 0.0% |
| Turnover Rate | 89% | — | — |
| Ticker Symbol | VSTCX | — | — |
| Expense Ratio1 | 0.34% | — | — |
| 30-Day SEC Yield | 1.58% | — | — |
| Short-Term Reserves | -0.1% | — | — |
| | | |
| Sector Diversification (% of equity exposure) |
| | | | DJ |
| | | | U.S. |
| | | MSCI US | Total |
| | | Small Cap | Market |
| | | 1750 | FA |
| | Fund | Index | Index |
| Consumer | | | |
| Discretionary | 12.6% | 12.7% | 12.8% |
| Consumer Staples | 3.1 | 3.1 | 8.7 |
| Energy | 4.5 | 4.5 | 6.7 |
| Financials | 16.3 | 16.4 | 13.3 |
| Health Care | 12.7 | 12.5 | 14.2 |
| Industrials | 14.0 | 14.2 | 10.3 |
| Information | | | |
| Technology | 17.1 | 17.0 | 20.7 |
| Materials | 5.8 | 5.7 | 3.3 |
| Real Estate | 9.9 | 10.0 | 4.3 |
| Telecommunication | | | |
| Services | 0.6 | 0.6 | 2.4 |
| Utilities | 3.4 | 3.3 | 3.3 |
| | |
| Volatility Measures | | |
| | MSCI US | DJ |
| | Small Cap | U.S. Total |
| | 1750 | Market |
| | Index | FA Index |
| R-Squared | 0.96 | 0.81 |
| Beta | 0.93 | 1.04 |
| These measures show the degree and timing of the fund’s |
| fluctuations compared with the indexes over 36 months. |
| | |
| Ten Largest Holdings (% of total net assets) |
| Computer Sciences | IT Consulting & | |
| Corp. | Other Services | 0.8% |
| Advanced Micro Devices | | |
| Inc. | Semiconductors | 0.8 |
| WellCare Health Plans | Managed Health | |
| Inc. | Care | 0.7 |
| SYNNEX Corp. | Technology | |
| | Distributors | 0.7 |
| Hospitality Properties | | |
| Trust | Hotel & Resort REITs | 0.7 |
| Booz Allen Hamilton | IT Consulting & | |
| Holding Corp. | Other Services | 0.7 |
| Cirrus Logic Inc. | Semiconductors | 0.7 |
| NCR Corp. | Technology | |
| | Hardware, Storage & | |
| | Peripherals | 0.7 |
| Synovus Financial Corp. | Regional Banks | 0.7 |
| Popular Inc. | Regional Banks | 0.7 |
| Top Ten | | 7.2% |
| The holdings listed exclude any temporary cash investments and equity index products. |
Investment Focus

1 The expense ratio shown is from the prospectus dated January 28, 2016, and represents estimated costs for the current fiscal year. For the fiscal
year ended September 30, 2016, the expense ratio was 0.29%.
8
Strategic Small-Cap Equity Fund
Performance Summary
All of the returns in this report represent past performance, which is not a guarantee of future results that may be achieved by the fund. (Current performance may be lower or higher than the performance data cited. For performance data current to the most recent month-end, visit our website at vanguard.com/performance.) Note, too, that both investment returns and principal value can fluctuate widely, so an investor’s shares, when sold, could be worth more or less than their original cost. The returns shown do not reflect taxes that a shareholder would pay on fund distributions or on the sale of fund shares.
Cumulative Performance: September 30, 2006, Through September 30, 2016
Initial Investment of $10,000

| | | | | |
| | | Average Annual Total Returns | |
| | | Periods Ended September 30, 2016 | |
| | | | | | Final Value |
| | | One | Five | Ten | of a $10,000 |
| | | Year | Years | Years | Investment |
| | Strategic Small-Cap Equity Fund | 11.14% | 17.39% | 7.40% | $20,416 |
| •••••••• | MSCI US Small Cap 1750 Index | 15.43 | 16.59 | 8.31 | 22,217 |
| |
| – – – – | Dow Small-Cap Jones Core U.S. Funds Total Stock Average Market | 13.01 | 14.38 | 6.21 | 18,266 |
| | Float Adjusted Index | 14.93 | 16.30 | 7.49 | 20,592 |
| Small-Cap Core Funds Average: Derived from data provided by Lipper, a Thomson Reuters Company. |
See Financial Highlights for dividend and capital gains information.
9
Strategic Small-Cap Equity Fund
Fiscal-Year Total Returns (%): September 30, 2006, Through September 30, 2016

10
Strategic Small-Cap Equity Fund
Financial Statements
Statement of Net Assets
As of September 30, 2016
The fund reports a complete list of its holdings in regulatory filings four times in each fiscal year, at the quarter-ends. For the second and fourth fiscal quarters, the lists appear in the fund’s semiannual and annual reports to shareholders. For the first and third fiscal quarters, the fund files the lists with the Securities and Exchange Commission on Form N-Q. Shareholders can look up the fund’s Forms N-Q on the SEC’s website at sec.gov. Forms N-Q may also be reviewed and copied at the SEC’s Public Reference Room (see the back cover of this report for further information).
| | | |
| | | | Market |
| | | | Value• |
| | | Shares | ($000) |
| Common Stocks (99.6%)1 | | |
| Consumer Discretionary (12.5%) | |
| * | MSG Networks Inc. | 425,916 | 7,926 |
| * | Boyd Gaming Corp. | 395,271 | 7,818 |
| | Children’s Place Inc. | 96,621 | 7,717 |
| | Big Lots Inc. | 161,322 | 7,703 |
| * | Cooper-Standard Holding | | |
| | Inc. | 77,650 | 7,672 |
| | American Eagle Outfitters | | |
| | Inc. | 414,934 | 7,411 |
| | Bloomin’ Brands Inc. | 426,729 | 7,357 |
| * | Smith & Wesson Holding | | |
| | Corp. | 274,995 | 7,312 |
| | Bob Evans Farms Inc. | 187,467 | 7,180 |
| | Tupperware Brands Corp. | 102,767 | 6,718 |
| | Regal Entertainment | | |
| | Group Class A | 301,046 | 6,548 |
| | Rent-A-Center Inc. | 499,647 | 6,316 |
| * | American Axle & | | |
| | Manufacturing Holdings | | |
| | Inc. | 364,741 | 6,281 |
| * | Denny’s Corp. | 581,323 | 6,214 |
| | AMC Entertainment | | |
| | Holdings Inc. | 194,290 | 6,040 |
| | Sturm Ruger & Co. Inc. | 103,493 | 5,978 |
| * | Express Inc. | 438,352 | 5,168 |
| * | Strayer Education Inc. | 100,581 | 4,695 |
| | Ruth’s Hospitality Group | | |
| | Inc. | 301,818 | 4,262 |
| | Ethan Allen Interiors Inc. | 129,333 | 4,044 |
| | Barnes & Noble Inc. | 317,027 | 3,582 |
| | Visteon Corp. | 47,653 | 3,415 |
| | Cato Corp. Class A | 98,227 | 3,231 |
| * | Genesco Inc. | 55,600 | 3,028 |
| | Movado Group Inc. | 134,869 | 2,897 |
| | Cheesecake Factory Inc. | 57,779 | 2,892 |
| ^,* | Weight Watchers | | |
| | International Inc. | 192,075 | 1,982 |
| | Papa John’s International | | |
| | Inc. | 25,000 | 1,971 |
| | | |
| | Time Inc. | 133,126 | 1,928 |
| | Gannett Co. Inc. | 154,563 | 1,799 |
| | Libbey Inc. | 85,197 | 1,521 |
| * | Francesca’s Holdings Corp. | 95,900 | 1,480 |
| * | TopBuild Corp. | 43,056 | 1,429 |
| | Callaway Golf Co. | 117,112 | 1,360 |
| * | BJ’s Restaurants Inc. | 37,283 | 1,325 |
| * | Dave & Buster’s | | |
| | Entertainment Inc. | 29,955 | 1,174 |
| * | Scientific Games Corp. | | |
| | Class A | 102,200 | 1,152 |
| | GNC Holdings Inc. Class A | 52,400 | 1,070 |
| | Nexstar Broadcasting | | |
| | Group Inc. Class A | 14,460 | 834 |
| | Brinker International Inc. | 13,900 | 701 |
| * | Tile Shop Holdings Inc. | 22,400 | 371 |
| | | | 169,502 |
| Consumer Staples (3.1%) | | |
| | Dean Foods Co. | 431,110 | 7,070 |
| | Universal Corp. | 117,981 | 6,869 |
| | Fresh Del Monte | | |
| | Produce Inc. | 109,150 | 6,538 |
| * | SUPERVALU Inc. | 983,225 | 4,906 |
| | Energizer Holdings Inc. | 87,229 | 4,358 |
| | Ingles Markets Inc. Class A | 95,752 | 3,786 |
| * | Central Garden & Pet Co. | 108,952 | 2,833 |
| ^,* | Amplify Snack Brands Inc. | 104,419 | 1,692 |
| * | Central Garden & Pet Co. | | |
| | Class A | 59,546 | 1,477 |
| | Lancaster Colony Corp. | 10,028 | 1,325 |
| * | Sprouts Farmers Market Inc. | 35,706 | 737 |
| | SpartanNash Co. | 22,277 | 644 |
| | | | 42,235 |
| Energy (4.5%) | | |
| | Rowan Cos. plc Class A | 587,811 | 8,911 |
| ^,* | Transocean Ltd. | 775,678 | 8,269 |
| * | Enbridge Energy | | |
| | Management LLC | 308,374 | 7,845 |
| ^,* | Denbury Resources Inc. 2,383,011 | 7,697 |
11
Strategic Small-Cap Equity Fund
| | | |
| | | | Market |
| | | | Value• |
| | | Shares | ($000) |
| | Diamond Offshore Drilling | | |
| | Inc. | 320,695 | 5,648 |
| * | McDermott International | | |
| | Inc. | 980,684 | 4,913 |
| ^,* | Sanchez Energy Corp. | 478,836 | 4,233 |
| | Archrock Inc. | 315,129 | 4,122 |
| * | TETRA Technologies Inc. | 611,300 | 3,735 |
| ^ | Atwood Oceanics Inc. | 369,868 | 3,214 |
| | World Fuel Services Corp. | 25,214 | 1,167 |
| * | Unit Corp. | 60,500 | 1,125 |
| | | | 60,879 |
| Financials (16.2%) | | |
| | Synovus Financial Corp. | 282,941 | 9,204 |
| | Popular Inc. | 240,354 | 9,186 |
| | Assured Guaranty Ltd. | 321,341 | 8,917 |
| | Washington Federal Inc. | 316,134 | 8,434 |
| | Cathay General Bancorp | 265,823 | 8,182 |
| | Universal Insurance | | |
| | Holdings Inc. | 311,531 | 7,851 |
| | Primerica Inc. | 147,907 | 7,844 |
| * | KCG Holdings Inc. Class A | 502,043 | 7,797 |
| | CNO Financial Group Inc. | 493,217 | 7,531 |
| | Capital Bank Financial Corp. | 234,260 | 7,522 |
| * | Flagstar Bancorp Inc. | 267,146 | 7,413 |
| * | INTL. FCStone Inc. | 186,510 | 7,246 |
| | Central Pacific Financial | | |
| | Corp. | 284,268 | 7,161 |
| * | Walker & Dunlop Inc. | 280,913 | 7,096 |
| ^,* | Credit Acceptance Corp. | 34,591 | 6,955 |
| | NorthStar Asset | | |
| | Management Group Inc. | 530,586 | 6,860 |
| | Great Western Bancorp Inc. | 200,346 | 6,676 |
| | Nelnet Inc. Class A | 160,733 | 6,489 |
| ^,* | World Acceptance Corp. | 118,934 | 5,833 |
| | Banc of California Inc. | 320,055 | 5,588 |
| | IBERIABANK Corp. | 81,500 | 5,470 |
| | Heritage Insurance | | |
| | Holdings Inc. | 340,528 | 4,907 |
| | Sterling Bancorp | 252,504 | 4,419 |
| * | Essent Group Ltd. | 155,240 | 4,131 |
| | Federal Agricultural | | |
| | Mortgage Corp. | 100,672 | 3,977 |
| | Union Bankshares Corp. | 140,511 | 3,761 |
| | Aspen Insurance Holdings | | |
| | Ltd. | 79,663 | 3,712 |
| | LPL Financial Holdings Inc. | 119,136 | 3,563 |
| | TCF Financial Corp. | 230,754 | 3,348 |
| | International Bancshares | | |
| | Corp. | 106,163 | 3,162 |
| | Old National Bancorp | 206,100 | 2,898 |
| | Maiden Holdings Ltd. | 218,110 | 2,768 |
| | Dime Community | | |
| | Bancshares Inc. | 146,260 | 2,451 |
| ^,* | BofI Holding Inc. | 79,139 | 1,773 |
| | | |
| | RenaissanceRe Holdings | | |
| | Ltd. | 14,537 | 1,747 |
| | Investors Bancorp Inc. | 130,085 | 1,562 |
| | Federated Investors Inc. | | |
| | Class B | 52,100 | 1,544 |
| | Enterprise Financial | | |
| | Services Corp. | 48,315 | 1,510 |
| | Flushing Financial Corp. | 58,003 | 1,376 |
| | Fulton Financial Corp. | 86,327 | 1,253 |
| | HCI Group Inc. | 41,247 | 1,252 |
| | First Financial Corp. | 26,645 | 1,084 |
| | Old Republic International | | |
| | Corp. | 60,430 | 1,065 |
| | Virtus Investment Partners | | |
| | Inc. | 10,100 | 988 |
| | First Financial Bancorp | 44,891 | 980 |
| | MarketAxess Holdings Inc. | 5,800 | 960 |
| | Greenhill & Co. Inc. | 34,800 | 820 |
| | Brookline Bancorp Inc. | 64,117 | 782 |
| * | Ambac Financial Group Inc. | 41,888 | 770 |
| * | Green Dot Corp. Class A | 28,000 | 646 |
| | Morningstar Inc. | 8,000 | 634 |
| | | | 219,098 |
| Health Care (12.7%) | | |
| * | WellCare Health Plans Inc. | 85,076 | 9,962 |
| * | Charles River Laboratories | | |
| | International Inc. | 106,069 | 8,840 |
| * | PRA Health Sciences Inc. | 156,019 | 8,817 |
| * | Five Prime Therapeutics | | |
| | Inc. | 158,864 | 8,339 |
| * | INC Research Holdings | | |
| | Inc. Class A | 184,399 | 8,221 |
| | Bruker Corp. | 360,115 | 8,157 |
| * | Array BioPharma Inc. | 1,205,557 | 8,138 |
| * | Prestige Brands Holdings | | |
| | Inc. | 167,128 | 8,067 |
| * | Masimo Corp. | 132,956 | 7,910 |
| | Chemed Corp. | 54,386 | 7,672 |
| * | Emergent BioSolutions Inc. | 239,300 | 7,545 |
| * | PAREXEL International | | |
| | Corp. | 94,209 | 6,543 |
| * | Orthofix International NV | 136,228 | 5,826 |
| | Owens & Minor Inc. | 163,493 | 5,678 |
| * | ABIOMED Inc. | 44,011 | 5,659 |
| * | Cambrex Corp. | 123,318 | 5,483 |
| * | Halyard Health Inc. | 158,118 | 5,480 |
| * | Inogen Inc. | 74,509 | 4,463 |
| * | Cynosure Inc. Class A | 76,207 | 3,882 |
| * | Amedisys Inc. | 72,604 | 3,444 |
| * | LHC Group Inc. | 92,049 | 3,395 |
| * | Triple-S Management Corp. | |
| | Class B | 153,905 | 3,375 |
| * | HMS Holdings Corp. | 149,449 | 3,313 |
| * | Healthways Inc. | 120,700 | 3,194 |
| * | PharMerica Corp. | 110,347 | 3,097 |
12
Strategic Small-Cap Equity Fund
| | | |
| | | | Market |
| | | | Value• |
| | | Shares | ($000) |
| * | FibroGen Inc. | 104,100 | 2,155 |
| | Phibro Animal Health Corp. | | |
| | Class A | 65,555 | 1,782 |
| * | Infinity Pharmaceuticals | | |
| | Inc. | 1,138,454 | 1,776 |
| * | Amphastar | | |
| | Pharmaceuticals Inc. | 73,944 | 1,403 |
| * | Merit Medical Systems Inc. | 57,449 | 1,395 |
| * | Allscripts Healthcare | | |
| | Solutions Inc. | 97,980 | 1,290 |
| * | VCA Inc. | 18,424 | 1,289 |
| * | VWR Corp. | 44,514 | 1,262 |
| * | Surgical Care Affiliates Inc. | 25,359 | 1,236 |
| * | Aratana Therapeutics Inc. | 130,300 | 1,220 |
| * | OraSure Technologies Inc. | 113,700 | 906 |
| | Kindred Healthcare Inc. | 74,000 | 756 |
| | | | 170,970 |
| Industrials (14.0%) | | |
| | BWX Technologies Inc. | 231,568 | 8,885 |
| * | Hawaiian Holdings Inc. | 178,134 | 8,657 |
| | Greenbrier Cos. Inc. | 226,437 | 7,993 |
| * | Meritor Inc. | 716,173 | 7,971 |
| | Universal Forest Products | | |
| | Inc. | 79,647 | 7,844 |
| | GATX Corp. | 175,936 | 7,838 |
| | Insperity Inc. | 106,042 | 7,703 |
| * | Wabash National Corp. | 539,441 | 7,682 |
| | General Cable Corp. | 507,413 | 7,601 |
| | SkyWest Inc. | 280,391 | 7,405 |
| | Global Brass & Copper | | |
| | Holdings Inc. | 253,069 | 7,311 |
| * | ACCO Brands Corp. | 703,134 | 6,778 |
| | Brink’s Co. | 181,155 | 6,717 |
| | Comfort Systems USA Inc. | 213,029 | 6,244 |
| | Huntington Ingalls | | |
| | Industries Inc. | 39,733 | 6,096 |
| | Aircastle Ltd. | 294,071 | 5,840 |
| | Douglas Dynamics Inc. | 166,505 | 5,318 |
| | West Corp. | 230,648 | 5,093 |
| * | Continental Building | | |
| | Products Inc. | 225,124 | 4,725 |
| * | Spirit AeroSystems | | |
| | Holdings Inc. Class A | 101,300 | 4,512 |
| | Ennis Inc. | 263,315 | 4,437 |
| | Herman Miller Inc. | 147,567 | 4,220 |
| * | Swift Transportation Co. | 169,705 | 3,644 |
| | Briggs & Stratton Corp. | 189,090 | 3,527 |
| * | MasTec Inc. | 115,855 | 3,445 |
| | Quad/Graphics Inc. | 123,756 | 3,307 |
| | RR Donnelley & Sons Co. | 198,773 | 3,125 |
| * | Trex Co. Inc. | 48,581 | 2,853 |
| * | NCI Building Systems Inc. | 187,531 | 2,736 |
| * | MRC Global Inc. | 157,068 | 2,581 |
| | Griffon Corp. | 103,736 | 1,765 |
| | | |
| | American Railcar | | |
| | Industries Inc. | 41,878 | 1,737 |
| * | Gibraltar Industries Inc. | 43,226 | 1,606 |
| * | Lydall Inc. | 31,040 | 1,587 |
| | Insteel Industries Inc. | 39,083 | 1,416 |
| * | TriNet Group Inc. | 60,829 | 1,316 |
| | Kforce Inc. | 63,342 | 1,298 |
| | Triumph Group Inc. | 44,286 | 1,235 |
| * | JetBlue Airways Corp. | 58,669 | 1,011 |
| * | Aegion Corp. Class A | 50,530 | 964 |
| * | Chart Industries Inc. | 29,100 | 955 |
| * | Energy Recovery Inc. | 49,900 | 797 |
| * | American Woodmark Corp. | 7,916 | 638 |
| | | | 188,413 |
| Information Technology (17.0%) | |
| | Computer Sciences Corp. | 216,791 | 11,319 |
| * | Advanced Micro Devices | | |
| | Inc. | 1,535,320 | 10,609 |
| | SYNNEX Corp. | 84,757 | 9,672 |
| | Booz Allen Hamilton | | |
| | Holding Corp. Class A | 293,619 | 9,281 |
| * | Cirrus Logic Inc. | 174,368 | 9,268 |
| * | NCR Corp. | 286,837 | 9,233 |
| * | Tech Data Corp. | 107,218 | 9,082 |
| * | NETGEAR Inc. | 143,208 | 8,663 |
| | Travelport Worldwide Ltd. | 560,213 | 8,420 |
| * | GoDaddy Inc. Class A | 242,495 | 8,373 |
| * | Synaptics Inc. | 142,494 | 8,347 |
| | CSG Systems | | |
| | International Inc. | 181,395 | 7,497 |
| * | Cardtronics plc Class A | 167,366 | 7,465 |
| * | CACI International Inc. | | |
| | Class A | 69,543 | 7,017 |
| * | Manhattan Associates Inc. | 120,606 | 6,949 |
| * | MaxLinear Inc. | 340,660 | 6,905 |
| * | Sykes Enterprises Inc. | 237,642 | 6,685 |
| | EarthLink Holdings Corp. | 1,077,718 | 6,682 |
| * | Viavi Solutions Inc. | 825,624 | 6,101 |
| | Leidos Holdings Inc. | 135,524 | 5,865 |
| * | ePlus Inc. | 59,754 | 5,641 |
| * | Itron Inc. | 93,559 | 5,217 |
| * | Gigamon Inc. | 93,717 | 5,136 |
| * | Advanced Energy | | |
| | Industries Inc. | 107,266 | 5,076 |
| * | Aspen Technology Inc. | 106,639 | 4,990 |
| * | Angie’s List Inc. | 467,600 | 4,634 |
| | ManTech International | | |
| | Corp. Class A | 115,255 | 4,344 |
| * | Sanmina Corp. | 150,097 | 4,273 |
| * | Plexus Corp. | 77,354 | 3,619 |
| * | Avid Technology Inc. | 416,509 | 3,307 |
| | CSRA Inc. | 109,027 | 2,933 |
| | TeleTech Holdings Inc. | 100,165 | 2,904 |
| * | Super Micro Computer Inc. | 116,804 | 2,730 |
| * | Inphi Corp. | 58,176 | 2,531 |
13
Strategic Small-Cap Equity Fund
| | | |
| | | | Market |
| | | | Value• |
| | | Shares | ($000) |
| * | Sigma Designs Inc. | 293,500 | 2,286 |
| | Science Applications | | |
| | International Corp. | 25,700 | 1,783 |
| * | Benchmark Electronics Inc. | 59,745 | 1,491 |
| * | TTM Technologies Inc. | 123,000 | 1,408 |
| * | ShoreTel Inc. | 147,550 | 1,180 |
| * | Xcerra Corp. | 92,022 | 558 |
| | | | 229,474 |
| Materials (5.8%) | | |
| | Cabot Corp. | 171,520 | 8,990 |
| | Worthington Industries Inc. | 183,431 | 8,810 |
| | Trinseo SA | 151,476 | 8,568 |
| | Schnitzer Steel Industries | | |
| | Inc. | 375,774 | 7,854 |
| | Rayonier Advanced | | |
| | Materials Inc. | 584,988 | 7,821 |
| ^,* | AK Steel Holding Corp. | 1,611,415 | 7,783 |
| | Commercial Metals Co. | 473,766 | 7,670 |
| * | Coeur Mining Inc. | 612,706 | 7,248 |
| * | Koppers Holdings Inc. | 196,177 | 6,313 |
| | Chemours Co. | 195,179 | 3,123 |
| | Mercer International Inc. | 297,777 | 2,522 |
| | Steel Dynamics Inc. | 39,500 | 987 |
| | | | 77,689 |
| Real Estate (9.9%) | | |
| | Hospitality Properties Trust | 313,330 | 9,312 |
| | Lexington Realty Trust | 791,254 | 8,150 |
| | Sunstone Hotel Investors | | |
| | Inc. | 636,598 | 8,142 |
| | NorthStar Realty Finance | | |
| | Corp. | 605,449 | 7,974 |
| | Select Income REIT | 296,109 | 7,965 |
| | Washington Prime Group | | |
| | Inc. | 635,604 | 7,869 |
| | CBL & Associates | | |
| | Properties Inc. | 641,713 | 7,790 |
| | Government Properties | | |
| | Income Trust | 343,856 | 7,778 |
| | DuPont Fabros Technology | | |
| | Inc. | 188,463 | 7,774 |
| | Care Capital Properties Inc. | 200,095 | 5,703 |
| | Outfront Media Inc. | 229,863 | 5,436 |
| | Brandywine Realty Trust | 338,399 | 5,286 |
| | Ryman Hospitality | | |
| | Properties Inc. | 107,861 | 5,195 |
| | GEO Group Inc. | 205,177 | 4,879 |
| | Spirit Realty Capital Inc. | 365,650 | 4,874 |
| | LaSalle Hotel Properties | 173,100 | 4,132 |
| | Summit Hotel Properties | | |
| | Inc. | 297,114 | 3,910 |
| | Piedmont Office Realty | | |
| | Trust Inc. Class A | 139,690 | 3,041 |
| | Apple Hospitality REIT Inc. | 160,458 | 2,970 |
| | Mack-Cali Realty Corp. | 102,394 | 2,787 |
| | Sabra Health Care REIT Inc. | 91,047 | 2,292 |
| | | |
| | Global Net Lease Inc. | 279,041 | 2,277 |
| | Gaming and Leisure | | |
| | Properties Inc. | 63,758 | 2,133 |
| | Universal Health Realty | | |
| | Income Trust | 22,411 | 1,412 |
| | Monmouth Real Estate | | |
| | Investment Corp. | 85,761 | 1,224 |
| | One Liberty Properties Inc. | 47,185 | 1,140 |
| | Tier REIT Inc. | 58,631 | 905 |
| | RAIT Financial Trust | 257,300 | 870 |
| | Getty Realty Corp. | 15,279 | 366 |
| | | | 133,586 |
| Telecommunication Services (0.6%) | |
| * | Cincinnati Bell Inc. | 1,582,611 | 6,457 |
| | Windstream Holdings Inc. | 105,700 | 1,062 |
| | Cogent Communications | | |
| | Holdings Inc. | 18,283 | 673 |
| | | | 8,192 |
| Utilities (3.3%) | | |
| | Great Plains Energy Inc. | 320,001 | 8,733 |
| | ONE Gas Inc. | 132,924 | 8,220 |
| | Southwest Gas Corp. | 117,349 | 8,198 |
| | Avista Corp. | 177,146 | 7,403 |
| | Unitil Corp. | 70,250 | 2,744 |
| | NRG Yield Inc. | 142,670 | 2,420 |
| ^ | Spark Energy Inc. Class A | 73,284 | 2,135 |
| | Ormat Technologies Inc. | 42,440 | 2,055 |
| | Middlesex Water Co. | 48,707 | 1,716 |
| | Otter Tail Corp. | 38,231 | 1,322 |
| | | | 44,946 |
| Total Common Stocks | | |
| (Cost $1,202,173) | | 1,344,984 |
| Temporary Cash Investments (1.2%)1 | |
| Money Market Fund (1.2%) | | |
| 2,3 | Vanguard Market | | |
| | Liquidity Fund, 0.640% | 157,327 | 15,734 |
| |
| | | Face | |
| | | Amount | |
| | | ($000) | |
| U.S. Government and Agency Obligations (0.0%) |
| 4,5 | Federal Home Loan | | |
| | Bank Discount Notes, | | |
| | 0.380%, 10/5/16 | 500 | 500 |
| 4,5 | Federal Home Loan | | |
| | Bank Discount Notes, | | |
| | 0.511%, 10/12/16 | 100 | 100 |
| | | | 600 |
| Total Temporary Cash Investments | |
| (Cost $16,334) | | 16,334 |
| Total Investments (100.8%) | | |
| (Cost $1,218,507) | | 1,361,318 |
14
Strategic Small-Cap Equity Fund
| |
| | Amount |
| | ($000) |
| Other Assets and Liabilities (-0.8%) | |
| Other Assets | |
| Investment in Vanguard | 103 |
| Receivables for Investment Securities Sold 2,283 |
| Receivables for Accrued Income | 1,258 |
| Receivables for Capital Shares Issued | 554 |
| Other Assets 6 | 1,279 |
| Total Other Assets | 5,477 |
| Liabilities | |
| Payables for Investment Securities | |
| Purchased | (2,216) |
| Collateral for Securities on Loan | (11,557) |
| Payables for Capital Shares Redeemed | (1,596) |
| Payables to Vanguard | (665) |
| Other Liabilities | (217) |
| Total Liabilities | (16,251) |
| Net Assets (100%) | |
| Applicable to 42,946,963 outstanding | |
| $.001 par value shares of beneficial | |
| interest (unlimited authorization) | 1,350,544 |
| Net Asset Value Per Share | $31.45 |
| |
| At September 30, 2016, net assets consisted of: |
| | Amount |
| | ($000) |
| Paid-in Capital | 1,193,807 |
| Undistributed Net Investment Income | 13,973 |
| Accumulated Net Realized Losses | (136) |
| Unrealized Appreciation (Depreciation) | |
| Investment Securities | 142,811 |
| Futures Contracts | 89 |
| Net Assets | 1,350,544 |
• See Note A in Notes to Financial Statements.
* Non-income-producing security.
^ Includes partial security positions on loan to broker-dealers. The total value of securities on loan is $11,158,000.
1 The fund invests a portion of its cash reserves in equity markets through the use of index futures contracts. After giving effect to futures
investments, the fund’s effective common stock and temporary cash investment positions represent 100.0% and 0.8%, respectively,
of net assets.
2 Affiliated money market fund available only to Vanguard funds and certain trusts and accounts managed by Vanguard. Rate shown is the
7-day yield.
3 Includes $11,557,000 of collateral received for securities on loan.
4 The issuer operates under a congressional charter; its securities are generally neither guaranteed by the U.S. Treasury nor backed by the full
faith and credit of the U.S. government.
5 Securities with a value of $400,000 have been segregated as initial margin for open futures contracts.
6 Cash of $300,000 has been segregated as initial margin for open futures contracts.
REIT—Real Estate Investment Trust.
See accompanying Notes, which are an integral part of the Financial Statements.
15
Strategic Small-Cap Equity Fund
Statement of Operations
| |
| | Year Ended |
| | September 30, 2016 |
| | ($000) |
| Investment Income | |
| Income | |
| Dividends | 22,785 |
| Interest1 | 34 |
| Securities Lending—Net | 1,257 |
| Total Income | 24,076 |
| Expenses | |
| The Vanguard Group—Note B | |
| Investment Advisory Services | 1,050 |
| Management and Administrative | 1,908 |
| Marketing and Distribution | 309 |
| Custodian Fees | 23 |
| Auditing Fees | 35 |
| Shareholders’ Reports | 39 |
| Trustees’ Fees and Expenses | 1 |
| Total Expenses | 3,365 |
| Net Investment Income | 20,711 |
| Realized Net Gain (Loss) | |
| Investment Securities Sold1 | (193) |
| Futures Contracts | 721 |
| Realized Net Gain (Loss) | 528 |
| Change in Unrealized Appreciation (Depreciation) | |
| Investment Securities | 115,399 |
| Futures Contracts | 216 |
| Change in Unrealized Appreciation (Depreciation) | 115,615 |
| Net Increase (Decrease) in Net Assets Resulting from Operations | 136,854 |
| 1 Interest income and realized net gain (loss) from an affiliated company of the fund were $34,000 and $0, respectively. |
See accompanying Notes, which are an integral part of the Financial Statements.
16
Strategic Small-Cap Equity Fund
Statement of Changes in Net Assets
| | |
| | Year Ended September 30, |
| | 2016 | 2015 |
| | ($000) | ($000) |
| Increase (Decrease) in Net Assets | | |
| Operations | | |
| Net Investment Income | 20,711 | 10,602 |
| Realized Net Gain (Loss) | 528 | 14,991 |
| Change in Unrealized Appreciation (Depreciation) | 115,615 | (43,049) |
| Net Increase (Decrease) in Net Assets Resulting from Operations | 136,854 | (17,456) |
| Distributions | | |
| Net Investment Income | (11,861) | (4,646) |
| Realized Capital Gain1 | (11,722) | (45,915) |
| Total Distributions | (23,583) | (50,561) |
| Capital Share Transactions | | |
| Issued | 561,076 | 586,229 |
| Issued in Lieu of Cash Distributions | 22,050 | 47,237 |
| Redeemed | (291,039) | (165,424) |
| Net Increase (Decrease) from Capital Share Transactions | 292,087 | 468,042 |
| Total Increase (Decrease) | 405,358 | 400,025 |
| Net Assets | | |
| Beginning of Period | 945,186 | 545,161 |
| End of Period2 | 1,350,544 | 945,186 |
| 1 Includes fiscal 2016 and 2015 short-term gain distributions totaling $0 and $6,762,000, respectively. Short-term gain distributions are |
| treated as ordinary income dividends for tax purposes. |
| 2 Net Assets—End of Period includes undistributed (overdistributed) net investment income of $13,973,000 and $7,198,000. |
See accompanying Notes, which are an integral part of the Financial Statements.
17
Strategic Small-Cap Equity Fund
Financial Highlights
| | | | | |
| For a Share Outstanding | Year Ended September 30, |
| Throughout Each Period | 2016 | 2015 | 2014 | 2013 | 2012 |
| Net Asset Value, Beginning of Period | $28.95 | $30.91 | $27.94 | $21.37 | $16.44 |
| Investment Operations | | | | | |
| Net Investment Income | .494 | .368 | .277 | .345 | .238 |
| Net Realized and Unrealized Gain (Loss) | | | | | |
| on Investments | 2.682 | .349 | 3.201 | 6.585 | 4.888 |
| Total from Investment Operations | 3.176 | .717 | 3.478 | 6.930 | 5.126 |
| Distributions | | | | | |
| Dividends from Net Investment Income | (. 340) | (. 246) | (. 232) | (. 360) | (.196) |
| Distributions from Realized Capital Gains | (.336) | (2.431) | (.276) | — | — |
| Total Distributions | (. 676) | (2.677) | (. 508) | (. 360) | (.196) |
| Net Asset Value, End of Period | $31.45 | $28.95 | $30.91 | $27.94 | $21.37 |
| |
| Total Return1 | 11.14% | 2.10% | 12.48% | 32.94% | 31.38% |
| |
| Ratios/Supplemental Data | | | | | |
| Net Assets, End of Period (Millions) | $1,351 | $945 | $545 | $377 | $259 |
| Ratio of Total Expenses to Average Net Assets | 0.29% | 0.34% | 0.38% | 0.38% | 0.38% |
| Ratio of Net Investment Income to | | | | | |
| Average Net Assets | 1.78% | 1.34% | 0.96% | 1.40% | 1.16% |
| Portfolio Turnover Rate | 89% | 62% | 64% | 64% | 66% |
| 1 Total returns do not include account service fees that may have applied in the periods shown. Fund prospectuses provide information about |
| any applicable account service fees. |
See accompanying Notes, which are an integral part of the Financial Statements.
18
Strategic Small-Cap Equity Fund
Notes to Financial Statements
Vanguard Strategic Small-Cap Equity Fund is registered under the Investment Company Act of 1940 as an open-end investment company, or mutual fund.
A. The following significant accounting policies conform to generally accepted accounting principles for U.S. investment companies. The fund consistently follows such policies in preparing its financial statements.
1. Security Valuation: Securities are valued as of the close of trading on the New York Stock Exchange (generally 4 p.m., Eastern time) on the valuation date. Equity securities are valued at the latest quoted sales prices or official closing prices taken from the primary market in which each security trades; such securities not traded on the valuation date are valued at the mean of the latest quoted bid and asked prices. Securities for which market quotations are not readily available, or whose values have been materially affected by events occurring before the fund’s pricing time but after the close of the securities’ primary markets, are valued by methods deemed by the board of trustees to represent fair value. Investments in Vanguard Market Liquidity Fund are valued at that fund’s net asset value. Temporary cash investments acquired over 60 days to maturity are valued using the latest bid prices or using valuations based on a matrix system (which considers such factors as security prices, yields, maturities, and ratings), both as furnished by independent pricing services. Other temporary cash investments are valued at amortized cost, which approximates market value.
2. Futures Contracts: The fund uses index futures contracts to a limited extent, with the objective of maintaining full exposure to the stock market while maintaining liquidity. The fund may purchase or sell futures contracts to achieve a desired level of investment, whether to accommodate portfolio turnover or cash flows from capital share transactions. The primary risks associated with the use of futures contracts are imperfect correlation between changes in market values of stocks held by the fund and the prices of futures contracts, and the possibility of an illiquid market. Counterparty risk involving futures is mitigated because a regulated clearinghouse is the counterparty instead of the clearing broker. To further mitigate counterparty risk, the fund trades futures contracts on an exchange, monitors the financial strength of its clearing brokers and clearinghouse, and has entered into clearing agreements with its clearing brokers. The clearinghouse imposes initial margin requirements to secure the fund’s performance and requires daily settlement of variation margin representing changes in the market value of each contract.
Futures contracts are valued at their quoted daily settlement prices. The aggregate settlement values of the contracts are not recorded in the Statement of Net Assets. Fluctuations in the value of the contracts are recorded in the Statement of Net Assets as an asset (liability) and in the Statement of Operations as unrealized appreciation (depreciation) until the contracts are closed, when they are recorded as realized futures gains (losses).
During the year ended September 30, 2016, the fund’s average investments in long and short futures contracts represented less than 1% and 0% of net assets, respectively, based on the average of aggregate settlement values at each quarter-end during the period.
3. Federal Income Taxes: The fund intends to continue to qualify as a regulated investment company and distribute all of its taxable income. Management has analyzed the fund’s tax positions taken for all open federal income tax years (September 30, 2013–2016), and has concluded that no provision for federal income tax is required in the fund’s financial statements.
4. Distributions: Distributions to shareholders are recorded on the ex-dividend date.
19
Strategic Small-Cap Equity Fund
5. Securities Lending: To earn additional income, the fund lends its securities to qualified institutional borrowers. Security loans are subject to termination by the fund at any time, and are required to be secured at all times by collateral in an amount at least equal to the market value of securities loaned. Daily market fluctuations could cause the value of loaned securities to be more or less than the value of the collateral received. When this occurs, the collateral is adjusted and settled on the next business day. The fund further mitigates its counterparty risk by entering into securities lending transactions only with a diverse group of prequalified counterparties, monitoring their financial strength, and entering into master securities lending agreements with its counterparties. The master securities lending agreements provide that, in the event of a counterparty’s default (including bankruptcy), the fund may terminate any loans with that borrower, determine the net amount owed, and sell or retain the collateral up to the net amount owed to the fund; however, such actions may be subject to legal proceedings. While collateral mitigates counterparty risk, in the absence of a default the fund may experience delays and costs in recovering the securities loaned. The fund invests cash collateral received in Vanguard Market Liquidity Fund, and records a liability in the Statement of Net Assets for the return of the collateral, during the period the securities are on loan. Securities lending income represents fees charged to borrowers plus income earned on invested cash collateral, less expenses associated with the loan. During the term of the loan, the fund is entitled to all distributions made on or in respect of the loaned securities.
6. Credit Facility: The fund and certain other funds managed by The Vanguard Group (“Vanguard”) participate in a $3.1 billion committed credit facility provided by a syndicate of lenders pursuant to a credit agreement that may be renewed annually; each fund is individually liable for its borrowings, if any, under the credit facility. Borrowings may be utilized for temporary and emergency purposes, and are subject to the fund’s regulatory and contractual borrowing restrictions. The participating funds are charged administrative fees and an annual commitment fee of 0.10% of the undrawn amount of the facility; these fees are allocated to the funds based on a method approved by the fund’s board of trustees and included in Management and Administrative expenses on the fund’s Statement of Operations. Any borrowings under this facility bear interest at a rate based upon the higher of the one-month London Interbank Offered Rate, federal funds effective rate, or overnight bank funding rate plus an agreed-upon spread.
The fund had no borrowings outstanding at September 30, 2016, or at any time during the period then ended.
7. Other: Dividend income is recorded on the ex-dividend date. Interest income includes income distributions received from Vanguard Market Liquidity Fund and is accrued daily. Premiums and discounts on debt securities purchased are amortized and accreted, respectively, to interest income over the lives of the respective securities. Security transactions are accounted for on the date securities are bought or sold. Costs used to determine realized gains (losses) on the sale of investment securities are those of the specific securities sold.
B. In accordance with the terms of a Funds’ Service Agreement (the “FSA”) between Vanguard and the fund, Vanguard furnishes to the fund investment advisory, corporate management, administrative, marketing, and distribution services at Vanguard’s cost of operations (as defined by the FSA). These costs of operations are allocated to the fund based on methods and guidelines approved by the board of trustees. Vanguard does not require reimbursement in the current period for certain costs of operations (such as deferred compensation/benefits and risk/insurance costs); the fund’s liability for these costs of operations is included in Payables to Vanguard on the Statement of Net Assets.
20
Strategic Small-Cap Equity Fund
Upon the request of Vanguard, the fund may invest up to 0.40% of its net assets as capital in Vanguard. At September 30, 2016, the fund had contributed to Vanguard capital in the amount of $103,000, representing 0.01% of the fund’s net assets and 0.04% of Vanguard’s capitalization. The fund’s trustees and officers are also directors and employees, respectively, of Vanguard.
C. Various inputs may be used to determine the value of the fund’s investments. These inputs are summarized in three broad levels for financial statement purposes. The inputs or methodologies used to value securities are not necessarily an indication of the risk associated with investing in those securities.
Level 1—Quoted prices in active markets for identical securities.
Level 2—Other significant observable inputs (including quoted prices for similar securities, interest rates, prepayment speeds, credit risk, etc.).
Level 3—Significant unobservable inputs (including the fund’s own assumptions used to determine the fair value of investments).
The following table summarizes the market value of the fund’s investments as of September 30, 2016, based on the inputs used to value them:
| | | |
| | Level 1 | Level 2 | Level 3 |
| Investments | ($000) | ($000) | ($000) |
| Common Stocks | 1,344,984 | — | — |
| Temporary Cash Investments | 15,734 | 600 | — |
| Futures Contracts—Assets1 | 70 | — | — |
| Futures Contracts— Liabilities1 | (5) | — | — |
| Total | 1,360,783 | 600 | — |
| 1 Represents variation margin on the last day of the reporting period. |
D. At September 30, 2016, the aggregate settlement value of open futures contracts and the related unrealized appreciation (depreciation) were:
| | | | |
| | | | ($000) |
| | | | Aggregate | |
| | | Number of | Settlement | Unrealized |
| | | Long (Short) | Value | Appreciation |
| Futures Contracts | Expiration | Contracts | Long (Short) | (Depreciation) |
| E-mini Russell 2000 Index | December 2016 | 49 | 6,117 | 89 |
Unrealized appreciation (depreciation) on open futures contracts is required to be treated as realized gain (loss) for tax purposes.
E. Distributions are determined on a tax basis and may differ from net investment income and realized capital gains for financial reporting purposes. Differences may be permanent or temporary. Permanent differences are reclassified among capital accounts in the financial statements to reflect their tax character. Temporary differences arise when certain items of income, expense, gain, or loss are recognized in different periods for financial statement and tax purposes. These differences will reverse at some time in the future. Differences in classification may also result from the treatment of short-term gains as ordinary income for tax purposes.
21
Strategic Small-Cap Equity Fund
The fund used a tax accounting practice to treat a portion of the price of capital shares redeemed during the year as distributions from net investment income and realized capital gains. Accordingly, the fund has reclassified $2,075,000 from undistributed net investment income to paid-in capital.
For tax purposes, at September 30, 2016, the fund had $14,462,000 of ordinary income available for distribution.
At September 30, 2016, the cost of investment securities for tax purposes was $1,218,507,000. Net unrealized appreciation of investment securities for tax purposes was $142,811,000, consisting of unrealized gains of $184,513,000 on securities that had risen in value since their purchase and $41,702,000 in unrealized losses on securities that had fallen in value since their purchase.
F. During the year ended September 30, 2016, the fund purchased $1,329,124,000 of investment securities and sold $1,036,779,000 of investment securities, other than temporary cash investments.
G. Capital shares issued and redeemed were:
| | |
| | Year Ended September 30, |
| | 2016 | 2015 |
| | Shares | Shares |
| | (000) | (000) |
| Issued | 19,461 | 18,723 |
| Issued in Lieu of Cash Distributions | 751 | 1,590 |
| Redeemed | (9,919) | (5,297) |
| Net Increase (Decrease) in Shares Outstanding | 10,293 | 15,016 |
H. Management has determined that no material events or transactions occurred subsequent to September 30, 2016, that would require recognition or disclosure in these financial statements.
22
Report of Independent Registered Public Accounting Firm
To the Board of Trustees of Vanguard Horizon Funds and the Shareholders of Vanguard Strategic Small-Cap Equity Fund:
In our opinion, the accompanying statement of net assets and the related statements of operations and of changes in net assets and the financial highlights present fairly, in all material respects, the financial position of Vanguard Strategic Small-Cap Equity Fund (constituting a separate portfolio of Vanguard Horizon Funds, hereafter referred to as the “Fund”) at September 30, 2016, the results of its operations for the year then ended, the changes in its net assets for each of the two years in the period then ended, and the financial highlights for each of the five years in the period then ended, in conformity with accounting principles generally accepted in the United States of America. These financial statements and financial highlights (hereafter referred to as “financial statements”) are the responsibility of the Fund’s management. Our responsibility is to express an opinion on these financial statements based on our audits. We conducted our audits of these financial statements in accordance with the standards of the Public Company Accounting Oversight Board (United States). Those standards require that we plan and perform the audit to obtain reasonable assurance about whether the financial statements are free of material misstatement. An audit includes examining, on a test basis, evidence supporting the amounts and disclosures in the financial statements, assessing the accounting principles used and significant estimates made by management, and evaluating the overall financial statement presentation. We believe that our audits, which included confirmation of securities at September 30, 2016 by correspondence with the custodian and brokers and by agreement to the underlying ownership records of the transfer agent, provide a reasonable basis for our opinion.
/s/PricewaterhouseCoopers LLP
Philadelphia, Pennsylvania
November 15, 2016

Special 2016 tax information (unaudited) for Vanguard Strategic Small-Cap Equity Fund
This information for the fiscal year ended September 30, 2016, is included pursuant to provisions of
the Internal Revenue Code.
The fund distributed $12,036,000 as capital gain dividends (20% rate gain distributions) to
shareholders during the fiscal year.
The fund distributed $8,953,000 of qualified dividend income to shareholders during the fiscal year.
For corporate shareholders, 72.4% of investment income (dividend income plus short-term gains,
if any) qualifies for the dividends-received deduction.
23
Your Fund’s After-Tax Returns
This table presents returns for your fund both before and after taxes. The after-tax returns are shown in two ways: (1) assuming that an investor owned the fund during the entire period and paid taxes on the fund’s distributions, and (2) assuming that an investor paid taxes on the fund’s distributions and sold all shares at the end of each period.
Calculations are based on the highest individual federal income tax and capital gains tax rates in effect at the times of the distributions and the hypothetical sales. State and local taxes were not considered. After-tax returns reflect any qualified dividend income, using actual prior-year figures and estimates for 2016. (In the example, returns after the sale of fund shares may be higher than those assuming no sale. This occurs when the sale would have produced a capital loss. The calculation assumes that the investor received a tax deduction for the loss.)
Please note that your actual after-tax returns will depend on your tax situation and may differ from those shown. Also note that if you own the fund in a tax-deferred account, such as an individual retirement account or a 401(k) plan, this information does not apply to you. Such accounts are not subject to current taxes.
Finally, keep in mind that a fund’s performance—whether before or after taxes—does not guarantee future results.
| | | |
| Average Annual Total Returns: Strategic Small-Cap Equity Fund | | |
| Periods Ended September 30, 2016 | | | |
| | One | Five | Ten |
| | Year | Years | Years |
| Returns Before Taxes | 11.14% | 17.39% | 7.40% |
| Returns After Taxes on Distributions | 10.48 | 16.54 | 6.90 |
| Returns After Taxes on Distributions and Sale of Fund Shares | 6.68 | 14.00 | 5.93 |
24
About Your Fund’s Expenses
As a shareholder of the fund, you incur ongoing costs, which include costs for portfolio management, administrative services, and shareholder reports (like this one), among others. Operating expenses, which are deducted from a fund’s gross income, directly reduce the investment return of the fund.
A fund’s expenses are expressed as a percentage of its average net assets. This figure is known as the expense ratio. The following examples are intended to help you understand the ongoing costs (in dollars) of investing in your fund and to compare these costs with those of other mutual funds. The examples are based on an investment of $1,000 made at the beginning of the period shown and held for the entire period.
The accompanying table illustrates your fund’s costs in two ways:
• Based on actual fund return. This section helps you to estimate the actual expenses that you paid over the period. The ”Ending Account Value“ shown is derived from the fund‘s actual return, and the third column shows the dollar amount that would have been paid by an investor who started with $1,000 in the fund. You may use the information here, together with the amount you invested, to estimate the expenses that you paid over the period.
To do so, simply divide your account value by $1,000 (for example, an $8,600 account value divided by $1,000 = 8.6), then multiply the result by the number given for your fund under the heading ”Expenses Paid During Period.“
• Based on hypothetical 5% yearly return. This section is intended to help you compare your fund‘s costs with those of other mutual funds. It assumes that the fund had a yearly return of 5% before expenses, but that the expense ratio is unchanged. In this case—because the return used is not the fund’s actual return—the results do not apply to your investment. The example is useful in making comparisons because the Securities and Exchange Commission requires all mutual funds to calculate expenses based on a 5% return. You can assess your fund’s costs by comparing this hypothetical example with the hypothetical examples that appear in shareholder reports of other funds.
Note that the expenses shown in the table are meant to highlight and help you compare ongoing costs only and do not reflect transaction costs incurred by the fund for buying and selling securities. Further, the expenses do not include any purchase, redemption, or account service fees described in the fund prospectus. If such fees were applied to your account, your costs would be higher. Your fund does not carry a “sales load.”
The calculations assume no shares were bought or sold during the period. Your actual costs may have been higher or lower, depending on the amount of your investment and the timing of any purchases or redemptions.
You can find more information about the fund’s expenses, including annual expense ratios, in the Financial Statements section of this report. For additional information on operating expenses and other shareholder costs, please refer to your fund’s current prospectus.
25
| | | |
| Six Months Ended September 30, 2016 | | | |
| | Beginning | Ending | Expenses |
| | Account Value | Account Value | Paid During |
| Strategic Small-Cap Equity Fund | 3/31/2016 | 9/30/2016 | Period |
| Based on Actual Fund Return | $1,000.00 | $1,076.69 | $1.40 |
| Based on Hypothetical 5% Yearly Return | 1,000.00 | 1,023.65 | 1.37 |
The calculations are based on expenses incurred in the most recent six-month period. The fund’s annualized six-month expense ratio for that
period is 0.27%. The dollar amounts shown as “Expenses Paid” are equal to the annualized expense ratio multiplied by the average account
value over the period, multiplied by the number of days in the most recent six-month period, then divided by the number of days in the most
recent 12-month period (183/366).
26
Glossary
30-Day SEC Yield. A fund’s 30-day SEC yield is derived using a formula specified by the U.S. Securities and Exchange Commission. Under the formula, data related to the fund’s security holdings in the previous 30 days are used to calculate the fund’s hypothetical net income for that period, which is then annualized and divided by the fund’s estimated average net assets over the calculation period. For the purposes of this calculation, a security’s income is based on its current market yield to maturity (for bonds), its actual income (for asset-backed securities), or its projected dividend yield (for stocks). Because the SEC yield represents hypothetical annualized income, it will differ—at times significantly—from the fund’s actual experience. As a result, the fund’s income distributions may be higher or lower than implied by the SEC yield.
Beta. A measure of the magnitude of a fund’s past share-price fluctuations in relation to the ups and downs of a given market index. The index is assigned a beta of 1.00. Compared with a given index, a fund with a beta of 1.20 typically would have seen its share price rise or fall by 12% when the index rose or fell by 10%. For this report, beta is based on returns over the past 36 months for both the fund and the index. Note that a fund’s beta should be reviewed in conjunction with its R-squared (see definition). The lower the R-squared, the less correlation there is between the fund and the index, and the less reliable beta is as an indicator of volatility.
Dividend Yield. Dividend income earned by stocks, expressed as a percentage of the aggregate market value (or of net asset value, for a fund). The yield is determined by dividing the amount of the annual dividends by the aggregate value (or net asset value) at the end of the period. For a fund, the dividend yield is based solely on stock holdings and does not include any income produced by other investments.
Earnings Growth Rate. The average annual rate of growth in earnings over the past five years for the stocks now in a fund.
Equity Exposure. A measure that reflects a fund’s investments in stocks and stock futures. Any holdings in short-term reserves are excluded.
Expense Ratio. A fund’s total annual operating expenses expressed as a percentage of the fund’s average net assets. The expense ratio includes management and administrative expenses, but does not include the transaction costs of buying and selling portfolio securities.
Foreign Holdings. The percentage of a fund represented by securities or depositary receipts of companies based outside the United States.
Inception Date. The date on which the assets of a fund (or one of its share classes) are first invested in accordance with the fund’s investment objective. For funds with a subscription period, the inception date is the day after that period ends. Investment performance is measured from the inception date.
Median Market Cap. An indicator of the size of companies in which a fund invests; the midpoint of market capitalization (market price x shares outstanding) of a fund’s stocks, weighted by the proportion of the fund’s assets invested in each stock. Stocks representing half of the fund’s assets have market capitalizations above the median, and the rest are below it.
Price/Book Ratio. The share price of a stock divided by its net worth, or book value, per share. For a fund, the weighted average price/book ratio of the stocks it holds.
27
Price/Earnings Ratio. The ratio of a stock’s current price to its per-share earnings over the past year. For a fund, the weighted average P/E of the stocks it holds. P/E is an indicator of market expectations about corporate prospects; the higher the P/E, the greater the expectations for a company’s future growth.
R-Squared. A measure of how much of a fund’s past returns can be explained by the returns from the market in general, as measured by a given index. If a fund’s total returns were precisely synchronized with an index’s returns, its R-squared would be 1.00. If the fund’s returns bore no relationship to the index’s returns, its R-squared would be 0. For this report, R-squared is based on returns over the past 36 months for both the fund and the index.
Return on Equity. The annual average rate of return generated by a company during the past five years for each dollar of shareholder’s equity (net income divided by shareholder’s equity). For a fund, the weighted average return on equity for the companies whose stocks it holds.
Short-Term Reserves. The percentage of a fund invested in highly liquid, short-term securities that can be readily converted to cash.
Turnover Rate. An indication of the fund’s trading activity. Funds with high turnover rates incur higher transaction costs and may be more likely to distribute capital gains (which may be taxable to investors). The turnover rate excludes in-kind transactions, which have minimal impact on costs.
28
This page intentionally left blank.
This page intentionally left blank.
This page intentionally left blank.
The People Who Govern Your Fund
The trustees of your mutual fund are there to see that the fund is operated and managed in your best interests since, as a shareholder, you are a part owner of the fund. Your fund’s trustees also serve on the board of directors of The Vanguard Group, Inc., which is owned by the Vanguard funds and provides services to them on an at-cost basis.
A majority of Vanguard’s board members are independent, meaning that they have no affiliation with Vanguard or the funds they oversee, apart from the sizable personal investments they have made as private individuals. The independent board members have distinguished backgrounds in business, academia, and public service. Each of the trustees and executive officers oversees 198 Vanguard funds.
The following table provides information for each trustee and executive officer of the fund. The mailing address of the trustees and officers is P.O. Box 876, Valley Forge, PA 19482. More information about the trustees is in the Statement of Additional Information, which can be obtained, without charge, by contacting Vanguard at 800-662-7447, or online at vanguard.com.
|
| InterestedTrustee1 |
| F. William McNabb III |
| Born 1957. Trustee Since July 2009. Chairman of |
| the Board. Principal Occupation(s) During the Past |
| Five Years and Other Experience: Chairman of the |
| Board of The Vanguard Group, Inc., and of each of |
| the investment companies served by The Vanguard |
| Group, since January 2010; Director of The Vanguard |
| Group since 2008; Chief Executive Officer and |
| President of The Vanguard Group, and of each of |
| the investment companies served by The Vanguard |
| Group, since 2008; Director of Vanguard Marketing |
| Corporation; Managing Director of The Vanguard |
| Group (1995–2008). |
| |
| IndependentTrustees |
| Emerson U. Fullwood |
| Born 1948. Trustee Since January 2008. Principal |
| Occupation(s) During the Past Five Years and Other |
| Experience: Executive Chief Staff and Marketing |
| Officer for North America and Corporate Vice President |
| (retired 2008) of Xerox Corporation (document manage- |
| ment products and services); Executive in Residence |
| and 2009–2010 Distinguished Minett Professor at |
| the Rochester Institute of Technology; Lead Director |
| of SPX FLOW, Inc. (multi-industry manufacturing); |
| Director of the United Way of Rochester, the University |
| of Rochester Medical Center, Monroe Community |
| College Foundation, North Carolina A&T University, |
| and Roberts Wesleyan College. |
|
| Rajiv L. Gupta |
| Born 1945. Trustee Since December 2001.2 Principal |
| Occupation(s) During the Past Five Years and Other |
| Experience: Chairman and Chief Executive Officer |
| (retired 2009) and President (2006–2008) of |
| Rohm and Haas Co. (chemicals); Director of Tyco |
| International plc (diversified manufacturing and |
| services), HP Inc. (printer and personal computer |
| manufacturing), and Delphi Automotive plc |
| (automotive components); Senior Advisor at |
| New Mountain Capital. |
Amy Gutmann |
| Born 1949. Trustee Since June 2006. Principal |
| Occupation(s) During the Past Five Years and |
| Other Experience: President of the University of |
| Pennsylvania; Christopher H. Browne Distinguished |
| Professor of Political Science, School of Arts and |
| Sciences, and Professor of Communication, Annenberg |
| School for Communication, with secondary faculty |
| appointments in the Department of Philosophy, School |
| of Arts and Sciences, and at the Graduate School of |
| Education, University of Pennsylvania; Trustee of the |
| National Constitution Center; Chair of the Presidential |
| Commission for the Study of Bioethical Issues. |
JoAnn Heffernan Heisen |
| Born 1950. Trustee Since July 1998. Principal |
| Occupation(s) During the Past Five Years and |
| Other Experience: Corporate Vice President and |
| Chief Global Diversity Officer (retired 2008) and |
| Member of the Executive Committee (1997–2008) |
| of Johnson & Johnson (pharmaceuticals/medical |
| devices/consumer products); Director of Skytop |
| Lodge Corporation (hotels) and the Robert Wood |
| Johnson Foundation; Member of the Advisory |
| Board of the Institute for Women’s Leadership |
| at Rutgers University. |
|
| F. Joseph Loughrey |
| Born 1949. Trustee Since October 2009. Principal |
| Occupation(s) During the Past Five Years and Other |
| Experience: President and Chief Operating Officer |
| (retired 2009) of Cummins Inc. (industrial machinery); |
| Chairman of the Board of Hillenbrand, Inc. (specialized |
| consumer services), and of Oxfam America; Director |
| of SKF AB (industrial machinery), Hyster-Yale Materials |
| Handling, Inc. (forklift trucks), the Lumina Foundation |
| for Education, and the V Foundation for Cancer |
| Research; Member of the Advisory Council for the |
| College of Arts and Letters and of the Advisory Board |
| to the Kellogg Institute for International Studies, both |
| at the University of Notre Dame. |
Mark Loughridge |
| Born 1953. Trustee Since March 2012. Principal |
| Occupation(s) During the Past Five Years and Other |
| Experience: Senior Vice President and Chief Financial |
| Officer (retired 2013) at IBM (information technology |
| services); Fiduciary Member of IBM’s Retirement Plan |
| Committee (2004–2013); Director of the Dow Chemical |
| Company; Member of the Council on Chicago Booth. |
Scott C. Malpass |
| Born 1962. Trustee Since March 2012. Principal |
| Occupation(s) During the Past Five Years and Other |
| Experience: Chief Investment Officer and Vice |
| President at the University of Notre Dame; Assistant |
| Professor of Finance at the Mendoza College of |
| Business at Notre Dame; Member of the Notre Dame |
| 403(b) Investment Committee, the Board of Advisors |
| for Spruceview Capital Partners, and the Investment |
| Advisory Committee of Major League Baseball; Board |
| Member of TIFF Advisory Services, Inc., and Catholic |
| Investment Services, Inc. (investment advisors). |
André F. Perold |
| Born 1952. Trustee Since December 2004. Principal |
| Occupation(s) During the Past Five Years and Other |
| Experience: George Gund Professor of Finance and |
| Banking, Emeritus at the Harvard Business School |
| (retired 2011); Chief Investment Officer and Managing |
| Partner of HighVista Strategies LLC (private investment |
| firm); Director of Rand Merchant Bank; Overseer of |
| the Museum of Fine Arts Boston. |
Peter F. Volanakis |
| Born 1955. Trustee Since July 2009. Principal |
| Occupation(s) During the Past Five Years and |
| Other Experience: President and Chief Operating |
| Officer (retired 2010) of Corning Incorporated |
| (communications equipment); Chairman of the |
| Board of Trustees of Colby-Sawyer College; |
| Member of the Advisory Board of the Norris |
| Cotton Cancer Center. |
| |
| Executive Officers | |
| Glenn Booraem | |
| Born 1967. Treasurer Since May 2015. Principal |
| Occupation(s) During the Past Five Years and |
| Other Experience: Principal of The Vanguard Group, |
| Inc.; Treasurer of each of the investment companies |
| served by The Vanguard Group; Controller of each of |
| the investment companies served by The Vanguard |
| Group (2010–2015); Assistant Controller of each of |
| the investment companies served by The Vanguard |
| Group (2001–2010). | |
Thomas J. Higgins | |
| Born 1957. Chief Financial Officer Since September |
| 2008. Principal Occupation(s) During the Past Five |
| Years and Other Experience: Principal of The Vanguard |
| Group, Inc.; Chief Financial Officer of each of the |
| investment companies served by The Vanguard Group; |
| Treasurer of each of the investment companies served |
| by The Vanguard Group (1998–2008). |
Peter Mahoney | |
| Born 1974. Controller Since May 2015. Principal |
| Occupation(s) During the Past Five Years and Other |
| Experience: Head of Global Fund Accounting at The |
| Vanguard Group, Inc.; Controller of each of the invest- |
| ment companies served by The Vanguard Group; |
| Head of International Fund Services at The Vanguard |
| Group (2008–2014). | |
Anne E. Robinson | |
| Born 1970. Secretary Since September 2016. Principal |
| Occupation(s) During the Past Five Years and Other |
| Experience: Managing Director of The Vanguard Group, |
| Inc.; General Counsel of The Vanguard Group; Secretary |
| of The Vanguard Group and of each of the investment |
| companies served by The Vanguard Group; Director |
| and Senior Vice President of Vanguard Marketing |
| Corporation; Managing Director and General Counsel |
| of Global Cards and Consumer Services at Citigroup |
| (2014–2016); Counsel at American Express (2003–2014). |
| |
| Vanguard Senior ManagementTeam |
| Mortimer J. Buckley | James M. Norris |
| Kathleen C. Gubanich | Thomas M. Rampulla |
| Martha G. King | Glenn W. Reed |
| John T. Marcante | Karin A. Risi |
| Chris D. McIsaac | Michael Rollings |
| |
| Chairman Emeritus and Senior Advisor |
| John J. Brennan | |
| Chairman, 1996–2009 | |
| Chief Executive Officer and President, 1996–2008 |
| |
| Founder | |
| John C. Bogle | |
| Chairman and Chief Executive Officer, 1974–1996 |
1 Mr. McNabb is considered an “interested person,” as defined in the Investment Company Act of 1940, because he is an officer of the Vanguard funds.
2 December 2002 for Vanguard Equity Income Fund, the Vanguard Municipal Bond Funds, and the Vanguard State Tax-Exempt Funds.
|  |
| | P.O. Box 2600 |
| | Valley Forge, PA 19482-2600 |
| |
| |
| |
| Connect with Vanguard® > vanguard.com |
| |
| |
| |
| Fund Information > 800-662-7447 | CFA® is a registered trademark owned by CFA Institute. |
| Direct Investor Account Services > 800-662-2739 | |
| Institutional Investor Services > 800-523-1036 | |
| Text Telephone for People | |
| Who Are Deaf or Hard of Hearing> 800-749-7273 | |
| |
| This material may be used in conjunction | |
| with the offering of shares of any Vanguard | |
| fund only if preceded or accompanied by | |
| the fund’s current prospectus. | |
| |
| All comparative mutual fund data are from Lipper, a | |
| Thomson Reuters Company, or Morningstar, Inc., unless | |
| otherwise noted. | |
| |
| You can obtain a free copy of Vanguard’s proxy voting | |
| guidelines by visiting vanguard.com/proxyreporting or by | |
| calling Vanguard at 800-662-2739. The guidelines are | |
| also available from the SEC’s website, sec.gov. In | |
| addition, you may obtain a free report on how your fund | |
| voted the proxies for securities it owned during the 12 | |
| months ended June 30. To get the report, visit either | |
| vanguard.com/proxyreporting or sec.gov. | |
| |
| You can review and copy information about your fund at | |
| the SEC’s Public Reference Room in Washington, D.C. To | |
| find out more about this public service, call the SEC at | |
| 202-551-8090. Information about your fund is also | |
| available on the SEC’s website, and you can receive | |
| copies of this information, for a fee, by sending a | |
| request in either of two ways: via email addressed to | |
| publicinfo@sec.gov or via regular mail addressed to the | |
| Public Reference Section, Securities and Exchange | |
| Commission, Washington, DC 20549-1520. | |
| |
| | © 2016 The Vanguard Group, Inc. |
| | All rights reserved. |
| | Vanguard Marketing Corporation, Distributor. |
| |
| | Q6150 112016 |

Annual Report | September 30, 2016
Vanguard Global Equity Fund
A new format, unwavering commitment
As you begin reading this report, you’ll notice that we’ve made some improvements to the opening sections—based on feedback from you, our clients.
Page 1 starts with a new ”Your Fund’s Performance at a Glance,” a concise, handy summary of how your fund performed during the period.
In the renamed ”Chairman’s Perspective,” Bill McNabb will focus on enduring principles and investment insights.
We’ve modified some tables, and eliminated some redundancy, but we haven’t removed any information.
At Vanguard, we’re always looking for better ways to communicate and to help you make sound investment decisions. Thank you for entrusting your assets to us.
| |
| Contents | |
| Your Fund’s Performance at a Glance. | 1 |
| Chairman’s Perspective. | 3 |
| Advisors’ Report. | 6 |
| Fund Profile. | 11 |
| Performance Summary. | 13 |
| Financial Statements. | 15 |
| Your Fund’s After-Tax Returns. | 32 |
| About Your Fund’s Expenses. | 33 |
| Glossary. | 35 |
Please note: The opinions expressed in this report are just that—informed opinions. They should not be considered promises or advice.
Also, please keep in mind that the information and opinions cover the period through the date on the front of this report. Of course, the
risks of investing in your fund are spelled out in the prospectus.
See the Glossary for definitions of investment terms used in this report.
About the cover: No matter what language you speak, Vanguard has one consistent message and set of principles. Our primary
focus is on you, our clients. We conduct our business with integrity as a faithful steward of your assets. This message is shown
translated into seven languages, reflecting our expanding global presence.
Your Fund’s Performance at a Glance
• The fund returned more than 12% for the 12 months ended September 30, 2016.
It bested its benchmark’s 11.96% return and the 10.44% average return of its peers.
• The advisors’ selections in emerging markets (+29%) were the leading outperformers versus the benchmark. Among countries, the fund’s U.S. stocks (+12%) were the most notable underperformers.
• Nine of the ten industry sectors represented in the fund during the entire 12 months posted positive results. Information technology (+31%) posted the highest return and made the most significant contribution to the fund’s outperformance.
• Real estate was one of the best-performing financial subsectors as investors favored the steady income from real estate investment trusts. Effective September 1, the index provider designated real estate as a separate sector, the 11th in the benchmark.
• The fund’s average annual return for the ten years ended September 30, 2016, exceeded that of its benchmark index and its peer group.
| |
| Total Returns: Fiscal Year Ended September 30, 2016 | |
| | Total |
| | Returns |
| Vanguard Global Equity Fund | 12.11% |
| MSCI All Country World Index | 11.96 |
| Global Funds Average | 10.44 |
| Global Funds Average: Derived from data provided by Lipper, a Thomson Reuters Company. |
| |
| Total Returns: Ten Years Ended September 30, 2016 | |
| | Average |
| | Annual Return |
| Global Equity Fund | 4.51% |
| Spliced Global Equity Index | 4.36 |
| Global Funds Average | 3.99 |
| For a benchmark description, see the Glossary. |
| Global Funds Average: Derived from data provided by Lipper, a Thomson Reuters Company. |
The figures shown represent past performance, which is not a guarantee of future results. (Current performance may be
lower or higher than the performance data cited. For performance data current to the most recent month-end, visit our
website at vanguard.com/performance.) Note, too, that both investment returns and principal value can fluctuate widely, so
an investor’s shares, when sold, could be worth more or less than their original cost.
1
| | |
| Expense Ratios | | |
| Your Fund Compared With Its Peer Group | | |
| | | Peer Group |
| | Fund | Average |
| Global Equity Fund | 0.57% | 1.27% |
The fund expense ratio shown is from the prospectus dated January 28, 2016, and represents estimated costs for the current fiscal year. For
the fiscal year ended September 30, 2016, the fund’s expense ratio was 0.51%. This decrease from the estimated expense ratio reflects a
performance-based investment advisory fee adjustment. When the performance adjustment is positive, the fund’s expenses increase; when it
is negative, expenses decrease. The peer-group expense ratio is derived from data provided by Lipper, a Thomson Reuters Company, and
captures information through year-end 2015.
Peer group: Global Funds.
2
Chairman’s Perspective

Bill McNabb
Chairman and Chief Executive Officer
Dear Shareholder,
If you think you’ve had reason to feel uneasy about the investment environment lately, you’re not imagining things. In just the past few months, we’ve seen economic uncertainty, intense political polarization, and super-low bond yields. Yet at the same time, the stock market kept pushing higher.
In this confusing and sometimes contradictory climate, you may be asking yourself a question that I hear often: How do I make sense of all this, keep investing, and still get a good night’s sleep?
As with any problem, there are multiple ways to go at it. But there’s one approach in particular that is simple, straightforward, and nearly foolproof: Save more money. Not only can saving more give you a greater sense of control over your investment plan, it can help compensate for long-term returns that, in our estimation, could fall short of historical averages.
I love the way one of our investment pros put it. Fran Kinniry this summer told The Wall Street Journal, “Investing is always a partnership between you and the markets.” He explained that the markets carried more than their fair share of the weight for a couple of decades, through the 1990s, providing outsized returns that made the investor’s half of the partnership relatively light work. “But now you are going to have to be the majority partner.”
Sobering? Sure. Hopeless? Definitely not.
3
Over the 12 months since last September, U.S. stocks returned 15%, though the rise has not been a one-way ticket straight up. International markets have also posted strong returns, but lower than those of the broad U.S. market. The decision by United Kingdom voters in June to exit the European Union came as a surprise but caused market heartburn for only a few days.
In fixed income, yields remained extremely low—about 1.60% on the 10-year U.S. Treasury note at the end of September, after dipping below 1.40% over the summer. And bond yields in some international markets were negative.
Even this relatively small window of time illustrates a truism of the financial markets: There will always be segments that perform well and others that don’t. Saving more saves you from trying to control the uncontrollable—how economies and the markets perform. And it keeps you in control of one of the most vital parts of your investment program.
Although the “save more” logic is easy to grasp, it’s not always easy to follow. Bills, illness, the loss of a job—these can affect any of us.
But whatever our circumstances, figuring out how to save more is worth the effort. It requires that we make difficult decisions to forgo some consumption today to increase the likelihood of consuming (or consuming more) in the future. This is the very heart of investing. Sacrifices are never fun, so consider carrying them out systematically and in doses that you
| | | |
| Market Barometer | | | |
| | Average Annual Total Returns |
| | Periods Ended September 30, 2016 |
| | One | Three | Five |
| | Year | Years | Years |
| Stocks | | | |
| Russell 1000 Index (Large-caps) | 14.93% | 10.78% | 16.41% |
| Russell 2000 Index (Small-caps) | 15.47 | 6.71 | 15.82 |
| Russell 3000 Index (Broad U.S. market) | 14.96 | 10.44 | 16.36 |
| FTSE All-World ex US Index (International) | 9.62 | 0.71 | 6.50 |
| |
| Bonds | | | |
| Bloomberg Barclays U.S. Aggregate Bond Index | | | |
| (Broad taxable market) | 5.19% | 4.03% | 3.08% |
| Bloomberg Barclays Municipal Bond Index | | | |
| (Broad tax-exempt market) | 5.58 | 5.54 | 4.48 |
| Citigroup Three-Month U.S. Treasury Bill Index | 0.20 | 0.06 | 0.06 |
| |
| CPI | | | |
| Consumer Price Index | 1.46% | 1.03% | 1.25% |
4
can be comfortable with—for instance, gradually getting up to the max in your IRA, or adding a percentage point or so to the amount you stash in your employer’s retirement plan. As a point of reference, we generally suggest that investors strive for a retirement savings rate of 12%–15%, including any employer contributions.
If you need more convincing about the wisdom of the “save more” course of action, it might be helpful to examine your alternatives. This list is by no means exhaustive, but it hits on a few of the big ones, and none are without risk.
• Reach for yield. With yields so low on many types of bonds, it’s tempting to find the corners of the fixed income market where payouts are juicier. But with the juice comes considerable risk. You need to be aware that you’d be taking on more risk—and how much more.
• Go all-in on a hot-performing asset class or fund. By now, you know better than that, right?
• Sit tight. This approach isn’t a terrible idea; it’s better than panicking and deciding to just “do something,” particularly if that means changing your approach in response to the market’s movements.
Here’s the inescapably challenging part of your partnership with the markets: In the short run, your “partner” is fickle, emotional, and wildly unpredictable. But in the long run, your partner is mostly rational and extremely helpful.
The best way to minimize your vulnerability to the market’s mood swings, and to maximize the benefit of your partner’s longer-term strengths, is to expect less and save more. Maybe the markets will deliver better-than-expected returns. Maybe they’ll be consistent with our more modest expectations. In either case, a higher savings rate can help put you in a better position to reach your goals.
As always, thank you for investing with Vanguard.
Sincerely,

F. William McNabb III
Chairman and Chief Executive Officer
October 18, 2016
5
Advisors’ Report
For the fiscal year ended September 30, 2016, Vanguard Global Equity Fund returned 12.11%, outpacing its benchmark index and the average return of its peers. Your fund is managed by three independent advisors, a strategy that enhances the fund’s diversification by providing exposure to distinct yet complementary investment approaches. It’s not uncommon for different advisors to have different views about individual securities or the broader investment environment.
The advisors, the amount and percentage of fund assets each manages, and brief descriptions of their investment strategies are presented in the table below. Each advisor has also prepared a discussion of the investment environment that existed during the year and its effect on portfolio positioning. These comments were prepared on October 21, 2016.
| | | |
| Vanguard Global Equity Fund Investment Advisors | |
| |
| | Fund Assets Managed | |
| Investment Advisor | % | $ Million | Investment Strategy |
| Baillie Gifford Overseas Ltd. | 33 | 1,469 | A long-term, active, bottom-up investment approach is |
| | | | used to identify companies that can generate |
| | | | above-average growth in earnings and cash flow. |
| Acadian Asset Management LLC | 32 | 1,467 | A quantitative, active, bottom-up investment process |
| | | | that combines stock and peer-group valuation to arrive |
| | | | at a return forecast for each of more than 35,000 |
| | | | securities in the global universe. |
| Marathon Asset Management | 32 | 1,455 | A long-term and contrarian investment philosophy and |
| LLP | | | process with a focus on industry capital cycle analysis |
| | | | and in-depth management assessment. |
| Cash Investments | 3 | 124 | These short-term reserves are invested by Vanguard in |
| | | | equity index products to simulate investment in stocks. |
| | | | Each advisor may also maintain a modest cash |
| | | | position. |
6
Baillie Gifford Overseas Ltd.
Portfolio Managers:
Charles Plowden,
Joint Senior Partner and
Lead Portfolio Manager
Spencer Adair, CFA,
Partner and Investment Manager,
Global Alpha Strategy
Malcolm MacColl,
Partner and Investment Manager,
Global Alpha Strategy
Although investors in global stock markets have been rewarded by rising share prices over the past 12 months, a rise in volatility has also reminded us that patience is a virtue. In early 2016, markets fell on concerns about a Chinese economic slowdown and its impact on global growth. However, as the year progressed sentiment improved, driven by a recognition that the global economy has continued to grow steadily. While the United Kingdom’s decision to leave the European Union triggered another fall in markets at the end of June, that decline was short-lived, and share prices rose toward the end of the reporting period.
Against this backdrop, stock selection helped our results. Several technology businesses contributed strongly. Amazon stood out, as both its e-commerce and its cloud computing businesses are growing rapidly. Elsewhere, Chinese e-commerce firm Alibaba, Naspers (media conglomerate with a large holding in Chinese social media platform Tencent), and Yandex (Russian search engine) are all also delivering impressive growth. As share prices rise, we reassess investments to determine if their new, higher prices are justified. These technology platforms remain attractive to us as long-term growth investors; they are relatively capital-light and can dominate their chosen markets.
Our enthusiasm for technology platforms has led us to research this area more broadly, both to review existing investments and to look for new opportunities. Consequently, we purchased Ctrip (Chinese travel website) and LINE (Japanese social media platform) and sold eBay and Twitter, both of which were failing to deliver operationally.
We also took advantage of stock market volatility to make some modest changes. Most recently, following the United Kingdom’s vote to leave the European Union, we trimmed our positions in Ryanair (Europe’s low-cost airline) and CRH (construction materials, mainly for the U.S. market). Europe is a key market for both companies, and we think further political uncertainty there could lead to weaker demand. We also added to our stake in Prudential. Although the life insurer is based in the United Kingdom,
7
the majority of its new business profits are from Asian markets with considerable potential for long-term growth. Portfolio turnover remains low, consistent with our long-term approach.
Political uncertainty—particularly around upcoming elections in the United States and Europe—will distract many over the coming weeks and months. We remain focused on finding exceptional individual companies in which to invest, and we remain optimistic about our ability to add value in years to come.
Acadian Asset Management LLC
Portfolio Managers:
John R. Chisholm, CFA,
Executive Vice President and
Chief Investment Officer
Brendan O. Bradley, Ph.D.,
Senior Vice President and
Director of Portfolio Management
Global equities notched solid returns for the year ended September 30, 2016, as gains early and late in the period helped buffer losses in the middle. As 2015 drew to a close, an October rally offset declines fueled by geopolitical worries, disappointing signals from the European Central Bank and the Bank of Japan, uncertainty over the Fed’s next move, and continued weakness in energy prices. In December, market reaction to the Federal Reserve’s first rate hike in over nine years was mixed. Volatility returned to global financial markets at the start of 2016, with steep declines amid renewed worries about growth, particularly in China and other emerging markets; plunging oil prices; and already weak inflation around the world. Indications of a more cautious stance from the Fed, ramifications from energy weakness, and a banking sector under mounting pressures helped solidify a “risk-off” tone.
Global equities regained some ground heading into the second quarter of 2016, helped mainly by more stable oil prices, the Fed’s decision to leave interest rates on hold, and cautious optimism about global growth. Although the unexpected outcome of the Brexit vote in late June led to a sharp sell-off and a spike in volatility, global equities steadily recovered through the third quarter. Even as a number of macroeconomic developments remained in flux—particularly around the direction of oil prices and the potential for divergent central bank policies—the final three months of the period were tranquil overall.
We focused on attractively valued stocks that appeared likely to rise in price based on earnings data, price characteristics, and various measures of company quality. Based on bottom-up stock selection, the portfolio was overweighted relative to the benchmark in markets including Canada,
8
Taiwan, the United States, and South Korea. We were underweighted in the United Kingdom, France, and Switzerland. Our sector allocations focused on health care, energy, and information technology, and were light in consumer discretionary, financials, and materials.
Underperformance at the stock level was partially offset by some positive returns from country allocations. Our U.S. selections, particularly within energy, detracted most. Industrials (notably airlines) also lagged. Our selections in Japan and South Korea added some value. From a country allocation standpoint, underweights to the United Kingdom, Switzerland, and France helped most.
In terms of sectors, our overweighting of information technology and consumer discretionary added relative value.
Marathon Asset Management LLP
Portfolio Managers:
Neil M. Ostrer,
Co-Head of Global Equity
William J. Arah,
Co-Head of Global Equity
In a period rife with market-moving news, including the surprising result of the Brexit referendum, strong stock selection helped our results most. Overall currency positions resulting from stock selection also contributed positively. Regional allocation, on the other hand, hurt results.
More specifically, stock selection was a positive contributor across every region of the portfolio except Japan. The portfolio’s overweight exposure to Japan and its underweight to the United States pushed down performance. In terms of currency effects, the stronger Japanese yen boosted performance while the weaker British pound detracted from it.
At the stock level, Linear Technology contributed most, helped by its acquisition by Analog Devices, and Texas Instruments rose on positive sentiment for analog semiconductors. Several blue-chip companies also contributed, including Johnson & Johnson and Procter & Gamble. McDonald’s continued to trend upwards on turnaround efforts by new management. Canadian Natural Resources rallied. European wind turbine manufacturer Vestas continued to benefit from improved margins and demand for green power. Not owning scandal-ridden Valeant Pharmaceuticals also helped results
Both valuations and profit margins remain high in North America. The U.S. economy continues to be resilient, with low unemployment and healthy consumer confidence. There are also signs of wage growth picking up. There has been little aggregate earnings growth, however, thanks to the headwinds of a strong dollar, persistent weakness in the industrial and energy sectors, and disruptive competition in the retail and media segments.
9
Despite persistent hesitancy from the Federal Reserve, interest rates seem set to rise in the near term, and asset prices seem vulnerable to correction. Uncertainty around the upcoming presidential election may be a negative catalyst. There is, however, an acknowledgment that this seems to be the consensus view, and it is possible that markets will continue to climb this wall of worry. Investor hopes for a continuation of the bull market are now shifting away from central bank policy toward fiscal stimulus and a potential recovery in capital spending—but equity markets may need to move lower before they make progress.
Over the coming months, the outlook for European markets will be influenced not only by the progress of Brexit negotiations but also by a series of important European political events, including the Italian referendum and the French and German elections. The European Central Bank and the Bank of England remain accommodative, while the U.S. and Chinese economies are likely to have a positive impact. In addition, earnings reports were, on balance, fairly upbeat, with a majority beating expectations.
10
Global Equity Fund
Fund Profile
As of September 30, 2016
| | |
| Portfolio Characteristics | | |
| | | MSCI All |
| | | Country |
| | Fund | World Index |
| Number of Stocks | 1,045 | 2,461 |
| Median Market Cap | $20.1B | $45.4B |
| Price/Earnings Ratio | 22.2x | 22.0x |
| Price/Book Ratio | 2.3x | 2.1x |
| Return on Equity | 15.8% | 16.2% |
| Earnings Growth | | |
| Rate | 7.8% | 7.0% |
| Dividend Yield | 1.9% | 2.5% |
| Turnover Rate | 45% | — |
| Ticker Symbol | VHGEX | — |
| Expense Ratio1 | 0.57% | — |
| Short-Term Reserves | 1.4% | — |
| | |
| Sector Diversification (% of equity exposure) |
| | | MSCI All |
| | | Country |
| | Fund | World Index |
| Consumer Discretionary | 13.3% | 12.3% |
| Consumer Staples | 10.1 | 10.4 |
| Energy | 4.9 | 6.9 |
| Financials | 17.9 | 16.9 |
| Health Care | 11.1 | 11.7 |
| Industrials | 12.0 | 10.4 |
| Information Technology | 20.4 | 15.8 |
| Materials | 4.4 | 5.1 |
| Real Estate | 1.7 | 3.4 |
| Telecommunication Services | 2.9 | 3.8 |
| Utilities | 1.3 | 3.3 |
| |
| Volatility Measures | |
| | MSCI All |
| | Country |
| | World Index |
| R-Squared | 0.96 |
| Beta | 0.95 |
| These measures show the degree and timing of the fund’s |
| fluctuations compared with the index over 36 months. |
| | |
| Ten Largest Holdings (% of total net assets) |
| Amazon.com Inc. | Internet & Direct | |
| | Marketing Retail | 2.3% |
| Samsung Electronics Co. Technology | |
| Ltd. | Hardware, Storage & | |
| | Peripherals | 1.6 |
| Procter & Gamble Co. | Household Products | 1.2 |
| Alphabet Inc. | Internet Software & | |
| | Services | 1.2 |
| Naspers Ltd. | Cable & Satellite | 1.1 |
| Taiwan Semiconductor | | |
| Manufacturing Co. Ltd. | Semiconductors | 1.0 |
| Prudential plc | Life & Health | |
| | Insurance | 1.0 |
| Coca-Cola Co. | Soft Drinks | 1.0 |
| Apple Inc. | Technology | |
| | Hardware, Storage & | |
| | Peripherals | 0.9 |
| Royal Caribbean Cruises | Hotels, Resorts & | |
| Ltd. | Cruise Lines | 0.9 |
| Top Ten | | 12.2% |
| The holdings listed exclude any temporary cash investments and equity index products. |
Allocation by Region (% of equity exposure)

1 The expense ratio shown is from the prospectus dated January 28, 2016, and represents estimated costs for the current fiscal year. For the fiscal
year ended September 30, 2016, the expense ratio was 0.51%.
11
Global Equity Fund
| | |
| Market Diversification (% of equity exposure) |
| | | MSCI All |
| | | Country |
| | | World |
| | Fund | Index |
| Europe | | |
| United Kingdom | 6.7% | 6.3% |
| Germany | 2.8 | 3.0 |
| Switzerland | 2.3 | 3.0 |
| Ireland | 1.5 | 0.2 |
| Sweden | 1.4 | 0.9 |
| France | 1.3 | 3.2 |
| Denmark | 1.3 | 0.6 |
| Other | 3.7 | 3.9 |
| Subtotal | 21.0% | 21.1% |
| Pacific | | |
| Japan | 9.1% | 7.9% |
| South Korea | 2.8 | 1.6 |
| Australia | 1.6 | 2.4 |
| Hong Kong | 1.4 | 1.2 |
| Other | 0.5 | 0.5 |
| Subtotal | 15.4% | 13.6% |
| Emerging Markets | | |
| Taiwan | 2.8% | 1.3% |
| China | 2.7 | 3.0 |
| South Africa | 1.6 | 0.8 |
| India | 1.1 | 0.9 |
| Other | 3.1 | 3.1 |
| Subtotal | 11.3% | 9.1% |
| North America | | |
| United States | 49.0% | 52.7% |
| Canada | 3.2 | 3.2 |
| Subtotal | 52.2% | 55.9% |
| Middle East | | |
| Other | 0.1% | 0.2% |
| Other | 0.0% | 0.1% |
12
Global Equity Fund
Performance Summary
All of the returns in this report represent past performance, which is not a guarantee of future results that may be achieved by the fund. (Current performance may be lower or higher than the performance data cited. For performance data current to the most recent month-end, visit our website at vanguard.com/performance.) Note, too, that both investment returns and principal value can fluctuate widely, so an investor’s shares, when sold, could be worth more or less than their original cost. The returns shown do not reflect taxes that a shareholder would pay on fund distributions or on the sale of fund shares.
Cumulative Performance: September 30, 2006, Through September 30, 2016
Initial Investment of $10,000
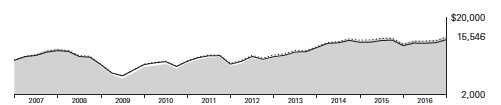
| | | | |
| | Average Annual Total Returns | |
| | Periods Ended September 30, 2016 | |
| | | | | Final Value |
| | One | Five | Ten | of a $10,000 |
| | Year | Years | Years | Investment |
| Global Equity Fund | 12.11% | 12.54% | 4.51% | $15,546 |
| |
| •••••••• Global Spliced Funds Global Average Equity Index | 10.44 11.96 | 10.25 10.63 | 3.99 4.36 | 14,782 15,325 |
| For a benchmark description, see the Glossary. |
| Global Funds Average: Derived from data provided by Lipper, a Thomson Reuters Company. |
See Financial Highlights for dividend and capital gains information.
13
Global Equity Fund
Fiscal-Year Total Returns (%): September 30, 2006, Through September 30, 2016

For a benchmark description, see the Glossary.
14
Global Equity Fund
Financial Statements
Statement of Net Assets—Investments Summary
As of September 30, 2016
This Statement summarizes the fund’s holdings by asset type. Details are reported for each of the fund’s 50 largest individual holdings and for investments that, in total for any issuer, represent more than 1% of the fund’s net assets. The total value of smaller holdings is reported as a single amount within each category.
The fund reports a complete list of its holdings in regulatory filings four times in each fiscal year, at the quarter-ends. For the second and fourth fiscal quarters, the complete listing of the fund’s holdings is available electronically on vanguard.com and on the Securities and Exchange Commission’s website (sec.gov), or you can have it mailed to you without charge by calling 800-662-7447. For the first and third fiscal quarters, the fund files the lists with the SEC on Form N-Q. Shareholders can look up the fund’s Forms N-Q on the SEC’s website. Forms N-Q may also be reviewed and copied at the SEC’s Public Reference Room (see the back cover of this report for further information).
| | | |
| | | Market | Percentage |
| | | Value• | of Net |
| | Shares | ($000) | Assets |
| Common Stocks | | | |
| Australia † | | 65,903 | 1.5% |
| Austria † | | 2,760 | 0.1% |
| Belgium † | | 6,879 | 0.2% |
| Brazil † | | 31,832 | 0.7% |
| Canada † | | 143,650 | 3.2% |
| Chile † | | 11,593 | 0.3% |
| China | | | |
| * Alibaba Group Holding Ltd. ADR | 264,258 | 27,956 | 0.6% |
| * Baidu Inc. ADR | 112,357 | 20,457 | 0.5% |
| China—Other † | | 69,310 | 1.5% |
| | | 117,723 | 2.6% |
| Colombia † | | 2,374 | 0.1% |
| Cyprus † | | 236 | 0.0% |
| Czech Republic † | | 474 | 0.0% |
| Denmark † | | 56,109 | 1.2% |
| Finland † | | 25,068 | 0.6% |
| France † | | 53,119 | 1.2% |
15
| | | |
| Global Equity Fund | | | |
| |
| |
| | | Market | Percentage |
| | | Value• | of Net |
| | Shares | ($000) | Assets |
| Germany | | | |
| SAP SE | 429,798 | 39,107 | 0.9% |
| Germany—Other † | | 78,816 | 1.7% |
| | | 117,923 | 2.6% |
| Greece † | | 2,141 | 0.0% |
| Hong Kong | | | |
| AIA Group Ltd. | 3,784,000 | 25,353 | 0.6% |
| Hong Kong—Other † | | 37,364 | 0.8% |
| | | 62,717 | 1.4% |
| Hungary † | | 373 | 0.0% |
| India † | | 46,720 | 1.0% |
| Indonesia † | | 8,188 | 0.2% |
| Ireland | | | |
| CRH plc | 942,597 | 31,256 | 0.7% |
| Ireland—Other † | | 33,853 | 0.7% |
| | | 65,109 | 1.4% |
| Israel † | | 3,755 | 0.1% |
| |
| 1Italy † | | 21,064 | 0.5% |
| Japan | | | |
| MS&AD Insurance Group Holdings Inc. | 1,133,400 | 31,618 | 0.7% |
| Daito Trust Construction Co. Ltd. | 145,500 | 23,253 | 0.5% |
| Japan—Other † | | 340,318 | 7.6% |
| | | 395,189 | 8.8% |
| Luxembourg † | | 2,395 | 0.1% |
| Malaysia † | | 22,013 | 0.5% |
| Mexico † | | 4,857 | 0.1% |
| Netherlands | | | |
| Unilever NV | 476,652 | 21,988 | 0.5% |
| Netherlands—Other † | | 17,258 | 0.4% |
| | | 39,246 | 0.9% |
| New Zealand † | | 1,425 | 0.0% |
| Norway † | | 29,073 | 0.6% |
| Other | | | |
| 2 Vanguard FTSE Emerging Markets ETF | 421,149 | 15,848 | 0.4% |
| Peru † | | 1,143 | 0.0% |
| Philippines † | | 1,688 | 0.0% |
16
| | | |
| Global Equity Fund | | | |
| |
| |
| |
| | | Market | Percentage |
| | | Value• | of Net |
| | Shares | ($000) | Assets |
| Poland † | | 1,937 | 0.0% |
| |
| Qatar † | | 1,921 | 0.0% |
| |
| Russia † | | 33,759 | 0.7% |
| |
| Singapore † | | 20,627 | 0.5% |
| |
| South Africa | | | |
| Naspers Ltd. | 282,364 | 48,936 | 1.1% |
| South Africa—Other † | | 20,946 | 0.4% |
| | | 69,882 | 1.5% |
| South Korea | | | |
| Samsung Electronics Co. Ltd. | 33,578 | 48,938 | 1.1% |
| Samsung Electronics Co. Ltd. GDR | 32,887 | 23,682 | 0.5% |
| South Korea—Other † | | 52,083 | 1.2% |
| | | 124,703 | 2.8% |
| |
| Spain † | | 26,838 | 0.6% |
| |
| Sweden | | | |
| Svenska Handelsbanken AB Class A | 1,768,064 | 24,280 | 0.5% |
| Sweden—Other † | | 35,961 | 0.8% |
| | | 60,241 | 1.3% |
| Switzerland | | | |
| Nestle SA | 324,871 | 25,598 | 0.6% |
| Switzerland—Other † | | 78,383 | 1.7% |
| | | 103,981 | 2.3% |
| Taiwan | | | |
| Taiwan Semiconductor Manufacturing Co. Ltd. ADR | 1,356,486 | 41,495 | 0.9% |
| Hon Hai Precision Industry Co. Ltd. | 11,148,717 | 28,226 | 0.6% |
| Chunghwa Telecom Co. Ltd. | 5,644,000 | 19,921 | 0.5% |
| Taiwan Semiconductor Manufacturing Co. Ltd. | 789,577 | 4,631 | 0.1% |
| Taiwan—Other † | | 28,872 | 0.6% |
| | | 123,145 | 2.7% |
| |
| Thailand † | | 6,559 | 0.1% |
| |
| Turkey † | | 7,316 | 0.2% |
| |
| United Kingdom | | | |
| Prudential plc | 2,536,608 | 45,021 | 1.0% |
| Reckitt Benckiser Group plc | 221,853 | 20,907 | 0.5% |
| Royal Dutch Shell plc Class A | 791,410 | 19,800 | 0.4% |
| 1 United Kingdom—Other † | | 203,316 | 4.5% |
| | | 289,044 | 6.4% |
| United States | | | |
| Consumer Discretionary | | | |
| * Amazon.com Inc. | 125,698 | 105,248 | 2.3% |
| Royal Caribbean Cruises Ltd. | 549,584 | 41,191 | 0.9% |
| * CarMax Inc. | 406,640 | 21,694 | 0.5% |
| Consumer Discretionary—Other † | | 123,434 | 2.8% |
| | | 291,567 | 6.5% |
17
| | | |
| Global Equity Fund | | | |
| |
| |
| |
| | | Market | Percentage |
| | | Value• | of Net |
| | Shares | ($000) | Assets |
| Consumer Staples | | | |
| Procter & Gamble Co. | 615,340 | 55,227 | 1.2% |
| Coca-Cola Co. | 1,051,531 | 44,501 | 1.0% |
| Colgate-Palmolive Co. | 437,656 | 32,448 | 0.7% |
| PepsiCo Inc. | 277,980 | 30,236 | 0.7% |
| Consumer Staples—Other † | | 87,631 | 1.9% |
| | | 250,043 | 5.5% |
| Energy | | | |
| Exxon Mobil Corp. | 396,117 | 34,573 | 0.8% |
| Apache Corp. | 325,185 | 20,770 | 0.5% |
| EOG Resources Inc. | 211,202 | 20,425 | 0.4% |
| Energy—Other † | | 20,726 | 0.4% |
| | | 96,494 | 2.1% |
| Financials | | | |
| * Berkshire Hathaway Inc. Class B | 268,568 | 38,800 | 0.9% |
| First Republic Bank | 423,434 | 32,651 | 0.7% |
| * Markel Corp. | 34,304 | 31,860 | 0.7% |
| Moody’s Corp. | 279,879 | 30,305 | 0.7% |
| TD Ameritrade Holding Corp. | 741,980 | 26,147 | 0.6% |
| Wells Fargo & Co. | 510,039 | 22,585 | 0.5% |
| Financials—Other † | | 174,097 | 3.8% |
| | | 356,445 | 7.9% |
| Health Care | | | |
| Johnson & Johnson | 259,146 | 30,613 | 0.7% |
| * Waters Corp. | 173,914 | 27,564 | 0.6% |
| Anthem Inc. | 208,861 | 26,172 | 0.6% |
| * Mettler-Toledo International Inc. | 57,107 | 23,975 | 0.5% |
| * WellCare Health Plans Inc. | 193,900 | 22,704 | 0.5% |
| Health Care—Other † | | 241,809 | 5.4% |
| | | 372,837 | 8.3% |
| |
| Industrials † | | 147,130 | 3.3% |
| |
| Information Technology | | | |
| * Alphabet Inc. Class C | 57,929 | 45,028 | 1.0% |
| Apple Inc. | 366,170 | 41,395 | 0.9% |
| Microsoft Corp. | 653,918 | 37,666 | 0.8% |
| * Facebook Inc. Class A | 276,942 | 35,523 | 0.8% |
| Intel Corp. | 641,298 | 24,209 | 0.5% |
| Visa Inc. Class A | 269,925 | 22,323 | 0.5% |
| Linear Technology Corp. | 363,301 | 21,540 | 0.5% |
| Mastercard Inc. | 199,029 | 20,255 | 0.5% |
| * Alphabet Inc. Class A | 11,994 | 9,644 | 0.2% |
| Information Technology—Other † | | 221,005 | 4.9% |
| | | 478,588 | 10.6% |
| Materials | | | |
| Martin Marietta Materials Inc. | 114,290 | 20,470 | 0.4% |
| Materials—Other † | | 44,930 | 1.0% |
| | | 65,400 | 1.4% |
| |
| Other † | | — | 0.0% |
| |
| Real Estate † | | 21,148 | 0.5% |
18
| | | | | | |
| Global Equity Fund | | | | | |
| |
| |
| |
| | | | | | Market | Percentage |
| | | | | | Value• | of Net |
| | | | | Shares | ($000) | Assets |
| Telecommunication Services | | | | | |
| | AT&T Inc. | | | 776,150 | 31,520 | 0.7% |
| | Telecommunication Services—Other † | | | 2,210 | 0.0% |
| | | | | | 33,730 | 0.7% |
| | | | | | 2,113,382 | 46.8% |
| Total Common Stocks (Cost $3,762,084) | | | 4,341,922 | 96.2%3 |
| |
| | | Coupon | | | | |
| Temporary Cash Investments | | | | | |
| Money Market Fund | | | | | |
| 4,5 Vanguard Market Liquidity Fund | 0.640% | | 1,793,806 | 179,399 | 4.0% |
| |
| | | | | Face | | |
| | | | Maturity | Amount | | |
| | | | Date | ($000) | | |
| U.S. Government and Agency Obligations | | | | |
| 6 | United States Treasury Bill | 0.281%–0.300% | 12/15/16– | | | |
| | | | 12/22/16 | 1,500 | 1,499 | 0.0% |
| 6 | U.S. Government and | | | | | |
| | Agency Obligations—Other † | | | | 5,600 | 0.1% |
| | | | | | 7,099 | 0.1% |
| Total Temporary Cash Investments (Cost $186,494) | | | 186,498 | 4.1%3 |
| 7Total Investments (Cost $3,948,578) | | | 4,528,420 | 100.3% |
| |
| | | | | | Amount | |
| | | | | | ($000) | |
| Other Assets and Liabilities | | | | | |
| Other Assets | | | | | |
| Investment in Vanguard | | | | 337 | |
| Receivables for Investment Securities Sold | | | 4,894 | |
| Receivables for Accrued Income | | | | 10,767 | |
| Receivables for Capital Shares Issued | | | 1,898 | |
| Other Assets6 | | | | 12,854 | |
| Total Other Assets | | | | 30,750 | 0.7% |
| Liabilities | | | | | |
| Payables for Investment Securities Purchased | | | (6,137) | |
| Collateral for Securities on Loan | | | | (21,355) | |
| Payables to Investment Advisor | | | | (3,081) | |
| Payables for Capital Shares Redeemed | | | (1,904) | |
| Payables to Vanguard | | | | (7,908) | |
| Other Liabilities | | | | (3,338) | |
| Total Liabilities | | | | (43,723) | (1.0%) |
| Net Assets | | | | 4,515,447 | 100.0% |
| Applicable to 179,337,922 outstanding $.001 par value shares of | | | |
| beneficial interest (unlimited authorization) | | | | 4,515,447 |
| Net Asset Value Per Share | | | | | $25.18 |
19
| |
| Global Equity Fund | |
| |
| |
| |
| At September 30, 2016, net assets consisted of: | |
| | Amount |
| | ($000) |
| Paid-in Capital | 4,210,222 |
| Undistributed Net Investment Income | 41,358 |
| Accumulated Net Realized Losses | (317,086) |
| Unrealized Appreciation (Depreciation) | |
| Investment Securities | 579,842 |
| Futures Contracts | 1,557 |
| Forward Currency Contracts | (140) |
| Foreign Currencies | (306) |
| Net Assets | 4,515,447 |
• See Note A in Notes to Financial Statements.
* Non-income-producing security.
† Represents the aggregate value, by category, of securities that are not among the 50 largest holdings and, in total for any issuer, represent
1% or less of net assets.
1 Certain of the fund’s securities are exempt from registration under Rule 144A of the Securities Act of 1933. Such securities may be sold
in transactions exempt from registration, normally to qualified institutional buyers. At September 30, 2016, the aggregate value of these
securities was $5,177,000, representing 0.1% of net assets.
2 Considered an affiliated company of the fund as the issuer is another member of The Vanguard Group.
3 The fund invests a portion of its cash reserves in equity markets through the use of index futures contracts. After giving effect to futures
investments, the fund’s effective common stock and temporary cash investment positions represent 98.4% and 1.9%, respectively,
of net assets.
4 Affiliated money market fund available only to Vanguard funds and certain trusts and accounts managed by Vanguard. Rate shown is the
7-day yield.
5 Includes $21,355,000 of collateral received for securities on loan.
6 Securities with a value of $5,899,000 and cash of $2,613,000 have been segregated as initial margin for open futures contracts.
7 The total value of securities on loan is $19,743,000.
ADR—American Depositary Receipt.
GDR—Global Depositary Receipt.
See accompanying Notes, which are an integral part of the Financial Statements.
20
Global Equity Fund
Statement of Operations
| |
| | Year Ended |
| | September 30, 2016 |
| | ($000) |
| Investment Income | |
| Income | |
| Dividends1,2 | 88,032 |
| Interest2 | 677 |
| Securities Lending—Net | 1,990 |
| Total Income | 90,699 |
| Expenses | |
| Investment Advisory Fees—Note B | |
| Basic Fee | 10,369 |
| Performance Adjustment | 2,004 |
| The Vanguard Group—Note C | |
| Management and Administrative | 8,247 |
| Marketing and Distribution | 634 |
| Custodian Fees | 472 |
| Auditing Fees | 46 |
| Shareholders’ Reports | 61 |
| Trustees’ Fees and Expenses | 6 |
| Total Expenses | 21,839 |
| Net Investment Income | 68,860 |
| Realized Net Gain (Loss) | |
| Investment Securities Sold2 | 47,882 |
| Futures Contracts | 4,795 |
| Foreign Currencies and Forward Currency Contracts | 1,212 |
| Realized Net Gain (Loss) | 53,889 |
| Change in Unrealized Appreciation (Depreciation) | |
| Investment Securities | 365,038 |
| Futures Contracts | 3,059 |
| Foreign Currencies and Forward Currency Contracts | 308 |
| Change in Unrealized Appreciation (Depreciation) | 368,405 |
| Net Increase (Decrease) in Net Assets Resulting from Operations | 491,154 |
| 1 Dividends are net of foreign withholding taxes of $3,925,000. |
| 2 Dividend income, interest income, and realized net gain (loss) from affiliated companies of the fund were $424,000, $626,000, and |
| $4,000, respectively. |
See accompanying Notes, which are an integral part of the Financial Statements.
21
Global Equity Fund
Statement of Changes in Net Assets
| | |
| | Year Ended September 30, |
| | 2016 | 2015 |
| | ($000) | ($000) |
| Increase (Decrease) in Net Assets | | |
| Operations | | |
| Net Investment Income | 68,860 | 67,373 |
| Realized Net Gain (Loss) | 53,889 | 237,228 |
| Change in Unrealized Appreciation (Depreciation) | 368,405 | (475,371) |
| Net Increase (Decrease) in Net Assets Resulting from Operations | 491,154 | (170,770) |
| Distributions | | |
| Net Investment Income | (72,900) | (69,095) |
| Realized Capital Gain | — | — |
| Total Distributions | (72,900) | (69,095) |
| Capital Share Transactions | | |
| Issued | 475,200 | 435,287 |
| Issued in Lieu of Cash Distributions | 68,287 | 65,332 |
| Redeemed | (589,795) | (648,717) |
| Net Increase (Decrease) from Capital Share Transactions | (46,308) | (148,098) |
| Total Increase (Decrease) | 371,946 | (387,963) |
| Net Assets | | |
| Beginning of Period | 4,143,501 | 4,531,464 |
| End of Period1 | 4,515,447 | 4,143,501 |
| 1 Net Assets—End of Period includes undistributed (overdistributed) net investment income of $41,358,000 and $42,018,000. |
See accompanying Notes, which are an integral part of the Financial Statements.
22
Global Equity Fund
Financial Highlights
| | | | | |
| For a Share Outstanding | Year Ended September 30, |
| Throughout Each Period | 2016 | 2015 | 2014 | 2013 | 2012 |
| Net Asset Value, Beginning of Period | $22.85 | $24.19 | $21.94 | $18.21 | $15.24 |
| Investment Operations | | | | | |
| Net Investment Income | .385 | .373 | .353 | .342 | .320 |
| Net Realized and Unrealized Gain (Loss) | | | | | |
| on Investments | 2.350 | (1.338) | 2.255 | 3.730 | 3.012 |
| Total from Investment Operations | 2.735 | (.965) | 2.608 | 4.072 | 3.332 |
| Distributions | | | | | |
| Dividends from Net Investment Income | (. 405) | (. 375) | (. 358) | (. 342) | (. 362) |
| Distributions from Realized Capital Gains | — | — | — | — | — |
| Total Distributions | (. 405) | (. 375) | (. 358) | (. 342) | (. 362) |
| Net Asset Value, End of Period | $25.18 | $22.85 | $24.19 | $21.94 | $18.21 |
| |
| Total Return1 | 12.11% | -4.09% | 11.95% | 22.72% | 22.20% |
| |
| Ratios/Supplemental Data | | | | | |
| Net Assets, End of Period (Millions) | $4,515 | $4,144 | $4,531 | $4,499 | $3,853 |
| Ratio of Total Expenses to Average Net Assets2 | 0.51% | 0.57% | 0.61% | 0.61% | 0.57% |
| Ratio of Net Investment Income to | | | | | |
| Average Net Assets | 1.61% | 1.49% | 1.45% | 1.69% | 1.82% |
| Portfolio Turnover Rate | 45% | 36% | 45% | 70% | 67% |
| 1 Total returns do not include account service fees that may have applied in the periods shown. Fund prospectuses provide information about |
| any applicable account service fees. |
| 2 Includes performance-based investment advisory fee increases (decreases) of 0.05%, 0.08%, 0.08%, 0.07%, and 0.02%. |
See accompanying Notes, which are an integral part of the Financial Statements.
23
Global Equity Fund
Notes to Financial Statements
Vanguard Global Equity Fund is registered under the Investment Company Act of 1940 as an open-end investment company, or mutual fund. The fund invests in securities of foreign issuers, which may subject it to investment risks not normally associated with investing in securities of U.S. corporations.
A. The following significant accounting policies conform to generally accepted accounting principles for U.S. investment companies. The fund consistently follows such policies in preparing its financial statements.
1. Security Valuation: Securities are valued as of the close of trading on the New York Stock Exchange (generally 4 p.m., Eastern time) on the valuation date. Equity securities are valued at the latest quoted sales prices or official closing prices taken from the primary market in which each security trades; such securities not traded on the valuation date are valued at the mean of the latest quoted bid and asked prices. Securities for which market quotations are not readily available, or whose values have been affected by events occurring before the fund’s pricing time but after the close of the securities’ primary markets, are valued at their fair values calculated according to procedures adopted by the board of trustees. These procedures include obtaining quotations from an independent pricing service, monitoring news to identify significant market- or security-specific events, and evaluating changes in the values of foreign market proxies (for example, ADRs, futures contracts, or exchange-traded funds), between the time the foreign markets close and the fund’s pricing time. When fair-value pricing is employed, the prices of securities used by a fund to calculate its net asset value may differ from quoted or published prices for the same securities. Investments in Vanguard Market Liquidity Fund are valued at that fund’s net asset value. Temporary cash investments acquired over 60 days to maturity are valued using the latest bid prices or using valuations based on a matrix system (which considers such factors as security prices, yields, maturities, and ratings), both as furnished by independent pricing services. Other temporary cash investments are valued at amortized cost, which approximates market value.
2. Foreign Currency: Securities and other assets and liabilities denominated in foreign currencies are translated into U.S. dollars using exchange rates obtained from an independent third party as of the fund’s pricing time on the valuation date. Realized gains (losses) and unrealized appreciation (depreciation) on investment securities include the effects of changes in exchange rates since the securities were purchased, combined with the effects of changes in security prices. Fluctuations in the value of other assets and liabilities resulting from changes in exchange rates are recorded as unrealized foreign currency gains (losses) until the assets or liabilities are settled in cash, at which time they are recorded as realized foreign currency gains (losses).
3. Futures and Forward Currency Contracts: The fund uses index futures contracts to a limited extent, with the objective of maintaining full exposure to the stock market while maintaining liquidity. The fund may purchase or sell futures contracts to achieve a desired level of investment, whether to accommodate portfolio turnover or cash flows from capital share transactions. The primary risks associated with the use of futures contracts are imperfect correlation between changes in market values of stocks held by the fund and the prices of futures contracts, and the possibility of an illiquid market. Counterparty risk involving futures is mitigated because a regulated clearinghouse is the counterparty instead of the clearing broker. To further mitigate counterparty risk, the fund trades futures contracts on an exchange, monitors the financial strength of its clearing brokers and clearing-
24
Global Equity Fund
house, and has entered into clearing agreements with its clearing brokers. The clearinghouse imposes initial margin requirements to secure the fund’s performance and requires daily settlement of variation margin representing changes in the market value of each contract.
The fund enters into forward currency contracts to provide the appropriate currency exposure related to any open futures contracts or to protect the value of securities and related receivables and payables against changes in foreign exchange rates. The fund’s risks in using these contracts include movement in the values of the foreign currencies relative to the U.S. dollar and the ability of the counterparties to fulfill their obligations under the contracts. The fund mitigates its counterparty risk by entering into forward currency contracts only with a diverse group of prequalified counterparties, monitoring their financial strength, entering into master netting arrangements with its counterparties, and requiring its counterparties to transfer collateral as security for their performance. In the absence of a default, the collateral pledged or received by the fund cannot be repledged, resold or rehypothecated. The master netting arrangements provide that, in the event of a counterparty’s default (including bankruptcy), the fund may terminate the forward currency contracts, determine the net amount owed by either party in accordance with its master netting arrangements, and sell or retain any collateral held up to the net amount owed to the fund under the master netting arrangements. The forward currency contracts contain provisions whereby a counterparty may terminate open contracts if the fund’s net assets decline below a certain level, triggering a payment by the fund if the fund is in a net liability position at the time of the termination. The payment amount would be reduced by any collateral the fund has pledged. Any assets pledged as collateral for open contracts are noted in the Statement of Net Assets. The value of collateral received or pledged is compared daily to the value of the forward currency contracts exposure with each counterparty, and any difference, if in excess of a specified minimum transfer amount, is adjusted and settled within two business days.
Futures contracts are valued at their quoted daily settlement prices. Forward currency contracts are valued at their quoted daily prices obtained from an independent third party, adjusted for currency risk based on the expiration date of each contract. The aggregate settlement values and notional amounts of the contracts are not recorded in the Statement of Net Assets. Fluctuations in the value of the contracts are recorded in the Statement of Net Assets as an asset (liability) and in the Statement of Operations as unrealized appreciation (depreciation) until the contracts are closed, when they are recorded as realized gains (losses) on futures or forward currency contracts.
During the year ended September 30, 2016, the fund’s average investments in long and short futures contracts represented 2% and 0% of net assets, respectively, based on the average of aggregate settlement values at each quarter-end during the period. The fund’s average investment in forward currency contracts represented 1% of net assets, based on the average of notional amounts at each quarter-end during the period.
4. Federal Income Taxes: The fund intends to continue to qualify as a regulated investment company and distribute all of its taxable income. Management has analyzed the fund’s tax positions taken for all open federal income tax years (September 30, 2013–2016), and has concluded that no provision for federal income tax is required in the fund’s financial statements.
5. Distributions: Distributions to shareholders are recorded on the ex-dividend date.
25
Global Equity Fund
6. Securities Lending: To earn additional income, the fund lends its securities to qualified institutional borrowers. Security loans are subject to termination by the fund at any time, and are required to be secured at all times by collateral in an amount at least equal to the market value of securities loaned. Daily market fluctuations could cause the value of loaned securities to be more or less than the value of the collateral received. When this occurs, the collateral is adjusted and settled on the next business day. The fund further mitigates its counterparty risk by entering into securities lending transactions only with a diverse group of prequalified counterparties, monitoring their financial strength, and entering into master securities lending agreements with its counterparties. The master securities lending agreements provide that, in the event of a counterparty’s default (including bankruptcy), the fund may terminate any loans with that borrower, determine the net amount owed, and sell or retain the collateral up to the net amount owed to the fund; however, such actions may be subject to legal proceedings. While collateral mitigates counterparty risk, in the absence of a default the fund may experience delays and costs in recovering the securities loaned. The fund invests cash collateral received in Vanguard Market Liquidity Fund, and records a liability in the Statement of Net Assets for the return of the collateral, during the period the securities are on loan. Securities lending income represents fees charged to borrowers plus income earned on invested cash collateral, less expenses associated with the loan. During the term of the loan, the fund is entitled to all distributions made on or in respect of the loaned securities.
7. Credit Facility: The fund and certain other funds managed by The Vanguard Group (“Vanguard”) participate in a $3.1 billion committed credit facility provided by a syndicate of lenders pursuant to a credit agreement that may be renewed annually; each fund is individually liable for its borrowings, if any, under the credit facility. Borrowings may be utilized for temporary and emergency purposes, and are subject to the fund’s regulatory and contractual borrowing restrictions. The participating funds are charged administrative fees and an annual commitment fee of 0.10% of the undrawn amount of the facility; these fees are allocated to the funds based on a method approved by the fund’s board of trustees and included in Management and Administrative expenses on the fund’s Statement of Operations. Any borrowings under this facility bear interest at a rate based upon the higher of the one-month London Interbank Offered Rate, federal funds effective rate, or overnight bank funding rate plus an agreed-upon spread.
The fund had no borrowings outstanding at September 30, 2016, or at any time during the period then ended.
8. Other: Dividend income is recorded on the ex-dividend date. Interest income includes income distributions received from Vanguard Market Liquidity Fund and is accrued daily. Premiums and discounts on debt securities purchased are amortized and accreted, respectively, to interest income over the lives of the respective securities. Security transactions are accounted for on the date securities are bought or sold. Costs used to determine realized gains (losses) on the sale of investment securities are those of the specific securities sold.
B. The investment advisory firms Baillie Gifford Overseas Ltd., Acadian Asset Management LLC, and Marathon Asset Management LLP each provide investment advisory services to a portion of the fund for a fee calculated at an annual percentage rate of average net assets managed by the advisor. The basic fees of Baillie Gifford Overseas Ltd., Acadian Asset Management LLC, and Marathon Asset Management LLP are subject to quarterly adjustments based on performance relative to the MSCI All Country World Index for the preceding three years.
26
Global Equity Fund
Vanguard manages the cash reserves of the fund as described below.
For the year ended September 30, 2016, the aggregate investment advisory fee represented an effective annual basic rate of 0.24% of the fund’s average net assets, before an increase of $2,004,000 (0.05%) based on performance.
C. In accordance with the terms of a Funds’ Service Agreement (the “FSA”) between Vanguard and the fund, Vanguard furnishes to the fund corporate management, administrative, marketing, distribution, and cash management services at Vanguard’s cost of operations (as defined by the FSA). These costs of operations are allocated to the fund based on methods and guidelines approved by the board of trustees. Vanguard does not require reimbursement in the current period for certain costs of operations (such as deferred compensation/benefits and risk/insurance costs); the fund’s liability for these costs of operations is included in Payables to Vanguard on the Statement of Net Assets.
Upon the request of Vanguard, the fund may invest up to 0.40% of its net assets as capital in Vanguard. At September 30, 2016, the fund had contributed to Vanguard capital in the amount of $337,000, representing 0.01% of the fund’s net assets and 0.13% of Vanguard’s capitalization. The fund’s trustees and officers are also directors and employees, respectively, of Vanguard.
D. Various inputs may be used to determine the value of the fund’s investments. These inputs are summarized in three broad levels for financial statement purposes. The inputs or methodologies used to value securities are not necessarily an indication of the risk associated with investing in those securities.
Level 1—Quoted prices in active markets for identical securities.
Level 2—Other significant observable inputs (including quoted prices for similar securities, interest rates, prepayment speeds, credit risk, etc.).
Level 3—Significant unobservable inputs (including the fund’s own assumptions used to determine the fair value of investments).
The following table summarizes the market value of the fund’s investments as of September 30, 2016, based on the inputs used to value them:
| | | |
| | Level 1 | Level 2 | Level 3 |
| Investments | ($000) | ($000) | ($000) |
| Common Stocks—International | 391,656 | 1,836,884 | — |
| Common Stocks—United States | 2,113,382 | — | — |
| Temporary Cash Investments | 179,399 | 7,099 | — |
| Futures Contracts—Assets1 | 438 | — | — |
| Futures Contracts—Liabilities1 | (202) | — | — |
| Forward Currency Contracts—Assets | — | 296 | — |
| Forward Currency Contracts—Liabilities | — | (436) | — |
| Total | 2,684,673 | 1,843,843 | — |
| 1 Represents variation margin on the last day of the reporting period. |
27
Global Equity Fund
E. At September 30, 2016, the fair values of derivatives were reflected in the Statement of Net Assets as follows:
| | | |
| | | Foreign | |
| | Equity | Exchange | |
| | Contracts | Contracts | Total |
| Statement of Net Assets Caption | ($000) | ($000) | ($000) |
| Other Assets | 438 | 296 | 734 |
| Other Liabilities | (202) | (436) | (638) |
Realized net gain (loss) and the change in unrealized appreciation (depreciation) on derivatives for the year ended September 30, 2016, were:
| | | |
| | | Foreign | |
| | Equity | Exchange | |
| | Contracts | Contracts | Total |
| Realized Net Gain (Loss) on Derivatives | ($000) | ($000) | ($000) |
| Futures Contracts | 4,795 | — | 4,795 |
| Forward Currency Contracts | — | 401 | 401 |
| Realized Net Gain (Loss) on Derivatives | 4,795 | 401 | 5,196 |
| |
| Change in Unrealized Appreciation (Depreciation) on Derivatives | | | |
| Futures Contracts | 3,059 | — | 3,059 |
| Forward Currency Contracts | — | 230 | 230 |
| Change in Unrealized Appreciation (Depreciation) on Derivatives | 3,059 | 230 | 3,289 |
At September 30, 2016, the aggregate settlement value of open futures contracts and the related unrealized appreciation (depreciation) were:
| | | | |
| | | | ($000) |
| | | | Aggregate | |
| | | Number of | Settlement | Unrealized |
| | | Long (Short) | Value Long | Appreciation |
| Futures Contracts | Expiration | Contracts | (Short) | (Depreciation) |
| E-mini S&P 500 Index | December 2016 | 618 | 66,756 | 872 |
| Dow Jones EURO STOXX 50 Index | December 2016 | 469 | 15,780 | 173 |
| Topix Index | December 2016 | 63 | 8,231 | 83 |
| FTSE 100 Index | December 2016 | 89 | 7,928 | 259 |
| S&P ASX 200 Index | December 2016 | 41 | 4,248 | 170 |
| | | | | 1,557 |
Unrealized appreciation (depreciation) on open E-mini S&P 500 Index, Dow Jones EURO STOXX 50 Index, and FTSE 100 Index futures contracts is required to be treated as realized gain (loss) for tax purposes.
28
Global Equity Fund
At September 30, 2016, the fund had open forward currency contracts to receive and deliver currencies as follows. Unrealized appreciation (depreciation) on open forward currency contracts is treated as realized gain (loss) for tax purposes.
| | | | | | |
| | | | | | | Unrealized |
| | Contract | | | | | Appreciation |
| | | | | | |
| | Settlement | Contract Amount (000) | (Depreciation) |
| Counterparty | Date | | Receive | | Deliver | ($000) |
| The Toronto-Dominion Bank | 12/21/16 | EUR | 11,304 | USD | 12,759 | (10) |
| Barclays Bank plc | 12/21/16 | EUR | 8,428 | USD | 9,516 | (10) |
| BNP Paribas | 12/13/16 | JPY | 735,489 | USD | 7,213 | 64 |
| JPMorgan Chase Bank, N.A. | 12/20/16 | AUD | 8,449 | USD | 6,292 | 162 |
| Bank of America, N.A. | 12/21/16 | GBP | 4,556 | USD | 6,098 | (181) |
| Barclays Bank plc | 12/13/16 | JPY | 521,200 | USD | 5,108 | 49 |
| Goldman Sachs International | 12/21/16 | GBP | 3,712 | USD | 4,934 | (114) |
| JPMorgan Chase Bank, N.A. | 12/21/16 | GBP | 556 | USD | 743 | (21) |
| BNP Paribas | 12/21/16 | EUR | 634 | USD | 715 | — |
| Barclays Bank plc | 12/21/16 | USD | 7,115 | EUR | 6,343 | (39) |
| Citibank, N.A. | 12/13/16 | USD | 4,090 | JPY | 415,200 | (19) |
| Goldman Sachs International | 12/21/16 | USD | 3,831 | GBP | 2,934 | 21 |
| Barclays Bank plc | 12/20/16 | USD | 1,881 | AUD | 2,503 | (31) |
| JPMorgan Chase Bank, N.A. | 12/20/16 | USD | 493 | AUD | 659 | (11) |
| | | | | | | (140) |
| AUD—Australian dollar. |
| EUR—Euro. |
| GBP—British pound. |
| JPY—Japanese yen. |
| USD—U.S. dollar. |
F. Distributions are determined on a tax basis and may differ from net investment income and realized capital gains for financial reporting purposes. Differences may be permanent or temporary. Permanent differences are reclassified among capital accounts in the financial statements to reflect their tax character. Temporary differences arise when certain items of income, expense, gain, or loss are recognized in different periods for financial statement and tax purposes. These differences will reverse at some time in the future. Differences in classification may also result from the treatment of short-term gains as ordinary income for tax purposes.
During the year ended September 30, 2016, the fund realized net foreign currency gains of $811,000, which increased distributable net income for tax purposes; accordingly, such gains have been reclassified from accumulated net realized losses to undistributed net investment income. Certain of the fund’s investments are in securities considered to be passive foreign investment companies, for which any unrealized appreciation and/or realized gains are required to be included in distributable net income for tax purposes. During the year ended September 30, 2016, the fund realized gains on the
29
Global Equity Fund
sale of passive foreign investment companies of $2,733,000, which have been included in current and prior periods’ taxable income; accordingly, such gains have been reclassified from accumulated net realized losses to undistributed net investment income. Passive foreign investment companies held at September 30, 2016, had unrealized appreciation of $6,930,000, all of which has been distributed and is reflected in the balance of undistributed net investment income.
The fund realized gains on the sale of securities that were subject to capital gains tax in certain foreign countries. Capital gains taxes reduce realized gains for financial statement purposes but are treated as an expense for tax purposes. Accordingly, $164,000 of capital gains tax has been reclassified from accumulated net realized losses to undistributed net investment income.
For tax purposes, at September 30, 2016, the fund had $56,823,000 of ordinary income available for distribution. The fund used capital loss carryforwards of $53,120,000 to offset taxable capital gains realized during the year ended September 30, 2016. At September 30, 2016, the fund had available capital losses totaling $316,665,000 to offset future net capital gains. Of this amount, $293,404,000 is subject to expiration on September 30, 2018. Capital losses of $23,261,000 realized beginning in fiscal 2012 may be carried forward indefinitely under the Regulated Investment Company Modernization Act of 2010, but must be used before any expiring loss carryforwards.
At September 30, 2016, the cost of investment securities for tax purposes was $3,955,722,000. Net unrealized appreciation of investment securities for tax purposes was $572,698,000, consisting of unrealized gains of $812,230,000 on securities that had risen in value since their purchase and $239,532,000 in unrealized losses on securities that had fallen in value since their purchase.
G. During the year ended September 30, 2016, the fund purchased $1,861,365,000 of investment securities and sold $1,920,866,000 of investment securities, other than temporary cash investments.
H. Capital shares issued and redeemed were:
| | |
| | Year Ended September 30, |
| | 2016 | 2015 |
| | Shares | Shares |
| | (000) | (000) |
| Issued | 19,970 | 17,696 |
| Issued in Lieu of Cash Distributions | 2,933 | 2,678 |
| Redeemed | (24,908) | (26,391) |
| Net Increase (Decrease) in Shares Outstanding | (2,005) | (6,017) |
I. Management has determined that no material events or transactions occurred subsequent
to September 30, 2016, that would require recognition or disclosure in these financial statement.
30
Report of Independent Registered
Public Accounting Firm
To the Board of Trustees of Vanguard Horizon Funds and the Shareholders of Vanguard Global Equity Fund:
In our opinion, the accompanying statement of net assets—investment summary and the related statements of operations and of changes in net assets and the financial highlights present fairly, in all material respects, the financial position of Vanguard Global Equity Fund (constituting a separate portfolio of Vanguard Horizon Funds, hereafter referred to as the “Fund”) at September 30, 2016, the results of its operations for the year then ended, the changes in its net assets for each of the two years in the period then ended, and the financial highlights for each of the five years in the period then ended, in conformity with accounting principles generally accepted in the United States of America. These financial statements and financial highlights (hereafter referred to as “financial statements”) are the responsibility of the Fund’s management. Our responsibility is to express an opinion on these financial statements based on our audits. We conducted our audits of these financial statements in accordance with the standards of the Public Company Accounting Oversight Board (United States). Those standards require that we plan and perform the audit to obtain reasonable assurance about whether the financial statements are free of material misstatement. An audit includes examining, on a test basis, evidence supporting the amounts and disclosures in the financial statements, assessing the accounting principles used and significant estimates made by management, and evaluating the overall financial statement presentation. We believe that our audits, which included confirmation of securities at September 30, 2016 by correspondence with the custodian and brokers and by agreement to the underlying ownership records of the transfer agent, provide a reasonable basis for our opinion.
/s/PricewaterhouseCoopers LLP
Philadelphia, Pennsylvania
November 15, 2016

Special 2016 tax information (unaudited) for Vanguard Global Equity Fund
This information for the fiscal year ended September 30, 2016, is included pursuant to provisions of
the Internal Revenue Code.
The fund distributed $72,900,000 of qualified dividend income to shareholders during the fiscal year.
For corporate shareholders, 45.1% of investment income (dividend income plus short-term gains,
if any) qualifies for the dividends-received deduction.
The fund designates to shareholders foreign source income of $43,790,000 and foreign taxes paid
of $4,043,000. Shareholders will receive more detailed information with their Form 1099-DIV in
January 2017 to determine the calendar-year amounts to be included on their 2016 tax returns.
31
Your Fund’s After-Tax Returns
This table presents returns for your fund both before and after taxes. The after-tax returns are shown in two ways: (1) assuming that an investor owned the fund during the entire period and paid taxes on the fund’s distributions, and (2) assuming that an investor paid taxes on the fund’s distributions and sold all shares at the end of each period.
Calculations are based on the highest individual federal income tax and capital gains tax rates in effect at the times of the distributions and the hypothetical sales. State and local taxes were not considered. After-tax returns reflect any qualified dividend income, using actual prior-year figures and estimates for 2016. (In the example, returns after the sale of fund shares may be higher than those assuming no sale. This occurs when the sale would have produced a capital loss. The calculation assumes that the investor received a tax deduction for the loss.)
Please note that your actual after-tax returns will depend on your tax situation and may differ from those shown. Also note that if you own the fund in a tax-deferred account, such as an individual retirement account or a 401(k) plan, this information does not apply to you. Such accounts are not subject to current taxes.
Finally, keep in mind that a fund’s performance—whether before or after taxes—does not guarantee future results.
| | | |
| Average Annual Total Returns: Global Equity Fund | | | |
| Periods Ended September 30, 2016 | | | |
| | One | Five | Ten |
| | Year | Years | Years |
| Returns Before Taxes | 12.11% | 12.54% | 4.51% |
| Returns After Taxes on Distributions | 11.71 | 12.17 | 3.92 |
| Returns After Taxes on Distributions and Sale of Fund Shares | 7.23 | 10.06 | 3.55 |
32
About Your Fund’s Expenses
As a shareholder of the fund, you incur ongoing costs, which include costs for portfolio management, administrative services, and shareholder reports (like this one), among others. Operating expenses, which are deducted from a fund’s gross income, directly reduce the investment return of the fund.
A fund’s expenses are expressed as a percentage of its average net assets. This figure is known as the expense ratio. The following examples are intended to help you understand the ongoing costs (in dollars) of investing in your fund and to compare these costs with those of other mutual funds. The examples are based on an investment of $1,000 made at the beginning of the period shown and held for the entire period.
The accompanying table illustrates your fund’s costs in two ways:
• Based on actual fund return. This section helps you to estimate the actual expenses that you paid over the period. The ”Ending Account Value“ shown is derived from the fund‘s actual return, and the third column shows the dollar amount that would have been paid by an investor who started with $1,000 in the fund. You may use the information here, together with the amount you invested, to estimate the expenses that you paid over the period.
To do so, simply divide your account value by $1,000 (for example, an $8,600 account value divided by $1,000 = 8.6), then multiply the result by the number given for your fund under the heading ”Expenses Paid During Period.“
• Based on hypothetical 5% yearly return. This section is intended to help you compare your fund‘s costs with those of other mutual funds. It assumes that the fund had a yearly return of 5% before expenses, but that the expense ratio is unchanged. In this case—because the return used is not the fund’s actual return—the results do not apply to your investment. The example is useful in making comparisons because the Securities and Exchange Commission requires all mutual funds to calculate expenses based on a 5% return. You can assess your fund’s costs by comparing this hypothetical example with the hypothetical examples that appear in shareholder reports of other funds.
Note that the expenses shown in the table are meant to highlight and help you compare ongoing costs only and do not reflect transaction costs incurred by the fund for buying and selling securities. Further, the expenses do not include any purchase, redemption, or account service fees described in the fund prospectus. If such fees were applied to your account, your costs would be higher. Your fund does not carry a “sales load.”
The calculations assume no shares were bought or sold during the period. Your actual costs may have been higher or lower, depending on the amount of your investment and the timing of any purchases or redemptions.
You can find more information about the fund’s expenses, including annual expense ratios, in the Financial Statements section of this report. For additional information on operating expenses and other shareholder costs, please refer to your fund’s current prospectus.
33
| | | |
| Six Months Ended September 30, 2016 | | | |
| | Beginning | Ending | Expenses |
| | Account Value | Account Value | Paid During |
| Global Equity Fund | 3/31/2016 | 9/30/2016 | Period |
| Based on Actual Fund Return | $1,000.00 | $1,067.85 | $2.58 |
| Based on Hypothetical 5% Yearly Return | 1,000.00 | 1,022.50 | 2.53 |
The calculations are based on expenses incurred in the most recent six-month period. The fund’s annualized six-month expense ratio for that
period is 0.50%. The dollar amounts shown as “Expenses Paid” are equal to the annualized expense ratio multiplied by the average account
value over the period, multiplied by the number of days in the most recent six-month period, then divided by the number of days in the most
recent 12-month period (183/366).
34
Glossary
Beta. A measure of the magnitude of a fund’s past share-price fluctuations in relation to the ups and downs of a given market index. The index is assigned a beta of 1.00. Compared with a given index, a fund with a beta of 1.20 typically would have seen its share price rise or fall by 12% when the index rose or fell by 10%. For this report, beta is based on returns over the past 36 months for both the fund and the index. Note that a fund’s beta should be reviewed in conjunction with its R-squared (see definition). The lower the R-squared, the less correlation there is between the fund and the index, and the less reliable beta is as an indicator of volatility.
Dividend Yield. Dividend income earned by stocks, expressed as a percentage of the aggregate market value (or of net asset value, for a fund). The yield is determined by dividing the amount of the annual dividends by the aggregate value (or net asset value) at the end of the period. For a fund, the dividend yield is based solely on stock holdings and does not include any income produced by other investments.
Earnings Growth Rate. The average annual rate of growth in earnings over the past five years for the stocks now in a fund.
Equity Exposure. A measure that reflects a fund’s investments in stocks and stock futures. Any holdings in short-term reserves are excluded.
Expense Ratio. A fund’s total annual operating expenses expressed as a percentage of the fund’s average net assets. The expense ratio includes management and administrative expenses, but does not include the transaction costs of buying and selling portfolio securities.
Inception Date. The date on which the assets of a fund (or one of its share classes) are first invested in accordance with the fund’s investment objective. For funds with a subscription period, the inception date is the day after that period ends. Investment performance is measured from the inception date.
Median Market Cap. An indicator of the size of companies in which a fund invests; the midpoint of market capitalization (market price x shares outstanding) of a fund’s stocks, weighted by the proportion of the fund’s assets invested in each stock. Stocks representing half of the fund’s assets have market capitalizations above the median, and the rest are below it.
Price/Book Ratio. The share price of a stock divided by its net worth, or book value, per share. For a fund, the weighted average price/book ratio of the stocks it holds.
Price/Earnings Ratio. The ratio of a stock’s current price to its per-share earnings over the past year. For a fund, the weighted average P/E of the stocks it holds. P/E is an indicator of market expectations about corporate prospects; the higher the P/E, the greater the expectations for a company’s future growth.
R-Squared. A measure of how much of a fund’s past returns can be explained by the returns from the market in general, as measured by a given index. If a fund’s total returns were precisely synchronized with an index’s returns, its R-squared would be 1.00. If the fund’s returns bore no relationship to the index’s returns, its R-squared would be 0. For this report, R-squared is based on returns over the past 36 months for both the fund and the index.
35
Return on Equity. The annual average rate of return generated by a company during the past five
years for each dollar of shareholder’s equity (net income divided by shareholder’s equity). For a fund,
the weighted average return on equity for the companies whose stocks it holds.
Short-Term Reserves. The percentage of a fund invested in highly liquid, short-term securities that
can be readily converted to cash.
Turnover Rate. An indication of the fund’s trading activity. Funds with high turnover rates incur
higher transaction costs and may be more likely to distribute capital gains (which may be taxable to
investors). The turnover rate excludes in-kind transactions, which have minimal impact on costs.
Benchmark Information
Spliced Global Equity Index: MSCI All Country World Index returns gross of taxes through March
31, 2007; MSCI All Country World Index returns net of withholding taxes thereafter.
36
This page intentionally left blank.
This page intentionally left blank.
This page intentionally left blank.
The People Who Govern Your Fund
The trustees of your mutual fund are there to see that the fund is operated and managed in your best interests since, as a shareholder, you are a part owner of the fund. Your fund’s trustees also serve on the board of directors of The Vanguard Group, Inc., which is owned by the Vanguard funds and provides services to them on an at-cost basis.
A majority of Vanguard’s board members are independent, meaning that they have no affiliation with Vanguard or the funds they oversee, apart from the sizable personal investments they have made as private individuals. The independent board members have distinguished backgrounds in business, academia, and public service. Each of the trustees and executive officers oversees 198 Vanguard funds.
The following table provides information for each trustee and executive officer of the fund. The mailing address of the trustees and officers is P.O. Box 876, Valley Forge, PA 19482. More information about the trustees is in the Statement of Additional Information, which can be obtained, without charge, by contacting Vanguard at 800-662-7447, or online at vanguard.com.
|
| InterestedTrustee1 |
| F. William McNabb III |
| Born 1957. Trustee Since July 2009. Chairman of |
| the Board. Principal Occupation(s) During the Past |
| Five Years and Other Experience: Chairman of the |
| Board of The Vanguard Group, Inc., and of each of |
| the investment companies served by The Vanguard |
| Group, since January 2010; Director of The Vanguard |
| Group since 2008; Chief Executive Officer and |
| President of The Vanguard Group, and of each of |
| the investment companies served by The Vanguard |
| Group, since 2008; Director of Vanguard Marketing |
| Corporation; Managing Director of The Vanguard |
| Group (1995–2008). |
| |
| IndependentTrustees |
| Emerson U. Fullwood |
| Born 1948. Trustee Since January 2008. Principal |
| Occupation(s) During the Past Five Years and Other |
| Experience: Executive Chief Staff and Marketing |
| Officer for North America and Corporate Vice President |
| (retired 2008) of Xerox Corporation (document manage- |
| ment products and services); Executive in Residence |
| and 2009–2010 Distinguished Minett Professor at |
| the Rochester Institute of Technology; Lead Director |
| of SPX FLOW, Inc. (multi-industry manufacturing); |
| Director of the United Way of Rochester, the University |
| of Rochester Medical Center, Monroe Community |
| College Foundation, North Carolina A&T University, |
| and Roberts Wesleyan College. |
|
| Rajiv L. Gupta |
| Born 1945. Trustee Since December 2001.2 Principal |
| Occupation(s) During the Past Five Years and Other |
| Experience: Chairman and Chief Executive Officer |
| (retired 2009) and President (2006–2008) of |
| Rohm and Haas Co. (chemicals); Director of Tyco |
| International plc (diversified manufacturing and |
| services), HP Inc. (printer and personal computer |
| manufacturing), and Delphi Automotive plc |
| (automotive components); Senior Advisor at |
| New Mountain Capital. |
Amy Gutmann |
| Born 1949. Trustee Since June 2006. Principal |
| Occupation(s) During the Past Five Years and |
| Other Experience: President of the University of |
| Pennsylvania; Christopher H. Browne Distinguished |
| Professor of Political Science, School of Arts and |
| Sciences, and Professor of Communication, Annenberg |
| School for Communication, with secondary faculty |
| appointments in the Department of Philosophy, School |
| of Arts and Sciences, and at the Graduate School of |
| Education, University of Pennsylvania; Trustee of the |
| National Constitution Center; Chair of the Presidential |
| Commission for the Study of Bioethical Issues. |
JoAnn Heffernan Heisen |
| Born 1950. Trustee Since July 1998. Principal |
| Occupation(s) During the Past Five Years and |
| Other Experience: Corporate Vice President and |
| Chief Global Diversity Officer (retired 2008) and |
| Member of the Executive Committee (1997–2008) |
| of Johnson & Johnson (pharmaceuticals/medical |
| devices/consumer products); Director of Skytop |
| Lodge Corporation (hotels) and the Robert Wood |
| Johnson Foundation; Member of the Advisory |
| Board of the Institute for Women’s Leadership |
| at Rutgers University. |
|
| F. Joseph Loughrey |
| Born 1949. Trustee Since October 2009. Principal |
| Occupation(s) During the Past Five Years and Other |
| Experience: President and Chief Operating Officer |
| (retired 2009) of Cummins Inc. (industrial machinery); |
| Chairman of the Board of Hillenbrand, Inc. (specialized |
| consumer services), and of Oxfam America; Director |
| of SKF AB (industrial machinery), Hyster-Yale Materials |
| Handling, Inc. (forklift trucks), the Lumina Foundation |
| for Education, and the V Foundation for Cancer |
| Research; Member of the Advisory Council for the |
| College of Arts and Letters and of the Advisory Board |
| to the Kellogg Institute for International Studies, both |
| at the University of Notre Dame. |
Mark Loughridge |
| Born 1953. Trustee Since March 2012. Principal |
| Occupation(s) During the Past Five Years and Other |
| Experience: Senior Vice President and Chief Financial |
| Officer (retired 2013) at IBM (information technology |
| services); Fiduciary Member of IBM’s Retirement Plan |
| Committee (2004–2013); Director of the Dow Chemical |
| Company; Member of the Council on Chicago Booth. |
Scott C. Malpass |
| Born 1962. Trustee Since March 2012. Principal |
| Occupation(s) During the Past Five Years and Other |
| Experience: Chief Investment Officer and Vice |
| President at the University of Notre Dame; Assistant |
| Professor of Finance at the Mendoza College of |
| Business at Notre Dame; Member of the Notre Dame |
| 403(b) Investment Committee, the Board of Advisors |
| for Spruceview Capital Partners, and the Investment |
| Advisory Committee of Major League Baseball; Board |
| Member of TIFF Advisory Services, Inc., and Catholic |
| Investment Services, Inc. (investment advisors). |
André F. Perold |
| Born 1952. Trustee Since December 2004. Principal |
| Occupation(s) During the Past Five Years and Other |
| Experience: George Gund Professor of Finance and |
| Banking, Emeritus at the Harvard Business School |
| (retired 2011); Chief Investment Officer and Managing |
| Partner of HighVista Strategies LLC (private investment |
| firm); Director of Rand Merchant Bank; Overseer of |
| the Museum of Fine Arts Boston. |
Peter F. Volanakis |
| Born 1955. Trustee Since July 2009. Principal |
| Occupation(s) During the Past Five Years and |
| Other Experience: President and Chief Operating |
| Officer (retired 2010) of Corning Incorporated |
| (communications equipment); Chairman of the |
| Board of Trustees of Colby-Sawyer College; |
| Member of the Advisory Board of the Norris |
| Cotton Cancer Center. |
| |
| Executive Officers | |
| Glenn Booraem | |
| Born 1967. Treasurer Since May 2015. Principal |
| Occupation(s) During the Past Five Years and |
| Other Experience: Principal of The Vanguard Group, |
| Inc.; Treasurer of each of the investment companies |
| served by The Vanguard Group; Controller of each of |
| the investment companies served by The Vanguard |
| Group (2010–2015); Assistant Controller of each of |
| the investment companies served by The Vanguard |
| Group (2001–2010). | |
Thomas J. Higgins | |
| Born 1957. Chief Financial Officer Since September |
| 2008. Principal Occupation(s) During the Past Five |
| Years and Other Experience: Principal of The Vanguard |
| Group, Inc.; Chief Financial Officer of each of the |
| investment companies served by The Vanguard Group; |
| Treasurer of each of the investment companies served |
| by The Vanguard Group (1998–2008). |
Peter Mahoney | |
| Born 1974. Controller Since May 2015. Principal |
| Occupation(s) During the Past Five Years and Other |
| Experience: Head of Global Fund Accounting at The |
| Vanguard Group, Inc.; Controller of each of the invest- |
| ment companies served by The Vanguard Group; |
| Head of International Fund Services at The Vanguard |
| Group (2008–2014). | |
Anne E. Robinson | |
| Born 1970. Secretary Since September 2016. Principal |
| Occupation(s) During the Past Five Years and Other |
| Experience: Managing Director of The Vanguard Group, |
| Inc.; General Counsel of The Vanguard Group; Secretary |
| of The Vanguard Group and of each of the investment |
| companies served by The Vanguard Group; Director |
| and Senior Vice President of Vanguard Marketing |
| Corporation; Managing Director and General Counsel |
| of Global Cards and Consumer Services at Citigroup |
| (2014–2016); Counsel at American Express (2003–2014). |
| |
| Vanguard Senior ManagementTeam |
| Mortimer J. Buckley | James M. Norris |
| Kathleen C. Gubanich | Thomas M. Rampulla |
| Martha G. King | Glenn W. Reed |
| John T. Marcante | Karin A. Risi |
| Chris D. McIsaac | Michael Rollings |
| |
| Chairman Emeritus and Senior Advisor |
| John J. Brennan | |
| Chairman, 1996–2009 | |
| Chief Executive Officer and President, 1996–2008 |
| |
| Founder | |
| John C. Bogle | |
| Chairman and Chief Executive Officer, 1974–1996 |
1 Mr. McNabb is considered an “interested person,” as defined in the Investment Company Act of 1940, because he is an officer of the Vanguard funds.
2 December 2002 for Vanguard Equity Income Fund, the Vanguard Municipal Bond Funds, and the Vanguard State Tax-Exempt Funds.
|  |
| | P.O. Box 2600 |
| | Valley Forge, PA 19482-2600 |
| |
| |
| |
| Connect with Vanguard® > vanguard.com |
| |
| |
| |
| Fund Information > 800-662-7447 | CFA® is a registered trademark owned by CFA Institute. |
| Direct Investor Account Services > 800-662-2739 | |
| Institutional Investor Services > 800-523-1036 | |
| Text Telephone for People | |
| Who Are Deaf or Hard of Hearing> 800-749-7273 | |
| |
| This material may be used in conjunction | |
| with the offering of shares of any Vanguard | |
| fund only if preceded or accompanied by | |
| the fund’s current prospectus. | |
| |
| All comparative mutual fund data are from Lipper, a | |
| Thomson Reuters Company, or Morningstar, Inc., unless | |
| otherwise noted. | |
| |
| You can obtain a free copy of Vanguard’s proxy voting | |
| guidelines by visiting vanguard.com/proxyreporting or by | |
| calling Vanguard at 800-662-2739. The guidelines are | |
| also available from the SEC’s website, sec.gov. In | |
| addition, you may obtain a free report on how your fund | |
| voted the proxies for securities it owned during the 12 | |
| months ended June 30. To get the report, visit either | |
| vanguard.com/proxyreporting or sec.gov. | |
| |
| You can review and copy information about your fund at | |
| the SEC’s Public Reference Room in Washington, D.C. To | |
| find out more about this public service, call the SEC at | |
| 202-551-8090. Information about your fund is also | |
| available on the SEC’s website, and you can receive | |
| copies of this information, for a fee, by sending a | |
| request in either of two ways: via email addressed to | |
| publicinfo@sec.gov or via regular mail addressed to the | |
| Public Reference Section, Securities and Exchange | |
| Commission, Washington, DC 20549-1520. | |
| |
| | © 2016 The Vanguard Group, Inc. |
| | All rights reserved. |
| | Vanguard Marketing Corporation, Distributor. |
| |
| | Q1290 112016 |
Item 2: Code of Ethics. The Registrant has adopted a code of ethics that applies to the Registrant’s principal executive officer, principal financial officer, principal accounting officer or controller or persons performing similar functions. The Code of Ethics was amended during the reporting period covered by this report to make certain technical, non-material changes.
Item 3: Audit Committee Financial Expert. All members of the Audit Committee have been determined by the Registrant’s Board of Trustees to be Audit Committee Financial Experts and to be independent: Rajiv L. Gupta, JoAnn Heffernan Heisen, F. Joseph Loughrey, Mark Loughridge, and Peter F. Volanakis.
Item 4: Principal Accountant Fees and Services.
(a) Audit Fees.
Audit Fees of the Registrant
Fiscal Year Ended September 30, 2016: $149,000
Fiscal Year Ended September 30, 2015: $142,000
Aggregate Audit Fees of Registered Investment Companies in the Vanguard Group.
Fiscal Year Ended September 30, 2016: $9,629,849
Fiscal Year Ended September 30, 2015: $7,000,200
Includes fees billed in connection with audits of the Registrant, other registered investment
companies in the Vanguard complex, The Vanguard Group, Inc. and Vanguard Marketing
Corporation.
(b) Audit-Related Fees.
Fiscal Year Ended September 30, 2016: $2,717,627
Fiscal Year Ended September 30, 2015: $2,899,096
Includes fees billed in connection with assurance and related services provided to the
Registrant, other registered investment companies in the Vanguard complex, The Vanguard
Group, Inc., and Vanguard Marketing Corporation.
(c) Tax Fees.
Fiscal Year Ended September 30, 2016: $254,050
Fiscal Year Ended September 30, 2015: $353,389
Includes fees billed in connection with tax compliance, planning, and advice services provided to the Registrant, other registered investment companies in the Vanguard complex, The Vanguard Group, Inc., and Vanguard Marketing Corporation.
(d) All Other Fees.
Fiscal Year Ended September 30, 2016: $214,225
Fiscal Year Ended September 30, 2015: $202,313
Includes fees billed for services related to tax reported information provided to the Registrant, other registered investment companies in the Vanguard complex, The Vanguard Group, Inc., and Vanguard Marketing Corporation.
(e) (1) Pre-Approval Policies. The policy of the Registrant’s Audit Committee is to consider and, if appropriate, approve before the principal accountant is engaged for such services, all specific audit and non-audit services provided to: the Registrant, other registered investment companies in the Vanguard complex, The Vanguard Group, Inc., and entities controlled by The Vanguard Group, Inc. that provide ongoing services to the Registrant. In making a determination, the Audit Committee considers whether the services are consistent with maintaining the principal accountant’s independence.
In the event of a contingency situation in which the principal accountant is needed to provide services in between scheduled Audit Committee meetings, the Chairman of the Audit Committee would be called on to consider and, if appropriate, pre-approve audit or permitted non-audit services in an amount sufficient to complete services through the next Audit Committee meeting, and to determine if such services would be consistent with maintaining the accountant’s independence. At the next scheduled Audit Committee meeting, services and fees would be presented to the Audit Committee for formal consideration, and, if appropriate, approval by the entire Audit Committee. The Audit Committee would again consider whether such services and fees are consistent with maintaining the principal accountant’s independence.
The Registrant’s Audit Committee is informed at least annually of all audit and non-audit services provided by the principal accountant to the Vanguard complex, whether such services are provided to: the Registrant, other registered investment companies in the Vanguard complex, The Vanguard Group, Inc., or other entities controlled by The Vanguard Group, Inc. that provide ongoing services to the Registrant.
(2) No percentage of the principal accountant’s fees or services were approved pursuant to the waiver provision of paragraph (c)(7)(i)(C) of Rule 2-01 of Regulation S-X.
(f) For the most recent fiscal year, over 50% of the hours worked under the principal accountant’s engagement were not performed by persons other than full-time, permanent employees of the principal accountant.
(g) Aggregate Non-Audit Fees.
Fiscal Year Ended September 30, 2016: $468,275
Fiscal Year Ended September 30, 2015: $555,702
Includes fees billed for non-audit services provided to the Registrant, other registered investment companies in the Vanguard complex, The Vanguard Group, Inc., and Vanguard Marketing Corporation.
(h) For the most recent fiscal year, the Audit Committee has determined that the provision of all non-audit services was consistent with maintaining the principal accountant’s independence.
Item 5: Audit Committee of Listed Registrants.
Not Applicable.
Item 6: Investments.
Vanguard® Global Equity Fund
Schedule of Investments
September 30, 2016
| | |
| | | Market |
| | | Value |
| | Shares | ($000) |
| |
| Common Stocks (96.2%)1 | | |
| Australia (1.5%) | | |
| Brambles Ltd. | 1,452,541 | 13,356 |
| Caltex Australia Ltd. | 303,878 | 8,022 |
| Aristocrat Leisure Ltd. | 512,134 | 6,213 |
| BlueScope Steel Ltd. | 1,032,385 | 6,134 |
| Qantas Airways Ltd. | 2,503,330 | 6,005 |
| Cochlear Ltd. | 33,471 | 3,628 |
| Newcrest Mining Ltd. | 194,403 | 3,230 |
| Coca-Cola Amatil Ltd. | 312,849 | 2,459 |
| Alumina Ltd. | 1,642,895 | 1,840 |
| Cleanaway Waste Management Ltd. | 1,736,239 | 1,493 |
| Orica Ltd. | 117,880 | 1,375 |
| ALS Ltd. | 273,936 | 1,256 |
| Fairfax Media Ltd. | 1,612,912 | 1,171 |
| BHP Billiton Ltd. | 51,757 | 895 |
| Iluka Resources Ltd. | 166,853 | 805 |
| * Metcash Ltd. | 496,051 | 799 |
| Asaleo Care Ltd. | 624,888 | 766 |
| Regis Resources Ltd. | 246,581 | 713 |
| Sigma Pharmaceuticals Ltd. | 555,893 | 605 |
| DuluxGroup Ltd. | 118,177 | 598 |
| Resolute Mining Ltd. | 402,129 | 592 |
| GUD Holdings Ltd. | 72,599 | 587 |
| Amcor Ltd. | 49,459 | 575 |
| Spotless Group Holdings Ltd. | 621,817 | 511 |
| Mirvac Group | 281,083 | 483 |
| Tabcorp Holdings Ltd. | 84,177 | 322 |
| ASX Ltd. | 8,338 | 308 |
| Santos Ltd. | 101,341 | 285 |
| Northern Star Resources Ltd. | 79,000 | 275 |
| Orora Ltd. | 107,206 | 259 |
| Cover-More Group Ltd. | 191,343 | 214 |
| Premier Investments Ltd. | 10,829 | 129 |
| | | 65,903 |
| Austria (0.1%) | | |
| Wienerberger AG | 61,314 | 1,041 |
| Oesterreichische Post AG | 18,982 | 672 |
| ANDRITZ AG | 12,145 | 661 |
| BUWOG AG | 14,275 | 386 |
| | | 2,760 |
| Belgium (0.2%) | | |
| Anheuser-Busch InBev SA/NV | 30,257 | 3,972 |
| Bekaert SA | 32,870 | 1,499 |
| Cofinimmo SA | 6,553 | 815 |
| Euronav NV | 40,459 | 309 |
| * Orange Belgium SA | 11,618 | 284 |
| | | 6,879 |
| Brazil (0.7%) | | |
| BM&FBovespa SA - Bolsa de Valores Mercadorias e Futuros | 1,685,600 | 8,713 |
| EDP - Energias do Brasil SA | 772,927 | 3,418 |
| Alpargatas SA Preference Shares | 848,182 | 2,519 |
| Natura Cosmeticos SA | 253,426 | 2,434 |
| MRV Engenharia e Participacoes SA | 484,500 | 1,779 |
| Itausa - Investimentos Itau SA Preference Shares | 599,413 | 1,537 |
| Cosan Ltd. | 211,964 | 1,515 |
| TOTVS SA | 152,400 | 1,424 |
| BTG Pactual Group | 215,802 | 944 |
| Porto Seguro SA | 88,209 | 809 |
| TIM Participacoes SA | 328,835 | 799 |
| Cia Energetica de Minas Gerais ADR | 307,244 | 796 |
| * B2W Cia Digital | 139,581 | 684 |
| Cia Brasileira de Distribuicao Grupo Pao de Acucar Preference Shares | 39,490 | 645 |
| |
| |
| |
| |
| | 1 | |
Vanguard® Global Equity Fund
Schedule of Investments
September 30, 2016
| | | |
| | | | Market |
| | | | Value |
| | | Shares | ($000) |
| | Banco Bradesco SA Preference Shares | 69,316 | 632 |
| * | Marfrig Global Foods SA | 388,354 | 623 |
| | Cia de Saneamento Basico do Estado de Sao Paulo | 62,900 | 584 |
| | Gerdau SA Preference Shares | 163,100 | 444 |
| * | LPS Brasil Consultoria de Imoveis SA | 279,700 | 353 |
| | Ultrapar Participacoes SA | 15,500 | 339 |
| | Qualicorp SA | 55,600 | 328 |
| | Grendene SA | 49,400 | 271 |
| | Eletropaulo Metropolitana Eletricidade de Sao Paulo SA Preference Shares | 74,300 | 242 |
| | | | 31,832 |
| Canada (3.2%) | | |
| ^ | Canadian Imperial Bank of Commerce | 215,800 | 16,733 |
| | Fairfax Financial Holdings Ltd. (U.S. Shares) | 27,770 | 16,278 |
| | Royal Bank of Canada | 252,000 | 15,609 |
| | Magna International Inc. | 338,100 | 14,514 |
| | Bank of Montreal | 174,500 | 11,435 |
| | Ritchie Bros Auctioneers Inc. (New York Shares) | 319,315 | 11,198 |
| | Canadian Natural Resources Ltd. | 229,882 | 7,349 |
| | Yamana Gold Inc. | 1,439,000 | 6,197 |
| | Fairfax Financial Holdings Ltd. | 10,022 | 5,872 |
| | Brookfield Asset Management Inc. Class A | 155,933 | 5,483 |
| | Rogers Communications Inc. Class B | 125,572 | 5,327 |
| | Loblaw Cos. Ltd. | 75,690 | 3,894 |
| * | CGI Group Inc. Class A | 58,700 | 2,796 |
| ^ | H&R REIT | 158,200 | 2,705 |
| | Open Text Corp. | 37,800 | 2,449 |
| ^ | PrairieSky Royalty Ltd. | 93,107 | 1,898 |
| | Ritchie Bros Auctioneers Inc. | 49,744 | 1,743 |
| ^ | Quebecor Inc. Class B | 53,000 | 1,611 |
| ^ | Bonavista Energy Corp. | 375,020 | 1,206 |
| ^ | Parkland Fuel Corp. | 48,200 | 1,136 |
| | Canadian REIT | 25,800 | 926 |
| | Constellation Software Inc. | 2,000 | 902 |
| ^ | Enerplus Corp. | 129,200 | 829 |
| | Industrial Alliance Insurance & Financial Services Inc. | 19,200 | 691 |
| ^ | Capital Power Corp. | 28,700 | 451 |
| | Aimia Inc. | 70,900 | 446 |
| * | Newmarket Gold Inc. | 99,019 | 356 |
| * | Argonaut Gold Inc. | 123,200 | 324 |
| ^ | Mullen Group Ltd. | 23,900 | 300 |
| * | Kinross Gold Corp. | 70,614 | 298 |
| ^ | Morneau Shepell Inc. | 20,500 | 297 |
| * | Painted Pony Petroleum Ltd. | 47,700 | 293 |
| ^ | Nevsun Resources Ltd. | 96,300 | 291 |
| *,^ | Teranga Gold Corp. | 325,100 | 290 |
| | Maple Leaf Foods Inc. | 11,800 | 271 |
| | Smart REIT | 10,000 | 269 |
| | Dorel Industries Inc. Class B | 10,000 | 269 |
| | Pengrowth Energy Corp. | 148,100 | 234 |
| * | RMP Energy Inc. | 251,500 | 199 |
| | Russel Metals Inc. | 8,957 | 143 |
| | Intertape Polymer Group Inc. | 8,000 | 138 |
| | | | 143,650 |
| Chile (0.3%) | | |
| | Enersis Americas SA ADR | 564,716 | 4,625 |
| | Enersis Chile SA ADR | 564,716 | 2,682 |
| | Quinenco SA | 1,019,877 | 2,263 |
| | Cia Cervecerias Unidas SA | 162,069 | 1,638 |
| * | Cia Sud Americana de Vapores SA | 11,229,484 | 186 |
| | Sociedad Quimica y Minera de Chile SA ADR | 5,329 | 143 |
| | Enaex SA | 5,437 | 56 |
| | | | 11,593 |
| |
| |
| |
| |
| | | 2 | |
Vanguard® Global Equity Fund
Schedule of Investments
September 30, 2016
| | |
| | | Market |
| | | Value |
| | Shares | ($000) |
| China (2.6%) | | |
| * Alibaba Group Holding Ltd. ADR | 264,258 | 27,956 |
| * Baidu Inc. ADR | 112,357 | 20,457 |
| China Mobile Ltd. | 1,232,000 | 15,126 |
| * Ctrip.com International Ltd. ADR | 164,971 | 7,683 |
| * China Biologic Products Inc. | 52,184 | 6,496 |
| NetEase Inc. ADR | 25,009 | 6,022 |
| Tsingtao Brewery Co. Ltd. | 1,204,000 | 4,720 |
| * Autohome Inc. ADR | 153,602 | 3,725 |
| Kingboard Chemical Holdings Ltd. | 1,103,000 | 3,360 |
| China Telecom Corp. Ltd. | 4,664,000 | 2,375 |
| China Mengniu Dairy Co. Ltd. | 1,038,000 | 1,944 |
| * Li Ning Co. Ltd. | 2,652,833 | 1,827 |
| * China Resources Beer Holdings Co. Ltd. | 802,658 | 1,712 |
| Want Want China Holdings Ltd. | 2,723,557 | 1,695 |
| CNOOC Ltd. | 1,038,913 | 1,309 |
| Tingyi Cayman Islands Holding Corp. | 1,069,608 | 1,247 |
| BYD Electronic International Co. Ltd. | 1,205,000 | 1,013 |
| Zhongsheng Group Holdings Ltd. | 918,000 | 876 |
| China Resources Cement Holdings Ltd. | 2,136,000 | 859 |
| TravelSky Technology Ltd. | 326,000 | 778 |
| Ajisen China Holdings Ltd. | 1,627,000 | 748 |
| Goodbaby International Holdings Ltd. | 1,435,000 | 738 |
| * Tarena International Inc. ADR | 40,358 | 584 |
| Shenzhou International Group Holdings Ltd. | 72,456 | 507 |
| China High Speed Transmission Equipment Group Co. Ltd. | 436,000 | 442 |
| Kingboard Laminates Holdings Ltd. | 429,000 | 394 |
| KWG Property Holding Ltd. | 592,500 | 391 |
| Nexteer Automotive Group Ltd. | 290,000 | 378 |
| K Wah International Holdings Ltd. | 664,000 | 366 |
| Geely Automobile Holdings Ltd. | 380,000 | 342 |
| Chaowei Power Holdings Ltd. | 412,000 | 341 |
| Pou Sheng International Holdings Ltd. | 954,000 | 317 |
| Xingda International Holdings Ltd. | 761,000 | 315 |
| * Greentown Service Group Co. Ltd. | 782,000 | 294 |
| China Merchants Port Holdings Co. Ltd. | 96,000 | 257 |
| * Daphne International Holdings Ltd. | 962,000 | 129 |
| | | 117,723 |
| Colombia (0.1%) | | |
| Bancolombia SA ADR | 42,523 | 1,660 |
| Almacenes Exito SA | 140,056 | 714 |
| | | 2,374 |
| Cyprus (0.0%) | | |
| Globaltrans Investment plc GDR | 50,250 | 236 |
| |
| Czech Republic (0.0%) | | |
| Komercni banka as | 13,670 | 474 |
| |
| Denmark (1.2%) | | |
| Novo Nordisk A/S Class B | 444,484 | 18,520 |
| Carlsberg A/S Class B | 150,233 | 14,353 |
| Vestas Wind Systems A/S | 119,515 | 9,874 |
| Coloplast A/S Class B | 56,366 | 4,371 |
| GN Store Nord A/S | 148,284 | 3,199 |
| William Demant Holding A/S | 101,371 | 2,069 |
| * H Lundbeck A/S | 28,164 | 925 |
| ISS A/S | 20,836 | 867 |
| * Topdanmark A/S | 21,996 | 617 |
| Danske Bank A/S | 17,759 | 520 |
| Dfds A/S | 8,224 | 417 |
| Rockwool International A/S Class B | 2,092 | 377 |
| | | 56,109 |
| Finland (0.6%) | | |
| Neste Oyj | 226,786 | 9,665 |
| |
| |
| |
| |
| | 3 | |
Vanguard® Global Equity Fund
Schedule of Investments
September 30, 2016
| | | |
| | | | Market |
| | | | Value |
| | | Shares | ($000) |
| | Tikkurila Oyj | 238,288 | 5,126 |
| | Sampo Oyj Class A | 107,735 | 4,792 |
| | Nokian Renkaat Oyj | 30,649 | 1,117 |
| | Metso Oyj | 32,019 | 934 |
| | UPM-Kymmene Oyj | 43,369 | 916 |
| | Wartsila Oyj Abp | 15,674 | 706 |
| | Amer Sports Oyj | 20,675 | 632 |
| | Tieto Oyj | 18,385 | 580 |
| | Cargotec Oyj Class B | 6,944 | 319 |
| | Sponda Oyj | 54,616 | 281 |
| | | | 25,068 |
| France (1.2%) | | |
| | Bureau Veritas SA | 434,996 | 9,331 |
| | L'Oreal SA | 30,284 | 5,718 |
| | Legrand SA | 96,277 | 5,677 |
| * | Nexans SA | 56,789 | 3,257 |
| * | Peugeot SA | 182,006 | 2,779 |
| | BNP Paribas SA | 45,146 | 2,321 |
| | Eurofins Scientific SE | 4,553 | 2,068 |
| | Airbus Group SE | 29,498 | 1,784 |
| | Atos SE | 15,557 | 1,676 |
| | Zodiac Aerospace | 66,609 | 1,622 |
| | Rexel SA | 92,873 | 1,421 |
| | AXA SA | 59,465 | 1,265 |
| | Edenred | 52,618 | 1,230 |
| | Groupe Eurotunnel SE | 112,314 | 1,214 |
| | Christian Dior SE | 6,478 | 1,161 |
| | Thales SA | 11,154 | 1,027 |
| * | ArcelorMittal | 137,930 | 842 |
| | Sanofi | 10,226 | 779 |
| | Dassault Systemes | 8,113 | 704 |
| *,^ | Air France-KLM | 124,733 | 670 |
| | Nexity SA | 12,245 | 646 |
| | SEB SA | 4,423 | 624 |
| | TOTAL SA | 13,118 | 622 |
| | Capgemini SA | 6,236 | 611 |
| | STMicroelectronics NV | 74,088 | 605 |
| | Neopost SA | 20,140 | 544 |
| | JCDecaux SA | 14,906 | 481 |
| | Vicat SA | 6,537 | 422 |
| | Technip SA | 6,734 | 414 |
| | Imerys SA | 4,477 | 323 |
| * | Flamel Technologies SA ADR | 25,944 | 322 |
| * | Criteo SA ADR | 9,076 | 319 |
| | Elis SA | 16,564 | 273 |
| *,^ | Vallourec SA | 47,126 | 211 |
| * | Virbac SA | 933 | 156 |
| | | | 53,119 |
| Germany (2.6%) | | |
| | SAP SE | 429,798 | 39,107 |
| * | Deutsche Boerse AG | 184,850 | 14,968 |
| * | QIAGEN NV | 315,500 | 8,657 |
| | Deutsche Lufthansa AG | 651,968 | 7,255 |
| | Software AG | 115,565 | 4,897 |
| | Fresenius Medical Care AG & Co. KGaA | 52,204 | 4,557 |
| | OSRAM Licht AG | 59,212 | 3,476 |
| * | Kloeckner & Co. SE | 279,321 | 3,401 |
| | BASF SE | 35,313 | 3,020 |
| | Deutsche Telekom AG | 150,756 | 2,527 |
| | adidas AG | 13,002 | 2,257 |
| | Bayerische Motoren Werke AG | 25,889 | 2,176 |
| | Volkswagen AG Preference Shares | 13,729 | 1,804 |
| | Evonik Industries AG | 50,702 | 1,714 |
| | Brenntag AG | 30,415 | 1,660 |
| |
| |
| |
| |
| | | 4 | |
Vanguard® Global Equity Fund
Schedule of Investments
September 30, 2016
| | | |
| | | | Market |
| | | | Value |
| | | Shares | ($000) |
| | HOCHTIEF AG | 11,207 | 1,580 |
| | HeidelbergCement AG | 15,799 | 1,492 |
| | Bechtle AG | 12,145 | 1,405 |
| | CANCOM SE | 25,269 | 1,319 |
| | Axel Springer SE | 25,465 | 1,304 |
| | Symrise AG | 14,095 | 1,033 |
| | CTS Eventim AG & Co. KGaA | 26,037 | 927 |
| | Hannover Rueck SE | 7,332 | 785 |
| | Rheinmetall AG | 10,161 | 707 |
| | TUI AG-DI | 49,514 | 706 |
| | GEA Group AG | 11,926 | 661 |
| | Fielmann AG | 6,583 | 537 |
| | Gerresheimer AG | 5,919 | 503 |
| | Suedzucker AG | 16,836 | 468 |
| | Henkel AG & Co. KGaA Preference Shares | 2,961 | 402 |
| *,^ | Heidelberger Druckmaschinen AG | 158,538 | 383 |
| | Salzgitter AG | 11,594 | 380 |
| | Vonovia SE | 9,375 | 355 |
| | Jenoptik AG | 17,651 | 323 |
| | AURELIUS Equity Opportunities SE & Co. KGaA | 4,988 | 315 |
| | Draegerwerk AG & Co. KGaA Preference Shares | 4,111 | 295 |
| | Carl Zeiss Meditec AG | 7,493 | 286 |
| | TAG Immobilien AG | 19,333 | 281 |
| | | | 117,923 |
| Greece (0.0%) | | |
| | Grivalia Properties REIC AE | 140,485 | 1,058 |
| | OPAP SA | 40,989 | 346 |
| | JUMBO SA | 26,152 | 326 |
| * | Fourlis Holdings SA | 50,267 | 217 |
| | Alpha Bank AE | 115,936 | 194 |
| | | | 2,141 |
| Hong Kong (1.4%) | | |
| | AIA Group Ltd. | 3,784,000 | 25,353 |
| | Jardine Matheson Holdings Ltd. | 228,700 | 13,893 |
| | Sands China Ltd. | 1,676,400 | 7,343 |
| | CK Hutchison Holdings Ltd. | 349,800 | 4,463 |
| * | Esprit Holdings Ltd. | 3,738,714 | 3,041 |
| | HSBC Holdings plc | 354,400 | 2,633 |
| | First Pacific Co. Ltd. | 1,751,250 | 1,254 |
| | Television Broadcasts Ltd. | 244,900 | 934 |
| | Hongkong & Shanghai Hotels Ltd. | 713,200 | 710 |
| | NagaCorp Ltd. | 956,000 | 632 |
| | Dairy Farm International Holdings Ltd. | 64,000 | 455 |
| | Stella International Holdings Ltd. | 239,173 | 410 |
| | SmarTone Telecommunications Holdings Ltd. | 217,194 | 360 |
| | Emperor Capital Group Ltd. | 2,850,000 | 296 |
| | Fairwood Holdings Ltd. | 56,500 | 263 |
| | Truly International Holdings Ltd. | 586,000 | 240 |
| | Cheung Kong Property Holdings Ltd. | 31,192 | 230 |
| | New World Development Co. Ltd. | 82,000 | 107 |
| | Texwinca Holdings Ltd. | 144,823 | 100 |
| | | | 62,717 |
| Hungary (0.0%) | | |
| | MOL Hungarian Oil & Gas plc | 6,014 | 373 |
| |
| India (1.0%) | | |
| | ICICI Bank Ltd. | 4,521,094 | 17,221 |
| | Housing Development Finance Corp. Ltd. | 668,115 | 14,029 |
| | Bharat Petroleum Corp. Ltd. | 550,395 | 5,076 |
| | CESC Ltd. | 194,216 | 1,787 |
| | Karnataka Bank Ltd. | 603,797 | 1,337 |
| | Bharti Airtel Ltd. | 172,513 | 815 |
| | Axis Bank Ltd. | 98,082 | 802 |
| | Indian Oil Corp. Ltd. | 90,197 | 790 |
| |
| |
| |
| |
| | | 5 | |
Vanguard® Global Equity Fund
Schedule of Investments
September 30, 2016
| | | |
| | | | Market |
| | | | Value |
| | | Shares | ($000) |
| | MRF Ltd. | 832 | 637 |
| | Hindalco Industries Ltd. | 206,898 | 477 |
| * | Bank of Baroda | 185,353 | 469 |
| | Indraprastha Gas Ltd. | 38,453 | 451 |
| | Chennai Petroleum Corp. Ltd. | 97,219 | 421 |
| | Hindustan Petroleum Corp. Ltd. | 65,808 | 420 |
| | Manappuram Finance Ltd. | 291,679 | 403 |
| | Bodal Chemicals Ltd. | 176,679 | 381 |
| | JSW Steel Ltd. | 12,712 | 331 |
| | Omaxe Ltd. | 117,953 | 303 |
| | Petronet LNG Ltd. | 56,882 | 295 |
| | Tata Chemicals Ltd. | 34,825 | 275 |
| | | | 46,720 |
| Indonesia (0.2%) | | |
| | Telekomunikasi Indonesia Persero Tbk PT | 18,377,400 | 6,087 |
| | Telekomunikasi Indonesia Persero Tbk PT ADR | 17,078 | 1,129 |
| | Matahari Department Store Tbk PT | 262,800 | 373 |
| * | XL Axiata Tbk PT | 1,585,850 | 329 |
| | Elnusa Tbk PT | 7,669,800 | 270 |
| | | | 8,188 |
| Ireland (1.4%) | | |
| | CRH plc | 942,597 | 31,256 |
| | Ryanair Holdings plc ADR | 259,201 | 19,448 |
| * | Bank of Ireland | 46,545,784 | 9,698 |
| | Paddy Power Betfair plc (London Shares) | 17,632 | 1,987 |
| | Paddy Power Betfair plc | 17,160 | 1,941 |
| | Irish Continental Group plc | 158,768 | 779 |
| * | Irish Bank Resolution Corp. Ltd. | 122,273 | — |
| | | | 65,109 |
| Israel (0.1%) | | |
| * | Bank Leumi Le-Israel BM | 364,209 | 1,384 |
| | Bank Hapoalim BM | 144,325 | 818 |
| * | SodaStream International Ltd. | 12,839 | 341 |
| | El Al Israel Airlines | 361,418 | 332 |
| * | Wix.com Ltd. | 7,611 | 331 |
| * | Taro Pharmaceutical Industries Ltd. | 2,760 | 305 |
| * | Partner Communications Co. Ltd. | 53,432 | 244 |
| | | | 3,755 |
| Italy (0.5%) | | |
| | Fiat Chrysler Automobiles NV | 693,924 | 4,406 |
| | Ferrari NV | 69,392 | 3,605 |
| | Luxottica Group SPA ADR | 49,592 | 2,371 |
| | CNH Industrial NV | 325,314 | 2,328 |
| ^ | Piaggio & C SPA | 1,032,540 | 1,930 |
| * | Saipem SPA | 3,846,238 | 1,628 |
| | UniCredit SPA | 429,171 | 1,000 |
| | EXOR SPA | 24,451 | 991 |
| | Luxottica Group SPA | 16,818 | 804 |
| | Davide Campari-Milano SPA | 53,329 | 601 |
| | Intesa Sanpaolo SPA (Registered) | 219,899 | 488 |
| | Autogrill SPA | 42,331 | 359 |
| | Buzzi Unicem SPA | 13,612 | 279 |
| | Saras SPA | 104,270 | 166 |
| *,2 | Technogym SPA | 17,218 | 84 |
| | Recordati SPA | 753 | 24 |
| | | | 21,064 |
| Japan (8.8%) | | |
| | MS&AD Insurance Group Holdings Inc. | 1,133,400 | 31,618 |
| | Daito Trust Construction Co. Ltd. | 145,500 | 23,253 |
| | Nippon Telegraph & Telephone Corp. | 375,400 | 17,145 |
| | SMC Corp. | 48,300 | 13,933 |
| | Daiwa House Industry Co. Ltd. | 437,900 | 11,994 |
| | Secom Co. Ltd. | 153,000 | 11,418 |
| |
| |
| |
| |
| | | 6 | |
Vanguard® Global Equity Fund
Schedule of Investments
September 30, 2016
| | | |
| | | | Market |
| | | | Value |
| | | Shares | ($000) |
| | CyberAgent Inc. | 382,800 | 11,358 |
| | Olympus Corp. | 308,300 | 10,755 |
| | Kansai Paint Co. Ltd. | 388,900 | 8,519 |
| | Japan Exchange Group Inc. | 518,000 | 8,105 |
| | FUJIFILM Holdings Corp. | 208,200 | 7,705 |
| | Rohm Co. Ltd. | 145,200 | 7,654 |
| | Seven & i Holdings Co. Ltd. | 148,200 | 7,004 |
| | Kirin Holdings Co. Ltd. | 417,400 | 6,911 |
| | West Japan Railway Co. | 109,200 | 6,760 |
| *,^ | LINE Corp. | 134,900 | 6,517 |
| | Toyota Motor Corp. | 110,800 | 6,426 |
| | Bandai Namco Holdings Inc. | 202,650 | 6,198 |
| * | Tokyo Electric Power Co. Holdings Inc. | 1,424,400 | 6,160 |
| | NTT Data Corp. | 119,100 | 5,953 |
| | East Japan Railway Co. | 62,100 | 5,599 |
| | Dai-ichi Life Insurance Co. Ltd. | 404,500 | 5,552 |
| | Hitachi Ltd. | 1,102,000 | 5,154 |
| | Obayashi Corp. | 511,300 | 5,068 |
| | Sumitomo Mitsui Financial Group Inc. | 147,100 | 4,958 |
| | Shiseido Co. Ltd. | 186,300 | 4,927 |
| | Fujitsu Ltd. | 896,000 | 4,837 |
| | Kao Corp. | 83,300 | 4,692 |
| | Sompo Japan Nipponkoa Holdings Inc. | 151,000 | 4,468 |
| | Tokio Marine Holdings Inc. | 115,200 | 4,415 |
| | USS Co. Ltd. | 261,000 | 4,412 |
| | Alfresa Holdings Corp. | 206,000 | 4,357 |
| | Japan Airlines Co. Ltd. | 148,000 | 4,357 |
| | THK Co. Ltd. | 221,032 | 4,354 |
| | Sumitomo Dainippon Pharma Co. Ltd. | 220,100 | 4,255 |
| | Mizuho Financial Group Inc. | 2,220,500 | 3,710 |
| | Japan Post Holdings Co. Ltd. | 264,600 | 3,325 |
| | LIXIL Group Corp. | 149,900 | 3,216 |
| | Yamato Holdings Co. Ltd. | 137,200 | 3,193 |
| | Resona Holdings Inc. | 736,800 | 3,099 |
| | Toyo Seikan Group Holdings Ltd. | 175,300 | 3,089 |
| | Tohoku Electric Power Co. Inc. | 235,400 | 3,070 |
| | Konami Holdings Corp. | 75,100 | 2,908 |
| | SoftBank Group Corp. | 44,100 | 2,857 |
| | NEC Corp. | 1,105,000 | 2,855 |
| | Mitsubishi Heavy Industries Ltd. | 673,000 | 2,814 |
| | Fuji Media Holdings Inc. | 198,000 | 2,689 |
| | Mixi Inc. | 71,600 | 2,581 |
| | Mitsubishi Estate Co. Ltd. | 137,000 | 2,568 |
| | Otsuka Holdings Co. Ltd. | 53,400 | 2,436 |
| | Nippon Television Holdings Inc. | 133,870 | 2,266 |
| | JFE Holdings Inc. | 154,200 | 2,248 |
| | Tokyo Electron Ltd. | 25,300 | 2,233 |
| | Nomura Holdings Inc. | 496,000 | 2,220 |
| | Japan Tobacco Inc. | 53,900 | 2,202 |
| | Toyo Suisan Kaisha Ltd. | 49,800 | 2,110 |
| | Sumitomo Mitsui Trust Holdings Inc. | 62,900 | 2,041 |
| | Mitsubishi Corp. | 84,600 | 1,923 |
| | NTT Urban Development Corp. | 197,000 | 1,902 |
| | Isetan Mitsukoshi Holdings Ltd. | 176,800 | 1,740 |
| | Mitsubishi Logistics Corp. | 120,000 | 1,730 |
| | Shimizu Corp. | 191,000 | 1,704 |
| | Yamada Denki Co. Ltd. | 332,200 | 1,648 |
| | Fujitsu General Ltd. | 69,000 | 1,499 |
| | Azbil Corp. | 44,700 | 1,351 |
| | Sumitomo Electric Industries Ltd. | 91,500 | 1,294 |
| | Sumitomo Chemical Co. Ltd. | 284,000 | 1,263 |
| | Onward Holdings Co. Ltd. | 164,000 | 1,183 |
| | Nintendo Co. Ltd. | 4,000 | 1,058 |
| | Kyocera Corp. | 20,800 | 998 |
| |
| |
| |
| |
| | | 7 | |
Vanguard® Global Equity Fund
Schedule of Investments
September 30, 2016
| | |
| | | Market |
| | | Value |
| | Shares | ($000) |
| Toridoll.corp | 43,300 | 993 |
| Nippon Suisan Kaisha Ltd. | 212,300 | 912 |
| Tokyu Construction Co. Ltd. | 89,100 | 891 |
| NH Foods Ltd. | 36,000 | 868 |
| Mitsubishi UFJ Financial Group Inc. | 160,900 | 811 |
| * JAC Recruitment Co. Ltd. | 67,100 | 807 |
| Nikon Corp. | 52,600 | 786 |
| Fuji Heavy Industries Ltd. | 20,500 | 770 |
| Toyota Industries Corp. | 15,800 | 733 |
| Nissan Motor Co. Ltd. | 74,300 | 728 |
| Bridgestone Corp. | 18,200 | 671 |
| Zensho Holdings Co. Ltd. | 37,600 | 671 |
| Daiichi Sankyo Co. Ltd. | 27,600 | 661 |
| Penta-Ocean Construction Co. Ltd. | 106,000 | 604 |
| Komeri Co. Ltd. | 23,500 | 571 |
| SCREEN Holdings Co. Ltd. | 8,800 | 567 |
| Concordia Financial Group Ltd. | 126,000 | 551 |
| ITOCHU Corp. | 43,600 | 546 |
| Gree Inc. | 92,400 | 518 |
| Marui Group Co. Ltd. | 37,300 | 493 |
| Toa Corp. | 23,500 | 434 |
| Kubota Corp. | 28,300 | 428 |
| TDK Corp. | 6,200 | 415 |
| Dowa Holdings Co. Ltd. | 59,000 | 413 |
| Nichias Corp. | 46,000 | 406 |
| Toho Holdings Co. Ltd. | 19,000 | 403 |
| Coca-Cola West Co. Ltd. | 14,200 | 397 |
| Toyo Engineering Corp. | 117,000 | 379 |
| Tokyo Steel Manufacturing Co. Ltd. | 55,700 | 377 |
| TIS Inc. | 14,300 | 370 |
| Suzuken Co. Ltd. | 11,100 | 366 |
| KDDI Corp. | 11,800 | 363 |
| Morinaga Milk Industry Co. Ltd. | 44,000 | 352 |
| Noritz Corp. | 16,800 | 347 |
| Adastria Co. Ltd. | 14,400 | 331 |
| Ulvac Inc. | 11,000 | 327 |
| * Daito Pharmaceutical Co. Ltd. | 13,600 | 319 |
| Sumitomo Bakelite Co. Ltd. | 61,000 | 319 |
| JVC Kenwood Corp. | 126,300 | 318 |
| Furukawa Electric Co. Ltd. | 11,600 | 315 |
| Megmilk Snow Brand Co. Ltd. | 8,500 | 310 |
| Seria Co. Ltd. | 3,800 | 308 |
| Lion Corp. | 19,000 | 307 |
| Hanwa Co. Ltd. | 50,000 | 303 |
| Ryohin Keikaku Co. Ltd. | 1,500 | 302 |
| Avex Group Holdings Inc. | 22,100 | 300 |
| EDION Corp. | 35,600 | 298 |
| Asahi Glass Co. Ltd. | 46,000 | 298 |
| Gurunavi Inc. | 10,700 | 294 |
| Nojima Corp. | 23,700 | 294 |
| Daiho Corp. | 53,000 | 294 |
| Kanematsu Corp. | 186,000 | 289 |
| Yodogawa Steel Works Ltd. | 10,700 | 287 |
| Shimamura Co. Ltd. | 2,300 | 279 |
| Nippon Light Metal Holdings Co. Ltd. | 128,400 | 277 |
| Omron Corp. | 7,600 | 273 |
| Saizeriya Co. Ltd. | 12,000 | 273 |
| Tokyo Gas Co. Ltd. | 58,000 | 258 |
| Paramount Bed Holdings Co. Ltd. | 6,100 | 230 |
| Casio Computer Co. Ltd. | 15,800 | 222 |
| Studio Alice Co. Ltd. | 8,400 | 184 |
| Matsumotokiyoshi Holdings Co. Ltd. | 3,200 | 165 |
| Sekisui Chemical Co. Ltd. | 11,000 | 158 |
| AEON Financial Service Co. Ltd. | 8,500 | 148 |
| |
| |
| |
| |
| | 8 | |
Vanguard® Global Equity Fund
Schedule of Investments
September 30, 2016
| | | |
| | | | Market |
| | | | Value |
| | | Shares | ($000) |
| | Nissan Chemical Industries Ltd. | 4,800 | 145 |
| | Fukuoka Financial Group Inc. | 35,000 | 145 |
| | OSG Corp. | 7,200 | 143 |
| | Meidensha Corp. | 43,000 | 142 |
| | Hitachi Capital Corp. | 6,100 | 130 |
| | TechnoPro Holdings Inc. | 3,000 | 113 |
| | Temp Holdings Co. Ltd. | 6,000 | 105 |
| | Suntory Beverage & Food Ltd. | 2,400 | 104 |
| | Senko Co. Ltd. | 14,500 | 101 |
| | Daifuku Co. Ltd. | 4,900 | 90 |
| | Sawai Pharmaceutical Co. Ltd. | 1,200 | 85 |
| | SCSK Corp. | 1,400 | 57 |
| | Maeda Corp. | 6,000 | 51 |
| | Chiba Bank Ltd. | 8,000 | 45 |
| | Obic Co. Ltd. | 700 | 37 |
| | | | 395,189 |
| Luxembourg (0.1%) | | |
| | Ternium SA ADR | 71,622 | 1,406 |
| * | Stabilus SA | 17,568 | 989 |
| | | | 2,395 |
| Malaysia (0.5%) | | |
| | Tenaga Nasional Bhd. | 5,675,800 | 19,648 |
| | Public Bank Bhd. (Local) | 453,500 | 2,175 |
| | Top Glove Corp. Bhd. | 153,900 | 190 |
| | | | 22,013 |
| Mexico (0.1%) | | |
| * | Cemex SAB de CV ADR | 228,369 | 1,813 |
| * | Controladora Vuela Cia de Aviacion SAB de CV ADR | 45,023 | 783 |
| | America Movil SAB de CV ADR | 48,619 | 556 |
| | Industrias Bachoco SAB de CV Class B | 131,636 | 550 |
| | Gentera SAB de CV | 157,272 | 283 |
| | Grupo Mexico SAB de CV Class B | 109,853 | 269 |
| | Alfa SAB de CV Class A | 171,017 | 267 |
| | Grupo Elektra SAB DE CV | 19,464 | 252 |
| * | Industrias CH SAB de CV Class B | 18,735 | 84 |
| | | | 4,857 |
| Netherlands (0.9%) | | |
| | Unilever NV | 476,652 | 21,988 |
| | Heineken NV | 39,687 | 3,491 |
| | Akzo Nobel NV | 37,710 | 2,552 |
| | Koninklijke Philips NV | 83,947 | 2,485 |
| | Koninklijke Ahold Delhaize NV | 87,630 | 1,996 |
| | Koninklijke KPN NV | 578,700 | 1,921 |
| | Wolters Kluwer NV | 33,660 | 1,441 |
| | Boskalis Westminster | 35,998 | 1,281 |
| | ASML Holding NV | 6,210 | 681 |
| | Corbion NV | 16,433 | 443 |
| | Randstad Holding NV | 8,676 | 395 |
| | Koninklijke Vopak NV | 5,657 | 297 |
| * | ASR Nederland NV | 13,546 | 275 |
| | | | 39,246 |
| New Zealand (0.0%) | | |
| | Spark New Zealand Ltd. | 534,344 | 1,405 |
| | PGG Wrightson Ltd. | 51,996 | 20 |
| | | | 1,425 |
| Norway (0.6%) | | |
| | Statoil ASA | 630,224 | 10,573 |
| | Schibsted ASA Class A | 298,323 | 8,778 |
| | Schibsted ASA Class B | 298,323 | 8,005 |
| | DNB ASA | 60,589 | 796 |
| | Grieg Seafood ASA | 43,054 | 345 |
| | Bakkafrost P/F | 7,018 | 294 |
| |
| |
| |
| |
| | | 9 | |
Vanguard® Global Equity Fund
Schedule of Investments
September 30, 2016
| | | | |
| | | | | Market |
| | | | | Value |
| | | | Shares | ($000) |
| | Salmar ASA | | 9,235 | 282 |
| | | | | 29,073 |
| Other (0.4%) | | | |
| 3 | Vanguard FTSE Emerging Markets ETF | | 421,149 | 15,848 |
| |
| Peru (0.0%) | | | |
| * | Cia de Minas Buenaventura SAA ADR | | 82,604 | 1,143 |
| |
| Philippines (0.0%) | | | |
| | Energy Development Corp. | | 9,468,500 | 1,159 |
| | Lopez Holdings Corp. | | 3,106,249 | 529 |
| | | | | 1,688 |
| Poland (0.0%) | | | |
| | Polski Koncern Naftowy ORLEN SA | | 73,601 | 1,257 |
| | Polskie Gornictwo Naftowe i Gazownictwo SA | | 347,186 | 460 |
| | Bank Pekao SA | | 6,780 | 220 |
| | | | | 1,937 |
| Qatar (0.0%) | | | |
| | Barwa Real Estate Co. | | 129,964 | 1,208 |
| | Ooredoo QSC | | 27,036 | 713 |
| | | | | 1,921 |
| Russia (0.7%) | | | |
| * | Yandex NV Class A | | 737,771 | 15,530 |
| | Sberbank of Russia PJSC ADR | | 1,108,663 | 10,378 |
| | Lukoil PJSC ADR | | 83,742 | 4,071 |
| | Gazprom PJSC ADR | | 440,704 | 1,857 |
| * | Global Ports Investments plc GDR | | 289,481 | 835 |
| | Rosneft PJSC GDR | | 114,107 | 624 |
| | O'Key Group SA GDR | | 267,777 | 464 |
| | | | | 33,759 |
| Singapore (0.5%) | | | |
| | DBS Group Holdings Ltd. | | 1,402,500 | 15,921 |
| | Great Eastern Holdings Ltd. | | 144,000 | 2,156 |
| | United Overseas Bank Ltd. | | 39,200 | 544 |
| * | GL Ltd. | | 766,700 | 440 |
| | Singapore Airlines Ltd. | | 51,800 | 401 |
| | Venture Corp. Ltd. | | 47,900 | 317 |
| | China Aviation Oil Singapore Corp. Ltd. | | 291,800 | 288 |
| | Haw Par Corp. Ltd. | | 40,600 | 269 |
| | United Industrial Corp. Ltd. | | 108,200 | 216 |
| | Super Group Ltd. | | 128,800 | 75 |
| | | | | 20,627 |
| South Africa (1.5%) | | | |
| | Naspers Ltd. | | 282,364 | 48,936 |
| | MTN Group Ltd. | | 532,636 | 4,568 |
| | Standard Bank Group Ltd. | | 333,858 | 3,430 |
| * | Sappi Ltd. | | 638,716 | 3,310 |
| | Gold Fields Ltd. ADR | | 528,274 | 2,562 |
| ^ | Harmony Gold Mining Co. Ltd. ADR | | 359,065 | 1,253 |
| | Old Mutual plc | | 390,933 | 1,029 |
| | JSE Ltd. | | 77,966 | 909 |
| | Clicks Group Ltd. | | 96,311 | 893 |
| * | Anglo American Platinum Ltd. | | 28,424 | 802 |
| | Telkom SA SOC Ltd. | | 131,268 | 579 |
| | Grindrod Ltd. | | 439,255 | 369 |
| | SPAR Group Ltd. | | 24,897 | 349 |
| | Barloworld Ltd. | | 51,706 | 315 |
| | Exxaro Resources Ltd. | | 48,597 | 300 |
| | MMI Holdings Ltd. | | 170,111 | 278 |
| * | African Bank Investments Ltd. | | 2,597,627 | — |
| | | | | 69,882 |
| South Korea (2.8%) | | | |
| | Samsung Electronics Co. Ltd. | | 33,578 | 48,938 |
| |
| |
| |
| |
| | | 10 | |
Vanguard® Global Equity Fund
Schedule of Investments
September 30, 2016
| | | |
| | | | Market |
| | | | Value |
| | | Shares | ($000) |
| Samsung Electronics Co. Ltd. GDR | | 32,887 | 23,682 |
| SK Hynix Inc. | | 506,671 | 18,543 |
| LG Display Co. Ltd. | | 271,319 | 6,920 |
| Shinhan Financial Group Co. Ltd. | | 97,376 | 3,567 |
| Korea Electric Power Corp. | | 63,494 | 3,109 |
| KT Corp. | | 106,276 | 3,079 |
| LG Electronics Inc. | | 59,430 | 2,590 |
| Hyundai Motor Co. | | 19,948 | 2,463 |
| Hana Financial Group Inc. | | 80,602 | 2,050 |
| Lotte Shopping Co. Ltd. | | 9,092 | 1,709 |
| LG Uplus Corp. | | 104,834 | 1,118 |
| SK Innovation Co. Ltd. | | 7,241 | 1,070 |
| S-Oil Corp. | | 10,917 | 809 |
| KB Financial Group Inc. | | 23,236 | 798 |
| LG Corp. | | 10,943 | 646 |
| Hite Jinro Co. Ltd. | | 28,487 | 584 |
| S-1 Corp. | | 5,659 | 523 |
| Kia Motors Corp. | | 9,888 | 380 |
| Poongsan Corp. | | 12,087 | 373 |
| * Visang Education Inc. | | 18,447 | 295 |
| GS Home Shopping Inc. | | 1,823 | 273 |
| * Dongkuk Steel Mill Co. Ltd. | | 36,289 | 260 |
| CJ O Shopping Co. Ltd. | | 1,713 | 251 |
| Partron Co. Ltd. | | 29,054 | 241 |
| Dongjin Semichem Co. Ltd. | | 28,540 | 237 |
| Samsung Fire & Marine Insurance Co. Ltd. | | 766 | 195 |
| | | | 124,703 |
| Spain (0.6%) | | | |
| ACS Actividades de Construccion y Servicios SA | | 328,302 | 9,922 |
| Distribuidora Internacional de Alimentacion SA | | 1,414,167 | 8,755 |
| Red Electrica Corp. SA | | 85,123 | 1,835 |
| Viscofan SA | | 26,706 | 1,445 |
| Endesa SA | | 67,030 | 1,437 |
| Acerinox SA | | 89,420 | 1,183 |
| Mediaset Espana Comunicacion SA | | 82,426 | 977 |
| Gas Natural SDG SA | | 41,512 | 853 |
| Prosegur Cia de Seguridad SA | | 41,980 | 293 |
| Banco Santander SA | | 31,187 | 138 |
| | | | 26,838 |
| Sweden (1.3%) | | | |
| Svenska Handelsbanken AB Class A | | 1,768,064 | 24,280 |
| Atlas Copco AB Class B | | 608,315 | 16,609 |
| Assa Abloy AB Class B | | 225,345 | 4,576 |
| Electrolux AB Class B | | 106,760 | 2,675 |
| Swedish Match AB | | 47,982 | 1,760 |
| Sandvik AB | | 141,294 | 1,553 |
| NCC AB Class B | | 40,720 | 1,066 |
| Telefonaktiebolaget LM Ericsson Class B | | 142,373 | 1,027 |
| Nordea Bank AB | | 99,291 | 985 |
| * Oriflame Holding AG | | 24,851 | 911 |
| Millicom International Cellular SA | | 17,060 | 884 |
| Modern Times Group MTG AB Class B | | 27,883 | 714 |
| * Bonava AB | | 40,720 | 513 |
| Granges AB | | 43,715 | 446 |
| L E Lundbergforetagen AB Class B | | 6,634 | 435 |
| Peab AB | | 37,897 | 327 |
| Saab AB Class B | | 8,550 | 304 |
| Hufvudstaden AB Class A | | 17,304 | 300 |
| Vitrolife AB | | 4,708 | 299 |
| Loomis AB Class B | | 9,517 | 294 |
| Husqvarna AB | | 32,409 | 283 |
| | | | 60,241 |
| |
| |
| |
| |
| | 11 | |
Vanguard® Global Equity Fund
Schedule of Investments
September 30, 2016
| | | |
| | | | Market |
| | | | Value |
| | | Shares | ($000) |
| Switzerland (2.3%) | | | |
| Nestle SA | | 324,871 | 25,598 |
| Schindler Holding AG | | 103,396 | 19,371 |
| Cie Financiere Richemont SA | | 227,987 | 13,882 |
| Novartis AG | | 137,152 | 10,786 |
| Geberit AG | | 16,793 | 7,350 |
| OC Oerlikon Corp. AG | | 605,523 | 6,046 |
| Roche Holding AG | | 15,250 | 3,778 |
| Galenica AG | | 3,044 | 3,228 |
| Logitech International SA | | 101,419 | 2,275 |
| Adecco Group AG | | 37,688 | 2,122 |
| UBS Group AG | | 139,651 | 1,896 |
| Sonova Holding AG | | 7,923 | 1,121 |
| Swiss Re AG | | 11,009 | 993 |
| Swiss Life Holding AG | | 3,426 | 885 |
| Cie Financiere Richemont SA (Johannesburg Shares) | | 141,491 | 860 |
| Lonza Group AG | | 4,320 | 824 |
| Temenos Group AG | | 8,616 | 543 |
| Helvetia Holding AG | | 847 | 427 |
| Swiss Prime Site AG | | 4,673 | 410 |
| DKSH Holding AG | | 4,667 | 343 |
| Vontobel Holding AG | | 6,876 | 342 |
| Tecan Group AG | | 1,775 | 311 |
| ALSO Holding AG | | 3,433 | 302 |
| Valora Holding AG | | 1,010 | 288 |
| | | | 103,981 |
| Taiwan (2.7%) | | | |
| Taiwan Semiconductor Manufacturing Co. Ltd. ADR | | 1,356,486 | 41,495 |
| Hon Hai Precision Industry Co. Ltd. | | 11,148,717 | 28,226 |
| Chunghwa Telecom Co. Ltd. | | 5,644,000 | 19,921 |
| * HTC Corp. | | 2,415,000 | 6,774 |
| United Microelectronics Corp. | | 18,021,000 | 6,620 |
| Taiwan Semiconductor Manufacturing Co. Ltd. | | 789,577 | 4,631 |
| Teco Electric and Machinery Co. Ltd. | | 2,136,190 | 1,852 |
| Yungtay Engineering Co. Ltd. | | 1,233,000 | 1,837 |
| Elite Material Co. Ltd. | | 578,000 | 1,582 |
| Delta Electronics Inc. | | 260,488 | 1,396 |
| Formosa Petrochemical Corp. | | 370,000 | 1,116 |
| Chroma ATE Inc. | | 356,000 | 958 |
| Ruentex Industries Ltd. | | 453,164 | 733 |
| Tripod Technology Corp. | | 308,000 | 687 |
| Micro-Star International Co. Ltd. | | 203,000 | 531 |
| Giantplus Technology Co. Ltd. | | 700,000 | 438 |
| Getac Technology Corp. | | 360,000 | 421 |
| Silicon Motion Technology Corp. ADR | | 7,168 | 371 |
| Wistron Corp. | | 442,862 | 330 |
| Gigabyte Technology Co. Ltd. | | 239,000 | 319 |
| China General Plastics Corp. | | 475,000 | 315 |
| Hitron Technology Inc. | | 438,000 | 300 |
| Taiwan Sakura Corp. | | 278,000 | 294 |
| Acer Inc. | | 624,000 | 292 |
| Primax Electronics Ltd. | | 198,000 | 291 |
| Alpha Networks Inc. | | 462,000 | 286 |
| Sitronix Technology Corp. | | 86,000 | 285 |
| Lite-On Technology Corp. | | 196,978 | 285 |
| Topco Scientific Co. Ltd. | | 103,000 | 280 |
| Taiwan Business Bank | | 1,098,300 | 279 |
| | | | 123,145 |
| Thailand (0.1%) | | | |
| Bangkok Bank PCL (Foreign) | | 422,800 | 1,992 |
| Star Petroleum Refining PCL | | 3,939,300 | 1,232 |
| Kasikornbank PCL (Foreign) | | 156,700 | 853 |
| Thai Oil PCL | | 334,400 | 665 |
| * Asia Aviation PCL | | 1,620,200 | 337 |
| |
| |
| |
| |
| | 12 | |
Vanguard® Global Equity Fund
Schedule of Investments
September 30, 2016
| | | |
| | | | Market |
| | | | Value |
| | | Shares | ($000) |
| IRPC PCL | | 2,207,400 | 312 |
| Siam Cement PCL NVDR | | 19,850 | 296 |
| Sansiri PCL | | 5,822,000 | 294 |
| * Thanachart Capital PCL | | 250,400 | 294 |
| Banpu PCL | | 610,600 | 278 |
| * Banpu PCL - NVDR Rights Exp. 10/13/2016 | | 26,350 | 6 |
| | | | 6,559 |
| Turkey (0.2%) | | | |
| Turkiye Garanti Bankasi AS | | 791,300 | 2,102 |
| Turkiye Halk Bankasi AS | | 549,704 | 1,675 |
| Tekfen Holding AS | | 483,687 | 1,247 |
| * Yapi ve Kredi Bankasi AS | | 793,798 | 971 |
| Kordsa Global Endustriyel Iplik ve Kord Bezi Sanayi ve Ticaret AS | | 230,255 | 522 |
| Trakya Cam Sanayii AS | | 325,627 | 271 |
| Goodyear Lastikleri TAS | | 225,583 | 267 |
| Kardemir Karabuk Demir Celik Sanayi ve Ticaret AS | | 617,702 | 261 |
| | | | 7,316 |
| United Kingdom (6.4%) | | | |
| Prudential plc | | 2,536,608 | 45,021 |
| Reckitt Benckiser Group plc | | 221,853 | 20,907 |
| Royal Dutch Shell plc Class A | | 791,410 | 19,800 |
| Wolseley plc | | 325,472 | 18,346 |
| BP plc ADR | | 447,634 | 15,739 |
| WPP plc | | 586,606 | 13,807 |
| Rolls-Royce Holdings plc | | 1,221,374 | 11,400 |
| Hays plc | | 4,586,892 | 7,718 |
| Spectris plc | | 289,298 | 7,380 |
| Compass Group plc | | 247,829 | 4,806 |
| Rightmove plc | | 86,160 | 4,715 |
| Intertek Group plc | | 97,273 | 4,404 |
| Diageo plc | | 147,955 | 4,242 |
| Experian plc | | 203,894 | 4,085 |
| Unilever plc | | 83,306 | 3,949 |
| BP plc | | 668,491 | 3,893 |
| Bunzl plc | | 129,398 | 3,829 |
| Jupiter Fund Management plc | | 610,838 | 3,368 |
| RELX NV | | 168,007 | 3,188 |
| Rotork plc | | 1,161,411 | 3,180 |
| Provident Financial plc | | 72,327 | 2,837 |
| DCC plc | | 30,089 | 2,743 |
| BAE Systems plc | | 397,336 | 2,696 |
| ITV plc | | 1,077,156 | 2,618 |
| 2 Merlin Entertainments plc | | 423,744 | 2,418 |
| 3i Group plc | | 285,834 | 2,406 |
| * Anglo American plc Ordinary Shares | | 177,625 | 2,228 |
| 2 Auto Trader Group plc | | 402,514 | 2,116 |
| Lloyds Banking Group plc | | 2,876,860 | 2,037 |
| G4S plc | | 668,341 | 1,973 |
| Capita plc | | 224,165 | 1,947 |
| HomeServe plc | | 260,634 | 1,942 |
| British American Tobacco plc | | 30,026 | 1,920 |
| Barclays plc | | 878,576 | 1,916 |
| Vodafone Group plc | | 664,903 | 1,907 |
| Admiral Group plc | | 70,912 | 1,883 |
| Ladbrokes plc | | 1,034,411 | 1,877 |
| * Standard Chartered plc | | 216,140 | 1,760 |
| Carnival plc | | 34,694 | 1,694 |
| TUI AG | | 117,190 | 1,666 |
| WH Smith plc | | 81,457 | 1,626 |
| * Serco Group plc | | 948,253 | 1,606 |
| Royal Dutch Shell plc Class B | | 58,266 | 1,512 |
| Mondi plc | | 71,186 | 1,497 |
| SSP Group plc | | 359,875 | 1,492 |
| AstraZeneca plc | | 22,141 | 1,434 |
| |
| |
| |
| |
| | 13 | |
Vanguard® Global Equity Fund
Schedule of Investments
September 30, 2016
| | | |
| | | | Market |
| | | | Value |
| | | Shares | ($000) |
| Daily Mail & General Trust plc | | 147,095 | 1,419 |
| ICAP plc | | 234,847 | 1,419 |
| BGEO Group plc | | 36,421 | 1,373 |
| * Glencore plc | | 500,371 | 1,372 |
| IG Group Holdings plc | | 115,254 | 1,301 |
| Rio Tinto plc | | 36,353 | 1,210 |
| Informa plc | | 126,929 | 1,173 |
| * Thomas Cook Group plc | | 1,281,853 | 1,150 |
| Berendsen plc | | 71,109 | 1,147 |
| Moneysupermarket.com Group plc | | 291,692 | 1,136 |
| BHP Billiton plc | | 72,680 | 1,092 |
| GVC Holdings plc | | 111,696 | 1,074 |
| Imperial Brands plc | | 18,915 | 975 |
| * Just Eat plc | | 135,937 | 944 |
| St. James's Place plc | | 72,165 | 889 |
| International Personal Finance plc | | 251,684 | 848 |
| Stagecoach Group plc | | 298,344 | 817 |
| * Tesco plc | | 338,212 | 801 |
| UBM plc | | 76,829 | 710 |
| Pets at Home Group plc | | 226,878 | 692 |
| GlaxoSmithKline plc | | 28,723 | 612 |
| Sky plc | | 50,016 | 580 |
| Johnson Matthey plc | | 13,484 | 576 |
| Amec Foster Wheeler plc | | 77,314 | 576 |
| Drax Group plc | | 139,975 | 554 |
| Barratt Developments plc | | 84,673 | 544 |
| easyJet plc | | 40,792 | 533 |
| Smith & Nephew plc | | 33,020 | 533 |
| InterContinental Hotels Group plc | | 12,823 | 529 |
| J D Wetherspoon plc | | 39,513 | 482 |
| Beazley plc | | 94,397 | 474 |
| Devro plc | | 153,629 | 473 |
| National Grid plc | | 33,099 | 468 |
| JD Sports Fashion plc | | 24,095 | 460 |
| Close Brothers Group plc | | 24,651 | 437 |
| Wm Morrison Supermarkets plc | | 139,409 | 394 |
| National Express Group plc | | 83,321 | 372 |
| Pagegroup plc | | 81,035 | 354 |
| ^ Antofagasta plc | | 51,864 | 351 |
| Inchcape plc | | 36,597 | 312 |
| Abcam plc | | 28,624 | 312 |
| 2 Non-Standard Finance plc | | 323,829 | 310 |
| Petrofac Ltd. | | 24,478 | 283 |
| Millennium & Copthorne Hotels plc | | 50,101 | 282 |
| IMI plc | | 19,191 | 267 |
| 2 McCarthy & Stone plc | | 115,132 | 249 |
| * Premier Oil plc | | 262,285 | 233 |
| Centrica plc | | 71,680 | 212 |
| Northgate plc | | 37,787 | 212 |
| | | | 289,044 |
| United States (46.8%) | | | |
| Consumer Discretionary (6.5%) | | | |
| * Amazon.com Inc. | | 125,698 | 105,248 |
| Royal Caribbean Cruises Ltd. | | 549,584 | 41,191 |
| * CarMax Inc. | | 406,640 | 21,694 |
| Omnicom Group Inc. | | 190,488 | 16,191 |
| Harley-Davidson Inc. | | 221,910 | 11,670 |
| * Tesla Motors Inc. | | 54,373 | 11,094 |
| Time Warner Inc. | | 129,423 | 10,303 |
| McDonald's Corp. | | 88,347 | 10,192 |
| * TripAdvisor Inc. | | 146,589 | 9,261 |
| * Priceline Group Inc. | | 5,025 | 7,394 |
| American Eagle Outfitters Inc. | | 338,297 | 6,042 |
| * Urban Outfitters Inc. | | 140,660 | 4,856 |
| |
| |
| |
| |
| | 14 | |
Vanguard® Global Equity Fund
Schedule of Investments
September 30, 2016
| | | |
| | | | Market |
| | | | Value |
| | | Shares | ($000) |
| Cooper Tire & Rubber Co. | | 125,761 | 4,781 |
| * AutoZone Inc. | | 5,934 | 4,559 |
| Big Lots Inc. | | 93,420 | 4,461 |
| International Game Technology plc | | 147,732 | 3,602 |
| * Genesco Inc. | | 53,831 | 2,932 |
| Kohl's Corp. | | 64,365 | 2,816 |
| Wolverine World Wide Inc. | | 101,355 | 2,334 |
| Williams-Sonoma Inc. | | 45,058 | 2,302 |
| Children's Place Inc. | | 21,230 | 1,696 |
| TJX Cos. Inc. | | 11,850 | 886 |
| Garmin Ltd. | | 16,528 | 795 |
| Home Depot Inc. | | 5,978 | 769 |
| Nutrisystem Inc. | | 25,280 | 751 |
| Gannett Co. Inc. | | 44,809 | 522 |
| Dillard's Inc. Class A | | 7,619 | 480 |
| * Francesca's Holdings Corp. | | 30,368 | 469 |
| * Stoneridge Inc. | | 24,027 | 442 |
| Interpublic Group of Cos. Inc. | | 14,904 | 333 |
| * K12 Inc. | | 23,050 | 331 |
| General Motors Co. | | 9,266 | 294 |
| Ethan Allen Interiors Inc. | | 8,996 | 281 |
| Speedway Motorsports Inc. | | 14,086 | 252 |
| * American Public Education Inc. | | 9,739 | 193 |
| Rocky Brands Inc. | | 14,203 | 150 |
| | | | 291,567 |
| Consumer Staples (5.5%) | | | |
| Procter & Gamble Co. | | 615,340 | 55,227 |
| Coca-Cola Co. | | 1,051,531 | 44,501 |
| Colgate-Palmolive Co. | | 437,656 | 32,448 |
| PepsiCo Inc. | | 277,980 | 30,236 |
| Hershey Co. | | 134,220 | 12,831 |
| Wal-Mart Stores Inc. | | 131,668 | 9,496 |
| Philip Morris International Inc. | | 82,327 | 8,004 |
| Mead Johnson Nutrition Co. | | 92,735 | 7,327 |
| Dean Foods Co. | | 435,046 | 7,135 |
| Archer-Daniels-Midland Co. | | 162,603 | 6,857 |
| Estee Lauder Cos. Inc. Class A | | 69,967 | 6,196 |
| Pilgrim's Pride Corp. | | 254,259 | 5,370 |
| Altria Group Inc. | | 84,706 | 5,356 |
| Bunge Ltd. | | 87,799 | 5,200 |
| Costco Wholesale Corp. | | 33,052 | 5,041 |
| Sanderson Farms Inc. | | 44,027 | 4,241 |
| Ingredion Inc. | | 26,471 | 3,522 |
| Kraft Heinz Co. | | 8,409 | 753 |
| * AdvancePierre Foods Holdings Inc. | | 10,978 | 302 |
| | | | 250,043 |
| Energy (2.1%) | | | |
| Exxon Mobil Corp. | | 396,117 | 34,573 |
| Apache Corp. | | 325,185 | 20,770 |
| EOG Resources Inc. | | 211,202 | 20,425 |
| Rowan Cos. plc Class A | | 426,052 | 6,459 |
| National Oilwell Varco Inc. | | 151,506 | 5,566 |
| World Fuel Services Corp. | | 98,951 | 4,577 |
| Superior Energy Services Inc. | | 167,683 | 3,002 |
| * Overseas Shipholding Group Inc. Class A | | 56,561 | 598 |
| * McDermott International Inc. | | 54,657 | 274 |
| * Exterran Corp. | | 15,974 | 250 |
| | | | 96,494 |
| Financials (7.9%) | | | |
| * Berkshire Hathaway Inc. Class B | | 268,568 | 38,800 |
| First Republic Bank | | 423,434 | 32,651 |
| * Markel Corp. | | 34,304 | 31,860 |
| Moody's Corp. | | 279,879 | 30,305 |
| |
| |
| |
| |
| | 15 | |
Vanguard® Global Equity Fund
Schedule of Investments
September 30, 2016
| | | |
| | | | Market |
| | | | Value |
| | | Shares | ($000) |
| TD Ameritrade Holding Corp. | | 741,980 | 26,147 |
| Wells Fargo & Co. | | 510,039 | 22,585 |
| US Bancorp | | 416,137 | 17,848 |
| Travelers Cos. Inc. | | 135,554 | 15,528 |
| Voya Financial Inc. | | 517,574 | 14,916 |
| Loews Corp. | | 301,640 | 12,412 |
| * Alleghany Corp. | | 20,936 | 10,992 |
| Aflac Inc. | | 144,129 | 10,359 |
| Chubb Ltd. | | 77,002 | 9,675 |
| MarketAxess Holdings Inc. | | 51,689 | 8,559 |
| Willis Towers Watson plc | | 55,853 | 7,416 |
| Interactive Brokers Group Inc. | | 184,605 | 6,511 |
| Franklin Resources Inc. | | 176,308 | 6,271 |
| American Express Co. | | 90,714 | 5,809 |
| Financial Engines Inc. | | 190,870 | 5,671 |
| CYS Investments Inc. | | 582,684 | 5,081 |
| Leucadia National Corp. | | 262,828 | 5,004 |
| RenaissanceRe Holdings Ltd. | | 37,838 | 4,547 |
| Hartford Financial Services Group Inc. | | 102,722 | 4,399 |
| Endurance Specialty Holdings Ltd. | | 59,397 | 3,888 |
| M&T Bank Corp. | | 33,040 | 3,836 |
| JPMorgan Chase & Co. | | 53,547 | 3,566 |
| Validus Holdings Ltd. | | 63,309 | 3,154 |
| T. Rowe Price Group Inc. | | 42,419 | 2,821 |
| Bank of New York Mellon Corp. | | 31,576 | 1,259 |
| Citizens Financial Group Inc. | | 50,376 | 1,245 |
| American International Group Inc. | | 19,288 | 1,145 |
| * EZCORP Inc. Class A | | 96,752 | 1,070 |
| Goldman Sachs Group Inc. | | 3,001 | 484 |
| * Piper Jaffray Cos. | | 6,112 | 295 |
| GAIN Capital Holdings Inc. | | 34,802 | 215 |
| Calamos Asset Management Inc. Class A | | 17,710 | 121 |
| | | | 356,445 |
| Health Care (8.3%) | | | |
| Johnson & Johnson | | 259,146 | 30,613 |
| * Waters Corp. | | 173,914 | 27,564 |
| Anthem Inc. | | 208,861 | 26,172 |
| * Mettler-Toledo International Inc. | | 57,107 | 23,975 |
| * WellCare Health Plans Inc. | | 193,900 | 22,704 |
| * Charles River Laboratories International Inc. | | 220,887 | 18,409 |
| Bruker Corp. | | 724,652 | 16,413 |
| * VWR Corp. | | 567,409 | 16,092 |
| * United Therapeutics Corp. | | 130,952 | 15,463 |
| * PRA Health Sciences Inc. | | 271,067 | 15,318 |
| * Seattle Genetics Inc. | | 279,918 | 15,118 |
| * Myriad Genetics Inc. | | 660,286 | 13,589 |
| * Bio-Rad Laboratories Inc. Class A | | 81,244 | 13,309 |
| ResMed Inc. | | 201,776 | 13,073 |
| * Mallinckrodt plc | | 167,032 | 11,656 |
| * INC Research Holdings Inc. Class A | | 246,188 | 10,975 |
| * Five Prime Therapeutics Inc. | | 164,324 | 8,625 |
| * Emergent BioSolutions Inc. | | 270,295 | 8,522 |
| * PAREXEL International Corp. | | 101,950 | 7,080 |
| Merck & Co. Inc. | | 109,504 | 6,834 |
| * Intuitive Surgical Inc. | | 8,519 | 6,175 |
| Baxter International Inc. | | 127,925 | 6,089 |
| * Alnylam Pharmaceuticals Inc. | | 85,961 | 5,826 |
| * Varian Medical Systems Inc. | | 58,495 | 5,822 |
| Abbott Laboratories | | 133,412 | 5,642 |
| PDL BioPharma Inc. | | 1,043,258 | 3,495 |
| * Exelixis Inc. | | 198,539 | 2,539 |
| * Cambrex Corp. | | 50,750 | 2,256 |
| * Luminex Corp. | | 89,233 | 2,027 |
| * Supernus Pharmaceuticals Inc. | | 65,202 | 1,612 |
| |
| |
| |
| |
| | 16 | |
Vanguard® Global Equity Fund
Schedule of Investments
September 30, 2016
| | | |
| | | | Market |
| | | | Value |
| | | Shares | ($000) |
| * Patheon NV | | 49,533 | 1,468 |
| * Amphastar Pharmaceuticals Inc. | | 49,533 | 940 |
| * Globus Medical Inc. | | 39,306 | 887 |
| * Orthofix International NV | | 18,593 | 795 |
| * Quintiles Transnational Holdings Inc. | | 7,872 | 638 |
| * Impax Laboratories Inc. | | 26,781 | 635 |
| * Triple-S Management Corp. Class B | | 28,538 | 626 |
| * Heska Corp. | | 9,672 | 527 |
| * BioTelemetry Inc. | | 24,707 | 459 |
| * BioSpecifics Technologies Corp. | | 9,084 | 415 |
| * Surmodics Inc. | | 11,690 | 352 |
| * Aptevo Therapeutics Inc. | | 135,147 | 346 |
| * SciClone Pharmaceuticals Inc. | | 32,848 | 337 |
| * Xencor Inc. | | 13,123 | 321 |
| * Aratana Therapeutics Inc. | | 31,258 | 293 |
| * Lantheus Holdings Inc. | | 34,356 | 285 |
| * Vanda Pharmaceuticals Inc. | | 15,336 | 255 |
| * Applied Genetic Technologies Corp. | | 15,032 | 147 |
| * Five Star Quality Care Inc. | | 40,229 | 77 |
| * Alliance HealthCare Services Inc. | | 6,889 | 47 |
| | | | 372,837 |
| Industrials (3.3%) | | | |
| CH Robinson Worldwide Inc. | | 268,445 | 18,915 |
| Wabtec Corp. | | 164,859 | 13,461 |
| Lincoln Electric Holdings Inc. | | 213,956 | 13,398 |
| * NOW Inc. | | 468,278 | 10,035 |
| General Electric Co. | | 335,091 | 9,925 |
| 3M Co. | | 54,052 | 9,526 |
| * Stericycle Inc. | | 109,290 | 8,759 |
| * Kirby Corp. | | 133,748 | 8,314 |
| Union Pacific Corp. | | 72,767 | 7,097 |
| United Technologies Corp. | | 60,220 | 6,118 |
| Emerson Electric Co. | | 94,102 | 5,129 |
| * Clean Harbors Inc. | | 96,726 | 4,641 |
| Insperity Inc. | | 58,829 | 4,273 |
| MSC Industrial Direct Co. Inc. Class A | | 50,886 | 3,736 |
| Universal Forest Products Inc. | | 35,414 | 3,488 |
| Expeditors International of Washington Inc. | | 62,871 | 3,239 |
| * Wabash National Corp. | | 113,593 | 1,618 |
| United Parcel Service Inc. Class B | | 14,573 | 1,594 |
| PACCAR Inc. | | 23,791 | 1,398 |
| Fastenal Co. | | 29,829 | 1,246 |
| Brady Corp. Class A | | 35,920 | 1,243 |
| Comfort Systems USA Inc. | | 41,308 | 1,211 |
| Insteel Industries Inc. | | 32,779 | 1,188 |
| HNI Corp. | | 26,439 | 1,052 |
| ManpowerGroup Inc. | | 11,962 | 864 |
| Kimball International Inc. Class B | | 48,535 | 628 |
| * Vectrus Inc. | | 35,898 | 547 |
| Global Brass & Copper Holdings Inc. | | 16,817 | 486 |
| Herman Miller Inc. | | 16,021 | 458 |
| * Herc Holdings Inc. | | 12,965 | 437 |
| Argan Inc. | | 7,080 | 419 |
| Quad/Graphics Inc. | | 15,552 | 416 |
| UniFirst Corp. | | 2,999 | 395 |
| McGrath RentCorp | | 10,508 | 333 |
| * RPX Corp. | | 26,689 | 285 |
| * Ducommun Inc. | | 12,486 | 285 |
| Supreme Industries Inc. Class A | | 14,540 | 281 |
| Knoll Inc. | | 11,111 | 254 |
| * Titan Machinery Inc. | | 22,144 | 230 |
| * ARC Document Solutions Inc. | | 55,705 | 208 |
| | | | 147,130 |
| |
| |
| |
| |
| | 17 | |
Vanguard® Global Equity Fund
Schedule of Investments
September 30, 2016
| | | | |
| | | | | Market |
| | | | | Value |
| | | | Shares | ($000) |
| Information Technology (10.6%) | | | |
| * | Alphabet Inc. Class C | | 57,929 | 45,028 |
| | Apple Inc. | | 366,170 | 41,395 |
| | Microsoft Corp. | | 653,918 | 37,666 |
| * | Facebook Inc. Class A | | 276,942 | 35,523 |
| | Intel Corp. | | 641,298 | 24,209 |
| | Visa Inc. Class A | | 269,925 | 22,323 |
| | Linear Technology Corp. | | 363,301 | 21,540 |
| | Mastercard Inc. | | 199,029 | 20,255 |
| | Symantec Corp. | | 671,369 | 16,851 |
| | Texas Instruments Inc. | | 223,718 | 15,701 |
| | Oracle Corp. | | 397,351 | 15,608 |
| | Teradyne Inc. | | 647,443 | 13,972 |
| | NVIDIA Corp. | | 194,165 | 13,304 |
| | Dolby Laboratories Inc. Class A | | 242,532 | 13,167 |
| * | GrubHub Inc. | | 235,337 | 10,117 |
| * | Alphabet Inc. Class A | | 11,994 | 9,644 |
| | Computer Sciences Corp. | | 180,323 | 9,415 |
| | Accenture plc Class A | | 76,349 | 9,328 |
| | Xilinx Inc. | | 154,054 | 8,371 |
| | Convergys Corp. | | 261,045 | 7,941 |
| * | Teradata Corp. | | 249,105 | 7,722 |
| * | PayPal Holdings Inc. | | 170,566 | 6,988 |
| | Xerox Corp. | | 640,663 | 6,490 |
| * | MicroStrategy Inc. Class A | | 38,007 | 6,364 |
| | FLIR Systems Inc. | | 201,978 | 6,346 |
| * | Tech Data Corp. | | 72,248 | 6,120 |
| | Analog Devices Inc. | | 89,065 | 5,740 |
| * | eBay Inc. | | 174,426 | 5,739 |
| | Paychex Inc. | | 84,064 | 4,865 |
| *,^ | Zillow Group Inc. | | 135,812 | 4,706 |
| | Automatic Data Processing Inc. | | 51,850 | 4,573 |
| | SYNNEX Corp. | | 27,113 | 3,094 |
| | ManTech International Corp. Class A | | 67,194 | 2,533 |
| * | IPG Photonics Corp. | | 29,131 | 2,399 |
| | CSG Systems International Inc. | | 56,634 | 2,341 |
| * | Zillow Group Inc. Class A | | 67,906 | 2,339 |
| * | CommVault Systems Inc. | | 26,660 | 1,416 |
| * | NETGEAR Inc. | | 22,857 | 1,383 |
| * | Insight Enterprises Inc. | | 28,768 | 936 |
| | EarthLink Holdings Corp. | | 149,361 | 926 |
| * | Manhattan Associates Inc. | | 15,731 | 906 |
| * | Sykes Enterprises Inc. | | 20,049 | 564 |
| * | Net 1 UEPS Technologies Inc. | | 60,242 | 516 |
| * | Finisar Corp. | | 13,201 | 393 |
| * | Genpact Ltd. | | 15,856 | 380 |
| * | Benchmark Electronics Inc. | | 13,708 | 342 |
| * | Alpha & Omega Semiconductor Ltd. | | 15,259 | 331 |
| * | Progress Software Corp. | | 9,806 | 267 |
| * | Rubicon Project Inc. | | 31,531 | 261 |
| * | Synacor Inc. | | 80,400 | 234 |
| * | Zedge Inc. Class B | | 4,595 | 16 |
| | | | | 478,588 |
| Materials (1.4%) | | | |
| | Martin Marietta Materials Inc. | | 114,290 | 20,470 |
| | Praxair Inc. | | 159,475 | 19,269 |
| | Monsanto Co. | | 150,273 | 15,358 |
| * | Axalta Coating Systems Ltd. | | 119,584 | 3,381 |
| | PPG Industries Inc. | | 24,328 | 2,515 |
| | Greif Inc. Class A | | 31,307 | 1,553 |
| | Trinseo SA | | 20,402 | 1,154 |
| | Schnitzer Steel Industries Inc. | | 45,790 | 957 |
| | Mercer International Inc. | | 47,458 | 402 |
| |
| |
| |
| |
| | | 18 | |
Vanguard® Global Equity Fund
Schedule of Investments
September 30, 2016
| | | | | |
| | | | | | Market |
| | | | | | Value |
| | | | | Shares | ($000) |
| | Stepan Co. | | | 4,698 | 341 |
| | | | | | 65,400 |
| Other (0.0%) | | | | |
| * | Sun-Times Media Group Inc. Class A | | | 130,959 | — |
| * | Washington Mutual Inc. Escrow | | | 166,300 | — |
| | | | | | — |
| Real Estate (0.5%) | | | | |
| | Rayonier Inc. | | | 314,728 | 8,353 |
| * | Howard Hughes Corp. | | | 71,184 | 8,151 |
| | Weyerhaeuser Co. | | | 111,178 | 3,551 |
| | Select Income REIT | | | 30,425 | 818 |
| * | Forestar Group Inc. | | | 23,469 | 275 |
| | | | | | 21,148 |
| Telecommunication Services (0.7%) | | | | |
| | AT&T Inc. | | | 776,150 | 31,520 |
| * | T-Mobile US Inc. | | | 36,949 | 1,726 |
| * | United States Cellular Corp. | | | 6,775 | 246 |
| | IDT Corp. Class B | | | 13,786 | 238 |
| | | | | | 33,730 |
| |
| | | | | | 2,113,382 |
| |
| Total Common Stocks (Cost $3,762,084) | | | | 4,341,922 |
| |
| |
| | | Coupon | | | |
| |
| Temporary Cash Investments (4.1%)1 | | | | |
| Money Market Fund (4.0%) | | | | |
| 4,5 | Vanguard Market Liquidity Fund | 0.640% | | 1,793,806 | 179,399 |
| |
| |
| | | | | Face | |
| | | | Maturity | Amount | |
| | | | Date | ($000) | |
| U.S. Government and Agency Obligations (0.1%) | | | | |
| 6,7 | Federal Home Loan Bank Discount Notes | 0.431% | 10/3/16 | 5,000 | 5,000 |
| 6,7 | Federal Home Loan Bank Discount Notes | 0.339% | 11/14/16 | 100 | 100 |
| 7,8 | Freddie Mac Discount Notes | 0.300% | 11/8/16 | 500 | 500 |
| 7 | United States Treasury Bill | 0.281% | 12/15/16 | 900 | 899 |
| 7 | United States Treasury Bill | 0.300% | 12/22/16 | 600 | 600 |
| |
| | | | | | 7,099 |
| |
| Total Temporary Cash Investments (Cost $186,494) | | | | 186,498 |
| |
| Total Investments (100.3%) (Cost $3,948,578) | | | | 4,528,420 |
| Other Assets and Liabilities—Net (-0.3%)5,7 | | | | (12,973) |
| |
| Net Assets (100%) | | | | 4,515,447 |
* Non-income-producing security.
^ Includes partial security positions on loan to broker-dealers. The total value of securities on loan is $19,743,000.
1 The fund invests a portion of its cash reserves in equity markets through the use of index futures contracts. After giving effect to futures
investments, the fund's effective common stock and temporary cash investment positions represent 98.4% and 1.9%, respectively, of net
assets.
2 Security exempt from registration under Rule 144A of the Securities Act of 1933. Such securities may be sold in transactions exempt from
registration, normally to qualified institutional buyers. At September 30, 2016, the aggregate value of these securities was $5,177,000,
representing 0.1% of net assets.
3 Considered an affiliated company of the fund as the issuer is another member of The Vanguard Group.
4 Affiliated money market fund available only to Vanguard funds and certain trusts and accounts managed by Vanguard. Rate shown is the 7-day
yield.
5 Includes $21,355,000 of collateral received for securities on loan.
6 The issuer operates under a congressional charter; its securities are generally neither guaranteed by the U.S. Treasury nor backed by the full
faith and credit of the U.S. government.
19
Vanguard® Global Equity Fund
Schedule of Investments
September 30, 2016
7 Securities with a value of $5,899,000 and cash of $2,613,000 have been segregated as initial margin for open futures contracts.
8 The issuer was placed under federal conservatorship in September 2008; since that time, its daily operations have been managed by the Federal
Housing Finance Agency and it receives capital from the U.S. Treasury, as needed to maintain a positive net worth, in exchange for senior
preferred stock.
ADR—American Depositary Receipt.
GDR—Global Depositary Receipt.
NVDR—Non-Voting Depository Receipt.
REIT—Real Estate Investment Trust.
20
This page intentionally left blank.
© 2016 The Vanguard Group, Inc.
All rights reserved.
Vanguard Marketing Corporation, Distributor.
SNA1290 112016

Report of Independent Registered Public Accounting Firm
To the Board of Trustees of Vanguard Horizon Funds and the Shareholders of Vanguard Global Equity Fund:
In our opinion, the accompanying statement of net assets – investments summary and the related statements of operations and of changes in net assets and the financial highlights (included in Item 1 of this Form N-CSR) and the schedule of investments (included in Item 6 of this Form N-CSR) present fairly, in all material respects, the financial position of the Vanguard Global Equity Fund (constituting a separate portfolio of Vanguard Horizon Funds, hereafter referred to as the "Fund") at September 30, 2016, the results of its operations for the year then ended, the changes in its net assets for each of the two years in the period then ended, and the financial highlights for each of the five years in the period then ended, in conformity with accounting principles generally accepted in the United States of America. These financial statements, financial highlights, and schedule of investments (hereafter referred to as "financial statements") are the responsibility of the Fund's management. Our responsibility is to express an opinion on these financial statements based on our audits. We conducted our audits of these financial statements in accordance with the standards of the Public Company Accounting Oversight Board (United States). Those standards require that we plan and perform the audit to obtain reasonable assurance about whether the financial statements are free of material misstatement. An audit includes examining, on a test basis, evidence supporting the amounts and disclosures in the financial statements, assessing the accounting principles used and significant estimates made by management, and evaluating the overall financial statement presentation. We believe that our audits, which included confirmation of securities at September 30, 2016 by correspondence with the custodian and brokers and by agreement to the underlying ownership records of the transfer agent, provide a reasonable basis for our opinion.

November 15, 2016
PricewaterhouseCoopers LLP, Two Commerce Square, Suite 1800, 2001 Market Street, Philadelphia, PA 19103-7042 T: (267) 330 3000, F: (267) 330 3300, www.pwc.com/us
Item 7: Disclosure of Proxy Voting Policies and Procedures for Closed-End Management
Investment Companies.
Not Applicable.
Item 8: Portfolio Managers of Closed-End Management Investment Companies.
Not Applicable.
Item 9: Purchase of Equity Securities by Closed-End Management Investment Company and
Affiliated Purchasers.
Not Applicable.
Item 10: Submission of Matters to a Vote of Security Holders.
Not Applicable.
Item 11: Controls and Procedures.
(a) Disclosure Controls and Procedures. The Principal Executive and Financial Officers concluded that the Registrant’s Disclosure Controls and Procedures are effective based on their evaluation of the Disclosure Controls and Procedures as of a date within 90 days of the filing date of this report.
(b) Internal Control Over Financial Reporting. There were no significant changes in Registrant’s Internal Control Over Financial Reporting or in other factors that could significantly affect this control subsequent to the date of the evaluation, including any corrective actions with regard to significant deficiencies and material weaknesses.
Item 12: Exhibits.
(a) Code of Ethics.
(b) Certifications.
Pursuant to the requirements of the Securities Exchange Act of 1934 and the Investment Company Act of 1940, the registrant has duly caused this report to be signed on its behalf by the undersigned, thereunto duly authorized.
| |
| | VANGUARD HORIZON FUNDS |
| |
| |
| BY: | /s/ F. WILLIAM MCNABB III* |
| | F. WILLIAM MCNABB III |
| | CHIEF EXECUTIVE OFFICER |
| |
| Date: November 17, 2016 |
Pursuant to the requirements of the Securities Exchange Act of 1934 and the Investment Company Act of 1940, this report has been signed below by the following persons on behalf of the registrant and in the capacities and on the dates indicated.
| |
| | VANGUARD HORIZON FUNDS |
BY: | /s/ F. WILLIAM MCNABB III* |
| | F. WILLIAM MCNABB III |
| | CHIEF EXECUTIVE OFFICER |
Date: November 17, 2016 |
| VANGUARD HORIZON FUNDS |
BY: | /s/ THOMAS J. HIGGINS* |
| | THOMAS J. HIGGINS |
| | CHIEF FINANCIAL OFFICER |
| Date: November 17, 2016 |
* By: /s/ Anne E. Robinson
Anne E. Robinson, pursuant to a Power of Attorney filed on October 4, 2016 see file Number
33-32548, Incorporated by Reference.